UNITED STATES
SECURITIES AND EXCHANGE COMMISSION
Washington, D.C. 20549
FORM N-CSR
CERTIFIED SHAREHOLDER REPORT OF REGISTERED
MANAGEMENT INVESTMENT COMPANIES
Investment Company Act file number | 811-09645 |
|
Columbia Funds Series Trust |
(Exact name of registrant as specified in charter) |
|
50606 Ameriprise Financial Center Minneapolis, MN | | 55474 |
(Address of principal executive offices) | | (Zip code) |
|
Ryan Larrenaga c/o Columbia Management Investment Advisers, LLC 225 Franklin Street Boston, MA 02110 |
(Name and address of agent for service) |
|
Registrant’s telephone number, including area code: | (800) 345-6611 | |
|
Date of fiscal year end: | February 29 | |
|
Date of reporting period: | February 29, 2016 | |
| | | | | | | | |
Form N-CSR is to be used by management investment companies to file reports with the Commission not later than 10 days after the transmission to stockholders of any report that is required to be transmitted to stockholders under Rule 30e-1 under the Investment Company Act of 1940 (17 CFR 270.30e-1). The Commission may use the information provided on Form N-CSR in its regulatory, disclosure review, inspection, and policymaking roles.
A registrant is required to disclose the information specified by Form N-CSR, and the Commission will make this information public. A registrant is not required to respond to the collection of information contained in Form N-CSR unless the Form displays a currently valid Office of Management and Budget (“OMB”) control number. Please direct comments concerning the accuracy of the information collection burden estimate and any suggestions for reducing the burden to Secretary, Securities and Exchange Commission, 450 Fifth Street, NW, Washington, DC 20549-0609. The OMB has reviewed this collection of information under the clearance requirements of 44 U.S.C. § 3507.
Item 1. Reports to Stockholders.

ANNUAL REPORT
February 29, 2016

COLUMBIA CONVERTIBLE SECURITIES FUND


ABOUT COLUMBIA THREADNEEDLE INVESTMENTS
Columbia Threadneedle Investments is a leading global asset management group that provides a broad range of actively managed investment strategies and solutions for individual, institutional and corporate clients around the world.
With more than 2,000 people, including over 450 investment professionals based in North America, Europe and Asia, we manage $472 billion* of assets across developed and emerging market equities, fixed income, asset allocation solutions and alternatives. We are the 13th largest manager of long-term mutual fund assets in the U.S.** and the 4th largest manager of retail funds in the U.K.***
Our priority is the investment success of our clients. We aim to deliver the investment outcomes they expect through an investment approach that is team-based, performance-driven and risk-aware. Our culture is dynamic and interactive. By sharing our insights across asset classes and geographies, we generate richer perspectives on global, regional and local investment landscapes. The ability to exchange and debate investment ideas in a collaborative environment enriches our teams' investment processes. More importantly, it results in better informed investment decisions for our clients.
Columbia funds are distributed by Columbia Management Investment Distributors, Inc., member FINRA, and managed by Columbia Management Investment Advisers, LLC.
Columbia Threadneedle Investments (Columbia Threadneedle) is the global brand name of the Columbia and Threadneedle group of companies.
* In U.S. dollars as of December 31, 2015. Source: Ameriprise Q4 Earnings Release. Includes all assets managed by entities in the Columbia and Threadneedle groups of companies. Contact us for more current data.
** Source: ICI as of December 31, 2015 for Columbia Management Investment Advisers, LLC.
*** Source: Investment Association as of September 2015 for Threadneedle Asset Management Limited.
© 2016 Columbia Management Investment Advisers, LLC. All rights reserved.
Not part of the shareholder report
Investment strategies to help meet investor needs
We are committed to helping investors navigate financial challenges to reach their desired outcomes. The possibilities are endless.
Your success is our priority.
 Retire comfortably
 Fund college or higher education
 Leave a legacy

Generate an appropriate stream of income in retirement
Traditional approaches to income may no longer be adequate — and they may no longer provide the diversification benefits they once did. Investors need to rethink how they generate retirement income.
Worried about running out of income? You are not alone.

Navigate a changing interest rate environment
Even in today's challenging interest rate environment, it's still possible to navigate markets and achieve your goals.
Make investment choices designed specifically for this market environment.

Maximize after-tax returns
In an environment where what you keep is more important than what you earn, municipal bonds can help mitigate higher taxes while providing attractive yields compared to other investment options.
You've worked too hard building your wealth to lose it to taxes.

Grow assets to achieve financial goals
Finding growth opportunities in today's complex market environment requires strong research capabilities, creative thinking and a disciplined approach.
Do your investments deliver the portfolio growth you need?

Ease the impact of volatile markets
With increasing concerns about market volatility, investors should consider diversifying their portfolios with non-traditional holdings.
Interested in turning volatility into opportunity?
To find out more, contact your financial professional, call 800.426.3750 or visit columbiathreadneedle.com/us
Not part of the shareholder report
 Dear Shareholder,
Today's investors are typically focused on outcomes, like living a certain retirement lifestyle, paying for college education or building a legacy. But in today's complex global investment landscape, even simple goals are not easily achieved.
At Columbia Threadneedle Investments, we aspire to help satisfy five core needs of today's investors:
n Generate an appropriate stream of income in retirement
Traditional approaches to generating income may not provide the diversification benefits they once did, and they may actually introduce unwanted risk in today's market. To seek to improve your potential to live comfortably long term, we endeavor to pursue investments that explore less traveled paths to income.
n Navigate a changing interest rate environment
Today's uncertain market environment includes the prospect of a rise in interest rates. Blending traditional investments with non-traditional or alternative products may help protect your wealth during periods of volatility. We can attempt to help strengthen your portfolio with agile products designed to take on the market's ups and downs.
n Maximize after-tax returns
In an environment where what you keep may be more important than what you earn, municipal bonds can help mitigate high tax burdens while providing potentially attractive yields. Our state and federal tax-exempt products are aimed at helping investors manage risk, minimize the fluctuation of capital and grow wealth on a more tax-efficient basis.
n Grow assets to achieve financial goals
We believe that finding and protecting growth comes from a disciplined security selection process designed to create excess return. Our goal is to provide investment solutions built to help you face today's market challenges and grow your assets at each crossroad of your journey.
n Ease the impact of volatile markets
Despite a bull market run that has benefited many investors over the past several years, it's important to remember the lessons of 2008 and the value that a well-diversified portfolio may provide through times of market volatility. We are here to help you hold onto the savings you have worked tirelessly to amass, and to provide you the best opportunity to maintain your standard of living regardless of market conditions.
Find out today how we can help you confidently invest to realize your dreams. Please visit us at blog.columbiathreadneedleus.com/our-best-ideas to learn more about our unique investment solutions.
The world is constantly changing, but our priority remains the same: to help you secure your finances, meet your goals and achieve success. Thank you for your continued investment with us.
Sincerely,

Christopher O. Petersen
President, Columbia Funds
Investors should consider the investment objectives, risks, charges and expenses of a mutual fund carefully before investing. For a free prospectus and summary prospectus, which contains this and other important information about a fund, visit columbiathreadneedle.com/us. The prospectus should be read carefully before investing.
Columbia Funds are distributed by Columbia Management Investment Distributors, Inc., member FINRA, and managed by Columbia Management Investment Advisers, LLC.
© 2016 Columbia Management Investment Advisers, LLC. All rights reserved.
COLUMBIA CONVERTIBLE SECURITIES FUND
Performance Overview | | | 2 | | |
Manager Discussion of Fund Performance | | | 4 | | |
Understanding Your Fund's Expenses | | | 6 | | |
Portfolio of Investments | | | 7 | | |
Statement of Assets and Liabilities | | | 14 | | |
Statement of Operations | | | 16 | | |
Statement of Changes in Net Assets | | | 17 | | |
Financial Highlights | | | 20 | | |
Notes to Financial Statements | | | 30 | | |
Report of Independent Registered Public Accounting Firm | | | 39 | | |
Federal Income Tax Information | | | 40 | | |
Trustees and Officers | | | 41 | | |
Important Information About This Report | | | 47 | | |
Fund Investment Manager
Columbia Management Investment
Advisers, LLC
225 Franklin Street
Boston, MA 02110
Fund Distributor
Columbia Management Investment
Distributors, Inc.
225 Franklin Street
Boston, MA 02110
Fund Transfer Agent
Columbia Management Investment
Services Corp.
P.O. Box 8081
Boston, MA 02266-8081
For more information about any of the funds, please visit columbiathreadneedle.com/us or call 800.345.6611. Customer Service Representatives are available to answer your questions Monday through Friday from 8 a.m. to 7 p.m. Eastern time.
The views expressed in this report reflect the current views of the respective parties. These views are not guarantees of future performance and involve certain risks, uncertainties and assumptions that are difficult to predict, so actual outcomes and results may differ significantly from the views expressed. These views are subject to change at any time based upon economic, market or other conditions and the respective parties disclaim any responsibility to update such views. These views may not be relied on as investment advice and, because investment decisions for a Columbia fund are based on numerous factors, may not be relied on as an indication of trading intent on behalf of any particular Columbia fund. References to specific securities should not be construed as a recommendation or investment advice.
COLUMBIA CONVERTIBLE SECURITIES FUND
Performance Summary
n Columbia Convertible Securities Fund (the Fund) Class A shares returned -15.46% excluding sales charges for the 12-month period ended February 29, 2016.
n The Fund underperformed its benchmark, the BofAML All Convertibles All Qualities Index, which returned -11.70% for the same time period.
n In a difficult period for the convertibles market, the Fund underperformed its benchmark. Several technology and biotechnology positions were a significant drag on relative results.
Average Annual Total Returns (%) (for period ended February 29, 2016)
| | | Inception | | 1 Year | | 5 Years | | 10 Years | |
Class A | | 09/25/87 | | | | | | | |
Excluding sales charges | | | | | | | -15.46 | | | | 3.85 | | | | 4.26 | | |
Including sales charges | | | | | | | -20.31 | | | | 2.62 | | | | 3.65 | | |
Class B | | 07/15/98 | | | | | | | |
Excluding sales charges | | | | | | | -16.05 | | | | 3.07 | | | | 3.48 | | |
Including sales charges | | | | | | | -19.90 | | | | 2.73 | | | | 3.48 | | |
Class C | | 10/21/96 | | | | | | | |
Excluding sales charges | | | | | | | -16.06 | | | | 3.06 | | | | 3.48 | | |
Including sales charges | | | | | | | -16.83 | | | | 3.06 | | | | 3.48 | | |
Class I* | | 09/27/10 | | | -15.06 | | | | 4.27 | | | | 4.50 | | |
Class R* | | 11/16/11 | | | -15.63 | | | | 3.57 | | | | 3.91 | | |
Class R4* | | 11/08/12 | | | -15.21 | | | | 4.03 | | | | 4.36 | | |
Class R5* | | 11/08/12 | | | -15.13 | | | | 4.11 | | | | 4.40 | | |
Class W* | | 11/16/11 | | | -15.43 | | | | 3.81 | | | | 4.16 | | |
Class Y* | | 10/01/14 | | | -15.09 | | | | 3.97 | | | | 4.33 | | |
Class Z | | 05/21/99 | | | -15.21 | | | | 4.10 | | | | 4.54 | | |
BofAML All Convertibles All Qualities Index | | | | | | | -11.70 | | | | 5.40 | | | | 5.62 | | |
Returns for Class A are shown with and without the maximum initial sales charge of 5.75%. Returns for Class B are shown with and without the applicable contingent deferred sales charge (CDSC) of 5.00% in the first year, declining to 1.00% in the sixth year and eliminated thereafter. Returns for Class C are shown with and without the 1.00% CDSC for the first year only. The Fund's other classes are not subject to sales charges and have limited eligibility. Please see the Fund's prospectus for details. Performance for different share classes will vary based on differences in sales charges and fees associated with each class. All results shown assume reinvestment of distributions during the period. Returns do not reflect the deduction of taxes that a shareholder may pay on Fund distributions or on the redemption of Fund shares. Performance results reflect the effect of any fee waivers or reimbursements of Fund expenses by Columbia Management Investment Advisers, LLC and/or any of its affiliates. Absent these fee waivers or expense reimbursement arrangements, performance results would have been lower.
The performance information shown represents past performance and is not a guarantee of future results. The investment return and principal value of your investment will fluctuate so that your shares, when redeemed, may be worth more or less than their original cost. Current performance may be lower or higher than the performance information shown. You may obtain performance information current to the most recent month-end by contacting your financial intermediary, visiting columbiathreadneedle.com/us or calling 800.345.6611.
*The returns shown for periods prior to the share class inception date (including returns for the Life of the Fund, if shown, which are since Fund inception) include the returns of the Fund's oldest share class. These returns are adjusted to reflect any higher class-related operating expenses of the newer share classes, as applicable. Please visit columbiathreadneedle.com/us/investment-products/
mutual-funds/appended-performance for more information.
The BofAML All Convertibles All Qualities Index measures the performance of U.S. dollar-denominated convertible securities not currently in bankruptcy with a total market value greater than $50 million at issuance.
Indices are not available for investment, are not professionally managed and do not reflect sales charges, fees, brokerage commissions, taxes or other expenses of investing. Securities in the Fund may not match those in an index.
Annual Report 2016
2
COLUMBIA CONVERTIBLE SECURITIES FUND
PERFORMANCE OVERVIEW (continued)
Performance of a Hypothetical $10,000 Investment (March 1, 2006 – February 29, 2016)
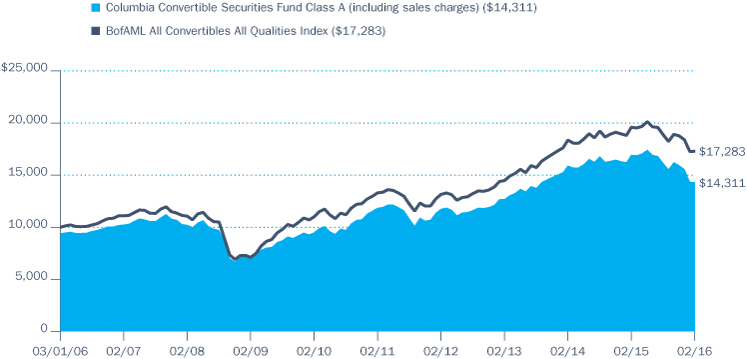
The chart above shows the change in value of a hypothetical $10,000 investment in Class A shares of Columbia Convertible Securities Fund during the stated time period, and does not reflect the deduction of taxes that a shareholder may pay on Fund distributions or on the redemption of Fund shares.
Annual Report 2016
3
COLUMBIA CONVERTIBLE SECURITIES FUND
MANAGER DISCUSSION OF FUND PERFORMANCE
Portfolio Management
David King, CFA
Yan Jin
Top Ten Holdings (%)
(at February 29, 2016) | |
Allergan PLC, 5.500% | | | 3.8 | | |
Intel Corp.
08/01/39 3.250% | | | 3.3
| | |
Teva Pharmaceutical
Industries Ltd.,
7.000% | | | 3.1
| | |
Microchip Technology, Inc.
02/15/25 1.625% | | | 2.7
| | |
Bank of America Corp.,
7.250% | | | 2.3
| | |
NextEra Energy, Inc.,
6.371% | | | 2.2
| | |
Lam Research Corp. | | | 1.8 | | |
Priceline Group, Inc. (The)
03/15/18 1.000% | | | 1.8
| | |
NVIDIA Corp.
12/01/18 1.000% | | | 1.7
| | |
Salesforce.com, Inc.
04/01/18 0.250% | | | 1.7
| | |
Percentages indicated are based upon total investments (excluding Money Market Funds).
For further detail about these holdings, please refer to the section entitled "Portfolio of Investments."
Fund holdings are as of the date given, are subject to change at any time, and are not recommendations to buy or sell any security.
Portfolio Breakdown (%)
(at February 29, 2016) | |
Common Stocks | | | 2.4 | | |
Convertible Bonds | | | 66.9 | | |
Convertible Preferred Stocks | | | 27.6 | | |
Equity-Linked Notes | | | 1.2 | | |
Money Market Funds | | | 1.9 | | |
Total | | | 100.0 | | |
Percentages indicated are based upon total investments. The Fund's portfolio composition is subject to change.
For the 12-month period ended February 29, 2016, the Fund's Class A shares returned -15.46% excluding sales charges. The Fund underperformed its benchmark, the BofAML All Convertibles All Qualities Index, which returned -11.70% for the same time period. Several technology and biotechnology positions were a significant drag on relative results.
Mounting Global Pressures Weighed on Markets
Around the world, investors turned negative over the 12-month period that ended February 29, 2016, as lackluster economic growth, contentious geopolitical conflicts and a shift in U.S. monetary policy weighed on confidence. Subpar global economic growth continued for a fourth straight year, with China's slowdown heading the list of disappointments. Conflicts in the Middle East and terrorism, both at home and abroad, heightened security fears. Plummeting oil prices and a rising dollar rounded the list of mounting pressures. A widening trade deficit also took a significant bite out of growth.
Despite these setbacks, the U.S. economy continued to expand for the seventh consecutive year. U.S. labor markets recovered to full employment and consumer spending strengthened. The housing market inched forward, although sales slipped near the end of the period as a new industry regulation led to longer closing periods. Manufacturing activity softened, putting a damper on growth.
Modest stock market gains in the first half of the period were wiped out in the second half. The S&P 500 Index, a broad measure of U.S. stock market performance, returned -6.19%, including dividends. Large-cap stocks held up better than mid- and small-cap stocks, and growth stocks outperformed value stocks. Convertible securities finished the year lower than domestic equities.
In December 2015, the Federal Reserve (the Fed) raised the target range of its benchmark interest rate by a quarter of a point, ending a lengthy debate about whether the economy was strong enough to withstand higher borrowing costs. Mixed economic signals early in 2016 put additional rate hikes on hold — at least for now.
A Challenging Period for the Convertibles Market
As the period began, the equity sensitivity of the convertibles market was considerably higher than its historical norm. Convertible issuance failed to keep up with demand during the years of strong equity market performance, from early 2009 through 2015, while interest rates remained low. As a result, older, in-the-money issues were highly sensitive to equity market movements. As stock prices fell across most market sectors and capitalization ranges, convertible securities suffered even more than the broad stock market, because convertible issuers tend to be smaller and more capital-intensive than the large-cap companies that dominate the S&P 500 Index. In addition to higher equity sensitivity, the convertibles market also suffered because credit spreads widened. (The majority of the convertibles market is non investment grade or Not Rated so widening spreads adversely affect prices.)
Annual Report 2016
4
COLUMBIA CONVERTIBLE SECURITIES FUND
MANAGER DISCUSSION OF FUND PERFORMANCE (continued)
Contributors and Detractors
Solid returns from Tyson Foods and Post Foods helped bolster results during the period. Tyson Foods has done a good job in integrating its acquisition of Hillshire Brands, which it acquired in 2014. The company has benefited from a consumer shift to protein-based diets and from lowered grain costs. An overweight in NextEra Energy in the utilities sector also aided returns.
Disappointments in several key names in the information technology and biotechnology sectors generally accounted for the Fund's shortfall relative to its benchmark. Positions in technology companies Micron and SunEdison, both long-term Fund holdings, dropped sharply. We reduced the Fund's exposure to Micron, a leading semiconductor multinational, during the period, but its substantial decline was a significant drag on Fund performance. A cloud of concern regarding accounting practices and management accountability hung over SunEdison, a global renewable energy company, and we sold the position. In biotechnology, bonds of Clovis Oncology and PTC Therapeutics suffered sharp losses. With a cancer drug that showed promise in shrinking tumor growth in Phase I clinical trials, Clovis fell sharply after Phase III trials failed to support earlier results. PTC, a pharmaceutical company focused on the development of small molecule, orally-administered treatments for orphan diseases, has a drug that targets Duchenne muscular dystrophy. However, the company has not been able to design a satisfactory trial to earn FDA approval, even though the drug has already been approved for use in Europe. The Fund's positions in Clovis and PTC are small and we held on to both of them. A position in Chesapeake Energy convertible preferred stock was a drag on performance. The company suspended its dividend and we sold it. Underexposure to the banking industry, which was relatively stable, also negatively impacted performance.
At Period's End
We believe the downdraft in the convertible securities market over the past 12 months has resulted in more attractive valuations and a more normal sensitivity to the equity market. While we are disappointed in last year's performance, we believe the environment at period's end was more attractive for our flexible management style. We continue to use bottom-up security selection to target convertible securities and other income-generating securities that have the potential for both price appreciation and high current income.
Investment Risks
Market risk may affect a single issuer, sector of the economy, industry or the market as a whole. Convertible securities are subject to issuer default risk. A rise in interest rates may result in a price decline of fixed-income instruments held by the Fund, negatively impacting its performance and NAV. Falling rates may result in the fund investing in lower yielding debt instruments, lowering the fund's income and yield. These risks may be heightened for longer maturity and duration securities. The Fund may also be forced to convert a convertible security at an inopportune time, which may decrease the Fund's return. Non-investment-grade (high-yield or junk) securities present greater price volatility and more risk to principal and income than higher rated securities. Foreign investments subject the Fund to risks, including political, economic, market, social and others within a particular country, as well as to currency instabilities and less stringent financial and accounting standards generally applicable to U.S. issuers. Short positions (where the underlying asset is not owned) can create unlimited risk. Market or other (e.g., interest rate) environments may adversely affect the liquidity of fund investments, negatively impacting their price. Generally, the less liquid the market at the time the Fund sells a holding, the greater the risk of loss or decline of value to the Fund. See the Fund's prospectus for information on these and other risks.
Annual Report 2016
5
COLUMBIA CONVERTIBLE SECURITIES FUND
UNDERSTANDING YOUR FUND'S EXPENSES
(Unaudited)
As an investor, you incur two types of costs. There are transaction costs, which generally include sales charges on purchases and may include redemption fees. There are also ongoing costs, which generally include management fees, distribution and/or service fees, and other fund expenses. The following information is intended to help you understand your ongoing costs (in dollars) of investing in the Fund and to help you compare these costs with the ongoing costs of investing in other mutual funds.
Analyzing Your Fund's Expenses
To illustrate these ongoing costs, we have provided examples and calculated the expenses paid by investors in each share class of the Fund during the period. The actual and hypothetical information in the table is based on an initial investment of $1,000 at the beginning of the period indicated and held for the entire period. Expense information is calculated two ways and each method provides you with different information. The amount listed in the "Actual" column is calculated using the Fund's actual operating expenses and total return for the period. You may use the Actual information, together with the amount invested, to estimate the expenses that you paid over the period. Simply divide your account value by $1,000 (for example, an $8,600 account value divided by $1,000 = 8.6), then multiply the results by the expenses paid during the period under the "Actual" column. The amount listed in the "Hypothetical" column assumes a 5% annual rate of return before expenses (which is not the Fund's actual return) and then applies the Fund's actual expense ratio for the period to the hypothetical return. You should not use the hypothetical account values and expenses to estimate either your actual account balance at the end of the period or the expenses you paid during the period. See "Compare With Other Funds" below for details on how to use the hypothetical data.
Compare With Other Funds
Since all mutual funds are required to include the same hypothetical calculations about expenses in shareholder reports, you can use this information to compare the ongoing cost of investing in the Fund with other funds. To do so, compare the hypothetical example with the 5% hypothetical examples that appear in the shareholder reports of other funds. As you compare hypothetical examples of other funds, it is important to note that hypothetical examples are meant to highlight the ongoing costs of investing in a fund only and do not reflect any transaction costs, such as sales charges, or redemption or exchange fees. Therefore, the hypothetical calculations are useful in comparing ongoing costs only, and will not help you determine the relative total costs of owning different funds. If transaction costs were included in these calculations, your costs would be higher.
September 1, 2015 – February 29, 2016
| | | Account Value at the Beginning
of the Period ($) | | Account Value at the End of the
Period ($) | | Expenses Paid During the
Period ($) | | Fund's Annualized
Expense Ratio (%) | |
| | | Actual | | Hypothetical | | Actual | | Hypothetical | | Actual | | Hypothetical | | Actual | |
Class A | | | 1,000.00 | | | | 1,000.00 | | | | 886.80 | | | | 1,019.24 | | | | 5.30 | | | | 5.67 | | | | 1.13 | | |
Class B | | | 1,000.00 | | | | 1,000.00 | | | | 883.80 | | | | 1,015.51 | | | | 8.81 | | | | 9.42 | | | | 1.88 | | |
Class C | | | 1,000.00 | | | | 1,000.00 | | | | 883.40 | | | | 1,015.51 | | | | 8.80 | | | | 9.42 | | | | 1.88 | | |
Class I | | | 1,000.00 | | | | 1,000.00 | | | | 889.00 | | | | 1,021.28 | | | | 3.38 | | | | 3.62 | | | | 0.72 | | |
Class R | | | 1,000.00 | | | | 1,000.00 | | | | 886.10 | | | | 1,018.00 | | | | 6.47 | | | | 6.92 | | | | 1.38 | | |
Class R4 | | | 1,000.00 | | | | 1,000.00 | | | | 887.90 | | | | 1,020.49 | | | | 4.13 | | | | 4.42 | | | | 0.88 | | |
Class R5 | | | 1,000.00 | | | | 1,000.00 | | | | 888.80 | | | | 1,021.03 | | | | 3.62 | | | | 3.87 | | | | 0.77 | | |
Class W | | | 1,000.00 | | | | 1,000.00 | | | | 887.10 | | | | 1,019.24 | | | | 5.30 | | | | 5.67 | | | | 1.13 | | |
Class Y | | | 1,000.00 | | | | 1,000.00 | | | | 888.70 | | | | 1,021.28 | | | | 3.38 | | | | 3.62 | | | | 0.72 | | |
Class Z | | | 1,000.00 | | | | 1,000.00 | | | | 888.20 | | | | 1,020.49 | | | | 4.13 | | | | 4.42 | | | | 0.88 | | |
Expenses paid during the period are equal to the annualized expense ratio for each class as indicated above, multiplied by the average account value over the period and then multiplied by the number of days in the Fund's most recent fiscal half year and divided by 366.
Expenses do not include fees and expenses incurred indirectly by the Fund from its investment in underlying funds, including affiliated and non-affiliated pooled investment vehicles, such as mutual funds and exchange-traded funds.
Had Columbia Management Investment Advisers, LLC and/or certain of its affiliates not waived/reimbursed certain fees and expenses, account value at the end of the period would have been reduced.
Annual Report 2016
6
COLUMBIA CONVERTIBLE SECURITIES FUND
PORTFOLIO OF INVESTMENTS
February 29, 2016
(Percentages represent value of investments compared to net assets)
Common Stocks 2.3%
Issuer | | Shares | | Value ($) | |
INDUSTRIALS 0.5% | |
Transportation Infrastructure 0.5% | |
Macquarie Infrastructure Corp. | | | 61,000 | | | | 3,724,050 | | |
Total Industrials | | | | | 3,724,050 | | |
INFORMATION TECHNOLOGY 1.8% | |
Semiconductors & Semiconductor Equipment 1.8% | |
Lam Research Corp. | | | 167,000 | | | | 12,241,100 | | |
Total Information Technology | | | | | 12,241,100 | | |
MATERIALS — % | |
Metals & Mining — % | |
Jaguar Mining, Inc.(a) | | | 1,244,388 | | | | 174,748 | | |
Total Materials | | | | | 174,748 | | |
Total Common Stocks
(Cost: $15,219,854) | | | | | 16,139,898 | | |
Convertible Preferred Stocks 27.3%
CONSUMER STAPLES 2.8% | |
Food Products 2.8% | |
Bunge Ltd., 4.875% | | | 105,200 | | | | 8,358,898 | | |
Tyson Foods, Inc., 4.750% | | | 147,300 | | | | 10,620,330 | | |
Total | | | | | 18,979,228 | | |
Total Consumer Staples | | | | | 18,979,228 | | |
ENERGY 2.6% | |
Oil, Gas & Consumable Fuels 2.6% | |
Anadarko Petroleum Corp., 7.500% | | | 140,000 | | | | 4,190,200 | | |
Hess Corp., 8.000% | | | 105,000 | | | | 5,846,400 | | |
Kinder Morgan, Inc., 9.750% | | | 121,100 | | | | 5,293,281 | | |
Penn Virginia Corp., 6.000% | | | 69,700 | | | | 20,687 | | |
Southwestern Energy Co., 6.250% | | | 165,000 | | | | 2,352,900 | | |
Total | | | | | 17,703,468 | | |
Total Energy | | | | | 17,703,468 | | |
FINANCIALS 9.1% | |
Banks 2.2% | |
Bank of America Corp., 7.250% | | | 13,900 | | | | 15,311,545 | | |
Convertible Preferred Stocks (continued)
Issuer | | Shares | | Value ($) | |
Capital Markets 1.7% | |
AMG Capital Trust II, 5.150% | | | 148,400 | | | | 7,308,700 | | |
Cowen Group, Inc., 5.625%(c)(d) | | | 6,200 | | | | 4,134,625 | | |
Total | | | | | 11,443,325 | | |
Real Estate Investment Trusts (REITs) 5.2% | |
Alexandria Real Estate Equities, Inc.,
7.000% | | | 281,300 | | | | 7,763,880 | | |
American Tower Corp., 5.250% | | | 59,900 | | | | 5,930,100 | | |
American Tower Corp., 5.500% | | | 66,200 | | | | 6,444,570 | | |
Crown Castle International Corp.,
4.500% | | | 81,500 | | | | 8,659,375 | | |
Welltower, Inc., 5.510% | | | 122,500 | | | | 7,133,175 | | |
Total | | | | | 35,931,100 | | |
Total Financials | | | | | 62,685,970 | | |
HEALTH CARE 7.9% | |
Health Care Providers & Services 1.3% | |
Anthem, Inc., 5.250% | | | 200,000 | | | | 8,848,000 | | |
Pharmaceuticals 6.6% | |
Allergan PLC, 5.500% | | | 26,000 | | | | 25,115,480 | | |
Teva Pharmaceutical Industries Ltd.,
7.000% | | | 22,700 | | | | 20,600,250 | | |
Total | | | | | 45,715,730 | | |
Total Health Care | | | | | 54,563,730 | | |
MATERIALS 0.5% | |
Chemicals 0.5% | |
A. Schulman, Inc., 6.000% | | | 5,175 | | | | 3,450,897 | | |
Total Materials | | | | | 3,450,897 | | |
TELECOMMUNICATION SERVICES 2.3% | |
Diversified Telecommunication Services 1.3% | |
Frontier Communications Corp.,
11.125% | | | 85,400 | | | | 8,659,560 | | |
Wireless Telecommunication Services 1.0% | |
T-Mobile USA, Inc., 5.500% | | | 107,200 | | | | 6,868,304 | | |
Total Telecommunication Services | | | | | 15,527,864 | | |
UTILITIES 2.1% | |
Electric Utilities 2.1% | |
NextEra Energy, Inc., 6.371% | | | 264,700 | | | | 14,690,850 | | |
Total Utilities | | | | | 14,690,850 | | |
Total Convertible Preferred Stocks
(Cost: $201,476,577) | | | | | 187,602,007 | | |
The accompanying Notes to Financial Statements are an integral part of this statement.
Annual Report 2016
7
COLUMBIA CONVERTIBLE SECURITIES FUND
PORTFOLIO OF INVESTMENTS (continued)
February 29, 2016
Convertible Bonds 66.2%
Issuer | | Coupon
Rate | | Principal
Amount ($) | | Value ($) | |
AUTOMOTIVE 0.8% | |
Navistar International Corp.
04/15/19 | | | 4.750 | % | | | 14,580,000 | | | | 5,376,375 | | |
BUILDING MATERIALS 0.5% | |
Cemex SAB de CV
03/15/18 | | | 3.750 | % | | | 4,000,000 | | | | 3,677,500 | | |
CONSUMER PRODUCTS 1.3% | |
Jarden Corp.
09/15/18 | | | 1.875 | % | | | 5,250,000 | | | | 8,875,781 | | |
ELECTRIC 2.1% | |
NRG Yield, Inc.(c)
06/01/20 | | | 3.250 | % | | | 9,400,000 | | | | 7,672,750 | | |
SunPower Corp.(c)
01/15/23 | | | 4.000 | % | | | 6,900,000 | | | | 7,170,894 | | |
Total | | | | | | | 14,843,644 | | |
FINANCE COMPANIES 0.8% | |
Air Lease Corp.
12/01/18 | | | 3.875 | % | | | 4,570,000 | | | | 5,835,319 | | |
HEALTH CARE 3.6% | |
Brookdale Senior Living, Inc.
06/15/18 | | | 2.750 | % | | | 4,920,000 | | | | 4,655,550 | | |
Endologix, Inc.
11/01/20 | | | 3.250 | % | | | 4,600,000 | | | | 4,579,875 | | |
Fluidigm Corp.
02/01/34 | | | 2.750 | % | | | 8,040,000 | | | | 3,937,285 | | |
Immunomedics, Inc.
02/15/20 | | | 4.750 | % | | | 4,970,000 | | | | 3,485,734 | | |
Invacare Corp.(c)
02/15/21 | | | 5.000 | % | | | 3,385,000 | | | | 3,273,701 | | |
Novavax, Inc.(c)
02/01/23 | | | 3.750 | % | | | 5,300,000 | | | | 4,671,155 | | |
Total | | | | | | | 24,603,300 | | |
HEALTHCARE INSURANCE 1.1% | |
Molina Healthcare, Inc.
08/15/44 | | | 1.625 | % | | | 6,050,000 | | | | 7,430,156 | | |
HOME CONSTRUCTION 0.6% | |
CalAtlantic Group, Inc.
05/15/18 | | | 1.625 | % | | | 3,620,000 | | | | 4,208,250 | | |
Convertible Bonds (continued)
Issuer | | Coupon
Rate | | Principal
Amount ($) | | Value ($) | |
INDEPENDENT ENERGY 1.0% | |
Pattern Energy Group, Inc.(c)
07/15/20 | | | 4.000 | % | | | 6,420,000 | | | | 5,368,725 | | |
Stone Energy Corp.
03/01/17 | | | 1.750 | % | | | 2,810,000 | | | | 1,545,500 | | |
Total | | | | | | | 6,914,225 | | |
INTEGRATED ENERGY —% | |
Ascent Resources — Utica LLC(c)(e)
03/01/21 | | | 3.500 | % | | | 4,865,272 | | | | 201,422 | | |
MEDIA AND ENTERTAINMENT 2.2% | |
Liberty Interactive LLC
03/30/43 | | | 0.750 | % | | | 6,700,000 | | | | 10,410,125 | | |
Pandora Media, Inc.(c)
12/01/20 | | | 1.750 | % | | | 5,180,000 | | | | 4,678,187 | | |
Total | | | | | | | 15,088,312 | | |
MIDSTREAM 0.6% | |
Scorpio Tankers, Inc.(c)
07/01/19 | | | 2.375 | % | | | 4,790,000 | | | | 3,947,650 | | |
OIL FIELD SERVICES 0.6% | |
Cobalt International Energy, Inc.
12/01/19 | | | 2.625 | % | | | 8,450,000 | | | | 3,865,892 | | |
Energy XXI Ltd.
12/15/18 | | | 3.000 | % | | | 10,830,000 | | | | 65,002 | | |
Total | | | | | | | 3,930,894 | | |
OTHER FINANCIAL INSTITUTIONS 2.3% | |
American Energy-Permian Basin LLC
Junior Subordinated PIK(c)
05/01/22 | | | 8.000 | % | | | 5,200,000 | | | | 754,000 | | |
Encore Capital Group, Inc.
03/15/21 | | | 2.875 | % | | | 5,610,000 | | | | 3,576,375 | | |
Forest City Realty Trust, Inc.
08/15/20 | | | 3.625 | % | | | 7,995,000 | | | | 7,975,012 | | |
Walter Investment Management Corp.
11/01/19 | | | 4.500 | % | | | 7,130,000 | | | | 3,832,375 | | |
Total | | | | | | | 16,137,762 | | |
OTHER INDUSTRY 0.5% | |
General Cable Corp.
Subordinated(f)
11/15/29 | | | 4.500 | % | | | 8,610,000 | | | | 3,207,225 | | |
The accompanying Notes to Financial Statements are an integral part of this statement.
Annual Report 2016
8
COLUMBIA CONVERTIBLE SECURITIES FUND
PORTFOLIO OF INVESTMENTS (continued)
February 29, 2016
Convertible Bonds (continued)
Issuer | | Coupon
Rate | | Principal
Amount ($) | | Value ($) | |
OTHER REIT 4.0% | |
Blackstone Mortgage Trust, Inc.
12/01/18 | | | 5.250 | % | | | 4,440,000 | | | | 4,445,061 | | |
Colony Starwood Homes
07/01/19 | | | 3.000 | % | | | 3,376,000 | | | | 3,205,090 | | |
Extra Space Storage LP(c)
10/01/35 | | | 3.125 | % | | | 7,310,000 | | | | 7,949,625 | | |
RWT Holdings, Inc
11/15/19 | | | 5.625 | % | | | 4,840,000 | | | | 4,356,000 | | |
Starwood Property Trust, Inc.
10/15/17 | | | 3.750 | % | | | 7,770,000 | | | | 7,570,894 | | |
Total | | | | | | | 27,526,670 | | |
OTHER UTILITY 0.6% | |
EnerNOC, Inc.
08/15/19 | | | 2.250 | % | | | 6,100,000 | | | | 3,972,826 | | |
PHARMACEUTICALS 10.1% | |
AMAG Pharmaceuticals, Inc.
02/15/19 | | | 2.500 | % | | | 4,100,000 | | | | 4,707,313 | | |
ARIAD Pharmaceuticals, Inc.(c)
06/15/19 | | | 3.625 | % | | | 4,900,000 | | | | 4,455,227 | | |
Aegerion Pharmaceuticals, Inc.
08/15/19 | | | 2.000 | % | | | 8,260,000 | | | | 4,582,235 | | |
BioMarin Pharmaceutical, Inc.
10/15/20 | | | 1.500 | % | | | 9,500,000 | | | | 11,132,812 | | |
Clovis Oncology, Inc.
09/15/21 | | | 2.500 | % | | | 3,100,000 | | | | 2,073,125 | | |
Corsicanto Ltd.
01/15/32 | | | 3.500 | % | | | 5,550,000 | | | | 4,381,031 | | |
Impax Laboratories, Inc.(c)
06/15/22 | | | 2.000 | % | | | 7,690,000 | | | | 6,906,581 | | |
Incyte Corp.
11/15/20 | | | 1.250 | % | | | 4,800,000 | | | | 7,648,608 | | |
Jazz Investments I Ltd.
08/15/21 | | | 1.875 | % | | | 4,290,000 | | | | 4,309,262 | | |
Medicines Co. (The)
01/15/22 | | | 2.500 | % | | | 4,110,000 | | | | 4,728,021 | | |
Merrimack Pharmaceuticals, Inc.
07/15/20 | | | 4.500 | % | | | 3,020,000 | | | | 3,554,163 | | |
PTC Therapeutics, Inc.(c)
08/15/22 | | | 3.000 | % | | | 5,900,000 | | | | 2,743,500 | | |
Pacira Pharmaceuticals, Inc.
02/01/19 | | | 3.250 | % | | | 1,650,000 | | | | 3,545,289 | | |
TESARO, Inc.
10/01/21 | | | 3.000 | % | | | 3,270,000 | | | | 4,518,731 | | |
Total | | | | | | | 69,285,898 | | |
Convertible Bonds (continued)
Issuer | | Coupon
Rate | | Principal
Amount ($) | | Value ($) | |
PROPERTY & CASUALTY 1.8% | |
MGIC Investment Corp.
04/01/20 | | | 2.000 | % | | | 3,620,000 | | | | 4,178,838 | | |
MGIC Investment Corp.(c)(f)
Junior Subordinated
04/01/63 | | | 9.000 | % | | | 7,820,000 | | | | 8,606,887 | | |
Total | | | | | | | 12,785,725 | | |
RAILROADS 1.0% | |
Greenbrier Companies, Inc. (The)
04/01/18 | | | 3.500 | % | | | 6,700,000 | | | | 6,905,188 | | |
REFINING 0.4% | |
Clean Energy Fuels Corp.(c)
10/01/18 | | | 5.250 | % | | | 5,820,000 | | | | 2,771,868 | | |
RETAILERS 3.2% | |
Iconix Brand Group, Inc.
06/01/16 | | | 2.500 | % | | | 2,800,000 | | | | 2,593,500 | | |
03/15/18 | | | 1.500 | % | | | 7,100,000 | | | | 3,900,562 | | |
Priceline Group, Inc. (The)
03/15/18 | | | 1.000 | % | | | 8,490,000 | | | | 11,901,919 | | |
Restoration Hardware Holdings, Inc.(b)(c)
07/15/20 | | | 0.000 | % | | | 4,825,000 | | | | 3,355,402 | | |
Total | | | | | | | 21,751,383 | | |
TECHNOLOGY 24.0% | |
Broadsoft, Inc.(c)
09/01/22 | | | 1.000 | % | | | 4,200,000 | | | | 4,724,286 | | |
Ciena Corp.
12/15/20 | | | 4.000 | % | | | 4,180,000 | | | | 5,379,137 | | |
Ciena Corp.(c)
10/15/18 | | | 3.750 | % | | | 1,510,000 | | | | 1,846,202 | | |
Ctrip.com International Ltd.(c)
07/01/25 | | | 1.990 | % | | | 3,900,000 | | | | 4,087,688 | | |
Envestnet, Inc.
12/15/19 | | | 1.750 | % | | | 7,000,000 | | | | 5,796,875 | | |
Exelixis, Inc.
08/15/19 | | | 4.250 | % | | | 3,890,000 | | | | 3,578,800 | | |
FireEye, Inc.(c)
06/01/35 | | | 1.625 | % | | | 6,800,000 | | | | 5,355,000 | | |
Integrated Device Technology, Inc.(c)
11/15/22 | | | 0.875 | % | | | 5,340,000 | | | | 4,802,662 | | |
Intel Corp.
Junior Subordinated
08/01/39 | | | 3.250 | % | | | 14,920,000 | | | | 22,137,550 | | |
LinkedIn Corp.
11/01/19 | | | 0.500 | % | | | 5,340,000 | | | | 4,762,613 | | |
The accompanying Notes to Financial Statements are an integral part of this statement.
Annual Report 2016
9
COLUMBIA CONVERTIBLE SECURITIES FUND
PORTFOLIO OF INVESTMENTS (continued)
February 29, 2016
Convertible Bonds (continued)
Issuer | | Coupon
Rate | | Principal
Amount ($) | | Value ($) | |
Microchip Technology, Inc.
02/15/25 | | | 1.625 | % | | | 18,750,000 | | | | 17,988,281 | | |
Micron Technology, Inc.
02/15/33 | | | 2.125 | % | | | 3,150,000 | | | | 3,760,313 | | |
NVIDIA Corp.
12/01/18 | | | 1.000 | % | | | 7,190,000 | | | | 11,557,925 | | |
NXP Semiconductors NV
12/01/19 | | | 1.000 | % | | | 6,700,000 | | | | 7,089,270 | | |
Nuance Communications, Inc.(c)
12/15/35 | | | 1.000 | % | | | 7,320,000 | | | | 6,981,889 | | |
Palo Alto Networks, Inc.(b)
07/01/19 | | | 0.000 | % | | | 5,330,000 | | | | 7,618,569 | | |
Red Hat, Inc.
10/01/19 | | | 0.250 | % | | | 4,430,000 | | | | 5,152,644 | | |
Salesforce.com, Inc.
04/01/18 | | | 0.250 | % | | | 9,510,000 | | | | 11,340,675 | | |
ServiceNow, Inc.(b)
11/01/18 | | | 0.000 | % | | | 4,960,000 | | | | 5,161,500 | | |
SunEdison, Inc.(c)
07/02/18 | | | 5.000 | % | | | 4,320,000 | | | | 2,748,600 | | |
TiVo, Inc.
10/01/21 | | | 2.000 | % | | | 10,095,000 | | | | 8,650,910 | | |
Workday, Inc.
07/15/20 | | | 1.500 | % | | | 7,750,000 | | | | 8,234,375 | | |
j2 Global, Inc.
06/15/29 | | | 3.250 | % | | | 5,094,000 | | | | 6,208,312 | | |
Total | | | | | | | 164,964,076 | | |
TOBACCO 1.1% | |
Vector Group Ltd.(f)
04/15/20 | | | 1.750 | % | | | 6,520,000 | | | | 7,305,399 | | |
TRANSPORTATION SERVICES 1.5% | |
Atlas Air Worldwide Holdings, Inc.
06/01/22 | | | 2.250 | % | | | 5,530,000 | | | | 4,216,625 | | |
Echo Global Logistics, Inc.
05/01/20 | | | 2.500 | % | | | 6,500,000 | | | | 6,179,063 | | |
Total | | | | | | | 10,395,688 | | |
Convertible Bonds (continued)
Issuer | | Coupon
Rate | | Principal
Amount ($) | | Value ($) | |
WIRELESS 0.5% | |
Gogo, Inc.(c)
03/01/20 | | | 3.750 | % | | | 4,500,000 | | | | 3,437,640 | | |
Total Convertible Bonds
(Cost: $516,191,847) | | | | | | | 455,380,176 | | |
Equity-Linked Notes 1.2%
Issuer | | Coupon
Rate | | Shares | | Value ($) | |
Nomura Resecuritization Trust
(linked to common stock of Yahoo!, Inc.)(c)
11/22/16 | | | 1.720 | % | | | 10,000 | | | | 8,254,000 | | |
Total Equity-Linked Notes
(Cost: $10,000,000) | | | | | | | 8,254,000 | | |
Money Market Funds 1.9%
| | | Shares | | Value ($) | |
Columbia Short-Term Cash Fund,
0.420%(g)(h) | | | 13,331,793 | | | | 13,331,793 | | |
Total Money Market Funds
(Cost: $13,331,793) | | | | | 13,331,793 | | |
Total Investments
(Cost: $756,220,071) | | | | | 680,707,874 | | |
Other Assets & Liabilities, Net | | | | | 7,278,935 | | |
Net Assets | | | | | 687,986,809 | | |
Notes to Portfolio of Investments
(a) Non-income producing investment.
(b) Zero coupon bond.
(c) Represents privately placed and other securities and instruments exempt from SEC registration (collectively, private placements), such as Section 4(a)(2) and Rule 144A eligible securities, which are often sold only to qualified institutional buyers. The Fund may invest in private placements determined to be liquid as well as those determined to be illiquid. Private placements may be determined to be liquid under guidelines established by the Fund's Board of Trustees. At February 29, 2016, the value of these securities amounted to $120,920,853 or 17.58% of net assets.
The accompanying Notes to Financial Statements are an integral part of this statement.
Annual Report 2016
10
COLUMBIA CONVERTIBLE SECURITIES FUND
PORTFOLIO OF INVESTMENTS (continued)
February 29, 2016
Notes to Portfolio of Investments (continued)
(d) Identifies securities considered by the Investment Manager to be illiquid and may be difficult to sell. The aggregate value of such securities at February 29, 2016 was $4,134,625, which represents 0.60% of net assets. Information concerning such security holdings at February 29, 2016 is as follows:
Security Description | | Acquisition Dates | | Cost ($) | |
Cowen Group, Inc. | | 05/14/2015 – 10/15/2015 | | | 6,054,868 | | |
(e) Represents fair value as determined in good faith under procedures approved by the Board of Trustees. At February 29, 2016, the value of these securities amounted to $201,422, which represents 0.03% of net assets.
(f) Variable rate security.
(g) The rate shown is the seven-day current annualized yield at February 29, 2016.
(h) As defined in the Investment Company Act of 1940, an affiliated company is one in which the Fund owns 5% or more of the company's outstanding voting securities, or a company which is under common ownership or control with the Fund. Holdings and transactions in these affiliated companies during the year ended February 29, 2016 are as follows:
Issuer | | Beginning
Cost ($) | | Purchase
Cost ($) | | Proceeds
From Sales ($) | | Ending
Cost ($) | | Dividends —
Affiliated
Issuers ($) | | Value ($) | |
Columbia Short-Term Cash Fund | | | 71,773,939 | | | | 563,528,037 | | | | (621,970,183 | ) | | | 13,331,793 | | | | 64,841 | | | | 13,331,793 | | |
Abbreviation Legend
PIK Payment-in-Kind
Fair Value Measurements
The Fund categorizes its fair value measurements according to a three-level hierarchy that maximizes the use of observable inputs and minimizes the use of unobservable inputs by prioritizing that the most observable input be used when available. Observable inputs are those that market participants would use in pricing an investment based on market data obtained from sources independent of the reporting entity. Unobservable inputs are those that reflect the Fund's assumptions about the information market participants would use in pricing an investment. An investment's level within the fair value hierarchy is based on the lowest level of any input that is deemed significant to the asset's or liability's fair value measurement. The input levels are not necessarily an indication of the risk or liquidity associated with investments at that level. For example, certain U.S. government securities are generally high quality and liquid, however, they are reflected as Level 2 because the inputs used to determine fair value may not always be quoted prices in an active market.
Fair value inputs are summarized in the three broad levels listed below:
> Level 1 — Valuations based on quoted prices for investments in active markets that the Fund has the ability to access at the measurement date (including NAV for open-end mutual funds). Valuation adjustments are not applied to Level 1 investments.
> Level 2 — Valuations based on other significant observable inputs (including quoted prices for similar securities, interest rates, prepayment speeds, credit risks, etc.).
> Level 3 — Valuations based on significant unobservable inputs (including the Fund's own assumptions and judgment in determining the fair value of investments).
Inputs that are used in determining fair value of an investment may include price information, credit data, volatility statistics, and other factors. These inputs can be either observable or unobservable. The availability of observable inputs can vary between investments, and is affected by various factors such as the type of investment, and the volume and level of activity for that investment or similar investments in the marketplace. The inputs will be considered by the Investment Manager, along with any other relevant factors in the calculation of an investment's fair value. The Fund uses prices and inputs that are current as of the measurement date, which may include periods of market dislocations. During these periods, the availability of prices and inputs may be reduced for many investments. This condition could cause an investment to be reclassified between the various levels within the hierarchy.
Foreign equity securities actively traded in markets where there is a significant delay in the local close relative to the New York Stock Exchange (NYSE) are classified as Level 2. The values of these securities may include an adjustment to reflect the impact of significant market movements following the close of local trading, as described in Note 2 to the financial statements — Security Valuation.
Investments falling into the Level 3 category are primarily supported by quoted prices from brokers and dealers participating in the market for those investments. However, these may be classified as Level 3 investments due to lack of market transparency and corroboration to support these quoted prices. Additionally, valuation models may be used as the pricing source for any remaining investments classified as Level 3. These models may rely on one or more significant unobservable inputs and/or significant assumptions by the Investment Manager. Inputs
The accompanying Notes to Financial Statements are an integral part of this statement.
Annual Report 2016
11
COLUMBIA CONVERTIBLE SECURITIES FUND
PORTFOLIO OF INVESTMENTS (continued)
February 29, 2016
Fair Value Measurements (continued)
used in valuations may include, but are not limited to, financial statement analysis, capital account balances, discount rates and estimated cash flows, and comparable company data.
Under the direction of the Fund's Board of Trustees (the Board), the Investment Manager's Valuation Committee (the Committee) is responsible for overseeing the valuation procedures approved by the Board. The Committee consists of voting and non-voting members from various groups within the Investment Manager's organization, including operations and accounting, trading and investments, compliance, risk management and legal.
The Committee meets at least monthly to review and approve valuation matters, which may include a description of specific valuation determinations, data regarding pricing information received from approved pricing vendors and brokers and the results of Board-approved valuation control policies and procedures (the Policies). The Policies address, among other things, instances when market quotations are or are not readily available, including recommendations of third party pricing vendors and a determination of appropriate pricing methodologies; events that require specific valuation determinations and assessment of fair value techniques; securities with a potential for stale pricing, including those that are illiquid, restricted, or in default; and the effectiveness of third party pricing vendors, including periodic reviews of vendors. The Committee meets more frequently, as needed, to discuss additional valuation matters, which may include the need to review back-testing results, review time-sensitive information or approve related valuation actions. The Committee reports to the Board, with members of the Committee meeting with the Board at each of its regularly scheduled meetings to discuss valuation matters and actions during the period, similar to those described earlier.
For investments categorized as Level 3, the Committee monitors information similar to that described above, which may include: (i) data specific to the issuer or comparable issuers, (ii) general market or specific sector news and (iii) quoted prices and specific or similar security transactions. The Committee considers this data and any changes from prior periods in order to assess the reasonableness of observable and unobservable inputs, any assumptions or internal models used to value those securities and changes in fair value. This data is also used to corroborate, when available, information received from approved pricing vendors and brokers. Various factors impact the frequency of monitoring this information (which may occur as often as daily). However, the Committee may determine that changes to inputs, assumptions and models are not required as a result of the monitoring procedures performed.
The following table is a summary of the inputs used to value the Fund's investments at February 29, 2016:
| | | Level 1
Quoted Prices in Active
Markets for Identical
Assets ($) | | Level 2
Other Significant
Observable Inputs ($) | | Level 3
Significant
Unobservable Inputs ($) | | Total ($) | |
Investments | |
Common Stocks | |
Industrials | | | 3,724,050 | | | | — | | | | — | | | | 3,724,050 | | |
Information Technology | | | 12,241,100 | | | | — | | | | — | | | | 12,241,100 | | |
Materials | | | — | | | | 174,748 | | | | — | | | | 174,748 | | |
Total Common Stocks | | | 15,965,150 | | | | 174,748 | | | | — | | | | 16,139,898 | | |
Convertible Preferred Stocks | |
Consumer Staples | | | 10,620,330 | | | | 8,358,898 | | | | — | | | | 18,979,228 | | |
Energy | | | 17,682,781 | | | | 20,687 | | | | — | | | | 17,703,468 | | |
Financials | | | 43,478,765 | | | | 19,207,205 | | | | — | | | | 62,685,970 | | |
Health Care | | | 54,563,730 | | | | — | | | | — | | | | 54,563,730 | | |
Materials | | | — | | | | 3,450,897 | | | | — | | | | 3,450,897 | | |
Telecommunication Services | | | 15,527,864 | | | | — | | | | — | | | | 15,527,864 | | |
Utilities | | | 14,690,850 | | | | — | | | | — | | | | 14,690,850 | | |
Total Convertible Preferred Stocks | | | 156,564,320 | | | | 31,037,687 | | | | — | | | | 187,602,007 | | |
Convertible Bonds | | | — | | | | 455,178,754 | | | | 201,422 | | | | 455,380,176 | | |
Equity-Linked Notes | | | — | | | | 8,254,000 | | | | — | | | | 8,254,000 | | |
Money Market Funds | | | — | | | | 13,331,793 | | | | — | | | | 13,331,793 | | |
Total Investments | | | 172,529,470 | | | | 507,976,982 | | | | 201,422 | | | | 680,707,874 | | |
The accompanying Notes to Financial Statements are an integral part of this statement.
Annual Report 2016
12
COLUMBIA CONVERTIBLE SECURITIES FUND
PORTFOLIO OF INVESTMENTS (continued)
February 29, 2016
Fair Value Measurements (continued)
See the Portfolio of Investments for all investment classifications not indicated in the table.
The Fund's assets assigned to the Level 2 input category are generally valued using the market approach, in which a security's value is determined through reference to prices and information from market transactions for similar or identical assets and/or fund per share market values which are not considered publicly available. These assets include certain foreign securities for which a third party statistical pricing service may be employed for purposes of fair market valuation. The model utilized by such third party statistical pricing service takes into account a security's correlation to available market data including, but not limited to, intraday index, ADR, and exchange-traded fund movements.
Financial assets were transferred from Level 1 to Level 2 as the market for these assets is not considered publicly available. Fund per share market values were obtained using observable market inputs.
Financial assets were transferred from Level 2 to Level 1 as the market for these assets was deemed to be active during the period and fair values were consequently obtained using quoted prices for identical assets rather than being based upon other observable market inputs as of period end.
The following table shows transfers between Level 1 and Level 2 of the fair value hierarchy:
Transfers In | | Transfers Out | |
| Level 1 ($) | | Level 2 ($) | | Level 1 ($) | | Level 2 ($) | |
| | 22,819,599 | | | | 71,773,939 | | | | 71,773,939 | | | | 22,819,599 | | |
Transfers between Level 1 and Level 2 are determined based on the fair value at the beginning of the period for security positions held throughout the period.
The Fund does not hold any significant investments (greater than one percent of net assets) categorized as Level 3.
The Fund's assets assigned to the Level 3 category are valued utilizing the valuation technique deemed the most appropriate in the circumstances. Certain convertible bonds classified as Level 3 are valued using a market approach. To determine fair value for these securities, management considered various factors which may have included, but were not limited to, the closing prices of similar securities from the issuer and quoted bids from market participants. Significant increases (decreases) to any of these inputs would result in a significantly lower (higher) fair value measurement.
The accompanying Notes to Financial Statements are an integral part of this statement.
Annual Report 2016
13
COLUMBIA CONVERTIBLE SECURITIES FUND
STATEMENT OF ASSETS AND LIABILITIES
February 29, 2016
Assets | |
Investments, at value | |
Unaffiliated issuers (identified cost $742,888,278) | | $ | 667,376,081 | | |
Affiliated issuers (identified cost $13,331,793) | | | 13,331,793 | | |
Total investments (identified cost $756,220,071) | | | 680,707,874 | | |
Receivable for: | |
Investments sold | | | 4,084,930 | | |
Capital shares sold | | | 794,968 | | |
Regulatory settlements (Note 6) | | | 2,024,844 | | |
Dividends | | | 883,810 | | |
Interest | | | 3,211,908 | | |
Foreign tax reclaims | | | 4,964 | | |
Expense reimbursement due from Investment Manager | | | 8,302 | | |
Prepaid expenses | | | 3,285 | | |
Total assets | | | 691,724,885 | | |
Liabilities | |
Payable for: | |
Investments purchased | | | 1,648,189 | | |
Capital shares purchased | | | 1,736,968 | | |
Investment management fees | | | 45,663 | | |
Distribution and/or service fees | | | 9,927 | | |
Transfer agent fees | | | 120,763 | | |
Compensation of board members | | | 118,198 | | |
Other expenses | | | 58,368 | | |
Total liabilities | | | 3,738,076 | | |
Net assets applicable to outstanding capital stock | | $ | 687,986,809 | | |
Represented by | |
Paid-in capital | | $ | 832,478,384 | | |
Excess of distributions over net investment income | | | (12,397,015 | ) | |
Accumulated net realized loss | | | (56,582,363 | ) | |
Unrealized appreciation (depreciation) on: | |
Investments | | | (75,512,197 | ) | |
Total — representing net assets applicable to outstanding capital stock | | $ | 687,986,809 | | |
The accompanying Notes to Financial Statements are an integral part of this statement.
Annual Report 2016
14
COLUMBIA CONVERTIBLE SECURITIES FUND
STATEMENT OF ASSETS AND LIABILITIES (continued)
February 29, 2016
Class A | |
Net assets | | $ | 287,363,558 | | |
Shares outstanding | | | 19,063,435 | | |
Net asset value per share | | $ | 15.07 | | |
Maximum offering price per share(a) | | $ | 15.99 | | |
Class B | |
Net assets | | $ | 325,984 | | |
Shares outstanding | | | 22,091 | | |
Net asset value per share | | $ | 14.76 | | |
Class C | |
Net assets | | $ | 47,322,015 | | |
Shares outstanding | | | 3,150,210 | | |
Net asset value per share | | $ | 15.02 | | |
Class I | |
Net assets | | $ | 92,808,008 | | |
Shares outstanding | | | 6,139,006 | | |
Net asset value per share | | $ | 15.12 | | |
Class R | |
Net assets | | $ | 2,429,483 | | |
Shares outstanding | | | 161,329 | | |
Net asset value per share | | $ | 15.06 | | |
Class R4 | |
Net assets | | $ | 14,556,018 | | |
Shares outstanding | | | 956,854 | | |
Net asset value per share | | $ | 15.21 | | |
Class R5 | |
Net assets | | $ | 38,716,754 | | |
Shares outstanding | | | 2,547,075 | | |
Net asset value per share | | $ | 15.20 | | |
Class W | |
Net assets | | $ | 79,033 | | |
Shares outstanding | | | 5,258 | | |
Net asset value per share | | $ | 15.03 | | |
Class Y | |
Net assets | | $ | 811,977 | | |
Shares outstanding | | | 53,035 | | |
Net asset value per share | | $ | 15.31 | | |
Class Z | |
Net assets | | $ | 203,573,979 | | |
Shares outstanding | | | 13,485,127 | | |
Net asset value per share | | $ | 15.10 | | |
(a) The maximum offering price per share is calculated by dividing the net asset value per share by 1.0 minus the maximum sales charge of 5.75%.
The accompanying Notes to Financial Statements are an integral part of this statement.
Annual Report 2016
15
COLUMBIA CONVERTIBLE SECURITIES FUND
STATEMENT OF OPERATIONS
Year Ended February 29, 2016
Net investment income | |
Income: | |
Dividends — unaffiliated issuers | | $ | 16,433,385 | | |
Dividends — affiliated issuers | | | 64,841 | | |
Interest | | | 22,530,655 | | |
Foreign taxes withheld | | | (12,958 | ) | |
Total income | | | 39,015,923 | | |
Expenses: | |
Investment management fees | | | 9,586,364 | | |
Distribution and/or service fees | |
Class A | | | 1,021,304 | | |
Class B | | | 5,415 | | |
Class C | | | 586,234 | | |
Class R | | | 12,342 | | |
Class W | | | 274 | | |
Transfer agent fees | |
Class A | | | 696,787 | | |
Class B | | | 928 | | |
Class C | | | 99,903 | | |
Class R | | | 4,202 | | |
Class R4 | | | 12,077 | | |
Class R5 | | | 24,051 | | |
Class W | | | 187 | | |
Class Z | | | 1,035,617 | | |
Compensation of board members | | | 19,780 | | |
Custodian fees | | | 13,304 | | |
Printing and postage fees | | | 89,968 | | |
Registration fees | | | 159,628 | | |
Audit fees | | | 26,473 | | |
Legal fees | | | 15,622 | | |
Line of credit interest expense | | | 820 | | |
Other | | | 30,752 | | |
Total expenses | | | 13,442,032 | | |
Fees waived or expenses reimbursed by Investment Manager and its affiliates | | | (1,457,434 | ) | |
Expense reductions | | | (823 | ) | |
Total net expenses | | | 11,983,775 | | |
Net investment income | | | 27,032,148 | | |
Realized and unrealized gain (loss) — net | |
Net realized gain (loss) on: | |
Investments | | | (16,275,531 | ) | |
Net realized loss | | | (16,275,531 | ) | |
Net change in unrealized appreciation (depreciation) on: | |
Investments | | | (200,070,407 | ) | |
Net change in unrealized depreciation | | | (200,070,407 | ) | |
Net realized and unrealized loss | | | (216,345,938 | ) | |
Net decrease in net assets from operations | | $ | (189,313,790 | ) | |
The accompanying Notes to Financial Statements are an integral part of this statement.
Annual Report 2016
16
COLUMBIA CONVERTIBLE SECURITIES FUND
STATEMENT OF CHANGES IN NET ASSETS
| | | Year Ended
February 29,
2016 | | Year Ended
February 28,
2015(a) | |
Operations | |
Net investment income | | $ | 27,032,148 | | | $ | 19,213,540 | | |
Net realized gain (loss) | | | (16,275,531 | ) | | | 55,080,911 | | |
Net change in unrealized appreciation (depreciation) | | | (200,070,407 | ) | | | 10,796,258 | | |
Net increase (decrease) in net assets resulting from operations | | | (189,313,790 | ) | | | 85,090,709 | | |
Distributions to shareholders | |
Net investment income | |
Class A | | | (16,658,219 | ) | | | (8,111,104 | ) | |
Class B | | | (17,677 | ) | | | (12,501 | ) | |
Class C | | | (2,007,085 | ) | | | (662,725 | ) | |
Class I | | | (4,443,055 | ) | | | (3,391,208 | ) | |
Class R | | | (95,818 | ) | | | (48,972 | ) | |
Class R4 | | | (326,791 | ) | | | (58,689 | ) | |
Class R5 | | | (2,191,849 | ) | | | (424,817 | ) | |
Class W | | | (4,400 | ) | | | (133,841 | ) | |
Class Y | | | (20,617 | ) | | | (17 | ) | |
Class Z | | | (26,170,543 | ) | | | (14,725,315 | ) | |
Net realized gains | |
Class A | | | (19,727,332 | ) | | | (9,082,238 | ) | |
Class B | | | (24,780 | ) | | | (20,052 | ) | |
Class C | | | (2,849,900 | ) | | | (1,153,184 | ) | |
Class I | | | (4,944,158 | ) | | | (2,791,830 | ) | |
Class R | | | (117,595 | ) | | | (61,052 | ) | |
Class R4 | | | (377,157 | ) | | | (66,065 | ) | |
Class R5 | | | (2,468,120 | ) | | | (574,489 | ) | |
Class W | | | (5,014 | ) | | | (3,675 | ) | |
Class Y | | | (24,015 | ) | | | (39 | ) | |
Class Z | | | (27,058,521 | ) | | | (16,567,793 | ) | |
Total distributions to shareholders | | | (109,532,646 | ) | | | (57,889,606 | ) | |
Increase (decrease) in net assets from capital stock activity | | | (412,864,188 | ) | | | 365,660,577 | | |
Proceeds from regulatory settlements (Note 6) | | | 2,024,844 | | | | — | | |
Total increase (decrease) in net assets | | | (709,685,780 | ) | | | 392,861,680 | | |
Net assets at beginning of year | | | 1,397,672,589 | | | | 1,004,810,909 | | |
Net assets at end of year | | $ | 687,986,809 | | | $ | 1,397,672,589 | | |
Excess of distributions over net investment income | | $ | (12,397,015 | ) | | $ | (1,111,742 | ) | |
(a) Class Y shares are based on operations from October 1, 2014 (commencement of operations) through the stated period end.
The accompanying Notes to Financial Statements are an integral part of this statement.
Annual Report 2016
17
COLUMBIA CONVERTIBLE SECURITIES FUND
STATEMENT OF CHANGES IN NET ASSETS (continued)
| | | Year Ended February 29, 2016 | | Year Ended February 28, 2015(a) | |
| | | Shares | | Dollars ($) | | Shares | | Dollars ($) | |
Capital stock activity | |
Class A shares | |
Subscriptions(b) | | | 12,352,035 | | | | 231,983,036 | | | | 12,962,037 | | | | 248,929,628 | | |
Distributions reinvested | | | 1,571,465 | | | | 27,455,353 | | | | 634,558 | | | | 12,068,927 | | |
Redemptions | | | (14,668,791 | ) | | | (254,690,503 | ) | | | (10,623,258 | ) | | | (202,931,014 | ) | |
Net increase (decrease) | | | (745,291 | ) | | | 4,747,886 | | | | 2,973,337 | | | | 58,067,541 | | |
Class B shares | |
Subscriptions | | | 1,314 | | | | 23,981 | | | | 6,119 | | | | 115,500 | | |
Distributions reinvested | | | 1,961 | | | | 33,712 | | | | 1,274 | | | | 23,780 | | |
Redemptions(b) | | | (19,120 | ) | | | (337,598 | ) | | | (17,733 | ) | | | (330,055 | ) | |
Net decrease | | | (15,845 | ) | | | (279,905 | ) | | | (10,340 | ) | | | (190,775 | ) | |
Class C shares | |
Subscriptions | | | 1,290,638 | | | | 24,068,740 | | | | 1,451,455 | | | | 27,745,546 | | |
Distributions reinvested | | | 206,814 | | | | 3,569,741 | | | | 61,615 | | | | 1,165,961 | | |
Redemptions | | | (1,155,102 | ) | | | (19,798,270 | ) | | | (388,218 | ) | | | (7,367,326 | ) | |
Net increase | | | 342,350 | | | | 7,840,211 | | | | 1,124,852 | | | | 21,544,181 | | |
Class I shares | |
Subscriptions | | | 2,384,196 | | | | 42,866,730 | | | | 148,653 | | | | 2,866,277 | | |
Distributions reinvested | | | 534,145 | | | | 9,386,974 | | | | 323,085 | | | | 6,182,897 | | |
Redemptions | | | (1,732,931 | ) | | | (32,422,280 | ) | | | (3,326,073 | ) | | | (64,334,483 | ) | |
Net increase (decrease) | | | 1,185,410 | | | | 19,831,424 | | | | (2,854,335 | ) | | | (55,285,309 | ) | |
Class R shares | |
Subscriptions | | | 98,545 | | | | 1,714,501 | | | | 45,507 | | | | 870,161 | | |
Distributions reinvested | | | 3,267 | | | | 56,327 | | | | 1,012 | | | | 19,251 | | |
Redemptions | | | (64,082 | ) | | | (1,117,034 | ) | | | (49,087 | ) | | | (937,748 | ) | |
Net increase (decrease) | | | 37,730 | | | | 653,794 | | | | (2,568 | ) | | | (48,336 | ) | |
Class R4 shares | |
Subscriptions | | | 935,079 | | | | 15,894,748 | | | | 207,877 | | | | 4,043,798 | | |
Distributions reinvested | | | 40,974 | | | | 703,718 | | | | 6,518 | | | | 124,620 | | |
Redemptions | | | (172,912 | ) | | | (2,979,813 | ) | | | (96,040 | ) | | | (1,844,277 | ) | |
Net increase | | | 803,141 | | | | 13,618,653 | | | | 118,355 | | | | 2,324,141 | | |
Class R5 shares | |
Subscriptions | | | 2,420,461 | | | | 45,527,134 | | | | 1,902,273 | | | | 36,662,649 | | |
Distributions reinvested | | | 265,552 | | | | 4,658,813 | | | | 52,437 | | | | 997,562 | | |
Redemptions | | | (1,960,952 | ) | | | (34,643,256 | ) | | | (181,542 | ) | | | (3,493,997 | ) | |
Net increase | | | 725,061 | | | | 15,542,691 | | | | 1,773,168 | | | | 34,166,214 | | |
The accompanying Notes to Financial Statements are an integral part of this statement.
Annual Report 2016
18
COLUMBIA CONVERTIBLE SECURITIES FUND
STATEMENT OF CHANGES IN NET ASSETS (continued)
| | | Year Ended February 29, 2016 | | Year Ended February 28, 2015(a) | |
| | | Shares | | Dollars ($) | | Shares | | Dollars ($) | |
Capital stock activity (continued) | |
Class W shares | |
Subscriptions | | | — | | | | — | | | | 39,675 | | | | 750,663 | | |
Distributions reinvested | | | 524 | | | | 9,188 | | | | 7,216 | | | | 137,388 | | |
Redemptions | | | (1,924 | ) | | | (34,023 | ) | | | (1,506,880 | ) | | | (28,229,007 | ) | |
Net decrease | | | (1,400 | ) | | | (24,835 | ) | | | (1,459,989 | ) | | | (27,340,956 | ) | |
Class Y shares | |
Subscriptions | | | 50,248 | | | | 896,678 | | | | 3,087 | | | | 59,000 | | |
Distributions reinvested | | | 2,693 | | | | 44,411 | | | | — | | | | — | | |
Redemptions | | | (2,993 | ) | | | (55,617 | ) | | | — | | | | — | | |
Net increase | | | 49,948 | | | | 885,472 | | | | 3,087 | | | | 59,000 | | |
Class Z shares | |
Subscriptions | | | 17,333,134 | | | | 321,527,408 | | | | 26,318,341 | | | | 498,393,075 | | |
Distributions reinvested | | | 863,758 | | | | 15,168,494 | | | | 272,902 | | | | 5,186,538 | | |
Redemptions | | | (46,485,741 | ) | | | (812,375,481 | ) | | | (8,991,309 | ) | | | (171,214,737 | ) | |
Net increase (decrease) | | | (28,288,849 | ) | | | (475,679,579 | ) | | | 17,599,934 | | | | 332,364,876 | | |
Total net increase (decrease) | | | (25,907,745 | ) | | | (412,864,188 | ) | | | 19,265,501 | | | | 365,660,577 | | |
(a) Class Y shares are based on operations from October 1, 2014 (commencement of operations) through the stated period end.
(b) Includes conversions of Class B shares to Class A shares, if any.
The accompanying Notes to Financial Statements are an integral part of this statement.
Annual Report 2016
19
COLUMBIA CONVERTIBLE SECURITIES FUND
The following tables are intended to help you understand the Fund's financial performance. Certain information reflects financial results for a single share of a class held for the periods shown. Per share net investment income (loss) amounts are calculated based on average shares outstanding during the period. Total return assumes reinvestment of all dividends and distributions, if any. Total return does not reflect payment of sales charges, if any. Total return and portfolio turnover are not annualized for periods of less than one year. The portfolio turnover rate is calculated without regard to purchase and sales transactions of short-term instruments and certain derivatives, if any. If such transactions were included, the Fund's portfolio turnover rate may be higher.
| | | Year Ended
February 29, | | Year Ended February 28, | | Year Ended
February 29, | |
Class A | | 2016 | | 2015 | | 2014 | | 2013 | | 2012 | |
Per share data | |
Net asset value, beginning of period | | $ | 19.53 | | | $ | 19.22 | | | $ | 15.68 | | | $ | 14.99 | | | $ | 15.55 | | |
Income from investment operations: | |
Net investment income | | | 0.38 | | | | 0.28 | | | | 0.34 | | | | 0.41 | | | | 0.42 | | |
Net realized and unrealized gain (loss) | | | (3.25 | ) | | | 0.92 | | | | 3.58 | | | | 0.73 | | | | (0.56 | ) | |
Total from investment operations | | | (2.87 | ) | | | 1.20 | | | | 3.92 | | | | 1.14 | | | | (0.14 | ) | |
Less distributions to shareholders: | |
Net investment income | | | (0.75 | ) | | | (0.43 | ) | | | (0.38 | ) | | | (0.45 | ) | | | (0.42 | ) | |
Net realized gains | | | (0.87 | ) | | | (0.46 | ) | | | — | | | | — | | | | — | | |
Total distributions to shareholders | | | (1.62 | ) | | | (0.89 | ) | | | (0.38 | ) | | | (0.45 | ) | | | (0.42 | ) | |
Proceeds from regulatory settlements | | | 0.03 | | | | — | | | | — | | | | — | | | | — | | |
Net asset value, end of period | | $ | 15.07 | | | $ | 19.53 | | | $ | 19.22 | | | $ | 15.68 | | | $ | 14.99 | | |
Total return | | | (15.46 | %)(a) | | | 6.44 | % | | | 25.38 | % | | | 7.84 | % | | | (0.75 | %) | |
Ratios to average net assets(b) | |
Total gross expenses | | | 1.23 | %(c) | | | 1.30 | %(c) | | | 1.35 | % | | | 1.39 | % | | | 1.27 | % | |
Total net expenses(d) | | | 1.11 | %(c)(e) | | | 1.10 | %(c)(e) | | | 1.12 | %(e) | | | 1.15 | %(e) | | | 1.12 | %(e) | |
Net investment income | | | 2.11 | % | | | 1.49 | % | | | 1.97 | % | | | 2.80 | % | | | 2.86 | % | |
Supplemental data | |
Net assets, end of period (in thousands) | | $ | 287,364 | | | $ | 386,856 | | | $ | 323,622 | | | $ | 212,252 | | | $ | 198,721 | | |
Portfolio turnover | | | 71 | % | | | 78 | % | | | 76 | % | | | 71 | % | | | 66 | % | |
Notes to Financial Highlights
(a) The Fund received proceeds from regulatory settlements. Had the Fund not received these proceeds, the total return would have been lower by 0.14%.
(b) In addition to the fees and expenses that the Fund bears directly, the Fund indirectly bears a pro rata share of the fees and expenses of any other funds in which it invests. Such indirect expenses are not included in the Fund's reported expense ratios.
(c) Ratios include line of credit interest expense which is less than 0.01%.
(d) Total net expenses include the impact of certain fee waivers/expense reimbursements made by the Investment Manager and certain of its affiliates, if applicable.
(e) The benefits derived from expense reductions had an impact of less than 0.01%.
The accompanying Notes to Financial Statements are an integral part of this statement.
Annual Report 2016
20
COLUMBIA CONVERTIBLE SECURITIES FUND
FINANCIAL HIGHLIGHTS (continued)
| | | Year Ended
February 29, | | Year Ended February 28, | | Year Ended
February 29, | |
Class B | | 2016 | | 2015 | | 2014 | | 2013 | | 2012 | |
Per share data | |
Net asset value, beginning of period | | $ | 19.15 | | | $ | 18.86 | | | $ | 15.40 | | | $ | 14.72 | | | $ | 15.28 | | |
Income from investment operations: | |
Net investment income | | | 0.23 | | | | 0.14 | | | | 0.21 | | | | 0.30 | | | | 0.30 | | |
Net realized and unrealized gain (loss) | | | (3.17 | ) | | | 0.90 | | | | 3.51 | | | | 0.72 | | | | (0.55 | ) | |
Total from investment operations | | | (2.94 | ) | | | 1.04 | | | | 3.72 | | | | 1.02 | | | | (0.25 | ) | |
Less distributions to shareholders: | |
Net investment income | | | (0.61 | ) | | | (0.29 | ) | | | (0.26 | ) | | | (0.34 | ) | | | (0.31 | ) | |
Net realized gains | | | (0.87 | ) | | | (0.46 | ) | | | — | | | | — | | | | — | | |
Total distributions to shareholders | | | (1.48 | ) | | | (0.75 | ) | | | (0.26 | ) | | | (0.34 | ) | | | (0.31 | ) | |
Proceeds from regulatory settlements | | | 0.03 | | | | — | | | | — | | | | — | | | | — | | |
Net asset value, end of period | | $ | 14.76 | | | $ | 19.15 | | | $ | 18.86 | | | $ | 15.40 | | | $ | 14.72 | | |
Total return | | | (16.05 | %)(a) | | | 5.65 | % | | | 24.37 | % | | | 7.10 | % | | | (1.53 | %) | |
Ratios to average net assets(b) | |
Total gross expenses | | | 1.98 | %(c) | | | 2.05 | %(c) | | | 2.10 | % | | | 2.13 | % | | | 2.04 | % | |
Total net expenses(d) | | | 1.86 | %(c)(e) | | | 1.85 | %(c)(e) | | | 1.88 | %(e) | | | 1.89 | %(e) | | | 1.88 | %(e) | |
Net investment income | | | 1.29 | % | | | 0.74 | % | | | 1.23 | % | | | 2.07 | % | | | 2.04 | % | |
Supplemental data | |
Net assets, end of period (in thousands) | | $ | 326 | | | $ | 726 | | | $ | 911 | | | $ | 1,335 | | | $ | 3,102 | | |
Portfolio turnover | | | 71 | % | | | 78 | % | | | 76 | % | | | 71 | % | | | 66 | % | |
Notes to Financial Highlights
(a) The Fund received proceeds from regulatory settlements. Had the Fund not received these proceeds, the total return would have been lower by 0.14%.
(b) In addition to the fees and expenses that the Fund bears directly, the Fund indirectly bears a pro rata share of the fees and expenses of any other funds in which it invests. Such indirect expenses are not included in the Fund's reported expense ratios.
(c) Ratios include line of credit interest expense which is less than 0.01%.
(d) Total net expenses include the impact of certain fee waivers/expense reimbursements made by the Investment Manager and certain of its affiliates, if applicable.
(e) The benefits derived from expense reductions had an impact of less than 0.01%.
The accompanying Notes to Financial Statements are an integral part of this statement.
Annual Report 2016
21
COLUMBIA CONVERTIBLE SECURITIES FUND
FINANCIAL HIGHLIGHTS (continued)
| | | Year Ended
February 29, | | Year Ended February 28, | | Year Ended
February 29, | |
Class C | | 2016 | | 2015 | | 2014 | | 2013 | | 2012 | |
Per share data | |
Net asset value, beginning of period | | $ | 19.46 | | | $ | 19.16 | | | $ | 15.63 | | | $ | 14.95 | | | $ | 15.51 | | |
Income from investment operations: | |
Net investment income | | | 0.25 | | | | 0.14 | | | | 0.21 | | | | 0.30 | | | | 0.31 | | |
Net realized and unrealized gain (loss) | | | (3.24 | ) | | | 0.91 | | | | 3.58 | | | | 0.72 | | | | (0.56 | ) | |
Total from investment operations | | | (2.99 | ) | | | 1.05 | | | | 3.79 | | | | 1.02 | | | | (0.25 | ) | |
Less distributions to shareholders: | |
Net investment income | | | (0.61 | ) | | | (0.29 | ) | | | (0.26 | ) | | | (0.34 | ) | | | (0.31 | ) | |
Net realized gains | | | (0.87 | ) | | | (0.46 | ) | | | — | | | | — | | | | — | | |
Total distributions to shareholders | | | (1.48 | ) | | | (0.75 | ) | | | (0.26 | ) | | | (0.34 | ) | | | (0.31 | ) | |
Proceeds from regulatory settlements | | | 0.03 | | | | — | | | | — | | | | — | | | | — | | |
Net asset value, end of period | | $ | 15.02 | | | $ | 19.46 | | | $ | 19.16 | | | $ | 15.63 | | | $ | 14.95 | | |
Total return | | | (16.06 | %)(a) | | | 5.62 | % | | | 24.46 | % | | | 6.99 | % | | | (1.51 | %) | |
Ratios to average net assets(b) | |
Total gross expenses | | | 1.99 | %(c) | | | 2.05 | %(c) | | | 2.10 | % | | | 2.14 | % | | | 2.02 | % | |
Total net expenses(d) | | | 1.87 | %(c)(e) | | | 1.85 | %(c)(e) | | | 1.87 | %(e) | | | 1.90 | %(e) | | | 1.87 | %(e) | |
Net investment income | | | 1.38 | % | | | 0.74 | % | | | 1.21 | % | | | 2.05 | % | | | 2.10 | % | |
Supplemental data | |
Net assets, end of period (in thousands) | | $ | 47,322 | | | $ | 54,655 | | | $ | 32,250 | | | $ | 17,617 | | | $ | 20,127 | | |
Portfolio turnover | | | 71 | % | | | 78 | % | | | 76 | % | | | 71 | % | | | 66 | % | |
Notes to Financial Highlights
(a) The Fund received proceeds from regulatory settlements. Had the Fund not received these proceeds, the total return would have been lower by 0.14%.
(b) In addition to the fees and expenses that the Fund bears directly, the Fund indirectly bears a pro rata share of the fees and expenses of any other funds in which it invests. Such indirect expenses are not included in the Fund's reported expense ratios.
(c) Ratios include line of credit interest expense which is less than 0.01%.
(d) Total net expenses include the impact of certain fee waivers/expense reimbursements made by the Investment Manager and certain of its affiliates, if applicable.
(e) The benefits derived from expense reductions had an impact of less than 0.01%.
The accompanying Notes to Financial Statements are an integral part of this statement.
Annual Report 2016
22
COLUMBIA CONVERTIBLE SECURITIES FUND
FINANCIAL HIGHLIGHTS (continued)
| | | Year Ended
February 29, | | Year Ended February 28, | | Year Ended
February 29, | |
Class I | | 2016 | | 2015 | | 2014 | | 2013 | | 2012 | |
Per share data | |
Net asset value, beginning of period | | $ | 19.58 | | | $ | 19.27 | | | $ | 15.72 | | | $ | 15.02 | | | $ | 15.58 | | |
Income from investment operations: | |
Net investment income | | | 0.45 | | | | 0.37 | | | | 0.42 | | | | 0.48 | | | | 0.47 | | |
Net realized and unrealized gain (loss) | | | (3.24 | ) | | | 0.91 | | | | 3.58 | | | | 0.72 | | | | (0.57 | ) | |
Total from investment operations | | | (2.79 | ) | | | 1.28 | | | | 4.00 | | | | 1.20 | | | | (0.10 | ) | |
Less distributions to shareholders: | |
Net investment income | | | (0.83 | ) | | | (0.51 | ) | | | (0.45 | ) | | | (0.50 | ) | | | (0.46 | ) | |
Net realized gains | | | (0.87 | ) | | | (0.46 | ) | | | — | | | | — | | | | — | | |
Total distributions to shareholders | | | (1.70 | ) | | | (0.97 | ) | | | (0.45 | ) | | | (0.50 | ) | | | (0.46 | ) | |
Proceeds from regulatory settlements | | | 0.03 | | | | — | | | | — | | | | — | | | | — | | |
Net asset value, end of period | | $ | 15.12 | | | $ | 19.58 | | | $ | 19.27 | | | $ | 15.72 | | | $ | 15.02 | | |
Total return | | | (15.06 | %)(a) | | | 6.88 | % | | | 25.90 | % | | | 8.29 | % | | | (0.43 | %) | |
Ratios to average net assets(b) | |
Total gross expenses | | | 0.81 | %(c) | | | 0.81 | %(c) | | | 0.85 | % | | | 0.89 | % | | | 0.84 | % | |
Total net expenses(d) | | | 0.71 | %(c) | | | 0.68 | %(c) | | | 0.69 | % | | | 0.74 | % | | | 0.77 | % | |
Net investment income | | | 2.51 | % | | | 1.91 | % | | | 2.43 | % | | | 3.21 | % | | | 3.28 | % | |
Supplemental data | |
Net assets, end of period (in thousands) | | $ | 92,808 | | | $ | 97,006 | | | $ | 150,494 | | | $ | 180,374 | | | $ | 186,160 | | |
Portfolio turnover | | | 71 | % | | | 78 | % | | | 76 | % | | | 71 | % | | | 66 | % | |
Notes to Financial Highlights
(a) The Fund received proceeds from regulatory settlements. Had the Fund not received these proceeds, the total return would have been lower by 0.14%.
(b) In addition to the fees and expenses that the Fund bears directly, the Fund indirectly bears a pro rata share of the fees and expenses of any other funds in which it invests. Such indirect expenses are not included in the Fund's reported expense ratios.
(c) Ratios include line of credit interest expense which is less than 0.01%.
(d) Total net expenses include the impact of certain fee waivers/expense reimbursements made by the Investment Manager and certain of its affiliates, if applicable.
The accompanying Notes to Financial Statements are an integral part of this statement.
Annual Report 2016
23
COLUMBIA CONVERTIBLE SECURITIES FUND
FINANCIAL HIGHLIGHTS (continued)
The accompanying Notes to Financial Statements are an integral part of this statement.
| | | Year Ended
February 29, | | Year Ended February 28, | | Year Ended
February 29, | |
Class R | | 2016 | | 2015 | | 2014 | | 2013 | | 2012(a) | |
Per share data | |
Net asset value, beginning of period | | $ | 19.51 | | | $ | 19.21 | | | $ | 15.67 | | | $ | 14.99 | | | $ | 13.80 | | |
Income from investment operations: | |
Net investment income | | | 0.34 | | | | 0.24 | | | | 0.30 | | | | 0.38 | | | | 0.11 | | |
Net realized and unrealized gain (loss) | | | (3.24 | ) | | | 0.90 | | | | 3.58 | | | | 0.72 | | | | 1.20 | (b) | |
Total from investment operations | | | (2.90 | ) | | | 1.14 | | | | 3.88 | | | | 1.10 | | | | 1.31 | | |
Less distributions to shareholders: | |
Net investment income | | | (0.71 | ) | | | (0.38 | ) | | | (0.34 | ) | | | (0.42 | ) | | | (0.12 | ) | |
Net realized gains | | | (0.87 | ) | | | (0.46 | ) | | | — | | | | — | | | | — | | |
Total distributions to shareholders | | | (1.58 | ) | | | (0.84 | ) | | | (0.34 | ) | | | (0.42 | ) | | | (0.12 | ) | |
Proceeds from regulatory settlements | | | 0.03 | | | | — | | | | — | | | | — | | | | — | | |
Net asset value, end of period | | $ | 15.06 | | | $ | 19.51 | | | $ | 19.21 | | | $ | 15.67 | | | $ | 14.99 | | |
Total return | | | (15.63 | %)(c) | | | 6.13 | % | | | 25.08 | % | | | 7.55 | % | | | 9.57 | % | |
Ratios to average net assets(d) | |
Total gross expenses | | | 1.49 | %(e) | | | 1.55 | %(e) | | | 1.60 | % | | | 1.64 | % | | | 1.28 | %(f) | |
Total net expenses(g) | | | 1.37 | %(e)(h) | | | 1.35 | %(e)(h) | | | 1.37 | %(h) | | | 1.40 | %(h) | | | 1.20 | %(f) | |
Net investment income | | | 1.91 | % | | | 1.24 | % | | | 1.72 | % | | | 2.56 | % | | | 2.64 | %(f) | |
Supplemental data | |
Net assets, end of period (in thousands) | | $ | 2,429 | | | $ | 2,412 | | | $ | 2,423 | | | $ | 1,894 | | | $ | 2,068 | | |
Portfolio turnover | | | 71 | % | | | 78 | % | | | 76 | % | | | 71 | % | | | 66 | % | |
Notes to Financial Highlights
(a) Based on operations from November 16, 2011 (commencement of operations) through the stated period end.
(b) Calculation of the net gain (loss) per share (both realized and unrealized) does not correlate to the aggregate realized and unrealized gain (loss) presented in the Statement of Operations due to the timing of subscriptions and redemptions of Fund shares in relation to fluctuations in the market value of the portfolio.
(c) The Fund received proceeds from regulatory settlements. Had the Fund not received these proceeds, the total return would have been lower by 0.14%.
(d) In addition to the fees and expenses that the Fund bears directly, the Fund indirectly bears a pro rata share of the fees and expenses of any other funds in which it invests. Such indirect expenses are not included in the Fund's reported expense ratios.
(e) Ratios include line of credit interest expense which is less than 0.01%.
(f) Annualized.
(g) Total net expenses include the impact of certain fee waivers/expense reimbursements made by the Investment Manager and certain of its affiliates, if applicable.
(h) The benefits derived from expense reductions had an impact of less than 0.01%.
Annual Report 2016
24
COLUMBIA CONVERTIBLE SECURITIES FUND
FINANCIAL HIGHLIGHTS (continued)
| | | Year Ended
February 29, | | Year Ended February 28, | |
Class R4 | | 2016 | | 2015 | | 2014 | | 2013(a) | |
Per share data | |
Net asset value, beginning of period | | $ | 19.69 | | | $ | 19.37 | | | $ | 15.80 | | | $ | 14.75 | | |
Income from investment operations: | |
Net investment income | | | 0.45 | | | | 0.33 | | | | 0.37 | | | | 0.14 | | |
Net realized and unrealized gain (loss) | | | (3.29 | ) | | | 0.93 | | | | 3.62 | | | | 1.04 | | |
Total from investment operations | | | (2.84 | ) | | | 1.26 | | | | 3.99 | | | | 1.18 | | |
Less distributions to shareholders: | |
Net investment income | | | (0.80 | ) | | | (0.48 | ) | | | (0.42 | ) | | | (0.13 | ) | |
Net realized gains | | | (0.87 | ) | | | (0.46 | ) | | | — | | | | — | | |
Total distributions to shareholders | | | (1.67 | ) | | | (0.94 | ) | | | (0.42 | ) | | | (0.13 | ) | |
Proceeds from regulatory settlements | | | 0.03 | | | | — | | | | — | | | | — | | |
Net asset value, end of period | | $ | 15.21 | | | $ | 19.69 | | | $ | 19.37 | | | $ | 15.80 | | |
Total return | | | (15.21 | %)(b) | | | 6.71 | % | | | 25.68 | % | | | 8.05 | % | |
Ratios to average net assets(c) | |
Total gross expenses | | | 1.00 | %(d) | | | 1.05 | %(d) | | | 1.10 | % | | | 1.24 | %(e) | |
Total net expenses(f) | | | 0.87 | %(d)(g) | | | 0.85 | %(d)(g) | | | 0.85 | %(g) | | | 0.92 | %(e) | |
Net investment income | | | 2.59 | % | | | 1.74 | % | | | 2.09 | % | | | 2.96 | %(e) | |
Supplemental data | |
Net assets, end of period (in thousands) | | $ | 14,556 | | | $ | 3,027 | | | $ | 685 | | | $ | 3 | | |
Portfolio turnover | | | 71 | % | | | 78 | % | | | 76 | % | | | 71 | % | |
Notes to Financial Highlights
(a) Based on operations from November 8, 2012 (commencement of operations) through the stated period end.
(b) The Fund received proceeds from regulatory settlements. Had the Fund not received these proceeds, the total return would have been lower by 0.14%.
(c) In addition to the fees and expenses that the Fund bears directly, the Fund indirectly bears a pro rata share of the fees and expenses of any other funds in which it invests. Such indirect expenses are not included in the Fund's reported expense ratios.
(d) Ratios include line of credit interest expense which is less than 0.01%.
(e) Annualized.
(f) Total net expenses include the impact of certain fee waivers/expense reimbursements made by the Investment Manager and certain of its affiliates, if applicable.
(g) The benefits derived from expense reductions had an impact of less than 0.01%.
The accompanying Notes to Financial Statements are an integral part of this statement.
Annual Report 2016
25
COLUMBIA CONVERTIBLE SECURITIES FUND
FINANCIAL HIGHLIGHTS (continued)
| | | Year Ended
February 29, | | Year Ended February 28, | |
Class R5 | | 2016 | | 2015 | | 2014 | | 2013(a) | |
Per share data | |
Net asset value, beginning of period | | $ | 19.68 | | | $ | 19.37 | | | $ | 15.80 | | | $ | 14.75 | | |
Income from investment operations: | |
Net investment income | | | 0.45 | | | | 0.35 | | | | 0.40 | | | | 0.14 | | |
Net realized and unrealized gain (loss) | | | (3.27 | ) | | | 0.92 | | | | 3.62 | | | | 1.04 | | |
Total from investment operations | | | (2.82 | ) | | | 1.27 | | | | 4.02 | | | | 1.18 | | |
Less distributions to shareholders: | |
Net investment income | | | (0.82 | ) | | | (0.50 | ) | | | (0.45 | ) | | | (0.13 | ) | |
Net realized gains | | | (0.87 | ) | | | (0.46 | ) | | | — | | | | — | | |
Total distributions to shareholders | | | (1.69 | ) | | | (0.96 | ) | | | (0.45 | ) | | | (0.13 | ) | |
Proceeds from regulatory settlements | | | 0.03 | | | | — | | | | — | | | | — | | |
Net asset value, end of period | | $ | 15.20 | | | $ | 19.68 | | | $ | 19.37 | | | $ | 15.80 | | |
Total return | | | (15.13 | %)(b) | | | 6.80 | % | | | 25.86 | % | | | 8.08 | % | |
Ratios to average net assets(c) | |
Total gross expenses | | | 0.87 | %(d) | | | 0.86 | %(d) | | | 0.90 | % | | | 1.01 | %(e) | |
Total net expenses(f) | | | 0.76 | %(d) | | | 0.73 | %(d) | | | 0.71 | % | | | 0.79 | %(e) | |
Net investment income | | | 2.48 | % | | | 1.86 | % | | | 2.25 | % | | | 3.09 | %(e) | |
Supplemental data | |
Net assets, end of period (in thousands) | | $ | 38,717 | | | $ | 35,859 | | | $ | 946 | | | $ | 3 | | |
Portfolio turnover | | | 71 | % | | | 78 | % | | | 76 | % | | | 71 | % | |
Notes to Financial Highlights
(a) Based on operations from November 8, 2012 (commencement of operations) through the stated period end.
(b) The Fund received proceeds from regulatory settlements. Had the Fund not received these proceeds, the total return would have been lower by 0.14%.
(c) In addition to the fees and expenses that the Fund bears directly, the Fund indirectly bears a pro rata share of the fees and expenses of any other funds in which it invests. Such indirect expenses are not included in the Fund's reported expense ratios.
(d) Ratios include line of credit interest expense which is less than 0.01%.
(e) Annualized.
(f) Total net expenses include the impact of certain fee waivers/expense reimbursements made by the Investment Manager and certain of its affiliates, if applicable.
The accompanying Notes to Financial Statements are an integral part of this statement.
Annual Report 2016
26
COLUMBIA CONVERTIBLE SECURITIES FUND
FINANCIAL HIGHLIGHTS (continued)
The accompanying Notes to Financial Statements are an integral part of this statement.
| | | Year Ended
February 29, | | Year Ended February 28, | | Year Ended
February 29, | |
Class W | | 2016 | | 2015 | | 2014 | | 2013 | | 2012(a) | |
Per share data | |
Net asset value, beginning of period | | $ | 19.48 | | | $ | 19.20 | | | $ | 15.66 | | | $ | 14.98 | | | $ | 13.80 | | |
Income from investment operations: | |
Net investment income | | | 0.38 | | | | 0.31 | | | | 0.34 | | | | 0.42 | | | | 0.14 | | |
Net realized and unrealized gain (loss) | | | (3.23 | ) | | | 0.87 | | | | 3.58 | | | | 0.72 | | | | 1.17 | (b) | |
Total from investment operations | | | (2.85 | ) | | | 1.18 | | | | 3.92 | | | | 1.14 | | | | 1.31 | | |
Less distributions to shareholders: | |
Net investment income | | | (0.76 | ) | | | (0.44 | ) | | | (0.38 | ) | | | (0.46 | ) | | | (0.13 | ) | |
Net realized gains | | | (0.87 | ) | | | (0.46 | ) | | | — | | | | — | | | | — | | |
Total distributions to shareholders | | | (1.63 | ) | | | (0.90 | ) | | | (0.38 | ) | | | (0.46 | ) | | | (0.13 | ) | |
Proceeds from regulatory settlements | | | 0.03 | | | | — | | | | — | | | | — | | | | — | | |
Net asset value, end of period | | $ | 15.03 | | | $ | 19.48 | | | $ | 19.20 | | | $ | 15.66 | | | $ | 14.98 | | |
Total return | | | (15.43 | %)(c) | | | 6.33 | % | | | 25.41 | % | | | 7.87 | % | | | 9.56 | % | |
Ratios to average net assets(d) | |
Total gross expenses | | | 1.23 | %(e) | | | 1.25 | %(e) | | | 1.35 | % | | | 1.39 | % | | | 0.85 | %(f) | |
Total net expenses(g) | | | 1.11 | %(e)(h) | | | 1.05 | %(e)(h) | | | 1.12 | %(h) | | | 1.15 | %(h) | | | 0.77 | %(f) | |
Net investment income | | | 2.07 | % | | | 1.55 | % | | | 1.98 | % | | | 2.83 | % | | | 3.44 | %(f) | |
Supplemental data | |
Net assets, end of period (in thousands) | | $ | 79 | | | $ | 130 | | | $ | 28,153 | | | $ | 26,640 | | | $ | 28,830 | | |
Portfolio turnover | | | 71 | % | | | 78 | % | | | 76 | % | | | 71 | % | | | 66 | % | |
Notes to Financial Highlights
(a) Based on operations from November 16, 2011 (commencement of operations) through the stated period end.
(b) Calculation of the net gain (loss) per share (both realized and unrealized) does not correlate to the aggregate realized and unrealized gain (loss) presented in the Statement of Operations due to the timing of subscriptions and redemptions of Fund shares in relation to fluctuations in the market value of the portfolio.
(c) The Fund received proceeds from regulatory settlements. Had the Fund not received these proceeds, the total return would have been lower by 0.14%.
(d) In addition to the fees and expenses that the Fund bears directly, the Fund indirectly bears a pro rata share of the fees and expenses of any other funds in which it invests. Such indirect expenses are not included in the Fund's reported expense ratios.
(e) Ratios include line of credit interest expense which is less than 0.01%.
(f) Annualized.
(g) Total net expenses include the impact of certain fee waivers/expense reimbursements made by the Investment Manager and certain of its affiliates, if applicable.
(h) The benefits derived from expense reductions had an impact of less than 0.01%.
Annual Report 2016
27
COLUMBIA CONVERTIBLE SECURITIES FUND
FINANCIAL HIGHLIGHTS (continued)
Class Y | | Year Ended
February 29,
2016 | | Year Ended
February 28,
2015(a) | |
Per share data | |
Net asset value, beginning of period | | $ | 19.81 | | | $ | 19.21 | | |
Income from investment operations: | |
Net investment income | | | 0.51 | | | | 0.13 | | |
Net realized and unrealized gain (loss) | | | (3.34 | ) | | | 0.90 | | |
Total from investment operations | | | (2.83 | ) | | | 1.03 | | |
Less distributions to shareholders: | |
Net investment income | | | (0.83 | ) | | | (0.13 | ) | |
Net realized gains | | | (0.87 | ) | | | (0.30 | ) | |
Total distributions to shareholders | | | (1.70 | ) | | | (0.43 | ) | |
Proceeds from regulatory settlements | | | 0.03 | | | | — | | |
Net asset value, end of period | | $ | 15.31 | | | $ | 19.81 | | |
Total return | | | (15.09 | %)(b) | | | 5.48 | % | |
Ratios to average net assets(c) | |
Total gross expenses | | | 0.84 | %(d) | | | 0.81 | %(d)(e) | |
Total net expenses(f) | | | 0.72 | %(d) | | | 0.69 | %(d)(e) | |
Net investment income | | | 3.01 | % | | | 1.88 | %(e) | |
Supplemental data | |
Net assets, end of period (in thousands) | | $ | 812 | | | $ | 61 | | |
Portfolio turnover | | | 71 | % | | | 78 | % | |
Notes to Financial Highlights
(a) Based on operations from October 1, 2014 (commencement of operations) through the stated period end.
(b) The Fund received proceeds from regulatory settlements. Had the Fund not received these proceeds, the total return would have been lower by 0.14%.
(c) In addition to the fees and expenses that the Fund bears directly, the Fund indirectly bears a pro rata share of the fees and expenses of any other funds in which it invests. Such indirect expenses are not included in the Fund's reported expense ratios.
(d) Ratios include line of credit interest expense which is less than 0.01%.
(e) Annualized.
(f) Total net expenses include the impact of certain fee waivers/expense reimbursements made by the Investment Manager and certain of its affiliates, if applicable.
The accompanying Notes to Financial Statements are an integral part of this statement.
Annual Report 2016
28
COLUMBIA CONVERTIBLE SECURITIES FUND
FINANCIAL HIGHLIGHTS (continued)
| | | Year Ended
February 29, | | Year Ended February 28, | | Year Ended
February 29, | |
Class Z | | 2016 | | 2015 | | 2014 | | 2013 | | 2012 | |
Per share data | |
Net asset value, beginning of period | | $ | 19.56 | | | $ | 19.25 | | | $ | 15.70 | | | $ | 15.01 | | | $ | 15.58 | | |
Income from investment operations: | |
Net investment income | | | 0.42 | | | | 0.33 | | | | 0.38 | | | | 0.45 | | | | 0.45 | | |
Net realized and unrealized gain (loss) | | | (3.24 | ) | | | 0.92 | | | | 3.59 | | | | 0.73 | | | | (0.57 | ) | |
Total from investment operations | | | (2.82 | ) | | | 1.25 | | | | 3.97 | | | | 1.18 | | | | (0.12 | ) | |
Less distributions to shareholders: | |
Net investment income | | | (0.80 | ) | | | (0.48 | ) | | | (0.42 | ) | | | (0.49 | ) | | | (0.45 | ) | |
Net realized gains | | | (0.87 | ) | | | (0.46 | ) | | | — | | | | — | | | | — | | |
Total distributions to shareholders | | | (1.67 | ) | | | (0.94 | ) | | | (0.42 | ) | | | (0.49 | ) | | | (0.45 | ) | |
Proceeds from regulatory settlements | | | 0.03 | | | | — | | | | — | | | | — | | | | — | | |
Net asset value, end of period | | $ | 15.10 | | | $ | 19.56 | | | $ | 19.25 | | | $ | 15.70 | | | $ | 15.01 | | |
Total return | | | (15.21 | %)(a) | | | 6.70 | % | | | 25.72 | % | | | 8.10 | % | | | (0.56 | %) | |
Ratios to average net assets(b) | |
Total gross expenses | | | 0.98 | %(c) | | | 1.05 | %(c) | | | 1.10 | % | | | 1.14 | % | | | 1.02 | % | |
Total net expenses(d) | | | 0.86 | %(c)(e) | | | 0.85 | %(c)(e) | | | 0.87 | %(e) | | | 0.90 | %(e) | | | 0.87 | %(e) | |
Net investment income | | | 2.27 | % | | | 1.74 | % | | | 2.18 | % | | | 3.06 | % | | | 3.08 | % | |
Supplemental data | |
Net assets, end of period (in thousands) | | $ | 203,574 | | | $ | 816,941 | | | $ | 465,328 | | | $ | 120,906 | | | $ | 130,380 | | |
Portfolio turnover | | | 71 | % | | | 78 | % | | | 76 | % | | | 71 | % | | | 66 | % | |
Notes to Financial Highlights
(a) The Fund received proceeds from regulatory settlements. Had the Fund not received these proceeds, the total return would have been lower by 0.14%.
(b) In addition to the fees and expenses that the Fund bears directly, the Fund indirectly bears a pro rata share of the fees and expenses of any other funds in which it invests. Such indirect expenses are not included in the Fund's reported expense ratios.
(c) Ratios include line of credit interest expense which is less than 0.01%.
(d) Total net expenses include the impact of certain fee waivers/expense reimbursements made by the Investment Manager and certain of its affiliates, if applicable.
(e) The benefits derived from expense reductions had an impact of less than 0.01%.
The accompanying Notes to Financial Statements are an integral part of this statement.
Annual Report 2016
29
COLUMBIA CONVERTIBLE SECURITIES FUND
NOTES TO FINANCIAL STATEMENTS
February 29, 2016
Note 1. Organization
Columbia Convertible Securities Fund (the Fund), a series of Columbia Funds Series Trust (the Trust), is a diversified fund. The Trust is registered under the Investment Company Act of 1940, as amended (the 1940 Act), as an open-end management investment company organized as a Delaware statutory trust.
Fund Shares
The Trust may issue an unlimited number of shares (without par value). The Fund offers Class A, Class B, Class C, Class I, Class R, Class R4, Class R5, Class W, Class Y and Class Z shares. Although all share classes generally have identical voting, dividend and liquidation rights, each share class votes separately when required by the Trust's organizational documents or by law. Different share classes pay different distribution amounts to the extent the expenses of such share classes differ, and distributions in liquidation will be proportional to the net asset value of each share class. Each share class has its own expense and sales charge structure.
Class A shares are subject to a maximum front-end sales charge of 5.75% based on the initial investment amount. Class A shares purchased without an initial sales charge in accounts aggregating $1 million to $50 million at the time of purchase are subject to a contingent deferred sales charge (CDSC) if the shares are sold within 18 months after purchase, charged as follows: 1.00% CDSC if redeemed within 12 months after purchase, and 0.50% CDSC if redeemed more than 12, but less than 18, months after purchase.
Class B shares may be subject to a maximum CDSC of 5.00% based upon the holding period after purchase. Class B shares will generally convert to Class A shares eight years after purchase. The Fund no longer accepts investments by new or existing investors in the Fund's Class B shares, except in connection with the reinvestment of any dividend and/or capital gain distributions in Class B shares of the Fund and exchanges by existing Class B shareholders of certain other funds within the Columbia Family of Funds.
Class C shares are subject to a 1.00% CDSC on shares redeemed within 12 months after purchase.
Class I shares are not subject to sales charges and are available only to the Columbia Family of Funds.
Class R shares are not subject to sales charges and are generally available only to certain retirement plans and other investors as described in the Fund's prospectus.
Class R4 shares are not subject to sales charges and are generally available only to omnibus retirement plans and certain investors as described in the Fund's prospectus.
Class R5 shares are not subject to sales charges and are generally available only to investors purchasing through authorized investment professionals and omnibus retirement plans.
Class W shares are not subject to sales charges and are available only to investors purchasing through authorized investment programs managed by investment professionals, including discretionary managed account programs.
Class Y shares are not subject to sales charges and are generally available only to certain retirement plans as described in the Fund's prospectus.
Class Z shares are not subject to sales charges and are available only to eligible investors, which are subject to different investment minimums as described in the Fund's prospectus.
Note 2. Summary of Significant Accounting Policies
Basis of Preparation
The Fund is an investment company that applies the accounting and reporting guidance in the Financial Accounting Standards Board (FASB) Accounting Standards Codification Topic 946, Financial Services — Investment Companies (ASC 946). The financial statements are prepared in accordance with U.S. generally accepted accounting principles (GAAP), which requires management to make certain estimates and assumptions that affect the reported amounts of assets and liabilities, the disclosure of contingent assets and liabilities at the date of the financial statements and the reported amounts of income and expenses during the reporting period. Actual results could differ from those estimates.
The following is a summary of significant accounting policies followed by the Fund in the preparation of its financial statements.
Security Valuation
Debt securities generally are valued by pricing services approved by the Board of Trustees (the Board) based upon market transactions for normal, institutional-size trading units of similar securities. The services may use various pricing techniques that take into account, as applicable, factors such as yield, quality, coupon rate,
Annual Report 2016
30
COLUMBIA CONVERTIBLE SECURITIES FUND
NOTES TO FINANCIAL STATEMENTS (continued)
February 29, 2016
maturity, type of issue, trading characteristics and other data, as well as broker quotes. Debt securities for which quotations are not readily available or not believed to be reflective of market value may also be valued based upon a bid quote from an approved independent broker-dealer. Debt securities maturing in 60 days or less are valued primarily at amortized cost value, unless this method results in a valuation that management believes does not approximate market value.
All equity securities are valued at the close of business of the New York Stock Exchange (NYSE). Equity securities are valued at the last quoted sales price on the principal exchange or market on which they trade, except for securities traded on the NASDAQ Stock Market, which are valued at the NASDAQ official close price. Unlisted securities or listed securities for which there were no sales during the day are valued at the mean of the latest quoted bid and ask prices on such exchanges or markets.
Foreign equity securities are valued based on the closing price on the foreign exchange in which such securities are primarily traded. If any foreign equity security closing prices are not readily available, the securities are valued at the mean of the latest quoted bid and ask prices on such exchanges or markets. Foreign currency exchange rates are generally determined at 4:00 p.m. Eastern (U.S.) time. Many securities markets and exchanges outside the U.S. close prior to the close of the NYSE; therefore, the closing prices for securities in such markets or on such exchanges may not fully reflect events that occur after such close but before the close of the NYSE. In those situations, foreign securities will be fair valued pursuant to a policy adopted by the Board, including, if available, utilizing a third party pricing service to determine these fair values. The third party pricing service takes into account multiple factors, including, but not limited to, movements in the U.S. securities markets, certain depositary receipts, futures contracts and foreign exchange rates that have occurred subsequent to the close of the foreign exchange or market, to determine a good faith estimate that reasonably reflects the current market conditions as of the close of the NYSE. The fair value of a security is likely to be different from the quoted or published price, if available.
Investments in open-end investment companies, including money market funds, are valued at their latest net asset value.
Investments for which market quotations are not readily available, or that have quotations which management
believes are not reflective of market value or reliable, are valued at fair value as determined in good faith under procedures approved by and under the general supervision of the Board. If a security or class of securities (such as foreign securities) is valued at fair value, such value is likely to be different from the quoted or published price for the security.
The determination of fair value often requires significant judgment. To determine fair value, management may use assumptions including but not limited to future cash flows and estimated risk premiums. Multiple inputs from various sources may be used to determine fair value.
GAAP requires disclosure regarding the inputs and valuation techniques used to measure fair value and any changes in valuation inputs or techniques. In addition, investments shall be disclosed by major category. This information is disclosed following the Fund's Portfolio of Investments.
Equity-Linked Notes
The Fund may invest in equity-linked notes (ELNs). An ELN is a debt instrument generally valued based on a quotation received from a counterparty, which is based on the value of a single equity security, basket of equity securities or an index of equity securities (each, an Underlying Equity). An ELN typically provides interest income, thereby offering a yield advantage over investing directly in an Underlying Equity. However, the holder of an ELN may have limited or no benefit from any appreciation in the Underlying Equity, but is exposed to various risks, including, without limitation, volatility, issuer and market risk. The Fund may purchase ELNs that trade on a securities exchange or those that trade on the over-the-counter markets, including securities offered and sold under Rule 144A of the Securities Act of 1933, as amended. The Fund may also purchase an ELN in a privately negotiated transaction with the issuer of the ELN (or its broker-dealer affiliate).
Security Transactions
Security transactions are accounted for on the trade date. Cost is determined and gains (losses) are based upon the specific identification method for both financial statement and federal income tax purposes.
Income Recognition
Interest income is recorded on an accrual basis. Market premiums and discounts, including original issue discounts, are amortized and accreted, respectively, over the expected life of the security on all debt securities,
Annual Report 2016
31
COLUMBIA CONVERTIBLE SECURITIES FUND
NOTES TO FINANCIAL STATEMENTS (continued)
February 29, 2016
unless otherwise noted. For convertible securities, premiums attributable to the conversion feature are not amortized.
The Fund may place a debt security on non-accrual status and reduce related interest income when it becomes probable that the interest will not be collected and the amount of uncollectible interest can be reasonably estimated. A defaulted debt security is removed from non-accrual status when the issuer resumes interest payments or when collectibility of interest is reasonably assured.
Corporate actions and dividend income are generally recorded net of any non-reclaimable tax withholdings, on the ex-dividend date or upon receipt of ex-dividend notification in the case of certain foreign securities.
The Fund may receive distributions from holdings in equity securities, business development companies (BDCs), exchange-traded funds, other regulated investment companies (RICs), and real estate investment trusts (REITs), which report information on the tax character of their distributions annually. These distributions are allocated to dividend income, capital gain and return of capital based on actual information reported. Return of capital is recorded as a reduction of the cost basis of securities held. If the Fund no longer owns the applicable securities, return of capital is recorded as a realized gain. With respect to REITs, to the extent actual information has not yet been reported, estimates for return of capital are made by the Fund's management. Management's estimates are subsequently adjusted when the actual character of the distributions is disclosed by the REITs, which could result in a proportionate change in return of capital to shareholders.
Awards from class action litigation are recorded as a reduction of cost basis if the Fund still owns the applicable securities on the payment date. If the Fund no longer owns the applicable securities, the proceeds are recorded as realized gains.
The value of additional securities received as an income payment is recorded as income and increases the cost basis of such securities.
Expenses
General expenses of the Trust are allocated to the Fund and other funds of the Trust based upon relative net assets or other expense allocation methodologies determined by the nature of the expense. Expenses directly attributable to the Fund are charged to the Fund.
Expenses directly attributable to a specific class of shares are charged to that share class.
Determination of Class Net Asset Value
All income, expenses (other than class-specific expenses, which are charged to that share class, as shown in the Statement of Operations) and realized and unrealized gains (losses) are allocated to each class of the Fund on a daily basis, based on the relative net assets of each class, for purposes of determining the net asset value of each class.
Federal Income Tax Status
The Fund intends to qualify each year as a regulated investment company under Subchapter M of the Internal Revenue Code, as amended, and will distribute substantially all of its taxable income (including net short-term capital gains), if any, for its tax year, and as such will not be subject to federal income taxes. In addition, the Fund intends to distribute in each calendar year substantially all of its net investment income, capital gains and certain other amounts, if any, such that the Fund should not be subject to federal excise tax. Therefore, no federal income or excise tax provision is recorded.
Foreign Taxes
The Fund may be subject to foreign taxes on income, gains on investments or currency repatriation, a portion of which may be recoverable. The Fund will accrue such taxes and recoveries, as applicable, based upon its current interpretation of tax rules and regulations that exist in the markets in which it invests.
Realized gains in certain countries may be subject to foreign taxes at the Fund level, based on statutory rates. The Fund accrues for such foreign taxes on realized and unrealized gains at the appropriate rate for each jurisdiction, as applicable. The amount, if any, is disclosed as a liability on the Statement of Assets and Liabilities.
Distributions to Shareholders
Distributions from net investment income, if any, are declared and paid each calendar quarter. Net realized capital gains, if any, are distributed at least annually. Income distributions and capital gain distributions are determined in accordance with federal income tax regulations, which may differ from GAAP.
Annual Report 2016
32
COLUMBIA CONVERTIBLE SECURITIES FUND
NOTES TO FINANCIAL STATEMENTS (continued)
February 29, 2016
Guarantees and Indemnifications
Under the Trust's organizational documents and, in some cases, by contract, its officers and trustees are indemnified against certain liabilities arising out of the performance of their duties to the Trust or its funds. In addition, certain of the Fund's contracts with its service providers contain general indemnification clauses. The Fund's maximum exposure under these arrangements is unknown since the amount of any future claims that may be made against the Fund cannot be determined, and the Fund has no historical basis for predicting the likelihood of any such claims.
Recent Accounting Pronouncement
Fair Value Measurement (Topic 820), Disclosure for Investments in Certain Entities That Calculate Net Asset Value per Share (or Its Equivalent)
In May 2015, FASB issued Accounting Standards Update (ASU) No. 2015-07, Fair Value Measurement (Topic 820), Disclosure for Investments in Certain Entities That Calculate Net Asset Value per Share (or Its Equivalent). ASU No. 2015-07 changes the disclosure requirements for investments for which fair value is measured using the net asset value per share practical expedient. The disclosure requirements are effective for annual periods beginning after December 15, 2015 and interim periods within those fiscal years. At this time, management is evaluating the implications of this guidance and the impact it will have on the financial statement amounts and footnote disclosures, if any.
Note 3. Fees and Other Transactions with Affiliates
Management Fees
Effective July 1, 2015, the Fund entered into a Management Agreement with Columbia Management Investment Advisers, LLC (the Investment Manager), a wholly-owned subsidiary of Ameriprise Financial, Inc. (Ameriprise Financial). Under the Management Agreement, the Investment Manager provides the Fund with investment research and advice, as well as administrative and accounting services. The management services fee is an annual fee that is equal to a percentage of the Fund's average daily net assets that declines from 0.82% to 0.67% as the Fund's net assets increase. The effective management services fee rate for the year ended February 29, 2016 was 0.78% of the Fund's average daily net assets.
Prior to July 1, 2015, the Fund paid the Investment Manager an annual fee for advisory services under an Investment Management Services Agreement and a separate annual fee for administrative and accounting services under an Administrative Services Agreement. For the period from March 1, 2015 through June 30, 2015, the investment advisory services fee paid to the Investment Manager was $3,335,564, and the administrative services fee paid to the Investment Manager was $258,714.
Other Expenses
Other expenses are for, among other things, miscellaneous expenses of the Fund or the Board, including payments to Board Services Corp., a company providing limited administrative services to the Fund and the Board. That company's expenses include boardroom and office expense, employee compensation, employee health and retirement benefits, and certain other expenses. For the year ended February 29, 2016, other expenses paid by the Fund to this company were $3,287.
Compensation of Board Members
Board members, who are not officers or employees of the Investment Manager or Ameriprise Financial, are compensated for their services to the Fund as disclosed in the Statement of Operations. Under a Deferred Compensation Plan (the Plan), these Board members may elect to defer payment of up to 100% of their compensation. Deferred amounts are treated as though equivalent dollar amounts had been invested in shares of certain funds managed by the Investment Manager. The Fund's liability for these amounts is adjusted for market value changes and remains in the Fund until distributed in accordance with the Plan. All amounts payable under the Plan constitute a general unsecured obligation of the Fund.
Transfer Agency Fees
Under a Transfer and Dividend Disbursing Agent Agreement, Columbia Management Investment Services Corp. (the Transfer Agent), an affiliate of the Investment Manager and a wholly-owned subsidiary of Ameriprise Financial, is responsible for providing transfer agency services to the Fund. The Transfer Agent has contracted with Boston Financial Data Services (BFDS) to serve as sub-transfer agent.
The Transfer Agent receives a monthly transfer agency fee based on the number or the average value of
Annual Report 2016
33
COLUMBIA CONVERTIBLE SECURITIES FUND
NOTES TO FINANCIAL STATEMENTS (continued)
February 29, 2016
accounts, depending on the type of account. In addition, the Transfer Agent also receives sub-transfer agency fees based on a percentage of the average aggregate value of the Fund's shares maintained in omnibus accounts (other than omnibus accounts for which American Enterprise Investment Services Inc. is the broker of record or accounts where the beneficial shareholder is a customer of Ameriprise Financial Services, Inc., for which the Transfer Agent receives a per account fee). The Transfer Agent pays the fees of BFDS for services as sub-transfer agent and is not entitled to reimbursement for such fees from the Fund (with the exception of out-of-pocket fees).
The Transfer Agent also receives compensation from the Fund for various shareholder services and reimbursements for certain out-of-pocket fees. Total transfer agency fees for and Class R5 shares are subject to an annual limitation of not more than 0.05% of the average daily net assets attributable to Class R5 shares. Class I and Class Y shares do not pay transfer agency fees.
For the year ended February 29, 2016, the Fund's annualized effective transfer agency fee rates as a percentage of average daily net assets of each class were as follows:
Class A | | | 0.17 | % | |
Class B | | | 0.17 | | |
Class C | | | 0.17 | | |
Class R | | | 0.17 | | |
Class R4 | | | 0.17 | | |
Class R5 | | | 0.05 | | |
Class W | | | 0.17 | | |
Class Z | | | 0.17 | | |
An annual minimum account balance fee of $20 may apply to certain accounts with a value below the applicable share class's initial minimum investment requirements to reduce the impact of small accounts on transfer agency fees. These minimum account balance fees are remitted to the Fund and recorded as part of expense reductions in the Statement of Operations. For the year ended February 29, 2016, these minimum account balance fees reduced total expenses of the Fund by $823.
Distribution and Service Fees
The Fund has an agreement with Columbia Management Investment Distributors, Inc. (the Distributor), an affiliate of the Investment Manager and a wholly-owned
subsidiary of Ameriprise Financial, for distribution and shareholder services. The Board has approved, and the Fund has adopted, distribution and shareholder service plans (the Plans) applicable to certain share classes, which set the distribution and service fees for the Fund. These fees are calculated daily and are intended to compensate the Distributor and/or eligible selling and/or servicing agents for selling shares of the Fund and providing services to investors.
Under the Plans, the Fund pays a monthly combined distribution and service fee to the Distributor at the maximum annual rate of 0.25% of the average daily net assets attributable to Class A shares of the Fund. Also under the Plans, the Fund pays a monthly service fee at the maximum annual rate of 0.25% of the average daily net assets attributable to Class B, Class C and Class W shares of the Fund and a monthly distribution fee at the maximum annual rate of 0.75%, 0.75%, 0.50% and 0.25% of the average daily net assets attributable to Class B, Class C, Class R and Class W shares of the Fund, respectively.
Although the Fund may pay a distribution fee up to 0.25% of the Fund's average daily net assets attributable to Class W shares and a service fee of up to 0.25% of the Fund's average daily net assets attributable to Class W shares, the aggregate fee shall not exceed 0.25% of the Fund's average daily net assets attributable to Class W shares.
Sales Charges
Sales charges, including front-end charges and CDSCs, received by the Distributor for distributing Fund shares were $629,327 for Class A and $9,513 for Class C shares for the year ended February 29, 2016.
Expenses Waived/Reimbursed by the Investment Manager and its Affiliates
The Fund's expense ratio is subject to an expense reimbursement arrangement pursuant to which fees will be waived and/or expenses reimbursed (excluding certain fees and expenses described below), so that the Fund's net operating expenses, after giving effect to fees waived/expenses reimbursed and any balance credits
Annual Report 2016
34
COLUMBIA CONVERTIBLE SECURITIES FUND
NOTES TO FINANCIAL STATEMENTS (continued)
February 29, 2016
and/or overdraft charges from the Fund's custodian, do not exceed the annual rates of:
| | | Contractual
Expense Cap
July 1, 2015
Through
June 30, 2016 | | Contractual
Expense Cap
Prior to
July 1, 2015 | |
Class A | | | 1.13 | % | | | 1.13 | % | |
Class B | | | 1.88 | | | | 1.88 | | |
Class C | | | 1.88 | | | | 1.88 | | |
Class I | | | 0.72 | | | | 0.72 | | |
Class R | | | 1.38 | | | | 1.38 | | |
Class R4 | | | 0.88 | | | | 0.88 | | |
Class R5 | | | 0.77 | | | | 0.77 | | |
Class W | | | 1.13 | | | | 1.13 | | |
Class Y | | | 0.72 | | | | 0.72 | * | |
Class Z | | | 0.88 | | | | 0.88 | | |
*Expense cap rate is contractual from October 1, 2014 (the commencement of operations of Class Y shares) through September 30, 2015.
The contractual agreement may be modified or amended only with approval from the Investment Manager, certain of its affiliates and the Fund. Under the arrangements, the following fees and expenses are excluded from the waiver/reimbursement commitment, and therefore will be paid by the Fund, if applicable: taxes (including foreign transaction taxes), expenses associated with investments in affiliated and non-affiliated pooled investment vehicles (including mutual funds and exchange-traded funds), transaction costs and brokerage commissions, costs related to any securities lending program, dividend and interest expenses associated with securities sold short, inverse floater program fees and expenses, transaction charges and interest on borrowed money, interest and extraordinary expenses and any other expenses the exclusion of which is specifically approved by the Board.
Prior to July 1, 2015, the Fund's expense ratio was subject to a voluntary expense reimbursement arrangement pursuant to which fees were waived and/or expenses reimbursed (excluding certain fees and expenses immediately described above), so that the Fund's net operating expenses, after giving effect to fees waived/expenses reimbursed and any balance credits and/or overdraft charges from the Fund's custodian, did not exceed the annual rates of 1.10% for Class A, 1.85% for Class B, 1.85% for Class C, 0.69% for Class I, 1.35% for Class R, 0.85% for Class R4, 0.74% for Class R5, 1.10% for Class W, 0.69% for Class Y and 0.85% for Class Z.
Any fees waived and/or expenses reimbursed under the expense reimbursement arrangements described above are not recoverable by the Investment Manager or its affiliates in future periods.
Note 4. Federal Tax Information
The timing and character of income and capital gain distributions are determined in accordance with income tax regulations, which may differ from GAAP because of temporary or permanent book to tax differences.
At February 29, 2016, these differences are primarily due to differing treatment for deferral/reversal of wash sale losses, Trustees' deferred compensation, distribution reclassifications, deemed distributions, post-October capital losses, late-year ordinary losses, proceeds from regulatory settlements and amortization/accretion on certain convertible securities. To the extent these differences are permanent, reclassifications are made among the components of the Fund's net assets in the Statement of Assets and Liabilities. Temporary differences do not require reclassifications. In the Statement of Assets and Liabilities the following reclassifications were made:
Excess of distributions over net investment income | | $ | 13,618,633 | | |
Accumulated net realized loss | | | (11,530,641 | ) | |
Paid-in capital | | | (2,087,992 | ) | |
Net investment income (loss) and net realized gains (losses), as disclosed in the Statement of Operations, and net assets were not affected by this reclassification.
The tax character of distributions paid during the years indicated was as follows:
Year Ended | | February 29,
2016 | | February 28,
2015 | |
Ordinary income | | $ | 56,471,146 | | | $ | 34,784,198 | | |
Long-term capital gains | | | 53,061,500 | | | | 23,105,408 | | |
Total | | $ | 109,532,646 | | | $ | 57,889,606 | | |
Short-term capital gain distributions, if any, are considered ordinary income distributions for tax purposes.
At February 29, 2016, the components of distributable earnings on a tax basis were as follows:
Net unrealized depreciation | | $ | (83,815,575 | ) | |
At February 29, 2016, the cost of investments for federal income tax purposes was $764,523,449 and the
Annual Report 2016
35
COLUMBIA CONVERTIBLE SECURITIES FUND
NOTES TO FINANCIAL STATEMENTS (continued)
February 29, 2016
aggregate gross unrealized appreciation and depreciation based on that cost was:
Unrealized appreciation | | $ | 31,094,310 | | |
Unrealized depreciation | | | (114,909,885 | ) | |
Net unrealized depreciation | | $ | (83,815,575 | ) | |
Under current tax rules, regulated investment companies can elect to treat certain late-year ordinary losses incurred and post-October capital losses (capital losses realized after October 31) as arising on the first day of the following taxable year. As of February 29, 2016, the Fund will elect to treat late-year ordinary losses of $6,332,443 and post-October capital losses of $54,201,386 as arising on March 1, 2016.
Management of the Fund has concluded that there are no significant uncertain tax positions in the Fund that would require recognition in the financial statements. However, management's conclusion may be subject to review and adjustment at a later date based on factors including, but not limited to, new tax laws, regulations, and administrative interpretations (including relevant court decisions). Generally, the Fund's federal tax returns for the prior three fiscal years remain subject to examination by the Internal Revenue Service.
Note 5. Portfolio Information
The cost of purchases and proceeds from sales of securities, excluding short-term investments and derivatives, if any, aggregated to $815,793,012 and $1,282,266,423, respectively, for the year ended February 29, 2016. The amount of purchase and sale activity impacts the portfolio turnover rate reported in the Financial Highlights.
Note 6. Regulatory Settlements
During the year ended February 29, 2016, the Fund recorded a receivable $2,024,844 as a result of a regulatory settlement proceeding brought by the Securities and Exchange Commission against an unaffiliated third party relating to market timing and/or late trading of mutual funds. This amount represented the Fund's portion of the proceeds from the settlement (neither the Fund nor the Investment Manager were a party to the proceeding). The payments have been included in Proceeds from regulatory settlements in the Statement of Changes in Net Assets.
Note 7. Affiliated Money Market Fund
The Fund invests in Columbia Short-Term Cash Fund, an affiliated money market fund established for the
exclusive use by the Fund and other affiliated funds. The income earned by the Fund from such investments is included as Dividends — affiliated issuers in the Statement of Operations. As an investing fund, the Fund indirectly bears its proportionate share of the expenses of Columbia Short-Term Cash Fund.
Note 8. Line of Credit
The Fund has access to a revolving credit facility whereby the Fund may borrow for the temporary funding of shareholder redemptions or for other temporary or emergency purposes. Effective December 8, 2015, Citibank, N.A. and HSBC Bank USA, N.A. joined JPMorgan Chase Bank, N.A. (JPMorgan) as lead of a syndicate of banks under the credit facility, which is a collective agreement between the Fund and certain other funds managed by the Investment Manager, severally and not jointly, that permits collective borrowings up to $1 billion. Interest is charged to each participating fund based on its borrowings at a rate equal to the higher of (i) the overnight federal funds rate plus 1.00% or (ii) the one-month LIBOR rate plus 1.00%. Each borrowing under the credit facility matures no later than 60 days after the date of borrowing. The Fund also pays a commitment fee equal to its pro rata share of the amount of the credit facility at a rate of 0.15% per annum. The commitment fee is included in other expenses in the Statement of Operations. Prior to December 8, 2015, JPMorgan was the sole lead bank under the credit facility agreement that permitted borrowings up to $550 million under the same terms and interest rates as described above with the exception of the commitment fee which was charged at a rate of 0.075% per annum.
For the year ended February 29, 2016, the average daily loan balance outstanding on days when borrowing existed was $22,700,000 at a weighted average interest rate of 1.30%. Interest expense incurred by the Fund is recorded as a line of credit interest expense in the Statement of Operations. The Fund had no outstanding borrowings at February 29, 2016.
Note 9. Significant Risks
Shareholder Concentration Risk
At February 29, 2016, one unaffiliated shareholder of record owned 27.0% of the outstanding shares of the Fund in one or more accounts. The Fund has no knowledge about whether any portion of those shares was owned beneficially. Affiliated shareholders of record owned 30.8% of the outstanding shares of the Fund in one or more accounts. Subscription and redemption
Annual Report 2016
36
COLUMBIA CONVERTIBLE SECURITIES FUND
NOTES TO FINANCIAL STATEMENTS (continued)
February 29, 2016
activity by concentrated accounts may have a significant effect on the operations of the Fund. In the case of a large redemption, the Fund may be forced to sell investments at inopportune times, including its liquid or more liquid positions, resulting in Fund losses and the Fund holding a higher percentage of less liquid or illiquid securities. Large redemptions could result in decreased economies of scale and increased operating expenses for non-redeeming Fund shareholders.
Credit Risk
Credit risk is the risk that the value of debt securities in the Fund's portfolio may decline because the issuer may default and fail to pay interest or repay principal when due. Rating agencies assign credit ratings to debt securities to indicate their credit risk. Lower rated or unrated debt securities held by the Fund may present increased credit risk as compared to higher-rated debt securities.
Interest Rate Risk
Interest rate risk is the risk of losses attributable to changes in interest rates. In general, if prevailing interest rates rise, the values of debt securities tend to fall, and if interest rates fall, the values of debt securities tend to rise. Actions by governments and central banking authorities can result in increases in interest rates. Increasing interest rates may negatively affect the value of debt securities held by the Fund, resulting in a negative impact on the Fund's performance and net asset value per share. In general, the longer the maturity or duration of a debt security, the greater its sensitivity to changes in interest rates.
Liquidity Risk
Liquidity risk is the risk associated with a lack of marketability of investments which may make it difficult to sell the investment at a desirable time or price. Changing regulatory, market or other conditions or environments (for example, the interest rate or credit environments) may adversely affect the liquidity of the Fund's investments. The Fund may have to accept a lower selling price for the holding, sell other investments, or forego another, more appealing investment opportunity. Generally, the less liquid the market at the time the Fund sells a portfolio investment, the greater the risk of loss or decline of value to the Fund. A less liquid market can lead to an increase in Fund redemptions, which may negatively impact Fund performance and net asset value per share, including, for
example, if the Fund is forced to sell securities in a down market.
Convertible Securities Risk
Convertible debt securities are subject to the usual risks associated with debt securities, such as interest rate risk and credit risk. Convertible securities also react to changes in the value of the common stock into which they convert, and are thus subject to market risk. The Fund may also be forced to convert a convertible security at an inopportune time, which may decrease the Fund's return.
Note 10. Subsequent Events
Management has evaluated the events and transactions that have occurred through the date the financial statements were issued and noted no items requiring adjustment of the financial statements or additional disclosure.
Note 11. Information Regarding Pending and Settled Legal Proceedings
In December 2005, without admitting or denying the allegations, American Express Financial Corporation (AEFC, which is now known as Ameriprise Financial, Inc. (Ameriprise Financial)) entered into settlement agreements with the Securities and Exchange Commission (SEC) and Minnesota Department of Commerce (MDOC) related to market timing activities. As a result, AEFC was censured and ordered to cease and desist from committing or causing any violations of certain provisions of the Investment Advisers Act of 1940, the Investment Company Act of 1940, and various Minnesota laws. AEFC agreed to pay disgorgement of $10 million and civil money penalties of $7 million. AEFC also agreed to retain an independent distribution consultant to assist in developing a plan for distribution of all disgorgement and civil penalties ordered by the SEC in accordance with various undertakings detailed at http://www.sec.gov/litigation/admin/ia-2451.pdf. Ameriprise Financial and its affiliates have cooperated with the SEC and the MDOC in these legal proceedings, and have made regular reports to the Funds' Boards of Trustees.
Ameriprise Financial and certain of its affiliates have historically been involved in a number of legal, arbitration and regulatory proceedings, including routine litigation, class actions, and governmental actions, concerning matters arising in connection with the conduct of their business activities. Ameriprise Financial believes that
Annual Report 2016
37
COLUMBIA CONVERTIBLE SECURITIES FUND
NOTES TO FINANCIAL STATEMENTS (continued)
February 29, 2016
the Funds are not currently the subject of, and that neither Ameriprise Financial nor any of its affiliates are the subject of, any pending legal, arbitration or regulatory proceedings that are likely to have a material adverse effect on the Funds or the ability of Ameriprise Financial or its affiliates to perform under their contracts with the Funds. Ameriprise Financial is required to make quarterly (10-Q), annual (10-K) and, as necessary, 8-K filings with the SEC on legal and regulatory matters that relate to Ameriprise Financial and its affiliates. Copies of these filings may be obtained by accessing the SEC website at www.sec.gov.
There can be no assurance that these matters, or the adverse publicity associated with them, will not result in increased fund redemptions, reduced sale of fund shares or other adverse consequences to the Funds. Further, although we believe proceedings are not likely to have a material adverse effect on the Funds or the ability of Ameriprise Financial or its affiliates to perform under their contracts with the Funds, these proceedings are subject to uncertainties and, as such, we are unable to estimate the possible loss or range of loss that may result. An adverse outcome in one or more of these proceedings could result in adverse judgments, settlements, fines, penalties or other relief that could have a material adverse effect on the consolidated financial condition or results of operations of Ameriprise Financial.
Annual Report 2016
38
COLUMBIA CONVERTIBLE SECURITIES FUND
REPORT OF INDEPENDENT REGISTERED PUBLIC ACCOUNTING FIRM
To the Trustees of Columbia Funds Series Trust and the Shareholders of
Columbia Convertible Securities Fund
In our opinion, the accompanying statement of assets and liabilities, including the portfolio of investments, and the related statements of operations and of changes in net assets and the financial highlights present fairly, in all material respects, the financial position of Columbia Convertible Securities Fund (the "Fund," a series of Columbia Funds Series Trust) at February 29, 2016, and the results of its operations, the changes in its net assets and the financial highlights for each of the periods indicated, in conformity with accounting principles generally accepted in the United States of America. These financial statements and financial highlights (hereafter referred to as "financial statements") are the responsibility of the Fund's management. Our responsibility is to express an opinion on these financial statements based on our audits. We conducted our audits of these financial statements in accordance with the standards of the Public Company Accounting Oversight Board (United States). Those standards require that we plan and perform the audit to obtain reasonable assurance about whether the financial statements are free of material misstatement. An audit includes examining, on a test basis, evidence supporting the amounts and disclosures in the financial statements, assessing the accounting principles used and significant estimates made by management, and evaluating the overall financial statement presentation. We believe that our audits, which included confirmation of securities at February 29, 2016 by correspondence with the custodian, brokers and transfer agent, and the application of alternative auditing procedures where such confirmations had not been received, provide a reasonable basis for our opinion.
PricewaterhouseCoopers LLP
Minneapolis, MN
April 21, 2016
Annual Report 2016
39
COLUMBIA CONVERTIBLE SECURITIES FUND
FEDERAL INCOME TAX INFORMATION
(Unaudited)
The Fund hereby designates the following tax attributes for the fiscal year ended February 29, 2016. Shareholders will be notified in early 2017 of the amounts for use in preparing 2016 income tax returns.
Tax Designations:
| Qualified Dividend Income | | | 22.68 | % | |
| Dividends Received Deduction | | | 16.18 | % | |
| Capital Gain Dividend | | $ | 28,510,144 | | |
Qualified Dividend Income. For taxable, non-corporate shareholders, the percentage of ordinary income distributed during the fiscal year that represents qualified dividend income subject to reduced tax rates.
Dividends Received Deduction. The percentage of ordinary income distributed during the fiscal year that qualifies for the corporate dividends received deduction.
Capital Gain Dividend. The Fund designates as a capital gain dividend the amount reflected above, or if subsequently determined to be different, the net capital gain of such fiscal period.
Annual Report 2016
40
COLUMBIA CONVERTIBLE SECURITIES FUND
Shareholders elect the Board that oversees the Fund's operations. The Board appoints officers who are responsible for day-to-day business decisions based on policies set by the Board. The following table provides basic biographical information about the Fund's Trustees, including their principal occupations during the past five years, although specific titles for individuals may have varied over the period. Under current Board policy, members generally may serve through the end of the calendar year in which they reach either the mandatory retirement age established by the Board or the fifteenth anniversary of the first Board meeting they attended as a member of the Board.
Trustees
Independent Trustees
Name,
Address,
Year of Birth | | Position Held With
the Funds and Length of
Service | | Principal Occupation(s)
During the Past Five Years
and Other Relevant
Professional Experience | | Number of
Funds in the
Columbia
Funds Complex
Overseen | | Other Directorships
Held by Trustee
During the Past
Five Years | |
Kathleen Blatz
901 S. Marquette Ave.
Minneapolis, MN 55402
1954 | | Trustee since 1/06 for RiverSource Funds and since 6/11 for Nations Funds | | Attorney; specializing in arbitration and mediation; Chief Justice, Minnesota Supreme Court, 1998-2006; Associate Justice, Minnesota Supreme Court, 1996-1998; Fourth Judicial District Court Judge, Hennepin County, 1994-1996; Attorney in private practice and public service, 1984-1993; State Representative, Minnesota House of Representatives, 1979-1993, which included service on the Tax and Financial Institutions and Insurance Committees | | | 124 | | | Trustee, BlueCross BlueShield of Minnesota (Chair of the Business Development Committee) since 2009; Chair of the Robina Foundation since August 2013 | |
Edward J. Boudreau, Jr.
901 S. Marquette Ave.
Minneapolis, MN 55402
1944 | | Trustee since 6/11 for RiverSource Funds and since 1/05 for Nations Funds | | Managing Director, E.J. Boudreau & Associates (consulting) since 2000; FINRA Industry Arbitrator, 2002-present; Chairman and Chief Executive Officer, John Hancock Funds (asset management), Chairman and Interested Trustee for open-end and closed-end funds offered by John Hancock, 1989-2000; John Hancock Life Insurance Company, including SVP and Treasurer and SVP Information Technology, 1968-1988 | | | 122 | | | Former Trustee, Boston Museum of Science (Chair of Finance Committee), 1985-2013; former Trustee, BofA Funds Series Trust (11 funds), 2005-2011 | |
Pamela G. Carlton
901 S. Marquette Ave.
Minneapolis, MN 55402
1954 | | Trustee since 7/07 for RiverSource Funds and since 6/11 for Nations Funds | | President, Springboard-Partners in Cross Cultural Leadership (consulting company) since 2003; Managing Director of US Equity Research, JP Morgan Chase, 1999-2003; Director of US Equity Research, Chase Asset Management, 1996-1999; Co-Director Latin America Research, 1993-1996, COO Global Research, 1992-1996, Co-Director of US Research, 1991-1992, Investment Banker, Morgan Stanley, 1982-1991 | | | 124 | | | Trustee, New York Presbyterian Hospital Board (Executive Committee and Chair of Human Resources Committee) since 1996 | |
Annual Report 2016
41
COLUMBIA CONVERTIBLE SECURITIES FUND
TRUSTEES AND OFFICERS (continued)
Independent Trustees (continued)
Name,
Address,
Year of Birth | | Position Held With
the Funds and Length of
Service | | Principal Occupation(s)
During the Past Five Years
and Other Relevant
Professional Experience | | Number of
Funds in the
Columbia
Funds Complex
Overseen | | Other Directorships
Held by Trustee
During the Past
Five Years | |
William P. Carmichael
901 S. Marquette Ave.
Minneapolis, MN 55402
1943 | | Trustee since 6/11 for RiverSource Funds and since 2003 for Nations Funds; Chair of the Board from 1/14-11/15 | | Retired; Co-founder, The Succession Fund (provides exit strategies to owners of privately held companies), 1998-2007; Adjunct Professor of Finance, Kelley School of Business, Indiana University, 1993-2007; Senior Vice President, Sara Lee Corporation, 1991-1993; Senior Vice President and Chief Financial Officer, Beatrice Foods Company, 1984-1990; Vice President, Esmark, Inc., 1973-1984; Associate, Price Waterhouse, 1968-1972 | | | 124 | | | Director, The Finish Line (athletic shoes and apparel) since July 2003; Director, International Textile Corp. since 2012; Director, hhgregg since May, 2015; former Director, Cobra Electronics Corporation (electronic equipment manufacturer), 1994-August 2014; former Director, Spectrum Brands, Inc. (consumer products), 2002-2009; former Director, Simmons Company (bedding), 2004-2010; former Trustee, BofA Funds Series Trust (11 funds), 2009-2011; former Director, McMoRan Exploration Company (oil and gas exploration and development), 2010-2013 | |
Patricia M. Flynn
901 S. Marquette Ave.
Minneapolis, MN 55402
1950 | | Trustee since 11/04 for RiverSource Funds and since 6/11 for Nations Funds | | Trustee Professor of Economics and Management, Bentley University since 1976 (also teaches and conducts research on corporate governance); Dean, McCallum Graduate School of Business, Bentley University, 1992-2002 | | | 124 | | | Trustee, MA Taxpayers Foundation since 1997; Board of Governors, Innovation Institute, MA Technology Collaborative since 2010 | |
William A. Hawkins
901 S. Marquette Ave.
Minneapolis, MN 55402
1942 | | Chair of the Board since 11/15; Trustee since 6/11 for RiverSource Funds and since 1/05 for Nations Funds | | Managing Director, Overton Partners (financial consulting) since August 2010; President and Chief Executive Officer, California General Bank, N.A., January 2008-August 2010; Operation Hope, COO, 2004-2007; IndyMac Bancorp, President, CBG, 1999-2003; American General Bank, President, 1997-1999; Griffin Financial Services, CEO, 1981-1997; The Griffin Funds, CEO, 1992-1998 | | | 124 | | | Former Trustee, BofA Funds Series Trust (11 funds), 2009-2015 | |
R. Glenn Hilliard
901 S. Marquette Ave.
Minneapolis, MN 55402
1943 | | Trustee since 6/11 for RiverSource Funds and since 1/05 for Nations Funds | | Chairman and Chief Executive Officer, Hilliard Group LLC (investing and consulting) since April 2003; Non-Executive Director & Chairman, CNO Financial Group, Inc. (insurance), 2003-2011; Chair & CEO, ING Americas, 1996-2003 | | | 122 | | | Chairman, BofA Funds Series Trust (11 funds); former Director, CNO Financial Group, Inc. (insurance), 2003-2011 | |
Annual Report 2016
42
COLUMBIA CONVERTIBLE SECURITIES FUND
TRUSTEES AND OFFICERS (continued)
Independent Trustees (continued)
Name,
Address,
Year of Birth | | Position Held With
the Funds and Length of
Service | | Principal Occupation(s)
During the Past Five Years
and Other Relevant
Professional Experience | | Number of
Funds in the
Columbia
Funds Complex
Overseen | | Other Directorships
Held by Trustee
During the Past
Five Years | |
Catherine James Paglia
901 S. Marquette Ave.
Minneapolis, MN 55402
1952 | | Trustee since 11/04 for RiverSource Funds and since 6/11 for Nations Funds | | Director, Enterprise Asset Management, Inc. (private real estate and asset management company) since September 1998; Managing Director and Partner, Interlaken Capital, Inc., 1989-1997; Managing Director, Morgan Stanley, 1982-1989; Vice President, Investment Banking, 1980-1982, Associate, Investment Banking, 1976-1980, Dean Witter Reynolds, Inc. | | | 124 | | | Director, Valmont Industries, Inc. (irrigation systems manufacturer) since 2012; Trustee, Carleton College (on the Investment Committee); Trustee, Carnegie Endowment for International Peace (on the Investment Committee) | |
Leroy C. Richie
901 S. Marquette Ave.
Minneapolis, MN 55402
1941 | | Trustee since 2000 for Seligman Funds, since 11/08 for RiverSource Funds and since 6/11 for Nations Funds | | Counsel, Lewis & Munday, P.C. (law firm) since 2004; Vice President and General Counsel, Automotive Legal Affairs, Chrysler Corporation, 1993-1997 | | | 122 | | | Lead Outside Director, Infinity Resources, Inc. (oil and gas exploration and production) since 1994; Lead Outside Director, Digital Ally, Inc. (digital imaging) since September 2005; Trustee, Marygrove College (Chair of Finance Committee) since 2007; former Director, OGE Energy Corp. (energy and energy services), 2007-2014 | |
Minor M. Shaw
901 S. Marquette Ave.
Minneapolis, MN 55402
1947 | | Trustee since 6/11 for RiverSource Funds and since 2003 for Nations Funds | | President, Micco LLC (private investments) since 2011; President, Micco Corp. (family investment business), 1998-2011 | | | 124 | | | Director, Piedmont Natural Gas; Director, BlueCross BlueShield of South Carolina since April 2008; Chair of the Duke Endowment; Director, National Association of Corporate Directors, Carolinas Chapter since 2013; Chair of Greenville — Spartanburg Airport Commission; former Trustee, BofA Funds Series Trust (11 funds), 2003-2011 | |
Alison Taunton-Rigby
901 S. Marquette Ave.
Minneapolis, MN 55402
1944 | | Trustee since 11/02 for RiverSource Funds and since 6/11 for Nations Funds | | Managing Director, Forester Biotech (consulting), 2001-2003; Chief Executive Officer and Director, RiboNovix, Inc., (biotechnology), 2003-2010; President and Chief Executive Officer of CMT Inc., 2001-2003; Aquila Biopharmaceuticals Inc., 1996-2000; Cambridge Biotech Corporation, 1995-1996; Mitotix Inc., 1993-1994 | | | 124 | | | Director, Abt Associates (government contractor) since 2001; Director, Boston Children's Hospital since 2002; Director, Healthways, Inc. (health and well-being solutions) since 2005; Director, ICI Mutual Insurance Company since 2011 | |
Annual Report 2016
43
COLUMBIA CONVERTIBLE SECURITIES FUND
TRUSTEES AND OFFICERS (continued)
Interested Trustee Not Affiliated with Investment Manager*
Name,
Address,
Year of Birth | | Position Held With
Funds and Length of
Service | | Principal Occupation(s)
During Past Five Years
and Other Relevant
Professional Experience | | Number of
Funds in the
Fund Family
Overseen by
Board Member | | Other Present or Past
Directorships/
Trusteeships
(Within Past 5 Years) | |
Anthony M. Santomero
901 S. Marquette Ave.
Minneapolis, MN 55402
1946 | | Trustee since 6/11 for RiverSource Funds and since 1/08 for Nations Funds | | Richard K. Mellon Professor Emeritus of Finance, The Wharton School, University of Pennsylvania since 2002; Senior Advisor, McKinsey & Company (consulting), 2006-2008; President, Federal Reserve Bank of Philadelphia, 2000-2006; Professor of Finance, The Wharton School, University of Pennsylvania, 1972-2002 | | | 122 | | | Trustee, Penn Mutual Life Insurance Company since March 2008; Director, Renaissance Reinsurance Ltd. since May 2008; Director, Citigroup Inc. since 2009; Director, Citibank, N.A. since 2009; former Trustee, BofA Funds Series Trust (11 funds), 2008-2011 | |
* Dr. Santomero is not an affiliated person of the Investment Manager or Ameriprise Financial. However, he is currently deemed by the Funds to be an "interested person" (as defined in the 1940 Act) of the Funds because he serves as a Director of Citigroup Inc. and Citibank, N.A., companies that may directly or through subsidiaries and affiliates engage from time-to-time in brokerage execution, principal transactions and lending relationships with the Funds or accounts advised/managed by the Investment Manager.
Annual Report 2016
44
COLUMBIA CONVERTIBLE SECURITIES FUND
TRUSTEES AND OFFICERS (continued)
Interested Trustee Affiliated with Investment Manager*
Name,
Address,
Year of Birth | | Position Held With
the Funds and Length of
Service | | Principal Occupation(s)
During Past Five Years
and Other Relevant
Professional Experience | | Number of
Funds in the
Columbia
Funds Complex
Overseen | | Other Directorships
Held by Trustee
During the Past
Five Years | |
William F. Truscott
c/o Columbia Management Investment Advisers, LLC,
225 Franklin St.
Boston, MA 02110
1960 | | Trustee since 11/01 for RiverSource Funds and since 6/11 for Nations Funds; Senior Vice President since 2002 for RiverSource Funds and since 5/10 for Nations Funds | | Chairman of the Board and President, Columbia Management Investment Advisers, LLC since May 2010 and February 2012, respectively (previously President and Chief Investment Officer, 2001-April 2010); Chief Executive Officer, Global Asset Management, Ameriprise Financial, Inc. since September 2012 (previously Chief Executive Officer, U.S. Asset Management & President, Annuities, May 2010-September 2012 and President — U.S. Asset Management and Chief Investment Officer, 2005-April 2010); Director and Chief Executive Officer, Columbia Management Investment Distributors, Inc. since May 2010 and February 2012, respectively (previously Chairman of the Board and Chief Executive Officer, 2006-April 2010); Chairman of the Board and Chief Executive Officer, RiverSource Distributors, Inc. since 2006; Director, Threadneedle Asset Management Holdings, SARL since 2014; President and Chief Executive Officer, Ameriprise Certificate Company, 2006-August 2012. | | | 182 | | | Chairman of the Board, Columbia Management Investment Advisers, LLC since May 2010; Director, Columbia Management Investment Distributors, Inc. since May 2010; Former Director, Ameriprise Certificate Company, 2006-January 2013 | |
* Interested person (as defined under the 1940 Act) by reason of being an officer, director, security holder and/or employee of the Investment Manager or Ameriprise Financial.
The Statement of Additional Information has additional information about the Fund's Board members and is available, without charge, upon request by calling 800.345.6611; contacting your financial intermediary; or visiting columbiathreadneedle.com/us.
Annual Report 2016
45
COLUMBIA CONVERTIBLE SECURITIES FUND
TRUSTEES AND OFFICERS (continued)
The Board has appointed officers who are responsible for day-to-day business decisions based on policies it has established. The officers serve at the pleasure of the Board. The following table provides basic information about the Officers of the Fund, including principal occupations during the past five years, although their specific titles may have varied over the period. In addition to Mr. Truscott, who is Senior Vice President, the Fund's other officers are:
Fund Officers
Name,
Address and
Year of Birth | | Position and Year
First Appointed to
Position for any Fund
in the Columbia
Funds Complex or a
Predecessor Thereof | | Principal Occupation(s) During Past Five Years | |
Christopher O. Petersen
5228 Ameriprise
Financial Center
Minneapolis, MN 55474
Born 1970 | | President and Principal Executive Officer (2015) | | Vice President and Lead Chief Counsel, Ameriprise Financial, Inc. since January 2015 (previously, Vice President and Chief Counsel January 2010-December 2014; and Vice President and Group Counsel or Counsel 2004-January 2010); officer of Columbia Funds and affiliated funds since 2007. | |
Michael G. Clarke
225 Franklin Street
Boston, MA 02110
Born 1969 | | Treasurer (2011), Chief Financial Officer (2009) and Chief Accounting Officer (2015) | | Vice President — Mutual Fund Administration, Columbia Management Investment Advisers, LLC, since May 2010; Managing Director of Fund Administration, Columbia Management Advisors, LLC, September 2004-April 2010; senior officer of Columbia Funds and affiliated funds since 2002. | |
Paul B. Goucher
100 Park Avenue
New York, NY 10017
Born 1968 | | Senior Vice President (2011), Chief Legal Officer (2015) and Assistant Secretary (2008) | | Vice President and Lead Chief Counsel, Ameriprise Financial, Inc. since November 2008 and January 2013, respectively (previously Chief Counsel, January 2010-January 2013 and Group Counsel, November 2008-January 2010). | |
Thomas P. McGuire
225 Franklin Street
Boston, MA 02110
Born 1972 | | Senior Vice President and Chief Compliance Officer (2012) | | Vice President — Asset Management Compliance, Ameriprise Financial, Inc., since May 2010; Chief Compliance Officer, Ameriprise Certificate Company since September 2010; Compliance Executive, Bank of America, 2005-April 2010. | |
Colin Moore
225 Franklin Street
Boston, MA 02110
Born 1958 | | Senior Vice President (2010) | | Executive Vice President and Global Chief Investment Officer, Ameriprise Financial, Inc., since July 2013; Director and Global Chief Investment Officer, Columbia Management Investment Advisers, LLC since May 2010; Manager, Managing Director and Chief Investment Officer, Columbia Management Advisors, LLC, 2007-April 2010. | |
Michael E. DeFao
225 Franklin Street
Boston, MA 02110
Born 1968 | | Vice President (2011) and Assistant Secretary (2010) | | Vice President and Chief Counsel, Ameriprise Financial, Inc. since May 2010; Associate General Counsel, Bank of America, 2005-April 2010. | |
Amy Johnson
5228 Ameriprise
Financial Center
Minneapolis, MN 55474
Born 1965 | | Vice President (2006) | | Managing Director and Chief Operating Officer, Columbia Management Investment Advisers, LLC since May 2010 (previously Chief Administrative Officer, 2009-April 2010, and Vice President — Asset Management and Trust Company Services, 2006-2009). | |
Lyn Kephart-Strong
5228 Ameriprise
Financial Center
Minneapolis, MN 55474
Born 1960 | | Vice President (2015) | | President, Columbia Management Investment Services Corp. since October 2014; Vice President & Resolution Officer, Ameriprise Trust Company since August 2009; President, RiverSource Service Corporation 2004-2010. | |
Ryan C. Larrenaga
225 Franklin Street
Boston, MA 02110
Born 1970 | | Vice President and Secretary (2015) | | Vice President and Group Counsel, Ameriprise Financial, Inc. since August 2011 (previously, Counsel from May 2010 to August 2011); Assistant General Counsel, Bank of America, 2005-April 2010; officer of Columbia Funds and affiliated funds since 2005. | |
Annual Report 2016
46
COLUMBIA CONVERTIBLE SECURITIES FUND
IMPORTANT INFORMATION ABOUT THIS REPORT
Each fund mails one shareholder report to each shareholder address. If you would like more than one report, please call shareholder services at 800.345.6611 and additional reports will be sent to you.
The policy of the Board is to vote the proxies of the companies in which each fund holds investments consistent with the procedures as stated in the Statement of Additional Information (SAI). You may obtain a copy of the SAI without charge by calling 800.345.6611; contacting your financial intermediary; visiting columbiathreadneedle.com/us; or searching the website of the Securities and Exchange Commission (SEC) at sec.gov. Information regarding how each fund voted proxies relating to portfolio securities is filed with the SEC by August 31st for the most recent 12-month period ending June 30th of that year, and is available without charge by visiting columbiathreadneedle.com/us, or searching the website of the SEC at sec.gov.
Each fund files a complete schedule of portfolio holdings with the SEC for the first and third quarters of each fiscal year on Form N-Q. Each fund's Form N-Q is available on the SEC's website at sec.gov and may be reviewed and copied at the SEC's Public Reference Room in Washington, D.C. Information on the operation of the Public Reference Room may be obtained by calling 800.SEC.0330. Each fund's complete schedule of portfolio holdings, as filed on Form N-Q, can also be obtained without charge, upon request, by calling 800.345.6611.
Annual Report 2016
47
Columbia Convertible Securities Fund
P.O. Box 8081
Boston, MA 02266-8081

This information is for use with concurrent or prior delivery of a fund prospectus. Please read and consider the investment objectives, risks, charges and expenses for any fund carefully before investing. For a prospectus and summary prospectus, which contains this and other important information about the Fund, go to columbiathreadneedle.com/us. The Fund is distributed by Columbia Management Investment Distributors, Inc., member FINRA, and managed by Columbia Management Investment Advisers, LLC.
Columbia Threadneedle Investments (Columbia Threadneedle) is the global brand name of the Columbia and Threadneedle group of companies.
All rights reserved. Columbia Management Investment Distributors, Inc., 225 Franklin Street, Boston, MA 02110-2804
© 2016 Columbia Management Investment Advisers, LLC.
columbiathreadneedle.com/us
ANN134_02_F01_(04/16)

ANNUAL REPORT
February 29, 2016

COLUMBIA INTERNATIONAL OPPORTUNITIES FUND

ABOUT COLUMBIA THREADNEEDLE INVESTMENTS
Columbia Threadneedle Investments is a leading global asset management group that provides a broad range of actively managed investment strategies and solutions for individual, institutional and corporate clients around the world.
With more than 2,000 people, including over 450 investment professionals based in North America, Europe and Asia, we manage $472 billion* of assets across developed and emerging market equities, fixed income, asset allocation solutions and alternatives. We are the 13th largest manager of long-term mutual fund assets in the U.S.** and the 4th largest manager of retail funds in the U.K.***
Our priority is the investment success of our clients. We aim to deliver the investment outcomes they expect through an investment approach that is team-based, performance-driven and risk-aware. Our culture is dynamic and interactive. By sharing our insights across asset classes and geographies, we generate richer perspectives on global, regional and local investment landscapes. The ability to exchange and debate investment ideas in a collaborative environment enriches our teams' investment processes. More importantly, it results in better informed investment decisions for our clients.
Columbia funds are distributed by Columbia Management Investment Distributors, Inc., member FINRA, and managed by Columbia Management Investment Advisers, LLC.
Columbia Threadneedle Investments (Columbia Threadneedle) is the global brand name of the Columbia and Threadneedle group of companies.
* In U.S. dollars as of December 31, 2015. Source: Ameriprise Q4 Earnings Release. Includes all assets managed by entities in the Columbia and Threadneedle groups of companies. Contact us for more current data.
** Source: ICI as of December 31, 2015 for Columbia Management Investment Advisers, LLC.
*** Source: Investment Association as of September 2015 for Threadneedle Asset Management Limited.
© 2016 Columbia Management Investment Advisers, LLC. All rights reserved.
Not part of the shareholder report
 Dear Shareholder,
Today's investors are typically focused on outcomes, like living a certain retirement lifestyle, paying for college education or building a legacy. But in today's complex global investment landscape, even simple goals are not easily achieved.
At Columbia Threadneedle Investments, we aspire to help satisfy five core needs of today's investors:
n Generate an appropriate stream of income in retirement
Traditional approaches to generating income may not provide the diversification benefits they once did, and they may actually introduce unwanted risk in today's market. To seek to improve your potential to live comfortably long term, we endeavor to pursue investments that explore less traveled paths to income.
n Navigate a changing interest rate environment
Today's uncertain market environment includes the prospect of a rise in interest rates. Blending traditional investments with non-traditional or alternative products may help protect your wealth during periods of volatility. We can attempt to help strengthen your portfolio with agile products designed to take on the market's ups and downs.
n Maximize after-tax returns
In an environment where what you keep may be more important than what you earn, municipal bonds can help mitigate high tax burdens while providing potentially attractive yields. Our state and federal tax-exempt products are aimed at helping investors manage risk, minimize the fluctuation of capital and grow wealth on a more tax-efficient basis.
n Grow assets to achieve financial goals
We believe that finding and protecting growth comes from a disciplined security selection process designed to create excess return. Our goal is to provide investment solutions built to help you face today's market challenges and grow your assets at each crossroad of your journey.
n Ease the impact of volatile markets
Despite a bull market run that has benefited many investors over the past several years, it's important to remember the lessons of 2008 and the value that a well-diversified portfolio may provide through times of market volatility. We are here to help you hold onto the savings you have worked tirelessly to amass, and to provide you the best opportunity to maintain your standard of living regardless of market conditions.
Find out today how we can help you confidently invest to realize your dreams. Please visit us at blog.columbiathreadneedleus.com/our-best-ideas to learn more about our unique investment solutions.
The world is constantly changing, but our priority remains the same: to help you secure your finances, meet your goals and achieve success. Thank you for your continued investment with us.
Sincerely,

Christopher O. Petersen
President, Columbia Funds
Investors should consider the investment objectives, risks, charges and expenses of a mutual fund carefully before investing. For a free prospectus and summary prospectus, which contains this and other important information about a fund, visit columbiathreadneedle.com/us. The prospectus should be read carefully before investing.
Columbia Funds are distributed by Columbia Management Investment Distributors, Inc., member FINRA, and managed by Columbia Management Investment Advisers, LLC.
© 2016 Columbia Management Investment Advisers, LLC. All rights reserved.
COLUMBIA INTERNATIONAL OPPORTUNITIES FUND
Fund Investment Manager
Columbia Management Investment
Advisers, LLC
225 Franklin Street
Boston, MA 02110
Fund Distributor
Columbia Management Investment
Distributors, Inc.
225 Franklin Street
Boston, MA 02110
Fund Transfer Agent
Columbia Management Investment
Services Corp.
P.O. Box 8081
Boston, MA 02266-8081
For more information about any of the funds, please visit columbiathreadneedle.com/us or call 800.345.6611. Customer Service Representatives are available to answer your questions Monday through Friday from 8 a.m. to 7 p.m. Eastern time.
The views expressed in this report reflect the current views of the respective parties. These views are not guarantees of future performance and involve certain risks, uncertainties and assumptions that are difficult to predict, so actual outcomes and results may differ significantly from the views expressed. These views are subject to change at any time based upon economic, market or other conditions and the respective parties disclaim any responsibility to update such views. These views may not be relied on as investment advice and, because investment decisions for a Columbia fund are based on numerous factors, may not be relied on as an indication of trading intent on behalf of any particular Columbia fund. References to specific securities should not be construed as a recommendation or investment advice.
Performance Overview | | | 3 | | |
Manager Discussion of Fund Performance | | | 5 | | |
Understanding Your Fund's Expenses | | | 8 | | |
Portfolio of Investments | | | 9 | | |
Statement of Assets and Liabilities | | | 13 | | |
Statement of Operations | | | 15 | | |
Statement of Changes in Net Assets | | | 16 | | |
Financial Highlights | | | 18 | | |
Notes to Financial Statements | | | 25 | | |
Report of Independent Registered Public Accounting Firm | | | 33 | | |
Federal Income Tax Information | | | 34 | | |
Trustees and Officers | | | 35 | | |
Important Information About This Report | | | 41 | | |
COLUMBIA INTERNATIONAL OPPORTUNITIES FUND
Performance Summary
n Columbia International Opportunities Fund (the Fund) Class A shares returned -16.76% excluding sales charges for the 12-month period that ended February 29, 2016.
n The Fund underperformed its benchmark, the MSCI EAFE Index (Net), which returned -15.18% during the same time period.
n The Fund benefited from underweight positions relative to the benchmark in energy and financials. The Fund's overweight in Japanese stocks, however, was a significant negative, as Japanese exporters and financials underperformed due to the yen's appreciation and concerns about the impact of negative interest rates.
Average Annual Total Returns (%) (for period ended February 29, 2016)
| | | Inception | | 1 Year | | 5 Years | | 10 Years | |
Class A | | 08/01/00 | | | | | | | |
Excluding sales charges | | | | | | | -16.76 | | | | -0.34 | | | | 0.68 | | |
Including sales charges | | | | | | | -21.56 | | | | -1.52 | | | | 0.08 | | |
Class B | | 08/01/00 | | | | | | | |
Excluding sales charges | | | | | | | -17.47 | | | | -1.11 | | | | -0.09 | | |
Including sales charges | | | | | | | -21.60 | | | | -1.50 | | | | -0.09 | | |
Class C | | 08/01/00 | | | | | | | |
Excluding sales charges | | | | | | | -17.39 | | | | -1.11 | | | | -0.09 | | |
Including sales charges | | | | | | | -18.22 | | | | -1.11 | | | | -0.09 | | |
Class I* | | 09/27/10 | | | -16.45 | | | | 0.17 | | | | 0.95 | | |
Class R | | 01/23/06 | | | -17.02 | | | | -0.60 | | | | 0.42 | | |
Class R4* | | 11/08/12 | | | -16.61 | | | | -0.20 | | | | 0.75 | | |
Class Z | | 08/01/00 | | | -16.56 | | | | -0.11 | | | | 0.92 | | |
MSCI EAFE Index (Net) | | | | | | | -15.18 | | | | 0.56 | | | | 1.49 | | |
Returns for Class A are shown with and without the maximum initial sales charge of 5.75%. Returns for Class B are shown with and without the applicable contingent deferred sales charge (CDSC) of 5.00% in the first year, declining to 1.00% in the sixth year and eliminated thereafter. Returns for Class C are shown with and without the 1.00% CDSC for the first year only. The Fund's other classes are not subject to sales charges and have limited eligibility. Please see the Fund's prospectus for details. Performance for different share classes will vary based on differences in sales charges and fees associated with each class. All results shown assume reinvestment of distributions during the period. Returns do not reflect the deduction of taxes that a shareholder may pay on Fund distributions or on the redemption of Fund shares. Performance results reflect the effect of any fee waivers or reimbursements of Fund expenses by Columbia Management Investment Advisers, LLC and/or any of its affiliates. Absent these fee waivers or expense reimbursement arrangements, performance results would have been lower.
The performance information shown represents past performance and is not a guarantee of future results. The investment return and principal value of your investment will fluctuate so that your shares, when redeemed, may be worth more or less than their original cost. Current performance may be lower or higher than the performance information shown. You may obtain performance information current to the most recent month-end by contacting your financial intermediary, visiting columbiathreadneedle.com/us or calling 800.345.6611.
*The returns shown for periods prior to the share class inception date (including returns for the Life of the Fund, if shown, which are since Fund inception) include the returns of the Fund's oldest share class. Since the Fund launched more than one class of shares at its inception, Class A shares were used. These returns are adjusted to reflect any higher class-related operating expenses of the newer share classes, as applicable. Please visit columbiathreadneedle.com/us/investment-products/mutual-funds/appended-performance for more information.
The MSCI EAFE Index (Net) is a free float-adjusted market capitalization index that is designed to measure the equity market performance of developed markets, excluding the U.S. and Canada. The index is compiled from a composite of securities markets of Europe, Australasia and the Far East and is widely recognized by investors in foreign markets as the measurement index for portfolios of non-North American securities.
Indices are not available for investment, are not professionally managed and do not reflect sales charges, fees, brokerage commissions, taxes (except the MSCI EAFE Index (Net), which reflects reinvested dividends net of withholding taxes) or other expenses of investing. Securities in the Fund may not match those in an index.
Annual Report 2016
3
COLUMBIA INTERNATIONAL OPPORTUNITIES FUND
PERFORMANCE OVERVIEW (continued)
Performance of a Hypothetical $10,000 Investment (March 1, 2006 – February 29, 2016)
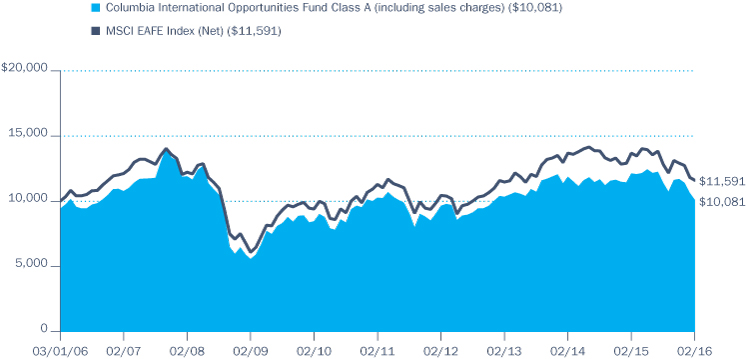
The chart above shows the change in value of a hypothetical $10,000 investment in Class A shares of Columbia International Opportunities Fund during the stated time period, and does not reflect the deduction of taxes that a shareholder may pay on Fund distributions or on the redemption of Fund shares.
Annual Report 2016
4
COLUMBIA INTERNATIONAL OPPORTUNITIES FUND
MANAGER DISCUSSION OF FUND PERFORMANCE
At February 29, 2016, approximately 26.8% of the Fund's shares were owned in the aggregate by affiliated funds-of-funds managed by Columbia Management Investment Advisers, LLC (the Investment Manager). As a result of asset allocation decisions by the Investment Manager, it is possible that the Fund may experience relatively large purchases or redemptions from affiliated funds-of-funds. The Investment Manager seeks to minimize the impact of these transactions by structuring them over a reasonable period of time. The Fund may experience increased expenses as it buys and sells securities as a result of purchases or redemptions by affiliated funds-of-funds.
For the 12-month period that ended February 29, 2016, the Fund's Class A shares returned -16.76% excluding sales charges. The Fund underperformed its benchmark, the MSCI EAFE Index (Net), which returned -15.18% over the same period. The Fund benefited from underweight positions relative to the benchmark in energy and financials. The Fund's overweight in Japanese stocks, however, was a significant negative, as Japanese exporters and financials underperformed due to the yen's appreciation and concerns about the impact of negative interest rates.
World's Investors on Interest-Rate Watch
For much of the period, the world's investors watched for signs of when the U.S. would finally lift interest rates from their historic lows. Volatility in emerging markets and slow growth in Europe complicated the decision by the Federal Reserve Board (the Fed), as did persistently underwhelming industrial-production numbers in the U.S. itself. However, solid U.S. jobs figures and hints of rising wage growth eventually led the central bank to raise rates in December. Investors in most equity markets initially reacted to the news with relief, but a slump throughout global markets at the beginning of 2016 raised questions over whether the Fed had acted too soon. In the eurozone, an agreement early in the period between Greece and its creditors over terms of a further bailout was greeted with relief by investors. After an initial boost to markets from the European Central Bank's program of quantitative easing (QE) in early 2015, persistent sluggishness raised expectations of further action, which ultimately took place toward the end of the period under review. However, the extra stimulus — moving the deposit rate further into negative territory and extending QE by six months — left markets unimpressed.
Although Japanese stocks performed well for much of the period, with Japan's corporations generally exhibiting strong earnings, Japanese stocks fell sharply towards the end of the period. As markets convulsed early in 2016, and despite the Bank of Japan taking interest rates into negative territory, investors parked their cash in the traditional "safe haven" asset of the Japanese yen, spooking the country's export-dependent stock market. Elsewhere, China fared poorly as a stock-market surge through the first half of 2015 was followed by a prolonged slump. In an attempt to offset persistently worrying economic data, China's central bank undertook a series of stimulus measures, including lowering banks' reserve requirements. The Chinese authorities also implemented broader measures as part of a five-year plan aimed at rebalancing the Chinese
Portfolio Management
Simon Haines, CFA
William Davies
David Dudding, CFA
Morningstar Style BoxTM

The Morningstar Style BoxTM is based on a fund's portfolio holdings. For equity funds, the vertical axis shows the market capitalization of the stocks owned, and the horizontal axis shows investment style (value, blend, or growth). Information shown is based on the most recent data provided by Morningstar.
© 2016 Morningstar, Inc. All rights reserved. The Morningstar information contained herein: (1) is proprietary to Morningstar and/or its content providers; (2) may not be copied or distributed; and (3) is not warranted to be accurate, complete or timely. Neither Morningstar nor its content providers are responsible for any damages or losses arising from any use of this information.
Top Ten Holdings (%)
(at February 29, 2016) | |
UBS AG (Switzerland) | | | 3.2 | | |
Shimano, Inc. (Japan) | | | 3.2 | | |
Unilever PLC (United Kingdom) | | | 3.1 | | |
Roche Holding AG,
Genusschein Shares
(Switzerland) | | | 3.0 | | |
ASML Holding NV (Netherlands) | | | 2.9 | | |
Continental AG (Germany) | | | 2.9 | | |
Bayer AG, Registered Shares
(Germany) | | | 2.8 | | |
Airbus Group SE (France) | | | 2.7 | | |
Berendsen PLC
(United Kingdom) | | | 2.7 | | |
Royal Dutch Shell PLC,
Class A (United Kingdom) | | | 2.6 | | |
Percentages indicated are based upon total investments (excluding Money Market Funds).
Annual Report 2016
5
COLUMBIA INTERNATIONAL OPPORTUNITIES FUND
MANAGER DISCUSSION OF FUND PERFORMANCE (continued)
For further detail about these holdings, please refer to the section entitled "Portfolio of Investments."
Fund holdings are as of the date given, are subject to change at any time, and are not recommendations to buy or sell any security.
Country Breakdown (%)
(at February 29, 2016) | |
Australia | | | 3.0 | | |
Belgium | | | 1.8 | | |
Brazil | | | 0.3 | | |
China | | | 0.5 | | |
Denmark | | | 2.2 | | |
France | | | 6.7 | | |
Germany | | | 10.2 | | |
Hong Kong | | | 4.3 | | |
Indonesia | | | 1.6 | | |
Ireland | | | 3.5 | | |
Japan | | | 28.7 | | |
Netherlands | | | 3.7 | | |
Spain | | | 1.9 | | |
Switzerland | | | 6.2 | | |
United Kingdom | | | 24.0 | | |
United States(a) | | | 1.4 | | |
Total | | | 100.0 | | |
Country Breakdown is based primarily on issuer's place of organization/incorporation. Percentages indicated are based upon total investments. The Fund's portfolio composition is subject to change.
(a) Includes investments in Money Market Funds.
economy away from manufacturing and exporting and towards domestic consumption.
Detractors and Contributors
The three market sectors that detracted most from Fund performance were industrials, due to our overweight position; consumer discretionary, another overweight coupled with sub-par stock selection; and consumer staples, where we were underweight relative to the benchmark. Individual detractors included Methanex, Mitsubishi UFJ Financial Group, and Bayer. Because the price of methanol is closely correlated to the oil price, the stock of methanol producer Methanex followed crude prices downwards during the period. We have sold the stock, which is consistent with our approach of being underweight in the energy sector. Shares in the banking and financial holding company Mitsubishi UFJ Financial Group were weak along with the underperforming Japanese banking sector. Most notably, towards the end of the period, the stock fell heavily as the Bank of Japan's negative interest-rate policy announcement was set to impact earnings negatively. The Fund's position had been reduced prior to the announcement, but the stock is still in the Fund's portfolio. Bayer, the pharmaceutical and crop-science company, faced numerous problems during the period, including the adverse impact of El Niño in its agricultural-chemical businesses, and negative pricing policies on pharmaceuticals in the U.S. The Fund still holds Bayer, as we believe there is a strong underpinning valuation, and the company's portfolio remains strong.
The three strongest-contributing market sectors to the Fund on a relative basis were energy and financials, where we had an underweight position; and information technology, which was an overweight. Asset allocation within these three sectors was positive, and particularly strong in energy. Among individual holdings, SCSK, Novo Nordisk and Shimadzu were the top performers. The Japanese software-services company SCSK benefited from strong spending on systems, particularly from financial-sector clients. In addition, the stock benefited from positive earnings revisions throughout the year. Novo Nordisk, a Danish pharmaceutical company, which specializes in diabetes drugs, made good progress with the launch of its long-lasting insulin, Tresiba. The shares re-rated throughout calendar 2015. Finally, Shimadzu in Japan manufactures precision tooling and analysis equipment for medical and scientific research, such as chromatographs, x-ray and mass spectrometers. The Fund held the stock during the middle of the period under review, during which significant profits upgrades occurred thanks to strong sales across the company's range of products. The position in Shimadzu was eliminated by period end.
Portfolio Positioning
We increased the Fund's exposure to the consumer discretionary, telecommunication services and information technology sectors during the period. We also increased our weighting in energy toward the end of the period. At the same time, we reduced our weighting in materials, and moved to a zero weight in utilities. Among individual stocks, we added
Annual Report 2016
6
COLUMBIA INTERNATIONAL OPPORTUNITIES FUND
MANAGER DISCUSSION OF FUND PERFORMANCE (continued)
Roche to the portfolio; we consider it to be positively positioned, having attractive asset developments within immune-oncology. We also opened a new position in Shimano during the year. Shimano has a dominant position in the bicycle-component industry, which is expected to grow, supported by trends such as an increased awareness of health and "wellness," and increased leisure-related spending. We also initiated a position in Royal Dutch Shell. Within the energy sector, we prefer defensive super-majors with strong balance sheets and cash flows, which may be used to acquire distressed assets.
Meanwhile, we reduced our position in L'Oréal after recent gains. We sold Daikin, a Japanese manufacturer of air-conditioning units, on concerns about its significant exposure to the Chinese construction industry. We also sold the Japanese recruitment firm Recruit, switching the proceeds into FANUC, a Japanese company that manufactures automated products including robotics. We believe FANUC is the top company in its sector and generates significant profit margins.
Equity Sector Breakdown (%)
(at February 29, 2016) | |
Consumer Discretionary | | | 17.4 | | |
Consumer Staples | | | 8.9 | | |
Energy | | | 2.6 | | |
Financials | | | 20.4 | | |
Health Care | | | 13.2 | | |
Industrials | | | 16.8 | | |
Information Technology | | | 11.8 | | |
Materials | | | 5.0 | | |
Telecommunication Services | | | 3.9 | | |
Total | | | 100.0 | | |
Percentages indicated are based upon total equity investments. The Fund's portfolio composition is subject to change.
Investment Risks
Market risk may affect a single issuer, sector of the economy, industry or the market as a whole. Growth securities, at times, may not perform as well as value securities or the stock market in general and may be out of favor with investors. International investing involves certain risks and volatility due to potential political, economic or currency instabilities and different financial and accounting standards. Risks are enhanced for emerging market issuers. See the Fund's prospectus for more information on these and other risks.
Annual Report 2016
7
COLUMBIA INTERNATIONAL OPPORTUNITIES FUND
UNDERSTANDING YOUR FUND'S EXPENSES
(Unaudited)
As an investor, you incur two types of costs. There are transaction costs, which generally include sales charges on purchases and may include redemption fees. There are also ongoing costs, which generally include management fees, distribution and/or service fees, and other fund expenses. The following information is intended to help you understand your ongoing costs (in dollars) of investing in the Fund and to help you compare these costs with the ongoing costs of investing in other mutual funds.
Analyzing Your Fund's Expenses
To illustrate these ongoing costs, we have provided examples and calculated the expenses paid by investors in each share class of the Fund during the period. The actual and hypothetical information in the table is based on an initial investment of $1,000 at the beginning of the period indicated and held for the entire period. Expense information is calculated two ways and each method provides you with different information. The amount listed in the "Actual" column is calculated using the Fund's actual operating expenses and total return for the period. You may use the Actual information, together with the amount invested, to estimate the expenses that you paid over the period. Simply divide your account value by $1,000 (for example, an $8,600 account value divided by $1,000 = 8.6), then multiply the results by the expenses paid during the period under the "Actual" column. The amount listed in the "Hypothetical" column assumes a 5% annual rate of return before expenses (which is not the Fund's actual return) and then applies the Fund's actual expense ratio for the period to the hypothetical return. You should not use the hypothetical account values and expenses to estimate either your actual account balance at the end of the period or the expenses you paid during the period. See "Compare With Other Funds" below for details on how to use the hypothetical data.
Compare With Other Funds
Since all mutual funds are required to include the same hypothetical calculations about expenses in shareholder reports, you can use this information to compare the ongoing cost of investing in the Fund with other funds. To do so, compare the hypothetical example with the 5% hypothetical examples that appear in the shareholder reports of other funds. As you compare hypothetical examples of other funds, it is important to note that hypothetical examples are meant to highlight the ongoing costs of investing in a fund only and do not reflect any transaction costs, such as sales charges, or redemption or exchange fees. Therefore, the hypothetical calculations are useful in comparing ongoing costs only, and will not help you determine the relative total costs of owning different funds. If transaction costs were included in these calculations, your costs would be higher.
September 1, 2015 – February 29, 2016
| | | Account Value at the Beginning
of the Period ($) | | Account Value at the End of the
Period ($) | | Expenses Paid During the
Period ($) | | Fund's Annualized
Expense Ratio (%) | |
| | | Actual | | Hypothetical | | Actual | | Hypothetical | | Actual | | Hypothetical | | Actual | |
Class A | | | 1,000.00 | | | | 1,000.00 | | | | 885.90 | | | | 1,017.80 | | | | 6.66 | | | | 7.12 | | | | 1.42 | | |
Class B | | | 1,000.00 | | | | 1,000.00 | | | | 882.40 | | | | 1,014.07 | | | | 10.16 | | | | 10.87 | | | | 2.17 | | |
Class C | | | 1,000.00 | | | | 1,000.00 | | | | 882.50 | | | | 1,014.07 | | | | 10.16 | | | | 10.87 | | | | 2.17 | | |
Class I | | | 1,000.00 | | | | 1,000.00 | | | | 887.30 | | | | 1,019.79 | | | | 4.79 | | | | 5.12 | | | | 1.02 | | |
Class R | | | 1,000.00 | | | | 1,000.00 | | | | 884.50 | | | | 1,016.56 | | | | 7.82 | | | | 8.37 | | | | 1.67 | | |
Class R4 | | | 1,000.00 | | | | 1,000.00 | | | | 886.50 | | | | 1,019.05 | | | | 5.49 | | | | 5.87 | | | | 1.17 | | |
Class Z | | | 1,000.00 | | | | 1,000.00 | | | | 886.70 | | | | 1,019.05 | | | | 5.49 | | | | 5.87 | | | | 1.17 | | |
Expenses paid during the period are equal to the annualized expense ratio for each class as indicated above, multiplied by the average account value over the period and then multiplied by the number of days in the Fund's most recent fiscal half year and divided by 366.
Expenses do not include fees and expenses incurred indirectly by the Fund from its investment in underlying funds, including affiliated and non-affiliated pooled investment vehicles, such as mutual funds and exchange-traded funds.
Had Columbia Management Investment Advisers, LLC and/or certain of its affiliates not waived/reimbursed certain fees and expenses, account value at the end of the period would have been reduced.
Annual Report 2016
8
COLUMBIA INTERNATIONAL OPPORTUNITIES FUND
PORTFOLIO OF INVESTMENTS
February 29, 2016
(Percentages represent value of investments compared to net assets)
Common Stocks 98.0%
Issuer | | Shares | | Value ($) | |
AUSTRALIA 3.0% | |
Ansell Ltd. | | | 109,507 | | | | 1,342,210 | | |
CSL Ltd. | | | 20,182 | | | | 1,475,812 | | |
Total | | | | | 2,818,022 | | |
BELGIUM 1.8% | |
Anheuser-Busch InBev SA/NV | | | 14,552 | | | | 1,628,030 | | |
BRAZIL 0.3% | |
Kroton Educacional SA | | | 119,700 | | | | 298,985 | | |
CHINA 0.5% | |
Sinopharm Group Co. Class H | | | 138,000 | | | | 504,284 | | |
DENMARK 2.2% | |
Novo Nordisk A/S, Class B | | | 38,751 | | | | 1,995,083 | | |
FRANCE 6.6% | |
Airbus Group SE | | | 38,634 | | | | 2,493,314 | | |
L'Oreal SA | | | 9,319 | | | | 1,568,482 | | |
Schneider Electric SE | | | 35,124 | | | | 2,093,582 | | |
Total | | | | | 6,155,378 | | |
GERMANY 10.2% | |
Allianz SE, Registered Shares | | | 6,210 | | | | 921,111 | | |
Bayer AG, Registered Shares | | | 24,300 | | | | 2,519,133 | | |
Brenntag AG | | | 19,981 | | | | 964,428 | | |
Continental AG | | | 13,213 | | | | 2,629,881 | | |
Linde AG | | | 9,340 | | | | 1,293,098 | | |
TUI AG | | | 74,834 | | | | 1,111,592 | | |
Total | | | | | 9,439,243 | | |
HONG KONG 4.2% | |
AIA Group Ltd. | | | 452,600 | | | | 2,310,667 | | |
HKT Trust & HKT Ltd. | | | 1,177,000 | | | | 1,628,238 | | |
Total | | | | | 3,938,905 | | |
INDONESIA 1.6% | |
PT Bank Rakyat Indonesia Persero Tbk | | | 1,799,900 | | | | 1,488,925 | | |
IRELAND 3.5% | |
Bank of Ireland(a) | | | 7,957,952 | | | | 2,256,671 | | |
CRH PLC | | | 36,755 | | | | 942,786 | | |
Total | | | | | 3,199,457 | | |
Common Stocks (continued)
Issuer | | Shares | | Value ($) | |
JAPAN 28.5% | |
Alps Electric Co., Ltd. | | | 58,500 | | | | 960,016 | | |
Capcom Co., Ltd. | | | 100,800 | | | | 2,101,202 | | |
Dentsu, Inc. | | | 44,500 | | | | 2,068,341 | | |
FANUC Corp. | | | 6,200 | | | | 910,410 | | |
Hitachi High-Technologies Corp. | | | 53,200 | | | | 1,413,327 | | |
Japan Exchange Group, Inc. | | | 122,300 | | | | 1,894,372 | | |
Mazda Motor Corp. | | | 81,300 | | | | 1,131,431 | | |
Mitsubishi UFJ Financial Group, Inc. | | | 387,600 | | | | 1,672,614 | | |
Nomura Holdings, Inc. | | | 190,000 | | | | 802,895 | | |
OSG Corp. | | | 66,000 | | | | 1,113,967 | | |
Rakuten, Inc. | | | 128,300 | | | | 1,220,559 | | |
SCSK Corp. | | | 47,900 | | | | 1,838,384 | | |
Sekisui Chemical Co., Ltd. | | | 156,300 | | | | 1,731,138 | | |
Shimano, Inc. | | | 18,700 | | | | 2,924,306 | | |
Tadano Ltd. | | | 159,000 | | | | 1,361,225 | | |
Taiheiyo Cement Corp. | | | 723,000 | | | | 1,536,461 | | |
Yaskawa Electric Corp. | | | 152,000 | | | | 1,822,963 | | |
Total | | | | | 26,503,611 | | |
NETHERLANDS 3.7% | |
| ASML Holding NV | | | 29,233 | | | | 2,663,064 | | |
ING Groep NV-CVA | | | 64,535 | | | | 769,344 | | |
Total | | | | | 3,432,408 | | |
SPAIN 1.9% | |
Industria de Diseno Textil SA | | | 57,897 | | | | 1,786,409 | | |
SWITZERLAND 6.1% | |
Roche Holding AG, Genusschein Shares | | | 10,749 | | | | 2,756,208 | | |
UBS AG | | | 192,871 | | | | 2,946,489 | | |
Total | | | | | 5,702,697 | | |
UNITED KINGDOM 23.9% | |
| 3i Group PLC | | | 342,241 | | | | 2,072,517 | | |
AstraZeneca PLC | | | 25,675 | | | | 1,468,708 | | |
Berendsen PLC | | | 152,113 | | | | 2,440,615 | | |
BT Group PLC | | | 290,894 | | | | 1,958,927 | | |
Diageo PLC | | | 80,444 | | | | 2,067,442 | | |
GKN PLC | | | 246,743 | | | | 938,016 | | |
Hays PLC | | | 997,232 | | | | 1,587,189 | | |
Legal & General Group PLC | | | 448,096 | | | | 1,409,407 | | |
The accompanying Notes to Financial Statements are an integral part of this statement.
Annual Report 2016
9
COLUMBIA INTERNATIONAL OPPORTUNITIES FUND
PORTFOLIO OF INVESTMENTS (continued)
February 29, 2016
Common Stocks (continued)
Issuer | | Shares | | Value ($) | |
Rio Tinto PLC | | | 29,104 | | | | 765,518 | | |
Royal Dutch Shell PLC, Class A | | | 103,474 | | | | 2,360,660 | | |
Unilever PLC | | | 65,957 | | | | 2,817,852 | | |
Wolseley PLC | | | 45,577 | | | | 2,337,296 | | |
Total | | | | | 22,224,147 | | |
Total Common Stocks
(Cost: $106,417,085) | | | | | 91,115,584 | | |
Money Market Funds 1.4%
| | | Shares | | Value ($) | |
Columbia Short-Term Cash Fund,
0.420%(b)(c) | | | 1,261,561 | | | | 1,261,561 | | |
Total Money Market Funds
(Cost: $1,261,561) | | | | | 1,261,561 | | |
Total Investments
(Cost: $107,678,646) | | | | | 92,377,145 | | |
Other Assets & Liabilities, Net | | | | | 523,759 | | |
Net Assets | | | | | 92,900,904 | | |
Notes to Portfolio of Investments
(a) Non-income producing investment.
(b) The rate shown is the seven-day current annualized yield at February 29, 2016.
(c) As defined in the Investment Company Act of 1940, an affiliated company is one in which the Fund owns 5% or more of the company's outstanding voting securities, or a company which is under common ownership or control with the Fund. Holdings and transactions in these affiliated companies during the year ended February 29, 2016 are as follows:
Issuer | | Beginning
Cost ($) | | Purchase
Cost ($) | | Proceeds
From Sales ($) | | Ending
Cost ($) | | Dividends —
Affiliated
Issuers ($) | | Value ($) | |
Columbia Short-Term Cash Fund | | | 1,030,338 | | | | 86,167,397 | | | | (85,936,174 | ) | | | 1,261,561 | | | | 3,627 | | | | 1,261,561 | | |
Fair Value Measurements
The Fund categorizes its fair value measurements according to a three-level hierarchy that maximizes the use of observable inputs and minimizes the use of unobservable inputs by prioritizing that the most observable input be used when available. Observable inputs are those that market participants would use in pricing an investment based on market data obtained from sources independent of the reporting entity. Unobservable inputs are those that reflect the Fund's assumptions about the information market participants would use in pricing an investment. An investment's level within the fair value hierarchy is based on the lowest level of any input that is deemed significant to the asset's or liability's fair value measurement. The input levels are not necessarily an indication of the risk or liquidity associated with investments at that level. For example, certain U.S. government securities are generally high quality and liquid, however, they are reflected as Level 2 because the inputs used to determine fair value may not always be quoted prices in an active market.
Fair value inputs are summarized in the three broad levels listed below:
> Level 1 — Valuations based on quoted prices for investments in active markets that the Fund has the ability to access at the measurement date (including NAV for open-end mutual funds). Valuation adjustments are not applied to Level 1 investments.
> Level 2 — Valuations based on other significant observable inputs (including quoted prices for similar securities, interest rates, prepayment speeds, credit risks, etc.).
> Level 3 — Valuations based on significant unobservable inputs (including the Fund's own assumptions and judgment in determining the fair value of investments).
The accompanying Notes to Financial Statements are an integral part of this statement.
Annual Report 2016
10
COLUMBIA INTERNATIONAL OPPORTUNITIES FUND
PORTFOLIO OF INVESTMENTS (continued)
February 29, 2016
Fair Value Measurements (continued)
Inputs that are used in determining fair value of an investment may include price information, credit data, volatility statistics, and other factors. These inputs can be either observable or unobservable. The availability of observable inputs can vary between investments, and is affected by various factors such as the type of investment, and the volume and level of activity for that investment or similar investments in the marketplace. The inputs will be considered by the Investment Manager, along with any other relevant factors in the calculation of an investment's fair value. The Fund uses prices and inputs that are current as of the measurement date, which may include periods of market dislocations. During these periods, the availability of prices and inputs may be reduced for many investments. This condition could cause an investment to be reclassified between the various levels within the hierarchy.
Foreign equity securities actively traded in markets where there is a significant delay in the local close relative to the New York Stock Exchange (NYSE) are classified as Level 2. The values of these securities may include an adjustment to reflect the impact of significant market movements following the close of local trading, as described in Note 2 to the financial statements — Security Valuation.
Investments falling into the Level 3 category are primarily supported by quoted prices from brokers and dealers participating in the market for those investments. However, these may be classified as Level 3 investments due to lack of market transparency and corroboration to support these quoted prices. Additionally, valuation models may be used as the pricing source for any remaining investments classified as Level 3. These models may rely on one or more significant unobservable inputs and/or significant assumptions by the Investment Manager. Inputs used in valuations may include, but are not limited to, financial statement analysis, capital account balances, discount rates and estimated cash flows, and comparable company data.
Under the direction of the Fund's Board of Trustees (the Board), the Investment Manager's Valuation Committee (the Committee) is responsible for overseeing the valuation procedures approved by the Board. The Committee consists of voting and non-voting members from various groups within the Investment Manager's organization, including operations and accounting, trading and investments, compliance, risk management and legal.
The Committee meets at least monthly to review and approve valuation matters, which may include a description of specific valuation determinations, data regarding pricing information received from approved pricing vendors and brokers and the results of Board-approved valuation control policies and procedures (the Policies). The Policies address, among other things, instances when market quotations are or are not readily available, including recommendations of third party pricing vendors and a determination of appropriate pricing methodologies; events that require specific valuation determinations and assessment of fair value techniques; securities with a potential for stale pricing, including those that are illiquid, restricted, or in default; and the effectiveness of third party pricing vendors, including periodic reviews of vendors. The Committee meets more frequently, as needed, to discuss additional valuation matters, which may include the need to review back-testing results, review time-sensitive information or approve related valuation actions. The Committee reports to the Board, with members of the Committee meeting with the Board at each of its regularly scheduled meetings to discuss valuation matters and actions during the period, similar to those described earlier.
For investments categorized as Level 3, the Committee monitors information similar to that described above, which may include: (i) data specific to the issuer or comparable issuers, (ii) general market or specific sector news and (iii) quoted prices and specific or similar security transactions. The Committee considers this data and any changes from prior periods in order to assess the reasonableness of observable and unobservable inputs, any assumptions or internal models used to value those securities and changes in fair value. This data is also used to corroborate, when available, information received from approved pricing vendors and brokers. Various factors impact the frequency of monitoring this information (which may occur as often as daily). However, the Committee may determine that changes to inputs, assumptions and models are not required as a result of the monitoring procedures performed.
The accompanying Notes to Financial Statements are an integral part of this statement.
Annual Report 2016
11
COLUMBIA INTERNATIONAL OPPORTUNITIES FUND
PORTFOLIO OF INVESTMENTS (continued)
February 29, 2016
Fair Value Measurements (continued)
The following table is a summary of the inputs used to value the Fund's investments at February 29, 2016:
| | | Level 1
Quoted Prices in Active
Markets for Identical
Assets ($) | | Level 2
Other Significant
Observable Inputs ($) | | Level 3
Significant
Unobservable Inputs ($) | | Total ($) | |
Investments | |
Common Stocks | |
Australia | | | — | | | | 2,818,022 | | | | — | | | | 2,818,022 | | |
Belgium | | | — | | | | 1,628,030 | | | | — | | | | 1,628,030 | | |
Brazil | | | 298,985 | | | | — | | | | — | | | | 298,985 | | |
China | | | — | | | | 504,284 | | | | — | | | | 504,284 | | |
Denmark | | | — | | | | 1,995,083 | | | | — | | | | 1,995,083 | | |
France | | | — | | | | 6,155,378 | | | | — | | | | 6,155,378 | | |
Germany | | | — | | | | 9,439,243 | | | | — | | | | 9,439,243 | | |
Hong Kong | | | — | | | | 3,938,905 | | | | — | | | | 3,938,905 | | |
Indonesia | | | — | | | | 1,488,925 | | | | — | | | | 1,488,925 | | |
Ireland | | | — | | | | 3,199,457 | | | | — | | | | 3,199,457 | | |
Japan | | | — | | | | 26,503,611 | | | | — | | | | 26,503,611 | | |
Netherlands | | | — | | | | 3,432,408 | | | | — | | | | 3,432,408 | | |
Spain | | | — | | | | 1,786,409 | | | | — | | | | 1,786,409 | | |
Switzerland | | | — | | | | 5,702,697 | | | | — | | | | 5,702,697 | | |
United Kingdom | | | — | | | | 22,224,147 | | | | — | | | | 22,224,147 | | |
Total Common Stocks | | | 298,985 | | | | 90,816,599 | | | | — | | | | 91,115,584 | | |
Money Market Funds | | | — | | | | 1,261,561 | | | | — | | | | 1,261,561 | | |
Total Investments | | | 298,985 | | | | 92,078,160 | | | | — | | | | 92,377,145 | | |
See the Portfolio of Investments for all investment classifications not indicated in the table.
The Fund's assets assigned to the Level 2 input category are generally valued using the market approach, in which a security's value is determined through reference to prices and information from market transactions for similar or identical assets and/or fund per share market values which are not considered publicly available. These assets include certain foreign securities for which a third party statistical pricing service may be employed for purposes of fair market valuation. The model utilized by such third party statistical pricing service takes into account a security's correlation to available market data including, but not limited to, intraday index, ADR, and exchange-traded fund movements.
Financial assets were transferred from Level 1 to Level 2 as the market for these assets is not considered publicly available. Fund per share market values were obtained using observable market inputs.
The following table shows transfers between Level 1 and Level 2 of the fair value hierarchy:
Transfers In | | Transfers Out | |
| Level 1 ($) | | Level 2 ($) | | Level 1 ($) | | Level 2 ($) | |
| | — | | | | 1,030,338 | | | | 1,030,338 | | | | — | | |
Transfers between Level 1 and Level 2 are determined based on the fair value at the beginning of the period for security positions held throughout the period.
There were no transfers of financial assets between Levels 2 and 3 during the period.
The accompanying Notes to Financial Statements are an integral part of this statement.
Annual Report 2016
12
COLUMBIA INTERNATIONAL OPPORTUNITIES FUND
STATEMENT OF ASSETS AND LIABILITIES
February 29, 2016
Assets | |
Investments, at value | |
Unaffiliated issuers (identified cost $106,417,085) | | $ | 91,115,584 | | |
Affiliated issuers (identified cost $1,261,561) | | | 1,261,561 | | |
Total investments (identified cost $107,678,646) | | | 92,377,145 | | |
Receivable for: | |
Investments sold | | | 387,673 | | |
Capital shares sold | | | 23,922 | | |
Dividends | | | 214,802 | | |
Foreign tax reclaims | | | 147,129 | | |
Expense reimbursement due from Investment Manager | | | 310 | | |
Prepaid expenses | | | 1,295 | | |
Total assets | | | 93,152,276 | | |
Liabilities | |
Payable for: | |
Investments purchased | | | 1,490 | | |
Capital shares purchased | | | 98,835 | | |
Investment management fees | | | 6,659 | | |
Distribution and/or service fees | | | 1,433 | | |
Transfer agent fees | | | 15,026 | | |
Compensation of board members | | | 85,543 | | |
Audit fees | | | 27,710 | | |
Other expenses | | | 14,676 | | |
Total liabilities | | | 251,372 | | |
Net assets applicable to outstanding capital stock | | $ | 92,900,904 | | |
Represented by | |
Paid-in capital | | $ | 681,694,341 | | |
Undistributed net investment income | | | 65,823 | | |
Accumulated net realized loss | | | (573,536,703 | ) | |
Unrealized appreciation (depreciation) on: | |
Investments | | | (15,301,501 | ) | |
Foreign currency translations | | | (21,056 | ) | |
Total — representing net assets applicable to outstanding capital stock | | $ | 92,900,904 | | |
The accompanying Notes to Financial Statements are an integral part of this statement.
Annual Report 2016
13
COLUMBIA INTERNATIONAL OPPORTUNITIES FUND
STATEMENT OF ASSETS AND LIABILITIES (continued)
February 29, 2016
Class A | |
Net assets | | $ | 33,103,886 | | |
Shares outstanding | | | 2,861,882 | | |
Net asset value per share | | $ | 11.57 | | |
Maximum offering price per share(a) | | $ | 12.28 | | |
Class B | |
Net assets | | $ | 650,042 | | |
Shares outstanding | | | 61,423 | | |
Net asset value per share | | $ | 10.58 | | |
Class C | |
Net assets | | $ | 8,175,552 | | |
Shares outstanding | | | 771,973 | | |
Net asset value per share | | $ | 10.59 | | |
Class I | |
Net assets | | $ | 25,704,996 | | |
Shares outstanding | | | 2,135,072 | | |
Net asset value per share | | $ | 12.04 | | |
Class R | |
Net assets | | $ | 545,549 | | |
Shares outstanding | | | 47,811 | | |
Net asset value per share | | $ | 11.41 | | |
Class R4 | |
Net assets | | $ | 166,083 | | |
Shares outstanding | | | 13,894 | | |
Net asset value per share | | $ | 11.95 | | |
Class Z | |
Net assets | | $ | 24,554,796 | | |
Shares outstanding | | | 2,065,382 | | |
Net asset value per share | | $ | 11.89 | | |
(a) The maximum offering price per share is calculated by dividing the net asset value per share by 1.0 minus the maximum sales charge of 5.75%.
The accompanying Notes to Financial Statements are an integral part of this statement.
Annual Report 2016
14
COLUMBIA INTERNATIONAL OPPORTUNITIES FUND
STATEMENT OF OPERATIONS
Year Ended February 29, 2016
Net investment income | |
Income: | |
Dividends — unaffiliated issuers | | $ | 1,688,671 | | |
Dividends — affiliated issuers | | | 3,627 | | |
Foreign taxes withheld | | | (154,686 | ) | |
Total income | | | 1,537,612 | | |
Expenses: | |
Investment management fees | | | 854,276 | | |
Distribution and/or service fees | |
Class A | | | 98,110 | | |
Class B | | | 10,955 | | |
Class C | | | 104,925 | | |
Class R | | | 3,301 | | |
Transfer agent fees | |
Class A | | | 78,573 | | |
Class B | | | 2,218 | | |
Class C | | | 21,073 | | |
Class R | | | 1,327 | | |
Class R4 | | | 532 | | |
Class Z | | | 55,648 | | |
Compensation of board members | | | 6,570 | | |
Custodian fees | | | 21,536 | | |
Printing and postage fees | | | 38,825 | | |
Registration fees | | | 82,883 | | |
Audit fees | | | 52,238 | | |
Legal fees | | | 6,488 | | |
Other | | | 15,504 | | |
Total expenses | | | 1,454,982 | | |
Fees waived or expenses reimbursed by Investment Manager and its affiliates | | | (105,189 | ) | |
Expense reductions | | | (300 | ) | |
Total net expenses | | | 1,349,493 | | |
Net investment income | | | 188,119 | | |
Realized and unrealized gain (loss) — net | |
Net realized gain (loss) on: | |
Investments | | | 9,378,839 | | |
Foreign currency translations | | | (59,101 | ) | |
Net realized gain | | | 9,319,738 | | |
Net change in unrealized appreciation (depreciation) on: | |
Investments | | | (28,827,102 | ) | |
Foreign currency translations | | | (880 | ) | |
Net change in unrealized depreciation | | | (28,827,982 | ) | |
Net realized and unrealized loss | | | (19,508,244 | ) | |
Net decrease in net assets from operations | | $ | (19,320,125 | ) | |
The accompanying Notes to Financial Statements are an integral part of this statement.
Annual Report 2016
15
COLUMBIA INTERNATIONAL OPPORTUNITIES FUND
STATEMENT OF CHANGES IN NET ASSETS
| | | Year Ended
February 29,
2016 | | Year Ended
February 28,
2015 | |
Operations | |
Net investment income (loss) | | $ | 188,119 | | | $ | (345,464 | ) | |
Net realized gain | | | 9,319,738 | | | | 19,360,698 | | |
Net change in unrealized depreciation | | | (28,827,982 | ) | | | (20,395,317 | ) | |
Net decrease in net assets resulting from operations | | | (19,320,125 | ) | | | (1,380,083 | ) | |
Distributions to shareholders | |
Net investment income | |
Class A | | | — | | | | (134,593 | ) | |
Class B | | | — | | | | (2,339 | ) | |
Class C | | | — | | | | (11,388 | ) | |
Class I | | | — | | | | (6 | ) | |
Class R | | | — | | | | (1,430 | ) | |
Class R4 | | | — | | | | (519 | ) | |
Class Z | | | — | | | | (152,742 | ) | |
Total distributions to shareholders | | | — | | | | (303,017 | ) | |
Increase (decrease) in net assets from capital stock activity | | | 25,555,382 | | | | (100,974,055 | ) | |
Total increase (decrease) in net assets | | | 6,235,257 | | | | (102,657,155 | ) | |
Net assets at beginning of year | | | 86,665,647 | | | | 189,322,802 | | |
Net assets at end of year | | $ | 92,900,904 | | | $ | 86,665,647 | | |
Undistributed (excess of distributions over) net investment income | | $ | 65,823 | | | $ | (88,513 | ) | |
The accompanying Notes to Financial Statements are an integral part of this statement.
Annual Report 2016
16
COLUMBIA INTERNATIONAL OPPORTUNITIES FUND
STATEMENT OF CHANGES IN NET ASSETS (continued)
| | | Year Ended February 29, 2016 | | Year Ended February 28, 2015 | |
| | | Shares | | Dollars ($) | | Shares | | Dollars ($) | |
Capital stock activity | |
Class A shares | |
Subscriptions(a) | | | 578,104 | | | | 7,798,172 | | | | 626,862 | | | | 8,221,851 | | |
Distributions reinvested | | | — | | | | — | | | | 8,531 | | | | 115,341 | | |
Redemptions | | | (622,319 | ) | | | (8,236,313 | ) | | | (4,579,012 | ) | | | (61,173,536 | ) | |
Net decrease | | | (44,215 | ) | | | (438,141 | ) | | | (3,943,619 | ) | | | (52,836,344 | ) | |
Class B shares | |
Subscriptions | | | 3,784 | | | | 49,030 | | | | 573 | | | | 6,876 | | |
Distributions reinvested | | | — | | | | — | | | | 148 | | | | 1,857 | | |
Redemptions(a) | | | (70,121 | ) | | | (871,471 | ) | | | (174,751 | ) | | | (2,109,347 | ) | |
Net decrease | | | (66,337 | ) | | | (822,441 | ) | | | (174,030 | ) | | | (2,100,614 | ) | |
Class C shares | |
Subscriptions | | | 33,475 | | | | 422,446 | | | | 32,189 | | | | 394,736 | | |
Distributions reinvested | | | — | | | | — | | | | 694 | | | | 8,704 | | |
Redemptions | | | (170,589 | ) | | | (2,097,586 | ) | | | (347,061 | ) | | | (4,213,401 | ) | |
Net decrease | | | (137,114 | ) | | | (1,675,140 | ) | | | (314,178 | ) | | | (3,809,961 | ) | |
Class I shares | |
Subscriptions | | | 2,339,814 | | | | 34,133,870 | | | | — | | | | — | | |
Redemptions | | | (204,915 | ) | | | (2,860,665 | ) | | | (51 | ) | | | (700 | ) | |
Net increase (decrease) | | | 2,134,899 | | | | 31,273,205 | | | | (51 | ) | | | (700 | ) | |
Class R shares | |
Subscriptions | | | 6,357 | | | | 80,699 | | | | 8,440 | | | | 110,557 | | |
Distributions reinvested | | | — | | | | — | | | | 76 | | | | 1,024 | | |
Redemptions | | | (13,482 | ) | | | (184,377 | ) | | | (24,678 | ) | | | (321,958 | ) | |
Net decrease | | | (7,125 | ) | | | (103,678 | ) | | | (16,162 | ) | | | (210,377 | ) | |
Class R4 shares | |
Subscriptions | | | 8,234 | | | | 116,114 | | | | 27,506 | | | | 376,035 | | |
Distributions reinvested | | | — | | | | — | | | | 37 | | | | 513 | | |
Redemptions | | | (27,118 | ) | | | (387,125 | ) | | | (11,175 | ) | | | (153,404 | ) | |
Net increase (decrease) | | | (18,884 | ) | | | (271,011 | ) | | | 16,368 | | | | 223,144 | | |
Class Z shares | |
Subscriptions | | | 561,026 | | | | 7,566,458 | | | | 314,532 | | | | 4,275,196 | | |
Distributions reinvested | | | — | | | | — | | | | 8,951 | | | | 123,879 | | |
Redemptions | | | (723,525 | ) | | | (9,973,870 | ) | | | (3,509,255 | ) | | | (46,638,278 | ) | |
Net decrease | | | (162,499 | ) | | | (2,407,412 | ) | | | (3,185,772 | ) | | | (42,239,203 | ) | |
Total net increase (decrease) | | | 1,698,725 | | | | 25,555,382 | | | | (7,617,444 | ) | | | (100,974,055 | ) | |
(a) Includes conversions of Class B shares to Class A shares, if any.
The accompanying Notes to Financial Statements are an integral part of this statement.
Annual Report 2016
17
COLUMBIA INTERNATIONAL OPPORTUNITIES FUND
The following tables are intended to help you understand the Fund's financial performance. Certain information reflects financial results for a single share of a class held for the periods shown. Per share net investment income (loss) amounts are calculated based on average shares outstanding during the period. Total return assumes reinvestment of all dividends and distributions, if any. Total return does not reflect payment of sales charges, if any. Total return and portfolio turnover are not annualized for periods of less than one year. The portfolio turnover rate is calculated without regard to purchase and sales transactions of short-term instruments and certain derivatives, if any. If such transactions were included, the Fund's portfolio turnover rate may be higher.
| | | Year Ended
February 29, | | Year Ended February 28, | | Year Ended
February 29, | |
Class A | | 2016 | | 2015 | | 2014 | | 2013 | | 2012 | |
Per share data | |
Net asset value, beginning of period | | $ | 13.90 | | | $ | 13.63 | | | $ | 12.04 | | | $ | 11.24 | | | $ | 11.96 | | |
Income from investment operations: | |
Net investment income (loss) | | | 0.02 | | | | (0.02 | ) | | | 0.02 | | | | 0.12 | | | | 0.01 | | |
Net realized and unrealized gain (loss) | | | (2.35 | ) | | | 0.32 | (a) | | | 1.74 | | | | 0.68 | | | | (0.73 | ) | |
Total from investment operations | | | (2.33 | ) | | | 0.30 | | | | 1.76 | | | | 0.80 | | | | (0.72 | ) | |
Less distributions to shareholders: | |
Net investment income | | | — | | | | (0.03 | ) | | | (0.17 | ) | | | — | | | | — | | |
Total distributions to shareholders | | | — | | | | (0.03 | ) | | | (0.17 | ) | | | — | | | | — | | |
Net asset value, end of period | | $ | 11.57 | | | $ | 13.90 | | | $ | 13.63 | | | $ | 12.04 | | | $ | 11.24 | | |
Total return | | | (16.76 | %) | | | 2.18 | % | | | 14.80 | % | | | 7.12 | % | | | (6.02 | %) | |
Ratios to average net assets(b) | |
Total gross expenses | | | 1.55 | % | | | 1.46 | % | | | 1.41 | %(c) | | | 1.49 | %(c) | | | 1.53 | % | |
Total net expenses(d) | | | 1.44 | %(e) | | | 1.44 | %(e) | | | 1.41 | %(c)(e) | | | 1.49 | %(c)(e) | | | 1.53 | %(e) | |
Net investment income (loss) | | | 0.13 | % | | | (0.18 | %) | | | 0.16 | % | | | 1.10 | % | | | 0.06 | % | |
Supplemental data | |
Net assets, end of period (in thousands) | | $ | 33,104 | | | $ | 40,396 | | | $ | 93,346 | | | $ | 85,963 | | | $ | 99,757 | | |
Portfolio turnover | | | 152 | % | | | 165 | % | | | 141 | % | | | 73 | % | | | 86 | % | |
Notes to Financial Highlights
(a) Calculation of the net gain (loss) per share (both realized and unrealized) does not correlate to the aggregate realized and unrealized gain (loss) presented in the Statement of Operations due to the timing of subscriptions and redemptions of Fund shares in relation to fluctuations in the market value of the portfolio.
(b) In addition to the fees and expenses that the Fund bears directly, the Fund indirectly bears a pro rata share of the fees and expenses of any other funds in which it invests. Such indirect expenses are not included in the Fund's reported expense ratios.
(c) Ratios include line of credit interest expense which is less than 0.01%.
(d) Total net expenses include the impact of certain fee waivers/expense reimbursements made by the Investment Manager and certain of its affiliates, if applicable.
(e) The benefits derived from expense reductions had an impact of less than 0.01%.
The accompanying Notes to Financial Statements are an integral part of this statement.
Annual Report 2016
18
COLUMBIA INTERNATIONAL OPPORTUNITIES FUND
FINANCIAL HIGHLIGHTS (continued)
| | | Year Ended
February 29, | | Year Ended February 28, | | Year Ended
February 29, | |
Class B | | 2016 | | 2015 | | 2014 | | 2013 | | 2012 | |
Per share data | |
Net asset value, beginning of period | | $ | 12.82 | | | $ | 12.65 | | | $ | 11.26 | | | $ | 10.58 | | | $ | 11.35 | | |
Income from investment operations: | |
Net investment income (loss) | | | (0.08 | ) | | | (0.13 | ) | | | (0.06 | ) | | | 0.04 | | | | (0.07 | ) | |
Net realized and unrealized gain (loss) | | | (2.16 | ) | | | 0.31 | (a) | | | 1.61 | | | | 0.64 | | | | (0.70 | ) | |
Total from investment operations | | | (2.24 | ) | | | 0.18 | | | | 1.55 | | | | 0.68 | | | | (0.77 | ) | |
Less distributions to shareholders: | |
Net investment income | | | — | | | | (0.01 | ) | | | (0.16 | ) | | | — | | | | — | | |
Total distributions to shareholders | | | — | | | | (0.01 | ) | | | (0.16 | ) | | | — | | | | — | | |
Net asset value, end of period | | $ | 10.58 | | | $ | 12.82 | | | $ | 12.65 | | | $ | 11.26 | | | $ | 10.58 | | |
Total return | | | (17.47 | %) | | | 1.43 | % | | | 13.89 | % | | | 6.43 | % | | | (6.78 | %) | |
Ratios to average net assets(b) | |
Total gross expenses | | | 2.31 | % | | | 2.22 | % | | | 2.16 | %(c) | | | 2.24 | %(c) | | | 2.27 | % | |
Total net expenses(d) | | | 2.19 | %(e) | | | 2.20 | %(e) | | | 2.16 | %(c)(e) | | | 2.24 | %(c)(e) | | | 2.27 | %(e) | |
Net investment income (loss) | | | (0.60 | %) | | | (1.04 | %) | | | (0.47 | %) | | | 0.40 | % | | | (0.65 | %) | |
Supplemental data | |
Net assets, end of period (in thousands) | | $ | 650 | | | $ | 1,637 | | | $ | 3,816 | | | $ | 5,645 | | | $ | 8,381 | | |
Portfolio turnover | | | 152 | % | | | 165 | % | | | 141 | % | | | 73 | % | | | 86 | % | |
Notes to Financial Highlights
(a) Calculation of the net gain (loss) per share (both realized and unrealized) does not correlate to the aggregate realized and unrealized gain (loss) presented in the Statement of Operations due to the timing of subscriptions and redemptions of Fund shares in relation to fluctuations in the market value of the portfolio.
(b) In addition to the fees and expenses that the Fund bears directly, the Fund indirectly bears a pro rata share of the fees and expenses of any other funds in which it invests. Such indirect expenses are not included in the Fund's reported expense ratios.
(c) Ratios include line of credit interest expense which is less than 0.01%.
(d) Total net expenses include the impact of certain fee waivers/expense reimbursements made by the Investment Manager and certain of its affiliates, if applicable.
(e) The benefits derived from expense reductions had an impact of less than 0.01%.
The accompanying Notes to Financial Statements are an integral part of this statement.
Annual Report 2016
19
COLUMBIA INTERNATIONAL OPPORTUNITIES FUND
FINANCIAL HIGHLIGHTS (continued)
| | | Year Ended
February 29, | | Year Ended February 28, | | Year Ended
February 29, | |
Class C | | 2016 | | 2015 | | 2014 | | 2013 | | 2012 | |
Per share data | |
Net asset value, beginning of period | | $ | 12.82 | | | $ | 12.65 | | | $ | 11.26 | | | $ | 10.59 | | | $ | 11.36 | | |
Income from investment operations: | |
Net investment income (loss) | | | (0.08 | ) | | | (0.14 | ) | | | (0.06 | ) | | | 0.04 | | | | (0.07 | ) | |
Net realized and unrealized gain (loss) | | | (2.15 | ) | | | 0.32 | (a) | | | 1.61 | | | | 0.63 | | | | (0.70 | ) | |
Total from investment operations | | | (2.23 | ) | | | 0.18 | | | | 1.55 | | | | 0.67 | | | | (0.77 | ) | |
Less distributions to shareholders: | |
Net investment income | | | — | | | | (0.01 | ) | | | (0.16 | ) | | | — | | | | — | | |
Total distributions to shareholders | | | — | | | | (0.01 | ) | | | (0.16 | ) | | | — | | | | — | | |
Net asset value, end of period | | $ | 10.59 | | | $ | 12.82 | | | $ | 12.65 | | | $ | 11.26 | | | $ | 10.59 | | |
Total return | | | (17.39 | %) | | | 1.43 | % | | | 13.89 | % | | | 6.33 | % | | | (6.78 | %) | |
Ratios to average net assets(b) | |
Total gross expenses | | | 2.31 | % | | | 2.23 | % | | | 2.16 | %(c) | | | 2.24 | %(c) | | | 2.28 | % | |
Total net expenses(d) | | | 2.19 | %(e) | | | 2.20 | %(e) | | | 2.16 | %(c)(e) | | | 2.24 | %(c)(e) | | | 2.28 | %(e) | |
Net investment income (loss) | | | (0.61 | %) | | | (1.11 | %) | | | (0.52 | %) | | | 0.37 | % | | | (0.68 | %) | |
Supplemental data | |
Net assets, end of period (in thousands) | | $ | 8,176 | | | $ | 11,657 | | | $ | 15,478 | | | $ | 19,402 | | | $ | 25,608 | | |
Portfolio turnover | | | 152 | % | | | 165 | % | | | 141 | % | | | 73 | % | | | 86 | % | |
Notes to Financial Highlights
(a) Calculation of the net gain (loss) per share (both realized and unrealized) does not correlate to the aggregate realized and unrealized gain (loss) presented in the Statement of Operations due to the timing of subscriptions and redemptions of Fund shares in relation to fluctuations in the market value of the portfolio.
(b) In addition to the fees and expenses that the Fund bears directly, the Fund indirectly bears a pro rata share of the fees and expenses of any other funds in which it invests. Such indirect expenses are not included in the Fund's reported expense ratios.
(c) Ratios include line of credit interest expense which is less than 0.01%.
(d) Total net expenses include the impact of certain fee waivers/expense reimbursements made by the Investment Manager and certain of its affiliates, if applicable.
(e) The benefits derived from expense reductions had an impact of less than 0.01%.
The accompanying Notes to Financial Statements are an integral part of this statement.
Annual Report 2016
20
COLUMBIA INTERNATIONAL OPPORTUNITIES FUND
FINANCIAL HIGHLIGHTS (continued)
| | | Year Ended
February 29, | | Year Ended February 28, | | Year Ended
February 29, | |
Class I | | 2016 | | 2015 | | 2014 | | 2013 | | 2012 | |
Per share data | |
Net asset value, beginning of period | | $ | 14.41 | | | $ | 14.08 | | | $ | 12.40 | | | $ | 11.52 | | | $ | 12.14 | | |
Income from investment operations: | |
Net investment income | | | 0.07 | | | | 0.00 | (a) | | | 0.07 | | | | 0.17 | | | | 0.12 | | |
Net realized and unrealized gain (loss) | | | (2.44 | ) | | | 0.37 | (b) | | | 1.79 | | | | 0.71 | | | | (0.74 | ) | |
Total from investment operations | | | (2.37 | ) | | | 0.37 | | | | 1.86 | | | | 0.88 | | | | (0.62 | ) | |
Less distributions to shareholders: | |
Net investment income | | | — | | | | (0.04 | ) | | | (0.18 | ) | | | — | | | | — | | |
Total distributions to shareholders | | | — | | | | (0.04 | ) | | | (0.18 | ) | | | — | | | | — | | |
Net asset value, end of period | | $ | 12.04 | | | $ | 14.41 | | | $ | 14.08 | | | $ | 12.40 | | | $ | 11.52 | | |
Total return | | | (16.45 | %) | | | 2.60 | % | | | 15.18 | % | | | 7.64 | % | | | (5.11 | %) | |
Ratios to average net assets(c) | |
Total gross expenses | | | 1.09 | % | | | 1.09 | % | | | 0.99 | %(d) | | | 1.04 | %(d) | | | 1.12 | % | |
Total net expenses(e) | | | 1.02 | % | | | 1.07 | % | | | 0.99 | %(d) | | | 1.04 | %(d) | | | 1.12 | %(f) | |
Net investment income | | | 0.55 | % | | | 0.01 | % | | | 0.56 | % | | | 1.50 | % | | | 1.00 | % | |
Supplemental data | |
Net assets, end of period (in thousands) | | $ | 25,705 | | | $ | 2 | | | $ | 3 | | | $ | 3 | | | $ | 3 | | |
Portfolio turnover | | | 152 | % | | | 165 | % | | | 141 | % | | | 73 | % | | | 86 | % | |
Notes to Financial Highlights
(a) Rounds to zero.
(b) Calculation of the net gain (loss) per share (both realized and unrealized) does not correlate to the aggregate realized and unrealized gain (loss) presented in the Statement of Operations due to the timing of subscriptions and redemptions of Fund shares in relation to fluctuations in the market value of the portfolio.
(c) In addition to the fees and expenses that the Fund bears directly, the Fund indirectly bears a pro rata share of the fees and expenses of any other funds in which it invests. Such indirect expenses are not included in the Fund's reported expense ratios.
(d) Ratios include line of credit interest expense which is less than 0.01%.
(e) Total net expenses include the impact of certain fee waivers/expense reimbursements made by the Investment Manager and certain of its affiliates, if applicable.
(f) The benefits derived from expense reductions had an impact of less than 0.01%.
The accompanying Notes to Financial Statements are an integral part of this statement.
Annual Report 2016
21
COLUMBIA INTERNATIONAL OPPORTUNITIES FUND
FINANCIAL HIGHLIGHTS (continued)
| | | Year Ended
February 29, | | Year Ended February 28, | | Year Ended
February 29, | |
Class R | | 2016 | | 2015 | | 2014 | | 2013 | | 2012 | |
Per share data | |
Net asset value, beginning of period | | $ | 13.75 | | | $ | 13.51 | | | $ | 11.96 | | | $ | 11.19 | | | $ | 11.94 | | |
Income from investment operations: | |
Net investment income (loss) | | | (0.02 | ) | | | (0.08 | ) | | | (0.00 | )(a) | | | 0.10 | | | | (0.02 | ) | |
Net realized and unrealized gain (loss) | | | (2.32 | ) | | | 0.34 | (b) | | | 1.71 | | | | 0.67 | | | | (0.73 | ) | |
Total from investment operations | | | (2.34 | ) | | | 0.26 | | | | 1.71 | | | | 0.77 | | | | (0.75 | ) | |
Less distributions to shareholders: | |
Net investment income | | | — | | | | (0.02 | ) | | | (0.16 | ) | | | — | | | | — | | |
Total distributions to shareholders | | | — | | | | (0.02 | ) | | | (0.16 | ) | | | — | | | | — | | |
Net asset value, end of period | | $ | 11.41 | | | $ | 13.75 | | | $ | 13.51 | | | $ | 11.96 | | | $ | 11.19 | | |
Total return | | | (17.02 | %) | | | 1.94 | % | | | 14.51 | % | | | 6.88 | % | | | (6.28 | %) | |
Ratios to average net assets(c) | |
Total gross expenses | | | 1.81 | % | | | 1.73 | % | | | 1.66 | %(d) | | | 1.74 | %(d) | | | 1.77 | % | |
Total net expenses(e) | | | 1.69 | %(f) | | | 1.70 | %(f) | | | 1.66 | %(d)(f) | | | 1.74 | %(d)(f) | | | 1.77 | %(f) | |
Net investment income (loss) | | | (0.13 | %) | | | (0.61 | %) | | | (0.04 | %) | | | 0.88 | % | | | (0.17 | %) | |
Supplemental data | |
Net assets, end of period (in thousands) | | $ | 546 | | | $ | 755 | | | $ | 960 | | | $ | 1,067 | | | $ | 1,640 | | |
Portfolio turnover | | | 152 | % | | | 165 | % | | | 141 | % | | | 73 | % | | | 86 | % | |
Notes to Financial Highlights
(a) Rounds to zero.
(b) Calculation of the net gain (loss) per share (both realized and unrealized) does not correlate to the aggregate realized and unrealized gain (loss) presented in the Statement of Operations due to the timing of subscriptions and redemptions of Fund shares in relation to fluctuations in the market value of the portfolio.
(c) In addition to the fees and expenses that the Fund bears directly, the Fund indirectly bears a pro rata share of the fees and expenses of any other funds in which it invests. Such indirect expenses are not included in the Fund's reported expense ratios.
(d) Ratios include line of credit interest expense which is less than 0.01%.
(e) Total net expenses include the impact of certain fee waivers/expense reimbursements made by the Investment Manager and certain of its affiliates, if applicable.
(f) The benefits derived from expense reductions had an impact of less than 0.01%.
The accompanying Notes to Financial Statements are an integral part of this statement.
Annual Report 2016
22
COLUMBIA INTERNATIONAL OPPORTUNITIES FUND
FINANCIAL HIGHLIGHTS (continued)
| | | Year Ended
February 29, | | Year Ended February 28, | |
Class R4 | | 2016 | | 2015 | | 2014 | | 2013(a) | |
Per share data | |
Net asset value, beginning of period | | $ | 14.33 | | | $ | 14.02 | | | $ | 12.36 | | | $ | 11.17 | | |
Income from investment operations: | |
Net investment income (loss) | | | 0.05 | | | | (0.03 | ) | | | 0.01 | | | | 0.03 | | |
Net realized and unrealized gain (loss) | | | (2.43 | ) | | | 0.37 | (b) | | | 1.83 | | | | 1.16 | | |
Total from investment operations | | | (2.38 | ) | | | 0.34 | | | | 1.84 | | | | 1.19 | | |
Less distributions to shareholders: | |
Net investment income | | | — | | | | (0.03 | ) | | | (0.18 | ) | | | — | | |
Total distributions to shareholders | | | — | | | | (0.03 | ) | | | (0.18 | ) | | | — | | |
Net asset value, end of period | | $ | 11.95 | | | $ | 14.33 | | | $ | 14.02 | | | $ | 12.36 | | |
Total return | | | (16.61 | %) | | | 2.45 | % | | | 15.04 | % | | | 10.65 | % | |
Ratios to average net assets(c) | |
Total gross expenses | | | 1.31 | % | | | 1.25 | % | | | 1.16 | %(d) | | | 1.15 | %(d)(e) | |
Total net expenses(f) | | | 1.19 | %(g) | | | 1.21 | %(g) | | | 1.16 | %(d)(g) | | | 1.15 | %(d)(e) | |
Net investment income (loss) | | | 0.33 | % | | | (0.22 | %) | | | 0.09 | % | | | 0.93 | %(e) | |
Supplemental data | |
Net assets, end of period (in thousands) | | $ | 166 | | | $ | 470 | | | $ | 230 | | | $ | 3 | | |
Portfolio turnover | | | 152 | % | | | 165 | % | | | 141 | % | | | 73 | % | |
Notes to Financial Highlights
(a) Based on operations from November 8, 2012 (commencement of operations) through the stated period end.
(b) Calculation of the net gain (loss) per share (both realized and unrealized) does not correlate to the aggregate realized and unrealized gain (loss) presented in the Statement of Operations due to the timing of subscriptions and redemptions of Fund shares in relation to fluctuations in the market value of the portfolio.
(c) In addition to the fees and expenses that the Fund bears directly, the Fund indirectly bears a pro rata share of the fees and expenses of any other funds in which it invests. Such indirect expenses are not included in the Fund's reported expense ratios.
(d) Ratios include line of credit interest expense which is less than 0.01%.
(e) Annualized.
(f) Total net expenses include the impact of certain fee waivers/expense reimbursements made by the Investment Manager and certain of its affiliates, if applicable.
(g) The benefits derived from expense reductions had an impact of less than 0.01%.
The accompanying Notes to Financial Statements are an integral part of this statement.
Annual Report 2016
23
COLUMBIA INTERNATIONAL OPPORTUNITIES FUND
FINANCIAL HIGHLIGHTS (continued)
| | | Year Ended
February 29, | | Year Ended February 28, | | Year Ended
February 29, | |
Class Z | | 2016 | | 2015 | | 2014 | | 2013 | | 2012 | |
Per share data | |
Net asset value, beginning of period | | $ | 14.25 | | | $ | 13.94 | | | $ | 12.30 | | | $ | 11.44 | | | $ | 12.15 | | |
Income from investment operations: | |
Net investment income (loss) | | | 0.05 | | | | (0.01 | ) | | | 0.12 | | | | 0.16 | | | | 0.04 | | |
Net realized and unrealized gain (loss) | | | (2.41 | ) | | | 0.35 | (a) | | | 1.69 | | | | 0.70 | | | | (0.75 | ) | |
Total from investment operations | | | (2.36 | ) | | | 0.34 | | | | 1.81 | | | | 0.86 | | | | (0.71 | ) | |
Less distributions to shareholders: | |
Net investment income | | | — | | | | (0.03 | ) | | | (0.17 | ) | | | — | | | | — | | |
Total distributions to shareholders | | | — | | | | (0.03 | ) | | | (0.17 | ) | | | — | | | | — | | |
Net asset value, end of period | | $ | 11.89 | | | $ | 14.25 | | | $ | 13.94 | | | $ | 12.30 | | | $ | 11.44 | | |
Total return | | | (16.56 | %) | | | 2.46 | % | | | 14.94 | % | | | 7.52 | % | | | (5.84 | %) | |
Ratios to average net assets(b) | |
Total gross expenses | | | 1.30 | % | | | 1.22 | % | | | 1.15 | %(c) | | | 1.24 | %(c) | | | 1.28 | % | |
Total net expenses(d) | | | 1.19 | %(e) | | | 1.20 | %(e) | | | 1.15 | %(c)(e) | | | 1.24 | %(c)(e) | | | 1.28 | %(e) | |
Net investment income (loss) | | | 0.38 | % | | | (0.11 | %) | | | 0.93 | % | | | 1.40 | % | | | 0.38 | % | |
Supplemental data | |
Net assets, end of period (in thousands) | | $ | 24,555 | | | $ | 31,748 | | | $ | 75,489 | | | $ | 253,916 | | | $ | 456,645 | | |
Portfolio turnover | | | 152 | % | | | 165 | % | | | 141 | % | | | 73 | % | | | 86 | % | |
Notes to Financial Highlights
(a) Calculation of the net gain (loss) per share (both realized and unrealized) does not correlate to the aggregate realized and unrealized gain (loss) presented in the Statement of Operations due to the timing of subscriptions and redemptions of Fund shares in relation to fluctuations in the market value of the portfolio.
(b) In addition to the fees and expenses that the Fund bears directly, the Fund indirectly bears a pro rata share of the fees and expenses of any other funds in which it invests. Such indirect expenses are not included in the Fund's reported expense ratios.
(c) Ratios include line of credit interest expense which is less than 0.01%.
(d) Total net expenses include the impact of certain fee waivers/expense reimbursements made by the Investment Manager and certain of its affiliates, if applicable.
(e) The benefits derived from expense reductions had an impact of less than 0.01%.
The accompanying Notes to Financial Statements are an integral part of this statement.
Annual Report 2016
24
COLUMBIA INTERNATIONAL OPPORTUNITIES FUND
NOTES TO FINANCIAL STATEMENTS
February 29, 2016
Note 1. Organization
Columbia International Opportunities Fund (formerly known as Columbia Marsico International Opportunities Fund) (the Fund), a series of Columbia Funds Series Trust (the Trust), is a diversified fund. The Trust is registered under the Investment Company Act of 1940, as amended (the 1940 Act), as an open-end management investment company organized as a Delaware statutory trust. Effective May 1, 2015, Columbia Marsico International Opportunities Fund was renamed Columbia International Opportunities Fund.
Fund Shares
The Trust may issue an unlimited number of shares (without par value). The Fund offers Class A, Class B, Class C, Class I, Class R, Class R4 and Class Z shares. Although all share classes generally have identical voting, dividend and liquidation rights, each share class votes separately when required by the Trust's organizational documents or by law. Different share classes pay different distribution amounts to the extent the expenses of such share classes differ, and distributions in liquidation will be proportional to the net asset value of each share class. Each share class has its own expense and sales charge structure.
Class A shares are subject to a maximum front-end sales charge of 5.75% based on the initial investment amount. Class A shares purchased without an initial sales charge in accounts aggregating $1 million to $50 million at the time of purchase are subject to a contingent deferred sales charge (CDSC) if the shares are sold within 18 months after purchase, charged as follows: 1.00% CDSC if redeemed within 12 months after purchase, and 0.50% CDSC if redeemed more than 12, but less than 18, months after purchase.
Class B shares may be subject to a maximum CDSC of 5.00% based upon the holding period after purchase. Class B shares will generally convert to Class A shares eight years after purchase. The Fund no longer accepts investments by new or existing investors in the Fund's Class B shares, except in connection with the reinvestment of any dividend and/or capital gain distributions in Class B shares of the Fund and exchanges by existing Class B shareholders of certain other funds within the Columbia Family of Funds.
Class C shares are subject to a 1.00% CDSC on shares redeemed within 12 months after purchase.
Class I shares are not subject to sales charges and are available only to the Columbia Family of Funds.
Class R shares are not subject to sales charges and are generally available only to certain retirement plans and other investors as described in the Fund's prospectus.
Class R4 shares are not subject to sales charges and are generally available only to omnibus retirement plans and certain investors as described in the Fund's prospectus.
Class Z shares are not subject to sales charges and are available only to eligible investors, which are subject to different investment minimums as described in the Fund's prospectus.
Note 2. Summary of Significant Accounting Policies
Basis of Preparation
The Fund is an investment company that applies the accounting and reporting guidance in the Financial Accounting Standards Board (FASB) Accounting Standards Codification Topic 946, Financial Services — Investment Companies (ASC 946). The financial statements are prepared in accordance with U.S. generally accepted accounting principles (GAAP), which requires management to make certain estimates and assumptions that affect the reported amounts of assets and liabilities, the disclosure of contingent assets and liabilities at the date of the financial statements and the reported amounts of income and expenses during the reporting period. Actual results could differ from those estimates.
The following is a summary of significant accounting policies followed by the Fund in the preparation of its financial statements.
Security Valuation
All equity securities are valued at the close of business of the New York Stock Exchange (NYSE). Equity securities are valued at the last quoted sales price on the principal exchange or market on which they trade, except for securities traded on the NASDAQ Stock Market, which are valued at the NASDAQ official close price. Unlisted securities or listed securities for which there were no sales during the day are valued at the mean of the latest quoted bid and ask prices on such exchanges or markets.
Foreign equity securities are valued based on the closing price on the foreign exchange in which such securities are primarily traded. If any foreign equity security closing prices are not readily available, the securities are valued at the mean of the latest quoted bid and ask prices on
Annual Report 2016
25
COLUMBIA INTERNATIONAL OPPORTUNITIES FUND
NOTES TO FINANCIAL STATEMENTS (continued)
February 29, 2016
such exchanges or markets. Foreign currency exchange rates are generally determined at 4:00 p.m. Eastern (U.S.) time. Many securities markets and exchanges outside the U.S. close prior to the close of the NYSE; therefore, the closing prices for securities in such markets or on such exchanges may not fully reflect events that occur after such close but before the close of the NYSE. In those situations, foreign securities will be fair valued pursuant to a policy adopted by the Board of Trustees (the Board), including, if available, utilizing a third party pricing service to determine these fair values. The third party pricing service takes into account multiple factors, including, but not limited to, movements in the U.S. securities markets, certain depositary receipts, futures contracts and foreign exchange rates that have occurred subsequent to the close of the foreign exchange or market, to determine a good faith estimate that reasonably reflects the current market conditions as of the close of the NYSE. The fair value of a security is likely to be different from the quoted or published price, if available.
Investments in open-end investment companies, including money market funds, are valued at their latest net asset value.
Investments for which market quotations are not readily available, or that have quotations which management believes are not reflective of market value or reliable, are valued at fair value as determined in good faith under procedures approved by and under the general supervision of the Board. If a security or class of securities (such as foreign securities) is valued at fair value, such value is likely to be different from the quoted or published price for the security.
The determination of fair value often requires significant judgment. To determine fair value, management may use assumptions including but not limited to future cash flows and estimated risk premiums. Multiple inputs from various sources may be used to determine fair value.
GAAP requires disclosure regarding the inputs and valuation techniques used to measure fair value and any changes in valuation inputs or techniques. In addition, investments shall be disclosed by major category. This information is disclosed following the Fund's Portfolio of Investments.
Foreign Currency Transactions and Translations
The values of all assets and liabilities denominated in foreign currencies are generally translated into U.S. dollars at exchange rates determined at the close of the NYSE on any given day. Net realized and unrealized gains (losses) on
foreign currency transactions and translations include gains (losses) arising from the fluctuation in exchange rates between trade and settlement dates on securities transactions, gains (losses) arising from the disposition of foreign currency and currency gains (losses) between the accrual and payment dates on dividends, interest income and foreign withholding taxes.
For financial statement purposes, the Fund does not distinguish that portion of gains (losses) on investments which is due to changes in foreign exchange rates from that which is due to changes in market prices of the investments. Such fluctuations are included with the net realized and unrealized gains (losses) on investments in the Statement of Operations.
Security Transactions
Security transactions are accounted for on the trade date. Cost is determined and gains (losses) are based upon the specific identification method for both financial statement and federal income tax purposes.
Income Recognition
Corporate actions and dividend income are generally recorded net of any non-reclaimable tax withholdings, on the ex-dividend date or upon receipt of ex-dividend notification in the case of certain foreign securities.
The Fund may receive distributions from holdings in equity securities, business development companies (BDCs), exchange-traded funds, other regulated investment companies (RICs), and real estate investment trusts (REITs), which report information on the tax character of their distributions annually. These distributions are allocated to dividend income, capital gain and return of capital based on actual information reported. Return of capital is recorded as a reduction of the cost basis of securities held. If the Fund no longer owns the applicable securities, return of capital is recorded as a realized gain. With respect to REITs, to the extent actual information has not yet been reported, estimates for return of capital are made by the Fund's management. Management's estimates are subsequently adjusted when the actual character of the distributions is disclosed by the REITs, which could result in a proportionate change in return of capital to shareholders.
Awards from class action litigation are recorded as a reduction of cost basis if the Fund still owns the applicable securities on the payment date. If the Fund no longer owns the applicable securities, the proceeds are recorded as realized gains.
Annual Report 2016
26
COLUMBIA INTERNATIONAL OPPORTUNITIES FUND
NOTES TO FINANCIAL STATEMENTS (continued)
February 29, 2016
Expenses
General expenses of the Trust are allocated to the Fund and other funds of the Trust based upon relative net assets or other expense allocation methodologies determined by the nature of the expense. Expenses directly attributable to the Fund are charged to the Fund. Expenses directly attributable to a specific class of shares are charged to that share class.
Determination of Class Net Asset Value
All income, expenses (other than class-specific expenses, which are charged to that share class, as shown in the Statement of Operations) and realized and unrealized gains (losses) are allocated to each class of the Fund on a daily basis, based on the relative net assets of each class, for purposes of determining the net asset value of each class.
Federal Income Tax Status
The Fund intends to qualify each year as a regulated investment company under Subchapter M of the Internal Revenue Code, as amended, and will distribute substantially all of its taxable income (including net short-term capital gains), if any, for its tax year, and as such will not be subject to federal income taxes. In addition, the Fund intends to distribute in each calendar year substantially all of its net investment income, capital gains and certain other amounts, if any, such that the Fund should not be subject to federal excise tax. Therefore, no federal income or excise tax provision is recorded.
Foreign Taxes
The Fund may be subject to foreign taxes on income, gains on investments or currency repatriation, a portion of which may be recoverable. The Fund will accrue such taxes and recoveries, as applicable, based upon its current interpretation of tax rules and regulations that exist in the markets in which it invests.
Realized gains in certain countries may be subject to foreign taxes at the Fund level, based on statutory rates. The Fund accrues for such foreign taxes on realized and unrealized gains at the appropriate rate for each jurisdiction, as applicable. The amount, if any, is disclosed as a liability on the Statement of Assets and Liabilities.
Distributions to Shareholders
Distributions from net investment income, if any, are declared and paid semi-annually. Net realized capital gains, if any, are distributed at least annually. Income distributions and capital gain distributions are
determined in accordance with federal income tax regulations, which may differ from GAAP.
Guarantees and Indemnifications
Under the Trust's organizational documents and, in some cases, by contract, its officers and trustees are indemnified against certain liabilities arising out of the performance of their duties to the Trust or its funds. In addition, certain of the Fund's contracts with its service providers contain general indemnification clauses. The Fund's maximum exposure under these arrangements is unknown since the amount of any future claims that may be made against the Fund cannot be determined, and the Fund has no historical basis for predicting the likelihood of any such claims.
Recent Accounting Pronouncement
Fair Value Measurement (Topic 820), Disclosure for Investments in Certain Entities That Calculate Net Asset Value per Share (or Its Equivalent)
In May 2015, FASB issued Accounting Standards Update (ASU) No. 2015-07, Fair Value Measurement (Topic 820), Disclosure for Investments in Certain Entities That Calculate Net Asset Value per Share (or Its Equivalent). ASU No. 2015-07 changes the disclosure requirements for investments for which fair value is measured using the net asset value per share practical expedient. The disclosure requirements are effective for annual periods beginning after December 15, 2015 and interim periods within those fiscal years. At this time, management is evaluating the implications of this guidance and the impact it will have on the financial statement amounts and footnote disclosures, if any.
Note 3. Fees and Other Transactions with Affiliates
Management Fees
Effective July 1, 2015, the Fund entered into a Management Agreement with Columbia Management Investment Advisers, LLC (the Investment Manager), a wholly-owned subsidiary of Ameriprise Financial, Inc. (Ameriprise Financial). Under the Management Agreement, the Investment Manager provides the Fund with investment research and advice, as well as administrative and accounting services. The management services fee is an annual fee that is equal to a percentage of the Fund's average daily net assets that declines from 0.87% to 0.67% as the Fund's net assets increase. The effective management services fee rate for the year ended February 29, 2016 was 0.87% of the Fund's average daily net assets.
Annual Report 2016
27
COLUMBIA INTERNATIONAL OPPORTUNITIES FUND
NOTES TO FINANCIAL STATEMENTS (continued)
February 29, 2016
Prior to July 1, 2015, the Fund paid the Investment Manager an annual fee for advisory services under an Investment Management Services Agreement and a separate annual fee for administrative and accounting services under an Administrative Services Agreement. For the period from March 1, 2015 through June 30, 2015, the investment advisory services fee paid to the Investment Manager was $226,849, and the administrative services fee paid to the Investment Manager was $22,972.
Subadvisory Agreement
Prior to May 1, 2015, the Investment Manager entered into a Subadvisory Agreement with Marsico Capital Management, LLC (Marsico) to serve as the subadviser to the Fund. The Investment Manager compensated Marsico to manage the investment of the Fund's assets. Effective May 1, 2015, Marsico no longer serves as the subadviser to the Fund and the Investment Manager has assumed the day-to-day portfolio management of the Fund.
Participating Affiliates
The Investment Manager and its investment advisory affiliates (Participating Affiliates) around the world may coordinate in providing services to their clients. Such coordination may include functional leadership of the business (the "Global" business). From time to time the Investment Manager (or any affiliated investment subadviser to the Fund, as the case may be) may engage its Participating Affiliates to provide a variety of services such as investment research, investment monitoring, trading and discretionary investment management (including portfolio management) to certain accounts managed by the Investment Manager, including the Fund. These Participating Affiliates will provide services to the Investment Manager (or any affiliated investment subadviser to the Fund as the case may be) either pursuant to subadvisory agreements, personnel-sharing agreements or similar inter-company arrangements and the Fund will pay no additional fees and expenses as a result of any such arrangements.
These Participating Affiliates, like the Investment Manager, are direct or indirect subsidiaries of Ameriprise Financial and are registered with appropriate respective regulators in their home jurisdictions and, where required, the Securities and Exchange Commission and the Commodity Futures Trading Commission in the United States.
Pursuant to some of these arrangements, certain employees of these Participating Affiliates may serve as
"associated persons" of the Investment Manager and, in this capacity, subject to the oversight and supervision of the Investment Manager and consistent with the investment objectives, policies and limitations set forth in the Fund's prospectus and Statement of Additional Information (SAI), may provide such services to the Fund on behalf of the Investment Manager.
Other Expenses
Other expenses are for, among other things, miscellaneous expenses of the Fund or the Board, including payments to Board Services Corp., a company providing limited administrative services to the Fund and the Board. That company's expenses include boardroom and office expense, employee compensation, employee health and retirement benefits, and certain other expenses. For the year ended February 29, 2016, other expenses paid by the Fund to this company were $1,417.
Compensation of Board Members
Board members, who are not officers or employees of the Investment Manager or Ameriprise Financial, are compensated for their services to the Fund as disclosed in the Statement of Operations. Under a Deferred Compensation Plan (the Plan), these Board members may elect to defer payment of up to 100% of their compensation. Deferred amounts are treated as though equivalent dollar amounts had been invested in shares of certain funds managed by the Investment Manager. The Fund's liability for these amounts is adjusted for market value changes and remains in the Fund until distributed in accordance with the Plan. All amounts payable under the Plan constitute a general unsecured obligation of the Fund.
Transfer Agency Fees
Under a Transfer and Dividend Disbursing Agent Agreement, Columbia Management Investment Services Corp. (the Transfer Agent), an affiliate of the Investment Manager and a wholly-owned subsidiary of Ameriprise Financial, is responsible for providing transfer agency services to the Fund. The Transfer Agent has contracted with Boston Financial Data Services (BFDS) to serve as sub-transfer agent.
The Transfer Agent receives a monthly transfer agency fee based on the number or the average value of accounts, depending on the type of account. In addition, the Transfer Agent also receives sub-transfer agency fees based on a percentage of the average aggregate value of the Fund's shares maintained in omnibus accounts (other than omnibus accounts for which American Enterprise Investment Services Inc. is the broker of record or
Annual Report 2016
28
COLUMBIA INTERNATIONAL OPPORTUNITIES FUND
NOTES TO FINANCIAL STATEMENTS (continued)
February 29, 2016
accounts where the beneficial shareholder is a customer of Ameriprise Financial Services, Inc., for which the Transfer Agent receives a per account fee). The Transfer Agent pays the fees of BFDS for services as sub-transfer agent and is not entitled to reimbursement for such fees from the Fund (with the exception of out-of-pocket fees).
The Transfer Agent also receives compensation from the Fund for various shareholder services and reimbursements for certain out-of-pocket fees. Class I shares do not pay transfer agency fees.
For the year ended February 29, 2016, the Fund's effective transfer agency fee rates as a percentage of average daily net assets of each class were as follows:
Class A | | | 0.20 | % | |
Class B | | | 0.20 | | |
Class C | | | 0.20 | | |
Class R | | | 0.20 | | |
Class R4 | | | 0.20 | | |
Class Z | | | 0.20 | | |
An annual minimum account balance fee of $20 may apply to certain accounts with a value below the applicable share class's initial minimum investment requirements to reduce the impact of small accounts on transfer agency fees. These minimum account balance fees are remitted to the Fund and recorded as part of expense reductions in the Statement of Operations. For the year ended February 29, 2016, these minimum account balance fees reduced total expenses of the Fund by $300.
Distribution and Service Fees
The Fund has an agreement with Columbia Management Investment Distributors, Inc. (the Distributor), an affiliate of the Investment Manager and a wholly-owned subsidiary of Ameriprise Financial, for distribution and shareholder services. The Board has approved, and the Fund has adopted, distribution and shareholder service plans (the Plans) applicable to certain share classes, which set the distribution and service fees for the Fund. These fees are calculated daily and are intended to compensate the Distributor and/or eligible selling and/or servicing agents for selling shares of the Fund and providing services to investors.
Under the Plans, the Fund pays a monthly combined distribution and service fee to the Distributor at the maximum annual rate of 0.25% of the average daily net assets attributable to Class A shares of the Fund. Also under the Plans, the Fund pays a monthly service fee at the maximum annual rate of 0.25% of the average daily net assets attributable to Class B and Class C shares of
the Fund and a monthly distribution fee at the maximum annual rate of 0.75%, 0.75% and 0.50% of the average daily net assets attributable to Class B, Class C and Class R shares of the Fund, respectively.
Sales Charges
Sales charges, including front-end charges and CDSCs, received by the Distributor for distributing Fund shares were $23,388 for Class A, $57 for Class B and $135 for Class C shares for the year ended February 29, 2016.
Expenses Waived/Reimbursed by the Investment Manager and its Affiliates
The Fund's expense ratio is subject to an expense reimbursement arrangement pursuant to which fees will be waived and/or expenses reimbursed (excluding certain fees and expenses described below), so that the Fund's net operating expenses, after giving effect to fees waived/expenses reimbursed and any balance credits and/or overdraft charges from the Fund's custodian, do not exceed the annual rates of:
| | | Contractual
Expense Cap
July 1, 2015
through
June 30, 2016 | | Voluntary
Expense Cap
Prior to
July 1, 2015 | |
Class A | | | 1.42 | % | | | 1.47 | % | |
Class B | | | 2.17 | | | | 2.22 | | |
Class C | | | 2.17 | | | | 2.22 | | |
Class I | | | 1.02 | | | | 1.09 | | |
Class R | | | 1.67 | | | | 1.72 | | |
Class R4 | | | 1.17 | | | | 1.22 | | |
Class Z | | | 1.17 | | | | 1.22 | | |
The contractual agreement may be modified or amended only with approval from the Investment Manager, certain of its affiliates and the Fund. Under the arrangements, the following fees and expenses are excluded from the waiver/reimbursement commitment, and therefore will be paid by the Fund, if applicable: taxes (including foreign transaction taxes), expenses associated with investments in affiliated and non-affiliated pooled investment vehicles (including mutual funds and exchange-traded funds), transaction costs and brokerage commissions, costs related to any securities lending program, dividend and interest expenses associated with securities sold short, inverse floater program fees and expenses, transaction charges and interest on borrowed money, interest and extraordinary expenses. Any fees waived and/or expenses reimbursed under the expense reimbursement arrangements described above are not recoverable by the Investment Manager or its affiliates in future periods.
Annual Report 2016
29
COLUMBIA INTERNATIONAL OPPORTUNITIES FUND
NOTES TO FINANCIAL STATEMENTS (continued)
February 29, 2016
Note 4. Federal Tax Information
The timing and character of income and capital gain distributions are determined in accordance with income tax regulations, which may differ from GAAP because of temporary or permanent book to tax differences.
At February 29, 2016, these differences are primarily due to differing treatment for capital loss carryforwards, deferral/reversal of wash sale losses, Trustees' deferred compensation, foreign currency transactions, passive foreign investment company (PFIC) holdings and post-October capital losses. To the extent these differences are permanent, reclassifications are made among the components of the Fund's net assets in the Statement of Assets and Liabilities. Temporary differences do not require reclassifications. In the Statement of Assets and Liabilities the following reclassifications were made:
Undistributed net investment income | | $ | (33,783 | ) | |
Accumulated net realized loss | | | 33,783 | | |
Net investment income (loss) and net realized gains (losses), as disclosed in the Statement of Operations, and net assets were not affected by this reclassification.
The tax character of distributions paid during the years indicated was as follows:
Year Ended | | February 29, 2016 | | February 28, 2015 | |
Ordinary income | | $ | — | | | $ | 303,017 | | |
Short-term capital gain distributions, if any, are considered ordinary income distributions for tax purposes.
At February 29, 2016, the components of distributable earnings on a tax basis were as follows:
Undistributed ordinary income | | $ | 155,265 | | |
Capital loss carryforwards | | | (570,956,393 | ) | |
Net unrealized depreciation | | | (15,380,128 | ) | |
At February 29, 2016, the cost of investments for federal income tax purposes was $107,757,273 and the aggregate gross unrealized appreciation and depreciation based on that cost was:
Unrealized appreciation | | $ | 1,235,387 | | |
Unrealized depreciation | | | (16,615,515 | ) | |
Net unrealized depreciation | | | (15,380,128 | ) | |
The following capital loss carryforwards, determined at February 29, 2016, may be available to reduce taxable income arising from future net realized gains on
investments, if any, to the extent permitted by the Internal Revenue Code:
Year of Expiration | | Amount ($) | |
2017 | | | 150,407,799 | | |
2018 | | | 420,548,594 | | |
Total | | | 570,956,393 | | |
Capital loss carryforwards with no expiration are required to be utilized prior to any capital losses which carry an expiration date. As a result of this ordering rule, capital loss carryforwards which carry an expiration date may be more likely to expire unused.
For the year ended February 29, 2016, $10,279,980 of capital loss carryforward was utilized.
Under current tax rules, regulated investment companies can elect to treat certain late-year ordinary losses incurred and post-October capital losses (capital losses realized after October 31) as arising on the first day of the following taxable year. As of February 29, 2016, the Fund will elect to treat post-October capital losses of $2,506,381 as arising on March 1, 2016.
Management of the Fund has concluded that there are no significant uncertain tax positions in the Fund that would require recognition in the financial statements. However, management's conclusion may be subject to review and adjustment at a later date based on factors including, but not limited to, new tax laws, regulations, and administrative interpretations (including relevant court decisions). Generally, the Fund's federal tax returns for the prior three fiscal years remain subject to examination by the Internal Revenue Service.
Note 5. Portfolio Information
The cost of purchases and proceeds from sales of securities, excluding short-term investments and derivatives, if any, aggregated to $169,220,228 and $145,154,418, respectively, for the year ended February 29, 2016. The amount of purchase and sale activity impacts the portfolio turnover rate reported in the Financial Highlights.
Note 6. Affiliated Money Market Fund
The Fund invests in Columbia Short-Term Cash Fund, an affiliated money market fund established for the exclusive use by the Fund and other affiliated funds. The income earned by the Fund from such investments is included as Dividends — affiliated issuers in the Statement of Operations. As an investing fund, the Fund
Annual Report 2016
30
COLUMBIA INTERNATIONAL OPPORTUNITIES FUND
NOTES TO FINANCIAL STATEMENTS (continued)
February 29, 2016
indirectly bears its proportionate share of the expenses of Columbia Short-Term Cash Fund.
Note 7. Line of Credit
The Fund has access to a revolving credit facility whereby the Fund may borrow for the temporary funding of shareholder redemptions or for other temporary or emergency purposes. Effective December 8, 2015, Citibank, N.A. and HSBC Bank USA, N.A. joined JPMorgan Chase Bank, N.A. (JPMorgan) as lead of a syndicate of banks under the credit facility, which is a collective agreement between the Fund and certain other funds managed by the Investment Manager, severally and not jointly, that permits collective borrowings up to $1 billion. Interest is charged to each participating fund based on its borrowings at a rate equal to the higher of (i) the overnight federal funds rate plus 1.00% or (ii) the one-month LIBOR rate plus 1.00%. Each borrowing under the credit facility matures no later than 60 days after the date of borrowing. The Fund also pays a commitment fee equal to its pro rata share of the amount of the credit facility at a rate of 0.15% per annum. The commitment fee is included in other expenses in the Statement of Operations. Prior to December 8, 2015, JPMorgan was the sole lead bank under the credit facility agreement that permitted borrowings up to $550 million under the same terms and interest rates as described above with the exception of the commitment fee which was charged at a rate of 0.075% per annum.
The Fund had no borrowings during the year ended February 29, 2016.
Note 8. Significant Risks
Shareholder Concentration Risk
At February 29, 2016, two unaffiliated shareholders of record owned 24.0% of the outstanding shares of the Fund in one or more accounts. The Fund has no knowledge about whether any portion of those shares was owned beneficially. Affiliated shareholders of record owned 37.0% of the outstanding shares of the Fund in one or more accounts. Subscription and redemption activity by concentrated accounts may have a significant effect on the operations of the Fund. In the case of a large redemption, the Fund may be forced to sell investments at inopportune times, including its liquid or more liquid positions, resulting in Fund losses and the Fund holding a higher percentage of less liquid or illiquid securities. Large redemptions could result in decreased economies of scale and increased operating expenses for non-redeeming Fund shareholders.
Financial Sector Risk
The Fund may be more susceptible to the particular risks that may affect companies in the financial services sector than if it were invested in a wider variety of companies in unrelated sectors. Companies in the financial services sector are subject to certain risks, including the risk of regulatory change, decreased liquidity in credit markets and unstable interest rates. Such companies may have concentrated portfolios, such as a high level of loans to real estate developers, which makes them vulnerable to economic conditions that affect that industry. Performance of such companies may be affected by competitive pressures and exposure to investments or agreements that, under certain circumstances, may lead to losses (e.g., subprime loans). Companies in the financial services sector are subject to extensive governmental regulation that may limit the amount and types of loans and other financial commitments they can make, and interest rates and fees that they may charge. In addition, profitability of such companies is largely dependent upon the availability and the cost of capital.
Foreign Securities and Emerging Market Countries Risk
Investing in foreign securities may include certain risks and considerations not typically associated with investing in U.S. securities, such as fluctuating currency values and changing local and regional economic, political and social conditions, which may result in greater market volatility. In addition, certain foreign securities may not be as liquid as U.S. securities. Investing in emerging markets may accentuate these risks. These countries are also more likely to experience high levels of inflation, deflation or currency devaluation which could hurt their economies and securities markets. To the extent that the Fund concentrates its investment exposure to any one or a few specific countries, the Fund will be particularly susceptible to the various conditions, events or other factors impacting those countries and may, therefore, have a greater risk than that of a fund which is more geographically diversified.
Note 9. Subsequent Events
Management has evaluated the events and transactions that have occurred through the date the financial statements were issued. Other than as noted below, there were no items requiring adjustment of the financial statements or additional disclosure.
Annual Report 2016
31
COLUMBIA INTERNATIONAL OPPORTUNITIES FUND
NOTES TO FINANCIAL STATEMENTS (continued)
February 29, 2016
On April 15, 2016, shareholders of the Fund approved a proposal to merge the Fund into Columbia Select International Equity Fund. The merger is expected to take place on or about May 20, 2016.
Note 10. Information Regarding Pending and Settled Legal Proceedings
In December 2005, without admitting or denying the allegations, American Express Financial Corporation (AEFC, which is now known as Ameriprise Financial, Inc. (Ameriprise Financial)) entered into settlement agreements with the Securities and Exchange Commission (SEC) and Minnesota Department of Commerce (MDOC) related to market timing activities. As a result, AEFC was censured and ordered to cease and desist from committing or causing any violations of certain provisions of the Investment Advisers Act of 1940, the Investment Company Act of 1940, and various Minnesota laws. AEFC agreed to pay disgorgement of $10 million and civil money penalties of $7 million. AEFC also agreed to retain an independent distribution consultant to assist in developing a plan for distribution of all disgorgement and civil penalties ordered by the SEC in accordance with various undertakings detailed at http://www.sec.gov/litigation/admin/ia-2451.pdf. Ameriprise Financial and its affiliates have cooperated with the SEC and the MDOC in these legal proceedings, and have made regular reports to the Funds' Boards of Trustees.
Ameriprise Financial and certain of its affiliates have historically been involved in a number of legal, arbitration and regulatory proceedings, including routine litigation, class actions, and governmental actions, concerning matters arising in connection with the conduct of their business activities. Ameriprise Financial believes that the Funds are not currently the subject of, and that neither Ameriprise Financial nor any of its affiliates are the subject of, any pending legal, arbitration or regulatory proceedings that are likely to have a material adverse effect on the Funds or the ability of Ameriprise Financial or its affiliates to perform under their contracts with the Funds. Ameriprise Financial is required to make quarterly (10-Q), annual (10-K) and, as necessary, 8-K filings with the SEC on legal and regulatory matters that relate to Ameriprise Financial and its affiliates. Copies of these filings may be obtained by accessing the SEC website at www.sec.gov.
There can be no assurance that these matters, or the adverse publicity associated with them, will not result in increased fund redemptions, reduced sale of fund shares or other adverse consequences to the Funds. Further,
although we believe proceedings are not likely to have a material adverse effect on the Funds or the ability of Ameriprise Financial or its affiliates to perform under their contracts with the Funds, these proceedings are subject to uncertainties and, as such, we are unable to estimate the possible loss or range of loss that may result. An adverse outcome in one or more of these proceedings could result in adverse judgments, settlements, fines, penalties or other relief that could have a material adverse effect on the consolidated financial condition or results of operations of Ameriprise Financial.
Annual Report 2016
32
COLUMBIA INTERNATIONAL OPPORTUNITIES FUND
REPORT OF INDEPENDENT REGISTERED PUBLIC ACCOUNTING FIRM
To the Trustees of Columbia Funds Series Trust and the Shareholders of
Columbia International Opportunities Fund (formerly known as Columbia Marsico
International Opportunities Fund)
In our opinion, the accompanying statement of assets and liabilities, including the portfolio of investments, and the related statements of operations and of changes in net assets and the financial highlights present fairly, in all material respects, the financial position of Columbia International Opportunities Fund (formerly known as Columbia Marsico International Opportunities Fund) (the "Fund," a series of Columbia Funds Series Trust) at February 29, 2016, and the results of its operations, the changes in its net assets and the financial highlights for each of the periods indicated, in conformity with accounting principles generally accepted in the United States of America. These financial statements and financial highlights (hereafter referred to as "financial statements") are the responsibility of the Fund's management. Our responsibility is to express an opinion on these financial statements based on our audits. We conducted our audits of these financial statements in accordance with the standards of the Public Company Accounting Oversight Board (United States). Those standards require that we plan and perform the audit to obtain reasonable assurance about whether the financial statements are free of material misstatement. An audit includes examining, on a test basis, evidence supporting the amounts and disclosures in the financial statements, assessing the accounting principles used and significant estimates made by management, and evaluating the overall financial statement presentation. We believe that our audits, which included confirmation of securities at February 29, 2016 by correspondence with the custodian, brokers and transfer agent, provide a reasonable basis for our opinion.
PricewaterhouseCoopers LLP
Minneapolis, MN
April 21, 2016
Annual Report 2016
33
COLUMBIA INTERNATIONAL OPPORTUNITIES FUND
FEDERAL INCOME TAX INFORMATION
(Unaudited)
The Fund hereby designates the following tax attributes for the fiscal year ended February 29, 2016. Shareholders will be notified in early 2017 of the amounts for use in preparing 2016 income tax returns.
Tax Designations:
Foreign Taxes Paid | | $ | 92,744 | | |
Foreign Taxes Paid Per Share | | $ | 0.01 | | |
Foreign Source Income | | $ | 1,684,146 | | |
Foreign Source Income Per Share | | $ | 0.21 | | |
Foreign Taxes. The Fund makes the election to pass through to shareholders the foreign taxes paid. Eligible shareholders may claim a foreign tax credit. These taxes, and the corresponding foreign source income, are provided.
Annual Report 2016
34
COLUMBIA INTERNATIONAL OPPORTUNITIES FUND
Shareholders elect the Board that oversees the Fund's operations. The Board appoints officers who are responsible for day-to-day business decisions based on policies set by the Board. The following table provides basic biographical information about the Fund's Trustees, including their principal occupations during the past five years, although specific titles for individuals may have varied over the period. Under current Board policy, members generally may serve through the end of the calendar year in which they reach either the mandatory retirement age established by the Board or the fifteenth anniversary of the first Board meeting they attended as a member of the Board.
Trustees
Independent Trustees
Name,
Address,
Year of Birth | | Position Held With
the Funds and Length of
Service | | Principal Occupation(s)
During the Past Five Years
and Other Relevant
Professional Experience | | Number of
Funds in the
Columbia
Funds Complex
Overseen | | Other Directorships
Held by Trustee
During the Past
Five Years | |
Kathleen Blatz
901 S. Marquette Ave.
Minneapolis, MN 55402
1954 | | Trustee since 1/06 for RiverSource Funds and since 6/11 for Nations Funds | | Attorney; specializing in arbitration and mediation; Chief Justice, Minnesota Supreme Court, 1998-2006; Associate Justice, Minnesota Supreme Court, 1996-1998; Fourth Judicial District Court Judge, Hennepin County, 1994-1996; Attorney in private practice and public service, 1984-1993; State Representative, Minnesota House of Representatives, 1979-1993, which included service on the Tax and Financial Institutions and Insurance Committees | | | 124 | | | Trustee, BlueCross BlueShield of Minnesota (Chair of the Business Development Committee) since 2009; Chair of the Robina Foundation since August 2013 | |
Edward J. Boudreau, Jr.
901 S. Marquette Ave.
Minneapolis, MN 55402
1944 | | Trustee since 6/11 for RiverSource Funds and since 1/05 for Nations Funds | | Managing Director, E.J. Boudreau & Associates (consulting) since 2000; FINRA Industry Arbitrator, 2002-present; Chairman and Chief Executive Officer, John Hancock Funds (asset management), Chairman and Interested Trustee for open-end and closed-end funds offered by John Hancock, 1989-2000; John Hancock Life Insurance Company, including SVP and Treasurer and SVP Information Technology, 1968-1988 | | | 122 | | | Former Trustee, Boston Museum of Science (Chair of Finance Committee), 1985-2013; former Trustee, BofA Funds Series Trust (11 funds), 2005-2011 | |
Pamela G. Carlton
901 S. Marquette Ave.
Minneapolis, MN 55402
1954 | | Trustee since 7/07 for RiverSource Funds and since 6/11 for Nations Funds | | President, Springboard-Partners in Cross Cultural Leadership (consulting company) since 2003; Managing Director of US Equity Research, JP Morgan Chase, 1999-2003; Director of US Equity Research, Chase Asset Management, 1996-1999; Co-Director Latin America Research, 1993-1996, COO Global Research, 1992-1996, Co-Director of US Research, 1991-1992, Investment Banker, Morgan Stanley, 1982-1991 | | | 124 | | | Trustee, New York Presbyterian Hospital Board (Executive Committee and Chair of Human Resources Committee) since 1996 | |
Annual Report 2016
35
COLUMBIA INTERNATIONAL OPPORTUNITIES FUND
TRUSTEES AND OFFICERS (continued)
Independent Trustees (continued)
Name,
Address,
Year of Birth | | Position Held With
the Funds and Length of
Service | | Principal Occupation(s)
During the Past Five Years
and Other Relevant
Professional Experience | | Number of
Funds in the
Columbia
Funds Complex
Overseen | | Other Directorships
Held by Trustee
During the Past
Five Years | |
William P. Carmichael
901 S. Marquette Ave.
Minneapolis, MN 55402
1943 | | Trustee since 6/11 for RiverSource Funds and since 2003 for Nations Funds; Chair of the Board from 1/14-11/15 | | Retired; Co-founder, The Succession Fund (provides exit strategies to owners of privately held companies), 1998-2007; Adjunct Professor of Finance, Kelley School of Business, Indiana University, 1993-2007; Senior Vice President, Sara Lee Corporation, 1991-1993; Senior Vice President and Chief Financial Officer, Beatrice Foods Company, 1984-1990; Vice President, Esmark, Inc., 1973-1984; Associate, Price Waterhouse, 1968-1972 | | | 124 | | | Director, The Finish Line (athletic shoes and apparel) since July 2003; Director, International Textile Corp. since 2012; Director, hhgregg since May, 2015; former Director, Cobra Electronics Corporation (electronic equipment manufacturer), 1994-August 2014; former Director, Spectrum Brands, Inc. (consumer products), 2002-2009; former Director, Simmons Company (bedding), 2004-2010; former Trustee, BofA Funds Series Trust (11 funds), 2009-2011; former Director, McMoRan Exploration Company (oil and gas exploration and development), 2010-2013 | |
Patricia M. Flynn
901 S. Marquette Ave.
Minneapolis, MN 55402
1950 | | Trustee since 11/04 for RiverSource Funds and since 6/11 for Nations Funds | | Trustee Professor of Economics and Management, Bentley University since 1976 (also teaches and conducts research on corporate governance); Dean, McCallum Graduate School of Business, Bentley University, 1992-2002 | | | 124 | | | Trustee, MA Taxpayers Foundation since 1997; Board of Governors, Innovation Institute, MA Technology Collaborative since 2010 | |
William A. Hawkins
901 S. Marquette Ave.
Minneapolis, MN 55402
1942 | | Chair of the Board since 11/15; Trustee since 6/11 for RiverSource Funds and since 1/05 for Nations Funds | | Managing Director, Overton Partners (financial consulting) since August 2010; President and Chief Executive Officer, California General Bank, N.A., January 2008-August 2010; Operation Hope, COO, 2004-2007; IndyMac Bancorp, President, CBG, 1999-2003; American General Bank, President, 1997-1999; Griffin Financial Services, CEO, 1981-1997; The Griffin Funds, CEO, 1992-1998 | | | 124 | | | Former Trustee, BofA Funds Series Trust (11 funds), 2009-2015 | |
R. Glenn Hilliard
901 S. Marquette Ave.
Minneapolis, MN 55402
1943 | | Trustee since 6/11 for RiverSource Funds and since 1/05 for Nations Funds | | Chairman and Chief Executive Officer, Hilliard Group LLC (investing and consulting) since April 2003; Non-Executive Director & Chairman, CNO Financial Group, Inc. (insurance), 2003-2011; Chair & CEO, ING Americas, 1996-2003 | | | 122 | | | Chairman, BofA Funds Series Trust (11 funds); former Director, CNO Financial Group, Inc. (insurance), 2003-2011 | |
Annual Report 2016
36
COLUMBIA INTERNATIONAL OPPORTUNITIES FUND
TRUSTEES AND OFFICERS (continued)
Independent Trustees (continued)
Name,
Address,
Year of Birth | | Position Held With
the Funds and Length of
Service | | Principal Occupation(s)
During the Past Five Years
and Other Relevant
Professional Experience | | Number of
Funds in the
Columbia
Funds Complex
Overseen | | Other Directorships
Held by Trustee
During the Past
Five Years | |
Catherine James Paglia
901 S. Marquette Ave.
Minneapolis, MN 55402
1952 | | Trustee since 11/04 for RiverSource Funds and since 6/11 for Nations Funds | | Director, Enterprise Asset Management, Inc. (private real estate and asset management company) since September 1998; Managing Director and Partner, Interlaken Capital, Inc., 1989-1997; Managing Director, Morgan Stanley, 1982-1989; Vice President, Investment Banking, 1980-1982, Associate, Investment Banking, 1976-1980, Dean Witter Reynolds, Inc. | | | 124 | | | Director, Valmont Industries, Inc. (irrigation systems manufacturer) since 2012; Trustee, Carleton College (on the Investment Committee); Trustee, Carnegie Endowment for International Peace (on the Investment Committee) | |
Leroy C. Richie
901 S. Marquette Ave.
Minneapolis, MN 55402
1941 | | Trustee since 2000 for Seligman Funds, since 11/08 for RiverSource Funds and since 6/11 for Nations Funds | | Counsel, Lewis & Munday, P.C. (law firm) since 2004; Vice President and General Counsel, Automotive Legal Affairs, Chrysler Corporation, 1993-1997 | | | 122 | | | Lead Outside Director, Infinity Resources, Inc. (oil and gas exploration and production) since 1994; Lead Outside Director, Digital Ally, Inc. (digital imaging) since September 2005; Trustee, Marygrove College (Chair of Finance Committee) since 2007; former Director, OGE Energy Corp. (energy and energy services), 2007-2014 | |
Minor M. Shaw
901 S. Marquette Ave.
Minneapolis, MN 55402
1947 | | Trustee since 6/11 for RiverSource Funds and since 2003 for Nations Funds | | President, Micco LLC (private investments) since 2011; President, Micco Corp. (family investment business), 1998-2011 | | | 124 | | | Director, Piedmont Natural Gas; Director, BlueCross BlueShield of South Carolina since April 2008; Chair of the Duke Endowment; Director, National Association of Corporate Directors, Carolinas Chapter since 2013; Chair of Greenville — Spartanburg Airport Commission; former Trustee, BofA Funds Series Trust (11 funds), 2003-2011 | |
Alison Taunton-Rigby
901 S. Marquette Ave.
Minneapolis, MN 55402
1944 | | Trustee since 11/02 for RiverSource Funds and since 6/11 for Nations Funds | | Managing Director, Forester Biotech (consulting), 2001-2003; Chief Executive Officer and Director, RiboNovix, Inc., (biotechnology), 2003-2010; President and Chief Executive Officer of CMT Inc., 2001-2003; Aquila Biopharmaceuticals Inc., 1996-2000; Cambridge Biotech Corporation, 1995-1996; Mitotix Inc., 1993-1994 | | | 124 | | | Director, Abt Associates (government contractor) since 2001; Director, Boston Children's Hospital since 2002; Director, Healthways, Inc. (health and well-being solutions) since 2005; Director, ICI Mutual Insurance Company since 2011 | |
Annual Report 2016
37
COLUMBIA INTERNATIONAL OPPORTUNITIES FUND
TRUSTEES AND OFFICERS (continued)
Interested Trustee Not Affiliated with Investment Manager*
Name,
Address,
Year of Birth | | Position Held With
Funds and Length of
Service | | Principal Occupation(s)
During Past Five Years
and Other Relevant
Professional Experience | | Number of
Funds in the
Fund Family
Overseen by
Board Member | | Other Present or Past
Directorships/
Trusteeships
(Within Past 5 Years) | |
Anthony M. Santomero
901 S. Marquette Ave.
Minneapolis, MN 55402
1946 | | Trustee since 6/11 for RiverSource Funds and since 1/08 for Nations Funds | | Richard K. Mellon Professor Emeritus of Finance, The Wharton School, University of Pennsylvania since 2002; Senior Advisor, McKinsey & Company (consulting), 2006-2008; President, Federal Reserve Bank of Philadelphia, 2000-2006; Professor of Finance, The Wharton School, University of Pennsylvania, 1972-2002 | | | 122 | | | Trustee, Penn Mutual Life Insurance Company since March 2008; Director, Renaissance Reinsurance Ltd. since May 2008; Director, Citigroup Inc. since 2009; Director, Citibank, N.A. since 2009; former Trustee, BofA Funds Series Trust (11 funds), 2008-2011 | |
* Dr. Santomero is not an affiliated person of the Investment Manager or Ameriprise Financial. However, he is currently deemed by the Funds to be an "interested person" (as defined in the 1940 Act) of the Funds because he serves as a Director of Citigroup Inc. and Citibank, N.A., companies that may directly or through subsidiaries and affiliates engage from time-to-time in brokerage execution, principal transactions and lending relationships with the Funds or accounts advised/managed by the Investment Manager.
Annual Report 2016
38
COLUMBIA INTERNATIONAL OPPORTUNITIES FUND
TRUSTEES AND OFFICERS (continued)
Interested Trustee Affiliated with Investment Manager*
Name,
Address,
Year of Birth | | Position Held With
the Funds and Length of
Service | | Principal Occupation(s)
During Past Five Years
and Other Relevant
Professional Experience | | Number of
Funds in the
Columbia
Funds Complex
Overseen | | Other Directorships
Held by Trustee
During the Past
Five Years | |
William F. Truscott
c/o Columbia Management Investment Advisers, LLC,
225 Franklin St.
Boston, MA 02110
1960 | | Trustee since 11/01 for RiverSource Funds and since 6/11 for Nations Funds; Senior Vice President since 2002 for RiverSource Funds and since 5/10 for Nations Funds | | Chairman of the Board and President, Columbia Management Investment Advisers, LLC since May 2010 and February 2012, respectively (previously President and Chief Investment Officer, 2001-April 2010); Chief Executive Officer, Global Asset Management, Ameriprise Financial, Inc. since September 2012 (previously Chief Executive Officer, U.S. Asset Management & President, Annuities, May 2010-September 2012 and President — U.S. Asset Management and Chief Investment Officer, 2005-April 2010); Director and Chief Executive Officer, Columbia Management Investment Distributors, Inc. since May 2010 and February 2012, respectively (previously Chairman of the Board and Chief Executive Officer, 2006-April 2010); Chairman of the Board and Chief Executive Officer, RiverSource Distributors, Inc. since 2006; Director, Threadneedle Asset Management Holdings, SARL since 2014; President and Chief Executive Officer, Ameriprise Certificate Company, 2006-August 2012. | | | 182 | | | Chairman of the Board, Columbia Management Investment Advisers, LLC since May 2010; Director, Columbia Management Investment Distributors, Inc. since May 2010; Former Director, Ameriprise Certificate Company, 2006-January 2013 | |
* Interested person (as defined under the 1940 Act) by reason of being an officer, director, security holder and/or employee of the Investment Manager or Ameriprise Financial.
The Statement of Additional Information has additional information about the Fund's Board members and is available, without charge, upon request by calling 800.345.6611; contacting your financial intermediary; or visiting columbiathreadneedle.com/us.
Annual Report 2016
39
COLUMBIA INTERNATIONAL OPPORTUNITIES FUND
TRUSTEES AND OFFICERS (continued)
The Board has appointed officers who are responsible for day-to-day business decisions based on policies it has established. The officers serve at the pleasure of the Board. The following table provides basic information about the Officers of the Fund, including principal occupations during the past five years, although their specific titles may have varied over the period. In addition to Mr. Truscott, who is Senior Vice President, the Fund's other officers are:
Fund Officers
Name,
Address and
Year of Birth | | Position and Year
First Appointed to
Position for any Fund
in the Columbia
Funds Complex or a
Predecessor Thereof | | Principal Occupation(s) During Past Five Years | |
Christopher O. Petersen
5228 Ameriprise
Financial Center
Minneapolis, MN 55474
Born 1970 | | President and Principal Executive Officer (2015) | | Vice President and Lead Chief Counsel, Ameriprise Financial, Inc. since January 2015 (previously, Vice President and Chief Counsel January 2010-December 2014; and Vice President and Group Counsel or Counsel 2004-January 2010); officer of Columbia Funds and affiliated funds since 2007. | |
Michael G. Clarke
225 Franklin Street
Boston, MA 02110
Born 1969 | | Treasurer (2011), Chief Financial Officer (2009) and Chief Accounting Officer (2015) | | Vice President — Mutual Fund Administration, Columbia Management Investment Advisers, LLC, since May 2010; Managing Director of Fund Administration, Columbia Management Advisors, LLC, September 2004-April 2010; senior officer of Columbia Funds and affiliated funds since 2002. | |
Paul B. Goucher
100 Park Avenue
New York, NY 10017
Born 1968 | | Senior Vice President (2011), Chief Legal Officer (2015) and Assistant Secretary (2008) | | Vice President and Lead Chief Counsel, Ameriprise Financial, Inc. since November 2008 and January 2013, respectively (previously Chief Counsel, January 2010-January 2013 and Group Counsel, November 2008-January 2010). | |
Thomas P. McGuire
225 Franklin Street
Boston, MA 02110
Born 1972 | | Senior Vice President and Chief Compliance Officer (2012) | | Vice President — Asset Management Compliance, Ameriprise Financial, Inc., since May 2010; Chief Compliance Officer, Ameriprise Certificate Company since September 2010; Compliance Executive, Bank of America, 2005-April 2010. | |
Colin Moore
225 Franklin Street
Boston, MA 02110
Born 1958 | | Senior Vice President (2010) | | Executive Vice President and Global Chief Investment Officer, Ameriprise Financial, Inc., since July 2013; Director and Global Chief Investment Officer, Columbia Management Investment Advisers, LLC since May 2010; Manager, Managing Director and Chief Investment Officer, Columbia Management Advisors, LLC, 2007-April 2010. | |
Michael E. DeFao
225 Franklin Street
Boston, MA 02110
Born 1968 | | Vice President (2011) and Assistant Secretary (2010) | | Vice President and Chief Counsel, Ameriprise Financial, Inc. since May 2010; Associate General Counsel, Bank of America, 2005-April 2010. | |
Amy Johnson
5228 Ameriprise
Financial Center
Minneapolis, MN 55474
Born 1965 | | Vice President (2006) | | Managing Director and Chief Operating Officer, Columbia Management Investment Advisers, LLC since May 2010 (previously Chief Administrative Officer, 2009-April 2010, and Vice President — Asset Management and Trust Company Services, 2006-2009). | |
Lyn Kephart-Strong
5228 Ameriprise
Financial Center
Minneapolis, MN 55474
Born 1960 | | Vice President (2015) | | President, Columbia Management Investment Services Corp. since October 2014; Vice President & Resolution Officer, Ameriprise Trust Company since August 2009; President, RiverSource Service Corporation 2004-2010. | |
Ryan C. Larrenaga
225 Franklin Street
Boston, MA 02110
Born 1970 | | Vice President and Secretary (2015) | | Vice President and Group Counsel, Ameriprise Financial, Inc. since August 2011 (previously, Counsel from May 2010 to August 2011); Assistant General Counsel, Bank of America, 2005-April 2010; officer of Columbia Funds and affiliated funds since 2005. | |
Annual Report 2016
40
COLUMBIA INTERNATIONAL OPPORTUNITIES FUND
IMPORTANT INFORMATION ABOUT THIS REPORT
Each fund mails one shareholder report to each shareholder address. If you would like more than one report, please call shareholder services at 800.345.6611 and additional reports will be sent to you.
The policy of the Board is to vote the proxies of the companies in which each fund holds investments consistent with the procedures as stated in the Statement of Additional Information (SAI). You may obtain a copy of the SAI without charge by calling 800.345.6611; contacting your financial intermediary; visiting columbiathreadneedle.com/us; or searching the website of the Securities and Exchange Commission (SEC) at sec.gov. Information regarding how each fund voted proxies relating to portfolio securities is filed with the SEC by August 31st for the most recent 12-month period ending June 30th of that year, and is available without charge by visiting columbiathreadneedle.com/us, or searching the website of the SEC at sec.gov.
Each fund files a complete schedule of portfolio holdings with the SEC for the first and third quarters of each fiscal year on Form N-Q. Each fund's Form N-Q is available on the SEC's website at sec.gov and may be reviewed and copied at the SEC's Public Reference Room in Washington, D.C. Information on the operation of the Public Reference Room may be obtained by calling 800.SEC.0330. Each fund's complete schedule of portfolio holdings, as filed on Form N-Q, can also be obtained without charge, upon request, by calling 800.345.6611.
Annual Report 2016
41
Columbia International Opportunities Fund
P.O. Box 8081
Boston, MA 02266-8081

This information is for use with concurrent or prior delivery of a fund prospectus. Please read and consider the investment objectives, risks, charges and expenses for any fund carefully before investing. For a prospectus and summary prospectus, which contains this and other important information about the Fund, go to columbiathreadneedle.com/us. The Fund is distributed by Columbia Management Investment Distributors, Inc., member FINRA, and managed by Columbia Management Investment Advisers, LLC.
Columbia Threadneedle Investments (Columbia Threadneedle) is the global brand name of the Columbia and Threadneedle group of companies.
All rights reserved. Columbia Management Investment Distributors, Inc., 225 Franklin Street, Boston, MA 02110-2804
© 2016 Columbia Management Investment Advisers, LLC.
columbiathreadneedle.com/us
ANN189_02_F01_(04/16)

ANNUAL REPORT
February 29, 2016

COLUMBIA INTERNATIONAL VALUE FUND

ABOUT COLUMBIA THREADNEEDLE INVESTMENTS
Columbia Threadneedle Investments is a leading global asset management group that provides a broad range of actively managed investment strategies and solutions for individual, institutional and corporate clients around the world.
With more than 2,000 people, including over 450 investment professionals based in North America, Europe and Asia, we manage $472 billion* of assets across developed and emerging market equities, fixed income, asset allocation solutions and alternatives. We are the 13th largest manager of long-term mutual fund assets in the U.S.** and the 4th largest manager of retail funds in the U.K.***
Our priority is the investment success of our clients. We aim to deliver the investment outcomes they expect through an investment approach that is team-based, performance-driven and risk-aware. Our culture is dynamic and interactive. By sharing our insights across asset classes and geographies, we generate richer perspectives on global, regional and local investment landscapes. The ability to exchange and debate investment ideas in a collaborative environment enriches our teams' investment processes. More importantly, it results in better informed investment decisions for our clients.
Columbia funds are distributed by Columbia Management Investment Distributors, Inc., member FINRA, and managed by Columbia Management Investment Advisers, LLC.
Columbia Threadneedle Investments (Columbia Threadneedle) is the global brand name of the Columbia and Threadneedle group of companies.
* In U.S. dollars as of December 31, 2015. Source: Ameriprise Q4 Earnings Release. Includes all assets managed by entities in the Columbia and Threadneedle groups of companies. Contact us for more current data.
** Source: ICI as of December 31, 2015 for Columbia Management Investment Advisers, LLC.
*** Source: Investment Association as of September 2015 for Threadneedle Asset Management Limited.
© 2016 Columbia Management Investment Advisers, LLC. All rights reserved.
Not part of the shareholder report
Investment strategies to help meet investor needs
We are committed to helping investors navigate financial challenges to reach their desired outcomes. The possibilities are endless.
Your success is our priority.
Retire comfortably
Fund college or higher education
Leave a legacy
Generate an appropriate stream of income in retirement
Traditional approaches to income may no longer be adequate — and they may no longer provide the diversification benefits they once did. Investors need to rethink how they generate retirement income.
Worried about running out of income? You are not alone.
Navigate a changing interest rate environment
Even in today's challenging interest rate environment, it's still possible to navigate markets and achieve your goals.
Make investment choices designed specifically for this market environment.
Maximize after-tax returns
In an environment where what you keep is more important than what you earn, municipal bonds can help mitigate higher taxes while providing attractive yields compared to other investment options.
You've worked too hard building your wealth to lose it to taxes.
Grow assets to achieve financial goals
Finding growth opportunities in today's complex market environment requires strong research capabilities, creative thinking and a disciplined approach.
Do your investments deliver the portfolio growth you need?
Ease the impact of volatile markets
With increasing concerns about market volatility, investors should consider diversifying their portfolios with non-traditional holdings.
Interested in turning volatility into opportunity?
To find out more, contact your financial professional, call 800.426.3750 or visit columbiathreadneedle.com/us
Not part of the shareholder report
Get the market insight you need from our investment experts and subscribe to our latest publications


Stay informed with Columbia Threadneedle Investments
Investor insight
Find economic and market commentary, investment videos, white papers, mutual fund commentary and more at columbiathreadneedle.com/us.
Subscribe to the latest information from Columbia Threadneedle. Register your information online at columbiathreadneedle.com/us/subscribe and select the publications you would like to receive, including:
n Columbia Threadneedle Investor Newsletter, highlighting the latest macro- and micro-economic trends, investment themes, products, service changes and other items of interest to our investors
n Investment Strategy Outlook, showcasing the Columbia Threadneedle Asset Allocation Team's perspective on global economic investment conditions and markets
n MarketTrack, featuring straightforward insight on current investment opportunities
n White papers that delve deep into a variety of investment topics
n Quarterly portfolio manager commentary and fund fact sheets
Update your subscriptions at any time by accessing the email subscription center.
Social media 
We offer you multiple ways to access our market commentary and investment insights.
n Perspectives blog at columbiathreadneedle.com/us
Read timely posts by our investment team, including our chief investment officer, chief economist and portfolio managers.
n Twitter.com/CTinvest_US
Follow us on Twitter for quick, up-to-the-minute comments on market news and more.
n Youtube.com/CTInvestUS
View our commentaries on the economy, markets and current investment opportunities.
n Linkedin.com/company/Columbia-Threadneedle-Investments-US
Connect with us on LinkedIn for updates from our thought leaders.
Not part of the shareholder report
 Dear Shareholder,
Today's investors are typically focused on outcomes, like living a certain retirement lifestyle, paying for college education or building a legacy. But in today's complex global investment landscape, even simple goals are not easily achieved.
At Columbia Threadneedle Investments, we aspire to help satisfy five core needs of today's investors:
n Generate an appropriate stream of income in retirement
Traditional approaches to generating income may not provide the diversification benefits they once did, and they may actually introduce unwanted risk in today's market. To seek to improve your potential to live comfortably long term, we endeavor to pursue investments that explore less traveled paths to income.
n Navigate a changing interest rate environment
Today's uncertain market environment includes the prospect of a rise in interest rates. Blending traditional investments with non-traditional or alternative products may help protect your wealth during periods of volatility. We can attempt to help strengthen your portfolio with agile products designed to take on the market's ups and downs.
n Maximize after-tax returns
In an environment where what you keep may be more important than what you earn, municipal bonds can help mitigate high tax burdens while providing potentially attractive yields. Our state and federal tax-exempt products are aimed at helping investors manage risk, minimize the fluctuation of capital and grow wealth on a more tax-efficient basis.
n Grow assets to achieve financial goals
We believe that finding and protecting growth comes from a disciplined security selection process designed to create excess return. Our goal is to provide investment solutions built to help you face today's market challenges and grow your assets at each crossroad of your journey.
n Ease the impact of volatile markets
Despite a bull market run that has benefited many investors over the past several years, it's important to remember the lessons of 2008 and the value that a well-diversified portfolio may provide through times of market volatility. We are here to help you hold onto the savings you have worked tirelessly to amass, and to provide you the best opportunity to maintain your standard of living regardless of market conditions.
Find out today how we can help you confidently invest to realize your dreams. Please visit us at blog.columbiathreadneedleus.com/our-best-ideas to learn more about our unique investment solutions.
The world is constantly changing, but our priority remains the same: to help you secure your finances, meet your goals and achieve success. Thank you for your continued investment with us.
Sincerely,

Christopher O. Petersen
President, Columbia Funds
Investors should consider the investment objectives, risks, charges and expenses of a mutual fund carefully before investing. For a free prospectus and summary prospectus, which contains this and other important information about a fund, visit columbiathreadneedle.com/us. The prospectus should be read carefully before investing.
Columbia Funds are distributed by Columbia Management Investment Distributors, Inc., member FINRA, and managed by Columbia Management Investment Advisers, LLC.
© 2016 Columbia Management Investment Advisers, LLC. All rights reserved.
COLUMBIA INTERNATIONAL VALUE FUND
Fund Investment Manager
Columbia Management Investment
Advisers, LLC
225 Franklin Street
Boston, MA 02110
Fund Distributor
Columbia Management Investment
Distributors, Inc.
225 Franklin Street
Boston, MA 02110
Fund Transfer Agent
Columbia Management Investment
Services Corp.
P.O. Box 8081
Boston, MA 02266-8081
For more information about any of the funds, please visit columbiathreadneedle.com/us or call 800.345.6611. Customer Service Representatives are available to answer your questions Monday through Friday from 8 a.m. to 7 p.m. Eastern time.
The views expressed in this report reflect the current views of the respective parties. These views are not guarantees of future performance and involve certain risks, uncertainties and assumptions that are difficult to predict, so actual outcomes and results may differ significantly from the views expressed. These views are subject to change at any time based upon economic, market or other conditions and the respective parties disclaim any responsibility to update such views. These views may not be relied on as investment advice and, because investment decisions for a Columbia fund are based on numerous factors, may not be relied on as an indication of trading intent on behalf of any particular Columbia fund. References to specific securities should not be construed as a recommendation or investment advice.
Performance Overview | | | 3 | | |
Manager Discussion of Fund Performance | | | 5 | | |
Understanding Your Fund's Expenses | | | 8 | | |
Portfolio of Investments | | | 9 | | |
Statement of Assets and Liabilities | | | 15 | | |
Statement of Operations | | | 17 | | |
Statement of Changes in Net Assets | | | 18 | | |
Financial Highlights | | | 20 | | |
Notes to Financial Statements | | | 28 | | |
Report of Independent Registered Public Accounting Firm | | | 39 | | |
Federal Income Tax Information | | | 40 | | |
Trustees and Officers | | | 41 | | |
Important Information About This Report | | | 47 | | |
COLUMBIA INTERNATIONAL VALUE FUND
Performance Summary
n Columbia International Value Fund (the Fund) Class A shares returned -12.08% excluding sales charges for the 12-month period that ended February 29, 2016.
n In a difficult period for stock markets around the world, the Fund held up better than its benchmark, the MSCI EAFE Value Index (Net), which returned -19.82% for the same period.
n Stock selection across countries and sectors generally accounted for the Fund's performance advantage relative to the benchmark.
Average Annual Total Returns (%) (for period ended February 29, 2016)
| | | Inception | | 1 Year | | 5 Years | | 10 Years | |
Class A | | 12/27/95 | | | | | | | | | | | | | |
Excluding sales charges | | | | | | | -12.08 | | | | -0.15 | | | | 1.07 | | |
Including sales charges | | | | | | | -17.12 | | | | -1.32 | | | | 0.48 | | |
Class B | | 05/22/98 | | | | | | | | | | | | | |
Excluding sales charges | | | | | | | -12.77 | | | | -0.91 | | | | 0.33 | | |
Including sales charges | | | | | | | -17.08 | | | | -1.25 | | | | 0.33 | | |
Class C | | 06/15/98 | | | | | | | | | | | | | |
Excluding sales charges | | | | | | | -12.82 | | | | -0.92 | | | | 0.31 | | |
Including sales charges | | | | | | | -13.68 | | | | -0.92 | | | | 0.31 | | |
Class I* | | 09/27/10 | | | -11.78 | | | | -0.49 | | | | 0.92 | | |
Class R* | | 09/27/10 | | | -12.36 | | | | -0.43 | | | | 0.79 | | |
Class R4* | | 11/08/12 | | | -11.93 | | | | 0.02 | | | | 1.16 | | |
Class R5* | | 11/08/12 | | | -11.77 | | | | 0.09 | | | | 1.19 | | |
Class Z | | 12/27/95 | | | -11.91 | | | | 0.08 | | | | 1.32 | | |
MSCI EAFE Value Index (Net) | | | | | | | -19.82 | | | | -1.12 | | | | 0.23 | | |
Returns for Class A are shown with and without the maximum initial sales charge of 5.75%. Returns for Class B are shown with and without the applicable contingent deferred sales charge (CDSC) of 5.00% in the first year, declining to 1.00% in the sixth year and eliminated thereafter. Returns for Class C are shown with and without the 1.00% CDSC for the first year only. The Fund's other classes are not subject to sales charges and have limited eligibility. Please see the Fund's prospectus for details. Performance for different share classes will vary based on differences in sales charges and fees associated with each class. All results shown assume reinvestment of distributions during the period. Returns do not reflect the deduction of taxes that a shareholder may pay on Fund distributions or on the redemption of Fund shares. Performance results reflect the effect of any fee waivers or reimbursements of Fund expenses by Columbia Management Investment Advisers, LLC and/or any of its affiliates. Absent these fee waivers or expense reimbursement arrangements, performance results would have been lower.
The performance information shown represents past performance and is not a guarantee of future results. The investment return and principal value of your investment will fluctuate so that your shares, when redeemed, may be worth more or less than their original cost. Current performance may be lower or higher than the performance information shown. You may obtain performance information current to the most recent month-end by contacting your financial intermediary, visiting columbiathreadneedle.com/us or calling 800.345.6611.
*The returns shown for periods prior to the share class inception date (including returns for the Life of the Fund, if shown, which are since Fund inception) include the returns of the Fund's oldest share class. Since the Fund launched more than one share class at its inception, Class A shares were used. These returns are adjusted to reflect any higher class-related operating expenses of the newer share classes, as applicable. Please visit columbiathreadneedle.com/us/investment-products/mutual-funds/appended-performance for more information.
The MSCI EAFE Value Index (Net) is a subset of the MSCI EAFE Index (Net), and constituents of the index include securities from Europe, Australasia and the Far East. The index generally represents approximately 50% of the free float-adjusted market capitalization of the MSCI EAFE Index (Net), and consists of those securities classified by MSCI Inc. as most representing the value style, such as, higher book value-to-price ratios, higher forward earnings-to-price ratios, higher dividend yields and lower forecasted growth rates than securities representing the growth style.
Indices are not available for investment, are not professionally managed and do not reflect sales charges, fees, brokerage commissions, taxes (except the MSCI EAFE Value Index (Net), which reflects reinvested dividends net of withholding taxes) or other expenses of investing. Securities in the Fund may not match those in an index.
Annual Report 2016
3
COLUMBIA INTERNATIONAL VALUE FUND
PERFORMANCE OVERVIEW (continued)
Performance of a Hypothetical $10,000 Investment (March 1, 2006 – February 29, 2016)
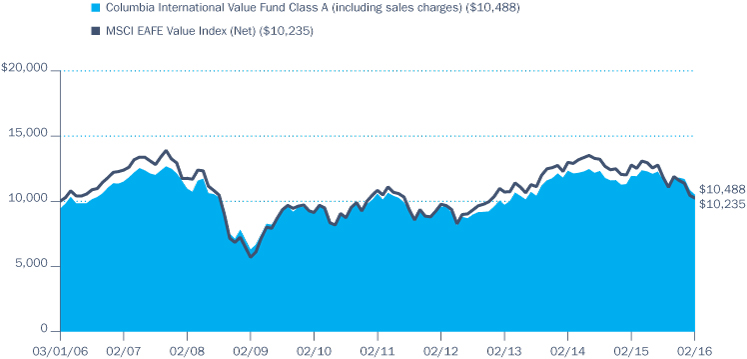
The chart above shows the change in value of a hypothetical $10,000 investment in Class A shares of Columbia International Value Fund during the stated time period, and does not reflect the deduction of taxes that a shareholder may pay on Fund distributions or on the redemption of Fund shares.
Annual Report 2016
4
COLUMBIA INTERNATIONAL VALUE FUND
MANAGER DISCUSSION OF FUND PERFORMANCE
For the 12-month period that ended February 29, 2016, the Fund's Class A shares returned -12.08% excluding sales charges. In a difficult period for stock markets around the world, the Fund held up better than its benchmark, the MSCI EAFE Value Index (Net), which returned -19.82% for the same period. Stock selection across countries and sectors heavily weighted in the portfolio generally accounted for the Fund's performance advantage relative to the benchmark.
Market Concerns Weighed on Global Stock Markets
Equity markets in developed countries outside the United States began the 12-month period with modestly positive performance against a favorable backdrop of improving growth across Europe and Japan. Oil's dramatic price decline, which began in the second half of 2014, provided a boost to importing countries and weaker currencies helped the export segment of the market. These tailwinds were more than sufficient to overcome concerns about Greek solvency, civil war in the Ukraine and unrest in the Middle East. However, international markets began a sharp, volatile and sustained drop midway through the period as tensions in Greece continued, commodity prices plummeted and slow global growth drove investor uncertainty. Many sovereign bonds traded at negative yields, an aberration that was considered symptomatic of deep underlying instability in the global financial system. Despite a brief rally in the fourth quarter of 2015, international equities finished the period down sharply as the weight of these concerns dampened market sentiment. Of the 21 developed markets in the MSCI EAFE Index, only Denmark and Israel posted modest positive returns, as measured in U.S. dollars. International growth stocks held up better during the period, finishing down only about half as much as international value stocks, in large part because the value segment has more exposure to consumer staples stocks, which lagged, and less exposure to financials, which performed strongly.
Contributors and Detractors
Security selection was especially strong in the United Kingdom and Japan, which together constitute nearly half of the Fund's benchmark, as well as in a number of European countries that collectively account for an additional 20% of the benchmark. Stock selection was decidedly positive in nine of 10 economic sectors. From a sector perspective, top contributors included information technology, financials, consumer discretionary, industrials and telecommunication services. Top-performing securities during the period included Paysafe Group, a U.K.-based online payment processing and money transfer provider that rose based on the successful acquisition of a digital payments business, strong results and solid growth forecasts; Bezeq Israel Telecommunication Corp., a Tel Aviv-based telecommunications services provider that was rewarded by investors primarily for strong dividend growth; and Daiichikosho, a Tokyo-based provider of commercial karaoke equipment, which rose strongly after forecasting an increased dividend. All three stocks were held by the Fund at period end, although we modestly trimmed position sizes in keeping with our risk-management process.
Portfolio Management
Fred Copper, CFA
Daisuke Nomoto, CMA (SAAJ)
Morningstar Style BoxTM

The Morningstar Style BoxTM is based on a fund's portfolio holdings. For equity funds, the vertical axis shows the market capitalization of the stocks owned, and the horizontal axis shows investment style (value, blend, or growth). Information shown is based on the most recent data provided by Morningstar.
© 2016 Morningstar, Inc. All rights reserved. The Morningstar information contained herein: (1) is proprietary to Morningstar and/or its content providers; (2) may not be copied or distributed; and (3) is not warranted to be accurate, complete or timely. Neither Morningstar nor its content providers are responsible for any damages or losses arising from any use of this information.
Top Ten Holdings (%)
(at February 29, 2016) | |
Royal Dutch Shell PLC, Class B
(United Kingdom) | | | 3.9 | | |
Sanofi (France) | | | 2.5 | | |
iShares MSCI EAFE ETF
(United States) | | | 2.3 | | |
HSBC Holdings PLC
(United Kingdom) | | | 2.1 | | |
Allianz SE, Registered Shares
(Germany) | | | 2.1 | | |
BNP Paribas SA (France) | | | 2.0 | | |
AXA SA (France) | | | 2.0 | | |
ING Groep NV-CVA
(Netherlands) | | | 1.9 | | |
Paysafe Group PLC
(United Kingdom) | | | 1.7 | | |
Iberdrola SA (Spain) | | | 1.7 | | |
Percentages indicated are based upon total investments (excluding Money Market Funds).
Annual Report 2016
5
COLUMBIA INTERNATIONAL VALUE FUND
MANAGER DISCUSSION OF FUND PERFORMANCE (continued)
For further detail about these holdings, please refer to the section entitled "Portfolio of Investments."
Fund holdings are as of the date given, are subject to change at any time, and are not recommendations to buy or sell any security.
Country Breakdown (%)
(at February 29, 2016) | |
Australia | | | 1.6 | | |
Belgium | | | 1.2 | | |
China | | | 1.7 | | |
Denmark | | | 0.8 | | |
France | | | 10.8 | | |
Germany | | | 5.4 | | |
Hong Kong | | | 1.0 | | |
Ireland | | | 1.0 | | |
Israel | | | 1.3 | | |
Italy | | | 2.1 | | |
Japan | | | 24.2 | | |
Netherlands | | | 2.9 | | |
Norway | | | 5.7 | | |
Pakistan | | | 0.7 | | |
Portugal | | | 0.0 | (a) | |
Singapore | | | 1.5 | | |
South Korea | | | 1.7 | | |
Spain | | | 4.4 | | |
Sweden | | | 3.3 | | |
Switzerland | | | 5.1 | | |
United Kingdom | | | 17.9 | | |
United States(b) | | | 5.7 | | |
Total | | | 100.0 | | |
Country Breakdown is based primarily on issuer's place of organization/incorporation. Percentages indicated are based upon total investments. The Fund's portfolio composition is subject to change.
(a) Rounds to zero.
(b) Includes investments in Money Market Funds and Exchange — Traded Funds.
Holdings in the United States, France and Singapore detracted from results, with the most significant disappointments in health care, utilities and consumer staples. Country and sector exposures reflect the Fund's bottom-up stock selection process more so than readily identifiable country- or sector-wide themes. Key individual detractors included Casino Guichard-Perrachon, Plus500 and BHP Billiton. Casino Guichard-Perrachon, a global food retailer based in France, fell as investors questioned its deleveraging plan and future growth prospects in various emerging markets. We maintained our conviction in the company and increased Fund exposure to the stock. Late in the period and after the stock had dropped as the result of operational issues, the Fund established a position in Plus500, an Israel-based online trading platform operating primarily in the United Kingdom. We maintained a small position in Plus500 based on our belief that the company had adequately addressed the issues. BHP Billiton, a London-based mining company, fell in concert with the global downturn in commodities, including copper and iron ore. We maintained our conviction in the company and increased exposure to the stock.
Fund Positioning at Period's End
Although certain stocks may be categorized as growth based on commonly accepted metrics, we believe it is possible to find these stocks at times when they are attractively priced. Even though the Fund benefited from this strategic aspect of our investment process, it maintained its categorization as a value portfolio by external evaluators, such as Morningstar. In terms of positioning, the Fund ended the period with slightly more exposure to energy, materials and technology stocks.
Annual Report 2016
6
COLUMBIA INTERNATIONAL VALUE FUND
MANAGER DISCUSSION OF FUND PERFORMANCE (continued)
Equity Sector Breakdown (%)
(at February 29, 2016) | |
Consumer Discretionary | | | 12.2 | | |
Consumer Staples | | | 4.1 | | |
Energy | | | 9.7 | | |
Financials | | | 32.1 | | |
Health Care | | | 10.4 | | |
Industrials | | | 8.6 | | |
Information Technology | | | 7.7 | | |
Materials | | | 5.0 | | |
Telecommunication Services | | | 6.8 | | |
Utilities | | | 3.4 | | |
Total | | | 100.0 | | |
Percentages indicated are based upon total equity investments. The Fund's portfolio composition is subject to change.
Investment Risks
Market risk may affect a single issuer, sector of the economy, industry or the market as a whole. Value securities may be unprofitable if the market fails to recognize their intrinsic worth or the portfolio manager misgauged that worth. International investing involves certain risks and volatility due to potential political, economic or currency instabilities and different financial and accounting standards. Risks are enhanced for emerging market issuers. Investing in derivatives is a specialized activity that involves special risks that subject the Fund to significant loss potential, including when used as leverage, and may result in greater fluctuation in Fund value. See the Fund's prospectus for more information on these and other risks.
Annual Report 2016
7
COLUMBIA INTERNATIONAL VALUE FUND
UNDERSTANDING YOUR FUND'S EXPENSES
(Unaudited)
As an investor, you incur two types of costs. There are transaction costs, which generally include sales charges on purchases and may include redemption fees. There are also ongoing costs, which generally include management fees, distribution and/or service fees, and other fund expenses. The following information is intended to help you understand your ongoing costs (in dollars) of investing in the Fund and to help you compare these costs with the ongoing costs of investing in other mutual funds.
Analyzing Your Fund's Expenses
To illustrate these ongoing costs, we have provided examples and calculated the expenses paid by investors in each share class of the Fund during the period. The actual and hypothetical information in the table is based on an initial investment of $1,000 at the beginning of the period indicated and held for the entire period. Expense information is calculated two ways and each method provides you with different information. The amount listed in the "Actual" column is calculated using the Fund's actual operating expenses and total return for the period. You may use the Actual information, together with the amount invested, to estimate the expenses that you paid over the period. Simply divide your account value by $1,000 (for example, an $8,600 account value divided by $1,000 = 8.6), then multiply the results by the expenses paid during the period under the "Actual" column. The amount listed in the "Hypothetical" column assumes a 5% annual rate of return before expenses (which is not the Fund's actual return) and then applies the Fund's actual expense ratio for the period to the hypothetical return. You should not use the hypothetical account values and expenses to estimate either your actual account balance at the end of the period or the expenses you paid during the period. See "Compare With Other Funds" below for details on how to use the hypothetical data.
Compare With Other Funds
Since all mutual funds are required to include the same hypothetical calculations about expenses in shareholder reports, you can use this information to compare the ongoing cost of investing in the Fund with other funds. To do so, compare the hypothetical example with the 5% hypothetical examples that appear in the shareholder reports of other funds. As you compare hypothetical examples of other funds, it is important to note that hypothetical examples are meant to highlight the ongoing costs of investing in a fund only and do not reflect any transaction costs, such as sales charges, or redemption or exchange fees. Therefore, the hypothetical calculations are useful in comparing ongoing costs only, and will not help you determine the relative total costs of owning different funds. If transaction costs were included in these calculations, your costs would be higher.
September 1, 2015 – February 29, 2016
| | | Account Value at the Beginning
of the Period ($) | | Account Value at the End of the
Period ($) | | Expenses Paid During the
Period ($) | | Fund's Annualized
Expense Ratio (%) | |
| | | Actual | | Hypothetical | | Actual | | Hypothetical | | Actual | | Hypothetical | | Actual | |
Class A | | | 1,000.00 | | | | 1,000.00 | | | | 906.40 | | | | 1,017.60 | | | | 6.92 | | | | 7.32 | | | | 1.46 | | |
Class B | | | 1,000.00 | | | | 1,000.00 | | | | 902.80 | | | | 1,013.87 | | | | 10.46 | | | | 11.07 | | | | 2.21 | | |
Class C | | | 1,000.00 | | | | 1,000.00 | | | | 902.40 | | | | 1,013.87 | | | | 10.45 | | | | 11.07 | | | | 2.21 | | |
Class I | | | 1,000.00 | | | | 1,000.00 | | | | 907.80 | | | | 1,019.84 | | | | 4.79 | | | | 5.07 | | | | 1.01 | | |
Class R | | | 1,000.00 | | | | 1,000.00 | | | | 905.10 | | | | 1,016.36 | | | | 8.10 | | | | 8.57 | | | | 1.71 | | |
Class R4 | | | 1,000.00 | | | | 1,000.00 | | | | 907.00 | | | | 1,018.85 | | | | 5.74 | | | | 6.07 | | | | 1.21 | | |
Class R5 | | | 1,000.00 | | | | 1,000.00 | | | | 907.90 | | | | 1,019.49 | | | | 5.12 | | | | 5.42 | | | | 1.08 | | |
Class Z | | | 1,000.00 | | | | 1,000.00 | | | | 906.80 | | | | 1,018.85 | | | | 5.74 | | | | 6.07 | | | | 1.21 | | |
Expenses paid during the period are equal to the annualized expense ratio for each class as indicated above, multiplied by the average account value over the period and then multiplied by the number of days in the Fund's most recent fiscal half year and divided by 366.
Expenses do not include fees and expenses incurred indirectly by the Fund from its investment in underlying funds, including affiliated and non-affiliated pooled investment vehicles, such as mutual funds and exchange-traded funds.
Had Columbia Management Investment Advisers, LLC and/or certain of its affiliates not waived/reimbursed certain fees and expenses, account value at the end of the period would have been reduced.
Annual Report 2016
8
COLUMBIA INTERNATIONAL VALUE FUND
PORTFOLIO OF INVESTMENTS
February 29, 2016
(Percentages represent value of investments compared to net assets)
Common Stocks 97.2%
Issuer | | Shares | | Value ($) | |
AUSTRALIA 1.6% | |
Macquarie Group Ltd. | | | 20,570 | | | | 939,740 | | |
National Australia Bank Ltd. | | | 96,992 | | | | 1,668,287 | | |
Total | | | | | 2,608,027 | | |
BELGIUM 1.2% | |
KBC Groep NV | | | 37,225 | | | | 1,971,280 | | |
CHINA 1.7% | |
58.Com, Inc., ADR(a) | | | 20,940 | | | | 1,109,820 | | |
Tencent Holdings Ltd. | | | 90,700 | | | | 1,659,585 | | |
Total | | | | | 2,769,405 | | |
DENMARK 0.8% | |
Novo Nordisk A/S, Class B | | | 24,463 | | | | 1,259,469 | | |
FRANCE 10.8% | |
Aperam SA(a) | | | 51,849 | | | | 1,761,098 | | |
AXA SA | | | 148,580 | | | | 3,266,760 | | |
BNP Paribas SA | | | 70,815 | | | | 3,302,603 | | |
Casino Guichard Perrachon SA | | | 23,423 | | | | 1,054,549 | | |
CNP Assurances | | | 57,428 | | | | 849,274 | | |
Sanofi | | | 51,593 | | | | 4,088,142 | | |
Total SA | | | 26,947 | | | | 1,207,777 | | |
VINCI SA | | | 30,475 | | | | 2,104,948 | | |
Total | | | | | 17,635,151 | | |
GERMANY 5.4% | |
Allianz SE, Registered Shares | | | 22,596 | | | | 3,351,599 | | |
BASF SE | | | 15,741 | | | | 1,020,615 | | |
Continental AG | | | 7,816 | | | | 1,555,676 | | |
Duerr AG | | | 22,317 | | | | 1,319,661 | | |
Freenet AG | | | 33,972 | | | | 1,009,294 | | |
RWE AG | | | 51,769 | | | | 586,627 | | |
Total | | | | | 8,843,472 | | |
HONG KONG 1.0% | |
CK Hutchison Holdings Ltd. | | | 138,000 | | | | 1,663,848 | | |
IRELAND 1.0% | |
Amarin Corp. PLC, ADR(a) | | | 177,530 | | | | 259,194 | | |
Smurfit Kappa Group PLC | | | 61,255 | | | | 1,412,851 | | |
Total | | | | | 1,672,045 | | |
Common Stocks (continued)
Issuer | | Shares | | Value ($) | |
ISRAEL 1.4% | |
Bezeq Israeli Telecommunication
Corp., Ltd. (The) | | | 973,472 | | | | 2,182,398 | | |
ITALY 2.1% | |
Ei Towers SpA | | | 41,047 | | | | 2,266,502 | | |
Esprinet SpA | | | 133,440 | | | | 1,199,767 | | |
Total | | | | | 3,466,269 | | |
JAPAN 24.2% | |
Alps Electric Co., Ltd. | | | 35,600 | | | | 584,215 | | |
Aozora Bank Ltd. | | | 312,000 | | | | 1,016,506 | | |
CyberAgent, Inc. | | | 44,948 | | | | 1,844,648 | | |
CYBERDYNE, Inc.(a) | | | 21,300 | | | | 364,214 | | |
Daiichikosho Co., Ltd. | | | 64,300 | | | | 2,689,321 | | |
Eisai Co., Ltd. | | | 14,400 | | | | 887,576 | | |
Fuji Heavy Industries Ltd. | | | 61,500 | | | | 2,012,085 | | |
Hoya Corp. | | | 39,100 | | | | 1,412,948 | | |
Invincible Investment Corp. | | | 1,406 | | | | 924,537 | | |
ITOCHU Corp. | | | 157,600 | | | | 1,857,978 | | |
KDDI Corp. | | | 87,200 | | | | 2,227,786 | | |
Keyence Corp. | | | 2,700 | | | | 1,395,475 | | |
LaSalle Logiport REIT(a) | | | 1,112 | | | | 1,035,519 | | |
Mitsubishi UFJ Financial Group, Inc. | | | 504,231 | | | | 2,175,913 | | |
Nakanishi, Inc. | | | 33,700 | | | | 1,170,324 | | |
Nihon M&A Center, Inc. | | | 32,300 | | | | 1,528,565 | | |
Nippon Telegraph & Telephone Corp. | | | 55,800 | | | | 2,362,980 | | |
Nishi-Nippon City Bank Ltd. (The) | | | 487,000 | | | | 879,972 | | |
ORIX Corp. | | | 174,400 | | | | 2,283,055 | | |
Relo Holdings, Inc. | | | 10,700 | | | | 1,311,572 | | |
Shinmaywa Industries Ltd. | | | 245,000 | | | | 1,735,370 | | |
Sony Corp. | | | 50,300 | | | | 1,057,030 | | |
Sumitomo Mitsui Financial Group, Inc. | | | 56,442 | | | | 1,583,773 | | |
Takuma Co., Ltd. | | | 32,923 | | | | 287,660 | | |
Tanseisha Co., Ltd. | | | 169,750 | | | | 1,007,592 | | |
Tokio Marine Holdings, Inc. | | | 30,900 | | | | 1,077,236 | | |
Toyota Motor Corp. | | | 23,900 | | | | 1,246,089 | | |
Tsuruha Holdings, Inc. | | | 18,700 | | | | 1,581,468 | | |
Total | | | | | 39,541,407 | | |
The accompanying Notes to Financial Statements are an integral part of this statement.
Annual Report 2016
9
COLUMBIA INTERNATIONAL VALUE FUND
PORTFOLIO OF INVESTMENTS (continued)
February 29, 2016
Common Stocks (continued)
Issuer | | Shares | | Value ($) | |
NETHERLANDS 2.9% | |
ING Groep NV-CVA | | | 259,112 | | | | 3,088,963 | | |
Koninklijke Ahold NV | | | 77,739 | | | | 1,702,281 | | |
Total | | | | | 4,791,244 | | |
NORWAY 5.7% | |
Atea ASA | | | 132,726 | | | | 1,156,970 | | |
BW LPG Ltd. | | | 405,046 | | | | 2,629,088 | | |
Kongsberg Automotive ASA(a) | | | 2,940,291 | | | | 2,344,800 | | |
Leroy Seafood Group ASA | | | 21,429 | | | | 900,269 | | |
Spectrum ASA | | | 84,408 | | | | 237,632 | | |
Tanker Investments Ltd.(a) | | | 207,482 | | | | 2,013,197 | | |
Total | | | | | 9,281,956 | | |
PAKISTAN 0.7% | |
DG Khan Cement Co., Ltd. | | | 802,200 | | | | 1,198,231 | | |
PORTUGAL —% | |
Banco Espirito Santo SA, Registered
Shares(a)(b)(c) | | | 829,472 | | | | 27,070 | | |
SINGAPORE 1.5% | |
DBS Group Holdings Ltd. | | | 249,900 | | | | 2,406,919 | | |
SOUTH KOREA 1.8% | |
GS Home Shopping, Inc. | | | 5,327 | | | | 791,509 | | |
Hyundai Home Shopping Network Corp. | | | 12,938 | | | | 1,329,436 | | |
LF Corp. | | | 36,174 | | | | 731,996 | | |
Total | | | | | 2,852,941 | | |
SPAIN 4.4% | |
Banco Santander SA | | | 245,515 | | | | 993,106 | | |
Cellnex Telecom SAU | | | 89,413 | | | | 1,428,931 | | |
Endesa SA | | | 113,711 | | | | 2,049,540 | | |
Iberdrola SA | | | 421,483 | | | | 2,715,282 | | |
Total | | | | | 7,186,859 | | |
SWEDEN 3.3% | |
Hemfosa Fastigheter AB | | | 134,623 | | | | 1,489,134 | | |
Nordea Bank AB | | | 259,239 | | | | 2,578,440 | | |
Saab AB, Class B | | | 41,085 | | | | 1,313,421 | | |
Total | | | | | 5,380,995 | | |
SWITZERLAND 5.2% | |
Autoneum Holding AG | | | 10,134 | | | | 2,176,971 | | |
Common Stocks (continued)
Issuer | | Shares | | Value ($) | |
Baloise Holding AG, Registered Shares | | | 8,488 | | | | 1,067,697 | | |
Nestlé SA, Registered Shares | | | 19,004 | | | | 1,328,969 | | |
UBS AG | | | 58,793 | | | | 898,180 | | |
Wizz Air Holdings PLC(a) | | | 53,259 | | | | 1,349,244 | | |
Zurich Insurance Group AG | | | 7,438 | | | | 1,575,450 | | |
Total | | | | | 8,396,511 | | |
UNITED KINGDOM 17.9% | |
AstraZeneca PLC | | | 28,095 | | | | 1,597,389 | | |
Aviva PLC | | | 267,103 | | | | 1,620,674 | | |
BHP Billiton PLC | | | 185,238 | | | | 1,863,218 | | |
| BP PLC | | | 186,401 | | | | 904,640 | | |
Crest Nicholson Holdings PLC | | | 209,576 | | | | 1,627,085 | | |
DCC PLC | | | 12,896 | | | | 1,007,835 | | |
GlaxoSmithKline PLC | | | 81,805 | | | | 1,585,386 | | |
GW Pharmaceuticals PLC ADR(a) | | | 6,406 | | | | 263,287 | | |
HSBC Holdings PLC | | | 530,656 | | | | 3,374,621 | | |
Intermediate Capital Group PLC | | | 258,447 | | | | 2,068,320 | | |
John Wood Group PLC | | | 233,788 | | | | 2,021,249 | | |
Paysafe Group PLC(a) | | | 511,575 | | | | 2,813,729 | | |
Plus500 Ltd. | | | 59,262 | | | | 494,286 | | |
Royal Dutch Shell PLC, Class B | | | 280,057 | | | | 6,358,853 | | |
Vodafone Group PLC | | | 531,335 | | | | 1,611,486 | | |
Total | | | | | 29,212,058 | | |
UNITED STATES 2.6% | |
Aerie Pharmaceuticals, Inc.(a) | | | 11,416 | | | | 192,245 | | |
Alexion Pharmaceuticals, Inc.(a) | | | 1,772 | | | | 249,498 | | |
Alkermes PLC(a) | | | 4,930 | | | | 159,091 | | |
Arrowhead Research Corp.(a) | | | 31,525 | | | | 122,947 | | |
BioMarin Pharmaceutical, Inc.(a) | | | 2,808 | | | | 229,891 | | |
Bluebird Bio, Inc.(a) | | | 5,917 | | | | 273,484 | | |
Flex Pharma, Inc.(a) | | | 42,567 | | | | 316,273 | | |
Incyte Corp.(a) | | | 1,951 | | | | 143,398 | | |
Insmed, Inc.(a) | | | 9,894 | | | | 121,004 | | |
Novavax, Inc.(a) | | | 49,842 | | | | 217,311 | | |
PTC Therapeutics, Inc.(a) | | | 21,505 | | | | 171,610 | | |
Puma Biotechnology, Inc.(a) | | | 2,737 | | | | 122,563 | | |
Quotient Ltd.(a) | | | 75,184 | | | | 565,384 | | |
Stillwater Mining Co.(a) | | | 80,607 | | | | 676,293 | | |
TESARO, Inc.(a) | | | 4,308 | | | | 174,302 | | |
The accompanying Notes to Financial Statements are an integral part of this statement.
Annual Report 2016
10
COLUMBIA INTERNATIONAL VALUE FUND
PORTFOLIO OF INVESTMENTS (continued)
February 29, 2016
Common Stocks (continued)
Issuer | | Shares | | Value ($) | |
Ultragenyx Pharmaceutical, Inc.(a) | | | 4,609 | | | | 281,103 | | |
Vertex Pharmaceuticals, Inc.(a) | | | 2,574 | | | | 220,051 | | |
Total | | | | | 4,236,448 | | |
Total Common Stocks
(Cost: $187,335,719) | | | | | 158,584,003 | | |
Exchange-Traded Funds 2.3%
| | | Shares | | Value ($) | |
iShares MSCI EAFE ETF | | | 68,468 | | | | 3,669,885 | | |
Total Exchange-Traded Funds
(Cost: $3,735,280) | | | | | 3,669,885 | | |
Money Market Funds 0.8%
| | | Shares | | Value ($) | |
Columbia Short-Term Cash Fund,
0.420%(d)(e) | | | 1,276,455 | | | | 1,276,455 | | |
Total Money Market Funds
(Cost: $1,276,455) | | | | | 1,276,455 | | |
Total Investments
(Cost: $192,347,454) | | | | | 163,530,343 | | |
Other Assets & Liabilities, Net | | | | | (409,611 | ) | |
Net Assets | | | | | 163,120,732 | | |
Investments in Derivatives
Forward Foreign Currency Exchange Contracts Open at February 29, 2016
Counterparty | | Exchange Date | | Currency to
be Delivered | |
| | Currency to
be Received | | | | Unrealized
Appreciation ($) | | Unrealized
Depreciation ($) | |
Toronto Dominion | | 4/20/2016 | | | 4,396,000 | | | DKK | | | | | 648,714 | | | USD | | | | | 6,522 | | | | — | | |
Toronto Dominion | | 4/20/2016 | | | 2,546,000 | | | ILS | | | | | 653,023 | | | USD | | | | | — | | | | (313 | ) | |
Toronto Dominion | | 4/20/2016 | | | 253,025,000 | | | JPY | | | | | 2,243,328 | | | USD | | | | | — | | | | (4,287 | ) | |
Toronto Dominion | | 4/20/2016 | | | 3,326,622,000 | | | KRW | | | | | 2,682,738 | | | USD | | | | | 2,289 | | | | — | | |
Toronto Dominion | | 4/20/2016 | | | 67,216,000 | | | NOK | | | | | 7,763,913 | | | USD | | | | | 42,609 | | | | — | | |
Toronto Dominion | | 4/20/2016 | | | 8,277,000 | | | SEK | | | | | 971,793 | | | USD | | | | | 3,178 | | | | — | | |
Toronto Dominion | | 4/20/2016 | | | 7,606,797 | | | USD | | | | | 10,590,000 | | | AUD | | | | | — | | | | (65,618 | ) | |
Toronto Dominion | | 4/20/2016 | | | 2,021,324 | | | USD | | | | | 2,002,000 | | | CHF | | | | | — | | | | (11,242 | ) | |
Toronto Dominion | | 4/20/2016 | | | 2,843,895 | | | USD | | | | | 2,578,000 | | | EUR | | | | | — | | | | (35,119 | ) | |
Toronto Dominion | | 4/20/2016 | | | 6,754,598 | | | USD | | | | | 4,838,000 | | | GBP | | | | | — | | | | (19,621 | ) | |
Total | | | | | | | | | | | | | 54,598 | | | | (136,200 | ) | |
Notes to Portfolio of Investments
(a) Non-income producing investment.
(b) Identifies securities considered by the Investment Manager to be illiquid and may be difficult to sell. The aggregate value of such securities at February 29, 2016 was $27,070, which represents 0.02% of net assets. Information concerning such security holdings at February 29, 2016 is as follows:
Security Description | | Acquisition Dates | | Cost ($) | |
Banco Espirito Santo SA, Registered Shares | | 07/02/2014 – 07/29/2014 | | | 684,429 | | |
(c) Represents fair value as determined in good faith under procedures approved by the Board of Trustees. At February 29, 2016, the value of these securities amounted to $27,070, which represents 0.02% of net assets.
(d) The rate shown is the seven-day current annualized yield at February 29, 2016.
The accompanying Notes to Financial Statements are an integral part of this statement.
Annual Report 2016
11
COLUMBIA INTERNATIONAL VALUE FUND
PORTFOLIO OF INVESTMENTS (continued)
February 29, 2016
Notes to Portfolio of Investments (continued)
(e) As defined in the Investment Company Act of 1940, an affiliated company is one in which the Fund owns 5% or more of the company's outstanding voting securities, or a company which is under common ownership or control with the Fund. Holdings and transactions in these affiliated companies during the year ended February 29, 2016 are as follows:
Issuer | | Beginning
Cost ($) | | Purchase
Cost ($) | | Proceeds
From Sales ($) | | Ending
Cost ($) | | Dividends —
Affiliated
Issuers ($) | | Value ($) | |
Columbia Short-Term Cash Fund | | | — | | | | 66,092,431 | | | | (64,815,976 | ) | | | 1,276,455 | | | | 2,687 | | | | 1,276,455 | | |
Abbreviation Legend
ADR American Depositary Receipt
Currency Legend
AUD Australian Dollar
CHF Swiss Franc
DKK Danish Krone
EUR Euro
GBP British Pound
ILS Israeli Shekel
JPY Japanese Yen
KRW Korean Won
NOK Norwegian Krone
SEK Swedish Krona
USD US Dollar
Fair Value Measurements
The Fund categorizes its fair value measurements according to a three-level hierarchy that maximizes the use of observable inputs and minimizes the use of unobservable inputs by prioritizing that the most observable input be used when available. Observable inputs are those that market participants would use in pricing an investment based on market data obtained from sources independent of the reporting entity. Unobservable inputs are those that reflect the Fund's assumptions about the information market participants would use in pricing an investment. An investment's level within the fair value hierarchy is based on the lowest level of any input that is deemed significant to the asset's or liability's fair value measurement. The input levels are not necessarily an indication of the risk or liquidity associated with investments at that level. For example, certain U.S. government securities are generally high quality and liquid, however, they are reflected as Level 2 because the inputs used to determine fair value may not always be quoted prices in an active market.
Fair value inputs are summarized in the three broad levels listed below:
> Level 1 — Valuations based on quoted prices for investments in active markets that the Fund has the ability to access at the measurement date (including NAV for open-end mutual funds). Valuation adjustments are not applied to Level 1 investments.
> Level 2 — Valuations based on other significant observable inputs (including quoted prices for similar securities, interest rates, prepayment speeds, credit risks, etc.).
> Level 3 — Valuations based on significant unobservable inputs (including the Fund's own assumptions and judgment in determining the fair value of investments).
Inputs that are used in determining fair value of an investment may include price information, credit data, volatility statistics, and other factors. These inputs can be either observable or unobservable. The availability of observable inputs can vary between investments, and is affected by various factors such as the type of investment, and the volume and level of activity for that investment or similar investments in the marketplace. The inputs will be considered by the Investment Manager, along with any other relevant factors in the calculation of an investment's fair value. The Fund uses prices and inputs that are current as of the measurement date, which may include periods of market dislocations. During these periods, the availability of prices and inputs may be reduced for many investments. This condition could cause an investment to be reclassified between the various levels within the hierarchy.
The accompanying Notes to Financial Statements are an integral part of this statement.
Annual Report 2016
12
COLUMBIA INTERNATIONAL VALUE FUND
PORTFOLIO OF INVESTMENTS (continued)
February 29, 2016
Fair Value Measurements (continued)
Foreign equity securities actively traded in markets where there is a significant delay in the local close relative to the New York Stock Exchange (NYSE) are classified as Level 2. The values of these securities may include an adjustment to reflect the impact of significant market movements following the close of local trading, as described in Note 2 to the financial statements — Security Valuation.
Investments falling into the Level 3 category are primarily supported by quoted prices from brokers and dealers participating in the market for those investments. However, these may be classified as Level 3 investments due to lack of market transparency and corroboration to support these quoted prices. Additionally, valuation models may be used as the pricing source for any remaining investments classified as Level 3. These models may rely on one or more significant unobservable inputs and/or significant assumptions by the Investment Manager. Inputs used in valuations may include, but are not limited to, financial statement analysis, capital account balances, discount rates and estimated cash flows, and comparable company data.
Under the direction of the Fund's Board of Trustees (the Board), the Investment Manager's Valuation Committee (the Committee) is responsible for overseeing the valuation procedures approved by the Board. The Committee consists of voting and non-voting members from various groups within the Investment Manager's organization, including operations and accounting, trading and investments, compliance, risk management and legal.
The Committee meets at least monthly to review and approve valuation matters, which may include a description of specific valuation determinations, data regarding pricing information received from approved pricing vendors and brokers and the results of Board-approved valuation control policies and procedures (the Policies). The Policies address, among other things, instances when market quotations are or are not readily available, including recommendations of third party pricing vendors and a determination of appropriate pricing methodologies; events that require specific valuation determinations and assessment of fair value techniques; securities with a potential for stale pricing, including those that are illiquid, restricted, or in default; and the effectiveness of third party pricing vendors, including periodic reviews of vendors. The Committee meets more frequently, as needed, to discuss additional valuation matters, which may include the need to review back-testing results, review time-sensitive information or approve related valuation actions. The Committee reports to the Board, with members of the Committee meeting with the Board at each of its regularly scheduled meetings to discuss valuation matters and actions during the period, similar to those described earlier.
For investments categorized as Level 3, the Committee monitors information similar to that described above, which may include: (i) data specific to the issuer or comparable issuers, (ii) general market or specific sector news and (iii) quoted prices and specific or similar security transactions. The Committee considers this data and any changes from prior periods in order to assess the reasonableness of observable and unobservable inputs, any assumptions or internal models used to value those securities and changes in fair value. This data is also used to corroborate, when available, information received from approved pricing vendors and brokers. Various factors impact the frequency of monitoring this information (which may occur as often as daily). However, the Committee may determine that changes to inputs, assumptions and models are not required as a result of the monitoring procedures performed.
The following table is a summary of the inputs used to value the Fund's investments at February 29, 2016:
| | | Level 1
Quoted Prices in Active
Markets for Identical
Assets ($) | |
Level 2
Other Significant
Observable Inputs ($) | |
Level 3
Significant
Unobservable Inputs ($) | |
Total ($) | |
Investments | |
Common Stocks | |
Australia | | | — | | | | 2,608,027 | | | | — | | | | 2,608,027 | | |
Belgium | | | — | | | | 1,971,280 | | | | — | | | | 1,971,280 | | |
China | | | 1,109,820 | | | | 1,659,585 | | | | — | | | | 2,769,405 | | |
Denmark | | | — | | | | 1,259,469 | | | | — | | | | 1,259,469 | | |
France | | | — | | | | 17,635,151 | | | | — | | | | 17,635,151 | | |
Germany | | | — | | | | 8,843,472 | | | | — | | | | 8,843,472 | | |
Hong Kong | | | — | | | | 1,663,848 | | | | — | | | | 1,663,848 | | |
Ireland | | | 259,194 | | | | 1,412,851 | | | | — | | | | 1,672,045 | | |
Israel | | | — | | | | 2,182,398 | | | | — | | | | 2,182,398 | | |
Italy | | | — | | | | 3,466,269 | | | | — | | | | 3,466,269 | | |
Japan | | | — | | | | 39,541,407 | | | | — | | | | 39,541,407 | | |
Netherlands | | | — | | | | 4,791,244 | | | | — | | | | 4,791,244 | | |
The accompanying Notes to Financial Statements are an integral part of this statement.
Annual Report 2016
13
COLUMBIA INTERNATIONAL VALUE FUND
PORTFOLIO OF INVESTMENTS (continued)
February 29, 2016
Fair Value Measurements (continued)
| | | Level 1
Quoted Prices in Active
Markets for Identical
Assets ($) | |
Level 2
Other Significant
Observable Inputs ($) | |
Level 3
Significant
Unobservable Inputs ($) | |
Total ($) | |
Norway | | | — | | | | 9,281,956 | | | | — | | | | 9,281,956 | | |
Pakistan | | | — | | | | 1,198,231 | | | | — | | | | 1,198,231 | | |
Portugal | | | — | | | | — | | | | 27,070 | | | | 27,070 | | |
Singapore | | | — | | | | 2,406,919 | | | | — | | | | 2,406,919 | | |
South Korea | | | — | | | | 2,852,941 | | | | — | | | | 2,852,941 | | |
Spain | | | — | | | | 7,186,859 | | | | — | | | | 7,186,859 | | |
Sweden | | | — | | | | 5,380,995 | | | | — | | | | 5,380,995 | | |
Switzerland | | | — | | | | 8,396,511 | | | | — | | | | 8,396,511 | | |
United Kingdom | | | 263,287 | | | | 28,948,771 | | | | — | | | | 29,212,058 | | |
United States | | | 4,236,448 | | | | — | | | | — | | | | 4,236,448 | | |
Total Common Stocks | | | 5,868,749 | | | | 152,688,184 | | | | 27,070 | | | | 158,584,003 | | |
Exchange-Traded Funds | | | 3,669,885 | | | | — | | | | — | | | | 3,669,885 | | |
Money Market Funds | | | — | | | | 1,276,455 | | | | — | | | | 1,276,455 | | |
Total Investments | | | 9,538,634 | | | | 153,964,639 | | | | 27,070 | | | | 163,530,343 | | |
Derivatives | |
Assets | |
Forward Foreign Currency
Exchange Contracts | | | — | | | | 54,598 | | | | — | | | | 54,598 | | |
Liabilities | |
Forward Foreign Currency
Exchange Contracts | | | — | | | | (136,200 | ) | | | — | | | | (136,200 | ) | |
Total | | | 9,538,634 | | | | 153,883,037 | | | | 27,070 | | | | 163,448,741 | | |
See the Portfolio of Investments for all investment classifications not indicated in the table.
The Fund's assets assigned to the Level 2 input category are generally valued using the market approach, in which a security's value is determined through reference to prices and information from market transactions for similar or identical assets and/or fund per share market values which are not considered publicly available. These assets include certain foreign securities for which a third party statistical pricing service may be employed for purposes of fair market valuation. The model utilized by such third party statistical pricing service takes into account a security's correlation to available market data including, but not limited to, intraday index, ADR, and exchange-traded fund movements.
Derivative instruments are valued at unrealized appreciation (depreciation).
There were no transfers of financial assets between levels during the period.
The Fund does not hold any significant investments (greater than one percent of net assets) categorized as Level 3.
The Fund's assets assigned to the Level 3 category are valued utilizing the valuation technique deemed the most appropriate in the circumstances. Certain common stocks classified as Level 3 securities are valued using the market approach. To determine fair value for these securities, management considered various factors which may have included, but were not limited to, the closing prices of similar securities from the issuer and quoted bids from market participants. Significant increases (decreases) to any of these inputs would result in a significantly lower (higher) valuation measurement.
The accompanying Notes to Financial Statements are an integral part of this statement.
Annual Report 2016
14
COLUMBIA INTERNATIONAL VALUE FUND
STATEMENT OF ASSETS AND LIABILITIES
February 29, 2016
Assets | |
Investments, at value | |
Unaffiliated issuers (identified cost $191,070,999) | | $ | 162,253,888 | | |
Affiliated issuers (identified cost $1,276,455) | | | 1,276,455 | | |
Total investments (identified cost $192,347,454) | | | 163,530,343 | | |
Foreign currency (identified cost $145) | | | 145 | | |
Unrealized appreciation on forward foreign currency exchange contracts | | | 54,598 | | |
Receivable for: | |
Investments sold | | | 2,832,665 | | |
Capital shares sold | | | 316,537 | | |
Regulatory settlements (Note 6) | | | 66,145 | | |
Dividends | | | 319,529 | | |
Foreign tax reclaims | | | 464,716 | | |
Expense reimbursement due from Investment Manager | | | 180 | | |
Prepaid expenses | | | 1,442 | | |
Total assets | | | 167,586,300 | | |
Liabilities | |
Unrealized depreciation on forward foreign currency exchange contracts | | | 136,200 | | |
Payable for: | |
Investments purchased | | | 2,427,095 | | |
Capital shares purchased | | | 1,668,951 | | |
Foreign capital gains taxes deferred | | | 8,987 | | |
Investment management fees | | | 11,739 | | |
Distribution and/or service fees | | | 2,733 | | |
Transfer agent fees | | | 31,200 | | |
Compensation of board members | | | 121,116 | | |
Other expenses | | | 57,547 | | |
Total liabilities | | | 4,465,568 | | |
Net assets applicable to outstanding capital stock | | $ | 163,120,732 | | |
Represented by | |
Paid-in capital | | $ | 729,410,770 | | |
Excess of distributions over net investment income | | | (378,124 | ) | |
Accumulated net realized loss | | | (536,915,081 | ) | |
Unrealized appreciation (depreciation) on: | |
Investments | | | (28,817,111 | ) | |
Foreign currency translations | | | (89,133 | ) | |
Forward foreign currency exchange contracts | | | (81,602 | ) | |
Foreign capital gains tax | | | (8,987 | ) | |
Total — representing net assets applicable to outstanding capital stock | | $ | 163,120,732 | | |
The accompanying Notes to Financial Statements are an integral part of this statement.
Annual Report 2016
15
COLUMBIA INTERNATIONAL VALUE FUND
STATEMENT OF ASSETS AND LIABILITIES (continued)
February 29, 2016
Class A | |
Net assets | | $ | 62,919,092 | | |
Shares outstanding | | | 5,043,221 | | |
Net asset value per share | | $ | 12.48 | | |
Maximum offering price per share(a) | | $ | 13.24 | | |
Class B | |
Net assets | | $ | 147,483 | | |
Shares outstanding | | | 12,314 | | |
Net asset value per share | | $ | 11.98 | | |
Class C | |
Net assets | | $ | 17,237,486 | | |
Shares outstanding | | | 1,444,395 | | |
Net asset value per share | | $ | 11.93 | | |
Class I | |
Net assets | | $ | 2,007 | | |
Shares outstanding | | | 166 | | |
Net asset value per share(b) | | $ | 12.08 | | |
Class R | |
Net assets | | $ | 336,179 | | |
Shares outstanding | | | 26,920 | | |
Net asset value per share | | $ | 12.49 | | |
Class R4 | |
Net assets | | $ | 15,309,944 | | |
Shares outstanding | | | 1,199,931 | | |
Net asset value per share | | $ | 12.76 | | |
Class R5 | |
Net assets | | $ | 14,808,276 | | |
Shares outstanding | | | 1,161,549 | | |
Net asset value per share | | $ | 12.75 | | |
Class Z | |
Net assets | | $ | 52,360,265 | | |
Shares outstanding | | | 4,146,085 | | |
Net asset value per share | | $ | 12.63 | | |
(a) The maximum offering price per share is calculated by dividing the net asset value per share by 1.0 minus the maximum sales charge of 5.75%.
(b) Net asset value per share rounds to this amount due to fractional shares outstanding.
The accompanying Notes to Financial Statements are an integral part of this statement.
Annual Report 2016
16
COLUMBIA INTERNATIONAL VALUE FUND
STATEMENT OF OPERATIONS
Year Ended February 29, 2016
Net investment income | |
Income: | |
Dividends — unaffiliated issuers | | $ | 6,738,537 | | |
Dividends — affiliated issuers | | | 2,687 | | |
Foreign taxes withheld | | | (621,786 | ) | |
Total income | | | 6,119,438 | | |
Expenses: | |
Investment management fees | | | 1,559,297 | | |
Distribution and/or service fees | |
Class A | | | 183,900 | | |
Class B | | | 2,011 | | |
Class C | | | 207,338 | | |
Class R | | | 1,248 | | |
Transfer agent fees | |
Class A | | | 141,788 | | |
Class B | | | 389 | | |
Class C | | | 39,989 | | |
Class R | | | 479 | | |
Class R4 | | | 9,548 | | |
Class R5 | | | 3,052 | | |
Class Z | | | 141,298 | | |
Compensation of board members | | | 6,073 | | |
Custodian fees | | | 45,574 | | |
Printing and postage fees | | | 43,123 | | |
Registration fees | | | 94,429 | | |
Audit fees | | | 52,761 | | |
Legal fees | | | 7,084 | | |
Line of credit interest expense | | | 1,099 | | |
Other | | | 18,171 | | |
Total expenses | | | 2,558,651 | | |
Fees waived or expenses reimbursed by Investment Manager and its affiliates | | | (33,017 | ) | |
Expense reductions | | | (560 | ) | |
Total net expenses | | | 2,525,074 | | |
Net investment income | | | 3,594,364 | | |
Realized and unrealized gain (loss) — net | |
Net realized gain (loss) on: | |
Investments | | | 9,809,871 | | |
Foreign currency translations | | | (128,140 | ) | |
Forward foreign currency exchange contracts | | | (632,440 | ) | |
Options contracts written | | | 5,078 | | |
Net realized gain | | | 9,054,369 | | |
Net change in unrealized appreciation (depreciation) on: | |
Investments | | | (33,950,096 | ) | |
Foreign currency translations | | | 63,954 | | |
Forward foreign currency exchange contracts | | | (339,955 | ) | |
Foreign capital gains tax | | | (8,987 | ) | |
Net change in unrealized depreciation | | | (34,235,084 | ) | |
Net realized and unrealized loss | | | (25,180,715 | ) | |
Net decrease in net assets from operations | | $ | (21,586,351 | ) | |
The accompanying Notes to Financial Statements are an integral part of this statement.
Annual Report 2016
17
COLUMBIA INTERNATIONAL VALUE FUND
STATEMENT OF CHANGES IN NET ASSETS
| | | Year Ended
February 29,
2016 | | Year Ended
February 28,
2015 | |
Operations | |
Net investment income | | $ | 3,594,364 | | | $ | 5,465,187 | | |
Net realized gain | | | 9,054,369 | | | | 13,553,148 | | |
Net change in unrealized depreciation | | | (34,235,084 | ) | | | (27,575,757 | ) | |
Net decrease in net assets resulting from operations | | | (21,586,351 | ) | | | (8,557,422 | ) | |
Distributions to shareholders | |
Net investment income | |
Class A | | | (1,306,991 | ) | | | (3,697,826 | ) | |
Class B | | | (1,923 | ) | | | (10,683 | ) | |
Class C | | | (217,757 | ) | | | (777,041 | ) | |
Class I | | | (53 | ) | | | (106 | ) | |
Class R | | | (3,800 | ) | | | (8,896 | ) | |
Class R4 | | | (180,805 | ) | | | (104,695 | ) | |
Class R5 | | | (109,174 | ) | | | (47,879 | ) | |
Class Z | | | (1,587,584 | ) | | | (3,996,745 | ) | |
Total distributions to shareholders | | | (3,408,087 | ) | | | (8,643,871 | ) | |
Increase (decrease) in net assets from capital stock activity | | | 247,908 | | | | (67,334,364 | ) | |
Proceeds from regulatory settlements (Note 6) | | | 66,145 | | | | — | | |
Total decrease in net assets | | | (24,680,385 | ) | | | (84,535,657 | ) | |
Net assets at beginning of year | | | 187,801,117 | | | | 272,336,774 | | |
Net assets at end of year | | $ | 163,120,732 | | | $ | 187,801,117 | | |
Excess of distributions over net investment income | | $ | (378,124 | ) | | $ | (520,986 | ) | |
The accompanying Notes to Financial Statements are an integral part of this statement.
Annual Report 2016
18
COLUMBIA INTERNATIONAL VALUE FUND
STATEMENT OF CHANGES IN NET ASSETS (continued)
| | | Year Ended February 29, 2016 | | Year Ended February 28, 2015 | |
| | | Shares | | Dollars ($) | | Shares | | Dollars ($) | |
Capital stock activity | |
Class A shares | |
Subscriptions(a) | | | 1,545,183 | | | | 21,655,083 | | | | 1,011,605 | | | | 14,742,889 | | |
Distributions reinvested | | | 68,711 | | | | 947,138 | | | | 194,023 | | | | 2,775,884 | | |
Redemptions | | | (2,333,179 | ) | | | (32,939,498 | ) | | | (2,748,762 | ) | | | (40,415,599 | ) | |
Net decrease | | | (719,285 | ) | | | (10,337,277 | ) | | | (1,543,134 | ) | | | (22,896,826 | ) | |
Class B shares | |
Subscriptions | | | 3,583 | | | | 50,736 | | | | 647 | | | | 9,424 | | |
Distributions reinvested | | | 128 | | | | 1,696 | | | | 670 | | | | 9,296 | | |
Redemptions(a) | | | (9,915 | ) | | | (139,522 | ) | | | (13,105 | ) | | | (182,047 | ) | |
Net decrease | | | (6,204 | ) | | | (87,090 | ) | | | (11,788 | ) | | | (163,327 | ) | |
Class C shares | |
Subscriptions | | | 132,593 | | | | 1,808,517 | | | | 177,327 | | | | 2,490,130 | | |
Distributions reinvested | | | 10,930 | | | | 143,904 | | | | 38,021 | | | | 522,484 | | |
Redemptions | | | (303,847 | ) | | | (4,139,390 | ) | | | (404,112 | ) | | | (5,669,227 | ) | |
Net decrease | | | (160,324 | ) | | | (2,186,969 | ) | | | (188,764 | ) | | | (2,656,613 | ) | |
Class I shares | |
Redemptions | | | — | | | | — | | | | (13 | ) | | | (197 | ) | |
Net decrease | | | — | | | | — | | | | (13 | ) | | | (197 | ) | |
Class R shares | |
Subscriptions | | | 20,798 | | | | 287,717 | | | | 6,241 | | | | 91,361 | | |
Distributions reinvested | | | 264 | | | | 3,634 | | | | 626 | | | | 8,896 | | |
Redemptions | | | (12,128 | ) | | | (168,481 | ) | | | (2,072 | ) | | | (30,083 | ) | |
Net increase | | | 8,934 | | | | 122,870 | | | | 4,795 | | | | 70,174 | | |
Class R4 shares | |
Subscriptions | | | 1,381,100 | | | | 18,918,226 | | | | 108,014 | | | | 1,602,547 | | |
Distributions reinvested | | | 12,933 | | | | 180,758 | | | | 7,238 | | | | 104,595 | | |
Redemptions | | | (374,948 | ) | | | (5,002,665 | ) | | | (64,715 | ) | | | (940,624 | ) | |
Net increase | | | 1,019,085 | | | | 14,096,319 | | | | 50,537 | | | | 766,518 | | |
Class R5 shares | |
Subscriptions | | | 1,377,854 | | | | 19,567,718 | | | | 5,257 | | | | 80,287 | | |
Distributions reinvested | | | 7,766 | | | | 109,124 | | | | 3,266 | | | | 47,776 | | |
Redemptions | | | (248,097 | ) | | | (3,518,828 | ) | | | (198,036 | ) | | | (3,025,348 | ) | |
Net increase (decrease) | | | 1,137,523 | | | | 16,158,014 | | | | (189,513 | ) | | | (2,897,285 | ) | |
Class Z shares | |
Subscriptions | | | 1,422,850 | | | | 20,179,406 | | | | 1,474,144 | | | | 22,311,927 | | |
Distributions reinvested | | | 91,598 | | | | 1,277,337 | | | | 231,084 | | | | 3,350,698 | | |
Redemptions | | | (2,745,098 | ) | | | (38,974,702 | ) | | | (4,332,826 | ) | | | (65,219,433 | ) | |
Net decrease | | | (1,230,650 | ) | | | (17,517,959 | ) | | | (2,627,598 | ) | | | (39,556,808 | ) | |
Total net increase (decrease) | | | 49,079 | | | | 247,908 | | | | (4,505,478 | ) | | | (67,334,364 | ) | |
(a) Includes conversions of Class B shares to Class A shares, if any.
The accompanying Notes to Financial Statements are an integral part of this statement.
Annual Report 2016
19
COLUMBIA INTERNATIONAL VALUE FUND
The following tables are intended to help you understand the Fund's financial performance. Certain information reflects financial results for a single share of a class held for the periods shown. The per share amounts and percentages reflect income and expenses assuming inclusion of the Fund's proportionate share of the income and expenses of Columbia International Value Master Portfolio for all periods prior to the Fund's conversion to a stand-alone fund after the close of business on December 13, 2013. Per share net investment income (loss) amounts are calculated based on average shares outstanding during the period. Total return assumes reinvestment of all dividends and distributions, if any. Total return does not reflect payment of sales charges, if any. Total return and portfolio turnover are not annualized for periods of less than one year. The portfolio turnover rate is calculated without regard to purchase and sales transactions of short-term instruments and certain derivatives, if any. If such transactions were included, the Fund's portfolio turnover rate may be higher.
| | | Year Ended
February 29, | | Year Ended February 28, | | Year Ended
February 29, | |
Class A | | 2016 | | 2015 | | 2014 | | 2013 | | 2012 | |
Per share data | |
Net asset value, beginning of period | | $ | 14.46 | | | $ | 15.55 | | | $ | 12.85 | | | $ | 13.14 | | | $ | 15.12 | | |
Income from investment operations: | |
Net investment income | | | 0.29 | | | | 0.34 | | | | 0.41 | | | | 0.39 | | | | 0.39 | | |
Net realized and unrealized gain (loss) | | | (2.02 | ) | | | (0.85 | ) | | | 3.00 | | | | (0.20 | ) | | | (1.88 | ) | |
Total from investment operations | | | (1.73 | ) | | | (0.51 | ) | | | 3.41 | | | | 0.19 | | | | (1.49 | ) | |
Less distributions to shareholders: | |
Net investment income | | | (0.26 | ) | | | (0.58 | ) | | | (0.71 | ) | | | (0.46 | ) | | | (0.49 | ) | |
Tax return of capital | | | — | | | | — | | | | — | | | | (0.02 | ) | | | — | | |
Total distributions to shareholders | | | (0.26 | ) | | | (0.58 | ) | | | (0.71 | ) | | | (0.48 | ) | | | (0.49 | ) | |
Proceeds from regulatory settlements | | | 0.01 | | | | — | | | | — | | | | — | | | | 0.00 | (a) | |
Net asset value, end of period | | $ | 12.48 | | | $ | 14.46 | | | $ | 15.55 | | | $ | 12.85 | | | $ | 13.14 | | |
Total return | | | (12.08 | %)(b) | | | (3.19 | %) | | | 26.87 | % | | | 1.56 | % | | | (9.51 | %) | |
Ratios to average net assets(c) | |
Total gross expenses | | | 1.47 | %(d) | | | 1.46 | %(d) | | | 1.48 | %(d) | | | 1.57 | %(d) | | | 1.53 | %(d) | |
Total net expenses(e) | | | 1.45 | %(d)(f) | | | 1.42 | %(d)(f) | | | 1.43 | %(d)(f) | | | 1.43 | %(d)(f) | | | 1.41 | %(d)(f) | |
Net investment income | | | 2.02 | % | | | 2.31 | % | | | 2.85 | % | | | 3.09 | % | | | 2.87 | % | |
Supplemental data | |
Net assets, end of period (in thousands) | | $ | 62,919 | | | $ | 83,340 | | | $ | 113,594 | | | $ | 168,944 | | | $ | 225,747 | | |
Portfolio turnover | | | 77 | % | | | 80 | % | | | 14 | %(g) | | | — | % | | | — | % | |
Portfolio turnover of Columbia International Value Master Portfolio | | | — | % | | | — | % | | | 100 | %(h) | | | 13 | % | | | 16 | % | |
Notes to Financial Highlights
(a) Rounds to zero.
(b) The Fund received proceeds from regulatory settlements. Had the Fund not received these proceeds, the total return would have been lower by 0.04%.
(c) In addition to the fees and expenses that the Fund bears directly, the Fund indirectly bears a pro rata share of the fees and expenses of any other funds in which it invests. Such indirect expenses are not included in the Fund's reported expense ratios.
(d) Ratios include line of credit interest expense which is less than 0.01%.
(e) Total net expenses include the impact of certain fee waivers/expense reimbursements made by the Investment Manager and certain of its affiliates, if applicable.
(f) The benefits derived from expense reductions had an impact of less than 0.01%.
(g) Amount represents results after the Fund's conversion to a stand-alone structure.
(h) Amount represents results prior to the Fund's conversion to a stand-alone structure.
The accompanying Notes to Financial Statements are an integral part of this statement.
Annual Report 2016
20
COLUMBIA INTERNATIONAL VALUE FUND
FINANCIAL HIGHLIGHTS (continued)
| | | Year Ended
February 29, | | Year Ended February 28, | | Year Ended
February 29, | |
Class B | | 2016 | | 2015 | | 2014 | | 2013 | | 2012 | |
Per share data | |
Net asset value, beginning of period | | $ | 13.89 | | | $ | 14.95 | | | $ | 12.39 | | | $ | 12.68 | | | $ | 14.61 | | |
Income from investment operations: | |
Net investment income | | | 0.21 | | | | 0.24 | | | | 0.26 | | | | 0.29 | | | | 0.27 | | |
Net realized and unrealized gain (loss) | | | (1.98 | ) | | | (0.83 | ) | | | 2.92 | | | | (0.19 | ) | | | (1.81 | ) | |
Total from investment operations | | | (1.77 | ) | | | (0.59 | ) | | | 3.18 | | | | 0.10 | | | | (1.54 | ) | |
Less distributions to shareholders: | |
Net investment income | | | (0.15 | ) | | | (0.47 | ) | | | (0.62 | ) | | | (0.38 | ) | | | (0.39 | ) | |
Tax return of capital | | | — | | | | — | | | | — | | | | (0.01 | ) | | | — | | |
Total distributions to shareholders | | | (0.15 | ) | | | (0.47 | ) | | | (0.62 | ) | | | (0.39 | ) | | | (0.39 | ) | |
Proceeds from regulatory settlements | | | 0.01 | | | | — | | | | — | | | | — | | | | 0.00 | (a) | |
Net asset value, end of period | | $ | 11.98 | | | $ | 13.89 | | | $ | 14.95 | | | $ | 12.39 | | | $ | 12.68 | | |
Total return | | | (12.77 | %)(b) | | | (3.91 | %) | | | 25.96 | % | | | 0.84 | % | | | (10.28 | %) | |
Ratios to average net assets(c) | |
Total gross expenses | | | 2.22 | %(d) | | | 2.20 | %(d) | | | 2.23 | %(d) | | | 2.32 | %(d) | | | 2.27 | %(d) | |
Total net expenses(e) | | | 2.19 | %(d)(f) | | | 2.17 | %(d)(f) | | | 2.17 | %(d)(f) | | | 2.18 | %(d)(f) | | | 2.16 | %(d)(f) | |
Net investment income | | | 1.55 | % | | | 1.69 | % | | | 1.85 | % | | | 2.41 | % | | | 2.05 | % | |
Supplemental data | |
Net assets, end of period (in thousands) | | $ | 147 | | | $ | 257 | | | $ | 453 | | | $ | 518 | | | $ | 807 | | |
Portfolio turnover | | | 77 | % | | | 80 | % | | | 14 | %(g) | | | — | % | | | — | % | |
Portfolio turnover of Columbia International Value Master Portfolio | | | — | % | | | — | % | | | 100 | %(h) | | | 13 | % | | | 16 | % | |
Notes to Financial Highlights
(a) Rounds to zero.
(b) The Fund received proceeds from regulatory settlements. Had the Fund not received these proceeds, the total return would have been lower by 0.04%.
(c) In addition to the fees and expenses that the Fund bears directly, the Fund indirectly bears a pro rata share of the fees and expenses of any other funds in which it invests. Such indirect expenses are not included in the Fund's reported expense ratios.
(d) Ratios include line of credit interest expense which is less than 0.01%.
(e) Total net expenses include the impact of certain fee waivers/expense reimbursements made by the Investment Manager and certain of its affiliates, if applicable.
(f) The benefits derived from expense reductions had an impact of less than 0.01%.
(g) Amount represents results after the Fund's conversion to a stand-alone structure.
(h) Amount represents results prior to the Fund's conversion to a stand-alone structure.
The accompanying Notes to Financial Statements are an integral part of this statement.
Annual Report 2016
21
COLUMBIA INTERNATIONAL VALUE FUND
FINANCIAL HIGHLIGHTS (continued)
| | | Year Ended
February 29, | | Year Ended February 28, | | Year Ended
February 29, | |
Class C | | 2016 | | 2015 | | 2014 | | 2013 | | 2012 | |
Per share data | |
Net asset value, beginning of period | | $ | 13.84 | | | $ | 14.89 | | | $ | 12.35 | | | $ | 12.64 | | | $ | 14.56 | | |
Income from investment operations: | |
Net investment income | | | 0.17 | | | | 0.22 | | | | 0.26 | | | | 0.28 | | | | 0.27 | | |
Net realized and unrealized gain (loss) | | | (1.94 | ) | | | (0.80 | ) | | | 2.90 | | | | (0.18 | ) | | | (1.80 | ) | |
Total from investment operations | | | (1.77 | ) | | | (0.58 | ) | | | 3.16 | | | | 0.10 | | | | (1.53 | ) | |
Less distributions to shareholders: | |
Net investment income | | | (0.15 | ) | | | (0.47 | ) | | | (0.62 | ) | | | (0.38 | ) | | | (0.39 | ) | |
Tax return of capital | | | — | | | | — | | | | — | | | | (0.01 | ) | | | — | | |
Total distributions to shareholders | | | (0.15 | ) | | | (0.47 | ) | | | (0.62 | ) | | | (0.39 | ) | | | (0.39 | ) | |
Proceeds from regulatory settlements | | | 0.01 | | | | — | | | | — | | | | — | | | | 0.00 | (a) | |
Net asset value, end of period | | $ | 11.93 | | | $ | 13.84 | | | $ | 14.89 | | | $ | 12.35 | | | $ | 12.64 | | |
Total return | | | (12.82 | %)(b) | | | (3.86 | %) | | | 25.88 | % | | | 0.85 | % | | | (10.24 | %) | |
Ratios to average net assets(c) | |
Total gross expenses | | | 2.22 | %(d) | | | 2.21 | %(d) | | | 2.23 | %(d) | | | 2.32 | %(d) | | | 2.28 | %(d) | |
Total net expenses(e) | | | 2.20 | %(d)(f) | | | 2.17 | %(d)(f) | | | 2.17 | %(d)(f) | | | 2.18 | %(d)(f) | | | 2.16 | %(d)(f) | |
Net investment income | | | 1.28 | % | | | 1.54 | % | | | 1.91 | % | | | 2.35 | % | | | 2.10 | % | |
Supplemental data | |
Net assets, end of period (in thousands) | | $ | 17,237 | | | $ | 22,207 | | | $ | 26,710 | | | $ | 26,193 | | | $ | 34,910 | | |
Portfolio turnover | | | 77 | % | | | 80 | % | | | 14 | %(g) | | | — | % | | | — | % | |
Portfolio turnover of Columbia International Value Master Portfolio | | | — | % | | | — | % | | | 100 | %(h) | | | 13 | % | | | 16 | % | |
Notes to Financial Highlights
(a) Rounds to zero.
(b) The Fund received proceeds from regulatory settlements. Had the Fund not received these proceeds, the total return would have been lower by 0.04%.
(c) In addition to the fees and expenses that the Fund bears directly, the Fund indirectly bears a pro rata share of the fees and expenses of any other funds in which it invests. Such indirect expenses are not included in the Fund's reported expense ratios.
(d) Ratios include line of credit interest expense which is less than 0.01%.
(e) Total net expenses include the impact of certain fee waivers/expense reimbursements made by the Investment Manager and certain of its affiliates, if applicable.
(f) The benefits derived from expense reductions had an impact of less than 0.01%.
(g) Amount represents results after the Fund's conversion to a stand-alone structure.
(h) Amount represents results prior to the Fund's conversion to a stand-alone structure.
The accompanying Notes to Financial Statements are an integral part of this statement.
Annual Report 2016
22
COLUMBIA INTERNATIONAL VALUE FUND
FINANCIAL HIGHLIGHTS (continued)
| | | Year Ended
February 29, | | Year Ended February 28, | | Year Ended
February 29, | |
Class I | | 2016 | | 2015 | | 2014 | | 2013 | | 2012 | |
Per share data | |
Net asset value, beginning of period | | $ | 14.02 | | | $ | 15.09 | | | $ | 12.48 | | | $ | 12.77 | | | $ | 15.27 | | |
Income from investment operations: | |
Net investment income | | | 0.33 | | | | 0.38 | | | | 0.42 | | | | 0.40 | | | | 0.70 | | |
Net realized and unrealized gain (loss) | | | (1.96 | ) | | | (0.81 | ) | | | 2.95 | | | | (0.16 | ) | | | (2.65 | ) | |
Total from investment operations | | | (1.63 | ) | | | (0.43 | ) | | | 3.37 | | | | 0.24 | | | | (1.95 | ) | |
Less distributions to shareholders: | |
Net investment income | | | (0.32 | ) | | | (0.64 | ) | | | (0.76 | ) | | | (0.51 | ) | | | (0.55 | ) | |
Tax return of capital | | | — | | | | — | | | | — | | | | (0.02 | ) | | | — | | |
Total distributions to shareholders | | | (0.32 | ) | | | (0.64 | ) | | | (0.76 | ) | | | (0.53 | ) | | | (0.55 | ) | |
Proceeds from regulatory settlements | | | 0.01 | | | | — | | | | — | | | | — | | | | 0.00 | (a) | |
Net asset value, end of period | | $ | 12.08 | | | $ | 14.02 | | | $ | 15.09 | | | $ | 12.48 | | | $ | 12.77 | | |
Total return | | | (11.78 | %)(b) | | | (2.74 | %) | | | 27.35 | % | | | 2.00 | % | | | (12.47 | %) | |
Ratios to average net assets(c) | |
Total gross expenses | | | 1.04 | %(d) | | | 1.03 | %(d) | | | 1.00 | %(d) | | | 1.13 | %(d) | | | 1.06 | %(d) | |
Total net expenses(e) | | | 1.03 | %(d) | | | 1.03 | %(d) | | | 0.99 | %(d) | | | 1.04 | %(d) | | | 1.06 | %(d)(f) | |
Net investment income | | | 2.40 | % | | | 2.66 | % | | | 3.00 | % | | | 3.31 | % | | | 4.77 | % | |
Supplemental data | |
Net assets, end of period (in thousands) | | $ | 2 | | | $ | 2 | | | $ | 3 | | | $ | 2 | | | $ | 2 | | |
Portfolio turnover | | | 77 | % | | | 80 | % | | | 14 | %(g) | | | — | % | | | — | % | |
Portfolio turnover of Columbia International Value Master Portfolio | | | — | % | | | — | % | | | 100 | %(h) | | | 13 | % | | | 16 | % | |
Notes to Financial Highlights
(a) Rounds to zero.
(b) The Fund received proceeds from regulatory settlements. Had the Fund not received these proceeds, the total return would have been lower by 0.04%.
(c) In addition to the fees and expenses that the Fund bears directly, the Fund indirectly bears a pro rata share of the fees and expenses of any other funds in which it invests. Such indirect expenses are not included in the Fund's reported expense ratios.
(d) Ratios include line of credit interest expense which is less than 0.01%.
(e) Total net expenses include the impact of certain fee waivers/expense reimbursements made by the Investment Manager and certain of its affiliates, if applicable.
(f) The benefits derived from expense reductions had an impact of less than 0.01%.
(g) Amount represents results after the Fund's conversion to a stand-alone structure.
(h) Amount represents results prior to the Fund's conversion to a stand-alone structure.
The accompanying Notes to Financial Statements are an integral part of this statement.
Annual Report 2016
23
COLUMBIA INTERNATIONAL VALUE FUND
FINANCIAL HIGHLIGHTS (continued)
| | | Year Ended
February 29, | | Year Ended February 28, | | Year Ended
February 29, | |
Class R | | 2016 | | 2015 | | 2014 | | 2013 | | 2012 | |
Per share data | |
Net asset value, beginning of period | | $ | 14.48 | | | $ | 15.56 | | | $ | 12.87 | | | $ | 13.15 | | | $ | 15.15 | | |
Income from investment operations: | |
Net investment income | | | 0.21 | | | | 0.27 | | | | 0.31 | | | | 0.15 | | | | 0.25 | | |
Net realized and unrealized gain (loss) | | | (1.99 | ) | | | (0.81 | ) | | | 3.06 | | | | 0.02 | (a) | | | (1.79 | ) | |
Total from investment operations | | | (1.78 | ) | | | (0.54 | ) | | | 3.37 | | | | 0.17 | | | | (1.54 | ) | |
Less distributions to shareholders: | |
Net investment income | | | (0.22 | ) | | | (0.54 | ) | | | (0.68 | ) | | | (0.44 | ) | | | (0.46 | ) | |
Tax return of capital | | | — | | | | — | | | | — | | | | (0.01 | ) | | | — | | |
Total distributions to shareholders | | | (0.22 | ) | | | (0.54 | ) | | | (0.68 | ) | | | (0.45 | ) | | | (0.46 | ) | |
Proceeds from regulatory settlements | | | 0.01 | | | | — | | | | — | | | | — | | | | 0.00 | (b) | |
Net asset value, end of period | | $ | 12.49 | | | $ | 14.48 | | | $ | 15.56 | | | $ | 12.87 | | | $ | 13.15 | | |
Total return | | | (12.36 | %)(c) | | | (3.38 | %) | | | 26.50 | % | | | 1.39 | % | | | (9.90 | %) | |
Ratios to average net assets(d) | |
Total gross expenses | | | 1.72 | %(e) | | | 1.71 | %(e) | | | 1.71 | %(e) | | | 1.85 | %(e) | | | 1.86 | %(e) | |
Total net expenses(f) | | | 1.70 | %(e)(g) | | | 1.67 | %(e)(g) | | | 1.67 | %(e)(g) | | | 1.70 | %(e)(g) | | | 1.64 | %(e)(g) | |
Net investment income | | | 1.46 | % | | | 1.87 | % | | | 2.13 | % | | | 1.16 | % | | | 1.94 | % | |
Supplemental data | |
Net assets, end of period (in thousands) | | $ | 336 | | | $ | 260 | | | $ | 205 | | | $ | 98 | | | $ | 8 | | |
Portfolio turnover | | | 77 | % | | | 80 | % | | | 14 | %(h) | | | — | % | | | — | % | |
Portfolio turnover of Columbia International Value Master Portfolio | | | — | % | | | — | % | | | 100 | %(i) | | | 13 | % | | | 16 | % | |
Notes to Financial Highlights
(a) Calculation of the net gain (loss) per share (both realized and unrealized) does not correlate to the aggregate realized and unrealized gain (loss) presented in the Statement of Operations due to the timing of subscriptions and redemptions of Fund shares in relation to fluctuations in the market value of the portfolio.
(b) Rounds to zero.
(c) The Fund received proceeds from regulatory settlements. Had the Fund not received these proceeds, the total return would have been lower by 0.04%.
(d) In addition to the fees and expenses that the Fund bears directly, the Fund indirectly bears a pro rata share of the fees and expenses of any other funds in which it invests. Such indirect expenses are not included in the Fund's reported expense ratios.
(e) Ratios include line of credit interest expense which is less than 0.01%.
(f) Total net expenses include the impact of certain fee waivers/expense reimbursements made by the Investment Manager and certain of its affiliates, if applicable.
(g) The benefits derived from expense reductions had an impact of less than 0.01%.
(h) Amount represents results after the Fund's conversion to a stand-alone structure.
(i) Amount represents results prior to the Fund's conversion to a stand-alone structure.
The accompanying Notes to Financial Statements are an integral part of this statement.
Annual Report 2016
24
COLUMBIA INTERNATIONAL VALUE FUND
FINANCIAL HIGHLIGHTS (continued)
| | Year Ended
February 29, | | Year Ended February 28, | |
Class R4 | | 2016 | | 2015 | | 2014 | | 2013(a) | |
Per share data | |
Net asset value, beginning of period | | $ | 14.79 | | | $ | 15.88 | | | $ | 13.10 | | | $ | 12.51 | | |
Income from investment operations: | |
Net investment income | | | 0.19 | | | | 0.35 | | | | 0.30 | | | | 0.02 | | |
Net realized and unrealized gain (loss) | | | (1.94 | ) | | | (0.82 | ) | | | 3.22 | | | | 1.05 | (b) | |
Total from investment operations | | | (1.75 | ) | | | (0.47 | ) | | | 3.52 | | | | 1.07 | | |
Less distributions to shareholders: | |
Net investment income | | | (0.29 | ) | | | (0.62 | ) | | | (0.74 | ) | | | (0.46 | ) | |
Tax return of capital | | | — | | | | — | | | | — | | | | (0.02 | ) | |
Total distributions to shareholders | | | (0.29 | ) | | | (0.62 | ) | | | (0.74 | ) | | | (0.48 | ) | |
Proceeds from regulatory settlements | | | 0.01 | | | | — | | | | — | | | | — | | |
Net asset value, end of period | | $ | 12.76 | | | $ | 14.79 | | | $ | 15.88 | | | $ | 13.10 | | |
Total return | | | (11.93 | %)(c) | | | (2.87 | %) | | | 27.21 | % | | | 8.64 | % | |
Ratios to average net assets(d) | |
Total gross expenses | | | 1.22 | %(e) | | | 1.21 | %(e) | | | 1.25 | %(e) | | | 1.31 | %(e)(f) | |
Total net expenses(g) | | | 1.20 | %(e)(h) | | | 1.17 | %(e)(h) | | | 1.17 | %(e)(h) | | | 1.21 | %(e)(f) | |
Net investment income | | | 1.35 | % | | | 2.34 | % | | | 2.09 | % | | | 0.59 | %(f) | |
Supplemental data | |
Net assets, end of period (in thousands) | | $ | 15,310 | | | $ | 2,674 | | | $ | 2,070 | | | $ | 3 | | |
Portfolio turnover | | | 77 | % | | | 80 | % | | | 14 | %(i) | | | — | % | |
Portfolio turnover of Columbia International Value Master Portfolio | | | — | % | | | — | % | | | 100 | %(j) | | | 13 | % | |
Notes to Financial Highlights
(a) Based on operations from November 8, 2012 (commencement of operations) through the stated period end.
(b) Calculation of the net gain (loss) per share (both realized and unrealized) does not correlate to the aggregate realized and unrealized gain (loss) presented in the Statement of Operations due to the timing of subscriptions and redemptions of Fund shares in relation to fluctuations in the market value of the portfolio.
(c) The Fund received proceeds from regulatory settlements. Had the Fund not received these proceeds, the total return would have been lower by 0.04%.
(d) In addition to the fees and expenses that the Fund bears directly, the Fund indirectly bears a pro rata share of the fees and expenses of any other funds in which it invests. Such indirect expenses are not included in the Fund's reported expense ratios.
(e) Ratios include line of credit interest expense which is less than 0.01%.
(f) Annualized.
(g) Total net expenses include the impact of certain fee waivers/expense reimbursements made by the Investment Manager and certain of its affiliates, if applicable.
(h) The benefits derived from expense reductions had an impact of less than 0.01%.
(i) Amount represents results after the Fund's conversion to a stand-alone structure.
(j) Amount represents results prior to the Fund's conversion to a stand-alone structure.
The accompanying Notes to Financial Statements are an integral part of this statement.
Annual Report 2016
25
COLUMBIA INTERNATIONAL VALUE FUND
FINANCIAL HIGHLIGHTS (continued)
| | Year Ended
February 29, | | Year Ended February 28, | |
Class R5 | | 2016 | | 2015 | | 2014 | | 2013(a) | |
Per share data | |
Net asset value, beginning of period | | $ | 14.77 | | | $ | 15.87 | | | $ | 13.09 | | | $ | 12.51 | | |
Income from investment operations: | |
Net investment income | | | 0.25 | | | | 0.51 | | | | 0.37 | | | | 0.07 | | |
Net realized and unrealized gain (loss) | | | (1.97 | ) | | | (0.97 | ) | | | 3.16 | | | | 1.00 | (b) | |
Total from investment operations | | | (1.72 | ) | | | (0.46 | ) | | | 3.53 | | | | 1.07 | | |
Less distributions to shareholders: | |
Net investment income | | | (0.31 | ) | | | (0.64 | ) | | | (0.75 | ) | | | (0.47 | ) | |
Tax return of capital | | | — | | | | — | | | | — | | | | (0.02 | ) | |
Total distributions to shareholders | | | (0.31 | ) | | | (0.64 | ) | | | (0.75 | ) | | | (0.49 | ) | |
Proceeds from regulatory settlements | | | 0.01 | | | | — | | | | — | | | | — | | |
Net asset value, end of period | | $ | 12.75 | | | $ | 14.77 | | | $ | 15.87 | | | $ | 13.09 | | |
Total return | | | (11.77 | %)(c) | | | (2.82 | %) | | | 27.34 | % | | | 8.64 | % | |
Ratios to average net assets(d) | |
Total gross expenses | | | 1.08 | %(e) | | | 1.05 | %(e) | | | 1.09 | %(e) | | | 1.28 | %(e)(f) | |
Total net expenses(g) | | | 1.08 | %(e) | | | 1.05 | %(e) | | | 1.07 | %(e) | | | 1.09 | %(e)(f) | |
Net investment income | | | 1.79 | % | | | 3.31 | % | | | 2.49 | % | | | 1.88 | %(f) | |
Supplemental data | |
Net assets, end of period (in thousands) | | $ | 14,808 | | | $ | 355 | | | $ | 3,388 | | | $ | 696 | | |
Portfolio turnover | | | 77 | % | | | 80 | % | | | 14 | %(h) | | | — | % | |
Portfolio turnover of Columbia International Value Master Portfolio | | | — | % | | | — | % | | | 100 | %(i) | | | 13 | % | |
Notes to Financial Highlights
(a) Based on operations from November 8, 2012 (commencement of operations) through the stated period end.
(b) Calculation of the net gain (loss) per share (both realized and unrealized) does not correlate to the aggregate realized and unrealized gain (loss) presented in the Statement of Operations due to the timing of subscriptions and redemptions of Fund shares in relation to fluctuations in the market value of the portfolio.
(c) The Fund received proceeds from regulatory settlements. Had the Fund not received these proceeds, the total return would have been lower by 0.04%.
(d) In addition to the fees and expenses that the Fund bears directly, the Fund indirectly bears a pro rata share of the fees and expenses of any other funds in which it invests. Such indirect expenses are not included in the Fund's reported expense ratios.
(e) Ratios include line of credit interest expense which is less than 0.01%.
(f) Annualized.
(g) Total net expenses include the impact of certain fee waivers/expense reimbursements made by the Investment Manager and certain of its affiliates, if applicable.
(h) Amount represents results after the Fund's conversion to a stand-alone structure.
(i) Amount represents results prior to the Fund's conversion to a stand-alone structure.
The accompanying Notes to Financial Statements are an integral part of this statement.
Annual Report 2016
26
COLUMBIA INTERNATIONAL VALUE FUND
FINANCIAL HIGHLIGHTS (continued)
| | | Year Ended
February 29, | | Year Ended February 28, | | Year Ended
February 29, | |
Class Z | | 2016 | | 2015 | | 2014 | | 2013 | | 2012 | |
Per share data | |
Net asset value, beginning of period | | $ | 14.64 | | | $ | 15.73 | | | $ | 12.99 | | | $ | 13.27 | | | $ | 15.28 | | |
Income from investment operations: | |
Net investment income | | | 0.33 | | | | 0.40 | | | | 0.58 | | | | 0.42 | | | | 0.42 | | |
Net realized and unrealized gain (loss) | | | (2.06 | ) | | | (0.87 | ) | | | 2.90 | | | | (0.19 | ) | | | (1.90 | ) | |
Total from investment operations | | | (1.73 | ) | | | (0.47 | ) | | | 3.48 | | | | 0.23 | | | | (1.48 | ) | |
Less distributions to shareholders: | |
Net investment income | | | (0.29 | ) | | | (0.62 | ) | | | (0.74 | ) | | | (0.49 | ) | | | (0.53 | ) | |
Tax return of capital | | | — | | | | — | | | | — | | | | (0.02 | ) | | | — | | |
Total distributions to shareholders | | | (0.29 | ) | | | (0.62 | ) | | | (0.74 | ) | | | (0.51 | ) | | | (0.53 | ) | |
Proceeds from regulatory settlements | | | 0.01 | | | | — | | | | — | | | | — | | | | 0.00 | (a) | |
Net asset value, end of period | | $ | 12.63 | | | $ | 14.64 | | | $ | 15.73 | | | $ | 12.99 | | | $ | 13.27 | | |
Total return | | | (11.91 | %)(b) | | | (2.91 | %) | | | 27.13 | % | | | 1.86 | % | | | (9.35 | %) | |
Ratios to average net assets(c) | |
Total gross expenses | | | 1.21 | %(d) | | | 1.21 | %(d) | | | 1.26 | %(d) | | | 1.32 | %(d) | | | 1.27 | %(d) | |
Total net expenses(e) | | | 1.20 | %(d)(f) | | | 1.17 | %(d)(f) | | | 1.19 | %(d)(f) | | | 1.18 | %(d)(f) | | | 1.16 | %(d)(f) | |
Net investment income | | | 2.27 | % | | | 2.65 | % | | | 4.05 | % | | | 3.35 | % | | | 3.09 | % | |
Supplemental data | |
Net assets, end of period (in thousands) | | $ | 52,360 | | | $ | 78,705 | | | $ | 125,914 | | | $ | 453,526 | | | $ | 924,777 | | |
Portfolio turnover | | | 77 | % | | | 80 | % | | | 14 | %(g) | | | — | % | | | — | % | |
Portfolio turnover of Columbia International Value Master Portfolio | | | — | % | | | — | % | | | 100 | %(h) | | | 13 | % | | | 16 | % | |
Notes to Financial Highlights
(a) Rounds to zero.
(b) The Fund received proceeds from regulatory settlements. Had the Fund not received these proceeds, the total return would have been lower by 0.04%.
(c) In addition to the fees and expenses that the Fund bears directly, the Fund indirectly bears a pro rata share of the fees and expenses of any other funds in which it invests. Such indirect expenses are not included in the Fund's reported expense ratios.
(d) Ratios include line of credit interest expense which is less than 0.01%.
(e) Total net expenses include the impact of certain fee waivers/expense reimbursements made by the Investment Manager and certain of its affiliates, if applicable.
(f) The benefits derived from expense reductions had an impact of less than 0.01%.
(g) Amount represents results after the Fund's conversion to a stand-alone structure.
(h) Amount represents results prior to the Fund's conversion to a stand-alone structure.
The accompanying Notes to Financial Statements are an integral part of this statement.
Annual Report 2016
27
COLUMBIA INTERNATIONAL VALUE FUND
NOTES TO FINANCIAL STATEMENTS
February 29, 2016
Note 1. Organization
Columbia International Value Fund (the Fund), a series of Columbia Funds Series Trust (the Trust), is a diversified fund. The Trust is registered under the Investment Company Act of 1940, as amended (the 1940 Act), as an open-end management investment company organized as a Delaware statutory trust.
Fund Shares
The Trust may issue an unlimited number of shares (without par value). The Fund offers Class A, Class B, Class C, Class I, Class R, Class R4, Class R5 and Class Z shares. Although all share classes generally have identical voting, dividend and liquidation rights, each share class votes separately when required by the Trust's organizational documents or by law. Different share classes pay different distribution amounts to the extent the expenses of such share classes differ, and distributions in liquidation will be proportional to the net asset value of each share class. Each share class has its own expense and sales charge structure.
Class A shares are subject to a maximum front-end sales charge of 5.75% based on the initial investment amount. Class A shares purchased without an initial sales charge in accounts aggregating $1 million to $50 million at the time of purchase are subject to a contingent deferred sales charge (CDSC) if the shares are sold within 18 months after purchase, charged as follows: 1.00% CDSC if redeemed within 12 months after purchase, and 0.50% CDSC if redeemed more than 12, but less than 18, months after purchase.
Class B shares may be subject to a maximum CDSC of 5.00% based upon the holding period after purchase. Class B shares will generally convert to Class A shares eight years after purchase. The Fund no longer accepts investments by new or existing investors in the Fund's Class B shares, except in connection with the reinvestment of any dividend and/or capital gain distributions in Class B shares of the Fund and exchanges by existing Class B shareholders of certain other funds within the Columbia Family of Funds.
Class C shares are subject to a 1.00% CDSC on shares redeemed within 12 months after purchase.
Class I shares are not subject to sales charges and are available only to the Columbia Family of Funds.
Class R shares are not subject to sales charges and are generally available only to certain retirement plans and other investors as described in the Fund's prospectus.
Class R4 shares are not subject to sales charges and are generally available only to omnibus retirement plans and certain investors as described in the Fund's prospectus.
Class R5 shares are not subject to sales charges and are generally available only to investors purchasing through authorized investment professionals and omnibus retirement plans.
Class Z shares are not subject to sales charges and are available only to eligible investors, which are subject to different investment minimums as described in the Fund's prospectus.
Note 2. Summary of Significant Accounting Policies
Basis of Preparation
The Fund is an investment company that applies the accounting and reporting guidance in the Financial Accounting Standards Board (FASB) Accounting Standards Codification Topic 946, Financial Services — Investment Companies (ASC 946). The financial statements are prepared in accordance with U.S. generally accepted accounting principles (GAAP), which requires management to make certain estimates and assumptions that affect the reported amounts of assets and liabilities, the disclosure of contingent assets and liabilities at the date of the financial statements and the reported amounts of income and expenses during the reporting period. Actual results could differ from those estimates.
The following is a summary of significant accounting policies followed by the Fund in the preparation of its financial statements.
Security Valuation
All equity securities and exchange-traded funds are valued at the close of business of the New York Stock Exchange (NYSE). Equity securities and exchange-traded funds are valued at the last quoted sales price on the principal exchange or market on which they trade, except for securities traded on the NASDAQ Stock Market, which are valued at the NASDAQ official close price. Unlisted securities or listed securities for which there were no sales during the day are valued at the mean of the latest quoted bid and ask prices on such exchanges or markets.
Foreign equity securities are valued based on the closing price on the foreign exchange in which such securities are primarily traded. If any foreign equity security closing
Annual Report 2016
28
COLUMBIA INTERNATIONAL VALUE FUND
NOTES TO FINANCIAL STATEMENTS (continued)
February 29, 2016
prices are not readily available, the securities are valued at the mean of the latest quoted bid and ask prices on such exchanges or markets. Foreign currency exchange rates are generally determined at 4:00 p.m. Eastern (U.S.) time. Many securities markets and exchanges outside the U.S. close prior to the close of the NYSE; therefore, the closing prices for securities in such markets or on such exchanges may not fully reflect events that occur after such close but before the close of the NYSE. In those situations, foreign securities will be fair valued pursuant to a policy adopted by the Board of Trustees (the Board), including, if available, utilizing a third party pricing service to determine these fair values. The third party pricing service takes into account multiple factors, including, but not limited to, movements in the U.S. securities markets, certain depositary receipts, futures contracts and foreign exchange rates that have occurred subsequent to the close of the foreign exchange or market, to determine a good faith estimate that reasonably reflects the current market conditions as of the close of the NYSE. The fair value of a security is likely to be different from the quoted or published price, if available.
Investments in open-end investment companies, including money market funds, are valued at their latest net asset value.
Forward foreign currency exchange contracts are marked-to-market based upon foreign currency exchange rates provided by a pricing service.
Option contracts are valued at the mean of the latest quoted bid and ask prices on their primary exchanges. Option contracts, including over-the-counter option contracts, with no readily available market quotations are valued using quotes obtained from independent brokers as of the close of the NYSE.
Investments for which market quotations are not readily available, or that have quotations which management believes are not reflective of market value or reliable, are valued at fair value as determined in good faith under procedures approved by and under the general supervision of the Board. If a security or class of securities (such as foreign securities) is valued at fair value, such value is likely to be different from the quoted or published price for the security.
The determination of fair value often requires significant judgment. To determine fair value, management may use assumptions including but not limited to future cash flows and estimated risk premiums. Multiple inputs from various sources may be used to determine fair value.
GAAP requires disclosure regarding the inputs and valuation techniques used to measure fair value and any changes in valuation inputs or techniques. In addition, investments shall be disclosed by major category. This information is disclosed following the Fund's Portfolio of Investments.
Foreign Currency Transactions and Translations
The values of all assets and liabilities denominated in foreign currencies are generally translated into U.S. dollars at exchange rates determined at the close of the NYSE on any given day. Net realized and unrealized gains (losses) on foreign currency transactions and translations include gains (losses) arising from the fluctuation in exchange rates between trade and settlement dates on securities transactions, gains (losses) arising from the disposition of foreign currency and currency gains (losses) between the accrual and payment dates on dividends, interest income and foreign withholding taxes.
For financial statement purposes, the Fund does not distinguish that portion of gains (losses) on investments which is due to changes in foreign exchange rates from that which is due to changes in market prices of the investments. Such fluctuations are included with the net realized and unrealized gains (losses) on investments in the Statement of Operations.
Derivative Instruments
The Fund invests in certain derivative instruments, as detailed below, to meet its investment objectives. Derivatives are instruments whose values depend on, or are derived from, in whole or in part, the value of one or more securities, currencies, commodities, indices, or other assets or instruments. Derivatives may be used to increase investment flexibility (including to maintain cash reserves while maintaining desired exposure to certain assets), for risk management (hedging) purposes, to facilitate trading, to reduce transaction costs and to pursue higher investment returns. The Fund may also use derivative instruments to mitigate certain investment risks, such as foreign currency exchange rate risk, interest rate risk and credit risk. Derivatives may involve various risks, including the potential inability of the counterparty to fulfill its obligation under the terms of the contract, the potential for an illiquid secondary market (making it difficult for the Fund to sell, including at favorable prices) and the potential for market movements which may expose the Fund to gains or losses in excess of the amount shown in the Statement of Assets and Liabilities. The notional amounts of derivative instruments, if applicable, are not recorded in the financial statements.
Annual Report 2016
29
COLUMBIA INTERNATIONAL VALUE FUND
NOTES TO FINANCIAL STATEMENTS (continued)
February 29, 2016
A derivative instrument may suffer a marked-to-market loss if the value of the contract decreases due to an unfavorable change in the market rates or values of the underlying instrument. Losses can also occur if the counterparty does not perform under the contract. The Fund's risk of loss from counterparty credit risk on over-the-counter derivatives is generally limited to the aggregate unrealized gain netted against any collateral held by the Fund and the amount of any variation margin held by the counterparty. With exchange-traded or centrally cleared derivatives, there is reduced counterparty credit risk to the Fund since the exchange's clearinghouse, as counterparty to such instruments, guarantees against a possible default. The clearinghouse stands between the buyer and the seller of the contract; therefore, the counterparty credit risk is failure of the clearinghouse. However, credit risk still exists in exchange-traded or centrally cleared derivatives with respect to initial and variation margin that is held in a broker's customer account. While brokers are required to segregate customer margin from their own assets, in the event that a broker becomes insolvent or goes into bankruptcy and at that time there is a shortfall in the aggregate amount of margin held by the broker for all its clients, U.S. bankruptcy laws will typically allocate that shortfall on a pro-rata basis across all the broker's customers (including the Fund), potentially resulting in losses to the Fund.
In order to better define its contractual rights and to secure rights that will help the Fund mitigate its counterparty risk, the Fund may enter into an International Swaps and Derivatives Association, Inc. Master Agreement (ISDA Master Agreement) or similar agreement with its derivatives contract counterparties. An ISDA Master Agreement is an agreement between the Fund and a counterparty that governs over-the-counter derivatives and forward foreign currency exchange contracts and typically contains, among other things, collateral posting terms and netting provisions in the event of a default and/or termination event. Under an ISDA Master Agreement, the Fund may, under certain circumstances, offset with the counterparty certain derivative instrument's payables and/or receivables with collateral held and/or posted and create one single net payment. The provisions of the ISDA Master Agreement typically permit a single net payment in the event of default (close-out netting) including the bankruptcy or insolvency of the counterparty. Note, however, that bankruptcy or insolvency laws of a particular jurisdiction may impose restrictions on or prohibitions against the right of offset in bankruptcy, insolvency or other events.
Collateral (margin) requirements differ by type of derivative. Margin requirements are established by the exchange or clearinghouse for exchange-traded and centrally cleared derivatives. Brokers can ask for margin in excess of the minimum in certain circumstances. Collateral terms are contract specific for over-the-counter derivatives. For over-the-counter derivatives traded under an ISDA Master Agreement, the collateral requirements are typically calculated by netting the marked-to-market amount for each transaction under such agreement and comparing that amount to the value of any variation margin currently pledged by the Fund and/or the counterparty. Generally, the amount of collateral due from or to a party has to exceed a minimum transfer amount threshold (e.g., $500,000) before a transfer has to be made. To the extent amounts due to the Fund from its counterparties are not fully collateralized, contractually or otherwise, the Fund bears the risk of loss from counterparty nonperformance. The Fund attempts to mitigate counterparty risk by only entering into agreements with counterparties that it believes have the financial resources to honor their obligations and by monitoring the financial stability of those counterparties.
Certain ISDA Master Agreements allow counterparties to over-the-counter derivatives transactions to terminate derivatives contracts prior to maturity in the event the Fund's net asset value declines by a stated percentage over a specified time period or if the Fund fails to meet certain terms of the ISDA Master Agreement, which would cause the Fund to accelerate payment of any net liability owed to the counterparty. The Fund also has termination rights if the counterparty fails to meet certain terms of the ISDA Master Agreement. In addition to considering counterparty credit risk, the Fund would consider terminating the derivatives contracts based on whether termination would result in a net liability owed from the counterparty.
For financial reporting purposes, the Fund does not offset derivative assets and derivative liabilities that are subject to netting arrangements in the Statement of Assets and Liabilities.
Forward Foreign Currency Exchange Contracts
Forward foreign currency exchange contracts are over-the-counter agreements between two parties to buy and sell a currency at a set price on a future date. The Fund utilized forward foreign currency exchange contracts to hedge the currency exposure associated with some or all of the Fund's securities, to shift investment exposure from one currency to another, to shift U.S. dollar
Annual Report 2016
30
COLUMBIA INTERNATIONAL VALUE FUND
NOTES TO FINANCIAL STATEMENTS (continued)
February 29, 2016
exposure to achieve a representative weighted mix of major currencies in its benchmark and/or to recover an underweight country exposure in its portfolio. These instruments may be used for other purposes in future periods.
The values of forward foreign currency exchange contracts fluctuate daily with changes in foreign currency exchange rates. Changes in the value of these contracts are recorded as unrealized appreciation or depreciation until the contract is exercised or has expired. The Fund will realize a gain or loss when the forward foreign currency exchange contract is closed or expires.
The use of forward foreign currency exchange contracts does not eliminate fluctuations in the prices of the Fund's portfolio securities. The risks of forward foreign currency exchange contracts include movement in the values of the foreign currencies relative to the U.S. dollar (or other foreign currencies) and the possibility that counterparties will not complete their contractual obligations, which may be in excess of the amount reflected, if any, in the Statement of Assets and Liabilities.
Options Contracts
Options are contracts which entitle the holder to purchase or sell securities or other identified assets at a specified price, or in the case of index option contracts, to receive or pay the difference between the index value and the strike price of the index option contract. Option contracts can be either exchange-traded or over-the-counter. The Fund purchased and wrote option contracts to decrease the Fund's exposure to equity market risk, to increase return on investments and to facilitate buying and selling of securities for investments. These instruments may be used for other purposes in future periods. Completion of transactions for option contracts traded in the over-the-counter market depends upon the performance of the other party. Cash collateral may be collected or posted by the Fund to secure certain over-the-counter option contract trades. Cash collateral held or posted by the Fund for such option contract trades must be returned to the counterparty or the Fund upon closure, exercise or expiration of the contract.
Options contracts purchased are recorded as investments. When the Fund writes an options contract, the premium received is recorded as an asset and an amount equivalent to the premium is recorded as a liability in the Statement of Assets and Liabilities and is subsequently adjusted to reflect the current fair value of the option written. Changes in the fair value of the written option are recorded as unrealized appreciation or depreciation until the contract is exercised or has expired.
The Fund will realize a gain or loss when the option contract is closed or expires. When option contracts are exercised, the proceeds on sales for a written call or purchased put option contract, or the purchase cost for a written put or purchased call option contract, is adjusted by the amount of premium received or paid.
For over-the-counter options purchased, the Fund bears the risk of loss of the amount of the premiums paid plus the positive change in market values net of any collateral held by the Fund should the counterparty fail to perform under the contracts. Option contracts written by the Fund do not typically give rise to counterparty credit risk, as options written generally obligate the Fund and not the counterparty to perform. The risk in writing a call option contract is that the Fund gives up the opportunity for profit if the market price of the security increases above the strike price and the option contract is exercised. The risk in writing a put option contract is that the Fund may incur a loss if the market price of the security decreases below the strike price and the option contract is exercised. Exercise of a written option could result in the Fund purchasing or selling a security or foreign currency when it otherwise would not, or at a price different from the current market value. In purchasing and writing options, the Fund bears the risk of an unfavorable change in the value of the underlying instrument or the risk that the Fund may not be able to enter into a closing transaction due to an illiquid market.
Contracts and premiums associated with options contracts written for the Year Ended February 29, 2016 are as follows:
| | | Calls | |
| | | Contracts | | Premiums ($) | |
Balance at February 28, 2015 | | | — | | | | — | | |
Opened | | | 54 | | | | (5,078 | ) | |
Closed | | | — | | | | — | | |
Expired | | | (54 | ) | | | 5,078 | | |
Exercised | | | — | | | | — | | |
Balance at February 29, 2016 | | | — | | | | — | | |
Effects of Derivative Transactions in the Financial Statements
The following tables are intended to provide additional information about the effect of derivatives on the financial statements of the Fund, including: the fair value of derivatives by risk category and the location of those fair values in the Statement of Assets and Liabilities; and the impact of derivative transactions over the period in the Statement of Operations, including realized and
Annual Report 2016
31
COLUMBIA INTERNATIONAL VALUE FUND
NOTES TO FINANCIAL STATEMENTS (continued)
February 29, 2016
unrealized gains (losses). The derivative instrument schedules following the Portfolio of Investments present additional information regarding derivative instruments outstanding at the end of the period, if any.
The following table is a summary of the fair value of derivative instruments (not considered to be hedging instruments for accounting disclosure purposes) at February 29, 2016:
Asset Derivatives | |
Risk Exposure
Category | | Statement of Assets and
Liabilities Location | | Fair Value ($) | |
Foreign exchange
risk | | Unrealized appreciation on
forward foreign currency
exchange contracts | | | 54,598
| | |
Liability Derivatives | |
Risk Exposure
Category | | Statement of Assets and
Liabilities Location | |
Fair Value ($) | |
Foreign exchange
risk | | Unrealized depreciation on
forward foreign currency
exchange contracts | | | 136,200
| | |
The following table indicates the effect of derivative instruments (not considered to be hedging instruments for accounting disclosure purposes) in the Statement of Operations for the year ended February 29, 2016:
Amount of Realized Gain (Loss) on Derivatives Recognized in Income | |
Risk Exposure
Category | | Forward Foreign
Currency Exchange
Contracts ($) | | Options
Contracts
Written ($) | | Total ($) | |
Equity risk | | | — | | | | 5,078 | | | | 5,078 | | |
Foreign exchange risk | | | (632,440 | ) | | | — | | | | (632,440 | ) | |
Total | | | (632,440 | ) | | | 5,078 | | | | (627,362 | ) | |
Change in Unrealized Appreciation (Depreciation) on
Derivatives Recognized in Income | |
Risk Exposure Category | | Forward Foreign Currency
Exchange Contracts ($) | |
Foreign exchange risk | | | (339,955 | ) | |
The following table provides a summary of the average outstanding volume by derivative instrument for the year ended February 29, 2016:
Derivative Instrument | | Average market value ($)* | |
Options contracts — Written | | | — | | |
Derivative Instrument | | Average unrealized
appreciation ($)** | | Average unrealized
depreciation ($)** | |
Forward foreign currency
exchange contracts | | | 209,902 | | | | (363,162) | | |
*Based on the ending quarterly outstanding amounts for the year ended February 29, 2016. While there was no market value of options outstanding at any quarter end, the Fund did enter into options during the year; the gain (loss) associated with this activity is presented in the Statement of Operations.
**Based on the ending quarterly outstanding amounts for the year ended February 29, 2016.
Offsetting of Assets and Liabilities
The following table presents the Fund's gross and net amount of assets and liabilities available for offset under netting arrangements as well as any related collateral received or pledged by the Fund as of February 29, 2016:
| | | Toronto Dominion ($) | |
Assets | |
Forward foreign currency exchange contracts | | | 54,598 | | |
Liabilities | |
Forward foreign currency exchange contracts | | | 136,200 | | |
Total Financial and Derivative Net Assets | | | (81,602 | ) | |
Total collateral received (pledged)(a) | | | — | | |
Net Amount(b) | | | (81,602 | ) | |
(a) In some instances, the actual collateral received and/or pledged may be more than the amount shown due to overcollateralization.
(b) Represents the net amount due from/(to) counterparties in the event of default.
Security Transactions
Security transactions are accounted for on the trade date. Cost is determined and gains (losses) are based upon the specific identification method for both financial statement and federal income tax purposes.
Income Recognition
Corporate actions and dividend income are generally recorded net of any non-reclaimable tax withholdings, on the ex-dividend date or upon receipt of ex-dividend notification in the case of certain foreign securities.
The Fund may receive distributions from holdings in equity securities, business development companies (BDCs), exchange-traded funds, other regulated investment companies (RICs), and real estate investment trusts (REITs), which report information on the tax character of their distributions annually. These distributions are allocated to dividend income, capital gain and return of capital based on actual information reported. Return of capital is recorded as a reduction of the cost basis of securities held. If the Fund no longer owns the applicable securities, return of capital is recorded as a realized gain. With respect to REITs, to the extent actual information has not yet been reported, estimates for return of capital are made by the Fund's management. Management's estimates are subsequently adjusted when the actual character of the distributions is disclosed by the REITs, which could result
Annual Report 2016
32
COLUMBIA INTERNATIONAL VALUE FUND
NOTES TO FINANCIAL STATEMENTS (continued)
February 29, 2016
in a proportionate change in return of capital to shareholders.
Awards from class action litigation are recorded as a reduction of cost basis if the Fund still owns the applicable securities on the payment date. If the Fund no longer owns the applicable securities, the proceeds are recorded as realized gains.
Expenses
General expenses of the Trust are allocated to the Fund and other funds of the Trust based upon relative net assets or other expense allocation methodologies determined by the nature of the expense. Expenses directly attributable to the Fund are charged to the Fund. Expenses directly attributable to a specific class of shares are charged to that share class.
Determination of Class Net Asset Value
All income, expenses (other than class-specific expenses, which are charged to that share class, as shown in the Statement of Operations) and realized and unrealized gains (losses) are allocated to each class of the Fund on a daily basis, based on the relative net assets of each class, for purposes of determining the net asset value of each class.
Federal Income Tax Status
The Fund intends to qualify each year as a regulated investment company under Subchapter M of the Internal Revenue Code, as amended, and will distribute substantially all of its taxable income (including net short-term capital gains), if any, for its tax year, and as such will not be subject to federal income taxes. In addition, the Fund intends to distribute in each calendar year substantially all of its net investment income, capital gains and certain other amounts, if any, such that the Fund should not be subject to federal excise tax. Therefore, no federal income or excise tax provision is recorded.
Foreign Taxes
The Fund may be subject to foreign taxes on income, gains on investments or currency repatriation, a portion of which may be recoverable. The Fund will accrue such taxes and recoveries, as applicable, based upon its current interpretation of tax rules and regulations that exist in the markets in which it invests.
Realized gains in certain countries may be subject to foreign taxes at the Fund level, based on statutory rates. The Fund accrues for such foreign taxes on realized and unrealized gains at the appropriate rate for each jurisdiction, as applicable. The amount, if any, is
disclosed as a liability on the Statement of Assets and Liabilities.
Distributions to Shareholders
Distributions from net investment income, if any, are declared and paid semi-annually. Net realized capital gains, if any, are distributed at least annually. Income distributions and capital gain distributions are determined in accordance with federal income tax regulations, which may differ from GAAP.
Guarantees and Indemnifications
Under the Trust's organizational documents and, in some cases, by contract, its officers and trustees are indemnified against certain liabilities arising out of the performance of their duties to the Trust or its funds. In addition, certain of the Fund's contracts with its service providers contain general indemnification clauses. The Fund's maximum exposure under these arrangements is unknown since the amount of any future claims that may be made against the Fund cannot be determined, and the Fund has no historical basis for predicting the likelihood of any such claims.
Recent Accounting Pronouncement
Fair Value Measurement (Topic 820), Disclosure for Investments in Certain Entities That Calculate Net Asset Value per Share (or Its Equivalent)
In May 2015, FASB issued Accounting Standards Update (ASU) No. 2015-07, Fair Value Measurement (Topic 820), Disclosure for Investments in Certain Entities That Calculate Net Asset Value per Share (or Its Equivalent). ASU No. 2015-07 changes the disclosure requirements for investments for which fair value is measured using the net asset value per share practical expedient. The disclosure requirements are effective for annual periods beginning after December 15, 2015 and interim periods within those fiscal years. At this time, management is evaluating the implications of this guidance and the impact it will have on the financial statement amounts and footnote disclosures, if any.
Note 3. Fees and Other Transactions with Affiliates
Management Fees
Effective July 1, 2015, the Fund entered into a Management Agreement with Columbia Management Investment Advisers, LLC (the Investment Manager), a wholly-owned subsidiary of Ameriprise Financial, Inc. (Ameriprise Financial). Under the Management Agreement, the Investment Manager provides the Fund
Annual Report 2016
33
COLUMBIA INTERNATIONAL VALUE FUND
NOTES TO FINANCIAL STATEMENTS (continued)
February 29, 2016
with investment research and advice, as well as administrative and accounting services. The management services fee is an annual fee that is equal to a percentage of the Fund's average daily net assets that declines from 0.87% to 0.67% as the Fund's net assets increase. The effective management services fee rate for the year ended February 29, 2016 was 0.87% of the Fund's average daily net assets.
Prior to July 1, 2015, the Fund paid the Investment Manager an annual fee for advisory services under an Investment Management Services Agreement and a separate annual fee for administrative and accounting services under an Administrative Services Agreement. For the period from March 1, 2015 through June 30, 2015, the investment advisory services fee paid to the Investment Manager was $500,363, and the administrative services fee paid to the Investment Manager was $50,670.
Other Expenses
Other expenses are for, among other things, miscellaneous expenses of the Fund or the Board, including payments to Board Services Corp., a company providing limited administrative services to the Fund and the Board. That company's expenses include boardroom and office expense, employee compensation, employee health and retirement benefits, and certain other expenses. For the year ended February 29, 2016, other expenses paid by the Fund to this company were $1,553.
Compensation of Board Members
Board members, who are not officers or employees of the Investment Manager or Ameriprise Financial, are compensated for their services to the Fund as disclosed in the Statement of Operations. Under a Deferred Compensation Plan (the Plan), these Board members may elect to defer payment of up to 100% of their compensation. Deferred amounts are treated as though equivalent dollar amounts had been invested in shares of certain funds managed by the Investment Manager. The Fund's liability for these amounts is adjusted for market value changes and remains in the Fund until distributed in accordance with the Plan. All amounts payable under the Plan constitute a general unsecured obligation of the Fund.
Transfer Agency Fees
Under a Transfer and Dividend Disbursing Agent Agreement, Columbia Management Investment Services Corp. (the Transfer Agent), an affiliate of the Investment Manager and a wholly-owned subsidiary of Ameriprise Financial, is responsible for providing transfer agency
services to the Fund. The Transfer Agent has contracted with Boston Financial Data Services (BFDS) to serve as sub-transfer agent.
The Transfer Agent receives a monthly transfer agency fee based on the number or the average value of accounts, depending on the type of account. In addition, the Transfer Agent also receives sub-transfer agency fees based on a percentage of the average aggregate value of the Fund's shares maintained in omnibus accounts (other than omnibus accounts for which American Enterprise Investment Services Inc. is the broker of record or accounts where the beneficial shareholder is a customer of Ameriprise Financial Services, Inc., for which the Transfer Agent receives a per account fee). The Transfer Agent pays the fees of BFDS for services as sub-transfer agent and is not entitled to reimbursement for such fees from the Fund (with the exception of out-of-pocket fees).
The Transfer Agent also receives compensation from the Fund for various shareholder services and reimbursements for certain out-of-pocket fees. Class I shares do not pay transfer agency fees. Total transfer agency fees for Class R5 shares are subject to an annual limitation of not more than 0.05% of the average daily net assets attributable to Class R5 shares.
For the year ended February 29, 2016, the Fund's effective transfer agency fee rates as a percentage of average daily net assets of each class were as follows:
Class A | | | 0.19 | % | |
Class B | | | 0.19 | | |
Class C | | | 0.19 | | |
Class R | | | 0.19 | | |
Class R4 | | | 0.19 | | |
Class R5 | | | 0.05 | | |
Class Z | | | 0.19 | | |
An annual minimum account balance fee of $20 may apply to certain accounts with a value below the applicable share class's initial minimum investment requirements to reduce the impact of small accounts on transfer agency fees. These minimum account balance fees are remitted to the Fund and recorded as part of expense reductions in the Statement of Operations. For the year ended February 29, 2016, these minimum account balance fees reduced total expenses of the Fund by $560.
Distribution and Service Fees
The Fund has an agreement with Columbia Management Investment Distributors, Inc. (the Distributor), an affiliate
Annual Report 2016
34
COLUMBIA INTERNATIONAL VALUE FUND
NOTES TO FINANCIAL STATEMENTS (continued)
February 29, 2016
of the Investment Manager and a wholly-owned subsidiary of Ameriprise Financial, for distribution and shareholder services. The Board has approved, and the Fund has adopted, distribution and shareholder service plans (the Plans) applicable to certain share classes, which set the distribution and service fees for the Fund. These fees are calculated daily and are intended to compensate the Distributor and/or eligible selling and/or servicing agents for selling shares of the Fund and providing services to investors.
Under the Plans, the Fund pays a monthly combined distribution and service fee to the Distributor at the maximum annual rate of 0.25% of the average daily net assets attributable to Class A shares of the Fund. Also under the Plans, the Fund pays a monthly service fee at the maximum annual rate of 0.25% of the average daily net assets attributable to Class B and Class C shares of the Fund and a monthly distribution fee at the maximum annual rate of 0.75%, 0.75% and 0.50% of the average daily net assets attributable to Class B, Class C and Class R shares of the Fund, respectively.
Sales Charges
Sales charges, including front-end charges and CDSCs, received by the Distributor for distributing Fund shares were $66,994 for Class A, $0 for Class B and $1,683 for Class C shares for the year ended February 29, 2016.
Expenses Waived/Reimbursed by the Investment Manager and its Affiliates
The Fund's expense ratio is subject to an expense reimbursement arrangement pursuant to which fees will be waived and/or expenses reimbursed (excluding certain fees and expenses described below), so that the Fund's net operating expenses, after giving effect to fees waived/expenses reimbursed and any balance credits and/or overdraft charges from the Fund's custodian, do not exceed the annual rates of:
| | | Contractual
Expense Cap
July 1, 2015
through
June 30, 2016 | | Voluntary
Expense Cap
Prior to
July 1, 2015 | |
Class A | | | 1.46 | % | | | 1.42 | % | |
Class B | | | 2.21 | | | | 2.17 | | |
Class C | | | 2.21 | | | | 2.17 | | |
Class I | | | 1.07 | | | | 1.03 | | |
Class R | | | 1.71 | | | | 1.67 | | |
Class R4 | | | 1.21 | | | | 1.17 | | |
Class R5 | | | 1.12 | | | | 1.08 | | |
Class Z | | | 1.21 | | | | 1.17 | | |
The contractual agreement may be modified or amended only with approval from the Investment Manager, certain of its affiliates and the Fund. Under the arrangements, the following fees and expenses are excluded from the waiver/reimbursement commitment, and therefore will be paid by the Fund, if applicable: taxes (including foreign transaction taxes), expenses associated with investments in affiliated and non-affiliated pooled investment vehicles (including mutual funds and exchange-traded funds), transaction costs and brokerage commissions, costs related to any securities lending program, dividend and interest expenses associated with securities sold short, inverse floater program fees and expenses, transaction charges and interest on borrowed money, interest and extraordinary expenses. Any fees waived and/or expenses reimbursed under the expense reimbursement arrangements described above are not recoverable by the Investment Manager or its affiliates in future periods.
Note 4. Federal Tax Information
The timing and character of income and capital gain distributions are determined in accordance with income tax regulations, which may differ from GAAP because of temporary or permanent book to tax differences.
At February 29, 2016, these differences are primarily due to differing treatment for capital loss carryforwards, deferral/reversal of wash sale losses, Trustees' deferred compensation, foreign currency transactions, passive foreign investment company (PFIC) holdings and derivative investments. To the extent these differences are permanent, reclassifications are made among the components of the Fund's net assets in the Statement of Assets and Liabilities. Temporary differences do not require reclassifications. In the Statement of Assets and Liabilities the following reclassifications were made:
Excess of distributions over net investment income | | $ | (43,415 | ) | |
Accumulated net realized loss | | | 43,419 | | |
Paid-in capital | | | (4 | ) | |
Net investment income (loss) and net realized gains (losses), as disclosed in the Statement of Operations, and net assets were not affected by this reclassification.
The tax character of distributions paid during the years indicated was as follows:
Year Ended | | February 29,
2016 | | February 28,
2015 | |
Ordinary income | | $ | 3,408,087 | | | $ | 8,643,871 | | |
Short-term capital gain distributions, if any, are considered ordinary income distributions for tax purposes.
Annual Report 2016
35
COLUMBIA INTERNATIONAL VALUE FUND
NOTES TO FINANCIAL STATEMENTS (continued)
February 29, 2016
At February 29, 2016, the components of distributable earnings on a tax basis were as follows:
Undistributed ordinary income | | $ | 35,092 | | |
Capital loss carryforwards | | | (535,742,170 | ) | |
Net unrealized depreciation | | | (30,371,112 | ) | |
At February 29, 2016, the cost of investments for federal income tax purposes was $193,901,455 and the aggregate gross unrealized appreciation and depreciation based on that cost was:
Unrealized appreciation | | $ | 6,421,883 | | |
Unrealized depreciation | | | (36,792,995 | ) | |
Net unrealized depreciation | | $ | (30,371,112 | ) | |
The following capital loss carryforwards, determined at February 29, 2016, may be available to reduce taxable income arising from future net realized gains on investments, if any, to the extent permitted by the Internal Revenue Code:
Year of Expiration | | Amount ($) | |
2018 | | | 185,725,377 | | |
2019 | | | 68,376,538 | | |
No expiration — long-term | | | 281,640,255 | | |
Total | | | 535,742,170 | | |
Capital loss carryforwards with no expiration are required to be utilized prior to any capital losses which carry an expiration date. As a result of this ordering rule, capital loss carryforwards which carry an expiration date may be more likely to expire unused.
For the year ended February 29, 2016, $9,843,615 of capital loss carryforward was utilized.
Management of the Fund has concluded that there are no significant uncertain tax positions in the Fund that would require recognition in the financial statements. However, management's conclusion may be subject to review and adjustment at a later date based on factors including, but not limited to, new tax laws, regulations, and administrative interpretations (including relevant court decisions). Generally, the Fund's federal tax returns for the prior three fiscal years remain subject to examination by the Internal Revenue Service.
Note 5. Portfolio Information
The cost of purchases and proceeds from sales of securities, excluding short-term investments and derivatives, if any, aggregated to $137,744,659 and $136,189,138, respectively, for the year ended February 29, 2016. The amount of purchase and sale
activity impacts the portfolio turnover rate reported in the Financial Highlights.
Note 6. Regulatory Settlements
During the year ended February 29, 2016, the Fund recorded a receivable of $66,145 as a result of a regulatory settlement proceeding brought by the Securities and Exchange Commission against an unaffiliated third party relating to market timing and/or late trading of mutual funds. This amount represented the Fund's portion of the proceeds from the settlement (neither the Fund nor the Investment Manager were a party to the proceeding). The payments have been included in Proceeds from regulatory settlements in the Statement of Changes in Net Assets.
Note 7. Affiliated Money Market Fund
The Fund invests in Columbia Short-Term Cash Fund, an affiliated money market fund established for the exclusive use by the Fund and other affiliated funds. The income earned by the Fund from such investments is included as Dividends — affiliated issuers in the Statement of Operations. As an investing fund, the Fund indirectly bears its proportionate share of the expenses of Columbia Short-Term Cash Fund.
Note 8. Line of Credit
The Fund has access to a revolving credit facility whereby the Fund may borrow for the temporary funding of shareholder redemptions or for other temporary or emergency purposes. Effective December 8, 2015, Citibank, N.A. and HSBC Bank USA, N.A. joined JPMorgan Chase Bank, N.A. (JPMorgan) as lead of a syndicate of banks under the credit facility, which is a collective agreement between the Fund and certain other funds managed by the Investment Manager, severally and not jointly, that permits collective borrowings up to $1 billion. Interest is charged to each participating fund based on its borrowings at a rate equal to the higher of (i) the overnight federal funds rate plus 1.00% or (ii) the one-month LIBOR rate plus 1.00%. Each borrowing under the credit facility matures no later than 60 days after the date of borrowing. The Fund also pays a commitment fee equal to its pro rata share of the amount of the credit facility at a rate of 0.15% per annum. The commitment fee is included in other expenses in the Statement of Operations. Prior to December 8, 2015, JPMorgan was the sole lead bank under the credit facility agreement that permitted borrowings up to $550 million under the same terms and interest rates as described above with
Annual Report 2016
36
COLUMBIA INTERNATIONAL VALUE FUND
NOTES TO FINANCIAL STATEMENTS (continued)
February 29, 2016
the exception of the commitment fee which was charged at a rate of 0.075% per annum.
For the year ended February 29, 2016, the average daily loan balance outstanding on days when borrowing existed was $4,975,000 at a weighted average interest rate of 1.30%. Interest expense incurred by the Fund is recorded as a line of credit interest expense in the Statement of Operations. The Fund had no outstanding borrowings at February 29, 2016.
Note 9. Significant Risks
Shareholder Concentration Risk
At February 29, 2016, three unaffiliated shareholders of record owned 45.7% of the outstanding shares of the Fund in one or more accounts. The Fund has no knowledge about whether any portion of those shares was owned beneficially. Subscription and redemption activity by concentrated accounts may have a significant effect on the operations of the Fund. In the case of a large redemption, the Fund may be forced to sell investments at inopportune times, including its liquid or more liquid positions, resulting in Fund losses and the Fund holding a higher percentage of less liquid or illiquid securities. Large redemptions could result in decreased economies of scale and increased operating expenses for non-redeeming Fund shareholders.
Financial Sector Risk
The Fund may be more susceptible to the particular risks that may affect companies in the financial services sector than if it were invested in a wider variety of companies in unrelated sectors. Companies in the financial services sector are subject to certain risks, including the risk of regulatory change, decreased liquidity in credit markets and unstable interest rates. Such companies may have concentrated portfolios, such as a high level of loans to real estate developers, which makes them vulnerable to economic conditions that affect that industry. Performance of such companies may be affected by competitive pressures and exposure to investments or agreements that, under certain circumstances, may lead to losses (e.g., subprime loans). Companies in the financial services sector are subject to extensive governmental regulation that may limit the amount and types of loans and other financial commitments they can make, and interest rates and fees that they may charge. In addition, profitability of such companies is largely dependent upon the availability and the cost of capital.
Foreign Securities and Emerging Market Countries Risk
Investing in foreign securities may include certain risks and considerations not typically associated with investing in U.S. securities, such as fluctuating currency values and changing local and regional economic, political and social conditions, which may result in greater market volatility. In addition, certain foreign securities may not be as liquid as U.S. securities. Investing in emerging markets may accentuate these risks. These countries are also more likely to experience high levels of inflation, deflation or currency devaluation which could hurt their economies and securities markets. To the extent that the Fund concentrates its investment exposure to any one or a few specific countries, the Fund will be particularly susceptible to the various conditions, events or other factors impacting those countries and may, therefore, have a greater risk than that of a fund which is more geographically diversified.
Note 10. Subsequent Events
Management has evaluated the events and transactions that have occurred through the date the financial statements were issued. Other than as noted below, there were no items requiring adjustment of the financial statements or additional disclosure.
In December 2015, the Board approved a proposal to merge the Fund into Columbia Overseas Value Fund. Shareholders of the Fund will vote on the proposed merger at a special meeting of shareholders to be held during the first half of 2016. If approved by shareholders, the merger is expected to take place shortly thereafter.
Note 11. Information Regarding Pending and Settled Legal Proceedings
In December 2005, without admitting or denying the allegations, American Express Financial Corporation (AEFC, which is now known as Ameriprise Financial, Inc. (Ameriprise Financial)) entered into settlement agreements with the Securities and Exchange Commission (SEC) and Minnesota Department of Commerce (MDOC) related to market timing activities. As a result, AEFC was censured and ordered to cease and desist from committing or causing any violations of certain provisions of the Investment Advisers Act of 1940, the Investment Company Act of 1940, and various Minnesota laws. AEFC agreed to pay disgorgement of $10 million and civil money penalties of $7 million. AEFC also agreed to retain an independent distribution consultant to assist in developing a plan for distribution
Annual Report 2016
37
COLUMBIA INTERNATIONAL VALUE FUND
NOTES TO FINANCIAL STATEMENTS (continued)
February 29, 2016
of all disgorgement and civil penalties ordered by the SEC in accordance with various undertakings detailed at http://www.sec.gov/litigation/admin/ia-2451.pdf. Ameriprise Financial and its affiliates have cooperated with the SEC and the MDOC in these legal proceedings, and have made regular reports to the Funds' Boards of Trustees.
Ameriprise Financial and certain of its affiliates have historically been involved in a number of legal, arbitration and regulatory proceedings, including routine litigation, class actions, and governmental actions, concerning matters arising in connection with the conduct of their business activities. Ameriprise Financial believes that the Funds are not currently the subject of, and that neither Ameriprise Financial nor any of its affiliates are the subject of, any pending legal, arbitration or regulatory proceedings that are likely to have a material adverse effect on the Funds or the ability of Ameriprise Financial or its affiliates to perform under their contracts with the Funds. Ameriprise Financial is required to make quarterly (10-Q), annual (10-K) and, as necessary, 8-K filings with the SEC on legal and regulatory matters that relate to Ameriprise Financial and its affiliates. Copies of these filings may be obtained by accessing the SEC website at www.sec.gov.
There can be no assurance that these matters, or the adverse publicity associated with them, will not result in increased fund redemptions, reduced sale of fund shares or other adverse consequences to the Funds. Further, although we believe proceedings are not likely to have a material adverse effect on the Funds or the ability of Ameriprise Financial or its affiliates to perform under their contracts with the Funds, these proceedings are subject to uncertainties and, as such, we are unable to estimate the possible loss or range of loss that may result. An adverse outcome in one or more of these proceedings could result in adverse judgments, settlements, fines, penalties or other relief that could have a material adverse effect on the consolidated financial condition or results of operations of Ameriprise Financial.
Annual Report 2016
38
COLUMBIA INTERNATIONAL VALUE FUND
REPORT OF INDEPENDENT REGISTERED PUBLIC ACCOUNTING FIRM
To the Trustees of Columbia Funds Series Trust and the Shareholders of
Columbia International Value Fund
In our opinion, the accompanying statement of assets and liabilities, including the portfolio of investments, and the related statements of operations and of changes in net assets and the financial highlights present fairly, in all material respects, the financial position of Columbia International Value Fund (the "Fund," a series of Columbia Funds Series Trust) at February 29, 2016, and the results of its operations, the changes in its net assets and the financial highlights for each of the periods indicated, in conformity with accounting principles generally accepted in the United States of America. These financial statements and financial highlights (hereafter referred to as "financial statements") are the responsibility of the Fund's management. Our responsibility is to express an opinion on these financial statements based on our audits. We conducted our audits of these financial statements in accordance with the standards of the Public Company Accounting Oversight Board (United States). Those standards require that we plan and perform the audit to obtain reasonable assurance about whether the financial statements are free of material misstatement. An audit includes examining, on a test basis, evidence supporting the amounts and disclosures in the financial statements, assessing the accounting principles used and significant estimates made by management, and evaluating the overall financial statement presentation. We believe that our audits, which included confirmation of securities at February 29, 2016 by correspondence with the custodian, brokers and transfer agent, and the application of alternative auditing procedures where such confirmations had not been received, provide a reasonable basis for our opinion.
PricewaterhouseCoopers LLP
Minneapolis, MN
April 21, 2016
Annual Report 2016
39
COLUMBIA INTERNATIONAL VALUE FUND
FEDERAL INCOME TAX INFORMATION
(Unaudited)
The Fund hereby designates the following tax attributes for the fiscal year ended February 29, 2016. Shareholders will be notified in early 2017 of the amounts for use in preparing 2016 income tax returns.
Tax Designations:
| Qualified Dividend Income | | | 100.00 | % | |
Foreign Taxes Paid | | $ | 442,616 | | |
Foreign Taxes Paid Per Share | | $ | 0.03 | | |
Foreign Source Income | | $ | 6,598,228 | | |
Foreign Source Income Per Share | | $ | 0.51 | | |
Qualified Dividend Income. For taxable, non-corporate shareholders, the percentage of ordinary income distributed during the fiscal year that represents qualified dividend income subject to reduced tax rates.
Foreign Taxes. The Fund makes the election to pass through to shareholders the foreign taxes paid. Eligible shareholders may claim a foreign tax credit. These taxes, and the corresponding foreign source income, are provided.
Annual Report 2016
40
COLUMBIA INTERNATIONAL VALUE FUND
Shareholders elect the Board that oversees the Fund's operations. The Board appoints officers who are responsible for day-to-day business decisions based on policies set by the Board. The following table provides basic biographical information about the Fund's Trustees, including their principal occupations during the past five years, although specific titles for individuals may have varied over the period. Under current Board policy, members generally may serve through the end of the calendar year in which they reach either the mandatory retirement age established by the Board or the fifteenth anniversary of the first Board meeting they attended as a member of the Board.
Trustees
Independent Trustees
Name,
Address,
Year of Birth | | Position Held With
the Funds and Length of
Service | | Principal Occupation(s)
During the Past Five Years
and Other Relevant
Professional Experience | | Number of
Funds in the
Columbia
Funds Complex
Overseen | | Other Directorships
Held by Trustee
During the Past
Five Years | |
Kathleen Blatz
901 S. Marquette Ave.
Minneapolis, MN 55402
1954 | | Trustee since 1/06 for RiverSource Funds and since 6/11 for Nations Funds | | Attorney; specializing in arbitration and mediation; Chief Justice, Minnesota Supreme Court, 1998-2006; Associate Justice, Minnesota Supreme Court, 1996-1998; Fourth Judicial District Court Judge, Hennepin County, 1994-1996; Attorney in private practice and public service, 1984-1993; State Representative, Minnesota House of Representatives, 1979-1993, which included service on the Tax and Financial Institutions and Insurance Committees | | | 124 | | | Trustee, BlueCross BlueShield of Minnesota (Chair of the Business Development Committee) since 2009; Chair of the Robina Foundation since August 2013 | |
Edward J. Boudreau, Jr.
901 S. Marquette Ave.
Minneapolis, MN 55402
1944 | | Trustee since 6/11 for RiverSource Funds and since 1/05 for Nations Funds | | Managing Director, E.J. Boudreau & Associates (consulting) since 2000; FINRA Industry Arbitrator, 2002-present; Chairman and Chief Executive Officer, John Hancock Funds (asset management), Chairman and Interested Trustee for open-end and closed-end funds offered by John Hancock, 1989-2000; John Hancock Life Insurance Company, including SVP and Treasurer and SVP Information Technology, 1968-1988 | | | 122 | | | Former Trustee, Boston Museum of Science (Chair of Finance Committee), 1985-2013; former Trustee, BofA Funds Series Trust (11 funds), 2005-2011 | |
Pamela G. Carlton
901 S. Marquette Ave.
Minneapolis, MN 55402
1954 | | Trustee since 7/07 for RiverSource Funds and since 6/11 for Nations Funds | | President, Springboard-Partners in Cross Cultural Leadership (consulting company) since 2003; Managing Director of US Equity Research, JP Morgan Chase, 1999-2003; Director of US Equity Research, Chase Asset Management, 1996-1999; Co-Director Latin America Research, 1993-1996, COO Global Research, 1992-1996, Co-Director of US Research, 1991-1992, Investment Banker, Morgan Stanley, 1982-1991 | | | 124 | | | Trustee, New York Presbyterian Hospital Board (Executive Committee and Chair of Human Resources Committee) since 1996 | |
Annual Report 2016
41
COLUMBIA INTERNATIONAL VALUE FUND
TRUSTEES AND OFFICERS (continued)
Independent Trustees (continued)
Name,
Address,
Year of Birth | | Position Held With
the Funds and Length of
Service | | Principal Occupation(s)
During the Past Five Years
and Other Relevant
Professional Experience | | Number of
Funds in the
Columbia
Funds Complex
Overseen | | Other Directorships
Held by Trustee
During the Past
Five Years | |
William P. Carmichael
901 S. Marquette Ave.
Minneapolis, MN 55402
1943 | | Trustee since 6/11 for RiverSource Funds and since 2003 for Nations Funds; Chair of the Board from 1/14-11/15 | | Retired; Co-founder, The Succession Fund (provides exit strategies to owners of privately held companies), 1998-2007; Adjunct Professor of Finance, Kelley School of Business, Indiana University, 1993-2007; Senior Vice President, Sara Lee Corporation, 1991-1993; Senior Vice President and Chief Financial Officer, Beatrice Foods Company, 1984-1990; Vice President, Esmark, Inc., 1973-1984; Associate, Price Waterhouse, 1968-1972 | | | 124 | | | Director, The Finish Line (athletic shoes and apparel) since July 2003; Director, International Textile Corp. since 2012; Director, hhgregg since May, 2015; former Director, Cobra Electronics Corporation (electronic equipment manufacturer), 1994-August 2014; former Director, Spectrum Brands, Inc. (consumer products), 2002-2009; former Director, Simmons Company (bedding), 2004-2010; former Trustee, BofA Funds Series Trust (11 funds), 2009-2011; former Director, McMoRan Exploration Company (oil and gas exploration and development), 2010-2013 | |
Patricia M. Flynn
901 S. Marquette Ave.
Minneapolis, MN 55402
1950 | | Trustee since 11/04 for RiverSource Funds and since 6/11 for Nations Funds | | Trustee Professor of Economics and Management, Bentley University since 1976 (also teaches and conducts research on corporate governance); Dean, McCallum Graduate School of Business, Bentley University, 1992-2002 | | | 124 | | | Trustee, MA Taxpayers Foundation since 1997; Board of Governors, Innovation Institute, MA Technology Collaborative since 2010 | |
William A. Hawkins
901 S. Marquette Ave.
Minneapolis, MN 55402
1942 | | Chair of the Board since 11/15; Trustee since 6/11 for RiverSource Funds and since 1/05 for Nations Funds | | Managing Director, Overton Partners (financial consulting) since August 2010; President and Chief Executive Officer, California General Bank, N.A., January 2008-August 2010; Operation Hope, COO, 2004-2007; IndyMac Bancorp, President, CBG, 1999-2003; American General Bank, President, 1997-1999; Griffin Financial Services, CEO, 1981-1997; The Griffin Funds, CEO, 1992-1998 | | | 124 | | | Former Trustee, BofA Funds Series Trust (11 funds), 2009-2015 | |
R. Glenn Hilliard
901 S. Marquette Ave.
Minneapolis, MN 55402
1943 | | Trustee since 6/11 for RiverSource Funds and since 1/05 for Nations Funds | | Chairman and Chief Executive Officer, Hilliard Group LLC (investing and consulting) since April 2003; Non-Executive Director & Chairman, CNO Financial Group, Inc. (insurance), 2003-2011; Chair & CEO, ING Americas, 1996-2003 | | | 122 | | | Chairman, BofA Funds Series Trust (11 funds); former Director, CNO Financial Group, Inc. (insurance), 2003-2011 | |
Annual Report 2016
42
COLUMBIA INTERNATIONAL VALUE FUND
TRUSTEES AND OFFICERS (continued)
Independent Trustees (continued)
Name,
Address,
Year of Birth | | Position Held With
the Funds and Length of
Service | | Principal Occupation(s)
During the Past Five Years
and Other Relevant
Professional Experience | | Number of
Funds in the
Columbia
Funds Complex
Overseen | | Other Directorships
Held by Trustee
During the Past
Five Years | |
Catherine James Paglia
901 S. Marquette Ave.
Minneapolis, MN 55402
1952 | | Trustee since 11/04 for RiverSource Funds and since 6/11 for Nations Funds | | Director, Enterprise Asset Management, Inc. (private real estate and asset management company) since September 1998; Managing Director and Partner, Interlaken Capital, Inc., 1989-1997; Managing Director, Morgan Stanley, 1982-1989; Vice President, Investment Banking, 1980-1982, Associate, Investment Banking, 1976-1980, Dean Witter Reynolds, Inc. | | | 124 | | | Director, Valmont Industries, Inc. (irrigation systems manufacturer) since 2012; Trustee, Carleton College (on the Investment Committee); Trustee, Carnegie Endowment for International Peace (on the Investment Committee) | |
Leroy C. Richie
901 S. Marquette Ave.
Minneapolis, MN 55402
1941 | | Trustee since 2000 for Seligman Funds, since 11/08 for RiverSource Funds and since 6/11 for Nations Funds | | Counsel, Lewis & Munday, P.C. (law firm) since 2004; Vice President and General Counsel, Automotive Legal Affairs, Chrysler Corporation, 1993-1997 | | | 122 | | | Lead Outside Director, Infinity Resources, Inc. (oil and gas exploration and production) since 1994; Lead Outside Director, Digital Ally, Inc. (digital imaging) since September 2005; Trustee, Marygrove College (Chair of Finance Committee) since 2007; former Director, OGE Energy Corp. (energy and energy services), 2007-2014 | |
Minor M. Shaw
901 S. Marquette Ave.
Minneapolis, MN 55402
1947 | | Trustee since 6/11 for RiverSource Funds and since 2003 for Nations Funds | | President, Micco LLC (private investments) since 2011; President, Micco Corp. (family investment business), 1998-2011 | | | 124 | | | Director, Piedmont Natural Gas; Director, BlueCross BlueShield of South Carolina since April 2008; Chair of the Duke Endowment; Director, National Association of Corporate Directors, Carolinas Chapter since 2013; Chair of Greenville — Spartanburg Airport Commission; former Trustee, BofA Funds Series Trust (11 funds), 2003-2011 | |
Alison Taunton-Rigby
901 S. Marquette Ave.
Minneapolis, MN 55402
1944 | | Trustee since 11/02 for RiverSource Funds and since 6/11 for Nations Funds | | Managing Director, Forester Biotech (consulting), 2001-2003; Chief Executive Officer and Director, RiboNovix, Inc., (biotechnology), 2003-2010; President and Chief Executive Officer of CMT Inc., 2001-2003; Aquila Biopharmaceuticals Inc., 1996-2000; Cambridge Biotech Corporation, 1995-1996; Mitotix Inc., 1993-1994 | | | 124 | | | Director, Abt Associates (government contractor) since 2001; Director, Boston Children's Hospital since 2002; Director, Healthways, Inc. (health and well-being solutions) since 2005; Director, ICI Mutual Insurance Company since 2011 | |
Annual Report 2016
43
COLUMBIA INTERNATIONAL VALUE FUND
TRUSTEES AND OFFICERS (continued)
Interested Trustee Not Affiliated with Investment Manager*
Name,
Address,
Year of Birth | | Position Held With
Funds and Length of
Service | | Principal Occupation(s)
During Past Five Years
and Other Relevant
Professional Experience | | Number of
Funds in the
Fund Family
Overseen by
Board Member | | Other Present or Past
Directorships/
Trusteeships
(Within Past 5 Years) | |
Anthony M. Santomero
901 S. Marquette Ave.
Minneapolis, MN 55402
1946 | | Trustee since 6/11 for RiverSource Funds and since 1/08 for Nations Funds | | Richard K. Mellon Professor Emeritus of Finance, The Wharton School, University of Pennsylvania since 2002; Senior Advisor, McKinsey & Company (consulting), 2006-2008; President, Federal Reserve Bank of Philadelphia, 2000-2006; Professor of Finance, The Wharton School, University of Pennsylvania, 1972-2002 | | | 122 | | | Trustee, Penn Mutual Life Insurance Company since March 2008; Director, Renaissance Reinsurance Ltd. since May 2008; Director, Citigroup Inc. since 2009; Director, Citibank, N.A. since 2009; former Trustee, BofA Funds Series Trust (11 funds), 2008-2011 | |
* Dr. Santomero is not an affiliated person of the Investment Manager or Ameriprise Financial. However, he is currently deemed by the Funds to be an "interested person" (as defined in the 1940 Act) of the Funds because he serves as a Director of Citigroup Inc. and Citibank, N.A., companies that may directly or through subsidiaries and affiliates engage from time-to-time in brokerage execution, principal transactions and lending relationships with the Funds or accounts advised/managed by the Investment Manager.
Annual Report 2016
44
COLUMBIA INTERNATIONAL VALUE FUND
TRUSTEES AND OFFICERS (continued)
Interested Trustee Affiliated with Investment Manager*
Name,
Address,
Year of Birth | | Position Held With
the Funds and Length of
Service | | Principal Occupation(s)
During Past Five Years
and Other Relevant
Professional Experience | | Number of
Funds in the
Columbia
Funds Complex
Overseen | | Other Directorships
Held by Trustee
During the Past
Five Years | |
William F. Truscott
c/o Columbia Management Investment Advisers, LLC,
225 Franklin St.
Boston, MA 02110
1960 | | Trustee since 11/01 for RiverSource Funds and since 6/11 for Nations Funds; Senior Vice President since 2002 for RiverSource Funds and since 5/10 for Nations Funds | | Chairman of the Board and President, Columbia Management Investment Advisers, LLC since May 2010 and February 2012, respectively (previously President and Chief Investment Officer, 2001-April 2010); Chief Executive Officer, Global Asset Management, Ameriprise Financial, Inc. since September 2012 (previously Chief Executive Officer, U.S. Asset Management & President, Annuities, May 2010-September 2012 and President — U.S. Asset Management and Chief Investment Officer, 2005-April 2010); Director and Chief Executive Officer, Columbia Management Investment Distributors, Inc. since May 2010 and February 2012, respectively (previously Chairman of the Board and Chief Executive Officer, 2006-April 2010); Chairman of the Board and Chief Executive Officer, RiverSource Distributors, Inc. since 2006; Director, Threadneedle Asset Management Holdings, SARL since 2014; President and Chief Executive Officer, Ameriprise Certificate Company, 2006-August 2012. | | | 182 | | | Chairman of the Board, Columbia Management Investment Advisers, LLC since May 2010; Director, Columbia Management Investment Distributors, Inc. since May 2010; Former Director, Ameriprise Certificate Company, 2006-January 2013 | |
* Interested person (as defined under the 1940 Act) by reason of being an officer, director, security holder and/or employee of the Investment Manager or Ameriprise Financial.
The Statement of Additional Information has additional information about the Fund's Board members and is available, without charge, upon request by calling 800.345.6611; contacting your financial intermediary; or visiting columbiathreadneedle.com/us.
Annual Report 2016
45
COLUMBIA INTERNATIONAL VALUE FUND
TRUSTEES AND OFFICERS (continued)
The Board has appointed officers who are responsible for day-to-day business decisions based on policies it has established. The officers serve at the pleasure of the Board. The following table provides basic information about the Officers of the Fund, including principal occupations during the past five years, although their specific titles may have varied over the period. In addition to Mr. Truscott, who is Senior Vice President, the Fund's other officers are:
Fund Officers
Name,
Address and
Year of Birth | | Position and Year
First Appointed to
Position for any Fund
in the Columbia
Funds Complex or a
Predecessor Thereof | | Principal Occupation(s) During Past Five Years | |
Christopher O. Petersen
5228 Ameriprise
Financial Center
Minneapolis, MN 55474
Born 1970 | | President and Principal Executive Officer (2015) | | Vice President and Lead Chief Counsel, Ameriprise Financial, Inc. since January 2015 (previously, Vice President and Chief Counsel January 2010-December 2014; and Vice President and Group Counsel or Counsel 2004-January 2010); officer of Columbia Funds and affiliated funds since 2007. | |
Michael G. Clarke
225 Franklin Street
Boston, MA 02110
Born 1969 | | Treasurer (2011), Chief Financial Officer (2009) and Chief Accounting Officer (2015) | | Vice President — Mutual Fund Administration, Columbia Management Investment Advisers, LLC, since May 2010; Managing Director of Fund Administration, Columbia Management Advisors, LLC, September 2004-April 2010; senior officer of Columbia Funds and affiliated funds since 2002. | |
Paul B. Goucher
100 Park Avenue
New York, NY 10017
Born 1968 | | Senior Vice President (2011), Chief Legal Officer (2015) and Assistant Secretary (2008) | | Vice President and Lead Chief Counsel, Ameriprise Financial, Inc. since November 2008 and January 2013, respectively (previously Chief Counsel, January 2010-January 2013 and Group Counsel, November 2008-January 2010). | |
Thomas P. McGuire
225 Franklin Street
Boston, MA 02110
Born 1972 | | Senior Vice President and Chief Compliance Officer (2012) | | Vice President — Asset Management Compliance, Ameriprise Financial, Inc., since May 2010; Chief Compliance Officer, Ameriprise Certificate Company since September 2010; Compliance Executive, Bank of America, 2005-April 2010. | |
Colin Moore
225 Franklin Street
Boston, MA 02110
Born 1958 | | Senior Vice President (2010) | | Executive Vice President and Global Chief Investment Officer, Ameriprise Financial, Inc., since July 2013; Director and Global Chief Investment Officer, Columbia Management Investment Advisers, LLC since May 2010; Manager, Managing Director and Chief Investment Officer, Columbia Management Advisors, LLC, 2007-April 2010. | |
Michael E. DeFao
225 Franklin Street
Boston, MA 02110
Born 1968 | | Vice President (2011) and Assistant Secretary (2010) | | Vice President and Chief Counsel, Ameriprise Financial, Inc. since May 2010; Associate General Counsel, Bank of America, 2005-April 2010. | |
Amy Johnson
5228 Ameriprise
Financial Center
Minneapolis, MN 55474
Born 1965 | | Vice President (2006) | | Managing Director and Chief Operating Officer, Columbia Management Investment Advisers, LLC since May 2010 (previously Chief Administrative Officer, 2009-April 2010, and Vice President — Asset Management and Trust Company Services, 2006-2009). | |
Lyn Kephart-Strong
5228 Ameriprise
Financial Center
Minneapolis, MN 55474
Born 1960 | | Vice President (2015) | | President, Columbia Management Investment Services Corp. since October 2014; Vice President & Resolution Officer, Ameriprise Trust Company since August 2009; President, RiverSource Service Corporation 2004-2010. | |
Ryan C. Larrenaga
225 Franklin Street
Boston, MA 02110
Born 1970 | | Vice President and Secretary (2015) | | Vice President and Group Counsel, Ameriprise Financial, Inc. since August 2011 (previously, Counsel from May 2010 to August 2011); Assistant General Counsel, Bank of America, 2005-April 2010; officer of Columbia Funds and affiliated funds since 2005. | |
Annual Report 2016
46
COLUMBIA INTERNATIONAL VALUE FUND
IMPORTANT INFORMATION ABOUT THIS REPORT
Each fund mails one shareholder report to each shareholder address. If you would like more than one report, please call shareholder services at 800.345.6611 and additional reports will be sent to you.
The policy of the Board is to vote the proxies of the companies in which each fund holds investments consistent with the procedures as stated in the Statement of Additional Information (SAI). You may obtain a copy of the SAI without charge by calling 800.345.6611; contacting your financial intermediary; visiting columbiathreadneedle.com/us; or searching the website of the Securities and Exchange Commission (SEC) at sec.gov. Information regarding how each fund voted proxies relating to portfolio securities is filed with the SEC by August 31st for the most recent 12-month period ending June 30th of that year, and is available without charge by visiting columbiathreadneedle.com/us, or searching the website of the SEC at sec.gov.
Each fund files a complete schedule of portfolio holdings with the SEC for the first and third quarters of each fiscal year on Form N-Q. Each fund's Form N-Q is available on the SEC's website at sec.gov and may be reviewed and copied at the SEC's Public Reference Room in Washington, D.C. Information on the operation of the Public Reference Room may be obtained by calling 800.SEC.0330. Each fund's complete schedule of portfolio holdings, as filed on Form N-Q, can also be obtained without charge, upon request, by calling 800.345.6611.
Annual Report 2016
47
Columbia International Value Fund
P.O. Box 8081
Boston, MA 02266-8081

This information is for use with concurrent or prior delivery of a fund prospectus. Please read and consider the investment objectives, risks, charges and expenses for any fund carefully before investing. For a prospectus and summary prospectus, which contains this and other important information about the Fund, go to columbiathreadneedle.com/us. The Fund is distributed by Columbia Management Investment Distributors, Inc., member FINRA, and managed by Columbia Management Investment Advisers, LLC.
Columbia Threadneedle Investments (Columbia Threadneedle) is the global brand name of the Columbia and Threadneedle group of companies.
All rights reserved. Columbia Management Investment Distributors, Inc., 225 Franklin Street, Boston, MA 02110-2804
© 2016 Columbia Management Investment Advisers, LLC.
columbiathreadneedle.com/us
ANN170_02_F01_(04/16)

ANNUAL REPORT
February 29, 2016

COLUMBIA LARGE CAP GROWTH FUND II
(formerly Columbia Marsico 21st Century Fund)

ABOUT COLUMBIA THREADNEEDLE INVESTMENTS
Columbia Threadneedle Investments is a leading global asset management group that provides a broad range of actively managed investment strategies and solutions for individual, institutional and corporate clients around the world.
With more than 2,000 people, including over 450 investment professionals based in North America, Europe and Asia, we manage $472 billion* of assets across developed and emerging market equities, fixed income, asset allocation solutions and alternatives. We are the 13th largest manager of long-term mutual fund assets in the U.S.** and the 4th largest manager of retail funds in the U.K.***
Our priority is the investment success of our clients. We aim to deliver the investment outcomes they expect through an investment approach that is team-based, performance-driven and risk-aware. Our culture is dynamic and interactive. By sharing our insights across asset classes and geographies, we generate richer perspectives on global, regional and local investment landscapes. The ability to exchange and debate investment ideas in a collaborative environment enriches our teams' investment processes. More importantly, it results in better informed investment decisions for our clients.
Columbia funds are distributed by Columbia Management Investment Distributors, Inc., member FINRA, and managed by Columbia Management Investment Advisers, LLC.
Columbia Threadneedle Investments (Columbia Threadneedle) is the global brand name of the Columbia and Threadneedle group of companies.
* In U.S. dollars as of December 31, 2015. Source: Ameriprise Q4 Earnings Release. Includes all assets managed by entities in the Columbia and Threadneedle groups of companies. Contact us for more current data.
** Source: ICI as of December 31, 2015 for Columbia Management Investment Advisers, LLC.
*** Source: Investment Association as of September 2015 for Threadneedle Asset Management Limited.
© 2016 Columbia Management Investment Advisers, LLC. All rights reserved.
Not part of the shareholder report
Investment strategies to help meet investor needs
We are committed to helping investors navigate financial challenges to reach their desired outcomes. The possibilities are endless.
Your success is our priority.
Retire comfortably
Fund college or higher education
Leave a legacy
Generate an appropriate stream of income in retirement
Traditional approaches to income may no longer be adequate — and they may no longer provide the diversification benefits they once did. Investors need to rethink how they generate retirement income.
Worried about running out of income? You are not alone.
Navigate a changing interest rate environment
Even in today's challenging interest rate environment, it's still possible to navigate markets and achieve your goals.
Make investment choices designed specifically for this market environment.
Maximize after-tax returns
In an environment where what you keep is more important than what you earn, municipal bonds can help mitigate higher taxes while providing attractive yields compared to other investment options.
You've worked too hard building your wealth to lose it to taxes.
Grow assets to achieve financial goals
Finding growth opportunities in today's complex market environment requires strong research capabilities, creative thinking and a disciplined approach.
Do your investments deliver the portfolio growth you need?
Ease the impact of volatile markets
With increasing concerns about market volatility, investors should consider diversifying their portfolios with non-traditional holdings.
Interested in turning volatility into opportunity?
To find out more, contact your financial professional, call 800.426.3750 or visit columbiathreadneedle.com/us
Not part of the shareholder report
 Dear Shareholder,
Today's investors are typically focused on outcomes, like living a certain retirement lifestyle, paying for college education or building a legacy. But in today's complex global investment landscape, even simple goals are not easily achieved.
At Columbia Threadneedle Investments, we aspire to help satisfy five core needs of today's investors:
n Generate an appropriate stream of income in retirement
Traditional approaches to generating income may not provide the diversification benefits they once did, and they may actually introduce unwanted risk in today's market. To seek to improve your potential to live comfortably long term, we endeavor to pursue investments that explore less traveled paths to income.
n Navigate a changing interest rate environment
Today's uncertain market environment includes the prospect of a rise in interest rates. Blending traditional investments with non-traditional or alternative products may help protect your wealth during periods of volatility. We can attempt to help strengthen your portfolio with agile products designed to take on the market's ups and downs.
n Maximize after-tax returns
In an environment where what you keep may be more important than what you earn, municipal bonds can help mitigate high tax burdens while providing potentially attractive yields. Our state and federal tax-exempt products are aimed at helping investors manage risk, minimize the fluctuation of capital and grow wealth on a more tax-efficient basis.
n Grow assets to achieve financial goals
We believe that finding and protecting growth comes from a disciplined security selection process designed to create excess return. Our goal is to provide investment solutions built to help you face today's market challenges and grow your assets at each crossroad of your journey.
n Ease the impact of volatile markets
Despite a bull market run that has benefited many investors over the past several years, it's important to remember the lessons of 2008 and the value that a well-diversified portfolio may provide through times of market volatility. We are here to help you hold onto the savings you have worked tirelessly to amass, and to provide you the best opportunity to maintain your standard of living regardless of market conditions.
Find out today how we can help you confidently invest to realize your dreams. Please visit us at blog.columbiathreadneedleus.com/our-best-ideas to learn more about our unique investment solutions.
The world is constantly changing, but our priority remains the same: to help you secure your finances, meet your goals and achieve success. Thank you for your continued investment with us.
Sincerely,

Christopher O. Petersen
President, Columbia Funds
Investors should consider the investment objectives, risks, charges and expenses of a mutual fund carefully before investing. For a free prospectus and summary prospectus, which contains this and other important information about a fund, visit columbiathreadneedle.com/us. The prospectus should be read carefully before investing.
Columbia Funds are distributed by Columbia Management Investment Distributors, Inc., member FINRA, and managed by Columbia Management Investment Advisers, LLC.
© 2016 Columbia Management Investment Advisers, LLC. All rights reserved.
COLUMBIA LARGE CAP GROWTH FUND II
Performance Overview | | | 2 | | |
Manager Discussion of Fund Performance | | | 4 | | |
Understanding Your Fund's Expenses | | | 6 | | |
Portfolio of Investments | | | 7 | | |
Statement of Assets and Liabilities | | | 12 | | |
Statement of Operations | | | 14 | | |
Statement of Changes in Net Assets | | | 15 | | |
Financial Highlights | | | 17 | | |
Notes to Financial Statements | | | 24 | | |
Report of Independent Registered Public Accounting Firm | | | 32 | | |
Trustees and Officers | | | 33 | | |
Important Information About This Report | | | 39 | | |
Fund Investment Manager
Columbia Management Investment
Advisers, LLC
225 Franklin Street
Boston, MA 02110
Fund Distributor
Columbia Management Investment
Distributors, Inc.
225 Franklin Street
Boston, MA 02110
Fund Transfer Agent
Columbia Management Investment
Services Corp.
P.O. Box 8081
Boston, MA 02266-8081
For more information about any of the funds, please visit columbiathreadneedle.com/us or call 800.345.6611. Customer Service Representatives are available to answer your questions Monday through Friday from 8 a.m. to 7 p.m. Eastern time.
The views expressed in this report reflect the current views of the respective parties. These views are not guarantees of future performance and involve certain risks, uncertainties and assumptions that are difficult to predict, so actual outcomes and results may differ significantly from the views expressed. These views are subject to change at any time based upon economic, market or other conditions and the respective parties disclaim any responsibility to update such views. These views may not be relied on as investment advice and, because investment decisions for a Columbia fund are based on numerous factors, may not be relied on as an indication of trading intent on behalf of any particular Columbia fund. References to specific securities should not be construed as a recommendation or investment advice.
COLUMBIA LARGE CAP GROWTH FUND II
Performance Summary
n Columbia Large Cap Growth Fund II (the Fund) Class A shares returned -14.98% excluding sales charges for the 12-month period that ended February 29, 2016.
n The Fund's benchmark, the Russell 1000 Growth Index, returned -5.05% for the same time period.
n In a period of heightened market volatility, stock selection detracted from performance relative to its benchmark.
Average Annual Total Returns (%) (for period ended February 29, 2016)
| | | Inception | | 1 Year | | 5 Years | | 10 Years | |
Class A | | 04/10/00 | | | | | | | |
Excluding sales charges | | | | | | | -14.98 | | | | 5.14 | | | | 3.98 | | |
Including sales charges | | | | | | | -19.87 | | | | 3.90 | | | | 3.37 | | |
Class B | | 04/10/00 | | | | | | | |
Excluding sales charges | | | | | | | -15.65 | | | | 4.35 | | | | 3.20 | | |
Including sales charges | | | | | | | -19.86 | | | | 4.01 | | | | 3.20 | | |
Class C | | 04/10/00 | | | | | | | |
Excluding sales charges | | | | | | | -15.65 | | | | 4.35 | | | | 3.21 | | |
Including sales charges | | | | | | | -16.49 | | | | 4.35 | | | | 3.21 | | |
Class R | | 01/23/06 | | | -15.20 | | | | 4.89 | | | | 3.72 | | |
Class R4* | | 11/08/12 | | | -14.79 | | | | 5.32 | | | | 4.07 | | |
Class R5* | | 01/08/14 | | | -14.70 | | | | 5.31 | | | | 4.06 | | |
Class Z | | 04/10/00 | | | -14.77 | | | | 5.40 | | | | 4.24 | | |
Russell 1000 Growth Index | | | | | | | -5.05 | | | | 10.95 | | | | 7.74 | | |
Returns for Class A are shown with and without the maximum initial sales charge of 5.75%. Returns for Class B are shown with and without the applicable contingent deferred sales charge (CDSC) of 5.00% in the first year, declining to 1.00% in the sixth year and eliminated thereafter. Returns for Class C are shown with and without the 1.00% CDSC for the first year only. The Fund's other classes are not subject to sales charges and have limited eligibility. Please see the Fund's prospectus for details. Performance for different share classes will vary based on differences in sales charges and fees associated with each class. All results shown assume reinvestment of distributions during the period. Returns do not reflect the deduction of taxes that a shareholder may pay on Fund distributions or on the redemption of Fund shares. Performance results reflect the effect of any fee waivers or reimbursements of Fund expenses by Columbia Management Investment Advisers, LLC and/or any of its affiliates. Absent these fee waivers or expense reimbursement arrangements, performance results would have been lower.
The performance information shown represents past performance and is not a guarantee of future results. The investment return and principal value of your investment will fluctuate so that your shares, when redeemed, may be worth more or less than their original cost. Current performance may be lower or higher than the performance information shown. You may obtain performance information current to the most recent month-end by contacting your financial intermediary, visiting columbiathreadneedle.com/us or calling 800.345.6611.
*The returns shown for periods prior to the share class inception date (including returns for the Life of the Fund, if shown, which are since Fund inception) include the returns of the Fund's oldest share class. Since the Fund launched more than one class of shares at its inception, Class A shares were used. These returns are adjusted to reflect any higher class-related operating expenses of the newer share classes, as applicable. Please visit columbiathreadneedle.com/us/investment-products/mutual-funds/appended-performance for more information.
Effective November 20, 2015 the Fund compares its performance to that of the Russell 1000 Growth Index (replacing the Russell 3000 Index). The Fund's investment manager believes that the new index provides a more appropriate basis for comparing the Fund's performance in light of the changes made to the Fund's name and principal investment strategies.
The Russell 1000 Growth Index, an unmanaged index, measures the performance of those Russell 1000 Index companies with higher price-to-book ratios and higher forecasted growth values.
The Russell 3000 Index, an unmanaged index, measures the performance of the 3,000 largest U.S. companies based on total market capitalization, which represents approximately 98% of the investable U.S. equity market.
Indices are not available for investment, are not professionally managed and do not reflect sales charges, fees, brokerage commissions, taxes or other expenses of investing. Securities in the Fund may not match those in an index.
Annual Report 2016
2
COLUMBIA LARGE CAP GROWTH FUND II
PERFORMANCE OVERVIEW (continued)
Performance of a Hypothetical $10,000 Investment (March 1, 2006 – February 29, 2016)
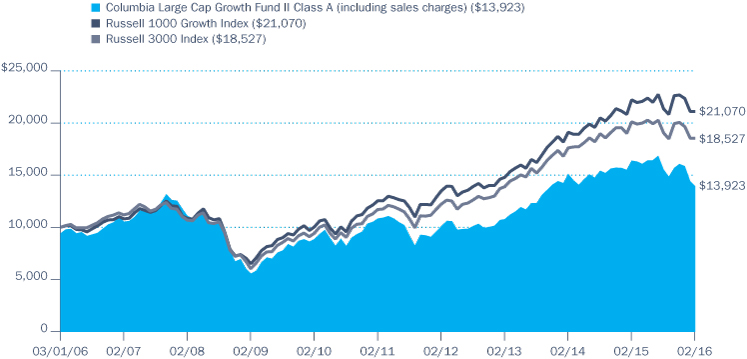
The chart above shows the change in value of a hypothetical $10,000 investment in Class A shares of Columbia Large Cap Growth Fund II during the stated time period, and does not reflect the deduction of taxes that a shareholder may pay on Fund distributions or on the redemption of Fund shares.
Annual Report 2016
3
COLUMBIA LARGE CAP GROWTH FUND II
MANAGER DISCUSSION OF FUND PERFORMANCE
Portfolio Management
John Wilson, CFA
Peter Deininger, CFA, CAIA
Tchintcia Barros, CFA
Effective November 20, 2015, Marsico Capital Management, LLC (Marsico) no longer serves as the subadviser to the Fund and Columbia Management Investment Advisers, LLC assumed the day-to-day management of the Fund's portfolio.
Morningstar Style BoxTM

The Morningstar Style BoxTM is based on a fund's portfolio holdings. For equity funds, the vertical axis shows the market capitalization of the stocks owned, and the horizontal axis shows investment style (value, blend, or growth). Information shown is based on the most recent data provided by Morningstar.
© 2016 Morningstar, Inc. All rights reserved. The Morningstar information contained herein: (1) is proprietary to Morningstar and/or its content providers; (2) may not be copied or distributed; and (3) is not warranted to be accurate, complete or timely. Neither Morningstar nor its content providers are responsible for any damages or losses arising from any use of this information.
Investment Risks
Market risk may affect a single issuer, sector of the economy, industry or the market as a whole. Growth securities, at times, may not perform as well as value securities or the stock market in general and may be out of favor with investors. Foreign investments subject the fund to risks, including political, economic, market, social and others within a particular country, as well as to currency instabilities and less stringent financial and accounting standards generally applicable to U.S. issuers. The fund may invest significantly in issuers within a particular sector, which may be negatively affected by market, economic or other conditions, making the fund more vulnerable to unfavorable developments in the sector.
For the 12-month period that ended February 29, 2016, the Fund's Class A shares returned -14.98%. The Fund underperformed its new benchmark, the Russell 1000 Growth Index, which returned -5.05% over the same time period. The Fund's underperformance of its benchmark was due primarily to stock selection.
Mounting Global Pressures Weighed on Markets
Around the world, investors turned cautious over the 12-month period that ended February 29, 2016, as lackluster economic growth, contentious geopolitical conflicts and a shift in U.S. monetary policy weighed on confidence. Subpar global economic growth continued for a fourth straight year, with China's slowdown heading the list of disappointments. Conflicts in the Middle East and terrorism, both at home and abroad, heightened security fears. Plummeting oil prices and a rising dollar rounded the list of mounting pressures. A widening trade deficit also took a significant bite out of growth.
Despite these setbacks, the U.S. economy continued to expand for the seventh consecutive year. U.S. labor markets recovered to full employment and consumer spending strengthened. The housing market inched forward, although sales slipped near the end of the period as new industry regulation led to longer closing periods. Manufacturing activity softened, putting a damper on growth.
Modest stock market gains in the first half of the period were wiped out in the second half. The S&P 500 Index, a broad measure of U.S. stock market performance, returned -6.19%, including dividends. Large-cap stocks held up better than mid- and small-cap stocks and growth stocks outperformed value stocks.
In December 2015, the Federal Reserve (the Fed) raised the target range of its benchmark interest rate by a quarter of a point, ending a lengthy debate about whether the economy was strong enough to withstand higher borrowing costs. Mixed economic signals early in 2016 put additional rate hikes on hold — at least for now.
Marsico-Subadvised Portfolio
From March 1, 2015 through November 19, 2015, Marsico provided day-to-day portfolio management of the Fund and the Fund's performance was compared to that of the Russell 3000 Index. This section discusses the contributors and detractors to the Fund's portfolio during the period in which Marsico subadvised the portfolio.
The consumer discretionary and information technology sectors were the Fund's best performers during the period the Fund was managed by Marsico. An overweight allocation to consumer discretionary stocks and stock selection within the consumer discretionary sector, specifically in the retail and media industry groups, benefited performance. Ctrip.com International, China's largest online travel agency, was one of the Fund's top performers. The company effectively consolidated the online travel market by buying another sizeable competitor and taking a significant stake in the number two player in the market. Recent results showed an acceleration in online travel trends and higher-than-expected margins due to market consolidation.
Annual Report 2016
4
COLUMBIA LARGE CAP GROWTH FUND II
MANAGER DISCUSSION OF FUND PERFORMANCE (continued)
Stock selection and an overweight in information technology stocks also aided performance as certain software and services positions generated double-digit returns for the period, including Facebook and Electronic Arts. Facebook's business grew as more advertising shifted from traditional to online media. Earnings growth was better-than-expected, fueled by active user growth. Facebook continued to innovate ways to engage with its users. Electronic Arts, a gaming company in the technology software segment, delivered a double-digit gain that was driven by strong sales of both digital content and key sports titles. Tight expense control led to higher-than-expected revenue, operating profit and earnings per share. An underweight in energy, the weakest performing sector of the Russell 3000 Index during the period, also aided relative results.
Health care stocks led the list of detractors for the period. Shares of Endo International and Concordia Healthcare declined sharply. The Fund's position in Concordia Healthcare was sold and the Fund's position in Endo International was reduced.
CMIA Portfolio
Effective November 20, 2015, Columbia Management Investment Advisers, LLC, the Investment Manager, assumed day-to-day portfolio management of the Fund and the Fund began comparing its performance to that of the Russell 1000 Growth Index. This section discusses the contributors and detractors to the Fund's portfolio from November 20, 2015 through February 29, 2016.
In a period of exceptional volatility, we began to transition the portfolio's holdings to bring it in line with our large-cap growth strategy, a process that has been underway since we assumed Fund management on November 20, 2015. The Fund also adopted a new benchmark, the Russell 1000 Growth Index, which we believe more accurately reflects our growth style. We increased the Fund's weighting in consumer staples and decreased weightings in consumer discretionary and health care. Overall, the Fund has become more diversified, with an expanded list of approximately 65 to 85 company names. At period's end, the portfolio was focused on high quality growth companies with track records of consistent earnings growth and particular emphasis on both health care and information technology.
Top Ten Holdings (%)
(at February 29, 2016) | |
Amazon.com, Inc. | | | 4.0 | | |
Facebook, Inc., Class A | | | 4.0 | | |
Microsoft Corp. | | | 4.0 | | |
Apple, Inc. | | | 3.7 | | |
Visa, Inc., Class A | | | 3.2 | | |
Alphabet, Inc., Class A | | | 3.2 | | |
PepsiCo, Inc. | | | 3.0 | | |
Comcast Corp., Class A | | | 3.0 | | |
Philip Morris International, Inc. | | | 2.8 | | |
iShares Russell 1000 Growth
Index Fund | | | 2.7 | | |
Percentages indicated are based upon total investments (excluding Money Market Funds).
For further detail about these holdings, please refer to the section entitled "Portfolio of Investments."
Fund holdings are as of the date given, are subject to change at any time, and are not recommendations to buy or sell any security.
Portfolio Breakdown (%)
(at February 29, 2016) | |
Common Stocks | | | 88.5 | | |
Exchange-Traded Funds | | | 4.9 | | |
Money Market Funds | | | 6.6 | | |
Total | | | 100.0 | | |
Percentages indicated are based upon total investments. The Fund's portfolio composition is subject to change.
Equity Sector Breakdown (%)
(at February 29, 2016) | |
Consumer Discretionary | | | 19.7 | | |
Consumer Staples | | | 12.4 | | |
Financials | | | 5.3 | | |
Health Care | | | 15.2 | | |
Industrials | | | 8.3 | | |
Information Technology | | | 35.8 | | |
Materials | | | 2.4 | | |
Telecommunication Services | | | 0.9 | | |
Total | | | 100.0 | | |
Percentages indicated are based upon total equity investments. The Fund's portfolio composition is subject to change.
Annual Report 2016
5
COLUMBIA LARGE CAP GROWTH FUND II
UNDERSTANDING YOUR FUND'S EXPENSES
(Unaudited)
As an investor, you incur two types of costs. There are transaction costs, which generally include sales charges on purchases and may include redemption fees. There are also ongoing costs, which generally include management fees, distribution and/or service fees, and other fund expenses. The following information is intended to help you understand your ongoing costs (in dollars) of investing in the Fund and to help you compare these costs with the ongoing costs of investing in other mutual funds.
Analyzing Your Fund's Expenses
To illustrate these ongoing costs, we have provided examples and calculated the expenses paid by investors in each share class of the Fund during the period. The actual and hypothetical information in the table is based on an initial investment of $1,000 at the beginning of the period indicated and held for the entire period. Expense information is calculated two ways and each method provides you with different information. The amount listed in the "Actual" column is calculated using the Fund's actual operating expenses and total return for the period. You may use the Actual information, together with the amount invested, to estimate the expenses that you paid over the period. Simply divide your account value by $1,000 (for example, an $8,600 account value divided by $1,000 = 8.6), then multiply the results by the expenses paid during the period under the "Actual" column. The amount listed in the "Hypothetical" column assumes a 5% annual rate of return before expenses (which is not the Fund's actual return) and then applies the Fund's actual expense ratio for the period to the hypothetical return. You should not use the hypothetical account values and expenses to estimate either your actual account balance at the end of the period or the expenses you paid during the period. See "Compare With Other Funds" below for details on how to use the hypothetical data.
Compare With Other Funds
Since all mutual funds are required to include the same hypothetical calculations about expenses in shareholder reports, you can use this information to compare the ongoing cost of investing in the Fund with other funds. To do so, compare the hypothetical example with the 5% hypothetical examples that appear in the shareholder reports of other funds. As you compare hypothetical examples of other funds, it is important to note that hypothetical examples are meant to highlight the ongoing costs of investing in a fund only and do not reflect any transaction costs, such as sales charges, or redemption or exchange fees. Therefore, the hypothetical calculations are useful in comparing ongoing costs only, and will not help you determine the relative total costs of owning different funds. If transaction costs were included in these calculations, your costs would be higher.
September 1, 2015 – February 29, 2016
| | | Account Value at the Beginning
of the Period ($) | | Account Value at the End of the
Period ($) | | Expenses Paid During the
Period ($) | | Fund's Annualized
Expense Ratio (%) | |
| | | Actual | | Hypothetical | | Actual | | Hypothetical | | Actual | | Hypothetical | | Actual | |
Class A | | | 1,000.00 | | | | 1,000.00 | | | | 896.50 | | | | 1,018.75 | | | | 5.80 | | | | 6.17 | | | | 1.23 | | |
Class B | | | 1,000.00 | | | | 1,000.00 | | | | 893.20 | | | | 1,015.07 | | | | 9.27 | | | | 9.87 | | | | 1.97 | | |
Class C | | | 1,000.00 | | | | 1,000.00 | | | | 893.20 | | | | 1,015.02 | | | | 9.32 | | | | 9.92 | | | | 1.98 | | |
Class R | | | 1,000.00 | | | | 1,000.00 | | | | 895.50 | | | | 1,017.50 | | | | 6.98 | | | | 7.42 | | | | 1.48 | | |
Class R4 | | | 1,000.00 | | | | 1,000.00 | | | | 897.60 | | | | 1,019.99 | | | | 4.62 | | | | 4.92 | | | | 0.98 | | |
Class R5 | | | 1,000.00 | | | | 1,000.00 | | | | 898.00 | | | | 1,020.69 | | | | 3.96 | | | | 4.22 | | | | 0.84 | | |
Class Z | | | 1,000.00 | | | | 1,000.00 | | | | 897.70 | | | | 1,019.99 | | | | 4.62 | | | | 4.92 | | | | 0.98 | | |
Expenses paid during the period are equal to the annualized expense ratio for each class as indicated above, multiplied by the average account value over the period and then multiplied by the number of days in the Fund's most recent fiscal half year and divided by 366.
Expenses do not include fees and expenses incurred indirectly by the Fund from its investment in underlying funds, including affiliated and non-affiliated pooled investment vehicles, such as mutual funds and exchange-traded funds.
Had Columbia Management Investment Advisers, LLC and/or certain of its affiliates not waived/reimbursed certain fees and expenses, account value at the end of the period would have been reduced.
Annual Report 2016
6
COLUMBIA LARGE CAP GROWTH FUND II
PORTFOLIO OF INVESTMENTS
February 29, 2016
(Percentages represent value of investments compared to net assets)
Common Stocks 87.3%
Issuer | | Shares | | Value ($) | |
CONSUMER DISCRETIONARY 17.2% | |
Auto Components 0.5% | |
Visteon Corp. | | | 53,651 | | | | 3,751,278 | | |
Hotels, Restaurants & Leisure 1.6% | |
Norwegian Cruise Line Holdings Ltd.(a) | | | 235,886 | | | | 11,589,079 | | |
Household Durables 0.7% | |
Jarden Corp.(a) | | | 97,401 | | | | 5,150,565 | | |
Internet & Catalog Retail 5.9% | |
Amazon.com, Inc.(a) | | | 48,672 | | | | 26,892,253 | | |
Ctrip.com International Ltd., ADR(a) | | | 140,237 | | | | 5,738,498 | | |
Expedia, Inc. | | | 38,328 | | | | 3,990,328 | | |
Priceline Group, Inc. (The)(a) | | | 4,623 | | | | 5,849,066 | | |
Total | | | | | 42,470,145 | | |
Media 3.5% | |
Comcast Corp., Class A | | | 342,603 | | | | 19,778,471 | | |
DISH Network Corp., Class A(a) | | | 121,350 | | | | 5,719,226 | | |
Total | | | | | 25,497,697 | | |
Multiline Retail 1.1% | |
Dollar General Corp. | | | 105,504 | | | | 7,833,672 | | |
Specialty Retail 3.4% | |
Lowe's Companies, Inc. | | | 226,720 | | | | 15,310,401 | | |
TJX Companies, Inc. (The) | | | 130,399 | | | | 9,662,566 | | |
Total | | | | | 24,972,967 | | |
Textiles, Apparel & Luxury Goods 0.5% | |
lululemon athletica, Inc.(a) | | | 58,119 | | | | 3,645,805 | | |
Total Consumer Discretionary | | | | | 124,911,208 | | |
CONSUMER STAPLES 10.8% | |
Beverages 5.5% | |
Constellation Brands, Inc., Class A | | | 72,942 | | | | 10,316,187 | | |
Molson Coors Brewing Co., Class B | | | 107,400 | | | | 9,157,998 | | |
PepsiCo, Inc. | | | 206,030 | | | | 20,153,854 | | |
Total | | | | | 39,628,039 | | |
Food & Staples Retailing 2.4% | |
CVS Health Corp. | | | 182,104 | | | | 17,695,046 | | |
Food Products 0.4% | |
Tyson Foods, Inc., Class A | | | 39,899 | | | | 2,583,460 | | |
Tobacco 2.5% | |
Philip Morris International, Inc. | | | 201,858 | | | | 18,375,134 | | |
Total Consumer Staples | | | | | 78,281,679 | | |
Common Stocks (continued)
Issuer | | Shares | | Value ($) | |
FINANCIALS 4.6% | |
Banks 1.2% | |
First Republic Bank | | | 84,002 | | | | 5,169,483 | | |
Wells Fargo & Co. | | | 78,931 | | | | 3,703,443 | | |
Total | | | | | 8,872,926 | | |
Capital Markets 2.7% | |
Bank of New York Mellon Corp. (The) | | | 255,325 | | | | 9,035,952 | | |
BlackRock, Inc. | | | 11,574 | | | | 3,610,625 | | |
Goldman Sachs Group, Inc. (The) | | | 24,613 | | | | 3,680,382 | | |
Invesco Ltd. | | | 125,467 | | | | 3,354,987 | | |
Total | | | | | 19,681,946 | | |
Real Estate Investment Trusts (REITs) 0.7% | |
Simon Property Group, Inc. | | | 26,685 | | | | 5,062,945 | | |
Total Financials | | | | | 33,617,817 | | |
HEALTH CARE 13.3% | |
Biotechnology 6.0% | |
Alexion Pharmaceuticals, Inc.(a) | | | 83,831 | | | | 11,803,405 | | |
Alkermes PLC(a) | | | 252,178 | | | | 8,137,784 | | |
Biogen, Inc.(a) | | | 30,317 | | | | 7,864,836 | | |
Celgene Corp.(a) | | | 84,092 | | | | 8,478,997 | | |
Incyte Corp.(a) | | | 19,858 | | | | 1,459,563 | | |
Intercept Pharmaceuticals, Inc.(a) | | | 8,074 | | | | 899,282 | | |
Novavax, Inc.(a) | | | 169,761 | | | | 740,158 | | |
Ultragenyx Pharmaceutical, Inc.(a) | | | 13,896 | | | | 847,517 | | |
Vertex Pharmaceuticals, Inc.(a) | | | 39,504 | | | | 3,377,197 | | |
Total | | | | | 43,608,739 | | |
Health Care Equipment & Supplies 1.7% | |
Medtronic PLC | | | 160,683 | | | | 12,435,257 | | |
Health Care Providers & Services 1.4% | |
Express Scripts Holding Co.(a) | | | 74,310 | | | | 5,229,938 | | |
Laboratory Corp. of America Holdings(a) | | | 43,556 | | | | 4,784,191 | | |
Total | | | | | 10,014,129 | | |
Life Sciences Tools & Services 1.8% | |
Thermo Fisher Scientific, Inc. | | | 97,804 | | | | 12,635,299 | | |
Pharmaceuticals 2.4% | |
Bristol-Myers Squibb Co. | | | 279,456 | | | | 17,306,710 | | |
Total Health Care | | | | | 96,000,134 | | |
The accompanying Notes to Financial Statements are an integral part of this statement.
Annual Report 2016
7
COLUMBIA LARGE CAP GROWTH FUND II
PORTFOLIO OF INVESTMENTS (continued)
February 29, 2016
Common Stocks (continued)
Issuer | | Shares | | Value ($) | |
INDUSTRIALS 7.2% | |
Aerospace & Defense 1.2% | |
Northrop Grumman Corp. | | | 44,851 | | | | 8,621,259 | | |
Air Freight & Logistics 1.6% | |
FedEx Corp. | | | 85,490 | | | | 11,701,871 | | |
Airlines 1.6% | |
Delta Air Lines, Inc. | | | 245,499 | | | | 11,842,872 | | |
Electrical Equipment 0.5% | |
AMETEK, Inc. | | | 71,466 | | | | 3,316,737 | | |
Machinery 1.7% | |
Ingersoll-Rand PLC | | | 119,771 | | | | 6,654,477 | | |
Stanley Black & Decker, Inc. | | | 57,967 | | | | 5,449,478 | | |
Total | | | | | 12,103,955 | | |
Road & Rail 0.6% | |
Kansas City Southern | | | 57,830 | | | | 4,725,289 | | |
Total Industrials | | | | | 52,311,983 | | |
INFORMATION TECHNOLOGY 31.3% | |
Communications Equipment 1.1% | |
Palo Alto Networks, Inc.(a) | | | 55,207 | | | | 7,993,422 | | |
Internet Software & Services 9.2% | |
Alibaba Group Holding Ltd., ADR(a) | | | 89,566 | | | | 6,163,036 | | |
Alphabet, Inc., Class A(a) | | | 29,862 | | | | 21,417,624 | | |
Alphabet, Inc., Class C(a) | | | 15,067 | | | | 10,513,300 | | |
Facebook, Inc., Class A(a) | | | 250,565 | | | | 26,790,410 | | |
LinkedIn Corp., Class A(a) | | | 13,737 | | | | 1,609,839 | | |
Total | | | | | 66,494,209 | | |
IT Services 3.7% | |
PayPal Holdings, Inc.(a) | | | 134,620 | | | | 5,134,407 | | |
Visa, Inc., Class A | | | 296,072 | | | | 21,432,652 | | |
Total | | | | | 26,567,059 | | |
Semiconductors & Semiconductor Equipment 3.5% | |
Broadcom Ltd. | | | 83,772 | | | | 11,222,935 | | |
NVIDIA Corp. | | | 133,420 | | | | 4,184,051 | | |
NXP Semiconductors NV(a) | | | 91,964 | | | | 6,551,515 | | |
Qorvo, Inc.(a) | | | 71,549 | | | | 3,225,429 | | |
Total | | | | | 25,183,930 | | |
Software 10.4% | |
Adobe Systems, Inc.(a) | | | 113,641 | | | | 9,676,531 | | |
Electronic Arts, Inc.(a) | | | 238,033 | | | | 15,291,240 | | |
Common Stocks (continued)
Issuer | | Shares | | Value ($) | |
Microsoft Corp. | | | 519,679 | | | | 26,441,268 | | |
Red Hat, Inc.(a) | | | 112,123 | | | | 7,327,238 | | |
Salesforce.com, inc.(a) | | | 201,339 | | | | 13,640,717 | | |
ServiceNow, Inc.(a) | | | 57,389 | | | | 3,155,821 | | |
Total | | | | | 75,532,815 | | |
Technology Hardware, Storage & Peripherals 3.4% | |
Apple, Inc. | | | 254,549 | | | | 24,612,343 | | |
Total Information Technology | | | | | 226,383,778 | | |
MATERIALS 2.1% | |
Chemicals 2.1% | |
Eastman Chemical Co. | | | 96,359 | | | | 6,181,430 | | |
Sherwin-Williams Co. (The) | | | 33,550 | | | | 9,075,275 | | |
Total | | | | | 15,256,705 | | |
Total Materials | | | | | 15,256,705 | | |
TELECOMMUNICATION SERVICES 0.8% | |
Diversified Telecommunication Services 0.8% | |
SBA Communications Corp., Class A(a) | | | 59,064 | | | | 5,604,583 | | |
Total Telecommunication Services | | | | | 5,604,583 | | |
Total Common Stocks
(Cost: $655,056,842) | | | | | 632,367,887 | | |
Exchange-Traded Funds 4.8%
| | | Shares | | Value ($) | |
SPDR S&P 500 ETF Trust | | | 84,510 | | | | 16,357,756 | | |
iShares Russell 1000 Growth Index Fund | | | 194,619 | | | | 18,261,101 | | |
Total Exchange-Traded Funds
(Cost: $36,423,632) | | | | | 34,618,857 | | |
Money Market Funds 6.5%
Columbia Short-Term Cash Fund,
0.420%(b)(c) | | | 47,441,684 | | | | 47,441,684 | | |
Total Money Market Funds
(Cost: $47,441,684) | | | | | 47,441,684 | | |
Total Investments
(Cost: $738,922,158) | | | | | 714,428,428 | | |
Other Assets & Liabilities, Net | | | | | 10,243,544 | | |
Net Assets | | | | | 724,671,972 | | |
The accompanying Notes to Financial Statements are an integral part of this statement.
Annual Report 2016
8
COLUMBIA LARGE CAP GROWTH FUND II
PORTFOLIO OF INVESTMENTS (continued)
February 29, 2016
Notes to Portfolio of Investments
(a) Non-income producing investment.
(b) The rate shown is the seven-day current annualized yield at February 29, 2016.
(c) As defined in the Investment Company Act of 1940, an affiliated company is one in which the Fund owns 5% or more of the company's outstanding voting securities, or a company which is under common ownership or control with the Fund. Holdings and transactions in these affiliated companies during the year ended February 29, 2016 are as follows:
Issuer | | Beginning
Cost ($) | | Purchase
Cost ($) | | Proceeds
From Sales ($) | | Ending
Cost ($) | | Dividends —
Affiliated
Issuers ($) | | Value ($) | |
Columbia Short-Term Cash Fund | | | 2,149,309 | | | | 511,493,574 | | | | (466,201,199 | ) | | | 47,441,684 | | | | 79,496 | | | | 47,441,684 | | |
Abbreviation Legend
ADR American Depositary Receipt
Fair Value Measurements
The Fund categorizes its fair value measurements according to a three-level hierarchy that maximizes the use of observable inputs and minimizes the use of unobservable inputs by prioritizing that the most observable input be used when available. Observable inputs are those that market participants would use in pricing an investment based on market data obtained from sources independent of the reporting entity. Unobservable inputs are those that reflect the Fund's assumptions about the information market participants would use in pricing an investment. An investment's level within the fair value hierarchy is based on the lowest level of any input that is deemed significant to the asset's or liability's fair value measurement. The input levels are not necessarily an indication of the risk or liquidity associated with investments at that level. For example, certain U.S. government securities are generally high quality and liquid, however, they are reflected as Level 2 because the inputs used to determine fair value may not always be quoted prices in an active market.
Fair value inputs are summarized in the three broad levels listed below:
> Level 1 — Valuations based on quoted prices for investments in active markets that the Fund has the ability to access at the measurement date (including NAV for open-end mutual funds). Valuation adjustments are not applied to Level 1 investments.
> Level 2 — Valuations based on other significant observable inputs (including quoted prices for similar securities, interest rates, prepayment speeds, credit risks, etc.).
> Level 3 — Valuations based on significant unobservable inputs (including the Fund's own assumptions and judgment in determining the fair value of investments).
Inputs that are used in determining fair value of an investment may include price information, credit data, volatility statistics, and other factors. These inputs can be either observable or unobservable. The availability of observable inputs can vary between investments, and is affected by various factors such as the type of investment, and the volume and level of activity for that investment or similar investments in the marketplace. The inputs will be considered by the Investment Manager, along with any other relevant factors in the calculation of an investment's fair value. The Fund uses prices and inputs that are current as of the measurement date, which may include periods of market dislocations. During these periods, the availability of prices and inputs may be reduced for many investments. This condition could cause an investment to be reclassified between the various levels within the hierarchy.
Investments falling into the Level 3 category are primarily supported by quoted prices from brokers and dealers participating in the market for those investments. However, these may be classified as Level 3 investments due to lack of market transparency and corroboration to support these quoted prices. Additionally, valuation models may be used as the pricing source for any remaining investments classified as Level 3. These models may rely on one or more significant unobservable inputs and/or significant assumptions by the Investment Manager. Inputs used in valuations may include, but are not limited to, financial statement analysis, capital account balances, discount rates and estimated cash flows, and comparable company data.
Under the direction of the Fund's Board of Trustees (the Board), the Investment Manager's Valuation Committee (the Committee) is responsible for overseeing the valuation procedures approved by the Board. The Committee consists of voting and non-voting members from various groups within the Investment Manager's organization, including operations and accounting, trading and investments, compliance, risk management and legal.
The accompanying Notes to Financial Statements are an integral part of this statement.
Annual Report 2016
9
COLUMBIA LARGE CAP GROWTH FUND II
PORTFOLIO OF INVESTMENTS (continued)
February 29, 2016
Fair Value Measurements (continued)
The Committee meets at least monthly to review and approve valuation matters, which may include a description of specific valuation determinations, data regarding pricing information received from approved pricing vendors and brokers and the results of Board-approved valuation control policies and procedures (the Policies). The Policies address, among other things, instances when market quotations are or are not readily available, including recommendations of third party pricing vendors and a determination of appropriate pricing methodologies; events that require specific valuation determinations and assessment of fair value techniques; securities with a potential for stale pricing, including those that are illiquid, restricted, or in default; and the effectiveness of third party pricing vendors, including periodic reviews of vendors. The Committee meets more frequently, as needed, to discuss additional valuation matters, which may include the need to review back-testing results, review time-sensitive information or approve related valuation actions. The Committee reports to the Board, with members of the Committee meeting with the Board at each of its regularly scheduled meetings to discuss valuation matters and actions during the period, similar to those described earlier.
For investments categorized as Level 3, the Committee monitors information similar to that described above, which may include: (i) data specific to the issuer or comparable issuers, (ii) general market or specific sector news and (iii) quoted prices and specific or similar security transactions. The Committee considers this data and any changes from prior periods in order to assess the reasonableness of observable and unobservable inputs, any assumptions or internal models used to value those securities and changes in fair value. This data is also used to corroborate, when available, information received from approved pricing vendors and brokers. Various factors impact the frequency of monitoring this information (which may occur as often as daily). However, the Committee may determine that changes to inputs, assumptions and models are not required as a result of the monitoring procedures performed.
The following table is a summary of the inputs used to value the Fund's investments at February 29, 2016:
| | | Level 1
Quoted Prices in Active
Markets for Identical
Assets ($) | | Level 2
Other Significant
Observable Inputs ($) | | Level 3
Significant
Unobservable Inputs ($) | | Total ($) | |
Investments | |
Common Stocks | |
Consumer Discretionary | | | 124,911,208 | | | | — | | | | — | | | | 124,911,208 | | |
Consumer Staples | | | 78,281,679 | | | | — | | | | — | | | | 78,281,679 | | |
Financials | | | 33,617,817 | | | | — | | | | — | | | | 33,617,817 | | |
Health Care | | | 96,000,134 | | | | — | | | | — | | | | 96,000,134 | | |
Industrials | | | 52,311,983 | | | | — | | | | — | | | | 52,311,983 | | |
Information Technology | | | 226,383,778 | | | | — | | | | — | | | | 226,383,778 | | |
Materials | | | 15,256,705 | | | | — | | | | — | | | | 15,256,705 | | |
Telecommunication Services | | | 5,604,583 | | | | — | | | | — | | | | 5,604,583 | | |
Total Common Stocks | | | 632,367,887 | | | | — | | | | — | | | | 632,367,887 | | |
Exchange-Traded Funds | | | 34,618,857 | | | | — | | | | — | | | | 34,618,857 | | |
Money Market Funds | | | — | | | | 47,441,684 | | | | — | | | | 47,441,684 | | |
Total Investments | | | 666,986,744 | | | | 47,441,684 | | | | — | | | | 714,428,428 | | |
See the Portfolio of Investments for all investment classifications not indicated in the table.
The Fund's assets assigned to the Level 2 input category are valued based upon utilizing observable market inputs, in which a security's value is determined through reference to prices and information from market transactions for similar or identical assets and/or fund per share market values which are not considered publicly available.
Financial assets were transferred from Level 1 to Level 2 as the market for these assets is not considered publicly available. Fund per share market values were obtained using observable market inputs.
The accompanying Notes to Financial Statements are an integral part of this statement.
Annual Report 2016
10
COLUMBIA LARGE CAP GROWTH FUND II
PORTFOLIO OF INVESTMENTS (continued)
February 29, 2016
Fair Value Measurements (continued)
The following table shows transfers between Level 1 and Level 2 of the fair value hierarchy:
Transfers In | | Transfers Out | |
| Level 1 ($) | | Level 2 ($) | | Level 1 ($) | | Level 2 ($) | |
| | — | | | | 2,149,309 | | | | 2,149,309 | | | | — | | |
Transfers between Level 1 and Level 2 are determined based on the fair value at the beginning of the period for security positions held throughout the period.
There were no transfers of financial assets between Levels 2 and 3 during the period.
The accompanying Notes to Financial Statements are an integral part of this statement.
Annual Report 2016
11
COLUMBIA LARGE CAP GROWTH FUND II
STATEMENT OF ASSETS AND LIABILITIES
February 29, 2016
Assets | |
Investments, at value | |
Unaffiliated issuers (identified cost $691,480,474) | | $ | 666,986,744 | | |
Affiliated issuers (identified cost $47,441,684) | | | 47,441,684 | | |
Total investments (identified cost $738,922,158) | | | 714,428,428 | | |
Receivable for: | |
Investments sold | | | 21,423,271 | | |
Capital shares sold | | | 73,884 | | |
Dividends | | | 570,999 | | |
Foreign tax reclaims | | | 21,419 | | |
Expense reimbursement due from Investment Manager | | | 236 | | |
Prepaid expenses | | | 2,615 | | |
Total assets | | | 736,520,852 | | |
Liabilities | |
Payable for: | |
Investments purchased | | | 10,104,594 | | |
Capital shares purchased | | | 1,315,013 | | |
Investment management fees | | | 45,372 | | |
Distribution and/or service fees | | | 23,880 | | |
Transfer agent fees | | | 173,487 | | |
Compensation of board members | | | 117,716 | | |
Other expenses | | | 68,818 | | |
Total liabilities | | | 11,848,880 | | |
Net assets applicable to outstanding capital stock | | $ | 724,671,972 | | |
Represented by | |
Paid-in capital | | $ | 2,072,799,186 | | |
Excess of distributions over net investment income | | | (709,336 | ) | |
Accumulated net realized loss | | | (1,322,922,083 | ) | |
Unrealized appreciation (depreciation) on: | |
Investments | | | (24,493,730 | ) | |
Foreign currency translations | | | (2,065 | ) | |
Total — representing net assets applicable to outstanding capital stock | | $ | 724,671,972 | | |
The accompanying Notes to Financial Statements are an integral part of this statement.
Annual Report 2016
12
COLUMBIA LARGE CAP GROWTH FUND II
STATEMENT OF ASSETS AND LIABILITIES (continued)
February 29, 2016
Class A | |
Net assets | | $ | 358,205,306 | | |
Shares outstanding | | | 19,608,855 | | |
Net asset value per share | | $ | 18.27 | | |
Maximum offering price per share(a) | | $ | 19.38 | | |
Class B | |
Net assets | | $ | 7,156,567 | | |
Shares outstanding | | | 436,704 | | |
Net asset value per share | | $ | 16.39 | | |
Class C | |
Net assets | | $ | 184,473,057 | | |
Shares outstanding | | | 11,257,042 | | |
Net asset value per share | | $ | 16.39 | | |
Class R | |
Net assets | | $ | 13,845,462 | | |
Shares outstanding | | | 773,207 | | |
Net asset value per share | | $ | 17.91 | | |
Class R4 | |
Net assets | | $ | 1,012,865 | | |
Shares outstanding | | | 52,792 | | |
Net asset value per share | | $ | 19.19 | | |
Class R5 | |
Net assets | | $ | 549,006 | | |
Shares outstanding | | | 29,011 | | |
Net asset value per share | | $ | 18.92 | | |
Class Z | |
Net assets | | $ | 159,429,709 | | |
Shares outstanding | | | 8,450,042 | | |
Net asset value per share | | $ | 18.87 | | |
(a) The maximum offering price per share is calculated by dividing the net asset value per share by 1.0 minus the maximum sales charge of 5.75%.
The accompanying Notes to Financial Statements are an integral part of this statement.
Annual Report 2016
13
COLUMBIA LARGE CAP GROWTH FUND II
STATEMENT OF OPERATIONS
Year Ended February 29, 2016
Net investment income | |
Income: | |
Dividends — unaffiliated issuers | | $ | 4,949,440 | | |
Dividends — affiliated issuers | | | 79,496 | | |
Interest | | | 873 | | |
Foreign taxes withheld | | | (43,512 | ) | |
Total income | | | 4,986,297 | | |
Expenses: | |
Investment management fees | | | 6,863,425 | | |
Distribution and/or service fees | |
Class A | | | 1,108,983 | | |
Class B | | | 173,728 | | |
Class C | | | 2,284,237 | | |
Class R | | | 91,532 | | |
Transfer agent fees | |
Class A | | | 836,005 | | |
Class B | | | 32,812 | | |
Class C | | | 430,518 | | |
Class R | | | 34,527 | | |
Class R4 | | | 2,153 | | |
Class R5 | | | 180 | | |
Class Z | | | 394,733 | | |
Compensation of board members | | | 15,200 | | |
Custodian fees | | | 13,803 | | |
Printing and postage fees | | | 139,642 | | |
Registration fees | | | 96,846 | | |
Audit fees | | | 20,780 | | |
Legal fees | | | 12,590 | | |
Other | | | 29,940 | | |
Total expenses | | | 12,581,634 | | |
Fees waived or expenses reimbursed by Investment Manager and its affiliates | | | (236 | ) | |
Expense reductions | | | (640 | ) | |
Total net expenses | | | 12,580,758 | | |
Net investment loss | | | (7,594,461 | ) | |
Realized and unrealized gain (loss) — net | |
Net realized gain (loss) on: | |
Investments | | | 140,554,326 | | |
Foreign currency translations | | | (11,449 | ) | |
Net realized gain | | | 140,542,877 | | |
Net change in unrealized appreciation (depreciation) on: | |
Investments | | | (269,291,341 | ) | |
Foreign currency translations | | | (1,014 | ) | |
Net change in unrealized depreciation | | | (269,292,355 | ) | |
Net realized and unrealized loss | | | (128,749,478 | ) | |
Net decrease in net assets from operations | | $ | (136,343,939 | ) | |
The accompanying Notes to Financial Statements are an integral part of this statement.
Annual Report 2016
14
COLUMBIA LARGE CAP GROWTH FUND II
STATEMENT OF CHANGES IN NET ASSETS
| | | Year Ended
February 29,
2016 | | Year Ended
February 28,
2015 | |
Operations | |
Net investment loss | | $ | (7,594,461 | ) | | $ | (7,920,024 | ) | |
Net realized gain | | | 140,542,877 | | | | 162,037,220 | | |
Net change in unrealized depreciation | | | (269,292,355 | ) | | | (76,657,451 | ) | |
Net increase (decrease) in net assets resulting from operations | | | (136,343,939 | ) | | | 77,459,745 | | |
Decrease in net assets from capital stock activity | | | (167,581,461 | ) | | | (201,760,853 | ) | |
Total decrease in net assets | | | (303,925,400 | ) | | | (124,301,108 | ) | |
Net assets at beginning of year | | | 1,028,597,372 | | | | 1,152,898,480 | | |
Net assets at end of year | | $ | 724,671,972 | | | $ | 1,028,597,372 | | |
Excess of distributions over net investment income | | $ | (709,336 | ) | | $ | (935,096 | ) | |
The accompanying Notes to Financial Statements are an integral part of this statement.
Annual Report 2016
15
COLUMBIA LARGE CAP GROWTH FUND II
STATEMENT OF CHANGES IN NET ASSETS (continued)
| | | Year Ended February 29, 2016 | | Year Ended February 28, 2015 | |
| | | Shares | | Dollars ($) | | Shares | | Dollars ($) | |
Capital stock activity | |
Class A shares | |
Subscriptions(a) | | | 1,672,564 | | | | 34,716,565 | | | | 1,822,398 | | | | 35,828,885 | | |
Redemptions | | | (4,548,095 | ) | | | (93,570,631 | ) | | | (8,698,301 | ) | | | (172,353,015 | ) | |
Net decrease | | | (2,875,531 | ) | | | (58,854,066 | ) | | | (6,875,903 | ) | | | (136,524,130 | ) | |
Class B shares | |
Subscriptions | | | 2,034 | | | | 39,007 | | | | 5,175 | | | | 92,504 | | |
Redemptions(a) | | | (1,079,587 | ) | | | (20,318,470 | ) | | | (1,314,748 | ) | | | (23,424,857 | ) | |
Net decrease | | | (1,077,553 | ) | | | (20,279,463 | ) | | | (1,309,573 | ) | | | (23,332,353 | ) | |
Class C shares | |
Subscriptions | | | 269,695 | | | | 5,058,395 | | | | 330,566 | | | | 5,960,073 | | |
Redemptions | | | (1,996,059 | ) | | | (37,055,568 | ) | | | (2,284,607 | ) | | | (41,075,556 | ) | |
Net decrease | | | (1,726,364 | ) | | | (31,997,173 | ) | | | (1,954,041 | ) | | | (35,115,483 | ) | |
Class R shares | |
Subscriptions | | | 112,343 | | | | 2,297,474 | | | | 126,730 | | | | 2,465,018 | | |
Redemptions | | | (333,893 | ) | | | (6,863,164 | ) | | | (397,081 | ) | | | (7,624,823 | ) | |
Net decrease | | | (221,550 | ) | | | (4,565,690 | ) | | | (270,351 | ) | | | (5,159,805 | ) | |
Class R4 shares | |
Subscriptions | | | 31,994 | | | | 711,269 | | | | 40,807 | | | | 857,251 | | |
Redemptions | | | (19,077 | ) | | | (400,024 | ) | | | (11,930 | ) | | | (264,813 | ) | |
Net increase | | | 12,917 | | | | 311,245 | | | | 28,877 | | | | 592,438 | | |
Class R5 shares | |
Subscriptions | | | 30,030 | | | | 657,503 | | | | 2,573 | | | | 54,344 | | |
Redemptions | | | (3,296 | ) | | | (66,989 | ) | | | (424 | ) | | | (8,972 | ) | |
Net increase | | | 26,734 | | | | 590,514 | | | | 2,149 | | | | 45,372 | | |
Class Z shares | |
Subscriptions | | | 572,402 | | | | 12,201,671 | | | | 3,982,334 | | | | 81,594,747 | | |
Redemptions | | | (3,039,851 | ) | | | (64,988,499 | ) | | | (4,139,957 | ) | | | (83,861,639 | ) | |
Net decrease | | | (2,467,449 | ) | | | (52,786,828 | ) | | | (157,623 | ) | | | (2,266,892 | ) | |
Total net decrease | | | (8,328,796 | ) | | | (167,581,461 | ) | | | (10,536,465 | ) | | | (201,760,853 | ) | |
(a) Includes conversions of Class B shares to Class A shares, if any.
The accompanying Notes to Financial Statements are an integral part of this statement.
Annual Report 2016
16
COLUMBIA LARGE CAP GROWTH FUND II
The following tables are intended to help you understand the Fund's financial performance. Certain information reflects financial results for a single share of a class held for the periods shown. Per share net investment income (loss) amounts are calculated based on average shares outstanding during the period. Total return assumes reinvestment of all dividends and distributions, if any. Total return does not reflect payment of sales charges, if any. Total return and portfolio turnover are not annualized for periods of less than one year. The portfolio turnover rate is calculated without regard to purchase and sales transactions of short-term instruments and certain derivatives, if any. If such transactions were included, the Fund's portfolio turnover rate may be higher.
| | | Year Ended
February 29, | | Year Ended February 28, | | Year Ended
February 29, | |
Class A | | 2016 | | 2015 | | 2014 | | 2013 | | 2012 | |
Per share data | |
Net asset value, beginning of period | | $ | 21.49 | | | $ | 19.82 | | | $ | 14.14 | | | $ | 13.25 | | | $ | 14.22 | | |
Income from investment operations: | |
Net investment income (loss) | | | (0.14 | ) | | | (0.12 | ) | | | (0.10 | ) | | | 0.01 | | | | (0.03 | ) | |
Net realized and unrealized gain (loss) | | | (3.08 | ) | | | 1.79 | | | | 5.78 | | | | 0.88 | | | | (0.94 | ) | |
Total from investment operations | | | (3.22 | ) | | | 1.67 | | | | 5.68 | | | | 0.89 | | | | (0.97 | ) | |
Less distributions to shareholders: | |
Net investment income | | | — | | | | — | | | | — | | | | (0.00 | )(a) | | | — | | |
Total distributions to shareholders | | | — | | | | — | | | | — | | | | (0.00 | )(a) | | | — | | |
Net asset value, end of period | | $ | 18.27 | | | $ | 21.49 | | | $ | 19.82 | | | $ | 14.14 | | | $ | 13.25 | | |
Total return | | | (14.98 | %) | | | 8.43 | % | | | 40.17 | % | | | 6.74 | % | | | (6.82 | %) | |
Ratios to average net assets(b) | |
Total gross expenses | | | 1.22 | % | | | 1.21 | % | | | 1.23 | %(c) | | | 1.36 | %(c) | | | 1.37 | %(c) | |
Total net expenses(d) | | | 1.22 | %(e) | | | 1.21 | %(e) | | | 1.23 | %(c)(e) | | | 1.35 | %(c)(e) | | | 1.37 | %(c)(e) | |
Net investment income (loss) | | | (0.68 | %) | | | (0.60 | %) | | | (0.60 | %) | | | 0.06 | % | | | (0.23 | %) | |
Supplemental data | |
Net assets, end of period (in thousands) | | $ | 358,205 | | | $ | 483,252 | | | $ | 581,859 | | | $ | 526,471 | | | $ | 811,890 | | |
Portfolio turnover | | | 125 | % | | | 81 | % | | | 99 | % | | | 65 | % | | | 104 | % | |
Notes to Financial Highlights
(a) Rounds to zero.
(b) In addition to the fees and expenses that the Fund bears directly, the Fund indirectly bears a pro rata share of the fees and expenses of any other funds in which it invests. Such indirect expenses are not included in the Fund's reported expense ratios.
(c) Ratios include line of credit interest expense which is less than 0.01%.
(d) Total net expenses include the impact of certain fee waivers/expense reimbursements made by the Investment Manager and certain of its affiliates, if applicable.
(e) The benefits derived from expense reductions had an impact of less than 0.01%.
The accompanying Notes to Financial Statements are an integral part of this statement.
Annual Report 2016
17
COLUMBIA LARGE CAP GROWTH FUND II
FINANCIAL HIGHLIGHTS (continued)
| | | Year Ended
February 29, | | Year Ended February 28, | | Year Ended
February 29, | |
Class B | | 2016 | | 2015 | | 2014 | | 2013 | | 2012 | |
Per share data | |
Net asset value, beginning of period | | $ | 19.43 | | | $ | 18.05 | | | $ | 12.98 | | | $ | 12.25 | | | $ | 13.25 | | |
Income from investment operations: | |
Net investment loss | | | (0.28 | ) | | | (0.24 | ) | | | (0.21 | ) | | | (0.08 | ) | | | (0.12 | ) | |
Net realized and unrealized gain (loss) | | | (2.76 | ) | | | 1.62 | | | | 5.28 | | | | 0.81 | | | | (0.88 | ) | |
Total from investment operations | | | (3.04 | ) | | | 1.38 | | | | 5.07 | | | | 0.73 | | | | (1.00 | ) | |
Net asset value, end of period | | $ | 16.39 | | | $ | 19.43 | | | $ | 18.05 | | | $ | 12.98 | | | $ | 12.25 | | |
Total return | | | (15.65 | %) | | | 7.65 | % | | | 39.06 | % | | | 5.96 | % | | | (7.55 | %) | |
Ratios to average net assets(a) | |
Total gross expenses | | | 1.97 | % | | | 1.96 | % | | | 1.98 | %(b) | | | 2.10 | %(b) | | | 2.12 | %(b) | |
Total net expenses(c) | | | 1.97 | %(d) | | | 1.96 | %(d) | | | 1.98 | %(b)(d) | | | 2.10 | %(b)(d) | | | 2.12 | %(b)(d) | |
Net investment loss | | | (1.45 | %) | | | (1.37 | %) | | | (1.35 | %) | | | (0.67 | %) | | | (0.97 | %) | |
Supplemental data | |
Net assets, end of period (in thousands) | | $ | 7,157 | | | $ | 29,420 | | | $ | 50,972 | | | $ | 52,823 | | | $ | 72,692 | | |
Portfolio turnover | | | 125 | % | | | 81 | % | | | 99 | % | | | 65 | % | | | 104 | % | |
Notes to Financial Highlights
(a) In addition to the fees and expenses that the Fund bears directly, the Fund indirectly bears a pro rata share of the fees and expenses of any other funds in which it invests. Such indirect expenses are not included in the Fund's reported expense ratios.
(b) Ratios include line of credit interest expense which is less than 0.01%.
(c) Total net expenses include the impact of certain fee waivers/expense reimbursements made by the Investment Manager and certain of its affiliates, if applicable.
(d) The benefits derived from expense reductions had an impact of less than 0.01%.
The accompanying Notes to Financial Statements are an integral part of this statement.
Annual Report 2016
18
COLUMBIA LARGE CAP GROWTH FUND II
FINANCIAL HIGHLIGHTS (continued)
| | | Year Ended
February 29, | | Year Ended February 28, | | Year Ended
February 29, | |
Class C | | 2016 | | 2015 | | 2014 | | 2013 | | 2012 | |
Per share data | |
Net asset value, beginning of period | | $ | 19.43 | | | $ | 18.05 | | | $ | 12.98 | | | $ | 12.25 | | | $ | 13.25 | | |
Income from investment operations: | |
Net investment loss | | | (0.27 | ) | | | (0.24 | ) | | | (0.21 | ) | | | (0.08 | ) | | | (0.12 | ) | |
Net realized and unrealized gain (loss) | | | (2.77 | ) | | | 1.62 | | | | 5.28 | | | | 0.81 | | | | (0.88 | ) | |
Total from investment operations | | | (3.04 | ) | | | 1.38 | | | | 5.07 | | | | 0.73 | | | | (1.00 | ) | |
Net asset value, end of period | | $ | 16.39 | | | $ | 19.43 | | | $ | 18.05 | | | $ | 12.98 | | | $ | 12.25 | | |
Total return | | | (15.65 | %) | | | 7.65 | % | | | 39.06 | % | | | 5.96 | % | | | (7.55 | %) | |
Ratios to average net assets(a) | |
Total gross expenses | | | 1.98 | % | | | 1.96 | % | | | 1.98 | %(b) | | | 2.10 | %(b) | | | 2.12 | %(b) | |
Total net expenses(c) | | | 1.98 | %(d) | | | 1.96 | %(d) | | | 1.98 | %(b)(d) | | | 2.10 | %(b)(d) | | | 2.12 | %(b)(d) | |
Net investment loss | | | (1.43 | %) | | | (1.35 | %) | | | (1.36 | %) | | | (0.68 | %) | | | (0.97 | %) | |
Supplemental data | |
Net assets, end of period (in thousands) | | $ | 184,473 | | | $ | 252,224 | | | $ | 269,583 | | | $ | 236,373 | | | $ | 342,021 | | |
Portfolio turnover | | | 125 | % | | | 81 | % | | | 99 | % | | | 65 | % | | | 104 | % | |
Notes to Financial Highlights
(a) In addition to the fees and expenses that the Fund bears directly, the Fund indirectly bears a pro rata share of the fees and expenses of any other funds in which it invests. Such indirect expenses are not included in the Fund's reported expense ratios.
(b) Ratios include line of credit interest expense which is less than 0.01%.
(c) Total net expenses include the impact of certain fee waivers/expense reimbursements made by the Investment Manager and certain of its affiliates, if applicable.
(d) The benefits derived from expense reductions had an impact of less than 0.01%.
The accompanying Notes to Financial Statements are an integral part of this statement.
Annual Report 2016
19
COLUMBIA LARGE CAP GROWTH FUND II
FINANCIAL HIGHLIGHTS (continued)
| | | Year Ended
February 29, | | Year Ended February 28, | | Year Ended
February 29, | |
Class R | | 2016 | | 2015 | | 2014 | | 2013 | | 2012 | |
Per share data | |
Net asset value, beginning of period | | $ | 21.12 | | | $ | 19.52 | | | $ | 13.97 | | | $ | 13.12 | | | $ | 14.11 | | |
Income from investment operations: | |
Net investment loss | | | (0.19 | ) | | | (0.16 | ) | | | (0.14 | ) | | | (0.02 | ) | | | (0.06 | ) | |
Net realized and unrealized gain (loss) | | | (3.02 | ) | | | 1.76 | | | | 5.69 | | | | 0.87 | | | | (0.93 | ) | |
Total from investment operations | | | (3.21 | ) | | | 1.60 | | | | 5.55 | | | | 0.85 | | | | (0.99 | ) | |
Net asset value, end of period | | $ | 17.91 | | | $ | 21.12 | | | $ | 19.52 | | | $ | 13.97 | | | $ | 13.12 | | |
Total return | | | (15.20 | %) | | | 8.20 | % | | | 39.73 | % | | | 6.48 | % | | | (7.02 | %) | |
Ratios to average net assets(a) | |
Total gross expenses | | | 1.47 | % | | | 1.46 | % | | | 1.48 | %(b) | | | 1.61 | %(b) | | | 1.62 | %(b) | |
Total net expenses(c) | | | 1.47 | %(d) | | | 1.46 | %(d) | | | 1.48 | %(b)(d) | | | 1.60 | %(b)(d) | | | 1.62 | %(b)(d) | |
Net investment loss | | | (0.94 | %) | | | (0.85 | %) | | | (0.85 | %) | | | (0.17 | %) | | | (0.46 | %) | |
Supplemental data | |
Net assets, end of period (in thousands) | | $ | 13,845 | | | $ | 21,010 | | | $ | 24,700 | | | $ | 22,756 | | | $ | 30,137 | | |
Portfolio turnover | | | 125 | % | | | 81 | % | | | 99 | % | | | 65 | % | | | 104 | % | |
Notes to Financial Highlights
(a) In addition to the fees and expenses that the Fund bears directly, the Fund indirectly bears a pro rata share of the fees and expenses of any other funds in which it invests. Such indirect expenses are not included in the Fund's reported expense ratios.
(b) Ratios include line of credit interest expense which is less than 0.01%.
(c) Total net expenses include the impact of certain fee waivers/expense reimbursements made by the Investment Manager and certain of its affiliates, if applicable.
(d) The benefits derived from expense reductions had an impact of less than 0.01%.
The accompanying Notes to Financial Statements are an integral part of this statement.
Annual Report 2016
20
COLUMBIA LARGE CAP GROWTH FUND II
FINANCIAL HIGHLIGHTS (continued)
| | | Year Ended
February 29, | | Year Ended February 28, | |
Class R4 | | 2016 | | 2015 | | 2014 | | 2013(a) | |
Per share data | |
Net asset value, beginning of period | | $ | 22.52 | | | $ | 20.71 | | | $ | 14.74 | | | $ | 13.29 | | |
Income from investment operations: | |
Net investment income (loss) | | | (0.09 | ) | | | (0.06 | ) | | | (0.06 | ) | | | 0.01 | | |
Net realized and unrealized gain (loss) | | | (3.24 | ) | | | 1.87 | | | | 6.03 | | | | 1.48 | | |
Total from investment operations | | | (3.33 | ) | | | 1.81 | | | | 5.97 | | | | 1.49 | | |
Less distributions to shareholders: | |
Net investment income | | | — | | | | — | | | | — | | | | (0.04 | ) | |
Total distributions to shareholders | | | — | | | | — | | | | — | | | | (0.04 | ) | |
Net asset value, end of period | | $ | 19.19 | | | $ | 22.52 | | | $ | 20.71 | | | $ | 14.74 | | |
Total return | | | (14.79 | %) | | | 8.74 | % | | | 40.50 | % | | | 11.20 | % | |
Ratios to average net assets(b) | |
Total gross expenses | | | 0.98 | % | | | 0.97 | % | | | 0.98 | %(c) | | | 1.02 | %(c)(d) | |
Total net expenses(e) | | | 0.98 | %(f) | | | 0.97 | %(f) | | | 0.98 | %(c)(f) | | | 1.02 | %(c)(d) | |
Net investment income (loss) | | | (0.41 | %) | | | (0.28 | %) | | | (0.34 | %) | | | 0.28 | %(d) | |
Supplemental data | |
Net assets, end of period (in thousands) | | $ | 1,013 | | | $ | 898 | | | $ | 228 | | | $ | 3 | | |
Portfolio turnover | | | 125 | % | | | 81 | % | | | 99 | % | | | 65 | % | |
Notes to Financial Highlights
(a) Based on operations from November 8, 2012 (commencement of operations) through the stated period end.
(b) In addition to the fees and expenses that the Fund bears directly, the Fund indirectly bears a pro rata share of the fees and expenses of any other funds in which it invests. Such indirect expenses are not included in the Fund's reported expense ratios.
(c) Ratios include line of credit interest expense which is less than 0.01%.
(d) Annualized.
(e) Total net expenses include the impact of certain fee waivers/expense reimbursements made by the Investment Manager and certain of its affiliates, if applicable.
(f) The benefits derived from expense reductions had an impact of less than 0.01%.
The accompanying Notes to Financial Statements are an integral part of this statement.
Annual Report 2016
21
COLUMBIA LARGE CAP GROWTH FUND II
FINANCIAL HIGHLIGHTS (continued)
| | | Year Ended
February 29, | | Year Ended February 28, | |
Class R5 | | 2016 | | 2015 | | 2014(a) | |
Per share data | |
Net asset value, beginning of period | | $ | 22.18 | | | $ | 20.37 | | | $ | 19.48 | | |
Income from investment operations: | |
Net investment income (loss) | | | (0.05 | ) | | | (0.02 | ) | | | (0.01 | ) | |
Net realized and unrealized gain (loss) | | | (3.21 | ) | | | 1.83 | | | | 0.90 | | |
Total from investment operations | | | (3.26 | ) | | | 1.81 | | | | 0.89 | | |
Net asset value, end of period | | $ | 18.92 | | | $ | 22.18 | | | $ | 20.37 | | |
Total return | | | (14.70 | %) | | | 8.89 | % | | | 4.57 | % | |
Ratios to average net assets(b) | |
Total gross expenses | | | 0.84 | % | | | 0.84 | % | | | 0.80 | %(c) | |
Total net expenses(d) | | | 0.84 | % | | | 0.84 | % | | | 0.80 | %(c) | |
Net investment income (loss) | | | (0.22 | %) | | | (0.09 | %) | | | (0.51 | %)(c) | |
Supplemental data | |
Net assets, end of period (in thousands) | | $ | 549 | | | $ | 51 | | | $ | 3 | | |
Portfolio turnover | | | 125 | % | | | 81 | % | | | 99 | % | |
Notes to Financial Highlights
(a) Based on operations from January 8, 2014 (commencement of operations) through the stated period end.
(b) In addition to the fees and expenses that the Fund bears directly, the Fund indirectly bears a pro rata share of the fees and expenses of any other funds in which it invests. Such indirect expenses are not included in the Fund's reported expense ratios.
(c) Annualized.
(d) Total net expenses include the impact of certain fee waivers/expense reimbursements made by the Investment Manager and certain of its affiliates, if applicable.
The accompanying Notes to Financial Statements are an integral part of this statement.
Annual Report 2016
22
COLUMBIA LARGE CAP GROWTH FUND II
FINANCIAL HIGHLIGHTS (continued)
| | | Year Ended
February 29, | | Year Ended February 28, | | Year Ended
February 29, | |
Class Z | | 2016 | | 2015 | | 2014 | | 2013 | | 2012 | |
Per share data | |
Net asset value, beginning of period | | $ | 22.14 | | | $ | 20.37 | | | $ | 14.50 | | | $ | 13.57 | | | $ | 14.54 | | |
Income from investment operations: | |
Net investment income (loss) | | | (0.09 | ) | | | (0.07 | ) | | | (0.06 | ) | | | 0.04 | | | | 0.01 | | |
Net realized and unrealized gain (loss) | | | (3.18 | ) | | | 1.84 | | | | 5.93 | | | | 0.92 | | | | (0.98 | ) | |
Total from investment operations | | | (3.27 | ) | | | 1.77 | | | | 5.87 | | | | 0.96 | | | | (0.97 | ) | |
Less distributions to shareholders: | |
Net investment income | | | — | | | | — | | | | — | | | | (0.03 | ) | | | — | | |
Total distributions to shareholders | | | — | | | | — | | | | — | | | | (0.03 | ) | | | — | | |
Net asset value, end of period | | $ | 18.87 | | | $ | 22.14 | | | $ | 20.37 | | | $ | 14.50 | | | $ | 13.57 | | |
Total return | | | (14.77 | %) | | | 8.69 | % | | | 40.48 | % | | | 7.09 | % | | | (6.67 | %) | |
Ratios to average net assets(a) | |
Total gross expenses | | | 0.97 | % | | | 0.97 | % | | | 0.98 | %(b) | | | 1.11 | %(b) | | | 1.12 | %(b) | |
Total net expenses(c) | | | 0.97 | %(d) | | | 0.97 | %(d) | | | 0.98 | %(b)(d) | | | 1.10 | %(b)(d) | | | 1.12 | %(b)(d) | |
Net investment income (loss) | | | (0.43 | %) | | | (0.34 | %) | | | (0.36 | %) | | | 0.27 | % | | | 0.04 | % | |
Supplemental data | |
Net assets, end of period (in thousands) | | $ | 159,430 | | | $ | 241,743 | | | $ | 225,554 | | | $ | 200,226 | | | $ | 449,867 | | |
Portfolio turnover | | | 125 | % | | | 81 | % | | | 99 | % | | | 65 | % | | | 104 | % | |
Notes to Financial Highlights
(a) In addition to the fees and expenses that the Fund bears directly, the Fund indirectly bears a pro rata share of the fees and expenses of any other funds in which it invests. Such indirect expenses are not included in the Fund's reported expense ratios.
(b) Ratios include line of credit interest expense which is less than 0.01%.
(c) Total net expenses include the impact of certain fee waivers/expense reimbursements made by the Investment Manager and certain of its affiliates, if applicable.
(d) The benefits derived from expense reductions had an impact of less than 0.01%.
The accompanying Notes to Financial Statements are an integral part of this statement.
Annual Report 2016
23
COLUMBIA LARGE CAP GROWTH FUND II
NOTES TO FINANCIAL STATEMENTS
February 29, 2016
Note 1. Organization
Columbia Large Cap Growth Fund II (formerly known as Columbia Marsico 21st Century Fund) (the Fund), a series of Columbia Funds Series Trust (the Trust), is a diversified fund. The Trust is registered under the Investment Company Act of 1940, as amended (the 1940 Act), as an open-end management investment company organized as a Delaware statutory trust. Effective November 20, 2015, Columbia Marsico 21st Century Fund was renamed Columbia Large Cap Growth Fund II.
Fund Shares
The Trust may issue an unlimited number of shares (without par value). The Fund offers Class A, Class B, Class C, Class R, Class R4, Class R5 and Class Z shares. Although all share classes generally have identical voting, dividend and liquidation rights, each share class votes separately when required by the Trust's organizational documents or by law. Different share classes pay different distribution amounts to the extent the expenses of such share classes differ, and distributions in liquidation will be proportional to the net asset value of each share class. Each share class has its own expense and sales charge structure.
Class A shares are subject to a maximum front-end sales charge of 5.75% based on the initial investment amount. Class A shares purchased without an initial sales charge in accounts aggregating $1 million to $50 million at the time of purchase are subject to a contingent deferred sales charge (CDSC) if the shares are sold within 18 months after purchase, charged as follows: 1.00% CDSC if redeemed within 12 months after purchase, and 0.50% CDSC if redeemed more than 12, but less than 18, months after purchase.
Class B shares may be subject to a maximum CDSC of 5.00% based upon the holding period after purchase. Class B shares will generally convert to Class A shares eight years after purchase. The Fund no longer accepts investments by new or existing investors in the Fund's Class B shares, except in connection with the reinvestment of any dividend and/or capital gain distributions in Class B shares of the Fund and exchanges by existing Class B shareholders of certain other funds within the Columbia Family of Funds.
Class C shares are subject to a 1.00% CDSC on shares redeemed within 12 months after purchase.
Class R shares are not subject to sales charges and are generally available only to certain retirement plans and other investors as described in the Fund's prospectus.
Class R4 shares are not subject to sales charges and are generally available only to omnibus retirement plans and certain investors as described in the Fund's prospectus.
Class R5 shares are not subject to sales charges and are generally available only to investors purchasing through authorized investment professionals and omnibus retirement plans.
Class Z shares are not subject to sales charges and are available only to eligible investors, which are subject to different investment minimums as described in the Fund's prospectus.
Note 2. Summary of Significant Accounting Policies
Basis of Preparation
The Fund is an investment company that applies the accounting and reporting guidance in the Financial Accounting Standards Board (FASB) Accounting Standards Codification Topic 946, Financial Services — Investment Companies (ASC 946). The financial statements are prepared in accordance with U.S. generally accepted accounting principles (GAAP), which requires management to make certain estimates and assumptions that affect the reported amounts of assets and liabilities, the disclosure of contingent assets and liabilities at the date of the financial statements and the reported amounts of income and expenses during the reporting period. Actual results could differ from those estimates.
The following is a summary of significant accounting policies followed by the Fund in the preparation of its financial statements.
Security Valuation
All equity securities and exchange-traded funds are valued at the close of business of the New York Stock Exchange (NYSE). Equity securities and exchange-traded funds are valued at the last quoted sales price on the principal exchange or market on which they trade, except for securities traded on the NASDAQ Stock Market, which are valued at the NASDAQ official close price. Unlisted securities or listed securities for which there were no sales during the day are valued at the mean of the latest quoted bid and ask prices on such exchanges or markets.
Annual Report 2016
24
COLUMBIA LARGE CAP GROWTH FUND II
NOTES TO FINANCIAL STATEMENTS (continued)
February 29, 2016
Foreign equity securities are valued based on the closing price on the foreign exchange in which such securities are primarily traded. If any foreign equity security closing prices are not readily available, the securities are valued at the mean of the latest quoted bid and ask prices on such exchanges or markets. Foreign currency exchange rates are generally determined at 4:00 p.m. Eastern (U.S.) time. Many securities markets and exchanges outside the U.S. close prior to the close of the NYSE; therefore, the closing prices for securities in such markets or on such exchanges may not fully reflect events that occur after such close but before the close of the NYSE. In those situations, foreign securities will be fair valued pursuant to a policy adopted by the Board of Trustees (the Board), including, if available, utilizing a third party pricing service to determine these fair values. The third party pricing service takes into account multiple factors, including, but not limited to, movements in the U.S. securities markets, certain depositary receipts, futures contracts and foreign exchange rates that have occurred subsequent to the close of the foreign exchange or market, to determine a good faith estimate that reasonably reflects the current market conditions as of the close of the NYSE. The fair value of a security is likely to be different from the quoted or published price, if available.
Investments in open-end investment companies, including money market funds, are valued at their latest net asset value.
Investments for which market quotations are not readily available, or that have quotations which management believes are not reflective of market value or reliable, are valued at fair value as determined in good faith under procedures approved by and under the general supervision of the Board. If a security or class of securities (such as foreign securities) is valued at fair value, such value is likely to be different from the quoted or published price for the security.
The determination of fair value often requires significant judgment. To determine fair value, management may use assumptions including but not limited to future cash flows and estimated risk premiums. Multiple inputs from various sources may be used to determine fair value.
GAAP requires disclosure regarding the inputs and valuation techniques used to measure fair value and any changes in valuation inputs or techniques. In addition, investments shall be disclosed by major category. This information is disclosed following the Fund's Portfolio of Investments.
Foreign Currency Transactions and Translations
The values of all assets and liabilities denominated in foreign currencies are generally translated into U.S. dollars at exchange rates determined at the close of the NYSE on any given day. Net realized and unrealized gains (losses) on foreign currency transactions and translations include gains (losses) arising from the fluctuation in exchange rates between trade and settlement dates on securities transactions, gains (losses) arising from the disposition of foreign currency and currency gains (losses) between the accrual and payment dates on dividends, interest income and foreign withholding taxes.
For financial statement purposes, the Fund does not distinguish that portion of gains (losses) on investments which is due to changes in foreign exchange rates from that which is due to changes in market prices of the investments. Such fluctuations are included with the net realized and unrealized gains (losses) on investments in the Statement of Operations.
Security Transactions
Security transactions are accounted for on the trade date. Cost is determined and gains (losses) are based upon the specific identification method for both financial statement and federal income tax purposes.
Income Recognition
Corporate actions and dividend income are generally recorded net of any non-reclaimable tax withholdings, on the ex-dividend date or upon receipt of ex-dividend notification in the case of certain foreign securities.
The Fund may receive distributions from holdings in equity securities, business development companies (BDCs), exchange-traded funds, other regulated investment companies (RICs), and real estate investment trusts (REITs), which report information on the tax character of their distributions annually. These distributions are allocated to dividend income, capital gain and return of capital based on actual information reported. Return of capital is recorded as a reduction of the cost basis of securities held. If the Fund no longer owns the applicable securities, return of capital is recorded as a realized gain. With respect to REITs, to the extent actual information has not yet been reported, estimates for return of capital are made by the Fund's management. Management's estimates are subsequently adjusted when the actual character of the distributions is disclosed by the REITs, which could result
Annual Report 2016
25
COLUMBIA LARGE CAP GROWTH FUND II
NOTES TO FINANCIAL STATEMENTS (continued)
February 29, 2016
in a proportionate change in return of capital to shareholders.
Awards from class action litigation are recorded as a reduction of cost basis if the Fund still owns the applicable securities on the payment date. If the Fund no longer owns the applicable securities, the proceeds are recorded as realized gains.
Expenses
General expenses of the Trust are allocated to the Fund and other funds of the Trust based upon relative net assets or other expense allocation methodologies determined by the nature of the expense. Expenses directly attributable to the Fund are charged to the Fund. Expenses directly attributable to a specific class of shares are charged to that share class.
Determination of Class Net Asset Value
All income, expenses (other than class-specific expenses, which are charged to that share class, as shown in the Statement of Operations) and realized and unrealized gains (losses) are allocated to each class of the Fund on a daily basis, based on the relative net assets of each class, for purposes of determining the net asset value of each class.
Federal Income Tax Status
The Fund intends to qualify each year as a regulated investment company under Subchapter M of the Internal Revenue Code, as amended, and will distribute substantially all of its taxable income (including net short-term capital gains), if any, for its tax year, and as such will not be subject to federal income taxes. In addition, the Fund intends to distribute in each calendar year substantially all of its net investment income, capital gains and certain other amounts, if any, such that the Fund should not be subject to federal excise tax. Therefore, no federal income or excise tax provision is recorded.
Foreign Taxes
The Fund may be subject to foreign taxes on income, gains on investments or currency repatriation, a portion of which may be recoverable. The Fund will accrue such taxes and recoveries, as applicable, based upon its current interpretation of tax rules and regulations that exist in the markets in which it invests.
Realized gains in certain countries may be subject to foreign taxes at the Fund level, based on statutory rates. The Fund accrues for such foreign taxes on realized and unrealized gains at the appropriate rate for each
jurisdiction, as applicable. The amount, if any, is disclosed as a liability on the Statement of Assets and Liabilities.
Distributions to Shareholders
Distributions from net investment income, if any, are declared and paid semi-annually. Net realized capital gains, if any, are distributed at least annually. Income distributions and capital gain distributions are determined in accordance with federal income tax regulations, which may differ from GAAP.
Guarantees and Indemnifications
Under the Trust's organizational documents and, in some cases, by contract, its officers and trustees are indemnified against certain liabilities arising out of the performance of their duties to the Trust or its funds. In addition, certain of the Fund's contracts with its service providers contain general indemnification clauses. The Fund's maximum exposure under these arrangements is unknown since the amount of any future claims that may be made against the Fund cannot be determined, and the Fund has no historical basis for predicting the likelihood of any such claims.
Recent Accounting Pronouncement
Fair Value Measurement (Topic 820), Disclosure for Investments in Certain Entities That Calculate Net Asset Value per Share (or Its Equivalent)
In May 2015, FASB issued Accounting Standards Update (ASU) No. 2015-07, Fair Value Measurement (Topic 820), Disclosure for Investments in Certain Entities That Calculate Net Asset Value per Share (or Its Equivalent). ASU No. 2015-07 changes the disclosure requirements for investments for which fair value is measured using the net asset value per share practical expedient. The disclosure requirements are effective for annual periods beginning after December 15, 2015 and interim periods within those fiscal years. At this time, management is evaluating the implications of this guidance and the impact it will have on the financial statement amounts and footnote disclosures, if any.
Note 3. Fees and Other Transactions with Affiliates
Management Fees
Effective July 1, 2015, the Fund entered into a Management Agreement with Columbia Management Investment Advisers, LLC (the Investment Manager), a wholly-owned subsidiary of Ameriprise Financial, Inc.
Annual Report 2016
26
COLUMBIA LARGE CAP GROWTH FUND II
NOTES TO FINANCIAL STATEMENTS (continued)
February 29, 2016
(Ameriprise Financial). Under the Management Agreement, the Investment Manager provides the Fund with investment research and advice, as well as administrative and accounting services. The management services fee is an annual fee that is equal to a percentage of the Fund's average daily net assets that declines from 0.77% to 0.57% as the Fund's net assets increase. The effective management services fee rate for the year ended February 29, 2016 was 0.75% of the Fund's average daily net assets.
Prior to July 1, 2015, the Fund paid the Investment Manager an annual fee for advisory services under an Investment Management Services Agreement and a separate annual fee for administrative and accounting services under an Administrative Services Agreement. For the period from March 1, 2015 through June 30, 2015, the investment advisory services fee paid to the Investment Manager was $2,328,575, and the administrative services fee paid to the Investment Manager was $194,702.
Subadvisory Agreement
Prior to November 20, 2015, the Investment Manager entered into a Subadvisory Agreement with Marsico Capital Management, LLC (Marsico) to serve as the subadviser to the Fund. The Investment Manager compensated Marsico to manage the investment of the Fund's assets. Effective November 20, 2015, Marsico no longer serves as the subadviser to the Fund and the Investment Manager has assumed the day-to-day portfolio management of the Fund.
Other Expenses
Other expenses are for, among other things, miscellaneous expenses of the Fund or the Board, including payments to Board Services Corp., a company providing limited administrative services to the Fund and the Board. That company's expenses include boardroom and office expense, employee compensation, employee health and retirement benefits, and certain other expenses. For the year ended February 29, 2016, other expenses paid by the Fund to this company were $2,767.
Compensation of Board Members
Board members, who are not officers or employees of the Investment Manager or Ameriprise Financial, are compensated for their services to the Fund as disclosed in the Statement of Operations. Under a Deferred Compensation Plan (the Plan), these Board members may elect to defer payment of up to 100% of their
compensation. Deferred amounts are treated as though equivalent dollar amounts had been invested in shares of certain funds managed by the Investment Manager. The Fund's liability for these amounts is adjusted for market value changes and remains in the Fund until distributed in accordance with the Plan. All amounts payable under the Plan constitute a general unsecured obligation of the Fund.
Transfer Agency Fees
Under a Transfer and Dividend Disbursing Agent Agreement, Columbia Management Investment Services Corp. (the Transfer Agent), an affiliate of the Investment Manager and a wholly-owned subsidiary of Ameriprise Financial, is responsible for providing transfer agency services to the Fund. The Transfer Agent has contracted with Boston Financial Data Services (BFDS) to serve as sub-transfer agent.
The Transfer Agent receives a monthly transfer agency fee based on the number or the average value of accounts, depending on the type of account. In addition, the Transfer Agent also receives sub-transfer agency fees based on a percentage of the average aggregate value of the Fund's shares maintained in omnibus accounts (other than omnibus accounts for which American Enterprise Investment Services Inc. is the broker of record or accounts where the beneficial shareholder is a customer of Ameriprise Financial Services, Inc., for which the Transfer Agent receives a per account fee). The Transfer Agent pays the fees of BFDS for services as sub-transfer agent and is not entitled to reimbursement for such fees from the Fund (with the exception of out-of-pocket fees).
The Transfer Agent also receives compensation from the Fund for various shareholder services and reimbursements for certain out-of-pocket fees. Total transfer agency fees for Class R5 shares are subject to an annual limitation of not more than 0.05% of the average daily net assets attributable to Class R5 shares.
For the year ended February 29, 2016, the Fund's effective transfer agency fee rates as a percentage of average daily net assets of each class were as follows:
Class A | | | 0.19 | % | |
Class B | | | 0.19 | | |
Class C | | | 0.19 | | |
Class R | | | 0.19 | | |
Class R4 | | | 0.19 | | |
Class R5 | | | 0.05 | | |
Class Z | | | 0.19 | | |
Annual Report 2016
27
COLUMBIA LARGE CAP GROWTH FUND II
NOTES TO FINANCIAL STATEMENTS (continued)
February 29, 2016
An annual minimum account balance fee of $20 may apply to certain accounts with a value below the applicable share class's initial minimum investment requirements to reduce the impact of small accounts on transfer agency fees. These minimum account balance fees are remitted to the Fund and recorded as part of expense reductions in the Statement of Operations. For the year ended February 29, 2016, these minimum account balance fees reduced total expenses of the Fund by $640.
Distribution and Service Fees
The Fund has an agreement with Columbia Management Investment Distributors, Inc. (the Distributor), an affiliate of the Investment Manager and a wholly-owned subsidiary of Ameriprise Financial, for distribution and shareholder services. The Board has approved, and the Fund has adopted, distribution and shareholder service plans (the Plans) applicable to certain share classes, which set the distribution and service fees for the Fund. These fees are calculated daily and are intended to compensate the Distributor and/or eligible selling and/or servicing agents for selling shares of the Fund and providing services to investors.
Under the Plans, the Fund pays a monthly combined distribution and service fee to the Distributor at the maximum annual rate of 0.25% of the average daily net assets attributable to Class A shares of the Fund. Also under the Plans, the Fund pays a monthly service fee at the maximum annual rate of 0.25% of the average daily net assets attributable to Class B and Class C shares of the Fund and a monthly distribution fee at the maximum annual rate of 0.75%, 0.75% and 0.50% of the average daily net assets attributable to Class B, Class C and Class R shares of the Fund, respectively.
Sales Charges
Sales charges, including front-end charges and CDSCs, received by the Distributor for distributing Fund shares were $116,458 for Class A, $74 for Class B and $1,879 for Class C shares for the year ended February 29, 2016.
Expenses Waived/Reimbursed by the Investment Manager and its Affiliates
The Fund's expense ratio is subject to an expense reimbursement arrangement pursuant to which fees will be waived and/or expenses reimbursed (excluding certain fees and expenses described below), so that the Fund's net operating expenses, after giving effect to fees waived/expenses reimbursed and any balance credits and/or overdraft charges from the Fund's custodian, do
not exceed the following annual rates as a percentage of the class' average daily net assets:
| | | Contractual
Expense Cap
July 1, 2015
through
June 30, 2016 | | Voluntary
Expense Cap
Prior to
July 1, 2015 | |
Class A | | | 1.25 | % | | | 1.30 | % | |
Class B | | | 2.00 | | | | 2.05 | | |
Class C | | | 2.00 | | | | 2.05 | | |
Class R | | | 1.50 | | | | 1.55 | | |
Class R4 | | | 1.00 | | | | 1.05 | | |
Class R5 | | | 0.91 | | | | 0.96 | | |
Class Z | | | 1.00 | | | | 1.05 | | |
The contractual agreement may be modified or amended only with approval from the Investment Manager, certain of its affiliates and the Fund. Under the arrangements, the following fees and expenses are excluded from the waiver/reimbursement commitment, and therefore will be paid by the Fund, if applicable: taxes (including foreign transaction taxes), expenses associated with investments in affiliated and non-affiliated pooled investment vehicles (including mutual funds and exchange-traded funds), transaction costs and brokerage commissions, costs related to any securities lending program, dividend and interest expenses associated with securities sold short, inverse floater program fees and expenses, transaction charges and interest on borrowed money, interest and extraordinary expenses.
In addition, effective November 20, 2015, the Fund's expense ratio is subject to a voluntary expense reimbursement arrangement pursuant to which fees will be waived and/or expenses reimbursed (excluding certain fees and expenses immediately described above), so that the Fund's net operating expenses, after giving effect to fees waived/expenses reimbursed and any balance credits and/or overdraft charges from the Fund's custodian, do not exceed the annual rates of 1.23% for Class A, 1.98% for Class B, 1.98% for Class C, 1.48% for Class R, 0.98% for Class R4, 0.89% for Class R5 and 0.98% for Class Z. This arrangement may be revised or discontinued at any time.
Any fees waived and/or expenses reimbursed under the expense reimbursement arrangements described above are not recoverable by the Investment Manager or its affiliates in future periods.
Annual Report 2016
28
COLUMBIA LARGE CAP GROWTH FUND II
NOTES TO FINANCIAL STATEMENTS (continued)
February 29, 2016
Note 4. Federal Tax Information
The timing and character of income and capital gain distributions are determined in accordance with income tax regulations, which may differ from GAAP because of temporary or permanent book to tax differences.
At February 29, 2016, these differences are primarily due to differing treatment for capital loss carryforwards, deferral/reversal of wash sale losses, Trustees' deferred compensation, foreign currency transactions, net operating loss reclassification, post-October capital losses and late-year ordinary losses. To the extent these differences are permanent, reclassifications are made among the components of the Fund's net assets in the Statement of Assets and Liabilities. Temporary differences do not require reclassifications. In the Statement of Assets and Liabilities the following reclassifications were made:
Excess of distributions over net investment income | | $ | 7,820,221 | | |
Accumulated net realized loss | | | 11,449 | | |
Paid-in capital | | | (7,831,670 | ) | |
Net investment income (loss) and net realized gains (losses), as disclosed in the Statement of Operations, and net assets were not affected by this reclassification.
For the years ended February 29, 2016 and February 28, 2015, there were no distributions.
At February 29, 2016, the components of distributable earnings on a tax basis were as follows:
Capital loss carryforwards | | $ | (1,297,463,369 | ) | |
Net unrealized depreciation | | | (25,093,919 | ) | |
At February 29, 2016, the cost of investments for federal income tax purposes was $739,522,347 and the aggregate gross unrealized appreciation and depreciation based on that cost was:
Unrealized appreciation | | $ | 27,175,009 | | |
Unrealized depreciation | | | (52,268,928 | ) | |
Net unrealized depreciation | | $ | (25,093,919 | ) | |
The following capital loss carryforwards, determined at February 29, 2016, may be available to reduce taxable income arising from future net realized gains on investments, if any, to the extent permitted by the Internal Revenue Code:
Year of Expiration | | Amount ($) | |
2018 | | | 1,297,463,369 | | |
For the year ended February 29, 2016, $164,320,737 of capital loss carryforward was utilized.
Under current tax rules, regulated investment companies can elect to treat certain late-year ordinary losses incurred and post-October capital losses (capital losses realized after October 31) as arising on the first day of the following taxable year. As of February 29, 2016, the Fund will elect to treat late-year ordinary losses of $593,162 and post-October capital losses of $24,858,526 as arising on March 1, 2016.
Management of the Fund has concluded that there are no significant uncertain tax positions in the Fund that would require recognition in the financial statements. However, management's conclusion may be subject to review and adjustment at a later date based on factors including, but not limited to, new tax laws, regulations, and administrative interpretations (including relevant court decisions). Generally, the Fund's federal tax returns for the prior three fiscal years remain subject to examination by the Internal Revenue Service.
Note 5. Portfolio Information
The cost of purchases and proceeds from sales of securities, excluding short-term investments and derivatives, if any, aggregated to $1,089,238,237 and $1,310,126,807, respectively, for the year ended February 29, 2016. The amount of purchase and sale activity impacts the portfolio turnover rate reported in the Financial Highlights.
Note 6. Affiliated Money Market Fund
The Fund invests in Columbia Short-Term Cash Fund, an affiliated money market fund established for the exclusive use by the Fund and other affiliated funds. The income earned by the Fund from such investments is included as Dividends — affiliated issuers in the Statement of Operations. As an investing fund, the Fund indirectly bears its proportionate share of the expenses of Columbia Short-Term Cash Fund.
Note 7. Line of Credit
The Fund has access to a revolving credit facility whereby the Fund may borrow for the temporary funding of shareholder redemptions or for other temporary or emergency purposes. Effective December 8, 2015, Citibank, N.A. and HSBC Bank USA, N.A. joined JPMorgan Chase Bank, N.A. (JPMorgan) as lead of a syndicate of banks under the credit facility, which is a collective agreement between the Fund and certain other funds managed by the Investment Manager, severally and not jointly, that permits collective borrowings up to $1 billion. Interest is charged to each participating fund based on
Annual Report 2016
29
COLUMBIA LARGE CAP GROWTH FUND II
NOTES TO FINANCIAL STATEMENTS (continued)
February 29, 2016
its borrowings at a rate equal to the higher of (i) the overnight federal funds rate plus 1.00% or (ii) the one-month LIBOR rate plus 1.00%. Each borrowing under the credit facility matures no later than 60 days after the date of borrowing. The Fund also pays a commitment fee equal to its pro rata share of the amount of the credit facility at a rate of 0.15% per annum. The commitment fee is included in other expenses in the Statement of Operations. Prior to December 8, 2015, JPMorgan was the sole lead bank under the credit facility agreement that permitted borrowings up to $550 million under the same terms and interest rates as described above with the exception of the commitment fee which was charged at a rate of 0.075% per annum.
The Fund had no borrowings during the year ended February 29, 2016.
Note 8. Significant Risks
Consumer Discretionary Sector Risk
The Fund may be more susceptible to the particular risks that may affect companies in the consumer discretionary sector than if it were invested in a wider variety of companies in unrelated sectors. Companies in the consumer discretionary sector are subject to certain risks, including fluctuations in the performance of the overall domestic and international economy, interest rate changes, increased competition and consumer confidence. Performance of such companies may be affected by factors including reduced disposable household income, reduced consumer spending, changing demographics and consumer tastes.
Shareholder Concentration Risk
At February 29, 2016, one unaffiliated shareholder of record owned 16.5% of the outstanding shares of the Fund in one or more accounts. The Fund has no knowledge about whether any portion of those shares was owned beneficially. Affiliated shareholders of record owned 16.7% of the outstanding shares of the Fund in one or more accounts. Subscription and redemption activity by concentrated accounts may have a significant effect on the operations of the Fund. In the case of a large redemption, the Fund may be forced to sell investments at inopportune times, including its liquid or more liquid positions, resulting in Fund losses and the Fund holding a higher percentage of less liquid or illiquid securities. Large redemptions could result in decreased economies of scale and increased operating expenses for non-redeeming Fund shareholders.
Technology and Technology-related Investment Risk
The Fund may be more susceptible to the particular risks that may affect companies in the information technology sector, as well as other technology-related sectors (collectively, the technology sectors) than if it were invested in a wider variety of companies in unrelated sectors. Companies in the technology sectors are subject to certain risks, including the risk that new services, equipment or technologies will not be accepted by consumers and businesses or will become rapidly obsolete. Performance of such companies may be affected by factors including obtaining and protecting patents (or the failure to do so) and significant competitive pressures, including aggressive pricing of their products or services, new market entrants, competition for market share and short product cycles due to an accelerated rate of technological developments. Such competitive pressures may lead to limited earnings and/or falling profit margins. As a result, the value of their securities may fall or fail to rise. In addition, many technology sector companies have limited operating histories and prices of these companies' securities historically have been more volatile than other securities, especially over the short term.
Note 9. Subsequent Events
Management has evaluated the events and transactions that have occurred through the date the financial statements were issued. Other than as noted below, there were no items requiring adjustment of the financial statements or additional disclosure.
In December 2015, the Board approved a proposal to merge the Fund into Columbia Large Cap Growth Fund. Shareholders of the Fund will vote on the proposed merger at a special meeting of shareholders to be held during the first half of 2016. If approved by shareholders, the merger is expected to take place shortly thereafter.
Note 10. Information Regarding Pending and Settled Legal Proceedings
In December 2005, without admitting or denying the allegations, American Express Financial Corporation (AEFC, which is now known as Ameriprise Financial, Inc. (Ameriprise Financial)) entered into settlement agreements with the Securities and Exchange Commission (SEC) and Minnesota Department of Commerce (MDOC) related to market timing activities. As a result, AEFC was censured and ordered to cease and desist from committing or causing any violations of
Annual Report 2016
30
COLUMBIA LARGE CAP GROWTH FUND II
NOTES TO FINANCIAL STATEMENTS (continued)
February 29, 2016
certain provisions of the Investment Advisers Act of 1940, the Investment Company Act of 1940, and various Minnesota laws. AEFC agreed to pay disgorgement of $10 million and civil money penalties of $7 million. AEFC also agreed to retain an independent distribution consultant to assist in developing a plan for distribution of all disgorgement and civil penalties ordered by the SEC in accordance with various undertakings detailed at http://www.sec.gov/litigation/admin/ia-2451.pdf. Ameriprise Financial and its affiliates have cooperated with the SEC and the MDOC in these legal proceedings, and have made regular reports to the Funds' Boards of Trustees.
Ameriprise Financial and certain of its affiliates have historically been involved in a number of legal, arbitration and regulatory proceedings, including routine litigation, class actions, and governmental actions, concerning matters arising in connection with the conduct of their business activities. Ameriprise Financial believes that the Funds are not currently the subject of, and that neither Ameriprise Financial nor any of its affiliates are the subject of, any pending legal, arbitration or regulatory proceedings that are likely to have a material adverse effect on the Funds or the ability of Ameriprise Financial or its affiliates to perform under their contracts with the Funds. Ameriprise Financial is required to make quarterly (10-Q), annual (10-K) and, as necessary, 8-K filings with the SEC on legal and regulatory matters that relate to Ameriprise Financial and its affiliates. Copies of these filings may be obtained by accessing the SEC website at www.sec.gov.
There can be no assurance that these matters, or the adverse publicity associated with them, will not result in increased fund redemptions, reduced sale of fund shares or other adverse consequences to the Funds. Further, although we believe proceedings are not likely to have a material adverse effect on the Funds or the ability of Ameriprise Financial or its affiliates to perform under their contracts with the Funds, these proceedings are subject to uncertainties and, as such, we are unable to estimate the possible loss or range of loss that may result. An adverse outcome in one or more of these proceedings could result in adverse judgments, settlements, fines, penalties or other relief that could have a material adverse effect on the consolidated financial condition or results of operations of Ameriprise Financial.
Annual Report 2016
31
COLUMBIA LARGE CAP GROWTH FUND II
REPORT OF INDEPENDENT REGISTERED PUBLIC ACCOUNTING FIRM
To the Trustees of Columbia Funds Series Trust and the Shareholders of
Columbia Large Cap Growth Fund II (formerly known as Columbia Marsico 21st Century Fund)
In our opinion, the accompanying statement of assets and liabilities, including the portfolio of investments, and the related statements of operations and of changes in net assets and the financial highlights present fairly, in all material respects, the financial position of Columbia Large Cap Growth Fund II (formerly known as Columbia Marsico 21st Century Fund) (the "Fund," a series of Columbia Funds Series Trust) at February 29, 2016, and the results of its operations, the changes in its net assets and the financial highlights for each of the periods indicated, in conformity with accounting principles generally accepted in the United States of America. These financial statements and financial highlights (hereafter referred to as "financial statements") are the responsibility of the Fund's management. Our responsibility is to express an opinion on these financial statements based on our audits. We conducted our audits of these financial statements in accordance with the standards of the Public Company Accounting Oversight Board (United States). Those standards require that we plan and perform the audit to obtain reasonable assurance about whether the financial statements are free of material misstatement. An audit includes examining, on a test basis, evidence supporting the amounts and disclosures in the financial statements, assessing the accounting principles used and significant estimates made by management, and evaluating the overall financial statement presentation. We believe that our audits, which included confirmation of securities at February 29, 2016 by correspondence with the custodian, brokers and transfer agent, provide a reasonable basis for our opinion.
PricewaterhouseCoopers LLP
Minneapolis, MN
April 21, 2016
Annual Report 2016
32
COLUMBIA LARGE CAP GROWTH FUND II
Shareholders elect the Board that oversees the Fund's operations. The Board appoints officers who are responsible for day-to-day business decisions based on policies set by the Board. The following table provides basic biographical information about the Fund's Trustees, including their principal occupations during the past five years, although specific titles for individuals may have varied over the period. Under current Board policy, members generally may serve through the end of the calendar year in which they reach either the mandatory retirement age established by the Board or the fifteenth anniversary of the first Board meeting they attended as a member of the Board.
Trustees
Independent Trustees
Name,
Address,
Year of Birth | | Position Held With
the Funds and Length of
Service | | Principal Occupation(s)
During the Past Five Years
and Other Relevant
Professional Experience | | Number of
Funds in the
Columbia
Funds Complex
Overseen | | Other Directorships
Held by Trustee
During the Past
Five Years | |
Kathleen Blatz
901 S. Marquette Ave.
Minneapolis, MN 55402
1954 | | Trustee since 1/06 for RiverSource Funds and since 6/11 for Nations Funds | | Attorney; specializing in arbitration and mediation; Chief Justice, Minnesota Supreme Court, 1998-2006; Associate Justice, Minnesota Supreme Court, 1996-1998; Fourth Judicial District Court Judge, Hennepin County, 1994-1996; Attorney in private practice and public service, 1984-1993; State Representative, Minnesota House of Representatives, 1979-1993, which included service on the Tax and Financial Institutions and Insurance Committees | | | 124 | | | Trustee, BlueCross BlueShield of Minnesota (Chair of the Business Development Committee) since 2009; Chair of the Robina Foundation since August 2013 | |
Edward J. Boudreau, Jr.
901 S. Marquette Ave.
Minneapolis, MN 55402
1944 | | Trustee since 6/11 for RiverSource Funds and since 1/05 for Nations Funds | | Managing Director, E.J. Boudreau & Associates (consulting) since 2000; FINRA Industry Arbitrator, 2002-present; Chairman and Chief Executive Officer, John Hancock Funds (asset management), Chairman and Interested Trustee for open-end and closed-end funds offered by John Hancock, 1989-2000; John Hancock Life Insurance Company, including SVP and Treasurer and SVP Information Technology, 1968-1988 | | | 122 | | | Former Trustee, Boston Museum of Science (Chair of Finance Committee), 1985-2013; former Trustee, BofA Funds Series Trust (11 funds), 2005-2011 | |
Pamela G. Carlton
901 S. Marquette Ave.
Minneapolis, MN 55402
1954 | | Trustee since 7/07 for RiverSource Funds and since 6/11 for Nations Funds | | President, Springboard-Partners in Cross Cultural Leadership (consulting company) since 2003; Managing Director of US Equity Research, JP Morgan Chase, 1999-2003; Director of US Equity Research, Chase Asset Management, 1996-1999; Co-Director Latin America Research, 1993-1996, COO Global Research, 1992-1996, Co-Director of US Research, 1991-1992, Investment Banker, Morgan Stanley, 1982-1991 | | | 124 | | | Trustee, New York Presbyterian Hospital Board (Executive Committee and Chair of Human Resources Committee) since 1996 | |
Annual Report 2016
33
COLUMBIA LARGE CAP GROWTH FUND II
TRUSTEES AND OFFICERS (continued)
Independent Trustees (continued)
Name,
Address,
Year of Birth | | Position Held With
the Funds and Length of
Service | | Principal Occupation(s)
During the Past Five Years
and Other Relevant
Professional Experience | | Number of
Funds in the
Columbia
Funds Complex
Overseen | | Other Directorships
Held by Trustee
During the Past
Five Years | |
William P. Carmichael
901 S. Marquette Ave.
Minneapolis, MN 55402
1943 | | Trustee since 6/11 for RiverSource Funds and since 2003 for Nations Funds; Chair of the Board from 1/14-11/15 | | Retired; Co-founder, The Succession Fund (provides exit strategies to owners of privately held companies), 1998-2007; Adjunct Professor of Finance, Kelley School of Business, Indiana University, 1993-2007; Senior Vice President, Sara Lee Corporation, 1991-1993; Senior Vice President and Chief Financial Officer, Beatrice Foods Company, 1984-1990; Vice President, Esmark, Inc., 1973-1984; Associate, Price Waterhouse, 1968-1972 | | | 124 | | | Director, The Finish Line (athletic shoes and apparel) since July 2003; Director, International Textile Corp. since 2012; Director, hhgregg since May, 2015; former Director, Cobra Electronics Corporation (electronic equipment manufacturer), 1994-August 2014; former Director, Spectrum Brands, Inc. (consumer products), 2002-2009; former Director, Simmons Company (bedding), 2004-2010; former Trustee, BofA Funds Series Trust (11 funds), 2009-2011; former Director, McMoRan Exploration Company (oil and gas exploration and development), 2010-2013 | |
Patricia M. Flynn
901 S. Marquette Ave.
Minneapolis, MN 55402
1950 | | Trustee since 11/04 for RiverSource Funds and since 6/11 for Nations Funds | | Trustee Professor of Economics and Management, Bentley University since 1976 (also teaches and conducts research on corporate governance); Dean, McCallum Graduate School of Business, Bentley University, 1992-2002 | | | 124 | | | Trustee, MA Taxpayers Foundation since 1997; Board of Governors, Innovation Institute, MA Technology Collaborative since 2010 | |
William A. Hawkins
901 S. Marquette Ave.
Minneapolis, MN 55402
1942 | | Chair of the Board since 11/15; Trustee since 6/11 for RiverSource Funds and since 1/05 for Nations Funds | | Managing Director, Overton Partners (financial consulting) since August 2010; President and Chief Executive Officer, California General Bank, N.A., January 2008-August 2010; Operation Hope, COO, 2004-2007; IndyMac Bancorp, President, CBG, 1999-2003; American General Bank, President, 1997-1999; Griffin Financial Services, CEO, 1981-1997; The Griffin Funds, CEO, 1992-1998 | | | 124 | | | Former Trustee, BofA Funds Series Trust (11 funds), 2009-2015 | |
R. Glenn Hilliard
901 S. Marquette Ave.
Minneapolis, MN 55402
1943 | | Trustee since 6/11 for RiverSource Funds and since 1/05 for Nations Funds | | Chairman and Chief Executive Officer, Hilliard Group LLC (investing and consulting) since April 2003; Non-Executive Director & Chairman, CNO Financial Group, Inc. (insurance), 2003-2011; Chair & CEO, ING Americas, 1996-2003 | | | 122 | | | Chairman, BofA Funds Series Trust (11 funds); former Director, CNO Financial Group, Inc. (insurance), 2003-2011 | |
Annual Report 2016
34
COLUMBIA LARGE CAP GROWTH FUND II
TRUSTEES AND OFFICERS (continued)
Independent Trustees (continued)
Name,
Address,
Year of Birth | | Position Held With
the Funds and Length of
Service | | Principal Occupation(s)
During the Past Five Years
and Other Relevant
Professional Experience | | Number of
Funds in the
Columbia
Funds Complex
Overseen | | Other Directorships
Held by Trustee
During the Past
Five Years | |
Catherine James Paglia
901 S. Marquette Ave.
Minneapolis, MN 55402
1952 | | Trustee since 11/04 for RiverSource Funds and since 6/11 for Nations Funds | | Director, Enterprise Asset Management, Inc. (private real estate and asset management company) since September 1998; Managing Director and Partner, Interlaken Capital, Inc., 1989-1997; Managing Director, Morgan Stanley, 1982-1989; Vice President, Investment Banking, 1980-1982, Associate, Investment Banking, 1976-1980, Dean Witter Reynolds, Inc. | | | 124 | | | Director, Valmont Industries, Inc. (irrigation systems manufacturer) since 2012; Trustee, Carleton College (on the Investment Committee); Trustee, Carnegie Endowment for International Peace (on the Investment Committee) | |
Leroy C. Richie
901 S. Marquette Ave.
Minneapolis, MN 55402
1941 | | Trustee since 2000 for Seligman Funds, since 11/08 for RiverSource Funds and since 6/11 for Nations Funds | | Counsel, Lewis & Munday, P.C. (law firm) since 2004; Vice President and General Counsel, Automotive Legal Affairs, Chrysler Corporation, 1993-1997 | | | 122 | | | Lead Outside Director, Infinity Resources, Inc. (oil and gas exploration and production) since 1994; Lead Outside Director, Digital Ally, Inc. (digital imaging) since September 2005; Trustee, Marygrove College (Chair of Finance Committee) since 2007; former Director, OGE Energy Corp. (energy and energy services), 2007-2014 | |
Minor M. Shaw
901 S. Marquette Ave.
Minneapolis, MN 55402
1947 | | Trustee since 6/11 for RiverSource Funds and since 2003 for Nations Funds | | President, Micco LLC (private investments) since 2011; President, Micco Corp. (family investment business), 1998-2011 | | | 124 | | | Director, Piedmont Natural Gas; Director, BlueCross BlueShield of South Carolina since April 2008; Chair of the Duke Endowment; Director, National Association of Corporate Directors, Carolinas Chapter since 2013; Chair of Greenville — Spartanburg Airport Commission; former Trustee, BofA Funds Series Trust (11 funds), 2003-2011 | |
Alison Taunton-Rigby
901 S. Marquette Ave.
Minneapolis, MN 55402
1944 | | Trustee since 11/02 for RiverSource Funds and since 6/11 for Nations Funds | | Managing Director, Forester Biotech (consulting), 2001-2003; Chief Executive Officer and Director, RiboNovix, Inc., (biotechnology), 2003-2010; President and Chief Executive Officer of CMT Inc., 2001-2003; Aquila Biopharmaceuticals Inc., 1996-2000; Cambridge Biotech Corporation, 1995-1996; Mitotix Inc., 1993-1994 | | | 124 | | | Director, Abt Associates (government contractor) since 2001; Director, Boston Children's Hospital since 2002; Director, Healthways, Inc. (health and well-being solutions) since 2005; Director, ICI Mutual Insurance Company since 2011 | |
Annual Report 2016
35
COLUMBIA LARGE CAP GROWTH FUND II
TRUSTEES AND OFFICERS (continued)
Interested Trustee Not Affiliated with Investment Manager*
Name,
Address,
Year of Birth | | Position Held With
Funds and Length of
Service | | Principal Occupation(s)
During Past Five Years
and Other Relevant
Professional Experience | | Number of
Funds in the
Fund Family
Overseen by
Board Member | | Other Present or Past
Directorships/
Trusteeships
(Within Past 5 Years) | |
Anthony M. Santomero
901 S. Marquette Ave.
Minneapolis, MN 55402
1946 | | Trustee since 6/11 for RiverSource Funds and since 1/08 for Nations Funds | | Richard K. Mellon Professor Emeritus of Finance, The Wharton School, University of Pennsylvania since 2002; Senior Advisor, McKinsey & Company (consulting), 2006-2008; President, Federal Reserve Bank of Philadelphia, 2000-2006; Professor of Finance, The Wharton School, University of Pennsylvania, 1972-2002 | | | 122 | | | Trustee, Penn Mutual Life Insurance Company since March 2008; Director, Renaissance Reinsurance Ltd. since May 2008; Director, Citigroup Inc. since 2009; Director, Citibank, N.A. since 2009; former Trustee, BofA Funds Series Trust (11 funds), 2008-2011 | |
* Dr. Santomero is not an affiliated person of the Investment Manager or Ameriprise Financial. However, he is currently deemed by the Funds to be an "interested person" (as defined in the 1940 Act) of the Funds because he serves as a Director of Citigroup Inc. and Citibank, N.A., companies that may directly or through subsidiaries and affiliates engage from time-to-time in brokerage execution, principal transactions and lending relationships with the Funds or accounts advised/managed by the Investment Manager.
Annual Report 2016
36
COLUMBIA LARGE CAP GROWTH FUND II
TRUSTEES AND OFFICERS (continued)
Interested Trustee Affiliated with Investment Manager*
Name,
Address,
Year of Birth | | Position Held With
the Funds and Length of
Service | | Principal Occupation(s)
During Past Five Years
and Other Relevant
Professional Experience | | Number of
Funds in the
Columbia
Funds Complex
Overseen | | Other Directorships
Held by Trustee
During the Past
Five Years | |
William F. Truscott
c/o Columbia Management Investment Advisers, LLC,
225 Franklin St.
Boston, MA 02110
1960 | | Trustee since 11/01 for RiverSource Funds and since 6/11 for Nations Funds; Senior Vice President since 2002 for RiverSource Funds and since 5/10 for Nations Funds | | Chairman of the Board and President, Columbia Management Investment Advisers, LLC since May 2010 and February 2012, respectively (previously President and Chief Investment Officer, 2001-April 2010); Chief Executive Officer, Global Asset Management, Ameriprise Financial, Inc. since September 2012 (previously Chief Executive Officer, U.S. Asset Management & President, Annuities, May 2010-September 2012 and President — U.S. Asset Management and Chief Investment Officer, 2005-April 2010); Director and Chief Executive Officer, Columbia Management Investment Distributors, Inc. since May 2010 and February 2012, respectively (previously Chairman of the Board and Chief Executive Officer, 2006-April 2010); Chairman of the Board and Chief Executive Officer, RiverSource Distributors, Inc. since 2006; Director, Threadneedle Asset Management Holdings, SARL since 2014; President and Chief Executive Officer, Ameriprise Certificate Company, 2006-August 2012. | | | 182 | | | Chairman of the Board, Columbia Management Investment Advisers, LLC since May 2010; Director, Columbia Management Investment Distributors, Inc. since May 2010; Former Director, Ameriprise Certificate Company, 2006-January 2013 | |
* Interested person (as defined under the 1940 Act) by reason of being an officer, director, security holder and/or employee of the Investment Manager or Ameriprise Financial.
The Statement of Additional Information has additional information about the Fund's Board members and is available, without charge, upon request by calling 800.345.6611; contacting your financial intermediary; or visiting columbiathreadneedle.com/us.
Annual Report 2016
37
COLUMBIA LARGE CAP GROWTH FUND II
TRUSTEES AND OFFICERS (continued)
The Board has appointed officers who are responsible for day-to-day business decisions based on policies it has established. The officers serve at the pleasure of the Board. The following table provides basic information about the Officers of the Fund, including principal occupations during the past five years, although their specific titles may have varied over the period. In addition to Mr. Truscott, who is Senior Vice President, the Fund's other officers are:
Fund Officers
Name,
Address and
Year of Birth | | Position and Year
First Appointed to
Position for any Fund
in the Columbia
Funds Complex or a
Predecessor Thereof | | Principal Occupation(s) During Past Five Years | |
Christopher O. Petersen
5228 Ameriprise
Financial Center
Minneapolis, MN 55474
Born 1970 | | President and Principal Executive Officer (2015) | | Vice President and Lead Chief Counsel, Ameriprise Financial, Inc. since January 2015 (previously, Vice President and Chief Counsel January 2010-December 2014; and Vice President and Group Counsel or Counsel 2004-January 2010); officer of Columbia Funds and affiliated funds since 2007. | |
Michael G. Clarke
225 Franklin Street
Boston, MA 02110
Born 1969 | | Treasurer (2011), Chief Financial Officer (2009) and Chief Accounting Officer (2015) | | Vice President — Mutual Fund Administration, Columbia Management Investment Advisers, LLC, since May 2010; Managing Director of Fund Administration, Columbia Management Advisors, LLC, September 2004-April 2010; senior officer of Columbia Funds and affiliated funds since 2002. | |
Paul B. Goucher
100 Park Avenue
New York, NY 10017
Born 1968 | | Senior Vice President (2011), Chief Legal Officer (2015) and Assistant Secretary (2008) | | Vice President and Lead Chief Counsel, Ameriprise Financial, Inc. since November 2008 and January 2013, respectively (previously Chief Counsel, January 2010-January 2013 and Group Counsel, November 2008-January 2010). | |
Thomas P. McGuire
225 Franklin Street
Boston, MA 02110
Born 1972 | | Senior Vice President and Chief Compliance Officer (2012) | | Vice President — Asset Management Compliance, Ameriprise Financial, Inc., since May 2010; Chief Compliance Officer, Ameriprise Certificate Company since September 2010; Compliance Executive, Bank of America, 2005-April 2010. | |
Colin Moore
225 Franklin Street
Boston, MA 02110
Born 1958 | | Senior Vice President (2010) | | Executive Vice President and Global Chief Investment Officer, Ameriprise Financial, Inc., since July 2013; Director and Global Chief Investment Officer, Columbia Management Investment Advisers, LLC since May 2010; Manager, Managing Director and Chief Investment Officer, Columbia Management Advisors, LLC, 2007-April 2010. | |
Michael E. DeFao
225 Franklin Street
Boston, MA 02110
Born 1968 | | Vice President (2011) and Assistant Secretary (2010) | | Vice President and Chief Counsel, Ameriprise Financial, Inc. since May 2010; Associate General Counsel, Bank of America, 2005-April 2010. | |
Amy Johnson
5228 Ameriprise
Financial Center
Minneapolis, MN 55474
Born 1965 | | Vice President (2006) | | Managing Director and Chief Operating Officer, Columbia Management Investment Advisers, LLC since May 2010 (previously Chief Administrative Officer, 2009-April 2010, and Vice President — Asset Management and Trust Company Services, 2006-2009). | |
Lyn Kephart-Strong
5228 Ameriprise
Financial Center
Minneapolis, MN 55474
Born 1960 | | Vice President (2015) | | President, Columbia Management Investment Services Corp. since October 2014; Vice President & Resolution Officer, Ameriprise Trust Company since August 2009; President, RiverSource Service Corporation 2004-2010. | |
Ryan C. Larrenaga
225 Franklin Street
Boston, MA 02110
Born 1970 | | Vice President and Secretary (2015) | | Vice President and Group Counsel, Ameriprise Financial, Inc. since August 2011 (previously, Counsel from May 2010 to August 2011); Assistant General Counsel, Bank of America, 2005-April 2010; officer of Columbia Funds and affiliated funds since 2005. | |
Annual Report 2016
38
COLUMBIA LARGE CAP GROWTH FUND II
IMPORTANT INFORMATION ABOUT THIS REPORT
Each fund mails one shareholder report to each shareholder address. If you would like more than one report, please call shareholder services at 800.345.6611 and additional reports will be sent to you.
The policy of the Board is to vote the proxies of the companies in which each fund holds investments consistent with the procedures as stated in the Statement of Additional Information (SAI). You may obtain a copy of the SAI without charge by calling 800.345.6611; contacting your financial intermediary; visiting columbiathreadneedle.com/us; or searching the website of the Securities and Exchange Commission (SEC) at sec.gov. Information regarding how each fund voted proxies relating to portfolio securities is filed with the SEC by August 31st for the most recent 12-month period ending June 30th of that year, and is available without charge by visiting columbiathreadneedle.com/us, or searching the website of the SEC at sec.gov.
Each fund files a complete schedule of portfolio holdings with the SEC for the first and third quarters of each fiscal year on Form N-Q. Each fund's Form N-Q is available on the SEC's website at sec.gov and may be reviewed and copied at the SEC's Public Reference Room in Washington, D.C. Information on the operation of the Public Reference Room may be obtained by calling 800.SEC.0330. Each fund's complete schedule of portfolio holdings, as filed on Form N-Q, can also be obtained without charge, upon request, by calling 800.345.6611.
Annual Report 2016
39
Columbia Large Cap Growth Fund II
P.O. Box 8081
Boston, MA 02266-8081

This information is for use with concurrent or prior delivery of a fund prospectus. Please read and consider the investment objectives, risks, charges and expenses for any fund carefully before investing. For a prospectus and summary prospectus, which contains this and other important information about the Fund, go to columbiathreadneedle.com/us. The Fund is distributed by Columbia Management Investment Distributors, Inc., member FINRA, and managed by Columbia Management Investment Advisers, LLC.
Columbia Threadneedle Investments (Columbia Threadneedle) is the global brand name of the Columbia and Threadneedle group of companies.
All rights reserved. Columbia Management Investment Distributors, Inc., 225 Franklin Street, Boston, MA 02110-2804
© 2016 Columbia Management Investment Advisers, LLC.
columbiathreadneedle.com/us
ANN184_02_F01_(04/16)

ANNUAL REPORT
February 29, 2016

COLUMBIA LARGE CAP GROWTH FUND III
(formerly Columbia Marsico Focused Equities Fund)

ABOUT COLUMBIA THREADNEEDLE INVESTMENTS
Columbia Threadneedle Investments is a leading global asset management group that provides a broad range of actively managed investment strategies and solutions for individual, institutional and corporate clients around the world.
With more than 2,000 people, including over 450 investment professionals based in North America, Europe and Asia, we manage $472 billion* of assets across developed and emerging market equities, fixed income, asset allocation solutions and alternatives. We are the 13th largest manager of long-term mutual fund assets in the U.S.** and the 4th largest manager of retail funds in the U.K.***
Our priority is the investment success of our clients. We aim to deliver the investment outcomes they expect through an investment approach that is team-based, performance-driven and risk-aware. Our culture is dynamic and interactive. By sharing our insights across asset classes and geographies, we generate richer perspectives on global, regional and local investment landscapes. The ability to exchange and debate investment ideas in a collaborative environment enriches our teams' investment processes. More importantly, it results in better informed investment decisions for our clients.
Columbia funds are distributed by Columbia Management Investment Distributors, Inc., member FINRA, and managed by Columbia Management Investment Advisers, LLC.
Columbia Threadneedle Investments (Columbia Threadneedle) is the global brand name of the Columbia and Threadneedle group of companies.
* In U.S. dollars as of December 31, 2015. Source: Ameriprise Q4 Earnings Release. Includes all assets managed by entities in the Columbia and Threadneedle groups of companies. Contact us for more current data.
** Source: ICI as of December 31, 2015 for Columbia Management Investment Advisers, LLC.
*** Source: Investment Association as of September 2015 for Threadneedle Asset Management Limited.
© 2016 Columbia Management Investment Advisers, LLC. All rights reserved.
Not part of the shareholder report
 Dear Shareholder,
Today's investors are typically focused on outcomes, like living a certain retirement lifestyle, paying for college education or building a legacy. But in today's complex global investment landscape, even simple goals are not easily achieved.
At Columbia Threadneedle Investments, we aspire to help satisfy five core needs of today's investors:
n Generate an appropriate stream of income in retirement
Traditional approaches to generating income may not provide the diversification benefits they once did, and they may actually introduce unwanted risk in today's market. To seek to improve your potential to live comfortably long term, we endeavor to pursue investments that explore less traveled paths to income.
n Navigate a changing interest rate environment
Today's uncertain market environment includes the prospect of a rise in interest rates. Blending traditional investments with non-traditional or alternative products may help protect your wealth during periods of volatility. We can attempt to help strengthen your portfolio with agile products designed to take on the market's ups and downs.
n Maximize after-tax returns
In an environment where what you keep may be more important than what you earn, municipal bonds can help mitigate high tax burdens while providing potentially attractive yields. Our state and federal tax-exempt products are aimed at helping investors manage risk, minimize the fluctuation of capital and grow wealth on a more tax-efficient basis.
n Grow assets to achieve financial goals
We believe that finding and protecting growth comes from a disciplined security selection process designed to create excess return. Our goal is to provide investment solutions built to help you face today's market challenges and grow your assets at each crossroad of your journey.
n Ease the impact of volatile markets
Despite a bull market run that has benefited many investors over the past several years, it's important to remember the lessons of 2008 and the value that a well-diversified portfolio may provide through times of market volatility. We are here to help you hold onto the savings you have worked tirelessly to amass, and to provide you the best opportunity to maintain your standard of living regardless of market conditions.
Find out today how we can help you confidently invest to realize your dreams. Please visit us at blog.columbiathreadneedleus.com/our-best-ideas to learn more about our unique investment solutions.
The world is constantly changing, but our priority remains the same: to help you secure your finances, meet your goals and achieve success. Thank you for your continued investment with us.
Sincerely,

Christopher O. Petersen
President, Columbia Funds
Investors should consider the investment objectives, risks, charges and expenses of a mutual fund carefully before investing. For a free prospectus and summary prospectus, which contains this and other important information about a fund, visit columbiathreadneedle.com/us. The prospectus should be read carefully before investing.
Columbia Funds are distributed by Columbia Management Investment Distributors, Inc., member FINRA, and managed by Columbia Management Investment Advisers, LLC.
© 2016 Columbia Management Investment Advisers, LLC. All rights reserved.
COLUMBIA LARGE CAP GROWTH FUND III
Fund Investment Manager
Columbia Management Investment
Advisers, LLC
225 Franklin Street
Boston, MA 02110
Fund Distributor
Columbia Management Investment
Distributors, Inc.
225 Franklin Street
Boston, MA 02110
Fund Transfer Agent
Columbia Management Investment
Services Corp.
P.O. Box 8081
Boston, MA 02266-8081
For more information about any of the funds, please visit columbiathreadneedle.com/us or call 800.345.6611. Customer Service Representatives are available to answer your questions Monday through Friday from 8 a.m. to 7 p.m. Eastern time.
The views expressed in this report reflect the current views of the respective parties. These views are not guarantees of future performance and involve certain risks, uncertainties and assumptions that are difficult to predict, so actual outcomes and results may differ significantly from the views expressed. These views are subject to change at any time based upon economic, market or other conditions and the respective parties disclaim any responsibility to update such views. These views may not be relied on as investment advice and, because investment decisions for a Columbia fund are based on numerous factors, may not be relied on as an indication of trading intent on behalf of any particular Columbia fund. References to specific securities should not be construed as a recommendation or investment advice.
Performance Overview | | | 3 | | |
Manager Discussion of Fund Performance | | | 5 | | |
Understanding Your Fund's Expenses | | | 7 | | |
Portfolio of Investments | | | 8 | | |
Statement of Assets and Liabilities | | | 13 | | |
Statement of Operations | | | 15 | | |
Statement of Changes in Net Assets | | | 16 | | |
Financial Highlights | | | 18 | | |
Notes to Financial Statements | | | 25 | | |
Report of Independent Registered Public Accounting Firm | | | 33 | | |
Federal Income Tax Information | | | 34 | | |
Trustees and Officers | | | 35 | | |
Important Information About This Report | | | 41 | | |
COLUMBIA LARGE CAP GROWTH FUND III
Performance Summary
n Columbia Large Cap Growth Fund III (the Fund) Class A shares returned -11.07% excluding sales charges for the 12-month period that ended February 29, 2016.
n The Fund's benchmark, the Russell 1000 Growth Index, returned -5.05% for the same time period.
n In a period of heightened market volatility, stock selection detracted from performance relative to its benchmark.
Average Annual Total Returns (%) (for period ended February 29, 2016)
| | | Inception | | 1 Year | | 5 Years | | 10 Years | |
Class A | | 12/31/97 | | | | | | | |
Excluding sales charges | | | | | -11.07 | | | | 8.43 | | | | 5.59 | | |
Including sales charges | | | | | -16.18 | | | | 7.15 | | | | 4.96 | | |
Class B | | 12/31/97 | | | | | | | |
Excluding sales charges | | | | | -11.72 | | | | 7.63 | | | | 4.80 | | |
Including sales charges | | | | | -15.14 | | | | 7.47 | | | | 4.80 | | |
Class C | | 12/31/97 | | | | | | | |
Excluding sales charges | | | | | -11.70 | | | | 7.63 | | | | 4.80 | | |
Including sales charges | | | | | -12.39 | | | | 7.63 | | | | 4.80 | | |
Class I* | | 09/27/10 | | | -10.63 | | | | 9.02 | | | | 5.89 | | |
Class R4* | | 11/08/12 | | | -10.88 | | | | 8.61 | | | | 5.67 | | |
Class R5* | | 12/11/13 | | | -10.72 | | | | 8.63 | | | | 5.68 | | |
Class Z | | 12/31/97 | | | -10.87 | | | | 8.70 | | | | 5.85 | | |
Russell 1000 Growth Index | | | | | -5.05 | | | | 10.95 | | | | 7.74 | | |
Returns for Class A are shown with and without the maximum initial sales charge of 5.75%. Returns for Class B are shown with and without the applicable contingent deferred sales charge (CDSC) of 5.00% in the first year, declining to 1.00% in the sixth year and eliminated thereafter. Returns for Class C are shown with and without the 1.00% CDSC for the first year only. The Fund's other classes are not subject to sales charges and have limited eligibility. Please see the Fund's prospectus for details. Performance for different share classes will vary based on differences in sales charges and fees associated with each class. All results shown assume reinvestment of distributions during the period. Returns do not reflect the deduction of taxes that a shareholder may pay on Fund distributions or on the redemption of Fund shares. Performance results reflect the effect of any fee waivers or reimbursements of Fund expenses by Columbia Management Investment Advisers, LLC and/or any of its affiliates. Absent these fee waivers or expense reimbursement arrangements, performance results would have been lower.
The performance information shown represents past performance and is not a guarantee of future results. The investment return and principal value of your investment will fluctuate so that your shares, when redeemed, may be worth more or less than their original cost. Current performance may be lower or higher than the performance information shown. You may obtain performance information current to the most recent month-end by contacting your financial intermediary, visiting columbiathreadneedle.com/us or calling 800.345.6611.
*The returns shown for periods prior to the share class inception date (including returns for the Life of the Fund, if shown, which are since Fund inception) include the returns of the Fund's oldest share class. Since the Fund launched more than one class of shares at its inception, Class A shares were used. These returns are adjusted to reflect any higher class-related operating expenses of the newer share classes, as applicable. Please visit columbiathreadneedle.com/us/investment-products/mutual-funds/appended-performance for more information.
Effective November 20, 2015 the Fund compares its performance to that of the Russell 1000 Growth Index (replacing the S&P 500 Index). The Fund's investment manager believes that the new index provides a more appropriate basis for comparing the Fund's performance in light of the changes made to the Fund's name and principal investment strategies.
The Russell 1000 Growth Index, an unmanaged index, measures the performance of those Russell 1000 Index companies with higher price-to-book ratios and higher forecasted growth values.
The S&P 500 Index, an unmanaged index, measures the performance of 500 widely held, large-capitalization U.S. stocks and is frequently used as a general measure of market performance.
Indices are not available for investment, are not professionally managed and do not reflect sales charges, fees, brokerage commissions, taxes or other expenses of investing. Securities in the Fund may not match those in an index.
Annual Report 2016
3
COLUMBIA LARGE CAP GROWTH FUND III
PERFORMANCE OVERVIEW (continued)
Performance of a Hypothetical $10,000 Investment (March 1, 2006 – February 29, 2016)
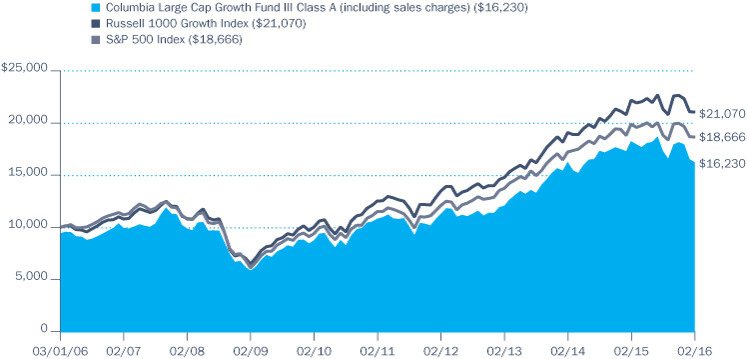
The chart above shows the change in value of a hypothetical $10,000 investment in Class A shares of Columbia Large Cap Growth Fund III during the stated time period, and does not reflect the deduction of taxes that a shareholder may pay on Fund distributions or on the redemption of Fund shares.
Annual Report 2016
4
COLUMBIA LARGE CAP GROWTH FUND III
MANAGER DISCUSSION OF FUND PERFORMANCE
For the 12-month period that ended February 29, 2016, the Fund's Class A shares returned -11.07% excluding sales charges. The Fund underperformed its benchmark, the Russell 1000 Growth Index, which returned -5.05% over the same time period. In a period of heightened market volatility, stock selection detracted from performance relative to its benchmark.
Mounting Global Pressures Weighed on Markets
Around the world, investors turned cautious over the 12-month period that ended February 29, 2016, as lackluster economic growth, contentious geopolitical conflicts and a shift in U.S. monetary policy weighed on confidence. Subpar global economic growth continued for a fourth straight year, with China's slowdown heading the list of disappointments. Conflicts in the Middle East and terrorism, both at home and abroad, heightened security fears. Plummeting oil prices and a rising dollar rounded the list of mounting pressures. A widening trade deficit also took a significant bite out of growth.
Despite these setbacks, the U.S. economy continued to expand for the seventh consecutive year. U.S. labor markets recovered to full employment and consumer spending strengthened. The housing market inched forward, although sales slipped near the end of the period as new industry regulation led to longer closing periods. Manufacturing activity softened, putting a damper on growth.
Modest stock market gains in the first half of the period were wiped out in the second half. The S&P 500 Index, a broad measure of U.S. stock market performance, returned -6.19%, including dividends. Large-cap stocks held up better than mid- and small-cap stocks and growth stocks outperformed value stocks.
In December 2015, the Federal Reserve (the Fed) raised the target range of its benchmark interest rate by a quarter of a point, ending a lengthy debate about whether the economy was strong enough to withstand higher borrowing costs. Mixed economic signals early in 2016 put additional rate hikes on hold — at least for now.
Marsico-Subadvised Portfolio
From March 1, 2015 through November 19, 2015, Marsico provided day-to-day portfolio management of the Fund and the Fund's performance was compared to that of the S&P 500 Index. This section discusses the contributors and detractors to the Fund's portfolio during the period in which Marsico subadvised the portfolio.
The Fund had more exposure than the S&P 500 Index to information technology and consumer discretionary stocks, the period's two strongest-performing sectors. These sectors also accounted for the top three individual performers in the Fund: Facebook, Starbucks and Nike. Facebook, a social media company, benefited from the advertising shift from traditional to online media. Better-than-expected earnings were fueled by active user growth as Facebook continued to innovate ways to engage with its users. The company's new Premium Video product experienced strong growth by mobile users — a key, fast-growing
Portfolio Management
John Wilson, CFA
Peter Deininger, CFA, CAIA
Tchintcia Barros, CFA
Effective November 20, 2015, Marsico Capital Management, LLC (Marsico) no longer serves as the subadviser to the Fund and Columbia Management Investment Advisers, LLC assumed the day-to-day management of the Fund's portfolio.
Morningstar Style BoxTM

The Morningstar Style BoxTM is based on a fund's portfolio holdings. For equity funds, the vertical axis shows the market capitalization of the stocks owned, and the horizontal axis shows investment style (value, blend, or growth). Information shown is based on the most recent data provided by Morningstar.
© 2016 Morningstar, Inc. All rights reserved. The Morningstar information contained herein: (1) is proprietary to Morningstar and/or its content providers; (2) may not be copied or distributed; and (3) is not warranted to be accurate, complete or timely. Neither Morningstar nor its content providers are responsible for any damages or losses arising from any use of this information.
Top Ten Holdings (%)
(at February 29, 2016) | |
Alphabet, Inc., Class A | | | 6.6 | | |
Apple, Inc. | | | 4.6 | | |
Amazon.com, Inc. | | | 4.0 | | |
Facebook, Inc., Class A | | | 3.9 | | |
Microsoft Corp. | | | 3.8 | | |
Visa, Inc., Class A | | | 3.1 | | |
CVS Health Corp. | | | 3.0 | | |
PepsiCo, Inc. | | | 2.9 | | |
Comcast Corp., Class A | | | 2.9 | | |
SPDR S&P 500 ETF Trust | | | 2.8 | | |
Percentages indicated are based upon total investments (excluding Money Market Funds).
Annual Report 2016
5
COLUMBIA LARGE CAP GROWTH FUND III
MANAGER DISCUSSION OF FUND PERFORMANCE (continued)
For further detail about these holdings, please refer to the section entitled "Portfolio of Investments."
Fund holdings are as of the date given, are subject to change at any time, and are not recommendations to buy or sell any security.
Portfolio Breakdown (%)
(at February 29, 2016) | |
Common Stocks | | | 90.4 | | |
Exchange-Traded Funds | | | 5.2 | | |
Money Market Funds | | | 4.4 | | |
Total | | | 100.0 | | |
Percentages indicated are based upon total investments. The Fund's portfolio composition is subject to change.
Equity Sector Breakdown (%)
(at February 29, 2016) | |
Consumer Discretionary | | | 23.7 | | |
Consumer Staples | | | 11.4 | | |
Energy | | | 0.9 | | |
Financials | | | 3.8 | | |
Health Care | | | 13.9 | | |
Industrials | | | 7.8 | | |
Information Technology | | | 36.2 | | |
Materials | | | 2.3 | | |
Total | | | 100.0 | | |
Percentages indicated are based upon total equity investments. The Fund's portfolio composition is subject to change.
Investment Risks
Market risk may affect a single issuer, sector of the economy, industry or the market as a whole. Growth securities, at times, may not perform as well as value securities or the stock market in general and may be out of favor with investors. Foreign investments subject the Fund to risks, including political, economic, market, social and others within a particular country, as well as to currency instabilities and less stringent financial and accounting standards generally applicable to U.S. issuers. As a non-diversified fund, fewer investments could have a greater effect on performance. The Fund may invest significantly in issuers within a particular sector, which may be negatively affected by market, economic or other conditions, making the Fund more vulnerable to unfavorable developments in the sector. See the Fund's prospectus for more information on these and other risks.
advertising market. Starbucks shares posted a sizeable gain as the company reported strong sales and continued its rollout of a mobile order and pay platform, which provides the company with data and individualized marketing opportunities. Shares of athletic apparel company Nike rose on the heels of accelerated sales, particularly in North America, Europe and China. The company continued to innovate in its footwear line and in technical fabrics for sports apparel. The Fund's positions in Facebook, Starbucks and Nike were modestly trimmed during the period. An underweight in energy, the weakest performing sector in the index, aided comparative results.
Health care was the biggest detractor from Fund performance during the period. In particular, several of the Fund's pharmaceuticals, biotechnology and life sciences positions disappointed. Within health care, Pacira Pharmaceuticals, a manufacturer of non-opioid post-surgical pain anesthetics, declined sharply on an uncertain approval outlook for its drug Exparel and a Department of Justice subpoena regarding Pacira's marketing practices. Illumina, a biotechnology company that delivers affordable genomic sequencing solutions for use in medical and pharmaceutical research, announced lower-than-expected sales results. The stock was sold. Industrials and consumer staples stocks also detracted from performance. Lack of exposure to the food, beverage and tobacco industry group within consumer staples was an additional drag on results.
CMIA Portfolio
Effective November 20, 2015, Columbia Management Investment Advisers, LLC, the Investment Manager, assumed day-to-day portfolio management of the Fund and the Fund began comparing its performance to that of the Russell 1000 Growth Index. This section discusses the contributors and detractors to the Fund's portfolio from November 20, 2015 through February 29, 2016.
In a period of exceptional volatility, we began to transition the portfolio's holdings to bring it in line with our large-cap growth strategy, a process that has been underway since we assumed Fund management on November 20, 2015. The Fund also adopted a new benchmark, the Russell 1000 Growth Index, which we believe more accurately reflects our growth style. We increased the Fund's weighting in consumer staples and decreased weightings in consumer discretionary and health care. Overall, the Fund has an expanded list of approximately 65 to 85 company names. At period's end, the portfolio was focused on high-quality growth companies with track records of consistent earnings growth and particular emphasis on both health care and information technology.
Annual Report 2016
6
COLUMBIA LARGE CAP GROWTH FUND III
UNDERSTANDING YOUR FUND'S EXPENSES
(Unaudited)
As an investor, you incur two types of costs. There are transaction costs, which generally include sales charges on purchases and may include redemption fees. There are also ongoing costs, which generally include management fees, distribution and/or service fees, and other fund expenses. The following information is intended to help you understand your ongoing costs (in dollars) of investing in the Fund and to help you compare these costs with the ongoing costs of investing in other mutual funds.
Analyzing Your Fund's Expenses
To illustrate these ongoing costs, we have provided examples and calculated the expenses paid by investors in each share class of the Fund during the period. The actual and hypothetical information in the table is based on an initial investment of $1,000 at the beginning of the period indicated and held for the entire period. Expense information is calculated two ways and each method provides you with different information. The amount listed in the "Actual" column is calculated using the Fund's actual operating expenses and total return for the period. You may use the Actual information, together with the amount invested, to estimate the expenses that you paid over the period. Simply divide your account value by $1,000 (for example, an $8,600 account value divided by $1,000 = 8.6), then multiply the results by the expenses paid during the period under the "Actual" column. The amount listed in the "Hypothetical" column assumes a 5% annual rate of return before expenses (which is not the Fund's actual return) and then applies the Fund's actual expense ratio for the period to the hypothetical return. You should not use the hypothetical account values and expenses to estimate either your actual account balance at the end of the period or the expenses you paid during the period. See "Compare With Other Funds" below for details on how to use the hypothetical data.
Compare With Other Funds
Since all mutual funds are required to include the same hypothetical calculations about expenses in shareholder reports, you can use this information to compare the ongoing cost of investing in the Fund with other funds. To do so, compare the hypothetical example with the 5% hypothetical examples that appear in the shareholder reports of other funds. As you compare hypothetical examples of other funds, it is important to note that hypothetical examples are meant to highlight the ongoing costs of investing in a fund only and do not reflect any transaction costs, such as sales charges, or redemption or exchange fees. Therefore, the hypothetical calculations are useful in comparing ongoing costs only, and will not help you determine the relative total costs of owning different funds. If transaction costs were included in these calculations, your costs would be higher.
September 1, 2015 – February 29, 2016
| | | Account Value at the Beginning
of the Period ($) | | Account Value at the End of the
Period ($) | | Expenses Paid During the
Period ($) | | Fund's Annualized
Expense Ratio (%) | |
| | | Actual | | Hypothetical | | Actual | | Hypothetical | | Actual | | Hypothetical | | Actual | |
Class A | | | 1,000.00 | | | | 1,000.00 | | | | 938.50 | | | | 1,018.80 | | | | 5.88 | | | | 6.12 | | | | 1.22 | | |
Class B | | | 1,000.00 | | | | 1,000.00 | | | | 935.30 | | | | 1,015.07 | | | | 9.48 | | | | 9.87 | | | | 1.97 | | |
Class C | | | 1,000.00 | | | | 1,000.00 | | | | 935.20 | | | | 1,015.07 | | | | 9.48 | | | | 9.87 | | | | 1.97 | | |
Class I | | | 1,000.00 | | | | 1,000.00 | | | | 941.10 | | | | 1,021.13 | | | | 3.62 | | | | 3.77 | | | | 0.75 | | |
Class R4 | | | 1,000.00 | | | | 1,000.00 | | | | 939.60 | | | | 1,020.04 | | | | 4.68 | | | | 4.87 | | | | 0.97 | | |
Class R5 | | | 1,000.00 | | | | 1,000.00 | | | | 940.50 | | | | 1,020.69 | | | | 4.05 | | | | 4.22 | | | | 0.84 | | |
Class Z | | | 1,000.00 | | | | 1,000.00 | | | | 939.40 | | | | 1,020.04 | | | | 4.68 | | | | 4.87 | | | | 0.97 | | |
Expenses paid during the period are equal to the annualized expense ratio for each class as indicated above, multiplied by the average account value over the period and then multiplied by the number of days in the Fund's most recent fiscal half year and divided by 366.
Expenses do not include fees and expenses incurred indirectly by the Fund from its investment in underlying funds, including affiliated and non-affiliated pooled investment vehicles, such as mutual funds and exchange-traded funds.
Had Columbia Management Investment Advisers, LLC and/or certain of its affiliates not waived/reimbursed certain fees and expenses, account value at the end of the period would have been reduced.
Annual Report 2016
7
COLUMBIA LARGE CAP GROWTH FUND III
PORTFOLIO OF INVESTMENTS
February 29, 2016
(Percentages represent value of investments compared to net assets)
Common Stocks 91.4%
Issuer | | Shares | | Value ($) | |
CONSUMER DISCRETIONARY 21.6% | |
Auto Components 0.3% | |
Visteon Corp. | | | 27,789 | | | | 1,943,007 | | |
Hotels, Restaurants & Leisure 3.6% | |
Norwegian Cruise Line Holdings Ltd.(a) | | | 146,928 | | | | 7,218,572 | | |
Starbucks Corp. | | | 280,013 | | | | 16,299,557 | | |
Total | | | | | 23,518,129 | | |
Household Durables 0.7% | |
Jarden Corp.(a) | | | 81,092 | | | | 4,288,145 | | |
Internet & Catalog Retail 6.0% | |
Amazon.com, Inc.(a) | | | 44,962 | | | | 24,842,404 | | |
Ctrip.com International Ltd., ADR(a) | | | 109,349 | | | | 4,474,561 | | |
Expedia, Inc. | | | 36,549 | | | | 3,805,116 | | |
Priceline Group, Inc. (The)(a) | | | 4,508 | | | | 5,703,567 | | |
Total | | | | | 38,825,648 | | |
Media 3.6% | |
Comcast Corp., Class A | | | 307,772 | | | | 17,767,678 | | |
DISH Network Corp., Class A(a) | | | 109,023 | | | | 5,138,254 | | |
Total | | | | | 22,905,932 | | |
Multiline Retail 2.2% | |
Dollar General Corp. | | | 94,460 | | | | 7,013,655 | | |
Dollar Tree, Inc.(a) | | | 89,788 | | | | 7,205,487 | | |
Total | | | | | 14,219,142 | | |
Specialty Retail 3.0% | |
Lowe's Companies, Inc. | | | 192,829 | | | | 13,021,742 | | |
TJX Companies, Inc. (The) | | | 88,464 | | | | 6,555,183 | | |
Total | | | | | 19,576,925 | | |
Textiles, Apparel & Luxury Goods 2.2% | |
lululemon athletica, Inc.(a) | | | 36,947 | | | | 2,317,685 | | |
Nike, Inc., Class B | | | 192,455 | | | | 11,853,304 | | |
Total | | | | | 14,170,989 | | |
Total Consumer Discretionary | | | | | 139,447,917 | | |
CONSUMER STAPLES 10.4% | |
Beverages 4.9% | |
Constellation Brands, Inc., Class A | | | 35,993 | | | | 5,090,490 | | |
Molson Coors Brewing Co., Class B | | | 96,629 | | | | 8,239,555 | | |
PepsiCo, Inc. | | | 185,276 | | | | 18,123,698 | | |
Total | | | | | 31,453,743 | | |
Common Stocks (continued)
Issuer | | Shares | | Value ($) | |
Food & Staples Retailing 2.9% | |
CVS Health Corp. | | | 191,636 | | | | 18,621,270 | | |
Food Products 0.3% | |
Tyson Foods, Inc., Class A | | | 35,921 | | | | 2,325,885 | | |
Tobacco 2.3% | |
Philip Morris International, Inc. | | | 160,231 | | | | 14,585,828 | | |
Total Consumer Staples | | | | | 66,986,726 | | |
ENERGY 0.8% | |
Energy Equipment & Services 0.8% | |
Schlumberger Ltd. | | | 71,284 | | | | 5,112,488 | | |
Total Energy | | | | | 5,112,488 | | |
FINANCIALS 3.5% | |
Banks 0.6% | |
Wells Fargo & Co. | | | 73,327 | | | | 3,440,503 | | |
Capital Markets 2.5% | |
Bank of New York Mellon Corp. (The) | | | 218,860 | | | | 7,745,455 | | |
BlackRock, Inc. | | | 9,032 | | | | 2,817,623 | | |
Goldman Sachs Group, Inc. (The) | | | 16,172 | | | | 2,418,199 | | |
Invesco Ltd. | | | 121,519 | | | | 3,249,418 | | |
Total | | | | | 16,230,695 | | |
Real Estate Investment Trusts (REITs) 0.4% | |
Simon Property Group, Inc. | | | 13,835 | | | | 2,624,915 | | |
Total Financials | | | | | 22,296,113 | | |
HEALTH CARE 12.7% | |
Biotechnology 5.5% | |
Alexion Pharmaceuticals, Inc.(a) | | | 39,241 | | | | 5,525,133 | | |
Alkermes PLC(a) | | | 87,746 | | | | 2,831,563 | | |
Biogen, Inc.(a) | | | 26,595 | | | | 6,899,275 | | |
Celgene Corp.(a) | | | 118,864 | | | | 11,985,057 | | |
Incyte Corp.(a) | | | 18,865 | | | | 1,386,577 | | |
Intercept Pharmaceuticals, Inc.(a) | | | 7,990 | | | | 889,926 | | |
Novavax, Inc.(a) | | | 157,494 | | | | 686,674 | | |
Ultragenyx Pharmaceutical, Inc.(a) | | | 14,610 | | | | 891,064 | | |
Vertex Pharmaceuticals, Inc.(a) | | | 49,589 | | | | 4,239,364 | | |
Total | | | | | 35,334,633 | | |
Health Care Equipment & Supplies 1.5% | |
Medtronic PLC | | | 125,642 | | | | 9,723,434 | | |
The accompanying Notes to Financial Statements are an integral part of this statement.
Annual Report 2016
8
COLUMBIA LARGE CAP GROWTH FUND III
PORTFOLIO OF INVESTMENTS (continued)
February 29, 2016
Common Stocks (continued)
Issuer | | Shares | | Value ($) | |
Health Care Providers & Services 1.5% | |
Express Scripts Holding Co.(a) | | | 70,514 | | | | 4,962,775 | | |
Laboratory Corp. of America Holdings(a) | | | 42,396 | | | | 4,656,777 | | |
Total | | | | | 9,619,552 | | |
Life Sciences Tools & Services 1.8% | |
Thermo Fisher Scientific, Inc. | | | 87,784 | | | | 11,340,815 | | |
Pharmaceuticals 2.4% | |
Bristol-Myers Squibb Co. | | | 250,891 | | | | 15,537,680 | | |
Total Health Care | | | | | 81,556,114 | | |
INDUSTRIALS 7.2% | |
Aerospace & Defense 1.2% | |
Northrop Grumman Corp. | | | 40,333 | | | | 7,752,809 | | |
Air Freight & Logistics 1.6% | |
FedEx Corp. | | | 76,400 | | | | 10,457,632 | | |
Airlines 1.7% | |
Delta Air Lines, Inc. | | | 220,776 | | | | 10,650,234 | | |
Electrical Equipment 0.3% | |
AMETEK, Inc. | | | 46,450 | | | | 2,155,745 | | |
Machinery 1.7% | |
Ingersoll-Rand PLC | | | 107,924 | | | | 5,996,258 | | |
Stanley Black & Decker, Inc. | | | 51,840 | | | | 4,873,478 | | |
Total | | | | | 10,869,736 | | |
Road & Rail 0.7% | |
Kansas City Southern | | | 51,900 | | | | 4,240,749 | | |
Total Industrials | | | | | 46,126,905 | | |
INFORMATION TECHNOLOGY 33.1% | |
Communications Equipment 0.6% | |
Palo Alto Networks, Inc.(a) | | | 27,356 | | | | 3,960,875 | | |
Internet Software & Services 11.3% | |
Alibaba Group Holding Ltd., ADR(a) | | | 80,190 | | | | 5,517,874 | | |
Alphabet, Inc., Class A(a) | | | 57,695 | | | | 41,380,008 | | |
Facebook, Inc., Class A(a) | | | 225,324 | | | | 24,091,642 | | |
LinkedIn Corp., Class A(a) | | | 13,884 | | | | 1,627,066 | | |
Total | | | | | 72,616,590 | | |
Common Stocks (continued)
Issuer | | Shares | | Value ($) | |
IT Services 3.7% | |
PayPal Holdings, Inc.(a) | | | 120,350 | | | | 4,590,149 | | |
Visa, Inc., Class A | | | 265,806 | | | | 19,241,696 | | |
Total | | | | | 23,831,845 | | |
Semiconductors & Semiconductor Equipment 3.7% | |
Broadcom Ltd. | | | 71,141 | | | | 9,530,760 | | |
NVIDIA Corp. | | | 228,505 | | | | 7,165,917 | | |
NXP Semiconductors NV(a) | | | 63,284 | | | | 4,508,352 | | |
Qorvo, Inc.(a) | | | 66,285 | | | | 2,988,128 | | |
Total | | | | | 24,193,157 | | |
Software 9.3% | |
Electronic Arts, Inc.(a) | | | 213,646 | | | | 13,724,619 | | |
Microsoft Corp. | | | 466,555 | | | | 23,738,318 | | |
Red Hat, Inc.(a) | | | 107,693 | | | | 7,037,738 | | |
Salesforce.com, inc.(a) | | | 180,711 | | | | 12,243,170 | | |
ServiceNow, Inc.(a) | | | 54,799 | | | | 3,013,397 | | |
Total | | | | | 59,757,242 | | |
Technology Hardware, Storage & Peripherals 4.5% | |
Apple, Inc. | | | 297,834 | | | | 28,797,569 | | |
Total Information Technology | | | | | 213,157,278 | | |
MATERIALS 2.1% | |
Chemicals 2.1% | |
Eastman Chemical Co. | | | 86,480 | | | | 5,547,692 | | |
Sherwin-Williams Co. (The) | | | 30,052 | | | | 8,129,066 | | |
Total | | | | | 13,676,758 | | |
Total Materials | | | | | 13,676,758 | | |
Total Common Stocks
(Cost: $565,842,585) | | | | | 588,360,299 | | |
Exchange-Traded Funds 5.3%
| | | Shares | | Value ($) | |
SPDR S&P 500 ETF Trust | | | 91,554 | | | | 17,721,192 | | |
iShares Russell 1000 Growth Index Fund | | | 175,679 | | | | 16,483,961 | | |
Total Exchange-Traded Funds
(Cost: $36,432,083) | | | | | 34,205,153 | | |
The accompanying Notes to Financial Statements are an integral part of this statement.
Annual Report 2016
9
COLUMBIA LARGE CAP GROWTH FUND III
PORTFOLIO OF INVESTMENTS (continued)
February 29, 2016
Money Market Funds 4.4%
| | | Shares | | Value ($) | |
Columbia Short-Term Cash Fund,
0.420%(b)(c) | | | 28,592,349 | | | | 28,592,349 | | |
Total Money Market Funds
(Cost: $28,592,349) | | | | | 28,592,349 | | |
Total Investments
(Cost: $630,867,017) | | | | | 651,157,801 | | |
Other Assets & Liabilities, Net | | | | | (6,834,817 | ) | |
Net Assets | | | | | 644,322,984 | | |
Notes to Portfolio of Investments
(a) Non-income producing investment.
(b) The rate shown is the seven-day current annualized yield at February 29, 2016.
(c) As defined in the Investment Company Act of 1940, an affiliated company is one in which the Fund owns 5% or more of the company's outstanding voting securities, or a company which is under common ownership or control with the Fund. Holdings and transactions in these affiliated companies during the year ended February 29, 2016 are as follows:
Issuer | | Beginning
Cost ($) | | Purchase
Cost ($) | | Proceeds
From Sales ($) | | Ending
Cost ($) | | Dividends —
Affiliated
Issuers ($) | | Value ($) | |
Columbia Short-Term Cash Fund | | | 23,630,450 | | | | 624,137,301 | | | | (619,175,402 | ) | | | 28,592,349 | | | | 56,869 | | | | 28,592,349 | | |
Abbreviation Legend
ADR American Depositary Receipt
Fair Value Measurements
The Fund categorizes its fair value measurements according to a three-level hierarchy that maximizes the use of observable inputs and minimizes the use of unobservable inputs by prioritizing that the most observable input be used when available. Observable inputs are those that market participants would use in pricing an investment based on market data obtained from sources independent of the reporting entity. Unobservable inputs are those that reflect the Fund's assumptions about the information market participants would use in pricing an investment. An investment's level within the fair value hierarchy is based on the lowest level of any input that is deemed significant to the asset's or liability's fair value measurement. The input levels are not necessarily an indication of the risk or liquidity associated with investments at that level. For example, certain U.S. government securities are generally high quality and liquid, however, they are reflected as Level 2 because the inputs used to determine fair value may not always be quoted prices in an active market.
Fair value inputs are summarized in the three broad levels listed below:
> Level 1 — Valuations based on quoted prices for investments in active markets that the Fund has the ability to access at the measurement date (including NAV for open-end mutual funds). Valuation adjustments are not applied to Level 1 investments.
> Level 2 — Valuations based on other significant observable inputs (including quoted prices for similar securities, interest rates, prepayment speeds, credit risks, etc.).
> Level 3 — Valuations based on significant unobservable inputs (including the Fund's own assumptions and judgment in determining the fair value of investments).
Inputs that are used in determining fair value of an investment may include price information, credit data, volatility statistics, and other factors. These inputs can be either observable or unobservable. The availability of observable inputs can vary between investments, and is affected by various factors such as the type of investment, and the volume and level of activity for that investment or similar investments in the marketplace. The inputs will be considered by the Investment Manager, along with any other relevant factors in the calculation of an investment's fair value. The Fund uses prices and inputs that are current as of the measurement date, which may include periods of market dislocations. During these periods, the availability of prices and inputs may be reduced for many investments. This condition could cause an investment to be reclassified between the various levels within the hierarchy.
The accompanying Notes to Financial Statements are an integral part of this statement.
Annual Report 2016
10
COLUMBIA LARGE CAP GROWTH FUND III
PORTFOLIO OF INVESTMENTS (continued)
February 29, 2016
Fair Value Measurements (continued)
Investments falling into the Level 3 category are primarily supported by quoted prices from brokers and dealers participating in the market for those investments. However, these may be classified as Level 3 investments due to lack of market transparency and corroboration to support these quoted prices. Additionally, valuation models may be used as the pricing source for any remaining investments classified as Level 3. These models may rely on one or more significant unobservable inputs and/or significant assumptions by the Investment Manager. Inputs used in valuations may include, but are not limited to, financial statement analysis, capital account balances, discount rates and estimated cash flows, and comparable company data.
Under the direction of the Fund's Board of Trustees (the Board), the Investment Manager's Valuation Committee (the Committee) is responsible for overseeing the valuation procedures approved by the Board. The Committee consists of voting and non-voting members from various groups within the Investment Manager's organization, including operations and accounting, trading and investments, compliance, risk management and legal.
The Committee meets at least monthly to review and approve valuation matters, which may include a description of specific valuation determinations, data regarding pricing information received from approved pricing vendors and brokers and the results of Board-approved valuation control policies and procedures (the Policies). The Policies address, among other things, instances when market quotations are or are not readily available, including recommendations of third party pricing vendors and a determination of appropriate pricing methodologies; events that require specific valuation determinations and assessment of fair value techniques; securities with a potential for stale pricing, including those that are illiquid, restricted, or in default; and the effectiveness of third party pricing vendors, including periodic reviews of vendors. The Committee meets more frequently, as needed, to discuss additional valuation matters, which may include the need to review back-testing results, review time-sensitive information or approve related valuation actions. The Committee reports to the Board, with members of the Committee meeting with the Board at each of its regularly scheduled meetings to discuss valuation matters and actions during the period, similar to those described earlier.
For investments categorized as Level 3, the Committee monitors information similar to that described above, which may include: (i) data specific to the issuer or comparable issuers, (ii) general market or specific sector news and (iii) quoted prices and specific or similar security transactions. The Committee considers this data and any changes from prior periods in order to assess the reasonableness of observable and unobservable inputs, any assumptions or internal models used to value those securities and changes in fair value. This data is also used to corroborate, when available, information received from approved pricing vendors and brokers. Various factors impact the frequency of monitoring this information (which may occur as often as daily). However, the Committee may determine that changes to inputs, assumptions and models are not required as a result of the monitoring procedures performed.
The following table is a summary of the inputs used to value the Fund's investments at February 29, 2016:
| | | Level 1
Quoted Prices in Active
Markets for Identical
Assets ($) | | Level 2
Other Significant
Observable Inputs ($) | | Level 3
Significant
Unobservable Inputs ($) | | Total ($) | |
Investments | |
Common Stocks | |
Consumer Discretionary | | | 139,447,917 | | | | — | | | | — | | | | 139,447,917 | | |
Consumer Staples | | | 66,986,726 | | | | — | | | | — | | | | 66,986,726 | | |
Energy | | | 5,112,488 | | | | — | | | | — | | | | 5,112,488 | | |
Financials | | | 22,296,113 | | | | — | | | | — | | | | 22,296,113 | | |
Health Care | | | 81,556,114 | | | | — | | | | — | | | | 81,556,114 | | |
Industrials | | | 46,126,905 | | | | — | | | | — | | | | 46,126,905 | | |
Information Technology | | | 213,157,278 | | | | — | | | | — | | | | 213,157,278 | | |
Materials | | | 13,676,758 | | | | — | | | | — | | | | 13,676,758 | | |
Total Common Stocks | | | 588,360,299 | | | | — | | | | — | | | | 588,360,299 | | |
Exchange-Traded Funds | | | 34,205,153 | | | | — | | | | — | | | | 34,205,153 | | |
Money Market Funds | | | — | | | | 28,592,349 | | | | — | | | | 28,592,349 | | |
Total Investments | | | 622,565,452 | | | | 28,592,349 | | | | — | | | | 651,157,801 | | |
See the Portfolio of Investments for all investment classifications not indicated in the table.
The accompanying Notes to Financial Statements are an integral part of this statement.
Annual Report 2016
11
COLUMBIA LARGE CAP GROWTH FUND III
PORTFOLIO OF INVESTMENTS (continued)
February 29, 2016
Fair Value Measurements (continued)
The Fund's assets assigned to the Level 2 input category are valued based upon utilizing observable market inputs, in which a security's value is determined through reference to prices and information from market transactions for similar or identical assets and/or fund per share market values which are not considered publicly available.
Financial assets were transferred from Level 1 to Level 2 as the market for these assets is not considered publicly available. Fund per share market values were obtained using observable market inputs.
The following table shows transfers between Level 1 and Level 2 of the fair value hierarchy:
Transfers In | | Transfers Out | |
| Level 1 ($) | | Level 2 ($) | | Level 1 ($) | | Level 2 ($) | |
| | — | | | | 23,630,450 | | | | 23,630,450 | | | | — | | |
Transfers between Level 1 and Level 2 are determined based on the fair value at the beginning of the period for security positions held throughout the period.
There were no transfers of financial assets between Levels 2 and 3 during the period.
The accompanying Notes to Financial Statements are an integral part of this statement.
Annual Report 2016
12
COLUMBIA LARGE CAP GROWTH FUND III
STATEMENT OF ASSETS AND LIABILITIES
February 29, 2016
Assets | |
Investments, at value | |
Unaffiliated issuers (identified cost $602,274,668) | | $ | 622,565,452 | | |
Affiliated issuers (identified cost $28,592,349) | | | 28,592,349 | | |
Total investments (identified cost $630,867,017) | | | 651,157,801 | | |
Receivable for: | |
Capital shares sold | | | 42,695 | | |
Dividends | | | 578,980 | | |
Foreign tax reclaims | | | 108,282 | | |
Expense reimbursement due from Investment Manager | | | 4,846 | | |
Prepaid expenses | | | 2,668 | | |
Total assets | | | 651,895,272 | | |
Liabilities | |
Payable for: | |
Capital shares purchased | | | 7,152,325 | | |
Investment management fees | | | 40,749 | | |
Distribution and/or service fees | | | 19,832 | | |
Transfer agent fees | | | 151,309 | | |
Compensation of board members | | | 143,359 | | |
Other expenses | | | 64,714 | | |
Total liabilities | | | 7,572,288 | | |
Net assets applicable to outstanding capital stock | | $ | 644,322,984 | | |
Represented by | |
Paid-in capital | | $ | 548,820,541 | | |
Excess of distributions over net investment income | | | (508,851 | ) | |
Accumulated net realized gain | | | 75,723,200 | | |
Unrealized appreciation (depreciation) on: | |
Investments | | | 20,290,784 | | |
Foreign currency translations | | | (2,690 | ) | |
Total — representing net assets applicable to outstanding capital stock | | $ | 644,322,984 | | |
The accompanying Notes to Financial Statements are an integral part of this statement.
Annual Report 2016
13
COLUMBIA LARGE CAP GROWTH FUND III
STATEMENT OF ASSETS AND LIABILITIES (continued)
February 29, 2016
Class A | |
Net assets | | $ | 356,034,876 | | |
Shares outstanding | | | 23,938,119 | | |
Net asset value per share | | $ | 14.87 | | |
Maximum offering price per share(a) | | $ | 15.78 | | |
Class B | |
Net assets | | $ | 1,876,689 | | |
Shares outstanding | | | 164,536 | | |
Net asset value per share | | $ | 11.41 | | |
Class C | |
Net assets | | $ | 148,419,927 | | |
Shares outstanding | | | 12,898,909 | | |
Net asset value per share | | $ | 11.51 | | |
Class I | |
Net assets | | $ | 1,935 | | |
Shares outstanding | | | 121 | | |
Net asset value per share(b) | | $ | 15.94 | | |
Class R4 | |
Net assets | | $ | 3,400,513 | | |
Shares outstanding | | | 210,823 | | |
Net asset value per share | | $ | 16.13 | | |
Class R5 | |
Net assets | | $ | 4,934,339 | | |
Shares outstanding | | | 304,065 | | |
Net asset value per share | | $ | 16.23 | | |
Class Z | |
Net assets | | $ | 129,654,705 | | |
Shares outstanding | | | 8,235,078 | | |
Net asset value per share | | $ | 15.74 | | |
(a) The maximum offering price per share is calculated by dividing the net asset value per share by 1.0 minus the maximum sales charge of 5.75%.
(b) Net asset value per share rounds to this amount due to fractional shares outstanding.
The accompanying Notes to Financial Statements are an integral part of this statement.
Annual Report 2016
14
COLUMBIA LARGE CAP GROWTH FUND III
STATEMENT OF OPERATIONS
Year Ended February 29, 2016
Net investment income | |
Income: | |
Dividends — unaffiliated issuers | | $ | 7,211,401 | | |
Dividends — affiliated issuers | | | 56,869 | | |
Foreign taxes withheld | | | (140,859 | ) | |
Total income | | | 7,127,411 | | |
Expenses: | |
Investment management fees | | | 7,026,151 | | |
Distribution and/or service fees | |
Class A | | | 1,187,568 | | |
Class B | | | 39,871 | | |
Class C | | | 1,998,328 | | |
Transfer agent fees | |
Class A | | | 956,599 | | |
Class B | | | 8,032 | | |
Class C | | | 402,419 | | |
Class R4 | | | 37,616 | | |
Class R5 | | | 3,539 | | |
Class Z | | | 477,242 | | |
Compensation of board members | | | 14,699 | | |
Custodian fees | | | 12,541 | | |
Printing and postage fees | | | 127,855 | | |
Registration fees | | | 97,844 | | |
Audit fees | | | 23,073 | | |
Legal fees | | | 12,968 | | |
Line of credit interest expense | | | 832 | | |
Other | | | 32,564 | | |
Total expenses | | | 12,459,741 | | |
Fees waived or expenses reimbursed by Investment Manager and its affiliates | | | (130,998 | ) | |
Expense reductions | | | (1,400 | ) | |
Total net expenses | | | 12,327,343 | | |
Net investment loss | | | (5,199,932 | ) | |
Realized and unrealized gain (loss) — net | |
Net realized gain (loss) on: | |
Investments | | | 238,220,797 | | |
Foreign currency translations | | | (26,619 | ) | |
Net realized gain | | | 238,194,178 | | |
Net change in unrealized appreciation (depreciation) on: | |
Investments | | | (324,511,272 | ) | |
Foreign currency translations | | | (2,690 | ) | |
Net change in unrealized depreciation | | | (324,513,962 | ) | |
Net realized and unrealized loss | | | (86,319,784 | ) | |
Net decrease in net assets from operations | | $ | (91,519,716 | ) | |
The accompanying Notes to Financial Statements are an integral part of this statement.
Annual Report 2016
15
COLUMBIA LARGE CAP GROWTH FUND III
STATEMENT OF CHANGES IN NET ASSETS
| | | Year Ended
February 29,
2016 | | Year Ended
February 28,
2015 | |
Operations | |
Net investment loss | | $ | (5,199,932 | ) | | $ | (3,485,716 | ) | |
Net realized gain | | | 238,194,178 | | | | 146,542,578 | | |
Net change in unrealized depreciation | | | (324,513,962 | ) | | | (21,368,432 | ) | |
Net increase (decrease) in net assets resulting from operations | | | (91,519,716 | ) | | | 121,688,430 | | |
Distributions to shareholders | |
Net realized gains | |
Class A | | | (88,649,651 | ) | | | (80,162,713 | ) | |
Class B | | | (851,880 | ) | | | (1,339,657 | ) | |
Class C | | | (46,922,640 | ) | | | (38,715,086 | ) | |
Class I | | | (464 | ) | | | (384 | ) | |
Class R4 | | | (3,991,973 | ) | | | (2,349,929 | ) | |
Class R5 | | | (1,215,209 | ) | | | (1,053,402 | ) | |
Class Z | | | (43,563,066 | ) | | | (38,715,563 | ) | |
Total distributions to shareholders | | | (185,194,883 | ) | | | (162,336,734 | ) | |
Decrease in net assets from capital stock activity | | | (169,504,539 | ) | | | (26,347,769 | ) | |
Total decrease in net assets | | | (446,219,138 | ) | | | (66,996,073 | ) | |
Net assets at beginning of year | | | 1,090,542,122 | | | | 1,157,538,195 | | |
Net assets at end of year | | $ | 644,322,984 | | | $ | 1,090,542,122 | | |
Excess of distributions over net investment income | | $ | (508,851 | ) | | $ | (147,214 | ) | |
The accompanying Notes to Financial Statements are an integral part of this statement.
Annual Report 2016
16
COLUMBIA LARGE CAP GROWTH FUND III
STATEMENT OF CHANGES IN NET ASSETS (continued)
| | | Year Ended February 29, 2016 | | Year Ended February 28, 2015 | |
| | | Shares | | Dollars ($) | | Shares | | Dollars ($) | |
Capital stock activity | |
Class A shares | |
Subscriptions(a) | | | 4,427,949 | | | | 81,872,803 | | | | 4,820,728 | | | | 97,594,452 | | |
Distributions reinvested | | | 3,282,991 | | | | 57,779,995 | | | | 2,776,625 | | | | 54,757,149 | | |
Redemptions | | | (10,271,531 | ) | | | (190,188,013 | ) | | | (9,322,975 | ) | | | (189,037,130 | ) | |
Net decrease | | | (2,560,591 | ) | | | (50,535,215 | ) | | | (1,725,622 | ) | | | (36,685,529 | ) | |
Class B shares | |
Subscriptions | | | 30,223 | | | | 416,419 | | | | 44,374 | | | | 720,662 | | |
Distributions reinvested | | | 28,684 | | | | 394,907 | | | | 37,916 | | | | 613,457 | | |
Redemptions(a) | | | (272,285 | ) | | | (4,012,136 | ) | | | (300,958 | ) | | | (5,014,838 | ) | |
Net decrease | | | (213,378 | ) | | | (3,200,810 | ) | | | (218,668 | ) | | | (3,680,719 | ) | |
Class C shares | |
Subscriptions | | | 2,064,880 | | | | 28,755,085 | | | | 1,597,783 | | | | 26,272,969 | | |
Distributions reinvested | | | 1,690,394 | | | | 23,264,246 | | | | 1,135,959 | | | | 18,508,823 | | |
Redemptions | | | (4,417,413 | ) | | | (63,038,735 | ) | | | (2,928,365 | ) | | | (49,238,868 | ) | |
Net decrease | | | (662,139 | ) | | | (11,019,404 | ) | | | (194,623 | ) | | | (4,457,076 | ) | |
Class R4 shares | |
Subscriptions | | | 471,382 | | | | 9,421,252 | | | | 627,616 | | | | 13,845,661 | | |
Distributions reinvested | | | 212,026 | | | | 3,991,536 | | | | 111,789 | | | | 2,349,570 | | |
Redemptions | | | (1,334,180 | ) | | | (23,461,566 | ) | | | (112,189 | ) | | | (2,400,603 | ) | |
Net increase (decrease) | | | (650,772 | ) | | | (10,048,778 | ) | | | 627,216 | | | | 13,794,628 | | |
Class R5 shares | |
Subscriptions | | | 43,806 | | | | 918,424 | | | | 107,825 | | | | 2,321,122 | | |
Distributions reinvested | | | 63,388 | | | | 1,214,764 | | | | 49,924 | | | | 1,053,035 | | |
Redemptions | | | (198,513 | ) | | | (4,031,461 | ) | | | (38,960 | ) | | | (825,076 | ) | |
Net increase (decrease) | | | (91,319 | ) | | | (1,898,273 | ) | | | 118,789 | | | | 2,549,081 | | |
Class Z shares | |
Subscriptions | | | 1,931,162 | | | | 37,151,303 | | | | 3,573,420 | | | | 75,216,851 | | |
Distributions reinvested | | | 1,728,002 | | | | 32,179,248 | | | | 1,368,412 | | | | 28,209,168 | | |
Redemptions | | | (8,734,883 | ) | | | (162,132,610 | ) | | | (4,785,626 | ) | | | (101,294,173 | ) | |
Net increase (decrease) | | | (5,075,719 | ) | | | (92,802,059 | ) | | | 156,206 | | | | 2,131,846 | | |
Total net decrease | | | (9,253,918 | ) | | | (169,504,539 | ) | | | (1,236,702 | ) | | | (26,347,769 | ) | |
(a) Includes conversions of Class B shares to Class A shares, if any.
The accompanying Notes to Financial Statements are an integral part of this statement.
Annual Report 2016
17
COLUMBIA LARGE CAP GROWTH FUND III
The following tables are intended to help you understand the Fund's financial performance. Certain information reflects financial results for a single share of a class held for the periods shown. Per share net investment income (loss) amounts are calculated based on average shares outstanding during the period. Total return assumes reinvestment of all dividends and distributions, if any. Total return does not reflect payment of sales charges, if any. Total return and portfolio turnover are not annualized for periods of less than one year. The portfolio turnover rate is calculated without regard to purchase and sales transactions of short-term instruments and certain derivatives, if any. If such transactions were included, the Fund's portfolio turnover rate may be higher.
| | | Year Ended
February 29, | | Year Ended February 28, | | Year Ended
February 29, | |
Class A | | 2016 | | 2015 | | 2014 | | 2013 | | 2012 | |
Per share data | |
Net asset value, beginning of period | | $ | 20.50 | | | $ | 21.22 | | | $ | 20.84 | | | $ | 24.18 | | | $ | 23.53 | | |
Income from investment operations: | |
Net investment income (loss) | | | (0.09 | ) | | | (0.05 | ) | | | (0.02 | ) | | | 0.06 | | | | 0.02 | | |
Net realized and unrealized gain (loss) | | | (1.73 | ) | | | 2.41 | | | | 6.50 | | | | 1.28 | | | | 0.95 | | |
Total from investment operations | | | (1.82 | ) | | | 2.36 | | | | 6.48 | | | | 1.34 | | | | 0.97 | | |
Less distributions to shareholders: | |
Net investment income | | | — | | | | — | | | | — | | | | (0.11 | ) | | | (0.01 | ) | |
Net realized gains | | | (3.81 | ) | | | (3.08 | ) | | | (6.10 | ) | | | (4.57 | ) | | | (0.31 | ) | |
Total distributions to shareholders | | | (3.81 | ) | | | (3.08 | ) | | | (6.10 | ) | | | (4.68 | ) | | | (0.32 | ) | |
Net asset value, end of period | | $ | 14.87 | | | $ | 20.50 | | | $ | 21.22 | | | $ | 20.84 | | | $ | 24.18 | | |
Total return | | | (11.07 | %) | | | 12.29 | % | | | 34.77 | % | | | 6.84 | % | | | 4.26 | % | |
Ratios to average net assets(a) | |
Total gross expenses | | | 1.24 | %(b) | | | 1.22 | %(b) | | | 1.21 | %(b) | | | 1.34 | % | | | 1.36 | % | |
Total net expenses(c) | | | 1.22 | %(b)(d) | | | 1.22 | %(b)(d) | | | 1.21 | %(b)(d) | | | 1.29 | %(d) | | | 1.36 | %(d) | |
Net investment income (loss) | | | (0.46 | %) | | | (0.23 | %) | | | (0.07 | %) | | | 0.28 | % | | | 0.09 | % | |
Supplemental data | |
Net assets, end of period (in thousands) | | $ | 356,035 | | | $ | 543,323 | | | $ | 598,791 | | | $ | 932,546 | | | $ | 1,137,240 | | |
Portfolio turnover | | | 102 | % | | | 53 | % | | | 95 | % | | | 76 | % | | | 90 | % | |
Notes to Financial Highlights
(a) In addition to the fees and expenses that the Fund bears directly, the Fund indirectly bears a pro rata share of the fees and expenses of any other funds in which it invests. Such indirect expenses are not included in the Fund's reported expense ratios.
(b) Ratios include line of credit interest expense which is less than 0.01%.
(c) Total net expenses include the impact of certain fee waivers/expense reimbursements made by the Investment Manager and certain of its affiliates, if applicable.
(d) The benefits derived from expense reductions had an impact of less than 0.01%.
The accompanying Notes to Financial Statements are an integral part of this statement.
Annual Report 2016
18
COLUMBIA LARGE CAP GROWTH FUND III
FINANCIAL HIGHLIGHTS (continued)
| | | Year Ended
February 29, | | Year Ended February 28, | | Year Ended
February 29, | |
Class B | | 2016 | | 2015 | | 2014 | | 2013 | | 2012 | |
Per share data | |
Net asset value, beginning of period | | $ | 16.70 | | | $ | 17.84 | | | $ | 18.35 | | | $ | 21.88 | | | $ | 21.48 | | |
Income from investment operations: | |
Net investment loss | | | (0.19 | ) | | | (0.16 | ) | | | (0.16 | ) | | | (0.09 | ) | | | (0.15 | ) | |
Net realized and unrealized gain (loss) | | | (1.32 | ) | | | 1.98 | | | | 5.61 | | | | 1.13 | | | | 0.86 | | |
Total from investment operations | | | (1.51 | ) | | | 1.82 | | | | 5.45 | | | | 1.04 | | | | 0.71 | | |
Less distributions to shareholders: | |
Net realized gains | | | (3.78 | ) | | | (2.96 | ) | | | (5.96 | ) | | | (4.57 | ) | | | (0.31 | ) | |
Total distributions to shareholders | | | (3.78 | ) | | | (2.96 | ) | | | (5.96 | ) | | | (4.57 | ) | | | (0.31 | ) | |
Net asset value, end of period | | $ | 11.41 | | | $ | 16.70 | | | $ | 17.84 | | | $ | 18.35 | | | $ | 21.88 | | |
Total return | | | (11.72 | %) | | | 11.48 | % | | | 33.71 | % | | | 6.09 | % | | | 3.44 | % | |
Ratios to average net assets(a) | |
Total gross expenses | | | 1.98 | %(b) | | | 1.97 | %(b) | | | 1.96 | %(b) | | | 2.09 | % | | | 2.12 | % | |
Total net expenses(c) | | | 1.97 | %(b)(d) | | | 1.97 | %(b)(d) | | | 1.96 | %(b)(d) | | | 2.04 | %(d) | | | 2.12 | %(d) | |
Net investment loss | | | (1.22 | %) | | | (0.98 | %) | | | (0.84 | %) | | | (0.46 | %) | | | (0.70 | %) | |
Supplemental data | |
Net assets, end of period (in thousands) | | $ | 1,877 | | | $ | 6,310 | | | $ | 10,640 | | | $ | 14,818 | | | $ | 23,745 | | |
Portfolio turnover | | | 102 | % | | | 53 | % | | | 95 | % | | | 76 | % | | | 90 | % | |
Notes to Financial Highlights
(a) In addition to the fees and expenses that the Fund bears directly, the Fund indirectly bears a pro rata share of the fees and expenses of any other funds in which it invests. Such indirect expenses are not included in the Fund's reported expense ratios.
(b) Ratios include line of credit interest expense which is less than 0.01%.
(c) Total net expenses include the impact of certain fee waivers/expense reimbursements made by the Investment Manager and certain of its affiliates, if applicable.
(d) The benefits derived from expense reductions had an impact of less than 0.01%.
The accompanying Notes to Financial Statements are an integral part of this statement.
Annual Report 2016
19
COLUMBIA LARGE CAP GROWTH FUND III
FINANCIAL HIGHLIGHTS (continued)
| | | Year Ended
February 29, | | Year Ended February 28, | | Year Ended
February 29, | |
Class C | | 2016 | | 2015 | | 2014 | | 2013 | | 2012 | |
Per share data | |
Net asset value, beginning of period | | $ | 16.81 | | | $ | 17.94 | | | $ | 18.42 | | | $ | 21.96 | | | $ | 21.55 | | |
Income from investment operations: | |
Net investment loss | | | (0.18 | ) | | | (0.16 | ) | | | (0.16 | ) | | | (0.10 | ) | | | (0.14 | ) | |
Net realized and unrealized gain (loss) | | | (1.34 | ) | | | 1.99 | | | | 5.64 | | | | 1.13 | | | | 0.86 | | |
Total from investment operations | | | (1.52 | ) | | | 1.83 | | | | 5.48 | | | | 1.03 | | | | 0.72 | | |
Less distributions to shareholders: | |
Net realized gains | | | (3.78 | ) | | | (2.96 | ) | | | (5.96 | ) | | | (4.57 | ) | | | (0.31 | ) | |
Total distributions to shareholders | | | (3.78 | ) | | | (2.96 | ) | | | (5.96 | ) | | | (4.57 | ) | | | (0.31 | ) | |
Net asset value, end of period | | $ | 11.51 | | | $ | 16.81 | | | $ | 17.94 | | | $ | 18.42 | | | $ | 21.96 | | |
Total return | | | (11.70 | %) | | | 11.47 | % | | | 33.75 | % | | | 6.02 | % | | | 3.47 | % | |
Ratios to average net assets(a) | |
Total gross expenses | | | 1.99 | %(b) | | | 1.97 | %(b) | | | 1.96 | %(b) | | | 2.09 | % | | | 2.11 | % | |
Total net expenses(c) | | | 1.97 | %(b)(d) | | | 1.97 | %(b)(d) | | | 1.96 | %(b)(d) | | | 2.04 | %(d) | | | 2.11 | %(d) | |
Net investment loss | | | (1.21 | %) | | | (0.98 | %) | | | (0.85 | %) | | | (0.47 | %) | | | (0.66 | %) | |
Supplemental data | |
Net assets, end of period (in thousands) | | $ | 148,420 | | | $ | 227,979 | | | $ | 246,747 | | | $ | 225,678 | | | $ | 262,048 | | |
Portfolio turnover | | | 102 | % | | | 53 | % | | | 95 | % | | | 76 | % | | | 90 | % | |
Notes to Financial Highlights
(a) In addition to the fees and expenses that the Fund bears directly, the Fund indirectly bears a pro rata share of the fees and expenses of any other funds in which it invests. Such indirect expenses are not included in the Fund's reported expense ratios.
(b) Ratios include line of credit interest expense which is less than 0.01%.
(c) Total net expenses include the impact of certain fee waivers/expense reimbursements made by the Investment Manager and certain of its affiliates, if applicable.
(d) The benefits derived from expense reductions had an impact of less than 0.01%.
The accompanying Notes to Financial Statements are an integral part of this statement.
Annual Report 2016
20
COLUMBIA LARGE CAP GROWTH FUND III
FINANCIAL HIGHLIGHTS (continued)
| | | Year Ended
February 29, | | Year Ended February 28, | | Year Ended
February 29, | |
Class I | | 2016 | | 2015 | | 2014 | | 2013 | | 2012 | |
Per share data | |
Net asset value, beginning of period | | $ | 21.62 | | | $ | 22.18 | | | $ | 21.53 | | | $ | 24.81 | | | $ | 24.04 | | |
Income from investment operations: | |
Net investment income | | | 0.01 | | | | 0.06 | | | | 0.09 | | | | 0.17 | | | | 0.10 | | |
Net realized and unrealized gain (loss) | | | (1.87 | ) | | | 2.55 | | | | 6.74 | | | | 1.32 | | | | 1.07 | | |
Total from investment operations | | | (1.86 | ) | | | 2.61 | | | | 6.83 | | | | 1.49 | | | | 1.17 | | |
Less distributions to shareholders: | |
Net investment income | | | — | | | | — | | | | — | | | | (0.20 | ) | | | (0.09 | ) | |
Net realized gains | | | (3.82 | ) | | | (3.17 | ) | | | (6.18 | ) | | | (4.57 | ) | | | (0.31 | ) | |
Total distributions to shareholders | | | (3.82 | ) | | | (3.17 | ) | | | (6.18 | ) | | | (4.77 | ) | | | (0.40 | ) | |
Net asset value, end of period | | $ | 15.94 | | | $ | 21.62 | | | $ | 22.18 | | | $ | 21.53 | | | $ | 24.81 | | |
Total return | | | (10.63 | %) | | | 12.91 | % | | | 35.39 | % | | | 7.29 | % | | | 5.04 | % | |
Ratios to average net assets(a) | |
Total gross expenses | | | 0.73 | %(b) | | | 0.71 | %(b) | | | 0.73 | %(b) | | | 0.88 | % | | | 0.91 | % | |
Total net expenses(c) | | | 0.73 | %(b) | | | 0.71 | %(b) | | | 0.73 | %(b) | | | 0.86 | % | | | 0.91 | %(d) | |
Net investment income | | | 0.03 | % | | | 0.28 | % | | | 0.40 | % | | | 0.71 | % | | | 0.44 | % | |
Supplemental data | |
Net assets, end of period (in thousands) | | $ | 2 | | | $ | 3 | | | $ | 3 | | | $ | 3 | | | $ | 3 | | |
Portfolio turnover | | | 102 | % | | | 53 | % | | | 95 | % | | | 76 | % | | | 90 | % | |
Notes to Financial Highlights
(a) In addition to the fees and expenses that the Fund bears directly, the Fund indirectly bears a pro rata share of the fees and expenses of any other funds in which it invests. Such indirect expenses are not included in the Fund's reported expense ratios.
(b) Ratios include line of credit interest expense which is less than 0.01%.
(c) Total net expenses include the impact of certain fee waivers/expense reimbursements made by the Investment Manager and certain of its affiliates, if applicable.
(d) The benefits derived from expense reductions had an impact of less than 0.01%.
The accompanying Notes to Financial Statements are an integral part of this statement.
Annual Report 2016
21
COLUMBIA LARGE CAP GROWTH FUND III
FINANCIAL HIGHLIGHTS (continued)
| | | Year Ended
February 29, | | Year Ended February 28, | |
Class R4 | | 2016 | | 2015 | | 2014 | | 2013(a) | |
Per share data | |
Net asset value, beginning of period | | $ | 21.88 | | | $ | 22.42 | | | $ | 21.72 | | | $ | 22.72 | | |
Income from investment operations: | |
Net investment income (loss) | | | (0.05 | ) | | | 0.01 | | | | 0.00 | (b) | | | 0.01 | | |
Net realized and unrealized gain (loss) | | | (1.89 | ) | | | 2.57 | | | | 6.84 | | | | 2.25 | | |
Total from investment operations | | | (1.94 | ) | | | 2.58 | | | | 6.84 | | | | 2.26 | | |
Less distributions to shareholders: | |
Net investment income | | | — | | | | — | | | | — | | | | (0.18 | ) | |
Net realized gains | | | (3.81 | ) | | | (3.12 | ) | | | (6.14 | ) | | | (3.08 | ) | |
Total distributions to shareholders | | | (3.81 | ) | | | (3.12 | ) | | | (6.14 | ) | | | (3.26 | ) | |
Net asset value, end of period | | $ | 16.13 | | | $ | 21.88 | | | $ | 22.42 | | | $ | 21.72 | | |
Total return | | | (10.88 | %) | | | 12.64 | % | | | 35.07 | % | | | 10.88 | % | |
Ratios to average net assets(c) | |
Total gross expenses | | | 0.98 | %(d) | | | 0.98 | %(d) | | | 0.97 | %(d) | | | 1.03 | %(e) | |
Total net expenses(f) | | | 0.97 | %(d)(g) | | | 0.97 | %(d)(g) | | | 0.97 | %(d)(g) | | | 0.99 | %(e) | |
Net investment income (loss) | | | (0.23 | %) | | | 0.03 | % | | | 0.02 | % | | | 0.18 | %(e) | |
Supplemental data | |
Net assets, end of period (in thousands) | | $ | 3,401 | | | $ | 18,848 | | | $ | 5,255 | | | $ | 2 | | |
Portfolio turnover | | | 102 | % | | | 53 | % | | | 95 | % | | | 76 | % | |
Notes to Financial Highlights
(a) Based on operations from November 8, 2012 (commencement of operations) through the stated period end.
(b) Rounds to zero.
(c) In addition to the fees and expenses that the Fund bears directly, the Fund indirectly bears a pro rata share of the fees and expenses of any other funds in which it invests. Such indirect expenses are not included in the Fund's reported expense ratios.
(d) Ratios include line of credit interest expense which is less than 0.01%.
(e) Annualized.
(f) Total net expenses include the impact of certain fee waivers/expense reimbursements made by the Investment Manager and certain of its affiliates, if applicable.
(g) The benefits derived from expense reductions had an impact of less than 0.01%.
The accompanying Notes to Financial Statements are an integral part of this statement.
Annual Report 2016
22
COLUMBIA LARGE CAP GROWTH FUND III
FINANCIAL HIGHLIGHTS (continued)
| | | Year Ended
February 29, | | Year Ended February 28, | |
Class R5 | | 2016 | | 2015 | | 2014(a) | |
Per share data | |
Net asset value, beginning of period | | $ | 21.96 | | | $ | 22.49 | | | $ | 25.48 | | |
Income from investment operations: | |
Net investment income (loss) | | | (0.01 | ) | | | 0.04 | | | | (0.00 | )(b) | |
Net realized and unrealized gain (loss) | | | (1.90 | ) | | | 2.58 | | | | 1.77 | | |
Total from investment operations | | | (1.91 | ) | | | 2.62 | | | | 1.77 | | |
Less distributions to shareholders: | |
Net realized gains | | | (3.82 | ) | | | (3.15 | ) | | | (4.76 | ) | |
Total distributions to shareholders | | | (3.82 | ) | | | (3.15 | ) | | | (4.76 | ) | |
Net asset value, end of period | | $ | 16.23 | | | $ | 21.96 | | | $ | 22.49 | | |
Total return | | | (10.72 | %) | | | 12.77 | % | | | 8.59 | % | |
Ratios to average net assets(c) | |
Total gross expenses | | | 0.83 | %(d) | | | 0.82 | %(d) | | | 0.81 | %(d)(e) | |
Total net expenses(f) | | | 0.83 | %(d) | | | 0.82 | %(d) | | | 0.81 | %(d)(e) | |
Net investment income (loss) | | | (0.07 | %) | | | 0.17 | % | | | (0.02 | %)(e) | |
Supplemental data | |
Net assets, end of period (in thousands) | | $ | 4,934 | | | $ | 8,682 | | | $ | 6,220 | | |
Portfolio turnover | | | 102 | % | | | 53 | % | | | 95 | % | |
Notes to Financial Highlights
(a) Based on operations from December 11, 2013 (commencement of operations) through the stated period end.
(b) Rounds to zero.
(c) In addition to the fees and expenses that the Fund bears directly, the Fund indirectly bears a pro rata share of the fees and expenses of any other funds in which it invests. Such indirect expenses are not included in the Fund's reported expense ratios.
(d) Ratios include line of credit interest expense which is less than 0.01%.
(e) Annualized.
(f) Total net expenses include the impact of certain fee waivers/expense reimbursements made by the Investment Manager and certain of its affiliates, if applicable.
The accompanying Notes to Financial Statements are an integral part of this statement.
Annual Report 2016
23
COLUMBIA LARGE CAP GROWTH FUND III
FINANCIAL HIGHLIGHTS (continued)
| | | Year Ended
February 29, | | Year Ended February 28, | | Year Ended
February 29, | |
Class Z | | 2016 | | 2015 | | 2014 | | 2013 | | 2012 | |
Per share data | |
Net asset value, beginning of period | | $ | 21.44 | | | $ | 22.04 | | | $ | 21.44 | | | $ | 24.73 | | | $ | 24.05 | | |
Income from investment operations: | |
Net investment income (loss) | | | (0.04 | ) | | | 0.01 | | | | 0.04 | | | | 0.13 | | | | 0.08 | | |
Net realized and unrealized gain (loss) | | | (1.85 | ) | | | 2.51 | | | | 6.70 | | | | 1.31 | | | | 0.97 | | |
Total from investment operations | | | (1.89 | ) | | | 2.52 | | | | 6.74 | | | | 1.44 | | | | 1.05 | | |
Less distributions to shareholders: | |
Net investment income | | | — | | | | — | | | | — | | | | (0.16 | ) | | | (0.06 | ) | |
Net realized gains | | | (3.81 | ) | | | (3.12 | ) | | | (6.14 | ) | | | (4.57 | ) | | | (0.31 | ) | |
Total distributions to shareholders | | | (3.81 | ) | | | (3.12 | ) | | | (6.14 | ) | | | (4.73 | ) | | | (0.37 | ) | |
Net asset value, end of period | | $ | 15.74 | | | $ | 21.44 | | | $ | 22.04 | | | $ | 21.44 | | | $ | 24.73 | | |
Total return | | | (10.87 | %) | | | 12.59 | % | | | 35.08 | % | | | 7.12 | % | | | 4.51 | % | |
Ratios to average net assets(a) | |
Total gross expenses | | | 0.98 | %(b) | | | 0.98 | %(b) | | | 0.96 | %(b) | | | 1.09 | % | | | 1.11 | % | |
Total net expenses(c) | | | 0.97 | %(b)(d) | | | 0.97 | %(b)(d) | | | 0.96 | %(b)(d) | | | 1.04 | %(d) | | | 1.11 | %(d) | |
Net investment income (loss) | | | (0.22 | %) | | | 0.03 | % | | | 0.16 | % | | | 0.55 | % | | | 0.34 | % | |
Supplemental data | |
Net assets, end of period (in thousands) | | $ | 129,655 | | | $ | 285,397 | | | $ | 289,882 | | | $ | 404,071 | | | $ | 1,028,756 | | |
Portfolio turnover | | | 102 | % | | | 53 | % | | | 95 | % | | | 76 | % | | | 90 | % | |
Notes to Financial Highlights
(a) In addition to the fees and expenses that the Fund bears directly, the Fund indirectly bears a pro rata share of the fees and expenses of any other funds in which it invests. Such indirect expenses are not included in the Fund's reported expense ratios.
(b) Ratios include line of credit interest expense which is less than 0.01%.
(c) Total net expenses include the impact of certain fee waivers/expense reimbursements made by the Investment Manager and certain of its affiliates, if applicable.
(d) The benefits derived from expense reductions had an impact of less than 0.01%.
The accompanying Notes to Financial Statements are an integral part of this statement.
Annual Report 2016
24
COLUMBIA LARGE CAP GROWTH FUND III
NOTES TO FINANCIAL STATEMENTS
February 29, 2016
Note 1. Organization
Columbia Large Cap Growth Fund III (formerly known as Columbia Marsico Focused Equities Fund) (the Fund), a series of Columbia Funds Series Trust (the Trust), is a non-diversified fund. The Trust is registered under the Investment Company Act of 1940, as amended (the 1940 Act), as an open-end management investment company organized as a Delaware statutory trust. Effective November 20, 2015, Columbia Marsico Focused Equities Fund was renamed Columbia Large Cap Growth Fund III.
Fund Shares
The Trust may issue an unlimited number of shares (without par value). The Fund offers Class A, Class B, Class C, Class I, Class R4, Class R5 and Class Z shares. Although all share classes generally have identical voting, dividend and liquidation rights, each share class votes separately when required by the Trust's organizational documents or by law. Different share classes pay different distribution amounts to the extent the expenses of such share classes differ, and distributions in liquidation will be proportional to the net asset value of each share class. Each share class has its own expense and sales charge structure.
Class A shares are subject to a maximum front-end sales charge of 5.75% based on the initial investment amount. Class A shares purchased without an initial sales charge in accounts aggregating $1 million to $50 million at the time of purchase are subject to a contingent deferred sales charge (CDSC) if the shares are sold within 18 months after purchase, charged as follows: 1.00% CDSC if redeemed within 12 months after purchase, and 0.50% CDSC if redeemed more than 12, but less than 18, months after purchase.
Class B shares may be subject to a maximum CDSC of 5.00% based upon the holding period after purchase. Class B shares will generally convert to Class A shares eight years after purchase. The Fund no longer accepts investments by new or existing investors in the Fund's Class B shares, except in connection with the reinvestment of any dividend and/or capital gain distributions in Class B shares of the Fund and exchanges by existing Class B shareholders of certain other funds within the Columbia Family of Funds.
Class C shares are subject to a 1.00% CDSC on shares redeemed within 12 months after purchase.
Class I shares are not subject to sales charges and are available only to the Columbia Family of Funds.
Class R4 shares are not subject to sales charges and are generally available only to omnibus retirement plans and certain investors as described in the Fund's prospectus.
Class R5 shares are not subject to sales charges and are generally available only to investors purchasing through authorized investment professionals and omnibus retirement plans.
Class Z shares are not subject to sales charges and are available only to eligible investors, which are subject to different investment minimums as described in the Fund's prospectus.
Note 2. Summary of Significant Accounting Policies
Basis of Preparation
The Fund is an investment company that applies the accounting and reporting guidance in the Financial Accounting Standards Board (FASB) Accounting Standards Codification Topic 946, Financial Services — Investment Companies (ASC 946). The financial statements are prepared in accordance with U.S. generally accepted accounting principles (GAAP), which requires management to make certain estimates and assumptions that affect the reported amounts of assets and liabilities, the disclosure of contingent assets and liabilities at the date of the financial statements and the reported amounts of income and expenses during the reporting period. Actual results could differ from those estimates.
The following is a summary of significant accounting policies followed by the Fund in the preparation of its financial statements.
Security Valuation
All equity securities and exchange-traded funds are valued at the close of business of the New York Stock Exchange (NYSE). Equity securities and exchange-traded funds are valued at the last quoted sales price on the principal exchange or market on which they trade, except for securities traded on the NASDAQ Stock Market, which are valued at the NASDAQ official close price. Unlisted securities or listed securities for which there were no sales during the day are valued at the mean of the latest quoted bid and ask prices on such exchanges or markets.
Foreign equity securities are valued based on the closing price on the foreign exchange in which such securities are primarily traded. If any foreign equity security closing
Annual Report 2016
25
COLUMBIA LARGE CAP GROWTH FUND III
NOTES TO FINANCIAL STATEMENTS (continued)
February 29, 2016
prices are not readily available, the securities are valued at the mean of the latest quoted bid and ask prices on such exchanges or markets. Foreign currency exchange rates are generally determined at 4:00 p.m. Eastern (U.S.) time. Many securities markets and exchanges outside the U.S. close prior to the close of the NYSE; therefore, the closing prices for securities in such markets or on such exchanges may not fully reflect events that occur after such close but before the close of the NYSE. In those situations, foreign securities will be fair valued pursuant to a policy adopted by the Board of Trustees (the Board), including, if available, utilizing a third party pricing service to determine these fair values. The third party pricing service takes into account multiple factors, including, but not limited to, movements in the U.S. securities markets, certain depositary receipts, futures contracts and foreign exchange rates that have occurred subsequent to the close of the foreign exchange or market, to determine a good faith estimate that reasonably reflects the current market conditions as of the close of the NYSE. The fair value of a security is likely to be different from the quoted or published price, if available.
Investments in open-end investment companies, including money market funds, are valued at their latest net asset value.
Investments for which market quotations are not readily available, or that have quotations which management believes are not reflective of market value or reliable, are valued at fair value as determined in good faith under procedures approved by and under the general supervision of the Board. If a security or class of securities (such as foreign securities) is valued at fair value, such value is likely to be different from the quoted or published price for the security.
The determination of fair value often requires significant judgment. To determine fair value, management may use assumptions including but not limited to future cash flows and estimated risk premiums. Multiple inputs from various sources may be used to determine fair value.
GAAP requires disclosure regarding the inputs and valuation techniques used to measure fair value and any changes in valuation inputs or techniques. In addition, investments shall be disclosed by major category. This information is disclosed following the Fund's Portfolio of Investments.
Foreign Currency Transactions and Translations
The values of all assets and liabilities denominated in foreign currencies are generally translated into U.S. dollars at exchange rates determined at the close of the NYSE on any given day. Net realized and unrealized gains (losses) on foreign currency transactions and translations include gains (losses) arising from the fluctuation in exchange rates between trade and settlement dates on securities transactions, gains (losses) arising from the disposition of foreign currency and currency gains (losses) between the accrual and payment dates on dividends, interest income and foreign withholding taxes.
For financial statement purposes, the Fund does not distinguish that portion of gains (losses) on investments which is due to changes in foreign exchange rates from that which is due to changes in market prices of the investments. Such fluctuations are included with the net realized and unrealized gains (losses) on investments in the Statement of Operations.
Security Transactions
Security transactions are accounted for on the trade date. Cost is determined and gains (losses) are based upon the specific identification method for both financial statement and federal income tax purposes.
Income Recognition
Corporate actions and dividend income are generally recorded net of any non-reclaimable tax withholdings, on the ex-dividend date or upon receipt of ex-dividend notification in the case of certain foreign securities.
The Fund may receive distributions from holdings in equity securities, business development companies (BDCs), exchange-traded funds, other regulated investment companies (RICs), and real estate investment trusts (REITs), which report information on the tax character of their distributions annually. These distributions are allocated to dividend income, capital gain and return of capital based on actual information reported. Return of capital is recorded as a reduction of the cost basis of securities held. If the Fund no longer owns the applicable securities, return of capital is recorded as a realized gain. With respect to REITs, to the extent actual information has not yet been reported, estimates for return of capital are made by the Fund's management. Management's estimates are subsequently adjusted when the actual character of the distributions is disclosed by the REITs, which could result
Annual Report 2016
26
COLUMBIA LARGE CAP GROWTH FUND III
NOTES TO FINANCIAL STATEMENTS (continued)
February 29, 2016
in a proportionate change in return of capital to shareholders.
Awards from class action litigation are recorded as a reduction of cost basis if the Fund still owns the applicable securities on the payment date. If the Fund no longer owns the applicable securities, the proceeds are recorded as realized gains.
Expenses
General expenses of the Trust are allocated to the Fund and other funds of the Trust based upon relative net assets or other expense allocation methodologies determined by the nature of the expense. Expenses directly attributable to the Fund are charged to the Fund. Expenses directly attributable to a specific class of shares are charged to that share class.
Determination of Class Net Asset Value
All income, expenses (other than class-specific expenses, which are charged to that share class, as shown in the Statement of Operations) and realized and unrealized gains (losses) are allocated to each class of the Fund on a daily basis, based on the relative net assets of each class, for purposes of determining the net asset value of each class.
Federal Income Tax Status
The Fund intends to qualify each year as a regulated investment company under Subchapter M of the Internal Revenue Code, as amended, and will distribute substantially all of its taxable income (including net short-term capital gains), if any, for its tax year, and as such will not be subject to federal income taxes. In addition, the Fund intends to distribute in each calendar year substantially all of its net investment income, capital gains and certain other amounts, if any, such that the Fund should not be subject to federal excise tax. Therefore, no federal income or excise tax provision is recorded.
Foreign Taxes
The Fund may be subject to foreign taxes on income, gains on investments or currency repatriation, a portion of which may be recoverable. The Fund will accrue such taxes and recoveries, as applicable, based upon its current interpretation of tax rules and regulations that exist in the markets in which it invests.
Realized gains in certain countries may be subject to foreign taxes at the Fund level, based on statutory rates. The Fund accrues for such foreign taxes on realized and unrealized gains at the appropriate rate for each
jurisdiction, as applicable. The amount, if any, is disclosed as a liability on the Statement of Assets and Liabilities.
Distributions to Shareholders
Distributions from net investment income, if any, are declared and paid semi-annually. Net realized capital gains, if any, are distributed at least annually. Income distributions and capital gain distributions are determined in accordance with federal income tax regulations, which may differ from GAAP.
Guarantees and Indemnifications
Under the Trust's organizational documents and, in some cases, by contract, its officers and trustees are indemnified against certain liabilities arising out of the performance of their duties to the Trust or its funds. In addition, certain of the Fund's contracts with its service providers contain general indemnification clauses. The Fund's maximum exposure under these arrangements is unknown since the amount of any future claims that may be made against the Fund cannot be determined, and the Fund has no historical basis for predicting the likelihood of any such claims.
Recent Accounting Pronouncement
Fair Value Measurement (Topic 820), Disclosure for Investments in Certain Entities That Calculate Net Asset Value per Share (or Its Equivalent)
In May 2015, FASB issued Accounting Standards Update (ASU) No. 2015-07, Fair Value Measurement (Topic 820), Disclosure for Investments in Certain Entities That Calculate Net Asset Value per Share (or Its Equivalent). ASU No. 2015-07 changes the disclosure requirements for investments for which fair value is measured using the net asset value per share practical expedient. The disclosure requirements are effective for annual periods beginning after December 15, 2015 and interim periods within those fiscal years. At this time, management is evaluating the implications of this guidance and the impact it will have on the financial statement amounts and footnote disclosures, if any.
Note 3. Fees and Other Transactions with Affiliates
Management Fees
Effective July 1, 2015, the Fund entered into a Management Agreement with Columbia Management Investment Advisers, LLC (the Investment Manager), a wholly-owned subsidiary of Ameriprise Financial, Inc.
Annual Report 2016
27
COLUMBIA LARGE CAP GROWTH FUND III
NOTES TO FINANCIAL STATEMENTS (continued)
February 29, 2016
(Ameriprise Financial). Under the Management Agreement, the Investment Manager provides the Fund with investment research and advice, as well as administrative and accounting services. The management services fee is an annual fee that is equal to a percentage of the Fund's average daily net assets that declines from 0.77% to 0.57% as the Fund's net assets increase. The effective management services fee rate for the year ended February 29, 2016 was 0.75% of the Fund's average daily net assets.
Prior to July 1, 2015, the Fund paid the Investment Manager an annual fee for advisory services under an Investment Management Services Agreement and a separate annual fee for administrative and accounting services under an Administrative Services Agreement. For the period from March 1, 2015 through June 30, 2015, the investment advisory services fee paid to the Investment Manager was $2,426,665, and the administrative services fee paid to the Investment Manager was $202,628.
Subadvisory Agreement
Prior to November 20, 2015, the Investment Manager entered into a Subadvisory Agreement with Marsico Capital Management, LLC (Marsico) to serve as the subadviser to the Fund. The Investment Manager compensated Marsico to manage the investment of the Fund's assets. Effective November 20, 2015, Marsico no longer serves as the subadviser to the Fund and the Investment Manager has assumed the day-to-day portfolio management of the Fund.
Other Expenses
Other expenses are for, among other things, miscellaneous expenses of the Fund or the Board, including payments to Board Services Corp., a company providing limited administrative services to the Fund and the Board. That company's expenses include boardroom and office expense, employee compensation, employee health and retirement benefits, and certain other expenses. For the year ended February 29, 2016, other expenses paid by the Fund to this company were $2,817.
Compensation of Board Members
Board members, who are not officers or employees of the Investment Manager or Ameriprise Financial, are compensated for their services to the Fund as disclosed in the Statement of Operations. Under a Deferred Compensation Plan (the Plan), these Board members may elect to defer payment of up to 100% of their
compensation. Deferred amounts are treated as though equivalent dollar amounts had been invested in shares of certain funds managed by the Investment Manager. The Fund's liability for these amounts is adjusted for market value changes and remains in the Fund until distributed in accordance with the Plan. All amounts payable under the Plan constitute a general unsecured obligation of the Fund.
Transfer Agency Fees
Under a Transfer and Dividend Disbursing Agent Agreement, Columbia Management Investment Services Corp. (the Transfer Agent), an affiliate of the Investment Manager and a wholly-owned subsidiary of Ameriprise Financial, is responsible for providing transfer agency services to the Fund. The Transfer Agent has contracted with Boston Financial Data Services (BFDS) to serve as sub-transfer agent.
The Transfer Agent receives a monthly transfer agency fee based on the number or the average value of accounts, depending on the type of account. In addition, the Transfer Agent also receives sub-transfer agency fees based on a percentage of the average aggregate value of the Fund's shares maintained in omnibus accounts (other than omnibus accounts for which American Enterprise Investment Services Inc. is the broker of record or accounts where the beneficial shareholder is a customer of Ameriprise Financial Services, Inc., for which the Transfer Agent receives a per account fee). The Transfer Agent pays the fees of BFDS for services as sub-transfer agent and is not entitled to reimbursement for such fees from the Fund (with the exception of out-of-pocket fees).
The Transfer Agent also receives compensation from the Fund for various shareholder services and reimbursements for certain out-of-pocket fees. Class I shares do not pay transfer agency fees. Total transfer agency fees for Class R5 shares are subject to an annual limitation of not more than 0.05% of the average daily net assets attributable to Class R5 shares.
For the year ended February 29, 2016, the Fund's effective transfer agency fee rates as a percentage of average daily net assets of each class were as follows:
Class A | | | 0.20 | % | |
Class B | | | 0.20 | | |
Class C | | | 0.20 | | |
Class R4 | | | 0.20 | | |
Class R5 | | | 0.05 | | |
Class Z | | | 0.20 | | |
Annual Report 2016
28
COLUMBIA LARGE CAP GROWTH FUND III
NOTES TO FINANCIAL STATEMENTS (continued)
February 29, 2016
An annual minimum account balance fee of $20 may apply to certain accounts with a value below the applicable share class's initial minimum investment requirements to reduce the impact of small accounts on transfer agency fees. These minimum account balance fees are remitted to the Fund and recorded as part of expense reductions in the Statement of Operations. For the year ended February 29, 2016, these minimum account balance fees reduced total expenses of the Fund by $1,400.
Distribution and Service Fees
The Fund has an agreement with Columbia Management Investment Distributors, Inc. (the Distributor), an affiliate of the Investment Manager and a wholly-owned subsidiary of Ameriprise Financial, for distribution and shareholder services. The Board has approved, and the Fund has adopted, distribution and shareholder service plans (the Plans) applicable to certain share classes, which set the distribution and service fees for the Fund. These fees are calculated daily and are intended to compensate the Distributor and/or eligible selling and/or servicing agents for selling shares of the Fund and providing services to investors.
Under the Plans, the Fund pays a monthly combined distribution and service fee to the Distributor at the maximum annual rate of 0.25% of the average daily net assets attributable to Class A shares of the Fund. Also under the Plans, the Fund pays a monthly service fee at the maximum annual rate of 0.25% of the average daily net assets attributable to Class B and Class C shares of the Fund and a monthly distribution fee at the maximum annual rate of 0.75% of the average daily net assets attributable to Class B and Class C shares of the Fund.
Sales Charges
Sales charges, including front-end charges and CDSCs, received by the Distributor for distributing Fund shares were $159,866 for Class A, $287 for Class B and $4,162 for Class C shares for the year ended February 29, 2016.
Expenses Waived/Reimbursed by the Investment Manager and its Affiliates
The Fund's expense ratio is subject to an expense reimbursement arrangement pursuant to which fees will be waived and/or expenses reimbursed (excluding certain fees and expenses described below), so that the Fund's net operating expenses, after giving effect to fees waived/expenses reimbursed and any balance credits
and/or overdraft charges from the Fund's custodian, do not exceed the annual rates of:
| | | Contractual
Expense Cap
July 1, 2015
Through
June 30, 2016 | | Voluntary
Expense Cap
Prior to
July 1, 2015 | |
Class A | | | 1.22 | % | | | 1.22 | % | |
Class B | | | 1.97 | | | | 1.97 | | |
Class C | | | 1.97 | | | | 1.97 | | |
Class I | | | 0.81 | | | | 0.82 | | |
Class R4 | | | 0.97 | | | | 0.97 | | |
Class R5 | | | 0.86 | | | | 0.87 | | |
Class Z | | | 0.97 | | | | 0.97 | | |
The contractual agreement may be modified or amended only with approval from the Investment Manager, certain of its affiliates and the Fund. Under the arrangements, the following fees and expenses are excluded from the waiver/reimbursement commitment, and therefore will be paid by the Fund, if applicable: taxes (including foreign transaction taxes), expenses associated with investments in affiliated and non-affiliated pooled investment vehicles (including mutual funds and exchange-traded funds), transaction costs and brokerage commissions, costs related to any securities lending program, dividend and interest expenses associated with securities sold short, inverse floater program fees and expenses, transaction charges and interest on borrowed money, interest and extraordinary expenses. Any fees waived and/or expenses reimbursed under the expense reimbursement arrangements described above are not recoverable by the Investment Manager or its affiliates in future periods.
Note 4. Federal Tax Information
The timing and character of income and capital gain distributions are determined in accordance with income tax regulations, which may differ from GAAP because of temporary or permanent book to tax differences.
At February 29, 2016, these differences are primarily due to differing treatment for deferral/reversal of wash sale losses, Trustees' deferred compensation, foreign currency transactions, net operating loss reclassification, late-year ordinary losses, re-characterization of distributions for investments and earnings and profits distributed to shareholders on the redemption of shares. To the extent these differences are permanent, reclassifications are made among the components of the Fund's net assets in the Statement of Assets and Liabilities. Temporary differences do not require
Annual Report 2016
29
COLUMBIA LARGE CAP GROWTH FUND III
NOTES TO FINANCIAL STATEMENTS (continued)
February 29, 2016
reclassifications. In the Statement of Assets and Liabilities the following reclassifications were made:
Excess of distributions over net investment income | | $ | 4,838,295 | | |
Accumulated net realized gain | | | (33,127,888 | ) | |
Paid-in capital | | | 28,289,593 | | |
Net investment income (loss) and net realized gains (losses), as disclosed in the Statement of Operations, and net assets were not affected by this reclassification.
The tax character of distributions paid during the years indicated was as follows:
Year Ended | | February 29,
2016 | | February 28,
2015 | |
Ordinary income | | $ | 8,560,220 | | | $ | 23,249,494 | | |
Long-term capital gains | | | 176,634,663 | | | | 139,087,240 | | |
Total | | | 185,194,883 | | | | 162,336,734 | | |
Short-term capital gain distributions, if any, are considered ordinary income distributions for tax purposes.
At February 29, 2016, the components of distributable earnings on a tax basis were as follows:
Undistributed long-term capital gains | | $ | 76,521,037 | | |
Net unrealized appreciation | | | 19,492,947 | | |
At February 29, 2016, the cost of investments for federal income tax purposes was $631,664,854 and the aggregate gross unrealized appreciation and depreciation based on that cost was:
Unrealized appreciation | | $ | 58,163,522 | | |
Unrealized depreciation | | | (38,670,575 | ) | |
Net unrealized appreciation | | $ | 19,492,947 | | |
Under current tax rules, regulated investment companies can elect to treat certain late-year ordinary losses incurred and post-October capital losses (capital losses realized after October 31) as arising on the first day of the following taxable year. As of February 29, 2016, the Fund will elect to treat late-year ordinary losses of $367,073 as arising on March 1, 2016.
Management of the Fund has concluded that there are no significant uncertain tax positions in the Fund that would require recognition in the financial statements. However, management's conclusion may be subject to review and adjustment at a later date based on factors including, but not limited to, new tax laws, regulations, and administrative interpretations (including relevant court decisions). Generally, the Fund's federal tax returns
for the prior three fiscal years remain subject to examination by the Internal Revenue Service.
Note 5. Portfolio Information
The cost of purchases and proceeds from sales of securities, excluding short-term investments and derivatives, if any, aggregated to $918,154,960 and $1,265,173,412, respectively, for the year ended February 29, 2016. The amount of purchase and sale activity impacts the portfolio turnover rate reported in the Financial Highlights.
Note 6. Affiliated Money Market Fund
The Fund invests in Columbia Short-Term Cash Fund, an affiliated money market fund established for the exclusive use by the Fund and other affiliated funds. The income earned by the Fund from such investments is included as Dividends — affiliated issuers in the Statement of Operations. As an investing fund, the Fund indirectly bears its proportionate share of the expenses of Columbia Short-Term Cash Fund.
Note 7. Line of Credit
The Fund has access to a revolving credit facility whereby the Fund may borrow for the temporary funding of shareholder redemptions or for other temporary or emergency purposes. Effective December 8, 2015, Citibank, N.A. and HSBC Bank USA, N.A. joined JPMorgan Chase Bank, N.A. (JPMorgan) as lead of a syndicate of banks under the credit facility, which is a collective agreement between the Fund and certain other funds managed by the Investment Manager, severally and not jointly, that permits collective borrowings up to $1 billion. Interest is charged to each participating fund based on its borrowings at a rate equal to the higher of (i) the overnight federal funds rate plus 1.00% or (ii) the one-month LIBOR rate plus 1.00%. Each borrowing under the credit facility matures no later than 60 days after the date of borrowing. The Fund also pays a commitment fee equal to its pro rata share of the amount of the credit facility at a rate of 0.15% per annum. The commitment fee is included in other expenses in the Statement of Operations. Prior to December 8, 2015, JPMorgan was the sole lead bank under the credit facility agreement that permitted borrowings up to $550 million under the same terms and interest rates as described above with the exception of the commitment fee which was charged at a rate of 0.075% per annum.
For the year ended February 29, 2016, the average daily loan balance outstanding on days when borrowing
Annual Report 2016
30
COLUMBIA LARGE CAP GROWTH FUND III
NOTES TO FINANCIAL STATEMENTS (continued)
February 29, 2016
existed was $3,600,000 at a weighted average interest rate of 1.19%. Interest expense incurred by the Fund is recorded as a line of credit interest expense in the Statement of Operations. The Fund had no outstanding borrowings at February 29, 2016.
Note 8. Significant Risks
Shareholder Concentration Risk
At February 29, 2016, one unaffiliated shareholder of record owned 37.3% of the outstanding shares of the Fund in one or more accounts. The Fund has no knowledge about whether any portion of those shares was owned beneficially. Subscription and redemption activity by concentrated accounts may have a significant effect on the operations of the Fund. In the case of a large redemption, the Fund may be forced to sell investments at inopportune times, including its liquid or more liquid positions, resulting in Fund losses and the Fund holding a higher percentage of less liquid or illiquid securities. Large redemptions could result in decreased economies of scale and increased operating expenses for non-redeeming Fund shareholders.
Consumer Discretionary Sector Risk
The Fund may be more susceptible to the particular risks that may affect companies in the consumer discretionary sector than if it were invested in a wider variety of companies in unrelated sectors. Companies in the consumer discretionary sector are subject to certain risks, including fluctuations in the performance of the overall domestic and international economy, interest rate changes, increased competition and consumer confidence. Performance of such companies may be affected by factors including reduced disposable household income, reduced consumer spending, changing demographics and consumer tastes.
Technology and Technology-related Investment Risk
The Fund may be more susceptible to the particular risks that may affect companies in the information technology sector, as well as other technology-related sectors (collectively, the technology sectors) than if it were invested in a wider variety of companies in unrelated sectors. Companies in the technology sectors are subject to certain risks, including the risk that new services, equipment or technologies will not be accepted by consumers and businesses or will become rapidly obsolete. Performance of such companies may be affected by factors including obtaining and protecting patents (or the failure to do so) and significant competitive pressures, including aggressive pricing of
their products or services, new market entrants, competition for market share and short product cycles due to an accelerated rate of technological developments. Such competitive pressures may lead to limited earnings and/or falling profit margins. As a result, the value of their securities may fall or fail to rise. In addition, many technology sector companies have limited operating histories and prices of these companies' securities historically have been more volatile than other securities, especially over the short term.
Non-Diversification Risk
A non-diversified fund is permitted to invest a greater percentage of its total assets in fewer issuers than a diversified fund. The Fund may, therefore, have a greater risk of loss from a few issuers than a similar fund that invests more broadly.
Note 9. Subsequent Events
Management has evaluated the events and transactions that have occurred through the date the financial statements were issued. Other than as noted below, there were no items requiring adjustment of the financial statements or additional disclosure.
In December 2015, the Board approved a proposal to merge the Fund into Columbia Large Cap Growth Fund. Shareholders of the Fund will vote on the proposed merger at a special meeting of shareholders to be held during the first half of 2016. If approved by shareholders, the merger is expected to take place shortly thereafter.
Note 10. Information Regarding Pending and Settled Legal Proceedings
In December 2005, without admitting or denying the allegations, American Express Financial Corporation (AEFC, which is now known as Ameriprise Financial, Inc. (Ameriprise Financial)) entered into settlement agreements with the Securities and Exchange Commission (SEC) and Minnesota Department of Commerce (MDOC) related to market timing activities. As a result, AEFC was censured and ordered to cease and desist from committing or causing any violations of certain provisions of the Investment Advisers Act of 1940, the Investment Company Act of 1940, and various Minnesota laws. AEFC agreed to pay disgorgement of $10 million and civil money penalties of $7 million. AEFC also agreed to retain an independent distribution consultant to assist in developing a plan for distribution of all disgorgement and civil penalties ordered by the SEC in accordance with various undertakings detailed at
Annual Report 2016
31
COLUMBIA LARGE CAP GROWTH FUND III
NOTES TO FINANCIAL STATEMENTS (continued)
February 29, 2016
http://www.sec.gov/litigation/admin/ia-2451.pdf. Ameriprise Financial and its affiliates have cooperated with the SEC and the MDOC in these legal proceedings, and have made regular reports to the Funds' Boards of Trustees.
Ameriprise Financial and certain of its affiliates have historically been involved in a number of legal, arbitration and regulatory proceedings, including routine litigation, class actions, and governmental actions, concerning matters arising in connection with the conduct of their business activities. Ameriprise Financial believes that the Funds are not currently the subject of, and that neither Ameriprise Financial nor any of its affiliates are the subject of, any pending legal, arbitration or regulatory proceedings that are likely to have a material adverse effect on the Funds or the ability of Ameriprise Financial or its affiliates to perform under their contracts with the Funds. Ameriprise Financial is required to make quarterly (10-Q), annual (10-K) and, as necessary, 8-K filings with the SEC on legal and regulatory matters that relate to Ameriprise Financial and its affiliates. Copies of these filings may be obtained by accessing the SEC website at www.sec.gov.
There can be no assurance that these matters, or the adverse publicity associated with them, will not result in increased fund redemptions, reduced sale of fund shares or other adverse consequences to the Funds. Further, although we believe proceedings are not likely to have a material adverse effect on the Funds or the ability of Ameriprise Financial or its affiliates to perform under their contracts with the Funds, these proceedings are subject to uncertainties and, as such, we are unable to estimate the possible loss or range of loss that may result. An adverse outcome in one or more of these proceedings could result in adverse judgments, settlements, fines, penalties or other relief that could have a material adverse effect on the consolidated financial condition or results of operations of Ameriprise Financial.
Annual Report 2016
32
COLUMBIA LARGE CAP GROWTH FUND III
REPORT OF INDEPENDENT REGISTERED PUBLIC ACCOUNTING FIRM
To the Trustees of Columbia Funds Series Trust and the Shareholders of
Columbia Large Cap Growth Fund III (formerly known as Columbia Marsico Focused Equities Fund)
In our opinion, the accompanying statement of assets and liabilities, including the portfolio of investments, and the related statements of operations and of changes in net assets and the financial highlights present fairly, in all material respects, the financial position of Columbia Large Cap Growth Fund III (formerly known as Columbia Marsico Focused Equities Fund) (the "Fund," a series of Columbia Funds Series Trust) at February 29, 2016, and the results of its operations, the changes in its net assets and the financial highlights for each of the periods indicated, in conformity with accounting principles generally accepted in the United States of America. These financial statements and financial highlights (hereafter referred to as "financial statements") are the responsibility of the Fund's management. Our responsibility is to express an opinion on these financial statements based on our audits. We conducted our audits of these financial statements in accordance with the standards of the Public Company Accounting Oversight Board (United States). Those standards require that we plan and perform the audit to obtain reasonable assurance about whether the financial statements are free of material misstatement. An audit includes examining, on a test basis, evidence supporting the amounts and disclosures in the financial statements, assessing the accounting principles used and significant estimates made by management, and evaluating the overall financial statement presentation. We believe that our audits, which included confirmation of securities at February 29, 2016 by correspondence with the custodian and transfer agent, provide a reasonable basis for our opinion.
PricewaterhouseCoopers LLP
Minneapolis, MN
April 21, 2016
Annual Report 2016
33
COLUMBIA LARGE CAP GROWTH FUND III
FEDERAL INCOME TAX INFORMATION
(Unaudited)
The Fund hereby designates the following tax attributes for the fiscal year ended February 29, 2016. Shareholders will be notified in early 2017 of the amounts for use in preparing 2016 income tax returns.
Tax Designations
| Qualified Dividend Income | | | 40.10 | % | |
| Dividends Received Deduction | | | 37.68 | % | |
Capital Gain Dividend | | $ | 250,263,360 | | |
Qualified Dividend Income. For taxable, non-corporate shareholders, the percentage of ordinary income distributed during the fiscal year that represents qualified dividend income subject to reduced tax rates.
Dividends Received Deduction. The percentage of ordinary income distributed during the fiscal year that qualifies for the corporate dividends received deduction.
Capital Gain Dividend. The Fund designates as a capital gain dividend the amount reflected above, or if subsequently determined to be different, the net capital gain of such fiscal period.
Annual Report 2016
34
COLUMBIA LARGE CAP GROWTH FUND III
Shareholders elect the Board that oversees the Fund's operations. The Board appoints officers who are responsible for day-to-day business decisions based on policies set by the Board. The following table provides basic biographical information about the Fund's Trustees, including their principal occupations during the past five years, although specific titles for individuals may have varied over the period. Under current Board policy, members generally may serve through the end of the calendar year in which they reach either the mandatory retirement age established by the Board or the fifteenth anniversary of the first Board meeting they attended as a member of the Board.
Trustees
Independent Trustees
Name,
Address,
Year of Birth | | Position Held With
the Funds and Length of
Service | | Principal Occupation(s)
During the Past Five Years
and Other Relevant
Professional Experience | | Number of
Funds in the
Columbia
Funds Complex
Overseen | | Other Directorships
Held by Trustee
During the Past
Five Years | |
Kathleen Blatz
901 S. Marquette Ave.
Minneapolis, MN 55402
1954 | | Trustee since 1/06 for RiverSource Funds and since 6/11 for Nations Funds | | Attorney; specializing in arbitration and mediation; Chief Justice, Minnesota Supreme Court, 1998-2006; Associate Justice, Minnesota Supreme Court, 1996-1998; Fourth Judicial District Court Judge, Hennepin County, 1994-1996; Attorney in private practice and public service, 1984-1993; State Representative, Minnesota House of Representatives, 1979-1993, which included service on the Tax and Financial Institutions and Insurance Committees | | | 124 | | | Trustee, BlueCross BlueShield of Minnesota (Chair of the Business Development Committee) since 2009; Chair of the Robina Foundation since August 2013 | |
Edward J. Boudreau, Jr.
901 S. Marquette Ave.
Minneapolis, MN 55402
1944 | | Trustee since 6/11 for RiverSource Funds and since 1/05 for Nations Funds | | Managing Director, E.J. Boudreau & Associates (consulting) since 2000; FINRA Industry Arbitrator, 2002-present; Chairman and Chief Executive Officer, John Hancock Funds (asset management), Chairman and Interested Trustee for open-end and closed-end funds offered by John Hancock, 1989-2000; John Hancock Life Insurance Company, including SVP and Treasurer and SVP Information Technology, 1968-1988 | | | 122 | | | Former Trustee, Boston Museum of Science (Chair of Finance Committee), 1985-2013; former Trustee, BofA Funds Series Trust (11 funds), 2005-2011 | |
Pamela G. Carlton
901 S. Marquette Ave.
Minneapolis, MN 55402
1954 | | Trustee since 7/07 for RiverSource Funds and since 6/11 for Nations Funds | | President, Springboard-Partners in Cross Cultural Leadership (consulting company) since 2003; Managing Director of US Equity Research, JP Morgan Chase, 1999-2003; Director of US Equity Research, Chase Asset Management, 1996-1999; Co-Director Latin America Research, 1993-1996, COO Global Research, 1992-1996, Co-Director of US Research, 1991-1992, Investment Banker, Morgan Stanley, 1982-1991 | | | 124 | | | Trustee, New York Presbyterian Hospital Board (Executive Committee and Chair of Human Resources Committee) since 1996 | |
Annual Report 2016
35
COLUMBIA LARGE CAP GROWTH FUND III
TRUSTEES AND OFFICERS (continued)
Independent Trustees (continued)
Name,
Address,
Year of Birth | | Position Held With
the Funds and Length of
Service | | Principal Occupation(s)
During the Past Five Years
and Other Relevant
Professional Experience | | Number of
Funds in the
Columbia
Funds Complex
Overseen | | Other Directorships
Held by Trustee
During the Past
Five Years | |
William P. Carmichael
901 S. Marquette Ave.
Minneapolis, MN 55402
1943 | | Trustee since 6/11 for RiverSource Funds and since 2003 for Nations Funds; Chair of the Board from 1/14-11/15 | | Retired; Co-founder, The Succession Fund (provides exit strategies to owners of privately held companies), 1998-2007; Adjunct Professor of Finance, Kelley School of Business, Indiana University, 1993-2007; Senior Vice President, Sara Lee Corporation, 1991-1993; Senior Vice President and Chief Financial Officer, Beatrice Foods Company, 1984-1990; Vice President, Esmark, Inc., 1973-1984; Associate, Price Waterhouse, 1968-1972 | | | 124 | | | Director, The Finish Line (athletic shoes and apparel) since July 2003; Director, International Textile Corp. since 2012; Director, hhgregg since May, 2015; former Director, Cobra Electronics Corporation (electronic equipment manufacturer), 1994-August 2014; former Director, Spectrum Brands, Inc. (consumer products), 2002-2009; former Director, Simmons Company (bedding), 2004-2010; former Trustee, BofA Funds Series Trust (11 funds), 2009-2011; former Director, McMoRan Exploration Company (oil and gas exploration and development), 2010-2013 | |
Patricia M. Flynn
901 S. Marquette Ave.
Minneapolis, MN 55402
1950 | | Trustee since 11/04 for RiverSource Funds and since 6/11 for Nations Funds | | Trustee Professor of Economics and Management, Bentley University since 1976 (also teaches and conducts research on corporate governance); Dean, McCallum Graduate School of Business, Bentley University, 1992-2002 | | | 124 | | | Trustee, MA Taxpayers Foundation since 1997; Board of Governors, Innovation Institute, MA Technology Collaborative since 2010 | |
William A. Hawkins
901 S. Marquette Ave.
Minneapolis, MN 55402
1942 | | Chair of the Board since 11/15; Trustee since 6/11 for RiverSource Funds and since 1/05 for Nations Funds | | Managing Director, Overton Partners (financial consulting) since August 2010; President and Chief Executive Officer, California General Bank, N.A., January 2008-August 2010; Operation Hope, COO, 2004-2007; IndyMac Bancorp, President, CBG, 1999-2003; American General Bank, President, 1997-1999; Griffin Financial Services, CEO, 1981-1997; The Griffin Funds, CEO, 1992-1998 | | | 124 | | | Former Trustee, BofA Funds Series Trust (11 funds), 2009-2015 | |
R. Glenn Hilliard
901 S. Marquette Ave.
Minneapolis, MN 55402
1943 | | Trustee since 6/11 for RiverSource Funds and since 1/05 for Nations Funds | | Chairman and Chief Executive Officer, Hilliard Group LLC (investing and consulting) since April 2003; Non-Executive Director & Chairman, CNO Financial Group, Inc. (insurance), 2003-2011; Chair & CEO, ING Americas, 1996-2003 | | | 122 | | | Chairman, BofA Funds Series Trust (11 funds); former Director, CNO Financial Group, Inc. (insurance), 2003-2011 | |
Annual Report 2016
36
COLUMBIA LARGE CAP GROWTH FUND III
TRUSTEES AND OFFICERS (continued)
Independent Trustees (continued)
Name,
Address,
Year of Birth | | Position Held With
the Funds and Length of
Service | | Principal Occupation(s)
During the Past Five Years
and Other Relevant
Professional Experience | | Number of
Funds in the
Columbia
Funds Complex
Overseen | | Other Directorships
Held by Trustee
During the Past
Five Years | |
Catherine James Paglia
901 S. Marquette Ave.
Minneapolis, MN 55402
1952 | | Trustee since 11/04 for RiverSource Funds and since 6/11 for Nations Funds | | Director, Enterprise Asset Management, Inc. (private real estate and asset management company) since September 1998; Managing Director and Partner, Interlaken Capital, Inc., 1989-1997; Managing Director, Morgan Stanley, 1982-1989; Vice President, Investment Banking, 1980-1982, Associate, Investment Banking, 1976-1980, Dean Witter Reynolds, Inc. | | | 124 | | | Director, Valmont Industries, Inc. (irrigation systems manufacturer) since 2012; Trustee, Carleton College (on the Investment Committee); Trustee, Carnegie Endowment for International Peace (on the Investment Committee) | |
Leroy C. Richie
901 S. Marquette Ave.
Minneapolis, MN 55402
1941 | | Trustee since 2000 for Seligman Funds, since 11/08 for RiverSource Funds and since 6/11 for Nations Funds | | Counsel, Lewis & Munday, P.C. (law firm) since 2004; Vice President and General Counsel, Automotive Legal Affairs, Chrysler Corporation, 1993-1997 | | | 122 | | | Lead Outside Director, Infinity Resources, Inc. (oil and gas exploration and production) since 1994; Lead Outside Director, Digital Ally, Inc. (digital imaging) since September 2005; Trustee, Marygrove College (Chair of Finance Committee) since 2007; former Director, OGE Energy Corp. (energy and energy services), 2007-2014 | |
Minor M. Shaw
901 S. Marquette Ave.
Minneapolis, MN 55402
1947 | | Trustee since 6/11 for RiverSource Funds and since 2003 for Nations Funds | | President, Micco LLC (private investments) since 2011; President, Micco Corp. (family investment business), 1998-2011 | | | 124 | | | Director, Piedmont Natural Gas; Director, BlueCross BlueShield of South Carolina since April 2008; Chair of the Duke Endowment; Director, National Association of Corporate Directors, Carolinas Chapter since 2013; Chair of Greenville — Spartanburg Airport Commission; former Trustee, BofA Funds Series Trust (11 funds), 2003-2011 | |
Alison Taunton-Rigby
901 S. Marquette Ave.
Minneapolis, MN 55402
1944 | | Trustee since 11/02 for RiverSource Funds and since 6/11 for Nations Funds | | Managing Director, Forester Biotech (consulting), 2001-2003; Chief Executive Officer and Director, RiboNovix, Inc., (biotechnology), 2003-2010; President and Chief Executive Officer of CMT Inc., 2001-2003; Aquila Biopharmaceuticals Inc., 1996-2000; Cambridge Biotech Corporation, 1995-1996; Mitotix Inc., 1993-1994 | | | 124 | | | Director, Abt Associates (government contractor) since 2001; Director, Boston Children's Hospital since 2002; Director, Healthways, Inc. (health and well-being solutions) since 2005; Director, ICI Mutual Insurance Company since 2011 | |
Annual Report 2016
37
COLUMBIA LARGE CAP GROWTH FUND III
TRUSTEES AND OFFICERS (continued)
Interested Trustee Not Affiliated with Investment Manager*
Name,
Address,
Year of Birth | | Position Held With
Funds and Length of
Service | | Principal Occupation(s)
During Past Five Years
and Other Relevant
Professional Experience | | Number of
Funds in the
Fund Family
Overseen by
Board Member | | Other Present or Past
Directorships/
Trusteeships
(Within Past 5 Years) | |
Anthony M. Santomero
901 S. Marquette Ave.
Minneapolis, MN 55402
1946 | | Trustee since 6/11 for RiverSource Funds and since 1/08 for Nations Funds | | Richard K. Mellon Professor Emeritus of Finance, The Wharton School, University of Pennsylvania since 2002; Senior Advisor, McKinsey & Company (consulting), 2006-2008; President, Federal Reserve Bank of Philadelphia, 2000-2006; Professor of Finance, The Wharton School, University of Pennsylvania, 1972-2002 | | | 122 | | | Trustee, Penn Mutual Life Insurance Company since March 2008; Director, Renaissance Reinsurance Ltd. since May 2008; Director, Citigroup Inc. since 2009; Director, Citibank, N.A. since 2009; former Trustee, BofA Funds Series Trust (11 funds), 2008-2011 | |
* Dr. Santomero is not an affiliated person of the Investment Manager or Ameriprise Financial. However, he is currently deemed by the Funds to be an "interested person" (as defined in the 1940 Act) of the Funds because he serves as a Director of Citigroup Inc. and Citibank, N.A., companies that may directly or through subsidiaries and affiliates engage from time-to-time in brokerage execution, principal transactions and lending relationships with the Funds or accounts advised/managed by the Investment Manager.
Annual Report 2016
38
COLUMBIA LARGE CAP GROWTH FUND III
TRUSTEES AND OFFICERS (continued)
Interested Trustee Affiliated with Investment Manager*
Name,
Address,
Year of Birth | | Position Held With
the Funds and Length of
Service | | Principal Occupation(s)
During Past Five Years
and Other Relevant
Professional Experience | | Number of
Funds in the
Columbia
Funds Complex
Overseen | | Other Directorships
Held by Trustee
During the Past
Five Years | |
William F. Truscott
c/o Columbia Management Investment Advisers, LLC,
225 Franklin St.
Boston, MA 02110
1960 | | Trustee since 11/01 for RiverSource Funds and since 6/11 for Nations Funds; Senior Vice President since 2002 for RiverSource Funds and since 5/10 for Nations Funds | | Chairman of the Board and President, Columbia Management Investment Advisers, LLC since May 2010 and February 2012, respectively (previously President and Chief Investment Officer, 2001-April 2010); Chief Executive Officer, Global Asset Management, Ameriprise Financial, Inc. since September 2012 (previously Chief Executive Officer, U.S. Asset Management & President, Annuities, May 2010-September 2012 and President — U.S. Asset Management and Chief Investment Officer, 2005-April 2010); Director and Chief Executive Officer, Columbia Management Investment Distributors, Inc. since May 2010 and February 2012, respectively (previously Chairman of the Board and Chief Executive Officer, 2006-April 2010); Chairman of the Board and Chief Executive Officer, RiverSource Distributors, Inc. since 2006; Director, Threadneedle Asset Management Holdings, SARL since 2014; President and Chief Executive Officer, Ameriprise Certificate Company, 2006-August 2012. | | | 182 | | | Chairman of the Board, Columbia Management Investment Advisers, LLC since May 2010; Director, Columbia Management Investment Distributors, Inc. since May 2010; Former Director, Ameriprise Certificate Company, 2006-January 2013 | |
* Interested person (as defined under the 1940 Act) by reason of being an officer, director, security holder and/or employee of the Investment Manager or Ameriprise Financial.
The Statement of Additional Information has additional information about the Fund's Board members and is available, without charge, upon request by calling 800.345.6611; contacting your financial intermediary; or visiting columbiathreadneedle.com/us.
Annual Report 2016
39
COLUMBIA LARGE CAP GROWTH FUND III
TRUSTEES AND OFFICERS (continued)
The Board has appointed officers who are responsible for day-to-day business decisions based on policies it has established. The officers serve at the pleasure of the Board. The following table provides basic information about the Officers of the Fund, including principal occupations during the past five years, although their specific titles may have varied over the period. In addition to Mr. Truscott, who is Senior Vice President, the Fund's other officers are:
Fund Officers
Name,
Address and
Year of Birth | | Position and Year
First Appointed to
Position for any Fund
in the Columbia
Funds Complex or a
Predecessor Thereof | | Principal Occupation(s) During Past Five Years | |
Christopher O. Petersen
5228 Ameriprise
Financial Center
Minneapolis, MN 55474
Born 1970 | | President and Principal Executive Officer (2015) | | Vice President and Lead Chief Counsel, Ameriprise Financial, Inc. since January 2015 (previously, Vice President and Chief Counsel January 2010-December 2014; and Vice President and Group Counsel or Counsel 2004-January 2010); officer of Columbia Funds and affiliated funds since 2007. | |
Michael G. Clarke
225 Franklin Street
Boston, MA 02110
Born 1969 | | Treasurer (2011), Chief Financial Officer (2009) and Chief Accounting Officer (2015) | | Vice President — Mutual Fund Administration, Columbia Management Investment Advisers, LLC, since May 2010; Managing Director of Fund Administration, Columbia Management Advisors, LLC, September 2004-April 2010; senior officer of Columbia Funds and affiliated funds since 2002. | |
Paul B. Goucher
100 Park Avenue
New York, NY 10017
Born 1968 | | Senior Vice President (2011), Chief Legal Officer (2015) and Assistant Secretary (2008) | | Vice President and Lead Chief Counsel, Ameriprise Financial, Inc. since November 2008 and January 2013, respectively (previously Chief Counsel, January 2010-January 2013 and Group Counsel, November 2008-January 2010). | |
Thomas P. McGuire
225 Franklin Street
Boston, MA 02110
Born 1972 | | Senior Vice President and Chief Compliance Officer (2012) | | Vice President — Asset Management Compliance, Ameriprise Financial, Inc., since May 2010; Chief Compliance Officer, Ameriprise Certificate Company since September 2010; Compliance Executive, Bank of America, 2005-April 2010. | |
Colin Moore
225 Franklin Street
Boston, MA 02110
Born 1958 | | Senior Vice President (2010) | | Executive Vice President and Global Chief Investment Officer, Ameriprise Financial, Inc., since July 2013; Director and Global Chief Investment Officer, Columbia Management Investment Advisers, LLC since May 2010; Manager, Managing Director and Chief Investment Officer, Columbia Management Advisors, LLC, 2007-April 2010. | |
Michael E. DeFao
225 Franklin Street
Boston, MA 02110
Born 1968 | | Vice President (2011) and Assistant Secretary (2010) | | Vice President and Chief Counsel, Ameriprise Financial, Inc. since May 2010; Associate General Counsel, Bank of America, 2005-April 2010. | |
Amy Johnson
5228 Ameriprise
Financial Center
Minneapolis, MN 55474
Born 1965 | | Vice President (2006) | | Managing Director and Chief Operating Officer, Columbia Management Investment Advisers, LLC since May 2010 (previously Chief Administrative Officer, 2009-April 2010, and Vice President — Asset Management and Trust Company Services, 2006-2009). | |
Lyn Kephart-Strong
5228 Ameriprise
Financial Center
Minneapolis, MN 55474
Born 1960 | | Vice President (2015) | | President, Columbia Management Investment Services Corp. since October 2014; Vice President & Resolution Officer, Ameriprise Trust Company since August 2009; President, RiverSource Service Corporation 2004-2010. | |
Ryan C. Larrenaga
225 Franklin Street
Boston, MA 02110
Born 1970 | | Vice President and Secretary (2015) | | Vice President and Group Counsel, Ameriprise Financial, Inc. since August 2011 (previously, Counsel from May 2010 to August 2011); Assistant General Counsel, Bank of America, 2005-April 2010; officer of Columbia Funds and affiliated funds since 2005. | |
Annual Report 2016
40
COLUMBIA LARGE CAP GROWTH FUND III
IMPORTANT INFORMATION ABOUT THIS REPORT
Each fund mails one shareholder report to each shareholder address. If you would like more than one report, please call shareholder services at 800.345.6611 and additional reports will be sent to you.
The policy of the Board is to vote the proxies of the companies in which each fund holds investments consistent with the procedures as stated in the Statement of Additional Information (SAI). You may obtain a copy of the SAI without charge by calling 800.345.6611; contacting your financial intermediary; visiting columbiathreadneedle.com/us; or searching the website of the Securities and Exchange Commission (SEC) at sec.gov. Information regarding how each fund voted proxies relating to portfolio securities is filed with the SEC by August 31st for the most recent 12-month period ending June 30th of that year, and is available without charge by visiting columbiathreadneedle.com/us, or searching the website of the SEC at sec.gov.
Each fund files a complete schedule of portfolio holdings with the SEC for the first and third quarters of each fiscal year on Form N-Q. Each fund's Form N-Q is available on the SEC's website at sec.gov and may be reviewed and copied at the SEC's Public Reference Room in Washington, D.C. Information on the operation of the Public Reference Room may be obtained by calling 800.SEC.0330. Each fund's complete schedule of portfolio holdings, as filed on Form N-Q, can also be obtained without charge, upon request, by calling 800.345.6611.
Annual Report 2016
41
Columbia Large Cap Growth Fund III
P.O. Box 8081
Boston, MA 02266-8081

This information is for use with concurrent or prior delivery of a fund prospectus. Please read and consider the investment objectives, risks, charges and expenses for any fund carefully before investing. For a prospectus and summary prospectus, which contains this and other important information about the Fund, go to columbiathreadneedle.com/us. The Fund is distributed by Columbia Management Investment Distributors, Inc., member FINRA, and managed by Columbia Management Investment Advisers, LLC.
Columbia Threadneedle Investments (Columbia Threadneedle) is the global brand name of the Columbia and Threadneedle group of companies.
All rights reserved. Columbia Management Investment Distributors, Inc., 225 Franklin Street, Boston, MA 02110-2804
© 2016 Columbia Management Investment Advisers, LLC.
columbiathreadneedle.com/us
ANN186_02_F01_(04/16)

ANNUAL REPORT
February 29, 2016

COLUMBIA LARGE CAP INDEX FUND

ABOUT COLUMBIA THREADNEEDLE INVESTMENTS
Columbia Threadneedle Investments is a leading global asset management group that provides a broad range of actively managed investment strategies and solutions for individual, institutional and corporate clients around the world.
With more than 2,000 people, including over 450 investment professionals based in North America, Europe and Asia, we manage $472 billion* of assets across developed and emerging market equities, fixed income, asset allocation solutions and alternatives. We are the 13th largest manager of long-term mutual fund assets in the U.S.** and the 4th largest manager of retail funds in the U.K.***
Our priority is the investment success of our clients. We aim to deliver the investment outcomes they expect through an investment approach that is team-based, performance-driven and risk-aware. Our culture is dynamic and interactive. By sharing our insights across asset classes and geographies, we generate richer perspectives on global, regional and local investment landscapes. The ability to exchange and debate investment ideas in a collaborative environment enriches our teams' investment processes. More importantly, it results in better informed investment decisions for our clients.
Columbia funds are distributed by Columbia Management Investment Distributors, Inc., member FINRA, and managed by Columbia Management Investment Advisers, LLC.
Columbia Threadneedle Investments (Columbia Threadneedle) is the global brand name of the Columbia and Threadneedle group of companies.
* In U.S. dollars as of December 31, 2015. Source: Ameriprise Q4 Earnings Release. Includes all assets managed by entities in the Columbia and Threadneedle groups of companies. Contact us for more current data.
** Source: ICI as of December 31, 2015 for Columbia Management Investment Advisers, LLC.
*** Source: Investment Association as of September 2015 for Threadneedle Asset Management Limited.
© 2016 Columbia Management Investment Advisers, LLC. All rights reserved.
Not part of the shareholder report
Investment strategies to help meet investor needs
We are committed to helping investors navigate financial challenges to reach their desired outcomes. The possibilities are endless.
Your success is our priority.
Retire comfortably
Fund college or higher education
Leave a legacy
Generate an appropriate stream of income in retirement
Traditional approaches to income may no longer be adequate — and they may no longer provide the diversification benefits they once did. Investors need to rethink how they generate retirement income.
Worried about running out of income? You are not alone.
Navigate a changing interest rate environment
Even in today's challenging interest rate environment, it's still possible to navigate markets and achieve your goals.
Make investment choices designed specifically for this market environment.
Maximize after-tax returns
In an environment where what you keep is more important than what you earn, municipal bonds can help mitigate higher taxes while providing attractive yields compared to other investment options.
You've worked too hard building your wealth to lose it to taxes.
Grow assets to achieve financial goals
Finding growth opportunities in today's complex market environment requires strong research capabilities, creative thinking and a disciplined approach.
Do your investments deliver the portfolio growth you need?
Ease the impact of volatile markets
With increasing concerns about market volatility, investors should consider diversifying their portfolios with non-traditional holdings.
Interested in turning volatility into opportunity?
To find out more, contact your financial professional, call 800.426.3750 or visit columbiathreadneedle.com/us
Not part of the shareholder report
Get the market insight you need from our investment experts and subscribe to our latest publications
Stay informed with Columbia Threadneedle Investments
Investor insight
Find economic and market commentary, investment videos, white papers, mutual fund commentary and more at columbiathreadneedle.com/us.
Subscribe to the latest information from Columbia Threadneedle. Register your information online at columbiathreadneedle.com/us/subscribe and select the publications you would like to receive, including:
n Columbia Threadneedle Investor Newsletter, highlighting the latest macro- and micro-economic trends, investment themes, products, service changes and other items of interest to our investors
n Investment Strategy Outlook, showcasing the Columbia Threadneedle Asset Allocation Team's perspective on global economic investment conditions and markets
n MarketTrack, featuring straightforward insight on current investment opportunities
n White papers that delve deep into a variety of investment topics
n Quarterly portfolio manager commentary and fund fact sheets
Update your subscriptions at any time by accessing the email subscription center.
Social media
We offer you multiple ways to access our market commentary and investment insights.
n Perspectives blog at columbiathreadneedle.com/us
Read timely posts by our investment team, including our chief investment officer, chief economist and portfolio managers.
n Twitter.com/CTinvest_US
Follow us on Twitter for quick, up-to-the-minute comments on market news and more.
n Youtube.com/CTInvestUS
View our commentaries on the economy, markets and current investment opportunities.
n Linkedin.com/company/Columbia-Threadneedle-Investments-US
Connect with us on LinkedIn for updates from our thought leaders.
Not part of the shareholder report
 Dear Shareholder,
Today's investors are typically focused on outcomes, like living a certain retirement lifestyle, paying for college education or building a legacy. But in today's complex global investment landscape, even simple goals are not easily achieved.
At Columbia Threadneedle Investments, we aspire to help satisfy five core needs of today's investors:
n Generate an appropriate stream of income in retirement
Traditional approaches to generating income may not provide the diversification benefits they once did, and they may actually introduce unwanted risk in today's market. To seek to improve your potential to live comfortably long term, we endeavor to pursue investments that explore less traveled paths to income.
n Navigate a changing interest rate environment
Today's uncertain market environment includes the prospect of a rise in interest rates. Blending traditional investments with non-traditional or alternative products may help protect your wealth during periods of volatility. We can attempt to help strengthen your portfolio with agile products designed to take on the market's ups and downs.
n Maximize after-tax returns
In an environment where what you keep may be more important than what you earn, municipal bonds can help mitigate high tax burdens while providing potentially attractive yields. Our state and federal tax-exempt products are aimed at helping investors manage risk, minimize the fluctuation of capital and grow wealth on a more tax-efficient basis.
n Grow assets to achieve financial goals
We believe that finding and protecting growth comes from a disciplined security selection process designed to create excess return. Our goal is to provide investment solutions built to help you face today's market challenges and grow your assets at each crossroad of your journey.
n Ease the impact of volatile markets
Despite a bull market run that has benefited many investors over the past several years, it's important to remember the lessons of 2008 and the value that a well-diversified portfolio may provide through times of market volatility. We are here to help you hold onto the savings you have worked tirelessly to amass, and to provide you the best opportunity to maintain your standard of living regardless of market conditions.
Find out today how we can help you confidently invest to realize your dreams. Please visit us at blog.columbiathreadneedleus.com/our-best-ideas to learn more about our unique investment solutions.
The world is constantly changing, but our priority remains the same: to help you secure your finances, meet your goals and achieve success. Thank you for your continued investment with us.
Sincerely,

Christopher O. Petersen
President, Columbia Funds
Investors should consider the investment objectives, risks, charges and expenses of a mutual fund carefully before investing. For a free prospectus and summary prospectus, which contains this and other important information about a fund, visit columbiathreadneedle.com/us. The prospectus should be read carefully before investing.
Columbia Funds are distributed by Columbia Management Investment Distributors, Inc., member FINRA, and managed by Columbia Management Investment Advisers, LLC.
© 2016 Columbia Management Investment Advisers, LLC. All rights reserved.
COLUMBIA LARGE CAP INDEX FUND
Fund Investment Manager
Columbia Management Investment
Advisers, LLC
225 Franklin Street
Boston, MA 02110
Fund Distributor
Columbia Management Investment
Distributors, Inc.
225 Franklin Street
Boston, MA 02110
Fund Transfer Agent
Columbia Management Investment
Services Corp.
P.O. Box 8081
Boston, MA 02266-8081
For more information about any of the funds, please visit columbiathreadneedle.com/us or call 800.345.6611. Customer Service Representatives are available to answer your questions Monday through Friday from 8 a.m. to 7 p.m. Eastern time.
The views expressed in this report reflect the current views of the respective parties. These views are not guarantees of future performance and involve certain risks, uncertainties and assumptions that are difficult to predict, so actual outcomes and results may differ significantly from the views expressed. These views are subject to change at any time based upon economic, market or other conditions and the respective parties disclaim any responsibility to update such views. These views may not be relied on as investment advice and, because investment decisions for a Columbia fund are based on numerous factors, may not be relied on as an indication of trading intent on behalf of any particular Columbia fund. References to specific securities should not be construed as a recommendation or investment advice.
Performance Overview | | | 3 | | |
Manager Discussion of Fund Performance | | | 5 | | |
Understanding Your Fund's Expenses | | | 7 | | |
Portfolio of Investments | | | 8 | | |
Statement of Assets and Liabilities | | | 20 | | |
Statement of Operations | | | 22 | | |
Statement of Changes in Net Assets | | | 23 | | |
Financial Highlights | | | 25 | | |
Notes to Financial Statements | | | 30 | | |
Report of Independent Registered Public Accounting Firm | | | 39 | | |
Federal Income Tax Information | | | 40 | | |
Trustees and Officers | | | 41 | | |
Important Information About This Report | | | 47 | | |
COLUMBIA LARGE CAP INDEX FUND
Performance Summary
n Columbia Large Cap Index Fund (the Fund) Class A shares returned -6.57% for the 12-month period that ended February 29, 2016.
n The Fund closely tracked its benchmark, the unmanaged S&P 500 Index, which returned -6.19% for the same period.
n Mutual funds, unlike unmanaged indices, incur operating expenses, which accounted for the performance differential between the Fund and the Index.
Average Annual Total Returns (%) (for period ended February 29, 2016)
| | | Inception | | 1 Year | | 5 Years | | 10 Years | |
Class A | | 10/10/95 | | | -6.57 | | | | 9.65 | | | | 6.02 | | |
Class B | | 09/23/05 | | | | | | | |
Excluding sales charges | | | | | | | -7.29 | | | | 8.84 | | | | 5.23 | | |
Including sales charges | | | | | | | -11.85 | | | | 8.55 | | | | 5.23 | | |
Class I* | | 11/16/11 | | | -6.36 | | | | 9.92 | | | | 6.25 | | |
Class R5* | | 11/08/12 | | | -6.33 | | | | 9.93 | | | | 6.28 | | |
Class Z | | 12/15/93 | | | -6.34 | | | | 9.93 | | | | 6.28 | | |
S&P 500 Index | | | | | | | -6.19 | | | | 10.13 | | | | 6.44 | | |
Returns for Class B are shown with and without the applicable contingent deferred sales charge (CDSC) of 5.00% in the first year, declining to 1.00% in the sixth year and eliminated thereafter. The Fund's other classes are not subject to sales charges and have limited eligibility. Please see the Fund's prospectus for details. Performance for different share classes will vary based on differences in sales charges and fees associated with each class. All results shown assume reinvestment of distributions during the period. Returns do not reflect the deduction of taxes that a shareholder may pay on Fund distributions or on the redemption of Fund shares. Performance results reflect the effect of any fee waivers or reimbursements of Fund expenses by Columbia Management Investment Advisers, LLC and/or any of its affiliates. Absent these fee waivers or expense reimbursement arrangements, performance results would have been lower.
The performance information shown represents past performance and is not a guarantee of future results. The investment return and principal value of your investment will fluctuate so that your shares, when redeemed, may be worth more or less than their original cost. Current performance may be lower or higher than the performance information shown. You may obtain performance information current to the most recent month-end by contacting your financial intermediary, visiting columbiathreadneedle.com/us or calling 800.345.6611.
*The returns shown for periods prior to the share class inception date (including returns for the Life of the Fund, if shown, which are since Fund inception) include the returns of the Fund's oldest share class. These returns are adjusted to reflect any higher class-related operating expenses of the newer share classes, as applicable. Please visit columbiathreadneedle.com/us/investment-products/mutual-funds/ appended-performance for more information.
The S&P 500 Index, an unmanaged index, measures the performance of 500 widely held, large-capitalization U.S. stocks and is frequently used as a general measure of market performance.
Indices are not available for investment, are not professionally managed and do not reflect sales charges, fees, brokerage commissions, taxes or other expenses of investing. Securities in the Fund may not match those in an index.
Annual Report 2016
3
COLUMBIA LARGE CAP INDEX FUND
PERFORMANCE OVERVIEW (continued)
Performance of a Hypothetical $10,000 Investment (March 1, 2006 – February 29, 2016)
The chart above shows the change in value of a hypothetical $10,000 investment in Class A shares of Columbia Large Cap Index Fund during the stated time period, and does not reflect the deduction of taxes that a shareholder may pay on Fund distributions or on the redemption of Fund shares.
Annual Report 2016
4
COLUMBIA LARGE CAP INDEX FUND
MANAGER DISCUSSION OF FUND PERFORMANCE
For the 12-month period that ended February 29, 2016, the Fund's Class A shares returned -6.57%. The Fund closely tracked its benchmark, the unmanaged S&P 500 Index, which returned -6.19% for the same period. Mutual funds, unlike unmanaged indices, incur operating expenses, which accounted for the performance differential between the Fund and the Index.
U.S. Equity Market Experienced a Roller Coaster Year
The performance of the U.S. economy topped the rest of the developed world, and the U.S. stock market, as represented by the S&P 500 Index, finished calendar year 2015 in positive territory. However, for the 12 months ended February 29, 2016, the U.S. equity market declined substantially, providing evidence of the roller coaster year experienced by most investors. Four factors dogged U.S. stocks during the 12-month period. One, a further and unexpected decline in commodity prices (making for a fifth consecutive year of negative returns), particularly oil. Two, continued strength of the U.S. dollar. Three, soft economic growth and currency devaluation in China. And four, a Federal Reserve (Fed) that only felt confident enough about the U.S. economy to begin raising interest rates in the waning weeks of December 2015. Twelve months earlier, many expected the Fed to begin tightening monetary policy as early as the first quarter of 2015.
Dissecting U.S. equity market returns further, it is clear that performance was narrowly driven by a handful of stocks. Indeed, just ten stocks accounted for 40% of the total positive contribution to the S&P 500 Index return in calendar year 2015. Even further, the so called "FANG" stocks — Facebook, Amazon.com, Netflix and Google accounted for over 20% of the total positive return in the S&P 500 Index in 2015.
Though overall 2015 will be remembered as one of the most uncertain and turbulent market years, in perspective, it is worth keeping in mind that there were also many important positive economic developments. For example, rising consumer confidence, especially toward the end of the calendar year, drove much of consumer spending for 2015. Also, home prices increased; inflation remained relatively stable; and the job market held steady, with unemployment declining to 5% at year end 2015.
In the first two months of 2016, anxiety about a potential U.S. recession began to subside. Retail sales, existing home sales, the Institute of Supply Management's Purchasing Managers Index, and the employment report all exceeded economists' consensus forecasts. Still, the S&P 500 Index declined more than 5% in the first two months of 2016, attributable primarily to January 2016 when U.S. equities were embroiled in what was a global rout, triggered by investor concerns of an intensifying economic slowdown in China and exacerbated by a plunge in oil prices to less than $30 per barrel. Market sentiment appeared to improve in February 2016, as central banks outside of the United States increasingly acknowledged rising economic risks, U.S. economic data improved, and oil prices recovered modestly from their trough point.
Portfolio Management
Christopher Lo, CFA
Vadim Shteyn
Morningstar Style BoxTM
The Morningstar Style BoxTM is based on a fund's portfolio holdings. For equity funds, the vertical axis shows the market capitalization of the stocks owned, and the horizontal axis shows investment style (value, blend, or growth). Information shown is based on the most recent data provided by Morningstar.
© 2016 Morningstar, Inc. All rights reserved. The Morningstar information contained herein: (1) is proprietary to Morningstar and/or its content providers; (2) may not be copied or distributed; and (3) is not warranted to be accurate, complete or timely. Neither Morningstar nor its content providers are responsible for any damages or losses arising from any use of this information.
Top Ten Holdings (%)
(at February 29, 2016) | |
Apple, Inc. | | | 3.2 | | |
Microsoft Corp. | | | 2.4 | | |
Exxon Mobil Corp. | | | 2.0 | | |
Johnson & Johnson | | | 1.7 | | |
General Electric Co. | | | 1.6 | | |
Berkshire Hathaway, Inc.,
Class B | | | 1.5 | | |
Facebook, Inc., Class A | | | 1.4 | | |
AT&T, Inc. | | | 1.3 | | |
Procter & Gamble Co. (The) | | | 1.3 | | |
Wells Fargo & Co. | | | 1.3 | | |
Percentages indicated are based upon total investments (excluding Money Market).
For further detail about these holdings, please refer to the section entitled "Portfolio of Investments."
Fund holdings are as of the date given, are subject to change at any time, and are not recommendations to buy or sell any security.
Annual Report 2016
5
COLUMBIA LARGE CAP INDEX FUND
MANAGER DISCUSSION OF FUND PERFORMANCE (continued)
Portfolio Breakdown (%)
(at February 29, 2016) | |
Common Stocks | | | 99.1 | | |
Money Market Funds | | | 0.9 | | |
Total | | | 100.0 | | |
Percentages indicated are based upon total investments. The Fund's portfolio composition is subject to change.
Equity Sector Breakdown (%)
(at February 29, 2016) | |
Consumer Discretionary | | | 12.9 | | |
Consumer Staples | | | 10.7 | | |
Energy | | | 6.6 | | |
Financials | | | 15.6 | | |
Health Care | | | 14.7 | | |
Industrials | | | 10.1 | | |
Information Technology | | | 20.4 | | |
Materials | | | 2.8 | | |
Telecommunication Services | | | 2.8 | | |
Utilities | | | 3.4 | | |
Total | | | 100.0 | | |
Percentages indicated are based upon total equity investments. The Fund's portfolio composition is subject to change.
Investment Risks
Market risk may affect a single issuer, sector of the economy, industry or the market as a whole. Investing in derivatives is a specialized activity that involves special risks, which may result in significant losses. The Fund's net asset value will generally decline when the performance of its targeted index declines. See the Fund's prospectus for information on these and other risks.
S&P 500 Index Faced Broad-Based Declines
Only three of the ten sectors of the S&P 500 Index posted positive returns during the 12 months ended February 29, 2016. In terms of total return and on the basis of impact, which takes weighting and total returns into account, consumer staples, telecommunication services and utilities, each considered a traditionally defensive sector, were the best relative performers. The top performing industries for the period were food, beverage and tobacco; telecommunications; software and services; retailing; and consumer services.
Conversely, energy, materials and financials, each considered a more cyclical sector, were the weakest sectors from a total return perspective. On the basis of impact, financials, energy and health care were the weakest. The worst performing industries for the period were energy; technology hardware and equipment; automobiles and components; transportation; and materials.
Top individual contributors within the S&P 500 Index included e-commerce retailing giant Amazon.com and information technology behemoths Facebook, Microsoft and Alphabet Class A and Class C (parent company of Google). Top detractors were information technology leader Apple, financials companies Citigroup, Bank of America and Wells Fargo; and integrated energy company Chevron.
As always, each sector and stock in the S&P 500 Index was represented in the Fund with approximately the same weighting as in the Index and therefore had a similar effect.
Index Additions and Deletions Drove Portfolio Changes
During the period, there were 37 additions and 35 deletions to the S&P 500 Index and the Fund's portfolio. Among those stocks added were consumer staples firms Church & Dwight; health care-related company Illumina; airlines American Airlines Group and United Continental Holdings; real estate-related companies SL Green Realty, Realty Income, Equinix, Extra Space Storage and Federal Realty Investment Trust; media and entertainment-related companies Activision Blizzard and Twenty-First Century Fox; and information technology companies Skyworks Solutions and Hewlett Packard Enterprise.
Deletions included energy-related companies Denbury Resources, Nabors Industries, Noble, QEP Resources and Integrys Energy Group; consumer staples companies Lorillard and Avon Products; financials companies Genworth Financial and Hudson City Bancorp; retailers Family Dollar Stores and PetSmart; and health care company Hospira.
We do not anticipate any changes in the portfolio beyond the customary quarterly rebalancings and stock substitutions we make to align the Fund with the S&P 500 Index. As the Fund seeks to closely approximate the performance of the S&P 500 Index, we will continue to seek to match its industry and risk characteristics by investing primarily in the securities that comprise the Index.
Annual Report 2016
6
COLUMBIA LARGE CAP INDEX FUND
UNDERSTANDING YOUR FUND'S EXPENSES
(Unaudited)
As an investor, you incur two types of costs. There are transaction costs, which generally include sales charges on purchases and may include redemption fees. There are also ongoing costs, which generally include management fees, distribution and/or service fees, and other fund expenses. The following information is intended to help you understand your ongoing costs (in dollars) of investing in the Fund and to help you compare these costs with the ongoing costs of investing in other mutual funds.
Analyzing Your Fund's Expenses
To illustrate these ongoing costs, we have provided examples and calculated the expenses paid by investors in each share class of the Fund during the period. The actual and hypothetical information in the table is based on an initial investment of $1,000 at the beginning of the period indicated and held for the entire period. Expense information is calculated two ways and each method provides you with different information. The amount listed in the "Actual" column is calculated using the Fund's actual operating expenses and total return for the period. You may use the Actual information, together with the amount invested, to estimate the expenses that you paid over the period. Simply divide your account value by $1,000 (for example, an $8,600 account value divided by $1,000 = 8.6), then multiply the results by the expenses paid during the period under the "Actual" column. The amount listed in the "Hypothetical" column assumes a 5% annual rate of return before expenses (which is not the Fund's actual return) and then applies the Fund's actual expense ratio for the period to the hypothetical return. You should not use the hypothetical account values and expenses to estimate either your actual account balance at the end of the period or the expenses you paid during the period. See "Compare With Other Funds" below for details on how to use the hypothetical data.
Compare With Other Funds
Since all mutual funds are required to include the same hypothetical calculations about expenses in shareholder reports, you can use this information to compare the ongoing cost of investing in the Fund with other funds. To do so, compare the hypothetical example with the 5% hypothetical examples that appear in the shareholder reports of other funds. As you compare hypothetical examples of other funds, it is important to note that hypothetical examples are meant to highlight the ongoing costs of investing in a fund only and do not reflect any transaction costs, such as sales charges, or redemption or exchange fees. Therefore, the hypothetical calculations are useful in comparing ongoing costs only, and will not help you determine the relative total costs of owning different funds. If transaction costs were included in these calculations, your costs would be higher.
September 1, 2015 – February 29, 2016
| | | Account Value at the Beginning
of the Period ($) | | Account Value at the End of the
Period ($) | | Expenses Paid During the
Period ($) | | Fund's Annualized
Expense Ratio (%) | |
| | | Actual | | Hypothetical | | Actual | | Hypothetical | | Actual | | Hypothetical | | Actual | |
Class A | | | 1,000.00 | | | | 1,000.00 | | | | 988.70 | | | | 1,022.63 | | | | 2.23 | | | | 2.26 | | | | 0.45 | | |
Class B | | | 1,000.00 | | | | 1,000.00 | | | | 984.90 | | | | 1,018.90 | | | | 5.92 | | | | 6.02 | | | | 1.20 | | |
Class I | | | 1,000.00 | | | | 1,000.00 | | | | 989.80 | | | | 1,023.87 | | | | 0.99 | | | | 1.01 | | | | 0.20 | | |
Class R5 | | | 1,000.00 | | | | 1,000.00 | | | | 989.90 | | | | 1,023.87 | | | | 0.99 | | | | 1.01 | | | | 0.20 | | |
Class Z | | | 1,000.00 | | | | 1,000.00 | | | | 990.00 | | | | 1,023.87 | | | | 0.99 | | | | 1.01 | | | | 0.20 | | |
Expenses paid during the period are equal to the annualized expense ratio for each class as indicated above, multiplied by the average account value over the period and then multiplied by the number of days in the Fund's most recent fiscal half year and divided by 366.
Expenses do not include fees and expenses incurred indirectly by the Fund from its investment in underlying funds, including affiliated and non-affiliated pooled investment vehicles, such as mutual funds and exchange-traded funds.
Had Columbia Management Investment Advisers, LLC and/or certain of its affiliates not waived/reimbursed certain fees and expenses, account value at the end of the period would have been reduced.
Annual Report 2016
7
COLUMBIA LARGE CAP INDEX FUND
PORTFOLIO OF INVESTMENTS
February 29, 2016
(Percentages represent value of investments compared to net assets)
Common Stocks 98.9%
Issuer | | Shares | | Value ($) | |
CONSUMER DISCRETIONARY 12.8% | |
Auto Components 0.3% | |
BorgWarner, Inc. | | | 42,475 | | | | 1,388,083 | | |
Delphi Automotive PLC | | | 53,076 | | | | 3,539,108 | | |
Goodyear Tire & Rubber Co. (The) | | | 50,957 | | | | 1,534,825 | | |
Johnson Controls, Inc. | | | 122,733 | | | | 4,474,845 | | |
Total | | | | | 10,936,861 | | |
Automobiles 0.6% | |
Ford Motor Co. | | | 738,620 | | | | 9,240,136 | | |
General Motors Co. | | | 268,352 | | | | 7,900,283 | | |
Harley-Davidson, Inc. | | | 36,357 | | | | 1,569,532 | | |
Total | | | | | 18,709,951 | | |
Distributors 0.1% | |
Genuine Parts Co. | | | 28,569 | | | | 2,575,495 | | |
Diversified Consumer Services —% | |
H&R Block, Inc. | | | 44,695 | | | | 1,469,572 | | |
Hotels, Restaurants & Leisure 1.9% | |
Carnival Corp. | | | 87,223 | | | | 4,183,215 | | |
Chipotle Mexican Grill, Inc.(a) | | | 5,910 | | | | 3,009,136 | | |
Darden Restaurants, Inc. | | | 21,854 | | | | 1,396,033 | | |
Marriott International, Inc., Class A | | | 36,544 | | | | 2,490,474 | | |
McDonald's Corp. | | | 174,002 | | | | 20,391,294 | | |
Royal Caribbean Cruises Ltd. | | | 32,517 | | | | 2,418,289 | | |
Starbucks Corp. | | | 281,366 | | | | 16,378,315 | | |
Starwood Hotels & Resorts Worldwide, Inc. | | | 31,968 | | | | 2,209,308 | | |
Wyndham Worldwide Corp. | | | 22,002 | | | | 1,602,626 | | |
Wynn Resorts Ltd. | | | 15,398 | | | | 1,270,027 | | |
Yum! Brands, Inc. | | | 77,459 | | | | 5,613,454 | | |
Total | | | | | 60,962,171 | | |
Household Durables 0.4% | |
D.R. Horton, Inc. | | | 62,183 | | | | 1,661,530 | | |
Garmin Ltd. | | | 22,363 | | | | 905,925 | | |
Harman International Industries, Inc. | | | 13,470 | | | | 1,032,880 | | |
Leggett & Platt, Inc. | | | 25,790 | | | | 1,151,781 | | |
Lennar Corp., Class A | | | 33,928 | | | | 1,422,940 | | |
Mohawk Industries, Inc.(a) | | | 12,048 | | | | 2,165,387 | | |
Newell Rubbermaid, Inc. | | | 50,615 | | | | 1,923,876 | | |
PulteGroup, Inc. | | | 60,206 | | | | 1,034,941 | | |
Whirlpool Corp. | | | 14,818 | | | | 2,301,532 | | |
Total | | | | | 13,600,792 | | |
Common Stocks (continued)
Issuer | | Shares | | Value ($) | |
Internet & Catalog Retail 2.0% | |
Amazon.com, Inc.(a) | | | 72,840 | | | | 40,245,557 | | |
Expedia, Inc. | | | 22,303 | | | | 2,321,965 | | |
Netflix, Inc.(a) | | | 80,989 | | | | 7,565,183 | | |
Priceline Group, Inc. (The)(a) | | | 9,434 | | | | 11,935,991 | | |
TripAdvisor, Inc.(a) | | | 21,412 | | | | 1,340,391 | | |
Total | | | | | 63,409,087 | | |
Leisure Products 0.1% | |
Hasbro, Inc. | | | 21,254 | | | | 1,612,541 | | |
Mattel, Inc. | | | 64,307 | | | | 2,091,264 | | |
Total | | | | | 3,703,805 | | |
Media 3.1% | |
21st Century Fox, Inc., Class A | | | 221,855 | | | | 5,994,522 | | |
21st Century Fox, Inc., Class B | | | 81,712 | | | | 2,219,298 | | |
Cablevision Systems Corp., Class A | | | 42,175 | | | | 1,371,953 | | |
CBS Corp., Class B Non Voting | | | 82,186 | | | | 3,976,159 | | |
Comcast Corp., Class A | | | 462,722 | | | | 26,712,941 | | |
Discovery Communications, Inc.,
Class A(a) | | | 28,331 | | | | 708,275 | | |
Discovery Communications, Inc.,
Class C(a) | | | 48,885 | | | | 1,205,015 | | |
Interpublic Group of Companies, Inc. (The) | | | 77,002 | | | | 1,647,073 | | |
News Corp., Class A | | | 72,302 | | | | 782,307 | | |
News Corp., Class B | | | 20,428 | | | | 233,083 | | |
Omnicom Group, Inc. | | | 45,907 | | | | 3,572,024 | | |
Scripps Networks Interactive, Inc.,
Class A | | | 17,930 | | | | 1,062,173 | | |
TEGNA, Inc. | | | 42,010 | | | | 1,035,126 | | |
Time Warner Cable, Inc. | | | 53,665 | | | | 10,242,502 | | |
Time Warner, Inc. | | | 151,500 | | | | 10,029,300 | | |
Viacom, Inc., Class B | | | 65,787 | | | | 2,424,251 | | |
Walt Disney Co. (The) | | | 288,211 | | | | 27,529,915 | | |
Total | | | | | 100,745,917 | | |
Multiline Retail 0.7% | |
Dollar General Corp. | | | 55,131 | | | | 4,093,477 | | |
Dollar Tree, Inc.(a) | | | 44,493 | | | | 3,570,563 | | |
Kohl's Corp. | | | 35,970 | | | | 1,678,720 | | |
Macy's, Inc. | | | 59,572 | | | | 2,574,106 | | |
Nordstrom, Inc. | | | 25,783 | | | | 1,323,184 | | |
Target Corp. | | | 116,740 | | | | 9,158,253 | | |
Total | | | | | 22,398,303 | | |
The accompanying Notes to Financial Statements are an integral part of this statement.
Annual Report 2016
8
COLUMBIA LARGE CAP INDEX FUND
PORTFOLIO OF INVESTMENTS (continued)
February 29, 2016
Common Stocks (continued)
Issuer | | Shares | | Value ($) | |
Specialty Retail 2.6% | |
Advance Auto Parts, Inc. | | | 13,878 | | | | 2,060,050 | | |
AutoNation, Inc.(a) | | | 14,465 | | | | 744,514 | | |
AutoZone, Inc.(a) | | | 5,777 | | | | 4,474,691 | | |
Bed Bath & Beyond, Inc.(a) | | | 31,626 | | | | 1,516,467 | | |
Best Buy Co., Inc. | | | 56,502 | | | | 1,830,100 | | |
CarMax, Inc.(a) | | | 38,399 | | | | 1,776,338 | | |
GameStop Corp., Class A | | | 19,990 | | | | 616,092 | | |
Gap, Inc. (The) | | | 43,411 | | | | 1,200,314 | | |
Home Depot, Inc. (The) | | | 240,260 | | | | 29,821,071 | | |
L Brands, Inc. | | | 48,265 | | | | 4,092,389 | | |
Lowe's Companies, Inc. | | | 173,410 | | | | 11,710,377 | | |
O'Reilly Automotive, Inc.(a) | | | 18,692 | | | | 4,865,902 | | |
Ross Stores, Inc. | | | 76,747 | | | | 4,219,550 | | |
Signet Jewelers Ltd. | | | 15,071 | | | | 1,633,696 | | |
Staples, Inc. | | | 121,965 | | | | 1,152,569 | | |
Tiffany & Co. | | | 21,137 | | | | 1,373,482 | | |
TJX Companies, Inc. (The) | | | 126,874 | | | | 9,401,363 | | |
Tractor Supply Co. | | | 25,456 | | | | 2,152,814 | | |
Urban Outfitters, Inc.(a) | | | 16,452 | | | | 435,814 | | |
Total | | | | | 85,077,593 | | |
Textiles, Apparel & Luxury Goods 1.0% | |
Coach, Inc. | | | 52,589 | | | | 2,047,816 | | |
Hanesbrands, Inc. | | | 74,249 | | | | 2,115,354 | | |
Michael Kors Holdings Ltd.(a) | | | 34,877 | | | | 1,975,782 | | |
Nike, Inc., Class B | | | 255,722 | | | | 15,749,918 | | |
PVH Corp. | | | 15,642 | | | | 1,238,064 | | |
Ralph Lauren Corp. | | | 11,145 | | | | 1,011,520 | | |
Under Armour, Inc., Class A(a) | | | 34,132 | | | | 2,856,507 | | |
VF Corp. | | | 64,628 | | | | 4,207,929 | | |
Total | | | | | 31,202,890 | | |
Total Consumer Discretionary | | | | | 414,792,437 | | |
CONSUMER STAPLES 10.6% | |
Beverages 2.4% | |
Brown-Forman Corp., Class B | | | 19,259 | | | | 1,896,434 | | |
Coca-Cola Co. (The) | | | 741,710 | | | | 31,989,952 | | |
Coca-Cola Enterprises, Inc. | | | 39,566 | | | | 1,919,347 | | |
Constellation Brands, Inc., Class A | | | 32,811 | | | | 4,640,460 | | |
Dr. Pepper Snapple Group, Inc. | | | 35,795 | | | | 3,276,316 | | |
Common Stocks (continued)
Issuer | | Shares | | Value ($) | |
Molson Coors Brewing Co., Class B | | | 34,440 | | | | 2,936,699 | | |
Monster Beverage Corp.(a) | | | 28,427 | | | | 3,567,588 | | |
PepsiCo, Inc. | | | 276,070 | | | | 27,005,167 | | |
Total | | | | | 77,231,963 | | |
Food & Staples Retailing 2.4% | |
Costco Wholesale Corp. | | | 82,888 | | | | 12,435,687 | | |
CVS Health Corp. | | | 209,834 | | | | 20,389,570 | | |
Kroger Co. (The) | | | 184,463 | | | | 7,361,918 | | |
SYSCO Corp. | | | 99,486 | | | | 4,390,317 | | |
Wal-Mart Stores, Inc. | | | 297,308 | | | | 19,723,413 | | |
Walgreens Boots Alliance, Inc. | | | 165,059 | | | | 13,029,758 | | |
Whole Foods Market, Inc. | | | 64,669 | | | | 2,024,786 | | |
Total | | | | | 79,355,449 | | |
Food Products 1.8% | |
Archer-Daniels-Midland Co. | | | 113,081 | | | | 3,953,312 | | |
Campbell Soup Co. | | | 34,034 | | | | 2,101,600 | | |
ConAgra Foods, Inc. | | | 82,036 | | | | 3,450,434 | | |
General Mills, Inc. | | | 113,260 | | | | 6,665,351 | | |
Hershey Co. (The) | | | 27,227 | | | | 2,474,662 | | |
Hormel Foods Corp. | | | 51,128 | | | | 2,173,451 | | |
JM Smucker Co. (The) | | | 22,679 | | | | 2,893,160 | | |
Kellogg Co. | | | 48,353 | | | | 3,579,089 | | |
Keurig Green Mountain, Inc. | | | 22,012 | | | | 2,023,783 | | |
Kraft Heinz Co. (The) | | | 112,674 | | | | 8,678,151 | | |
McCormick & Co., Inc. | | | 22,036 | | | | 2,055,077 | | |
Mead Johnson Nutrition Co. | | | 35,326 | | | | 2,605,646 | | |
Mondelez International, Inc., Class A | | | 301,143 | | | | 12,205,326 | | |
Tyson Foods, Inc., Class A | | | 56,024 | | | | 3,627,554 | | |
Total | | | | | 58,486,596 | | |
Household Products 2.1% | |
Church & Dwight Co., Inc. | | | 24,850 | | | | 2,255,386 | | |
Clorox Co. (The) | | | 24,462 | | | | 3,092,486 | | |
Colgate-Palmolive Co. | | | 169,965 | | | | 11,156,503 | | |
Kimberly-Clark Corp. | | | 68,787 | | | | 8,962,946 | | |
Procter & Gamble Co. (The) | | | 515,542 | | | | 41,392,867 | | |
Total | | | | | 66,860,188 | | |
Personal Products 0.1% | |
Estee Lauder Companies, Inc. (The),
Class A | | | 42,178 | | | | 3,852,117 | | |
The accompanying Notes to Financial Statements are an integral part of this statement.
Annual Report 2016
9
COLUMBIA LARGE CAP INDEX FUND
PORTFOLIO OF INVESTMENTS (continued)
February 29, 2016
Common Stocks (continued)
Issuer | | Shares | | Value ($) | |
Tobacco 1.8% | |
Altria Group, Inc. | | | 371,544 | | | | 22,875,964 | | |
Philip Morris International, Inc. | | | 293,588 | | | | 26,725,316 | | |
Reynolds American, Inc. | | | 157,071 | | | | 7,921,090 | | |
Total | | | | | 57,522,370 | | |
Total Consumer Staples | | | | | 343,308,683 | | |
ENERGY 6.5% | |
Energy Equipment & Services 1.0% | |
Baker Hughes, Inc. | | | 82,637 | | | | 3,542,648 | | |
Cameron International Corp.(a) | | | 36,216 | | | | 2,374,321 | | |
Diamond Offshore Drilling, Inc. | | | 12,216 | | | | 244,442 | | |
Ensco PLC, Class A | | | 44,631 | | | | 386,951 | | |
FMC Technologies, Inc.(a) | | | 43,202 | | | | 1,059,745 | | |
Halliburton Co. | | | 162,175 | | | | 5,235,009 | | |
Helmerich & Payne, Inc. | | | 20,425 | | | | 1,081,912 | | |
National Oilwell Varco, Inc. | | | 71,203 | | | | 2,084,112 | | |
Schlumberger Ltd. | | | 238,976 | | | | 17,139,359 | | |
Transocean Ltd. | | | 64,791 | | | | 560,442 | | |
Total | | | | | 33,708,941 | | |
Oil, Gas & Consumable Fuels 5.5% | |
Anadarko Petroleum Corp. | | | 96,292 | | | | 3,654,281 | | |
Apache Corp. | | | 71,633 | | | | 2,742,111 | | |
Cabot Oil & Gas Corp. | | | 86,758 | | | | 1,746,439 | | |
California Resources Corp. | | | 13,604 | | | | 7,647 | | |
Chesapeake Energy Corp. | | | 98,071 | | | | 255,965 | | |
Chevron Corp. | | | 356,642 | | | | 29,758,209 | | |
Cimarex Energy Co. | | | 17,919 | | | | 1,505,734 | | |
Columbia Pipeline Group, Inc. | | | 73,737 | | | | 1,338,327 | | |
Concho Resources, Inc.(a) | | | 24,460 | | | | 2,207,270 | | |
ConocoPhillips | | | 233,962 | | | | 7,914,934 | | |
CONSOL Energy, Inc. | | | 43,405 | | | | 374,585 | | |
Devon Energy Corp. | | | 96,711 | | | | 1,903,272 | | |
EOG Resources, Inc. | | | 104,168 | | | | 6,743,836 | | |
EQT Corp. | | | 28,906 | | | | 1,611,220 | | |
Exxon Mobil Corp.(b) | | | 788,867 | | | | 63,227,690 | | |
Hess Corp. | | | 49,520 | | | | 2,159,072 | | |
Kinder Morgan, Inc. | | | 346,751 | | | | 6,272,726 | | |
Marathon Oil Corp. | | | 128,339 | | | | 1,053,663 | | |
Marathon Petroleum Corp. | | | 100,997 | | | | 3,459,147 | | |
Common Stocks (continued)
Issuer | | Shares | | Value ($) | |
Murphy Oil Corp. | | | 30,642 | | | | 526,430 | | |
Newfield Exploration Co.(a) | | | 36,321 | | | | 989,021 | | |
Noble Energy, Inc. | | | 80,653 | | | | 2,379,264 | | |
Occidental Petroleum Corp. | | | 144,726 | | | | 9,960,043 | | |
ONEOK, Inc. | | | 39,658 | | | | 951,792 | | |
Phillips 66 | | | 89,966 | | | | 7,142,401 | | |
Pioneer Natural Resources Co. | | | 30,577 | | | | 3,685,446 | | |
Range Resources Corp. | | | 32,095 | | | | 761,614 | | |
Southwestern Energy Co.(a) | | | 72,849 | | | | 421,067 | | |
Spectra Energy Corp. | | | 127,231 | | | | 3,715,145 | | |
Tesoro Corp. | | | 22,814 | | | | 1,840,634 | | |
Valero Energy Corp. | | | 91,244 | | | | 5,481,940 | | |
Williams Companies, Inc. (The) | | | 129,292 | | | | 2,067,379 | | |
Total | | | | | 177,858,304 | | |
Total Energy | | | | | 211,567,245 | | |
FINANCIALS 15.4% | |
Banks 5.3% | |
Bank of America Corp. | | | 1,973,140 | | | | 24,703,713 | | |
BB&T Corp. | | | 147,837 | | | | 4,754,438 | | |
Citigroup, Inc. | | | 564,512 | | | | 21,931,291 | | |
Citizens Financial Group, Inc. | | | 100,120 | | | | 1,925,308 | | |
Comerica, Inc. | | | 33,491 | | | | 1,131,326 | | |
Fifth Third Bancorp | | | 150,524 | | | | 2,296,996 | | |
Huntington Bancshares, Inc. | | | 150,965 | | | | 1,320,944 | | |
JPMorgan Chase & Co. | | | 697,566 | | | | 39,272,966 | | |
KeyCorp | | | 158,300 | | | | 1,670,065 | | |
M&T Bank Corp. | | | 30,317 | | | | 3,109,008 | | |
People's United Financial, Inc. | | | 58,788 | | | | 858,893 | | |
PNC Financial Services Group, Inc. (The) | | | 96,228 | | | | 7,824,299 | | |
Regions Financial Corp. | | | 247,383 | | | | 1,860,320 | | |
SunTrust Banks, Inc. | | | 96,570 | | | | 3,204,192 | | |
U.S. Bancorp | | | 311,577 | | | | 12,001,946 | | |
Wells Fargo & Co. | | | 880,806 | | | | 41,327,417 | | |
Zions Bancorporation | | | 38,710 | | | | 825,297 | | |
Total | | | | | 170,018,419 | | |
Capital Markets 1.8% | |
Affiliated Managers Group, Inc.(a) | | | 10,240 | | | | 1,420,186 | | |
Ameriprise Financial, Inc.(c) | | | 32,994 | | | | 2,769,846 | | |
Bank of New York Mellon Corp. (The) | | | 207,112 | | | | 7,329,694 | | |
The accompanying Notes to Financial Statements are an integral part of this statement.
Annual Report 2016
10
COLUMBIA LARGE CAP INDEX FUND
PORTFOLIO OF INVESTMENTS (continued)
February 29, 2016
Common Stocks (continued)
Issuer | | Shares | | Value ($) | |
BlackRock, Inc. | | | 23,929 | | | | 7,464,891 | | |
Charles Schwab Corp. (The) | | | 227,025 | | | | 5,686,976 | | |
E*TRADE Financial Corp.(a) | | | 55,505 | | | | 1,302,147 | | |
Franklin Resources, Inc. | | | 71,808 | | | | 2,574,317 | | |
Goldman Sachs Group, Inc. (The) | | | 75,170 | | | | 11,240,170 | | |
Invesco Ltd. | | | 80,321 | | | | 2,147,783 | | |
Legg Mason, Inc. | | | 20,414 | | | | 583,024 | | |
Morgan Stanley | | | 286,190 | | | | 7,068,893 | | |
Northern Trust Corp. | | | 41,187 | | | | 2,445,684 | | |
State Street Corp. | | | 76,460 | | | | 4,188,479 | | |
T. Rowe Price Group, Inc. | | | 47,582 | | | | 3,288,392 | | |
Total | | | | | 59,510,482 | | |
Consumer Finance 0.8% | |
American Express Co. | | | 158,535 | | | | 8,811,375 | | |
Capital One Financial Corp. | | | 100,821 | | | | 6,626,964 | | |
Discover Financial Services | | | 81,007 | | | | 3,760,345 | | |
Navient Corp. | | | 68,657 | | | | 743,555 | | |
Synchrony Financial(a) | | | 158,008 | | | | 4,258,316 | | |
Total | | | | | 24,200,555 | | |
Diversified Financial Services 2.1% | |
Berkshire Hathaway, Inc., Class B(a) | | | 355,013 | | | | 47,632,094 | | |
CME Group, Inc. | | | 64,094 | | | | 5,860,755 | | |
Intercontinental Exchange, Inc. | | | 22,496 | | | | 5,364,396 | | |
Leucadia National Corp. | | | 63,169 | | | | 912,792 | | |
McGraw Hill Financial, Inc. | | | 51,221 | | | | 4,596,573 | | |
Moody's Corp. | | | 32,593 | | | | 2,894,259 | | |
Nasdaq, Inc. | | | 21,786 | | | | 1,378,836 | | |
Total | | | | | 68,639,705 | | |
Insurance 2.6% | |
Aflac, Inc. | | | 80,866 | | | | 4,813,144 | | |
Allstate Corp. (The) | | | 73,394 | | | | 4,657,583 | | |
American International Group, Inc. | | | 234,411 | | | | 11,767,432 | | |
Aon PLC | | | 51,907 | | | | 4,946,218 | | |
Assurant, Inc. | | | 12,476 | | | | 887,044 | | |
Chubb Ltd. | | | 87,329 | | | | 10,089,119 | | |
Cincinnati Financial Corp. | | | 27,945 | | | | 1,764,447 | | |
Hartford Financial Services Group, Inc.
(The) | | | 77,620 | | | | 3,269,354 | | |
Lincoln National Corp. | | | 46,895 | | | | 1,713,074 | | |
Loews Corp. | | | 53,046 | | | | 1,928,222 | | |
Common Stocks (continued)
Issuer | | Shares | | Value ($) | |
Marsh & McLennan Companies, Inc. | | | 98,851 | | | | 5,639,450 | | |
MetLife, Inc. | | | 210,651 | | | | 8,333,354 | | |
Principal Financial Group, Inc. | | | 51,592 | | | | 1,950,694 | | |
Progressive Corp. (The) | | | 110,761 | | | | 3,535,491 | | |
Prudential Financial, Inc. | | | 85,084 | | | | 5,623,202 | | |
Torchmark Corp. | | | 21,735 | | | | 1,113,267 | | |
Travelers Companies, Inc. (The) | | | 57,649 | | | | 6,198,420 | | |
Unum Group | | | 46,133 | | | | 1,316,175 | | |
Willis Towers Watson PLC | | | 26,017 | | | | 2,948,246 | | |
XL Group PLC | | | 56,425 | | | | 1,939,892 | | |
Total | | | | | 84,433,828 | | |
Real Estate Investment Trusts (REITs) 2.8% | |
American Tower Corp. | | | 80,266 | | | | 7,400,525 | | |
Apartment Investment & Management
Co., Class A | | | 29,642 | | | | 1,085,194 | | |
AvalonBay Communities, Inc. | | | 25,938 | | | | 4,451,998 | | |
Boston Properties, Inc. | | | 29,102 | | | | 3,321,702 | | |
Crown Castle International Corp. | | | 63,249 | | | | 5,471,039 | | |
Equinix, Inc. | | | 12,983 | | | | 3,942,807 | | |
Equity Residential | | | 69,027 | | | | 5,141,821 | | |
Essex Property Trust, Inc. | | | 12,513 | | | | 2,618,721 | | |
Extra Space Storage, Inc. | | | 23,370 | | | | 1,919,846 | | |
Federal Realty Investment Trust | | | 13,170 | | | | 1,949,950 | | |
General Growth Properties, Inc. | | | 110,341 | | | | 3,036,584 | | |
HCP, Inc. | | | 88,124 | | | | 2,606,708 | | |
Host Hotels & Resorts, Inc. | | | 142,429 | | | | 2,180,588 | | |
Iron Mountain, Inc. | | | 36,412 | | | | 1,069,785 | | |
Kimco Realty Corp. | | | 78,321 | | | | 2,095,087 | | |
Macerich Co. (The) | | | 25,502 | | | | 2,016,698 | | |
ProLogis, Inc. | | | 99,356 | | | | 3,821,232 | | |
Public Storage | | | 27,891 | | | | 6,958,526 | | |
Realty Income Corp. | | | 47,299 | | | | 2,768,883 | | |
Simon Property Group, Inc. | | | 58,632 | | | | 11,124,249 | | |
SL Green Realty Corp. | | | 18,893 | | | | 1,665,985 | | |
Ventas, Inc. | | | 63,099 | | | | 3,512,721 | | |
Vornado Realty Trust | | | 33,584 | | | | 2,900,314 | | |
Welltower, Inc. | | | 67,059 | | | | 4,277,023 | | |
Weyerhaeuser Co. | | | 149,363 | | | | 3,880,456 | | |
Total | | | | | 91,218,442 | | |
The accompanying Notes to Financial Statements are an integral part of this statement.
Annual Report 2016
11
COLUMBIA LARGE CAP INDEX FUND
PORTFOLIO OF INVESTMENTS (continued)
February 29, 2016
Common Stocks (continued)
Issuer | | Shares | | Value ($) | |
Real Estate Management & Development —% | |
CBRE Group, Inc., Class A(a) | | | 55,092 | | | | 1,399,888 | | |
Total Financials | | | | | 499,421,319 | | |
HEALTH CARE 14.6% | |
Biotechnology 3.3% | |
AbbVie, Inc. | | | 309,781 | | | | 16,917,141 | | |
Alexion Pharmaceuticals, Inc.(a) | | | 42,698 | | | | 6,011,878 | | |
Amgen, Inc. | | | 142,943 | | | | 20,337,930 | | |
Baxalta, Inc. | | | 110,558 | | | | 4,258,694 | | |
Biogen, Inc.(a) | | | 42,240 | | | | 10,957,901 | | |
Celgene Corp.(a) | | | 148,880 | | | | 15,011,570 | | |
Gilead Sciences, Inc. | | | 273,100 | | | | 23,827,975 | | |
Regeneron Pharmaceuticals, Inc.(a) | | | 14,712 | | | | 5,649,702 | | |
Vertex Pharmaceuticals, Inc.(a) | | | 46,563 | | | | 3,980,671 | | |
Total | | | | | 106,953,462 | | |
Health Care Equipment & Supplies 2.2% | |
Abbott Laboratories | | | 282,677 | | | | 10,950,907 | | |
Baxter International, Inc. | | | 103,659 | | | | 4,095,567 | | |
Becton Dickinson and Co. | | | 39,935 | | | | 5,888,416 | | |
Boston Scientific Corp.(a) | | | 254,911 | | | | 4,328,389 | | |
CR Bard, Inc. | | | 14,001 | | | | 2,693,512 | | |
DENTSPLY SIRONA, Inc. | | | 45,704 | | | | 2,786,116 | | |
Edwards Lifesciences Corp.(a) | | | 40,877 | | | | 3,556,299 | | |
Intuitive Surgical, Inc.(a) | | | 7,081 | | | | 3,987,028 | | |
Medtronic PLC | | | 266,463 | | | | 20,621,571 | | |
St. Jude Medical, Inc. | | | 53,563 | | | | 2,875,797 | | |
Stryker Corp. | | | 59,851 | | | | 5,977,918 | | |
Varian Medical Systems, Inc.(a) | | | 18,359 | | | | 1,436,041 | | |
Zimmer Biomet Holdings, Inc. | | | 33,917 | | | | 3,283,505 | | |
Total | | | | | 72,481,066 | | |
Health Care Providers & Services 2.7% | |
Aetna, Inc. | | | 66,078 | | | | 7,178,053 | | |
AmerisourceBergen Corp. | | | 37,019 | | | | 3,206,586 | | |
Anthem, Inc. | | | 49,472 | | | | 6,465,496 | | |
Cardinal Health, Inc. | | | 62,341 | | | | 5,093,260 | | |
CIGNA Corp. | | | 48,815 | | | | 6,815,062 | | |
DaVita HealthCare Partners, Inc.(a) | | | 31,587 | | | | 2,083,794 | | |
Express Scripts Holding Co.(a) | | | 128,153 | | | | 9,019,408 | | |
Five Star Quality Care, Inc.(a)(d)(e) | | | — | | | | 1 | | |
Common Stocks (continued)
Issuer | | Shares | | Value ($) | |
HCA Holdings, Inc.(a) | | | 59,484 | | | | 4,116,888 | | |
Henry Schein, Inc.(a) | | | 15,714 | | | | 2,599,881 | | |
Humana, Inc. | | | 28,088 | | | | 4,970,733 | | |
Laboratory Corp. of America Holdings(a) | | | 19,177 | | | | 2,106,402 | | |
McKesson Corp. | | | 43,605 | | | | 6,785,810 | | |
Patterson Companies, Inc. | | | 15,827 | | | | 687,525 | | |
Quest Diagnostics, Inc. | | | 27,164 | | | | 1,807,221 | | |
Tenet Healthcare Corp.(a) | | | 18,887 | | | | 468,775 | | |
UnitedHealth Group, Inc. | | | 180,612 | | | | 21,510,889 | | |
Universal Health Services, Inc., Class B | | | 17,280 | | | | 1,907,194 | | |
Total | | | | | 86,822,978 | | |
Health Care Technology 0.1% | |
Cerner Corp.(a) | | | 57,697 | | | | 2,946,009 | | |
Life Sciences Tools & Services 0.6% | |
Agilent Technologies, Inc. | | | 62,800 | | | | 2,345,580 | | |
Illumina, Inc.(a) | | | 27,742 | | | | 4,167,958 | | |
PerkinElmer, Inc. | | | 21,211 | | | | 1,002,432 | | |
Thermo Fisher Scientific, Inc. | | | 75,628 | | | | 9,770,381 | | |
Waters Corp.(a) | | | 15,475 | | | | 1,861,797 | | |
Total | | | | | 19,148,148 | | |
Pharmaceuticals 5.7% | |
Allergan PLC(a) | | | 74,686 | | | | 21,667,156 | | |
Bristol-Myers Squibb Co. | | | 316,136 | | | | 19,578,303 | | |
Eli Lilly & Co. | | | 184,947 | | | | 13,316,184 | | |
Endo International PLC(a) | | | 39,447 | | | | 1,649,279 | | |
Johnson & Johnson | | | 524,329 | | | | 55,164,654 | | |
Mallinckrodt PLC(a) | | | 21,972 | | | | 1,428,839 | | |
Merck & Co., Inc. | | | 529,370 | | | | 26,579,668 | | |
Mylan NV(a) | | | 78,275 | | | | 3,527,854 | | |
Perrigo Co. PLC | | | 27,743 | | | | 3,502,554 | | |
Pfizer, Inc. | | | 1,169,769 | | | | 34,707,046 | | |
Zoetis, Inc. | | | 86,806 | | | | 3,564,254 | | |
Total | | | | | 184,685,791 | | |
Total Health Care | | | | | 473,037,454 | | |
INDUSTRIALS 10.0% | |
Aerospace & Defense 2.5% | |
Boeing Co. (The) | | | 119,343 | | | | 14,103,956 | | |
General Dynamics Corp. | | | 56,311 | | | | 7,673,500 | | |
Honeywell International, Inc. | | | 146,044 | | | | 14,801,559 | | |
The accompanying Notes to Financial Statements are an integral part of this statement.
Annual Report 2016
12
COLUMBIA LARGE CAP INDEX FUND
PORTFOLIO OF INVESTMENTS (continued)
February 29, 2016
Common Stocks (continued)
Issuer | | Shares | | Value ($) | |
L-3 Communications Holdings, Inc. | | | 14,854 | | | | 1,742,523 | | |
Lockheed Martin Corp. | | | 50,079 | | | | 10,806,547 | | |
Northrop Grumman Corp. | | | 34,561 | | | | 6,643,315 | | |
Raytheon Co. | | | 57,057 | | | | 7,066,510 | | |
Rockwell Collins, Inc. | | | 24,909 | | | | 2,181,281 | | |
Textron, Inc. | | | 51,860 | | | | 1,771,019 | | |
United Technologies Corp. | | | 147,342 | | | | 14,236,184 | | |
Total | | | | | 81,026,394 | | |
Air Freight & Logistics 0.7% | |
CH Robinson Worldwide, Inc. | | | 27,217 | | | | 1,900,563 | | |
Expeditors International of
Washington, Inc. | | | 35,325 | | | | 1,617,179 | | |
FedEx Corp. | | | 49,764 | | | | 6,811,696 | | |
United Parcel Service, Inc., Class B | | | 131,917 | | | | 12,736,586 | | |
Total | | | | | 23,066,024 | | |
Airlines 0.6% | |
American Airlines Group, Inc. | | | 119,445 | | | | 4,897,245 | | |
Delta Air Lines, Inc. | | | 149,035 | | | | 7,189,449 | | |
Southwest Airlines Co. | | | 123,241 | | | | 5,169,960 | | |
United Continental Holdings, Inc.(a) | | | 70,647 | | | | 4,045,247 | | |
Total | | | | | 21,301,901 | | |
Building Products 0.1% | |
Allegion PLC | | | 18,175 | | | | 1,145,025 | | |
Masco Corp. | | | 63,761 | | | | 1,798,060 | | |
Total | | | | | 2,943,085 | | |
Commercial Services & Supplies 0.4% | |
ADT Corp. (The) | | | 31,255 | | | | 1,261,764 | | |
Cintas Corp. | | | 16,571 | | | | 1,391,798 | | |
Pitney Bowes, Inc. | | | 37,341 | | | | 676,619 | | |
Republic Services, Inc. | | | 45,403 | | | | 2,074,917 | | |
Stericycle, Inc.(a) | | | 16,104 | | | | 1,834,729 | | |
Tyco International PLC | | | 80,111 | | | | 2,818,305 | | |
Waste Management, Inc. | | | 78,687 | | | | 4,394,669 | | |
Total | | | | | 14,452,801 | | |
Construction & Engineering 0.1% | |
Fluor Corp. | | | 26,835 | | | | 1,235,483 | | |
Jacobs Engineering Group, Inc.(a) | | | 23,224 | | | | 897,608 | | |
Quanta Services, Inc.(a) | | | 30,274 | | | | 614,260 | | |
Total | | | | | 2,747,351 | | |
Common Stocks (continued)
Issuer | | Shares | | Value ($) | |
Electrical Equipment 0.5% | |
AMETEK, Inc. | | | 45,078 | | | | 2,092,070 | | |
Eaton Corp. PLC | | | 87,700 | | | | 4,973,467 | | |
Emerson Electric Co. | | | 124,037 | | | | 6,056,727 | | |
Rockwell Automation, Inc. | | | 25,017 | | | | 2,604,019 | | |
Total | | | | | 15,726,283 | | |
Industrial Conglomerates 2.6% | |
3M Co. | | | 116,676 | | | | 18,302,964 | | |
Danaher Corp. | | | 112,978 | | | | 10,085,546 | | |
General Electric Co. | | | 1,788,454 | | | | 52,115,550 | | |
Roper Technologies, Inc. | | | 19,102 | | | | 3,207,799 | | |
Total | | | | | 83,711,859 | | |
Machinery 1.2% | |
Caterpillar, Inc. | | | 110,332 | | | | 7,469,476 | | |
Cummins, Inc. | | | 31,126 | | | | 3,036,964 | | |
Deere & Co. | | | 59,077 | | | | 4,736,794 | | |
Dover Corp. | | | 29,366 | | | | 1,784,865 | | |
Flowserve Corp. | | | 24,799 | | | | 1,042,054 | | |
Illinois Tool Works, Inc. | | | 61,993 | | | | 5,842,840 | | |
Ingersoll-Rand PLC | | | 49,468 | | | | 2,748,442 | | |
PACCAR, Inc. | | | 66,979 | | | | 3,449,419 | | |
Parker-Hannifin Corp. | | | 25,768 | | | | 2,607,722 | | |
Pentair PLC | | | 34,158 | | | | 1,629,678 | | |
Snap-On, Inc. | | | 11,005 | | | | 1,592,093 | | |
Stanley Black & Decker, Inc. | | | 28,373 | | | | 2,667,346 | | |
Xylem, Inc. | | | 33,989 | | | | 1,271,529 | | |
Total | | | | | 39,879,222 | | |
Professional Services 0.3% | |
Dun & Bradstreet Corp. (The) | | | 6,847 | | | | 655,874 | | |
Equifax, Inc. | | | 22,451 | | | | 2,354,661 | | |
Nielsen Holdings PLC | | | 68,988 | | | | 3,472,856 | | |
Robert Half International, Inc. | | | 25,144 | | | | 990,422 | | |
Verisk Analytics, Inc.(a) | | | 29,538 | | | | 2,151,548 | | |
Total | | | | | 9,625,361 | | |
Road & Rail 0.8% | |
CSX Corp. | | | 184,750 | | | | 4,459,865 | | |
JB Hunt Transport Services, Inc. | | | 17,156 | | | | 1,308,831 | | |
Kansas City Southern | | | 20,681 | | | | 1,689,845 | | |
Norfolk Southern Corp. | | | 56,578 | | | | 4,139,812 | | |
The accompanying Notes to Financial Statements are an integral part of this statement.
Annual Report 2016
13
COLUMBIA LARGE CAP INDEX FUND
PORTFOLIO OF INVESTMENTS (continued)
February 29, 2016
Common Stocks (continued)
Issuer | | Shares | | Value ($) | |
Ryder System, Inc. | | | 10,124 | | | | 574,233 | | |
Union Pacific Corp. | | | 161,854 | | | | 12,763,807 | | |
Total | | | | | 24,936,393 | | |
Trading Companies & Distributors 0.2% | |
Fastenal Co. | | | 54,897 | | | | 2,486,285 | | |
United Rentals, Inc.(a) | | | 17,591 | | | | 907,168 | | |
WW Grainger, Inc. | | | 10,946 | | | | 2,374,187 | | |
Total | | | | | 5,767,640 | | |
Total Industrials | | | | | 325,184,314 | | |
INFORMATION TECHNOLOGY 20.2% | |
Communications Equipment 1.0% | |
Cisco Systems, Inc. | | | 961,905 | | | | 25,182,673 | | |
F5 Networks, Inc.(a) | | | 13,336 | | | | 1,282,523 | | |
Harris Corp. | | | 23,576 | | | | 1,839,400 | | |
Juniper Networks, Inc. | | | 67,269 | | | | 1,661,544 | | |
Motorola Solutions, Inc. | | | 30,447 | | | | 2,237,550 | | |
Total | | | | | 32,203,690 | | |
Electronic Equipment, Instruments & Components 0.4% | |
Amphenol Corp., Class A | | | 58,415 | | | | 3,100,084 | | |
Corning, Inc. | | | 210,903 | | | | 3,859,525 | | |
FLIR Systems, Inc. | | | 26,176 | | | | 810,409 | | |
TE Connectivity Ltd. | | | 73,204 | | | | 4,166,772 | | |
Total | | | | | 11,936,790 | | |
Internet Software & Services 4.3% | |
Akamai Technologies, Inc.(a) | | | 33,719 | | | | 1,819,815 | | |
Alphabet, Inc., Class A(a) | | | 55,206 | | | | 39,594,847 | | |
Alphabet, Inc., Class C(a) | | | 56,306 | | | | 39,288,638 | | |
eBay, Inc.(a) | | | 209,319 | | | | 4,981,792 | | |
Facebook, Inc., Class A(a) | | | 430,246 | | | | 46,001,902 | | |
VeriSign, Inc.(a) | | | 18,595 | | | | 1,571,092 | | |
Yahoo!, Inc.(a) | | | 164,637 | | | | 5,233,810 | | |
Total | | | | | 138,491,896 | | |
IT Services 3.6% | |
Accenture PLC, Class A | | | 118,399 | | | | 11,870,684 | | |
Alliance Data Systems Corp.(a) | | | 11,586 | | | | 2,434,566 | | |
Automatic Data Processing, Inc. | | | 87,398 | | | | 7,401,737 | | |
Cognizant Technology Solutions Corp.,
Class A(a) | | | 115,228 | | | | 6,565,691 | | |
CSRA, Inc. | | | 26,094 | | | | 677,139 | | |
Common Stocks (continued)
Issuer | | Shares | | Value ($) | |
Fidelity National Information Services, Inc. | | | 52,573 | | | | 3,062,377 | | |
Fiserv, Inc.(a) | | | 43,308 | | | | 4,141,544 | | |
International Business Machines Corp. | | | 169,127 | | | | 22,160,711 | | |
MasterCard, Inc., Class A | | | 187,643 | | | | 16,309,930 | | |
Paychex, Inc. | | | 60,806 | | | | 3,124,820 | | |
PayPal Holdings, Inc.(a) | | | 210,672 | | | | 8,035,030 | | |
Teradata Corp.(a) | | | 25,203 | | | | 628,815 | | |
Total System Services, Inc. | | | 32,076 | | | | 1,397,872 | | |
Visa, Inc., Class A | | | 368,846 | | | | 26,700,762 | | |
Western Union Co. (The) | | | 95,750 | | | | 1,748,395 | | |
Xerox Corp. | | | 180,337 | | | | 1,733,039 | | |
Total | | | | | 117,993,112 | | |
Semiconductors & Semiconductor Equipment 2.7% | |
Analog Devices, Inc. | | | 59,135 | | | | 3,133,564 | | |
Applied Materials, Inc. | | | 217,758 | | | | 4,109,093 | | |
Broadcom Ltd. | | | 73,687 | | | | 9,871,847 | | |
First Solar, Inc.(a) | | | 14,343 | | | | 1,030,831 | | |
Intel Corp. | | | 894,239 | | | | 26,460,532 | | |
KLA-Tencor Corp. | | | 29,551 | | | | 2,001,785 | | |
Lam Research Corp. | | | 30,015 | | | | 2,200,099 | | |
Linear Technology Corp. | | | 45,317 | | | | 1,976,728 | | |
Microchip Technology, Inc. | | | 38,491 | | | | 1,712,465 | | |
Micron Technology, Inc.(a) | | | 205,748 | | | | 2,187,101 | | |
NVIDIA Corp. | | | 96,852 | | | | 3,037,279 | | |
Qorvo, Inc.(a) | | | 24,464 | | | | 1,102,837 | | |
QUALCOMM, Inc. | | | 284,833 | | | | 14,466,668 | | |
Skyworks Solutions, Inc. | | | 36,223 | | | | 2,407,018 | | |
Texas Instruments, Inc. | | | 192,229 | | | | 10,191,982 | | |
Xilinx, Inc. | | | 48,696 | | | | 2,299,425 | | |
Total | | | | | 88,189,254 | | |
Software 4.3% | |
Activision Blizzard, Inc. | | | 95,605 | | | | 3,027,810 | | |
Adobe Systems, Inc.(a) | | | 94,521 | | | | 8,048,463 | | |
Autodesk, Inc.(a) | | | 42,864 | | | | 2,217,783 | | |
CA, Inc. | | | 56,070 | | | | 1,642,290 | | |
Citrix Systems, Inc.(a) | | | 29,149 | | | | 2,059,377 | | |
Electronic Arts, Inc.(a) | | | 58,897 | | | | 3,783,543 | | |
Intuit, Inc. | | | 50,028 | | | | 4,834,706 | | |
Microsoft Corp. | | | 1,513,691 | | | | 77,016,598 | | |
Oracle Corp. | | | 606,688 | | | | 22,313,985 | | |
The accompanying Notes to Financial Statements are an integral part of this statement.
Annual Report 2016
14
COLUMBIA LARGE CAP INDEX FUND
PORTFOLIO OF INVESTMENTS (continued)
February 29, 2016
Common Stocks (continued)
Issuer | | Shares | | Value ($) | |
Red Hat, Inc.(a) | | | 34,641 | | | | 2,263,789 | | |
Salesforce.com, inc.(a) | | | 118,277 | | | | 8,013,267 | | |
Symantec Corp. | | | 128,011 | | | | 2,471,893 | | |
Total | | | | | 137,693,504 | | |
Technology Hardware, Storage & Peripherals 3.9% | |
Apple, Inc. | | | 1,056,512 | | | | 102,154,145 | | |
EMC Corp. | | | 367,405 | | | | 9,600,293 | | |
Hewlett Packard Enterprise Co. | | | 340,759 | | | | 4,521,872 | | |
HP, Inc. | | | 342,311 | | | | 3,659,305 | | |
NetApp, Inc. | | | 55,398 | | | | 1,376,086 | | |
SanDisk Corp. | | | 38,030 | | | | 2,748,048 | | |
Seagate Technology PLC | | | 56,666 | | | | 1,777,046 | | |
Western Digital Corp. | | | 43,910 | | | | 1,911,402 | | |
Total | | | | | 127,748,197 | | |
Total Information Technology | | | | | 654,256,443 | | |
MATERIALS 2.8% | |
Chemicals 2.1% | |
Air Products & Chemicals, Inc. | | | 36,741 | | | | 4,867,080 | | |
Airgas, Inc. | | | 12,289 | | | | 1,739,139 | | |
CF Industries Holdings, Inc. | | | 44,167 | | | | 1,610,329 | | |
Dow Chemical Co. (The) | | | 213,093 | | | | 10,358,451 | | |
Eastman Chemical Co. | | | 28,161 | | | | 1,806,528 | | |
Ecolab, Inc. | | | 50,363 | | | | 5,164,726 | | |
EI du Pont de Nemours & Co. | | | 166,077 | | | | 10,109,107 | | |
FMC Corp. | | | 25,321 | | | | 953,082 | | |
International Flavors & Fragrances, Inc. | | | 15,207 | | | | 1,570,731 | | |
LyondellBasell Industries NV, Class A | | | 68,135 | | | | 5,465,108 | | |
Monsanto Co. | | | 83,348 | | | | 7,500,487 | | |
Mosaic Co. (The) | | | 63,546 | | | | 1,693,501 | | |
PPG Industries, Inc. | | | 51,026 | | | | 4,925,540 | | |
Praxair, Inc. | | | 53,978 | | | | 5,494,421 | | |
Sherwin-Williams Co. (The) | | | 14,996 | | | | 4,056,418 | | |
Total | | | | | 67,314,648 | | |
Construction Materials 0.1% | |
Martin Marietta Materials, Inc. | | | 12,534 | | | | 1,787,599 | | |
Vulcan Materials Co. | | | 25,264 | | | | 2,489,262 | | |
Total | | | | | 4,276,861 | | |
Containers & Packaging 0.3% | |
Avery Dennison Corp. | | | 17,264 | | | | 1,124,232 | | |
Common Stocks (continued)
Issuer | | Shares | | Value ($) | |
Ball Corp. | | | 25,833 | | | | 1,710,919 | | |
International Paper Co. | | | 78,559 | | | | 2,804,556 | | |
Owens-Illinois, Inc.(a) | | | 30,478 | | | | 455,951 | | |
Sealed Air Corp. | | | 37,411 | | | | 1,710,805 | | |
Westrock Co. | | | 48,722 | | | | 1,645,342 | | |
Total | | | | | 9,451,805 | | |
Metals & Mining 0.3% | |
Alcoa, Inc. | | | 248,266 | | | | 2,217,015 | | |
Freeport-McMoRan, Inc. | | | 236,875 | | | | 1,807,356 | | |
Newmont Mining Corp. | | | 100,267 | | | | 2,589,897 | | |
Nucor Corp. | | | 60,566 | | | | 2,382,667 | | |
Total | | | | | 8,996,935 | | |
Total Materials | | | | | 90,040,249 | | |
TELECOMMUNICATION SERVICES 2.7% | |
Diversified Telecommunication Services 2.7% | |
AT&T, Inc. | | | 1,165,790 | | | | 43,075,940 | | |
CenturyLink, Inc. | | | 104,035 | | | | 3,182,431 | | |
Frontier Communications Corp. | | | 221,374 | | | | 1,197,633 | | |
Level 3 Communications, Inc.(a) | | | 54,685 | | | | 2,654,957 | | |
Verizon Communications, Inc. | | | 771,042 | | | | 39,114,961 | | |
Total | | | | | 89,225,922 | | |
Total Telecommunication Services | | | | | 89,225,922 | | |
UTILITIES 3.3% | |
Electric Utilities 1.9% | |
American Electric Power Co., Inc. | | | 93,009 | | | | 5,743,306 | | |
Duke Energy Corp. | | | 130,438 | | | | 9,688,935 | | |
Edison International | | | 61,740 | | | | 4,208,198 | | |
Entergy Corp. | | | 33,804 | | | | 2,440,987 | | |
Eversource Energy | | | 60,107 | | | | 3,263,810 | | |
Exelon Corp. | | | 174,255 | | | | 5,487,290 | | |
FirstEnergy Corp. | | | 80,165 | | | | 2,683,122 | | |
NextEra Energy, Inc. | | | 87,270 | | | | 9,845,801 | | |
Pepco Holdings, Inc. | | | 48,060 | | | | 1,258,211 | | |
Pinnacle West Capital Corp. | | | 21,006 | | | | 1,445,843 | | |
PPL Corp. | | | 127,303 | | | | 4,454,332 | | |
Southern Co. (The) | | | 172,242 | | | | 8,298,620 | | |
Xcel Energy, Inc. | | | 96,169 | | | | 3,802,522 | | |
Total | | | | | 62,620,977 | | |
The accompanying Notes to Financial Statements are an integral part of this statement.
Annual Report 2016
15
COLUMBIA LARGE CAP INDEX FUND
PORTFOLIO OF INVESTMENTS (continued)
February 29, 2016
Common Stocks (continued)
Issuer | | Shares | | Value ($) | |
Gas Utilities —% | |
AGL Resources, Inc. | | | 22,785 | | | | 1,473,050 | | |
Independent Power and Renewable Electricity
Producers 0.1% | |
AES Corp. (The) | | | 127,506 | | | | 1,249,559 | | |
NRG Energy, Inc. | | | 59,536 | | | | 641,798 | | |
Total | | | | | 1,891,357 | | |
Multi-Utilities 1.3% | |
Ameren Corp. | | | 45,979 | | | | 2,158,714 | | |
CenterPoint Energy, Inc. | | | 81,534 | | | | 1,518,978 | | |
CMS Energy Corp. | | | 52,505 | | | | 2,077,098 | | |
Consolidated Edison, Inc. | | | 55,559 | | | | 3,889,686 | | |
Dominion Resources, Inc. | | | 112,814 | | | | 7,887,955 | | |
DTE Energy Co. | | | 34,010 | | | | 2,860,921 | | |
NiSource, Inc. | | | 60,387 | | | | 1,297,113 | | |
PG&E Corp. | | | 92,940 | | | | 5,272,486 | | |
Public Service Enterprise Group, Inc. | | | 95,879 | | | | 4,090,198 | | |
SCANA Corp. | | | 27,082 | | | | 1,760,872 | | |
Sempra Energy | | | 44,683 | | | | 4,312,356 | | |
TECO Energy, Inc. | | | 44,576 | | | | 1,224,503 | | |
WEC Energy Group, Inc. | | | 59,821 | | | | 3,370,913 | | |
Total | | | | | 41,721,793 | | |
Total Utilities | | | | | 107,707,177 | | |
Total Common Stocks
(Cost: $2,098,620,789) | | | | | 3,208,541,243 | | |
Money Market Funds 0.9%
| | | Shares | | Value ($) | |
Columbia Short-Term Cash Fund,
0.420%(c)(f) | | | 28,155,791 | | | | 28,155,791 | | |
Total Money Market Funds
(Cost: $28,155,791) | | | | | 28,155,791 | | |
Total Investments
(Cost: $2,126,776,580) | | | | | 3,236,697,034 | | |
Other Assets & Liabilities, Net | | | | | 5,117,254 | | |
Net Assets | | | | | 3,241,814,288 | | |
At February 29, 2016, securities totaling $3,230,045 were pledged as collateral.
Investments in Derivatives
Futures Contracts Outstanding at February 29, 2016
Long Futures Contracts Outstanding
Contract Description | | Number of
Contracts | | Trading
Currency | | Notional
Market
Value ($) | | Expiration
Date | | Unrealized
Appreciation ($) | | Unrealized
Depreciation ($) | |
S&P 500 FUTURE | | | 66 | | | USD | | | | | 31,836,750 | | | 03/2016 | | | 902,119 | | | | — | | |
Notes to Portfolio of Investments
(a) Non-income producing investment.
(b) This security or a portion of this security has been pledged as collateral in connection with derivative contracts.
The accompanying Notes to Financial Statements are an integral part of this statement.
Annual Report 2016
16
COLUMBIA LARGE CAP INDEX FUND
PORTFOLIO OF INVESTMENTS (continued)
February 29, 2016
Notes to Portfolio of Investments (continued)
(c) As defined in the Investment Company Act of 1940, an affiliated company is one in which the Fund owns 5% or more of the company's outstanding voting securities, or a company which is under common ownership or control with the Fund. Holdings and transactions in these affiliated companies during the year ended February 29, 2016 are as follows:
Issuer | | Beginning
Cost ($) | | Purchase
Cost ($) | | Proceeds
From Sales ($) | | Realized
Gain (Loss) ($) | | Ending
Cost ($) | | Dividends —
Affiliated
Issuers ($) | | Value ($) | |
Ameriprise
Financial, Inc. | | | 1,067,614 | | | | 244,286 | | | | (430,288 | ) | | | 74,286 | | | | 955,898 | | | | 92,100 | | | | 2,769,846 | | |
Columbia
Short-Term
Cash Fund | | | 172,199,950 | | | | 542,955,926 | | | | (687,000,085 | ) | | | — | | | | 28,155,791 | | | | 132,643 | | | | 28,155,791 | | |
Total | | | 173,267,564 | | | | 543,200,212 | | | | (687,430,373 | ) | | | 74,286 | | | | 29,111,689 | | | | 224,743 | | | | 30,925,637 | | |
(d) Identifies securities considered by the Investment Manager to be illiquid and may be difficult to sell. The aggregate value of such securities at February 29, 2016 was $1, which represents less than 0.01% of net assets. Information concerning such security holdings at February 29, 2016 is as follows:
Security Description | | Acquisition Dates | | Cost ($) | |
Five Star Quality Care, Inc. | | 01/02/2002 | | | 2 | | |
(e) Represents fractional shares.
(f) The rate shown is the seven-day current annualized yield at February 29, 2016.
Currency Legend
USD US Dollar
Fair Value Measurements
The Fund categorizes its fair value measurements according to a three-level hierarchy that maximizes the use of observable inputs and minimizes the use of unobservable inputs by prioritizing that the most observable input be used when available. Observable inputs are those that market participants would use in pricing an investment based on market data obtained from sources independent of the reporting entity. Unobservable inputs are those that reflect the Fund's assumptions about the information market participants would use in pricing an investment. An investment's level within the fair value hierarchy is based on the lowest level of any input that is deemed significant to the asset's or liability's fair value measurement. The input levels are not necessarily an indication of the risk or liquidity associated with investments at that level. For example, certain U.S. government securities are generally high quality and liquid, however, they are reflected as Level 2 because the inputs used to determine fair value may not always be quoted prices in an active market.
Fair value inputs are summarized in the three broad levels listed below:
> Level 1 — Valuations based on quoted prices for investments in active markets that the Fund has the ability to access at the measurement date (including NAV for open-end mutual funds). Valuation adjustments are not applied to Level 1 investments.
> Level 2 — Valuations based on other significant observable inputs (including quoted prices for similar securities, interest rates, prepayment speeds, credit risks, etc.).
> Level 3 — Valuations based on significant unobservable inputs (including the Fund's own assumptions and judgment in determining the fair value of investments).
Inputs that are used in determining fair value of an investment may include price information, credit data, volatility statistics, and other factors. These inputs can be either observable or unobservable. The availability of observable inputs can vary between investments, and is affected by various factors such as the type of investment, and the volume and level of activity for that investment or similar investments in the marketplace. The inputs will be considered by the Investment Manager, along with any other relevant factors in the calculation of an investment's fair value. The Fund uses prices and inputs that are current as of the measurement date, which may include periods of market dislocations. During these periods, the availability of prices and inputs may be reduced for many investments. This condition could cause an investment to be reclassified between the various levels within the hierarchy.
The accompanying Notes to Financial Statements are an integral part of this statement.
Annual Report 2016
17
COLUMBIA LARGE CAP INDEX FUND
PORTFOLIO OF INVESTMENTS (continued)
February 29, 2016
Fair Value Measurements (continued)
Investments falling into the Level 3 category are primarily supported by quoted prices from brokers and dealers participating in the market for those investments. However, these may be classified as Level 3 investments due to lack of market transparency and corroboration to support these quoted prices. Additionally, valuation models may be used as the pricing source for any remaining investments classified as Level 3. These models may rely on one or more significant unobservable inputs and/or significant assumptions by the Investment Manager. Inputs used in valuations may include, but are not limited to, financial statement analysis, capital account balances, discount rates and estimated cash flows, and comparable company data.
Under the direction of the Fund's Board of Trustees (the Board), the Investment Manager's Valuation Committee (the Committee) is responsible for overseeing the valuation procedures approved by the Board. The Committee consists of voting and non-voting members from various groups within the Investment Manager's organization, including operations and accounting, trading and investments, compliance, risk management and legal.
The Committee meets at least monthly to review and approve valuation matters, which may include a description of specific valuation determinations, data regarding pricing information received from approved pricing vendors and brokers and the results of Board-approved valuation control policies and procedures (the Policies). The Policies address, among other things, instances when market quotations are or are not readily available, including recommendations of third party pricing vendors and a determination of appropriate pricing methodologies; events that require specific valuation determinations and assessment of fair value techniques; securities with a potential for stale pricing, including those that are illiquid, restricted, or in default; and the effectiveness of third party pricing vendors, including periodic reviews of vendors. The Committee meets more frequently, as needed, to discuss additional valuation matters, which may include the need to review back-testing results, review time-sensitive information or approve related valuation actions. The Committee reports to the Board, with members of the Committee meeting with the Board at each of its regularly scheduled meetings to discuss valuation matters and actions during the period, similar to those described earlier.
For investments categorized as Level 3, the Committee monitors information similar to that described above, which may include: (i) data specific to the issuer or comparable issuers, (ii) general market or specific sector news and (iii) quoted prices and specific or similar security transactions. The Committee considers this data and any changes from prior periods in order to assess the reasonableness of observable and unobservable inputs, any assumptions or internal models used to value those securities and changes in fair value. This data is also used to corroborate, when available, information received from approved pricing vendors and brokers. Various factors impact the frequency of monitoring this information (which may occur as often as daily). However, the Committee may determine that changes to inputs, assumptions and models are not required as a result of the monitoring procedures performed.
The following table is a summary of the inputs used to value the Fund's investments at February 29, 2016:
| | | Level 1
Quoted Prices in Active
Markets for Identical
Assets ($) | |
Level 2
Other Significant
Observable Inputs ($) | |
Level 3
Significant
Unobservable Inputs ($) | |
Total ($) | |
Investments | |
Common Stocks | |
Consumer Discretionary | | | 414,792,437 | | | | — | | | | — | | | | 414,792,437 | | |
Consumer Staples | | | 343,308,683 | | | | — | | | | — | | | | 343,308,683 | | |
Energy | | | 211,567,245 | | | | — | | | | — | | | | 211,567,245 | | |
Financials | | | 499,421,319 | | | | — | | | | — | | | | 499,421,319 | | |
Health Care | | | 473,037,453 | | | | 1 | | | | — | | | | 473,037,454 | | |
Industrials | | | 325,184,314 | | | | — | | | | — | | | | 325,184,314 | | |
Information Technology | | | 654,256,443 | | | | — | | | | — | | | | 654,256,443 | | |
Materials | | | 90,040,249 | | | | — | | | | — | | | | 90,040,249 | | |
Telecommunication Services | | | 89,225,922 | | | | — | | | | — | | | | 89,225,922 | | |
Utilities | | | 107,707,177 | | | | — | | | | — | | | | 107,707,177 | | |
Total Common Stocks | | | 3,208,541,242 | | | | 1 | | | | — | | | | 3,208,541,243 | | |
Money Market Funds | | | — | | | | 28,155,791 | | | | — | | | | 28,155,791 | | |
Total Investments | | | 3,208,541,242 | | | | 28,155,792 | | | | — | | | | 3,236,697,034 | | |
Derivatives | |
Assets | |
Futures Contracts | | | 902,119 | | | | — | | | | — | | | | 902,119 | | |
Total | | | 3,209,443,361 | | | | 28,155,792 | | | | — | | | | 3,237,599,153 | | |
The accompanying Notes to Financial Statements are an integral part of this statement.
Annual Report 2016
18
COLUMBIA LARGE CAP INDEX FUND
PORTFOLIO OF INVESTMENTS (continued)
February 29, 2016
Fair Value Measurements (continued)
See the Portfolio of Investments for all investment classifications not indicated in the table.
The Fund's assets assigned to the Level 2 input category are valued based upon utilizing observable market inputs, in which a security's value is determined through reference to prices and information from market transactions for similar or identical assets and/or fund per share market values which are not considered publicly available.
Derivative instruments are valued at unrealized appreciation (depreciation).
Financial assets were transferred from Level 1 to Level 2 as the market for these assets is not considered publicly available. Fund per share market values were obtained using observable market inputs.
The following table shows transfers between Level 1 and Level 2 of the fair value hierarchy:
Transfers In | | Transfers Out | |
| Level 1 ($) | | Level 2 ($) | | Level 1 ($) | | Level 2 ($) | |
| | — | | | | 172,199,950 | | | | 172,199,950 | | | | — | | |
Transfers between Level 1 and Level 2 are determined based on the fair value at the beginning of the period for security positions held throughout the period.
There were no transfers of financial assets between Levels 2 and 3 during the period.
The accompanying Notes to Financial Statements are an integral part of this statement.
Annual Report 2016
19
COLUMBIA LARGE CAP INDEX FUND
STATEMENT OF ASSETS AND LIABILITIES
February 29, 2016
Assets | |
Investments, at value | |
Unaffiliated issuers (identified cost $2,097,664,891) | | $ | 3,205,771,397 | | |
Affiliated issuers (identified cost $29,111,689) | | | 30,925,637 | | |
Total investments (identified cost $2,126,776,580) | | | 3,236,697,034 | | |
Receivable for: | |
Investments sold | | | 648,084 | | |
Capital shares sold | | | 4,379,879 | | |
Dividends | | | 8,086,453 | | |
Foreign tax reclaims | | | 805 | | |
Expense reimbursement due from Investment Manager | | | 903 | | |
Total assets | | | 3,249,813,158 | | |
Liabilities | |
Payable for: | |
Investments purchased | | | 1,546,163 | | |
Capital shares purchased | | | 5,941,740 | | |
Variation margin | | | 252,532 | | |
Investment management fees | | | 53,593 | | |
Distribution and/or service fees | | | 20,528 | | |
Compensation of board members | | | 180,677 | | |
Other expenses | | | 3,637 | | |
Total liabilities | | | 7,998,870 | | |
Net assets applicable to outstanding capital stock | | $ | 3,241,814,288 | | |
Represented by | |
Paid-in capital | | $ | 2,166,111,155 | | |
Undistributed net investment income | | | 9,716,963 | | |
Accumulated net realized loss | | | (44,836,403 | ) | |
Unrealized appreciation (depreciation) on: | |
Investments — unaffiliated issuers | | | 1,108,106,506 | | |
Investments — affiliated issuers | | | 1,813,948 | | |
Futures contracts | | | 902,119 | | |
Total — representing net assets applicable to outstanding capital stock | | $ | 3,241,814,288 | | |
The accompanying Notes to Financial Statements are an integral part of this statement.
Annual Report 2016
20
COLUMBIA LARGE CAP INDEX FUND
STATEMENT OF ASSETS AND LIABILITIES (continued)
February 29, 2016
Class A | |
Net assets | | $ | 993,375,931 | | |
Shares outstanding | | | 26,812,230 | | |
Net asset value per share | | $ | 37.05 | | |
Class B | |
Net assets | | $ | 166,644 | | |
Shares outstanding | | | 4,488 | | |
Net asset value per share | | $ | 37.13 | | |
Class I | |
Net assets | | $ | 2,622 | | |
Shares outstanding | | | 70 | | |
Net asset value per share(a) | | $ | 37.21 | | |
Class R5 | |
Net assets | | $ | 273,169,688 | | |
Shares outstanding | | | 7,245,574 | | |
Net asset value per share | | $ | 37.70 | | |
Class Z | |
Net assets | | $ | 1,975,099,403 | | |
Shares outstanding | | | 53,064,729 | | |
Net asset value per share | | $ | 37.22 | | |
(a) Net asset value per share rounds to this amount due to fractional shares outstanding.
The accompanying Notes to Financial Statements are an integral part of this statement.
Annual Report 2016
21
COLUMBIA LARGE CAP INDEX FUND
STATEMENT OF OPERATIONS
Year Ended February 29, 2016
Net investment income | |
Income: | |
Dividends — unaffiliated issuers | | $ | 73,930,565 | | |
Dividends — affiliated issuers | | | 224,743 | | |
Foreign taxes withheld | | | (5,238 | ) | |
Total income | | | 74,150,070 | | |
Expenses: | |
Investment management fees | | | 7,086,283 | | |
Distribution and/or service fees | |
Class A | | | 2,648,925 | | |
Class B | | | 2,000 | | |
Compensation of board members | | | 43,851 | | |
Other | | | 23,346 | | |
Total expenses | | | 9,804,405 | | |
Fees waived or expenses reimbursed by Investment Manager and its affiliates | | | (88,551 | ) | |
Expense reductions | | | (3,909 | ) | |
Total net expenses | | | 9,711,945 | | |
Net investment income | | | 64,438,125 | | |
Realized and unrealized gain (loss) — net | |
Net realized gain (loss) on: | |
Investments — unaffiliated issuers | | | (10,011,398 | ) | |
Investments — affiliated issuers | | | 74,286 | | |
Futures contracts | | | 1,890,197 | | |
Net realized loss | | | (8,046,915 | ) | |
Net change in unrealized appreciation (depreciation) on: | |
Investments — unaffiliated issuers | | | (278,691,965 | ) | |
Investments — affiliated issuers | | | (1,773,573 | ) | |
Futures contracts | | | (6,518,836 | ) | |
Net change in unrealized depreciation | | | (286,984,374 | ) | |
Net realized and unrealized loss | | | (295,031,289 | ) | |
Net decrease in net assets from operations | | $ | (230,593,164 | ) | |
The accompanying Notes to Financial Statements are an integral part of this statement.
Annual Report 2016
22
COLUMBIA LARGE CAP INDEX FUND
STATEMENT OF CHANGES IN NET ASSETS
| | | Year Ended
February 29,
2016 | | Year Ended
February 28,
2015 | |
Operations | |
Net investment income | | $ | 64,438,125 | | | $ | 77,497,476 | | |
Net realized gain (loss) | | | (8,046,915 | ) | | | 13,059,168 | | |
Net change in unrealized appreciation (depreciation) | | | (286,984,374 | ) | | | 394,702,946 | | |
Net increase (decrease) in net assets resulting from operations | | | (230,593,164 | ) | | | 485,259,590 | | |
Distributions to shareholders | |
Net investment income | |
Class A | | | (22,249,897 | ) | | | (14,829,787 | ) | |
Class B | | | (2,716 | ) | | | (1,921 | ) | |
Class I | | | (67 | ) | | | (49 | ) | |
Class R5 | | | (5,651,926 | ) | | | (2,613,002 | ) | |
Class Z | | | (53,272,680 | ) | | | (39,992,685 | ) | |
Net realized gains | |
Class A | | | (2,731,656 | ) | | | (398,619 | ) | |
Class B | | | (525 | ) | | | (96 | ) | |
Class I | | | (7 | ) | | | (1 | ) | |
Class R5 | | | (543,620 | ) | | | (61,227 | ) | |
Class Z | | | (6,206,317 | ) | | | (899,951 | ) | |
Total distributions to shareholders | | | (90,659,411 | ) | | | (58,797,338 | ) | |
Increase (decrease) in net assets from capital stock activity | | | (140,228,807 | ) | | | 73,317,379 | | |
Total increase (decrease) in net assets | | | (461,481,382 | ) | | | 499,779,631 | | |
Net assets at beginning of year | | | 3,703,295,670 | | | | 3,203,516,039 | | |
Net assets at end of year | | $ | 3,241,814,288 | | | $ | 3,703,295,670 | | |
Undistributed net investment income | | $ | 9,716,963 | | | $ | 27,684,138 | | |
The accompanying Notes to Financial Statements are an integral part of this statement.
Annual Report 2016
23
COLUMBIA LARGE CAP INDEX FUND
STATEMENT OF CHANGES IN NET ASSETS (continued)
| | | Year Ended February 29, 2016 | | Year Ended February 28, 2015 | |
| | | Shares | | Dollars ($) | | Shares | | Dollars ($) | |
Capital stock activity | |
Class A shares | |
Subscriptions(a) | | | 8,616,166 | | | | 337,268,633 | | | | 12,232,068 | | | | 466,788,193 | | |
Distributions reinvested | | | 582,904 | | | | 23,472,176 | | | | 367,515 | | | | 14,549,403 | | |
Redemptions | | | (10,130,663 | ) | | | (399,110,370 | ) | | | (7,070,021 | ) | | | (270,204,930 | ) | |
Net increase (decrease) | | | (931,593 | ) | | | (38,369,561 | ) | | | 5,529,562 | | | | 211,132,666 | | |
Class B shares | |
Subscriptions | | | 62 | | | | 2,511 | | | | 284 | | | | 10,627 | | |
Distributions reinvested | | | 77 | | | | 3,104 | | | | 48 | | | | 1,904 | | |
Redemptions(a) | | | (1,625 | ) | | | (64,567 | ) | | | (1,627 | ) | | | (59,770 | ) | |
Net decrease | | | (1,486 | ) | | | (58,952 | ) | | | (1,295 | ) | | | (47,239 | ) | |
Class I shares | |
Redemptions | | | — | | | | — | | | | (33 | ) | | | (1,200 | ) | |
Net decrease | | | — | | | | — | | | | (33 | ) | | | (1,200 | ) | |
Class R5 shares | |
Subscriptions | | | 5,083,112 | | | | 204,324,481 | | | | 2,040,503 | | | | 78,666,552 | | |
Distributions reinvested | | | 151,465 | | | | 6,195,546 | | | | 62,516 | | | | 2,517,400 | | |
Redemptions | | | (2,111,691 | ) | | | (84,985,566 | ) | | | (681,138 | ) | | | (26,562,692 | ) | |
Net increase | | | 3,122,886 | | | | 125,534,461 | | | | 1,421,881 | | | | 54,621,260 | | |
Class Z shares | |
Subscriptions | | | 10,127,623 | | | | 398,923,467 | | | | 10,922,158 | | | | 418,946,102 | | |
Distributions reinvested | | | 1,152,502 | | | | 46,609,911 | | | | 798,567 | | | | 31,695,172 | | |
Redemptions | | | (17,219,242 | ) | | | (672,868,133 | ) | | | (16,830,574 | ) | | | (643,029,382 | ) | |
Net decrease | | | (5,939,117 | ) | | | (227,334,755 | ) | | | (5,109,849 | ) | | | (192,388,108 | ) | |
Total net increase (decrease) | | | (3,749,310 | ) | | | (140,228,807 | ) | | | 1,840,266 | | | | 73,317,379 | | |
(a) Includes conversions of Class B shares to Class A shares, if any.
The accompanying Notes to Financial Statements are an integral part of this statement.
Annual Report 2016
24
COLUMBIA LARGE CAP INDEX FUND
The following tables are intended to help you understand the Fund's financial performance. Certain information reflects financial results for a single share of a class held for the periods shown. Per share net investment income (loss) amounts are calculated based on average shares outstanding during the period. Total return assumes reinvestment of all dividends and distributions, if any. Total return does not reflect payment of sales charges, if any. Total return and portfolio turnover are not annualized for periods of less than one year. The portfolio turnover rate is calculated without regard to purchase and sales transactions of short-term instruments and certain derivatives, if any. If such transactions were included, the Fund's portfolio turnover rate may be higher.
| | | Year Ended
February 29, | | Year Ended February 28, | | Year Ended
February 29, | |
Class A | | 2016 | | 2015 | | 2014 | | 2013 | | 2012 | |
Per share data | |
Net asset value, beginning of period | | $ | 40.60 | | | $ | 35.85 | | | $ | 29.16 | | | $ | 26.35 | | | $ | 25.62 | | |
Income from investment operations: | |
Net investment income | | | 0.64 | | | | 0.83 | | | | 0.53 | | | | 0.50 | | | | 0.42 | | |
Net realized and unrealized gain (loss) | | | (3.24 | ) | | | 4.52 | | | | 6.67 | | | | 2.88 | | | | 0.74 | | |
Total from investment operations | | | (2.60 | ) | | | 5.35 | | | | 7.20 | | | | 3.38 | | | | 1.16 | | |
Less distributions to shareholders: | |
Net investment income | | | (0.85 | ) | | | (0.58 | ) | | | (0.51 | ) | | | (0.57 | ) | | | (0.43 | ) | |
Net realized gains | | | (0.10 | ) | | | (0.02 | ) | | | — | | | | — | | | | — | | |
Total distributions to shareholders | | | (0.95 | ) | | | (0.60 | ) | | | (0.51 | ) | | | (0.57 | ) | | | (0.43 | ) | |
Net asset value, end of period | | $ | 37.05 | | | $ | 40.60 | | | $ | 35.85 | | | $ | 29.16 | | | $ | 26.35 | | |
Total return | | | (6.57 | %) | | | 14.98 | % | | | 24.80 | % | | | 12.98 | % | | | 4.67 | % | |
Ratios to average net assets(a) | |
Total gross expenses | | | 0.45 | % | | | 0.45 | % | | | 0.45 | % | | | 0.45 | %(b) | | | 0.45 | % | |
Total net expenses(c) | | | 0.45 | %(d) | | | 0.45 | %(d) | | | 0.45 | %(d) | | | 0.44 | %(b)(d) | | | 0.42 | %(d) | |
Net investment income | | | 1.63 | % | | | 2.18 | % | | | 1.63 | % | | | 1.85 | % | | | 1.72 | % | |
Supplemental data | |
Net assets, end of period (in thousands) | | $ | 993,376 | | | $ | 1,126,444 | | | $ | 796,430 | | | $ | 544,128 | | | $ | 472,381 | | |
Portfolio turnover | | | 11 | % | | | 5 | % | | | 3 | % | | | 7 | % | | | 6 | % | |
Notes to Financial Highlights
(a) In addition to the fees and expenses that the Fund bears directly, the Fund indirectly bears a pro rata share of the fees and expenses of any other funds in which it invests. Such indirect expenses are not included in the Fund's reported expense ratios.
(b) Ratios include line of credit interest expense which is less than 0.01%.
(c) Total net expenses include the impact of certain fee waivers/expense reimbursements made by the Investment Manager and certain of its affiliates, if applicable.
(d) The benefits derived from expense reductions had an impact of less than 0.01%.
The accompanying Notes to Financial Statements are an integral part of this statement.
Annual Report 2016
25
COLUMBIA LARGE CAP INDEX FUND
FINANCIAL HIGHLIGHTS (continued)
| | | Year Ended
February 29, | | Year Ended February 28, | | Year Ended
February 29, | |
Class B | | 2016 | | 2015 | | 2014 | | 2013 | | 2012 | |
Per share data | |
Net asset value, beginning of period | | $ | 40.70 | | | $ | 35.93 | | | $ | 29.24 | | | $ | 26.44 | | | $ | 25.70 | | |
Income from investment operations: | |
Net investment income | | | 0.31 | | | | 0.50 | | | | 0.28 | | | | 0.28 | | | | 0.22 | | |
Net realized and unrealized gain (loss) | | | (3.23 | ) | | | 4.59 | | | | 6.69 | | | | 2.89 | | | | 0.76 | | |
Total from investment operations | | | (2.92 | ) | | | 5.09 | | | | 6.97 | | | | 3.17 | | | | 0.98 | | |
Less distributions to shareholders: | |
Net investment income | | | (0.55 | ) | | | (0.30 | ) | | | (0.28 | ) | | | (0.37 | ) | | | (0.24 | ) | |
Net realized gains | | | (0.10 | ) | | | (0.02 | ) | | | — | | | | — | | | | — | | |
Total distributions to shareholders | | | (0.65 | ) | | | (0.32 | ) | | | (0.28 | ) | | | (0.37 | ) | | | (0.24 | ) | |
Net asset value, end of period | | $ | 37.13 | | | $ | 40.70 | | | $ | 35.93 | | | $ | 29.24 | | | $ | 26.44 | | |
Total return | | | (7.29 | %) | | | 14.20 | % | | | 23.88 | % | | | 12.08 | % | | | 3.90 | % | |
Ratios to average net assets(a) | |
Total gross expenses | | | 1.20 | % | | | 1.20 | % | | | 1.20 | % | | | 1.20 | %(b) | | | 1.20 | % | |
Total net expenses(c) | | | 1.20 | %(d) | | | 1.20 | %(d) | | | 1.20 | %(d) | | | 1.18 | %(b)(d) | | | 1.17 | %(d) | |
Net investment income | | | 0.79 | % | | | 1.31 | % | | | 0.86 | % | | | 1.04 | % | | | 0.90 | % | |
Supplemental data | |
Net assets, end of period (in thousands) | | $ | 167 | | | $ | 243 | | | $ | 261 | | | $ | 426 | | | $ | 1,305 | | |
Portfolio turnover | | | 11 | % | | | 5 | % | | | 3 | % | | | 7 | % | | | 6 | % | |
Notes to Financial Highlights
(a) In addition to the fees and expenses that the Fund bears directly, the Fund indirectly bears a pro rata share of the fees and expenses of any other funds in which it invests. Such indirect expenses are not included in the Fund's reported expense ratios.
(b) Ratios include line of credit interest expense which is less than 0.01%.
(c) Total net expenses include the impact of certain fee waivers/expense reimbursements made by the Investment Manager and certain of its affiliates, if applicable.
(d) The benefits derived from expense reductions had an impact of less than 0.01%.
The accompanying Notes to Financial Statements are an integral part of this statement.
Annual Report 2016
26
COLUMBIA LARGE CAP INDEX FUND
FINANCIAL HIGHLIGHTS (continued)
| | | Year Ended
February 29, | | Year Ended February 28, | | Year Ended
February 29, | |
Class I | | 2016 | | 2015 | | 2014 | | 2013 | | 2012(a) | |
Per share data | |
Net asset value, beginning of period | | $ | 40.78 | | | $ | 36.01 | | | $ | 29.28 | | | $ | 26.45 | | | $ | 24.22 | | |
Income from investment operations: | |
Net investment income | | | 0.75 | | | | 0.89 | | | | 0.62 | | | | 0.57 | | | | 0.15 | | |
Net realized and unrealized gain (loss) | | | (3.27 | ) | | | 4.59 | | | | 6.70 | | | | 2.89 | | | | 2.49 | | |
Total from investment operations | | | (2.52 | ) | | | 5.48 | | | | 7.32 | | | | 3.46 | | | | 2.64 | | |
Less distributions to shareholders: | |
Net investment income | | | (0.95 | ) | | | (0.69 | ) | | | (0.59 | ) | | | (0.63 | ) | | | (0.41 | ) | |
Net realized gains | | | (0.10 | ) | | | (0.02 | ) | | | — | | | | — | | | | — | | |
Total distributions to shareholders | | | (1.05 | ) | | | (0.71 | ) | | | (0.59 | ) | | | (0.63 | ) | | | (0.41 | ) | |
Net asset value, end of period | | $ | 37.21 | | | $ | 40.78 | | | $ | 36.01 | | | $ | 29.28 | | | $ | 26.45 | | |
Total return | | | (6.36 | %) | | | 15.27 | % | | | 25.12 | % | | | 13.28 | % | | | 11.08 | % | |
Ratios to average net assets(b) | |
Total gross expenses | | | 0.20 | % | | | 0.20 | % | | | 0.22 | % | | | 0.22 | %(c) | | | 0.15 | %(d) | |
Total net expenses(e) | | | 0.20 | % | | | 0.20 | % | | | 0.20 | % | | | 0.19 | %(c) | | | 0.15 | %(d) | |
Net investment income | | | 1.91 | % | | | 2.33 | % | | | 1.88 | % | | | 2.09 | % | | | 2.06 | %(d) | |
Supplemental data | |
Net assets, end of period (in thousands) | | $ | 3 | | | $ | 3 | | | $ | 4 | | | $ | 3 | | | $ | 3 | | |
Portfolio turnover | | | 11 | % | | | 5 | % | | | 3 | % | | | 7 | % | | | 6 | % | |
Notes to Financial Highlights
(a) Based on operations from November 16, 2011 (commencement of operations) through the stated period end.
(b) In addition to the fees and expenses that the Fund bears directly, the Fund indirectly bears a pro rata share of the fees and expenses of any other funds in which it invests. Such indirect expenses are not included in the Fund's reported expense ratios.
(c) Ratios include line of credit interest expense which is less than 0.01%.
(d) Annualized.
(e) Total net expenses include the impact of certain fee waivers/expense reimbursements made by the Investment Manager and certain of its affiliates, if applicable.
The accompanying Notes to Financial Statements are an integral part of this statement.
Annual Report 2016
27
COLUMBIA LARGE CAP INDEX FUND
FINANCIAL HIGHLIGHTS (continued)
| | | Year Ended
February 29, | | Year Ended February 28, | |
Class R5 | | 2016 | | 2015 | | 2014 | | 2013(a) | |
Per share data | |
Net asset value, beginning of period | | $ | 41.29 | | | $ | 36.45 | | | $ | 29.63 | | | $ | 27.28 | | |
Income from investment operations: | |
Net investment income | | | 0.84 | | | | 0.94 | | | | 0.68 | | | | 0.21 | | |
Net realized and unrealized gain (loss) | | | (3.38 | ) | | | 4.60 | | | | 6.74 | | | | 2.68 | | |
Total from investment operations | | | (2.54 | ) | | | 5.54 | | | | 7.42 | | | | 2.89 | | |
Less distributions to shareholders: | |
Net investment income | | | (0.95 | ) | | | (0.68 | ) | | | (0.60 | ) | | | (0.54 | ) | |
Net realized gains | | | (0.10 | ) | | | (0.02 | ) | | | — | | | | — | | |
Total distributions to shareholders | | | (1.05 | ) | | | (0.70 | ) | | | (0.60 | ) | | | (0.54 | ) | |
Net asset value, end of period | | $ | 37.70 | | | $ | 41.29 | | | $ | 36.45 | | | $ | 29.63 | | |
Total return | | | (6.33 | %) | | | 15.25 | % | | | 25.14 | % | | | 10.73 | % | |
Ratios to average net assets(b) | |
Total gross expenses | | | 0.20 | % | | | 0.20 | % | | | 0.20 | % | | | 0.14 | %(c) | |
Total net expenses(d) | | | 0.20 | % | | | 0.20 | % | | | 0.20 | % | | | 0.14 | %(c) | |
Net investment income | | | 2.12 | % | | | 2.44 | % | | | 1.96 | % | | | 2.48 | %(c) | |
Supplemental data | |
Net assets, end of period (in thousands) | | $ | 273,170 | | | $ | 170,244 | | | $ | 98,439 | | | $ | 3 | | |
Portfolio turnover | | | 11 | % | | | 5 | % | | | 3 | % | | | 7 | % | |
Notes to Financial Highlights
(a) Based on operations from November 8, 2012 (commencement of operations) through the stated period end.
(b) In addition to the fees and expenses that the Fund bears directly, the Fund indirectly bears a pro rata share of the fees and expenses of any other funds in which it invests. Such indirect expenses are not included in the Fund's reported expense ratios.
(c) Annualized.
(d) Total net expenses include the impact of certain fee waivers/expense reimbursements made by the Investment Manager and certain of its affiliates, if applicable.
The accompanying Notes to Financial Statements are an integral part of this statement.
Annual Report 2016
28
COLUMBIA LARGE CAP INDEX FUND
FINANCIAL HIGHLIGHTS (continued)
| | | Year Ended
February 29, | | Year Ended February 28, | | Year Ended
February 29, | |
Class Z | | 2016 | | 2015 | | 2014 | | 2013 | | 2012 | |
Per share data | |
Net asset value, beginning of period | | $ | 40.78 | | | $ | 36.00 | | | $ | 29.28 | | | $ | 26.45 | | | $ | 25.72 | | |
Income from investment operations: | |
Net investment income | | | 0.75 | | | | 0.89 | | | | 0.62 | | | | 0.57 | | | | 0.48 | | |
Net realized and unrealized gain (loss) | | | (3.26 | ) | | | 4.59 | | | | 6.69 | | | | 2.89 | | | | 0.74 | | |
Total from investment operations | | | (2.51 | ) | | | 5.48 | | | | 7.31 | | | | 3.46 | | | | 1.22 | | |
Less distributions to shareholders: | |
Net investment income | | | (0.95 | ) | | | (0.68 | ) | | | (0.59 | ) | | | (0.63 | ) | | | (0.49 | ) | |
Net realized gains | | | (0.10 | ) | | | (0.02 | ) | | | — | | | | — | | | | — | | |
Total distributions to shareholders | | | (1.05 | ) | | | (0.70 | ) | | | (0.59 | ) | | | (0.63 | ) | | | (0.49 | ) | |
Net asset value, end of period | | $ | 37.22 | | | $ | 40.78 | | | $ | 36.00 | | | $ | 29.28 | | | $ | 26.45 | | |
Total return | | | (6.34 | %) | | | 15.27 | % | | | 25.09 | % | | | 13.28 | % | | | 4.91 | % | |
Ratios to average net assets(a) | |
Total gross expenses | | | 0.20 | % | | | 0.20 | % | | | 0.20 | % | | | 0.20 | %(b) | | | 0.20 | % | |
Total net expenses(c) | | | 0.20 | %(d) | | | 0.20 | %(d) | | | 0.20 | %(d) | | | 0.19 | %(b)(d) | | | 0.16 | %(d) | |
Net investment income | | | 1.88 | % | | | 2.33 | % | | | 1.88 | % | | | 2.06 | % | | | 1.95 | % | |
Supplemental data | |
Net assets, end of period (in thousands) | | $ | 1,975,099 | | | $ | 2,406,361 | | | $ | 2,308,382 | | | $ | 1,961,058 | | | $ | 3,148,041 | | |
Portfolio turnover | | | 11 | % | | | 5 | % | | | 3 | % | | | 7 | % | | | 6 | % | |
Notes to Financial Highlights
(a) In addition to the fees and expenses that the Fund bears directly, the Fund indirectly bears a pro rata share of the fees and expenses of any other funds in which it invests. Such indirect expenses are not included in the Fund's reported expense ratios.
(b) Ratios include line of credit interest expense which is less than 0.01%.
(c) Total net expenses include the impact of certain fee waivers/expense reimbursements made by the Investment Manager and certain of its affiliates, if applicable.
(d) The benefits derived from expense reductions had an impact of less than 0.01%.
The accompanying Notes to Financial Statements are an integral part of this statement.
Annual Report 2016
29
COLUMBIA LARGE CAP INDEX FUND
NOTES TO FINANCIAL STATEMENTS
February 29, 2016
Note 1. Organization
Columbia Large Cap Index Fund (the Fund), a series of Columbia Funds Series Trust (the Trust), is a diversified fund. The Trust is registered under the Investment Company Act of 1940, as amended (the 1940 Act), as an open-end management investment company organized as a Delaware statutory trust.
Fund Shares
The Trust may issue an unlimited number of shares (without par value). The Fund offers Class A, Class B, Class I, Class R5 and Class Z shares. Although all share classes generally have identical voting, dividend and liquidation rights, each share class votes separately when required by the Trust's organizational documents or by law. Different share classes pay different distribution amounts to the extent the expenses of such share classes differ, and distributions in liquidation will be proportional to the net asset value of each share class. Each share class has its own expense and sales charge structure.
Class A shares are not subject to any front-end sales charge or contingent deferred sales charge (CDSC).
Class B shares may be subject to a maximum CDSC of 5.00% based upon the holding period after purchase. Class B shares will generally convert to Class A shares eight years after purchase. The Fund no longer accepts investments by new or existing investors in the Fund's Class B shares, except in connection with the reinvestment of any dividend and/or capital gain distributions in Class B shares of the Fund and exchanges by existing Class B shareholders of certain other funds within the Columbia Family of Funds.
Class I shares are not subject to sales charges and are available only to the Columbia Family of Funds.
Class R5 shares are not subject to sales charges and are generally available only to investors purchasing through authorized investment professionals and omnibus retirement plans.
Class Z shares are not subject to sales charges and are available only to eligible investors, which are subject to different investment minimums as described in the Fund's prospectus.
Note 2. Summary of Significant Accounting Policies
Basis of Preparation
The Fund is an investment company that applies the accounting and reporting guidance in the Financial
Accounting Standards Board (FASB) Accounting Standards Codification Topic 946, Financial Services — Investment Companies (ASC 946). The financial statements are prepared in accordance with U.S. generally accepted accounting principles (GAAP), which requires management to make certain estimates and assumptions that affect the reported amounts of assets and liabilities, the disclosure of contingent assets and liabilities at the date of the financial statements and the reported amounts of income and expenses during the reporting period. Actual results could differ from those estimates.
The following is a summary of significant accounting policies followed by the Fund in the preparation of its financial statements.
Security Valuation
All equity securities are valued at the close of business of the New York Stock Exchange (NYSE). Equity securities are valued at the last quoted sales price on the principal exchange or market on which they trade, except for securities traded on the NASDAQ Stock Market, which are valued at the NASDAQ official close price. Unlisted securities or listed securities for which there were no sales during the day are valued at the mean of the latest quoted bid and ask prices on such exchanges or markets.
Foreign equity securities are valued based on the closing price on the foreign exchange in which such securities are primarily traded. If any foreign equity security closing prices are not readily available, the securities are valued at the mean of the latest quoted bid and ask prices on such exchanges or markets. Foreign currency exchange rates are generally determined at 4:00 p.m. Eastern (U.S.) time. Many securities markets and exchanges outside the U.S. close prior to the close of the NYSE; therefore, the closing prices for securities in such markets or on such exchanges may not fully reflect events that occur after such close but before the close of the NYSE. In those situations, foreign securities will be fair valued pursuant to a policy adopted by the Board of Trustees (the Board), including, if available, utilizing a third party pricing service to determine these fair values. The third party pricing service takes into account multiple factors, including, but not limited to, movements in the U.S. securities markets, certain depositary receipts, futures contracts and foreign exchange rates that have occurred subsequent to the close of the foreign exchange or market, to determine a good faith estimate that reasonably reflects the current market conditions as of the close of the NYSE. The fair value of a security is
Annual Report 2016
30
COLUMBIA LARGE CAP INDEX FUND
NOTES TO FINANCIAL STATEMENTS (continued)
February 29, 2016
likely to be different from the quoted or published price, if available.
Investments in open-end investment companies, including money market funds, are valued at their latest net asset value.
Futures and options on futures contracts are valued based upon the settlement price at the close of regular trading on their principal exchanges or, in the absence of transactions, at the mean of the latest quoted bid and ask prices.
Investments for which market quotations are not readily available, or that have quotations which management believes are not reflective of market value or reliable, are valued at fair value as determined in good faith under procedures approved by and under the general supervision of the Board. If a security or class of securities (such as foreign securities) is valued at fair value, such value is likely to be different from the quoted or published price for the security.
The determination of fair value often requires significant judgment. To determine fair value, management may use assumptions including but not limited to future cash flows and estimated risk premiums. Multiple inputs from various sources may be used to determine fair value.
GAAP requires disclosure regarding the inputs and valuation techniques used to measure fair value and any changes in valuation inputs or techniques. In addition, investments shall be disclosed by major category. This information is disclosed following the Fund's Portfolio of Investments.
Derivative Instruments
The Fund invests in certain derivative instruments, as detailed below, to meet its investment objectives. Derivatives are instruments whose values depend on, or are derived from, in whole or in part, the value of one or more securities, currencies, commodities, indices, or other assets or instruments. Derivatives may be used to increase investment flexibility (including to maintain cash reserves while maintaining desired exposure to certain assets), for risk management (hedging) purposes, to facilitate trading, to reduce transaction costs and to pursue higher investment returns. The Fund may also use derivative instruments to mitigate certain investment risks, such as foreign currency exchange rate risk, interest rate risk and credit risk. Derivatives may involve various risks, including the potential inability of the counterparty to fulfill its obligation under the terms of the
contract, the potential for an illiquid secondary market (making it difficult for the Fund to sell, including at favorable prices) and the potential for market movements which may expose the Fund to gains or losses in excess of the amount shown in the Statement of Assets and Liabilities. The notional amounts of derivative instruments, if applicable, are not recorded in the financial statements.
A derivative instrument may suffer a marked-to-market loss if the value of the contract decreases due to an unfavorable change in the market rates or values of the underlying instrument. Losses can also occur if the counterparty does not perform under the contract. The Fund's risk of loss from counterparty credit risk on over-the-counter derivatives is generally limited to the aggregate unrealized gain netted against any collateral held by the Fund and the amount of any variation margin held by the counterparty. With exchange-traded or centrally cleared derivatives, there is reduced counterparty credit risk to the Fund since the exchange's clearinghouse, as counterparty to such instruments, guarantees against a possible default. The clearinghouse stands between the buyer and the seller of the contract; therefore, the counterparty credit risk is failure of the clearinghouse. However, credit risk still exists in exchange-traded or centrally cleared derivatives with respect to initial and variation margin that is held in a broker's customer account. While brokers are required to segregate customer margin from their own assets, in the event that a broker becomes insolvent or goes into bankruptcy and at that time there is a shortfall in the aggregate amount of margin held by the broker for all its clients, U.S. bankruptcy laws will typically allocate that shortfall on a pro-rata basis across all the broker's customers (including the Fund), potentially resulting in losses to the Fund.
In order to better define its contractual rights and to secure rights that will help the Fund mitigate its counterparty risk, the Fund may enter into an International Swaps and Derivatives Association, Inc. Master Agreement (ISDA Master Agreement) or similar agreement with its derivatives contract counterparties. An ISDA Master Agreement is an agreement between the Fund and a counterparty that governs over-the-counter derivatives and forward foreign currency exchange contracts and typically contains, among other things, collateral posting terms and netting provisions in the event of a default and/or termination event. Under an ISDA Master Agreement, the Fund may, under certain
Annual Report 2016
31
COLUMBIA LARGE CAP INDEX FUND
NOTES TO FINANCIAL STATEMENTS (continued)
February 29, 2016
circumstances, offset with the counterparty certain derivative instrument's payables and/or receivables with collateral held and/or posted and create one single net payment. The provisions of the ISDA Master Agreement typically permit a single net payment in the event of default (close-out netting) including the bankruptcy or insolvency of the counterparty. Note, however, that bankruptcy or insolvency laws of a particular jurisdiction may impose restrictions on or prohibitions against the right of offset in bankruptcy, insolvency or other events.
Collateral (margin) requirements differ by type of derivative. Margin requirements are established by the exchange or clearinghouse for exchange-traded and centrally cleared derivatives. Brokers can ask for margin in excess of the minimum in certain circumstances. Collateral terms are contract specific for over-the-counter derivatives. For over-the-counter derivatives traded under an ISDA Master Agreement, the collateral requirements are typically calculated by netting the marked-to-market amount for each transaction under such agreement and comparing that amount to the value of any variation margin currently pledged by the Fund and/or the counterparty. Generally, the amount of collateral due from or to a party has to exceed a minimum transfer amount threshold (e.g., $500,000) before a transfer has to be made. To the extent amounts due to the Fund from its counterparties are not fully collateralized, contractually or otherwise, the Fund bears the risk of loss from counterparty nonperformance. The Fund attempts to mitigate counterparty risk by only entering into agreements with counterparties that it believes have the financial resources to honor their obligations and by monitoring the financial stability of those counterparties.
Certain ISDA Master Agreements allow counterparties to over-the-counter derivatives transactions to terminate derivatives contracts prior to maturity in the event the Fund's net asset value declines by a stated percentage over a specified time period or if the Fund fails to meet certain terms of the ISDA Master Agreement, which would cause the Fund to accelerate payment of any net liability owed to the counterparty. The Fund also has termination rights if the counterparty fails to meet certain terms of the ISDA Master Agreement. In addition to considering counterparty credit risk, the Fund would consider terminating the derivatives contracts based on whether termination would result in a net liability owed from the counterparty.
For financial reporting purposes, the Fund does not offset derivative assets and derivative liabilities that are
subject to netting arrangements in the Statement of Assets and Liabilities.
Futures Contracts
Futures contracts are exchange traded and represent commitments for the future purchase or sale of an asset at a specified price on a specified date. The Fund bought and sold futures contracts to maintain appropriate equity market exposure while keeping sufficient cash to accommodate daily redemptions. These instruments may be used for other purposes in future periods. Upon entering into futures contracts, the Fund bears risks that it may not achieve the anticipated benefits of the futures contracts and may realize a loss. Additional risks include counterparty credit risk, the possibility of an illiquid market, and that a change in the value of the contract or option may not correlate with changes in the value of the underlying asset.
Upon entering into a futures contract, the Fund pledges cash or securities with the broker in an amount sufficient to meet the initial margin requirement. The initial margin deposit must be maintained at an established level over the life of the contract. Cash deposited as initial margin is recorded in the Statement of Assets and Liabilities as margin deposits. Securities deposited as initial margin are designated in the Portfolio of Investments. Subsequent payments (variation margin) are made or received by the Fund each day. The variation margin payments are equal to the daily change in the contract value and are recorded as variation margin receivable or payable and are offset in unrealized gains or losses. The Fund recognizes a realized gain or loss when the contract is closed or expires. Futures contracts involve, to varying degrees, risk of loss in excess of the variation margin disclosed in the Statement of Assets and Liabilities.
Effects of Derivative Transactions in the Financial Statements
The following tables are intended to provide additional information about the effect of derivatives on the financial statements of the Fund, including: the fair value of derivatives by risk category and the location of those fair values in the Statement of Assets and Liabilities; and the impact of derivative transactions over the period in the Statement of Operations, including realized and unrealized gains (losses). The derivative instrument schedules following the Portfolio of Investments present additional information regarding derivative instruments outstanding at the end of the period, if any.
Annual Report 2016
32
COLUMBIA LARGE CAP INDEX FUND
NOTES TO FINANCIAL STATEMENTS (continued)
February 29, 2016
The following table is a summary of the fair value of derivative instruments (not considered to be hedging instruments for accounting disclosure purposes) at February 29, 2016:
Asset Derivatives | |
Risk Exposure
Category | | Statement of Assets and
Liabilities Location | | Fair Value ($) | |
Equity risk | | Net assets — unrealized
appreciation on futures
contracts | | | 902,119 | * | |
*Includes cumulative appreciation (depreciation) as reported in the tables following the Portfolio of Investments. Only the current day's variation margin is reported in receivables or payables in the Statement of Assets and Liabilities.
The following table indicates the effect of derivative instruments (not considered to be hedging instruments for accounting disclosure purposes) in the Statement of Operations for the year ended February 29, 2016:
Amount of Realized Gain (Loss) on Derivatives Recognized in Income | |
Risk Exposure Category | | Futures Contracts ($) | |
Equity risk | | | 1,890,197 | | |
Change in Unrealized Appreciation (Depreciation) on
Derivatives Recognized in Income | |
Risk Exposure Category | | Futures Contracts ($) | |
Equity risk | | | (6,518,836 | ) | |
The following table provides a summary of the average outstanding volume by derivative instrument for the year ended February 29,2016:
Derivative Instrument | | Average Notional
Amounts ($)* | |
Futures contracts — Long | | | 97,240,038 | | |
*Based on the ending quarterly outstanding amounts for the year ended February 29, 2016.
Security Transactions
Security transactions are accounted for on the trade date. Cost is determined and gains (losses) are based upon the specific identification method for both financial statement and federal income tax purposes.
Income Recognition
Corporate actions and dividend income are generally recorded net of any non-reclaimable tax withholdings, on the ex-dividend date or upon receipt of ex-dividend notification in the case of certain foreign securities.
The Fund may receive distributions from holdings in equity securities, business development companies (BDCs), exchange-traded funds, other regulated
investment companies (RICs), and real estate investment trusts (REITs), which report information on the tax character of their distributions annually. These distributions are allocated to dividend income, capital gain and return of capital based on actual information reported. Return of capital is recorded as a reduction of the cost basis of securities held. If the Fund no longer owns the applicable securities, return of capital is recorded as a realized gain. With respect to REITs, to the extent actual information has not yet been reported, estimates for return of capital are made by the Fund's management. Management's estimates are subsequently adjusted when the actual character of the distributions is disclosed by the REITs, which could result in a proportionate change in return of capital to shareholders.
Awards from class action litigation are recorded as a reduction of cost basis if the Fund still owns the applicable securities on the payment date. If the Fund no longer owns the applicable securities, the proceeds are recorded as realized gains.
Expenses
General expenses of the Trust are allocated to the Fund and other funds of the Trust based upon relative net assets or other expense allocation methodologies determined by the nature of the expense. Expenses directly attributable to the Fund are charged to the Fund. Expenses directly attributable to a specific class of shares are charged to that share class.
Determination of Class Net Asset Value
All income, expenses (other than class-specific expenses, which are charged to that share class, as shown in the Statement of Operations) and realized and unrealized gains (losses) are allocated to each class of the Fund on a daily basis, based on the relative net assets of each class, for purposes of determining the net asset value of each class.
Federal Income Tax Status
The Fund intends to qualify each year as a regulated investment company under Subchapter M of the Internal Revenue Code, as amended, and will distribute substantially all of its taxable income (including net short-term capital gains), if any, for its tax year, and as such will not be subject to federal income taxes. In addition, the Fund intends to distribute in each calendar year substantially all of its net investment income, capital gains and certain other amounts, if any, such that the Fund should not be subject to federal excise tax.
Annual Report 2016
33
COLUMBIA LARGE CAP INDEX FUND
NOTES TO FINANCIAL STATEMENTS (continued)
February 29, 2016
Therefore, no federal income or excise tax provision is recorded.
Foreign Taxes
The Fund may be subject to foreign taxes on income, gains on investments or currency repatriation, a portion of which may be recoverable. The Fund will accrue such taxes and recoveries, as applicable, based upon its current interpretation of tax rules and regulations that exist in the markets in which it invests.
Realized gains in certain countries may be subject to foreign taxes at the Fund level, based on statutory rates. The Fund accrues for such foreign taxes on realized and unrealized gains at the appropriate rate for each jurisdiction, as applicable. The amount, if any, is disclosed as a liability on the Statement of Assets and Liabilities.
Distributions to Shareholders
Distributions from net investment income, if any, are declared and paid semi-annually. Net realized capital gains, if any, are distributed at least annually. Income distributions and capital gain distributions are determined in accordance with federal income tax regulations, which may differ from GAAP.
Guarantees and Indemnifications
Under the Trust's organizational documents and, in some cases, by contract, its officers and trustees are indemnified against certain liabilities arising out of the performance of their duties to the Trust or its funds. In addition, certain of the Fund's contracts with its service providers contain general indemnification clauses. The Fund's maximum exposure under these arrangements is unknown since the amount of any future claims that may be made against the Fund cannot be determined, and the Fund has no historical basis for predicting the likelihood of any such claims.
Recent Accounting Pronouncement
Fair Value Measurement (Topic 820), Disclosure for Investments in Certain Entities That Calculate Net Asset Value per Share (or Its Equivalent)
In May 2015, FASB issued Accounting Standards Update (ASU) No. 2015-07, Fair Value Measurement (Topic 820), Disclosure for Investments in Certain Entities That Calculate Net Asset Value per Share (or Its Equivalent). ASU No. 2015-07 changes the disclosure requirements for investments for which fair value is measured using the net asset value per share practical expedient. The disclosure requirements are effective for annual periods
beginning after December 15, 2015 and interim periods within those fiscal years. At this time, management is evaluating the implications of this guidance and the impact it will have on the financial statement amounts and footnote disclosures, if any.
Note 3. Fees and Other Transactions with Affiliates
Management Fees
Effective July 1, 2015, the Fund entered into a Management Agreement with Columbia Management Investment Advisers, LLC (the Investment Manager), a wholly-owned subsidiary of Ameriprise Financial, Inc. (Ameriprise Financial). Under the Management Agreement, the Investment Manager provides the Fund with investment research and advice, as well as administrative and accounting services. The management services fee is an annual fee that is equal to 0.20% of the Fund's average daily net assets.
Prior to July 1, 2015, the Fund paid the Investment Manager an annual fee for advisory services under an Investment Management Services Agreement and a separate annual fee for administrative and accounting services under an Administrative Services Agreement. For the period from March 1, 2015 through June 30, 2015, the investment advisory services fee paid to the Investment Manager was $1,247,854, and the administrative services fee paid to the Investment Manager was $1,247,854.
Other Expenses
Other expenses are for, among other things, miscellaneous expenses of the Fund or the Board, including payments to Board Services Corp., a company providing limited administrative services to the Fund and the Board. That company's expenses include boardroom and office expense, employee compensation, employee health and retirement benefits, and certain other expenses. For the year ended February 29, 2016, other expenses paid by the Fund to this company were $7,004.
Compensation of Board Members
Board members, who are not officers or employees of the Investment Manager or Ameriprise Financial, are compensated for their services to the Fund as disclosed in the Statement of Operations. Under a Deferred Compensation Plan (the Plan), these Board members may elect to defer payment of up to 100% of their compensation. Deferred amounts are treated as though
Annual Report 2016
34
COLUMBIA LARGE CAP INDEX FUND
NOTES TO FINANCIAL STATEMENTS (continued)
February 29, 2016
equivalent dollar amounts had been invested in shares of certain funds managed by the Investment Manager. The Fund's liability for these amounts is adjusted for market value changes and remains in the Fund until distributed in accordance with the Plan. All amounts payable under the Plan constitute a general unsecured obligation of the Fund.
Transfer Agency Fees
Under a Transfer and Dividend Disbursing Agent Agreement, Columbia Management Investment Services Corp. (the Transfer Agent), an affiliate of the Investment Manager and a wholly-owned subsidiary of Ameriprise Financial, is responsible for providing transfer agency services to the Fund. The Transfer Agent has contracted with Boston Financial Data Services (BFDS) to serve as sub-transfer agent.
The transfer agency fees are payable by the Investment Manager. The Transfer Agent pays the fees of BFDS for services as sub-transfer agent and is not entitled to reimbursement for such fees from the Fund. The Transfer Agent also receives compensation from the Investment Manager for various shareholder services and reimbursements for certain out-of-pocket expenses.
An annual minimum account balance fee of $20 may apply to certain accounts with a value below the applicable share class's initial minimum investment requirements to reduce the impact of small accounts on transfer agency fees. These minimum account balance fees are remitted to the Fund and recorded as part of expense reductions in the Statement of Operations. For the year ended February 29, 2016, these minimum account balance fees reduced total expenses of the Fund by $3,909.
Distribution and Service Fees
The Fund has an agreement with Columbia Management Investment Distributors, Inc. (the Distributor), an affiliate of the Investment Manager and a wholly-owned subsidiary of Ameriprise Financial, for distribution and shareholder services. The Board has approved, and the Fund has adopted, distribution and shareholder service plans (the Plans) applicable to certain share classes, which set the distribution and service fees for the Fund. These fees are calculated daily and are intended to compensate the Distributor and/or eligible selling and/or servicing agents for selling shares of the Fund and providing services to investors.
Under the Plans, the Fund pays a monthly combined distribution and service fee to the Distributor at the maximum annual rate of 0.25% of the average daily net assets attributable to Class A shares of the Fund. Also under the Plans, the Fund pays a monthly service fee at the maximum annual rate of 0.25% of the average daily net assets attributable to Class B shares of the Fund and a monthly distribution fee at the maximum annual rate of 0.75% of the average daily net assets attributable to Class B shares of the Fund.
Sales Charges
Sales charges, including front-end charges and CDSCs, received by the Distributor for distributing Fund shares were $116 for Class B shares for the year ended February 29, 2016.
Expenses Waived/Reimbursed by the Investment Manager and its Affiliates
The Investment Manager and certain of its affiliates have contractually agreed to waive fees and/or reimburse expenses (excluding certain fees and expenses described below) for the period disclosed below, unless sooner terminated at the sole discretion of the Board, so that the Fund's net operating expenses, after giving effect to fees waived/expenses reimbursed and any balance credits and/or overdraft charges from the Fund's custodian, do not exceed the following annual rates as a percentage of the class' average daily net assets:
| | | Fee Rates Contractual
through
June 30, 2016 | |
Class A | | | 0.45 | % | |
Class B | | | 1.20 | | |
Class I | | | 0.20 | | |
Class R5 | | | 0.20 | | |
Class Z | | | 0.20 | | |
Under the agreement governing these fee waivers and/or expense reimbursement arrangements, the following fees and expenses are excluded from the waiver/reimbursement commitment, and therefore will be paid by the Fund, if applicable: taxes (including foreign transaction taxes), expenses associated with investments in affiliated and non-affiliated pooled investment vehicles (including mutual funds and exchange-traded funds), transaction costs and brokerage commissions, costs related to any securities lending program, dividend and interest expenses associated with securities sold short, inverse floater program fees and
Annual Report 2016
35
COLUMBIA LARGE CAP INDEX FUND
NOTES TO FINANCIAL STATEMENTS (continued)
February 29, 2016
expenses, transaction charges and interest on borrowed money, interest, extraordinary expenses and any other expenses the exclusion of which is specifically approved by the Board. This agreement may be modified or amended only with approval from the Investment Manager, certain of its affiliates and the Fund. Any fees waived and/or expenses reimbursed under the expense reimbursement arrangements described above are not recoverable by the Investment Manager or its affiliates in future periods.
Note 4. Federal Tax Information
The timing and character of income and capital gain distributions are determined in accordance with income tax regulations, which may differ from GAAP because of temporary or permanent book to tax differences.
At February 29, 2016, these differences are primarily due to differing treatment for capital loss carryforwards, deferral/reversal of wash sale losses, Trustees' deferred compensation, distribution reclassifications, re-characterization of distributions for investments, derivative investments, and proceeds from regulatory settlements. To the extent these differences are permanent, reclassifications are made among the components of the Fund's net assets in the Statement of Assets and Liabilities. Temporary differences do not require reclassifications. In the Statement of Assets and Liabilities the following reclassifications were made:
Undistributed net investment income | | $ | (1,228,014 | ) | |
Accumulated net realized loss | | | 1,266,647 | | |
Paid-in capital | | | (38,633 | ) | |
Net investment income (loss) and net realized gains (losses), as disclosed in the Statement of Operations, and net assets were not affected by this reclassification.
The tax character of distributions paid during the years indicated was as follows:
Year Ended | | February 29,
2016 | | February 28,
2015 | |
Ordinary income | | $ | 90,659,411 | | | $ | 58,797,338 | | |
Short-term capital gain distributions, if any, are considered ordinary income distributions for tax purposes.
At February 29, 2016, the components of distributable earnings on a tax basis were as follows:
Undistributed ordinary income | | | 9,867,289 | | |
Capital loss carryforwards | | | (10,572,809 | ) | |
Net unrealized appreciation | | | 1,076,558,979 | | |
At February 29, 2016, the cost of investments for federal income tax purposes was $2,160,138,055 and the aggregate gross unrealized appreciation and depreciation based on that cost was:
Unrealized appreciation | | $ | 1,272,061,551 | | |
Unrealized depreciation | | | (195,502,572 | ) | |
Net unrealized appreciation | | | 1,076,558,979 | | |
The following capital loss carryforwards, determined at February 29, 2016, may be available to reduce taxable income arising from future net realized gains on investments, if any, to the extent permitted by the Internal Revenue Code:
Year of Expiration | | Amount ($) | |
No expiration — short-term | | | 8,243,367 | | |
No expiration — long-term | | | 2,329,442 | | |
Total | | | 10,572,809 | | |
Management of the Fund has concluded that there are no significant uncertain tax positions in the Fund that would require recognition in the financial statements. However, management's conclusion may be subject to review and adjustment at a later date based on factors including, but not limited to, new tax laws, regulations, and administrative interpretations (including relevant court decisions). Generally, the Fund's federal tax returns for the prior three fiscal years remain subject to examination by the Internal Revenue Service.
Note 5. Portfolio Information
The cost of purchases and proceeds from sales of securities, excluding short-term investments and derivatives, if any, aggregated to $387,439,770 and $409,234,626, respectively, for the year ended February 29, 2016. The amount of purchase and sale activity impacts the portfolio turnover rate reported in the Financial Highlights.
Note 6. Affiliated Money Market Fund
The Fund invests in Columbia Short-Term Cash Fund, an affiliated money market fund established for the exclusive use by the Fund and other affiliated funds. The income earned by the Fund from such investments is included as Dividends — affiliated issuers in the Statement of Operations. As an investing fund, the Fund indirectly bears its proportionate share of the expenses of Columbia Short-Term Cash Fund.
Annual Report 2016
36
COLUMBIA LARGE CAP INDEX FUND
NOTES TO FINANCIAL STATEMENTS (continued)
February 29, 2016
Note 7. Line of Credit
The Fund has access to a revolving credit facility whereby the Fund may borrow for the temporary funding of shareholder redemptions or for other temporary or emergency purposes. Effective December 8, 2015, Citibank, N.A. and HSBC Bank USA, N.A. joined JPMorgan Chase Bank, N.A. (JPMorgan) as lead of a syndicate of banks under the credit facility, which is a collective agreement between the Fund and certain other funds managed by the Investment Manager, severally and not jointly, that permits collective borrowings up to $1 billion. Interest is charged to each participating fund based on its borrowings at a rate equal to the higher of (i) the overnight federal funds rate plus 1.00% or (ii) the one-month LIBOR rate plus 1.00%. Each borrowing under the credit facility matures no later than 60 days after the date of borrowing. The Fund also pays a commitment fee equal to its pro rata share of the amount of the credit facility at a rate of 0.15% per annum. The commitment fee is included in other expenses in the Statement of Operations. Prior to December 8, 2015, JPMorgan was the sole lead bank under the credit facility agreement that permitted borrowings up to $550 million under the same terms and interest rates as described above with the exception of the commitment fee which was charged at a rate of 0.075% per annum.
The Fund had no borrowings during the year ended February 29, 2016.
Note 8. Significant Risks
Shareholder Concentration Risk
At February 29, 2016, one unaffiliated shareholder of record owned 14.5% of the outstanding shares of the Fund in one or more accounts. The Fund has no knowledge about whether any portion of those shares was owned beneficially. Affiliated shareholders of record owned 13.3% of the outstanding shares of the Fund in one or more accounts. Subscription and redemption activity by concentrated accounts may have a significant effect on the operations of the Fund. In the case of a large redemption, the Fund may be forced to sell investments at inopportune times, including its liquid or more liquid positions, resulting in Fund losses and the Fund holding a higher percentage of less liquid or illiquid securities. Large redemptions could result in decreased economies of scale and increased operating expenses for non-redeeming Fund shareholders.
Technology and Technology-related Investment Risk
The Fund may be more susceptible to the particular risks that may affect companies in the information technology sector, as well as other technology-related sectors (collectively, the technology sectors) than if it were invested in a wider variety of companies in unrelated sectors. Companies in the technology sectors are subject to certain risks, including the risk that new services, equipment or technologies will not be accepted by consumers and businesses or will become rapidly obsolete. Performance of such companies may be affected by factors including obtaining and protecting patents (or the failure to do so) and significant competitive pressures, including aggressive pricing of their products or services, new market entrants, competition for market share and short product cycles due to an accelerated rate of technological developments. Such competitive pressures may lead to limited earnings and/or falling profit margins. As a result, the value of their securities may fall or fail to rise. In addition, many technology sector companies have limited operating histories and prices of these companies' securities historically have been more volatile than other securities, especially over the short term.
Note 9. Subsequent Events
Management has evaluated the events and transactions that have occurred through the date the financial statements were issued and noted no items requiring adjustment of the financial statements or additional disclosure.
Note 10. Information Regarding Pending and Settled Legal Proceedings
In December 2005, without admitting or denying the allegations, American Express Financial Corporation (AEFC, which is now known as Ameriprise Financial, Inc. (Ameriprise Financial)) entered into settlement agreements with the Securities and Exchange Commission (SEC) and Minnesota Department of Commerce (MDOC) related to market timing activities. As a result, AEFC was censured and ordered to cease and desist from committing or causing any violations of certain provisions of the Investment Advisers Act of 1940, the Investment Company Act of 1940, and various Minnesota laws. AEFC agreed to pay disgorgement of $10 million and civil money penalties of $7 million. AEFC also agreed to retain an independent distribution consultant to assist in developing a plan for distribution of all disgorgement and civil penalties ordered by the
Annual Report 2016
37
COLUMBIA LARGE CAP INDEX FUND
NOTES TO FINANCIAL STATEMENTS (continued)
February 29, 2016
SEC in accordance with various undertakings detailed at http://www.sec.gov/litigation/admin/ia-2451.pdf. Ameriprise Financial and its affiliates have cooperated with the SEC and the MDOC in these legal proceedings, and have made regular reports to the Funds' Boards of Trustees.
Ameriprise Financial and certain of its affiliates have historically been involved in a number of legal, arbitration and regulatory proceedings, including routine litigation, class actions, and governmental actions, concerning matters arising in connection with the conduct of their business activities. Ameriprise Financial believes that the Funds are not currently the subject of, and that neither Ameriprise Financial nor any of its affiliates are the subject of, any pending legal, arbitration or regulatory proceedings that are likely to have a material adverse effect on the Funds or the ability of Ameriprise Financial or its affiliates to perform under their contracts with the Funds. Ameriprise Financial is required to make quarterly (10-Q), annual (10-K) and, as necessary, 8-K filings with the SEC on legal and regulatory matters that relate to Ameriprise Financial and its affiliates. Copies of these filings may be obtained by accessing the SEC website at www.sec.gov.
There can be no assurance that these matters, or the adverse publicity associated with them, will not result in increased fund redemptions, reduced sale of fund shares or other adverse consequences to the Funds. Further, although we believe proceedings are not likely to have a material adverse effect on the Funds or the ability of Ameriprise Financial or its affiliates to perform under their contracts with the Funds, these proceedings are subject to uncertainties and, as such, we are unable to estimate the possible loss or range of loss that may result. An adverse outcome in one or more of these proceedings could result in adverse judgments, settlements, fines, penalties or other relief that could have a material adverse effect on the consolidated financial condition or results of operations of Ameriprise Financial.
Annual Report 2016
38
COLUMBIA LARGE CAP INDEX FUND
REPORT OF INDEPENDENT REGISTERED PUBLIC ACCOUNTING FIRM
To the Trustees of Columbia Funds Series Trust and the Shareholders of
Columbia Large Cap Index Fund
In our opinion, the accompanying statement of assets and liabilities, including the portfolio of investments, and the related statements of operations and of changes in net assets and the financial highlights present fairly, in all material respects, the financial position of Columbia Large Cap Index Fund (the "Fund," a series of Columbia Funds Series Trust) at February 29, 2016, and the results of its operations, the changes in its net assets and the financial highlights for each of the periods indicated, in conformity with accounting principles generally accepted in the United States of America. These financial statements and financial highlights (hereafter referred to as "financial statements") are the responsibility of the Fund's management. Our responsibility is to express an opinion on these financial statements based on our audits. We conducted our audits of these financial statements in accordance with the standards of the Public Company Accounting Oversight Board (United States). Those standards require that we plan and perform the audit to obtain reasonable assurance about whether the financial statements are free of material misstatement. An audit includes examining, on a test basis, evidence supporting the amounts and disclosures in the financial statements, assessing the accounting principles used and significant estimates made by management, and evaluating the overall financial statement presentation. We believe that our audits, which included confirmation of securities at February 29, 2016 by correspondence with the custodian, brokers and transfer agent, and the application of alternative auditing procedures where such confirmations had not been received, provide a reasonable basis for our opinion.
PricewaterhouseCoopers LLP
Minneapolis, MN
April 21, 2016
Annual Report 2016
39
COLUMBIA LARGE CAP INDEX FUND
FEDERAL INCOME TAX INFORMATION
(Unaudited)
The Fund hereby designates the following tax attributes for the fiscal year ended February 29, 2016. Shareholders will be notified in early 2017 of the amounts for use in preparing 2016 income tax returns.
Tax Designations:
| Qualified Dividend Income | | | 97.79 | % | |
| Dividends Received Deduction | | | 96.79 | % | |
Qualified Dividend Income. For taxable, non-corporate shareholders, the percentage of ordinary income distributed during the fiscal year that represents qualified dividend income subject to reduced tax rates.
Dividends Received Deduction. The percentage of ordinary income distributed during the fiscal year that qualifies for the corporate dividends received deduction.
Annual Report 2016
40
COLUMBIA LARGE CAP INDEX FUND
Shareholders elect the Board that oversees the Fund's operations. The Board appoints officers who are responsible for day-to-day business decisions based on policies set by the Board. The following table provides basic biographical information about the Fund's Trustees, including their principal occupations during the past five years, although specific titles for individuals may have varied over the period. Under current Board policy, members generally may serve through the end of the calendar year in which they reach either the mandatory retirement age established by the Board or the fifteenth anniversary of the first Board meeting they attended as a member of the Board.
Trustees
Independent Trustees
Name,
Address,
Year of Birth | | Position Held With
the Funds and Length of
Service | | Principal Occupation(s)
During the Past Five Years
and Other Relevant
Professional Experience | | Number of
Funds in the
Columbia
Funds Complex
Overseen | | Other Directorships
Held by Trustee
During the Past
Five Years | |
Kathleen Blatz
901 S. Marquette Ave.
Minneapolis, MN 55402
1954 | | Trustee since 1/06 for RiverSource Funds and since 6/11 for Nations Funds | | Attorney; specializing in arbitration and mediation; Chief Justice, Minnesota Supreme Court, 1998-2006; Associate Justice, Minnesota Supreme Court, 1996-1998; Fourth Judicial District Court Judge, Hennepin County, 1994-1996; Attorney in private practice and public service, 1984-1993; State Representative, Minnesota House of Representatives, 1979-1993, which included service on the Tax and Financial Institutions and Insurance Committees | | | 124 | | | Trustee, BlueCross BlueShield of Minnesota (Chair of the Business Development Committee) since 2009; Chair of the Robina Foundation since August 2013 | |
Edward J. Boudreau, Jr.
901 S. Marquette Ave.
Minneapolis, MN 55402
1944 | | Trustee since 6/11 for RiverSource Funds and since 1/05 for Nations Funds | | Managing Director, E.J. Boudreau & Associates (consulting) since 2000; FINRA Industry Arbitrator, 2002-present; Chairman and Chief Executive Officer, John Hancock Funds (asset management), Chairman and Interested Trustee for open-end and closed-end funds offered by John Hancock, 1989-2000; John Hancock Life Insurance Company, including SVP and Treasurer and SVP Information Technology, 1968-1988 | | | 122 | | | Former Trustee, Boston Museum of Science (Chair of Finance Committee), 1985-2013; former Trustee, BofA Funds Series Trust (11 funds), 2005-2011 | |
Pamela G. Carlton
901 S. Marquette Ave.
Minneapolis, MN 55402
1954 | | Trustee since 7/07 for RiverSource Funds and since 6/11 for Nations Funds | | President, Springboard-Partners in Cross Cultural Leadership (consulting company) since 2003; Managing Director of US Equity Research, JP Morgan Chase, 1999-2003; Director of US Equity Research, Chase Asset Management, 1996-1999; Co-Director Latin America Research, 1993-1996, COO Global Research, 1992-1996, Co-Director of US Research, 1991-1992, Investment Banker, Morgan Stanley, 1982-1991 | | | 124 | | | Trustee, New York Presbyterian Hospital Board (Executive Committee and Chair of Human Resources Committee) since 1996 | |
Annual Report 2016
41
COLUMBIA LARGE CAP INDEX FUND
TRUSTEES AND OFFICERS (continued)
Independent Trustees (continued)
Name,
Address,
Year of Birth | | Position Held With
the Funds and Length of
Service | | Principal Occupation(s)
During the Past Five Years
and Other Relevant
Professional Experience | | Number of
Funds in the
Columbia
Funds Complex
Overseen | | Other Directorships
Held by Trustee
During the Past
Five Years | |
William P. Carmichael
901 S. Marquette Ave.
Minneapolis, MN 55402
1943 | | Trustee since 6/11 for RiverSource Funds and since 2003 for Nations Funds; Chair of the Board from 1/14-11/15 | | Retired; Co-founder, The Succession Fund (provides exit strategies to owners of privately held companies), 1998-2007; Adjunct Professor of Finance, Kelley School of Business, Indiana University, 1993-2007; Senior Vice President, Sara Lee Corporation, 1991-1993; Senior Vice President and Chief Financial Officer, Beatrice Foods Company, 1984-1990; Vice President, Esmark, Inc., 1973-1984; Associate, Price Waterhouse, 1968-1972 | | | 124 | | | Director, The Finish Line (athletic shoes and apparel) since July 2003; Director, International Textile Corp. since 2012; Director, hhgregg since May, 2015; former Director, Cobra Electronics Corporation (electronic equipment manufacturer), 1994-August 2014; former Director, Spectrum Brands, Inc. (consumer products), 2002-2009; former Director, Simmons Company (bedding), 2004-2010; former Trustee, BofA Funds Series Trust (11 funds), 2009-2011; former Director, McMoRan Exploration Company (oil and gas exploration and development), 2010-2013 | |
Patricia M. Flynn
901 S. Marquette Ave.
Minneapolis, MN 55402
1950 | | Trustee since 11/04 for RiverSource Funds and since 6/11 for Nations Funds | | Trustee Professor of Economics and Management, Bentley University since 1976 (also teaches and conducts research on corporate governance); Dean, McCallum Graduate School of Business, Bentley University, 1992-2002 | | | 124 | | | Trustee, MA Taxpayers Foundation since 1997; Board of Governors, Innovation Institute, MA Technology Collaborative since 2010 | |
William A. Hawkins
901 S. Marquette Ave.
Minneapolis, MN 55402
1942 | | Chair of the Board since 11/15; Trustee since 6/11 for RiverSource Funds and since 1/05 for Nations Funds | | Managing Director, Overton Partners (financial consulting) since August 2010; President and Chief Executive Officer, California General Bank, N.A., January 2008-August 2010; Operation Hope, COO, 2004-2007; IndyMac Bancorp, President, CBG, 1999-2003; American General Bank, President, 1997-1999; Griffin Financial Services, CEO, 1981-1997; The Griffin Funds, CEO, 1992-1998 | | | 124 | | | Former Trustee, BofA Funds Series Trust (11 funds), 2009-2015 | |
R. Glenn Hilliard
901 S. Marquette Ave.
Minneapolis, MN 55402
1943 | | Trustee since 6/11 for RiverSource Funds and since 1/05 for Nations Funds | | Chairman and Chief Executive Officer, Hilliard Group LLC (investing and consulting) since April 2003; Non-Executive Director & Chairman, CNO Financial Group, Inc. (insurance), 2003-2011; Chair & CEO, ING Americas, 1996-2003 | | | 122 | | | Chairman, BofA Funds Series Trust (11 funds); former Director, CNO Financial Group, Inc. (insurance), 2003-2011 | |
Annual Report 2016
42
COLUMBIA LARGE CAP INDEX FUND
TRUSTEES AND OFFICERS (continued)
Independent Trustees (continued)
Name,
Address,
Year of Birth | | Position Held With
the Funds and Length of
Service | | Principal Occupation(s)
During the Past Five Years
and Other Relevant
Professional Experience | | Number of
Funds in the
Columbia
Funds Complex
Overseen | | Other Directorships
Held by Trustee
During the Past
Five Years | |
Catherine James Paglia
901 S. Marquette Ave.
Minneapolis, MN 55402
1952 | | Trustee since 11/04 for RiverSource Funds and since 6/11 for Nations Funds | | Director, Enterprise Asset Management, Inc. (private real estate and asset management company) since September 1998; Managing Director and Partner, Interlaken Capital, Inc., 1989-1997; Managing Director, Morgan Stanley, 1982-1989; Vice President, Investment Banking, 1980-1982, Associate, Investment Banking, 1976-1980, Dean Witter Reynolds, Inc. | | | 124 | | | Director, Valmont Industries, Inc. (irrigation systems manufacturer) since 2012; Trustee, Carleton College (on the Investment Committee); Trustee, Carnegie Endowment for International Peace (on the Investment Committee) | |
Leroy C. Richie
901 S. Marquette Ave.
Minneapolis, MN 55402
1941 | | Trustee since 2000 for Seligman Funds, since 11/08 for RiverSource Funds and since 6/11 for Nations Funds | | Counsel, Lewis & Munday, P.C. (law firm) since 2004; Vice President and General Counsel, Automotive Legal Affairs, Chrysler Corporation, 1993-1997 | | | 122 | | | Lead Outside Director, Infinity Resources, Inc. (oil and gas exploration and production) since 1994; Lead Outside Director, Digital Ally, Inc. (digital imaging) since September 2005; Trustee, Marygrove College (Chair of Finance Committee) since 2007; former Director, OGE Energy Corp. (energy and energy services), 2007-2014 | |
Minor M. Shaw
901 S. Marquette Ave.
Minneapolis, MN 55402
1947 | | Trustee since 6/11 for RiverSource Funds and since 2003 for Nations Funds | | President, Micco LLC (private investments) since 2011; President, Micco Corp. (family investment business), 1998-2011 | | | 124 | | | Director, Piedmont Natural Gas; Director, BlueCross BlueShield of South Carolina since April 2008; Chair of the Duke Endowment; Director, National Association of Corporate Directors, Carolinas Chapter since 2013; Chair of Greenville — Spartanburg Airport Commission; former Trustee, BofA Funds Series Trust (11 funds), 2003-2011 | |
Alison Taunton-Rigby
901 S. Marquette Ave.
Minneapolis, MN 55402
1944 | | Trustee since 11/02 for RiverSource Funds and since 6/11 for Nations Funds | | Managing Director, Forester Biotech (consulting), 2001-2003; Chief Executive Officer and Director, RiboNovix, Inc., (biotechnology), 2003-2010; President and Chief Executive Officer of CMT Inc., 2001-2003; Aquila Biopharmaceuticals Inc., 1996-2000; Cambridge Biotech Corporation, 1995-1996; Mitotix Inc., 1993-1994 | | | 124 | | | Director, Abt Associates (government contractor) since 2001; Director, Boston Children's Hospital since 2002; Director, Healthways, Inc. (health and well-being solutions) since 2005; Director, ICI Mutual Insurance Company since 2011 | |
Annual Report 2016
43
COLUMBIA LARGE CAP INDEX FUND
TRUSTEES AND OFFICERS (continued)
Interested Trustee Not Affiliated with Investment Manager*
Name,
Address,
Year of Birth | | Position Held With
Funds and Length of
Service | | Principal Occupation(s)
During Past Five Years
and Other Relevant
Professional Experience | | Number of
Funds in the
Fund Family
Overseen by
Board Member | | Other Present or Past
Directorships/
Trusteeships
(Within Past 5 Years) | |
Anthony M. Santomero
901 S. Marquette Ave.
Minneapolis, MN 55402
1946 | | Trustee since 6/11 for RiverSource Funds and since 1/08 for Nations Funds | | Richard K. Mellon Professor Emeritus of Finance, The Wharton School, University of Pennsylvania since 2002; Senior Advisor, McKinsey & Company (consulting), 2006-2008; President, Federal Reserve Bank of Philadelphia, 2000-2006; Professor of Finance, The Wharton School, University of Pennsylvania, 1972-2002 | | | 122 | | | Trustee, Penn Mutual Life Insurance Company since March 2008; Director, Renaissance Reinsurance Ltd. since May 2008; Director, Citigroup Inc. since 2009; Director, Citibank, N.A. since 2009; former Trustee, BofA Funds Series Trust (11 funds), 2008-2011 | |
* Dr. Santomero is not an affiliated person of the Investment Manager or Ameriprise Financial. However, he is currently deemed by the Funds to be an "interested person" (as defined in the 1940 Act) of the Funds because he serves as a Director of Citigroup Inc. and Citibank, N.A., companies that may directly or through subsidiaries and affiliates engage from time-to-time in brokerage execution, principal transactions and lending relationships with the Funds or accounts advised/managed by the Investment Manager.
Annual Report 2016
44
COLUMBIA LARGE CAP INDEX FUND
TRUSTEES AND OFFICERS (continued)
Interested Trustee Affiliated with Investment Manager*
Name,
Address,
Year of Birth | | Position Held With
the Funds and Length of
Service | | Principal Occupation(s)
During Past Five Years
and Other Relevant
Professional Experience | | Number of
Funds in the
Columbia
Funds Complex
Overseen | | Other Directorships
Held by Trustee
During the Past
Five Years | |
William F. Truscott
c/o Columbia Management Investment Advisers, LLC,
225 Franklin St.
Boston, MA 02110
1960 | | Trustee since 11/01 for RiverSource Funds and since 6/11 for Nations Funds; Senior Vice President since 2002 for RiverSource Funds and since 5/10 for Nations Funds | | Chairman of the Board and President, Columbia Management Investment Advisers, LLC since May 2010 and February 2012, respectively (previously President and Chief Investment Officer, 2001-April 2010); Chief Executive Officer, Global Asset Management, Ameriprise Financial, Inc. since September 2012 (previously Chief Executive Officer, U.S. Asset Management & President, Annuities, May 2010-September 2012 and President — U.S. Asset Management and Chief Investment Officer, 2005-April 2010); Director and Chief Executive Officer, Columbia Management Investment Distributors, Inc. since May 2010 and February 2012, respectively (previously Chairman of the Board and Chief Executive Officer, 2006-April 2010); Chairman of the Board and Chief Executive Officer, RiverSource Distributors, Inc. since 2006; Director, Threadneedle Asset Management Holdings, SARL since 2014; President and Chief Executive Officer, Ameriprise Certificate Company, 2006-August 2012. | | | 182 | | | Chairman of the Board, Columbia Management Investment Advisers, LLC since May 2010; Director, Columbia Management Investment Distributors, Inc. since May 2010; Former Director, Ameriprise Certificate Company, 2006-January 2013 | |
* Interested person (as defined under the 1940 Act) by reason of being an officer, director, security holder and/or employee of the Investment Manager or Ameriprise Financial.
The Statement of Additional Information has additional information about the Fund's Board members and is available, without charge, upon request by calling 800.345.6611; contacting your financial intermediary; or visiting columbiathreadneedle.com/us.
Annual Report 2016
45
COLUMBIA LARGE CAP INDEX FUND
TRUSTEES AND OFFICERS (continued)
The Board has appointed officers who are responsible for day-to-day business decisions based on policies it has established. The officers serve at the pleasure of the Board. The following table provides basic information about the Officers of the Fund, including principal occupations during the past five years, although their specific titles may have varied over the period. In addition to Mr. Truscott, who is Senior Vice President, the Fund's other officers are:
Fund Officers
Name,
Address and
Year of Birth | | Position and Year
First Appointed to
Position for any Fund
in the Columbia
Funds Complex or a
Predecessor Thereof | | Principal Occupation(s) During Past Five Years | |
Christopher O. Petersen
5228 Ameriprise
Financial Center
Minneapolis, MN 55474
Born 1970 | | President and Principal Executive Officer (2015) | | Vice President and Lead Chief Counsel, Ameriprise Financial, Inc. since January 2015 (previously, Vice President and Chief Counsel January 2010-December 2014; and Vice President and Group Counsel or Counsel 2004-January 2010); officer of Columbia Funds and affiliated funds since 2007. | |
Michael G. Clarke
225 Franklin Street
Boston, MA 02110
Born 1969 | | Treasurer (2011), Chief Financial Officer (2009) and Chief Accounting Officer (2015) | | Vice President — Mutual Fund Administration, Columbia Management Investment Advisers, LLC, since May 2010; Managing Director of Fund Administration, Columbia Management Advisors, LLC, September 2004-April 2010; senior officer of Columbia Funds and affiliated funds since 2002. | |
Paul B. Goucher
100 Park Avenue
New York, NY 10017
Born 1968 | | Senior Vice President (2011), Chief Legal Officer (2015) and Assistant Secretary (2008) | | Vice President and Lead Chief Counsel, Ameriprise Financial, Inc. since November 2008 and January 2013, respectively (previously Chief Counsel, January 2010-January 2013 and Group Counsel, November 2008-January 2010). | |
Thomas P. McGuire
225 Franklin Street
Boston, MA 02110
Born 1972 | | Senior Vice President and Chief Compliance Officer (2012) | | Vice President — Asset Management Compliance, Ameriprise Financial, Inc., since May 2010; Chief Compliance Officer, Ameriprise Certificate Company since September 2010; Compliance Executive, Bank of America, 2005-April 2010. | |
Colin Moore
225 Franklin Street
Boston, MA 02110
Born 1958 | | Senior Vice President (2010) | | Executive Vice President and Global Chief Investment Officer, Ameriprise Financial, Inc., since July 2013; Director and Global Chief Investment Officer, Columbia Management Investment Advisers, LLC since May 2010; Manager, Managing Director and Chief Investment Officer, Columbia Management Advisors, LLC, 2007-April 2010. | |
Michael E. DeFao
225 Franklin Street
Boston, MA 02110
Born 1968 | | Vice President (2011) and Assistant Secretary (2010) | | Vice President and Chief Counsel, Ameriprise Financial, Inc. since May 2010; Associate General Counsel, Bank of America, 2005-April 2010. | |
Amy Johnson
5228 Ameriprise
Financial Center
Minneapolis, MN 55474
Born 1965 | | Vice President (2006) | | Managing Director and Chief Operating Officer, Columbia Management Investment Advisers, LLC since May 2010 (previously Chief Administrative Officer, 2009-April 2010, and Vice President — Asset Management and Trust Company Services, 2006-2009). | |
Lyn Kephart-Strong
5228 Ameriprise
Financial Center
Minneapolis, MN 55474
Born 1960 | | Vice President (2015) | | President, Columbia Management Investment Services Corp. since October 2014; Vice President & Resolution Officer, Ameriprise Trust Company since August 2009; President, RiverSource Service Corporation 2004-2010. | |
Ryan C. Larrenaga
225 Franklin Street
Boston, MA 02110
Born 1970 | | Vice President and Secretary (2015) | | Vice President and Group Counsel, Ameriprise Financial, Inc. since August 2011 (previously, Counsel from May 2010 to August 2011); Assistant General Counsel, Bank of America, 2005-April 2010; officer of Columbia Funds and affiliated funds since 2005. | |
Annual Report 2016
46
COLUMBIA LARGE CAP INDEX FUND
IMPORTANT INFORMATION ABOUT THIS REPORT
Each fund mails one shareholder report to each shareholder address. If you would like more than one report, please call shareholder services at 800.345.6611 and additional reports will be sent to you.
The policy of the Board is to vote the proxies of the companies in which each fund holds investments consistent with the procedures as stated in the Statement of Additional Information (SAI). You may obtain a copy of the SAI without charge by calling 800.345.6611; contacting your financial intermediary; visiting columbiathreadneedle.com/us; or searching the website of the Securities and Exchange Commission (SEC) at sec.gov. Information regarding how each fund voted proxies relating to portfolio securities is filed with the SEC by August 31st for the most recent 12-month period ending June 30th of that year, and is available without charge by visiting columbiathreadneedle.com/us, or searching the website of the SEC at sec.gov.
Each fund files a complete schedule of portfolio holdings with the SEC for the first and third quarters of each fiscal year on Form N-Q. Each fund's Form N-Q is available on the SEC's website at sec.gov and may be reviewed and copied at the SEC's Public Reference Room in Washington, D.C. Information on the operation of the Public Reference Room may be obtained by calling 800.SEC.0330. Each fund's complete schedule of portfolio holdings, as filed on Form N-Q, can also be obtained without charge, upon request, by calling 800.345.6611.
Annual Report 2016
47
Columbia Large Cap Index Fund
P.O. Box 8081
Boston, MA 02266-8081

This information is for use with concurrent or prior delivery of a fund prospectus. Please read and consider the investment objectives, risks, charges and expenses for any fund carefully before investing. For a prospectus and summary prospectus, which contains this and other important information about the Fund, go to columbiathreadneedle.com/us. The Fund is distributed by Columbia Management Investment Distributors, Inc., member FINRA, and managed by Columbia Management Investment Advisers, LLC.
Columbia Threadneedle Investments (Columbia Threadneedle) is the global brand name of the Columbia and Threadneedle group of companies.
All rights reserved. Columbia Management Investment Distributors, Inc., 225 Franklin Street, Boston, MA 02110-2804
© 2016 Columbia Management Investment Advisers, LLC.
columbiathreadneedle.com/us
ANN175_02_F01_(04/16)

ANNUAL REPORT
February 29, 2016

COLUMBIA MID CAP INDEX FUND

ABOUT COLUMBIA THREADNEEDLE INVESTMENTS
Columbia Threadneedle Investments is a leading global asset management group that provides a broad range of actively managed investment strategies and solutions for individual, institutional and corporate clients around the world.
With more than 2,000 people, including over 450 investment professionals based in North America, Europe and Asia, we manage $472 billion* of assets across developed and emerging market equities, fixed income, asset allocation solutions and alternatives. We are the 13th largest manager of long-term mutual fund assets in the U.S.** and the 4th largest manager of retail funds in the U.K.***
Our priority is the investment success of our clients. We aim to deliver the investment outcomes they expect through an investment approach that is team-based, performance-driven and risk-aware. Our culture is dynamic and interactive. By sharing our insights across asset classes and geographies, we generate richer perspectives on global, regional and local investment landscapes. The ability to exchange and debate investment ideas in a collaborative environment enriches our teams' investment processes. More importantly, it results in better informed investment decisions for our clients.
Columbia funds are distributed by Columbia Management Investment Distributors, Inc., member FINRA, and managed by Columbia Management Investment Advisers, LLC.
Columbia Threadneedle Investments (Columbia Threadneedle) is the global brand name of the Columbia and Threadneedle group of companies.
* In U.S. dollars as of December 31, 2015. Source: Ameriprise Q4 Earnings Release. Includes all assets managed by entities in the Columbia and Threadneedle groups of companies. Contact us for more current data.
��** Source: ICI as of December 31, 2015 for Columbia Management Investment Advisers, LLC.
*** Source: Investment Association as of September 2015 for Threadneedle Asset Management Limited.
© 2016 Columbia Management Investment Advisers, LLC. All rights reserved.
Not part of the shareholder report
Investment strategies to help meet investor needs
We are committed to helping investors navigate financial challenges to reach their desired outcomes. The possibilities are endless.
Your success is our priority.
Retire comfortably
Fund college or higher education
Leave a legacy
Generate an appropriate stream of income in retirement
Traditional approaches to income may no longer be adequate — and they may no longer provide the diversification benefits they once did. Investors need to rethink how they generate retirement income.
Worried about running out of income? You are not alone.
Navigate a changing interest rate environment
Even in today's challenging interest rate environment, it's still possible to navigate markets and achieve your goals.
Make investment choices designed specifically for this market environment.
Maximize after-tax returns
In an environment where what you keep is more important than what you earn, municipal bonds can help mitigate higher taxes while providing attractive yields compared to other investment options.
You've worked too hard building your wealth to lose it to taxes.
Grow assets to achieve financial goals
Finding growth opportunities in today's complex market environment requires strong research capabilities, creative thinking and a disciplined approach.
Do your investments deliver the portfolio growth you need?
Ease the impact of volatile markets
With increasing concerns about market volatility, investors should consider diversifying their portfolios with non-traditional holdings.
Interested in turning volatility into opportunity?
To find out more, contact your financial professional, call 800.426.3750 or visit columbiathreadneedle.com/us
Not part of the shareholder report
 Dear Shareholder,
Today's investors are typically focused on outcomes, like living a certain retirement lifestyle, paying for college education or building a legacy. But in today's complex global investment landscape, even simple goals are not easily achieved.
At Columbia Threadneedle Investments, we aspire to help satisfy five core needs of today's investors:
n Generate an appropriate stream of income in retirement
Traditional approaches to generating income may not provide the diversification benefits they once did, and they may actually introduce unwanted risk in today's market. To seek to improve your potential to live comfortably long term, we endeavor to pursue investments that explore less traveled paths to income.
n Navigate a changing interest rate environment
Today's uncertain market environment includes the prospect of a rise in interest rates. Blending traditional investments with non-traditional or alternative products may help protect your wealth during periods of volatility. We can attempt to help strengthen your portfolio with agile products designed to take on the market's ups and downs.
n Maximize after-tax returns
In an environment where what you keep may be more important than what you earn, municipal bonds can help mitigate high tax burdens while providing potentially attractive yields. Our state and federal tax-exempt products are aimed at helping investors manage risk, minimize the fluctuation of capital and grow wealth on a more tax-efficient basis.
n Grow assets to achieve financial goals
We believe that finding and protecting growth comes from a disciplined security selection process designed to create excess return. Our goal is to provide investment solutions built to help you face today's market challenges and grow your assets at each crossroad of your journey.
n Ease the impact of volatile markets
Despite a bull market run that has benefited many investors over the past several years, it's important to remember the lessons of 2008 and the value that a well-diversified portfolio may provide through times of market volatility. We are here to help you hold onto the savings you have worked tirelessly to amass, and to provide you the best opportunity to maintain your standard of living regardless of market conditions.
Find out today how we can help you confidently invest to realize your dreams. Please visit us at blog.columbiathreadneedleus.com/our-best-ideas to learn more about our unique investment solutions.
The world is constantly changing, but our priority remains the same: to help you secure your finances, meet your goals and achieve success. Thank you for your continued investment with us.
Sincerely,

Christopher O. Petersen
President, Columbia Funds
Investors should consider the investment objectives, risks, charges and expenses of a mutual fund carefully before investing. For a free prospectus and summary prospectus, which contains this and other important information about a fund, visit columbiathreadneedle.com/us. The prospectus should be read carefully before investing.
Columbia Funds are distributed by Columbia Management Investment Distributors, Inc., member FINRA, and managed by Columbia Management Investment Advisers, LLC.
© 2016 Columbia Management Investment Advisers, LLC. All rights reserved.
COLUMBIA MID CAP INDEX FUND
Performance Overview | | | 2 | | |
Manager Discussion of Fund Performance | | | 4 | | |
Understanding Your Fund's Expenses | | | 6 | | |
Portfolio of Investments | | | 7 | | |
Statement of Assets and Liabilities | | | 17 | | |
Statement of Operations | | | 19 | | |
Statement of Changes in Net Assets | | | 20 | | |
Financial Highlights | | | 22 | | |
Notes to Financial Statements | | | 26 | | |
Report of Independent Registered Public Accounting Firm | | | 35 | | |
Federal Income Tax Information | | | 36 | | |
Trustees and Officers | | | 37 | | |
Important Information About This Report | | | 43 | | |
Fund Investment Manager
Columbia Management Investment
Advisers, LLC
225 Franklin Street
Boston, MA 02110
Fund Distributor
Columbia Management Investment
Distributors, Inc.
225 Franklin Street
Boston, MA 02110
Fund Transfer Agent
Columbia Management Investment
Services Corp.
P.O. Box 8081
Boston, MA 02266-8081
For more information about any of the funds, please visit columbiathreadneedle.com/us or call 800.345.6611. Customer Service Representatives are available to answer your questions Monday through Friday from 8 a.m. to 7 p.m. Eastern time.
The views expressed in this report reflect the current views of the respective parties. These views are not guarantees of future performance and involve certain risks, uncertainties and assumptions that are difficult to predict, so actual outcomes and results may differ significantly from the views expressed. These views are subject to change at any time based upon economic, market or other conditions and the respective parties disclaim any responsibility to update such views. These views may not be relied on as investment advice and, because investment decisions for a Columbia fund are based on numerous factors, may not be relied on as an indication of trading intent on behalf of any particular Columbia fund. References to specific securities should not be construed as a recommendation or investment advice.
COLUMBIA MID CAP INDEX FUND
Performance Summary
n Columbia Mid Cap Index Fund (the Fund) Class A shares returned -10.37% for the 12-month period that ended February 29, 2016.
n The Fund closely tracked its benchmark, the unmanaged S&P MidCap 400 Index, which returned -9.99% for the same period.
n Mutual funds, unlike unmanaged indices, incur operating expenses, which accounted for the performance differential between the Fund and the Index.
Average Annual Total Returns (%) (for period ended February 29, 2016)
| | | Inception | | 1 Year | | 5 Years | | 10 Years | |
Class A | | 05/31/00 | | | -10.37 | | | | 7.78 | | | | 6.75 | | |
Class I* | | 09/27/10 | | | -10.16 | | | | 8.09 | | | | 7.04 | | |
Class R5* | | 11/08/12 | | | -10.14 | | | | 8.09 | | | | 7.04 | | |
Class Z | | 03/31/00 | | | -10.18 | | | | 8.06 | | | | 7.02 | | |
S&P MidCap 400 Index | | | | | | | -9.99 | | | | 8.27 | | | | 7.17 | | |
All results shown assume reinvestment of distributions during the period. Returns do not reflect the deduction of taxes that a shareholder may pay on Fund distributions or on the redemption of Fund shares. Performance results reflect the effect of any fee waivers or reimbursements of Fund expenses by Columbia Management Investment Advisers, LLC and/or any of its affiliates. Absent these fee waivers or expense reimbursement arrangements, performance results would have been lower.
The performance information shown represents past performance and is not a guarantee of future results. The investment return and principal value of your investment will fluctuate so that your shares, when redeemed, may be worth more or less than their original cost. Current performance may be lower or higher than the performance information shown. You may obtain performance information current to the most recent month-end by contacting your financial intermediary, visiting columbiathreadneedle.com/us or calling 800.345.6611.
*The returns shown for periods prior to the share class inception date (including returns for the Life of the Fund, if shown, which are since Fund inception) include the returns of the Fund's oldest share class. These returns are adjusted to reflect any higher class-related operating expenses of the newer share classes, as applicable. Please visit columbiathreadneedle.com/us/investment-products/mutual-funds/appended-performance for more information.
The S&P MidCap 400 Index is a market-value weighted index that tracks the performance of 400 mid-cap U.S. companies.
Indices are not available for investment, are not professionally managed and do not reflect sales charges, fees, brokerage commissions, taxes or other expenses of investing. Securities in the Fund may not match those in an index.
Annual Report 2016
2
COLUMBIA MID CAP INDEX FUND
PERFORMANCE OVERVIEW (continued)
Performance of a Hypothetical $10,000 Investment (March 1, 2006 – February 29, 2016)
The chart above shows the change in value of a hypothetical $10,000 investment in Class A shares of Columbia Mid Cap Index Fund during the stated time period, and does not reflect the deduction of taxes that a shareholder may pay on Fund distributions or on the redemption of Fund shares.
Annual Report 2016
3
COLUMBIA MID CAP INDEX FUND
MANAGER DISCUSSION OF FUND PERFORMANCE
Portfolio Management
Christopher Lo, CFA
Vadim Shteyn
Morningstar Style BoxTM

The Morningstar Style BoxTM is based on a fund's portfolio holdings. For equity funds, the vertical axis shows the market capitalization of the stocks owned, and the horizontal axis shows investment style (value, blend, or growth). Information shown is based on the most recent data provided by Morningstar.
© 2016 Morningstar, Inc. All rights reserved. The Morningstar information contained herein: (1) is proprietary to Morningstar and/or its content providers; (2) may not be copied or distributed; and (3) is not warranted to be accurate, complete or timely. Neither Morningstar nor its content providers are responsible for any damages or losses arising from any use of this information.
Top Ten Holdings (%)
(at February 29, 2016) | |
Jarden Corp. | | | 0.8 | | |
Alaska Air Group, Inc. | | | 0.7 | | |
Acuity Brands, Inc. | | | 0.7 | | |
UDR, Inc. | | | 0.6 | | |
Mettler-Toledo International, Inc. | | | 0.6 | | |
Foot Locker, Inc. | | | 0.6 | | |
Hologic, Inc. | | | 0.6 | | |
LKQ Corp. | | | 0.6 | | |
Fortune Brands Home &
Security, Inc. | | | 0.6 | | |
Everest Re Group Ltd. | | | 0.6 | | |
Percentages indicated are based upon total investments (excluding Money Market Funds).
For further detail about these holdings, please refer to the section entitled "Portfolio of Investments."
Fund holdings are as of the date given, are subject to change at any time, and are not recommendations to buy or sell any security.
For the 12-month period that ended February 29, 2016, the Fund's Class A shares returned -10.37%. The Fund closely tracked its benchmark, the unmanaged S&P MidCap 400 Index, which returned -9.99% for the same period. Mutual funds, unlike unmanaged indices, incur operating expenses.
U.S. Equity Market Experienced a Roller Coaster Year
The U.S. economy topped the rest of the developed world, and the U.S. stock market, as represented by the S&P 500 Index, finished calendar year 2015 in positive territory, though mid-cap stocks, as represented by the S&P MidCap 400 Index, did not perform as well. For the 12 months ended February 29, 2016, the U.S. equity market, both large-cap and mid-cap stocks, declined substantially, providing evidence of the roller coaster year experienced by most investors. Four factors dogged U.S. stocks during the period. One, a further and unexpected decline in commodity prices (making for a fifth consecutive year of negative returns), particularly oil. Two, continued strength in the U.S. dollar. Three, soft economic growth and currency devaluation in China. And four, a Federal Reserve (Fed) that only felt confident enough about the U.S. economy to begin raising interest rates in the waning weeks of December 2015. Twelve months earlier, many expected the Fed to begin tightening monetary policy as early as the first quarter of 2015.
Dissecting U.S. equity market returns further, it is clear that performance was narrowly driven by a handful of stocks. Indeed, just ten stocks accounted for 40% of the total positive contribution to the S&P 500 Index return in calendar year 2015. Even further, the so called "FANG" stocks — Facebook, Amazon.com, Netflix and Google accounted for over 20% of the total positive return in the S&P 500 Index in 2015.
Though overall 2015 will be remembered as one of the most uncertain and turbulent market years, in perspective, it is worth keeping in mind that there were also many important positive economic developments. For example, rising consumer confidence, especially toward the end of the calendar year, drove much of consumer spending for 2015. Also, home prices increased; inflation remained relatively stable; and the job market held steady, with unemployment declining to 5% at year end 2015.
In the first two months of 2016, anxiety about a potential U.S. recession began to subside. Retail sales, existing home sales, the Institute of Supply Management's Purchasing Managers Index, and the employment report all exceeded economists' consensus forecasts. Still, the S&P 500 Index declined more than 5% and the S&P MidCap 400 Index declined more than 4% in the first two months of 2016, attributable primarily to January 2016 when U.S. equities were embroiled in what was a global rout, triggered by investor concerns of an intensifying economic slowdown in China and exacerbated by a plunge in oil prices to less than $30 per barrel. Market sentiment appeared to improve in February 2016, as central banks outside of the U.S. increasingly acknowledged rising economic risks, U.S. economic data improved, and oil prices recovered, albeit modestly, from their trough point.
Annual Report 2016
4
COLUMBIA MID CAP INDEX FUND
MANAGER DISCUSSION OF FUND PERFORMANCE (continued)
S&P MidCap 400 Index Faced Broad-Based Declines
Only one of the ten sectors of the S&P MidCap 400 Index posted a positive return during the 12 months ended February 29, 2016 — namely, utilities. In terms of total return, utilities, financials and health care were the best relative performers. On the basis of impact, which takes weightings and total returns into account, utilities, telecommunication services and consumer staples were the biggest contributors to the Index's return. The top performing industries for the period were utilities; insurance; commercial and professional services; food, beverage and tobacco; and software and services.
Conversely, energy, materials and consumer discretionary, each traditionally considered a more cyclical sector, were the weakest sectors from a total return perspective. On the basis of impact, energy, information technology and consumer discretionary were the weakest. The worst performing industries for the period were energy; food and staples retailing; semiconductors; automobiles and components; and technology hardware and equipment.
Top individual contributors within the S&P MidCap 400 Index included insurance company StanCorp Financial Group, lighting systems producer Acuity Brands, consumer finance company Global Payments, information technology products and services wholesaler Ingram Micro and waste management company Waste Connections. Top detractors were recreational vehicle manufacturer Polaris Industries, container and packaging manufacturer Packaging Corporation of America, freight rail and passenger transit industry technology-based products and services provider Westinghouse Air Brake Technologies, real estate services provider Jones Lang LaSalle and packaged foods company Hain Celestial Group.
As always, each sector and stock in the S&P MidCap 400 Index was represented in the Fund with approximately the same weighting as in the Index and therefore had a similar effect.
Index Additions and Deletions Drove Portfolio Changes
During the period, there were 58 additions and 58 deletions to the Index and the Fund's portfolio. Among those stocks added were Buffalo Wild Wings, QEP Resources, Dunkin' Brands Group, Bank of the Ozarks, WisdomTree Investments, Cable One, Energizer Holdings, Skechers U.S.A., Noble, Joy Global, Genworth Financial, Fossil Group, Curtiss-Wright and Casey's General Stores.
Deletions included Advance Auto Parts, AOL, Peabody Energy, Cliffs Natural Resources, Equinix, Hanesbrands, Rent-A-Center, Rosetta Resources, SL Green Realty, Skyworks Solutions, Dresser-Rand Group, Apollo Education Group, Church & Dwight and Extra Space Storage.
We do not anticipate any changes in the portfolio beyond the customary quarterly rebalancings and stock substitutions we make to align the Fund with the S&P MidCap 400 Index. As the Fund seeks to closely approximate the performance of the S&P MidCap 400 Index, we will continue to match its industry and risk characteristics by investing primarily in the securities that comprise the Index.
Portfolio Breakdown (%)
(at February 29, 2016) | |
Common Stocks | | | 98.7 | | |
Money Market Funds | | | 1.3 | | |
Total | | | 100.0 | | |
Percentages indicated are based upon total investments. The Fund's portfolio composition is subject to change.
Equity Sector Breakdown (%)
(at February 29, 2016) | |
Consumer Discretionary | | | 13.6 | | |
Consumer Staples | | | 4.2 | | |
Energy | | | 2.6 | | |
Financials | | | 25.4 | | |
Health Care | | | 9.7 | | |
Industrials | | | 15.3 | | |
Information Technology | | | 16.7 | | |
Materials | | | 6.6 | | |
Telecommunication Services | | | 0.2 | | |
Utilities | | | 5.7 | | |
Total | | | 100.0 | | |
Percentages indicated are based upon total equity investments. The Fund's portfolio composition is subject to change.
Investment Risks
Market risk may affect a single issuer, sector of the economy, industry or the market as a whole. Investments in mid-cap companies involve risks and volatility greater than investments in larger, more established companies. The Fund's net value will generally decline when the performance of its targeted index declines. Investing in derivatives is a specialized activity that involves special risks, which may result in significant losses See the Fund's prospectus for information on these and other risks.
Annual Report 2016
5
COLUMBIA MID CAP INDEX FUND
UNDERSTANDING YOUR FUND'S EXPENSES
(Unaudited)
As an investor, you incur two types of costs. There are transaction costs, which generally include sales charges on purchases and may include redemption fees. There are also ongoing costs, which generally include management fees, distribution and/or service fees, and other fund expenses. The following information is intended to help you understand your ongoing costs (in dollars) of investing in the Fund and to help you compare these costs with the ongoing costs of investing in other mutual funds.
Analyzing Your Fund's Expenses
To illustrate these ongoing costs, we have provided examples and calculated the expenses paid by investors in each share class of the Fund during the period. The actual and hypothetical information in the table is based on an initial investment of $1,000 at the beginning of the period indicated and held for the entire period. Expense information is calculated two ways and each method provides you with different information. The amount listed in the "Actual" column is calculated using the Fund's actual operating expenses and total return for the period. You may use the Actual information, together with the amount invested, to estimate the expenses that you paid over the period. Simply divide your account value by $1,000 (for example, an $8,600 account value divided by $1,000 = 8.6), then multiply the results by the expenses paid during the period under the "Actual" column. The amount listed in the "Hypothetical" column assumes a 5% annual rate of return before expenses (which is not the Fund's actual return) and then applies the Fund's actual expense ratio for the period to the hypothetical return. You should not use the hypothetical account values and expenses to estimate either your actual account balance at the end of the period or the expenses you paid during the period. See "Compare With Other Funds" below for details on how to use the hypothetical data.
Compare With Other Funds
Since all mutual funds are required to include the same hypothetical calculations about expenses in shareholder reports, you can use this information to compare the ongoing cost of investing in the Fund with other funds. To do so, compare the hypothetical example with the 5% hypothetical examples that appear in the shareholder reports of other funds. As you compare hypothetical examples of other funds, it is important to note that hypothetical examples are meant to highlight the ongoing costs of investing in a fund only and do not reflect any transaction costs, such as sales charges, or redemption or exchange fees. Therefore, the hypothetical calculations are useful in comparing ongoing costs only, and will not help you determine the relative total costs of owning different funds. If transaction costs were included in these calculations, your costs would be higher.
September 1, 2015 – February 29, 2016
| | | Account Value at the Beginning of
the Period ($) | | Account Value at the End of
the Period ($) | | Expenses Paid During the
Period ($) | | Fund's Annualized
Expense Ratio (%) | |
| | | Actual | | Hypothetical | | Actual | | Hypothetical | | Actual | | Hypothetical | | Actual | |
Class A | | | 1,000.00 | | | | 1,000.00 | | | | 947.70 | | | | 1,022.63 | | | | 2.18 | | | | 2.26 | | | | 0.45 | | |
Class I | | | 1,000.00 | | | | 1,000.00 | | | | 949.10 | | | | 1,023.87 | | | | 0.97 | | | | 1.01 | | | | 0.20 | | |
Class R5 | | | 1,000.00 | | | | 1,000.00 | | | | 949.10 | | | | 1,023.87 | | | | 0.97 | | | | 1.01 | | | | 0.20 | | |
Class Z | | | 1,000.00 | | | | 1,000.00 | | | | 948.90 | | | | 1,023.87 | | | | 0.97 | | | | 1.01 | | | | 0.20 | | |
Expenses paid during the period are equal to the annualized expense ratio for each class as indicated above, multiplied by the average account value over the period and then multiplied by the number of days in the Fund's most recent fiscal half year and divided by 366.
Expenses do not include fees and expenses incurred indirectly by the Fund from its investment in underlying funds, including affiliated and non-affiliated pooled investment vehicles, such as mutual funds and exchange-traded funds.
Had Columbia Management Investment Advisers, LLC and/or certain of its affiliates not waived/reimbursed certain fees and expenses, account value at the end of the period would have been reduced.
Annual Report 2016
6
COLUMBIA MID CAP INDEX FUND
PORTFOLIO OF INVESTMENTS
February 29, 2016
(Percentages represent value of investments compared to net assets)
Common Stocks 98.9%
Issuer | | Shares | | Value ($) | |
CONSUMER DISCRETIONARY 13.5% | |
Auto Components 0.4% | |
Dana Holding Corp. | | | 355,860 | | | | 4,426,898 | | |
Gentex Corp. | | | 678,516 | | | | 9,879,193 | | |
Total | | | | | 14,306,091 | | |
Automobiles 0.2% | |
Thor Industries, Inc. | | | 106,274 | | | | 5,885,454 | | |
Distributors 0.8% | |
LKQ Corp.(a) | | | 711,017 | | | | 19,624,070 | | |
Pool Corp. | | | 99,260 | | | | 7,967,600 | | |
Total | | | | | 27,591,670 | | |
Diversified Consumer Services 0.7% | |
DeVry Education Group, Inc. | | | 132,968 | | | | 2,427,996 | | |
Graham Holdings Co., Class B | | | 10,442 | | | | 5,096,844 | | |
Service Corp. International | | | 457,361 | | | | 10,757,131 | | |
Sotheby's | | | 138,432 | | | | 3,149,328 | | |
Total | | | | | 21,431,299 | | |
Hotels, Restaurants & Leisure 2.4% | |
Brinker International, Inc. | | | 138,609 | | | | 6,902,728 | | |
Buffalo Wild Wings, Inc.(a) | | | 44,330 | | | | 7,032,954 | | |
Cheesecake Factory, Inc. (The) | | | 105,325 | | | | 5,255,718 | | |
Cracker Barrel Old Country Store, Inc. | | | 55,720 | | | | 8,249,346 | | |
Domino's Pizza, Inc. | | | 127,190 | | | | 16,921,358 | | |
Dunkin' Brands Group, Inc. | | | 215,620 | | | | 10,043,580 | | |
International Speedway Corp., Class A | | | 62,149 | | | | 2,143,519 | | |
Jack in the Box, Inc. | | | 83,310 | | | | 5,727,562 | | |
Panera Bread Co., Class A(a) | | | 55,391 | | | | 11,477,015 | | |
Wendy's Co. (The) | | | 509,208 | | | | 4,771,279 | | |
Total | | | | | 78,525,059 | | |
Household Durables 2.4% | |
CalAtlantic Group, Inc. | | | 177,450 | | | | 5,383,833 | | |
Jarden Corp.(a) | | | 482,101 | | | | 25,493,501 | | |
KB Home | | | 212,136 | | | | 2,588,059 | | |
MDC Holdings, Inc. | | | 91,028 | | | | 2,012,629 | | |
NVR, Inc.(a) | | | 8,562 | | | | 14,015,994 | | |
Tempur Sealy International, Inc.(a) | | | 144,854 | | | | 8,353,730 | | |
Toll Brothers, Inc.(a) | | | 377,406 | | | | 10,359,795 | | |
TRI Pointe Group, Inc.(a) | | | 338,960 | | | | 3,494,678 | | |
Tupperware Brands Corp. | | | 117,200 | | | | 5,855,312 | | |
Total | | | | | 77,557,531 | | |
Common Stocks (continued)
Issuer | | Shares | | Value ($) | |
Internet & Catalog Retail 0.1% | |
HSN, Inc. | | | 74,499 | | | | 3,955,152 | | |
Leisure Products 0.9% | |
Brunswick Corp. | | | 211,910 | | | | 9,014,651 | | |
Polaris Industries, Inc. | | | 141,904 | | | | 12,474,781 | | |
Vista Outdoor, Inc.(a) | | | 145,014 | | | | 7,149,190 | | |
Total | | | | | 28,638,622 | | |
Media 1.5% | |
AMC Networks, Inc., Class A(a) | | | 141,754 | | | | 9,290,557 | | |
Cable One, Inc. | | | 10,354 | | | | 4,437,414 | | |
Cinemark Holdings, Inc. | | | 245,533 | | | | 8,127,142 | | |
DreamWorks Animation SKG, Inc.,
Class A(a) | | | 165,440 | | | | 4,245,190 | | |
John Wiley & Sons, Inc., Class A | | | 114,214 | | | | 4,971,736 | | |
Live Nation Entertainment, Inc.(a) | | | 339,090 | | | | 7,456,589 | | |
Meredith Corp. | | | 87,728 | | | | 3,815,291 | | |
New York Times Co. (The), Class A | | | 288,669 | | | | 3,628,569 | | |
Time, Inc. | | | 255,500 | | | | 3,602,550 | | |
Total | | | | | 49,575,038 | | |
Multiline Retail 0.4% | |
Big Lots, Inc. | | | 115,330 | | | | 4,665,099 | | |
JCPenney Co., Inc.(a) | | | 711,040 | | | | 7,252,608 | | |
Total | | | | | 11,917,707 | | |
Specialty Retail 2.6% | |
Aaron's, Inc. | | | 150,369 | | | | 3,456,983 | | |
Abercrombie & Fitch Co., Class A | | | 156,420 | | | | 4,544,001 | | |
American Eagle Outfitters, Inc. | | | 416,774 | | | | 6,359,971 | | |
Ascena Retail Group, Inc.(a) | | | 401,369 | | | | 3,391,568 | | |
Cabela's, Inc.(a) | | | 114,550 | | | | 5,496,109 | | |
Chico's FAS, Inc. | | | 324,448 | | | | 4,139,956 | | |
CST Brands, Inc. | | | 175,990 | | | | 5,709,116 | | |
Dick's Sporting Goods, Inc. | | | 209,660 | | | | 8,904,260 | | |
Foot Locker, Inc. | | | 319,477 | | | | 19,967,313 | | |
Guess?, Inc. | | | 148,178 | | | | 3,163,600 | | |
Murphy USA, Inc.(a) | | | 91,180 | | | | 5,807,254 | | |
Office Depot, Inc.(a) | | | 1,149,432 | | | | 5,839,115 | | |
Williams-Sonoma, Inc. | | | 194,308 | | | | 10,125,390 | | |
Total | | | | | 86,904,636 | | |
The accompanying Notes to Financial Statements are an integral part of this statement.
Annual Report 2016
7
COLUMBIA MID CAP INDEX FUND
PORTFOLIO OF INVESTMENTS (continued)
February 29, 2016
Common Stocks (continued)
Issuer | | Shares | | Value ($) | |
Textiles, Apparel & Luxury Goods 1.1% | |
Carter's, Inc. | | | 121,002 | | | | 12,297,433 | | |
Deckers Outdoor Corp.(a) | | | 75,252 | | | | 4,256,253 | | |
Fossil Group, Inc.(a) | | | 96,730 | | | | 4,537,605 | | |
Kate Spade & Co.(a) | | | 297,210 | | | | 5,890,702 | | |
Skechers U.S.A., Inc., Class A(a) | | | 302,500 | | | | 9,958,300 | | |
Total | | | | | 36,940,293 | | |
Total Consumer Discretionary | | | | | 443,228,552 | | |
CONSUMER STAPLES 4.1% | |
Beverages 0.1% | |
Boston Beer Co., Inc. (The), Class A(a) | | | 22,230 | | | | 4,181,686 | | |
Food & Staples Retailing 0.8% | |
Casey's General Stores, Inc. | | | 90,790 | | | | 9,584,700 | | |
Sprouts Farmers Market, Inc.(a) | | | 335,160 | | | | 9,545,357 | | |
SUPERVALU, Inc.(a) | | | 618,911 | | | | 3,162,635 | | |
United Natural Foods, Inc.(a) | | | 116,831 | | | | 3,605,405 | | |
Total | | | | | 25,898,097 | | |
Food Products 2.6% | |
Dean Foods Co. | | | 212,635 | | | | 4,101,729 | | |
Flowers Foods, Inc. | | | 434,541 | | | | 7,443,687 | | |
Hain Celestial Group, Inc. (The)(a) | | | 239,640 | | | | 8,859,491 | | |
Ingredion, Inc. | | | 166,516 | | | | 16,854,750 | | |
Lancaster Colony Corp. | | | 45,225 | | | | 4,602,548 | | |
Post Holdings, Inc.(a) | | | 144,491 | | | | 10,036,345 | | |
Snyders-Lance, Inc. | | | 184,330 | | | | 6,029,434 | | |
Tootsie Roll Industries, Inc. | | | 41,229 | | | | 1,373,750 | | |
TreeHouse Foods, Inc.(a) | | | 127,080 | | | | 10,728,094 | | |
WhiteWave Foods Co. (The), Class A(a) | | | 410,110 | | | | 15,879,459 | | |
Total | | | | | 85,909,287 | | |
Household Products 0.2% | |
Energizer Holdings, Inc. | | | 145,233 | | | | 5,655,373 | | |
Personal Products 0.4% | |
Avon Products, Inc. | | | 1,013,380 | | | | 3,860,978 | | |
Edgewell Personal Care Co. | | | 139,723 | | | | 10,681,823 | | |
Total | | | | | 14,542,801 | | |
Total Consumer Staples | | | | | 136,187,244 | | |
Common Stocks (continued)
Issuer | | Shares | | Value ($) | |
ENERGY 2.6% | |
Energy Equipment & Services 1.1% | |
Dril-Quip, Inc.(a) | | | 89,270 | | | | 4,842,898 | | |
Nabors Industries Ltd. | | | 659,840 | | | | 4,724,454 | | |
Noble Corp. PLC | | | 563,180 | | | | 4,691,289 | | |
Oceaneering International, Inc. | | | 227,736 | | | | 6,290,068 | | |
Oil States International, Inc.(a) | | | 118,248 | | | | 3,087,455 | | |
Patterson-UTI Energy, Inc. | | | 342,553 | | | | 5,323,274 | | |
Rowan Companies PLC, Class A | | | 290,500 | | | | 3,869,460 | | |
Superior Energy Services, Inc. | | | 350,839 | | | | 3,606,625 | | |
Total | | | | | 36,435,523 | | |
Oil, Gas & Consumable Fuels 1.5% | |
Denbury Resources, Inc. | | | 817,320 | | | | 1,046,170 | | |
Energen Corp. | | | 220,125 | | | | 5,828,910 | | |
Gulfport Energy Corp.(a) | | | 251,940 | | | | 6,046,560 | | |
HollyFrontier Corp. | | | 425,710 | | | | 14,397,512 | | |
QEP Resources, Inc. | | | 446,100 | | | | 4,353,936 | | |
SM Energy Co. | | | 158,209 | | | | 1,430,209 | | |
Western Refining, Inc. | | | 161,360 | | | | 4,303,471 | | |
World Fuel Services Corp. | | | 164,740 | | | | 7,711,480 | | |
WPX Energy, Inc.(a) | | | 544,590 | | | | 2,238,265 | | |
Total | | | | | 47,356,513 | | |
Total Energy | | | | | 83,792,036 | | |
FINANCIALS 25.1% | |
Banks 5.3% | |
Associated Banc-Corp. | | | 349,889 | | | | 6,018,091 | | |
BancorpSouth, Inc. | | | 196,880 | | | | 3,921,850 | | |
Bank of Hawaii Corp. | | | 100,766 | | | | 6,398,641 | | |
Bank of the Ozarks, Inc. | | | 189,290 | | | | 7,162,734 | | |
Cathay General Bancorp | | | 175,335 | | | | 4,679,691 | | |
Commerce Bancshares, Inc. | | | 195,083 | | | | 8,287,126 | | |
Cullen/Frost Bankers, Inc. | | | 127,639 | | | | 6,117,737 | | |
East West Bancorp, Inc. | | | 334,927 | | | | 10,037,762 | | |
First Horizon National Corp. | | | 557,040 | | | | 6,695,621 | | |
First Niagara Financial Group, Inc. | | | 825,759 | | | | 7,630,013 | | |
FirstMerit Corp. | | | 385,806 | | | | 7,573,372 | | |
FNB Corp. | | | 485,720 | | | | 5,964,642 | | |
Fulton Financial Corp. | | | 405,055 | | | | 5,107,743 | | |
Hancock Holding Co. | | | 180,141 | | | | 4,155,853 | | |
The accompanying Notes to Financial Statements are an integral part of this statement.
Annual Report 2016
8
COLUMBIA MID CAP INDEX FUND
PORTFOLIO OF INVESTMENTS (continued)
February 29, 2016
Common Stocks (continued)
Issuer | | Shares | | Value ($) | |
International Bancshares Corp. | | | 129,762 | | | | 2,926,133 | | |
PacWest Bancorp | | | 262,980 | | | | 8,462,696 | | |
PrivateBancorp, Inc. | | | 184,330 | | | | 6,333,579 | | |
Prosperity Bancshares, Inc. | | | 153,215 | | | | 6,197,547 | | |
Signature Bank(a) | | | 117,101 | | | | 15,170,434 | | |
SVB Financial Group(a) | | | 119,847 | | | | 10,648,406 | | |
Synovus Financial Corp. | | | 303,965 | | | | 8,082,429 | | |
TCF Financial Corp. | | | 394,579 | | | | 4,474,526 | | |
Trustmark Corp. | | | 157,240 | | | | 3,440,411 | | |
Umpqua Holdings Corp. | | | 512,550 | | | | 7,708,752 | | |
Valley National Bancorp | | | 519,961 | | | | 4,679,649 | | |
Webster Financial Corp. | | | 213,375 | | | | 7,171,534 | | |
Total | | | | | 175,046,972 | | |
Capital Markets 1.7% | |
Eaton Vance Corp. | | | 273,502 | | | | 7,906,943 | | |
Federated Investors, Inc., Class B | | | 220,490 | | | | 5,770,223 | | |
Janus Capital Group, Inc. | | | 339,690 | | | | 4,392,192 | | |
Raymond James Financial, Inc. | | | 296,526 | | | | 12,999,700 | | |
SEI Investments Co. | | | 321,885 | | | | 12,286,350 | | |
Stifel Financial Corp.(a) | | | 161,780 | | | | 4,685,149 | | |
Waddell & Reed Financial, Inc., Class A | | | 193,166 | | | | 4,523,948 | | |
WisdomTree Investments, Inc. | | | 267,310 | | | | 3,167,623 | | |
Total | | | | | 55,732,128 | | |
Consumer Finance 0.2% | |
SLM Corp.(a) | | | 991,760 | | | | 5,791,878 | | |
Diversified Financial Services 1.6% | |
CBOE Holdings, Inc. | | | 191,908 | | | | 11,994,250 | | |
Factset Research Systems, Inc. | | | 96,474 | | | | 14,518,372 | | |
MarketAxess Holdings, Inc. | | | 86,800 | | | | 10,282,328 | | |
MSCI, Inc. | | | 215,077 | | | | 15,167,230 | | |
Total | | | | | 51,962,180 | | |
Insurance 5.6% | |
Alleghany Corp.(a) | | | 36,248 | | | | 16,818,347 | | |
American Financial Group, Inc. | | | 166,707 | | | | 11,182,706 | | |
Arthur J Gallagher & Co. | | | 411,258 | | | | 16,388,631 | | |
Aspen Insurance Holdings Ltd. | | | 141,474 | | | | 6,322,473 | | |
Brown & Brown, Inc. | | | 272,313 | | | | 8,798,433 | | |
CNO Financial Group, Inc. | | | 432,820 | | | | 7,544,053 | | |
Endurance Specialty Holdings Ltd. | | | 142,660 | | | | 8,883,438 | | |
Common Stocks (continued)
Issuer | | Shares | | Value ($) | |
Everest Re Group Ltd. | | | 100,270 | | | | 18,663,255 | | |
First American Financial Corp. | | | 253,095 | | | | 9,372,108 | | |
Genworth Financial, Inc., Class A(a) | | | 1,157,840 | | | | 2,454,621 | | |
Hanover Insurance Group, Inc. (The) | | | 100,660 | | | | 8,349,747 | | |
Kemper Corp. | | | 112,131 | | | | 3,014,081 | | |
Mercury General Corp. | | | 84,741 | | | | 4,455,682 | | |
Old Republic International Corp. | | | 565,916 | | | | 10,073,305 | | |
Primerica, Inc. | | | 112,565 | | | | 4,749,117 | | |
Reinsurance Group of America, Inc. | | | 153,029 | | | | 13,787,913 | | |
RenaissanceRe Holdings Ltd. | | | 102,060 | | | | 11,553,192 | | |
StanCorp Financial Group, Inc. | | | 98,558 | | | | 11,324,314 | | |
WR Berkley Corp. | | | 229,553 | | | | 11,821,979 | | |
Total | | | | | 185,557,395 | | |
Real Estate Investment Trusts (REITs) 9.6% | |
Alexandria Real Estate Equities, Inc. | | | 168,741 | | | | 13,357,538 | | |
American Campus Communities, Inc. | | | 297,623 | | | | 13,026,959 | | |
Camden Property Trust | | | 202,167 | | | | 15,109,962 | | |
Care Capital Properties, Inc. | | | 195,050 | | | | 5,170,775 | | |
Communications Sales & Leasing, Inc.(a) | | | 280,324 | | | | 5,284,107 | | |
Corporate Office Properties Trust | | | 220,021 | | | | 5,148,491 | | |
Corrections Corp. of America | | | 272,835 | | | | 7,893,117 | | |
Douglas Emmett, Inc. | | | 324,540 | | | | 8,710,654 | | |
Duke Realty Corp. | | | 803,589 | | | | 16,618,220 | | |
EPR Properties | | | 146,790 | | | | 9,134,742 | | |
Equity One, Inc. | | | 209,815 | | | | 5,751,029 | | |
Highwoods Properties, Inc. | | | 221,874 | | | | 9,662,613 | | |
Hospitality Properties Trust | | | 352,723 | | | | 8,564,114 | | |
Kilroy Realty Corp. | | | 214,505 | | | | 11,641,186 | | |
Lamar Advertising Co. Class A | | | 190,819 | | | | 10,901,489 | | |
LaSalle Hotel Properties | | | 262,840 | | | | 6,400,154 | | |
Liberty Property Trust | | | 343,931 | | | | 9,932,727 | | |
Mack-Cali Realty Corp. | | | 207,868 | | | | 4,136,573 | | |
Mid-America Apartment Communities, Inc. | | | 175,440 | | | | 15,779,074 | | |
National Retail Properties, Inc. | | | 316,918 | | | | 13,938,054 | | |
Omega Healthcare Investors, Inc. | | | 383,100 | | | | 12,282,186 | | |
Post Properties, Inc. | | | 125,970 | | | | 7,020,308 | | |
Potlatch Corp. | | | 94,677 | | | | 2,503,260 | | |
Rayonier, Inc. | | | 288,035 | | | | 6,287,804 | | |
Regency Centers Corp. | | | 219,158 | | | | 15,468,172 | | |
The accompanying Notes to Financial Statements are an integral part of this statement.
Annual Report 2016
9
COLUMBIA MID CAP INDEX FUND
PORTFOLIO OF INVESTMENTS (continued)
February 29, 2016
Common Stocks (continued)
Issuer | | Shares | | Value ($) | |
Senior Housing Properties Trust | | | 552,715 | | | | 8,627,881 | | |
Sovran Self Storage, Inc. | | | 89,520 | | | | 9,528,509 | | |
Tanger Factory Outlet Centers, Inc. | | | 220,510 | | | | 7,073,961 | | |
Taubman Centers, Inc. | | | 140,189 | | | | 9,928,185 | | |
UDR, Inc. | | | 609,837 | | | | 20,935,704 | | |
Urban Edge Properties | | | 214,920 | | | | 5,226,854 | | |
Weingarten Realty Investors | | | 265,397 | | | | 9,349,936 | | |
WP Glimcher, Inc. | | | 431,290 | | | | 3,726,346 | | |
Total | | | | | 314,120,684 | | |
Real Estate Management & Development 0.4% | |
Alexander & Baldwin, Inc. | | | 106,926 | | | | 3,584,160 | | |
Jones Lang LaSalle, Inc. | | | 104,828 | | | | 10,699,794 | | |
Total | | | | | 14,283,954 | | |
Thrifts & Mortgage Finance 0.7% | |
New York Community Bancorp, Inc. | | | 1,128,694 | | | | 17,077,140 | | |
Washington Federal, Inc. | | | 216,549 | | | | 4,588,674 | | |
Total | | | | | 21,665,814 | | |
Total Financials | | | | | 824,161,005 | | |
HEALTH CARE 9.6% | |
Biotechnology 0.4% | |
United Therapeutics Corp.(a) | | | 106,198 | | | | 12,949,784 | | |
Health Care Equipment & Supplies 4.5% | |
Align Technology, Inc.(a) | | | 168,360 | | | | 11,116,811 | | |
Cooper Companies, Inc. (The) | | | 113,152 | | | | 16,176,210 | | |
Halyard Health, Inc.(a) | | | 108,490 | | | | 2,768,665 | | |
Hill-Rom Holdings, Inc. | | | 131,964 | | | | 6,116,531 | | |
Hologic, Inc.(a) | | | 572,856 | | | | 19,838,003 | | |
IDEXX Laboratories, Inc.(a) | | | 211,712 | | | | 15,488,850 | | |
LivaNova PLC(a) | | | 98,890 | | | | 5,581,352 | | |
ResMed, Inc. | | | 325,037 | | | | 18,497,856 | | |
Sirona Dental Systems, Inc.(a)(b)(c) | | | 130,100 | | | | 14,387,759 | | |
STERIS PLC | | | 199,778 | | | | 12,849,721 | | |
Teleflex, Inc. | | | 96,827 | | | | 13,828,832 | | |
West Pharmaceutical Services, Inc. | | | 167,780 | | | | 10,405,715 | | |
Total | | | | | 147,056,305 | | |
Health Care Providers & Services 2.8% | |
Amsurg Corp.(a) | | | 125,580 | | | | 8,545,719 | | |
Centene Corp.(a) | | | 277,440 | | | | 15,802,982 | | |
Common Stocks (continued)
Issuer | | Shares | | Value ($) | |
Community Health Systems, Inc.(a) | | | 275,078 | | | | 4,159,179 | | |
Health Net, Inc.(a) | | | 179,904 | | | | 11,193,627 | | |
LifePoint Health, Inc.(a) | | | 101,307 | | | | 6,317,504 | | |
Mednax, Inc.(a) | | | 218,882 | | | | 14,673,849 | | |
Molina Healthcare, Inc.(a) | | | 95,290 | | | | 5,911,792 | | |
Owens & Minor, Inc. | | | 146,360 | | | | 5,768,048 | | |
VCA, Inc.(a) | | | 187,692 | | | | 9,577,923 | | |
WellCare Health Plans, Inc.(a) | | | 102,656 | | | | 9,225,695 | | |
Total | | | | | 91,176,318 | | |
Health Care Technology 0.1% | |
Allscripts Healthcare Solutions, Inc.(a) | | | 439,923 | | | | 5,507,836 | | |
Life Sciences Tools & Services 1.5% | |
Bio-Rad Laboratories, Inc., Class A(a) | | | 48,391 | | | | 6,515,364 | | |
Bio-Techne Corp. | | | 86,561 | | | | 7,430,396 | | |
Charles River Laboratories
International, Inc.(a) | | | 108,518 | | | | 7,968,477 | | |
Mettler-Toledo International, Inc.(a) | | | 63,671 | | | | 20,050,635 | | |
PAREXEL International Corp.(a) | | | 123,910 | | | | 7,272,278 | | |
Total | | | | | 49,237,150 | | |
Pharmaceuticals 0.3% | |
Akorn, Inc.(a) | | | 186,440 | | | | 4,957,440 | | |
Catalent, Inc.(a) | | | 228,960 | | | | 5,556,859 | | |
Total | | | | | 10,514,299 | | |
Total Health Care | | | | | 316,441,692 | | |
INDUSTRIALS 15.1% | |
Aerospace & Defense 1.9% | |
B/E Aerospace, Inc. | | | 243,284 | | | | 10,612,048 | | |
Curtiss-Wright Corp. | | | 106,880 | | | | 7,544,659 | | |
Esterline Technologies Corp.(a) | | | 68,823 | | | | 3,854,776 | | |
Huntington Ingalls Industries, Inc. | | | 109,339 | | | | 14,329,969 | | |
KLX, Inc.(a) | | | 122,842 | | | | 3,438,348 | | |
Orbital ATK, Inc. | | | 136,927 | | | | 11,469,006 | | |
Teledyne Technologies, Inc.(a) | | | 82,490 | | | | 7,026,498 | | |
Triumph Group, Inc. | | | 114,782 | | | | 3,496,260 | | |
Total | | | | | 61,771,564 | | |
Airlines 1.1% | |
Alaska Air Group, Inc. | | | 293,566 | | | | 21,694,527 | | |
JetBlue Airways Corp.(a) | | | 733,296 | | | | 16,132,512 | | |
Total | | | | | 37,827,039 | | |
The accompanying Notes to Financial Statements are an integral part of this statement.
Annual Report 2016
10
COLUMBIA MID CAP INDEX FUND
PORTFOLIO OF INVESTMENTS (continued)
February 29, 2016
Common Stocks (continued)
Issuer | | Shares | | Value ($) | |
Building Products 1.3% | |
AO Smith Corp. | | | 174,310 | | | | 12,267,938 | | |
Fortune Brands Home & Security, Inc. | | | 371,691 | | | | 18,666,322 | | |
Lennox International, Inc. | | | 93,332 | | | | 12,059,428 | | |
Total | | | | | 42,993,688 | | |
Commercial Services & Supplies 1.9% | |
Clean Harbors, Inc.(a) | | | 121,970 | | | | 5,195,922 | | |
Copart, Inc.(a) | | | 237,234 | | | | 8,955,584 | | |
Deluxe Corp. | | | 114,562 | | | | 6,577,004 | | |
Herman Miller, Inc. | | | 139,349 | | | | 3,635,615 | | |
HNI Corp. | | | 102,835 | | | | 3,476,851 | | |
MSA Safety, Inc. | | | 73,876 | | | | 3,226,165 | | |
Rollins, Inc. | | | 218,769 | | | | 6,022,711 | | |
RR Donnelley & Sons Co. | | | 485,748 | | | | 7,373,655 | | |
Waste Connections, Inc. | | | 284,814 | | | | 17,564,479 | | |
Total | | | | | 62,027,986 | | |
Construction & Engineering 0.6% | |
AECOM(a) | | | 352,395 | | | | 9,676,767 | | |
Granite Construction, Inc. | | | 91,662 | | | | 3,799,390 | | |
KBR, Inc. | | | 335,767 | | | | 4,643,657 | | |
Total | | | | | 18,119,814 | | |
Electrical Equipment 1.2% | |
Acuity Brands, Inc. | | | 101,902 | | | | 21,341,336 | | |
Hubbell, Inc. | | | 126,605 | | | | 12,579,473 | | |
Regal Beloit Corp. | | | 103,944 | | | | 5,673,263 | | |
Total | | | | | 39,594,072 | | |
Industrial Conglomerates 0.4% | |
Carlisle Companies, Inc. | | | 151,294 | | | | 13,640,667 | | |
Machinery 4.4% | |
AGCO Corp. | | | 171,181 | | | | 8,471,748 | | |
CLARCOR, Inc. | | | 116,128 | | | | 5,590,402 | | |
Crane Co. | | | 114,875 | | | | 5,634,619 | | |
Donaldson Co., Inc. | | | 287,125 | | | | 8,108,410 | | |
Graco, Inc. | | | 130,132 | | | | 10,191,938 | | |
IDEX Corp. | | | 178,093 | | | | 13,385,470 | | |
ITT Corp. | | | 208,312 | | | | 7,345,081 | | |
Joy Global, Inc. | | | 226,870 | | | | 2,931,160 | | |
Kennametal, Inc. | | | 185,286 | | | | 3,729,807 | | |
Lincoln Electric Holdings, Inc. | | | 153,475 | | | | 8,375,131 | | |
Common Stocks (continued)
Issuer | | Shares | | Value ($) | |
Nordson Corp. | | | 125,006 | | | | 8,959,180 | | |
Oshkosh Corp. | | | 174,120 | | | | 6,007,140 | | |
Terex Corp. | | | 252,535 | | | | 5,651,733 | | |
Timken Co. (The) | | | 168,055 | | | | 5,013,081 | | |
Toro Co. (The) | | | 127,570 | | | | 10,167,329 | | |
Trinity Industries, Inc. | | | 355,766 | | | | 5,635,333 | | |
Valmont Industries, Inc. | | | 53,621 | | | | 6,061,854 | | |
Wabtec Corp. | | | 224,550 | | | | 15,853,230 | | |
Woodward, Inc. | | | 132,407 | | | | 6,216,509 | | |
Total | | | | | 143,329,155 | | |
Marine 0.2% | |
Kirby Corp.(a) | | | 125,708 | | | | 7,116,330 | | |
Professional Services 0.6% | |
CEB, Inc. | | | 77,018 | | | | 4,179,767 | | |
FTI Consulting, Inc.(a) | | | 97,643 | | | | 3,213,431 | | |
ManpowerGroup, Inc. | | | 171,337 | | | | 13,268,337 | | |
Total | | | | | 20,661,535 | | |
Road & Rail 0.8% | |
Genesee & Wyoming, Inc., Class A(a) | | | 132,424 | | | | 7,511,089 | | |
Landstar System, Inc. | | | 100,518 | | | | 5,950,666 | | |
Old Dominion Freight Line, Inc.(a) | | | 161,430 | | | | 10,421,921 | | |
Werner Enterprises, Inc. | | | 103,744 | | | | 2,754,403 | | |
Total | | | | | 26,638,079 | | |
Trading Companies & Distributors 0.7% | |
GATX Corp. | | | 98,688 | | | | 4,244,571 | | |
MSC Industrial Direct Co., Inc., Class A | | | 112,570 | | | | 7,832,620 | | |
NOW, Inc.(a) | | | 249,510 | | | | 4,037,072 | | |
Watsco, Inc. | | | 59,843 | | | | 7,632,975 | | |
Total | | | | | 23,747,238 | | |
Total Industrials | | | | | 497,467,167 | | |
INFORMATION TECHNOLOGY 16.5% | |
Communications Equipment 1.0% | |
Arris International PLC(a) | | | 414,860 | | | | 9,911,005 | | |
Ciena Corp.(a) | | | 294,822 | | | | 6,043,851 | | |
InterDigital, Inc. | | | 82,414 | | | | 4,098,448 | | |
Netscout Systems, Inc.(a) | | | 230,730 | | | | 4,769,189 | | |
Plantronics, Inc. | | | 78,389 | | | | 2,939,588 | | |
Polycom, Inc.(a) | | | 308,270 | | | | 3,209,091 | | |
Total | | | | | 30,971,172 | | |
The accompanying Notes to Financial Statements are an integral part of this statement.
Annual Report 2016
11
COLUMBIA MID CAP INDEX FUND
PORTFOLIO OF INVESTMENTS (continued)
February 29, 2016
Common Stocks (continued)
Issuer | | Shares | | Value ($) | |
Electronic Equipment, Instruments & Components 4.2% | |
Arrow Electronics, Inc.(a) | | | 217,686 | | | | 12,442,932 | | |
Avnet, Inc. | | | 307,250 | | | | 12,643,337 | | |
Belden, Inc. | | | 97,700 | | | | 5,351,029 | | |
Cognex Corp. | | | 197,470 | | | | 7,308,365 | | |
FEI Co. | | | 95,090 | | | | 7,725,111 | | |
Ingram Micro, Inc., Class A | | | 362,676 | | | | 12,983,801 | | |
IPG Photonics Corp.(a) | | | 84,760 | | | | 6,989,309 | | |
Jabil Circuit, Inc. | | | 440,530 | | | | 9,185,050 | | |
Keysight Technologies, Inc.(a) | | | 395,670 | | | | 10,323,030 | | |
Knowles Corp.(a) | | | 205,840 | | | | 2,342,459 | | |
National Instruments Corp. | | | 234,056 | | | | 6,752,516 | | |
SYNNEX Corp. | | | 67,620 | | | | 6,358,309 | | |
Tech Data Corp.(a) | | | 81,634 | | | | 5,747,850 | | |
Trimble Navigation Ltd.(a) | | | 582,988 | | | | 13,560,301 | | |
VeriFone Systems, Inc.(a) | | | 267,536 | | | | 6,391,435 | | |
Vishay Intertechnology, Inc. | | | 315,238 | | | | 3,732,418 | | |
Zebra Technologies Corp., Class A(a) | | | 121,265 | | | | 7,491,752 | | |
Total | | | | | 137,329,004 | | |
Internet Software & Services 0.6% | |
comScore, Inc.(a) | | | 109,890 | | | | 4,521,974 | | |
j2 Global, Inc. | | | 107,290 | | | | 7,840,753 | | |
Rackspace Hosting, Inc.(a) | | | 266,476 | | | | 5,737,228 | | |
Total | | | | | 18,099,955 | | |
IT Services 3.8% | |
Acxiom Corp.(a) | | | 181,253 | | | | 3,759,187 | | |
Broadridge Financial Solutions, Inc. | | | 276,002 | | | | 15,491,992 | | |
Computer Sciences Corp. | | | 323,020 | | | | 9,306,206 | | |
Convergys Corp. | | | 227,004 | | | | 5,852,163 | | |
CoreLogic, Inc.(a) | | | 205,167 | | | | 7,096,727 | | |
DST Systems, Inc. | | | 75,707 | | | | 7,917,438 | | |
Gartner, Inc.(a) | | | 192,847 | | | | 15,890,593 | | |
Global Payments, Inc. | | | 302,304 | | | | 18,425,429 | | |
Jack Henry & Associates, Inc. | | | 186,028 | | | | 15,298,943 | | |
Leidos Holdings, Inc. | | | 149,342 | | | | 6,454,561 | | |
MAXIMUS, Inc. | | | 152,070 | | | | 7,477,282 | | |
NeuStar, Inc., Class A(a) | | | 123,385 | | | | 3,068,585 | | |
Science Applications International Corp. | | | 96,294 | | | | 4,299,527 | | |
WEX, Inc.(a) | | | 89,937 | | | | 5,872,886 | | |
Total | | | | | 126,211,519 | | |
Common Stocks (continued)
Issuer | | Shares | | Value ($) | |
Semiconductors & Semiconductor Equipment 2.1% | |
Advanced Micro Devices, Inc.(a) | | | 1,489,710 | | | | 3,187,979 | | |
Atmel Corp. | | | 978,244 | | | | 7,904,212 | | |
Cree, Inc.(a) | | | 239,838 | | | | 7,612,458 | | |
Cypress Semiconductor Corp. | | | 776,962 | | | | 6,200,157 | | |
Fairchild Semiconductor
International, Inc.(a) | | | 263,923 | | | | 5,294,295 | | |
Integrated Device Technology, Inc.(a) | | | 315,141 | | | | 6,120,038 | | |
Intersil Corp., Class A | | | 308,436 | | | | 3,938,728 | | |
Microsemi Corp.(a) | | | 259,140 | | | | 8,974,018 | | |
Silicon Laboratories, Inc.(a) | | | 89,992 | | | | 3,712,170 | | |
SunEdison, Inc.(a) | | | 737,161 | | | | 1,459,579 | | |
Synaptics, Inc.(a) | | | 84,330 | | | | 6,848,439 | | |
Teradyne, Inc. | | | 478,340 | | | | 9,126,727 | | |
Total | | | | | 70,378,800 | | |
Software 4.3% | |
ACI Worldwide, Inc.(a) | | | 275,248 | | | | 5,136,128 | | |
ANSYS, Inc.(a) | | | 207,123 | | | | 17,195,351 | | |
Cadence Design Systems, Inc.(a) | | | 692,413 | | | | 14,921,500 | | |
CDK Global, Inc. | | | 371,060 | | | | 16,656,883 | | |
CommVault Systems, Inc.(a) | | | 98,075 | | | | 3,674,870 | | |
Fair Isaac Corp. | | | 72,332 | | | | 7,198,481 | | |
Fortinet, Inc.(a) | | | 340,800 | | | | 9,678,720 | | |
Manhattan Associates, Inc.(a) | | | 170,050 | | | | 9,396,963 | | |
Mentor Graphics Corp. | | | 232,417 | | | | 4,439,165 | | |
PTC, Inc.(a) | | | 266,560 | | | | 8,239,370 | | |
Solera Holdings, Inc. | | | 156,510 | | | | 8,717,607 | | |
Synopsys, Inc.(a) | | | 362,966 | | | | 16,242,729 | | |
Tyler Technologies, Inc.(a) | | | 75,570 | | | | 9,092,582 | | |
Ultimate Software Group, Inc. (The)(a) | | | 66,700 | | | | 11,456,392 | | |
Total | | | | | 142,046,741 | | |
Technology Hardware, Storage & Peripherals 0.5% | |
3D Systems Corp.(a) | | | 247,820 | | | | 2,644,239 | | |
Diebold, Inc. | | | 151,272 | | | | 3,754,571 | | |
Lexmark International, Inc., Class A | | | 143,870 | | | | 4,462,848 | | |
NCR Corp.(a) | | | 287,880 | | | | 6,724,877 | | |
Total | | | | | 17,586,535 | | |
Total Information Technology | | | | | 542,623,726 | | |
The accompanying Notes to Financial Statements are an integral part of this statement.
Annual Report 2016
12
COLUMBIA MID CAP INDEX FUND
PORTFOLIO OF INVESTMENTS (continued)
February 29, 2016
Common Stocks (continued)
Issuer | | Shares | | Value ($) | |
MATERIALS 6.6% | |
Chemicals 3.0% | |
Albemarle Corp. | | | 261,149 | | | | 14,681,797 | | |
Ashland, Inc. | | | 146,410 | | | | 13,951,409 | | |
Cabot Corp. | | | 145,619 | | | | 6,484,414 | | |
Minerals Technologies, Inc. | | | 80,875 | | | | 4,110,067 | | |
NewMarket Corp. | | | 23,433 | | | | 8,556,326 | | |
Olin Corp. | | | 384,293 | | | | 5,825,882 | | |
PolyOne Corp. | | | 200,830 | | | | 5,404,335 | | |
RPM International, Inc. | | | 309,661 | | | | 12,649,652 | | |
Scotts Miracle-Gro Co., Class A | | | 105,947 | | | | 7,312,462 | | |
Sensient Technologies Corp. | | | 105,250 | | | | 6,049,770 | | |
Valspar Corp. (The) | | | 170,164 | | | | 13,313,631 | | |
Total | | | | | 98,339,745 | | |
Construction Materials 0.2% | |
Eagle Materials, Inc. | | | 116,480 | | | | 7,037,722 | | |
Containers & Packaging 1.5% | |
AptarGroup, Inc. | | | 145,342 | | | | 10,713,159 | | |
Bemis Co., Inc. | | | 223,370 | | | | 10,960,766 | | |
Greif, Inc., Class A | | | 59,823 | | | | 1,585,908 | | |
Packaging Corp. of America | | | 225,769 | | | | 10,949,796 | | |
Silgan Holdings, Inc. | | | 94,175 | | | | 4,824,585 | | |
Sonoco Products Co. | | | 234,926 | | | | 10,266,266 | | |
Total | | | | | 49,300,480 | | |
Metals & Mining 1.6% | |
Allegheny Technologies, Inc. | | | 254,180 | | | | 3,408,554 | | |
Carpenter Technology Corp. | | | 114,332 | | | | 3,397,947 | | |
Commercial Metals Co. | | | 270,832 | | | | 3,978,522 | | |
Compass Minerals International, Inc. | | | 78,444 | | | | 5,321,641 | | |
Reliance Steel & Aluminum Co. | | | 166,741 | | | | 10,152,860 | | |
Royal Gold, Inc. | | | 151,955 | | | | 7,046,153 | | |
Steel Dynamics, Inc. | | | 563,539 | | | | 10,250,774 | | |
United States Steel Corp. | | | 340,450 | | | | 3,104,904 | | |
Worthington Industries, Inc. | | | 107,670 | | | | 3,349,614 | | |
Total | | | | | 50,010,969 | | |
Paper & Forest Products 0.3% | |
Domtar Corp. | | | 146,286 | | | | 5,147,805 | | |
Louisiana-Pacific Corp.(a) | | | 332,497 | | | | 5,283,377 | | |
Total | | | | | 10,431,182 | | |
Total Materials | | | | | 215,120,098 | | |
Common Stocks (continued)
Issuer | | Shares | | Value ($) | |
TELECOMMUNICATION SERVICES 0.2% | |
Wireless Telecommunication Services 0.2% | |
Telephone & Data Systems, Inc. | | | 219,825 | | | | 5,873,724 | | |
Total Telecommunication Services | | | | | 5,873,724 | | |
UTILITIES 5.6% | |
Electric Utilities 1.9% | |
Cleco Corp. | | | 140,769 | | | | 6,462,705 | | |
Great Plains Energy, Inc. | | | 358,746 | | | | 10,525,608 | | |
Hawaiian Electric Industries, Inc. | | | 250,106 | | | | 7,343,112 | | |
IDACORP, Inc. | | | 117,169 | | | | 8,314,312 | | |
OGE Energy Corp. | | | 464,808 | | | | 11,564,423 | | |
PNM Resources, Inc. | | | 185,390 | | | | 5,917,649 | | |
Westar Energy, Inc. | | | 328,961 | | | | 14,296,645 | | |
Total | | | | | 64,424,454 | | |
Gas Utilities 2.0% | |
Atmos Energy Corp. | | | 236,257 | | | | 16,398,598 | | |
National Fuel Gas Co. | | | 196,985 | | | | 8,998,275 | | |
ONE Gas, Inc. | | | 121,390 | | | | 7,038,192 | | |
Questar Corp. | | | 406,952 | | | | 10,080,201 | | |
UGI Corp. | | | 401,361 | | | | 14,834,303 | | |
WGL Holdings, Inc. | | | 115,985 | | | | 7,909,017 | | |
Total | | | | | 65,258,586 | | |
Independent Power and Renewable Electricity Producers —% | |
Talen Energy Corp.(a) | | | 149,550 | | | | 951,138 | | |
Multi-Utilities 1.3% | |
Alliant Energy Corp. | | | 263,838 | | | | 17,927,792 | | |
Black Hills Corp. | | | 119,112 | | | | 6,671,463 | | |
MDU Resources Group, Inc. | | | 454,476 | | | | 8,276,008 | | |
Vectren Corp. | | | 192,490 | | | | 8,762,145 | | |
Total | | | | | 41,637,408 | | |
Water Utilities 0.4% | |
Aqua America, Inc. | | | 410,628 | | | | 12,552,898 | | |
Total Utilities | | | | | 184,824,484 | | |
Total Common Stocks
(Cost: $2,491,431,465) | | | | | 3,249,719,728 | | |
The accompanying Notes to Financial Statements are an integral part of this statement.
Annual Report 2016
13
COLUMBIA MID CAP INDEX FUND
PORTFOLIO OF INVESTMENTS (continued)
February 29, 2016
Money Market Funds 1.3%
| | | Shares | | Value ($) | |
Columbia Short-Term Cash Fund,
0.420%(d)(e) | | | 43,938,078 | | | | 43,938,078 | | |
Total Money Market Funds
(Cost: $43,938,078) | | | | | 43,938,078 | | |
Total Investments
(Cost: $2,535,369,543) | | | | | 3,293,657,806 | | |
Other Assets & Liabilities, Net | | | | | (5,946,587 | ) | |
Net Assets | | | | | 3,287,711,219 | | |
At February 29, 2016, cash totaling $2,505,800 was pledged as collateral.
Investments in Derivatives
Futures Contracts Outstanding at February 29, 2016
Long Futures Contracts Outstanding
Contract Description | | Number of
Contracts | | Trading
Currency | | Notional
Market
Value ($) | | Expiration
Date | | Unrealized
Appreciation ($) | | Unrealized
Depreciation ($) | |
S&P MID 400 EMINI | | | 287 | | | USD | | | | | 38,248,490 | | | 03/2016 | | | 1,590,695 | | | | — | | |
Notes to Portfolio of Investments
(a) Non-income producing investment.
(b) Represents fair value as determined in good faith under procedures approved by the Board of Trustees. At February 29, 2016, the value of these securities amounted to $14,387,759, which represents 0.44% of net assets.
(c) Identifies securities considered by the Investment Manager to be illiquid and may be difficult to sell. The aggregate value of such securities at February 29, 2016 was $14,387,759, which represents 0.44% of net assets. Information concerning such security holdings at February 29, 2016 is as follows:
Security Description | | Acquisition Dates | | Cost ($) | |
Sirona Dental Systems, Inc | | 01/28/2014 – 12/18/2015 | | | 9,818,220 | | |
(d) The rate shown is the seven-day current annualized yield at February 29, 2016.
(e) As defined in the Investment Company Act of 1940, an affiliated company is one in which the Fund owns 5% or more of the company's outstanding voting securities, or a company which is under common ownership or control with the Fund. Holdings and transactions in these affiliated companies during the year ended February 29, 2016 are as follows:
Issuer | | Beginning
Cost ($) | | Purchase
Cost ($) | | Proceeds
From Sales ($) | | Ending
Cost ($) | | Dividends —
Affiliated
Issuers ($) | | Value ($) | |
Columbia Short-Term Cash Fund | | | 152,697,480 | | | | 668,329,821 | | | | (777,089,223 | ) | | | 43,938,078 | | | | 123,947 | | | | 43,938,078 | | |
Currency Legend
USD US Dollar
The accompanying Notes to Financial Statements are an integral part of this statement.
Annual Report 2016
14
COLUMBIA MID CAP INDEX FUND
PORTFOLIO OF INVESTMENTS (continued)
February 29, 2016
The Fund categorizes its fair value measurements according to a three-level hierarchy that maximizes the use of observable inputs and minimizes the use of unobservable inputs by prioritizing that the most observable input be used when available. Observable inputs are those that market participants would use in pricing an investment based on market data obtained from sources independent of the reporting entity. Unobservable inputs are those that reflect the Fund's assumptions about the information market participants would use in pricing an investment. An investment's level within the fair value hierarchy is based on the lowest level of any input that is deemed significant to the asset's or liability's fair value measurement. The input levels are not necessarily an indication of the risk or liquidity associated with investments at that level. For example, certain U.S. government securities are generally high quality and liquid, however, they are reflected as Level 2 because the inputs used to determine fair value may not always be quoted prices in an active market.
Fair value inputs are summarized in the three broad levels listed below:
> Level 1 — Valuations based on quoted prices for investments in active markets that the Fund has the ability to access at the measurement date (including NAV for open-end mutual funds). Valuation adjustments are not applied to Level 1 investments.
> Level 2 — Valuations based on other significant observable inputs (including quoted prices for similar securities, interest rates, prepayment speeds, credit risks, etc.).
> Level 3 — Valuations based on significant unobservable inputs (including the Fund's own assumptions and judgment in determining the fair value of investments).
Inputs that are used in determining fair value of an investment may include price information, credit data, volatility statistics, and other factors. These inputs can be either observable or unobservable. The availability of observable inputs can vary between investments, and is affected by various factors such as the type of investment, and the volume and level of activity for that investment or similar investments in the marketplace. The inputs will be considered by the Investment Manager, along with any other relevant factors in the calculation of an investment's fair value. The Fund uses prices and inputs that are current as of the measurement date, which may include periods of market dislocations. During these periods, the availability of prices and inputs may be reduced for many investments. This condition could cause an investment to be reclassified between the various levels within the hierarchy.
Investments falling into the Level 3 category are primarily supported by quoted prices from brokers and dealers participating in the market for those investments. However, these may be classified as Level 3 investments due to lack of market transparency and corroboration to support these quoted prices. Additionally, valuation models may be used as the pricing source for any remaining investments classified as Level 3. These models may rely on one or more significant unobservable inputs and/or significant assumptions by the Investment Manager. Inputs used in valuations may include, but are not limited to, financial statement analysis, capital account balances, discount rates and estimated cash flows, and comparable company data.
Under the direction of the Fund's Board of Trustees (the Board), the Investment Manager's Valuation Committee (the Committee) is responsible for overseeing the valuation procedures approved by the Board. The Committee consists of voting and non-voting members from various groups within the Investment Manager's organization, including operations and accounting, trading and investments, compliance, risk management and legal.
The Committee meets at least monthly to review and approve valuation matters, which may include a description of specific valuation determinations, data regarding pricing information received from approved pricing vendors and brokers and the results of Board-approved valuation control policies and procedures (the Policies). The Policies address, among other things, instances when market quotations are or are not readily available, including recommendations of third party pricing vendors and a determination of appropriate pricing methodologies; events that require specific valuation determinations and assessment of fair value techniques; securities with a potential for stale pricing, including those that are illiquid, restricted, or in default; and the effectiveness of third party pricing vendors, including periodic reviews of vendors. The Committee meets more frequently, as needed, to discuss additional valuation matters, which may include the need to review back-testing results, review time-sensitive information or approve related valuation actions. The Committee reports to the Board, with members of the Committee meeting with the Board at each of its regularly scheduled meetings to discuss valuation matters and actions during the period, similar to those described earlier.
For investments categorized as Level 3, the Committee monitors information similar to that described above, which may include: (i) data specific to the issuer or comparable issuers, (ii) general market or specific sector news and (iii) quoted prices and specific or similar security transactions. The Committee considers this data and any changes from prior periods in order to assess the reasonableness of observable and unobservable inputs, any assumptions or internal models used to value those securities and changes in fair value. This data is also used to corroborate, when available, information received from approved pricing vendors and brokers. Various factors impact the frequency of monitoring this information (which may occur as often as daily). However, the Committee may determine that changes to inputs, assumptions and models are not required as a result of the monitoring procedures performed.
The accompanying Notes to Financial Statements are an integral part of this statement.
Annual Report 2016
15
COLUMBIA MID CAP INDEX FUND
PORTFOLIO OF INVESTMENTS (continued)
February 29, 2016
Fair Value Measurements (continued)
The following table is a summary of the inputs used to value the Fund's investments at February 29, 2016:
| | | Level 1
Quoted Prices in Active
Markets for Identical
Assets ($) | | Level 2
Other Significant
Observable Inputs ($) | | Level 3
Significant
Unobservable Inputs ($) | | Total ($) | |
Investments | |
Common Stocks | |
Consumer Discretionary | | | 443,228,552 | | | | — | | | | — | | | | 443,228,552 | | |
Consumer Staples | | | 136,187,244 | | | | — | | | | — | | | | 136,187,244 | | |
Energy | | | 83,792,036 | | | | — | | | | — | | | | 83,792,036 | | |
Financials | | | 824,161,005 | | | | — | | | | — | | | | 824,161,005 | | |
Health Care | | | 302,053,933 | | | | 14,387,759 | | | | — | | | | 316,441,692 | | |
Industrials | | | 497,467,167 | | | | — | | | | — | | | | 497,467,167 | | |
Information Technology | | | 542,623,726 | | | | — | | | | — | | | | 542,623,726 | | |
Materials | | | 215,120,098 | | | | — | | | | — | | | | 215,120,098 | | |
Telecommunication Services | | | 5,873,724 | | | | — | | | | — | | | | 5,873,724 | | |
Utilities | | | 184,824,484 | | | | — | | | | — | | | | 184,824,484 | | |
Total Common Stocks | | | 3,235,331,969 | | | | 14,387,759 | | | | — | | | | 3,249,719,728 | | |
Money Market Funds | | | — | | | | 43,938,078 | | | | — | | | | 43,938,078 | | |
Total Investments | | | 3,235,331,969 | | | | 58,325,837 | | | | — | | | | 3,293,657,806 | | |
Derivatives | |
Assets | |
Futures Contracts | | | 1,590,695 | | | | — | | | | — | | | | 1,590,695 | | |
Total | | | 3,236,922,664 | | | | 58,325,837 | | | | — | | | | 3,295,248,501 | | |
See the Portfolio of Investments for all investment classifications not indicated in the table.
The Fund's assets assigned to the Level 2 input category are valued based upon utilizing observable market inputs, in which a security's value is determined through reference to prices and information from market transactions for similar or identical assets and/or fund per share market values which are not considered publicly available.
Derivative instruments are valued at unrealized appreciation (depreciation).
Financial assets were transferred from Level 1 to Level 2 as the market for these assets was deemed not to be active and fair values were consequently obtained using observable market inputs rather than quoted prices for identical assets as of period end.
Financial assets were transferred from Level 1 to Level 2 as the market for these assets is not considered publicly available. Fund per share market values were obtained using observable market inputs.
The following table shows transfers between Level 1 and Level 2 of the fair value hierarchy:
Transfers In | | Transfers Out | |
| Level 1 ($) | | Level 2 ($) | | Level 1 ($) | | Level 2 ($) | |
| | — | | | | 164,136,259 | | | | 164,136,259 | | | | — | | |
Transfers between Level 1 and Level 2 are determined based on the fair value at the beginning of the period for security positions held throughout the period.
There were no transfers of financial assets between Levels 2 and 3 during the period.
The accompanying Notes to Financial Statements are an integral part of this statement.
Annual Report 2016
16
COLUMBIA MID CAP INDEX FUND
STATEMENT OF ASSETS AND LIABILITIES
February 29, 2016
Assets | |
Investments, at value | |
Unaffiliated issuers (identified cost $2,491,431,465) | | $ | 3,249,719,728 | | |
Affiliated issuers (identified cost $43,938,078) | | | 43,938,078 | | |
Total investments (identified cost $2,535,369,543) | | | 3,293,657,806 | | |
Margin deposits | | | 2,505,800 | | |
Receivable for: | |
Capital shares sold | | | 4,052,573 | | |
Dividends | | | 3,828,626 | | |
Expense reimbursement due from Investment Manager | | | 50,184 | | |
Prepaid expenses | | | 7,058 | | |
Total assets | | | 3,304,102,047 | | |
Liabilities | |
Payable for: | |
Investments purchased | | | 9,078,694 | | |
Capital shares purchased | | | 5,952,656 | | |
Variation margin | | | 190,865 | | |
Investment management fees | | | 54,179 | | |
Distribution and/or service fees | | | 21,488 | | |
Transfer agent fees | | | 795,344 | | |
Compensation of board members | | | 155,943 | | |
Other expenses | | | 141,659 | | |
Total liabilities | | | 16,390,828 | | |
Net assets applicable to outstanding capital stock | | $ | 3,287,711,219 | | |
Represented by | |
Paid-in capital | | $ | 2,498,478,318 | | |
Undistributed net investment income | | | 4,259,907 | | |
Accumulated net realized gain | | | 25,094,036 | | |
Unrealized appreciation (depreciation) on: | |
Investments | | | 758,288,263 | | |
Futures contracts | | | 1,590,695 | | |
Total — representing net assets applicable to outstanding capital stock | | $ | 3,287,711,219 | | |
The accompanying Notes to Financial Statements are an integral part of this statement.
Annual Report 2016
17
COLUMBIA MID CAP INDEX FUND
STATEMENT OF ASSETS AND LIABILITIES (continued)
February 29, 2016
Class A | |
Net assets | | $ | 1,044,589,278 | | |
Shares outstanding | | | 78,937,082 | | |
Net asset value per share | | $ | 13.23 | | |
Class I | |
Net assets | | $ | 2,220 | | |
Shares outstanding | | | 168 | | |
Net asset value per share(a) | | $ | 13.18 | | |
Class R5 | |
Net assets | | $ | 506,523,913 | | |
Shares outstanding | | | 37,786,000 | | |
Net asset value per share | | $ | 13.41 | | |
Class Z | |
Net assets | | $ | 1,736,595,808 | | |
Shares outstanding | | | 131,756,460 | | |
Net asset value per share | | $ | 13.18 | | |
(a) Net asset value per share rounds to this amount due to fractional shares outstanding.
The accompanying Notes to Financial Statements are an integral part of this statement.
Annual Report 2016
18
COLUMBIA MID CAP INDEX FUND
STATEMENT OF OPERATIONS
Year Ended February 29, 2016
Net investment income | |
Income: | |
Dividends — unaffiliated issuers | | $ | 55,706,737 | | |
Dividends — affiliated issuers | | | 123,947 | | |
Total income | | | 55,830,684 | | |
Expenses: | |
Investment management fees | | | 7,489,663 | | |
Distribution and/or service fees | |
Class A | | | 2,731,824 | | |
Transfer agent fees | |
Class A | | | 2,160,211 | | |
Class R5 | | | 279,922 | | |
Class Z | | | 4,138,930 | | |
Compensation of board members | | | 47,727 | | |
Custodian fees | | | 33,672 | | |
Printing and postage fees | | | 226,259 | | |
Registration fees | | | 73,234 | | |
Licensing fees | | | 38,665 | | |
Audit fees | | | 22,573 | | |
Legal fees | | | 33,396 | | |
Other | | | 64,147 | | |
Total expenses | | | 17,340,223 | | |
Fees waived or expenses reimbursed by Investment Manager and its affiliates | | | (7,142,608 | ) | |
Expense reductions | | | (40 | ) | |
Total net expenses | | | 10,197,575 | | |
Net investment income | | | 45,633,109 | | |
Realized and unrealized gain (loss) — net | |
Net realized gain (loss) on: | |
Investments | | | 295,980,522 | | |
Futures contracts | | | 2,863,359 | | |
Net realized gain | | | 298,843,881 | | |
Net change in unrealized appreciation (depreciation) on: | |
Investments | | | (720,623,625 | ) | |
Futures contracts | | | (7,436,410 | ) | |
Net change in unrealized depreciation | | | (728,060,035 | ) | |
Net realized and unrealized loss | | | (429,216,154 | ) | |
Net decrease in net assets from operations | | $ | (383,583,045 | ) | |
The accompanying Notes to Financial Statements are an integral part of this statement.
Annual Report 2016
19
COLUMBIA MID CAP INDEX FUND
STATEMENT OF CHANGES IN NET ASSETS
| | | Year Ended
February 29,
2016 | | Year Ended
February 28,
2015 | |
Operations | |
Net investment income | | $ | 45,633,109 | | | $ | 43,285,418 | | |
Net realized gain | | | 298,843,881 | | | | 218,031,306 | | |
Net change in unrealized appreciation (depreciation) | | | (728,060,035 | ) | | | 134,915,978 | | |
Net increase (decrease) in net assets resulting from operations | | | (383,583,045 | ) | | | 396,232,702 | | |
Distributions to shareholders | |
Net investment income | |
Class A | | | (11,243,225 | ) | | | (9,156,888 | ) | |
Class I | | | (33 | ) | | | (32 | ) | |
Class R5 | | | (6,792,873 | ) | | | (6,127,850 | ) | |
Class Z | | | (25,652,868 | ) | | | (25,711,214 | ) | |
Net realized gains | |
Class A | | | (86,200,291 | ) | | | (50,942,346 | ) | |
Class I | | | (202 | ) | | | (134 | ) | |
Class R5 | | | (41,996,525 | ) | | | (26,657,902 | ) | |
Class Z | | | (158,976,963 | ) | | | (113,684,264 | ) | |
Total distributions to shareholders | | | (330,862,980 | ) | | | (232,280,630 | ) | |
Increase in net assets from capital stock activity | | | 16,359,375 | | | | 50,278,566 | | |
Total increase (decrease) in net assets | | | (698,086,650 | ) | | | 214,230,638 | | |
Net assets at beginning of year | | | 3,985,797,869 | | | | 3,771,567,231 | | |
Net assets at end of year | | $ | 3,287,711,219 | | | $ | 3,985,797,869 | | |
Undistributed net investment income | | $ | 4,259,907 | | | $ | 5,292,897 | | |
The accompanying Notes to Financial Statements are an integral part of this statement.
Annual Report 2016
20
COLUMBIA MID CAP INDEX FUND
STATEMENT OF CHANGES IN NET ASSETS (continued)
| | | Year Ended February 29, 2016 | | Year Ended February 28, 2015 | |
| | | Shares | | Dollars ($) | | Shares | | Dollars ($) | |
Capital stock activity | |
Class A shares | |
Subscriptions | | | 29,361,311 | | | | 443,419,905 | | | | 26,601,530 | | | | 414,514,294 | | |
Distributions reinvested | | | 5,833,995 | | | | 85,872,449 | | | | 3,521,634 | | | | 54,632,712 | | |
Redemptions | | | (22,381,594 | ) | | | (334,361,897 | ) | | | (26,683,853 | ) | | | (414,105,072 | ) | |
Net increase | | | 12,813,712 | | | | 194,930,457 | | | | 3,439,311 | | | | 55,041,934 | | |
Class I shares | |
Redemptions | | | — | | | | — | | | | (77 | ) | | | (1,200 | ) | |
Net decrease | | | — | | | | — | | | | (77 | ) | | | (1,200 | ) | |
Class R5 shares | |
Subscriptions | | | 10,559,099 | | | | 162,018,968 | | | | 15,239,143 | | | | 238,997,893 | | |
Distributions reinvested | | | 3,122,828 | | | | 46,630,426 | | | | 2,021,342 | | | | 31,714,967 | | |
Redemptions | | | (13,784,226 | ) | | | (217,324,973 | ) | | | (11,613,335 | ) | | | (183,705,443 | ) | |
Net increase (decrease) | | | (102,299 | ) | | | (8,675,579 | ) | | | 5,647,150 | | | | 87,007,417 | | |
Class Z shares | |
Subscriptions | | | 23,600,376 | | | | 355,125,145 | | | | 26,769,888 | | | | 415,239,640 | | |
Distributions reinvested | | | 8,157,308 | | | | 119,822,427 | | | | 5,677,573 | | | | 87,759,915 | | |
Redemptions | | | (42,937,803 | ) | | | (644,843,075 | ) | | | (38,271,520 | ) | | | (594,769,140 | ) | |
Net decrease | | | (11,180,119 | ) | | | (169,895,503 | ) | | | (5,824,059 | ) | | | (91,769,585 | ) | |
Total net increase | | | 1,531,294 | | | | 16,359,375 | | | | 3,262,325 | | | | 50,278,566 | | |
The accompanying Notes to Financial Statements are an integral part of this statement.
Annual Report 2016
21
COLUMBIA MID CAP INDEX FUND
The following tables are intended to help you understand the Fund's financial performance. Certain information reflects financial results for a single share of a class held for the periods shown. Per share net investment income (loss) amounts are calculated based on average shares outstanding during the period. Total return assumes reinvestment of all dividends and distributions, if any. Total return does not reflect payment of sales charges, if any. Total return and portfolio turnover are not annualized for periods of less than one year. The portfolio turnover rate is calculated without regard to purchase and sales transactions of short-term instruments and certain derivatives, if any. If such transactions were included, the Fund's portfolio turnover rate may be higher.
| | | Year Ended
February 29, | | Year Ended February 28, | | Year Ended
February 29, | |
Class A | | 2016 | | 2015 | | 2014 | | 2013 | | 2012 | |
Per share data | |
Net asset value, beginning of period | | $ | 16.14 | | | $ | 15.49 | | | $ | 12.82 | | | $ | 11.92 | | | $ | 12.33 | | |
Income from investment operations: | |
Net investment income | | | 0.16 | | | | 0.15 | | | | 0.14 | | | | 0.14 | | | | 0.10 | | |
Net realized and unrealized gain (loss) | | | (1.71 | ) | | | 1.44 | | | | 3.14 | | | | 1.45 | | | | 0.10 | | |
Total from investment operations | | | (1.55 | ) | | | 1.59 | | | | 3.28 | | | | 1.59 | | | | 0.20 | | |
Less distributions to shareholders: | |
Net investment income | | | (0.16 | ) | | | (0.14 | ) | | | (0.11 | ) | | | (0.15 | ) | | | (0.09 | ) | |
Net realized gains | | | (1.20 | ) | | | (0.80 | ) | | | (0.50 | ) | | | (0.54 | ) | | | (0.52 | ) | |
Total distributions to shareholders | | | (1.36 | ) | | | (0.94 | ) | | | (0.61 | ) | | | (0.69 | ) | | | (0.61 | ) | |
Net asset value, end of period | | $ | 13.23 | | | $ | 16.14 | | | $ | 15.49 | | | $ | 12.82 | | | $ | 11.92 | | |
Total return | | | (10.37 | %) | | | 10.58 | % | | | 26.04 | % | | | 14.03 | % | | | 2.12 | % | |
Ratios to average net assets(a) | |
Total gross expenses | | | 0.66 | % | | | 0.66 | % | | | 0.66 | % | | | 0.66 | % | | | 0.66 | % | |
Total net expenses(b) | | | 0.45 | %(c) | | | 0.45 | %(c) | | | 0.45 | %(c) | | | 0.45 | %(c) | | | 0.45 | %(c) | |
Net investment income | | | 1.05 | % | | | 0.96 | % | | | 0.95 | % | | | 1.18 | % | | | 0.83 | % | |
Supplemental data | |
Net assets, end of period (in thousands) | | $ | 1,044,589 | | | $ | 1,067,529 | | | $ | 970,805 | | | $ | 592,450 | | | $ | 470,550 | | |
Portfolio turnover | | | 20 | % | | | 13 | % | | | 14 | % | | | 20 | % | | | 15 | % | |
Notes to Financial Highlights
(a) In addition to the fees and expenses that the Fund bears directly, the Fund indirectly bears a pro rata share of the fees and expenses of any other funds in which it invests. Such indirect expenses are not included in the Fund's reported expense ratios.
(b) Total net expenses include the impact of certain fee waivers/expense reimbursements made by the Investment Manager and certain of its affiliates, if applicable.
(c) The benefits derived from expense reductions had an impact of less than 0.01%.
The accompanying Notes to Financial Statements are an integral part of this statement.
Annual Report 2016
22
COLUMBIA MID CAP INDEX FUND
FINANCIAL HIGHLIGHTS (continued)
| | | Year Ended
February 29, | | Year Ended February 28, | | Year Ended
February 29, | |
Class I | | 2016 | | 2015 | | 2014 | | 2013 | | 2012 | |
Per share data | |
Net asset value, beginning of period | | $ | 16.09 | | | $ | 15.43 | | | $ | 12.77 | | | $ | 11.88 | | | $ | 12.29 | | |
Income from investment operations: | |
Net investment income | | | 0.20 | | | | 0.19 | | | | 0.17 | | | | 0.17 | | | | 0.12 | | |
Net realized and unrealized gain (loss) | | | (1.71 | ) | | | 1.45 | | | | 3.14 | | | | 1.44 | | | | 0.11 | | |
Total from investment operations | | | (1.51 | ) | | | 1.64 | | | | 3.31 | | | | 1.61 | | | | 0.23 | | |
Less distributions to shareholders: | |
Net investment income | | | (0.20 | ) | | | (0.18 | ) | | | (0.15 | ) | | | (0.18 | ) | | | (0.12 | ) | |
Net realized gains | | | (1.20 | ) | | | (0.80 | ) | | | (0.50 | ) | | | (0.54 | ) | | | (0.52 | ) | |
Total distributions to shareholders | | | (1.40 | ) | | | (0.98 | ) | | | (0.65 | ) | | | (0.72 | ) | | | (0.64 | ) | �� |
Net asset value, end of period | | $ | 13.18 | | | $ | 16.09 | | | $ | 15.43 | | | $ | 12.77 | | | $ | 11.88 | | |
Total return | | | (10.16 | %) | | | 11.00 | % | | | 26.36 | % | | | 14.34 | % | | | 2.40 | % | |
Ratios to average net assets(a) | |
Total gross expenses | | | 0.21 | % | | | 0.20 | % | | | 0.21 | % | | | 0.24 | % | | | 0.20 | % | |
Total net expenses(b) | | | 0.20 | % | | | 0.20 | % | | | 0.20 | % | | | 0.15 | % | | | 0.19 | % | |
Net investment income | | | 1.29 | % | | | 1.21 | % | | | 1.21 | % | | | 1.48 | % | | | 1.08 | % | |
Supplemental data | |
Net assets, end of period (in thousands) | | $ | 2 | | | $ | 3 | | | $ | 4 | | | $ | 3 | | | $ | 3 | | |
Portfolio turnover | | | 20 | % | | | 13 | % | | | 14 | % | | | 20 | % | | | 15 | % | |
Notes to Financial Highlights
(a) In addition to the fees and expenses that the Fund bears directly, the Fund indirectly bears a pro rata share of the fees and expenses of any other funds in which it invests. Such indirect expenses are not included in the Fund's reported expense ratios.
(b) Total net expenses include the impact of certain fee waivers/expense reimbursements made by the Investment Manager and certain of its affiliates, if applicable.
The accompanying Notes to Financial Statements are an integral part of this statement.
Annual Report 2016
23
COLUMBIA MID CAP INDEX FUND
FINANCIAL HIGHLIGHTS (continued)
| | | Year Ended
February 29, | | Year Ended February 28, | |
Class R5 | | 2016 | | 2015 | | 2014 | | 2013(a) | |
Per share data | |
Net asset value, beginning of period | | $ | 16.34 | | | $ | 15.66 | | | $ | 12.95 | | | $ | 11.81 | | |
Income from investment operations: | |
Net investment income | | | 0.20 | | | | 0.19 | | | | 0.17 | | | | 0.07 | | |
Net realized and unrealized gain (loss) | | | (1.73 | ) | | | 1.47 | | | | 3.19 | | | | 1.57 | | |
Total from investment operations | | | (1.53 | ) | | | 1.66 | | | | 3.36 | | | | 1.64 | | |
Less distributions to shareholders: | |
Net investment income | | | (0.20 | ) | | | (0.18 | ) | | | (0.15 | ) | | | (0.16 | ) | |
Net realized gains | | | (1.20 | ) | | | (0.80 | ) | | | (0.50 | ) | | | (0.34 | ) | |
Total distributions to shareholders | | | (1.40 | ) | | | (0.98 | ) | | | (0.65 | ) | | | (0.50 | ) | |
Net asset value, end of period | | $ | 13.41 | | | $ | 16.34 | | | $ | 15.66 | | | $ | 12.95 | | |
Total return | | | (10.14 | %) | | | 10.92 | % | | | 26.38 | % | | | 14.34 | % | |
Ratios to average net assets(b) | |
Total gross expenses | | | 0.26 | % | | | 0.26 | % | | | 0.27 | % | | | 0.21 | %(c) | |
Total net expenses(d) | | | 0.20 | % | | | 0.20 | % | | | 0.20 | % | | | 0.16 | %(c) | |
Net investment income | | | 1.29 | % | | | 1.21 | % | | | 1.16 | % | | | 1.82 | %(c) | |
Supplemental data | |
Net assets, end of period (in thousands) | | $ | 506,524 | | | $ | 618,948 | | | $ | 504,850 | | | $ | 3 | | |
Portfolio turnover | | | 20 | % | | | 13 | % | | | 14 | % | | | 20 | % | |
Notes to Financial Highlights
(a) Based on operations from November 8, 2012 (commencement of operations) through the stated period end.
(b) In addition to the fees and expenses that the Fund bears directly, the Fund indirectly bears a pro rata share of the fees and expenses of any other funds in which it invests. Such indirect expenses are not included in the Fund's reported expense ratios.
(c) Annualized.
(d) Total net expenses include the impact of certain fee waivers/expense reimbursements made by the Investment Manager and certain of its affiliates, if applicable.
The accompanying Notes to Financial Statements are an integral part of this statement.
Annual Report 2016
24
COLUMBIA MID CAP INDEX FUND
FINANCIAL HIGHLIGHTS (continued)
| | | Year Ended
February 29, | | Year Ended February 28, | | Year Ended
February 29, | |
Class Z | | 2016 | | 2015 | | 2014 | | 2013 | | 2012 | |
Per share data | |
Net asset value, beginning of period | | $ | 16.09 | | | $ | 15.43 | | | $ | 12.78 | | | $ | 11.88 | | | $ | 12.29 | | |
Income from investment operations: | |
Net investment income | | | 0.20 | | | | 0.19 | | | | 0.17 | | | | 0.16 | | | | 0.12 | | |
Net realized and unrealized gain (loss) | | | (1.71 | ) | | | 1.45 | | | | 3.13 | | | | 1.45 | | | | 0.11 | | |
Total from investment operations | | | (1.51 | ) | | | 1.64 | | | | 3.30 | | | | 1.61 | | | | 0.23 | | |
Less distributions to shareholders: | |
Net investment income | | | (0.20 | ) | | | (0.18 | ) | | | (0.15 | ) | | | (0.17 | ) | | | (0.12 | ) | |
Net realized gains | | | (1.20 | ) | | | (0.80 | ) | | | (0.50 | ) | | | (0.54 | ) | | | (0.52 | ) | |
Total distributions to shareholders | | | (1.40 | ) | | | (0.98 | ) | | | (0.65 | ) | | | (0.71 | ) | | | (0.64 | ) | |
Net asset value, end of period | | $ | 13.18 | | | $ | 16.09 | | | $ | 15.43 | | | $ | 12.78 | | | $ | 11.88 | | |
Total return | | | (10.18 | %) | | | 10.95 | % | | | 26.25 | % | | | 14.35 | % | | | 2.39 | % | |
Ratios to average net assets(a) | |
Total gross expenses | | | 0.41 | % | | | 0.41 | % | | | 0.41 | % | | | 0.41 | % | | | 0.41 | % | |
Total net expenses(b) | | | 0.20 | %(c) | | | 0.20 | %(c) | | | 0.20 | %(c) | | | 0.20 | %(c) | | | 0.20 | %(c) | |
Net investment income | | | 1.29 | % | | | 1.20 | % | | | 1.21 | % | | | 1.39 | % | | | 1.07 | % | |
Supplemental data | |
Net assets, end of period (in thousands) | | $ | 1,736,596 | | | $ | 2,299,318 | | | $ | 2,295,909 | | | $ | 2,014,694 | | | $ | 2,517,203 | | |
Portfolio turnover | | | 20 | % | | | 13 | % | | | 14 | % | | | 20 | % | | | 15 | % | |
Notes to Financial Highlights
(a) In addition to the fees and expenses that the Fund bears directly, the Fund indirectly bears a pro rata share of the fees and expenses of any other funds in which it invests. Such indirect expenses are not included in the Fund's reported expense ratios.
(b) Total net expenses include the impact of certain fee waivers/expense reimbursements made by the Investment Manager and certain of its affiliates, if applicable.
(c) The benefits derived from expense reductions had an impact of less than 0.01%.
The accompanying Notes to Financial Statements are an integral part of this statement.
Annual Report 2016
25
COLUMBIA MID CAP INDEX FUND
NOTES TO FINANCIAL STATEMENTS
February 29, 2016
Note 1. Organization
Columbia Mid Cap Index Fund (the Fund), a series of Columbia Funds Series Trust (the Trust), is a diversified fund. The Trust is registered under the Investment Company Act of 1940, as amended (the 1940 Act), as an open-end management investment company organized as a Delaware statutory trust.
Fund Shares
The Trust may issue an unlimited number of shares (without par value). The Fund offers Class A, Class I, Class R5 and Class Z shares. Although all share classes generally have identical voting, dividend and liquidation rights, each share class votes separately when required by the Trust's organizational documents or by law. Different share classes pay different distribution amounts to the extent the expenses of such share classes differ, and distributions in liquidation will be proportional to the net asset value of each share class. Each share class has its own expense and sales charge structure.
Class A shares are not subject to any front-end sales charge or contingent deferred sales charge.
Class I shares are not subject to sales charges and are available only to the Columbia Family of Funds.
Class R5 shares are not subject to sales charges and are generally available only to investors purchasing through authorized investment professionals and omnibus retirement plans.
Class Z shares are not subject to sales charges and are available only to eligible investors, which are subject to different investment minimums as described in the Fund's prospectus.
Note 2. Summary of Significant Accounting Policies
Basis of Preparation
The Fund is an investment company that applies the accounting and reporting guidance in the Financial Accounting Standards Board (FASB) Accounting Standards Codification Topic 946, Financial Services — Investment Companies (ASC 946). The financial statements are prepared in accordance with U.S. generally accepted accounting principles (GAAP), which requires management to make certain estimates and assumptions that affect the reported amounts of assets and liabilities, the disclosure of contingent assets and liabilities at the date of the financial statements and the reported amounts of
income and expenses during the reporting period. Actual results could differ from those estimates.
The following is a summary of significant accounting policies followed by the Fund in the preparation of its financial statements.
Security Valuation
All equity securities are valued at the close of business of the New York Stock Exchange (NYSE). Equity securities are valued at the last quoted sales price on the principal exchange or market on which they trade, except for securities traded on the NASDAQ Stock Market, which are valued at the NASDAQ official close price. Unlisted securities or listed securities for which there were no sales during the day are valued at the mean of the latest quoted bid and ask prices on such exchanges or markets.
Foreign equity securities are valued based on the closing price on the foreign exchange in which such securities are primarily traded. If any foreign equity security closing prices are not readily available, the securities are valued at the mean of the latest quoted bid and ask prices on such exchanges or markets. Foreign currency exchange rates are generally determined at 4:00 p.m. Eastern (U.S.) time. Many securities markets and exchanges outside the U.S. close prior to the close of the NYSE; therefore, the closing prices for securities in such markets or on such exchanges may not fully reflect events that occur after such close but before the close of the NYSE. In those situations, foreign securities will be fair valued pursuant to a policy adopted by the Board of Trustees (the Board), including, if available, utilizing a third party pricing service to determine these fair values. The third party pricing service takes into account multiple factors, including, but not limited to, movements in the U.S. securities markets, certain depositary receipts, futures contracts and foreign exchange rates that have occurred subsequent to the close of the foreign exchange or market, to determine a good faith estimate that reasonably reflects the current market conditions as of the close of the NYSE. The fair value of a security is likely to be different from the quoted or published price, if available.
Investments in open-end investment companies, including money market funds, are valued at their latest net asset value.
Futures and options on futures contracts are valued based upon the settlement price at the close of regular trading on their principal exchanges or, in the absence of transactions, at the mean of the latest quoted bid and ask prices.
Annual Report 2016
26
COLUMBIA MID CAP INDEX FUND
NOTES TO FINANCIAL STATEMENTS (continued)
February 29, 2016
Investments for which market quotations are not readily available, or that have quotations which management believes are not reflective of market value or reliable, are valued at fair value as determined in good faith under procedures approved by and under the general supervision of the Board. If a security or class of securities (such as foreign securities) is valued at fair value, such value is likely to be different from the quoted or published price for the security.
The determination of fair value often requires significant judgment. To determine fair value, management may use assumptions including but not limited to future cash flows and estimated risk premiums. Multiple inputs from various sources may be used to determine fair value.
GAAP requires disclosure regarding the inputs and valuation techniques used to measure fair value and any changes in valuation inputs or techniques. In addition, investments shall be disclosed by major category. This information is disclosed following the Fund's Portfolio of Investments.
Derivative Instruments
The Fund invests in certain derivative instruments, as detailed below, to meet its investment objectives. Derivatives are instruments whose values depend on, or are derived from, in whole or in part, the value of one or more securities, currencies, commodities, indices, or other assets or instruments. Derivatives may be used to increase investment flexibility (including to maintain cash reserves while maintaining desired exposure to certain assets), for risk management (hedging) purposes, to facilitate trading, to reduce transaction costs and to pursue higher investment returns. The Fund may also use derivative instruments to mitigate certain investment risks, such as foreign currency exchange rate risk, interest rate risk and credit risk. Derivatives may involve various risks, including the potential inability of the counterparty to fulfill its obligation under the terms of the contract, the potential for an illiquid secondary market (making it difficult for the Fund to sell, including at favorable prices) and the potential for market movements which may expose the Fund to gains or losses in excess of the amount shown in the Statement of Assets and Liabilities. The notional amounts of derivative instruments, if applicable, are not recorded in the financial statements.
A derivative instrument may suffer a marked-to-market loss if the value of the contract decreases due to an unfavorable change in the market rates or values of the underlying instrument. Losses can also occur if the
counterparty does not perform under the contract. The Fund's risk of loss from counterparty credit risk on over-the-counter derivatives is generally limited to the aggregate unrealized gain netted against any collateral held by the Fund and the amount of any variation margin held by the counterparty. With exchange-traded or centrally cleared derivatives, there is reduced counterparty credit risk to the Fund since the exchange's clearinghouse, as counterparty to such instruments, guarantees against a possible default. The clearinghouse stands between the buyer and the seller of the contract; therefore, the counterparty credit risk is failure of the clearinghouse. However, credit risk still exists in exchange-traded or centrally cleared derivatives with respect to initial and variation margin that is held in a broker's customer account. While brokers are required to segregate customer margin from their own assets, in the event that a broker becomes insolvent or goes into bankruptcy and at that time there is a shortfall in the aggregate amount of margin held by the broker for all its clients, U.S. bankruptcy laws will typically allocate that shortfall on a pro-rata basis across all the broker's customers (including the Fund), potentially resulting in losses to the Fund.
In order to better define its contractual rights and to secure rights that will help the Fund mitigate its counterparty risk, the Fund may enter into an International Swaps and Derivatives Association, Inc. Master Agreement (ISDA Master Agreement) or similar agreement with its derivatives contract counterparties. An ISDA Master Agreement is an agreement between the Fund and a counterparty that governs over-the-counter derivatives and forward foreign currency exchange contracts and typically contains, among other things, collateral posting terms and netting provisions in the event of a default and/or termination event. Under an ISDA Master Agreement, the Fund may, under certain circumstances, offset with the counterparty certain derivative instrument's payables and/or receivables with collateral held and/or posted and create one single net payment. The provisions of the ISDA Master Agreement typically permit a single net payment in the event of default (close-out netting) including the bankruptcy or insolvency of the counterparty. Note, however, that bankruptcy or insolvency laws of a particular jurisdiction may impose restrictions on or prohibitions against the right of offset in bankruptcy, insolvency or other events.
Collateral (margin) requirements differ by type of derivative. Margin requirements are established by the exchange or clearinghouse for exchange-traded and
Annual Report 2016
27
COLUMBIA MID CAP INDEX FUND
NOTES TO FINANCIAL STATEMENTS (continued)
February 29, 2016
centrally cleared derivatives. Brokers can ask for margin in excess of the minimum in certain circumstances. Collateral terms are contract specific for over-the-counter derivatives. For over-the-counter derivatives traded under an ISDA Master Agreement, the collateral requirements are typically calculated by netting the marked-to-market amount for each transaction under such agreement and comparing that amount to the value of any variation margin currently pledged by the Fund and/or the counterparty. Generally, the amount of collateral due from or to a party has to exceed a minimum transfer amount threshold (e.g., $500,000) before a transfer has to be made. To the extent amounts due to the Fund from its counterparties are not fully collateralized, contractually or otherwise, the Fund bears the risk of loss from counterparty nonperformance. The Fund attempts to mitigate counterparty risk by only entering into agreements with counterparties that it believes have the financial resources to honor their obligations and by monitoring the financial stability of those counterparties.
Certain ISDA Master Agreements allow counterparties to over-the-counter derivatives transactions to terminate derivatives contracts prior to maturity in the event the Fund's net asset value declines by a stated percentage over a specified time period or if the Fund fails to meet certain terms of the ISDA Master Agreement, which would cause the Fund to accelerate payment of any net liability owed to the counterparty. The Fund also has termination rights if the counterparty fails to meet certain terms of the ISDA Master Agreement. In addition to considering counterparty credit risk, the Fund would consider terminating the derivatives contracts based on whether termination would result in a net liability owed from the counterparty.
For financial reporting purposes, the Fund does not offset derivative assets and derivative liabilities that are subject to netting arrangements in the Statement of Assets and Liabilities.
Futures Contracts
Futures contracts are exchange traded and represent commitments for the future purchase or sale of an asset at a specified price on a specified date. The Fund bought and sold futures contracts to maintain appropriate equity market exposure while keeping sufficient cash to accommodate daily redemptions. These instruments may be used for other purposes in future periods. Upon entering into futures contracts, the Fund bears risks that it may not achieve the anticipated benefits of the futures contracts and may realize a loss. Additional risks include
counterparty credit risk, the possibility of an illiquid market, and that a change in the value of the contract or option may not correlate with changes in the value of the underlying asset.
Upon entering into a futures contract, the Fund pledges cash or securities with the broker in an amount sufficient to meet the initial margin requirement. The initial margin deposit must be maintained at an established level over the life of the contract. Cash deposited as initial margin is recorded in the Statement of Assets and Liabilities as margin deposits. Securities deposited as initial margin are designated in the Portfolio of Investments. Subsequent payments (variation margin) are made or received by the Fund each day. The variation margin payments are equal to the daily change in the contract value and are recorded as variation margin receivable or payable and are offset in unrealized gains or losses. The Fund recognizes a realized gain or loss when the contract is closed or expires. Futures contracts involve, to varying degrees, risk of loss in excess of the variation margin disclosed in the Statement of Assets and Liabilities.
Effects of Derivative Transactions in the Financial Statements
The following tables are intended to provide additional information about the effect of derivatives on the financial statements of the Fund, including: the fair value of derivatives by risk category and the location of those fair values in the Statement of Assets and Liabilities; and the impact of derivative transactions over the period in the Statement of Operations, including realized and unrealized gains (losses). The derivative instrument schedules following the Portfolio of Investments present additional information regarding derivative instruments outstanding at the end of the period, if any.
The following table is a summary of the fair value of derivative instruments (not considered to be hedging instruments for accounting disclosure purposes) at February 29, 2016:
Asset Derivatives | |
Risk Exposure
Category | | Statement of Assets and
Liabilities Location | | Fair Value ($) | |
Equity risk
| | Net assets — unrealized
appreciation on futures
contracts | | | 1,590,695
| * | |
*Includes cumulative appreciation (depreciation) as reported in the tables following the Portfolio of Investments. Only the current day's variation margin is reported in receivables or payables in the Statement of Assets and Liabilities.
Annual Report 2016
28
COLUMBIA MID CAP INDEX FUND
NOTES TO FINANCIAL STATEMENTS (continued)
February 29, 2016
The following table indicates the effect of derivative instruments (not considered to be hedging instruments for accounting disclosure purposes) in the Statement of Operations for the year ended February 29, 2016:
Amount of Realized Gain (Loss) on Derivatives Recognized in Income | |
Risk Exposure Category | | Futures Contracts ($) | |
Equity risk | | | 2,863,359 | | |
Change in Unrealized Appreciation (Depreciation) on
Derivatives Recognized in Income | |
Risk Exposure Category | | Futures Contracts ($) | |
Equity risk | | | (7,436,410 | ) | |
The following table provides a summary of the average outstanding volume by derivative instrument for the year ended February 29, 2016:
Derivative Instrument | | Average Notional
Amounts ($)* | |
Futures contracts — Long | | | 89,952,715 | | |
*Based on the ending quarterly outstanding amounts for the year ended February 29, 2016.
Security Transactions
Security transactions are accounted for on the trade date. Cost is determined and gains (losses) are based upon the specific identification method for both financial statement and federal income tax purposes.
Income Recognition
Corporate actions and dividend income are generally recorded net of any non-reclaimable tax withholdings, on the ex-dividend date or upon receipt of ex-dividend notification in the case of certain foreign securities.
The Fund may receive distributions from holdings in equity securities, business development companies (BDCs), exchange-traded funds, other regulated investment companies (RICs), and real estate investment trusts (REITs), which report information on the tax character of their distributions annually. These distributions are allocated to dividend income, capital gain and return of capital based on actual information reported. Return of capital is recorded as a reduction of the cost basis of securities held. If the Fund no longer owns the applicable securities, return of capital is recorded as a realized gain. With respect to REITs, to the extent actual information has not yet been reported, estimates for return of capital are made by the Fund's management. Management's estimates are subsequently adjusted when the actual character of the distributions is disclosed by the REITs, which could result
in a proportionate change in return of capital to shareholders.
Awards from class action litigation are recorded as a reduction of cost basis if the Fund still owns the applicable securities on the payment date. If the Fund no longer owns the applicable securities, the proceeds are recorded as realized gains.
Expenses
General expenses of the Trust are allocated to the Fund and other funds of the Trust based upon relative net assets or other expense allocation methodologies determined by the nature of the expense. Expenses directly attributable to the Fund are charged to the Fund. Expenses directly attributable to a specific class of shares are charged to that share class.
Determination of Class Net Asset Value
All income, expenses (other than class-specific expenses, which are charged to that share class, as shown in the Statement of Operations) and realized and unrealized gains (losses) are allocated to each class of the Fund on a daily basis, based on the relative net assets of each class, for purposes of determining the net asset value of each class.
Federal Income Tax Status
The Fund intends to qualify each year as a regulated investment company under Subchapter M of the Internal Revenue Code, as amended, and will distribute substantially all of its taxable income (including net short-term capital gains), if any, for its tax year, and as such will not be subject to federal income taxes. In addition, the Fund intends to distribute in each calendar year substantially all of its net investment income, capital gains and certain other amounts, if any, such that the Fund should not be subject to federal excise tax. Therefore, no federal income or excise tax provision is recorded.
Distributions to Shareholders
Distributions from net investment income, if any, are declared and paid semi-annually. Net realized capital gains, if any, are distributed at least annually. Income distributions and capital gain distributions are determined in accordance with federal income tax regulations, which may differ from GAAP.
Annual Report 2016
29
COLUMBIA MID CAP INDEX FUND
NOTES TO FINANCIAL STATEMENTS (continued)
February 29, 2016
Recent Accounting Pronouncement
Fair Value Measurement (Topic 820), Disclosure for Investments in Certain Entities That Calculate Net Asset Value per Share (or Its Equivalent)
In May 2015, FASB issued Accounting Standards Update (ASU) No. 2015-07, Fair Value Measurement (Topic 820), Disclosure for Investments in Certain Entities That Calculate Net Asset Value per Share (or Its Equivalent). ASU No. 2015-07 changes the disclosure requirements for investments for which fair value is measured using the net asset value per share practical expedient. The disclosure requirements are effective for annual periods beginning after December 15, 2015 and interim periods within those fiscal years. At this time, management is evaluating the implications of this guidance and the impact it will have on the financial statement amounts and footnote disclosures, if any.
Guarantees and Indemnifications
Under the Trust's organizational documents and, in some cases, by contract, its officers and trustees are indemnified against certain liabilities arising out of the performance of their duties to the Trust or its funds. In addition, certain of the Fund's contracts with its service providers contain general indemnification clauses. The Fund's maximum exposure under these arrangements is unknown since the amount of any future claims that may be made against the Fund cannot be determined, and the Fund has no historical basis for predicting the likelihood of any such claims.
Note 3. Fees and Other Transactions with Affiliates
Management Fees
Effective July 1, 2015, the Fund entered into a Management Agreement with Columbia Management Investment Advisers, LLC (the Investment Manager), a wholly-owned subsidiary of Ameriprise Financial, Inc. (Ameriprise Financial). Under the Management Agreement, the Investment Manager provides the Fund with investment research and advice, as well as administrative and accounting services. The management services fee is an annual fee that is equal to 0.20% of the Fund's average daily net assets.
Prior to July 1, 2015, the Fund paid the Investment Manager an annual fee for advisory services under an Investment Management Services Agreement and a separate annual fee for administrative and accounting services under an Administrative Services Agreement.
For the period from March 1, 2015 through June 30, 2015, the investment advisory services fee paid to the Investment Manager was $1,355,862, and the administrative services fee paid to the Investment Manager was $1,355,862.
Other Expenses
Other expenses are for, among other things, miscellaneous expenses of the Fund or the Board, including payments to Board Services Corp., a company providing limited administrative services to the Fund and the Board. That company's expenses include boardroom and office expense, employee compensation, employee health and retirement benefits, and certain other expenses. For the year ended February 29, 2016, other expenses paid by the Fund to this company were $7,347.
Compensation of Board Members
Board members, who are not officers or employees of the Investment Manager or Ameriprise Financial, are compensated for their services to the Fund as disclosed in the Statement of Operations. Under a Deferred Compensation Plan (the Plan), these Board members may elect to defer payment of up to 100% of their compensation. Deferred amounts are treated as though equivalent dollar amounts had been invested in shares of certain funds managed by the Investment Manager. The Fund's liability for these amounts is adjusted for market value changes and remains in the Fund until distributed in accordance with the Plan. All amounts payable under the Plan constitute a general unsecured obligation of the Fund.
Transfer Agency Fees
Under a Transfer and Dividend Disbursing Agent Agreement, Columbia Management Investment Services Corp. (the Transfer Agent), an affiliate of the Investment Manager and a wholly-owned subsidiary of Ameriprise Financial, is responsible for providing transfer agency services to the Fund. The Transfer Agent has contracted with Boston Financial Data Services (BFDS) to serve as sub-transfer agent.
The Transfer Agent receives a monthly transfer agency fee based on the number or the average value of accounts, depending on the type of account. In addition, the Transfer Agent also receives sub-transfer agency fees based on a percentage of the average aggregate value of the Fund's shares maintained in omnibus accounts (other than omnibus accounts for which American Enterprise Investment Services Inc. is the broker of
Annual Report 2016
30
COLUMBIA MID CAP INDEX FUND
NOTES TO FINANCIAL STATEMENTS (continued)
February 29, 2016
record or accounts where the beneficial shareholder is a customer of Ameriprise Financial Services, Inc., for which the Transfer Agent receives a per account fee). The Transfer Agent pays the fees of BFDS for services as sub-transfer agent and is not entitled to reimbursement for such fees from the Fund (with the exception of out-of-pocket fees).
The Transfer Agent also receives compensation from the Fund for various shareholder services and reimbursements for certain out-of-pocket fees. Class I shares do not pay transfer agency fees. Total transfer agency fees for Class R5 shares are subject to an annual limitation of not more than 0.05% of the average daily net assets attributable to Class R5 shares.
For the year ended February 29, 2016, the Fund's effective transfer agency fee rates as a percentage of average daily net assets of each class were as follows:
Class A | | | 0.20 | % | |
Class R5 | | | 0.05 | | |
Class Z | | | 0.20 | | |
An annual minimum account balance fee of $20 may apply to certain accounts with a value below the applicable share class's initial minimum investment requirements to reduce the impact of small accounts on transfer agency fees. These minimum account balance fees are remitted to the Fund and recorded as part of expense reductions in the Statement of Operations. For the year ended February 29, 2016, these minimum account balance fees reduced total expenses of the Fund by $40.
Distribution and Service Fees
The Fund has an agreement with Columbia Management Investment Distributors, Inc. (the Distributor), an affiliate of the Investment Manager and a wholly-owned subsidiary of Ameriprise Financial, for distribution and shareholder services. The Board has approved, and the Fund has adopted, distribution and shareholder service plans (the Plans) applicable to certain share classes, which set the distribution and service fees for the Fund. These fees are calculated daily and are intended to compensate the Distributor and/or eligible selling and/or servicing agents for selling shares of the Fund and providing services to investors.
Under the Plans, the Fund pays a monthly combined distribution and service fee to the Distributor at the maximum annual rate of 0.25% of the average daily net assets attributable to Class A shares of the Fund.
Expenses Waived/Reimbursed by the Investment Manager and its Affiliates
The Investment Manager and certain of its affiliates have contractually agreed to waive fees and/or reimburse expenses (excluding certain fees and expenses described below) for the period disclosed below, unless sooner terminated at the sole discretion of the Board, so that the Fund's net operating expenses, after giving effect to fees waived/expenses reimbursed and any balance credits and/or overdraft charges from the Fund's custodian, do not exceed the following annual rates as a percentage of the class' average daily net assets:
| | | Fee Rates Contractual
Through
June 30, 2016 | |
Class A | | | 0.45 | % | |
Class I | | | 0.20 | | |
Class R5 | | | 0.20 | | |
Class Z | | | 0.20 | | |
Under the agreement governing these fee waivers and/or expense reimbursement arrangements, the following fees and expenses are excluded from the waiver/reimbursement commitment, and therefore will be paid by the Fund, if applicable: taxes (including foreign transaction taxes), expenses associated with investments in affiliated and non-affiliated pooled investment vehicles (including mutual funds and exchange-traded funds), transaction costs and brokerage commissions, costs related to any securities lending program, dividend and interest expenses associated with securities sold short, inverse floater program fees and expenses, transaction charges and interest on borrowed money, interest, extraordinary expenses and any other expenses the exclusion of which is specifically approved by the Board. This agreement may be modified or amended only with approval from the Investment Manager, certain of its affiliates and the Fund. Any fees waived and/or expenses reimbursed under the expense reimbursement arrangements described above are not recoverable by the Investment Manager or its affiliates in future periods.
Note 4. Federal Tax Information
The timing and character of income and capital gain distributions are determined in accordance with income tax regulations, which may differ from GAAP because of temporary or permanent book to tax differences.
At February 29, 2016, these differences are primarily due to differing treatment for deferral/reversal of wash sale
Annual Report 2016
31
COLUMBIA MID CAP INDEX FUND
NOTES TO FINANCIAL STATEMENTS (continued)
February 29, 2016
losses, Trustees' deferred compensation, distribution reclassifications, derivative investments, earnings and profits distributed to shareholders on the redemption of shares, and proceeds from regulatory settlements. To the extent these differences are permanent, reclassifications are made among the components of the Fund's net assets in the Statement of Assets and Liabilities. Temporary differences do not require reclassifications. In the Statement of Assets and Liabilities the following reclassifications were made:
Undistributed net investment income | | $ | (2,977,100 | ) | |
Accumulated net realized gain | | | (29,947,402 | ) | |
Paid-in capital | | | 32,924,502 | | |
Net investment income (loss) and net realized gains (losses), as disclosed in the Statement of Operations, and net assets were not affected by this reclassification.
The tax character of distributions paid during the years indicated was as follows:
Year Ended, | | February 29,
2016 | | February 28,
2015 | |
Ordinary income | | $ | 45,481,359 | | | $ | 48,145,426 | | |
Long-term capital gains | | | 285,381,621 | | | | 184,135,204 | | |
Total | | $ | 330,862,980 | | | $ | 232,280,630 | | |
Short-term capital gain distributions, if any, are considered ordinary income distributions for tax purposes.
At February 29, 2016, the components of distributable earnings on a tax basis were as follows:
Undistributed ordinary income | | $ | 4,411,700 | | |
Undistributed long-term capital gains | | | 44,819,966 | | |
Net unrealized appreciation | | | 740,153,028 | | |
At February 29, 2016, the cost of investments for federal income tax purposes was $2,553,504,778 and the aggregate gross unrealized appreciation and depreciation based on that cost was:
Unrealized appreciation | | $ | 1,048,679,792 | | |
Unrealized depreciation | | | (308,526,764 | ) | |
Net unrealized appreciation | | $ | 740,153,028 | | |
Management of the Fund has concluded that there are no significant uncertain tax positions in the Fund that would require recognition in the financial statements. However, management's conclusion may be subject to review and adjustment at a later date based on factors including, but not limited to, new tax laws, regulations, and administrative interpretations (including relevant
court decisions). Generally, the Fund's federal tax returns for the prior three fiscal years remain subject to examination by the Internal Revenue Service.
Note 5. Portfolio Information
The cost of purchases and proceeds from sales of securities, excluding short-term investments and derivatives, if any, aggregated to $742,670,318 and $887,860,389, respectively, for the year ended February 29, 2016. The amount of purchase and sale activity impacts the portfolio turnover rate reported in the Financial Highlights.
Note 6. Affiliated Money Market Fund
The Fund invests in Columbia Short-Term Cash Fund, an affiliated money market fund established for the exclusive use by the Fund and other affiliated funds. The income earned by the Fund from such investments is included as Dividends — affiliated issuers in the Statement of Operations. As an investing fund, the Fund indirectly bears its proportionate share of the expenses of Columbia Short-Term Cash Fund.
Note 7. Line of Credit
The Fund has access to a revolving credit facility whereby the Fund may borrow for the temporary funding of shareholder redemptions or for other temporary or emergency purposes. Effective December 8, 2015, Citibank, N.A. and HSBC Bank USA, N.A. joined JPMorgan Chase Bank, N.A. (JPMorgan) as lead of a syndicate of banks under the credit facility, which is a collective agreement between the Fund and certain other funds managed by the Investment Manager, severally and not jointly, that permits collective borrowings up to $1 billion. Interest is charged to each participating fund based on its borrowings at a rate equal to the higher of (i) the overnight federal funds rate plus 1.00% or (ii) the one-month LIBOR rate plus 1.00%. Each borrowing under the credit facility matures no later than 60 days after the date of borrowing. The Fund also pays a commitment fee equal to its pro rata share of the amount of the credit facility at a rate of 0.15% per annum. The commitment fee is included in other expenses in the Statement of Operations. Prior to December 8, 2015, JPMorgan was the sole lead bank under the credit facility agreement that permitted borrowings up to $550 million under the same terms and interest rates as described above with the exception of the commitment fee which was charged at a rate of 0.075% per annum.
Annual Report 2016
32
COLUMBIA MID CAP INDEX FUND
NOTES TO FINANCIAL STATEMENTS (continued)
February 29, 2016
The Fund had no borrowings during the year ended February 29, 2016.
Note 8. Significant Risks
Shareholder Concentration Risk
At February 29, 2016, one unaffiliated shareholder of record owned 22.2% of the outstanding shares of the Fund in one or more accounts. The Fund has no knowledge about whether any portion of those shares was owned beneficially. Subscription and redemption activity by concentrated accounts may have a significant effect on the operations of the Fund. In the case of a large redemption, the Fund may be forced to sell investments at inopportune times, including its liquid or more liquid positions, resulting in Fund losses and the Fund holding a higher percentage of less liquid or illiquid securities. Large redemptions could result in decreased economies of scale and increased operating expenses for non-redeeming Fund shareholders.
Financial Sector Risk
The Fund may be more susceptible to the particular risks that may affect companies in the financial services sector than if it were invested in a wider variety of companies in unrelated sectors. Companies in the financial services sector are subject to certain risks, including the risk of regulatory change, decreased liquidity in credit markets and unstable interest rates. Such companies may have concentrated portfolios, such as a high level of loans to real estate developers, which makes them vulnerable to economic conditions that affect that industry. Performance of such companies may be affected by competitive pressures and exposure to investments or agreements that, under certain circumstances, may lead to losses (e.g., subprime loans). Companies in the financial services sector are subject to extensive governmental regulation that may limit the amount and types of loans and other financial commitments they can make, and interest rates and fees that they may charge. In addition, profitability of such companies is largely dependent upon the availability and the cost of capital.
Note 9. Subsequent Events
Management has evaluated the events and transactions that have occurred through the date the financial statements were issued and noted no items requiring adjustment of the financial statements or additional disclosure.
Note 10. Information Regarding Pending and Settled Legal Proceedings
In December 2005, without admitting or denying the allegations, American Express Financial Corporation (AEFC, which is now known as Ameriprise Financial, Inc. (Ameriprise Financial)) entered into settlement agreements with the Securities and Exchange Commission (SEC) and Minnesota Department of Commerce (MDOC) related to market timing activities. As a result, AEFC was censured and ordered to cease and desist from committing or causing any violations of certain provisions of the Investment Advisers Act of 1940, the Investment Company Act of 1940, and various Minnesota laws. AEFC agreed to pay disgorgement of $10 million and civil money penalties of $7 million. AEFC also agreed to retain an independent distribution consultant to assist in developing a plan for distribution of all disgorgement and civil penalties ordered by the SEC in accordance with various undertakings detailed at http://www.sec.gov/litigation/admin/ia-2451.pdf. Ameriprise Financial and its affiliates have cooperated with the SEC and the MDOC in these legal proceedings, and have made regular reports to the Funds' Boards of Trustees.
Ameriprise Financial and certain of its affiliates have historically been involved in a number of legal, arbitration and regulatory proceedings, including routine litigation, class actions, and governmental actions, concerning matters arising in connection with the conduct of their business activities. Ameriprise Financial believes that the Funds are not currently the subject of, and that neither Ameriprise Financial nor any of its affiliates are the subject of, any pending legal, arbitration or regulatory proceedings that are likely to have a material adverse effect on the Funds or the ability of Ameriprise Financial or its affiliates to perform under their contracts with the Funds. Ameriprise Financial is required to make quarterly (10-Q), annual (10-K) and, as necessary, 8-K filings with the SEC on legal and regulatory matters that relate to Ameriprise Financial and its affiliates. Copies of these filings may be obtained by accessing the SEC website at www.sec.gov.
There can be no assurance that these matters, or the adverse publicity associated with them, will not result in increased fund redemptions, reduced sale of fund shares or other adverse consequences to the Funds. Further, although we believe proceedings are not likely to have a material adverse effect on the Funds or the ability of
Annual Report 2016
33
COLUMBIA MID CAP INDEX FUND
NOTES TO FINANCIAL STATEMENTS (continued)
February 29, 2016
Ameriprise Financial or its affiliates to perform under their contracts with the Funds, these proceedings are subject to uncertainties and, as such, we are unable to estimate the possible loss or range of loss that may result. An adverse outcome in one or more of these proceedings could result in adverse judgments, settlements, fines, penalties or other relief that could have a material adverse effect on the consolidated financial condition or results of operations of Ameriprise Financial.
Annual Report 2016
34
COLUMBIA MID CAP INDEX FUND
REPORT OF INDEPENDENT REGISTERED PUBLIC ACCOUNTING FIRM
To the Trustees of Columbia Funds Series Trust and the Shareholders of
Columbia Mid Cap Index Fund
In our opinion, the accompanying statement of assets and liabilities, including the portfolio of investments, and the related statements of operations and of changes in net assets and the financial highlights present fairly, in all material respects, the financial position of Columbia Mid Cap Index Fund (the "Fund," a series of Columbia Funds Series Trust) at February 29, 2016, and the results of its operations, the changes in its net assets and the financial highlights for each of the periods indicated, in conformity with accounting principles generally accepted in the United States of America. These financial statements and financial highlights (hereafter referred to as "financial statements") are the responsibility of the Fund's management. Our responsibility is to express an opinion on these financial statements based on our audits. We conducted our audits of these financial statements in accordance with the standards of the Public Company Accounting Oversight Board (United States). Those standards require that we plan and perform the audit to obtain reasonable assurance about whether the financial statements are free of material misstatement. An audit includes examining, on a test basis, evidence supporting the amounts and disclosures in the financial statements, assessing the accounting principles used and significant estimates made by management, and evaluating the overall financial statement presentation. We believe that our audits, which included confirmation of securities at February 29, 2016 by correspondence with the custodian, brokers and transfer agent, and the application of alternative auditing procedures where such confirmations had not been received, provide a reasonable basis for our opinion.
PricewaterhouseCoopers LLP
Minneapolis, MN
April 21, 2016
Annual Report 2016
35
COLUMBIA MID CAP INDEX FUND
FEDERAL INCOME TAX INFORMATION
(Unaudited)
The Fund hereby designates the following tax attributes for the fiscal year ended February 29, 2016. Shareholders will be notified in early 2017 of the amounts for use in preparing 2016 income tax returns.
Tax Designations
| Qualified Dividend Income | | | 95.93 | % | |
| Dividends Received Deduction | | | 94.88 | % | |
Capital Gain Dividend | | $ | 308,581,894 | | |
Qualified Dividend Income. For taxable, non-corporate shareholders, the percentage of ordinary income distributed during the fiscal year that represents qualified dividend income subject to reduced tax rates.
Dividends Received Deduction. The percentage of ordinary income distributed during the fiscal year that qualifies for the corporate dividends received deduction.
Capital Gain Dividend. The Fund designates as a capital gain dividend the amount reflected above, or if subsequently determined to be different, the net capital gain of such fiscal period.
Annual Report 2016
36
COLUMBIA MID CAP INDEX FUND
Shareholders elect the Board that oversees the Fund's operations. The Board appoints officers who are responsible for day-to-day business decisions based on policies set by the Board. The following table provides basic biographical information about the Fund's Trustees, including their principal occupations during the past five years, although specific titles for individuals may have varied over the period. Under current Board policy, members generally may serve through the end of the calendar year in which they reach either the mandatory retirement age established by the Board or the fifteenth anniversary of the first Board meeting they attended as a member of the Board.
Trustees
Independent Trustees
Name,
Address,
Year of Birth | | Position Held With
the Funds and Length of
Service | | Principal Occupation(s)
During the Past Five Years
and Other Relevant
Professional Experience | | Number of
Funds in the
Columbia
Funds Complex
Overseen | | Other Directorships
Held by Trustee
During the Past
Five Years | |
Kathleen Blatz
901 S. Marquette Ave.
Minneapolis, MN 55402
1954 | | Trustee since 1/06 for RiverSource Funds and since 6/11 for Nations Funds | | Attorney; specializing in arbitration and mediation; Chief Justice, Minnesota Supreme Court, 1998-2006; Associate Justice, Minnesota Supreme Court, 1996-1998; Fourth Judicial District Court Judge, Hennepin County, 1994-1996; Attorney in private practice and public service, 1984-1993; State Representative, Minnesota House of Representatives, 1979-1993, which included service on the Tax and Financial Institutions and Insurance Committees | | | 124 | | | Trustee, BlueCross BlueShield of Minnesota (Chair of the Business Development Committee) since 2009; Chair of the Robina Foundation since August 2013 | |
Edward J. Boudreau, Jr.
901 S. Marquette Ave.
Minneapolis, MN 55402
1944 | | Trustee since 6/11 for RiverSource Funds and since 1/05 for Nations Funds | | Managing Director, E.J. Boudreau & Associates (consulting) since 2000; FINRA Industry Arbitrator, 2002-present; Chairman and Chief Executive Officer, John Hancock Funds (asset management), Chairman and Interested Trustee for open-end and closed-end funds offered by John Hancock, 1989-2000; John Hancock Life Insurance Company, including SVP and Treasurer and SVP Information Technology, 1968-1988 | | | 122 | | | Former Trustee, Boston Museum of Science (Chair of Finance Committee), 1985-2013; former Trustee, BofA Funds Series Trust (11 funds), 2005-2011 | |
Pamela G. Carlton
901 S. Marquette Ave.
Minneapolis, MN 55402
1954 | | Trustee since 7/07 for RiverSource Funds and since 6/11 for Nations Funds | | President, Springboard-Partners in Cross Cultural Leadership (consulting company) since 2003; Managing Director of US Equity Research, JP Morgan Chase, 1999-2003; Director of US Equity Research, Chase Asset Management, 1996-1999; Co-Director Latin America Research, 1993-1996, COO Global Research, 1992-1996, Co-Director of US Research, 1991-1992, Investment Banker, Morgan Stanley, 1982-1991 | | | 124 | | | Trustee, New York Presbyterian Hospital Board (Executive Committee and Chair of Human Resources Committee) since 1996 | |
Annual Report 2016
37
COLUMBIA MID CAP INDEX FUND
TRUSTEES AND OFFICERS (continued)
Independent Trustees (continued)
Name,
Address,
Year of Birth | | Position Held With
the Funds and Length of
Service | | Principal Occupation(s)
During the Past Five Years
and Other Relevant
Professional Experience | | Number of
Funds in the
Columbia
Funds Complex
Overseen | | Other Directorships
Held by Trustee
During the Past
Five Years | |
William P. Carmichael
901 S. Marquette Ave.
Minneapolis, MN 55402
1943 | | Trustee since 6/11 for RiverSource Funds and since 2003 for Nations Funds; Chair of the Board from 1/14-11/15 | | Retired; Co-founder, The Succession Fund (provides exit strategies to owners of privately held companies), 1998-2007; Adjunct Professor of Finance, Kelley School of Business, Indiana University, 1993-2007; Senior Vice President, Sara Lee Corporation, 1991-1993; Senior Vice President and Chief Financial Officer, Beatrice Foods Company, 1984-1990; Vice President, Esmark, Inc., 1973-1984; Associate, Price Waterhouse, 1968-1972 | | | 124 | | | Director, The Finish Line (athletic shoes and apparel) since July 2003; Director, International Textile Corp. since 2012; Director, hhgregg since May, 2015; former Director, Cobra Electronics Corporation (electronic equipment manufacturer), 1994-August 2014; former Director, Spectrum Brands, Inc. (consumer products), 2002-2009; former Director, Simmons Company (bedding), 2004-2010; former Trustee, BofA Funds Series Trust (11 funds), 2009-2011; former Director, McMoRan Exploration Company (oil and gas exploration and development), 2010-2013 | |
Patricia M. Flynn
901 S. Marquette Ave.
Minneapolis, MN 55402
1950 | | Trustee since 11/04 for RiverSource Funds and since 6/11 for Nations Funds | | Trustee Professor of Economics and Management, Bentley University since 1976 (also teaches and conducts research on corporate governance); Dean, McCallum Graduate School of Business, Bentley University, 1992-2002 | | | 124 | | | Trustee, MA Taxpayers Foundation since 1997; Board of Governors, Innovation Institute, MA Technology Collaborative since 2010 | |
William A. Hawkins
901 S. Marquette Ave.
Minneapolis, MN 55402
1942 | | Chair of the Board since 11/15; Trustee since 6/11 for RiverSource Funds and since 1/05 for Nations Funds | | Managing Director, Overton Partners (financial consulting) since August 2010; President and Chief Executive Officer, California General Bank, N.A., January 2008-August 2010; Operation Hope, COO, 2004-2007; IndyMac Bancorp, President, CBG, 1999-2003; American General Bank, President, 1997-1999; Griffin Financial Services, CEO, 1981-1997; The Griffin Funds, CEO, 1992-1998 | | | 124 | | | Former Trustee, BofA Funds Series Trust (11 funds), 2009-2015 | |
R. Glenn Hilliard
901 S. Marquette Ave.
Minneapolis, MN 55402
1943 | | Trustee since 6/11 for RiverSource Funds and since 1/05 for Nations Funds | | Chairman and Chief Executive Officer, Hilliard Group LLC (investing and consulting) since April 2003; Non-Executive Director & Chairman, CNO Financial Group, Inc. (insurance), 2003-2011; Chair & CEO, ING Americas, 1996-2003 | | | 122 | | | Chairman, BofA Funds Series Trust (11 funds); former Director, CNO Financial Group, Inc. (insurance), 2003-2011 | |
Annual Report 2016
38
COLUMBIA MID CAP INDEX FUND
TRUSTEES AND OFFICERS (continued)
Independent Trustees (continued)
Name,
Address,
Year of Birth | | Position Held With
the Funds and Length of
Service | | Principal Occupation(s)
During the Past Five Years
and Other Relevant
Professional Experience | | Number of
Funds in the
Columbia
Funds Complex
Overseen | | Other Directorships
Held by Trustee
During the Past
Five Years | |
Catherine James Paglia
901 S. Marquette Ave.
Minneapolis, MN 55402
1952 | | Trustee since 11/04 for RiverSource Funds and since 6/11 for Nations Funds | | Director, Enterprise Asset Management, Inc. (private real estate and asset management company) since September 1998; Managing Director and Partner, Interlaken Capital, Inc., 1989-1997; Managing Director, Morgan Stanley, 1982-1989; Vice President, Investment Banking, 1980-1982, Associate, Investment Banking, 1976-1980, Dean Witter Reynolds, Inc. | | | 124 | | | Director, Valmont Industries, Inc. (irrigation systems manufacturer) since 2012; Trustee, Carleton College (on the Investment Committee); Trustee, Carnegie Endowment for International Peace (on the Investment Committee) | |
Leroy C. Richie
901 S. Marquette Ave.
Minneapolis, MN 55402
1941 | | Trustee since 2000 for Seligman Funds, since 11/08 for RiverSource Funds and since 6/11 for Nations Funds | | Counsel, Lewis & Munday, P.C. (law firm) since 2004; Vice President and General Counsel, Automotive Legal Affairs, Chrysler Corporation, 1993-1997 | | | 122 | | | Lead Outside Director, Infinity Resources, Inc. (oil and gas exploration and production) since 1994; Lead Outside Director, Digital Ally, Inc. (digital imaging) since September 2005; Trustee, Marygrove College (Chair of Finance Committee) since 2007; former Director, OGE Energy Corp. (energy and energy services), 2007-2014 | |
Minor M. Shaw
901 S. Marquette Ave.
Minneapolis, MN 55402
1947 | | Trustee since 6/11 for RiverSource Funds and since 2003 for Nations Funds | | President, Micco LLC (private investments) since 2011; President, Micco Corp. (family investment business), 1998-2011 | | | 124 | | | Director, Piedmont Natural Gas; Director, BlueCross BlueShield of South Carolina since April 2008; Chair of the Duke Endowment; Director, National Association of Corporate Directors, Carolinas Chapter since 2013; Chair of Greenville — Spartanburg Airport Commission; former Trustee, BofA Funds Series Trust (11 funds), 2003-2011 | |
Alison Taunton-Rigby
901 S. Marquette Ave.
Minneapolis, MN 55402
1944 | | Trustee since 11/02 for RiverSource Funds and since 6/11 for Nations Funds | | Managing Director, Forester Biotech (consulting), 2001-2003; Chief Executive Officer and Director, RiboNovix, Inc., (biotechnology), 2003-2010; President and Chief Executive Officer of CMT Inc., 2001-2003; Aquila Biopharmaceuticals Inc., 1996-2000; Cambridge Biotech Corporation, 1995-1996; Mitotix Inc., 1993-1994 | | | 124 | | | Director, Abt Associates (government contractor) since 2001; Director, Boston Children's Hospital since 2002; Director, Healthways, Inc. (health and well-being solutions) since 2005; Director, ICI Mutual Insurance Company since 2011 | |
Annual Report 2016
39
COLUMBIA MID CAP INDEX FUND
TRUSTEES AND OFFICERS (continued)
Interested Trustee Not Affiliated with Investment Manager*
Name,
Address,
Year of Birth | | Position Held With
Funds and Length of
Service | | Principal Occupation(s)
During Past Five Years
and Other Relevant
Professional Experience | | Number of
Funds in the
Fund Family
Overseen by
Board Member | | Other Present or Past
Directorships/
Trusteeships
(Within Past 5 Years) | |
Anthony M. Santomero
901 S. Marquette Ave.
Minneapolis, MN 55402
1946 | | Trustee since 6/11 for RiverSource Funds and since 1/08 for Nations Funds | | Richard K. Mellon Professor Emeritus of Finance, The Wharton School, University of Pennsylvania since 2002; Senior Advisor, McKinsey & Company (consulting), 2006-2008; President, Federal Reserve Bank of Philadelphia, 2000-2006; Professor of Finance, The Wharton School, University of Pennsylvania, 1972-2002 | | | 122 | | | Trustee, Penn Mutual Life Insurance Company since March 2008; Director, Renaissance Reinsurance Ltd. since May 2008; Director, Citigroup Inc. since 2009; Director, Citibank, N.A. since 2009; former Trustee, BofA Funds Series Trust (11 funds), 2008-2011 | |
* Dr. Santomero is not an affiliated person of the Investment Manager or Ameriprise Financial. However, he is currently deemed by the Funds to be an "interested person" (as defined in the 1940 Act) of the Funds because he serves as a Director of Citigroup Inc. and Citibank, N.A., companies that may directly or through subsidiaries and affiliates engage from time-to-time in brokerage execution, principal transactions and lending relationships with the Funds or accounts advised/managed by the Investment Manager.
Annual Report 2016
40
COLUMBIA MID CAP INDEX FUND
TRUSTEES AND OFFICERS (continued)
Interested Trustee Affiliated with Investment Manager*
Name,
Address,
Year of Birth | | Position Held With
the Funds and Length of
Service | | Principal Occupation(s)
During Past Five Years
and Other Relevant
Professional Experience | | Number of
Funds in the
Columbia
Funds Complex
Overseen | | Other Directorships
Held by Trustee
During the Past
Five Years | |
William F. Truscott
c/o Columbia Management Investment Advisers, LLC,
225 Franklin St.
Boston, MA 02110
1960 | | Trustee since 11/01 for RiverSource Funds and since 6/11 for Nations Funds; Senior Vice President since 2002 for RiverSource Funds and since 5/10 for Nations Funds | | Chairman of the Board and President, Columbia Management Investment Advisers, LLC since May 2010 and February 2012, respectively (previously President and Chief Investment Officer, 2001-April 2010); Chief Executive Officer, Global Asset Management, Ameriprise Financial, Inc. since September 2012 (previously Chief Executive Officer, U.S. Asset Management & President, Annuities, May 2010-September 2012 and President — U.S. Asset Management and Chief Investment Officer, 2005-April 2010); Director and Chief Executive Officer, Columbia Management Investment Distributors, Inc. since May 2010 and February 2012, respectively (previously Chairman of the Board and Chief Executive Officer, 2006-April 2010); Chairman of the Board and Chief Executive Officer, RiverSource Distributors, Inc. since 2006; Director, Threadneedle Asset Management Holdings, SARL since 2014; President and Chief Executive Officer, Ameriprise Certificate Company, 2006-August 2012. | | | 182 | | | Chairman of the Board, Columbia Management Investment Advisers, LLC since May 2010; Director, Columbia Management Investment Distributors, Inc. since May 2010; Former Director, Ameriprise Certificate Company, 2006-January 2013 | |
* Interested person (as defined under the 1940 Act) by reason of being an officer, director, security holder and/or employee of the Investment Manager or Ameriprise Financial.
The Statement of Additional Information has additional information about the Fund's Board members and is available, without charge, upon request by calling 800.345.6611; contacting your financial intermediary; or visiting columbiathreadneedle.com/us.
Annual Report 2016
41
COLUMBIA MID CAP INDEX FUND
TRUSTEES AND OFFICERS (continued)
The Board has appointed officers who are responsible for day-to-day business decisions based on policies it has established. The officers serve at the pleasure of the Board. The following table provides basic information about the Officers of the Fund, including principal occupations during the past five years, although their specific titles may have varied over the period. In addition to Mr. Truscott, who is Senior Vice President, the Fund's other officers are:
Fund Officers
Name,
Address and
Year of Birth | | Position and Year
First Appointed to
Position for any Fund
in the Columbia
Funds Complex or a
Predecessor Thereof | | Principal Occupation(s) During Past Five Years | |
Christopher O. Petersen
5228 Ameriprise
Financial Center
Minneapolis, MN 55474
Born 1970 | | President and Principal Executive Officer (2015) | | Vice President and Lead Chief Counsel, Ameriprise Financial, Inc. since January 2015 (previously, Vice President and Chief Counsel January 2010-December 2014; and Vice President and Group Counsel or Counsel 2004-January 2010); officer of Columbia Funds and affiliated funds since 2007. | |
Michael G. Clarke
225 Franklin Street
Boston, MA 02110
Born 1969 | | Treasurer (2011), Chief Financial Officer (2009) and Chief Accounting Officer (2015) | | Vice President — Mutual Fund Administration, Columbia Management Investment Advisers, LLC, since May 2010; Managing Director of Fund Administration, Columbia Management Advisors, LLC, September 2004-April 2010; senior officer of Columbia Funds and affiliated funds since 2002. | |
Paul B. Goucher
100 Park Avenue
New York, NY 10017
Born 1968 | | Senior Vice President (2011), Chief Legal Officer (2015) and Assistant Secretary (2008) | | Vice President and Lead Chief Counsel, Ameriprise Financial, Inc. since November 2008 and January 2013, respectively (previously Chief Counsel, January 2010-January 2013 and Group Counsel, November 2008-January 2010). | |
Thomas P. McGuire
225 Franklin Street
Boston, MA 02110
Born 1972 | | Senior Vice President and Chief Compliance Officer (2012) | | Vice President — Asset Management Compliance, Ameriprise Financial, Inc., since May 2010; Chief Compliance Officer, Ameriprise Certificate Company since September 2010; Compliance Executive, Bank of America, 2005-April 2010. | |
Colin Moore
225 Franklin Street
Boston, MA 02110
Born 1958 | | Senior Vice President (2010) | | Executive Vice President and Global Chief Investment Officer, Ameriprise Financial, Inc., since July 2013; Director and Global Chief Investment Officer, Columbia Management Investment Advisers, LLC since May 2010; Manager, Managing Director and Chief Investment Officer, Columbia Management Advisors, LLC, 2007-April 2010. | |
Michael E. DeFao
225 Franklin Street
Boston, MA 02110
Born 1968 | | Vice President (2011) and Assistant Secretary (2010) | | Vice President and Chief Counsel, Ameriprise Financial, Inc. since May 2010; Associate General Counsel, Bank of America, 2005-April 2010. | |
Amy Johnson
5228 Ameriprise
Financial Center
Minneapolis, MN 55474
Born 1965 | | Vice President (2006) | | Managing Director and Chief Operating Officer, Columbia Management Investment Advisers, LLC since May 2010 (previously Chief Administrative Officer, 2009-April 2010, and Vice President — Asset Management and Trust Company Services, 2006-2009). | |
Lyn Kephart-Strong
5228 Ameriprise
Financial Center
Minneapolis, MN 55474
Born 1960 | | Vice President (2015) | | President, Columbia Management Investment Services Corp. since October 2014; Vice President & Resolution Officer, Ameriprise Trust Company since August 2009; President, RiverSource Service Corporation 2004-2010. | |
Ryan C. Larrenaga
225 Franklin Street
Boston, MA 02110
Born 1970 | | Vice President and Secretary (2015) | | Vice President and Group Counsel, Ameriprise Financial, Inc. since August 2011 (previously, Counsel from May 2010 to August 2011); Assistant General Counsel, Bank of America, 2005-April 2010; officer of Columbia Funds and affiliated funds since 2005. | |
Annual Report 2016
42
COLUMBIA MID CAP INDEX FUND
IMPORTANT INFORMATION ABOUT THIS REPORT
Each fund mails one shareholder report to each shareholder address. If you would like more than one report, please call shareholder services at 800.345.6611 and additional reports will be sent to you.
The policy of the Board is to vote the proxies of the companies in which each fund holds investments consistent with the procedures as stated in the Statement of Additional Information (SAI). You may obtain a copy of the SAI without charge by calling 800.345.6611; contacting your financial intermediary; visiting columbiathreadneedle.com/us; or searching the website of the Securities and Exchange Commission (SEC) at sec.gov. Information regarding how each fund voted proxies relating to portfolio securities is filed with the SEC by August 31st for the most recent 12-month period ending June 30th of that year, and is available without charge by visiting columbiathreadneedle.com/us, or searching the website of the SEC at sec.gov.
Each fund files a complete schedule of portfolio holdings with the SEC for the first and third quarters of each fiscal year on Form N-Q. Each fund's Form N-Q is available on the SEC's website at sec.gov and may be reviewed and copied at the SEC's Public Reference Room in Washington, D.C. Information on the operation of the Public Reference Room may be obtained by calling 800.SEC.0330. Each fund's complete schedule of portfolio holdings, as filed on Form N-Q, can also be obtained without charge, upon request, by calling 800.345.6611.
Annual Report 2016
43
Columbia Mid Cap Index Fund
P.O. Box 8081
Boston, MA 02266-8081

This information is for use with concurrent or prior delivery of a fund prospectus. Please read and consider the investment objectives, risks, charges and expenses for any fund carefully before investing. For a prospectus and summary prospectus, which contains this and other important information about the Fund, go to columbiathreadneedle.com/us. The Fund is distributed by Columbia Management Investment Distributors, Inc., member FINRA, and managed by Columbia Management Investment Advisers, LLC.
Columbia Threadneedle Investments (Columbia Threadneedle) is the global brand name of the Columbia and Threadneedle group of companies.
All rights reserved. Columbia Management Investment Distributors, Inc., 225 Franklin Street, Boston, MA 02110-2804
© 2016 Columbia Management Investment Advisers, LLC.
columbiathreadneedle.com/us
ANN196_02_F01_(04/16)

ANNUAL REPORT
February 29, 2016

COLUMBIA OVERSEAS VALUE FUND

ABOUT COLUMBIA THREADNEEDLE INVESTMENTS
Columbia Threadneedle Investments is a leading global asset management group that provides a broad range of actively managed investment strategies and solutions for individual, institutional and corporate clients around the world.
With more than 2,000 people, including over 450 investment professionals based in North America, Europe and Asia, we manage $472 billion* of assets across developed and emerging market equities, fixed income, asset allocation solutions and alternatives. We are the 13th largest manager of long-term mutual fund assets in the U.S.** and the 4th largest manager of retail funds in the U.K.***
Our priority is the investment success of our clients. We aim to deliver the investment outcomes they expect through an investment approach that is team-based, performance-driven and risk-aware. Our culture is dynamic and interactive. By sharing our insights across asset classes and geographies, we generate richer perspectives on global, regional and local investment landscapes. The ability to exchange and debate investment ideas in a collaborative environment enriches our teams' investment processes. More importantly, it results in better informed investment decisions for our clients.
Columbia funds are distributed by Columbia Management Investment Distributors, Inc., member FINRA, and managed by Columbia Management Investment Advisers, LLC.
Columbia Threadneedle Investments (Columbia Threadneedle) is the global brand name of the Columbia and Threadneedle group of companies.
* In U.S. dollars as of December 31, 2015. Source: Ameriprise Q4 Earnings Release. Includes all assets managed by entities in the Columbia and Threadneedle groups of companies. Contact us for more current data.
** Source: ICI as of December 31, 2015 for Columbia Management Investment Advisers, LLC.
*** Source: Investment Association as of September 2015 for Threadneedle Asset Management Limited.
© 2016 Columbia Management Investment Advisers, LLC. All rights reserved.
Not part of the shareholder report
Investment strategies to help meet investor needs
We are committed to helping investors navigate financial challenges to reach their desired outcomes. The possibilities are endless.
Your success is our priority.
Retire comfortably
Fund college or higher education
Leave a legacy
Generate an appropriate stream of income in retirement
Traditional approaches to income may no longer be adequate — and they may no longer provide the diversification benefits they once did. Investors need to rethink how they generate retirement income.
Worried about running out of income? You are not alone.
Navigate a changing interest rate environment
Even in today's challenging interest rate environment, it's still possible to navigate markets and achieve your goals.
Make investment choices designed specifically for this market environment.
Maximize after-tax returns
In an environment where what you keep is more important than what you earn, municipal bonds can help mitigate higher taxes while providing attractive yields compared to other investment options.
You've worked too hard building your wealth to lose it to taxes.
Grow assets to achieve financial goals
Finding growth opportunities in today's complex market environment requires strong research capabilities, creative thinking and a disciplined approach.
Do your investments deliver the portfolio growth you need?
Ease the impact of volatile markets
With increasing concerns about market volatility, investors should consider diversifying their portfolios with non-traditional holdings.
Interested in turning volatility into opportunity?
To find out more, contact your financial professional, call 800.426.3750 or visit columbiathreadneedle.com/us
Not part of the shareholder report
Get the market insight you need from our investment experts and subscribe to our latest publications
Stay informed with Columbia Threadneedle Investments
Investor insight
Find economic and market commentary, investment videos, white papers, mutual fund commentary and more at columbiathreadneedle.com/us.
Subscribe to the latest information from Columbia Threadneedle. Register your information online at columbiathreadneedle.com/us/subscribe and select the publications you would like to receive, including:
n Columbia Threadneedle Investor Newsletter, highlighting the latest macro- and micro-economic trends, investment themes, products, service changes and other items of interest to our investors
n Investment Strategy Outlook, showcasing the Columbia Threadneedle Asset Allocation Team's perspective on global economic investment conditions and markets
n MarketTrack, featuring straightforward insight on current investment opportunities
n White papers that delve deep into a variety of investment topics
n Quarterly portfolio manager commentary and fund fact sheets
Update your subscriptions at any time by accessing the email subscription center.
Social media
We offer you multiple ways to access our market commentary and investment insights.
n Perspectives blog at columbiathreadneedle.com/us
Read timely posts by our investment team, including our chief investment officer, chief economist and portfolio managers.
n Twitter.com/CTinvest_US
Follow us on Twitter for quick, up-to-the-minute comments on market news and more.
n Youtube.com/CTInvestUS
View our commentaries on the economy, markets and current investment opportunities.
n Linkedin.com/company/Columbia-Threadneedle-Investments-US
Connect with us on LinkedIn for updates from our thought leaders.
Not part of the shareholder report
 Dear Shareholder,
Today's investors are typically focused on outcomes, like living a certain retirement lifestyle, paying for college education or building a legacy. But in today's complex global investment landscape, even simple goals are not easily achieved.
At Columbia Threadneedle Investments, we aspire to help satisfy five core needs of today's investors:
n Generate an appropriate stream of income in retirement
Traditional approaches to generating income may not provide the diversification benefits they once did, and they may actually introduce unwanted risk in today's market. To seek to improve your potential to live comfortably long term, we endeavor to pursue investments that explore less traveled paths to income.
n Navigate a changing interest rate environment
Today's uncertain market environment includes the prospect of a rise in interest rates. Blending traditional investments with non-traditional or alternative products may help protect your wealth during periods of volatility. We can attempt to help strengthen your portfolio with agile products designed to take on the market's ups and downs.
n Maximize after-tax returns
In an environment where what you keep may be more important than what you earn, municipal bonds can help mitigate high tax burdens while providing potentially attractive yields. Our state and federal tax-exempt products are aimed at helping investors manage risk, minimize the fluctuation of capital and grow wealth on a more tax-efficient basis.
n Grow assets to achieve financial goals
We believe that finding and protecting growth comes from a disciplined security selection process designed to create excess return. Our goal is to provide investment solutions built to help you face today's market challenges and grow your assets at each crossroad of your journey.
n Ease the impact of volatile markets
Despite a bull market run that has benefited many investors over the past several years, it's important to remember the lessons of 2008 and the value that a well-diversified portfolio may provide through times of market volatility. We are here to help you hold onto the savings you have worked tirelessly to amass, and to provide you the best opportunity to maintain your standard of living regardless of market conditions.
Find out today how we can help you confidently invest to realize your dreams. Please visit us at blog.columbiathreadneedleus.com/our-best-ideas to learn more about our unique investment solutions.
The world is constantly changing, but our priority remains the same: to help you secure your finances, meet your goals and achieve success. Thank you for your continued investment with us.
Sincerely,

Christopher O. Petersen
President, Columbia Funds
Investors should consider the investment objectives, risks, charges and expenses of a mutual fund carefully before investing. For a free prospectus and summary prospectus, which contains this and other important information about a fund, visit columbiathreadneedle.com/us. The prospectus should be read carefully before investing.
Columbia Funds are distributed by Columbia Management Investment Distributors, Inc., member FINRA, and managed by Columbia Management Investment Advisers, LLC.
© 2016 Columbia Management Investment Advisers, LLC. All rights reserved.
COLUMBIA OVERSEAS VALUE FUND
Fund Investment Manager
Columbia Management Investment
Advisers, LLC
225 Franklin Street
Boston, MA 02110
Fund Distributor
Columbia Management Investment
Distributors, Inc.
225 Franklin Street
Boston, MA 02110
Fund Transfer Agent
Columbia Management Investment
Services Corp.
P.O. Box 8081
Boston, MA 02266-8081
For more information about any of the funds, please visit columbiathreadneedle.com/us or call 800.345.6611. Customer Service Representatives are available to answer your questions Monday through Friday from 8 a.m. to 7 p.m. Eastern time.
The views expressed in this report reflect the current views of the respective parties. These views are not guarantees of future performance and involve certain risks, uncertainties and assumptions that are difficult to predict, so actual outcomes and results may differ significantly from the views expressed. These views are subject to change at any time based upon economic, market or other conditions and the respective parties disclaim any responsibility to update such views. These views may not be relied on as investment advice and, because investment decisions for a Columbia fund are based on numerous factors, may not be relied on as an indication of trading intent on behalf of any particular Columbia fund. References to specific securities should not be construed as a recommendation or investment advice.
Performance Overview | | | 3 | | |
Manager Discussion of Fund Performance | | | 5 | | |
Understanding Your Fund's Expenses | | | 8 | | |
Portfolio of Investments | | | 9 | | |
Statement of Assets and Liabilities | | | 16 | | |
Statement of Operations | | | 18 | | |
Statement of Changes in Net Assets | | | 19 | | |
Financial Highlights | | | 22 | | |
Notes to Financial Statements | | | 32 | | |
Report of Independent Registered Public Accounting Firm | | | 43 | | |
Federal Income Tax Information | | | 44 | | |
Trustees and Officers | | | 45 | | |
Important Information About This Report | | | 51 | | |
COLUMBIA OVERSEAS VALUE FUND
Performance Summary
n Columbia Overseas Value Fund (the Fund) Class A shares returned -11.95% excluding sales charges for the 12-month period that ended February 29, 2016.
n In a difficult period for stock markets around the world, the Fund outperformed its benchmark, the MSCI EAFE Value Index (Net), which returned -19.82% for the same period.
n Stock selection across countries and sectors generally accounted for the Fund's performance advantage relative to the benchmark.
Average Annual Total Returns (%) (for period ended February 29, 2016)
| | | Inception | | 1 Year | | 5 Years | | Life | |
Class A* | | 02/28/13 | | | | | | | | | | | | | |
Excluding sales charges | | | | | | | -11.95 | | | | 0.98 | | | | -1.11 | | |
Including sales charges | | | | | | | -17.04 | | | | -0.21 | | | | -1.85 | | |
Class B* | | 02/28/13 | | | | | | | | | | | | | |
Excluding sales charges | | | | | | | -12.66 | | | | 0.22 | | | | -1.86 | | |
Including sales charges | | | | | | | -16.97 | | | | -0.16 | | | | -1.86 | | |
Class C* | | 02/28/13 | | | | | | | | | | | | | |
Excluding sales charges | | | | | | | -12.66 | | | | 0.22 | | | | -1.86 | | |
Including sales charges | | | | | | | -13.52 | | | | 0.22 | | | | -1.86 | | |
Class I* | | 03/31/11 | | | -11.57 | | | | 1.50 | | | | -0.58 | | |
Class K* | | 02/28/13 | | | -11.80 | | | | 1.06 | | | | -1.08 | | |
Class R4* | | 07/01/15 | | | -11.83 | | | | 1.33 | | | | -0.68 | | |
Class R5* | | 07/01/15 | | | -11.81 | | | | 1.33 | | | | -0.68 | | |
Class W* | | 03/31/11 | | | -11.97 | | | | 1.10 | | | | -0.86 | | |
Class Y* | | 07/01/15 | | | -11.74 | | | | 1.35 | | | | -0.67 | | |
Class Z | | 03/31/08 | | | -11.87 | | | | 1.32 | | | | -0.69 | | |
MSCI EAFE Value Index (Net) | | | | | | | -19.82 | | | | -1.12 | | | | -1.65 | | |
Returns for Class A are shown with and without the maximum initial sales charge of 5.75%. Returns for Class B are shown with and without the applicable contingent deferred sales charge (CDSC) of 5.00% in the first year, declining to 1.00% in the sixth year and eliminated thereafter. Returns for Class C are shown with and without the 1.00% CDSC for the first year only. The Fund's other classes are not subject to sales charges and have limited eligibility. Please see the Fund's prospectus for details. Performance for different share classes will vary based on differences in sales charges and fees associated with each class. All results shown assume reinvestment of distributions during the period. Returns do not reflect the deduction of taxes that a shareholder may pay on Fund distributions or on the redemption of Fund shares. Performance results reflect the effect of any fee waivers or reimbursements of Fund expenses by Columbia Management Investment Advisers, LLC and/or any of its affiliates. Absent these fee waivers or expense reimbursement arrangements, performance results would have been lower.
The performance information shown represents past performance and is not a guarantee of future results. The investment return and principal value of your investment will fluctuate so that your shares, when redeemed, may be worth more or less than their original cost. Current performance may be lower or higher than the performance information shown. You may obtain performance information current to the most recent month-end by contacting your financial intermediary, visiting columbiathreadneedle.com/us or calling 800.345.6611.
*The returns shown for periods prior to the share class inception date (including returns for the Life of the Fund, if shown, which are since Fund inception) include the returns of the Fund's oldest share class. These returns are adjusted to reflect any higher class-related operating expenses of the newer share classes, as applicable. Please visit columbiathreadneedle.com/us/investment-products/mutual-funds/ appended-performance for more information.
The MSCI EAFE Value Index (Net) is a subset of the MSCI EAFE Index (Net), and constituents of the index include securities from Europe, Australasia and the Far East. The index generally represents approximately 50% of the free float-adjusted market capitalization of the MSCI EAFE Index (Net), and consists of those securities classified by MSCI Inc. as most representing the value style, such as, higher book value-to-price ratios, higher forward earnings-to-price ratios, higher dividend yields and lower forecasted growth rates than securities representing the growth style.
Indices are not available for investment, are not professionally managed and do not reflect sales charges, fees, brokerage commissions, taxes (except the MSCI EAFE Value Index (Net), which reflects reinvested dividends net of withholding taxes) or other expenses of investing. Securities in the Fund may not match those in an index.
Annual Report 2016
3
COLUMBIA OVERSEAS VALUE FUND
PERFORMANCE OVERVIEW (continued)
Performance of a Hypothetical $10,000 Investment (March 31, 2008 – February 29, 2016)

The chart above shows the change in value of a hypothetical $10,000 investment in Class A shares of Columbia Overseas Value Fund during the stated time period, and does not reflect the deduction of taxes that a shareholder may pay on Fund distributions or on the redemption of Fund shares.
Annual Report 2016
4
COLUMBIA OVERSEAS VALUE FUND
MANAGER DISCUSSION OF FUND PERFORMANCE
At February 29, 2016, approximately 44% of the Fund's shares were owned in the aggregate by affiliated funds-of-funds managed by Columbia Management Investment Advisers, LLC (the Investment Manager). As a result of asset allocation decisions by the Investment Manager, it is possible that the Fund may experience relatively large purchases or redemptions from affiliated funds-of-funds. The Investment Manager seeks to minimize the impact of these transactions by structuring them over a reasonable period of time. The Fund may experience increased expenses as it buys and sells securities as a result of purchases or redemptions by affiliated funds-of-funds.
For the 12-month period that ended February 29, 2016, the Fund's Class A shares returned -11.95% excluding sales charges. In a difficult period for stock markets around the world, the Fund outperformed its benchmark, the MSCI EAFE Value Index (Net), which returned -19.82% for the same period. Stock selection across countries and sectors heavily weighted in the portfolio generally accounted for the Fund's performance advantage relative to the benchmark.
Market Concerns Weighed on Global Stock Markets
Equity markets in developed countries outside the United States began the 12-month period with modestly positive performance against a favorable backdrop of improving growth across Europe and Japan. Oil's dramatic price decline, which began in the second half of 2014, provided a boost to importing countries and weaker currencies helped the export segment of the market. These tailwinds were more than sufficient to overcome concerns about Greek solvency, civil war in the Ukraine and unrest in the Middle East. However, international markets began a sharp, volatile and sustained drop midway through the period as tensions in Greece continued, commodity prices plummeted and slow global growth drove investor uncertainty. Many sovereign bonds traded at negative yields, an aberration that was considered symptomatic of deep underlying instability in the global financial system. Despite a brief rally in the fourth quarter of 2015, international equities finished the period down sharply as the weight of these concerns dampened market sentiment. Of the 21 developed markets in the MSCI EAFE Index (Net), only Denmark and Israel posted modest positive returns, as measured in U.S. dollars. International growth stocks held up better during the period, finishing down only about half as much as international value stocks, in large part because the value segment has more exposure to consumer staples stocks, which lagged, and less exposure to financials, which performed strongly.
Contributors and Detractors
Security selection was especially strong in the United Kingdom and Japan, which together constitute nearly half of the Fund's benchmark, as well as in a number of European countries that collectively account for an additional 20% of the benchmark. Stock selection was decidedly positive in nine of 10 economic sectors. From a sector perspective, top contributors included information technology, financials, consumer discretionary, industrials and telecommunication services. Top-performing securities during the period included Paysafe, a U.K.-based online
Portfolio Management
Fred Copper, CFA
Daisuke Nomoto, CMA (SAAJ)
Morningstar Style BoxTM
The Morningstar Style BoxTM is based on a fund's portfolio holdings. For equity funds, the vertical axis shows the market capitalization of the stocks owned, and the horizontal axis shows investment style (value, blend, or growth). Information shown is based on the most recent data provided by Morningstar.
© 2016 Morningstar, Inc. All rights reserved. The Morningstar information contained herein: (1) is proprietary to Morningstar and/or its content providers; (2) may not be copied or distributed; and (3) is not warranted to be accurate, complete or timely. Neither Morningstar nor its content providers are responsible for any damages or losses arising from any use of this information.
Top Ten Holdings (%)
(at February 29, 2016) | |
Royal Dutch Shell PLC, Class B
(United Kingdom) | | | 3.9 | | |
Sanofi (France) | | | 2.4 | | |
Allianz SE, Registered Shares
(Germany) | | | 2.1 | | |
AXA SA (France) | | | 2.1 | | |
HSBC Holdings PLC
(United Kingdom) | | | 2.0 | | |
BNP Paribas SA (France) | | | 2.0 | | |
ING Groep NV-CVA
(Netherlands) | | | 1.9 | | |
Paysafe Group PLC
(United Kingdom) | | | 1.7 | | |
Daiichikosho Co., Ltd. (Japan) | | | 1.7 | | |
Iberdrola SA (Spain) | | | 1.7 | | |
Percentages indicated are based upon total investments (excluding Money Market Funds).
Annual Report 2016
5
COLUMBIA OVERSEAS VALUE FUND
MANAGER DISCUSSION OF FUND PERFORMANCE (continued)
For further detail about these holdings, please refer to the section entitled "Portfolio of Investments."
Fund holdings are as of the date given, are subject to change at any time, and are not recommendations to buy or sell any security.
Country Breakdown (%)
(at February 29, 2016) | |
Australia | | | 1.6 | | |
Belgium | | | 1.2 | | |
China | | | 1.7 | | |
Denmark | | | 0.8 | | |
France | | | 10.8 | | |
Germany | | | 5.5 | | |
Hong Kong | | | 1.0 | | |
Ireland | | | 1.1 | | |
Israel | | | 1.3 | | |
Italy | | | 2.2 | | |
Japan | | | 24.6 | | |
Netherlands | | | 3.0 | | |
Norway | | | 5.8 | | |
Pakistan | | | 0.7 | | |
Portugal | | | 0.0 | (a) | |
Singapore | | | 1.4 | | |
South Korea | | | 1.8 | | |
Spain | | | 4.5 | | |
Sweden | | | 3.3 | | |
Switzerland | | | 5.3 | | |
United Kingdom | | | 18.0 | | |
United States(b) | | | 4.4 | | |
Total | | | 100.0 | | |
Country Breakdown is based primarily on issuer's place of organization/incorporation. Percentages indicated are based upon total investments. The Fund's portfolio composition is subject to change.
(a) Rounds to zero.
(b) Includes investments in Money Market Funds and Exchange-Traded Funds.
payment processing and money transfer provider that rose based on the successful acquisition of a digital payments business, strong results and solid growth forecasts; Bezeq Israel Telecommunication Corp., a Tel Aviv-based telecommunications services provider that was rewarded by investors primarily for strong dividend growth; and Daiichikosho, a Tokyo-based provider of commercial karaoke equipment, which rose strongly after forecasting an increased dividend. All three stocks were held by the Fund at period end, although we modestly trimmed position sizes in keeping with our risk-management process.
Holdings in the United States, France and Singapore detracted from results, with the most significant disappointments in health care, utilities and consumer staples. Country and sector exposures reflect the Fund's bottom-up stock selection process more so than readily identifiable country- or sector-wide themes. Key individual detractors included Casino Guichard Perrachon, Plus500 and BHP Billiton. Casino Guichard Perrachon, a global food retailer based in France, fell as investors questioned its deleveraging plan and future growth prospects in various emerging markets. We maintained our conviction in the company and increased Fund exposure to the stock. Late in the period and after the stock had dropped as the result of operational issues, the Fund established a position in Plus500, an Israel-based online trading platform operating primarily in the United Kingdom. We maintained a small position in Plus500 based on our belief that the company had adequately addressed its issues. BHP Billiton, a London-based mining company, fell in concert with the global downturn in commodities, including copper and iron ore. We maintained our conviction in the company and increased exposure to the stock.
Fund Positioning at Period's End
Although certain stocks may be categorized as growth based on commonly accepted metrics, we believe it is possible to find these stocks at times when they are attractively priced. Even though the Fund benefited from this strategic aspect of our investment process, it maintained its categorization as a value portfolio by external evaluators, such as Morningstar. In terms of positioning, the Fund ended the period with slightly more exposure to energy, materials and technology stocks.
Annual Report 2016
6
COLUMBIA OVERSEAS VALUE FUND
MANAGER DISCUSSION OF FUND PERFORMANCE (continued)
Equity Sector Breakdown (%)
(at February 29, 2016) | |
Consumer Discretionary | | | 12.4 | | |
Consumer Staples | | | 4.2 | | |
Energy | | | 9.7 | | |
Financials | | | 32.0 | | |
Health Care | | | 10.3 | | |
Industrials | | | 8.6 | | |
Information Technology | | | 7.7 | | |
Materials | | | 4.9 | | |
Telecommunication Services | | | 6.8 | | |
Utilities | | | 3.4 | | |
Total | | | 100.0 | | |
Percentages indicated are based upon total equity investments. The Fund's portfolio composition is subject to change.
Investment Risks
Market risk may affect a single issuer, sector of the economy, industry or the market as a whole. Value securities may be unprofitable if the market fails to recognize their intrinsic worth or the portfolio manager misgauged that worth. International investing involves certain risks and volatility due to potential political, economic or currency instabilities and different financial and accounting standards. Risks are enhanced for emerging market issuers. Investing in derivatives is a specialized activity that involves special risks that subject the Fund to significant loss potential, including when used as leverage, and may result in greater fluctuation in Fund value. See the Fund's prospectus for more information on these and other risks.
Annual Report 2016
7
COLUMBIA OVERSEAS VALUE FUND
UNDERSTANDING YOUR FUND'S EXPENSES
(Unaudited)
As an investor, you incur two types of costs. There are transaction costs, which generally include sales charges on purchases and may include redemption fees. There are also ongoing costs, which generally include management fees, distribution and/or service fees, and other fund expenses. The following information is intended to help you understand your ongoing costs (in dollars) of investing in the Fund and to help you compare these costs with the ongoing costs of investing in other mutual funds.
Analyzing Your Fund's Expenses
To illustrate these ongoing costs, we have provided examples and calculated the expenses paid by investors in each share class of the Fund during the period. The actual and hypothetical information in the table is based on an initial investment of $1,000 at the beginning of the period indicated and held for the entire period. Expense information is calculated two ways and each method provides you with different information. The amount listed in the "Actual" column is calculated using the Fund's actual operating expenses and total return for the period. You may use the Actual information, together with the amount invested, to estimate the expenses that you paid over the period. Simply divide your account value by $1,000 (for example, an $8,600 account value divided by $1,000 = 8.6), then multiply the results by the expenses paid during the period under the "Actual" column. The amount listed in the "Hypothetical" column assumes a 5% annual rate of return before expenses (which is not the Fund's actual return) and then applies the Fund's actual expense ratio for the period to the hypothetical return. You should not use the hypothetical account values and expenses to estimate either your actual account balance at the end of the period or the expenses you paid during the period. See "Compare With Other Funds" below for details on how to use the hypothetical data.
Compare With Other Funds
Since all mutual funds are required to include the same hypothetical calculations about expenses in shareholder reports, you can use this information to compare the ongoing cost of investing in the Fund with other funds. To do so, compare the hypothetical example with the 5% hypothetical examples that appear in the shareholder reports of other funds. As you compare hypothetical examples of other funds, it is important to note that hypothetical examples are meant to highlight the ongoing costs of investing in a fund only and do not reflect any transaction costs, such as sales charges, or redemption or exchange fees. Therefore, the hypothetical calculations are useful in comparing ongoing costs only, and will not help you determine the relative total costs of owning different funds. If transaction costs were included in these calculations, your costs would be higher.
September 1, 2015 – February 29, 2016
| | | Account Value at the Beginning
of the Period ($) | | Account Value at the End of the
Period ($) | | Expenses Paid During the
Period ($) | | Fund's Annualized
Expense Ratio (%) | |
| | | Actual | | Hypothetical | | Actual | | Hypothetical | | Actual | | Hypothetical | | Actual | |
Class A | | | 1,000.00 | | | | 1,000.00 | | | | 908.80 | | | | 1,017.60 | | | | 6.93 | | | | 7.32 | | | | 1.46 | | |
Class B | | | 1,000.00 | | | | 1,000.00 | | | | 904.80 | | | | 1,013.87 | | | | 10.47 | | | | 11.07 | | | | 2.21 | | |
Class C | | | 1,000.00 | | | | 1,000.00 | | | | 904.80 | | | | 1,013.87 | | | | 10.47 | | | | 11.07 | | | | 2.21 | | |
Class I | | | 1,000.00 | | | | 1,000.00 | | | | 910.60 | | | | 1,020.19 | | | | 4.47 | | | | 4.72 | | | | 0.94 | | |
Class K | | | 1,000.00 | | | | 1,000.00 | | | | 909.30 | | | | 1,018.70 | | | | 5.89 | | | | 6.22 | | | | 1.24 | | |
Class R4 | | | 1,000.00 | | | | 1,000.00 | | | | 909.20 | | | | 1,018.85 | | | | 5.74 | | | | 6.07 | | | | 1.21 | | |
Class R5 | | | 1,000.00 | | | | 1,000.00 | | | | 909.40 | | | | 1,019.69 | | | | 4.94 | | | | 5.22 | | | | 1.04 | | |
Class W | | | 1,000.00 | | | | 1,000.00 | | | | 907.60 | | | | 1,017.60 | | | | 6.92 | | | | 7.32 | | | | 1.46 | | |
Class Y | | | 1,000.00 | | | | 1,000.00 | | | | 909.00 | | | | 1,020.24 | | | | 4.41 | | | | 4.67 | | | | 0.93 | | |
Class Z | | | 1,000.00 | | | | 1,000.00 | | | | 908.50 | | | | 1,018.85 | | | | 5.74 | | | | 6.07 | | | | 1.21 | | |
Expenses paid during the period are equal to the annualized expense ratio for each class as indicated above, multiplied by the average account value over the period and then multiplied by the number of days in the Fund's most recent fiscal half year and divided by 366.
Expenses do not include fees and expenses incurred indirectly by the Fund from its investment in underlying funds, including affiliated and non-affiliated pooled investment vehicles, such as mutual funds and exchange-traded funds.
Had Columbia Management Investment Advisers, LLC and/or certain of its affiliates not waived/reimbursed certain fees and expenses, account value at the end of the period would have been reduced.
Annual Report 2016
8
COLUMBIA OVERSEAS VALUE FUND
PORTFOLIO OF INVESTMENTS
February 29, 2016
(Percentages represent value of investments compared to net assets)
Common Stocks 98.5%
Issuer | | Shares | | Value ($) | |
AUSTRALIA 1.6% | |
Macquarie Group Ltd. | | | 73,156 | | | | 3,342,130 | | |
National Australia Bank Ltd. | | | 340,340 | | | | 5,853,933 | | |
Total | | | | | 9,196,063 | | |
BELGIUM 1.2% | |
KBC Groep NV | | | 131,862 | | | | 6,982,859 | | |
CHINA 1.7% | |
58.Com, Inc., ADR(a) | | | 72,081 | | | | 3,820,293 | | |
Tencent Holdings Ltd. | | | 320,500 | | | | 5,864,357 | | |
Total | | | | | 9,684,650 | | |
DENMARK 0.8% | |
Novo Nordisk A/S, Class B | | | 86,983 | | | | 4,478,291 | | |
FRANCE 10.8% | |
Aperam SA(a) | | | 173,400 | | | | 5,889,688 | | |
AXA SA | | | 526,619 | | | | 11,578,530 | | |
BNP Paribas SA | | | 237,170 | | | | 11,060,911 | | |
Casino Guichard Perrachon SA | | | 82,749 | | | | 3,725,520 | | |
CNP Assurances | | | 203,910 | | | | 3,015,524 | | |
Sanofi | | | 172,871 | | | | 13,698,004 | | |
Total SA | | | 95,342 | | | | 4,273,273 | | |
VINCI SA | | | 108,063 | | | | 7,464,052 | | |
Total | | | | | 60,705,502 | | |
GERMANY 5.5% | |
Allianz SE, Registered Shares | | | 80,154 | | | | 11,889,011 | | |
BASF SE | | | 55,744 | | | | 3,614,330 | | |
Continental AG | | | 27,732 | | | | 5,519,704 | | |
Duerr AG | | | 76,039 | | | | 4,496,378 | | |
Freenet AG | | | 120,646 | | | | 3,584,342 | | |
RWE AG | | | 182,787 | | | | 2,071,274 | | |
Total | | | | | 31,175,039 | | |
HONG KONG 1.0% | |
CK Hutchison Holdings Ltd. | | | 489,500 | | | | 5,901,837 | | |
IRELAND 1.1% | |
Amarin Corp. PLC, ADR(a) | | | 627,752 | | | | 916,518 | | |
Smurfit Kappa Group PLC | | | 217,672 | | | | 5,020,620 | | |
Total | | | | | 5,937,138 | | |
Common Stocks (continued)
Issuer | | Shares | | Value ($) | |
ISRAEL 1.3% | |
Bezeq Israeli Telecommunication
Corp., Ltd. (The) | | | 3,316,785 | | | | 7,435,802 | | |
ITALY 2.2% | |
Ei Towers SpA | | | 145,627 | | | | 8,041,121 | | |
Esprinet SpA | | | 469,655 | | | | 4,222,695 | | |
Total | | | | | 12,263,816 | | |
JAPAN 24.7% | |
Alps Electric Co., Ltd. | | | 125,400 | | | | 2,057,881 | | |
Aozora Bank Ltd. | | | 1,102,000 | | | | 3,590,353 | | |
CyberAgent, Inc. | | | 158,500 | | | | 6,504,777 | | |
CYBERDYNE, Inc.(a) | | | 73,900 | | | | 1,263,634 | | |
Daiichikosho Co., Ltd. | | | 233,200 | | | | 9,753,493 | | |
Eisai Co., Ltd. | | | 50,600 | | | | 3,118,843 | | |
Fuji Heavy Industries Ltd. | | | 217,300 | | | | 7,109,368 | | |
Hoya Corp. | | | 138,600 | | | | 5,008,559 | | |
Invincible Investment Corp. | | | 4,950 | | | | 3,254,950 | | |
ITOCHU Corp. | | | 556,800 | | | | 6,564,228 | | |
KDDI Corp. | | | 308,100 | | | | 7,871,339 | | |
Keyence Corp. | | | 9,000 | | | | 4,651,583 | | |
LaSalle Logiport REIT(a) | | | 3,800 | | | | 3,538,646 | | |
Mitsubishi UFJ Financial Group, Inc. | | | 1,782,800 | | | | 7,693,333 | | |
Nakanishi, Inc. | | | 119,400 | | | | 4,146,489 | | |
Nihon M&A Center, Inc. | | | 113,900 | | | | 5,390,202 | | |
Nippon Telegraph & Telephone Corp. | | | 196,500 | | | | 8,321,248 | | |
Nishi-Nippon City Bank Ltd. (The) | | | 1,724,000 | | | | 3,115,138 | | |
ORIX Corp. | | | 616,700 | | | | 8,073,165 | | |
Relo Holdings, Inc. | | | 37,200 | | | | 4,559,857 | | |
Shinmaywa Industries Ltd. | | | 859,000 | | | | 6,084,420 | | |
Sony Corp. | | | 177,700 | | | | 3,734,279 | | |
Sumitomo Mitsui Financial Group, Inc. | | | 188,800 | | | | 5,297,763 | | |
Takuma Co., Ltd. | | | 113,355 | | | | 990,422 | | |
Tanseisha Co., Ltd. | | | 575,050 | | | | 3,413,347 | | |
Tokio Marine Holdings, Inc. | | | 109,300 | | | | 3,810,418 | | |
Toyota Motor Corp. | | | 84,500 | | | | 4,405,627 | | |
Tsuruha Holdings, Inc. | | | 66,200 | | | | 5,598,565 | | |
Total | | | | | 138,921,927 | | |
The accompanying Notes to Financial Statements are an integral part of this statement.
Annual Report 2016
9
COLUMBIA OVERSEAS VALUE FUND
PORTFOLIO OF INVESTMENTS (continued)
February 29, 2016
Common Stocks (continued)
Issuer | | Shares | | Value ($) | |
NETHERLANDS 3.0% | |
ING Groep NV-CVA | | | 913,178 | | | | 10,886,306 | | |
Koninklijke Ahold NV | | | 275,280 | | | | 6,027,914 | | |
Total | | | | | 16,914,220 | | |
NORWAY 5.8% | |
Atea ASA | | | 472,392 | | | | 4,117,833 | | |
BW LPG Ltd. | | | 1,423,821 | | | | 9,241,791 | | |
Kongsberg Automotive ASA(a) | | | 10,052,789 | | | | 8,016,818 | | |
Leroy Seafood Group ASA | | | 73,465 | | | | 3,086,390 | | |
Spectrum ASA | | | 300,423 | | | | 845,776 | | |
Tanker Investments Ltd.(a) | | | 735,799 | | | | 7,139,453 | | |
Total | | | | | 32,448,061 | | |
PAKISTAN 0.7% | |
DG Khan Cement Co., Ltd. | | | 2,656,000 | | | | 3,967,217 | | |
PORTUGAL —% | |
Banco Espirito Santo SA, Registered
Shares(a)(b)(c) | | | 2,753,345 | | | | 89,857 | | |
SINGAPORE 1.4% | |
DBS Group Holdings Ltd. | | | 835,700 | | | | 8,049,069 | | |
SOUTH KOREA 1.8% | |
GS Home Shopping, Inc. | | | 18,820 | | | | 2,796,359 | | |
Hyundai Home Shopping Network Corp. | | | 45,717 | | | | 4,697,622 | | |
LF Corp. | | | 127,816 | | | | 2,586,409 | | |
Total | | | | | 10,080,390 | | |
SPAIN 4.5% | |
Banco Santander SA | | | 869,928 | | | | 3,518,851 | | |
Cellnex Telecom SAU | | | 304,533 | | | | 4,866,818 | | |
Endesa SA | | | 403,841 | | | | 7,278,875 | | |
Iberdrola SA | | | 1,499,353 | | | | 9,659,147 | | |
Total | | | | | 25,323,691 | | |
SWEDEN 3.4% | |
Hemfosa Fastigheter AB | | | 473,905 | | | | 5,242,107 | | |
Nordea Bank AB | | | 917,174 | | | | 9,122,386 | | |
Saab AB, Class B | | | 140,854 | | | | 4,502,875 | | |
Total | | | | | 18,867,368 | | |
SWITZERLAND 5.3% | |
Autoneum Holding AG | | | 35,957 | | | | 7,724,228 | | |
Common Stocks (continued)
Issuer | | Shares | | Value ($) | |
Baloise Holding AG, Registered Shares | | | 30,186 | | | | 3,797,066 | | |
Nestlé SA, Registered Shares | | | 67,399 | | | | 4,713,278 | | |
UBS AG | | | 205,341 | | | | 3,136,993 | | |
Wizz Air Holdings PLC(a) | | | 185,333 | | | | 4,695,160 | | |
Zurich Insurance Group AG | | | 26,390 | | | | 5,589,692 | | |
Total | | | | | 29,656,417 | | |
UNITED KINGDOM 18.0% | |
AstraZeneca PLC | | | 98,814 | | | | 5,618,237 | | |
Aviva PLC | | | 935,654 | | | | 5,677,174 | | |
BHP Billiton PLC | | | 653,776 | | | | 6,576,011 | | |
| BP PLC | | | 680,290 | | | | 3,301,581 | | |
Crest Nicholson Holdings PLC | | | 744,808 | | | | 5,782,465 | | |
DCC PLC | | | 44,944 | | | | 3,512,419 | | |
GlaxoSmithKline PLC | | | 288,818 | | | | 5,597,312 | | |
GW Pharmaceuticals PLC ADR(a) | | | 22,172 | | | | 911,269 | | |
HSBC Holdings PLC | | | 1,772,056 | | | | 11,269,103 | | |
Intermediate Capital Group PLC | | | 911,251 | | | | 7,292,631 | | |
John Wood Group PLC | | | 819,251 | | | | 7,082,955 | | |
Paysafe Group PLC(a) | | | 1,779,537 | | | | 9,787,684 | | |
Plus500 Ltd. | | | 202,731 | | | | 1,690,916 | | |
Royal Dutch Shell PLC, Class B | | | 957,157 | | | | 21,732,792 | | |
Vodafone Group PLC | | | 1,875,865 | | | | 5,689,312 | | |
Total | | | | | 101,521,861 | | |
UNITED STATES 2.7% | |
Aerie Pharmaceuticals, Inc.(a) | | | 40,265 | | | | 678,063 | | |
Alexion Pharmaceuticals, Inc.(a) | | | 6,149 | | | | 865,779 | | |
Alkermes PLC(a) | | | 17,465 | | | | 563,596 | | |
Arrowhead Research Corp.(a) | | | 112,935 | | | | 440,447 | | |
BioMarin Pharmaceutical, Inc.(a) | | | 9,794 | | | | 801,835 | | |
Bluebird Bio, Inc.(a) | | | 21,131 | | | | 976,675 | | |
Flex Pharma, Inc.(a) | | | 146,944 | | | | 1,091,794 | | |
Incyte Corp.(a) | | | 6,853 | | | | 503,696 | | |
Insmed, Inc.(a) | | | 34,504 | | | | 421,984 | | |
Novavax, Inc.(a) | | | 171,115 | | | | 746,061 | | |
PTC Therapeutics, Inc.(a) | | | 73,889 | | | | 589,634 | | |
Puma Biotechnology, Inc.(a) | | | 9,640 | | | | 431,679 | | |
Quotient Ltd.(a) | | | 264,283 | | | | 1,987,408 | | |
Stillwater Mining Co.(a) | | | 287,967 | | | | 2,416,043 | | |
TESARO, Inc.(a) | | | 15,127 | | | | 612,038 | | |
The accompanying Notes to Financial Statements are an integral part of this statement.
Annual Report 2016
10
COLUMBIA OVERSEAS VALUE FUND
PORTFOLIO OF INVESTMENTS (continued)
February 29, 2016
Common Stocks (continued)
Issuer | | Shares | | Value ($) | |
Ultragenyx Pharmaceutical, Inc.(a) | | | 16,080 | | | | 980,719 | | |
Vertex Pharmaceuticals, Inc.(a) | | | 9,005 | | | | 769,837 | | |
Total | | | | | 14,877,288 | | |
Total Common Stocks
(Cost: $614,274,507) | | | | | 554,478,363 | | |
Exchange-Traded Funds 0.9%
| | | Shares | | Value ($) | |
iShares MSCI EAFE ETF | | | 103,589 | | | | 5,552,370 | | |
Total Exchange-Traded Funds
(Cost: $5,697,144) | | | | | 5,552,370 | | |
Money Market Funds 0.8%
| | | Shares | | Value ($) | |
Columbia Short-Term Cash Fund,
0.420%(d)(e) | | | 4,231,249 | | | | 4,231,249 | | |
Total Money Market Funds
(Cost: $4,231,249) | | | | | 4,231,249 | | |
Total Investments
(Cost: $624,202,900) | | | | | 564,261,982 | | |
Other Assets & Liabilities, Net | | | | | (1,388,400 | ) | |
Net Assets | | | | | 562,873,582 | | |
Investments in Derivatives
Forward Foreign Currency Exchange Contracts Open at February 29, 2016
Counterparty | | Exchange Date | | Currency to
be Delivered | |
| | Currency to
be Received | |
| | Unrealized
Appreciation ($) | | Unrealized
Depreciation ($) | |
Morgan Stanley | | 04/20/2016 | | | 15,144,000 | | | DKK | | | | | 2,237,024 | | | USD | | | | | 24,703 | | | | — | | |
Morgan Stanley | | 04/20/2016 | | | 8,771,000 | | | ILS | | | | | 2,248,532 | | | USD | | | | | — | | | | (2,221 | ) | |
Morgan Stanley | | 04/20/2016 | | | 996,119,000 | | | JPY | | | | | 8,838,866 | | | USD | | | | | — | | | | (9,635 | ) | |
Morgan Stanley | | 04/20/2016 | | | 11,806,608,000 | | | KRW | | | | | 9,517,452 | | | USD | | | | | 4,194 | | | | — | | |
Morgan Stanley | | 04/20/2016 | | | 238,853,000 | | | NOK | | | | | 27,582,589 | | | USD | | | | | 144,826 | | | | — | | |
Morgan Stanley | | 04/20/2016 | | | 28,512,000 | | | SEK | | | | | 3,348,307 | | | USD | | | | | 11,696 | | | | — | | |
Morgan Stanley | | 04/20/2016 | | | 27,043,872 | | | USD | | | | | 37,657,000 | | | AUD | | | | | — | | | | (228,179 | ) | |
Morgan Stanley | | 04/20/2016 | | | 7,231,106 | | | USD | | | | | 7,171,000 | | | CHF | | | | | — | | | | (31,156 | ) | |
Morgan Stanley | | 04/20/2016 | | | 10,066,407 | | | USD | | | | | 9,133,000 | | | EUR | | | | | — | | | | (115,844 | ) | |
Morgan Stanley | | 04/20/2016 | | | 24,099,925 | | | USD | | | | | 17,267,000 | | | GBP | | | | | — | | | | (62,545 | ) | |
Total | | | | | | | | | | | | | 185,419 | | | | (449,580 | ) | |
Notes to Portfolio of Investments
(a) Non-income producing investment.
(b) Identifies securities considered by the Investment Manager to be illiquid and may be difficult to sell. The aggregate value of such securities at February 29, 2016 was $89,857, which represents 0.02% of net assets. Information concerning such security holdings at February 29, 2016 is as follows:
Security Description | | Acquisition Dates | | Cost ($) | |
Banco Espirito Santo SA, Registered Shares | | 07/02/2014 – 07/29/2014 | | | 2,268,800 | | |
(c) Represents fair value as determined in good faith under procedures approved by the Board of Trustees. At February 29, 2016, the value of these securities amounted to $89,857, which represents 0.02% of net assets.
(d) The rate shown is the seven-day current annualized yield at February 29, 2016.
The accompanying Notes to Financial Statements are an integral part of this statement.
Annual Report 2016
11
COLUMBIA OVERSEAS VALUE FUND
PORTFOLIO OF INVESTMENTS (continued)
February 29, 2016
Notes to Portfolio of Investments (continued)
(e) As defined in the Investment Company Act of 1940, an affiliated company is one in which the Fund owns 5% or more of the company's outstanding voting securities, or a company which is under common ownership or control with the Fund. Holdings and transactions in these affiliated companies during the year ended February 29, 2016 are as follows:
Issuer | | Beginning
Cost ($) | | Purchase
Cost ($) | | Proceeds
From Sales ($) | | Ending
Cost ($) | | Dividends —
Affiliated
Issuers ($) | | Value ($) | |
Columbia Short-Term Cash Fund | | | 1,840,282 | | | | 217,647,421 | | | | (215,256,454 | ) | | | 4,231,249 | | | | 6,522 | | | | 4,231,249 | | |
Abbreviation Legend
ADR American Depositary Receipt
Currency Legend
AUD Australian Dollar
CHF Swiss Franc
DKK Danish Krone
EUR Euro
GBP British Pound
ILS Israeli Shekel
JPY Japanese Yen
KRW Korean Won
NOK Norwegian Krone
SEK Swedish Krona
USD US Dollar
Fair Value Measurements
The Fund categorizes its fair value measurements according to a three-level hierarchy that maximizes the use of observable inputs and minimizes the use of unobservable inputs by prioritizing that the most observable input be used when available. Observable inputs are those that market participants would use in pricing an investment based on market data obtained from sources independent of the reporting entity. Unobservable inputs are those that reflect the Fund's assumptions about the information market participants would use in pricing an investment. An investment's level within the fair value hierarchy is based on the lowest level of any input that is deemed significant to the asset's or liability's fair value measurement. The input levels are not necessarily an indication of the risk or liquidity associated with investments at that level. For example, certain U.S. government securities are generally high quality and liquid, however, they are reflected as Level 2 because the inputs used to determine fair value may not always be quoted prices in an active market.
Fair value inputs are summarized in the three broad levels listed below:
> Level 1 — Valuations based on quoted prices for investments in active markets that the Fund has the ability to access at the measurement date (including NAV for open-end mutual funds). Valuation adjustments are not applied to Level 1 investments.
> Level 2 — Valuations based on other significant observable inputs (including quoted prices for similar securities, interest rates, prepayment speeds, credit risks, etc.).
> Level 3 — Valuations based on significant unobservable inputs (including the Fund's own assumptions and judgment in determining the fair value of investments).
Inputs that are used in determining fair value of an investment may include price information, credit data, volatility statistics, and other factors. These inputs can be either observable or unobservable. The availability of observable inputs can vary between investments, and is affected by various factors such as the type of investment, and the volume and level of activity for that investment or similar investments in the marketplace. The inputs will be considered by the Investment Manager, along with any other relevant factors in the calculation of an investment's fair value. The Fund uses prices and inputs that are current as of the measurement date, which may include periods of market dislocations. During these periods, the availability of prices and inputs may be reduced for many investments. This condition could cause an investment to be reclassified between the various levels within the hierarchy.
The accompanying Notes to Financial Statements are an integral part of this statement.
Annual Report 2016
12
COLUMBIA OVERSEAS VALUE FUND
PORTFOLIO OF INVESTMENTS (continued)
February 29, 2016
Fair Value Measurements (continued)
Foreign equity securities actively traded in markets where there is a significant delay in the local close relative to the New York Stock Exchange (NYSE) are classified as Level 2. The values of these securities may include an adjustment to reflect the impact of significant market movements following the close of local trading, as described in Note 2 to the financial statements — Security Valuation.
Investments falling into the Level 3 category are primarily supported by quoted prices from brokers and dealers participating in the market for those investments. However, these may be classified as Level 3 investments due to lack of market transparency and corroboration to support these quoted prices. Additionally, valuation models may be used as the pricing source for any remaining investments classified as Level 3. These models may rely on one or more significant unobservable inputs and/or significant assumptions by the Investment Manager. Inputs used in valuations may include, but are not limited to, financial statement analysis, capital account balances, discount rates and estimated cash flows, and comparable company data.
Under the direction of the Fund's Board of Trustees (the Board), the Investment Manager's Valuation Committee (the Committee) is responsible for overseeing the valuation procedures approved by the Board. The Committee consists of voting and non-voting members from various groups within the Investment Manager's organization, including operations and accounting, trading and investments, compliance, risk management and legal.
The Committee meets at least monthly to review and approve valuation matters, which may include a description of specific valuation determinations, data regarding pricing information received from approved pricing vendors and brokers and the results of Board-approved valuation control policies and procedures (the Policies). The Policies address, among other things, instances when market quotations are or are not readily available, including recommendations of third party pricing vendors and a determination of appropriate pricing methodologies; events that require specific valuation determinations and assessment of fair value techniques; securities with a potential for stale pricing, including those that are illiquid, restricted, or in default; and the effectiveness of third party pricing vendors, including periodic reviews of vendors. The Committee meets more frequently, as needed, to discuss additional valuation matters, which may include the need to review back-testing results, review time-sensitive information or approve related valuation actions. The Committee reports to the Board, with members of the Committee meeting with the Board at each of its regularly scheduled meetings to discuss valuation matters and actions during the period, similar to those described earlier.
For investments categorized as Level 3, the Committee monitors information similar to that described above, which may include: (i) data specific to the issuer or comparable issuers, (ii) general market or specific sector news and (iii) quoted prices and specific or similar security transactions. The Committee considers this data and any changes from prior periods in order to assess the reasonableness of observable and unobservable inputs, any assumptions or internal models used to value those securities and changes in fair value. This data is also used to corroborate, when available, information received from approved pricing vendors and brokers. Various factors impact the frequency of monitoring this information (which may occur as often as daily). However, the Committee may determine that changes to inputs, assumptions and models are not required as a result of the monitoring procedures performed.
The following table is a summary of the inputs used to value the Fund's investments at February 29, 2016:
| | | Level 1
Quoted Prices in Active
Markets for Identical
Assets ($) | | Level 2
Other Significant
Observable Inputs ($) | | Level 3
Significant
Unobservable Inputs ($) | | Total ($) | |
Investments | |
Common Stocks | |
Australia | | | — | | | | 9,196,063 | | | | — | | | | 9,196,063 | | |
Belgium | | | — | | | | 6,982,859 | | | | — | | | | 6,982,859 | | |
China | | | 3,820,293 | | | | 5,864,357 | | | | — | | | | 9,684,650 | | |
Denmark | | | — | | | | 4,478,291 | | | | — | | | | 4,478,291 | | |
France | | | — | | | | 60,705,502 | | | | — | | | | 60,705,502 | | |
Germany | | | — | | | | 31,175,039 | | | | — | | | | 31,175,039 | | |
Hong Kong | | | — | | | | 5,901,837 | | | | — | | | | 5,901,837 | | |
Ireland | | | 916,518 | | | | 5,020,620 | | | | — | | | | 5,937,138 | | |
Israel | | | — | | | | 7,435,802 | | | | — | | | | 7,435,802 | | |
Italy | | | — | | | | 12,263,816 | | | | — | | | | 12,263,816 | | |
Japan | | | — | | | | 138,921,927 | | | | — | | | | 138,921,927 | | |
Netherlands | | | — | | | | 16,914,220 | | | | — | | | | 16,914,220 | | |
The accompanying Notes to Financial Statements are an integral part of this statement.
Annual Report 2016
13
COLUMBIA OVERSEAS VALUE FUND
PORTFOLIO OF INVESTMENTS (continued)
February 29, 2016
Fair Value Measurements (continued)
| | | Level 1
Quoted Prices in Active
Markets for Identical
Assets ($) | | Level 2
Other Significant
Observable Inputs ($) | | Level 3
Significant
Unobservable Inputs ($) | | Total ($) | |
Norway | | | — | | | | 32,448,061 | | | | — | | | | 32,448,061 | | |
Pakistan | | | — | | | | 3,967,217 | | | | — | | | | 3,967,217 | | |
Portugal | | | — | | | | — | | | | 89,857 | | | | 89,857 | | |
Singapore | | | — | | | | 8,049,069 | | | | — | | | | 8,049,069 | | |
South Korea | | | — | | | | 10,080,390 | | | | — | | | | 10,080,390 | | |
Spain | | | — | | | | 25,323,691 | | | | — | | | | 25,323,691 | | |
Sweden | | | — | | | | 18,867,368 | | | | — | | | | 18,867,368 | | |
Switzerland | | | — | | | | 29,656,417 | | | | — | | | | 29,656,417 | | |
United Kingdom | | | 911,269 | | | | 100,610,592 | | | | — | | | | 101,521,861 | | |
United States | | | 14,877,288 | | | | — | | | | — | | | | 14,877,288 | | |
Total Common Stocks | | | 20,525,368 | | | | 533,863,138 | | | | 89,857 | | | | 554,478,363 | | |
Exchange-Traded Funds | | | 5,552,370 | | | | — | | | | — | | | | 5,552,370 | | |
Money Market Funds | | | — | | | | 4,231,249 | | | | — | | | | 4,231,249 | | |
Total Investments | | | 26,077,738 | | | | 538,094,387 | | | | 89,857 | | | | 564,261,982 | | |
Derivatives | |
Assets | |
Forward Foreign Currency
Exchange Contracts | | | — | | | | 185,419 | | | | — | | | | 185,419 | | |
Liabilities | |
Forward Foreign Currency
Exchange Contracts | | | — | | | | (449,580 | ) | | | — | | | | (449,580 | ) | |
Total | | | 26,077,738 | | | | 537,830,226 | | | | 89,857 | | | | 563,997,821 | | |
See the Portfolio of Investments for all investment classifications not indicated in the table.
The Fund's assets assigned to the Level 2 input category are generally valued using the market approach, in which a security's value is determined through reference to prices and information from market transactions for similar or identical assets and/or fund per share market values which are not considered publicly available. These assets include certain foreign securities for which a third party statistical pricing service may be employed for purposes of fair market valuation. The model utilized by such third party statistical pricing service takes into account a security's correlation to available market data including, but not limited to, intraday index, ADR, and exchange-traded fund movements.
Derivative instruments are valued at unrealized appreciation (depreciation).
Financial assets were transferred from Level 1 to Level 2 as the market for these assets is not considered publicly available. Fund per share market values were obtained using observable market inputs.
The following table shows transfers between Level 1 and Level 2 of the fair value hierarchy:
Transfers In | | Transfers Out | |
| Level 1 ($) | | Level 2 ($) | | Level 1 ($) | | Level 2 ($) | |
| | — | | | | 1,840,282 | | | | 1,840,282 | | | | — | | |
Transfers between Level 1 and Level 2 are determined based on the fair value at the beginning of the period for security positions held throughout the period.
The Fund does not hold any significant investments (greater than one percent of net assets) categorized as Level 3.
The accompanying Notes to Financial Statements are an integral part of this statement.
Annual Report 2016
14
COLUMBIA OVERSEAS VALUE FUND
PORTFOLIO OF INVESTMENTS (continued)
February 29, 2016
Fair Value Measurements (continued)
The Fund's assets assigned to the Level 3 category are valued utilizing the valuation technique deemed the most appropriate in the circumstances. Certain common stocks classified as Level 3 securities are valued using the market approach. To determine fair value for these securities, management considered various factors which may have included, but were not limited to, the halt price of the security, discount rates observed in the market for similar assets as well as the movement in certain foreign or domestic market indices. Significant increases (decreases) to any of these inputs would result in a significantly lower (higher) fair value measurement. Generally, a change in observable yields on comparable securities would result in a directionally similar change to discount rates.
There were no transfers of financial assets between Levels 2 and 3 during the period.
The accompanying Notes to Financial Statements are an integral part of this statement.
Annual Report 2016
15
COLUMBIA OVERSEAS VALUE FUND
STATEMENT OF ASSETS AND LIABILITIES
February 29, 2016
Assets | |
Investments, at value | |
Unaffiliated issuers (identified cost $619,971,651) | | $ | 560,030,733 | | |
Affiliated issuers (identified cost $4,231,249) | | | 4,231,249 | | |
Total investments (identified cost $624,202,900) | | | 564,261,982 | | |
Unrealized appreciation on forward foreign currency exchange contracts | | | 185,419 | | |
Receivable for: | |
Investments sold | | | 2,196,250 | | |
Capital shares sold | | | 217,727 | | |
Dividends | | | 1,123,103 | | |
Foreign tax reclaims | | | 643,226 | | |
Expense reimbursement due from Investment Manager | | | 28 | | |
Prepaid expenses | | | 2,150 | | |
Other assets | | | 13,117 | | |
Total assets | | | 568,643,002 | | |
Liabilities | |
Unrealized depreciation on forward foreign currency exchange contracts | | | 449,580 | | |
Payable for: | |
Investments purchased | | | 4,591,023 | | |
Capital shares purchased | | | 419,645 | | |
Foreign capital gains taxes deferred | | | 31,142 | | |
Investment management fees | | | 39,938 | | |
Distribution and/or service fees | | | 6,791 | | |
Transfer agent fees | | | 59,504 | | |
Plan administration fees | | | 29 | | |
Compensation of board members | | | 67,094 | | |
Other expenses | | | 104,674 | | |
Total liabilities | | | 5,769,420 | | |
Net assets applicable to outstanding capital stock | | $ | 562,873,582 | | |
Represented by | |
Paid-in capital | | $ | 962,557,413 | | |
Excess of distributions over net investment income | | | (4,123,425 | ) | |
Accumulated net realized loss | | | (335,189,086 | ) | |
Unrealized appreciation (depreciation) on: | |
Investments | | | (59,940,918 | ) | |
Foreign currency translations | | | (135,099 | ) | |
Forward foreign currency exchange contracts | | | (264,161 | ) | |
Foreign capital gains tax | | | (31,142 | ) | |
Total — representing net assets applicable to outstanding capital stock | | $ | 562,873,582 | | |
The accompanying Notes to Financial Statements are an integral part of this statement.
Annual Report 2016
16
COLUMBIA OVERSEAS VALUE FUND
STATEMENT OF ASSETS AND LIABILITIES (continued)
February 29, 2016
Class A | |
Net assets | | $ | 171,630,082 | | |
Shares outstanding | | | 23,021,942 | | |
Net asset value per share | | $ | 7.46 | | |
Maximum offering price per share(a) | | $ | 7.92 | | |
Class B | |
Net assets | | $ | 1,812,245 | | |
Shares outstanding | | | 243,680 | | |
Net asset value per share | | $ | 7.44 | | |
Class C | |
Net assets | | $ | 5,344,885 | | |
Shares outstanding | | | 718,539 | | |
Net asset value per share | | $ | 7.44 | | |
Class I | |
Net assets | | $ | 247,603,285 | | |
Shares outstanding | | | 33,192,941 | | |
Net asset value per share | | $ | 7.46 | | |
Class K | |
Net assets | | $ | 131,422 | | |
Shares outstanding | | | 17,622 | | |
Net asset value per share | | $ | 7.46 | | |
Class R4 | |
Net assets | | $ | 1,425,206 | | |
Shares outstanding | | | 191,737 | | |
Net asset value per share | | $ | 7.43 | | |
Class R5 | |
Net assets | | $ | 768,485 | | |
Shares outstanding | | | 103,535 | | |
Net asset value per share | | $ | 7.42 | | |
Class W | |
Net assets | | $ | 130,495,711 | | |
Shares outstanding | | | 17,518,747 | | |
Net asset value per share | | $ | 7.45 | | |
Class Y | |
Net assets | | $ | 2,114 | | |
Shares outstanding | | | 285 | | |
Net asset value per share | | $ | 7.42 | | |
Class Z | |
Net assets | | $ | 3,660,147 | | |
Shares outstanding | | | 490,608 | | |
Net asset value per share | | $ | 7.46 | | |
(a) The maximum offering price per share is calculated by dividing the net asset value per share by 1.0 minus the maximum sales charge of 5.75%.
The accompanying Notes to Financial Statements are an integral part of this statement.
Annual Report 2016
17
COLUMBIA OVERSEAS VALUE FUND
STATEMENT OF OPERATIONS
Year Ended February 29, 2016
Net investment income | |
Income: | |
Dividends — unaffiliated issuers | | $ | 24,437,653 | | |
Dividends — affiliated issuers | | | 6,522 | | |
Interest | | | 6,514 | | |
Foreign taxes withheld | | | (2,291,885 | ) | |
Total income | | | 22,158,804 | | |
Expenses: | |
Investment management fees | | | 5,573,069 | | |
Distribution and/or service fees | |
Class A | | | 467,676 | | |
Class B | | | 33,634 | | |
Class C | | | 49,013 | | |
Class W | | | 425,451 | | |
Transfer agent fees | |
Class A | | | 476,672 | | |
Class B | | | 8,459 | | |
Class C | | | 12,543 | | |
Class K | | | 77 | | |
Class R4(a) | | | 1,120 | | |
Class R5(a) | | | 56 | | |
Class W | | | 431,021 | | |
Class Z | | | 2,620 | | |
Plan administration fees | |
Class K | | | 386 | | |
Compensation of board members | | | 13,992 | | |
Custodian fees | | | 121,915 | | |
Printing and postage fees | | | 109,372 | | |
Registration fees | | | 117,455 | | |
Audit fees | | | 57,575 | | |
Legal fees | | | 10,431 | | |
Other | | | 38,148 | | |
Total expenses | | | 7,950,685 | | |
Fees waived or expenses reimbursed by Investment Manager and its affiliates | | | (288 | ) | |
Expense reductions | | | (15 | ) | |
Total net expenses | | | 7,950,382 | | |
Net investment income | | | 14,208,422 | | |
Realized and unrealized gain (loss) — net | |
Net realized gain (loss) on: | |
Investments | | | 13,394,166 | | |
Foreign currency translations | | | (297,441 | ) | |
Forward foreign currency exchange contracts | | | (2,398,014 | ) | |
Options contracts written | | | 17,304 | | |
Net realized gain | | | 10,716,015 | | |
Net change in unrealized appreciation (depreciation) on: | |
Investments | | | (99,136,968 | ) | |
Foreign currency translations | | | (46,721 | ) | |
Forward foreign currency exchange contracts | | | (1,216,729 | ) | |
Foreign capital gains tax | | | (31,142 | ) | |
Net change in unrealized depreciation | | | (100,431,560 | ) | |
Net realized and unrealized loss | | | (89,715,545 | ) | |
Net decrease in net assets from operations | | $ | (75,507,123 | ) | |
(a) Based on operations from July 1, 2015 (commencement of operations) through the stated period end.
The accompanying Notes to Financial Statements are an integral part of this statement.
Annual Report 2016
18
COLUMBIA OVERSEAS VALUE FUND
STATEMENT OF CHANGES IN NET ASSETS
| | | Year Ended
February 29,
2016(a) | | Year Ended
February 28,
2015 | |
Operations | |
Net investment income | | $ | 14,208,422 | | | $ | 18,611,021 | | |
Net realized gain (loss) | | | 10,716,015 | | | | (13,101,793 | ) | |
Net change in unrealized depreciation | | | (100,431,560 | ) | | | (25,761,711 | ) | |
Net decrease in net assets resulting from operations | | | (75,507,123 | ) | | | (20,252,483 | ) | |
Distributions to shareholders | |
Net investment income | |
Class A | | | (3,740,850 | ) | | | (5,698,627 | ) | |
Class B | | | (32,177 | ) | | | (132,919 | ) | |
Class C | | | (67,143 | ) | | | (100,677 | ) | |
Class I | | | (6,770,139 | ) | | | (9,764,213 | ) | |
Class K | | | (3,203 | ) | | | (5,333 | ) | |
Class R4 | | | (29,712 | ) | | | — | | |
Class R5 | | | (816 | ) | | | — | | |
Class W | | | (2,993,331 | ) | | | (7,425,696 | ) | |
Class Y | | | (59 | ) | | | — | | |
Class Z | | | (21,828 | ) | | | (18,234 | ) | |
Tax return of capital | |
Class A | | | — | | | | (100,747 | ) | |
Class B | | | — | | | | (3,557 | ) | |
Class C | | | — | | | | (2,345 | ) | |
Class I | | | — | | | | (134,338 | ) | |
Class K | | | — | | | | (87 | ) | |
Class W | | | — | | | | (136,497 | ) | |
Class Z | | | — | | | | (198 | ) | |
Total distributions to shareholders | | | (13,659,258 | ) | | | (23,523,468 | ) | |
Increase (decrease) in net assets from capital stock activity | | | (41,105,126 | ) | | | 101,019,321 | | |
Total increase (decrease) in net assets | | | (130,271,507 | ) | | | 57,243,370 | | |
Net assets at beginning of year | | | 693,145,089 | | | | 635,901,719 | | |
Net assets at end of year | | $ | 562,873,582 | | | $ | 693,145,089 | | |
Excess of distributions over net investment income | | $ | (4,123,425 | ) | | $ | (3,439,252 | ) | |
(a) Class R4, Class R5 and Class Y shares are based on operations from July 1, 2015 (commencement of operations) through the stated period end.
The accompanying Notes to Financial Statements are an integral part of this statement.
Annual Report 2016
19
COLUMBIA OVERSEAS VALUE FUND
STATEMENT OF CHANGES IN NET ASSETS (continued)
| | | Year Ended February 29, 2016(a) | | Year Ended February 28, 2015 | |
| | | Shares | | Dollars ($) | | Shares | | Dollars ($) | |
Capital stock activity | |
Class A shares | |
Subscriptions(b) | | | 3,790,938 | | | | 31,807,308 | | | | 1,411,964 | | | | 12,400,765 | | |
Distributions reinvested | | | 453,091 | | | | 3,710,818 | | | | 700,883 | | | | 5,738,989 | | |
Redemptions | | | (2,975,794 | ) | | | (25,255,394 | ) | | | (4,189,888 | ) | | | (36,618,448 | ) | |
Net increase (decrease) | | | 1,268,235 | | | | 10,262,732 | | | | (2,077,041 | ) | | | (18,478,694 | ) | |
Class B shares | |
Subscriptions | | | 7,874 | | | | 69,877 | | | | 10,775 | | | | 96,521 | | |
Distributions reinvested | | | 3,919 | | | | 32,098 | | | | 16,564 | | | | 135,736 | | |
Redemptions(b) | | | (370,193 | ) | | | (3,192,153 | ) | | | (477,844 | ) | | | (4,152,745 | ) | |
Net decrease | | | (358,400 | ) | | | (3,090,178 | ) | | | (450,505 | ) | | | (3,920,488 | ) | |
Class C shares | |
Subscriptions | | | 266,426 | | | | 2,206,740 | | | | 64,689 | | | | 562,368 | | |
Distributions reinvested | | | 8,152 | | | | 66,763 | | | | 12,588 | | | | 102,840 | | |
Redemptions | | | (88,173 | ) | | | (734,379 | ) | | | (72,751 | ) | | | (635,372 | ) | |
Net increase | | | 186,405 | | | | 1,539,124 | | | | 4,526 | | | | 29,836 | | |
Class I shares | |
Subscriptions | | | 5,642,116 | | | | 49,720,056 | | | | 23,599,773 | | | | 209,476,876 | | |
Distributions reinvested | | | 826,628 | | | | 6,770,080 | | | | 1,211,428 | | | | 9,898,464 | | |
Redemptions | | | (6,338,087 | ) | | | (53,983,372 | ) | | | (2,480,943 | ) | | | (22,188,673 | ) | |
Net increase | | | 130,657 | | | | 2,506,764 | | | | 22,330,258 | | | | 197,186,667 | | |
Class K shares | |
Distributions reinvested | | | 385 | | | | 3,149 | | | | 652 | | | | 5,340 | | |
Redemptions | | | (2,620 | ) | | | (23,294 | ) | | | (2,230 | ) | | | (20,293 | ) | |
Net decrease | | | (2,235 | ) | | | (20,145 | ) | | | (1,578 | ) | | | (14,953 | ) | |
Class R4 shares | |
Subscriptions | | | 191,673 | | | | 1,595,352 | | | | — | | | | — | | |
Distributions reinvested | | | 3,635 | | | | 29,659 | | | | — | | | | — | | |
Redemptions | | | (3,571 | ) | | | (29,045 | ) | | | — | | | | — | | |
Net increase | | | 191,737 | | | | 1,595,966 | | | | — | | | | — | | |
Class R5 shares | |
Subscriptions | | | 108,351 | | | | 839,697 | | | | — | | | | — | | |
Distributions reinvested | | | 93 | | | | 759 | | | | — | | | | — | | |
Redemptions | | | (4,909 | ) | | | (40,553 | ) | | | — | | | | — | | |
Net increase | | | 103,535 | | | | 799,903 | | | | — | | | | — | | |
Class W shares | |
Subscriptions | | | 2,511,043 | | | | 21,430,038 | | | | 4,944,942 | | | | 43,705,233 | | |
Distributions reinvested | | | 365,480 | | | | 2,993,284 | | | | 923,496 | | | | 7,562,121 | | |
Redemptions | | | (9,504,321 | ) | | | (82,708,561 | ) | | | (14,729,279 | ) | | | (125,331,403 | ) | |
Net decrease | | | (6,627,798 | ) | | | (58,285,239 | ) | | | (8,860,841 | ) | | | (74,064,049 | ) | |
The accompanying Notes to Financial Statements are an integral part of this statement.
Annual Report 2016
20
COLUMBIA OVERSEAS VALUE FUND
STATEMENT OF CHANGES IN NET ASSETS (continued)
| | | Year Ended February 29, 2016(a) | | Year Ended February 28, 2015 | |
| | | Shares | | Dollars ($) | | Shares | | Dollars ($) | |
Capital stock activity (continued) | |
Class Y shares | |
Subscriptions | | | 285 | | | | 2,500 | | | | — | | | | — | | |
Net increase | | | 285 | | | | 2,500 | | | | — | | | | — | | |
Class Z shares | |
Subscriptions | | | 719,734 | | | | 5,693,388 | | | | 67,306 | | | | 593,280 | | |
Distributions reinvested | | | 2,648 | | | | 21,716 | | | | 1,363 | | | | 11,141 | | |
Redemptions | | | (271,017 | ) | | | (2,131,657 | ) | | | (38,970 | ) | | | (323,419 | ) | |
Net increase | | | 451,365 | | | | 3,583,447 | | | | 29,699 | | | | 281,002 | | |
Total net increase (decrease) | | | (4,656,214 | ) | | | (41,105,126 | ) | | | 10,974,518 | | | | 101,019,321 | | |
(a) Class R4, Class R5 and Class Y shares are based on operations from July 1, 2015 (commencement of operations) through the stated period end.
(b) Includes conversions of Class B shares to Class A shares, if any.
The accompanying Notes to Financial Statements are an integral part of this statement.
Annual Report 2016
21
COLUMBIA OVERSEAS VALUE FUND
The following tables are intended to help you understand the Fund's financial performance. Certain information reflects financial results for a single share of a class held for the periods shown. Per share net investment income (loss) amounts are calculated based on average shares outstanding during the period. Total return assumes reinvestment of all dividends and distributions, if any. Total return does not reflect payment of sales charges, if any. Total return and portfolio turnover are not annualized for periods of less than one year. The portfolio turnover rate is calculated without regard to purchase and sales transactions of short-term instruments and certain derivatives, if any. If such transactions were included, the Fund's portfolio turnover rate may be higher.
| | | Year Ended
February 29, | | Year Ended February 28, | |
Class A | | 2016 | | 2015 | | 2014(a) | |
Per share data | |
Net asset value, beginning of period | | $ | 8.65 | | | $ | 9.20 | | | $ | 7.65 | | |
Income from investment operations: | |
Net investment income | | | 0.16 | | | | 0.20 | | | | 0.19 | | |
Net realized and unrealized gain (loss) | | | (1.18 | ) | | | (0.49 | ) | | | 1.49 | | |
Total from investment operations | | | (1.02 | ) | | | (0.29 | ) | | | 1.68 | | |
Less distributions to shareholders: | |
Net investment income | | | (0.17 | ) | | | (0.26 | ) | | | (0.13 | ) | |
Tax return of capital | | | — | | | | (0.00 | )(b) | | | — | | |
Total distributions to shareholders | | | (0.17 | ) | | | (0.26 | ) | | | (0.13 | ) | |
Net asset value, end of period | | $ | 7.46 | | | $ | 8.65 | | | $ | 9.20 | | |
Total return | | | (11.95 | %) | | | (2.92 | %) | | | 22.10 | % | |
Ratios to average net assets(c) | |
Total gross expenses | | | 1.44 | % | | | 1.40 | % | | | 1.71 | % | |
Total net expenses(d) | | | 1.44 | %(e) | | | 1.40 | %(e) | | | 1.41 | %(e) | |
Net investment income | | | 1.93 | % | | | 2.32 | % | | | 2.22 | % | |
Supplemental data | |
Net assets, end of period (in thousands) | | $ | 171,630 | | | $ | 188,171 | | | $ | 219,133 | | |
Portfolio turnover | | | 68 | % | | | 74 | % | | | 63 | % | |
Notes to Financial Highlights
(a) Based on operations from February 28, 2013 (commencement of operations) through the stated period end.
(b) Rounds to zero.
(c) In addition to the fees and expenses that the Fund bears directly, the Fund indirectly bears a pro rata share of the fees and expenses of any other funds in which it invests. Such indirect expenses are not included in the Fund's reported expense ratios.
(d) Total net expenses include the impact of certain fee waivers/expense reimbursements made by the Investment Manager and certain of its affiliates, if applicable.
(e) The benefits derived from expense reductions had an impact of less than 0.01%.
The accompanying Notes to Financial Statements are an integral part of this statement.
Annual Report 2016
22
COLUMBIA OVERSEAS VALUE FUND
FINANCIAL HIGHLIGHTS (continued)
| | | Year Ended
February 29, | | Year Ended February 28, | |
Class B | | 2016 | | 2015 | | 2014(a) | |
Per share data | |
Net asset value, beginning of period | | $ | 8.64 | | | $ | 9.18 | | | $ | 7.65 | | |
Income from investment operations: | |
Net investment income | | | 0.14 | | | | 0.15 | | | | 0.14 | | |
Net realized and unrealized gain (loss) | | | (1.22 | ) | | | (0.49 | ) | | | 1.47 | | |
Total from investment operations | | | (1.08 | ) | | | (0.34 | ) | | | 1.61 | | |
Less distributions to shareholders: | |
Net investment income | | | (0.12 | ) | | | (0.20 | ) | | | (0.08 | ) | |
Tax return of capital | | | — | | | | (0.00 | )(b) | | | — | | |
Total distributions to shareholders | | | (0.12 | ) | | | (0.20 | ) | | | (0.08 | ) | |
Net asset value, end of period | | $ | 7.44 | | | $ | 8.64 | | | $ | 9.18 | | |
Total return | | | (12.66 | %) | | | (3.60 | %) | | | 21.13 | % | |
Ratios to average net assets(c) | |
Total gross expenses | | | 2.18 | % | | | 2.15 | % | | | 2.47 | % | |
Total net expenses(d) | | | 2.18 | %(e) | | | 2.15 | %(e) | | | 2.16 | %(e) | |
Net investment income | | | 1.67 | % | | | 1.74 | % | | | 1.66 | % | |
Supplemental data | |
Net assets, end of period (in thousands) | | $ | 1,812 | | | $ | 5,202 | | | $ | 9,662 | | |
Portfolio turnover | | | 68 | % | | | 74 | % | | | 63 | % | |
Notes to Financial Highlights
(a) Based on operations from February 28, 2013 (commencement of operations) through the stated period end.
(b) Rounds to zero.
(c) In addition to the fees and expenses that the Fund bears directly, the Fund indirectly bears a pro rata share of the fees and expenses of any other funds in which it invests. Such indirect expenses are not included in the Fund's reported expense ratios.
(d) Total net expenses include the impact of certain fee waivers/expense reimbursements made by the Investment Manager and certain of its affiliates, if applicable.
(e) The benefits derived from expense reductions had an impact of less than 0.01%.
The accompanying Notes to Financial Statements are an integral part of this statement.
Annual Report 2016
23
COLUMBIA OVERSEAS VALUE FUND
FINANCIAL HIGHLIGHTS (continued)
| | | Year Ended
February 29, | | Year Ended February 28, | |
Class C | | 2016 | | 2015 | | 2014(a) | |
Per share data | |
Net asset value, beginning of period | | $ | 8.64 | | | $ | 9.18 | | | $ | 7.65 | | |
Income from investment operations: | |
Net investment income | | | 0.09 | | | | 0.13 | | | | 0.12 | | |
Net realized and unrealized gain (loss) | | | (1.17 | ) | | | (0.47 | ) | | | 1.49 | | |
Total from investment operations | | | (1.08 | ) | | | (0.34 | ) | | | 1.61 | | |
Less distributions to shareholders: | |
Net investment income | | | (0.12 | ) | | | (0.20 | ) | | | (0.08 | ) | |
Tax return of capital | | | — | | | | (0.00 | )(b) | | | — | | |
Total distributions to shareholders | | | (0.12 | ) | | | (0.20 | ) | | | (0.08 | ) | |
Net asset value, end of period | | $ | 7.44 | | | $ | 8.64 | | | $ | 9.18 | | |
Total return | | | (12.66 | %) | | | (3.60 | %) | | | 21.13 | % | |
Ratios to average net assets(c) | |
Total gross expenses | | | 2.19 | % | | | 2.16 | % | | | 2.46 | % | |
Total net expenses(d) | | | 2.19 | %(e) | | | 2.16 | %(e) | | | 2.16 | %(e) | |
Net investment income | | | 1.08 | % | | | 1.54 | % | | | 1.46 | % | |
Supplemental data | |
Net assets, end of period (in thousands) | | $ | 5,345 | | | $ | 4,597 | | | $ | 4,843 | | |
Portfolio turnover | | | 68 | % | | | 74 | % | | | 63 | % | |
Notes to Financial Highlights
(a) Based on operations from February 28, 2013 (commencement of operations) through the stated period end.
(b) Rounds to zero.
(c) In addition to the fees and expenses that the Fund bears directly, the Fund indirectly bears a pro rata share of the fees and expenses of any other funds in which it invests. Such indirect expenses are not included in the Fund's reported expense ratios.
(d) Total net expenses include the impact of certain fee waivers/expense reimbursements made by the Investment Manager and certain of its affiliates, if applicable.
(e) The benefits derived from expense reductions had an impact of less than 0.01%.
The accompanying Notes to Financial Statements are an integral part of this statement.
Annual Report 2016
24
COLUMBIA OVERSEAS VALUE FUND
FINANCIAL HIGHLIGHTS (continued)
| | | Year Ended
February 29, | | Year Ended February 28, | | Year Ended
February 29, | |
Class I | | 2016 | | 2015 | | 2014 | | 2013 | | 2012(a) | |
Per share data | |
Net asset value, beginning of period | | $ | 8.65 | | | $ | 9.20 | | | $ | 7.65 | | | $ | 7.22 | | | $ | 7.87 | | |
Income from investment operations: | |
Net investment income | | | 0.21 | | | | 0.24 | | | | 0.20 | | | | 0.20 | | | | 0.22 | | |
Net realized and unrealized gain (loss) | | | (1.19 | ) | | | (0.48 | ) | | | 1.51 | | | | 0.40 | | | | (0.62 | ) | |
Total from investment operations | | | (0.98 | ) | | | (0.24 | ) | | | 1.71 | | | | 0.60 | | | | (0.40 | ) | |
Less distributions to shareholders: | |
Net investment income | | | (0.21 | ) | | | (0.31 | ) | | | (0.16 | ) | | | (0.17 | ) | | | (0.25 | ) | |
Tax return of capital | | | — | | | | (0.00 | )(b) | | | — | | | | — | | | | — | | |
Total distributions to shareholders | | | (0.21 | ) | | | (0.31 | ) | | | (0.16 | ) | | | (0.17 | ) | | | (0.25 | ) | |
Net asset value, end of period | | $ | 7.46 | | | $ | 8.65 | | | $ | 9.20 | | | $ | 7.65 | | | $ | 7.22 | | |
Total return | | | (11.57 | %) | | | (2.43 | %) | | | 22.55 | % | | | 8.49 | % | | | (4.55 | %) | |
Ratios to average net assets(c) | |
Total gross expenses | | | 0.93 | % | | | 0.92 | % | | | 1.04 | % | | | 1.33 | % | | | 1.76 | %(d) | |
Total net expenses(e) | | | 0.93 | % | | | 0.92 | % | | | 0.98 | % | | | 1.07 | % | | | 0.84 | %(d) | |
Net investment income | | | 2.42 | % | | | 2.73 | % | | | 2.36 | % | | | 2.78 | % | | | 3.37 | %(d) | |
Supplemental data | |
Net assets, end of period (in thousands) | | $ | 247,603 | | | $ | 285,957 | | | $ | 98,706 | | | $ | 26,514 | | | $ | 28,376 | | |
Portfolio turnover | | | 68 | % | | | 74 | % | | | 63 | % | | | 46 | % | | | 96 | % | |
Notes to Financial Highlights
(a) Based on operations from March 31, 2011 (commencement of operations) through the stated period end.
(b) Rounds to zero.
(c) In addition to the fees and expenses that the Fund bears directly, the Fund indirectly bears a pro rata share of the fees and expenses of any other funds in which it invests. Such indirect expenses are not included in the Fund's reported expense ratios.
(d) Annualized.
(e) Total net expenses include the impact of certain fee waivers/expense reimbursements made by the Investment Manager and certain of its affiliates, if applicable.
The accompanying Notes to Financial Statements are an integral part of this statement.
Annual Report 2016
25
COLUMBIA OVERSEAS VALUE FUND
FINANCIAL HIGHLIGHTS (continued)
| | | Year Ended
February 29, | | Year Ended February 28, | |
Class K | | 2016 | | 2015 | | 2014(a) | |
Per share data | |
Net asset value, beginning of period | | $ | 8.65 | | | $ | 9.20 | | | $ | 7.65 | | |
Income from investment operations: | |
Net investment income | | | 0.19 | | | | 0.22 | | | | 0.20 | | |
Net realized and unrealized gain (loss) | | | (1.19 | ) | | | (0.49 | ) | | | 1.49 | | |
Total from investment operations | | | (1.00 | ) | | | (0.27 | ) | | | 1.69 | | |
Less distributions to shareholders: | |
Net investment income | | | (0.19 | ) | | | (0.28 | ) | | | (0.14 | ) | |
Tax return of capital | | | — | | | | (0.00 | )(b) | | | — | | |
Total distributions to shareholders | | | (0.19 | ) | | | (0.28 | ) | | | (0.14 | ) | |
Net asset value, end of period | | $ | 7.46 | | | $ | 8.65 | | | $ | 9.20 | | |
Total return | | | (11.80 | %) | | | (2.73 | %) | | | 22.25 | % | |
Ratios to average net assets(c) | |
Total gross expenses | | | 1.23 | % | | | 1.22 | % | | | 1.33 | % | |
Total net expenses(d) | | | 1.23 | % | | | 1.22 | % | | | 1.26 | % | |
Net investment income | | | 2.26 | % | | | 2.49 | % | | | 2.39 | % | |
Supplemental data | |
Net assets, end of period (in thousands) | | $ | 131 | | | $ | 172 | | | $ | 197 | | |
Portfolio turnover | | | 68 | % | | | 74 | % | | | 63 | % | |
Notes to Financial Highlights
(a) Based on operations from February 28, 2013 (commencement of operations) through the stated period end.
(b) Rounds to zero.
(c) In addition to the fees and expenses that the Fund bears directly, the Fund indirectly bears a pro rata share of the fees and expenses of any other funds in which it invests. Such indirect expenses are not included in the Fund's reported expense ratios.
(d) Total net expenses include the impact of certain fee waivers/expense reimbursements made by the Investment Manager and certain of its affiliates, if applicable.
The accompanying Notes to Financial Statements are an integral part of this statement.
Annual Report 2016
26
COLUMBIA OVERSEAS VALUE FUND
FINANCIAL HIGHLIGHTS (continued)
Class R4 | | Year Ended
February 29,
2016(a) | |
Per share data | |
Net asset value, beginning of period | | $ | 8.78 | | |
Income from investment operations: | |
Net investment income | | | 0.01 | | |
Net realized and unrealized loss | | | (1.17 | ) | |
Total from investment operations | | | (1.16 | ) | |
Less distributions to shareholders: | |
Net investment income | | | (0.19 | ) | |
Total distributions to shareholders | | | (0.19 | ) | |
Net asset value, end of period | | $ | 7.43 | | |
Total return | | | (13.43 | %) | |
Ratios to average net assets(b) | |
Total gross expenses | | | 1.23 | %(c) | |
Total net expenses(d) | | | 1.21 | %(c)(e) | |
Net investment income | | | 0.22 | %(c) | |
Supplemental data | |
Net assets, end of period (in thousands) | | $ | 1,425 | | |
Portfolio turnover | | | 68 | % | |
Notes to Financial Highlights
(a) Based on operations from July 1, 2015 (commencement of operations) through the stated period end.
(b) In addition to the fees and expenses that the Fund bears directly, the Fund indirectly bears a pro rata share of the fees and expenses of any other funds in which it invests. Such indirect expenses are not included in the Fund's reported expense ratios.
(c) Annualized.
(d) Total net expenses include the impact of certain fee waivers/expense reimbursements made by the Investment Manager and certain of its affiliates, if applicable.
(e) The benefits derived from expense reductions had an impact of less than 0.01%.
The accompanying Notes to Financial Statements are an integral part of this statement.
Annual Report 2016
27
COLUMBIA OVERSEAS VALUE FUND
FINANCIAL HIGHLIGHTS (continued)
Class R5 | | Year Ended
February 29,
2016(a) | |
Per share data | |
Net asset value, beginning of period | | $ | 8.78 | | |
Income from investment operations: | |
Net investment income | | | 0.02 | | |
Net realized and unrealized loss | | | (1.18 | ) | |
Total from investment operations | | | (1.16 | ) | |
Less distributions to shareholders: | |
Net investment income | | | (0.20 | ) | |
Total distributions to shareholders | | | (0.20 | ) | |
Net asset value, end of period | | $ | 7.42 | | |
Total return | | | (13.41 | %) | |
Ratios to average net assets(b) | |
Total gross expenses | | | 1.04 | %(c) | |
Total net expenses(d) | | | 1.04 | %(c) | |
Net investment income | | | 0.45 | %(c) | |
Supplemental data | |
Net assets, end of period (in thousands) | | $ | 768 | | |
Portfolio turnover | | | 68 | % | |
Notes to Financial Highlights
(a) Based on operations from July 1, 2015 (commencement of operations) through the stated period end.
(b) In addition to the fees and expenses that the Fund bears directly, the Fund indirectly bears a pro rata share of the fees and expenses of any other funds in which it invests. Such indirect expenses are not included in the Fund's reported expense ratios.
(c) Annualized.
(d) Total net expenses include the impact of certain fee waivers/expense reimbursements made by the Investment Manager and certain of its affiliates, if applicable.
The accompanying Notes to Financial Statements are an integral part of this statement.
Annual Report 2016
28
COLUMBIA OVERSEAS VALUE FUND
FINANCIAL HIGHLIGHTS (continued)
| | | Year Ended
February 29, | | Year Ended February 28, | | Year Ended
February 29, | |
Class W | | 2016 | | 2015 | | 2014 | | 2013 | | 2012(a) | |
Per share data | |
Net asset value, beginning of period | | $ | 8.64 | | | $ | 9.19 | | | $ | 7.65 | | | $ | 7.22 | | | $ | 7.87 | | |
Income from investment operations: | |
Net investment income | | | 0.19 | | | | 0.21 | | | | 0.19 | | | | 0.17 | | | | 0.22 | | |
Net realized and unrealized gain (loss) | | | (1.21 | ) | | | (0.50 | ) | | | 1.48 | | | | 0.42 | | | | (0.64 | ) | |
Total from investment operations | | | (1.02 | ) | | | (0.29 | ) | | | 1.67 | | | | 0.59 | | | | (0.42 | ) | |
Less distributions to shareholders: | |
Net investment income | | | (0.17 | ) | | | (0.26 | ) | | | (0.13 | ) | | | (0.16 | ) | | | (0.23 | ) | |
Tax return of capital | | | — | | | | (0.00 | )(b) | | | — | | | | — | | | | — | | |
Total distributions to shareholders | | | (0.17 | ) | | | (0.26 | ) | | | (0.13 | ) | | | (0.16 | ) | | | (0.23 | ) | |
Net asset value, end of period | | $ | 7.45 | | | $ | 8.64 | | | $ | 9.19 | | | $ | 7.65 | | | $ | 7.22 | | |
Total return | | | (11.97 | %) | | | (2.93 | %) | | | 21.97 | % | | | 8.24 | % | | | (4.81 | %) | |
Ratios to average net assets(c) | |
Total gross expenses | | | 1.44 | % | | | 1.40 | % | | | 1.63 | % | | | 1.58 | % | | | 2.09 | %(d) | |
Total net expenses(e) | | | 1.44 | %(f) | | | 1.40 | %(f) | | | 1.41 | %(f) | | | 1.33 | % | | | 1.12 | %(d) | |
Net investment income | | | 2.17 | % | | | 2.41 | % | | | 2.21 | % | | | 2.46 | % | | | 3.24 | %(d) | |
Supplemental data | |
Net assets, end of period (in thousands) | | $ | 130,496 | | | $ | 208,707 | | | $ | 303,273 | | | $ | 2 | | | $ | 2 | | |
Portfolio turnover | | | 68 | % | | | 74 | % | | | 63 | % | | | 46 | % | | | 96 | % | |
Notes to Financial Highlights
(a) Based on operations from March 31, 2011 (commencement of operations) through the stated period end.
(b) Rounds to zero.
(c) In addition to the fees and expenses that the Fund bears directly, the Fund indirectly bears a pro rata share of the fees and expenses of any other funds in which it invests. Such indirect expenses are not included in the Fund's reported expense ratios.
(d) Annualized.
(e) Total net expenses include the impact of certain fee waivers/expense reimbursements made by the Investment Manager and certain of its affiliates, if applicable.
(f) The benefits derived from expense reductions had an impact of less than 0.01%.
The accompanying Notes to Financial Statements are an integral part of this statement.
Annual Report 2016
29
COLUMBIA OVERSEAS VALUE FUND
FINANCIAL HIGHLIGHTS (continued)
Class Y | | Year Ended
February 29,
2016(a) | |
Per share data | |
Net asset value, beginning of period | | $ | 8.78 | | |
Income from investment operations: | |
Net investment income | | | 0.07 | | |
Net realized and unrealized loss | | | (1.22 | ) | |
Total from investment operations | | | (1.15 | ) | |
Less distributions to shareholders: | |
Net investment income | | | (0.21 | ) | |
Total distributions to shareholders | | | (0.21 | ) | |
Net asset value, end of period | | $ | 7.42 | | |
Total return | | | (13.34 | %) | |
Ratios to average net assets(b) | |
Total gross expenses | | | 0.92 | %(c) | |
Total net expenses(d) | | | 0.92 | %(c) | |
Net investment income | | | 1.26 | %(c) | |
Supplemental data | |
Net assets, end of period (in thousands) | | $ | 2 | | |
Portfolio turnover | | | 68 | % | |
Notes to Financial Highlights
(a) Based on operations from July 1, 2015 (commencement of operations) through the stated period end.
(b) In addition to the fees and expenses that the Fund bears directly, the Fund indirectly bears a pro rata share of the fees and expenses of any other funds in which it invests. Such indirect expenses are not included in the Fund's reported expense ratios.
(c) Annualized.
(d) Total net expenses include the impact of certain fee waivers/expense reimbursements made by the Investment Manager and certain of its affiliates, if applicable.
The accompanying Notes to Financial Statements are an integral part of this statement.
Annual Report 2016
30
COLUMBIA OVERSEAS VALUE FUND
FINANCIAL HIGHLIGHTS (continued)
| | | Year Ended
February 29, | | Year Ended February 28, | | Year Ended
February 29, | | Year Ended
February 28, | |
Class Z | | 2016 | | 2015 | | 2014 | | 2013 | | 2012 | | 2011 | |
Per share data | |
Net asset value, beginning of period | | $ | 8.66 | | | $ | 9.20 | | | $ | 7.66 | | | $ | 7.23 | | | $ | 8.00 | | | $ | 6.98 | | |
Income from investment operations: | |
Net investment income | | | 0.10 | | | | 0.23 | | | | 0.40 | | | | 0.19 | | | | 0.32 | | | | 0.16 | | |
Net realized and unrealized gain (loss) | | | (1.11 | ) | | | (0.48 | ) | | | 1.29 | | | | 0.41 | | | | (0.85 | ) | | | 1.01 | | |
Total from investment operations | | | (1.01 | ) | | | (0.25 | ) | | | 1.69 | | | | 0.60 | | | | (0.53 | ) | | | 1.17 | | |
Less distributions to shareholders: | |
Net investment income | | | (0.19 | ) | | | (0.29 | ) | | | (0.15 | ) | | | (0.17 | ) | | | (0.24 | ) | | | (0.15 | ) | |
Tax return of capital | | | — | | | | (0.00 | )(a) | | | — | | | | — | | | | — | | | | — | | |
Total distributions to shareholders | | | (0.19 | ) | | | (0.29 | ) | | | (0.15 | ) | | | (0.17 | ) | | | (0.24 | ) | | | (0.15 | ) | |
Net asset value, end of period | | $ | 7.46 | | | $ | 8.66 | | | $ | 9.20 | | | $ | 7.66 | | | $ | 7.23 | | | $ | 8.00 | | |
Total return | | | (11.87 | %) | | | (2.56 | %) | | | 22.19 | % | | | 8.45 | % | | | (6.17 | %) | | | 17.06 | % | |
Ratios to average net assets(b) | |
Total gross expenses | | | 1.22 | % | | | 1.16 | % | | | 1.52 | % | | | 1.32 | % | | | 1.87 | % | | | 3.65 | % | |
Total net expenses(c) | | | 1.20 | %(d) | | | 1.16 | %(d) | | | 1.21 | %(d) | | | 1.07 | % | | | 0.98 | % | | | 1.15 | %(d) | |
Net investment income | | | 1.25 | % | | | 2.64 | % | | | 4.97 | % | | | 2.72 | % | | | 3.80 | % | | | 2.18 | % | |
Supplemental data | |
Net assets, end of period (in thousands) | | $ | 3,660 | | | $ | 340 | | | $ | 88 | | | $ | 2,680 | | | $ | 2,521 | | | $ | 8,690 | | |
Portfolio turnover | | | 68 | % | | | 74 | % | | | 63 | % | | | 46 | % | | | 96 | % | | | 48 | % | |
Notes to Financial Highlights
(a) Rounds to zero.
(b) In addition to the fees and expenses that the Fund bears directly, the Fund indirectly bears a pro rata share of the fees and expenses of any other funds in which it invests. Such indirect expenses are not included in the Fund's reported expense ratios.
(c) Total net expenses include the impact of certain fee waivers/expense reimbursements made by the Investment Manager and certain of its affiliates, if applicable.
(d) The benefits derived from expense reductions had an impact of less than 0.01%.
The accompanying Notes to Financial Statements are an integral part of this statement.
Annual Report 2016
31
COLUMBIA OVERSEAS VALUE FUND
NOTES TO FINANCIAL STATEMENTS
February 29, 2016
Note 1. Organization
Columbia Overseas Value Fund (the Fund), a series of Columbia Funds Series Trust (the Trust), is a diversified fund. The Trust is registered under the Investment Company Act of 1940, as amended (the 1940 Act), as an open-end management investment company organized as a Delaware statutory trust.
Fund Shares
The Trust may issue an unlimited number of shares (without par value). The Fund offers Class A, Class B, Class C, Class I, Class K, Class R4, Class R5, Class W, Class Y and Class Z shares. Effective March 1, 2016, the Fund also offers Class R shares. Although all share classes generally have identical voting, dividend and liquidation rights, each share class votes separately when required by the Trust's organizational documents or by law. Different share classes pay different distribution amounts to the extent the expenses of such share classes differ, and distributions in liquidation will be proportional to the net asset value of each share class. Each share class has its own expense and sales charge structure.
Class A shares are subject to a maximum front-end sales charge of 5.75% based on the initial investment amount. Class A shares purchased without an initial sales charge in accounts aggregating $1 million to $50 million at the time of purchase are subject to a contingent deferred sales charge (CDSC) if the shares are sold within 18 months after purchase, charged as follows: 1.00% CDSC if redeemed within 12 months after purchase, and 0.50% CDSC if redeemed more than 12, but less than 18, months after purchase.
Class B shares may be subject to a maximum CDSC of 5.00% based upon the holding period after purchase. Class B shares will generally convert to Class A shares eight years after purchase. The Fund no longer accepts investments by new or existing investors in the Fund's Class B shares, except in connection with the reinvestment of any dividend and/or capital gain distributions in Class B shares of the Fund and exchanges by existing Class B shareholders of certain other funds within the Columbia Family of Funds.
Class C shares are subject to a 1.00% CDSC on shares redeemed within 12 months after purchase.
Class I shares are not subject to sales charges and are available only to the Columbia Family of Funds.
Class K shares are not subject to sales charges, however this share class is closed to new investors.
Class R shares are not subject to sales charges and are generally available only to certain retirement plans and other investors as described in the Fund's prospectus. Class R shares commenced operations on March 1, 2016.
Class R4 shares are not subject to sales charges and are generally available only to omnibus retirement plans and certain investors as described in the Fund's prospectus. Class R4 shares commenced operations on July 1, 2015.
Class R5 shares are not subject to sales charges and are generally available only to investors purchasing through authorized investment professionals and omnibus retirement plans. Class R5 shares commenced operations on July 1, 2015.
Class W shares are not subject to sales charges and are available only to investors purchasing through authorized investment programs managed by investment professionals, including discretionary managed account programs.
Class Y shares are not subject to sales charges and are generally available only to certain retirement plans as described in the Fund's prospectus. Class Y shares commenced operations on July 1, 2015.
Class Z shares are not subject to sales charges and are available only to eligible investors, which are subject to different investment minimums as described in the Fund's prospectus.
Note 2. Summary of Significant Accounting Policies
Basis of Preparation
The Fund is an investment company that applies the accounting and reporting guidance in the Financial Accounting Standards Board (FASB) Accounting Standards Codification Topic 946, Financial Services — Investment Companies (ASC 946). The financial statements are prepared in accordance with U.S. generally accepted accounting principles (GAAP), which requires management to make certain estimates and assumptions that affect the reported amounts of assets and liabilities, the disclosure of contingent assets and liabilities at the date of the financial statements and the reported amounts of income and expenses during the reporting period. Actual results could differ from those estimates.
Annual Report 2016
32
COLUMBIA OVERSEAS VALUE FUND
NOTES TO FINANCIAL STATEMENTS (continued)
February 29, 2016
The following is a summary of significant accounting policies followed by the Fund in the preparation of its financial statements.
Security Valuation
All equity securities and exchange-traded funds are valued at the close of business of the New York Stock Exchange (NYSE). Equity securities and exchange-traded funds are valued at the last quoted sales price on the principal exchange or market on which they trade, except for securities traded on the NASDAQ Stock Market, which are valued at the NASDAQ official close price. Unlisted securities or listed securities for which there were no sales during the day are valued at the mean of the latest quoted bid and ask prices on such exchanges or markets.
Foreign equity securities are valued based on the closing price on the foreign exchange in which such securities are primarily traded. If any foreign equity security closing prices are not readily available, the securities are valued at the mean of the latest quoted bid and ask prices on such exchanges or markets. Foreign currency exchange rates are generally determined at 4:00 p.m. Eastern (U.S.) time. Many securities markets and exchanges outside the U.S. close prior to the close of the NYSE; therefore, the closing prices for securities in such markets or on such exchanges may not fully reflect events that occur after such close but before the close of the NYSE. In those situations, foreign securities will be fair valued pursuant to a policy adopted by the Board of Trustees (the Board), including, if available, utilizing a third party pricing service to determine these fair values. The third party pricing service takes into account multiple factors, including, but not limited to, movements in the U.S. securities markets, certain depositary receipts, futures contracts and foreign exchange rates that have occurred subsequent to the close of the foreign exchange or market, to determine a good faith estimate that reasonably reflects the current market conditions as of the close of the NYSE. The fair value of a security is likely to be different from the quoted or published price, if available.
Investments in open-end investment companies, including money market funds, are valued at their latest net asset value.
Forward foreign currency exchange contracts are marked-to-market based upon foreign currency exchange rates provided by a pricing service.
Option contracts are valued at the mean of the latest quoted bid and ask prices on their primary exchanges. Option contracts, including over-the-counter option contracts, with no readily available market quotations are valued using quotes obtained from independent brokers as of the close of the NYSE.
Investments for which market quotations are not readily available, or that have quotations which management believes are not reflective of market value or reliable, are valued at fair value as determined in good faith under procedures approved by and under the general supervision of the Board. If a security or class of securities (such as foreign securities) is valued at fair value, such value is likely to be different from the quoted or published price for the security.
The determination of fair value often requires significant judgment. To determine fair value, management may use assumptions including but not limited to future cash flows and estimated risk premiums. Multiple inputs from various sources may be used to determine fair value.
GAAP requires disclosure regarding the inputs and valuation techniques used to measure fair value and any changes in valuation inputs or techniques. In addition, investments shall be disclosed by major category. This information is disclosed following the Fund's Portfolio of Investments.
Foreign Currency Transactions and Translations
The values of all assets and liabilities denominated in foreign currencies are generally translated into U.S. dollars at exchange rates determined at the close of the NYSE on any given day. Net realized and unrealized gains (losses) on foreign currency transactions and translations include gains (losses) arising from the fluctuation in exchange rates between trade and settlement dates on securities transactions, gains (losses) arising from the disposition of foreign currency and currency gains (losses) between the accrual and payment dates on dividends, interest income and foreign withholding taxes.
For financial statement purposes, the Fund does not distinguish that portion of gains (losses) on investments which is due to changes in foreign exchange rates from that which is due to changes in market prices of the investments. Such fluctuations are included with the net realized and unrealized gains (losses) on investments in the Statement of Operations.
Annual Report 2016
33
COLUMBIA OVERSEAS VALUE FUND
NOTES TO FINANCIAL STATEMENTS (continued)
February 29, 2016
Derivative Instruments
The Fund invests in certain derivative instruments, as detailed below, to meet its investment objectives. Derivatives are instruments whose values depend on, or are derived from, in whole or in part, the value of one or more securities, currencies, commodities, indices, or other assets or instruments. Derivatives may be used to increase investment flexibility (including to maintain cash reserves while maintaining desired exposure to certain assets), for risk management (hedging) purposes, to facilitate trading, to reduce transaction costs and to pursue higher investment returns. The Fund may also use derivative instruments to mitigate certain investment risks, such as foreign currency exchange rate risk, interest rate risk and credit risk. Derivatives may involve various risks, including the potential inability of the counterparty to fulfill its obligation under the terms of the contract, the potential for an illiquid secondary market (making it difficult for the Fund to sell, including at favorable prices) and the potential for market movements which may expose the Fund to gains or losses in excess of the amount shown in the Statement of Assets and Liabilities. The notional amounts of derivative instruments, if applicable, are not recorded in the financial statements.
A derivative instrument may suffer a marked-to-market loss if the value of the contract decreases due to an unfavorable change in the market rates or values of the underlying instrument. Losses can also occur if the counterparty does not perform under the contract. The Fund's risk of loss from counterparty credit risk on over-the-counter derivatives is generally limited to the aggregate unrealized gain netted against any collateral held by the Fund and the amount of any variation margin held by the counterparty. With exchange-traded or centrally cleared derivatives, there is reduced counterparty credit risk to the Fund since the exchange's clearinghouse, as counterparty to such instruments, guarantees against a possible default. The clearinghouse stands between the buyer and the seller of the contract; therefore, the counterparty credit risk is failure of the clearinghouse. However, credit risk still exists in exchange-traded or centrally cleared derivatives with respect to initial and variation margin that is held in a broker's customer account. While brokers are required to segregate customer margin from their own assets, in the event that a broker becomes insolvent or goes into bankruptcy and at that time there is a shortfall in the aggregate amount of margin held by the broker for all its clients, U.S. bankruptcy laws will typically allocate that
shortfall on a pro-rata basis across all the broker's customers (including the Fund), potentially resulting in losses to the Fund.
In order to better define its contractual rights and to secure rights that will help the Fund mitigate its counterparty risk, the Fund may enter into an International Swaps and Derivatives Association, Inc. Master Agreement (ISDA Master Agreement) or similar agreement with its derivatives contract counterparties. An ISDA Master Agreement is an agreement between the Fund and a counterparty that governs over-the-counter derivatives and forward foreign currency exchange contracts and typically contains, among other things, collateral posting terms and netting provisions in the event of a default and/or termination event. Under an ISDA Master Agreement, the Fund may, under certain circumstances, offset with the counterparty certain derivative instrument's payables and/or receivables with collateral held and/or posted and create one single net payment. The provisions of the ISDA Master Agreement typically permit a single net payment in the event of default (close-out netting) including the bankruptcy or insolvency of the counterparty. Note, however, that bankruptcy or insolvency laws of a particular jurisdiction may impose restrictions on or prohibitions against the right of offset in bankruptcy, insolvency or other events.
Collateral (margin) requirements differ by type of derivative. Margin requirements are established by the exchange or clearinghouse for exchange-traded and centrally cleared derivatives. Brokers can ask for margin in excess of the minimum in certain circumstances. Collateral terms are contract specific for over-the-counter derivatives. For over-the-counter derivatives traded under an ISDA Master Agreement, the collateral requirements are typically calculated by netting the marked-to-market amount for each transaction under such agreement and comparing that amount to the value of any variation margin currently pledged by the Fund and/or the counterparty. Generally, the amount of collateral due from or to a party has to exceed a minimum transfer amount threshold (e.g., $500,000) before a transfer has to be made. To the extent amounts due to the Fund from its counterparties are not fully collateralized, contractually or otherwise, the Fund bears the risk of loss from counterparty nonperformance. The Fund attempts to mitigate counterparty risk by only entering into agreements with counterparties that it believes have the financial resources to honor their obligations and by monitoring the financial stability of those counterparties.
Annual Report 2016
34
COLUMBIA OVERSEAS VALUE FUND
NOTES TO FINANCIAL STATEMENTS (continued)
February 29, 2016
Certain ISDA Master Agreements allow counterparties to over-the-counter derivatives transactions to terminate derivatives contracts prior to maturity in the event the Fund's net asset value declines by a stated percentage over a specified time period or if the Fund fails to meet certain terms of the ISDA Master Agreement, which would cause the Fund to accelerate payment of any net liability owed to the counterparty. The Fund also has termination rights if the counterparty fails to meet certain terms of the ISDA Master Agreement. In addition to considering counterparty credit risk, the Fund would consider terminating the derivatives contracts based on whether termination would result in a net liability owed from the counterparty.
For financial reporting purposes, the Fund does not offset derivative assets and derivative liabilities that are subject to netting arrangements in the Statement of Assets and Liabilities.
Forward Foreign Currency Exchange Contracts
Forward foreign currency exchange contracts are over-the-counter agreements between two parties to buy and sell a currency at a set price on a future date. The Fund utilized forward foreign currency exchange contracts to hedge the currency exposure associated with some or all of the Fund's securities, to shift investment exposure from one currency to another and to shift U.S. dollar exposure to achieve a representative weighted mix of major currencies in its benchmark and/or to recover an underweight country exposure in its portfolio. These instruments may be used for other purposes in future periods.
The values of forward foreign currency exchange contracts fluctuate daily with changes in foreign currency exchange rates. Changes in the value of these contracts are recorded as unrealized appreciation or depreciation until the contract is exercised or has expired. The Fund will realize a gain or loss when the forward foreign currency exchange contract is closed or expires.
The use of forward foreign currency exchange contracts does not eliminate fluctuations in the prices of the Fund's portfolio securities. The risks of forward foreign currency exchange contracts include movement in the values of the foreign currencies relative to the U.S. dollar (or other foreign currencies) and the possibility that counterparties will not complete their contractual obligations, which may be in excess of the amount reflected, if any, in the Statement of Assets and Liabilities.
Options Contracts
Options are contracts which entitle the holder to purchase or sell securities or other identified assets at a specified price, or in the case of index option contracts, to receive or pay the difference between the index value and the strike price of the index option contract. Option contracts can be either exchange-traded or over-the-counter. The Fund purchased and wrote option contracts to decrease the Fund's exposure to equity market risk and to increase return on investments and to facilitate buying and selling of securities for investments. These instruments may be used for other purposes in future periods. Completion of transactions for option contracts traded in the over-the-counter market depends upon the performance of the other party. Cash collateral may be collected or posted by the Fund to secure certain over-the-counter option contract trades. Cash collateral held or posted by the Fund for such option contract trades must be returned to the counterparty or the Fund upon closure, exercise or expiration of the contract.
Options contracts purchased are recorded as investments. When the Fund writes an options contract, the premium received is recorded as an asset and an amount equivalent to the premium is recorded as a liability in the Statement of Assets and Liabilities and is subsequently adjusted to reflect the current fair value of the option written. Changes in the fair value of the written option are recorded as unrealized appreciation or depreciation until the contract is exercised or has expired. The Fund will realize a gain or loss when the option contract is closed or expires. When option contracts are exercised, the proceeds on sales for a written call or purchased put option contract, or the purchase cost for a written put or purchased call option contract, is adjusted by the amount of premium received or paid.
For over-the-counter options purchased, the Fund bears the risk of loss of the amount of the premiums paid plus the positive change in market values net of any collateral held by the Fund should the counterparty fail to perform under the contracts. Option contracts written by the Fund do not typically give rise to counterparty credit risk, as options written generally obligate the Fund and not the counterparty to perform. The risk in writing a call option contract is that the Fund gives up the opportunity for profit if the market price of the security increases above the strike price and the option contract is exercised. The risk in writing a put option contract is that the Fund may incur a loss if the market price of the security decreases
Annual Report 2016
35
COLUMBIA OVERSEAS VALUE FUND
NOTES TO FINANCIAL STATEMENTS (continued)
February 29, 2016
below the strike price and the option contract is exercised. Exercise of a written option could result in the Fund purchasing or selling a security or foreign currency when it otherwise would not, or at a price different from the current market value. In purchasing and writing options, the Fund bears the risk of an unfavorable change in the value of the underlying instrument or the risk that the Fund may not be able to enter into a closing transaction due to an illiquid market.
Contracts and premiums associated with options contracts written for the year ended February 29, 2016 are as follows:
| | | Calls | |
| | | Contracts | | Premiums ($) | |
Balance at February 28, 2015 | | | — | | | | — | | |
Opened | | | 184 | | | | 17,304 | | |
Expired | | | (184 | ) | | | (17,304 | ) | |
Balance at February 29, 2016 | | | — | | | | — | | |
Effects of Derivative Transactions in the Financial Statements
The following tables are intended to provide additional information about the effect of derivatives on the financial statements of the Fund, including: the fair value of derivatives by risk category and the location of those fair values in the Statement of Assets and Liabilities; and the impact of derivative transactions over the period in the Statement of Operations, including realized and unrealized gains (losses). The derivative instrument schedules following the Portfolio of Investments present additional information regarding derivative instruments outstanding at the end of the period, if any.
The following table is a summary of the fair value of derivative instruments (not considered to be hedging instruments for accounting disclosure purposes) at February 29, 2016:
Asset Derivatives | |
Risk Exposure
Category | | Statement of Assets and
Liabilities Location | | Fair Value ($) | |
Foreign exchange
risk
| | Unrealized appreciation on
forward foreign currency
exchange contracts | | | 185,419
| | |
Liability Derivatives | |
Risk Exposure
Category | | Statement of Assets and
Liabilities Location | | Fair Value ($) | |
Foreign exchange
risk
| | Unrealized depreciation on
forward foreign currency
exchange contracts | | | 449,580
| | |
The following table indicates the effect of derivative instruments (not considered to be hedging instruments
for accounting disclosure purposes) in the Statement of Operations for the year ended February 29, 2016:
Amount of Realized Gain (Loss) on Derivatives Recognized in Income | |
Risk Exposure
Category | | Forward Foreign
Currency Exchange
Contracts ($) | | Options
Contracts
Written ($) | | Total ($) | |
Equity risk | | | — | | | | 17,304 | | | | 17,304 | | |
Foreign exchange
risk | | | (2,398,014 | ) | | | — | | | | (2,398,014 | ) | |
Total | | | (2,398,014 | ) | | | 17,304 | | | | (2,380,710 | ) | |
Change in Unrealized Appreciation (Depreciation) on
Derivatives Recognized in Income | |
Risk Exposure
Category | | Forward Foreign
Currency Exchange
Contracts ($) | | | |
Foreign exchange
risk | | (1,216,729) | | | |
The following table provides a summary of the average outstanding volume by derivative instrument for the year ended February 29, 2016:
Derivative Instrument | | Average Market Value ($)* | |
Options contracts — Written | | | (220 | ) | |
Derivative Instrument | | Average
Unrealized
Appreciation ($)** | | Average
Unrealized
Depreciation ($)** | |
Forward foreign currency
exchange contracts | | | 738,371 | | | | (1,343,054 | ) | |
*Based on the ending daily outstanding amounts for the year ended February 29, 2016.
**Based on the ending quarterly outstanding amounts for the year ended February 29, 2016.
Offsetting of Assets and Liabilities
The following table presents the Fund's gross and net amount of assets and liabilities available for offset under netting arrangements as well as any related collateral received or pledged by the Fund as of February 29, 2016:
| | | Morgan Stanley ($) | |
Assets | |
Forward foreign currency exchange contracts | | | 185,419 | | |
Liabilities | |
Forward foreign currency exchange contracts | | | 449,580 | | |
Total Financial and Derivative Net Assets | | | (264,161 | ) | |
Total collateral received (pledged)(a) | | | — | | |
Net Amount(b) | | | (264,161 | ) | |
(a) In some instances, the actual collateral received and/or pledged may be more than the amount shown due to overcollateralization.
(b) Represents the net amount due from/(to) counterparties in the event of default.
Annual Report 2016
36
COLUMBIA OVERSEAS VALUE FUND
NOTES TO FINANCIAL STATEMENTS (continued)
February 29, 2016
Security Transactions
Security transactions are accounted for on the trade date. Cost is determined and gains (losses) are based upon the specific identification method for both financial statement and federal income tax purposes.
Income Recognition
Corporate actions and dividend income are generally recorded net of any non-reclaimable tax withholdings, on the ex-dividend date or upon receipt of ex-dividend notification in the case of certain foreign securities.
The Fund may receive distributions from holdings in equity securities, business development companies (BDCs), exchange-traded funds, other regulated investment companies (RICs), and real estate investment trusts (REITs), which report information on the tax character of their distributions annually. These distributions are allocated to dividend income, capital gain and return of capital based on actual information reported. Return of capital is recorded as a reduction of the cost basis of securities held. If the Fund no longer owns the applicable securities, return of capital is recorded as a realized gain. With respect to REITs, to the extent actual information has not yet been reported, estimates for return of capital are made by the Fund's management. Management's estimates are subsequently adjusted when the actual character of the distributions is disclosed by the REITs, which could result in a proportionate change in return of capital to shareholders.
Awards from class action litigation are recorded as a reduction of cost basis if the Fund still owns the applicable securities on the payment date. If the Fund no longer owns the applicable securities, the proceeds are recorded as realized gains.
Expenses
General expenses of the Trust are allocated to the Fund and other funds of the Trust based upon relative net assets or other expense allocation methodologies determined by the nature of the expense. Expenses directly attributable to the Fund are charged to the Fund. Expenses directly attributable to a specific class of shares are charged to that share class.
Determination of Class Net Asset Value
All income, expenses (other than class-specific expenses, which are charged to that share class, as shown in the Statement of Operations) and realized and unrealized gains (losses) are allocated to each class of the Fund on a daily basis, based on the relative net
assets of each class, for purposes of determining the net asset value of each class.
Federal Income Tax Status
The Fund intends to qualify each year as a regulated investment company under Subchapter M of the Internal Revenue Code, as amended, and will distribute substantially all of its taxable income (including net short-term capital gains), if any, for its tax year, and as such will not be subject to federal income taxes. In addition, the Fund intends to distribute in each calendar year substantially all of its net investment income, capital gains and certain other amounts, if any, such that the Fund should not be subject to federal excise tax. Therefore, no federal income or excise tax provision is recorded.
Foreign Taxes
The Fund may be subject to foreign taxes on income, gains on investments or currency repatriation, a portion of which may be recoverable. The Fund will accrue such taxes and recoveries, as applicable, based upon its current interpretation of tax rules and regulations that exist in the markets in which it invests.
Realized gains in certain countries may be subject to foreign taxes at the Fund level, based on statutory rates. The Fund accrues for such foreign taxes on realized and unrealized gains at the appropriate rate for each jurisdiction, as applicable. The amount, if any, is disclosed as a liability on the Statement of Assets and Liabilities.
Distributions to Shareholders
Distributions from net investment income, if any, are declared and paid semi-annually. Net realized capital gains, if any, are distributed at least annually. Income distributions and capital gain distributions are determined in accordance with federal income tax regulations, which may differ from GAAP.
Guarantees and Indemnifications
Under the Trust's organizational documents and, in some cases, by contract, its officers and trustees are indemnified against certain liabilities arising out of the performance of their duties to the Trust or its funds. In addition, certain of the Fund's contracts with its service providers contain general indemnification clauses. The Fund's maximum exposure under these arrangements is unknown since the amount of any future claims that may be made against the Fund cannot be determined, and
Annual Report 2016
37
COLUMBIA OVERSEAS VALUE FUND
NOTES TO FINANCIAL STATEMENTS (continued)
February 29, 2016
the Fund has no historical basis for predicting the likelihood of any such claims.
Recent Accounting Pronouncement
Fair Value Measurement (Topic 820), Disclosure for Investments in Certain Entities That Calculate Net Asset Value per Share (or Its Equivalent)
In May 2015, FASB issued Accounting Standards Update (ASU) No. 2015-07, Fair Value Measurement (Topic 820), Disclosure for Investments in Certain Entities That Calculate Net Asset Value per Share (or Its Equivalent). ASU No. 2015-07 changes the disclosure requirements for investments for which fair value is measured using the net asset value per share practical expedient. The disclosure requirements are effective for annual periods beginning after December 15, 2015 and interim periods within those fiscal years. At this time, management is evaluating the implications of this guidance and the impact it will have on the financial statement amounts and footnote disclosures, if any.
Note 3. Fees and Other Transactions with Affiliates
Management Fees
Effective July 1, 2015, the Fund entered into a Management Agreement with Columbia Management Investment Advisers, LLC (the Investment Manager), a wholly-owned subsidiary of Ameriprise Financial, Inc. (Ameriprise Financial). Under the Management Agreement, the Investment Manager provides the Fund with investment research and advice, as well as administrative and accounting services. The management services fee is an annual fee that is equal to a percentage of the Fund's average daily net assets that declines from 0.87% to 0.67% as the Fund's net assets increase. The effective management services fee rate for the year ended February 29, 2016 was 0.86% of the Fund's average daily net assets.
Prior to July 1, 2015, the Fund paid the Investment Manager an annual fee for advisory services under an Investment Management Services Agreement and a separate annual fee for administrative and accounting services under an Administrative Services Agreement. For the period from March 1, 2015 through June 30, 2015, the investment advisory services fee paid to the Investment Manager was $1,812,605, and the administrative services fee paid to the Investment Manager was $183,269.
Other Expenses
Other expenses are for, among other things, miscellaneous expenses of the Fund or the Board, including payments to Board Services Corp., a company providing limited administrative services to the Fund and the Board. That company's expenses include boardroom and office expense, employee compensation, employee health and retirement benefits, and certain other expenses. For the year ended February 29, 2016, other expenses paid by the Fund to this company were $2,313.
Compensation of Board Members
Board members, who are not officers or employees of the Investment Manager or Ameriprise Financial, are compensated for their services to the Fund as disclosed in the Statement of Operations. Under a Deferred Compensation Plan (the Plan), these Board members may elect to defer payment of up to 100% of their compensation. Deferred amounts are treated as though equivalent dollar amounts had been invested in shares of certain funds managed by the Investment Manager. The Fund's liability for these amounts is adjusted for market value changes and remains in the Fund until distributed in accordance with the Plan. All amounts payable under the Plan constitute a general unsecured obligation of the Fund.
Transfer Agency Fees
Under a Transfer and Dividend Disbursing Agent Agreement, Columbia Management Investment Services Corp. (the Transfer Agent), an affiliate of the Investment Manager and a wholly-owned subsidiary of Ameriprise Financial, is responsible for providing transfer agency services to the Fund. The Transfer Agent has contracted with Boston Financial Data Services (BFDS) to serve as sub-transfer agent.
The Transfer Agent receives a monthly transfer agency fee based on the number or the average value of accounts, depending on the type of account. In addition, the Transfer Agent also receives sub-transfer agency fees based on a percentage of the average aggregate value of the Fund's shares maintained in omnibus accounts (other than omnibus accounts for which American Enterprise Investment Services Inc. is the broker of record or accounts where the beneficial shareholder is a customer of Ameriprise Financial Services, Inc., for which the Transfer Agent receives a per account fee). The Transfer Agent pays the fees of BFDS for services as sub-transfer agent and is not entitled to reimbursement for
Annual Report 2016
38
COLUMBIA OVERSEAS VALUE FUND
NOTES TO FINANCIAL STATEMENTS (continued)
February 29, 2016
such fees from the Fund (with the exception of out-of-pocket fees).
The Transfer Agent also receives compensation from the Fund for various shareholder services and reimbursements for certain out-of-pocket fees. Total transfer agency fees for Class K and Class R5 shares are subject to an annual limitation of not more than 0.05% of the average daily net assets attributable to each share class. Class I and Class Y shares do not pay transfer agency fees.
For the year ended February 29, 2016, the Fund's effective transfer agency fee rates as a percentage of average daily net assets of each class were as follows:
Class A | | | 0.26 | % | |
Class B | | | 0.25 | | |
Class C | | | 0.26 | | |
Class K | | | 0.05 | | |
Class R4* | | | 0.27 | | |
Class R5* | | | 0.05 | | |
Class W | | | 0.25 | | |
Class Z | | | 0.27 | | |
*Annualized.
An annual minimum account balance fee of $20 may apply to certain accounts with a value below the applicable share class's initial minimum investment requirements to reduce the impact of small accounts on transfer agency fees. These minimum account balance fees are remitted to the Fund and recorded as part of expense reductions in the Statement of Operations. For the year ended February 29, 2016, these minimum account balance fees reduced total expenses of the Fund by $15.
Plan Administration Fees
Under a Plan Administration Services Agreement with the Transfer Agent, the Fund pays an annual fee at a rate of 0.25% of the Fund's average daily net assets attributable to Class K shares for the provision of various administrative, recordkeeping, communication and educational services.
Distribution and Service Fees
The Fund has an agreement with Columbia Management Investment Distributors, Inc. (the Distributor), an affiliate of the Investment Manager and a wholly-owned subsidiary of Ameriprise Financial, for distribution and shareholder services. The Board has approved, and the Fund has adopted, distribution and shareholder service
plans (the Plans) applicable to certain share classes, which set the distribution and service fees for the Fund. These fees are calculated daily and are intended to compensate the Distributor and/or eligible selling and/or servicing agents for selling shares of the Fund and providing services to investors.
Under the Plans, the Fund pays a monthly combined distribution and service fee to the Distributor at the maximum annual rate of 0.25% of the average daily net assets attributable to Class A shares of the Fund. Also under the Plans, the Fund pays a monthly service fee at the maximum annual rate of 0.25% of the average daily net assets attributable to Class B, Class C and Class W shares of the Fund and a monthly distribution fee at the maximum annual rate of 0.75%, 0.75% and 0.25% of the average daily net assets attributable to Class B, Class C and Class W shares of the Fund, respectively.
Although the Fund may pay a distribution fee up to 0.25% of the Fund's average daily net assets attributable to Class W shares and a service fee of up to 0.25% of the Fund's average daily net assets attributable to Class W shares, the aggregate fee shall not exceed 0.25% of the Fund's average daily net assets attributable to Class W shares.
Sales Charges
Sales charges, including front-end charges and CDSCs, received by the Distributor for distributing Fund shares were $181,629 for Class A, $892 for Class B and $412 for Class C for the year ended February 29, 2016.
Expenses Waived/Reimbursed by the Investment Manager and its Affiliates
The Fund's expense ratio is subject to an expense reimbursement arrangement pursuant to which fees will be waived and/or expenses reimbursed (excluding certain fees and expenses described below) so that the Fund's net operating expenses, after giving effect to fees waived/expenses reimbursed and any balance credits and/or overdraft charges from the Fund's custodian, do not exceed the following annual rates as a percentage of the class' average daily net assets:
| | Contractual
Expense Cap
July 1, 2015
through
June 30, 2015 | | Contractual
Expense Cap
Prior to
July 1, 2015 | |
Class A | | | 1.46 | % | | | 1.55 | % | |
Class B | | | 2.21 | | | | 2.30 | | |
Class C | | | 2.21 | | | | 2.30 | | |
Annual Report 2016
39
COLUMBIA OVERSEAS VALUE FUND
NOTES TO FINANCIAL STATEMENTS (continued)
February 29, 2016
| | Contractual
Expense Cap
July 1, 2015
through
June 30, 2015 | | Contractual
Expense Cap
Prior to
July 1, 2015 | |
Class I | | | 1.03 | % | | | 1.12 | % | |
Class K | | | 1.33 | | | | 1.42 | | |
Class R4 | | | 1.21 | | | | — | | |
Class R5 | | | 1.08 | | | | — | | |
Class W | | | 1.46 | | | | 1.55 | | |
Class Y | | | 1.03 | | | | — | | |
Class Z | | | 1.21 | | | | 1.30 | | |
The contractual agreement may be modified or amended only with approval from the Investment Manager, certain of its affiliates and the Fund. Under the arrangements, the following fees and expenses are excluded from the waiver/reimbursement commitment, and therefore will be paid by the Fund, if applicable: taxes (including foreign transaction taxes), expenses associated with investments in affiliated and non-affiliated pooled investment vehicles (including mutual funds and exchange-traded funds), transaction costs and brokerage commissions, costs related to any securities lending program, dividend and interest expenses associated with securities sold short, inverse floater program fees and expenses, transaction charges and interest on borrowed money, interest and extraordinary expenses.
Prior to July 1, 2015, the Fund's expense ratio was subject to a voluntary expense reimbursement arrangement pursuant to which fees were waived and/or expenses reimbursed (excluding certain fees and expenses immediately described above), so that the Fund's net operating expenses, after giving effect to fees waived/expenses reimbursed and any balance credits and/or overdraft charges from the Fund's custodian, did not exceed the annual rates of 1.49% for Class A, 2.24% for Class B, 2.24% for Class C, 1.06% for Class I, 1.36% for Class K, 1.49% for Class W and 1.24% for Class Z.
Note 4. Federal Tax Information
The timing and character of income and capital gain distributions are determined in accordance with income tax regulations, which may differ from GAAP because of temporary or permanent book to tax differences.
At February 29, 2016, these differences are primarily due to differing treatment for capital loss carryforwards, deferral/reversal of wash sale losses, Trustees' deferred compensation, foreign currency transactions, passive foreign investment company (PFIC) holdings, former PFIC
holdings, late-year ordinary losses and derivative investments. To the extent these differences are permanent, reclassifications are made among the components of the Fund's net assets in the Statement of Assets and Liabilities. Temporary differences do not require reclassifications. In the Statement of Assets and Liabilities the following reclassifications were made:
Excess of distributions over net investment income | | $ | (1,233,337 | ) | |
Accumulated net realized loss | | | 1,233,335 | | |
Paid-in capital | | | 2 | | |
Net investment income (loss) and net realized gains (losses), as disclosed in the Statement of Operations, and net assets were not affected by this reclassification.
The tax character of distributions paid during the years indicated was as follows:
Year Ended | | February 29,
2016 | | February 28,
2015 | |
Ordinary income | | $ | 13,659,258 | | | $ | 23,145,699 | | |
Short-term capital gain distributions, if any, are considered ordinary income distributions for tax purposes.
At February 29, 2016, the components of distributable earnings on a tax basis were as follows:
Capital loss carryforwards | | $ | (328,626,373 | ) | |
Net unrealized depreciation | | | (69,166,325 | ) | |
At February 29, 2016, the cost of investments for federal income tax purposes was $633,428,307 and the aggregate gross unrealized appreciation and depreciation based on that cost was:
Unrealized appreciation | | $ | 36,674,842 | | |
Unrealized depreciation | | | (105,841,167 | ) | |
Net unrealized depreciation | | $ | (69,166,325 | ) | |
The following capital loss carryforwards, determined at February 29, 2016, may be available to reduce taxable income arising from future net realized gains on investments, if any, to the extent permitted by the Internal Revenue Code:
Year of Expiration | | Amount ($) | |
2017 | | | 321,237,467 | | |
2018 | | | 3,000,399 | | |
No expiration — short-term | | | 4,382,871 | | |
No expiration — long-term | | | 5,636 | | |
Total | | | 328,626,373 | | |
Annual Report 2016
40
COLUMBIA OVERSEAS VALUE FUND
NOTES TO FINANCIAL STATEMENTS (continued)
February 29, 2016
Capital loss carryforwards with no expiration are required to be utilized prior to any capital losses which carry an expiration date. As a result of this ordering rule, capital loss carryforwards which carry an expiration date may be more likely to expire unused.
For the year ended February 29, 2016, $13,920,652 of capital loss carryforward was utilized and $1,238,180 was permanently lost.
Under current tax rules, regulated investment companies can elect to treat certain late-year ordinary losses incurred and post-October capital losses (capital losses realized after October 31) as arising on the first day of the following taxable year. As of February 29, 2016, the Fund will elect to treat late-year ordinary losses of $1,683,796 as arising on March 1, 2016.
Management of the Fund has concluded that there are no significant uncertain tax positions in the Fund that would require recognition in the financial statements. However, management's conclusion may be subject to review and adjustment at a later date based on factors including, but not limited to, new tax laws, regulations, and administrative interpretations (including relevant court decisions). Generally, the Fund's federal tax returns for the prior three fiscal years remain subject to examination by the Internal Revenue Service.
Note 5. Portfolio Information
The cost of purchases and proceeds from sales of securities, excluding short-term investments and derivatives, if any, aggregated to $435,966,897 and $477,526,446, respectively, for the year ended February 29, 2016. The amount of purchase and sale activity impacts the portfolio turnover rate reported in the Financial Highlights.
Note 6. Affiliated Money Market Fund
The Fund invests in Columbia Short-Term Cash Fund, an affiliated money market fund established for the exclusive use by the Fund and other affiliated funds. The income earned by the Fund from such investments is included as Dividends — affiliated issuers in the Statement of Operations. As an investing fund, the Fund indirectly bears its proportionate share of the expenses of Columbia Short-Term Cash Fund.
Note 7. Line of Credit
The Fund has access to a revolving credit facility whereby the Fund may borrow for the temporary funding of shareholder redemptions or for other temporary or emergency purposes. Effective December 8, 2015,
Citibank, N.A. and HSBC Bank USA, N.A. joined JPMorgan Chase Bank, N.A. (JPMorgan) as lead of a syndicate of banks under the credit facility, which is a collective agreement between the Fund and certain other funds managed by the Investment Manager, severally and not jointly, that permits collective borrowings up to $1 billion. Interest is charged to each participating fund based on its borrowings at a rate equal to the higher of (i) the overnight federal funds rate plus 1.00% or (ii) the one-month LIBOR rate plus 1.00%. Each borrowing under the credit facility matures no later than 60 days after the date of borrowing. The Fund also pays a commitment fee equal to its pro rata share of the amount of the credit facility at a rate of 0.15% per annum. The commitment fee is included in other expenses in the Statement of Operations. Prior to December 8, 2015, JPMorgan was the sole lead bank under the credit facility agreement that permitted borrowings up to $550 million under the same terms and interest rates as described above with the exception of the commitment fee which was charged at a rate of 0.075% per annum.
The Fund had no borrowings during the year ended February 29, 2016.
Note 8. Significant Risks
Shareholder Concentration Risk
At February 29, 2016, affiliated shareholders of record owned 96.7% of the outstanding shares of the Fund in one or more accounts. Subscription and redemption activity by concentrated accounts may have a significant effect on the operations of the Fund. In the case of a large redemption, the Fund may be forced to sell investments at inopportune times, including its liquid or more liquid positions, resulting in Fund losses and the Fund holding a higher percentage of less liquid or illiquid securities. Large redemptions could result in decreased economies of scale and increased operating expenses for non-redeeming Fund shareholders.
Financial Sector Risk
The Fund may be more susceptible to the particular risks that may affect companies in the financial services sector than if it were invested in a wider variety of companies in unrelated sectors. Companies in the financial services sector are subject to certain risks, including the risk of regulatory change, decreased liquidity in credit markets and unstable interest rates. Such companies may have concentrated portfolios, such as a high level of loans to real estate developers, which makes them vulnerable to economic conditions that
Annual Report 2016
41
COLUMBIA OVERSEAS VALUE FUND
NOTES TO FINANCIAL STATEMENTS (continued)
February 29, 2016
affect that industry. Performance of such companies may be affected by competitive pressures and exposure to investments or agreements that, under certain circumstances, may lead to losses (e.g., subprime loans). Companies in the financial services sector are subject to extensive governmental regulation that may limit the amount and types of loans and other financial commitments they can make, and interest rates and fees that they may charge. In addition, profitability of such companies is largely dependent upon the availability and the cost of capital.
Foreign Securities and Emerging Market Countries Risk
Investing in foreign securities may include certain risks and considerations not typically associated with investing in U.S. securities, such as fluctuating currency values and changing local and regional economic, political and social conditions, which may result in greater market volatility. In addition, certain foreign securities may not be as liquid as U.S. securities. Investing in emerging markets may accentuate these risks. These countries are also more likely to experience high levels of inflation, deflation or currency devaluation which could hurt their economies and securities markets. To the extent that the Fund concentrates its investment exposure to any one or a few specific countries, the Fund will be particularly susceptible to the various conditions, events or other factors impacting those countries and may, therefore, have a greater risk than that of a fund which is more geographically diversified.
Note 9. Subsequent Events
Management has evaluated the events and transactions that have occurred through the date the financial statements were issued and noted no items requiring adjustment of the financial statements or additional disclosure.
Note 10. Information Regarding Pending and Settled Legal Proceedings
In December 2005, without admitting or denying the allegations, American Express Financial Corporation (AEFC, which is now known as Ameriprise Financial, Inc. (Ameriprise Financial)) entered into settlement agreements with the Securities and Exchange Commission (SEC) and Minnesota Department of Commerce (MDOC) related to market timing activities. As a result, AEFC was censured and ordered to cease and desist from committing or causing any violations of certain provisions of the Investment Advisers Act of
1940, the Investment Company Act of 1940, and various Minnesota laws. AEFC agreed to pay disgorgement of $10 million and civil money penalties of $7 million. AEFC also agreed to retain an independent distribution consultant to assist in developing a plan for distribution of all disgorgement and civil penalties ordered by the SEC in accordance with various undertakings detailed at http://www.sec.gov/litigation/admin/ia-2451.pdf. Ameriprise Financial and its affiliates have cooperated with the SEC and the MDOC in these legal proceedings, and have made regular reports to the Funds' Boards of Trustees.
Ameriprise Financial and certain of its affiliates have historically been involved in a number of legal, arbitration and regulatory proceedings, including routine litigation, class actions, and governmental actions, concerning matters arising in connection with the conduct of their business activities. Ameriprise Financial believes that the Funds are not currently the subject of, and that neither Ameriprise Financial nor any of its affiliates are the subject of, any pending legal, arbitration or regulatory proceedings that are likely to have a material adverse effect on the Funds or the ability of Ameriprise Financial or its affiliates to perform under their contracts with the Funds. Ameriprise Financial is required to make quarterly (10-Q), annual (10-K) and, as necessary, 8-K filings with the SEC on legal and regulatory matters that relate to Ameriprise Financial and its affiliates. Copies of these filings may be obtained by accessing the SEC website at www.sec.gov.
There can be no assurance that these matters, or the adverse publicity associated with them, will not result in increased fund redemptions, reduced sale of fund shares or other adverse consequences to the Funds. Further, although we believe proceedings are not likely to have a material adverse effect on the Funds or the ability of Ameriprise Financial or its affiliates to perform under their contracts with the Funds, these proceedings are subject to uncertainties and, as such, we are unable to estimate the possible loss or range of loss that may result. An adverse outcome in one or more of these proceedings could result in adverse judgments, settlements, fines, penalties or other relief that could have a material adverse effect on the consolidated financial condition or results of operations of Ameriprise Financial.
Annual Report 2016
42
COLUMBIA OVERSEAS VALUE FUND
REPORT OF INDEPENDENT REGISTERED PUBLIC ACCOUNTING FIRM
To the Trustees of Columbia Funds Series Trust and the Shareholders of
Columbia Overseas Value Fund
In our opinion, the accompanying statement of assets and liabilities, including the portfolio of investments, and the related statements of operations and of changes in net assets and the financial highlights present fairly, in all material respects, the financial position of Columbia Overseas Value Fund (the "Fund," a series of Columbia Funds Series Trust) at February 29, 2016, and the results of its operations, the changes in its net assets and the financial highlights for each of the periods indicated, in conformity with accounting principles generally accepted in the United States of America. These financial statements and financial highlights (hereafter referred to as "financial statements") are the responsibility of the Fund's management. Our responsibility is to express an opinion on these financial statements based on our audits. We conducted our audits of these financial statements in accordance with the standards of the Public Company Accounting Oversight Board (United States). Those standards require that we plan and perform the audit to obtain reasonable assurance about whether the financial statements are free of material misstatement. An audit includes examining, on a test basis, evidence supporting the amounts and disclosures in the financial statements, assessing the accounting principles used and significant estimates made by management, and evaluating the overall financial statement presentation. We believe that our audits, which included confirmation of securities at February 29, 2016 by correspondence with the custodian, brokers and transfer agent, and the application of alternative auditing procedures where such confirmations had not been received, provide a reasonable basis for our opinion.
PricewaterhouseCoopers LLP
Minneapolis, MN
April 21, 2016
Annual Report 2016
43
COLUMBIA OVERSEAS VALUE FUND
FEDERAL INCOME TAX INFORMATION
(Unaudited)
The Fund hereby designates the following tax attributes for the fiscal year ended February 29, 2016. Shareholders will be notified in early 2017 of the amounts for use in preparing 2016 income tax returns.
Tax Designations:
| Qualified Dividend Income | | | 100 | % | |
Foreign Taxes Paid | | $ | 1,637,024 | | |
Foreign Taxes Paid Per Share | | $ | 0.02 | | |
Foreign Source Income | | $ | 24,296,358 | | |
Foreign Source Income Per Share | | $ | 0.32 | | |
Qualified Dividend Income. For taxable, non-corporate shareholders, the percentage of ordinary income distributed during the fiscal year that represents qualified dividend income subject to reduced tax rates.
Foreign Taxes. The Fund makes the election to pass through to shareholders the foreign taxes paid. Eligible shareholders may claim a foreign tax credit. These taxes, and the corresponding foreign source income, are provided.
Annual Report 2016
44
COLUMBIA OVERSEAS VALUE FUND
Shareholders elect the Board that oversees the Fund's operations. The Board appoints officers who are responsible for day-to-day business decisions based on policies set by the Board. The following table provides basic biographical information about the Fund's Trustees, including their principal occupations during the past five years, although specific titles for individuals may have varied over the period. Under current Board policy, members generally may serve through the end of the calendar year in which they reach either the mandatory retirement age established by the Board or the fifteenth anniversary of the first Board meeting they attended as a member of the Board.
Trustees
Independent Trustees
Name,
Address,
Year of Birth | | Position Held With
the Funds and Length of
Service | | Principal Occupation(s)
During the Past Five Years
and Other Relevant
Professional Experience | | Number of
Funds in the
Columbia
Funds Complex
Overseen | | Other Directorships
Held by Trustee
During the Past
Five Years | |
Kathleen Blatz
901 S. Marquette Ave.
Minneapolis, MN 55402
1954 | | Trustee since 1/06 for RiverSource Funds and since 6/11 for Nations Funds | | Attorney; specializing in arbitration and mediation; Chief Justice, Minnesota Supreme Court, 1998-2006; Associate Justice, Minnesota Supreme Court, 1996-1998; Fourth Judicial District Court Judge, Hennepin County, 1994-1996; Attorney in private practice and public service, 1984-1993; State Representative, Minnesota House of Representatives, 1979-1993, which included service on the Tax and Financial Institutions and Insurance Committees | | | 124 | | | Trustee, BlueCross BlueShield of Minnesota (Chair of the Business Development Committee) since 2009; Chair of the Robina Foundation since August 2013 | |
Edward J. Boudreau, Jr.
901 S. Marquette Ave.
Minneapolis, MN 55402
1944 | | Trustee since 6/11 for RiverSource Funds and since 1/05 for Nations Funds | | Managing Director, E.J. Boudreau & Associates (consulting) since 2000; FINRA Industry Arbitrator, 2002-present; Chairman and Chief Executive Officer, John Hancock Funds (asset management), Chairman and Interested Trustee for open-end and closed-end funds offered by John Hancock, 1989-2000; John Hancock Life Insurance Company, including SVP and Treasurer and SVP Information Technology, 1968-1988 | | | 122 | | | Former Trustee, Boston Museum of Science (Chair of Finance Committee), 1985-2013; former Trustee, BofA Funds Series Trust (11 funds), 2005-2011 | |
Pamela G. Carlton
901 S. Marquette Ave.
Minneapolis, MN 55402
1954 | | Trustee since 7/07 for RiverSource Funds and since 6/11 for Nations Funds | | President, Springboard-Partners in Cross Cultural Leadership (consulting company) since 2003; Managing Director of US Equity Research, JP Morgan Chase, 1999-2003; Director of US Equity Research, Chase Asset Management, 1996-1999; Co-Director Latin America Research, 1993-1996, COO Global Research, 1992-1996, Co-Director of US Research, 1991-1992, Investment Banker, Morgan Stanley, 1982-1991 | | | 124 | | | Trustee, New York Presbyterian Hospital Board (Executive Committee and Chair of Human Resources Committee) since 1996 | |
Annual Report 2016
45
COLUMBIA OVERSEAS VALUE FUND
TRUSTEES AND OFFICERS (continued)
Independent Trustees (continued)
Name,
Address,
Year of Birth | | Position Held With
the Funds and Length of
Service | | Principal Occupation(s)
During the Past Five Years
and Other Relevant
Professional Experience | | Number of
Funds in the
Columbia
Funds Complex
Overseen | | Other Directorships
Held by Trustee
During the Past
Five Years | |
William P. Carmichael
901 S. Marquette Ave.
Minneapolis, MN 55402
1943 | | Trustee since 6/11 for RiverSource Funds and since 2003 for Nations Funds; Chair of the Board from 1/14-11/15 | | Retired; Co-founder, The Succession Fund (provides exit strategies to owners of privately held companies), 1998-2007; Adjunct Professor of Finance, Kelley School of Business, Indiana University, 1993-2007; Senior Vice President, Sara Lee Corporation, 1991-1993; Senior Vice President and Chief Financial Officer, Beatrice Foods Company, 1984-1990; Vice President, Esmark, Inc., 1973-1984; Associate, Price Waterhouse, 1968-1972 | | | 124 | | | Director, The Finish Line (athletic shoes and apparel) since July 2003; Director, International Textile Corp. since 2012; Director, hhgregg since May, 2015; former Director, Cobra Electronics Corporation (electronic equipment manufacturer), 1994-August 2014; former Director, Spectrum Brands, Inc. (consumer products), 2002-2009; former Director, Simmons Company (bedding), 2004-2010; former Trustee, BofA Funds Series Trust (11 funds), 2009-2011; former Director, McMoRan Exploration Company (oil and gas exploration and development), 2010-2013 | |
Patricia M. Flynn
901 S. Marquette Ave.
Minneapolis, MN 55402
1950 | | Trustee since 11/04 for RiverSource Funds and since 6/11 for Nations Funds | | Trustee Professor of Economics and Management, Bentley University since 1976 (also teaches and conducts research on corporate governance); Dean, McCallum Graduate School of Business, Bentley University, 1992-2002 | | | 124 | | | Trustee, MA Taxpayers Foundation since 1997; Board of Governors, Innovation Institute, MA Technology Collaborative since 2010 | |
William A. Hawkins
901 S. Marquette Ave.
Minneapolis, MN 55402
1942 | | Chair of the Board since 11/15; Trustee since 6/11 for RiverSource Funds and since 1/05 for Nations Funds | | Managing Director, Overton Partners (financial consulting) since August 2010; President and Chief Executive Officer, California General Bank, N.A., January 2008-August 2010; Operation Hope, COO, 2004-2007; IndyMac Bancorp, President, CBG, 1999-2003; American General Bank, President, 1997-1999; Griffin Financial Services, CEO, 1981-1997; The Griffin Funds, CEO, 1992-1998 | | | 124 | | | Former Trustee, BofA Funds Series Trust (11 funds), 2009-2015 | |
R. Glenn Hilliard
901 S. Marquette Ave.
Minneapolis, MN 55402
1943 | | Trustee since 6/11 for RiverSource Funds and since 1/05 for Nations Funds | | Chairman and Chief Executive Officer, Hilliard Group LLC (investing and consulting) since April 2003; Non-Executive Director & Chairman, CNO Financial Group, Inc. (insurance), 2003-2011; Chair & CEO, ING Americas, 1996-2003 | | | 122 | | | Chairman, BofA Funds Series Trust (11 funds); former Director, CNO Financial Group, Inc. (insurance), 2003-2011 | |
Annual Report 2016
46
COLUMBIA OVERSEAS VALUE FUND
TRUSTEES AND OFFICERS (continued)
Independent Trustees (continued)
Name,
Address,
Year of Birth | | Position Held With
the Funds and Length of
Service | | Principal Occupation(s)
During the Past Five Years
and Other Relevant
Professional Experience | | Number of
Funds in the
Columbia
Funds Complex
Overseen | | Other Directorships
Held by Trustee
During the Past
Five Years | |
Catherine James Paglia
901 S. Marquette Ave.
Minneapolis, MN 55402
1952 | | Trustee since 11/04 for RiverSource Funds and since 6/11 for Nations Funds | | Director, Enterprise Asset Management, Inc. (private real estate and asset management company) since September 1998; Managing Director and Partner, Interlaken Capital, Inc., 1989-1997; Managing Director, Morgan Stanley, 1982-1989; Vice President, Investment Banking, 1980-1982, Associate, Investment Banking, 1976-1980, Dean Witter Reynolds, Inc. | | | 124 | | | Director, Valmont Industries, Inc. (irrigation systems manufacturer) since 2012; Trustee, Carleton College (on the Investment Committee); Trustee, Carnegie Endowment for International Peace (on the Investment Committee) | |
Leroy C. Richie
901 S. Marquette Ave.
Minneapolis, MN 55402
1941 | | Trustee since 2000 for Seligman Funds, since 11/08 for RiverSource Funds and since 6/11 for Nations Funds | | Counsel, Lewis & Munday, P.C. (law firm) since 2004; Vice President and General Counsel, Automotive Legal Affairs, Chrysler Corporation, 1993-1997 | | | 122 | | | Lead Outside Director, Infinity Resources, Inc. (oil and gas exploration and production) since 1994; Lead Outside Director, Digital Ally, Inc. (digital imaging) since September 2005; Trustee, Marygrove College (Chair of Finance Committee) since 2007; former Director, OGE Energy Corp. (energy and energy services), 2007-2014 | |
Minor M. Shaw
901 S. Marquette Ave.
Minneapolis, MN 55402
1947 | | Trustee since 6/11 for RiverSource Funds and since 2003 for Nations Funds | | President, Micco LLC (private investments) since 2011; President, Micco Corp. (family investment business), 1998-2011 | | | 124 | | | Director, Piedmont Natural Gas; Director, BlueCross BlueShield of South Carolina since April 2008; Chair of the Duke Endowment; Director, National Association of Corporate Directors, Carolinas Chapter since 2013; Chair of Greenville — Spartanburg Airport Commission; former Trustee, BofA Funds Series Trust (11 funds), 2003-2011 | |
Alison Taunton-Rigby
901 S. Marquette Ave.
Minneapolis, MN 55402
1944 | | Trustee since 11/02 for RiverSource Funds and since 6/11 for Nations Funds | | Managing Director, Forester Biotech (consulting), 2001-2003; Chief Executive Officer and Director, RiboNovix, Inc., (biotechnology), 2003-2010; President and Chief Executive Officer of CMT Inc., 2001-2003; Aquila Biopharmaceuticals Inc., 1996-2000; Cambridge Biotech Corporation, 1995-1996; Mitotix Inc., 1993-1994 | | | 124 | | | Director, Abt Associates (government contractor) since 2001; Director, Boston Children's Hospital since 2002; Director, Healthways, Inc. (health and well-being solutions) since 2005; Director, ICI Mutual Insurance Company since 2011 | |
Annual Report 2016
47
COLUMBIA OVERSEAS VALUE FUND
TRUSTEES AND OFFICERS (continued)
Interested Trustee Not Affiliated with Investment Manager*
Name,
Address,
Year of Birth | | Position Held With
Funds and Length of
Service | | Principal Occupation(s)
During Past Five Years
and Other Relevant
Professional Experience | | Number of
Funds in the
Fund Family
Overseen by
Board Member | | Other Present or Past
Directorships/
Trusteeships
(Within Past 5 Years) | |
Anthony M. Santomero
901 S. Marquette Ave.
Minneapolis, MN 55402
1946 | | Trustee since 6/11 for RiverSource Funds and since 1/08 for Nations Funds | | Richard K. Mellon Professor Emeritus of Finance, The Wharton School, University of Pennsylvania since 2002; Senior Advisor, McKinsey & Company (consulting), 2006-2008; President, Federal Reserve Bank of Philadelphia, 2000-2006; Professor of Finance, The Wharton School, University of Pennsylvania, 1972-2002 | | | 122 | | | Trustee, Penn Mutual Life Insurance Company since March 2008; Director, Renaissance Reinsurance Ltd. since May 2008; Director, Citigroup Inc. since 2009; Director, Citibank, N.A. since 2009; former Trustee, BofA Funds Series Trust (11 funds), 2008-2011 | |
* Dr. Santomero is not an affiliated person of the Investment Manager or Ameriprise Financial. However, he is currently deemed by the Funds to be an "interested person" (as defined in the 1940 Act) of the Funds because he serves as a Director of Citigroup Inc. and Citibank, N.A., companies that may directly or through subsidiaries and affiliates engage from time-to-time in brokerage execution, principal transactions and lending relationships with the Funds or accounts advised/managed by the Investment Manager.
Annual Report 2016
48
COLUMBIA OVERSEAS VALUE FUND
TRUSTEES AND OFFICERS (continued)
Interested Trustee Affiliated with Investment Manager*
Name,
Address,
Year of Birth | | Position Held With
the Funds and Length of
Service | | Principal Occupation(s)
During Past Five Years
and Other Relevant
Professional Experience | | Number of
Funds in the
Columbia
Funds Complex
Overseen | | Other Directorships
Held by Trustee
During the Past
Five Years | |
William F. Truscott
c/o Columbia Management Investment Advisers, LLC,
225 Franklin St.
Boston, MA 02110
1960 | | Trustee since 11/01 for RiverSource Funds and since 6/11 for Nations Funds; Senior Vice President since 2002 for RiverSource Funds and since 5/10 for Nations Funds | | Chairman of the Board and President, Columbia Management Investment Advisers, LLC since May 2010 and February 2012, respectively (previously President and Chief Investment Officer, 2001-April 2010); Chief Executive Officer, Global Asset Management, Ameriprise Financial, Inc. since September 2012 (previously Chief Executive Officer, U.S. Asset Management & President, Annuities, May 2010-September 2012 and President — U.S. Asset Management and Chief Investment Officer, 2005-April 2010); Director and Chief Executive Officer, Columbia Management Investment Distributors, Inc. since May 2010 and February 2012, respectively (previously Chairman of the Board and Chief Executive Officer, 2006-April 2010); Chairman of the Board and Chief Executive Officer, RiverSource Distributors, Inc. since 2006; Director, Threadneedle Asset Management Holdings, SARL since 2014; President and Chief Executive Officer, Ameriprise Certificate Company, 2006-August 2012. | | | 182 | | | Chairman of the Board, Columbia Management Investment Advisers, LLC since May 2010; Director, Columbia Management Investment Distributors, Inc. since May 2010; Former Director, Ameriprise Certificate Company, 2006-January 2013 | |
* Interested person (as defined under the 1940 Act) by reason of being an officer, director, security holder and/or employee of the Investment Manager or Ameriprise Financial.
The Statement of Additional Information has additional information about the Fund's Board members and is available, without charge, upon request by calling 800.345.6611; contacting your financial intermediary; or visiting columbiathreadneedle.com/us.
Annual Report 2016
49
COLUMBIA OVERSEAS VALUE FUND
TRUSTEES AND OFFICERS (continued)
The Board has appointed officers who are responsible for day-to-day business decisions based on policies it has established. The officers serve at the pleasure of the Board. The following table provides basic information about the Officers of the Fund, including principal occupations during the past five years, although their specific titles may have varied over the period. In addition to Mr. Truscott, who is Senior Vice President, the Fund's other officers are:
Fund Officers
Name,
Address and
Year of Birth | | Position and Year
First Appointed to
Position for any Fund
in the Columbia
Funds Complex or a
Predecessor Thereof | | Principal Occupation(s) During Past Five Years | |
Christopher O. Petersen
5228 Ameriprise
Financial Center
Minneapolis, MN 55474
Born 1970 | | President and Principal Executive Officer (2015) | | Vice President and Lead Chief Counsel, Ameriprise Financial, Inc. since January 2015 (previously, Vice President and Chief Counsel January 2010-December 2014; and Vice President and Group Counsel or Counsel 2004-January 2010); officer of Columbia Funds and affiliated funds since 2007. | |
Michael G. Clarke
225 Franklin Street
Boston, MA 02110
Born 1969 | | Treasurer (2011), Chief Financial Officer (2009) and Chief Accounting Officer (2015) | | Vice President — Mutual Fund Administration, Columbia Management Investment Advisers, LLC, since May 2010; Managing Director of Fund Administration, Columbia Management Advisors, LLC, September 2004-April 2010; senior officer of Columbia Funds and affiliated funds since 2002. | |
Paul B. Goucher
100 Park Avenue
New York, NY 10017
Born 1968 | | Senior Vice President (2011), Chief Legal Officer (2015) and Assistant Secretary (2008) | | Vice President and Lead Chief Counsel, Ameriprise Financial, Inc. since November 2008 and January 2013, respectively (previously Chief Counsel, January 2010-January 2013 and Group Counsel, November 2008-January 2010). | |
Thomas P. McGuire
225 Franklin Street
Boston, MA 02110
Born 1972 | | Senior Vice President and Chief Compliance Officer (2012) | | Vice President — Asset Management Compliance, Ameriprise Financial, Inc., since May 2010; Chief Compliance Officer, Ameriprise Certificate Company since September 2010; Compliance Executive, Bank of America, 2005-April 2010. | |
Colin Moore
225 Franklin Street
Boston, MA 02110
Born 1958 | | Senior Vice President (2010) | | Executive Vice President and Global Chief Investment Officer, Ameriprise Financial, Inc., since July 2013; Director and Global Chief Investment Officer, Columbia Management Investment Advisers, LLC since May 2010; Manager, Managing Director and Chief Investment Officer, Columbia Management Advisors, LLC, 2007-April 2010. | |
Michael E. DeFao
225 Franklin Street
Boston, MA 02110
Born 1968 | | Vice President (2011) and Assistant Secretary (2010) | | Vice President and Chief Counsel, Ameriprise Financial, Inc. since May 2010; Associate General Counsel, Bank of America, 2005-April 2010. | |
Amy Johnson
5228 Ameriprise
Financial Center
Minneapolis, MN 55474
Born 1965 | | Vice President (2006) | | Managing Director and Chief Operating Officer, Columbia Management Investment Advisers, LLC since May 2010 (previously Chief Administrative Officer, 2009-April 2010, and Vice President — Asset Management and Trust Company Services, 2006-2009). | |
Lyn Kephart-Strong
5228 Ameriprise
Financial Center
Minneapolis, MN 55474
Born 1960 | | Vice President (2015) | | President, Columbia Management Investment Services Corp. since October 2014; Vice President & Resolution Officer, Ameriprise Trust Company since August 2009; President, RiverSource Service Corporation 2004-2010. | |
Ryan C. Larrenaga
225 Franklin Street
Boston, MA 02110
Born 1970 | | Vice President and Secretary (2015) | | Vice President and Group Counsel, Ameriprise Financial, Inc. since August 2011 (previously, Counsel from May 2010 to August 2011); Assistant General Counsel, Bank of America, 2005-April 2010; officer of Columbia Funds and affiliated funds since 2005. | |
Annual Report 2016
50
COLUMBIA OVERSEAS VALUE FUND
IMPORTANT INFORMATION ABOUT THIS REPORT
Each fund mails one shareholder report to each shareholder address. If you would like more than one report, please call shareholder services at 800.345.6611 and additional reports will be sent to you.
The policy of the Board is to vote the proxies of the companies in which each fund holds investments consistent with the procedures as stated in the Statement of Additional Information (SAI). You may obtain a copy of the SAI without charge by calling 800.345.6611; contacting your financial intermediary; visiting columbiathreadneedle.com/us; or searching the website of the Securities and Exchange Commission (SEC) at sec.gov. Information regarding how each fund voted proxies relating to portfolio securities is filed with the SEC by August 31st for the most recent 12-month period ending June 30th of that year, and is available without charge by visiting columbiathreadneedle.com/us, or searching the website of the SEC at sec.gov.
Each fund files a complete schedule of portfolio holdings with the SEC for the first and third quarters of each fiscal year on Form N-Q. Each fund's Form N-Q is available on the SEC's website at sec.gov and may be reviewed and copied at the SEC's Public Reference Room in Washington, D.C. Information on the operation of the Public Reference Room may be obtained by calling 800.SEC.0330. Each fund's complete schedule of portfolio holdings, as filed on Form N-Q, can also be obtained without charge, upon request, by calling 800.345.6611.
Annual Report 2016
51
Columbia Overseas Value Fund
P.O. Box 8081
Boston, MA 02266-8081

This information is for use with concurrent or prior delivery of a fund prospectus. Please read and consider the investment objectives, risks, charges and expenses for any fund carefully before investing. For a prospectus and summary prospectus, which contains this and other important information about the Fund, go to columbiathreadneedle.com/us. The Fund is distributed by Columbia Management Investment Distributors, Inc., member FINRA, and managed by Columbia Management Investment Advisers, LLC.
Columbia Threadneedle Investments (Columbia Threadneedle) is the global brand name of the Columbia and Threadneedle group of companies.
All rights reserved. Columbia Management Investment Distributors, Inc., 225 Franklin Street, Boston, MA 02110-2804
© 2016 Columbia Management Investment Advisers, LLC.
columbiathreadneedle.com/us
ANN208_02_F01_(04/16)

ANNUAL REPORT
February 29, 2016

COLUMBIA SMALL CAP INDEX FUND

ABOUT COLUMBIA THREADNEEDLE INVESTMENTS
Columbia Threadneedle Investments is a leading global asset management group that provides a broad range of actively managed investment strategies and solutions for individual, institutional and corporate clients around the world.
With more than 2,000 people, including over 450 investment professionals based in North America, Europe and Asia, we manage $472 billion* of assets across developed and emerging market equities, fixed income, asset allocation solutions and alternatives. We are the 13th largest manager of long-term mutual fund assets in the U.S.** and the 4th largest manager of retail funds in the U.K.***
Our priority is the investment success of our clients. We aim to deliver the investment outcomes they expect through an investment approach that is team-based, performance-driven and risk-aware. Our culture is dynamic and interactive. By sharing our insights across asset classes and geographies, we generate richer perspectives on global, regional and local investment landscapes. The ability to exchange and debate investment ideas in a collaborative environment enriches our teams' investment processes. More importantly, it results in better informed investment decisions for our clients.
Columbia funds are distributed by Columbia Management Investment Distributors, Inc., member FINRA, and managed by Columbia Management Investment Advisers, LLC.
Columbia Threadneedle Investments (Columbia Threadneedle) is the global brand name of the Columbia and Threadneedle group of companies.
* In U.S. dollars as of December 31, 2015. Source: Ameriprise Q4 Earnings Release. Includes all assets managed by entities in the Columbia and Threadneedle groups of companies. Contact us for more current data.
** Source: ICI as of December 31, 2015 for Columbia Management Investment Advisers, LLC.
*** Source: Investment Association as of September 2015 for Threadneedle Asset Management Limited.
© 2016 Columbia Management Investment Advisers, LLC. All rights reserved.
Not part of the shareholder report
Investment strategies to help meet investor needs
We are committed to helping investors navigate financial challenges to reach their desired outcomes. The possibilities are endless.
Your success is our priority.
Retire comfortably
Fund college or higher education
Leave a legacy
Generate an appropriate stream of income in retirement
Traditional approaches to income may no longer be adequate — and they may no longer provide the diversification benefits they once did. Investors need to rethink how they generate retirement income.
Worried about running out of income? You are not alone.
Navigate a changing interest rate environment
Even in today's challenging interest rate environment, it's still possible to navigate markets and achieve your goals.
Make investment choices designed specifically for this market environment.
Maximize after-tax returns
In an environment where what you keep is more important than what you earn, municipal bonds can help mitigate higher taxes while providing attractive yields compared to other investment options.
You've worked too hard building your wealth to lose it to taxes.
Grow assets to achieve financial goals
Finding growth opportunities in today's complex market environment requires strong research capabilities, creative thinking and a disciplined approach.
Do your investments deliver the portfolio growth you need?
Ease the impact of volatile markets
With increasing concerns about market volatility, investors should consider diversifying their portfolios with non-traditional holdings.
Interested in turning volatility into opportunity?
To find out more, contact your financial professional, call 800.426.3750 or visit columbiathreadneedle.com/us
Not part of the shareholder report
Get the market insight you need from our investment experts and subscribe to our latest publications
Stay informed with Columbia Threadneedle Investments
Investor insight
Find economic and market commentary, investment videos, white papers, mutual fund commentary and more at columbiathreadneedle.com/us.
Subscribe to the latest information from Columbia Threadneedle. Register your information online at columbiathreadneedle.com/us/subscribe and select the publications you would like to receive, including:
n Columbia Threadneedle Investor Newsletter, highlighting the latest macro- and micro-economic trends, investment themes, products, service changes and other items of interest to our investors
n Investment Strategy Outlook, showcasing the Columbia Threadneedle Asset Allocation Team's perspective on global economic investment conditions and markets
n MarketTrack, featuring straightforward insight on current investment opportunities
n White papers that delve deep into a variety of investment topics
n Quarterly portfolio manager commentary and fund fact sheets
Update your subscriptions at any time by accessing the email subscription center.
Social media
We offer you multiple ways to access our market commentary and investment insights.
n Perspectives blog at columbiathreadneedle.com/us
Read timely posts by our investment team, including our chief investment officer, chief economist and portfolio managers.
n Twitter.com/CTinvest_US
Follow us on Twitter for quick, up-to-the-minute comments on market news and more.
n Youtube.com/CTInvestUS
View our commentaries on the economy, markets and current investment opportunities.
n Linkedin.com/company/Columbia-Threadneedle-Investments-US
Connect with us on LinkedIn for updates from our thought leaders.
Not part of the shareholder report
 Dear Shareholder,
Today's investors are typically focused on outcomes, like living a certain retirement lifestyle, paying for college education or building a legacy. But in today's complex global investment landscape, even simple goals are not easily achieved.
At Columbia Threadneedle Investments, we aspire to help satisfy five core needs of today's investors:
n Generate an appropriate stream of income in retirement
Traditional approaches to generating income may not provide the diversification benefits they once did, and they may actually introduce unwanted risk in today's market. To seek to improve your potential to live comfortably long term, we endeavor to pursue investments that explore less traveled paths to income.
n Navigate a changing interest rate environment
Today's uncertain market environment includes the prospect of a rise in interest rates. Blending traditional investments with non-traditional or alternative products may help protect your wealth during periods of volatility. We can attempt to help strengthen your portfolio with agile products designed to take on the market's ups and downs.
n Maximize after-tax returns
In an environment where what you keep may be more important than what you earn, municipal bonds can help mitigate high tax burdens while providing potentially attractive yields. Our state and federal tax-exempt products are aimed at helping investors manage risk, minimize the fluctuation of capital and grow wealth on a more tax-efficient basis.
n Grow assets to achieve financial goals
We believe that finding and protecting growth comes from a disciplined security selection process designed to create excess return. Our goal is to provide investment solutions built to help you face today's market challenges and grow your assets at each crossroad of your journey.
n Ease the impact of volatile markets
Despite a bull market run that has benefited many investors over the past several years, it's important to remember the lessons of 2008 and the value that a well-diversified portfolio may provide through times of market volatility. We are here to help you hold onto the savings you have worked tirelessly to amass, and to provide you the best opportunity to maintain your standard of living regardless of market conditions.
Find out today how we can help you confidently invest to realize your dreams. Please visit us at blog.columbiathreadneedleus.com/our-best-ideas to learn more about our unique investment solutions.
The world is constantly changing, but our priority remains the same: to help you secure your finances, meet your goals and achieve success. Thank you for your continued investment with us.
Sincerely,

Christopher O. Petersen
President, Columbia Funds
Investors should consider the investment objectives, risks, charges and expenses of a mutual fund carefully before investing. For a free prospectus and summary prospectus, which contains this and other important information about a fund, visit columbiathreadneedle.com/us. The prospectus should be read carefully before investing.
Columbia Funds are distributed by Columbia Management Investment Distributors, Inc., member FINRA, and managed by Columbia Management Investment Advisers, LLC.
© 2016 Columbia Management Investment Advisers, LLC. All rights reserved.
COLUMBIA SMALL CAP INDEX FUND
Fund Investment Manager
Columbia Management Investment
Advisers, LLC
225 Franklin Street
Boston, MA 02110
Fund Distributor
Columbia Management Investment
Distributors, Inc.
225 Franklin Street
Boston, MA 02110
Fund Transfer Agent
Columbia Management Investment
Services Corp.
P.O. Box 8081
Boston, MA 02266-8081
For more information about any of the funds, please visit columbiathreadneedle.com/us or call 800.345.6611. Customer Service Representatives are available to answer your questions Monday through Friday from 8 a.m. to 7 p.m. Eastern time.
The views expressed in this report reflect the current views of the respective parties. These views are not guarantees of future performance and involve certain risks, uncertainties and assumptions that are difficult to predict, so actual outcomes and results may differ significantly from the views expressed. These views are subject to change at any time based upon economic, market or other conditions and the respective parties disclaim any responsibility to update such views. These views may not be relied on as investment advice and, because investment decisions for a Columbia fund are based on numerous factors, may not be relied on as an indication of trading intent on behalf of any particular Columbia fund. References to specific securities should not be construed as a recommendation or investment advice.
Performance Overview | | | 3 | | |
Manager Discussion of Fund Performance | | | 5 | | |
Understanding Your Fund's Expenses | | | 7 | | |
Portfolio of Investments | | | 8 | | |
Statement of Assets and Liabilities | | | 22 | | |
Statement of Operations | | | 24 | | |
Statement of Changes in Net Assets | | | 25 | | |
Financial Highlights | | | 27 | | |
Notes to Financial Statements | | | 34 | | |
Report of Independent Registered Public Accounting Firm | | | 43 | | |
Federal Income Tax Information | | | 44 | | |
Trustees and Officers | | | 45 | | |
Important Information About This Report | | | 51 | | |
COLUMBIA SMALL CAP INDEX FUND
Performance Summary
n Columbia Small Cap Index Fund (the Fund) Class A shares returned -9.67% for the 12-month period that ended February 29, 2016.
n The Fund closely tracked its benchmark, the unmanaged S&P SmallCap 600 Index, which returned -9.10% for the same period.
n Mutual funds, unlike unmanaged indices, incur operating expenses, which accounted for the performance differential between the Fund and the Index.
Average Annual Total Returns (%) (for period ended February 29, 2016)
| | | Inception | | 1 Year | | 5 Years | | 10 Years | |
Class A | | 10/15/96 | | | -9.67 | | | | 8.80 | | | | 6.25 | | |
Class B* | | 03/07/11 | | | | | | | | | | | | | |
Excluding sales charges | | | | | -10.34 | | | | 7.99 | | | | 5.45 | | |
Including sales charges | | | | | -14.42 | | | | 7.69 | | | | 5.45 | | |
Class I* | | 11/16/11 | | | -9.43 | | | | 9.06 | | | | 6.37 | | |
Class K* | | 03/07/11 | | | -9.68 | | | | 8.80 | | | | 6.24 | | |
Class R5* | | 11/08/12 | | | -9.46 | | | | 8.99 | | | | 6.34 | | |
Class W* | | 06/25/14 | | | -9.65 | | | | 8.81 | | | | 6.25 | | |
Class Z | | 10/15/96 | | | -9.44 | | | | 9.07 | | | | 6.51 | | |
S&P SmallCap 600 Index | | | | | -9.10 | | | | 9.33 | | | | 6.66 | | |
Returns for Class B are shown with and without the applicable contingent deferred sales charge (CDSC) of 5.00% in the first year, declining to 1.00% in the sixth year and eliminated thereafter. The Fund's other classes are not subject to sales charges and have limited eligibility. Please see the Fund's prospectus for details. Performance for different share classes will vary based on differences in sales charges and fees associated with each class. All results shown assume reinvestment of distributions during the period. Returns do not reflect the deduction of taxes that a shareholder may pay on Fund distributions or on the redemption of Fund shares. Performance results reflect the effect of any fee waivers or reimbursements of Fund expenses by Columbia Management Investment Advisers, LLC and/or any of its affiliates. Absent these fee waivers or expense reimbursement arrangements, performance results would have been lower.
The performance information shown represents past performance and is not a guarantee of future results. The investment return and principal value of your investment will fluctuate so that your shares, when redeemed, may be worth more or less than their original cost. Current performance may be lower or higher than the performance information shown. You may obtain performance information current to the most recent month-end by contacting your financial intermediary, visiting columbiathreadneedle.com/us or calling 800.345.6611.
*The returns shown for periods prior to the share class inception date (including returns for the Life of the Fund, if shown, which are since Fund inception) include the returns of the Fund's oldest share class. Since the Fund launched more than one share class at its inception, Class A shares were used. These returns are adjusted to reflect any higher class-related operating expenses of the newer share classes, as applicable. Please visit columbiathreadneedle.com/us/investment-products/mutual-funds/appended-performance for more information.
The S&P SmallCap 600 Index tracks the performance of 600 domestic companies traded on major stock exchanges. The S&P SmallCap 600 Index is heavily weighted with the stocks of companies with small market capitalizations.
Indices are not available for investment, are not professionally managed and do not reflect sales charges, fees, brokerage commissions, taxes or other expenses of investing. Securities in the Fund may not match those in an index.
Annual Report 2016
3
COLUMBIA SMALL CAP INDEX FUND
PERFORMANCE OVERVIEW (continued)
Performance of a Hypothetical $10,000 Investment (March 1, 2006 – February 29, 2016)
The chart above shows the change in value of a hypothetical $10,000 investment in Class A shares of Columbia Small Cap Index Fund during the stated time period, and does not reflect the deduction of taxes that a shareholder may pay on Fund distributions or on the redemption of Fund shares.
Annual Report 2016
4
COLUMBIA SMALL CAP INDEX FUND
MANAGER DISCUSSION OF FUND PERFORMANCE
For the 12-month period that ended February 29, 2016, the Fund's Class A shares returned -9.67%. The Fund closely tracked its benchmark, the unmanaged S&P SmallCap 600 Index, which returned -9.10% for the same period. Mutual funds, unlike unmanaged indices, incur operating expenses, which accounted for the performance differential between the Fund and the Index.
U.S. Equity Market Experienced a Roller Coaster Year
The U.S. economy topped the rest of the developed world, and the U.S. stock market, as represented by the S&P 500 Index, finished calendar year 2015 in positive territory, though small-cap stocks, as represented by the S&P SmallCap 600 Index, did not perform as well. For the 12 months ended February 29, 2016, the U.S. equity market, across the market capitalization spectrum, declined substantially, providing evidence of the roller coaster year experienced by most investors. Four factors dogged U.S. stocks during the period. One, a further and unexpected decline in commodity prices (making for a fifth consecutive year of negative returns), particularly oil. Two, continued strength in the U.S. dollar. Three, soft economic growth and currency devaluation in China. And four, a Federal Reserve (Fed) that only felt confident enough about the U.S. economy to begin raising interest rates in the waning weeks of December 2015. Twelve months earlier, many expected the Fed to begin tightening monetary policy as early as the first quarter of 2015.
Dissecting U.S. equity market returns further, it is clear that performance was narrowly driven by a handful of stocks. Indeed, just ten stocks accounted for 40% of the total positive contribution to the S&P 500 Index return in calendar year 2015. Even further, the so called "FANG" stocks — Facebook, Amazon.com, Netflix and Google accounted for over 20% of the total positive return in the S&P 500 Index in 2015.
Though overall 2015 will be remembered as one of the most uncertain and turbulent market years, in perspective, it is worth keeping in mind that there were also many important positive economic developments. For example, rising consumer confidence, especially toward the end of the calendar year, drove much of consumer spending for 2015. Also, home prices increased; inflation remained relatively stable; and the job market held steady, with unemployment declining to 5% at year end 2015.
In the first two months of 2016, anxiety about a potential U.S. recession began to subside. Retail sales, existing home sales, the Institute of Supply Management's Purchasing Managers Index, and the employment report all exceeded economists' consensus forecasts. Still, the S&P 500 Index and the S&P SmallCap 600 Index each declined more than 5% in the first two months of 2016, attributable primarily to January 2016 when U.S. equities were embroiled in what was a global rout, triggered by investor concerns of an intensifying economic slowdown in China and exacerbated by a plunge in oil prices to less than $30 per barrel. Market sentiment appeared to improve in February 2016, as central banks outside of the U.S. increasingly acknowledged rising economic risks, U.S. economic data improved, and oil prices recovered modestly from their trough point.
Portfolio Management
Christopher Lo, CFA
Vadim Shteyn
Morningstar Style BoxTM
The Morningstar Style BoxTM is based on a fund's portfolio holdings. For equity funds, the vertical axis shows the market capitalization of the stocks owned, and the horizontal axis shows investment style (value, blend, or growth). Information shown is based on the most recent data provided by Morningstar.
© 2016 Morningstar, Inc. All rights reserved. The Morningstar information contained herein: (1) is proprietary to Morningstar and/or its content providers; (2) may not be copied or distributed; and (3) is not warranted to be accurate, complete or timely. Neither Morningstar nor its content providers are responsible for any damages or losses arising from any use of this information.
Top Ten Holdings (%)
(at February 29, 2016) | |
iShares Core S&P
Small-Cap ETF | | | 1.0 | | |
Piedmont Natural Gas Co., Inc. | | | 0.8 | | |
Heartland Payment
Systems, Inc. | | | 0.6 | | |
Viasat, Inc. | | | 0.6 | | |
ABIOMED, Inc. | | | 0.5 | | |
Take-Two Interactive
Software, Inc. | | | 0.5 | | |
New Jersey Resources Corp. | | | 0.5 | | |
Healthcare Realty Trust, Inc. | | | 0.5 | | |
Southwest Gas Corp. | | | 0.5 | | |
EMCOR Group, Inc. | | | 0.5 | | |
Percentages indicated are based upon total investments (excluding Money Market Funds).
For further detail about these holdings, please refer to the section entitled "Portfolio of Investments."
Annual Report 2016
5
COLUMBIA SMALL CAP INDEX FUND
MANAGER DISCUSSION OF FUND PERFORMANCE (continued)
Fund holdings are as of the date given, are subject to change at any time, and are not recommendations to buy or sell any security.
Portfolio Breakdown (%)
(at February 29, 2016) | |
Common Stocks | | | 97.8 | | |
Exchange-Traded Funds | | | 1.0 | | |
Money Market Funds | | | 1.2 | | |
Rights | | | 0.0 | (a) | |
Total | | | 100.0 | | |
Percentages indicated are based upon total investments. The Fund's portfolio composition is subject to change.
(a) Rounds to zero.
Equity Sector Breakdown (%)
(at February 29, 2016) | |
Consumer Discretionary | | | 14.9 | | |
Consumer Staples | | | 2.8 | | |
Energy | | | 2.2 | | |
Financials | | | 23.0 | | |
Health Care | | | 12.9 | | |
Industrials | | | 16.9 | | |
Information Technology | | | 17.0 | | |
Materials | | | 4.4 | | |
Telecommunication Services | | | 1.2 | | |
Utilities | | | 4.7 | | |
Total | | | 100.0 | | |
Percentages indicated are based upon total equity investments. The Fund's portfolio composition is subject to change.
Investment Risks
Market risk may affect a single issuer, sector of the economy, industry or the market as a whole. Investments in small-cap companies involve risks and volatility greater than investments in larger, more established companies. The Fund's net value will generally decline when the performance of its targeted index declines. Investing in derivatives is a specialized activity that involves special risks, which may result in significant losses. The Fund may invest significantly in issuers within a particular sector, which may be negatively affected by market, economic or other conditions, making the Fund more vulnerable to unfavorable developments in the sector. See the Fund's prospectus for information on these and other risks.
S&P SmallCap 600 Index Faced Broad-Based Declines
Only three of the ten sectors of the S&P SmallCap 600 Index posted positive returns during the 12 months ended February 29, 2016. In terms of total return, utilities, telecommunication services and consumer staples, each traditionally considered a defensive sector, were the best relative performers. On the basis of impact, which takes weightings and total returns into account, utilities, consumer staples and information technology were the biggest contributors to the Index's return. The top performing industries for the period were household and personal products; utilities; software and services; telecommunications; and food, beverage and tobacco.
Conversely, energy, materials and consumer discretionary, each considered a more cyclical sector, were the weakest performers from a total return perspective. On the basis of impact, energy, industrials and consumer discretionary were the weakest. The worst performing industries for the period were energy; materials; diversified financials; retailing; and transportation.
Top individual contributors within the S&P SmallCap 600 Index included consumer finance company Heartland Payment Systems, natural gas utilities network Piedmont Natural Gas, airline Hawaiian Holdings, internet-based postage provider Stamps.com and biotechnology firm Ligand Pharmaceuticals. Top detractors were footwear manufacturer Wolverine World Wide, agricultural producer Darling Ingredients, specialty chemicals company Chemours, oil and gas exploration and production company Carrizo Oil & Gas and hotel real estate investment trust DiamondRock Hospitality.
As always, each sector and stock in the S&P SmallCap 600 Index was represented in the Fund with approximately the same weighting as in the Index and therefore had a similar effect.
Index Additions and Deletions Drove Portfolio Changes
During the period, there were 76 additions and 74 deletions to the Index and the Fund's portfolio. Among those stocks added were Republic Airways, C&J Energy Services, Walker & Dunlop, Supernus Pharmaceuticals, Asbury Automotive Group, Northfield Bancorp, REX American Resources, Barnes & Noble Education, TimkenSteel, US Physical Therapy, Inogen, Tumi Holdings, Atwood Oceanics, WWE and Rent-A-Center.
Deletions included Arch Coal, Aeropostale, Buffalo Wild Wings, Casey's General Stores, Comstock Resources, Curtiss-Wright, ION Geophysical, Manhattan Associates, Montpelier Re Holdings, The Men's Wearhouse, Bank of the Ozarks, Post Properties, Wausau Paper, Entropic Communications and Jack in the Box.
We do not anticipate any changes in the portfolio beyond the customary quarterly rebalancings and stock substitutions we make to align the Fund with the S&P SmallCap 600 Index. As the Fund seeks to closely approximate the performance of the S&P SmallCap 600 Index, we will continue to match its industry and risk characteristics by investing primarily in the securities that comprise the Index.
Annual Report 2016
6
COLUMBIA SMALL CAP INDEX FUND
UNDERSTANDING YOUR FUND'S EXPENSES
(Unaudited)
As an investor, you incur two types of costs. There are transaction costs, which generally include sales charges on purchases and may include redemption fees. There are also ongoing costs, which generally include management fees, distribution and/or service fees, and other fund expenses. The following information is intended to help you understand your ongoing costs (in dollars) of investing in the Fund and to help you compare these costs with the ongoing costs of investing in other mutual funds.
Analyzing Your Fund's Expenses
To illustrate these ongoing costs, we have provided examples and calculated the expenses paid by investors in each share class of the Fund during the period. The actual and hypothetical information in the table is based on an initial investment of $1,000 at the beginning of the period indicated and held for the entire period. Expense information is calculated two ways and each method provides you with different information. The amount listed in the "Actual" column is calculated using the Fund's actual operating expenses and total return for the period. You may use the Actual information, together with the amount invested, to estimate the expenses that you paid over the period. Simply divide your account value by $1,000 (for example, an $8,600 account value divided by $1,000 = 8.6), then multiply the results by the expenses paid during the period under the "Actual" column. The amount listed in the "Hypothetical" column assumes a 5% annual rate of return before expenses (which is not the Fund's actual return) and then applies the Fund's actual expense ratio for the period to the hypothetical return. You should not use the hypothetical account values and expenses to estimate either your actual account balance at the end of the period or the expenses you paid during the period. See "Compare With Other Funds" below for details on how to use the hypothetical data.
Compare With Other Funds
Since all mutual funds are required to include the same hypothetical calculations about expenses in shareholder reports, you can use this information to compare the ongoing cost of investing in the Fund with other funds. To do so, compare the hypothetical example with the 5% hypothetical examples that appear in the shareholder reports of other funds. As you compare hypothetical examples of other funds, it is important to note that hypothetical examples are meant to highlight the ongoing costs of investing in a fund only and do not reflect any transaction costs, such as sales charges, or redemption or exchange fees. Therefore, the hypothetical calculations are useful in comparing ongoing costs only, and will not help you determine the relative total costs of owning different funds. If transaction costs were included in these calculations, your costs would be higher.
September 1, 2015 – February 29, 2016
| | | Account Value at the Beginning
of the Period ($) | | Account Value at the End of the
Period ($) | | Expenses Paid During the
Period ($) | | Fund's Annualized
Expense Ratio (%) | |
| | | Actual | | Hypothetical | | Actual | | Hypothetical | | Actual | | Hypothetical | | Actual | |
Class A | | | 1,000.00 | | | | 1,000.00 | | | | 946.60 | | | | 1,022.63 | | | | 2.18 | | | | 2.26 | | | | 0.45 | | |
Class B | | | 1,000.00 | | | | 1,000.00 | | | | 943.20 | | | | 1,018.90 | | | | 5.80 | | | | 6.02 | | | | 1.20 | | |
Class I | | | 1,000.00 | | | | 1,000.00 | | | | 947.90 | | | | 1,023.87 | | | | 0.97 | | | | 1.01 | | | | 0.20 | | |
Class K | | | 1,000.00 | | | | 1,000.00 | | | | 946.40 | | | | 1,022.63 | | | | 2.18 | | | | 2.26 | | | | 0.45 | | |
Class R5 | | | 1,000.00 | | | | 1,000.00 | | | | 947.60 | | | | 1,023.87 | | | | 0.97 | | | | 1.01 | | | | 0.20 | | |
Class W | | | 1,000.00 | | | | 1,000.00 | | | | 946.70 | | | | 1,022.63 | | | | 2.18 | | | | 2.26 | | | | 0.45 | | |
Class Z | | | 1,000.00 | | | | 1,000.00 | | | | 947.60 | | | | 1,023.87 | | | | 0.97 | | | | 1.01 | | | | 0.20 | | |
Expenses paid during the period are equal to the annualized expense ratio for each class as indicated above, multiplied by the average account value over the period and then multiplied by the number of days in the Fund's most recent fiscal half year and divided by 366.
Expenses do not include fees and expenses incurred indirectly by the Fund from its investment in underlying funds, including affiliated and non-affiliated pooled investment vehicles, such as mutual funds and exchange-traded funds.
Had Columbia Management Investment Advisers, LLC and/or certain of its affiliates not waived/reimbursed certain fees and expenses, account value at the end of the period would have been reduced.
Annual Report 2016
7
COLUMBIA SMALL CAP INDEX FUND
PORTFOLIO OF INVESTMENTS
February 29, 2016
(Percentages represent value of investments compared to net assets)
Common Stocks 97.6%
Issuer | | Shares | | Value ($) | |
CONSUMER DISCRETIONARY 14.5% | |
Auto Components 1.0% | |
Dorman Products, Inc.(a) | | | 141,665 | | | | 7,163,999 | | |
Drew Industries, Inc. | | | 110,767 | | | | 6,667,066 | | |
Gentherm, Inc.(a) | | | 166,100 | | | | 6,926,370 | | |
Motorcar Parts of America, Inc.(a) | | | 84,020 | | | | 2,898,690 | | |
Standard Motor Products, Inc. | | | 90,439 | | | | 2,723,118 | | |
Superior Industries International, Inc. | | | 106,134 | | | | 2,096,146 | | |
Total | | | | | 28,475,389 | | |
Automobiles 0.1% | |
Winnebago Industries, Inc. | | | 123,770 | | | | 2,318,212 | | |
Distributors 0.3% | |
Core-Mark Holding Co., Inc. | | | 105,740 | | | | 7,785,636 | | |
VOXX International Corp.(a) | | | 91,574 | | | | 365,380 | | |
Total | | | | | 8,151,016 | | |
Diversified Consumer Services 0.4% | |
American Public Education, Inc.(a) | | | 74,614 | | | | 1,151,294 | | |
Capella Education Co. | | | 49,783 | | | | 2,301,966 | | |
Career Education Corp.(a) | | | 311,898 | | | | 785,983 | | |
Regis Corp.(a) | | | 175,740 | | | | 2,518,354 | | |
Strayer Education, Inc.(a) | | | 50,585 | | | | 2,282,901 | | |
Universal Technical Institute, Inc. | | | 96,712 | | | | 378,144 | | |
Total | | | | | 9,418,642 | | |
Hotels, Restaurants & Leisure 3.3% | |
Belmond Ltd., Class A(a) | | | 405,810 | | | | 3,729,394 | | |
Biglari Holdings, Inc.(a) | | | 4,839 | | | | 1,784,236 | | |
BJ's Restaurants, Inc.(a) | | | 94,802 | | | | 4,178,872 | | |
Bob Evans Farms, Inc. | | | 95,730 | | | | 4,107,774 | | |
Boyd Gaming Corp.(a) | | | 366,753 | | | | 6,352,162 | | |
DineEquity, Inc. | | | 76,931 | | | | 7,036,879 | | |
Interval Leisure Group, Inc. | | | 179,328 | | | | 2,322,298 | | |
Marcus Corp. (The) | | | 86,703 | | | | 1,619,612 | | |
Marriott Vacations Worldwide Corp. | | | 123,967 | | | | 7,506,202 | | |
Monarch Casino & Resort, Inc.(a) | | | 49,075 | | | | 987,389 | | |
Papa John's International, Inc. | | | 132,426 | | | | 7,700,572 | | |
Pinnacle Entertainment, Inc.(a) | | | 279,214 | | | | 8,072,077 | | |
Popeyes Louisiana Kitchen, Inc.(a) | | | 103,080 | | | | 5,616,829 | | |
Red Robin Gourmet Burgers, Inc.(a) | | | 63,884 | | | | 4,158,848 | | |
Ruby Tuesday, Inc.(a) | | | 284,175 | | | | 1,503,286 | | |
Common Stocks (continued)
Issuer | | Shares | | Value ($) | |
Ruth's Hospitality Group, Inc. | | | 160,578 | | | | 2,821,356 | | |
Scientific Games Corp., Class A(a) | | | 229,420 | | | | 1,952,364 | | |
Sonic Corp. | | | 228,333 | | | | 6,706,140 | | |
Texas Roadhouse, Inc. | | | 289,578 | | | | 12,078,298 | | |
Total | | | | | 90,234,588 | | |
Household Durables 1.6% | |
Ethan Allen Interiors, Inc. | | | 119,912 | | | | 3,421,090 | | |
Helen of Troy Ltd.(a) | | | 128,888 | | | | 12,290,760 | | |
Installed Building Products, Inc.(a) | | | 76,250 | | | | 1,703,425 | | |
iRobot Corp.(a) | | | 133,345 | | | | 4,179,032 | | |
La-Z-Boy, Inc. | | | 230,237 | | | | 5,606,271 | | |
M/I Homes, Inc.(a) | | | 113,063 | | | | 1,986,517 | | |
Meritage Homes Corp.(a) | | | 169,211 | | | | 5,494,281 | | |
TopBuild Corp.(a) | | | 172,850 | | | | 4,663,493 | | |
Universal Electronics, Inc.(a) | | | 66,509 | | | | 3,534,288 | | |
Total | | | | | 42,879,157 | | |
Internet & Catalog Retail 0.3% | |
Blue Nile, Inc. | | | 52,902 | | | | 1,378,626 | | |
FTD Companies, Inc.(a) | | | 84,160 | | | | 1,956,720 | | |
Nutrisystem, Inc. | | | 133,842 | | | | 2,723,685 | | |
PetMed Express, Inc. | | | 92,408 | | | | 1,524,732 | | |
Total | | | | | 7,583,763 | | |
Leisure Products 0.4% | |
Arctic Cat, Inc. | | | 59,579 | | | | 1,041,441 | | |
Callaway Golf Co. | | | 412,475 | | | | 3,666,903 | | |
Sturm Ruger & Co., Inc. | | | 85,790 | | | | 6,031,895 | | |
Total | | | | | 10,740,239 | | |
Media 0.7% | |
EW Scripps Co. (The), Class A | | | 244,184 | | | | 4,214,616 | | |
Gannett Co., Inc. | | | 527,670 | | | | 8,052,244 | | |
Harte-Hanks, Inc. | | | 216,340 | | | | 668,491 | | |
Scholastic Corp. | | | 121,980 | | | | 4,272,959 | | |
Sizmek, Inc.(a) | | | 90,923 | | | | 296,409 | | |
World Wrestling Entertainment, Inc.,
Class A | | | 156,950 | | | | 2,624,204 | | |
Total | | | | | 20,128,923 | | |
Multiline Retail 0.1% | |
Fred's, Inc., Class A | | | 160,679 | | | | 2,296,103 | | |
Tuesday Morning Corp.(a) | | | 203,322 | | | | 1,368,357 | | |
Total | | | | | 3,664,460 | | |
The accompanying Notes to Financial Statements are an integral part of this statement.
Annual Report 2016
8
COLUMBIA SMALL CAP INDEX FUND
PORTFOLIO OF INVESTMENTS (continued)
February 29, 2016
Common Stocks (continued)
Issuer | | Shares | | Value ($) | |
Specialty Retail 4.5% | |
Asbury Automotive Group, Inc.(a) | | | 116,430 | | | | 6,799,512 | | |
Barnes & Noble Education, Inc.(a) | | | 179,073 | | | | 1,912,500 | | |
Barnes & Noble, Inc. | | | 284,120 | | | | 2,755,964 | | |
Big 5 Sporting Goods Corp. | | | 84,655 | | | | 1,159,774 | | |
Buckle, Inc. (The) | | | 129,121 | | | | 4,106,048 | | |
Caleres, Inc. | | | 200,504 | | | | 5,682,283 | | |
Cato Corp. (The), Class A | | | 119,975 | | | | 4,343,095 | | |
Children's Place, Inc. (The) | | | 93,181 | | | | 6,349,353 | | |
Express, Inc.(a) | | | 329,770 | | | | 5,681,937 | | |
Finish Line, Inc., Class A (The) | | | 205,827 | | | | 3,750,168 | | |
Five Below, Inc.(a) | | | 250,110 | | | | 9,591,718 | | |
Francesca's Holdings Corp.(a) | | | 191,085 | | | | 3,454,817 | | |
Genesco, Inc.(a) | | | 101,332 | | | | 6,685,885 | | |
Group 1 Automotive, Inc. | | | 103,255 | | | | 5,757,499 | | |
Haverty Furniture Companies, Inc. | | | 92,196 | | | | 1,792,290 | | |
Hibbett Sports, Inc.(a) | | | 104,523 | | | | 3,710,567 | | |
Kirkland's, Inc. | | | 72,184 | | | | 1,031,509 | | |
Lithia Motors, Inc., Class A | | | 108,682 | | | | 10,076,995 | | |
Lumber Liquidators Holdings, Inc.(a) | | | 124,248 | | | | 1,407,730 | | |
MarineMax, Inc.(a) | | | 117,219 | | | | 2,079,465 | | |
Monro Muffler Brake, Inc. | | | 146,681 | | | | 10,028,580 | | |
Outerwall, Inc. | | | 79,238 | | | | 2,471,433 | | |
Rent-A-Center, Inc. | | | 243,420 | | | | 3,108,473 | | |
Select Comfort Corp.(a) | | | 232,311 | | | | 4,158,367 | | |
Sonic Automotive, Inc., Class A | | | 147,311 | | | | 2,821,006 | | |
Stage Stores, Inc. | | | 146,872 | | | | 1,233,725 | | |
Stein Mart, Inc. | | | 134,091 | | | | 993,614 | | |
Tailored Brands, Inc. | | | 221,820 | | | | 3,424,901 | | |
Vitamin Shoppe, Inc.(a) | | | 133,583 | | | | 3,685,555 | | |
Zumiez, Inc.(a) | | | 91,738 | | | | 1,895,307 | | |
Total | | | | | 121,950,070 | | |
Textiles, Apparel & Luxury Goods 1.8% | |
Crocs, Inc.(a) | | | 337,878 | | | | 3,307,826 | | |
G-III Apparel Group Ltd.(a) | | | 183,810 | | | | 9,695,978 | | |
Iconix Brand Group, Inc.(a) | | | 221,981 | | | | 1,931,235 | | |
Movado Group, Inc. | | | 75,163 | | | | 2,195,511 | | |
Oxford Industries, Inc. | | | 66,946 | | | | 4,862,288 | | |
Perry Ellis International, Inc.(a) | | | 54,262 | | | | 1,002,219 | | |
Steven Madden Ltd.(a) | | | 258,342 | | | | 9,093,638 | | |
Common Stocks (continued)
Issuer | | Shares | | Value ($) | |
Tumi Holdings, Inc.(a) | | | 258,440 | | | | 5,104,190 | | |
Unifi, Inc.(a) | | | 68,610 | | | | 1,537,550 | | |
Vera Bradley, Inc.(a) | | | 94,230 | | | | 1,567,045 | | |
Wolverine World Wide, Inc. | | | 471,952 | | | | 8,934,051 | | |
Total | | | | | 49,231,531 | | |
Total Consumer Discretionary | | | | | 394,775,990 | | |
CONSUMER STAPLES 2.8% | |
Food & Staples Retailing 0.3% | |
Andersons, Inc. (The) | | | 119,559 | | | | 3,210,159 | | |
SpartanNash Co. | | | 172,459 | | | | 4,734,000 | | |
Total | | | | | 7,944,159 | | |
Food Products 1.8% | |
B&G Foods, Inc. | | | 265,946 | | | | 9,199,072 | | |
Cal-Maine Foods, Inc. | | | 142,316 | | | | 7,596,828 | | |
Calavo Growers, Inc. | | | 67,772 | | | | 3,629,868 | | |
Darling Ingredients, Inc.(a) | | | 755,603 | | | | 6,807,983 | | |
Diamond Foods, Inc.(a)(b) | | | 121,514 | | | | 4,595,660 | | |
J&J Snack Foods Corp. | | | 67,717 | | | | 7,502,367 | | |
Sanderson Farms, Inc. | | | 90,477 | | | | 8,256,931 | | |
Seneca Foods Corp., Class A(a) | | | 27,613 | | | | 918,408 | | |
Total | | | | | 48,507,117 | | |
Household Products 0.4% | |
Central Garden & Pet Co.(a) | | | 45,340 | | | | 631,586 | | |
Central Garden & Pet Co., Class A(a) | | | 149,862 | | | | 2,027,633 | | |
WD-40 Co. | | | 61,319 | | | | 6,622,452 | | |
Total | | | | | 9,281,671 | | |
Personal Products 0.1% | |
Inter Parfums, Inc. | | | 78,229 | | | | 1,979,976 | | |
Medifast, Inc. | | | 42,609 | | | | 1,293,183 | | |
Total | | | | | 3,273,159 | | |
Tobacco 0.2% | |
Universal Corp. | | | 104,200 | | | | 5,676,816 | | |
Total Consumer Staples | | | | | 74,682,922 | | |
ENERGY 2.1% | |
Energy Equipment & Services 1.2% | |
Archrock, Inc. | | | 318,550 | | | | 1,271,014 | | |
Atwood Oceanics, Inc. | | | 266,910 | | | | 1,836,341 | | |
Basic Energy Services, Inc.(a) | | | 179,831 | | | | 314,704 | | |
The accompanying Notes to Financial Statements are an integral part of this statement.
Annual Report 2016
9
COLUMBIA SMALL CAP INDEX FUND
PORTFOLIO OF INVESTMENTS (continued)
February 29, 2016
Common Stocks (continued)
Issuer | | Shares | | Value ($) | |
Bristow Group, Inc. | | | 160,285 | | | | 2,437,935 | | |
CARBO Ceramics, Inc. | | | 89,720 | | | | 1,793,503 | | |
Era Group, Inc.(a) | | | 88,379 | | | | 814,854 | | |
Exterran Corp.(a) | | | 161,250 | | | | 2,199,450 | | |
Geospace Technologies Corp.(a) | | | 60,310 | | | | 673,663 | | |
Gulf Island Fabrication, Inc. | | | 61,427 | | | | 547,315 | | |
Gulfmark Offshore, Inc., Class A(a) | | | 118,030 | | | | 423,728 | | |
Helix Energy Solutions Group, Inc.(a) | | | 452,770 | | | | 1,765,803 | | |
Hornbeck Offshore Services, Inc.(a) | | | 146,349 | | | | 1,257,138 | | |
Matrix Service Co.(a) | | | 121,726 | | | | 2,238,541 | | |
Newpark Resources, Inc.(a) | | | 386,000 | | | | 1,439,780 | | |
Pioneer Energy Services Corp.(a) | | | 295,858 | | | | 405,325 | | |
SEACOR Holdings, Inc.(a) | | | 73,234 | | | | 3,543,793 | | |
Tesco Corp. | | | 178,925 | | | | 1,295,417 | | |
Tetra Technologies, Inc.(a) | | | 368,019 | | | | 1,854,816 | | |
Tidewater, Inc. | | | 215,440 | | | | 1,238,780 | | |
Unit Corp.(a) | | | 231,250 | | | | 1,239,500 | | |
US Silica Holdings, Inc. | | | 244,870 | | | | 4,699,055 | | |
Total | | | | | 33,290,455 | | |
Oil, Gas & Consumable Fuels 0.9% | |
Bill Barrett Corp.(a) | | | 229,170 | | | | 655,426 | | |
Bonanza Creek Energy, Inc.(a) | | | 187,180 | | | | 348,155 | | |
Carrizo Oil & Gas, Inc.(a) | | | 248,815 | | | | 5,349,523 | | |
Cloud Peak Energy, Inc.(a) | | | 280,594 | | | | 477,010 | | |
Contango Oil & Gas Co.(a) | | | 80,098 | | | | 482,991 | | |
Green Plains, Inc. | | | 163,370 | | | | 2,221,832 | | |
Northern Oil and Gas, Inc.(a) | | | 239,710 | | | | 800,631 | | |
PDC Energy, Inc.(a) | | | 183,867 | | | | 9,213,575 | | |
REX American Resources Corp.(a) | | | 26,420 | | | | 1,334,210 | | |
Rex Energy Corp.(a) | | | 222,430 | | | | 131,323 | | |
Stone Energy Corp.(a) | | | 261,895 | | | | 405,937 | | |
Synergy Resources Corp.(a) | | | 515,630 | | | | 3,222,688 | | |
Total | | | | | 24,643,301 | | |
Total Energy | | | | | 57,933,756 | | |
FINANCIALS 22.5% | |
Banks 8.1% | |
Ameris Bancorp | | | 118,150 | | | | 3,188,869 | | |
Banner Corp. | | | 93,343 | | | | 3,706,651 | | |
BBCN Bancorp, Inc. | | | 364,912 | | | | 5,221,891 | | |
Common Stocks (continued)
Issuer | | Shares | | Value ($) | |
Boston Private Financial Holdings, Inc. | | | 383,715 | | | | 4,052,030 | | |
Brookline Bancorp, Inc. | | | 321,904 | | | | 3,383,211 | | |
Cardinal Financial Corp. | | | 147,745 | | | | 2,845,569 | | |
Central Pacific Financial Corp. | | | 143,720 | | | | 2,864,340 | | |
City Holding Co. | | | 70,190 | | | | 3,093,273 | | |
Columbia Banking System, Inc. | | | 264,815 | | | | 7,634,616 | | |
Community Bank System, Inc. | | | 199,450 | | | | 7,385,634 | | |
CVB Financial Corp. | | | 453,744 | | | | 7,046,644 | | |
First BanCorp(a) | | | 532,579 | | | | 1,427,312 | | |
First Commonwealth Financial Corp. | | | 408,072 | | | | 3,505,338 | | |
First Financial Bancorp | | | 282,765 | | | | 4,741,969 | | |
First Financial Bankshares, Inc. | | | 302,632 | | | | 7,992,511 | | |
First Midwest Bancorp, Inc. | | | 357,552 | | | | 5,971,118 | | |
First NBC Bank Holding Co.(a) | | | 72,600 | | | | 1,711,908 | | |
Glacier Bancorp, Inc. | | | 349,007 | | | | 8,313,347 | | |
Hanmi Financial Corp. | | | 146,680 | | | | 3,055,344 | | |
Home Bancshares, Inc. | | | 279,780 | | | | 11,056,906 | | |
Independent Bank Corp. | | | 120,346 | | | | 5,198,947 | | |
LegacyTexas Financial Group, Inc. | | | 201,043 | | | | 3,568,513 | | |
MB Financial, Inc. | | | 317,728 | | | | 9,697,059 | | |
National Penn Bancshares, Inc. | | | 643,576 | | | | 7,163,001 | | |
NBT Bancorp, Inc. | | | 198,570 | | | | 5,123,106 | | |
OFG Bancorp | | | 201,220 | | | | 1,171,100 | | |
Old National Bancorp | | | 525,326 | | | | 5,862,638 | | |
Pinnacle Financial Partners, Inc. | | | 161,153 | | | | 7,472,665 | | |
S&T Bancorp, Inc. | | | 159,687 | | | | 4,027,306 | | |
Simmons First National Corp., Class A | | | 129,092 | | | | 5,317,299 | | |
Southside Bancshares, Inc. | | | 108,242 | | | | 2,535,028 | | |
Sterling Bancorp | | | 547,520 | | | | 7,889,763 | | |
Talmer Bancorp, Inc. Class A | | | 288,150 | | | | 4,840,920 | | |
Texas Capital Bancshares, Inc.(a) | | | 210,289 | | | | 6,798,643 | | |
Tompkins Financial Corp. | | | 56,053 | | | | 3,165,313 | | |
UMB Financial Corp. | | | 192,197 | | | | 9,438,795 | | |
United Bankshares, Inc. | | | 296,928 | | | | 10,404,357 | | |
United Community Banks, Inc. | | | 266,685 | | | | 4,616,317 | | |
Westamerica Bancorporation | | | 117,100 | | | | 5,268,329 | | |
Wilshire Bancorp, Inc. | | | 324,480 | | | | 3,192,883 | | |
Wintrust Financial Corp. | | | 221,861 | | | | 9,429,093 | | |
Total | | | | | 220,379,556 | | |
The accompanying Notes to Financial Statements are an integral part of this statement.
Annual Report 2016
10
COLUMBIA SMALL CAP INDEX FUND
PORTFOLIO OF INVESTMENTS (continued)
February 29, 2016
Common Stocks (continued)
Issuer | | Shares | | Value ($) | |
Capital Markets 1.5% | |
Calamos Asset Management, Inc.,
Class A | | | 79,112 | | | | 670,079 | | |
Evercore Partners, Inc., Class A | | | 181,335 | | | | 8,462,904 | | |
Financial Engines, Inc. | | | 236,588 | | | | 5,772,747 | | |
Greenhill & Co., Inc. | | | 125,100 | | | | 2,884,806 | | |
HFF, Inc., Class A | | | 157,937 | | | | 3,953,163 | | |
Interactive Brokers Group, Inc., Class A | | | 265,800 | | | | 9,082,386 | | |
INTL FCStone, Inc.(a) | | | 70,670 | | | | 1,804,205 | | |
Investment Technology Group, Inc. | | | 154,053 | | | | 2,822,251 | | |
Piper Jaffray Companies(a) | | | 69,668 | | | | 2,950,440 | | |
Virtus Investment Partners, Inc. | | | 31,017 | | | | 2,847,671 | | |
Total | | | | | 41,250,652 | | |
Consumer Finance 0.9% | |
Cash America International, Inc. | | | 116,570 | | | | 3,927,243 | | |
Encore Capital Group, Inc.(a) | | | 107,815 | | | | 2,506,699 | | |
Enova International, Inc.(a) | | | 122,611 | | | | 708,691 | | |
Ezcorp, Inc., Class A(a) | | | 237,754 | | | | 689,487 | | |
First Cash Financial Services, Inc. | | | 127,543 | | | | 5,378,488 | | |
Green Dot Corp., Class A(a) | | | 215,815 | | | | 4,458,738 | | |
PRA Group, Inc.(a) | | | 221,124 | | | | 5,395,426 | | |
World Acceptance Corp.(a) | | | 38,870 | | | | 1,427,695 | | |
Total | | | | | 24,492,467 | | |
Insurance 2.8% | |
American Equity Investment Life
Holding Co. | | | 374,070 | | | | 5,087,352 | | |
AMERISAFE, Inc. | | | 87,580 | | | | 4,510,370 | | |
eHealth, Inc.(a) | | | 76,458 | | | | 771,461 | | |
Employers Holdings, Inc. | | | 147,146 | | | | 4,084,773 | | |
HCI Group, Inc. | | | 41,460 | | | | 1,456,904 | | |
Horace Mann Educators Corp. | | | 186,697 | | | | 5,752,135 | | |
Infinity Property & Casualty Corp. | | | 51,634 | | | | 3,860,158 | | |
Navigators Group, Inc. (The)(a) | | | 50,256 | | | | 4,069,731 | | |
ProAssurance Corp. | | | 243,766 | | | | 12,020,101 | | |
RLI Corp. | | | 173,136 | | | | 10,867,747 | | |
Safety Insurance Group, Inc. | | | 64,387 | | | | 3,561,245 | | |
Selective Insurance Group, Inc. | | | 262,359 | | | | 8,810,015 | | |
Stewart Information Services Corp. | | | 102,000 | | | | 3,442,500 | | |
United Fire Group, Inc. | | | 96,625 | | | | 3,895,920 | | |
United Insurance Holdings Corp. | | | 81,960 | | | | 1,599,040 | | |
Universal Insurance Holdings, Inc. | | | 148,600 | | | | 2,900,672 | | |
Total | | | | | 76,690,124 | | |
Common Stocks (continued)
Issuer | | Shares | | Value ($) | |
Real Estate Investment Trusts (REITs) 7.6% | |
Acadia Realty Trust | | | 316,602 | | | | 10,463,696 | | |
Agree Realty Corp. | | | 88,845 | | | | 3,291,707 | | |
American Assets Trust, Inc. | | | 180,960 | | | | 6,711,806 | | |
Capstead Mortgage Corp. | | | 439,555 | | | | 4,268,079 | | |
CareTrust REIT, Inc. | | | 220,856 | | | | 2,515,550 | | |
Cedar Realty Trust, Inc. | | | 343,306 | | | | 2,344,780 | | |
Chesapeake Lodging Trust | | | 273,650 | | | | 6,953,447 | | |
Coresite Realty Corp. | | | 140,570 | | | | 9,061,142 | | |
Cousins Properties, Inc. | | | 935,471 | | | | 8,101,179 | | |
DiamondRock Hospitality Co. | | | 920,808 | | | | 8,195,191 | | |
EastGroup Properties, Inc. | | | 147,512 | | | | 7,999,576 | | |
Education Realty Trust, Inc. | | | 279,378 | | | | 11,077,338 | | |
Four Corners Property Trust, Inc. | | | 176,570 | | | | 2,897,514 | | |
Franklin Street Properties Corp. | | | 409,005 | | | | 3,889,638 | | |
Geo Group, Inc. (The) | | | 338,327 | | | | 9,825,016 | | |
Getty Realty Corp. | | | 120,486 | | | | 2,191,640 | | |
Government Properties Income Trust | | | 326,255 | | | | 4,841,624 | | |
Healthcare Realty Trust, Inc. | | | 461,642 | | | | 13,392,235 | | |
Inland Real Estate Corp. | | | 415,234 | | | | 4,401,480 | | |
Kite Realty Group Trust | | | 382,210 | | | | 10,289,093 | | |
Lexington Realty Trust | | | 971,499 | | | | 7,519,402 | | |
LTC Properties, Inc. | | | 163,161 | | | | 7,250,875 | | |
Medical Properties Trust, Inc. | | | 1,090,969 | | | | 12,622,511 | | |
Parkway Properties, Inc. | | | 373,791 | | | | 5,005,062 | | |
Pennsylvania Real Estate Investment
Trust | | | 317,384 | | | | 6,081,078 | | |
PS Business Parks, Inc. | | | 89,220 | | | | 8,191,288 | | |
Retail Opportunity Investments Corp. | | | 456,340 | | | | 8,387,529 | | |
Sabra Health Care REIT, Inc. | | | 298,771 | | | | 5,950,025 | | |
Saul Centers, Inc. | | | 52,512 | | | | 2,572,038 | | |
Summit Hotel Properties, Inc. | | | 397,830 | | | | 4,300,542 | | |
Universal Health Realty Income Trust | | | 56,236 | | | | 2,915,274 | | |
Urstadt Biddle Properties, Inc., Class A | | | 121,646 | | | | 2,404,941 | | |
Total | | | | | 205,912,296 | | |
Real Estate Management & Development 0.1% | |
Forestar Group, Inc.(a) | | | 154,116 | | | | 1,502,631 | | |
RE/MAX Holdings, Inc., Class A | | | 77,250 | | | | 2,476,635 | | |
Total | | | | | 3,979,266 | | |
The accompanying Notes to Financial Statements are an integral part of this statement.
Annual Report 2016
11
COLUMBIA SMALL CAP INDEX FUND
PORTFOLIO OF INVESTMENTS (continued)
February 29, 2016
Common Stocks (continued)
Issuer | | Shares | | Value ($) | |
Thrifts & Mortgage Finance 1.5% | |
Astoria Financial Corp. | | | 416,080 | | | | 6,195,431 | | |
Bank Mutual Corp. | | | 194,046 | | | | 1,449,524 | | |
BofI Holding, Inc.(a) | | | 262,900 | | | | 4,871,537 | | |
Dime Community Bancshares, Inc. | | | 140,304 | | | | 2,389,377 | | |
LendingTree, Inc.(a) | | | 32,640 | | | | 2,884,397 | | |
Northfield Bancorp, Inc. | | | 179,350 | | | | 2,817,588 | | |
Northwest Bancshares, Inc. | | | 466,816 | | | | 5,877,213 | | |
Oritani Financial Corp. | | | 171,988 | | | | 2,910,037 | | |
Provident Financial Services, Inc. | | | 269,951 | | | | 5,018,389 | | |
TrustCo Bank Corp. | | | 436,225 | | | | 2,517,018 | | |
Walker & Dunlop, Inc.(a) | | | 123,380 | | | | 2,852,546 | | |
Total | | | | | 39,783,057 | | |
Total Financials | | | | | 612,487,418 | | |
HEALTH CARE 12.5% | |
Biotechnology 1.3% | |
Acorda Therapeutics, Inc.(a) | | | 197,955 | | | | 6,475,108 | | |
AMAG Pharmaceuticals, Inc.(a) | | | 159,470 | | | | 4,190,872 | | |
Emergent Biosolutions, Inc.(a) | | | 139,329 | | | | 4,713,500 | | |
Enanta Pharmaceuticals, Inc.(a) | | | 60,090 | | | | 1,705,955 | | |
Ligand Pharmaceuticals, Inc.(a) | | | 83,180 | | | | 7,675,850 | | |
MiMedx Group, Inc.(a) | | | 454,830 | | | | 3,743,251 | | |
Momenta Pharmaceuticals, Inc.(a) | | | 287,511 | | | | 2,416,530 | | |
Repligen Corp.(a) | | | 151,120 | | | | 3,888,318 | | |
Spectrum Pharmaceuticals, Inc.(a) | | | 271,825 | | | | 1,228,649 | | |
Total | | | | | 36,038,033 | | |
Health Care Equipment & Supplies 4.5% | |
Abaxis, Inc. | | | 97,949 | | | | 3,841,560 | | |
ABIOMED, Inc.(a) | | | 179,004 | | | | 14,322,110 | | |
Analogic Corp. | | | 56,980 | | | | 4,272,360 | | |
Angiodynamics, Inc.(a) | | | 121,480 | | | | 1,320,488 | | |
Anika Therapeutics, Inc.(a) | | | 67,140 | | | | 3,030,028 | | |
Cantel Medical Corp. | | | 164,135 | | | | 10,443,910 | | |
CONMED Corp. | | | 118,188 | | | | 4,696,791 | | |
CryoLife, Inc. | | | 116,540 | | | | 1,248,143 | | |
Cynosure Inc., Class A(a) | | | 104,246 | | | | 4,239,685 | | |
Greatbatch, Inc.(a) | | | 114,932 | | | | 4,344,430 | | |
Haemonetics Corp.(a) | | | 232,677 | | | | 7,464,278 | | |
ICU Medical, Inc.(a) | | | 65,959 | | | | 6,061,632 | | |
Common Stocks (continued)
Issuer | | Shares | | Value ($) | |
Inogen, Inc.(a) | | | 65,810 | | | | 2,249,386 | | |
Integra LifeSciences Holdings Corp.(a) | | | 132,319 | | | | 8,119,094 | | |
Invacare Corp. | | | 137,112 | | | | 1,660,426 | | |
Masimo Corp.(a) | | | 207,610 | | | | 7,855,962 | | |
Meridian Bioscience, Inc. | | | 191,950 | | | | 3,867,793 | | |
Merit Medical Systems, Inc.(a) | | | 202,758 | | | | 3,813,878 | | |
Natus Medical, Inc.(a) | | | 151,470 | | | | 5,501,390 | | |
Neogen Corp.(a) | | | 171,429 | | | | 8,442,878 | | |
NuVasive, Inc.(a) | | | 225,211 | | | | 9,413,820 | | |
SurModics, Inc.(a) | | | 59,379 | | | | 1,108,012 | | |
Vascular Solutions, Inc.(a) | | | 79,560 | | | | 2,391,574 | | |
Zeltiq Aesthetics, Inc.(a) | | | 146,790 | | | | 3,380,574 | | |
Total | | | | | 123,090,202 | | |
Health Care Providers & Services 3.2% | |
Aceto Corp. | | | 135,330 | | | | 2,902,828 | | |
Adeptus Health, Inc., Class A(a) | | | 54,940 | | | | 3,127,185 | | |
Air Methods Corp.(a) | | | 164,060 | | | | 5,960,300 | | |
Almost Family, Inc.(a) | | | 37,854 | | | | 1,429,367 | | |
Amedisys, Inc.(a) | | | 129,814 | | | | 4,769,366 | | |
AMN Healthcare Services, Inc.(a) | | | 218,770 | | | | 6,219,631 | | |
Chemed Corp. | | | 77,428 | | | | 9,949,498 | | |
Corvel Corp.(a) | | | 46,968 | | | | 1,948,702 | | |
Cross Country Healthcare, Inc.(a) | | | 149,421 | | | | 1,854,315 | | |
Ensign Group, Inc. (The) | | | 218,868 | | | | 4,488,983 | | |
ExamWorks Group, Inc.(a) | | | 182,850 | | | | 5,320,935 | | |
Hanger, Inc.(a) | | | 161,884 | | | | 403,091 | | |
HealthEquity, Inc.(a) | | | 160,110 | | | | 3,333,490 | | |
Healthways, Inc.(a) | | | 143,821 | | | | 1,514,435 | | |
Kindred Healthcare, Inc. | | | 384,375 | | | | 4,039,781 | | |
Landauer, Inc. | | | 43,936 | | | | 1,277,220 | | |
LHC Group, Inc.(a) | | | 59,350 | | | | 2,114,641 | | |
Magellan Health, Inc.(a) | | | 117,316 | | | | 7,389,148 | | |
PharMerica Corp.(a) | | | 139,699 | | | | 3,228,444 | | |
Providence Service Corp. (The)(a) | | | 57,830 | | | | 2,747,503 | | |
Select Medical Holdings Corp. | | | 481,420 | | | | 4,713,102 | | |
Surgical Care Affiliates, Inc.(a) | | | 123,460 | | | | 5,003,834 | | |
U.S. Physical Therapy, Inc. | | | 56,980 | | | | 2,888,316 | | |
Total | | | | | 86,624,115 | | |
The accompanying Notes to Financial Statements are an integral part of this statement.
Annual Report 2016
12
COLUMBIA SMALL CAP INDEX FUND
PORTFOLIO OF INVESTMENTS (continued)
February 29, 2016
Common Stocks (continued)
Issuer | | Shares | | Value ($) | |
Health Care Technology 1.0% | |
Computer Programs & Systems, Inc. | | | 48,121 | | | | 2,726,536 | | |
HealthStream, Inc.(a) | | | 111,779 | | | | 2,310,472 | | |
HMS Holdings Corp.(a) | | | 394,520 | | | | 5,195,828 | | |
Medidata Solutions, Inc.(a) | | | 253,982 | | | | 8,762,379 | | |
Omnicell, Inc.(a) | | | 162,505 | | | | 4,447,762 | | |
Quality Systems, Inc. | | | 203,803 | | | | 3,169,137 | | |
Total | | | | | 26,612,114 | | |
Life Sciences Tools & Services 0.6% | |
Affymetrix, Inc.(a) | | | 366,811 | | | | 5,150,026 | | |
Albany Molecular Research, Inc.(a) | | | 123,770 | | | | 1,824,370 | | |
Cambrex Corp.(a) | | | 144,633 | | | | 5,578,495 | | |
Luminex Corp.(a) | | | 175,794 | | | | 3,283,832 | | |
Total | | | | | 15,836,723 | | |
Pharmaceuticals 1.9% | |
ANI Pharmaceuticals, Inc.(a) | | | 34,780 | | | | 1,149,827 | | |
Depomed, Inc.(a) | | | 277,430 | | | | 4,239,130 | | |
Impax Laboratories, Inc.(a) | | | 304,040 | | | | 9,939,068 | | |
Lannett Co., Inc.(a) | | | 127,340 | | | | 3,203,874 | | |
Medicines Co. (The)(a) | | | 318,547 | | | | 10,244,471 | | |
Nektar Therapeutics(a) | | | 612,140 | | | | 6,837,604 | | |
Phibro Animal Health Corp., Class A | | | 83,030 | | | | 2,296,610 | | |
Prestige Brands Holdings, Inc.(a) | | | 241,948 | | | | 11,831,257 | | |
Sagent Pharmaceuticals, Inc.(a) | | | 109,790 | | | | 1,556,822 | | |
Supernus Pharmaceuticals, Inc.(a) | | | 157,090 | | | | 1,969,909 | | |
Total | | | | | 53,268,572 | | |
Total Health Care | | | | | 341,469,759 | | |
INDUSTRIALS 16.5% | |
Aerospace & Defense 1.1% | |
AAR Corp. | | | 151,803 | | | | 3,231,886 | | |
Aerojet Rocketdyne Holdings, Inc.(a) | | | 294,487 | | | | 4,573,383 | | |
Aerovironment, Inc.(a) | | | 94,859 | | | | 2,360,092 | | |
American Science & Engineering, Inc. | | | 32,876 | | | | 779,490 | | |
Cubic Corp. | | | 100,187 | | | | 3,520,571 | | |
Engility Holdings, Inc.(a) | | | 79,196 | | | | 1,149,134 | | |
Moog, Inc., Class A(a) | | | 152,844 | | | | 6,599,804 | | |
National Presto Industries, Inc. | | | 22,257 | | | | 1,811,720 | | |
Taser International, Inc.(a) | | | 246,060 | | | | 4,768,643 | | |
Total | | | | | 28,794,723 | | |
Common Stocks (continued)
Issuer | | Shares | | Value ($) | |
Air Freight & Logistics 0.7% | |
Atlas Air Worldwide Holdings, Inc.(a) | | | 112,985 | | | | 4,091,187 | | |
Echo Global Logistics, Inc.(a) | | | 117,810 | | | | 3,005,333 | | |
Forward Air Corp. | | | 141,429 | | | | 5,758,989 | | |
HUB Group, Inc., Class A(a) | | | 163,747 | | | | 6,045,539 | | |
Total | | | | | 18,901,048 | | |
Airlines 0.9% | |
Allegiant Travel Co. | | | 60,242 | | | | 9,872,459 | | |
Hawaiian Holdings, Inc.(a) | | | 217,240 | | | | 9,345,665 | | |
Skywest, Inc. | | | 232,799 | | | | 4,202,022 | | |
Total | | | | | 23,420,146 | | |
Building Products 1.6% | |
AAON, Inc. | | | 186,099 | | | | 4,615,255 | | |
American Woodmark Corp.(a) | | | 62,720 | | | | 4,283,149 | | |
Apogee Enterprises, Inc. | | | 133,440 | | | | 5,328,259 | | |
Gibraltar Industries, Inc.(a) | | | 135,267 | | | | 3,343,124 | | |
Griffon Corp. | | | 174,515 | | | | 2,593,293 | | |
PGT, Inc.(a) | | | 223,170 | | | | 2,207,151 | | |
Quanex Building Products Corp. | | | 155,574 | | | | 2,678,984 | | |
Simpson Manufacturing Co., Inc. | | | 188,236 | | | | 6,388,730 | | |
Trex Co., Inc.(a) | | | 141,670 | | | | 6,101,727 | | |
Universal Forest Products, Inc. | | | 92,350 | | | | 7,085,092 | | |
Total | | | | | 44,624,764 | | |
Commercial Services & Supplies 3.0% | |
ABM Industries, Inc. | | | 257,688 | | | | 8,091,403 | | |
Brady Corp., Class A | | | 215,776 | | | | 5,638,227 | | |
Brink's Co. (The) | | | 224,240 | | | | 6,559,020 | | |
Essendant, Inc. | | | 171,514 | | | | 5,054,518 | | |
G&K Services, Inc., Class A | | | 91,829 | | | | 6,088,263 | | |
Healthcare Services Group, Inc. | | | 330,116 | | | | 11,712,516 | | |
Interface, Inc. | | | 302,059 | | | | 4,802,738 | | |
Matthews International Corp., Class A | | | 150,830 | | | | 7,144,817 | | |
Mobile Mini, Inc. | | | 205,379 | | | | 5,902,592 | | |
Tetra Tech, Inc. | | | 270,754 | | | | 7,453,858 | | |
U.S. Ecology, Inc. | | | 99,690 | | | | 3,688,530 | | |
Unifirst Corp. | | | 69,972 | | | | 7,375,748 | | |
Viad Corp. | | | 92,372 | | | | 2,619,670 | | |
Total | | | | | 82,131,900 | | |
The accompanying Notes to Financial Statements are an integral part of this statement.
Annual Report 2016
13
COLUMBIA SMALL CAP INDEX FUND
PORTFOLIO OF INVESTMENTS (continued)
February 29, 2016
Common Stocks (continued)
Issuer | | Shares | | Value ($) | |
Construction & Engineering 1.2% | |
Aegion Corp.(a) | | | 166,258 | | | | 3,010,932 | | |
Comfort Systems U.S.A., Inc. | | | 171,043 | | | | 4,797,756 | | |
Dycom Industries, Inc.(a) | | | 148,994 | | | | 8,488,188 | | |
EMCOR Group, Inc. | | | 287,719 | | | | 13,197,671 | | |
MYR Group, Inc.(a) | | | 94,570 | | | | 2,121,205 | | |
Orion Marine Group, Inc.(a) | | | 125,138 | | | | 449,246 | | |
Total | | | | | 32,064,998 | | |
Electrical Equipment 1.0% | |
AZZ, Inc. | | | 118,315 | | | | 5,974,907 | | |
Encore Wire Corp. | | | 94,804 | | | | 3,426,217 | | |
EnerSys | | | 203,644 | | | | 10,459,156 | | |
Franklin Electric Co., Inc. | | | 176,506 | | | | 5,268,704 | | |
General Cable Corp. | | | 224,250 | | | | 1,926,307 | | |
Powell Industries, Inc. | | | 40,315 | | | | 1,067,138 | | |
Vicor Corp.(a) | | | 75,639 | | | | 627,804 | | |
Total | | | | | 28,750,233 | | |
Machinery 3.7% | |
Actuant Corp., Class A | | | 273,814 | | | | 6,409,986 | | |
Albany International Corp., Class A | | | 132,102 | | | | 4,837,575 | | |
Astec Industries, Inc. | | | 86,467 | | | | 3,755,262 | | |
Barnes Group, Inc. | | | 236,720 | | | | 8,121,863 | | |
Briggs & Stratton Corp. | | | 202,864 | | | | 4,314,917 | | |
Chart Industries, Inc.(a) | | | 140,110 | | | | 2,826,019 | | |
CIRCOR International, Inc. | | | 75,622 | | | | 3,031,686 | | |
EnPro Industries, Inc. | | | 100,723 | | | | 5,225,509 | | |
ESCO Technologies, Inc. | | | 118,442 | | | | 4,227,195 | | |
Federal Signal Corp. | | | 285,076 | | | | 3,381,001 | | |
Greenbrier Companies, Inc. (The) | | | 119,370 | | | | 3,037,967 | | |
Harsco Corp. | | | 367,390 | | | | 1,392,408 | | |
Hillenbrand, Inc. | | | 288,265 | | | | 8,106,012 | | |
John Bean Technologies Corp. | | | 133,658 | | | | 7,030,411 | | |
Lindsay Corp. | | | 51,788 | | | | 3,749,451 | | |
Lydall, Inc.(a) | | | 78,168 | | | | 2,262,964 | | |
Mueller Industries, Inc. | | | 262,190 | | | | 6,874,622 | | |
SPX Corp. | | | 187,170 | | | | 2,206,734 | | |
SPX FLOW, Inc.(a) | | | 188,510 | | | | 3,530,792 | | |
Standex International Corp. | | | 58,588 | | | | 4,126,353 | | |
Tennant Co. | | | 81,820 | | | | 3,807,903 | | |
Common Stocks (continued)
Issuer | | Shares | | Value ($) | |
Titan International, Inc. | | | 199,990 | | | | 1,013,949 | | |
Watts Water Technologies, Inc., Class A | | | 129,055 | | | | 6,655,366 | | |
Total | | | | | 99,925,945 | | |
Marine 0.3% | |
Matson, Inc. | | | 199,770 | | | | 8,008,779 | | |
Professional Services 1.7% | |
CDI Corp. | | | 66,874 | | | | 326,345 | | |
Exponent, Inc. | | | 118,100 | | | | 5,514,089 | | |
Heidrick & Struggles International, Inc. | | | 79,272 | | | | 1,862,099 | | |
Insperity, Inc. | | | 74,772 | | | | 3,550,922 | | |
Kelly Services, Inc., Class A | | | 136,269 | | | | 2,347,915 | | |
Korn/Ferry International | | | 234,877 | | | | 6,675,204 | | |
Navigant Consulting, Inc.(a) | | | 218,252 | | | | 3,313,065 | | |
On Assignment, Inc.(a) | | | 217,972 | | | | 7,195,256 | | |
Resources Connection, Inc. | | | 170,377 | | | | 2,363,129 | | |
TrueBlue, Inc.(a) | | | 192,511 | | | | 4,418,128 | | |
Wageworks, Inc.(a) | | | 164,870 | | | | 7,941,788 | | |
Total | | | | | 45,507,940 | | |
Road & Rail 0.8% | |
ArcBest Corp. | | | 111,945 | | | | 2,190,764 | | |
Celadon Group, Inc. | | | 127,760 | | | | 1,146,007 | | |
Heartland Express, Inc. | | | 277,326 | | | | 5,102,798 | | |
Knight Transportation, Inc. | | | 282,099 | | | | 6,835,259 | | |
Marten Transport Ltd. | | | 109,510 | | | | 1,795,964 | | |
Roadrunner Transportation
Systems, Inc.(a) | | | 138,670 | | | | 1,616,892 | | |
Saia, Inc.(a) | | | 114,510 | | | | 3,005,888 | | |
Total | | | | | 21,693,572 | | |
Trading Companies & Distributors 0.5% | |
Applied Industrial Technologies, Inc. | | | 180,401 | | | | 6,945,438 | | |
DXP Enterprises, Inc.(a) | | | 58,120 | | | | 789,851 | | |
Kaman Corp. | | | 124,271 | | | | 5,460,468 | | |
Veritiv Corp.(a) | | | 37,430 | | | | 1,195,514 | | |
Total | | | | | 14,391,271 | | |
Total Industrials | | | | | 448,215,319 | | |
INFORMATION TECHNOLOGY 16.6% | |
Communications Equipment 1.9% | |
ADTRAN, Inc. | | | 227,330 | | | | 4,253,344 | | |
Bel Fuse, Inc., Class B | | | 40,550 | | | | 602,168 | | |
The accompanying Notes to Financial Statements are an integral part of this statement.
Annual Report 2016
14
COLUMBIA SMALL CAP INDEX FUND
PORTFOLIO OF INVESTMENTS (continued)
February 29, 2016
Common Stocks (continued)
Issuer | | Shares | | Value ($) | |
Black Box Corp. | | | 70,553 | | | | 934,827 | | |
CalAmp Corp.(a) | | | 167,675 | | | | 3,065,099 | | |
Comtech Telecommunications Corp. | | | 74,067 | | | | 1,522,077 | | |
Digi International, Inc.(a) | | | 116,047 | | | | 985,239 | | |
Harmonic, Inc.(a) | | | 348,706 | | | | 1,168,165 | | |
Ixia(a) | | | 279,191 | | | | 3,185,569 | | |
Lumentum Holdings, Inc.(a) | | | 216,420 | | | | 5,200,573 | | |
NETGEAR, Inc.(a) | | | 144,535 | | | | 5,710,578 | | |
Ruckus Wireless, Inc.(a) | | | 406,820 | | | | 3,938,018 | | |
Viasat, Inc.(a) | | | 204,195 | | | | 14,908,277 | | |
Viavi Solutions, Inc.(a) | | | 1,064,510 | | | | 6,951,250 | | |
Total | | | | | 52,425,184 | | |
Electronic Equipment, Instruments & Components 4.5% | |
Agilysys, Inc.(a) | | | 69,454 | | | | 725,794 | | |
Anixter International, Inc.(a) | | | 130,061 | | | | 5,570,513 | | |
Badger Meter, Inc. | | | 66,568 | | | | 4,372,852 | | |
Benchmark Electronics, Inc.(a) | | | 231,791 | | | | 5,018,275 | | |
Checkpoint Systems, Inc. | | | 193,393 | | | | 1,452,382 | | |
Coherent, Inc.(a) | | | 110,949 | | | | 9,386,285 | | |
CTS Corp. | | | 149,707 | | | | 2,164,763 | | |
Daktronics, Inc. | | | 177,433 | | | | 1,254,451 | | |
DTS, Inc.(a) | | | 79,188 | | | | 1,874,380 | | |
Electro Scientific Industries, Inc.(a) | | | 126,693 | | | | 903,321 | | |
ePlus, Inc.(a) | | | 26,770 | | | | 2,010,159 | | |
Fabrinet(a) | | | 139,520 | | | | 3,983,296 | | |
FARO Technologies, Inc.(a) | | | 79,796 | | | | 2,557,462 | | |
II-VI, Inc.(a) | | | 241,183 | | | | 5,293,967 | | |
Insight Enterprises, Inc.(a) | | | 170,144 | | | | 4,440,758 | | |
Itron, Inc.(a) | | | 173,840 | | | | 6,925,786 | | |
Littelfuse, Inc. | | | 102,287 | | | | 11,621,849 | | |
Mercury Systems, Inc.(a) | | | 151,429 | | | | 2,474,350 | | |
Methode Electronics, Inc. | | | 176,491 | | | | 5,042,348 | | |
MTS Systems Corp. | | | 68,051 | | | | 3,739,403 | | |
Newport Corp.(a) | | | 176,951 | | | | 4,029,174 | | |
OSI Systems, Inc.(a) | | | 84,137 | | | | 5,079,351 | | |
Park Electrochemical Corp. | | | 92,897 | | | | 1,321,924 | | |
Plexus Corp.(a) | | | 153,294 | | | | 5,578,369 | | |
QLogic Corp.(a) | | | 384,560 | | | | 4,956,978 | | |
Rofin-Sinar Technologies, Inc.(a) | | | 130,089 | | | | 2,906,188 | | |
Rogers Corp.(a) | | | 82,286 | | | | 4,395,718 | | |
Common Stocks (continued)
Issuer | | Shares | | Value ($) | |
Sanmina Corp.(a) | | | 359,650 | | | | 7,408,790 | | |
Scansource, Inc.(a) | | | 122,775 | | | | 4,590,557 | | |
TTM Technologies, Inc.(a) | | | 295,573 | | | | 1,938,959 | | |
Total | | | | | 123,018,402 | | |
Internet Software & Services 1.0% | |
Blucora, Inc.(a) | | | 188,029 | | | | 1,156,378 | | |
DHI Group, Inc.(a) | | | 193,245 | | | | 1,503,446 | | |
Liquidity Services, Inc.(a) | | | 112,110 | | | | 523,554 | | |
LivePerson, Inc.(a) | | | 226,072 | | | | 1,159,749 | | |
LogMeIn, Inc.(a) | | | 114,954 | | | | 5,851,159 | | |
Monster Worldwide, Inc.(a) | | | 418,750 | | | | 1,247,875 | | |
NIC, Inc. | | | 279,925 | | | | 4,923,881 | | |
QuinStreet, Inc.(a) | | | 163,129 | | | | 484,493 | | |
Stamps.com, Inc.(a) | | | 68,530 | | | | 8,122,861 | | |
XO Group, Inc.(a) | | | 108,397 | | | | 1,547,909 | | |
Total | | | | | 26,521,305 | | |
IT Services 2.4% | |
CACI International, Inc., Class A(a) | | | 111,199 | | | | 10,744,047 | | |
Cardtronics, Inc.(a) | | | 206,008 | | | | 6,946,590 | | |
Ciber, Inc.(a) | | | 327,959 | | | | 655,918 | | |
CSG Systems International, Inc. | | | 149,977 | | | | 5,693,127 | | |
ExlService Holdings, Inc.(a) | | | 151,160 | | | | 7,118,124 | | |
Forrester Research, Inc. | | | 45,570 | | | | 1,418,138 | | |
Heartland Payment Systems, Inc. | | | 168,600 | | | | 15,767,472 | | |
Mantech International Corp., Class A | | | 111,760 | | | | 3,255,569 | | |
Perficient, Inc.(a) | | | 162,023 | | | | 2,924,515 | | |
Sykes Enterprises, Inc.(a) | | | 178,493 | | | | 5,438,682 | | |
TeleTech Holdings, Inc. | | | 75,475 | | | | 2,090,658 | | |
Virtusa Corp.(a) | | | 124,378 | | | | 4,402,981 | | |
Total | | | | | 66,455,821 | | |
Semiconductors & Semiconductor Equipment 3.3% | |
Advanced Energy Industries, Inc.(a) | | | 188,263 | | | | 5,615,885 | | |
Brooks Automation, Inc. | | | 310,289 | | | | 3,025,318 | | |
Cabot Microelectronics Corp.(a) | | | 110,377 | | | | 4,245,099 | | |
Ceva, Inc.(a) | | | 93,775 | | | | 1,838,928 | | |
Cirrus Logic, Inc.(a) | | | 292,170 | | | | 10,293,149 | | |
Cohu, Inc. | | | 113,856 | | | | 1,299,097 | | |
Diodes, Inc.(a) | | | 178,307 | | | | 3,412,796 | | |
DSP Group, Inc.(a) | | | 99,273 | | | | 856,726 | | |
Exar Corp.(a) | | | 222,082 | | | | 1,185,918 | | |
The accompanying Notes to Financial Statements are an integral part of this statement.
Annual Report 2016
15
COLUMBIA SMALL CAP INDEX FUND
PORTFOLIO OF INVESTMENTS (continued)
February 29, 2016
Common Stocks (continued)
Issuer | | Shares | | Value ($) | |
Kopin Corp.(a) | | | 286,599 | | | | 547,404 | | |
Kulicke & Soffa Industries, Inc.(a) | | | 324,285 | | | | 3,664,421 | | |
MKS Instruments, Inc. | | | 244,296 | | | | 8,037,338 | | |
Monolithic Power Systems, Inc. | | | 166,778 | | | | 9,849,909 | | |
Nanometrics, Inc.(a) | | | 110,950 | | | | 1,539,986 | | |
Power Integrations, Inc. | | | 130,414 | | | | 5,976,874 | | |
Rambus, Inc.(a) | | | 534,550 | | | | 6,965,186 | | |
Rudolph Technologies, Inc.(a) | | | 143,155 | | | | 1,855,289 | | |
Semtech Corp.(a) | | | 297,700 | | | | 5,703,932 | | |
Tessera Technologies, Inc. | | | 220,054 | | | | 6,487,192 | | |
Ultratech, Inc.(a) | | | 121,244 | | | | 2,458,828 | | |
Veeco Instruments, Inc.(a) | | | 187,805 | | | | 3,483,783 | | |
Total | | | | | 88,343,058 | | |
Software 2.7% | |
Blackbaud, Inc. | | | 211,410 | | | | 11,951,007 | | |
Bottomline Technologies de, Inc.(a) | | | 174,792 | | | | 4,930,882 | | |
Ebix, Inc. | | | 120,818 | | | | 4,473,890 | | |
EPIQ Systems, Inc. | | | 147,985 | | | | 2,024,435 | | |
Interactive Intelligence Group, Inc.(a) | | | 79,635 | | | | 2,383,476 | | |
MicroStrategy, Inc., Class A(a) | | | 42,799 | | | | 6,885,931 | | |
Monotype Imaging Holdings, Inc. | | | 183,051 | | | | 4,345,631 | | |
Progress Software Corp.(a) | | | 230,343 | | | | 5,809,250 | | |
Rovi Corp.(a) | | | 379,100 | | | | 8,635,898 | | |
Synchronoss Technologies, Inc.(a) | | | 182,158 | | | | 5,102,246 | | |
Take-Two Interactive Software, Inc.(a) | | | 388,168 | | | | 13,970,166 | | |
Tangoe, Inc.(a) | | | 171,830 | | | | 1,390,105 | | |
VASCO Data Security International, Inc.(a) | | | 136,193 | | | | 1,872,654 | | |
Total | | | | | 73,775,571 | | |
Technology Hardware, Storage & Peripherals 0.8% | |
Cray, Inc.(a) | | | 186,210 | | | | 7,897,166 | | |
Electronics for Imaging, Inc.(a) | | | 218,818 | | | | 8,667,381 | | |
Super Micro Computer, Inc.(a) | | | 167,842 | | | | 5,449,830 | | |
Total | | | | | 22,014,377 | | |
Total Information Technology | | | | | 452,553,718 | | |
MATERIALS 4.3% | |
Chemicals 2.2% | |
A. Schulman, Inc. | | | 134,383 | | | | 3,317,916 | | |
American Vanguard Corp. | | | 117,711 | | | | 1,484,336 | | |
Balchem Corp. | | | 144,592 | | | | 9,148,336 | | |
Common Stocks (continued)
Issuer | | Shares | | Value ($) | |
Calgon Carbon Corp. | | | 236,026 | | | | 3,309,085 | | |
Chemours Co. LLC (The) | | | 830,180 | | | | 4,258,823 | | |
Flotek Industries, Inc.(a) | | | 245,985 | | | | 1,790,771 | | |
FutureFuel Corp. | | | 104,260 | | | | 1,336,613 | | |
H.B. Fuller Co. | | | 231,923 | | | | 8,926,716 | | |
Hawkins, Inc. | | | 43,537 | | | | 1,392,313 | | |
Innophos Holdings, Inc. | | | 88,250 | | | | 2,557,485 | | |
Innospec, Inc. | | | 110,460 | | | | 4,793,964 | | |
Intrepid Potash, Inc.(a) | | | 258,530 | | | | 255,945 | | |
Koppers Holdings, Inc.(a) | | | 94,282 | | | | 1,653,706 | | |
Kraton Performance Polymers, Inc.(a) | | | 140,015 | | | | 2,404,058 | | |
LSB Industries, Inc.(a) | | | 89,985 | | | | 525,512 | | |
Quaker Chemical Corp. | | | 61,033 | | | | 4,748,978 | | |
Rayonier Advanced Materials, Inc. | | | 196,660 | | | | 1,469,050 | | |
Stepan Co. | | | 83,729 | | | | 4,159,657 | | |
Tredegar Corp. | | | 113,928 | | | | 1,564,231 | | |
Total | | | | | 59,097,495 | | |
Construction Materials 0.3% | |
Headwaters, Inc.(a) | | | 338,983 | | | | 5,972,880 | | |
US Concrete, Inc.(a) | | | 61,170 | | | | 3,287,888 | | |
Total | | | | | 9,260,768 | | |
Containers & Packaging 0.1% | |
Myers Industries, Inc. | | | 102,309 | | | | 1,230,777 | | |
Metals & Mining 0.8% | |
AK Steel Holding Corp.(a) | | | 815,805 | | | | 2,333,202 | | |
Century Aluminum Co.(a) | | | 227,294 | | | | 1,625,152 | | |
Haynes International, Inc. | | | 57,094 | | | | 1,758,495 | | |
Kaiser Aluminum Corp. | | | 81,369 | | | | 6,233,679 | | |
Materion Corp. | | | 91,749 | | | | 2,392,814 | | |
Olympic Steel, Inc. | | | 41,894 | | | | 449,104 | | |
Stillwater Mining Co.(a) | | | 555,013 | | | | 4,656,559 | | |
SunCoke Energy, Inc. | | | 293,517 | | | | 1,388,336 | | |
TimkenSteel Corp. | | | 174,330 | | | | 1,347,571 | | |
Total | | | | | 22,184,912 | | |
Paper & Forest Products 0.9% | |
Boise Cascade Co.(a) | | | 178,090 | | | | 2,981,227 | | |
Clearwater Paper Corp.(a) | | | 81,531 | | | | 3,315,866 | | |
Deltic Timber Corp. | | | 50,170 | | | | 2,840,625 | | |
KapStone Paper and Packaging Corp. | | | 393,198 | | | | 4,026,348 | | |
Neenah Paper, Inc. | | | 76,805 | | | | 4,651,311 | | |
The accompanying Notes to Financial Statements are an integral part of this statement.
Annual Report 2016
16
COLUMBIA SMALL CAP INDEX FUND
PORTFOLIO OF INVESTMENTS (continued)
February 29, 2016
Common Stocks (continued)
Issuer | | Shares | | Value ($) | |
PH Glatfelter Co. | | | 199,109 | | | | 3,657,632 | | |
Schweitzer-Mauduit International, Inc. | | | 139,777 | | | | 4,224,061 | | |
Total | | | | | 25,697,070 | | |
Total Materials | | | | | 117,471,022 | | |
TELECOMMUNICATION SERVICES 1.2% | |
Diversified Telecommunication Services 1.1% | |
8x8, Inc.(a) | | | 409,560 | | | | 4,763,183 | | |
Atlantic Tele-Network, Inc. | | | 49,364 | | | | 3,551,246 | | |
Cincinnati Bell, Inc.(a) | | | 962,664 | | | | 3,330,817 | | |
Cogent Communications Holdings, Inc. | | | 188,950 | | | | 6,934,465 | | |
Consolidated Communications
Holdings, Inc. | | | 231,690 | | | | 5,419,229 | | |
General Communication, Inc., Class A(a) | | | 136,242 | | | | 2,600,860 | | |
Iridium Communications, Inc.(a) | | | 370,200 | | | | 2,565,486 | | |
Lumos Networks Corp.(a) | | | 105,364 | | | | 1,295,977 | | |
Total | | | | | 30,461,263 | | |
Wireless Telecommunication Services 0.1% | |
Spok Holdings, Inc. | | | 96,329 | | | | 1,706,950 | | |
Total Telecommunication Services | | | | | 32,168,213 | | |
UTILITIES 4.6% | |
Electric Utilities 0.7% | |
Allete, Inc. | | | 209,841 | | | | 11,125,770 | | |
El Paso Electric Co. | | | 185,445 | | | | 7,575,428 | | |
Total | | | | | 18,701,198 | | |
Gas Utilities 2.8% | |
Laclede Group, Inc. (The) | | | 198,847 | | | | 13,028,455 | | |
New Jersey Resources Corp. | | | 393,546 | | | | 13,624,563 | | |
Northwest Natural Gas Co. | | | 125,555 | | | | 6,263,939 | | |
Piedmont Natural Gas Co., Inc. | | | 364,003 | | | | 21,625,418 | | |
South Jersey Industries, Inc. | | | 316,796 | | | | 8,062,458 | | |
Southwest Gas Corp. | | | 217,307 | | | | 13,255,727 | | |
Total | | | | | 75,860,560 | | |
Common Stocks (continued)
Issuer | | Shares | | Value ($) | |
Multi-Utilities 0.9% | |
Avista Corp. | | | 285,804 | | | | 10,803,391 | | |
NorthWestern Corp. | | | 220,952 | | | | 13,117,921 | | |
Total | | | | | 23,921,312 | | |
Water Utilities 0.2% | |
American States Water Co. | | | 168,474 | | | | 7,144,982 | | |
Total Utilities | | | | | 125,628,052 | | |
Total Common Stocks
(Cost: $2,163,165,947) | | | | | 2,657,386,169 | | |
Rights —%
INFORMATION TECHNOLOGY —% | |
Electronic Equipment, Instruments & Components —% | |
Gerber Scientific, Inc.(a)(b)(c)(d) | | | 112,391 | | | | — | | |
Total Information Technology | | | | | — | | |
Total Rights
(Cost: $—) | | | | | — | | |
Exchange-Traded Funds 1.0%
| | | Shares | | Value ($) | |
iShares Core S&P Small-Cap ETF | | | 265,010 | | | | 27,682,945 | | |
Total Exchange-Traded Funds
(Cost: $28,888,747) | | | | | 27,682,945 | | |
Money Market Funds 1.2%
| | | Shares | | Value ($) | |
Columbia Short-Term Cash Fund,
0.420%(e)(f) | | | 32,806,265 | | | | 32,806,265 | | |
Total Money Market Funds
(Cost: $32,806,265) | | | | | 32,806,265 | | |
Total Investments
(Cost: $2,224,860,959) | | | | | 2,717,875,379 | | |
Other Assets & Liabilities, Net | | | | | 6,405,132 | | |
Net Assets | | | | | 2,724,280,511 | | |
The accompanying Notes to Financial Statements are an integral part of this statement.
Annual Report 2016
17
COLUMBIA SMALL CAP INDEX FUND
PORTFOLIO OF INVESTMENTS (continued)
February 29, 2016
Investments in Derivatives
Futures Contracts Outstanding at February 29, 2016
At February 29, 2016, cash totaling $2,003,400 was pledged as collateral.
Long Futures Contracts Outstanding
Contract Description | | Number of
Contracts | | Trading
Currency | | Notional
Market
Value ($) | | Expiration
Date | | Unrealized
Appreciation ($) | | Unrealized
Depreciation ($) | |
RUSSELL 2000 Mini | | | 329 | | | USD | | | | | 33,942,930 | | | 03/2016 | | | 1,255,775 | | | | — | | |
RUSSELL 2000 Mini | | | 56 | | | USD | | | | | 5,777,520 | | | 03/2016 | | | 41,199 | | | | — | | |
Total | | | | | | | 39,720,450 | | | | | | 1,296,974 | | | | — | | |
Notes to Portfolio of Investments
(a) Non-income producing investment.
(b) Represents fair value as determined in good faith under procedures approved by the Board of Trustees. At February 29, 2016, the value of these securities amounted to $4,595,660, which represents 0.17% of net assets.
(c) Identifies securities considered by the Investment Manager to be illiquid and may be difficult to sell. The aggregate value of such securities at February 29, 2016 was $0. Information concerning such security holdings at February 29, 2016 is as follows:
Security Description | | Acquisition Dates | | Cost ($) | |
Gerber Scientific, Inc. | | 08/22/2011 | | | — | | |
(d) Negligible market value.
(e) The rate shown is the seven-day current annualized yield at February 29, 2016.
(f) As defined in the Investment Company Act of 1940, an affiliated company is one in which the Fund owns 5% or more of the company's outstanding voting securities, or a company which is under common ownership or control with the Fund. Holdings and transactions in these affiliated companies during the year ended February 29, 2016 are as follows:
Issuer | | Beginning
Cost ($) | | Purchase
Cost ($) | | Proceeds
From Sales ($) | | Ending
Cost ($) | | Dividends —
Affiliated
Issuers ($) | | Value ($) | |
Columbia Short-Term Cash Fund | | | 69,923,613 | | | | 571,047,159 | | | | (608,164,507 | ) | | | 32,806,265 | | | | 121,190 | | | | 32,806,265 | | |
Currency Legend
USD US Dollar
Fair Value Measurements
The Fund categorizes its fair value measurements according to a three-level hierarchy that maximizes the use of observable inputs and minimizes the use of unobservable inputs by prioritizing that the most observable input be used when available. Observable inputs are those that market participants would use in pricing an investment based on market data obtained from sources independent of the reporting entity. Unobservable inputs are those that reflect the Fund's assumptions about the information market participants would use in pricing an investment. An investment's level within the fair value hierarchy is based on the lowest level of any input that is deemed significant to the asset's or liability's fair value measurement. The input levels are not necessarily an indication of the risk or liquidity associated with investments at that level. For example, certain U.S. government securities are generally high quality and liquid, however, they are reflected as Level 2 because the inputs used to determine fair value may not always be quoted prices in an active market.
The accompanying Notes to Financial Statements are an integral part of this statement.
Annual Report 2016
18
COLUMBIA SMALL CAP INDEX FUND
PORTFOLIO OF INVESTMENTS (continued)
February 29, 2016
Fair Value Measurements (continued)
Fair value inputs are summarized in the three broad levels listed below:
> Level 1 — Valuations based on quoted prices for investments in active markets that the Fund has the ability to access at the measurement date (including NAV for open-end mutual funds). Valuation adjustments are not applied to Level 1 investments.
> Level 2 — Valuations based on other significant observable inputs (including quoted prices for similar securities, interest rates, prepayment speeds, credit risks, etc.).
> Level 3 — Valuations based on significant unobservable inputs (including the Fund's own assumptions and judgment in determining the fair value of investments).
Inputs that are used in determining fair value of an investment may include price information, credit data, volatility statistics, and other factors. These inputs can be either observable or unobservable. The availability of observable inputs can vary between investments, and is affected by various factors such as the type of investment, and the volume and level of activity for that investment or similar investments in the marketplace. The inputs will be considered by the Investment Manager, along with any other relevant factors in the calculation of an investment's fair value. The Fund uses prices and inputs that are current as of the measurement date, which may include periods of market dislocations. During these periods, the availability of prices and inputs may be reduced for many investments. This condition could cause an investment to be reclassified between the various levels within the hierarchy.
Investments falling into the Level 3 category are primarily supported by quoted prices from brokers and dealers participating in the market for those investments. However, these may be classified as Level 3 investments due to lack of market transparency and corroboration to support these quoted prices. Additionally, valuation models may be used as the pricing source for any remaining investments classified as Level 3. These models may rely on one or more significant unobservable inputs and/or significant assumptions by the Investment Manager. Inputs used in valuations may include, but are not limited to, financial statement analysis, capital account balances, discount rates and estimated cash flows, and comparable company data.
Under the direction of the Fund's Board of Trustees (the Board), the Investment Manager's Valuation Committee (the Committee) is responsible for overseeing the valuation procedures approved by the Board. The Committee consists of voting and non-voting members from various groups within the Investment Manager's organization, including operations and accounting, trading and investments, compliance, risk management and legal.
The Committee meets at least monthly to review and approve valuation matters, which may include a description of specific valuation determinations, data regarding pricing information received from approved pricing vendors and brokers and the results of Board-approved valuation control policies and procedures (the Policies). The Policies address, among other things, instances when market quotations are or are not readily available, including recommendations of third party pricing vendors and a determination of appropriate pricing methodologies; events that require specific valuation determinations and assessment of fair value techniques; securities with a potential for stale pricing, including those that are illiquid, restricted, or in default; and the effectiveness of third party pricing vendors, including periodic reviews of vendors. The Committee meets more frequently, as needed, to discuss additional valuation matters, which may include the need to review back-testing results, review time-sensitive information or approve related valuation actions. The Committee reports to the Board, with members of the Committee meeting with the Board at each of its regularly scheduled meetings to discuss valuation matters and actions during the period, similar to those described earlier.
For investments categorized as Level 3, the Committee monitors information similar to that described above, which may include: (i) data specific to the issuer or comparable issuers, (ii) general market or specific sector news and (iii) quoted prices and specific or similar security transactions. The Committee considers this data and any changes from prior periods in order to assess the reasonableness of observable and unobservable inputs, any assumptions or internal models used to value those securities and changes in fair value. This data is also used to corroborate, when available, information received from approved pricing vendors and brokers. Various factors impact the frequency of monitoring this information (which may occur as often as daily). However, the Committee may determine that changes to inputs, assumptions and models are not required as a result of the monitoring procedures performed.
The accompanying Notes to Financial Statements are an integral part of this statement.
Annual Report 2016
19
COLUMBIA SMALL CAP INDEX FUND
PORTFOLIO OF INVESTMENTS (continued)
February 29, 2016
Fair Value Measurements (continued)
The following table is a summary of the inputs used to value the Fund's investments at February 29, 2016:
| | | Level 1
Quoted Prices in Active
Markets for Identical
Assets ($) | | Level 2
Other Significant
Observable Inputs ($) | | Level 3
Significant
Unobservable Inputs ($) | | Total ($) | |
Investments | |
Common Stocks | |
Consumer Discretionary | | | 394,775,990 | | | | — | | | | — | | | | 394,775,990 | | |
Consumer Staples | | | 70,087,262 | | | | 4,595,660 | | | | — | | | | 74,682,922 | | |
Energy | | | 57,933,756 | | | | — | | | | — | | | | 57,933,756 | | |
Financials | | | 612,487,418 | | | | — | | | | — | | | | 612,487,418 | | |
Health Care | | | 341,469,759 | | | | — | | | | — | | | | 341,469,759 | | |
Industrials | | | 448,215,319 | | | | — | | | | — | | | | 448,215,319 | | |
Information Technology | | | 452,553,718 | | | | — | | | | — | | | | 452,553,718 | | |
Materials | | | 117,471,022 | | | | — | | | | — | | | | 117,471,022 | | |
Telecommunication Services | | | 32,168,213 | | | | — | | | | — | | | | 32,168,213 | | |
Utilities | | | 125,628,052 | | | | — | | | | — | | | | 125,628,052 | | |
Total Common Stocks | | | 2,652,790,509 | | | | 4,595,660 | | | | — | | | | 2,657,386,169 | | |
Rights | |
Information Technology | | | — | | | | — | | | | 0 | (a) | | | 0 | (a) | |
Exchange-Traded Funds | | | 27,682,945 | | | | — | | | | — | | | | 27,682,945 | | |
Money Market Funds | | | — | | | | 32,806,265 | | | | — | | | | 32,806,265 | | |
Total Investments | | | 2,680,473,454 | | | | 37,401,925 | | | | 0 | (a) | | | 2,717,875,379 | | |
Derivatives | |
Assets | |
Futures Contracts | | | 1,296,974 | | | | — | | | | — | | | | 1,296,974 | | |
Total | | | 2,681,770,428 | | | | 37,401,925 | | | | — | | | | 2,719,172,353 | | |
(a) Rounds to zero.
See the Portfolio of Investments for all investment classifications not indicated in the table.
The Fund's assets assigned to the Level 2 input category are valued based upon utilizing observable market inputs, in which a security's value is determined through reference to prices and information from market transactions for similar or identical assets and/or fund per share market values which are not considered publicly available.
Derivative instruments are valued at unrealized appreciation (depreciation).
Financial assets were transferred from Level 1 to Level 2 as the market for these assets were deemed not to be active and not considered publicly available. Fund per share market values and fair values were consequently obtained using observable market inputs rather than quoted prices for identical assets as of period end.
Financial assets were transferred from Level 1 to Level 2 as the market for these assets is not considered publicly available. Fund per share market values were obtained using observable market inputs.
The accompanying Notes to Financial Statements are an integral part of this statement.
Annual Report 2016
20
COLUMBIA SMALL CAP INDEX FUND
PORTFOLIO OF INVESTMENTS (continued)
February 29, 2016
Fair Value Measurements (continued)
The following table shows transfers between Level 1 and Level 2 of the fair value hierarchy:
Transfers In | | Transfers Out | |
| Level 1 ($) | | Level 2 ($) | | Level 1 ($) | | Level 2 ($) | |
| | | | | | 73,100,587 | | | | 73,100,587 | | | | | | |
Transfers between Level 1 and Level 2 are determined based on the fair value at the beginning of the period for security positions held throughout the period.
The Fund does not hold any significant investments (greater than one percent of net assets) categorized as Level 3.
The Fund's assets assigned to the Level 3 category are valued utilizing the valuation technique deemed the most appropriate in the circumstances. Certain rights classified as Level 3 are valued using an income approach. To determine fair value for these securities, management considered estimates of future distributions related to the potential actions of the respective company's restructuring. Significant increases (decreases) to any of these inputs would result in a significantly lower (higher) fair value measurement.
There were no transfers of financial assets between Levels 2 and 3 during the period.
The accompanying Notes to Financial Statements are an integral part of this statement.
Annual Report 2016
21
COLUMBIA SMALL CAP INDEX FUND
STATEMENT OF ASSETS AND LIABILITIES
February 29, 2016
Assets | |
Investments, at value | |
Unaffiliated issuers (identified cost $2,192,054,694) | | $ | 2,685,069,114 | | |
Affiliated issuers (identified cost $32,806,265) | | | 32,806,265 | | |
Total investments (identified cost $2,224,860,959) | | | 2,717,875,379 | | |
Margin deposits | | | 2,003,400 | | |
Receivable for: | |
Investments sold | | | 12,760,535 | | |
Capital shares sold | | | 4,194,877 | | |
Dividends | | | 3,531,516 | | |
Variation margin | | | 945 | | |
Expense reimbursement due from Investment Manager | | | 772 | | |
Total assets | | | 2,740,367,424 | | |
Liabilities | |
Payable for: | |
Investments purchased | | | 12,691,307 | | |
Capital shares purchased | | | 3,013,597 | | |
Variation margin | | | 142,890 | | |
Investment management fees | | | 44,732 | | |
Distribution and/or service fees | | | 24,324 | | |
Plan administration fees | | | 2,458 | | |
Compensation of board members | | | 164,503 | | |
Other expenses | | | 3,102 | | |
Total liabilities | | | 16,086,913 | | |
Net assets applicable to outstanding capital stock | | $ | 2,724,280,511 | | |
Represented by | |
Paid-in capital | | $ | 2,221,397,469 | | |
Undistributed net investment income | | | 2,133,325 | | |
Accumulated net realized gain | | | 6,438,323 | | |
Unrealized appreciation (depreciation) on: | |
Investments | | | 493,014,420 | | |
Futures contracts | | | 1,296,974 | | |
Total — representing net assets applicable to outstanding capital stock | | $ | 2,724,280,511 | | |
The accompanying Notes to Financial Statements are an integral part of this statement.
Annual Report 2016
22
COLUMBIA SMALL CAP INDEX FUND
STATEMENT OF ASSETS AND LIABILITIES (continued)
February 29, 2016
Class A | |
Net assets | | $ | 1,131,160,349 | | |
Shares outstanding | | | 59,369,953 | | |
Net asset value per share | | $ | 19.05 | | |
Class B | |
Net assets | | $ | 2,516,736 | | |
Shares outstanding | | | 132,948 | | |
Net asset value per share | | $ | 18.93 | | |
Class I | |
Net assets | | $ | 2,019 | | |
Shares outstanding | | | 106 | | |
Net asset value per share(a) | | $ | 19.07 | | |
Class K | |
Net assets | | $ | 11,702,985 | | |
Shares outstanding | | | 612,028 | | |
Net asset value per share | | $ | 19.12 | | |
Class R5 | |
Net assets | | $ | 208,441,301 | | |
Shares outstanding | | | 10,693,946 | | |
Net asset value per share | | $ | 19.49 | | |
Class W | |
Net assets | | $ | 43,728,811 | | |
Shares outstanding | | | 2,313,822 | | |
Net asset value per share | | $ | 18.90 | | |
Class Z | |
Net assets | | $ | 1,326,728,310 | | |
Shares outstanding | | | 69,315,543 | | |
Net asset value per share | | $ | 19.14 | | |
(a) Net asset value per share rounds to this amount due to fractional shares outstanding.
The accompanying Notes to Financial Statements are an integral part of this statement.
Annual Report 2016
23
COLUMBIA SMALL CAP INDEX FUND
STATEMENT OF OPERATIONS
Year Ended February 29, 2016
Net investment income | |
Income: | |
Dividends — unaffiliated issuers | | $ | 44,588,806 | | |
Dividends — affiliated issuers | | | 121,190 | | |
Interest | | | 2,401 | | |
Foreign taxes withheld | | | (12,408 | ) | |
Total income | | | 44,699,989 | | |
Expenses: | |
Investment management fees | | | 6,258,148 | | |
Distribution and/or service fees | |
Class A | | | 3,026,312 | | |
Class B | | | 40,893 | | |
Class W | | | 146,157 | | |
Plan administration fees | |
Class K | | | 31,100 | | |
Compensation of board members | | | 39,954 | | |
Other | | | 20,486 | | |
Total expenses | | | 9,563,050 | | |
Fees waived or expenses reimbursed by Investment Manager and its affiliates | | | (81,848 | ) | |
Expense reductions | | | (2,051 | ) | |
Total net expenses | | | 9,479,151 | | |
Net investment income | | | 35,220,838 | | |
Realized and unrealized gain (loss) — net | |
Net realized gain (loss) on: | |
Investments | | | 246,785,104 | | |
Futures contracts | | | 1,819,094 | | |
Net realized gain | | | 248,604,198 | | |
Net change in unrealized appreciation (depreciation) on: | |
Investments | | | (572,066,786 | ) | |
Futures contracts | | | (4,253,714 | ) | |
Net change in unrealized depreciation | | | (576,320,500 | ) | |
Net realized and unrealized loss | | | (327,716,302 | ) | |
Net decrease in net assets from operations | | $ | (292,495,464 | ) | |
The accompanying Notes to Financial Statements are an integral part of this statement.
Annual Report 2016
24
COLUMBIA SMALL CAP INDEX FUND
STATEMENT OF CHANGES IN NET ASSETS
| | | Year Ended
February 29,
2016 | | Year Ended
February 28,
2015(a) | |
Operations | |
Net investment income | | $ | 35,220,838 | | | $ | 30,672,280 | | |
Net realized gain | | | 248,604,198 | | | | 213,369,381 | | |
Net change in unrealized depreciation | | | (576,320,500 | ) | | | (24,461,526 | ) | |
Net increase (decrease) in net assets resulting from operations | | | (292,495,464 | ) | | | 219,580,135 | | |
Distributions to shareholders | |
Net investment income | |
Class A | | | (12,398,997 | ) | | | (9,063,779 | ) | |
Class B | | | (9,964 | ) | | | (7,070 | ) | |
Class I | | | (31 | ) | | | (26 | ) | |
Class K | | | (125,103 | ) | | | (96,665 | ) | |
Class R5 | | | (2,587,395 | ) | | | (1,350,713 | ) | |
Class W | | | (506,994 | ) | | | (499,115 | ) | |
Class Z | | | (19,485,249 | ) | | | (17,034,267 | ) | |
Net realized gains | |
Class A | | | (108,254,823 | ) | | | (83,792,409 | ) | |
Class B | | | (332,409 | ) | | | (492,490 | ) | |
Class I | | | (210 | ) | | | (177 | ) | |
Class K | | | (1,092,983 | ) | | | (902,686 | ) | |
Class R5 | | | (17,797,232 | ) | | | (8,689,693 | ) | |
Class W | | | (4,733,256 | ) | | | (2,806,647 | ) | |
Class Z | | | (139,562,725 | ) | | | (118,368,963 | ) | |
Total distributions to shareholders | | | (306,887,371 | ) | | | (243,104,700 | ) | |
Increase in net assets from capital stock activity | | | 113,334,552 | | | | 381,211,734 | | |
Total increase (decrease) in net assets | | | (486,048,283 | ) | | | 357,687,169 | | |
Net assets at beginning of year | | | 3,210,328,794 | | | | 2,852,641,625 | | |
Net assets at end of year | | $ | 2,724,280,511 | | | $ | 3,210,328,794 | | |
Undistributed net investment income | | $ | 2,133,325 | | | $ | 3,139,742 | | |
(a) Class W shares are based on operations from June 25, 2014 (commencement of operations) through the stated period end.
The accompanying Notes to Financial Statements are an integral part of this statement.
Annual Report 2016
25
COLUMBIA SMALL CAP INDEX FUND
STATEMENT OF CHANGES IN NET ASSETS (continued)
| | | Year Ended February 29, 2016 | | Year Ended February 28, 2015(a) | |
| | | Shares | | Dollars ($) | | Shares | | Dollars ($) | |
Capital stock activity | |
Class A shares | |
Subscriptions(b) | | | 17,385,035 | | | | 378,331,308 | | | | 17,321,688 | | | | 396,157,532 | | |
Distributions reinvested | | | 5,065,997 | | | | 109,466,238 | | | | 3,792,241 | | | | 85,751,001 | | |
Redemptions | | | (15,968,362 | ) | | | (348,017,505 | ) | | | (15,535,240 | ) | | | (354,019,081 | ) | |
Net increase | | | 6,482,670 | | | | 139,780,041 | | | | 5,578,689 | | | | 127,889,452 | | |
Class B shares | |
Subscriptions | | | 3,190 | | | | 67,829 | | | | 6,915 | | | | 158,500 | | |
Distributions reinvested | | | 15,793 | | | | 342,121 | | | | 22,120 | | | | 498,875 | | |
Redemptions(b) | | | (130,607 | ) | | | (2,839,809 | ) | | | (188,409 | ) | | | (4,261,122 | ) | |
Net decrease | | | (111,624 | ) | | | (2,429,859 | ) | | | (159,374 | ) | | | (3,603,747 | ) | |
Class I shares | |
Redemptions | | | — | | | | — | | | | (46 | ) | | | (1,100 | ) | |
Net decrease | | | — | | | | — | | | | (46 | ) | | | (1,100 | ) | |
Class K shares | |
Subscriptions | | | 142,643 | | | | 3,019,258 | | | | 84,413 | | | | 1,943,751 | | |
Distributions reinvested | | | 56,179 | | | | 1,217,850 | | | | 44,044 | | | | 999,154 | | |
Redemptions | | | (144,117 | ) | | | (3,098,732 | ) | | | (112,355 | ) | | | (2,573,565 | ) | |
Net increase | | | 54,705 | | | | 1,138,376 | | | | 16,102 | | | | 369,340 | | |
Class R5 shares | |
Subscriptions | | | 6,342,672 | | | | 142,374,678 | | | | 4,892,620 | | | | 113,702,536 | | |
Distributions reinvested | | | 872,898 | | | | 19,240,434 | | | | 408,553 | | | | 9,402,196 | | |
Redemptions | | | (3,513,913 | ) | | | (78,340,702 | ) | | | (1,631,742 | ) | | | (37,962,764 | ) | |
Net increase | | | 3,701,657 | | | | 83,274,410 | | | | 3,669,431 | | | | 85,141,968 | | |
Class W shares | |
Subscriptions | | | 347,732 | | | | 7,651,202 | | | | 2,949,425 | | | | 68,406,217 | | |
Distributions reinvested | | | 242,627 | | | | 5,240,010 | | | | 148,970 | | | | 3,305,611 | | |
Redemptions | | | (1,208,069 | ) | | | (26,156,671 | ) | | | (166,863 | ) | | | (3,765,601 | ) | |
Net increase (decrease) | | | (617,710 | ) | | | (13,265,459 | ) | | | 2,931,532 | | | | 67,946,227 | | |
Class Z shares | |
Subscriptions | | | 13,710,234 | | | | 300,527,742 | | | | 17,901,224 | | | | 410,896,361 | | |
Distributions reinvested | | | 4,830,934 | | | | 105,157,641 | | | | 3,806,276 | | | | 86,333,330 | | |
Redemptions | | | (23,015,603 | ) | | | (500,848,340 | ) | | | (17,182,275 | ) | | | (393,760,097 | ) | |
Net increase (decrease) | | | (4,474,435 | ) | | | (95,162,957 | ) | | | 4,525,225 | | | | 103,469,594 | | |
Total net increase | | | 5,035,263 | | | | 113,334,552 | | | | 16,561,559 | | | | 381,211,734 | | |
(a) Class W shares are based on operations from June 25, 2014 (commencement of operations) through the stated period end.
(b) Includes conversions of Class B shares to Class A shares, if any.
The accompanying Notes to Financial Statements are an integral part of this statement.
Annual Report 2016
26
COLUMBIA SMALL CAP INDEX FUND
The following tables are intended to help you understand the Fund's financial performance. Certain information reflects financial results for a single share of a class held for the periods shown. Per share net investment income (loss) amounts are calculated based on average shares outstanding during the period. Total return assumes reinvestment of all dividends and distributions, if any. Total return does not reflect payment of sales charges, if any. Total return and portfolio turnover are not annualized for periods of less than one year. The portfolio turnover rate is calculated without regard to purchase and sales transactions of short-term instruments and certain derivatives, if any. If such transactions were included, the Fund's portfolio turnover rate may be higher.
| | | Year Ended
February 29, | | Year Ended February 28, | | Year Ended
February 29, | |
Class A | | 2016 | | 2015 | | 2014 | | 2013 | | 2012 | |
Per share data | |
Net asset value, beginning of period | | $ | 23.29 | | | $ | 23.54 | | | $ | 19.00 | | | $ | 17.75 | | | $ | 18.01 | | |
Income from investment operations: | |
Net investment income | | | 0.22 | | | | 0.20 | | | | 0.16 | | | | 0.24 | | | | 0.12 | | |
Net realized and unrealized gain (loss) | | | (2.25 | ) | | | 1.40 | | | | 5.72 | | | | 2.14 | | | | 0.66 | | |
Total from investment operations | | | (2.03 | ) | | | 1.60 | | | | 5.88 | | | | 2.38 | | | | 0.78 | | |
Less distributions to shareholders: | |
Net investment income | | | (0.22 | ) | | | (0.18 | ) | | | (0.15 | ) | | | (0.25 | ) | | | (0.12 | ) | |
Net realized gains | | | (1.99 | ) | | | (1.67 | ) | | | (1.19 | ) | | | (0.88 | ) | | | (0.92 | ) | |
Total distributions to shareholders | | | (2.21 | ) | | | (1.85 | ) | | | (1.34 | ) | | | (1.13 | ) | | | (1.04 | ) | |
Proceeds from regulatory settlements | | | — | | | | — | | | | — | | | | — | | | | 0.00 | (a) | |
Net asset value, end of period | | $ | 19.05 | | | $ | 23.29 | | | $ | 23.54 | | | $ | 19.00 | | | $ | 17.75 | | |
Total return | | | (9.67 | %) | | | 7.19 | % | | | 31.63 | % | | | 14.32 | % | | | 4.65 | % | |
Ratios to average net assets(b) | |
Total gross expenses | | | 0.45 | % | | | 0.45 | % | | | 0.45 | % | | | 0.45 | %(c) | | | 0.45 | % | |
Total net expenses(d) | | | 0.45 | %(e) | | | 0.45 | %(e) | | | 0.45 | %(e) | | | 0.45 | %(c)(e) | | | 0.45 | %(e) | |
Net investment income | | | 0.99 | % | | | 0.89 | % | | | 0.73 | % | | | 1.37 | % | | | 0.74 | % | |
Supplemental data | |
Net assets, end of period (in thousands) | | $ | 1,131,160 | | | $ | 1,231,774 | | | $ | 1,113,746 | | | $ | 687,934 | | | $ | 570,806 | | |
Portfolio turnover | | | 19 | % | | | 17 | % | | | 15 | % | | | 17 | % | | | 20 | % | |
Notes to Financial Highlights
(a) Rounds to zero.
(b) In addition to the fees and expenses that the Fund bears directly, the Fund indirectly bears a pro rata share of the fees and expenses of any other funds in which it invests. Such indirect expenses are not included in the Fund's reported expense ratios.
(c) Ratios include line of credit interest expense which is less than 0.01%.
(d) Total net expenses include the impact of certain fee waivers/expense reimbursements made by the Investment Manager and certain of its affiliates, if applicable.
(e) The benefits derived from expense reductions had an impact of less than 0.01%.
The accompanying Notes to Financial Statements are an integral part of this statement.
Annual Report 2016
27
COLUMBIA SMALL CAP INDEX FUND
FINANCIAL HIGHLIGHTS (continued)
| | | Year Ended
February 29, | | Year Ended February 28, | | Year Ended
February 29, | |
Class B | | 2016 | | 2015 | | 2014 | | 2013 | | 2012(a) | |
Per share data | |
Net asset value, beginning of period | | $ | 23.16 | | | $ | 23.44 | | | $ | 18.95 | | | $ | 17.73 | | | $ | 17.82 | | |
Income from investment operations: | |
Net investment income (loss) | | | 0.05 | | | | 0.02 | | | | (0.01 | ) | | | 0.11 | | | | 0.00 | (b) | |
Net realized and unrealized gain (loss) | | | (2.23 | ) | | | 1.40 | | | | 5.70 | | | | 2.13 | | | | 0.84 | | |
Total from investment operations | | | (2.18 | ) | | | 1.42 | | | | 5.69 | | | | 2.24 | | | | 0.84 | | |
Less distributions to shareholders: | |
Net investment income | | | (0.06 | ) | | | (0.03 | ) | | | (0.01 | ) | | | (0.14 | ) | | | (0.01 | ) | |
Net realized gains | | | (1.99 | ) | | | (1.67 | ) | | | (1.19 | ) | | | (0.88 | ) | | | (0.92 | ) | |
Total distributions to shareholders | | | (2.05 | ) | | | (1.70 | ) | | | (1.20 | ) | | | (1.02 | ) | | | (0.93 | ) | |
Proceeds from regulatory settlements | | | — | | | | — | | | | — | | | | — | | | | 0.00 | (b) | |
Net asset value, end of period | | $ | 18.93 | | | $ | 23.16 | | | $ | 23.44 | | | $ | 18.95 | | | $ | 17.73 | | |
Total return | | | (10.34 | %) | | | 6.39 | % | | | 30.64 | % | | | 13.45 | % | | | 4.97 | % | |
Ratios to average net assets(c) | |
Total gross expenses | | | 1.20 | % | | | 1.20 | % | | | 1.20 | % | | | 1.20 | %(d) | | | 1.20 | %(e) | |
Total net expenses(f) | | | 1.20 | %(g) | | | 1.20 | %(g) | | | 1.20 | %(g) | | | 1.20 | %(d)(g) | | | 1.20 | %(g)(e) | |
Net investment income (loss) | | | 0.22 | % | | | 0.11 | % | | | (0.02 | %) | | | 0.61 | % | | | 0.01 | %(e) | |
Supplemental data | |
Net assets, end of period (in thousands) | | $ | 2,517 | | | $ | 5,664 | | | $ | 9,469 | | | $ | 11,596 | | | $ | 17,410 | | |
Portfolio turnover | | | 19 | % | | | 17 | % | | | 15 | % | | | 17 | % | | | 20 | % | |
Notes to Financial Highlights
(a) Based on operations from March 7, 2011 (commencement of operations) through the stated period end.
(b) Rounds to zero.
(c) In addition to the fees and expenses that the Fund bears directly, the Fund indirectly bears a pro rata share of the fees and expenses of any other funds in which it invests. Such indirect expenses are not included in the Fund's reported expense ratios.
(d) Ratios include line of credit interest expense which is less than 0.01%.
(e) Annualized.
(f) Total net expenses include the impact of certain fee waivers/expense reimbursements made by the Investment Manager and certain of its affiliates, if applicable.
(g) The benefits derived from expense reductions had an impact of less than 0.01%.
The accompanying Notes to Financial Statements are an integral part of this statement.
Annual Report 2016
28
COLUMBIA SMALL CAP INDEX FUND
FINANCIAL HIGHLIGHTS (continued)
| | | Year Ended
February 29, | | Year Ended February 28, | | Year Ended
February 29, | |
Class I | | 2016 | | 2015 | | 2014 | | 2013 | | 2012(a) | |
Per share data | |
Net asset value, beginning of period | | $ | 23.32 | | | $ | 23.56 | | | $ | 19.01 | | | $ | 17.76 | | | $ | 16.47 | | |
Income from investment operations: | |
Net investment income | | | 0.28 | | | | 0.27 | | | | 0.21 | | | | 0.29 | | | | 0.05 | | |
Net realized and unrealized gain (loss) | | | (2.25 | ) | | | 1.41 | | | | 5.73 | | | | 2.14 | | | | 1.87 | | |
Total from investment operations | | | (1.97 | ) | | | 1.68 | | | | 5.94 | | | | 2.43 | | | | 1.92 | | |
Less distributions to shareholders: | |
Net investment income | | | (0.29 | ) | | | (0.25 | ) | | | (0.20 | ) | | | (0.30 | ) | | | (0.17 | ) | |
Net realized gains | | | (1.99 | ) | | | (1.67 | ) | | | (1.19 | ) | | | (0.88 | ) | | | (0.46 | ) | |
Total distributions to shareholders | | | (2.28 | ) | | | (1.92 | ) | | | (1.39 | ) | | | (1.18 | ) | | | (0.63 | ) | |
Proceeds from regulatory settlements | | | — | | | | — | | | | — | | | | — | | | | 0.00 | (b) | |
Net asset value, end of period | | $ | 19.07 | | | $ | 23.32 | | | $ | 23.56 | | | $ | 19.01 | | | $ | 17.76 | | |
Total return | | | (9.43 | %) | | | 7.53 | % | | | 31.97 | % | | | 14.63 | % | | | 12.03 | % | |
Ratios to average net assets(c) | |
Total gross expenses | | | 0.20 | % | | | 0.20 | % | | | 0.22 | % | | | 0.18 | %(d) | | | 0.17 | %(e) | |
Total net expenses(f) | | | 0.20 | % | | | 0.20 | % | | | 0.20 | % | | | 0.18 | %(d) | | | 0.17 | %(e) | |
Net investment income | | | 1.27 | % | | | 1.17 | % | | | 0.98 | % | | | 1.65 | % | | | 1.09 | %(e) | |
Supplemental data | |
Net assets, end of period (in thousands) | | $ | 2 | | | $ | 2 | | | $ | 4 | | | $ | 3 | | | $ | 3 | | |
Portfolio turnover | | | 19 | % | | | 17 | % | | | 15 | % | | | 17 | % | | | 20 | % | |
Notes to Financial Highlights
(a) Based on operations from November 16, 2011 (commencement of operations) through the stated period end.
(b) Rounds to zero.
(c) In addition to the fees and expenses that the Fund bears directly, the Fund indirectly bears a pro rata share of the fees and expenses of any other funds in which it invests. Such indirect expenses are not included in the Fund's reported expense ratios.
(d) Ratios include line of credit interest expense which is less than 0.01%.
(e) Annualized.
(f) Total net expenses include the impact of certain fee waivers/expense reimbursements made by the Investment Manager and certain of its affiliates, if applicable.
The accompanying Notes to Financial Statements are an integral part of this statement.
Annual Report 2016
29
COLUMBIA SMALL CAP INDEX FUND
FINANCIAL HIGHLIGHTS (continued)
| | | Year Ended
February 29, | | Year Ended February 28, | | Year Ended
February 29, | |
Class K | | 2016 | | 2015 | | 2014 | | 2013 | | 2012(a) | |
Per share data | |
Net asset value, beginning of period | | $ | 23.37 | | | $ | 23.61 | | | $ | 19.05 | | | $ | 17.80 | | | $ | 17.87 | | |
Income from investment operations: | |
Net investment income | | | 0.22 | | | | 0.20 | | | | 0.16 | | | | 0.24 | | | | 0.13 | | |
Net realized and unrealized gain (loss) | | | (2.26 | ) | | | 1.41 | | | | 5.74 | | | | 2.14 | | | | 0.84 | | |
Total from investment operations | | | (2.04 | ) | | | 1.61 | | | | 5.90 | | | | 2.38 | | | | 0.97 | | |
Less distributions to shareholders: | |
Net investment income | | | (0.22 | ) | | | (0.18 | ) | | | (0.15 | ) | | | (0.25 | ) | | | (0.12 | ) | |
Net realized gains | | | (1.99 | ) | | | (1.67 | ) | | | (1.19 | ) | | | (0.88 | ) | | | (0.92 | ) | |
Total distributions to shareholders | | | (2.21 | ) | | | (1.85 | ) | | | (1.34 | ) | | | (1.13 | ) | | | (1.04 | ) | |
Proceeds from regulatory settlements | | | — | | | | — | | | | — | | | | — | | | | 0.00 | (b) | |
Net asset value, end of period | | $ | 19.12 | | | $ | 23.37 | | | $ | 23.61 | | | $ | 19.05 | | | $ | 17.80 | | |
Total return | | | (9.68 | %) | | | 7.22 | % | | | 31.65 | % | | | 14.27 | % | | | 5.76 | % | |
Ratios to average net assets(c) | |
Total gross expenses | | | 0.45 | % | | | 0.45 | % | | | 0.45 | % | | | 0.45 | %(d) | | | 0.45 | %(e) | |
Total net expenses(f) | | | 0.45 | % | | | 0.45 | % | | | 0.45 | % | | | 0.45 | %(d) | | | 0.45 | %(e) | |
Net investment income | | | 0.99 | % | | | 0.88 | % | | | 0.73 | % | | | 1.37 | % | | | 0.76 | %(e) | |
Supplemental data | |
Net assets, end of period (in thousands) | | $ | 11,703 | | | $ | 13,023 | | | $ | 12,781 | | | $ | 9,784 | | | $ | 9,858 | | |
Portfolio turnover | | | 19 | % | | | 17 | % | | | 15 | % | | | 17 | % | | | 20 | % | |
Notes to Financial Highlights
(a) Based on operations from March 7, 2011 (commencement of operations) through the stated period end.
(b) Rounds to zero.
(c) In addition to the fees and expenses that the Fund bears directly, the Fund indirectly bears a pro rata share of the fees and expenses of any other funds in which it invests. Such indirect expenses are not included in the Fund's reported expense ratios.
(d) Ratios include line of credit interest expense which is less than 0.01%.
(e) Annualized.
(f) Total net expenses include the impact of certain fee waivers/expense reimbursements made by the Investment Manager and certain of its affiliates, if applicable.
The accompanying Notes to Financial Statements are an integral part of this statement.
Annual Report 2016
30
COLUMBIA SMALL CAP INDEX FUND
FINANCIAL HIGHLIGHTS (continued)
| | | Year Ended
February 29, | | Year Ended February 28, | |
Class R5 | | 2016 | | 2015 | | 2014 | | 2013(a) | |
Per share data | |
Net asset value, beginning of period | | $ | 23.78 | | | $ | 23.99 | | | $ | 19.33 | | | $ | 17.47 | | |
Income from investment operations: | |
Net investment income | | | 0.28 | | | | 0.27 | | | | 0.23 | | | | 0.07 | | |
Net realized and unrealized gain (loss) | | | (2.30 | ) | | | 1.43 | | | | 5.82 | | | | 2.40 | | |
Total from investment operations | | | (2.02 | ) | | | 1.70 | | | | 6.05 | | | | 2.47 | | |
Less distributions to shareholders: | |
Net investment income | | | (0.28 | ) | | | (0.24 | ) | | | (0.20 | ) | | | (0.30 | ) | |
Net realized gains | | | (1.99 | ) | | | (1.67 | ) | | | (1.19 | ) | | | (0.31 | ) | |
Total distributions to shareholders | | | (2.27 | ) | | | (1.91 | ) | | | (1.39 | ) | | | (0.61 | ) | |
Net asset value, end of period | | $ | 19.49 | | | $ | 23.78 | | | $ | 23.99 | | | $ | 19.33 | | |
Total return | | | (9.46 | %) | | | 7.49 | % | | | 32.01 | % | | | 14.51 | % | |
Ratios to average net assets(b) | |
Total gross expenses | | | 0.20 | % | | | 0.20 | % | | | 0.20 | % | | | 0.24 | %(c) | |
Total net expenses(d) | | | 0.20 | % | | | 0.20 | % | | | 0.20 | % | | | 0.20 | %(c) | |
Net investment income | | | 1.24 | % | | | 1.17 | % | | | 0.99 | % | | | 1.44 | %(c) | |
Supplemental data | |
Net assets, end of period (in thousands) | | $ | 208,441 | | | $ | 166,247 | | | $ | 79,726 | | | $ | 81 | | |
Portfolio turnover | | | 19 | % | | | 17 | % | | | 15 | % | | | 17 | % | |
Notes to Financial Highlights
(a) Based on operations from November 8, 2012 (commencement of operations) through the stated period end.
(b) In addition to the fees and expenses that the Fund bears directly, the Fund indirectly bears a pro rata share of the fees and expenses of any other funds in which it invests. Such indirect expenses are not included in the Fund's reported expense ratios.
(c) Annualized.
(d) Total net expenses include the impact of certain fee waivers/expense reimbursements made by the Investment Manager and certain of its affiliates, if applicable.
The accompanying Notes to Financial Statements are an integral part of this statement.
Annual Report 2016
31
COLUMBIA SMALL CAP INDEX FUND
FINANCIAL HIGHLIGHTS (continued)
Class W | | Year Ended
February 29,
2016 | | Year Ended
February 28,
2015(a) | |
Per share data | |
Net asset value, beginning of period | | $ | 23.12 | | | $ | 23.08 | | |
Income from investment operations: | |
Net investment income | | | 0.21 | | | | 0.18 | | |
Net realized and unrealized gain (loss) | | | (2.22 | ) | | | 1.03 | | |
Total from investment operations | | | (2.01 | ) | | | 1.21 | | |
Less distributions to shareholders: | |
Net investment income | | | (0.22 | ) | | | (0.18 | ) | |
Net realized gains | | | (1.99 | ) | | | (0.99 | ) | |
Total distributions to shareholders | | | (2.21 | ) | | | (1.17 | ) | |
Net asset value, end of period | | $ | 18.90 | | | $ | 23.12 | | |
Total return | | | (9.65 | %) | | | 5.45 | % | |
Ratios to average net assets(b) | |
Total gross expenses | | | 0.45 | % | | | 0.46 | %(c) | |
Total net expenses(d) | | | 0.45 | %(e) | | | 0.45 | %(c)(e) | |
Net investment income | | | 0.97 | % | | | 1.22 | %(c) | |
Supplemental data | |
Net assets, end of period (in thousands) | | $ | 43,729 | | | $ | 67,780 | | |
Portfolio turnover | | | 19 | % | | | 17 | % | |
Notes to Financial Highlights
(a) Based on operations from June 25, 2014 (commencement of operations) through the stated period end.
(b) In addition to the fees and expenses that the Fund bears directly, the Fund indirectly bears a pro rata share of the fees and expenses of any other funds in which it invests. Such indirect expenses are not included in the Fund's reported expense ratios.
(c) Annualized.
(d) Total net expenses include the impact of certain fee waivers/expense reimbursements made by the Investment Manager and certain of its affiliates, if applicable.
(e) The benefits derived from expense reductions had an impact of less than 0.01%.
The accompanying Notes to Financial Statements are an integral part of this statement.
Annual Report 2016
32
COLUMBIA SMALL CAP INDEX FUND
FINANCIAL HIGHLIGHTS (continued)
| | | Year Ended
February 29, | | Year Ended February 28, | | Year Ended
February 29, | |
Class Z | | 2016 | | 2015 | | 2014 | | 2013 | | 2012 | |
Per share data | |
Net asset value, beginning of period | | $ | 23.39 | | | $ | 23.63 | | | $ | 19.06 | | | $ | 17.81 | | | $ | 18.06 | | |
Income from investment operations: | |
Net investment income | | | 0.27 | | | | 0.26 | | | | 0.21 | | | | 0.29 | | | | 0.16 | | |
Net realized and unrealized gain (loss) | | | (2.25 | ) | | | 1.41 | | | | 5.75 | | | | 2.14 | | | | 0.66 | | |
Total from investment operations | | | (1.98 | ) | | | 1.67 | | | | 5.96 | | | | 2.43 | | | | 0.82 | | |
Less distributions to shareholders: | |
Net investment income | | | (0.28 | ) | | | (0.24 | ) | | | (0.20 | ) | | | (0.30 | ) | | | (0.15 | ) | |
Net realized gains | | | (1.99 | ) | | | (1.67 | ) | | | (1.19 | ) | | | (0.88 | ) | | | (0.92 | ) | |
Total distributions to shareholders | | | (2.27 | ) | | | (1.91 | ) | | | (1.39 | ) | | | (1.18 | ) | | | (1.07 | ) | |
Proceeds from regulatory settlements | | | — | | | | — | | | | — | | | | — | | | | 0.00 | (a) | |
Net asset value, end of period | | $ | 19.14 | | | $ | 23.39 | | | $ | 23.63 | | | $ | 19.06 | | | $ | 17.81 | | |
Total return | | | (9.44 | %) | | | 7.47 | % | | | 31.99 | % | | | 14.54 | % | | | 4.92 | % | |
Ratios to average net assets(b) | |
Total gross expenses | | | 0.20 | % | | | 0.20 | % | | | 0.20 | % | | | 0.20 | %(c) | | | 0.20 | % | |
Total net expenses(d) | | | 0.20 | %(e) | | | 0.20 | %(e) | | | 0.20 | %(e) | | | 0.20 | %(c)(e) | | | 0.20 | %(e) | |
Net investment income | | | 1.22 | % | | | 1.14 | % | | | 0.98 | % | | | 1.64 | % | | | 0.96 | % | |
Supplemental data | |
Net assets, end of period (in thousands) | | $ | 1,326,728 | | | $ | 1,725,837 | | | $ | 1,636,915 | | | $ | 1,275,562 | | | $ | 1,700,205 | | |
Portfolio turnover | | | 19 | % | | | 17 | % | | | 15 | % | | | 17 | % | | | 20 | % | |
Notes to Financial Highlights
(a) Rounds to zero.
(b) In addition to the fees and expenses that the Fund bears directly, the Fund indirectly bears a pro rata share of the fees and expenses of any other funds in which it invests. Such indirect expenses are not included in the Fund's reported expense ratios.
(c) Ratios include line of credit interest expense which is less than 0.01%.
(d) Total net expenses include the impact of certain fee waivers/expense reimbursements made by the Investment Manager and certain of its affiliates, if applicable.
(e) The benefits derived from expense reductions had an impact of less than 0.01%.
The accompanying Notes to Financial Statements are an integral part of this statement.
Annual Report 2016
33
COLUMBIA SMALL CAP INDEX FUND
NOTES TO FINANCIAL STATEMENTS
February 29, 2016
Note 1. Organization
Columbia Small Cap Index Fund (the Fund), a series of Columbia Funds Series Trust (the Trust), is a diversified fund. The Trust is registered under the Investment Company Act of 1940, as amended (the 1940 Act), as an open-end management investment company organized as a Delaware statutory trust.
Fund Shares
The Trust may issue an unlimited number of shares (without par value). The Fund offers Class A, Class B, Class I, Class K, Class R5, Class W and Class Z shares. Although all share classes generally have identical voting, dividend and liquidation rights, each share class votes separately when required by the Trust's organizational documents or by law. Different share classes pay different distribution amounts to the extent the expenses of such share classes differ, and distributions in liquidation will be proportional to the net asset value of each share class. Each share class has its own expense and sales charge structure.
Class A shares are not subject to any front-end sales charge or contingent deferred sales charge (CDSC).
Class B shares may be subject to a maximum CDSC of 5.00% based upon the holding period after purchase. Class B shares will generally convert to Class A shares eight years after purchase. The Fund no longer accepts investments by new or existing investors in the Fund's Class B shares, except in connection with the reinvestment of any dividend and/or capital gain distributions in Class B shares of the Fund and exchanges by existing Class B shareholders of certain other funds within the Columbia Family of Funds.
Class I shares are not subject to sales charges and are available only to the Columbia Family of Funds.
Class K shares are not subject to sales charges, however this share class is closed to new investors.
Class R5 shares are not subject to sales charges and are generally available only to investors purchasing through authorized investment professionals and omnibus retirement plans.
Class W shares are not subject to sales charges and are available only to investors purchasing through authorized investment programs managed by investment professionals, including discretionary managed account programs.
Class Z shares are not subject to sales charges and are available only to eligible investors, which are subject to
different investment minimums as described in the Fund's prospectus.
Note 2. Summary of Significant Accounting Policies
Basis of Preparation
The Fund is an investment company that applies the accounting and reporting guidance in the Financial Accounting Standards Board (FASB) Accounting Standards Codification Topic 946, Financial Services — Investment Companies (ASC 946). The financial statements are prepared in accordance with U.S. generally accepted accounting principles (GAAP), which requires management to make certain estimates and assumptions that affect the reported amounts of assets and liabilities, the disclosure of contingent assets and liabilities at the date of the financial statements and the reported amounts of income and expenses during the reporting period. Actual results could differ from those estimates.
The following is a summary of significant accounting policies followed by the Fund in the preparation of its financial statements.
Security Valuation
All equity securities are valued at the close of business of the New York Stock Exchange (NYSE). Equity securities are valued at the last quoted sales price on the principal exchange or market on which they trade, except for securities traded on the NASDAQ Stock Market, which are valued at the NASDAQ official close price. Unlisted securities or listed securities for which there were no sales during the day are valued at the mean of the latest quoted bid and ask prices on such exchanges or markets.
Foreign equity securities are valued based on the closing price on the foreign exchange in which such securities are primarily traded. If any foreign equity security closing prices are not readily available, the securities are valued at the mean of the latest quoted bid and ask prices on such exchanges or markets. Foreign currency exchange rates are generally determined at 4:00 p.m. Eastern (U.S.) time. Many securities markets and exchanges outside the U.S. close prior to the close of the NYSE; therefore, the closing prices for securities in such markets or on such exchanges may not fully reflect events that occur after such close but before the close of the NYSE. In those situations, foreign securities will be fair valued pursuant to a policy adopted by the Board of
Annual Report 2016
34
COLUMBIA SMALL CAP INDEX FUND
NOTES TO FINANCIAL STATEMENTS (continued)
February 29, 2016
Trustees (the Board), including, if available, utilizing a third party pricing service to determine these fair values. The third party pricing service takes into account multiple factors, including, but not limited to, movements in the U.S. securities markets, certain depositary receipts, futures contracts and foreign exchange rates that have occurred subsequent to the close of the foreign exchange or market, to determine a good faith estimate that reasonably reflects the current market conditions as of the close of the NYSE. The fair value of a security is likely to be different from the quoted or published price, if available.
Investments in open-end investment companies, including money market funds, are valued at their latest net asset value.
Futures and options on futures contracts are valued based upon the settlement price at the close of regular trading on their principal exchanges or, in the absence of transactions, at the mean of the latest quoted bid and ask prices.
Investments for which market quotations are not readily available, or that have quotations which management believes are not reflective of market value or reliable, are valued at fair value as determined in good faith under procedures approved by and under the general supervision of the Board. If a security or class of securities (such as foreign securities) is valued at fair value, such value is likely to be different from the quoted or published price for the security.
The determination of fair value often requires significant judgment. To determine fair value, management may use assumptions including but not limited to future cash flows and estimated risk premiums. Multiple inputs from various sources may be used to determine fair value.
GAAP requires disclosure regarding the inputs and valuation techniques used to measure fair value and any changes in valuation inputs or techniques. In addition, investments shall be disclosed by major category. This information is disclosed following the Fund's Portfolio of Investments.
Derivative Instruments
The Fund invests in certain derivative instruments, as detailed below, to meet its investment objectives. Derivatives are instruments whose values depend on, or are derived from, in whole or in part, the value of one or more securities, currencies, commodities, indices, or other assets or instruments. Derivatives may be used to increase investment flexibility (including to maintain cash
reserves while maintaining desired exposure to certain assets), for risk management (hedging) purposes, to facilitate trading, to reduce transaction costs and to pursue higher investment returns. The Fund may also use derivative instruments to mitigate certain investment risks, such as foreign currency exchange rate risk, interest rate risk and credit risk. Derivatives may involve various risks, including the potential inability of the counterparty to fulfill its obligation under the terms of the contract, the potential for an illiquid secondary market (making it difficult for the Fund to sell, including at favorable prices) and the potential for market movements which may expose the Fund to gains or losses in excess of the amount shown in the Statement of Assets and Liabilities. The notional amounts of derivative instruments, if applicable, are not recorded in the financial statements.
A derivative instrument may suffer a marked-to-market loss if the value of the contract decreases due to an unfavorable change in the market rates or values of the underlying instrument. Losses can also occur if the counterparty does not perform under the contract. The Fund's risk of loss from counterparty credit risk on over-the-counter derivatives is generally limited to the aggregate unrealized gain netted against any collateral held by the Fund and the amount of any variation margin held by the counterparty. With exchange-traded or centrally cleared derivatives, there is reduced counterparty credit risk to the Fund since the exchange's clearinghouse, as counterparty to such instruments, guarantees against a possible default. The clearinghouse stands between the buyer and the seller of the contract; therefore, the counterparty credit risk is failure of the clearinghouse. However, credit risk still exists in exchange-traded or centrally cleared derivatives with respect to initial and variation margin that is held in a broker's customer account. While brokers are required to segregate customer margin from their own assets, in the event that a broker becomes insolvent or goes into bankruptcy and at that time there is a shortfall in the aggregate amount of margin held by the broker for all its clients, U.S. bankruptcy laws will typically allocate that shortfall on a pro-rata basis across all the broker's customers (including the Fund), potentially resulting in losses to the Fund.
In order to better define its contractual rights and to secure rights that will help the Fund mitigate its counterparty risk, the Fund may enter into an International Swaps and Derivatives Association, Inc. Master Agreement (ISDA Master Agreement) or similar
Annual Report 2016
35
COLUMBIA SMALL CAP INDEX FUND
NOTES TO FINANCIAL STATEMENTS (continued)
February 29, 2016
agreement with its derivatives contract counterparties. An ISDA Master Agreement is an agreement between the Fund and a counterparty that governs over-the-counter derivatives and forward foreign currency exchange contracts and typically contains, among other things, collateral posting terms and netting provisions in the event of a default and/or termination event. Under an ISDA Master Agreement, the Fund may, under certain circumstances, offset with the counterparty certain derivative instrument's payables and/or receivables with collateral held and/or posted and create one single net payment. The provisions of the ISDA Master Agreement typically permit a single net payment in the event of default (close-out netting) including the bankruptcy or insolvency of the counterparty. Note, however, that bankruptcy or insolvency laws of a particular jurisdiction may impose restrictions on or prohibitions against the right of offset in bankruptcy, insolvency or other events.
Collateral (margin) requirements differ by type of derivative. Margin requirements are established by the exchange or clearinghouse for exchange-traded and centrally cleared derivatives. Brokers can ask for margin in excess of the minimum in certain circumstances. Collateral terms are contract specific for over-the-counter derivatives. For over-the-counter derivatives traded under an ISDA Master Agreement, the collateral requirements are typically calculated by netting the marked-to-market amount for each transaction under such agreement and comparing that amount to the value of any variation margin currently pledged by the Fund and/or the counterparty. Generally, the amount of collateral due from or to a party has to exceed a minimum transfer amount threshold (e.g., $500,000) before a transfer has to be made. To the extent amounts due to the Fund from its counterparties are not fully collateralized, contractually or otherwise, the Fund bears the risk of loss from counterparty nonperformance. The Fund attempts to mitigate counterparty risk by only entering into agreements with counterparties that it believes have the financial resources to honor their obligations and by monitoring the financial stability of those counterparties.
Certain ISDA Master Agreements allow counterparties to over-the-counter derivatives transactions to terminate derivatives contracts prior to maturity in the event the Fund's net asset value declines by a stated percentage over a specified time period or if the Fund fails to meet certain terms of the ISDA Master Agreement, which would cause the Fund to accelerate payment of any net liability owed to the counterparty. The Fund also has termination rights if the counterparty fails to meet
certain terms of the ISDA Master Agreement. In addition to considering counterparty credit risk, the Fund would consider terminating the derivatives contracts based on whether termination would result in a net liability owed from the counterparty.
For financial reporting purposes, the Fund does not offset derivative assets and derivative liabilities that are subject to netting arrangements in the Statement of Assets and Liabilities.
Futures Contracts
Futures contracts are exchange traded and represent commitments for the future purchase or sale of an asset at a specified price on a specified date. The Fund bought and sold futures contracts to maintain appropriate equity market exposure while keeping sufficient cash to accommodate daily redemptions. These instruments may be used for other purposes in future periods. Upon entering into futures contracts, the Fund bears risks that it may not achieve the anticipated benefits of the futures contracts and may realize a loss. Additional risks include counterparty credit risk, the possibility of an illiquid market, and that a change in the value of the contract or option may not correlate with changes in the value of the underlying asset.
Upon entering into a futures contract, the Fund pledges cash or securities with the broker in an amount sufficient to meet the initial margin requirement. The initial margin deposit must be maintained at an established level over the life of the contract. Cash deposited as initial margin is recorded in the Statement of Assets and Liabilities as margin deposits. Securities deposited as initial margin are designated in the Portfolio of Investments. Subsequent payments (variation margin) are made or received by the Fund each day. The variation margin payments are equal to the daily change in the contract value and are recorded as variation margin receivable or payable and are offset in unrealized gains or losses. The Fund recognizes a realized gain or loss when the contract is closed or expires. Futures contracts involve, to varying degrees, risk of loss in excess of the variation margin disclosed in the Statement of Assets and Liabilities.
Effects of Derivative Transactions in the Financial Statements
The following tables are intended to provide additional information about the effect of derivatives on the financial statements of the Fund, including: the fair value of derivatives by risk category and the location of those fair values in the Statement of Assets and Liabilities;
Annual Report 2016
36
COLUMBIA SMALL CAP INDEX FUND
NOTES TO FINANCIAL STATEMENTS (continued)
February 29, 2016
and the impact of derivative transactions over the period in the Statement of Operations, including realized and unrealized gains (losses). The derivative instrument schedules following the Portfolio of Investments present additional information regarding derivative instruments outstanding at the end of the period, if any.
The following table is a summary of the fair value of derivative instruments (not considered to be hedging instruments for accounting disclosure purposes) at February 29, 2016:
Asset Derivatives | |
Risk Exposure
Category | | Statement of Assets
and Liabilities Location | | Fair Value ($) | |
Equity risk
| | Net assets — unrealized
appreciation on futures
contracts | | | 1,296,974
| * | |
*Includes cumulative appreciation (depreciation) as reported in the tables following the Portfolio of Investments. Only the current day's variation margin is reported in receivables or payables in the Statement of Assets and Liabilities.
The following table indicates the effect of derivative instruments (not considered to be hedging instruments for accounting disclosure purposes) in the Statement of Operations for the year ended February 29, 2016:
Amount of Realized Gain (Loss) on Derivatives Recognized in Income | |
Risk Exposure Category | | Futures Contracts ($) | |
Equity risk | | | 1,819,094 | | |
Change in Unrealized Appreciation (Depreciation) on Derivatives
Recognized in Income | |
Risk Exposure Category | | Futures Contracts ($) | |
Equity risk | | | (4,253,714 | ) | |
The following table provides a summary of the average outstanding volume by derivative instrument for the year ended February 29 , 2016:
Derivative Instrument | | Average notional amounts($)* | |
Futures contracts — Long | | | 67,503,723 | | |
*Based on the ending quarterly outstanding amounts for the year ended February 29, 2016.
Security Transactions
Security transactions are accounted for on the trade date. Cost is determined and gains (losses) are based upon the specific identification method for both financial statement and federal income tax purposes.
Income Recognition
Corporate actions and dividend income are generally recorded net of any non-reclaimable tax withholdings, on
the ex-dividend date or upon receipt of ex-dividend notification in the case of certain foreign securities.
The Fund may receive distributions from holdings in equity securities, business development companies (BDCs), exchange-traded funds, other regulated investment companies (RICs), and real estate investment trusts (REITs), which report information on the tax character of their distributions annually. These distributions are allocated to dividend income, capital gain and return of capital based on actual information reported. Return of capital is recorded as a reduction of the cost basis of securities held. If the Fund no longer owns the applicable securities, return of capital is recorded as a realized gain. With respect to REITs, to the extent actual information has not yet been reported, estimates for return of capital are made by the Fund's management. Management's estimates are subsequently adjusted when the actual character of the distributions is disclosed by the REITs, which could result in a proportionate change in return of capital to shareholders.
Awards from class action litigation are recorded as a reduction of cost basis if the Fund still owns the applicable securities on the payment date. If the Fund no longer owns the applicable securities, the proceeds are recorded as realized gains.
Expenses
General expenses of the Trust are allocated to the Fund and other funds of the Trust based upon relative net assets or other expense allocation methodologies determined by the nature of the expense. Expenses directly attributable to the Fund are charged to the Fund. Expenses directly attributable to a specific class of shares are charged to that share class.
Determination of Class Net Asset Value
All income, expenses (other than class-specific expenses, which are charged to that share class, as shown in the Statement of Operations) and realized and unrealized gains (losses) are allocated to each class of the Fund on a daily basis, based on the relative net assets of each class, for purposes of determining the net asset value of each class.
Federal Income Tax Status
The Fund intends to qualify each year as a regulated investment company under Subchapter M of the Internal Revenue Code, as amended, and will distribute substantially all of its taxable income (including net short-term capital gains), if any, for its tax year, and as
Annual Report 2016
37
COLUMBIA SMALL CAP INDEX FUND
NOTES TO FINANCIAL STATEMENTS (continued)
February 29, 2016
such will not be subject to federal income taxes. In addition, the Fund intends to distribute in each calendar year substantially all of its net investment income, capital gains and certain other amounts, if any, such that the Fund should not be subject to federal excise tax. Therefore, no federal income or excise tax provision is recorded.
Foreign Taxes
The Fund may be subject to foreign taxes on income, gains on investments or currency repatriation, a portion of which may be recoverable. The Fund will accrue such taxes and recoveries, as applicable, based upon its current interpretation of tax rules and regulations that exist in the markets in which it invests.
Realized gains in certain countries may be subject to foreign taxes at the Fund level, based on statutory rates. The Fund accrues for such foreign taxes on realized and unrealized gains at the appropriate rate for each jurisdiction, as applicable. The amount, if any, is disclosed as a liability on the Statement of Assets and Liabilities.
Distributions to Shareholders
Distributions from net investment income, if any, are declared and paid semi-annually. Net realized capital gains, if any, are distributed at least annually. Income distributions and capital gain distributions are determined in accordance with federal income tax regulations, which may differ from GAAP.
Guarantees and Indemnifications
Under the Trust's organizational documents and, in some cases, by contract, its officers and trustees are indemnified against certain liabilities arising out of the performance of their duties to the Trust or its funds. In addition, certain of the Fund's contracts with its service providers contain general indemnification clauses. The Fund's maximum exposure under these arrangements is unknown since the amount of any future claims that may be made against the Fund cannot be determined, and the Fund has no historical basis for predicting the likelihood of any such claims.
Recent Accounting Pronouncement
Fair Value Measurement (Topic 820), Disclosure for Investments in Certain Entities That Calculate Net Asset Value per Share (or Its Equivalent)
In May 2015, FASB issued Accounting Standards Update (ASU) No. 2015-07, Fair Value Measurement (Topic 820), Disclosure for Investments in Certain Entities That
Calculate Net Asset Value per Share (or Its Equivalent). ASU No. 2015-07 changes the disclosure requirements for investments for which fair value is measured using the net asset value per share practical expedient. The disclosure requirements are effective for annual periods beginning after December 15, 2015 and interim periods within those fiscal years. At this time, management is evaluating the implications of this guidance and the impact it will have on the financial statement amounts and footnote disclosures, if any.
Note 3. Fees and Other Transactions with Affiliates
Management Fees
Effective July 1, 2015, the Fund entered into a Management Agreement with Columbia Management Investment Advisers, LLC (the Investment Manager), a wholly-owned subsidiary of Ameriprise Financial, Inc. (Ameriprise Financial). Under the Management Agreement, the Investment Manager provides the Fund with investment research and advice, as well as administrative and accounting services. The management services fee is an annual fee that is equal to 0.20% of the Fund's average daily net assets.
Prior to July 1, 2015, the Fund paid the Investment Manager an annual fee for advisory services under an Investment Management Services Agreement and a separate annual fee for administrative and accounting services under an Administrative Services Agreement. For the period from March 1, 2015 through June 30, 2015, the investment advisory services fee paid to the Investment Manager was $1,120,310, and the administrative services fee paid to the Investment Manager was $1,120,310.
Other Expenses
Other expenses are for, among other things, miscellaneous expenses of the Fund or the Board, including payments to Board Services Corp., a company providing limited administrative services to the Fund and the Board. That company's expenses include boardroom and office expense, employee compensation, employee health and retirement benefits, and certain other expenses. For the year ended February 29, 2016, other expenses paid by the Fund to this company were $6,332.
Compensation of Board Members
Board members, who are not officers or employees of the Investment Manager or Ameriprise Financial, are compensated for their services to the Fund as disclosed
Annual Report 2016
38
COLUMBIA SMALL CAP INDEX FUND
NOTES TO FINANCIAL STATEMENTS (continued)
February 29, 2016
in the Statement of Operations. Under a Deferred Compensation Plan (the Plan), these Board members may elect to defer payment of up to 100% of their compensation. Deferred amounts are treated as though equivalent dollar amounts had been invested in shares of certain funds managed by the Investment Manager. The Fund's liability for these amounts is adjusted for market value changes and remains in the Fund until distributed in accordance with the Plan. All amounts payable under the Plan constitute a general unsecured obligation of the Fund.
Transfer Agency Fees
Under a Transfer and Dividend Disbursing Agent Agreement, Columbia Management Investment Services Corp. (the Transfer Agent), an affiliate of the Investment Manager and a wholly-owned subsidiary of Ameriprise Financial, is responsible for providing transfer agency services to the Fund. The Transfer Agent has contracted with Boston Financial Data Services (BFDS) to serve as sub-transfer agent.
The transfer agency fees are payable by the Investment Manager. The Transfer Agent pays the fees of BFDS for services as sub-transfer agent and is not entitled to reimbursement for such fees from the Fund. The Transfer Agent also receives compensation from the Investment Manager for various shareholder services and reimbursements for certain out-of-pocket expenses.
An annual minimum account balance fee of $20 may apply to certain accounts with a value below the applicable share class's initial minimum investment requirements to reduce the impact of small accounts on transfer agency fees. These minimum account balance fees are remitted to the Fund and recorded as part of expense reductions in the Statement of Operations. For the year ended February 29, 2016, these minimum account balance fees reduced total expenses of the Fund by $2,051.
Plan Administration Fees
Under a Plan Administration Services Agreement with the Transfer Agent, the Fund pays an annual fee at a rate of 0.25% of the Fund's average daily net assets attributable to Class K shares for the provision of various administrative, recordkeeping, communication and educational services.
Distribution and Service Fees
The Fund has an agreement with Columbia Management Investment Distributors, Inc. (the Distributor), an affiliate of the Investment Manager and a wholly-owned subsidiary of Ameriprise Financial, for distribution and shareholder services. The Board has approved, and the Fund has adopted, distribution and shareholder service plans (the Plans) applicable to certain share classes, which set the distribution and service fees for the Fund. These fees are calculated daily and are intended to compensate the Distributor and/or eligible selling and/or servicing agents for selling shares of the Fund and providing services to investors.
Under the Plans, the Fund pays a monthly combined distribution and service fee to the Distributor at the maximum annual rate of 0.25% of the average daily net assets attributable to Class A shares of the Fund. Also under the Plans, the Fund pays a monthly service fee at the maximum annual rate of 0.25% of the average daily net assets attributable to Class B and Class W shares of the Fund and a monthly distribution fee at the maximum annual rate of 0.75% and 0.25% of the average daily net assets attributable to Class B and Class W shares of the Fund, respectively.
Although the Fund may pay a distribution fee up to 0.25% of the Fund's average daily net assets attributable to Class W shares and a service fee of up to 0.25% of the Fund's average daily net assets attributable to Class W shares, the aggregate fee shall not exceed 0.25% of the Fund's average daily net assets attributable to Class W shares.
Sales Charges
Sales charges, including CDSCs, received by the Distributor for distributing Fund shares were $25 for Class A and $110 for Class B shares for the year ended February 29, 2016.
Expenses Waived/Reimbursed by the Investment Manager and its Affiliates
The Investment Manager and certain of its affiliates have contractually agreed to waive fees and/or reimburse expenses (excluding certain fees and expenses described below) for the period disclosed below, unless sooner terminated at the sole discretion of the Board, so that the Fund's net operating expenses, after giving effect to fees waived/expenses reimbursed and any
Annual Report 2016
39
COLUMBIA SMALL CAP INDEX FUND
NOTES TO FINANCIAL STATEMENTS (continued)
February 29, 2016
balance credits and/or overdraft charges from the Fund's custodian, do not exceed the following annual rates as a percentage of the class' average daily net assets:
| | | Fee Rates Contractual
through
June 30, 2016 | |
Class A | | | 0.45 | % | |
Class B | | | 1.20 | | |
Class I | | | 0.20 | | |
Class K | | | 0.45 | | |
Class R5 | | | 0.20 | | |
Class W | | | 0.45 | | |
Class Z | | | 0.20 | | |
Under the agreement governing these fee waivers and/or expense reimbursement arrangements, the following fees and expenses are excluded from the waiver/reimbursement commitment, and therefore will be paid by the Fund, if applicable: taxes (including foreign transaction taxes), expenses associated with investments in affiliated and non-affiliated pooled investment vehicles (including mutual funds and exchange-traded funds), transaction costs and brokerage commissions, costs related to any securities lending program, dividend and interest expenses associated with securities sold short, inverse floater program fees and expenses, transaction charges and interest on borrowed money, interest, extraordinary expenses and any other expenses the exclusion of which is specifically approved by the Board. This agreement may be modified or amended only with approval from the Investment Manager, certain of its affiliates and the Fund. Any fees waived and/or expenses reimbursed under the expense reimbursement arrangements described above are not recoverable by the Investment Manager or its affiliates in future periods.
Note 4. Federal Tax Information
The timing and character of income and capital gain distributions are determined in accordance with income tax regulations, which may differ from GAAP because of temporary or permanent book to tax differences.
At February 29, 2016, these differences are primarily due to differing treatment for deferral/reversal of wash sale losses, Trustees' deferred compensation, distribution reclassifications, re-characterization of distributions for investments, derivative investments and market timing regulatory payments. To the extent these differences are permanent, reclassifications are made among the components of the Fund's net assets in the Statement of
Assets and Liabilities. Temporary differences do not require reclassifications. In the Statement of Assets and Liabilities the following reclassifications were made:
Undistributed net investment income | | $ | (1,113,522 | ) | |
Accumulated net realized gain | | | 1,158,939 | | |
Paid-in capital | | | (45,417 | ) | |
Net investment income (loss) and net realized gains (losses), as disclosed in the Statement of Operations, and net assets were not affected by this reclassification.
The tax character of distributions paid during the years indicated was as follows:
Year Ended | | February 29, 2016 | | February 28,2015 | |
Ordinary income | | $ | 50,277,348 | | | $ | 37,872,925 | | |
Long-term capital gains | | | 256,610,023 | | | | 205,231,775 | | |
Total | | $ | 306,887,371 | | | $ | 243,104,700 | | |
Short-term capital gain distributions, if any, are considered ordinary income distributions for tax purposes.
At February 29, 2016, the components of distributable earnings on a tax basis were as follows:
Undistributed ordinary income | | $ | 2,294,216 | | |
Undistributed long-term capital gains | | | 47,775,042 | | |
Net unrealized appreciation | | | 452,938,303 | | |
At February 29, 2016, the cost of investments for federal income tax purposes was $2,264,937,076 and the aggregate gross unrealized appreciation and depreciation based on that cost was:
Unrealized appreciation | | $ | 733,042,357 | | |
Unrealized depreciation | | | (280,104,054 | ) | |
Net unrealized appreciation | | $ | 452,938,303 | | |
Management of the Fund has concluded that there are no significant uncertain tax positions in the Fund that would require recognition in the financial statements. However, management's conclusion may be subject to review and adjustment at a later date based on factors including, but not limited to, new tax laws, regulations, and administrative interpretations (including relevant court decisions). Generally, the Fund's federal tax returns for the prior three fiscal years remain subject to examination by the Internal Revenue Service.
Note 5. Portfolio Information
The cost of purchases and proceeds from sales of securities, excluding short-term investments and derivatives, if any, aggregated to $578,969,849 and
Annual Report 2016
40
COLUMBIA SMALL CAP INDEX FUND
NOTES TO FINANCIAL STATEMENTS (continued)
February 29, 2016
$692,899,304, respectively, for the year ended February 29, 2016 The amount of purchase and sale activity impacts the portfolio turnover rate reported in the Financial Highlights.
Note 6. Affiliated Money Market Fund
The Fund invests in Columbia Short-Term Cash Fund, an affiliated money market fund established for the exclusive use by the Fund and other affiliated funds. The income earned by the Fund from such investments is included as Dividends — affiliated issuers in the Statement of Operations. As an investing fund, the Fund indirectly bears its proportionate share of the expenses of Columbia Short-Term Cash Fund.
Note 7. Line of Credit
The Fund has access to a revolving credit facility whereby the Fund may borrow for the temporary funding of shareholder redemptions or for other temporary or emergency purposes. Effective December 8, 2015, Citibank, N.A. and HSBC Bank USA, N.A. joined JPMorgan Chase Bank, N.A. (JPMorgan) as lead of a syndicate of banks under the credit facility, which is a collective agreement between the Fund and certain other funds managed by the Investment Manager, severally and not jointly, that permits collective borrowings up to $1 billion. Interest is charged to each participating fund based on its borrowings at a rate equal to the higher of (i) the overnight federal funds rate plus 1.00% or (ii) the one-month LIBOR rate plus 1.00%. Each borrowing under the credit facility matures no later than 60 days after the date of borrowing. The Fund also pays a commitment fee equal to its pro rata share of the amount of the credit facility at a rate of 0.15% per annum. The commitment fee is included in other expenses in the Statement of Operations. Prior to December 8, 2015, JPMorgan was the sole lead bank under the credit facility agreement that permitted borrowings up to $550 million under the same terms and interest rates as described above with the exception of the commitment fee which was charged at a rate of 0.075% per annum.
The Fund had no borrowings during the year ended February 29, 2016.
Note 8. Significant Risks
Shareholder Concentration Risk
At February 29, 2016, one unaffiliated shareholder of record owned 19.6 % of the outstanding shares of the Fund in one or more accounts. The Fund has no knowledge about whether any portion of those shares
was owned beneficially. Affiliated shareholders of record owned 18.6 % of the outstanding shares of the Fund in one or more accounts. Subscription and redemption activity by concentrated accounts may have a significant effect on the operations of the Fund. In the case of a large redemption, the Fund may be forced to sell investments at inopportune times, including its liquid or more liquid positions, resulting in Fund losses and the Fund holding a higher percentage of less liquid or illiquid securities. Large redemptions could result in decreased economies of scale and increased operating expenses for non-redeeming Fund shareholders.
Financial Sector Risk
The Fund may be more susceptible to the particular risks that may affect companies in the financial services sector than if it were invested in a wider variety of companies in unrelated sectors. Companies in the financial services sector are subject to certain risks, including the risk of regulatory change, decreased liquidity in credit markets and unstable interest rates. Such companies may have concentrated portfolios, such as a high level of loans to real estate developers, which makes them vulnerable to economic conditions that affect that industry. Performance of such companies may be affected by competitive pressures and exposure to investments or agreements that, under certain circumstances, may lead to losses (e.g., subprime loans). Companies in the financial services sector are subject to extensive governmental regulation that may limit the amount and types of loans and other financial commitments they can make, and interest rates and fees that they may charge. In addition, profitability of such companies is largely dependent upon the availability and the cost of capital.
Note 9. Subsequent Events
Management has evaluated the events and transactions that have occurred through the date the financial statements were issued and noted no items requiring adjustment of the financial statements or additional disclosure.
Note 10. Information Regarding Pending and Settled Legal Proceedings
In December 2005, without admitting or denying the allegations, American Express Financial Corporation (AEFC, which is now known as Ameriprise Financial, Inc. (Ameriprise Financial)) entered into settlement agreements with the Securities and Exchange Commission (SEC) and Minnesota Department of
Annual Report 2016
41
COLUMBIA SMALL CAP INDEX FUND
NOTES TO FINANCIAL STATEMENTS (continued)
February 29, 2016
Commerce (MDOC) related to market timing activities. As a result, AEFC was censured and ordered to cease and desist from committing or causing any violations of certain provisions of the Investment Advisers Act of 1940, the Investment Company Act of 1940, and various Minnesota laws. AEFC agreed to pay disgorgement of $10 million and civil money penalties of $7 million. AEFC also agreed to retain an independent distribution consultant to assist in developing a plan for distribution of all disgorgement and civil penalties ordered by the SEC in accordance with various undertakings detailed at http://www.sec.gov/litigation/admin/ia-2451.pdf. Ameriprise Financial and its affiliates have cooperated with the SEC and the MDOC in these legal proceedings, and have made regular reports to the Funds' Boards of Trustees.
Ameriprise Financial and certain of its affiliates have historically been involved in a number of legal, arbitration and regulatory proceedings, including routine litigation, class actions, and governmental actions, concerning matters arising in connection with the conduct of their business activities. Ameriprise Financial believes that the Funds are not currently the subject of, and that neither Ameriprise Financial nor any of its affiliates are the subject of, any pending legal, arbitration or regulatory proceedings that are likely to have a material adverse effect on the Funds or the ability of Ameriprise Financial or its affiliates to perform under their contracts with the Funds. Ameriprise Financial is required to make quarterly (10-Q), annual (10-K) and, as necessary, 8-K filings with the SEC on legal and regulatory matters that relate to Ameriprise Financial and its affiliates. Copies of these filings may be obtained by accessing the SEC website at www.sec.gov.
There can be no assurance that these matters, or the adverse publicity associated with them, will not result in increased fund redemptions, reduced sale of fund shares or other adverse consequences to the Funds. Further, although we believe proceedings are not likely to have a material adverse effect on the Funds or the ability of Ameriprise Financial or its affiliates to perform under their contracts with the Funds, these proceedings are subject to uncertainties and, as such, we are unable to estimate the possible loss or range of loss that may result. An adverse outcome in one or more of these proceedings could result in adverse judgments, settlements, fines, penalties or other relief that could have a material adverse effect on the consolidated financial condition or results of operations of Ameriprise Financial.
Annual Report 2016
42
COLUMBIA SMALL CAP INDEX FUND
REPORT OF INDEPENDENT REGISTERED PUBLIC ACCOUNTING FIRM
To the Trustees of Columbia Funds Series Trust and the Shareholders of
Columbia Small Cap Index Fund
In our opinion, the accompanying statement of assets and liabilities, including the portfolio of investments, and the related statements of operations and of changes in net assets and the financial highlights present fairly, in all material respects, the financial position of Columbia Small Cap Index Fund (the "Fund," a series of Columbia Funds Series Trust) at February 29, 2016, and the results of its operations, the changes in its net assets and the financial highlights for each of the periods indicated, in conformity with accounting principles generally accepted in the United States of America. These financial statements and financial highlights (hereafter referred to as "financial statements") are the responsibility of the Fund's management. Our responsibility is to express an opinion on these financial statements based on our audits. We conducted our audits of these financial statements in accordance with the standards of the Public Company Accounting Oversight Board (United States). Those standards require that we plan and perform the audit to obtain reasonable assurance about whether the financial statements are free of material misstatement. An audit includes examining, on a test basis, evidence supporting the amounts and disclosures in the financial statements, assessing the accounting principles used and significant estimates made by management, and evaluating the overall financial statement presentation. We believe that our audits, which included confirmation of securities at February 29, 2016 by correspondence with the custodian, brokers and transfer agent, and the application of alternative auditing procedures where such confirmations had not been received, provide a reasonable basis for our opinion.
PricewaterhouseCoopers LLP
Minneapolis, MN
April 21, 2016
Annual Report 2016
43
COLUMBIA SMALL CAP INDEX FUND
FEDERAL INCOME TAX INFORMATION
(Unaudited)
The Fund hereby designates the following tax attributes for the fiscal year ended February 29, 2016. Shareholders will be notified in early 2017 of the amounts for use in preparing 2016 income tax returns.
Tax Designations:
| Qualified Dividend Income | | | 86.71 | % | |
| Dividends Received Deduction | | | 86.68 | % | |
Capital Gain Dividend | | $ | 252,242,054 | | |
Qualified Dividend Income. For taxable, non-corporate shareholders, the percentage of ordinary income distributed during the fiscal year that represents qualified dividend income subject to reduced tax rates.
Dividends Received Deduction. The percentage of ordinary income distributed during the fiscal year that qualifies for the corporate dividends received deduction.
Capital Gain Dividend. The Fund designates as a capital gain dividend the amount reflected above, or if subsequently determined to be different, the net capital gain of such fiscal period.
Annual Report 2016
44
COLUMBIA SMALL CAP INDEX FUND
Shareholders elect the Board that oversees the Fund's operations. The Board appoints officers who are responsible for day-to-day business decisions based on policies set by the Board. The following table provides basic biographical information about the Fund's Trustees, including their principal occupations during the past five years, although specific titles for individuals may have varied over the period. Under current Board policy, members generally may serve through the end of the calendar year in which they reach either the mandatory retirement age established by the Board or the fifteenth anniversary of the first Board meeting they attended as a member of the Board.
Trustees
Independent Trustees
Name,
Address,
Year of Birth | | Position Held With
the Funds and Length of
Service | | Principal Occupation(s)
During the Past Five Years
and Other Relevant
Professional Experience | | Number of
Funds in the
Columbia
Funds Complex
Overseen | | Other Directorships
Held by Trustee
During the Past
Five Years | |
Kathleen Blatz
901 S. Marquette Ave.
Minneapolis, MN 55402
1954 | | Trustee since 1/06 for RiverSource Funds and since 6/11 for Nations Funds | | Attorney; specializing in arbitration and mediation; Chief Justice, Minnesota Supreme Court, 1998-2006; Associate Justice, Minnesota Supreme Court, 1996-1998; Fourth Judicial District Court Judge, Hennepin County, 1994-1996; Attorney in private practice and public service, 1984-1993; State Representative, Minnesota House of Representatives, 1979-1993, which included service on the Tax and Financial Institutions and Insurance Committees | | | 124 | | | Trustee, BlueCross BlueShield of Minnesota (Chair of the Business Development Committee) since 2009; Chair of the Robina Foundation since August 2013 | |
Edward J. Boudreau, Jr.
901 S. Marquette Ave.
Minneapolis, MN 55402
1944 | | Trustee since 6/11 for RiverSource Funds and since 1/05 for Nations Funds | | Managing Director, E.J. Boudreau & Associates (consulting) since 2000; FINRA Industry Arbitrator, 2002-present; Chairman and Chief Executive Officer, John Hancock Funds (asset management), Chairman and Interested Trustee for open-end and closed-end funds offered by John Hancock, 1989-2000; John Hancock Life Insurance Company, including SVP and Treasurer and SVP Information Technology, 1968-1988 | | | 122 | | | Former Trustee, Boston Museum of Science (Chair of Finance Committee), 1985-2013; former Trustee, BofA Funds Series Trust (11 funds), 2005-2011 | |
Pamela G. Carlton
901 S. Marquette Ave.
Minneapolis, MN 55402
1954 | | Trustee since 7/07 for RiverSource Funds and since 6/11 for Nations Funds | | President, Springboard-Partners in Cross Cultural Leadership (consulting company) since 2003; Managing Director of US Equity Research, JP Morgan Chase, 1999-2003; Director of US Equity Research, Chase Asset Management, 1996-1999; Co-Director Latin America Research, 1993-1996, COO Global Research, 1992-1996, Co-Director of US Research, 1991-1992, Investment Banker, Morgan Stanley, 1982-1991 | | | 124 | | | Trustee, New York Presbyterian Hospital Board (Executive Committee and Chair of Human Resources Committee) since 1996 | |
Annual Report 2016
45
COLUMBIA SMALL CAP INDEX FUND
TRUSTEES AND OFFICERS (continued)
Independent Trustees (continued)
Name,
Address,
Year of Birth | | Position Held With
the Funds and Length of
Service | | Principal Occupation(s)
During the Past Five Years
and Other Relevant
Professional Experience | | Number of
Funds in the
Columbia
Funds Complex
Overseen | | Other Directorships
Held by Trustee
During the Past
Five Years | |
William P. Carmichael
901 S. Marquette Ave.
Minneapolis, MN 55402
1943 | | Trustee since 6/11 for RiverSource Funds and since 2003 for Nations Funds; Chair of the Board from 1/14-11/15 | | Retired; Co-founder, The Succession Fund (provides exit strategies to owners of privately held companies), 1998-2007; Adjunct Professor of Finance, Kelley School of Business, Indiana University, 1993-2007; Senior Vice President, Sara Lee Corporation, 1991-1993; Senior Vice President and Chief Financial Officer, Beatrice Foods Company, 1984-1990; Vice President, Esmark, Inc., 1973-1984; Associate, Price Waterhouse, 1968-1972 | | | 124 | | | Director, The Finish Line (athletic shoes and apparel) since July 2003; Director, International Textile Corp. since 2012; Director, hhgregg since May, 2015; former Director, Cobra Electronics Corporation (electronic equipment manufacturer), 1994-August 2014; former Director, Spectrum Brands, Inc. (consumer products), 2002-2009; former Director, Simmons Company (bedding), 2004-2010; former Trustee, BofA Funds Series Trust (11 funds), 2009-2011; former Director, McMoRan Exploration Company (oil and gas exploration and development), 2010-2013 | |
Patricia M. Flynn
901 S. Marquette Ave.
Minneapolis, MN 55402
1950 | | Trustee since 11/04 for RiverSource Funds and since 6/11 for Nations Funds | | Trustee Professor of Economics and Management, Bentley University since 1976 (also teaches and conducts research on corporate governance); Dean, McCallum Graduate School of Business, Bentley University, 1992-2002 | | | 124 | | | Trustee, MA Taxpayers Foundation since 1997; Board of Governors, Innovation Institute, MA Technology Collaborative since 2010 | |
William A. Hawkins
901 S. Marquette Ave.
Minneapolis, MN 55402
1942 | | Chair of the Board since 11/15; Trustee since 6/11 for RiverSource Funds and since 1/05 for Nations Funds | | Managing Director, Overton Partners (financial consulting) since August 2010; President and Chief Executive Officer, California General Bank, N.A., January 2008-August 2010; Operation Hope, COO, 2004-2007; IndyMac Bancorp, President, CBG, 1999-2003; American General Bank, President, 1997-1999; Griffin Financial Services, CEO, 1981-1997; The Griffin Funds, CEO, 1992-1998 | | | 124 | | | Former Trustee, BofA Funds Series Trust (11 funds), 2009-2015 | |
R. Glenn Hilliard
901 S. Marquette Ave.
Minneapolis, MN 55402
1943 | | Trustee since 6/11 for RiverSource Funds and since 1/05 for Nations Funds | | Chairman and Chief Executive Officer, Hilliard Group LLC (investing and consulting) since April 2003; Non-Executive Director & Chairman, CNO Financial Group, Inc. (insurance), 2003-2011; Chair & CEO, ING Americas, 1996-2003 | | | 122 | | | Chairman, BofA Funds Series Trust (11 funds); former Director, CNO Financial Group, Inc. (insurance), 2003-2011 | |
Annual Report 2016
46
COLUMBIA SMALL CAP INDEX FUND
TRUSTEES AND OFFICERS (continued)
Independent Trustees (continued)
Name,
Address,
Year of Birth | | Position Held With
the Funds and Length of
Service | | Principal Occupation(s)
During the Past Five Years
and Other Relevant
Professional Experience | | Number of
Funds in the
Columbia
Funds Complex
Overseen | | Other Directorships
Held by Trustee
During the Past
Five Years | |
Catherine James Paglia
901 S. Marquette Ave.
Minneapolis, MN 55402
1952 | | Trustee since 11/04 for RiverSource Funds and since 6/11 for Nations Funds | | Director, Enterprise Asset Management, Inc. (private real estate and asset management company) since September 1998; Managing Director and Partner, Interlaken Capital, Inc., 1989-1997; Managing Director, Morgan Stanley, 1982-1989; Vice President, Investment Banking, 1980-1982, Associate, Investment Banking, 1976-1980, Dean Witter Reynolds, Inc. | | | 124 | | | Director, Valmont Industries, Inc. (irrigation systems manufacturer) since 2012; Trustee, Carleton College (on the Investment Committee); Trustee, Carnegie Endowment for International Peace (on the Investment Committee) | |
Leroy C. Richie
901 S. Marquette Ave.
Minneapolis, MN 55402
1941 | | Trustee since 2000 for Seligman Funds, since 11/08 for RiverSource Funds and since 6/11 for Nations Funds | | Counsel, Lewis & Munday, P.C. (law firm) since 2004; Vice President and General Counsel, Automotive Legal Affairs, Chrysler Corporation, 1993-1997 | | | 122 | | | Lead Outside Director, Infinity Resources, Inc. (oil and gas exploration and production) since 1994; Lead Outside Director, Digital Ally, Inc. (digital imaging) since September 2005; Trustee, Marygrove College (Chair of Finance Committee) since 2007; former Director, OGE Energy Corp. (energy and energy services), 2007-2014 | |
Minor M. Shaw
901 S. Marquette Ave.
Minneapolis, MN 55402
1947 | | Trustee since 6/11 for RiverSource Funds and since 2003 for Nations Funds | | President, Micco LLC (private investments) since 2011; President, Micco Corp. (family investment business), 1998-2011 | | | 124 | | | Director, Piedmont Natural Gas; Director, BlueCross BlueShield of South Carolina since April 2008; Chair of the Duke Endowment; Director, National Association of Corporate Directors, Carolinas Chapter since 2013; Chair of Greenville — Spartanburg Airport Commission; former Trustee, BofA Funds Series Trust (11 funds), 2003-2011 | |
Alison Taunton-Rigby
901 S. Marquette Ave.
Minneapolis, MN 55402
1944 | | Trustee since 11/02 for RiverSource Funds and since 6/11 for Nations Funds | | Managing Director, Forester Biotech (consulting), 2001-2003; Chief Executive Officer and Director, RiboNovix, Inc., (biotechnology), 2003-2010; President and Chief Executive Officer of CMT Inc., 2001-2003; Aquila Biopharmaceuticals Inc., 1996-2000; Cambridge Biotech Corporation, 1995-1996; Mitotix Inc., 1993-1994 | | | 124 | | | Director, Abt Associates (government contractor) since 2001; Director, Boston Children's Hospital since 2002; Director, Healthways, Inc. (health and well-being solutions) since 2005; Director, ICI Mutual Insurance Company since 2011 | |
Annual Report 2016
47
COLUMBIA SMALL CAP INDEX FUND
TRUSTEES AND OFFICERS (continued)
Interested Trustee Not Affiliated with Investment Manager*
Name,
Address,
Year of Birth | | Position Held With
Funds and Length of
Service | | Principal Occupation(s)
During Past Five Years
and Other Relevant
Professional Experience | | Number of
Funds in the
Fund Family
Overseen by
Board Member | | Other Present or Past
Directorships/
Trusteeships
(Within Past 5 Years) | |
Anthony M. Santomero
901 S. Marquette Ave.
Minneapolis, MN 55402
1946 | | Trustee since 6/11 for RiverSource Funds and since 1/08 for Nations Funds | | Richard K. Mellon Professor Emeritus of Finance, The Wharton School, University of Pennsylvania since 2002; Senior Advisor, McKinsey & Company (consulting), 2006-2008; President, Federal Reserve Bank of Philadelphia, 2000-2006; Professor of Finance, The Wharton School, University of Pennsylvania, 1972-2002 | | | 122 | | | Trustee, Penn Mutual Life Insurance Company since March 2008; Director, Renaissance Reinsurance Ltd. since May 2008; Director, Citigroup Inc. since 2009; Director, Citibank, N.A. since 2009; former Trustee, BofA Funds Series Trust (11 funds), 2008-2011 | |
* Dr. Santomero is not an affiliated person of the Investment Manager or Ameriprise Financial. However, he is currently deemed by the Funds to be an "interested person" (as defined in the 1940 Act) of the Funds because he serves as a Director of Citigroup Inc. and Citibank, N.A., companies that may directly or through subsidiaries and affiliates engage from time-to-time in brokerage execution, principal transactions and lending relationships with the Funds or accounts advised/managed by the Investment Manager.
Annual Report 2016
48
COLUMBIA SMALL CAP INDEX FUND
TRUSTEES AND OFFICERS (continued)
Interested Trustee Affiliated with Investment Manager*
Name,
Address,
Year of Birth | | Position Held With
the Funds and Length of
Service | | Principal Occupation(s)
During Past Five Years
and Other Relevant
Professional Experience | | Number of
Funds in the
Columbia
Funds Complex
Overseen | | Other Directorships
Held by Trustee
During the Past
Five Years | |
William F. Truscott
c/o Columbia Management Investment Advisers, LLC,
225 Franklin St.
Boston, MA 02110
1960 | | Trustee since 11/01 for RiverSource Funds and since 6/11 for Nations Funds; Senior Vice President since 2002 for RiverSource Funds and since 5/10 for Nations Funds | | Chairman of the Board and President, Columbia Management Investment Advisers, LLC since May 2010 and February 2012, respectively (previously President and Chief Investment Officer, 2001-April 2010); Chief Executive Officer, Global Asset Management, Ameriprise Financial, Inc. since September 2012 (previously Chief Executive Officer, U.S. Asset Management & President, Annuities, May 2010-September 2012 and President — U.S. Asset Management and Chief Investment Officer, 2005-April 2010); Director and Chief Executive Officer, Columbia Management Investment Distributors, Inc. since May 2010 and February 2012, respectively (previously Chairman of the Board and Chief Executive Officer, 2006-April 2010); Chairman of the Board and Chief Executive Officer, RiverSource Distributors, Inc. since 2006; Director, Threadneedle Asset Management Holdings, SARL since 2014; President and Chief Executive Officer, Ameriprise Certificate Company, 2006-August 2012. | | | 182 | | | Chairman of the Board, Columbia Management Investment Advisers, LLC since May 2010; Director, Columbia Management Investment Distributors, Inc. since May 2010; Former Director, Ameriprise Certificate Company, 2006-January 2013 | |
* Interested person (as defined under the 1940 Act) by reason of being an officer, director, security holder and/or employee of the Investment Manager or Ameriprise Financial.
The Statement of Additional Information has additional information about the Fund's Board members and is available, without charge, upon request by calling 800.345.6611; contacting your financial intermediary; or visiting columbiathreadneedle.com/us.
Annual Report 2016
49
COLUMBIA SMALL CAP INDEX FUND
TRUSTEES AND OFFICERS (continued)
The Board has appointed officers who are responsible for day-to-day business decisions based on policies it has established. The officers serve at the pleasure of the Board. The following table provides basic information about the Officers of the Fund, including principal occupations during the past five years, although their specific titles may have varied over the period. In addition to Mr. Truscott, who is Senior Vice President, the Fund's other officers are:
Fund Officers
Name,
Address and
Year of Birth | | Position and Year
First Appointed to
Position for any Fund
in the Columbia
Funds Complex or a
Predecessor Thereof | | Principal Occupation(s) During Past Five Years | |
Christopher O. Petersen
5228 Ameriprise
Financial Center
Minneapolis, MN 55474
Born 1970 | | President and Principal Executive Officer (2015) | | Vice President and Lead Chief Counsel, Ameriprise Financial, Inc. since January 2015 (previously, Vice President and Chief Counsel January 2010-December 2014; and Vice President and Group Counsel or Counsel 2004-January 2010); officer of Columbia Funds and affiliated funds since 2007. | |
Michael G. Clarke
225 Franklin Street
Boston, MA 02110
Born 1969 | | Treasurer (2011), Chief Financial Officer (2009) and Chief Accounting Officer (2015) | | Vice President — Mutual Fund Administration, Columbia Management Investment Advisers, LLC, since May 2010; Managing Director of Fund Administration, Columbia Management Advisors, LLC, September 2004-April 2010; senior officer of Columbia Funds and affiliated funds since 2002. | |
Paul B. Goucher
100 Park Avenue
New York, NY 10017
Born 1968 | | Senior Vice President (2011), Chief Legal Officer (2015) and Assistant Secretary (2008) | | Vice President and Lead Chief Counsel, Ameriprise Financial, Inc. since November 2008 and January 2013, respectively (previously Chief Counsel, January 2010-January 2013 and Group Counsel, November 2008-January 2010). | |
Thomas P. McGuire
225 Franklin Street
Boston, MA 02110
Born 1972 | | Senior Vice President and Chief Compliance Officer (2012) | | Vice President — Asset Management Compliance, Ameriprise Financial, Inc., since May 2010; Chief Compliance Officer, Ameriprise Certificate Company since September 2010; Compliance Executive, Bank of America, 2005-April 2010. | |
Colin Moore
225 Franklin Street
Boston, MA 02110
Born 1958 | | Senior Vice President (2010) | | Executive Vice President and Global Chief Investment Officer, Ameriprise Financial, Inc., since July 2013; Director and Global Chief Investment Officer, Columbia Management Investment Advisers, LLC since May 2010; Manager, Managing Director and Chief Investment Officer, Columbia Management Advisors, LLC, 2007-April 2010. | |
Michael E. DeFao
225 Franklin Street
Boston, MA 02110
Born 1968 | | Vice President (2011) and Assistant Secretary (2010) | | Vice President and Chief Counsel, Ameriprise Financial, Inc. since May 2010; Associate General Counsel, Bank of America, 2005-April 2010. | |
Amy Johnson
5228 Ameriprise
Financial Center
Minneapolis, MN 55474
Born 1965 | | Vice President (2006) | | Managing Director and Chief Operating Officer, Columbia Management Investment Advisers, LLC since May 2010 (previously Chief Administrative Officer, 2009-April 2010, and Vice President — Asset Management and Trust Company Services, 2006-2009). | |
Lyn Kephart-Strong
5228 Ameriprise
Financial Center
Minneapolis, MN 55474
Born 1960 | | Vice President (2015) | | President, Columbia Management Investment Services Corp. since October 2014; Vice President & Resolution Officer, Ameriprise Trust Company since August 2009; President, RiverSource Service Corporation 2004-2010. | |
Ryan C. Larrenaga
225 Franklin Street
Boston, MA 02110
Born 1970 | | Vice President and Secretary (2015) | | Vice President and Group Counsel, Ameriprise Financial, Inc. since August 2011 (previously, Counsel from May 2010 to August 2011); Assistant General Counsel, Bank of America, 2005-April 2010; officer of Columbia Funds and affiliated funds since 2005. | |
Annual Report 2016
50
COLUMBIA SMALL CAP INDEX FUND
IMPORTANT INFORMATION ABOUT THIS REPORT
Each fund mails one shareholder report to each shareholder address. If you would like more than one report, please call shareholder services at 800.345.6611 and additional reports will be sent to you.
The policy of the Board is to vote the proxies of the companies in which each fund holds investments consistent with the procedures as stated in the Statement of Additional Information (SAI). You may obtain a copy of the SAI without charge by calling 800.345.6611; contacting your financial intermediary; visiting columbiathreadneedle.com/us; or searching the website of the Securities and Exchange Commission (SEC) at sec.gov. Information regarding how each fund voted proxies relating to portfolio securities is filed with the SEC by August 31st for the most recent 12-month period ending June 30th of that year, and is available without charge by visiting columbiathreadneedle.com/us, or searching the website of the SEC at sec.gov.
Each fund files a complete schedule of portfolio holdings with the SEC for the first and third quarters of each fiscal year on Form N-Q. Each fund's Form N-Q is available on the SEC's website at sec.gov and may be reviewed and copied at the SEC's Public Reference Room in Washington, D.C. Information on the operation of the Public Reference Room may be obtained by calling 800.SEC.0330. Each fund's complete schedule of portfolio holdings, as filed on Form N-Q, can also be obtained without charge, upon request, by calling 800.345.6611.
Annual Report 2016
51
Columbia Small Cap Index Fund
P.O. Box 8081
Boston, MA 02266-8081

This information is for use with concurrent or prior delivery of a fund prospectus. Please read and consider the investment objectives, risks, charges and expenses for any fund carefully before investing. For a prospectus and summary prospectus, which contains this and other important information about the Fund, go to columbiathreadneedle.com/us. The Fund is distributed by Columbia Management Investment Distributors, Inc., member FINRA, and managed by Columbia Management Investment Advisers, LLC.
Columbia Threadneedle Investments (Columbia Threadneedle) is the global brand name of the Columbia and Threadneedle group of companies.
All rights reserved. Columbia Management Investment Distributors, Inc., 225 Franklin Street, Boston, MA 02110-2804
© 2016 Columbia Management Investment Advisers, LLC.
columbiathreadneedle.com/us
ANN228_02_F01_(04/16)

ANNUAL REPORT
February 29, 2016

COLUMBIA LARGE CAP ENHANCED CORE FUND

ABOUT COLUMBIA THREADNEEDLE INVESTMENTS
Columbia Threadneedle Investments is a leading global asset management group that provides a broad range of actively managed investment strategies and solutions for individual, institutional and corporate clients around the world.
With more than 2,000 people, including over 450 investment professionals based in North America, Europe and Asia, we manage $472 billion* of assets across developed and emerging market equities, fixed income, asset allocation solutions and alternatives. We are the 13th largest manager of long-term mutual fund assets in the U.S.** and the 4th largest manager of retail funds in the U.K.***
Our priority is the investment success of our clients. We aim to deliver the investment outcomes they expect through an investment approach that is team-based, performance-driven and risk-aware. Our culture is dynamic and interactive. By sharing our insights across asset classes and geographies, we generate richer perspectives on global, regional and local investment landscapes. The ability to exchange and debate investment ideas in a collaborative environment enriches our teams' investment processes. More importantly, it results in better informed investment decisions for our clients.
Columbia funds are distributed by Columbia Management Investment Distributors, Inc., member FINRA, and managed by Columbia Management Investment Advisers, LLC.
Columbia Threadneedle Investments (Columbia Threadneedle) is the global brand name of the Columbia and Threadneedle group of companies.
* In U.S. dollars as of December 31, 2015. Source: Ameriprise Q4 Earnings Release. Includes all assets managed by entities in the Columbia and Threadneedle groups of companies. Contact us for more current data.
** Source: ICI as of December 31, 2015 for Columbia Management Investment Advisers, LLC.
*** Source: Investment Association as of September 2015 for Threadneedle Asset Management Limited.
© 2016 Columbia Management Investment Advisers, LLC. All rights reserved.
Not part of the shareholder report
Investment strategies to help meet investor needs
We are committed to helping investors navigate financial challenges to reach their desired outcomes. The possibilities are endless.
Your success is our priority.
Retire comfortably
Fund college or higher education
Leave a legacy
Generate an appropriate stream of income in retirement
Traditional approaches to income may no longer be adequate — and they may no longer provide the diversification benefits they once did. Investors need to rethink how they generate retirement income.
Worried about running out of income? You are not alone.
Navigate a changing interest rate environment
Even in today's challenging interest rate environment, it's still possible to navigate markets and achieve your goals.
Make investment choices designed specifically for this market environment.
Maximize after-tax returns
In an environment where what you keep is more important than what you earn, municipal bonds can help mitigate higher taxes while providing attractive yields compared to other investment options.
You've worked too hard building your wealth to lose it to taxes.
Grow assets to achieve financial goals
Finding growth opportunities in today's complex market environment requires strong research capabilities, creative thinking and a disciplined approach.
Do your investments deliver the portfolio growth you need?
Ease the impact of volatile markets
With increasing concerns about market volatility, investors should consider diversifying their portfolios with non-traditional holdings.
Interested in turning volatility into opportunity?
To find out more, contact your financial professional, call 800.426.3750 or visit columbiathreadneedle.com/us
Not part of the shareholder report
 Dear Shareholder,
Today's investors are typically focused on outcomes, like living a certain retirement lifestyle, paying for college education or building a legacy. But in today's complex global investment landscape, even simple goals are not easily achieved.
At Columbia Threadneedle Investments, we aspire to help satisfy five core needs of today's investors:
n Generate an appropriate stream of income in retirement
Traditional approaches to generating income may not provide the diversification benefits they once did, and they may actually introduce unwanted risk in today's market. To seek to improve your potential to live comfortably long term, we endeavor to pursue investments that explore less traveled paths to income.
n Navigate a changing interest rate environment
Today's uncertain market environment includes the prospect of a rise in interest rates. Blending traditional investments with non-traditional or alternative products may help protect your wealth during periods of volatility. We can attempt to help strengthen your portfolio with agile products designed to take on the market's ups and downs.
n Maximize after-tax returns
In an environment where what you keep may be more important than what you earn, municipal bonds can help mitigate high tax burdens while providing potentially attractive yields. Our state and federal tax-exempt products are aimed at helping investors manage risk, minimize the fluctuation of capital and grow wealth on a more tax-efficient basis.
n Grow assets to achieve financial goals
We believe that finding and protecting growth comes from a disciplined security selection process designed to create excess return. Our goal is to provide investment solutions built to help you face today's market challenges and grow your assets at each crossroad of your journey.
n Ease the impact of volatile markets
Despite a bull market run that has benefited many investors over the past several years, it's important to remember the lessons of 2008 and the value that a well-diversified portfolio may provide through times of market volatility. We are here to help you hold onto the savings you have worked tirelessly to amass, and to provide you the best opportunity to maintain your standard of living regardless of market conditions.
Find out today how we can help you confidently invest to realize your dreams. Please visit us at blog.columbiathreadneedleus.com/our-best-ideas to learn more about our unique investment solutions.
The world is constantly changing, but our priority remains the same: to help you secure your finances, meet your goals and achieve success. Thank you for your continued investment with us.
Sincerely,

Christopher O. Petersen
President, Columbia Funds
Investors should consider the investment objectives, risks, charges and expenses of a mutual fund carefully before investing. For a free prospectus and summary prospectus, which contains this and other important information about a fund, visit columbiathreadneedle.com/us. The prospectus should be read carefully before investing.
Columbia Funds are distributed by Columbia Management Investment Distributors, Inc., member FINRA, and managed by Columbia Management Investment Advisers, LLC.
© 2016 Columbia Management Investment Advisers, LLC. All rights reserved.
COLUMBIA LARGE CAP ENHANCED CORE FUND
Performance Overview | | | 2 | | |
Manager Discussion of Fund Performance | | | 4 | | |
Understanding Your Fund's Expenses | | | 7 | | |
Portfolio of Investments | | | 8 | | |
Statement of Assets and Liabilities | | | 14 | | |
Statement of Operations | | | 16 | | |
Statement of Changes in Net Assets | | | 17 | | |
Financial Highlights | | | 19 | | |
Notes to Financial Statements | | | 26 | | |
Report of Independent Registered Public Accounting Firm | | | 35 | | |
Federal Income Tax Information | | | 36 | | |
Trustees and Officers | | | 37 | | |
Important Information About This Report | | | 43 | | |
Fund Investment Manager
Columbia Management Investment
Advisers, LLC
225 Franklin Street
Boston, MA 02110
Fund Distributor
Columbia Management Investment
Distributors, Inc.
225 Franklin Street
Boston, MA 02110
Fund Transfer Agent
Columbia Management Investment
Services Corp.
P.O. Box 8081
Boston, MA 02266-8081
For more information about any of the funds, please visit columbiathreadneedle.com/us or call 800.345.6611. Customer Service Representatives are available to answer your questions Monday through Friday from 8 a.m. to 7 p.m. Eastern time.
The views expressed in this report reflect the current views of the respective parties. These views are not guarantees of future performance and involve certain risks, uncertainties and assumptions that are difficult to predict, so actual outcomes and results may differ significantly from the views expressed. These views are subject to change at any time based upon economic, market or other conditions and the respective parties disclaim any responsibility to update such views. These views may not be relied on as investment advice and, because investment decisions for a Columbia fund are based on numerous factors, may not be relied on as an indication of trading intent on behalf of any particular Columbia fund. References to specific securities should not be construed as a recommendation or investment advice.
COLUMBIA LARGE CAP ENHANCED CORE FUND
Performance Summary
n Columbia Large Cap Enhanced Core Fund (the Fund) Class A shares returned -8.94% for the 12-month period that ended February 29, 2016.
n The Fund lagged its benchmark, the S&P 500 Index, which returned -6.19% for the same period.
n Stock selection, especially in the consumer discretionary, financials, energy and materials sectors, generally accounted for the Fund's shortfall relative to the benchmark.
Average Annual Total Returns (%) (for period ended February 29, 2016)
| | | Inception | | 1 Year | | 5 Years | | 10 Years | |
Class A | | 07/31/96 | | | -8.94 | | | | 10.61 | | | | 6.21 | | |
Class I* | | 09/27/10 | | | -8.60 | | | | 11.02 | | | | 6.42 | | |
Class R | | 01/23/06 | | | -9.18 | | | | 10.34 | | | | 5.94 | | |
Class R4* | | 07/01/15 | | | -8.82 | | | | 10.64 | | | | 6.22 | | |
Class R5* | | 06/25/14 | | | -8.62 | | | | 10.75 | | | | 6.27 | | |
Class Y* | | 07/15/09 | | | -8.59 | | | | 11.03 | | | | 6.48 | | |
Class Z | | 07/31/96 | | | -8.73 | | | | 10.89 | | | | 6.47 | | |
S&P 500 Index | | | | | -6.19 | | | | 10.13 | | | | 6.44 | | |
All results shown assume reinvestment of distributions during the period. Returns do not reflect the deduction of taxes that a shareholder may pay on Fund distributions or on the redemption of Fund shares. Performance results reflect the effect of any fee waivers or reimbursements of Fund expenses by Columbia Management Investment Advisers, LLC and/or any of its affiliates. Absent these fee waivers or expense reimbursement arrangements, performance results would have been lower.
The performance information shown represents past performance and is not a guarantee of future results. The investment return and principal value of your investment will fluctuate so that your shares, when redeemed, may be worth more or less than their original cost. Current performance may be lower or higher than the performance information shown. You may obtain performance information current to the most recent month-end by contacting your financial intermediary, visiting columbiathreadneedle.com/us or calling 800.345.6611.
*The returns shown for periods prior to the share class inception date (including returns for the Life of the Fund, if shown, which are since Fund inception) include the returns of the Fund's oldest share class. Since the Fund launched more than one share class at its inception, Class A shares were used. These returns are adjusted to reflect any higher class-related operating expenses of the newer share classes, as applicable. Please visit columbiathreadneedle.com/us/investment-products/mutual-funds/appended-performance for more information.
The S&P 500 Index, an unmanaged index, measures the performance of 500 widely held, large-capitalization U.S. stocks and is frequently used as a general measure of market performance.
Indices are not available for investment, are not professionally managed and do not reflect sales charges, fees, brokerage commissions, taxes or other expenses of investing. Securities in the Fund may not match those in an index.
Annual Report 2016
2
COLUMBIA LARGE CAP ENHANCED CORE FUND
PERFORMANCE OVERVIEW (continued)
Performance of a Hypothetical $10,000 Investment (March 1, 2006 – February 29, 2016)
The chart above shows the change in value of a hypothetical $10,000 investment in Class A shares of Columbia Large Cap Enhanced Core Fund during the stated time period, and does not reflect the deduction of taxes that a shareholder may pay on Fund distributions or on the redemption of Fund shares.
Annual Report 2016
3
COLUMBIA LARGE CAP ENHANCED CORE FUND
MANAGER DISCUSSION OF FUND PERFORMANCE
Portfolio Management
Brian Condon, CFA
Peter Albanese
Morningstar Style BoxTM

The Morningstar Style BoxTM is based on a fund's portfolio holdings. For equity funds, the vertical axis shows the market capitalization of the stocks owned, and the horizontal axis shows investment style (value, blend, or growth). Information shown is based on the most recent data provided by Morningstar.
© 2016 Morningstar, Inc. All rights reserved. The Morningstar information contained herein: (1) is proprietary to Morningstar and/or its content providers; (2) may not be copied or distributed; and (3) is not warranted to be accurate, complete or timely. Neither Morningstar nor its content providers are responsible for any damages or losses arising from any use of this information.
Top Ten Holdings (%)
(at February 29, 2016) | |
Apple, Inc. | | | 4.0 | | |
Johnson & Johnson | | | 2.6 | | |
Facebook, Inc., Class A | | | 2.3 | | |
JPMorgan Chase & Co. | | | 2.0 | | |
Verizon Communications, Inc. | | | 2.0 | | |
Pfizer, Inc. | | | 1.9 | | |
Home Depot, Inc. (The) | | | 1.8 | | |
Cisco Systems, Inc. | | | 1.7 | | |
Philip Morris International, Inc. | | | 1.6 | | |
Comcast Corp., Class A | | | 1.6 | | |
Percentages indicated are based upon total investments (excluding Money Market Funds).
For further detail about these holdings, please refer to the section entitled "Portfolio of Investments."
Fund holdings are as of the date given, are subject to change at any time, and are not recommendations to buy or sell any security.
For the 12-month period that ended February 29, 2016, the Fund's Class A shares returned -8.94%. The Fund lagged its benchmark, the S&P 500 Index, which returned -6.19%. Stock selection, especially in the consumer discretionary, financials, energy and materials sectors, generally accounted for the Fund's shortfall relative to the benchmark.
Mounting Global Pressures Weighed on Markets
Around the world, investors turned cautious over the 12-month period that ended February 29, 2016, as lackluster economic growth, contentious geopolitical conflicts and a shift in U.S. monetary policy weighed on confidence. Subpar global economic growth continued for a fourth straight year, with China's slowdown heading the list of disappointments. Conflicts in the Middle East and terrorism, both at home and abroad, heightened security fears. Plummeting oil prices and a rising dollar rounded the list of mounting pressures. A widening trade deficit also took a significant bite out of growth.
Despite these setbacks, the U.S. economy continued to expand for the seventh consecutive year. U.S. labor markets recovered and consumer spending strengthened. The housing market inched forward, although sales slipped near the end of the period as new industry regulation led to longer closing periods. Manufacturing activity softened, putting a damper on growth.
Modest stock market gains in the first half of the period were wiped out in the second half. The S&P 500 Index, the Fund's benchmark and a broad measure of U.S. stock market performance, returned -6.19%, including dividends. Large-cap stocks held up better than mid- and small-cap stocks and growth stocks held up considerably better than value stocks, although both groups lost ground. Among large-cap stocks, the telecommunication services sector led the market, followed by utilities and consumer staples stocks. The energy sector, the period's worst performer, was down more than 20%.
In December 2015, the Federal Reserve (the Fed) raised the target range of its benchmark interest rate by a quarter of a point, ending a lengthy debate about whether the economy was strong enough to withstand higher borrowing costs. Mixed economic signals early in 2016 put additional rate hikes on hold — at least for now.
Stock Selection Models Delivered Mixed Results
We divide the metrics for our stock selection model into three broad categories: valuation (fundamental measures, such as earnings and cash flow, relative to market values), catalyst (price momentum and business momentum) and quality (quality of earnings and financial strength). We then rank the securities within a sector/industry from 1 (most attractive) to 5 (least attractive) based upon the metrics within these categories. For the period, the quality and catalyst composites performed best, and the valuation composite detracted from results. The model performed best in identifying stocks rated "2" that outperformed and stocks that rated "5" that underperformed. The Fund's highest exposure was to stocks rated "1," for which the model had mixed results.
Annual Report 2016
4
COLUMBIA LARGE CAP ENHANCED CORE FUND
MANAGER DISCUSSION OF FUND PERFORMANCE (continued)
The Fund's strategy is to keep sector weights in line with the benchmark, so performance is primarily driven by stock selection. Stock selection was strongest in the industrials and information technology sectors and weakest in the consumer discretionary, financials, energy and materials sectors.
Contributors
Security selection drove performance relative to the benchmark. Significant positions in NVIDIA, VeriSign and Tyson Foods made a substantial positive contribution to returns relative to the benchmark. NVIDIA is a leading supplier of graphics processing units (GPUs) and platforms for gaming, enterprise graphics, automotive and datacenter and cloud visual computing applications. NVIDIA's revenues and earnings exceeded expectations, fueled by the strength of new video game releases. Anticipation was also high for the 2015 holiday season, with video game developers releasing a new suite of games, including Star Wars Battlefront, Call of Duty - Black Ops III, Rainbow Six and Fallout Four. These highly anticipated games had high graphical requirements, which had the potential to increase demand for gaming platforms, personal computers, and — by extension — for NVIDIA GPU sales.
VeriSign is a global provider of domain name registry services and Internet security, enabling internet navigation for domain names and providing protection for websites and enterprises around the world. New domain name (.com/.net) additions exceeded the high end of the guided range, and the fourth quarter of 2015 represented a record for the company. It issued a statement indicating that the source of increased demand appeared to be China, and that possible drivers included government initiatives and regulation, among others.
Tyson Foods is a leading global protein and food-production company that operates in four primary segments: chicken, beef, pork and prepared foods. Tyson Foods stock rallied largely as the company raised its guidance on 2016 earnings per share. The company announced expectations for higher synergies from its acquisition of Hillshire Brands, highlighted its share repurchase plans and raised its estimate for its chicken products, despite current softness in the commodity market.
Detractors
Stock selection was weakest in consumer discretionary, financials, energy and materials sectors. The Fund's three top detractors from results were Navient, Transocean and ConocoPhillips. Navient, the spin-off company of SLM, a leading education loan management, servicing and asset recovery company came under pressure after it announced weaker-than-expected earnings in the second quarter of 2015, followed by reduced full-year guidance in July. A subsequent ratings review by Moody's and Fitch heightened regulatory focus on student loan servicers and accelerated the selloff of Navient shares.
Transocean is an international provider of offshore contract drilling services for oil and gas wells. The offshore rig market continued to deteriorate, given the lack of demand, and the company suffered from customer complaints about service and reliability.
Portfolio Breakdown (%)
(at February 29, 2016) | |
Common Stocks | | | 98.0 | | |
Money Market Funds | | | 2.0 | | |
Total | | | 100.0 | | |
Percentages indicated are based upon total investments. The Fund's portfolio composition is subject to change.
Equity Sector Breakdown (%)
(at February 29, 2016) | |
Consumer Discretionary | | | 12.6 | | |
Consumer Staples | | | 10.6 | | |
Energy | | | 5.9 | | |
Financials | | | 15.2 | | |
Health Care | | | 14.9 | | |
Industrials | | | 10.6 | | |
Information Technology | | | 20.8 | | |
Materials | | | 2.5 | | |
Telecommunication Services | | | 3.2 | | |
Utilities | | | 3.7 | | |
Total | | | 100.0 | | |
Percentages indicated are based upon total equity investments. The Fund's portfolio composition is subject to change.
Investment Risks
Market risk may affect a single issuer, sector of the economy, industry or the market as a whole. Investing in derivatives is a specialized activity that involves special risks, which may result in significant losses. The Fund's net value will generally decline when the performance of its targeted index declines. See the Fund's prospectus for information on these and other risks.
Annual Report 2016
5
COLUMBIA LARGE CAP ENHANCED CORE FUND
MANAGER DISCUSSION OF FUND PERFORMANCE (continued)
ConocoPhillips is an independent oil and gas exploration and production company. The collapse in commodity prices weakened revenues and earnings, but investors responded most negatively to a management decision to cut its dividend by 66%.
Investment Discipline Based on Stock Selection Model
Regardless of the economic environment, we maintain our investment discipline, which is linked to the Fund's quantitative stock selection model. Consequently, we do not rely on macroeconomic scenarios or market outlooks to choose securities. We do not try to predict when equities, as an asset class, will perform well or when they will perform poorly. Instead, we seek to keep the Fund substantially invested at all times in companies that meet our stock selection criteria: Companies with attractive valuations relative to their peers, with strong business and market momentum and good earnings quality and financial strength.
Annual Report 2016
6
COLUMBIA LARGE CAP ENHANCED CORE FUND
UNDERSTANDING YOUR FUND'S EXPENSES
(Unaudited)
As an investor, you incur two types of costs. There are transaction costs, which may include redemption fees. There are also ongoing costs, which generally include management fees, distribution and/or service fees, and other fund expenses. The following information is intended to help you understand your ongoing costs (in dollars) of investing in the Fund and to help you compare these costs with the ongoing costs of investing in other mutual funds.
Analyzing Your Fund's Expenses
To illustrate these ongoing costs, we have provided examples and calculated the expenses paid by investors in each share class of the Fund during the period. The actual and hypothetical information in the table is based on an initial investment of $1,000 at the beginning of the period indicated and held for the entire period. Expense information is calculated two ways and each method provides you with different information. The amount listed in the "Actual" column is calculated using the Fund's actual operating expenses and total return for the period. You may use the Actual information, together with the amount invested, to estimate the expenses that you paid over the period. Simply divide your account value by $1,000 (for example, an $8,600 account value divided by $1,000 = 8.6), then multiply the results by the expenses paid during the period under the "Actual" column. The amount listed in the "Hypothetical" column assumes a 5% annual rate of return before expenses (which is not the Fund's actual return) and then applies the Fund's actual expense ratio for the period to the hypothetical return. You should not use the hypothetical account values and expenses to estimate either your actual account balance at the end of the period or the expenses you paid during the period. See "Compare With Other Funds" below for details on how to use the hypothetical data.
Compare With Other Funds
Since all mutual funds are required to include the same hypothetical calculations about expenses in shareholder reports, you can use this information to compare the ongoing cost of investing in the Fund with other funds. To do so, compare the hypothetical example with the 5% hypothetical examples that appear in the shareholder reports of other funds. As you compare hypothetical examples of other funds, it is important to note that hypothetical examples are meant to highlight the ongoing costs of investing in a fund only and do not reflect any transaction costs, such as redemption or exchange fees. Therefore, the hypothetical calculations are useful in comparing ongoing costs only, and will not help you determine the relative total costs of owning different funds. If transaction costs were included in these calculations, your costs would be higher.
September 1, 2015 – February 29, 2016
| | | Account Value at the Beginning
of the Period ($) | | Account Value at the End of the
Period ($) | | Expenses Paid During the
Period ($) | | Fund's Annualized
Expense Ratio (%) | |
| | | Actual | | Hypothetical | | Actual | | Hypothetical | | Actual | | Hypothetical | | Actual | |
Class A | | | 1,000.00 | | | | 1,000.00 | | | | 976.00 | | | | 1,020.39 | | | | 4.42 | | | | 4.52 | | | | 0.90 | | |
Class I | | | 1,000.00 | | | | 1,000.00 | | | | 977.70 | | | | 1,022.38 | | | | 2.46 | | | | 2.51 | | | | 0.50 | | |
Class R | | | 1,000.00 | | | | 1,000.00 | | | | 974.40 | | | | 1,019.14 | | | | 5.65 | | | | 5.77 | | | | 1.15 | | |
Class R4 | | | 1,000.00 | | | | 1,000.00 | | | | 976.80 | | | | 1,021.63 | | | | 3.19 | | | | 3.27 | | | | 0.65 | | |
Class R5 | | | 1,000.00 | | | | 1,000.00 | | | | 977.80 | | | | 1,022.13 | | | | 2.70 | | | | 2.77 | | | | 0.55 | | |
Class Y | | | 1,000.00 | | | | 1,000.00 | | | | 977.80 | | | | 1,022.38 | | | | 2.46 | | | | 2.51 | | | | 0.50 | | |
Class Z | | | 1,000.00 | | | | 1,000.00 | | | | 977.00 | | | | 1,021.63 | | | | 3.20 | | | | 3.27 | | | | 0.65 | | |
Expenses paid during the period are equal to the annualized expense ratio for each class as indicated above, multiplied by the average account value over the period and then multiplied by the number of days in the Fund's most recent fiscal half year and divided by 366.
Expenses do not include fees and expenses incurred indirectly by the Fund from its investment in underlying funds, including affiliated and non-affiliated pooled investment vehicles, such as mutual funds and exchange-traded funds.
Had Columbia Management Investment Advisers, LLC and/or certain of its affiliates not waived/reimbursed certain fees and expenses, account value at the end of the period would have been reduced.
Annual Report 2016
7
COLUMBIA LARGE CAP ENHANCED CORE FUND
PORTFOLIO OF INVESTMENTS
February 29, 2016
(Percentages represent value of investments compared to net assets)
Common Stocks 97.9%
Issuer | | Shares | | Value ($) | |
CONSUMER DISCRETIONARY 12.3% | |
Automobiles 1.0% | |
Ford Motor Co. | | | 359,600 | | | | 4,498,596 | | |
Distributors 0.3% | |
Genuine Parts Co. | | | 17,700 | | | | 1,595,655 | | |
Hotels, Restaurants & Leisure 1.8% | |
Carnival Corp. | | | 88,000 | | | | 4,220,480 | | |
Darden Restaurants, Inc. | | | 62,900 | | | | 4,018,052 | | |
Total | | | | | 8,238,532 | | |
Internet & Catalog Retail 1.0% | |
Amazon.com, Inc.(a) | | | 8,400 | | | | 4,641,168 | | |
Media 2.6% | |
Comcast Corp., Class A | | | 125,500 | | | | 7,245,115 | | |
News Corp., Class A | | | 310,900 | | | | 3,363,938 | | |
Viacom, Inc., Class B | | | 10,800 | | | | 397,980 | | |
Walt Disney Co. (The) | | | 7,300 | | | | 697,296 | | |
Total | | | | | 11,704,329 | | |
Multiline Retail 1.1% | |
Target Corp. | | | 65,500 | | | | 5,138,475 | | |
Specialty Retail 4.5% | |
Best Buy Co., Inc. | | | 125,300 | | | | 4,058,467 | | |
GameStop Corp., Class A | | | 88,900 | | | | 2,739,898 | | |
Home Depot, Inc. (The) | | | 65,800 | | | | 8,167,096 | | |
Lowe's Companies, Inc. | | | 77,700 | | | | 5,247,081 | | |
Total | | | | | 20,212,542 | | |
Total Consumer Discretionary | | | | | 56,029,297 | | |
CONSUMER STAPLES 10.4% | |
Beverages 1.5% | |
Coca-Cola Co. (The) | | | 17,900 | | | | 772,027 | | |
PepsiCo, Inc. | | | 62,000 | | | | 6,064,840 | | |
Total | | | | | 6,836,867 | | |
Food & Staples Retailing 3.9% | |
CVS Health Corp. | | | 60,300 | | | | 5,859,351 | | |
Kroger Co. (The) | | | 122,800 | | | | 4,900,948 | | |
SYSCO Corp. | | | 11,900 | | | | 525,147 | | |
Wal-Mart Stores, Inc. | | | 97,000 | | | | 6,434,980 | | |
Total | | | | | 17,720,426 | | |
Common Stocks (continued)
Issuer | | Shares | | Value ($) | |
Food Products 1.4% | |
Campbell Soup Co. | | | 29,000 | | | | 1,790,750 | | |
Tyson Foods, Inc., Class A | | | 69,500 | | | | 4,500,125 | | |
Total | | | | | 6,290,875 | | |
Household Products 0.5% | |
Procter & Gamble Co. (The) | | | 24,600 | | | | 1,975,134 | | |
Tobacco 3.1% | |
Altria Group, Inc. | | | 112,300 | | | | 6,914,311 | | |
Philip Morris International, Inc. | | | 80,300 | | | | 7,309,709 | | |
Total | | | | | 14,224,020 | | |
Total Consumer Staples | | | | | 47,047,322 | | |
ENERGY 5.8% | |
Energy Equipment & Services 0.5% | |
Transocean Ltd. | | | 246,500 | | | | 2,132,225 | | |
Oil, Gas & Consumable Fuels 5.3% | |
Chevron Corp. | | | 26,700 | | | | 2,227,848 | | |
ConocoPhillips | | | 121,800 | | | | 4,120,494 | | |
EOG Resources, Inc. | | | 37,600 | | | | 2,434,224 | | |
Exxon Mobil Corp. | | | 63,300 | | | | 5,073,495 | | |
Marathon Petroleum Corp. | | | 87,700 | | | | 3,003,725 | | |
Phillips 66 | | | 18,800 | | | | 1,492,532 | | |
Southwestern Energy Co.(a) | | | 48,000 | | | | 277,440 | | |
Tesoro Corp. | | | 16,200 | | | | 1,307,016 | | |
Valero Energy Corp. | | | 70,300 | | | | 4,223,624 | | |
Total | | | | | 24,160,398 | | |
Total Energy | | | | | 26,292,623 | | |
FINANCIALS 14.9% | |
Banks 4.1% | |
Bank of America Corp. | | | 85,500 | | | | 1,070,460 | | |
Citigroup, Inc. | | | 160,700 | | | | 6,243,195 | | |
JPMorgan Chase & Co. | | | 155,300 | | | | 8,743,390 | | |
Wells Fargo & Co. | | | 57,300 | | | | 2,688,516 | | |
Total | | | | | 18,745,561 | | |
Capital Markets 0.9% | |
BlackRock, Inc. | | | 1,600 | | | | 499,136 | | |
T. Rowe Price Group, Inc. | | | 52,700 | | | | 3,642,097 | | |
Total | | | | | 4,141,233 | | |
The accompanying Notes to Financial Statements are an integral part of this statement.
Annual Report 2016
8
COLUMBIA LARGE CAP ENHANCED CORE FUND
PORTFOLIO OF INVESTMENTS (continued)
February 29, 2016
Common Stocks (continued)
Issuer | | Shares | | Value ($) | |
Consumer Finance 1.4% | |
Capital One Financial Corp. | | | 56,600 | | | | 3,720,318 | | |
Navient Corp. | | | 245,700 | | | | 2,660,931 | | |
Total | | | | | 6,381,249 | | |
Diversified Financial Services 2.3% | |
Berkshire Hathaway, Inc., Class B(a) | | | 22,300 | | | | 2,991,991 | | |
Intercontinental Exchange, Inc. | | | 16,600 | | | | 3,958,436 | | |
Moody's Corp. | | | 40,600 | | | | 3,605,280 | | |
Total | | | | | 10,555,707 | | |
Insurance 3.6% | |
Aflac, Inc. | | | 15,500 | | | | 922,560 | | |
Lincoln National Corp. | | | 86,400 | | | | 3,156,192 | | |
Marsh & McLennan Companies, Inc. | | | 73,100 | | | | 4,170,355 | | |
MetLife, Inc. | | | 38,200 | | | | 1,511,192 | | |
Prudential Financial, Inc. | | | 61,500 | | | | 4,064,535 | | |
Travelers Companies, Inc. (The) | | | 23,000 | | | | 2,472,960 | | |
Total | | | | | 16,297,794 | | |
Real Estate Investment Trusts (REITs) 2.6% | |
American Tower Corp. | | | 5,000 | | | | 461,000 | | |
Apartment Investment &
Management Co., Class A | | | 26,200 | | | | 959,182 | | |
Extra Space Storage, Inc. | | | 7,200 | | | | 591,480 | | |
Public Storage | | | 16,900 | | | | 4,216,381 | | |
Simon Property Group, Inc. | | | 28,000 | | | | 5,312,440 | | |
Total | | | | | 11,540,483 | | |
Total Financials | | | | | 67,662,027 | | |
HEALTH CARE 14.6% | |
Biotechnology 3.2% | |
Alexion Pharmaceuticals, Inc.(a) | | | 16,500 | | | | 2,323,200 | | |
Amgen, Inc. | | | 9,400 | | | | 1,337,432 | | |
Biogen, Inc.(a) | | | 12,400 | | | | 3,216,808 | | |
Celgene Corp.(a) | | | 35,800 | | | | 3,609,714 | | |
Gilead Sciences, Inc. | | | 21,000 | | | | 1,832,250 | | |
Vertex Pharmaceuticals, Inc.(a) | | | 27,500 | | | | 2,350,975 | | |
Total | | | | | 14,670,379 | | |
Common Stocks (continued)
Issuer | | Shares | | Value ($) | |
Health Care Equipment & Supplies 2.6% | |
Abbott Laboratories | | | 69,100 | | | | 2,676,934 | | |
Baxter International, Inc. | | | 25,700 | | | | 1,015,407 | | |
CR Bard, Inc. | | | 19,500 | | | | 3,751,410 | | |
DENTSPLY SIRONA, Inc. | | | 69,300 | | | | 4,224,528 | | |
Total | | | | | 11,668,279 | | |
Health Care Providers & Services 3.2% | |
AmerisourceBergen Corp. | | | 41,000 | | | | 3,551,420 | | |
Cardinal Health, Inc. | | | 21,500 | | | | 1,756,550 | | |
CIGNA Corp. | | | 32,000 | | | | 4,467,520 | | |
Express Scripts Holding Co.(a) | | | 64,600 | | | | 4,546,548 | | |
Total | | | | | 14,322,038 | | |
Pharmaceuticals 5.6% | |
Johnson & Johnson | | | 107,900 | | | | 11,352,159 | | |
Merck & Co., Inc. | | | 116,100 | | | | 5,829,381 | | |
Pfizer, Inc. | | | 277,500 | | | | 8,233,425 | | |
Total | | | | | 25,414,965 | | |
Total Health Care | | | | | 66,075,661 | | |
INDUSTRIALS 10.4% | |
Aerospace & Defense 3.4% | |
Boeing Co. (The) | | | 42,300 | | | | 4,999,014 | | |
Honeywell International, Inc. | | | 55,600 | | | | 5,635,060 | | |
Lockheed Martin Corp. | | | 21,400 | | | | 4,617,906 | | |
Total | | | | | 15,251,980 | | |
Air Freight & Logistics 0.7% | |
United Parcel Service, Inc., Class B | | | 33,300 | | | | 3,215,115 | | |
Airlines 2.1% | |
Delta Air Lines, Inc. | | | 102,400 | | | | 4,939,776 | | |
United Continental Holdings, Inc.(a) | | | 80,500 | | | | 4,609,430 | | |
Total | | | | | 9,549,206 | | |
Construction & Engineering 0.1% | |
Quanta Services, Inc.(a) | | | 34,900 | | | | 708,121 | | |
Electrical Equipment 1.2% | |
Eaton Corp. PLC | | | 23,600 | | | | 1,338,356 | | |
Rockwell Automation, Inc. | | | 38,600 | | | | 4,017,874 | | |
Total | | | | | 5,356,230 | | |
Industrial Conglomerates 0.9% | |
General Electric Co. | | | 134,400 | | | | 3,916,416 | | |
The accompanying Notes to Financial Statements are an integral part of this statement.
Annual Report 2016
9
COLUMBIA LARGE CAP ENHANCED CORE FUND
PORTFOLIO OF INVESTMENTS (continued)
February 29, 2016
Common Stocks (continued)
Issuer | | Shares | | Value ($) | |
Machinery 1.0% | |
Illinois Tool Works, Inc. | | | 48,400 | | | | 4,561,700 | | |
Professional Services 1.0% | |
Dun & Bradstreet Corp. (The) | | | 12,800 | | | | 1,226,112 | | |
Equifax, Inc. | | | 31,000 | | | | 3,251,280 | | |
Total | | | | | 4,477,392 | | |
Total Industrials | | | | | 47,036,160 | | |
| INFORMATION TECHNOLOGY 20.4% | |
Communications Equipment 2.2% | |
Cisco Systems, Inc. | | | 284,100 | | | | 7,437,738 | | |
F5 Networks, Inc.(a) | | | 28,100 | | | | 2,702,377 | | |
Total | | | | | 10,140,115 | | |
Internet Software & Services 5.8% | |
Alphabet, Inc., Class A(a) | | | 9,825 | | | | 7,046,687 | | |
Alphabet, Inc., Class C(a) | | | 1,385 | | | | 966,411 | | |
eBay, Inc.(a) | | | 161,400 | | | | 3,841,320 | | |
Facebook, Inc., Class A(a) | | | 94,100 | | | | 10,061,172 | | |
VeriSign, Inc.(a) | | | 49,600 | | | | 4,190,704 | | |
Total | | | | | 26,106,294 | | |
IT Services 2.9% | |
MasterCard, Inc., Class A | | | 68,100 | | | | 5,919,252 | | |
Visa, Inc., Class A | | | 99,300 | | | | 7,188,327 | | |
Total | | | | | 13,107,579 | | |
Semiconductors & Semiconductor Equipment 1.8% | |
Intel Corp. | | | 177,500 | | | | 5,252,225 | | |
NVIDIA Corp. | | | 96,800 | | | | 3,035,648 | | |
Total | | | | | 8,287,873 | | |
Software 3.3% | |
Electronic Arts, Inc.(a) | | | 63,100 | | | | 4,053,544 | | |
Microsoft Corp.(b) | | | 136,300 | | | | 6,934,944 | | |
Red Hat, Inc.(a) | | | 55,900 | | | | 3,653,065 | | |
Salesforce.com, inc.(a) | | | 6,600 | | | | 447,150 | | |
Total | | | | | 15,088,703 | | |
Technology Hardware, Storage & Peripherals 4.4% | |
Apple, Inc. | | | 185,375 | | | | 17,923,909 | | |
EMC Corp. | | | 73,300 | | | | 1,915,329 | | |
Total | | | | | 19,839,238 | | |
Total Information Technology | | | | | 92,569,802 | | |
Common Stocks (continued)
Issuer | | Shares | | Value ($) | |
MATERIALS 2.4% | |
Chemicals 2.4% | |
Dow Chemical Co. (The) | | | 71,000 | | | | 3,451,310 | | |
LyondellBasell Industries NV, Class A | | | 51,800 | | | | 4,154,878 | | |
Mosaic Co. (The) | | | 132,400 | | | | 3,528,460 | | |
Total | | | | | 11,134,648 | | |
Total Materials | | | | | 11,134,648 | | |
TELECOMMUNICATION SERVICES 3.1% | |
Diversified Telecommunication Services 3.1% | |
AT&T, Inc. | | | 57,000 | | | | 2,106,150 | | |
CenturyLink, Inc. | | | 105,700 | | | | 3,233,363 | | |
Verizon Communications, Inc. | | | 171,000 | | | | 8,674,830 | | |
Total | | | | | 14,014,343 | | |
Total Telecommunication Services | | | | | 14,014,343 | | |
UTILITIES 3.6% | |
Electric Utilities 1.0% | |
Entergy Corp. | | | 55,000 | | | | 3,971,550 | | |
Pinnacle West Capital Corp. | | | 6,100 | | | | 419,863 | | |
Total | | | | | 4,391,413 | | |
Independent Power and Renewable Electricity Producers 0.9% | |
AES Corp. (The) | | | 411,300 | | | | 4,030,740 | | |
Multi-Utilities 1.7% | |
Ameren Corp. | | | 77,700 | | | | 3,648,015 | | |
Public Service Enterprise Group, Inc. | | | 100,100 | | | | 4,270,266 | | |
Total | | | | | 7,918,281 | | |
Total Utilities | | | | | 16,340,434 | | |
Total Common Stocks
(Cost: $395,475,156) | | | | | 444,202,317 | | |
| | | Shares | | Value ($) | |
Money Market Funds 1.9%
Columbia Short-Term Cash Fund,
0.420%(c)(d) | | | 8,848,224 | | | | 8,848,224 | | |
Total Money Market Funds
(Cost: $8,848,224) | | | | | 8,848,224 | | |
Total Investments
(Cost: $404,323,380) | | | | | 453,050,541 | | |
Other Assets & Liabilities, Net | | | | | 927,559 | | |
Net Assets | | | | | 453,978,100 | | |
The accompanying Notes to Financial Statements are an integral part of this statement.
Annual Report 2016
10
COLUMBIA LARGE CAP ENHANCED CORE FUND
PORTFOLIO OF INVESTMENTS (continued)
February 29, 2016
At February 29, 2016, securities totaling $834,432 were pledged as collateral.
Investments in Derivatives
Futures Contracts Outstanding at February 29, 2016
Long Futures Contracts Outstanding
Contract Description | | Number of
Contracts | | Trading
Currency | | Notional
Market
Value ($) | | Expiration
Date | | Unrealized
Appreciation ($) | | Unrealized
Depreciation ($) | |
S&P 500 FUTURE | | | 20 | | | USD | | | | | 9,647,500 | | | 03/2016 | | | 363,430 | | | | — | | |
Notes to Portfolio of Investments
(a) Non-income producing investment.
(b) This security or a portion of this security has been pledged as collateral in connection with derivative contracts.
(c) The rate shown is the seven-day current annualized yield at February 29, 2016.
(d) As defined in the Investment Company Act of 1940, an affiliated company is one in which the Fund owns 5% or more of the company's outstanding voting securities, or a company which is under common ownership or control with the Fund. Holdings and transactions in these affiliated companies during the year ended February 29, 2016 are as follows:
Issuer | | Beginning
Cost ($) | | Purchase
Cost ($) | | Proceeds
From Sales ($) | | Ending
Cost ($) | | Dividends —
Affiliated
Issuers ($) | | Value ($) | |
Columbia Short-Term Cash Fund | | | 18,051,769 | | | | 152,088,758 | | | | (161,292,303 | ) | | | 8,848,224 | | | | 16,017 | | | | 8,848,224 | | |
Currency Legend
USD US Dollar
Fair Value Measurements
The Fund categorizes its fair value measurements according to a three-level hierarchy that maximizes the use of observable inputs and minimizes the use of unobservable inputs by prioritizing that the most observable input be used when available. Observable inputs are those that market participants would use in pricing an investment based on market data obtained from sources independent of the reporting entity. Unobservable inputs are those that reflect the Fund's assumptions about the information market participants would use in pricing an investment. An investment's level within the fair value hierarchy is based on the lowest level of any input that is deemed significant to the asset's or liability's fair value measurement. The input levels are not necessarily an indication of the risk or liquidity associated with investments at that level. For example, certain U.S. government securities are generally high quality and liquid, however, they are reflected as Level 2 because the inputs used to determine fair value may not always be quoted prices in an active market.
Fair value inputs are summarized in the three broad levels listed below:
> Level 1 — Valuations based on quoted prices for investments in active markets that the Fund has the ability to access at the measurement date (including NAV for open-end mutual funds). Valuation adjustments are not applied to Level 1 investments.
> Level 2 — Valuations based on other significant observable inputs (including quoted prices for similar securities, interest rates, prepayment speeds, credit risks, etc.).
> Level 3 — Valuations based on significant unobservable inputs (including the Fund's own assumptions and judgment in determining the fair value of investments).
Inputs that are used in determining fair value of an investment may include price information, credit data, volatility statistics, and other factors. These inputs can be either observable or unobservable. The availability of observable inputs can vary between investments, and is affected by various factors such as the type of investment, and the volume and level of activity for that investment or similar investments in the marketplace. The inputs will be considered by the Investment Manager, along with any other relevant factors in the calculation of an investment's fair value. The Fund uses prices and inputs that are current as of the measurement date, which may include periods of market
The accompanying Notes to Financial Statements are an integral part of this statement.
Annual Report 2016
11
COLUMBIA LARGE CAP ENHANCED CORE FUND
PORTFOLIO OF INVESTMENTS (continued)
February 29, 2016
Fair Value Measurements (continued)
dislocations. During these periods, the availability of prices and inputs may be reduced for many investments. This condition could cause an investment to be reclassified between the various levels within the hierarchy.
Investments falling into the Level 3 category are primarily supported by quoted prices from brokers and dealers participating in the market for those investments. However, these may be classified as Level 3 investments due to lack of market transparency and corroboration to support these quoted prices. Additionally, valuation models may be used as the pricing source for any remaining investments classified as Level 3. These models may rely on one or more significant unobservable inputs and/or significant assumptions by the Investment Manager. Inputs used in valuations may include, but are not limited to, financial statement analysis, capital account balances, discount rates and estimated cash flows, and comparable company data.
Under the direction of the Fund's Board of Trustees (the Board), the Investment Manager's Valuation Committee (the Committee) is responsible for overseeing the valuation procedures approved by the Board. The Committee consists of voting and non-voting members from various groups within the Investment Manager's organization, including operations and accounting, trading and investments, compliance, risk management and legal.
The Committee meets at least monthly to review and approve valuation matters, which may include a description of specific valuation determinations, data regarding pricing information received from approved pricing vendors and brokers and the results of Board-approved valuation control policies and procedures (the Policies). The Policies address, among other things, instances when market quotations are or are not readily available, including recommendations of third party pricing vendors and a determination of appropriate pricing methodologies; events that require specific valuation determinations and assessment of fair value techniques; securities with a potential for stale pricing, including those that are illiquid, restricted, or in default; and the effectiveness of third party pricing vendors, including periodic reviews of vendors. The Committee meets more frequently, as needed, to discuss additional valuation matters, which may include the need to review back-testing results, review time-sensitive information or approve related valuation actions. The Committee reports to the Board, with members of the Committee meeting with the Board at each of its regularly scheduled meetings to discuss valuation matters and actions during the period, similar to those described earlier.
For investments categorized as Level 3, the Committee monitors information similar to that described above, which may include: (i) data specific to the issuer or comparable issuers, (ii) general market or specific sector news and (iii) quoted prices and specific or similar security transactions. The Committee considers this data and any changes from prior periods in order to assess the reasonableness of observable and unobservable inputs, any assumptions or internal models used to value those securities and changes in fair value. This data is also used to corroborate, when available, information received from approved pricing vendors and brokers. Various factors impact the frequency of monitoring this information (which may occur as often as daily). However, the Committee may determine that changes to inputs, assumptions and models are not required as a result of the monitoring procedures performed.
The following table is a summary of the inputs used to value the Fund's investments at February 29, 2016:
| | | Level 1
Quoted Prices in Active
Markets for Identical
Assets ($) | | Level 2
Other Significant
Observable Inputs ($) | | Level 3
Significant
Unobservable Inputs ($) | | Total ($) | |
Investments | |
Common Stocks | |
Consumer Discretionary | | | 56,029,297 | | | | — | | | | — | | | | 56,029,297 | | |
Consumer Staples | | | 47,047,322 | | | | — | | | | — | | | | 47,047,322 | | |
Energy | | | 26,292,623 | | | | — | | | | — | | | | 26,292,623 | | |
Financials | | | 67,662,027 | | | | — | | | | — | | | | 67,662,027 | | |
Health Care | | | 66,075,661 | | | | — | | | | — | | | | 66,075,661 | | |
Industrials | | | 47,036,160 | | | | — | | | | — | | | | 47,036,160 | | |
Information Technology | | | 92,569,802 | | | | — | | | | — | | | | 92,569,802 | | |
Materials | | | 11,134,648 | | | | — | | | | — | | | | 11,134,648 | | |
Telecommunication Services | | | 14,014,343 | | | | — | | | | — | | | | 14,014,343 | | |
Utilities | | | 16,340,434 | | | | — | | | | — | | | | 16,340,434 | | |
Total Common Stocks | | | 444,202,317 | | | | — | | | | — | | | | 444,202,317 | | |
Money Market Funds | | | — | | | | 8,848,224 | | | | — | | | | 8,848,224 | | |
Total Investments | | | 444,202,317 | | | | 8,848,224 | | | | — | | | | 453,050,541 | | |
The accompanying Notes to Financial Statements are an integral part of this statement.
Annual Report 2016
12
COLUMBIA LARGE CAP ENHANCED CORE FUND
PORTFOLIO OF INVESTMENTS (continued)
February 29, 2016
Fair Value Measurements (continued)
| | | Level 1
Quoted Prices in Active
Markets for Identical
Assets ($) | | Level 2
Other Significant
Observable Inputs ($) | | Level 3
Significant
Unobservable Inputs ($) | | Total ($) | |
Derivatives | |
Assets | |
Futures Contracts | | | 363,430 | | | | — | | | | — | | | | 363,430 | | |
Total | | | 444,565,747 | | | | 8,848,224 | | | | — | | | | 453,413,971 | | |
See the Portfolio of Investments for all investment classifications not indicated in the table.
The Fund's assets assigned to the Level 2 input category are valued based upon utilizing observable market inputs, in which a security's value is determined through reference to prices and information from market transactions for similar or identical assets and/or fund per share market values which are not considered publicly available.
Derivative instruments are valued at unrealized appreciation (depreciation).
Financial assets were transferred from Level 1 to Level 2 as the market for these assets is not considered publicly available. Fund per share market values were obtained using observable market inputs.
The following table shows transfers between Level 1 and Level 2 of the fair value hierarchy:
Transfers In | | Transfers Out | |
| Level 1 ($) | | Level 2 ($) | | Level 1 ($) | | Level 2 ($) | |
| | — | | | | 18,051,769 | | | | 18,051,769 | | | | — | | |
Transfers between Level 1 and Level 2 are determined based on the fair value at the beginning of the period for security positions held throughout the period.
There were no transfers of financial assets between Levels 2 and 3 during the period.
The accompanying Notes to Financial Statements are an integral part of this statement.
Annual Report 2016
13
COLUMBIA LARGE CAP ENHANCED CORE FUND
STATEMENT OF ASSETS AND LIABILITIES
February 29, 2016
Assets | |
Investments, at value | |
Unaffiliated issuers (identified cost $395,475,156) | | $ | 444,202,317 | | |
Affiliated issuers (identified cost $8,848,224) | | | 8,848,224 | | |
Total investments (identified cost $404,323,380) | | | 453,050,541 | | |
Cash | | | 434 | | |
Receivable for: | |
Capital shares sold | | | 536,220 | | |
Dividends | | | 1,198,571 | | |
Expense reimbursement due from Investment Manager | | | 11,863 | | |
Prepaid expenses | | | 1,921 | | |
Other assets | | | 4,467 | | |
Total assets | | | 454,804,017 | | |
Liabilities | |
Payable for: | |
Capital shares purchased | | | 505,027 | | |
Variation margin | | | 69,929 | | |
Investment management fees | | | 28,162 | | |
Distribution and/or service fees | | | 2,767 | | |
Transfer agent fees | | | 79,273 | | |
Compensation of board members | | | 102,416 | | |
Other expenses | | | 38,343 | | |
Total liabilities | | | 825,917 | | |
Net assets applicable to outstanding capital stock | | $ | 453,978,100 | | |
Represented by | |
Paid-in capital | | $ | 415,829,963 | | |
Undistributed net investment income | | | 701,953 | | |
Accumulated net realized loss | | | (11,644,407 | ) | |
Unrealized appreciation (depreciation) on: | |
Investments | | | 48,727,161 | | |
Futures contracts | | | 363,430 | | |
Total — representing net assets applicable to outstanding capital stock | | $ | 453,978,100 | | |
The accompanying Notes to Financial Statements are an integral part of this statement.
Annual Report 2016
14
COLUMBIA LARGE CAP ENHANCED CORE FUND
STATEMENT OF ASSETS AND LIABILITIES (continued)
February 29, 2016
The accompanying Notes to Financial Statements are an integral part of this statement.
Class A | |
Net assets | | $ | 75,125,787 | | |
Shares outstanding | | | 3,816,131 | | |
Net asset value per share | | $ | 19.69 | | |
Class I | |
Net assets | | $ | 44,420,980 | | |
Shares outstanding | | | 2,262,039 | | |
Net asset value per share | | $ | 19.64 | | |
Class R | |
Net assets | | $ | 29,687,173 | | |
Shares outstanding | | | 1,510,200 | | |
Net asset value per share | | $ | 19.66 | | |
Class R4 | |
Net assets | | $ | 119,719 | | |
Shares outstanding | | | 6,141 | | |
Net asset value per share(a) | | $ | 19.49 | | |
Class R5 | |
Net assets | | $ | 2,968,855 | | |
Shares outstanding | | | 151,655 | | |
Net asset value per share | | $ | 19.58 | | |
Class Y | |
Net assets | | $ | 2,519,983 | | |
Shares outstanding | | | 128,249 | | |
Net asset value per share | | $ | 19.65 | | |
Class Z | |
Net assets | | $ | 299,135,603 | | |
Shares outstanding | | | 15,226,239 | | |
Net asset value per share | | $ | 19.65 | | |
(a) Net asset value per share rounds to this amount due to fractional shares outstanding.
Annual Report 2016
15
COLUMBIA LARGE CAP ENHANCED CORE FUND
STATEMENT OF OPERATIONS
Year Ended February 29, 2016
Net investment income | |
Income: | |
Dividends — unaffiliated issuers | | $ | 10,758,372 | | |
Dividends — affiliated issuers | | | 16,017 | | |
Total income | | | 10,774,389 | | |
Expenses: | |
Investment management fees | | | 3,574,464 | | |
Distribution and/or service fees | |
Class A | | | 198,581 | | |
Class R | | | 144,640 | | |
Transfer agent fees | |
Class A | | | 162,441 | | |
Class R | | | 59,256 | | |
Class R4(a) | | | 103 | | |
Class R5 | | | 473 | | |
Class Z | | | 691,214 | | |
Compensation of board members | | | 10,464 | | |
Custodian fees | | | 17,875 | | |
Printing and postage fees | | | 40,248 | | |
Registration fees | | | 106,305 | | |
Audit fees | | | 20,780 | | |
Legal fees | | | 9,437 | | |
Other | | | 17,452 | | |
Total expenses | | | 5,053,733 | | |
Fees waived or expenses reimbursed by Investment Manager and its affiliates | | | (1,665,694 | ) | |
Total net expenses | | | 3,388,039 | | |
Net investment income | | | 7,386,350 | | |
Realized and unrealized gain (loss) — net | |
Net realized gain (loss) on: | |
Investments | | | 382,264 | | |
Futures contracts | | | (511,936 | ) | |
Net realized loss | | | (129,672 | ) | |
Net change in unrealized appreciation (depreciation) on: | |
Investments | | | (50,354,498 | ) | |
Futures contracts | | | (10,443 | ) | |
Net change in unrealized depreciation | | | (50,364,941 | ) | |
Net realized and unrealized loss | | | (50,494,613 | ) | |
Net decrease in net assets from operations | | $ | (43,108,263 | ) | |
(a) Class R4 shares are based on operations from July 1, 2015 (commencement of operations) through the stated period end.
The accompanying Notes to Financial Statements are an integral part of this statement.
Annual Report 2016
16
COLUMBIA LARGE CAP ENHANCED CORE FUND
STATEMENT OF CHANGES IN NET ASSETS
| | | Year Ended
February 29,
2016 (a) | | Year Ended
February 28,
2015 (b) | |
Operations | |
Net investment income | | $ | 7,386,350 | | | $ | 7,692,009 | | |
Net realized gain (loss) | | | (129,672 | ) | | | 32,803,661 | | |
Net change in unrealized appreciation (depreciation) | | | (50,364,941 | ) | | | 19,260,329 | | |
Net increase (decrease) in net assets resulting from operations | | | (43,108,263 | ) | | | 59,755,999 | | |
Distributions to shareholders | |
Net investment income | |
Class A | | | (1,600,607 | ) | | | (534,094 | ) | |
Class I | | | (538,782 | ) | | | (183,701 | ) | |
Class R | | | (517,849 | ) | | | (142,581 | ) | |
Class R4 | | | (4,050 | ) | | | — | | |
Class R5 | | | (29,068 | ) | | | (2,624 | ) | |
Class Y | | | (72,267 | ) | | | (46,507 | ) | |
Class Z | | | (7,733,712 | ) | | | (3,318,025 | ) | |
Total distributions to shareholders | | | (10,496,335 | ) | | | (4,227,532 | ) | |
Increase in net assets from capital stock activity | | | 52,000,598 | | | | 130,637,322 | | |
Total increase (decrease) in net assets | | | (1,604,000 | ) | | | 186,165,789 | | |
Net assets at beginning of year | | | 455,582,100 | | | | 269,416,311 | | |
Net assets at end of year | | $ | 453,978,100 | | | $ | 455,582,100 | | |
Undistributed net investment income | | $ | 701,953 | | | $ | 3,899,926 | | |
(a) Class R4 based on operations from July 1, 2015 (commencement of operations) through the stated period end.
(b) Class R5 based on operations from June 25, 2014 (commencement of operations) through the stated period end.
The accompanying Notes to Financial Statements are an integral part of this statement.
Annual Report 2016
17
COLUMBIA LARGE CAP ENHANCED CORE FUND
STATEMENT OF CHANGES IN NET ASSETS (continued)
| | | Year Ended
February 29, 2016(a) | | Year Ended
February 28, 2015(b) | |
| | | Shares | | Dollars ($) | | Shares | | Dollars ($) | |
Capital stock activity | |
Class A shares | |
Subscriptions | | | 1,751,236 | | | | 37,219,254 | | | | 2,816,680 | | | | 58,950,189 | | |
Distributions reinvested | | | 66,435 | | | | 1,436,510 | | | | 21,783 | | | | 466,340 | | |
Redemptions | | | (1,867,773 | ) | | | (39,281,437 | ) | | | (329,060 | ) | | | (6,787,438 | ) | |
Net increase (decrease) | | | (50,102 | ) | | | (625,673 | ) | | | 2,509,403 | | | | 52,629,091 | | |
Class I shares | |
Subscriptions | | | 2,983,585 | | | | 61,213,181 | | | | 2,332,257 | | | | 45,826,823 | | |
Distributions reinvested | | | 24,985 | | | | 538,712 | | | | 8,714 | | | | 183,662 | | |
Redemptions | | | (1,315,825 | ) | | | (27,889,288 | ) | | | (2,855,235 | ) | | | (58,597,902 | ) | |
Net increase (decrease) | | | 1,692,745 | | | | 33,862,605 | | | | (514,264 | ) | | | (12,587,417 | ) | |
Class R shares | |
Subscriptions | | | 1,049,724 | | | | 22,278,488 | | | | 1,183,183 | | | | 24,033,094 | | |
Distributions reinvested | | | 14,444 | | | | 312,399 | | | | 3,085 | | | | 66,161 | | |
Redemptions | | | (617,234 | ) | | | (13,022,034 | ) | | | (268,544 | ) | | | (5,572,574 | ) | |
Net increase | | | 446,934 | | | | 9,568,853 | | | | 917,724 | | | | 18,526,681 | | |
Class R4 shares | |
Subscriptions | | | 13,740 | | | | 289,683 | | | | — | | | | — | | |
Distributions reinvested | | | 190 | | | | 4,015 | | | | — | | | | — | | |
Redemptions | | | (7,789 | ) | | | (158,887 | ) | | | — | | | | — | | |
Net increase | | | 6,141 | | | | 134,811 | | | | — | | | | — | | |
Class R5 shares | |
Subscriptions | | | 166,740 | | | | 3,296,124 | | | | 20,347 | | | | 413,572 | | |
Distributions reinvested | | | 1,360 | | | | 29,005 | | | | 121 | | | | 2,595 | | |
Redemptions | | | (35,773 | ) | | | (728,004 | ) | | | (1,140 | ) | | | (24,076 | ) | |
Net increase | | | 132,327 | | | | 2,597,125 | | | | 19,328 | | | | 392,091 | | |
Class Y shares | |
Subscriptions | | | 142,912 | | | | 3,026,731 | | | | 3,375 | | | | 72,625 | | |
Distributions reinvested | | | 1,966 | | | | 42,101 | | | | — | | | | — | | |
Redemptions | | | (176,160 | ) | | | (3,568,895 | ) | | | (28,059 | ) | | | (576,519 | ) | |
Net decrease | | | (31,282 | ) | | | (500,063 | ) | | | (24,684 | ) | | | (503,894 | ) | |
Class Z shares | |
Subscriptions | | | 3,926,764 | | | | 83,891,244 | | | | 5,984,935 | | | | 124,768,558 | | |
Distributions reinvested | | | 58,940 | | | | 1,271,071 | | | | 19,220 | | | | 410,481 | | |
Redemptions | | | (3,774,831 | ) | | | (78,199,375 | ) | | | (2,598,255 | ) | | | (52,998,269 | ) | |
Net increase | | | 210,873 | | | | 6,962,940 | | | | 3,405,900 | | | | 72,180,770 | | |
Total net increase | | | 2,407,636 | | | | 52,000,598 | | | | 6,313,407 | | | | 130,637,322 | | |
(a) Class R4 shares are based on operations from July 1, 2015 (commencement of operations) through the stated period end.
(b) Class R5 shares are based on operations from June 25, 2014 (commencement of operations) through the stated period end.
The accompanying Notes to Financial Statements are an integral part of this statement.
Annual Report 2016
18
COLUMBIA LARGE CAP ENHANCED CORE FUND
The following tables are intended to help you understand the Fund's financial performance. Certain information reflects financial results for a single share of a class held for the periods shown. Per share net investment income (loss) amounts are calculated based on average shares outstanding during the period. Total return assumes reinvestment of all dividends and distributions, if any. Total return does not reflect payment of sales charges, if any. Total return and portfolio turnover are not annualized for periods of less than one year. The portfolio turnover rate is calculated without regard to purchase and sales transactions of short-term instruments and certain derivatives, if any. If such transactions were included, the Fund's portfolio turnover rate may be higher.
| | | Year Ended
February 29, | | Year Ended February 28, | | Year Ended
February 29, | |
Class A | | 2016 | | 2015 | | 2014 | | 2013 | | 2012 | |
Per share data | |
Net asset value, beginning of period | | $ | 22.05 | | | $ | 18.77 | | | $ | 15.04 | | | $ | 13.67 | | | $ | 12.81 | | |
Income from investment operations: | |
Net investment income | | | 0.27 | | | | 0.51 | | | | 0.23 | | | | 0.22 | | | | 0.17 | | |
Net realized and unrealized gain (loss) | | | (2.20 | ) | | | 2.97 | | | | 3.76 | | | | 1.36 | | | | 0.89 | | |
Total from investment operations | | | (1.93 | ) | | | 3.48 | | | | 3.99 | | | | 1.58 | | | | 1.06 | | |
Less distributions to shareholders: | |
Net investment income | | | (0.43 | ) | | | (0.20 | ) | | | (0.26 | ) | | | (0.21 | ) | | | (0.20 | ) | |
Total distributions to shareholders | | | (0.43 | ) | | | (0.20 | ) | | | (0.26 | ) | | | (0.21 | ) | | | (0.20 | ) | |
Net asset value, end of period | | $ | 19.69 | | | $ | 22.05 | | | $ | 18.77 | | | $ | 15.04 | | | $ | 13.67 | | |
Total return | | | (8.94 | %) | | | 18.60 | % | | | 26.58 | % | | | 11.71 | % | | | 8.41 | % | |
Ratios to average net assets(a) | |
Total gross expenses | | | 1.25 | % | | | 1.27 | % | | | 1.26 | % | | | 1.28 | % | | | 1.19 | %(b) | |
Total net expenses(c) | | | 0.90 | % | | | 0.90 | %(d) | | | 0.89 | %(d) | | | 0.89 | %(d) | | | 0.94 | %(b)(d) | |
Net investment income | | | 1.27 | % | | | 2.51 | % | | | 1.34 | % | | | 1.53 | % | | | 1.33 | % | |
Supplemental data | |
Net assets, end of period (in thousands) | | $ | 75,126 | | | $ | 85,261 | | | $ | 25,474 | | | $ | 13,209 | | | $ | 12,404 | | |
Portfolio turnover | | | 89 | % | | | 91 | % | | | 101 | % | | | 92 | % | | | 67 | % | |
Notes to Financial Highlights
(a) In addition to the fees and expenses that the Fund bears directly, the Fund indirectly bears a pro rata share of the fees and expenses of any other funds in which it invests. Such indirect expenses are not included in the Fund's reported expense ratios.
(b) Ratios include line of credit interest expense which is less than 0.01%.
(c) Total net expenses include the impact of certain fee waivers/expense reimbursements made by the Investment Manager and certain of its affiliates, if applicable.
(d) The benefits derived from expense reductions had an impact of less than 0.01%.
The accompanying Notes to Financial Statements are an integral part of this statement.
Annual Report 2016
19
COLUMBIA LARGE CAP ENHANCED CORE FUND
FINANCIAL HIGHLIGHTS (continued)
| | | Year Ended
February 29, | | Year Ended February 28, | | Year Ended
February 29, | |
Class I | | 2016 | | 2015 | | 2014 | | 2013 | | 2012 | |
Per share data | |
Net asset value, beginning of period | | $ | 22.00 | | | $ | 18.72 | | | $ | 15.00 | | | $ | 13.63 | | | $ | 12.78 | | |
Income from investment operations: | |
Net investment income | | | 0.42 | | | | 0.42 | | | | 0.29 | | | | 0.28 | | | | 0.21 | | |
Net realized and unrealized gain (loss) | | | (2.27 | ) | | | 3.14 | | | | 3.75 | | | | 1.36 | | | | 0.88 | | |
Total from investment operations | | | (1.85 | ) | | | 3.56 | | | | 4.04 | | | | 1.64 | | | | 1.09 | | |
Less distributions to shareholders: | |
Net investment income | | | (0.51 | ) | | | (0.28 | ) | | | (0.32 | ) | | | (0.27 | ) | | | (0.24 | ) | |
Total distributions to shareholders | | | (0.51 | ) | | | (0.28 | ) | | | (0.32 | ) | | | (0.27 | ) | | | (0.24 | ) | |
Net asset value, end of period | | $ | 19.64 | | | $ | 22.00 | | | $ | 18.72 | | | $ | 15.00 | | | $ | 13.63 | | |
Total return | | | (8.60 | %) | | | 19.09 | % | | | 27.06 | % | | | 12.15 | % | | | 8.73 | % | |
Ratios to average net assets(a) | |
Total gross expenses | | | 0.80 | % | | | 0.81 | % | | | 0.80 | % | | | 0.84 | % | | | 0.74 | %(b) | |
Total net expenses(c) | | | 0.50 | % | | | 0.50 | % | | | 0.48 | % | | | 0.50 | % | | | 0.61 | %(b) | |
Net investment income | | | 2.05 | % | | | 2.07 | % | | | 1.72 | % | | | 2.01 | % | | | 1.72 | % | |
Supplemental data | |
Net assets, end of period (in thousands) | | $ | 44,421 | | | $ | 12,522 | | | $ | 20,286 | | | $ | 36,224 | | | $ | 13,297 | | |
Portfolio turnover | | | 89 | % | | | 91 | % | | | 101 | % | | | 92 | % | | | 67 | % | |
Notes to Financial Highlights
(a) In addition to the fees and expenses that the Fund bears directly, the Fund indirectly bears a pro rata share of the fees and expenses of any other funds in which it invests. Such indirect expenses are not included in the Fund's reported expense ratios.
(b) Ratios include line of credit interest expense which is less than 0.01%.
(c) Total net expenses include the impact of certain fee waivers/expense reimbursements made by the Investment Manager and certain of its affiliates, if applicable.
The accompanying Notes to Financial Statements are an integral part of this statement.
Annual Report 2016
20
COLUMBIA LARGE CAP ENHANCED CORE FUND
FINANCIAL HIGHLIGHTS (continued)
| | | Year Ended
February 29, | | Year Ended February 28, | | Year Ended
February 29, | |
Class R | | 2016 | | 2015 | | 2014 | | 2013 | | 2012 | |
Per share data | |
Net asset value, beginning of period | | $ | 22.02 | | | $ | 18.75 | | | $ | 15.03 | | | $ | 13.65 | | | $ | 12.80 | | |
Income from investment operations: | |
Net investment income | | | 0.25 | | | | 0.43 | | | | 0.18 | | | | 0.20 | | | | 0.14 | | |
Net realized and unrealized gain (loss) | | | (2.24 | ) | | | 2.99 | | | | 3.76 | | | | 1.36 | | | | 0.88 | | |
Total from investment operations | | | (1.99 | ) | | | 3.42 | | | | 3.94 | | | | 1.56 | | | | 1.02 | | |
Less distributions to shareholders: | |
Net investment income | | | (0.37 | ) | | | (0.15 | ) | | | (0.22 | ) | | | (0.18 | ) | | | (0.17 | ) | |
Total distributions to shareholders | | | (0.37 | ) | | | (0.15 | ) | | | (0.22 | ) | | | (0.18 | ) | | | (0.17 | ) | |
Net asset value, end of period | | $ | 19.66 | | | $ | 22.02 | | | $ | 18.75 | | | $ | 15.03 | | | $ | 13.65 | | |
Total return | | | (9.18 | %) | | | 18.30 | % | | | 26.26 | % | | | 11.54 | % | | | 8.08 | % | |
Ratios to average net assets(a) | |
Total gross expenses | | | 1.51 | % | | | 1.52 | % | | | 1.51 | % | | | 1.53 | % | | | 1.44 | %(b) | |
Total net expenses(c) | | | 1.15 | % | | | 1.15 | %(d) | | | 1.14 | %(d) | | | 1.12 | %(d) | | | 1.19 | %(b)(d) | |
Net investment income | | | 1.20 | % | | | 2.08 | % | | | 1.08 | % | | | 1.45 | % | | | 1.11 | % | |
Supplemental data | |
Net assets, end of period (in thousands) | | $ | 29,687 | | | $ | 23,414 | | | $ | 2,729 | | | $ | 1,284 | | | $ | 204 | | |
Portfolio turnover | | | 89 | % | | | 91 | % | | | 101 | % | | | 92 | % | | | 67 | % | |
Notes to Financial Highlights
(a) In addition to the fees and expenses that the Fund bears directly, the Fund indirectly bears a pro rata share of the fees and expenses of any other funds in which it invests. Such indirect expenses are not included in the Fund's reported expense ratios.
(b) Ratios include line of credit interest expense which is less than 0.01%.
(c) Total net expenses include the impact of certain fee waivers/expense reimbursements made by the Investment Manager and certain of its affiliates, if applicable.
(d) The benefits derived from expense reductions had an impact of less than 0.01%.
The accompanying Notes to Financial Statements are an integral part of this statement.
Annual Report 2016
21
COLUMBIA LARGE CAP ENHANCED CORE FUND
FINANCIAL HIGHLIGHTS (continued)
Class R4 | | Year Ended
February 29,
2016(a) | |
Per share data | |
Net asset value, beginning of period | | $ | 21.32 | | |
Income from investment operations: | |
Net investment income | | | 0.20 | | |
Net realized and unrealized loss | | | (1.74 | ) | |
Total from investment operations | | | (1.54 | ) | |
Less distributions to shareholders: | |
Net investment income | | | (0.29 | ) | |
Total distributions to shareholders | | | (0.29 | ) | |
Net asset value, end of period | | $ | 19.49 | | |
Total return | | | (7.31 | %) | |
Ratios to average net assets(b) | |
Total gross expenses | | | 1.01 | %(c) | |
Total net expenses(d) | | | 0.65 | %(c) | |
Net investment income | | | 1.49 | %(c) | |
Supplemental data | |
Net assets, end of period (in thousands) | | $ | 120 | | |
Portfolio turnover | | | 89 | % | |
Notes to Financial Highlights
(a) Based on operations from July 1, 2015 (commencement of operations) through the stated period end.
(b) In addition to the fees and expenses that the Fund bears directly, the Fund indirectly bears a pro rata share of the fees and expenses of any other funds in which it invests. Such indirect expenses are not included in the Fund's reported expense ratios.
(c) Annualized.
(d) Total net expenses include the impact of certain fee waivers/expense reimbursements made by the Investment Manager and certain of its affiliates, if applicable.
The accompanying Notes to Financial Statements are an integral part of this statement.
Annual Report 2016
22
COLUMBIA LARGE CAP ENHANCED CORE FUND
FINANCIAL HIGHLIGHTS (continued)
Class R5 | | Year Ended
February 29,
2016 | | Year Ended
February 28,
2015(a) | |
Per share data | |
Net asset value, beginning of period | | $ | 21.93 | | | $ | 19.88 | | |
Income from investment operations: | |
Net investment income | | | 0.37 | | | | 0.62 | | |
Net realized and unrealized gain (loss) | | | (2.22 | ) | | | 1.66 | | |
Total from investment operations | | | (1.85 | ) | | | 2.28 | | |
Less distributions to shareholders: | |
Net investment income | | | (0.50 | ) | | | (0.23 | ) | |
Total distributions to shareholders | | | (0.50 | ) | | | (0.23 | ) | |
Net asset value, end of period | | $ | 19.58 | | | $ | 21.93 | | |
Total return | | | (8.62 | %) | | | 11.49 | % | |
Ratios to average net assets(b) | |
Total gross expenses | | | 0.84 | % | | | 0.88 | %(c) | |
Total net expenses(d) | | | 0.55 | % | | | 0.55 | %(c) | |
Net investment income | | | 1.78 | % | | | 4.41 | %(c) | |
Supplemental data | |
Net assets, end of period (in thousands) | | $ | 2,969 | | | $ | 424 | | |
Portfolio turnover | | | 89 | % | | | 91 | % | |
Notes to Financial Highlights
(a) Based on operations from June 25, 2014 (commencement of operations) through the stated period end.
(b) In addition to the fees and expenses that the Fund bears directly, the Fund indirectly bears a pro rata share of the fees and expenses of any other funds in which it invests. Such indirect expenses are not included in the Fund's reported expense ratios.
(c) Annualized.
(d) Total net expenses include the impact of certain fee waivers/expense reimbursements made by the Investment Manager and certain of its affiliates, if applicable.
The accompanying Notes to Financial Statements are an integral part of this statement.
Annual Report 2016
23
COLUMBIA LARGE CAP ENHANCED CORE FUND
FINANCIAL HIGHLIGHTS (continued)
| | | Year Ended
February 29, | | Year Ended February 28, | | Year Ended
February 29, | |
Class Y | | 2016 | | 2015 | | 2014 | | 2013 | | 2012 | |
Per share data | |
Net asset value, beginning of period | | $ | 22.01 | | | $ | 18.73 | | | $ | 15.00 | | | $ | 13.63 | | | $ | 12.78 | | |
Income from investment operations: | |
Net investment income | | | 0.38 | | | | 0.46 | | | | 0.29 | | | | 0.27 | | | | 0.18 | | |
Net realized and unrealized gain (loss) | | | (2.23 | ) | | | 3.10 | | | | 3.76 | | | | 1.36 | | | | 0.91 | | |
Total from investment operations | | | (1.85 | ) | | | 3.56 | | | | 4.05 | | | | 1.63 | | | | 1.09 | | |
Less distributions to shareholders: | |
Net investment income | | | (0.51 | ) | | | (0.28 | ) | | | (0.32 | ) | | | (0.26 | ) | | | (0.24 | ) | |
Total distributions to shareholders | | | (0.51 | ) | | | (0.28 | ) | | | (0.32 | ) | | | (0.26 | ) | | | (0.24 | ) | |
Net asset value, end of period | | $ | 19.65 | | | $ | 22.01 | | | $ | 18.73 | | | $ | 15.00 | | | $ | 13.63 | | |
Total return | | | (8.59 | %) | | | 19.08 | % | | | 27.11 | % | | | 12.13 | % | | | 8.74 | % | |
Ratios to average net assets(a) | |
Total gross expenses | | | 0.80 | % | | | 0.81 | % | | | 0.80 | % | | | 0.83 | % | | | 0.74 | %(b) | |
Total net expenses(c) | | | 0.50 | % | | | 0.50 | % | | | 0.48 | % | | | 0.52 | % | | | 0.60 | %(b) | |
Net investment income | | | 1.79 | % | | | 2.30 | % | | | 1.72 | % | | | 1.90 | % | | | 1.46 | % | |
Supplemental data | |
Net assets, end of period (in thousands) | | $ | 2,520 | | | $ | 3,511 | | | $ | 3,451 | | | $ | 3,177 | | | $ | 3,024 | | |
Portfolio turnover | | | 89 | % | | | 91 | % | | | 101 | % | | | 92 | % | | | 67 | % | |
Notes to Financial Highlights
(a) In addition to the fees and expenses that the Fund bears directly, the Fund indirectly bears a pro rata share of the fees and expenses of any other funds in which it invests. Such indirect expenses are not included in the Fund's reported expense ratios.
(b) Ratios include line of credit interest expense which is less than 0.01%.
(c) Total net expenses include the impact of certain fee waivers/expense reimbursements made by the Investment Manager and certain of its affiliates, if applicable.
The accompanying Notes to Financial Statements are an integral part of this statement.
Annual Report 2016
24
COLUMBIA LARGE CAP ENHANCED CORE FUND
FINANCIAL HIGHLIGHTS (continued)
| | | Year Ended
February 29, | | Year Ended February 28, | | Year Ended
February 29, | |
Class Z | | 2016 | | 2015 | | 2014 | | 2013 | | 2012 | |
Per share data | |
Net asset value, beginning of period | | $ | 22.01 | | | $ | 18.73 | | | $ | 14.99 | | | $ | 13.62 | | | $ | 12.78 | | |
Income from investment operations: | |
Net investment income | | | 0.34 | | | | 0.47 | | | | 0.27 | | | | 0.25 | | | | 0.19 | | |
Net realized and unrealized gain (loss) | | | (2.22 | ) | | | 3.06 | | | | 3.77 | | | | 1.37 | | | | 0.88 | | |
Total from investment operations | | | (1.88 | ) | | | 3.53 | | | | 4.04 | | | | 1.62 | | | | 1.07 | | |
Less distributions to shareholders: | |
Net investment income | | | (0.48 | ) | | | (0.25 | ) | | | (0.30 | ) | | | (0.25 | ) | | | (0.23 | ) | |
Total distributions to shareholders | | | (0.48 | ) | | | (0.25 | ) | | | (0.30 | ) | | | (0.25 | ) | | | (0.23 | ) | |
Net asset value, end of period | | $ | 19.65 | | | $ | 22.01 | | | $ | 18.73 | | | $ | 14.99 | | | $ | 13.62 | | |
Total return | | | (8.73 | %) | | | 18.92 | % | | | 27.03 | % | | | 12.02 | % | | | 8.54 | % | |
Ratios to average net assets(a) | |
Total gross expenses | | | 1.00 | % | | | 1.02 | % | | | 1.01 | % | | | 1.03 | % | | | 0.94 | %(b) | |
Total net expenses(c) | | | 0.65 | % | | | 0.65 | %(d) | | | 0.64 | %(d) | | | 0.64 | %(d) | | | 0.70 | %(b)(d) | |
Net investment income | | | 1.61 | % | | | 2.32 | % | | | 1.57 | % | | | 1.77 | % | | | 1.54 | % | |
Supplemental data | |
Net assets, end of period (in thousands) | | $ | 299,136 | | | $ | 330,450 | | | $ | 217,477 | | | $ | 214,575 | | | $ | 254,500 | | |
Portfolio turnover | | | 89 | % | | | 91 | % | | | 101 | % | | | 92 | % | | | 67 | % | |
Notes to Financial Highlights
(a) In addition to the fees and expenses that the Fund bears directly, the Fund indirectly bears a pro rata share of the fees and expenses of any other funds in which it invests. Such indirect expenses are not included in the Fund's reported expense ratios.
(b) Ratios include line of credit interest expense which is less than 0.01%.
(c) Total net expenses include the impact of certain fee waivers/expense reimbursements made by the Investment Manager and certain of its affiliates, if applicable.
(d) The benefits derived from expense reductions had an impact of less than 0.01%.
The accompanying Notes to Financial Statements are an integral part of this statement.
Annual Report 2016
25
COLUMBIA LARGE CAP ENHANCED CORE FUND
NOTES TO FINANCIAL STATEMENTS
February 29, 2016
Note 1. Organization
Columbia Large Cap Enhanced Core Fund (the Fund), a series of Columbia Funds Series Trust (the Trust), is a diversified fund. The Trust is registered under the Investment Company Act of 1940, as amended (the 1940 Act), as an open-end management investment company organized as a Delaware statutory trust.
Fund Shares
The Trust may issue an unlimited number of shares (without par value). The Fund offers Class A, Class I, Class R, Class R4, Class R5, Class Y and Class Z shares. Although all share classes generally have identical voting, dividend and liquidation rights, each share class votes separately when required by the Trust's organizational documents or by law. Different share classes pay different distribution amounts to the extent the expenses of such share classes differ, and distributions in liquidation will be proportional to the net asset value of each share class. Each share class has its own expense and sales charge structure.
Class A shares are not subject to any front-end sales charge or contingent deferred sales charge.
Class I shares are not subject to sales charges and are available only to the Columbia Family of Funds.
Class R shares are not subject to sales charges and are generally available only to certain retirement plans and other investors as described in the Fund's prospectus.
Class R4 shares are not subject to sales charges and are generally available only to omnibus retirement plans and certain investors as described in the Fund's prospectus. Class R4 shares commenced operations on July 1, 2015.
Class R5 shares are not subject to sales charges and are generally available only to investors purchasing through authorized investment professionals and omnibus retirement plans.
Class Y shares are not subject to sales charges and are generally available only to certain retirement plans as described in the Fund's prospectus.
Class Z shares are not subject to sales charges and are available only to eligible investors, which are subject to different investment minimums as described in the Fund's prospectus.
Note 2. Summary of Significant Accounting Policies
Basis of Preparation
The Fund is an investment company that applies the accounting and reporting guidance in the Financial Accounting Standards Board (FASB) Accounting Standards Codification Topic 946, Financial Services — Investment Companies (ASC 946). The financial statements are prepared in accordance with U.S. generally accepted accounting principles (GAAP), which requires management to make certain estimates and assumptions that affect the reported amounts of assets and liabilities, the disclosure of contingent assets and liabilities at the date of the financial statements and the reported amounts of income and expenses during the reporting period. Actual results could differ from those estimates.
The following is a summary of significant accounting policies followed by the Fund in the preparation of its financial statements.
Security Valuation
All equity securities are valued at the close of business of the New York Stock Exchange (NYSE). Equity securities are valued at the last quoted sales price on the principal exchange or market on which they trade, except for securities traded on the NASDAQ Stock Market, which are valued at the NASDAQ official close price. Unlisted securities or listed securities for which there were no sales during the day are valued at the mean of the latest quoted bid and ask prices on such exchanges or markets.
Foreign equity securities are valued based on the closing price on the foreign exchange in which such securities are primarily traded. If any foreign equity security closing prices are not readily available, the securities are valued at the mean of the latest quoted bid and ask prices on such exchanges or markets. Foreign currency exchange rates are generally determined at 4:00 p.m. Eastern (U.S.) time. Many securities markets and exchanges outside the U.S. close prior to the close of the NYSE; therefore, the closing prices for securities in such markets or on such exchanges may not fully reflect events that occur after such close but before the close of the NYSE. In those situations, foreign securities will be fair valued pursuant to a policy adopted by the Board of Trustees (the Board), including, if available, utilizing a third party pricing service to determine these fair values. The third party pricing service takes into account multiple
Annual Report 2016
26
COLUMBIA LARGE CAP ENHANCED CORE FUND
NOTES TO FINANCIAL STATEMENTS (continued)
February 29, 2016
factors, including, but not limited to, movements in the U.S. securities markets, certain depositary receipts, futures contracts and foreign exchange rates that have occurred subsequent to the close of the foreign exchange or market, to determine a good faith estimate that reasonably reflects the current market conditions as of the close of the NYSE. The fair value of a security is likely to be different from the quoted or published price, if available.
Investments in open-end investment companies, including money market funds, are valued at their latest net asset value.
Futures and options on futures contracts are valued based upon the settlement price at the close of regular trading on their principal exchanges or, in the absence of transactions, at the mean of the latest quoted bid and ask prices.
Investments for which market quotations are not readily available, or that have quotations which management believes are not reflective of market value or reliable, are valued at fair value as determined in good faith under procedures approved by and under the general supervision of the Board. If a security or class of securities (such as foreign securities) is valued at fair value, such value is likely to be different from the quoted or published price for the security.
The determination of fair value often requires significant judgment. To determine fair value, management may use assumptions including but not limited to future cash flows and estimated risk premiums. Multiple inputs from various sources may be used to determine fair value.
GAAP requires disclosure regarding the inputs and valuation techniques used to measure fair value and any changes in valuation inputs or techniques. In addition, investments shall be disclosed by major category. This information is disclosed following the Fund's Portfolio of Investments.
Derivative Instruments
The Fund invests in certain derivative instruments, as detailed below, to meet its investment objectives. Derivatives are instruments whose values depend on, or are derived from, in whole or in part, the value of one or more securities, currencies, commodities, indices, or other assets or instruments. Derivatives may be used to increase investment flexibility (including to maintain cash reserves while maintaining desired exposure to certain assets), for risk management (hedging) purposes, to facilitate trading, to reduce transaction costs and to
pursue higher investment returns. The Fund may also use derivative instruments to mitigate certain investment risks, such as foreign currency exchange rate risk, interest rate risk and credit risk. Derivatives may involve various risks, including the potential inability of the counterparty to fulfill its obligation under the terms of the contract, the potential for an illiquid secondary market (making it difficult for the Fund to sell, including at favorable prices) and the potential for market movements which may expose the Fund to gains or losses in excess of the amount shown in the Statement of Assets and Liabilities. The notional amounts of derivative instruments, if applicable, are not recorded in the financial statements.
A derivative instrument may suffer a marked-to-market loss if the value of the contract decreases due to an unfavorable change in the market rates or values of the underlying instrument. Losses can also occur if the counterparty does not perform under the contract. The Fund's risk of loss from counterparty credit risk on over-the-counter derivatives is generally limited to the aggregate unrealized gain netted against any collateral held by the Fund and the amount of any variation margin held by the counterparty. With exchange-traded or centrally cleared derivatives, there is reduced counterparty credit risk to the Fund since the exchange's clearinghouse, as counterparty to such instruments, guarantees against a possible default. The clearinghouse stands between the buyer and the seller of the contract; therefore, the counterparty credit risk is failure of the clearinghouse. However, credit risk still exists in exchange-traded or centrally cleared derivatives with respect to initial and variation margin that is held in a broker's customer account. While brokers are required to segregate customer margin from their own assets, in the event that a broker becomes insolvent or goes into bankruptcy and at that time there is a shortfall in the aggregate amount of margin held by the broker for all its clients, U.S. bankruptcy laws will typically allocate that shortfall on a pro-rata basis across all the broker's customers (including the Fund), potentially resulting in losses to the Fund.
In order to better define its contractual rights and to secure rights that will help the Fund mitigate its counterparty risk, the Fund may enter into an International Swaps and Derivatives Association, Inc. Master Agreement (ISDA Master Agreement) or similar agreement with its derivatives contract counterparties. An ISDA Master Agreement is an agreement between the Fund and a counterparty that governs over-the-counter
Annual Report 2016
27
COLUMBIA LARGE CAP ENHANCED CORE FUND
NOTES TO FINANCIAL STATEMENTS (continued)
February 29, 2016
derivatives and forward foreign currency exchange contracts and typically contains, among other things, collateral posting terms and netting provisions in the event of a default and/or termination event. Under an ISDA Master Agreement, the Fund may, under certain circumstances, offset with the counterparty certain derivative instrument's payables and/or receivables with collateral held and/or posted and create one single net payment. The provisions of the ISDA Master Agreement typically permit a single net payment in the event of default (close-out netting) including the bankruptcy or insolvency of the counterparty. Note, however, that bankruptcy or insolvency laws of a particular jurisdiction may impose restrictions on or prohibitions against the right of offset in bankruptcy, insolvency or other events.
Collateral (margin) requirements differ by type of derivative. Margin requirements are established by the exchange or clearinghouse for exchange-traded and centrally cleared derivatives. Brokers can ask for margin in excess of the minimum in certain circumstances. Collateral terms are contract specific for over-the-counter derivatives. For over-the-counter derivatives traded under an ISDA Master Agreement, the collateral requirements are typically calculated by netting the marked-to-market amount for each transaction under such agreement and comparing that amount to the value of any variation margin currently pledged by the Fund and/or the counterparty. Generally, the amount of collateral due from or to a party has to exceed a minimum transfer amount threshold (e.g., $500,000) before a transfer has to be made. To the extent amounts due to the Fund from its counterparties are not fully collateralized, contractually or otherwise, the Fund bears the risk of loss from counterparty nonperformance. The Fund attempts to mitigate counterparty risk by only entering into agreements with counterparties that it believes have the financial resources to honor their obligations and by monitoring the financial stability of those counterparties.
Certain ISDA Master Agreements allow counterparties to over-the-counter derivatives transactions to terminate derivatives contracts prior to maturity in the event the Fund's net asset value declines by a stated percentage over a specified time period or if the Fund fails to meet certain terms of the ISDA Master Agreement, which would cause the Fund to accelerate payment of any net liability owed to the counterparty. The Fund also has termination rights if the counterparty fails to meet certain terms of the ISDA Master Agreement. In addition to considering counterparty credit risk, the Fund would consider terminating the derivatives contracts based on
whether termination would result in a net liability owed from the counterparty.
For financial reporting purposes, the Fund does not offset derivative assets and derivative liabilities that are subject to netting arrangements in the Statement of Assets and Liabilities.
Futures Contracts
Futures contracts are exchange traded and represent commitments for the future purchase or sale of an asset at a specified price on a specified date. The Fund bought and sold futures contracts to maintain appropriate equity market exposure while keeping sufficient cash to accommodate daily redemptions. These instruments may be used for other purposes in future periods. Upon entering into futures contracts, the Fund bears risks that it may not achieve the anticipated benefits of the futures contracts and may realize a loss. Additional risks include counterparty credit risk, the possibility of an illiquid market, and that a change in the value of the contract or option may not correlate with changes in the value of the underlying asset.
Upon entering into a futures contract, the Fund pledges cash or securities with the broker in an amount sufficient to meet the initial margin requirement. The initial margin deposit must be maintained at an established level over the life of the contract. Cash deposited as initial margin is recorded in the Statement of Assets and Liabilities as margin deposits. Securities deposited as initial margin are designated in the Portfolio of Investments. Subsequent payments (variation margin) are made or received by the Fund each day. The variation margin payments are equal to the daily change in the contract value and are recorded as variation margin receivable or payable and are offset in unrealized gains or losses. The Fund recognizes a realized gain or loss when the contract is closed or expires. Futures contracts involve, to varying degrees, risk of loss in excess of the variation margin disclosed in the Statement of Assets and Liabilities.
Effects of Derivative Transactions in the Financial Statements
The following tables are intended to provide additional information about the effect of derivatives on the financial statements of the Fund, including: the fair value of derivatives by risk category and the location of those fair values in the Statement of Assets and Liabilities; and the impact of derivative transactions over the period in the Statement of Operations, including realized and unrealized gains (losses). The derivative instrument
Annual Report 2016
28
COLUMBIA LARGE CAP ENHANCED CORE FUND
NOTES TO FINANCIAL STATEMENTS (continued)
February 29, 2016
schedules following the Portfolio of Investments present additional information regarding derivative instruments outstanding at the end of the period, if any.
The following table is a summary of the fair value of derivative instruments (not considered to be hedging instruments for accounting disclosure purposes) at February 29, 2016:
Asset Derivatives | |
Risk Exposure
Category | | Statement of Assets and
Liabilities Location | | Fair Value ($) | |
Equity risk
| | Net assets — unrealized
appreciation on futures
contracts | | | 363,430
| * | |
*Includes cumulative appreciation (depreciation) as reported in the tables following the Portfolio of Investments. Only the current day's variation margin is reported in receivables or payables in the Statement of Assets and Liabilities.
The following table indicates the effect of derivative instruments (not considered to be hedging instruments for accounting disclosure purposes) in the Statement of Operations for the year ended February 29, 2016:
Amount of Realized Gain (Loss) on Derivatives Recognized in Income | |
Risk Exposure Category | | Futures Contracts ($) | |
Equity risk | | | (511,936 | ) | |
Change in Unrealized Appreciation (Depreciation) on
Derivatives Recognized in Income | |
Risk Exposure Category | | Futures Contracts ($) | |
Equity risk | | | (10,443 | ) | |
The following table provides a summary of the average outstanding volume by derivative instrument for the year ended February 29, 2016:
Derivative Instrument | | Average Notional Amounts ($)* | |
Futures contracts — Long | | | 10,918,113 | | |
*Based on the ending quarterly outstanding amounts for the year ended February 29, 2016.
Security Transactions
Security transactions are accounted for on the trade date. Cost is determined and gains (losses) are based upon the specific identification method for both financial statement and federal income tax purposes.
Income Recognition
Corporate actions and dividend income are generally recorded net of any non-reclaimable tax withholdings, on
the ex-dividend date or upon receipt of ex-dividend notification in the case of certain foreign securities.
The Fund may receive distributions from holdings in equity securities, business development companies (BDCs), exchange-traded funds, other regulated investment companies (RICs), and real estate investment trusts (REITs), which report information on the tax character of their distributions annually. These distributions are allocated to dividend income, capital gain and return of capital based on actual information reported. Return of capital is recorded as a reduction of the cost basis of securities held. If the Fund no longer owns the applicable securities, return of capital is recorded as a realized gain. With respect to REITs, to the extent actual information has not yet been reported, estimates for return of capital are made by the Fund's management. Management's estimates are subsequently adjusted when the actual character of the distributions is disclosed by the REITs, which could result in a proportionate change in return of capital to shareholders.
Awards from class action litigation are recorded as a reduction of cost basis if the Fund still owns the applicable securities on the payment date. If the Fund no longer owns the applicable securities, the proceeds are recorded as realized gains.
Expenses
General expenses of the Trust are allocated to the Fund and other funds of the Trust based upon relative net assets or other expense allocation methodologies determined by the nature of the expense. Expenses directly attributable to the Fund are charged to the Fund. Expenses directly attributable to a specific class of shares are charged to that share class.
Determination of Class Net Asset Value
All income, expenses (other than class-specific expenses, which are charged to that share class, as shown in the Statement of Operations) and realized and unrealized gains (losses) are allocated to each class of the Fund on a daily basis, based on the relative net assets of each class, for purposes of determining the net asset value of each class.
Federal Income Tax Status
The Fund intends to qualify each year as a regulated investment company under Subchapter M of the Internal Revenue Code, as amended, and will distribute
Annual Report 2016
29
COLUMBIA LARGE CAP ENHANCED CORE FUND
NOTES TO FINANCIAL STATEMENTS (continued)
February 29, 2016
substantially all of its taxable income (including net short-term capital gains), if any, for its tax year, and as such will not be subject to federal income taxes. In addition, the Fund intends to distribute in each calendar year substantially all of its net investment income, capital gains and certain other amounts, if any, such that the Fund should not be subject to federal excise tax. Therefore, no federal income or excise tax provision is recorded.
Distributions to Shareholders
Distributions from net investment income, if any, are declared and paid semi-annually. Net realized capital gains, if any, are distributed at least annually. Income distributions and capital gain distributions are determined in accordance with federal income tax regulations, which may differ from GAAP.
Guarantees and Indemnifications
Under the Trust's organizational documents and, in some cases, by contract, its officers and trustees are indemnified against certain liabilities arising out of the performance of their duties to the Trust or its funds. In addition, certain of the Fund's contracts with its service providers contain general indemnification clauses. The Fund's maximum exposure under these arrangements is unknown since the amount of any future claims that may be made against the Fund cannot be determined, and the Fund has no historical basis for predicting the likelihood of any such claims.
Recent Accounting Pronouncement
Fair Value Measurement (Topic 820), Disclosure for Investments in Certain Entities That Calculate Net Asset Value per Share (or Its Equivalent)
In May 2015, FASB issued Accounting Standards Update (ASU) No. 2015-07, Fair Value Measurement (Topic 820), Disclosure for Investments in Certain Entities That Calculate Net Asset Value per Share (or Its Equivalent). ASU No. 2015-07 changes the disclosure requirements for investments for which fair value is measured using the net asset value per share practical expedient. The disclosure requirements are effective for annual periods beginning after December 15, 2015 and interim periods within those fiscal years. At this time, management is evaluating the implications of this guidance and the impact it will have on the financial statement amounts and footnote disclosures, if any.
Note 3. Fees and Other Transactions with Affiliates
Management Fees
Effective July 1, 2015, the Fund entered into a Management Agreement with Columbia Management Investment Advisers, LLC (the Investment Manager), a wholly-owned subsidiary of Ameriprise Financial, Inc. (Ameriprise Financial). Under the Management Agreement, the Investment Manager provides the Fund with investment research and advice, as well as administrative and accounting services. The management services fee is an annual fee that is equal to a percentage of the Fund's average daily net assets that declines from 0.75% to 0.55% as the Fund's net assets increase. The effective management services fee rate, net of fee waivers, for the year ended February 29, 2016 was 0.73% of the Fund's average daily net assets.
Prior to July 1, 2015, the Fund paid the Investment Manager an annual fee for advisory services under an Investment Management Services Agreement and a separate annual fee for administrative and accounting services under an Administrative Services Agreement. For the period from March 1, 2015 through June 30, 2015, the investment advisory services fee paid to the Investment Manager was $1,032,142, and the administrative services fee paid to the Investment Manager was $96,763.
Prior to July 1, 2015, the Investment Manager contractually agreed to waive 0.05% of the Fund's investment management fee. The effective investment management fee rate, net of fee waivers, for the period ended June 30, 2015 was 0.64% of the Fund's average daily net assets.
Other Expenses
Other expenses are for, among other things, miscellaneous expenses of the Fund or the Board, including payments to Board Services Corp., a company providing limited administrative services to the Fund and the Board. That company's expenses include boardroom and office expense, employee compensation, employee health and retirement benefits, and certain other expenses. For the year ended February 29, 2016, other expenses paid by the Fund to this company were $2,026.
Compensation of Board Members
Board members, who are not officers or employees of the Investment Manager or Ameriprise Financial, are
Annual Report 2016
30
COLUMBIA LARGE CAP ENHANCED CORE FUND
NOTES TO FINANCIAL STATEMENTS (continued)
February 29, 2016
compensated for their services to the Fund as disclosed in the Statement of Operations. Under a Deferred Compensation Plan (the Plan), these Board members may elect to defer payment of up to 100% of their compensation. Deferred amounts are treated as though equivalent dollar amounts had been invested in shares of certain funds managed by the Investment Manager. The Fund's liability for these amounts is adjusted for market value changes and remains in the Fund until distributed in accordance with the Plan. All amounts payable under the Plan constitute a general unsecured obligation of the Fund.
Transfer Agency Fees
Under a Transfer and Dividend Disbursing Agent Agreement, Columbia Management Investment Services Corp. (the Transfer Agent), an affiliate of the Investment Manager and a wholly-owned subsidiary of Ameriprise Financial, is responsible for providing transfer agency services to the Fund. The Transfer Agent has contracted with Boston Financial Data Services (BFDS) to serve as sub-transfer agent.
The Transfer Agent receives a monthly transfer agency fee based on the number or the average value of accounts, depending on the type of account. In addition, the Transfer Agent also receives sub-transfer agency fees based on a percentage of the average aggregate value of the Fund's shares maintained in omnibus accounts (other than omnibus accounts for which American Enterprise Investment Services Inc. is the broker of record or accounts where the beneficial shareholder is a customer of Ameriprise Financial Services, Inc., for which the Transfer Agent receives a per account fee). The Transfer Agent pays the fees of BFDS for services as sub-transfer agent and is not entitled to reimbursement for such fees from the Fund (with the exception of out-of-pocket fees).
The Transfer Agent also receives compensation from the Fund for various shareholder services and reimbursements for certain out-of-pocket fees. Total transfer agency fees for Class R5 shares are subject to an annual limitation of not more than 0.05% of the average daily net assets attributable to Class R5 shares. Class I and Class Y shares do not pay transfer agency fees.
For the year ended February 29, 2016, the Fund's effective transfer agency fee rates as a percentage of average daily net assets of each class were as follows:
Class A | | | 0.20 | % | |
Class R | | | 0.21 | | |
Class R4* | | | 0.20 | | |
Class R5 | | | 0.05 | | |
Class Z | | | 0.21 | | |
* Annualized.
An annual minimum account balance fee of $20 may apply to certain accounts with a value below the applicable share class's initial minimum investment requirements to reduce the impact of small accounts on transfer agency fees. These minimum account balance fees are remitted to the Fund and recorded as part of expense reductions in the Statement of Operations. For the year ended February 29, 2016, no minimum account balance fees were charged by the Fund.
Distribution and Service Fees
The Fund has an agreement with Columbia Management Investment Distributors, Inc. (the Distributor), an affiliate of the Investment Manager and a wholly-owned subsidiary of Ameriprise Financial, for distribution and shareholder services. The Board has approved, and the Fund has adopted, distribution and shareholder service plans (the Plans) applicable to certain share classes, which set the distribution and service fees for the Fund. These fees are calculated daily and are intended to compensate the Distributor and/or eligible selling and/or servicing agents for selling shares of the Fund and providing services to investors.
Under the Plans, the Fund pays a monthly combined distribution and service fee to the Distributor at the maximum annual rate of 0.25% of the average daily net assets attributable to Class A shares of the Fund. Also under the Plans, the Fund pays a monthly distribution fee at the maximum annual rate of 0.50% of the average daily net assets attributable to Class R shares of the Fund, respectively.
Expenses Waived/Reimbursed by the Investment Manager and its Affiliates
The Fund's expense ratio is subject to an expense reimbursement arrangement pursuant to which fees will be waived and/or expenses reimbursed (excluding certain fees and expenses described below), so that the Fund's net operating expenses, after giving effect to fees
Annual Report 2016
31
COLUMBIA LARGE CAP ENHANCED CORE FUND
NOTES TO FINANCIAL STATEMENTS (continued)
February 29, 2016
waived/expenses reimbursed and any balance credits and/or overdraft charges from the Fund's custodian, do not exceed the following annual rates as a percentage of the class' average daily net assets:
| | | Contractual
Expense Cap
July 1, 2015
Through
June 30, 2016 | | Contractual
Expense Cap
Prior to
July 1, 2015 | |
Class A | | | 0.90 | % | | | 1.02 | % | |
Class I | | | 0.50 | | | | 0.62 | | |
Class R | | | 1.15 | | | | 1.27 | | |
Class R4* | | | 0.65 | | | | — | | |
Class R5 | | | 0.55 | | | | 0.67 | | |
Class Y | | | 0.50 | | | | 0.62 | | |
Class Z | | | 0.65 | | | | 0.77 | | |
* Expense cap rate is contractual from July 1, 2015 (the commencement of operations of Class R4 shares) through June 30, 2016.
The contractual agreement may be modified or amended only with approval from the Investment Manager, certain of its affiliates and the Fund. Under the arrangements, the following fees and expenses are excluded from the waiver/reimbursement commitment, and therefore will be paid by the Fund, if applicable: taxes (including foreign transaction taxes), expenses associated with investments in affiliated and non-affiliated pooled investment vehicles (including mutual funds and exchange-traded funds), transaction costs and brokerage commissions, costs related to any securities lending program, dividend and interest expenses associated with securities sold short, inverse floater program fees and expenses, transaction charges and interest on borrowed money, interest and extraordinary expenses. Prior to July 1, 2015, the Fund's expense ratio was subject to a voluntary expense reimbursement arrangement pursuant to which fees were waived and/or expenses reimbursed (excluding certain fees and expenses immediately described above), so that the Fund's net operating expenses, after giving effect to fees waived/expenses reimbursed and any balance credits and/or overdraft charges from the Fund's custodian, did not exceed the annual rates of 0.90% for Class A, 0.50% for Class I, 1.15% for Class R, 0.55% for Class R5, 0.50% for Class Y and 0.65% for Class Z.
Any fees waived and/or expenses reimbursed under the expense reimbursement arrangements described above are not recoverable by the Investment Manager or its affiliates in future periods.
Note 4. Federal Tax Information
The timing and character of income and capital gain distributions are determined in accordance with income tax regulations, which may differ from GAAP because of temporary or permanent book to tax differences.
At February 29, 2016, these differences are primarily due to differing treatment for capital loss carryforwards, deferral/reversal of wash sale losses, Trustees' deferred compensation, post-October capital losses, re-characterization of distributions for investments, derivative investments and tax straddles. To the extent these differences are permanent, reclassifications are made among the components of the Fund's net assets in the Statement of Assets and Liabilities. Temporary differences do not require reclassifications. In the Statement of Assets and Liabilities the following reclassifications were made:
Undistributed net investment income | | $ | (87,988 | ) | |
Accumulated net realized loss | | | 104,752 | | |
Paid-in capital | | | (16,764 | ) | |
Net investment income (loss) and net realized gains (losses), as disclosed in the Statement of Operations, and net assets were not affected by this reclassification.
The tax character of distributions paid during the years indicated was as follows:
Year Ended February 29, | | 2016 | | 2015 | |
Ordinary income | | $ | 10,496,335 | | | $ | 4,227,532 | | |
Short-term capital gain distributions, if any, are considered ordinary income distributions for tax purposes.
At February 29, 2016, the components of distributable earnings on a tax basis were as follows:
Undistributed ordinary income | | $ | 803,221 | | |
Capital loss carryforwards | | | (4,131,287 | ) | |
Net unrealized appreciation | | | 45,157,055 | | |
At February 29, 2016, the cost of investments for federal income tax purposes was $407,893,486 and the aggregate gross unrealized appreciation and depreciation based on that cost was:
Unrealized appreciation | | $ | 72,607,774 | | |
Unrealized depreciation | | | (27,450,719 | ) | |
Net unrealized appreciation | | | 45,157,055 | | |
The following capital loss carryforwards, determined at February 29, 2016, may be available to reduce taxable income arising from future net realized gains on
Annual Report 2016
32
COLUMBIA LARGE CAP ENHANCED CORE FUND
NOTES TO FINANCIAL STATEMENTS (continued)
February 29, 2016
investments, if any, to the extent permitted by the Internal Revenue Code:
Year of Expiration | | Amount ($) | |
| | 2018 | | | | 4,131,287 | | |
For the year ended February 29, 2016, $5,984,869 of capital loss carryforward was utilized.
Under current tax rules, regulated investment companies can elect to treat certain late-year ordinary losses incurred and post-October capital losses (capital losses realized after October 31) as arising on the first day of the following taxable year. As of February 29, 2016, the Fund will elect to treat post-October capital losses of $3,525,584 as arising on March 1, 2016.
Management of the Fund has concluded that there are no significant uncertain tax positions in the Fund that would require recognition in the financial statements. However, management's conclusion may be subject to review and adjustment at a later date based on factors including, but not limited to, new tax laws, regulations, and administrative interpretations (including relevant court decisions). Generally, the Fund's federal tax returns for the prior three fiscal years remain subject to examination by the Internal Revenue Service.
Note 5. Portfolio Information
The cost of purchases and proceeds from sales of securities, excluding short-term investments and derivatives, if any, aggregated to $460,888,257 and $411,849,503, respectively, for the year ended February 29, 2016. The amount of purchase and sale activity impacts the portfolio turnover rate reported in the Financial Highlights.
Note 6. Affiliated Money Market Fund
The Fund invests in Columbia Short-Term Cash Fund, an affiliated money market fund established for the exclusive use by the Fund and other affiliated funds. The income earned by the Fund from such investments is included as Dividends — affiliated issuers in the Statement of Operations. As an investing fund, the Fund indirectly bears its proportionate share of the expenses of Columbia Short-Term Cash Fund.
Note 7. Line of Credit
The Fund has access to a revolving credit facility whereby the Fund may borrow for the temporary funding of shareholder redemptions or for other temporary or emergency purposes. Effective December 8, 2015, Citibank, N.A. and HSBC Bank USA, N.A. joined JPMorgan
Chase Bank, N.A. (JPMorgan) as lead of a syndicate of banks under the credit facility, which is a collective agreement between the Fund and certain other funds managed by the Investment Manager, severally and not jointly, that permits collective borrowings up to $1 billion. Interest is charged to each participating fund based on its borrowings at a rate equal to the higher of (i) the overnight federal funds rate plus 1.00% or (ii) the one-month LIBOR rate plus 1.00%. Each borrowing under the credit facility matures no later than 60 days after the date of borrowing. The Fund also pays a commitment fee equal to its pro rata share of the amount of the credit facility at a rate of 0.15% per annum. The commitment fee is included in other expenses in the Statement of Operations. Prior to December 8, 2015, JPMorgan was the sole lead bank under the credit facility agreement that permitted borrowings up to $550 million under the same terms and interest rates as described above with the exception of the commitment fee which was charged at a rate of 0.075% per annum.
The Fund had no borrowings during the year ended February 29, 2016.
Note 8. Significant Risks
Shareholder Concentration Risk
At February 29, 2016, one unaffiliated shareholder of record owned 58.1% of the outstanding shares of the Fund in one or more accounts. The Fund has no knowledge about whether any portion of those shares was owned beneficially. Affiliated shareholders of record owned 14.9% of the outstanding shares of the Fund in one or more accounts. Subscription and redemption activity by concentrated accounts may have a significant effect on the operations of the Fund. In the case of a large redemption, the Fund may be forced to sell investments at inopportune times, including its liquid or more liquid positions, resulting in Fund losses and the Fund holding a higher percentage of less liquid or illiquid securities. Large redemptions could result in decreased economies of scale and increased operating expenses for non-redeeming Fund shareholders.
Technology and Technology-related Investment Risk
The Fund may be more susceptible to the particular risks that may affect companies in the information technology sector, as well as other technology-related sectors (collectively, the technology sectors) than if it were invested in a wider variety of companies in unrelated sectors. Companies in the technology sectors are
Annual Report 2016
33
COLUMBIA LARGE CAP ENHANCED CORE FUND
NOTES TO FINANCIAL STATEMENTS (continued)
February 29, 2016
subject to certain risks, including the risk that new services, equipment or technologies will not be accepted by consumers and businesses or will become rapidly obsolete. Performance of such companies may be affected by factors including obtaining and protecting patents (or the failure to do so) and significant competitive pressures, including aggressive pricing of their products or services, new market entrants, competition for market share and short product cycles due to an accelerated rate of technological developments. Such competitive pressures may lead to limited earnings and/or falling profit margins. As a result, the value of their securities may fall or fail to rise. In addition, many technology sector companies have limited operating histories and prices of these companies' securities historically have been more volatile than other securities, especially over the short term.
Note 9. Subsequent Events
Management has evaluated the events and transactions that have occurred through the date the financial statements were issued and noted no items requiring adjustment of the financial statements or additional disclosure.
Note 10. Information Regarding Pending and Settled Legal Proceedings
In December 2005, without admitting or denying the allegations, American Express Financial Corporation (AEFC, which is now known as Ameriprise Financial, Inc. (Ameriprise Financial)) entered into settlement agreements with the Securities and Exchange Commission (SEC) and Minnesota Department of Commerce (MDOC) related to market timing activities. As a result, AEFC was censured and ordered to cease and desist from committing or causing any violations of certain provisions of the Investment Advisers Act of 1940, the Investment Company Act of 1940, and various Minnesota laws. AEFC agreed to pay disgorgement of $10 million and civil money penalties of $7 million. AEFC also agreed to retain an independent distribution consultant to assist in developing a plan for distribution of all disgorgement and civil penalties ordered by the SEC in accordance with various undertakings detailed at http://www.sec.gov/litigation/admin/ia-2451.pdf. Ameriprise Financial and its affiliates have cooperated with the SEC and the MDOC in these legal proceedings, and have made regular reports to the Funds' Boards of Trustees.
Ameriprise Financial and certain of its affiliates have historically been involved in a number of legal, arbitration and regulatory proceedings, including routine litigation, class actions, and governmental actions, concerning matters arising in connection with the conduct of their business activities. Ameriprise Financial believes that the Funds are not currently the subject of, and that neither Ameriprise Financial nor any of its affiliates are the subject of, any pending legal, arbitration or regulatory proceedings that are likely to have a material adverse effect on the Funds or the ability of Ameriprise Financial or its affiliates to perform under their contracts with the Funds. Ameriprise Financial is required to make quarterly (10-Q), annual (10-K) and, as necessary, 8-K filings with the SEC on legal and regulatory matters that relate to Ameriprise Financial and its affiliates. Copies of these filings may be obtained by accessing the SEC website at www.sec.gov.
There can be no assurance that these matters, or the adverse publicity associated with them, will not result in increased fund redemptions, reduced sale of fund shares or other adverse consequences to the Funds. Further, although we believe proceedings are not likely to have a material adverse effect on the Funds or the ability of Ameriprise Financial or its affiliates to perform under their contracts with the Funds, these proceedings are subject to uncertainties and, as such, we are unable to estimate the possible loss or range of loss that may result. An adverse outcome in one or more of these proceedings could result in adverse judgments, settlements, fines, penalties or other relief that could have a material adverse effect on the consolidated financial condition or results of operations of Ameriprise Financial.
Annual Report 2016
34
COLUMBIA LARGE CAP ENHANCED CORE FUND
REPORT OF INDEPENDENT REGISTERED PUBLIC ACCOUNTING FIRM
To the Trustees of Columbia Funds Series Trust and the Shareholders of
Columbia Large Cap Enhanced Core Fund
In our opinion, the accompanying statement of assets and liabilities, including the portfolio of investments, and the related statements of operations and of changes in net assets and the financial highlights present fairly, in all material respects, the financial position of Columbia Large Cap Enhanced Core Fund (the "Fund," a series of Columbia Funds Series Trust) at February 29, 2016, and the results of its operations, the changes in its net assets and the financial highlights for each of the periods indicated, in conformity with accounting principles generally accepted in the United States of America. These financial statements and financial highlights (hereafter referred to as "financial statements") are the responsibility of the Fund's management. Our responsibility is to express an opinion on these financial statements based on our audits. We conducted our audits of these financial statements in accordance with the standards of the Public Company Accounting Oversight Board (United States). Those standards require that we plan and perform the audit to obtain reasonable assurance about whether the financial statements are free of material misstatement. An audit includes examining, on a test basis, evidence supporting the amounts and disclosures in the financial statements, assessing the accounting principles used and significant estimates made by management, and evaluating the overall financial statement presentation. We believe that our audits, which included confirmation of securities at February 29, 2016 by correspondence with the custodian, brokers and transfer agent, provide a reasonable basis for our opinion.
PricewaterhouseCoopers LLP
Minneapolis, MN
April 21, 2016
Annual Report 2016
35
COLUMBIA LARGE CAP ENHANCED CORE FUND
FEDERAL INCOME TAX INFORMATION
(Unaudited)
The Fund hereby designates the following tax attributes for the fiscal year ended February 29, 2016. Shareholders will be notified in early 2017 of the amounts for use in preparing 2016 income tax returns.
Tax Designations
| Qualified Dividend Income | | | 100.00 | % | |
| Dividends Received Deduction | | | 100.00 | % | |
Qualified Dividend Income. For taxable, non-corporate shareholders, the percentage of ordinary income distributed during the fiscal year that represents qualified dividend income subject to reduced tax rates.
Dividends Received Deduction. The percentage of ordinary income distributed during the fiscal year that qualifies for the corporate dividends received deduction.
Annual Report 2016
36
COLUMBIA LARGE CAP ENHANCED CORE FUND
Shareholders elect the Board that oversees the Fund's operations. The Board appoints officers who are responsible for day-to-day business decisions based on policies set by the Board. The following table provides basic biographical information about the Fund's Trustees, including their principal occupations during the past five years, although specific titles for individuals may have varied over the period. Under current Board policy, members generally may serve through the end of the calendar year in which they reach either the mandatory retirement age established by the Board or the fifteenth anniversary of the first Board meeting they attended as a member of the Board.
Trustees
Independent Trustees
Name,
Address,
Year of Birth | | Position Held With
the Funds and Length of
Service | | Principal Occupation(s)
During the Past Five Years
and Other Relevant
Professional Experience | | Number of
Funds in the
Columbia
Funds Complex
Overseen | | Other Directorships
Held by Trustee
During the Past
Five Years | |
Kathleen Blatz
901 S. Marquette Ave.
Minneapolis, MN 55402
1954 | | Trustee since 1/06 for RiverSource Funds and since 6/11 for Nations Funds | | Attorney; specializing in arbitration and mediation; Chief Justice, Minnesota Supreme Court, 1998-2006; Associate Justice, Minnesota Supreme Court, 1996-1998; Fourth Judicial District Court Judge, Hennepin County, 1994-1996; Attorney in private practice and public service, 1984-1993; State Representative, Minnesota House of Representatives, 1979-1993, which included service on the Tax and Financial Institutions and Insurance Committees | | | 124 | | | Trustee, BlueCross BlueShield of Minnesota (Chair of the Business Development Committee) since 2009; Chair of the Robina Foundation since August 2013 | |
Edward J. Boudreau, Jr.
901 S. Marquette Ave.
Minneapolis, MN 55402
1944 | | Trustee since 6/11 for RiverSource Funds and since 1/05 for Nations Funds | | Managing Director, E.J. Boudreau & Associates (consulting) since 2000; FINRA Industry Arbitrator, 2002-present; Chairman and Chief Executive Officer, John Hancock Funds (asset management), Chairman and Interested Trustee for open-end and closed-end funds offered by John Hancock, 1989-2000; John Hancock Life Insurance Company, including SVP and Treasurer and SVP Information Technology, 1968-1988 | | | 122 | | | Former Trustee, Boston Museum of Science (Chair of Finance Committee), 1985-2013; former Trustee, BofA Funds Series Trust (11 funds), 2005-2011 | |
Pamela G. Carlton
901 S. Marquette Ave.
Minneapolis, MN 55402
1954 | | Trustee since 7/07 for RiverSource Funds and since 6/11 for Nations Funds | | President, Springboard-Partners in Cross Cultural Leadership (consulting company) since 2003; Managing Director of US Equity Research, JP Morgan Chase, 1999-2003; Director of US Equity Research, Chase Asset Management, 1996-1999; Co-Director Latin America Research, 1993-1996, COO Global Research, 1992-1996, Co-Director of US Research, 1991-1992, Investment Banker, Morgan Stanley, 1982-1991 | | | 124 | | | Trustee, New York Presbyterian Hospital Board (Executive Committee and Chair of Human Resources Committee) since 1996 | |
Annual Report 2016
37
COLUMBIA LARGE CAP ENHANCED CORE FUND
TRUSTEES AND OFFICERS (continued)
Independent Trustees (continued)
Name,
Address,
Year of Birth | | Position Held With
the Funds and Length of
Service | | Principal Occupation(s)
During the Past Five Years
and Other Relevant
Professional Experience | | Number of
Funds in the
Columbia
Funds Complex
Overseen | | Other Directorships
Held by Trustee
During the Past
Five Years | |
William P. Carmichael
901 S. Marquette Ave.
Minneapolis, MN 55402
1943 | | Trustee since 6/11 for RiverSource Funds and since 2003 for Nations Funds; Chair of the Board from 1/14-11/15 | | Retired; Co-founder, The Succession Fund (provides exit strategies to owners of privately held companies), 1998-2007; Adjunct Professor of Finance, Kelley School of Business, Indiana University, 1993-2007; Senior Vice President, Sara Lee Corporation, 1991-1993; Senior Vice President and Chief Financial Officer, Beatrice Foods Company, 1984-1990; Vice President, Esmark, Inc., 1973-1984; Associate, Price Waterhouse, 1968-1972 | | | 124 | | | Director, The Finish Line (athletic shoes and apparel) since July 2003; Director, International Textile Corp. since 2012; Director, hhgregg since May, 2015; former Director, Cobra Electronics Corporation (electronic equipment manufacturer), 1994-August 2014; former Director, Spectrum Brands, Inc. (consumer products), 2002-2009; former Director, Simmons Company (bedding), 2004-2010; former Trustee, BofA Funds Series Trust (11 funds), 2009-2011; former Director, McMoRan Exploration Company (oil and gas exploration and development), 2010-2013 | |
Patricia M. Flynn
901 S. Marquette Ave.
Minneapolis, MN 55402
1950 | | Trustee since 11/04 for RiverSource Funds and since 6/11 for Nations Funds | | Trustee Professor of Economics and Management, Bentley University since 1976 (also teaches and conducts research on corporate governance); Dean, McCallum Graduate School of Business, Bentley University, 1992-2002 | | | 124 | | | Trustee, MA Taxpayers Foundation since 1997; Board of Governors, Innovation Institute, MA Technology Collaborative since 2010 | |
William A. Hawkins
901 S. Marquette Ave.
Minneapolis, MN 55402
1942 | | Chair of the Board since 11/15; Trustee since 6/11 for RiverSource Funds and since 1/05 for Nations Funds | | Managing Director, Overton Partners (financial consulting) since August 2010; President and Chief Executive Officer, California General Bank, N.A., January 2008-August 2010; Operation Hope, COO, 2004-2007; IndyMac Bancorp, President, CBG, 1999-2003; American General Bank, President, 1997-1999; Griffin Financial Services, CEO, 1981-1997; The Griffin Funds, CEO, 1992-1998 | | | 124 | | | Former Trustee, BofA Funds Series Trust (11 funds), 2009-2015 | |
R. Glenn Hilliard
901 S. Marquette Ave.
Minneapolis, MN 55402
1943 | | Trustee since 6/11 for RiverSource Funds and since 1/05 for Nations Funds | | Chairman and Chief Executive Officer, Hilliard Group LLC (investing and consulting) since April 2003; Non-Executive Director & Chairman, CNO Financial Group, Inc. (insurance), 2003-2011; Chair & CEO, ING Americas, 1996-2003 | | | 122 | | | Chairman, BofA Funds Series Trust (11 funds); former Director, CNO Financial Group, Inc. (insurance), 2003-2011 | |
Annual Report 2016
38
COLUMBIA LARGE CAP ENHANCED CORE FUND
TRUSTEES AND OFFICERS (continued)
Independent Trustees (continued)
Name,
Address,
Year of Birth | | Position Held With
the Funds and Length of
Service | | Principal Occupation(s)
During the Past Five Years
and Other Relevant
Professional Experience | | Number of
Funds in the
Columbia
Funds Complex
Overseen | | Other Directorships
Held by Trustee
During the Past
Five Years | |
Catherine James Paglia
901 S. Marquette Ave.
Minneapolis, MN 55402
1952 | | Trustee since 11/04 for RiverSource Funds and since 6/11 for Nations Funds | | Director, Enterprise Asset Management, Inc. (private real estate and asset management company) since September 1998; Managing Director and Partner, Interlaken Capital, Inc., 1989-1997; Managing Director, Morgan Stanley, 1982-1989; Vice President, Investment Banking, 1980-1982, Associate, Investment Banking, 1976-1980, Dean Witter Reynolds, Inc. | | | 124 | | | Director, Valmont Industries, Inc. (irrigation systems manufacturer) since 2012; Trustee, Carleton College (on the Investment Committee); Trustee, Carnegie Endowment for International Peace (on the Investment Committee) | |
Leroy C. Richie
901 S. Marquette Ave.
Minneapolis, MN 55402
1941 | | Trustee since 2000 for Seligman Funds, since 11/08 for RiverSource Funds and since 6/11 for Nations Funds | | Counsel, Lewis & Munday, P.C. (law firm) since 2004; Vice President and General Counsel, Automotive Legal Affairs, Chrysler Corporation, 1993-1997 | | | 122 | | | Lead Outside Director, Infinity Resources, Inc. (oil and gas exploration and production) since 1994; Lead Outside Director, Digital Ally, Inc. (digital imaging) since September 2005; Trustee, Marygrove College (Chair of Finance Committee) since 2007; former Director, OGE Energy Corp. (energy and energy services), 2007-2014 | |
Minor M. Shaw
901 S. Marquette Ave.
Minneapolis, MN 55402
1947 | | Trustee since 6/11 for RiverSource Funds and since 2003 for Nations Funds | | President, Micco LLC (private investments) since 2011; President, Micco Corp. (family investment business), 1998-2011 | | | 124 | | | Director, Piedmont Natural Gas; Director, BlueCross BlueShield of South Carolina since April 2008; Chair of the Duke Endowment; Director, National Association of Corporate Directors, Carolinas Chapter since 2013; Chair of Greenville — Spartanburg Airport Commission; former Trustee, BofA Funds Series Trust (11 funds), 2003-2011 | |
Alison Taunton-Rigby
901 S. Marquette Ave.
Minneapolis, MN 55402
1944 | | Trustee since 11/02 for RiverSource Funds and since 6/11 for Nations Funds | | Managing Director, Forester Biotech (consulting), 2001-2003; Chief Executive Officer and Director, RiboNovix, Inc., (biotechnology), 2003-2010; President and Chief Executive Officer of CMT Inc., 2001-2003; Aquila Biopharmaceuticals Inc., 1996-2000; Cambridge Biotech Corporation, 1995-1996; Mitotix Inc., 1993-1994 | | | 124 | | | Director, Abt Associates (government contractor) since 2001; Director, Boston Children's Hospital since 2002; Director, Healthways, Inc. (health and well-being solutions) since 2005; Director, ICI Mutual Insurance Company since 2011 | |
Annual Report 2016
39
COLUMBIA LARGE CAP ENHANCED CORE FUND
TRUSTEES AND OFFICERS (continued)
Interested Trustee Not Affiliated with Investment Manager*
Name,
Address,
Year of Birth | | Position Held With
Funds and Length of
Service | | Principal Occupation(s)
During Past Five Years
and Other Relevant
Professional Experience | | Number of
Funds in the
Fund Family
Overseen by
Board Member | | Other Present or Past
Directorships/
Trusteeships
(Within Past 5 Years) | |
Anthony M. Santomero
901 S. Marquette Ave.
Minneapolis, MN 55402
1946 | | Trustee since 6/11 for RiverSource Funds and since 1/08 for Nations Funds | | Richard K. Mellon Professor Emeritus of Finance, The Wharton School, University of Pennsylvania since 2002; Senior Advisor, McKinsey & Company (consulting), 2006-2008; President, Federal Reserve Bank of Philadelphia, 2000-2006; Professor of Finance, The Wharton School, University of Pennsylvania, 1972-2002 | | | 122 | | | Trustee, Penn Mutual Life Insurance Company since March 2008; Director, Renaissance Reinsurance Ltd. since May 2008; Director, Citigroup Inc. since 2009; Director, Citibank, N.A. since 2009; former Trustee, BofA Funds Series Trust (11 funds), 2008-2011 | |
* Dr. Santomero is not an affiliated person of the Investment Manager or Ameriprise Financial. However, he is currently deemed by the Funds to be an "interested person" (as defined in the 1940 Act) of the Funds because he serves as a Director of Citigroup Inc. and Citibank, N.A., companies that may directly or through subsidiaries and affiliates engage from time-to-time in brokerage execution, principal transactions and lending relationships with the Funds or accounts advised/managed by the Investment Manager.
Annual Report 2016
40
COLUMBIA LARGE CAP ENHANCED CORE FUND
TRUSTEES AND OFFICERS (continued)
Interested Trustee Affiliated with Investment Manager*
Name,
Address,
Year of Birth | | Position Held With
the Funds and Length of
Service | | Principal Occupation(s)
During Past Five Years
and Other Relevant
Professional Experience | | Number of
Funds in the
Columbia
Funds Complex
Overseen | | Other Directorships
Held by Trustee
During the Past
Five Years | |
William F. Truscott
c/o Columbia Management Investment Advisers, LLC,
225 Franklin St.
Boston, MA 02110
1960 | | Trustee since 11/01 for RiverSource Funds and since 6/11 for Nations Funds; Senior Vice President since 2002 for RiverSource Funds and since 5/10 for Nations Funds | | Chairman of the Board and President, Columbia Management Investment Advisers, LLC since May 2010 and February 2012, respectively (previously President and Chief Investment Officer, 2001-April 2010); Chief Executive Officer, Global Asset Management, Ameriprise Financial, Inc. since September 2012 (previously Chief Executive Officer, U.S. Asset Management & President, Annuities, May 2010-September 2012 and President — U.S. Asset Management and Chief Investment Officer, 2005-April 2010); Director and Chief Executive Officer, Columbia Management Investment Distributors, Inc. since May 2010 and February 2012, respectively (previously Chairman of the Board and Chief Executive Officer, 2006-April 2010); Chairman of the Board and Chief Executive Officer, RiverSource Distributors, Inc. since 2006; Director, Threadneedle Asset Management Holdings, SARL since 2014; President and Chief Executive Officer, Ameriprise Certificate Company, 2006-August 2012. | | | 182 | | | Chairman of the Board, Columbia Management Investment Advisers, LLC since May 2010; Director, Columbia Management Investment Distributors, Inc. since May 2010; Former Director, Ameriprise Certificate Company, 2006-January 2013 | |
* Interested person (as defined under the 1940 Act) by reason of being an officer, director, security holder and/or employee of the Investment Manager or Ameriprise Financial.
The Statement of Additional Information has additional information about the Fund's Board members and is available, without charge, upon request by calling 800.345.6611; contacting your financial intermediary; or visiting columbiathreadneedle.com/us.
Annual Report 2016
41
COLUMBIA LARGE CAP ENHANCED CORE FUND
TRUSTEES AND OFFICERS (continued)
The Board has appointed officers who are responsible for day-to-day business decisions based on policies it has established. The officers serve at the pleasure of the Board. The following table provides basic information about the Officers of the Fund, including principal occupations during the past five years, although their specific titles may have varied over the period. In addition to Mr. Truscott, who is Senior Vice President, the Fund's other officers are:
Fund Officers
Name,
Address and
Year of Birth | | Position and Year
First Appointed to
Position for any Fund
in the Columbia
Funds Complex or a
Predecessor Thereof | | Principal Occupation(s) During Past Five Years | |
Christopher O. Petersen
5228 Ameriprise
Financial Center
Minneapolis, MN 55474
Born 1970 | | President and Principal Executive Officer (2015) | | Vice President and Lead Chief Counsel, Ameriprise Financial, Inc. since January 2015 (previously, Vice President and Chief Counsel January 2010-December 2014; and Vice President and Group Counsel or Counsel 2004-January 2010); officer of Columbia Funds and affiliated funds since 2007. | |
Michael G. Clarke
225 Franklin Street
Boston, MA 02110
Born 1969 | | Treasurer (2011), Chief Financial Officer (2009) and Chief Accounting Officer (2015) | | Vice President — Mutual Fund Administration, Columbia Management Investment Advisers, LLC, since May 2010; Managing Director of Fund Administration, Columbia Management Advisors, LLC, September 2004-April 2010; senior officer of Columbia Funds and affiliated funds since 2002. | |
Paul B. Goucher
100 Park Avenue
New York, NY 10017
Born 1968 | | Senior Vice President (2011), Chief Legal Officer (2015) and Assistant Secretary (2008) | | Vice President and Lead Chief Counsel, Ameriprise Financial, Inc. since November 2008 and January 2013, respectively (previously Chief Counsel, January 2010-January 2013 and Group Counsel, November 2008-January 2010). | |
Thomas P. McGuire
225 Franklin Street
Boston, MA 02110
Born 1972 | | Senior Vice President and Chief Compliance Officer (2012) | | Vice President — Asset Management Compliance, Ameriprise Financial, Inc., since May 2010; Chief Compliance Officer, Ameriprise Certificate Company since September 2010; Compliance Executive, Bank of America, 2005-April 2010. | |
Colin Moore
225 Franklin Street
Boston, MA 02110
Born 1958 | | Senior Vice President (2010) | | Executive Vice President and Global Chief Investment Officer, Ameriprise Financial, Inc., since July 2013; Director and Global Chief Investment Officer, Columbia Management Investment Advisers, LLC since May 2010; Manager, Managing Director and Chief Investment Officer, Columbia Management Advisors, LLC, 2007-April 2010. | |
Michael E. DeFao
225 Franklin Street
Boston, MA 02110
Born 1968 | | Vice President (2011) and Assistant Secretary (2010) | | Vice President and Chief Counsel, Ameriprise Financial, Inc. since May 2010; Associate General Counsel, Bank of America, 2005-April 2010. | |
Amy Johnson
5228 Ameriprise
Financial Center
Minneapolis, MN 55474
Born 1965 | | Vice President (2006) | | Managing Director and Chief Operating Officer, Columbia Management Investment Advisers, LLC since May 2010 (previously Chief Administrative Officer, 2009-April 2010, and Vice President — Asset Management and Trust Company Services, 2006-2009). | |
Lyn Kephart-Strong
5228 Ameriprise
Financial Center
Minneapolis, MN 55474
Born 1960 | | Vice President (2015) | | President, Columbia Management Investment Services Corp. since October 2014; Vice President & Resolution Officer, Ameriprise Trust Company since August 2009; President, RiverSource Service Corporation 2004-2010. | |
Ryan C. Larrenaga
225 Franklin Street
Boston, MA 02110
Born 1970 | | Vice President and Secretary (2015) | | Vice President and Group Counsel, Ameriprise Financial, Inc. since August 2011 (previously, Counsel from May 2010 to August 2011); Assistant General Counsel, Bank of America, 2005-April 2010; officer of Columbia Funds and affiliated funds since 2005. | |
Annual Report 2016
42
COLUMBIA LARGE CAP ENHANCED CORE FUND
IMPORTANT INFORMATION ABOUT THIS REPORT
Each fund mails one shareholder report to each shareholder address. If you would like more than one report, please call shareholder services at 800.345.6611 and additional reports will be sent to you.
The policy of the Board is to vote the proxies of the companies in which each fund holds investments consistent with the procedures as stated in the Statement of Additional Information (SAI). You may obtain a copy of the SAI without charge by calling 800.345.6611; contacting your financial intermediary; visiting columbiathreadneedle.com/us; or searching the website of the Securities and Exchange Commission (SEC) at sec.gov. Information regarding how each fund voted proxies relating to portfolio securities is filed with the SEC by August 31st for the most recent 12-month period ending June 30th of that year, and is available without charge by visiting columbiathreadneedle.com/us, or searching the website of the SEC at sec.gov.
Each fund files a complete schedule of portfolio holdings with the SEC for the first and third quarters of each fiscal year on Form N-Q. Each fund's Form N-Q is available on the SEC's website at sec.gov and may be reviewed and copied at the SEC's Public Reference Room in Washington, D.C. Information on the operation of the Public Reference Room may be obtained by calling 800.SEC.0330. Each fund's complete schedule of portfolio holdings, as filed on Form N-Q, can also be obtained without charge, upon request, by calling 800.345.6611.
Annual Report 2016
43
Columbia Large Cap Enhanced Core Fund
P.O. Box 8081
Boston, MA 02266-8081

This information is for use with concurrent or prior delivery of a fund prospectus. Please read and consider the investment objectives, risks, charges and expenses for any fund carefully before investing. For a prospectus and summary prospectus, which contains this and other important information about the Fund, go to columbiathreadneedle.com/us. The Fund is distributed by Columbia Management Investment Distributors, Inc., member FINRA, and managed by Columbia Management Investment Advisers, LLC.
Columbia Threadneedle Investments (Columbia Threadneedle) is the global brand name of the Columbia and Threadneedle group of companies.
All rights reserved. Columbia Management Investment Distributors, Inc., 225 Franklin Street, Boston, MA 02110-2804
© 2016 Columbia Management Investment Advisers, LLC.
columbiathreadneedle.com/us
ANN173_02_F01_(04/16)

ANNUAL REPORT
February 29, 2016

COLUMBIA MID CAP VALUE FUND

ABOUT COLUMBIA THREADNEEDLE INVESTMENTS
Columbia Threadneedle Investments is a leading global asset management group that provides a broad range of actively managed investment strategies and solutions for individual, institutional and corporate clients around the world.
With more than 2,000 people, including over 450 investment professionals based in North America, Europe and Asia, we manage $472 billion* of assets across developed and emerging market equities, fixed income, asset allocation solutions and alternatives. We are the 13th largest manager of long-term mutual fund assets in the U.S.** and the 4th largest manager of retail funds in the U.K.***
Our priority is the investment success of our clients. We aim to deliver the investment outcomes they expect through an investment approach that is team-based, performance-driven and risk-aware. Our culture is dynamic and interactive. By sharing our insights across asset classes and geographies, we generate richer perspectives on global, regional and local investment landscapes. The ability to exchange and debate investment ideas in a collaborative environment enriches our teams' investment processes. More importantly, it results in better informed investment decisions for our clients.
Columbia funds are distributed by Columbia Management Investment Distributors, Inc., member FINRA, and managed by Columbia Management Investment Advisers, LLC.
Columbia Threadneedle Investments (Columbia Threadneedle) is the global brand name of the Columbia and Threadneedle group of companies.
* In U.S. dollars as of December 31, 2015. Source: Ameriprise Q4 Earnings Release. Includes all assets managed by entities in the Columbia and Threadneedle groups of companies. Contact us for more current data.
** Source: ICI as of December 31, 2015 for Columbia Management Investment Advisers, LLC.
*** Source: Investment Association as of September 2015 for Threadneedle Asset Management Limited.
© 2016 Columbia Management Investment Advisers, LLC. All rights reserved.
Not part of the shareholder report
 Dear Shareholder,
Today's investors are typically focused on outcomes, like living a certain retirement lifestyle, paying for college education or building a legacy. But in today's complex global investment landscape, even simple goals are not easily achieved.
At Columbia Threadneedle Investments, we aspire to help satisfy five core needs of today's investors:
n Generate an appropriate stream of income in retirement
Traditional approaches to generating income may not provide the diversification benefits they once did, and they may actually introduce unwanted risk in today's market. To seek to improve your potential to live comfortably long term, we endeavor to pursue investments that explore less traveled paths to income.
n Navigate a changing interest rate environment
Today's uncertain market environment includes the prospect of a rise in interest rates. Blending traditional investments with non-traditional or alternative products may help protect your wealth during periods of volatility. We can attempt to help strengthen your portfolio with agile products designed to take on the market's ups and downs.
n Maximize after-tax returns
In an environment where what you keep may be more important than what you earn, municipal bonds can help mitigate high tax burdens while providing potentially attractive yields. Our state and federal tax-exempt products are aimed at helping investors manage risk, minimize the fluctuation of capital and grow wealth on a more tax-efficient basis.
n Grow assets to achieve financial goals
We believe that finding and protecting growth comes from a disciplined security selection process designed to create excess return. Our goal is to provide investment solutions built to help you face today's market challenges and grow your assets at each crossroad of your journey.
n Ease the impact of volatile markets
Despite a bull market run that has benefited many investors over the past several years, it's important to remember the lessons of 2008 and the value that a well-diversified portfolio may provide through times of market volatility. We are here to help you hold onto the savings you have worked tirelessly to amass, and to provide you the best opportunity to maintain your standard of living regardless of market conditions.
Find out today how we can help you confidently invest to realize your dreams. Please visit us at blog.columbiathreadneedleus.com/our-best-ideas to learn more about our unique investment solutions.
The world is constantly changing, but our priority remains the same: to help you secure your finances, meet your goals and achieve success. Thank you for your continued investment with us.
Sincerely,

Christopher O. Petersen
President, Columbia Funds
Investors should consider the investment objectives, risks, charges and expenses of a mutual fund carefully before investing. For a free prospectus and summary prospectus, which contains this and other important information about a fund, visit columbiathreadneedle.com/us. The prospectus should be read carefully before investing.
Columbia Funds are distributed by Columbia Management Investment Distributors, Inc., member FINRA, and managed by Columbia Management Investment Advisers, LLC.
© 2016 Columbia Management Investment Advisers, LLC. All rights reserved.
COLUMBIA MID CAP VALUE FUND
Fund Investment Manager
Columbia Management Investment
Advisers, LLC
225 Franklin Street
Boston, MA 02110
Fund Distributor
Columbia Management Investment
Distributors, Inc.
225 Franklin Street
Boston, MA 02110
Fund Transfer Agent
Columbia Management Investment
Services Corp.
P.O. Box 8081
Boston, MA 02266-8081
For more information about any of the funds, please visit columbiathreadneedle.com/us or call 800.345.6611. Customer Service Representatives are available to answer your questions Monday through Friday from 8 a.m. to 7 p.m. Eastern time.
The views expressed in this report reflect the current views of the respective parties. These views are not guarantees of future performance and involve certain risks, uncertainties and assumptions that are difficult to predict, so actual outcomes and results may differ significantly from the views expressed. These views are subject to change at any time based upon economic, market or other conditions and the respective parties disclaim any responsibility to update such views. These views may not be relied on as investment advice and, because investment decisions for a Columbia fund are based on numerous factors, may not be relied on as an indication of trading intent on behalf of any particular Columbia fund. References to specific securities should not be construed as a recommendation or investment advice.
Performance Overview | | | 3 | | |
Manager Discussion of Fund Performance | | | 5 | | |
Understanding Your Fund's Expenses | | | 7 | | |
Portfolio of Investments | | | 8 | | |
Statement of Assets and Liabilities | | | 13 | | |
Statement of Operations | | | 16 | | |
Statement of Changes in Net Assets | | | 17 | | |
Financial Highlights | | | 20 | | |
Notes to Financial Statements | | | 31 | | |
Report of Independent Registered Public Accounting Firm | | | 41 | | |
Federal Income Tax Information | | | 42 | | |
Trustees and Officers | | | 43 | | |
Important Information About This Report | | | 49 | | |
COLUMBIA MID CAP VALUE FUND
Performance Summary
n Columbia Mid Cap Value Fund (the Fund) Class A shares returned -12.77% excluding sales charges for the 12-month period that ended February 29, 2016.
n The Fund modestly lagged its benchmark, the Russell Midcap Value Index, which returned -11.72% during the same time period.
n In a difficult period for stock markets around the world, the Fund's holdings in the industrials, health care and financials sectors detracted from results relative to the benchmark.
Average Annual Total Returns (%) (for period ended February 29, 2016)
| | | Inception | | 1 Year | | 5 Years | | 10 Years | |
Class A | | 11/20/01 | | | | | | | |
Excluding sales charges | | | | | | | -12.77 | | | | 7.02 | | | | 5.29 | | |
Including sales charges | | | | | | | -17.79 | | | | 5.75 | | | | 4.67 | | |
Class B | | 11/20/01 | | | | | | | |
Excluding sales charges | | | | | | | -13.37 | | | | 6.22 | | | | 4.51 | | |
Including sales charges | | | | | | | -17.07 | | | | 5.95 | | | | 4.51 | | |
Class C | | 11/20/01 | | | | | | | |
Excluding sales charges | | | | | | | -13.42 | | | | 6.22 | | | | 4.51 | | |
Including sales charges | | | | | | | -14.16 | | | | 6.22 | | | | 4.51 | | |
Class I* | | 09/27/10 | | | -12.35 | | | | 7.51 | | | | 5.55 | | |
Class K* | | 03/07/11 | | | -12.63 | | | | 7.18 | | | | 5.37 | | |
Class R | | 01/23/06 | | | -13.02 | | | | 6.74 | | | | 5.03 | | |
Class R4* | | 11/08/12 | | | -12.53 | | | | 7.21 | | | | 5.39 | | |
Class R5* | | 11/08/12 | | | -12.40 | | | | 7.30 | | | | 5.43 | | |
Class W* | | 09/27/10 | | | -12.77 | | | | 7.02 | | | | 5.29 | | |
Class Y* | | 07/15/09 | | | -12.35 | | | | 7.47 | | | | 5.55 | | |
Class Z | | 11/20/01 | | | -12.51 | | | | 7.29 | | | | 5.56 | | |
Russell Midcap Value Index | | | | | | | -11.72 | | | | 8.89 | | | | 6.52 | | |
Returns for Class A are shown with and without the maximum initial sales charge of 5.75%. Returns for Class B are shown with and without the applicable contingent deferred sales charge (CDSC) of 5.00% in the first year, declining to 1.00% in the sixth year and eliminated thereafter. Returns for Class C are shown with and without the 1.00% CDSC for the first year only. The Fund's other classes are not subject to sales charges and have limited eligibility. Please see the Fund's prospectus for details. Performance for different share classes will vary based on differences in sales charges and fees associated with each class. All results shown assume reinvestment of distributions during the period. Returns do not reflect the deduction of taxes that a shareholder may pay on Fund distributions or on the redemption of Fund shares. Performance results reflect the effect of any fee waivers or reimbursements of Fund expenses by Columbia Management Investment Advisers, LLC and/or any of its affiliates. Absent these fee waivers or expense reimbursement arrangements, performance results would have been lower.
The performance information shown represents past performance and is not a guarantee of future results. The investment return and principal value of your investment will fluctuate so that your shares, when redeemed, may be worth more or less than their original cost. Current performance may be lower or higher than the performance information shown. You may obtain performance information current to the most recent month-end by contacting your financial intermediary, visiting columbiathreadneedle.com/us or calling 800.345.6611.
*The returns shown for periods prior to the share class inception date (including returns for the Life of the Fund, if shown, which are since Fund inception) include the returns of the Fund's oldest share class. Since the Fund launched more than one share class at its inception, Class A shares were used. These returns are adjusted to reflect any higher class-related operating expenses of the newer share classes, as applicable. Please visit columbiathreadneedle.com/us/investment-products/mutual-funds/appended-performance for more information.
The Russell Midcap Value Index, an unmanaged index, measures the performance of those Russell Midcap Index companies with lower price-to-book ratios and forecasted growth values.
Indices are not available for investment, are not professionally managed and do not reflect sales charges, fees, brokerage commissions, taxes or other expenses of investing. Securities in the Fund may not match those in an index.
Annual Report 2016
3
COLUMBIA MID CAP VALUE FUND
PERFORMANCE OVERVIEW (continued)
Performance of a Hypothetical $10,000 Investment (March 1, 2006 – February 29, 2016)
The chart above shows the change in value of a hypothetical $10,000 investment in Class A shares of Columbia Mid Cap Value Fund during the stated time period, and does not reflect the deduction of taxes that a shareholder may pay on Fund distributions or on the redemption of Fund shares.
Annual Report 2016
4
COLUMBIA MID CAP VALUE FUND
MANAGER DISCUSSION OF FUND PERFORMANCE
For the 12-month period that ended February 29, 2016, the Fund's Class A shares returned -12.77% excluding sales charges. The Fund's benchmark, the Russell Midcap Value Index, returned -11.72% for the same time period. In a difficult period for stock markets around the world, the Fund's holdings in the industrials, health care and financials sectors detracted from results relative to the benchmark.
Mounting Global Pressures Weighed on Markets
Around the world, investors turned cautious over the 12-month period that ended February 29, 2016, as lackluster economic growth, contentious geopolitical conflicts and a shift in U.S. monetary policy weighed on confidence. Subpar global economic growth continued for a fourth straight year, with China's slowdown heading the list of disappointments. Conflicts in the Middle East and terrorism, both at home and abroad, heightened security fears. Plummeting oil prices and a rising U.S. dollar rounded the list of mounting pressures. A widening trade deficit also took a significant bite out of growth. Despite these setbacks, the U.S. economy continued to expand for the seventh consecutive year. U.S. labor markets recovered and consumer spending strengthened. The housing market inched forward, although sales slipped near the end of the period as new industry regulation led to longer closing periods. Manufacturing activity softened, putting a damper on growth.
Modest stock market gains in the first half of the period were wiped out in the second half. The S&P 500 Index returned -6.19%, including dividends. Large-cap stocks held up better than mid- and small-cap stocks and growth stocks outperformed value stocks.
In December 2015, the Federal Reserve (the Fed) raised the target range of its benchmark interest rate by a quarter of a point, ending a lengthy debate about whether the economy was strong enough to withstand higher borrowing costs. Mixed economic signals early in 2016 put additional rate hikes on hold — at least for now.
Contributors and Detractors
Stock selection within energy, consumer staples, consumer discretionary, materials and information technology helped relative performance, primarily due to an improving U.S. economy and growing demand in key global markets. Within energy, our preference for larger cap, higher quality companies with solid balance sheets gave the Fund a performance edge over its benchmark. Oilfield equipment manufacturer Cameron International delivered a solid return, as the company announced its consent to be acquired by Schlumberger, the world's largest oilfield service company. We believe the additional scale has the potential to drive efficiencies and reduce costs for the newly combined company. Standouts within consumer staples included JM Smucker Company, which benefited from the integration of its recent pet food acquisition, and Dr. Pepper Snapple Group, which was helped by lower raw material costs and a more benign price environment, both of which boosted earnings. Within the consumer discretionary sector, Sinclair Broadcast Group experienced better core advertising trends and an improvement in net retransmission fees. Our focus on housing was rewarded as homebuilder
Portfolio Management
David Hoffman
Diane Sobin, CFA
Jonas Patrikson, CFA
Nicolas Janvier, CFA
Morningstar Style BoxTM
The Morningstar Style BoxTM is based on a fund's portfolio holdings. For equity funds, the vertical axis shows the market capitalization of the stocks owned, and the horizontal axis shows investment style (value, blend, or growth). Information shown is based on the most recent data provided by Morningstar.
© 2016 Morningstar, Inc. All rights reserved. The Morningstar information contained herein: (1) is proprietary to Morningstar and/or its content providers; (2) may not be copied or distributed; and (3) is not warranted to be accurate, complete or timely. Neither Morningstar nor its content providers are responsible for any damages or losses arising from any use of this information.
Top Ten Holdings (%)
(at February 29, 2016) | |
Synchrony Financial | | | 2.6 | | |
Edison International | | | 2.6 | | |
M&T Bank Corp. | | | 2.2 | | |
Fifth Third Bancorp | | | 2.2 | | |
Great Plains Energy, Inc. | | | 2.2 | | |
Hartford Financial Services
Group, Inc. (The) | | | 2.0 | | |
Portland General Electric Co. | | | 1.9 | | |
Zimmer Biomet Holdings, Inc. | | | 1.9 | | |
Ingersoll-Rand PLC | | | 1.8 | | |
PPL Corp. | | | 1.7 | | |
Percentages indicated are based upon total investments (excluding Money Market Funds).
For further detail about these holdings, please refer to the section entitled "Portfolio of Investments."
Annual Report 2016
5
COLUMBIA MID CAP VALUE FUND
MANAGER DISCUSSION OF FUND PERFORMANCE (continued)
Fund holdings are as of the date given, are subject to change at any time, and are not recommendations to buy or sell any security.
Portfolio Breakdown (%)
(at February 29, 2016) | |
Common Stocks | | | 97.6 | | |
Convertible Preferred Stocks | | | 0.8 | | |
Money Market Funds | | | 1.6 | | |
Total | | | 100.0 | | |
Percentages indicated are based upon total investments. The Fund's portfolio composition is subject to change.
Equity Sector Breakdown (%)
(at February 29, 2016) | |
Consumer Discretionary | | | 10.9 | | |
Consumer Staples | | | 5.1 | | |
Energy | | | 8.9 | | |
Financials | | | 29.4 | | |
Health Care | | | 7.3 | | |
Industrials | | | 8.8 | | |
Information Technology | | | 8.4 | | |
Materials | | | 8.2 | | |
Telecommunication Services | | | 1.0 | | |
Utilities | | | 12.0 | | |
Total | | | 100.0 | | |
Percentages indicated are based upon total equity investments. The Fund's portfolio composition is subject to change.
Investment Risks
Market risk may affect a single issuer, sector of the economy, industry or the market as a whole. Foreign investments subject the Fund to risks, including political, economic, market, social and others within a particular country, as well as to currency instabilities and less stringent financial and accounting standards generally applicable to U.S. issuers. Investments in mid-cap companies involve risks and volatility greater than investments in larger, more established companies. Value securities may be unprofitable if the market fails to recognize their intrinsic worth or the portfolio manager misgauged that worth. The Fund may invest significantly in issuers within a particular sector, which may be negatively affected by market, economic or other conditions, making the Fund more vulnerable to unfavorable developments in the sector. See the Fund's prospectus for information on these and other risks.
D.R. Horton benefited from a recovery in new home sales and, more specifically, from its move into the entry-level home market. Within information technology, an emphasis on video game makers aided results. Standout individual performers included Activision Blizzard and Electronic Arts. Both companies enjoyed higher profit margins as the industry transitioned from console-based games to online downloads. The Fund also gained ground against its benchmark in the materials sector, where we largely avoided mining stocks, which were pressured throughout the period.
Industrials, health care and financial stocks detracted from relative performance. Stock selection within industrials was generally weak due primarily to the Fund's exposure to USG, which was unable to pass through pricing in an oversupplied market. WESCO International, a leading industrial supply distributor with secondary oil and gas exposure, also weighed on results. We sold both USG and WESCO International during the period. An underweight in health care and lack of exposure to managed care providers Humana and Cigna, both of which were acquired during the period, detracted from Fund results relative to its benchmark. A position in Community Health Systems disappointed, and we sold the stock because benefits we had anticipated from the Affordable Care Act did not materialize. In the financials sector, stock selection weighed on results as we had positioned the Fund in anticipation of earlier and more aggressive rate increases by the Fed. Radian Group, a private mortgage insurer, was the victim of fears of a price war. Lincoln National and Voya Financial hampered performance as both companies were affected by potential regulation from the Department of Labor and by lower interest rates.
Given recent market volatility, we continue a cautious approach towards companies where multiples have expanded disproportionately relative to their operating earnings. As such, we remain true to our longstanding belief that the best investment opportunities are found when attractive valuations are combined with improving operating leverage over the medium to long term.
Annual Report 2016
6
COLUMBIA MID CAP VALUE FUND
UNDERSTANDING YOUR FUND'S EXPENSES
(Unaudited)
As an investor, you incur two types of costs. There are transaction costs, which generally include sales charges on purchases and may include redemption fees. There are also ongoing costs, which generally include management fees, distribution and/or service fees, and other fund expenses. The following information is intended to help you understand your ongoing costs (in dollars) of investing in the Fund and to help you compare these costs with the ongoing costs of investing in other mutual funds.
Analyzing Your Fund's Expenses
To illustrate these ongoing costs, we have provided examples and calculated the expenses paid by investors in each share class of the Fund during the period. The actual and hypothetical information in the table is based on an initial investment of $1,000 at the beginning of the period indicated and held for the entire period. Expense information is calculated two ways and each method provides you with different information. The amount listed in the "Actual" column is calculated using the Fund's actual operating expenses and total return for the period. You may use the Actual information, together with the amount invested, to estimate the expenses that you paid over the period. Simply divide your account value by $1,000 (for example, an $8,600 account value divided by $1,000 = 8.6), then multiply the results by the expenses paid during the period under the "Actual" column. The amount listed in the "Hypothetical" column assumes a 5% annual rate of return before expenses (which is not the Fund's actual return) and then applies the Fund's actual expense ratio for the period to the hypothetical return. You should not use the hypothetical account values and expenses to estimate either your actual account balance at the end of the period or the expenses you paid during the period. See "Compare With Other Funds" below for details on how to use the hypothetical data.
Compare With Other Funds
Since all mutual funds are required to include the same hypothetical calculations about expenses in shareholder reports, you can use this information to compare the ongoing cost of investing in the Fund with other funds. To do so, compare the hypothetical example with the 5% hypothetical examples that appear in the shareholder reports of other funds. As you compare hypothetical examples of other funds, it is important to note that hypothetical examples are meant to highlight the ongoing costs of investing in a fund only and do not reflect any transaction costs, such as sales charges, or redemption or exchange fees. Therefore, the hypothetical calculations are useful in comparing ongoing costs only, and will not help you determine the relative total costs of owning different funds. If transaction costs were included in these calculations, your costs would be higher.
September 1, 2015 – February 29, 2016
| | | Account Value at the Beginning
of the Period ($) | | Account Value at the End of the
Period ($) | | Expenses Paid During the
Period ($) | | Fund's Annualized
Expense Ratio (%) | |
| | | Actual | | Hypothetical | | Actual | | Hypothetical | | Actual | | Hypothetical | | Actual | |
Class A | | | 1,000.00 | | | | 1,000.00 | | | | 919.40 | | | | 1,019.00 | | | | 5.63 | | | | 5.92 | | | | 1.18 | | |
Class B | | | 1,000.00 | | | | 1,000.00 | | | | 916.60 | | | | 1,015.27 | | | | 9.20 | | | | 9.67 | | | | 1.93 | | |
Class C | | | 1,000.00 | | | | 1,000.00 | | | | 916.30 | | | | 1,015.22 | | | | 9.24 | | | | 9.72 | | | | 1.94 | | |
Class I | | | 1,000.00 | | | | 1,000.00 | | | | 922.30 | | | | 1,021.43 | | | | 3.30 | | | | 3.47 | | | | 0.69 | | |
Class K | | | 1,000.00 | | | | 1,000.00 | | | | 919.90 | | | | 1,019.79 | | | | 4.87 | | | | 5.12 | | | | 1.02 | | |
Class R | | | 1,000.00 | | | | 1,000.00 | | | | 918.50 | | | | 1,017.75 | | | | 6.82 | | | | 7.17 | | | | 1.43 | | |
Class R4 | | | 1,000.00 | | | | 1,000.00 | | | | 921.00 | | | | 1,020.24 | | | | 4.44 | | | | 4.67 | | | | 0.93 | | |
Class R5 | | | 1,000.00 | | | | 1,000.00 | | | | 921.70 | | | | 1,020.93 | | | | 3.77 | | | | 3.97 | | | | 0.79 | | |
Class W | | | 1,000.00 | | | | 1,000.00 | | | | 919.40 | | | | 1,019.00 | | | | 5.63 | | | | 5.92 | | | | 1.18 | | |
Class Y | | | 1,000.00 | | | | 1,000.00 | | | | 922.30 | | | | 1,021.18 | | | | 3.54 | | | | 3.72 | | | | 0.74 | | |
Class Z | | | 1,000.00 | | | | 1,000.00 | | | | 920.90 | | | | 1,020.24 | | | | 4.44 | | | | 4.67 | | | | 0.93 | | |
Expenses paid during the period are equal to the annualized expense ratio for each class as indicated above, multiplied by the average account value over the period and then multiplied by the number of days in the Fund's most recent fiscal half year and divided by 366.
Expenses do not include fees and expenses incurred indirectly by the Fund from its investment in underlying funds, including affiliated and non-affiliated pooled investment vehicles, such as mutual funds and exchange-traded funds.
Annual Report 2016
7
COLUMBIA MID CAP VALUE FUND
PORTFOLIO OF INVESTMENTS
February 29, 2016
(Percentages represent value of investments compared to net assets)
Common Stocks 97.7%
Issuer | | Shares | | Value ($) | |
CONSUMER DISCRETIONARY 10.8% | |
Auto Components 1.2% | |
Gentex Corp. | | | 2,096,825 | | | | 30,529,772 | | |
Diversified Consumer Services 1.4% | |
Houghton Mifflin Harcourt Co.(a) | | | 1,229,278 | | | | 23,122,719 | | |
ServiceMaster Global Holdings, Inc.(a) | | | 325,500 | | | | 12,346,215 | | |
Total | | | | | 35,468,934 | | |
Hotels, Restaurants & Leisure 2.5% | |
Aramark | | | 818,300 | | | | 25,710,986 | | |
Royal Caribbean Cruises Ltd. | | | 518,200 | | | | 38,538,534 | | |
Total | | | | | 64,249,520 | | |
Household Durables 3.0% | |
D.R. Horton, Inc. | | | 1,140,125 | | | | 30,464,140 | | |
Mohawk Industries, Inc.(a) | | | 156,350 | | | | 28,100,786 | | |
Whirlpool Corp. | | | 136,850 | | | | 21,255,542 | | |
Total | | | | | 79,820,468 | | |
Media 1.2% | |
DISH Network Corp., Class A(a) | | | 273,825 | | | | 12,905,372 | | |
Sinclair Broadcast Group, Inc., Class A | | | 639,600 | | | | 19,744,452 | | |
Total | | | | | 32,649,824 | | |
Specialty Retail 1.5% | |
Burlington Stores, Inc.(a) | | | 314,000 | | | | 17,602,840 | | |
Signet Jewelers Ltd. | | | 191,800 | | | | 20,791,120 | | |
Total | | | | | 38,393,960 | | |
Total Consumer Discretionary | | | | | 281,112,478 | | |
CONSUMER STAPLES 5.0% | |
Beverages 1.3% | |
Dr. Pepper Snapple Group, Inc. | | | 138,975 | | | | 12,720,381 | | |
Molson Coors Brewing Co., Class B | | | 250,851 | | | | 21,390,065 | | |
Total | | | | | 34,110,446 | | |
Food Products 3.7% | |
Hershey Co. (The) | | | 266,450 | | | | 24,217,641 | | |
JM Smucker Co. (The) | | | 323,065 | | | | 41,213,402 | | |
Tyson Foods, Inc., Class A | | | 493,900 | | | | 31,980,025 | | |
Total | | | | | 97,411,068 | | |
Total Consumer Staples | | | | | 131,521,514 | | |
Common Stocks (continued)
Issuer | | Shares | | Value ($) | |
ENERGY 8.0% | |
Energy Equipment & Services 2.4% | |
Helmerich & Payne, Inc. | | | 408,325 | | | | 21,628,975 | | |
Oceaneering International, Inc. | | | 428,750 | | | | 11,842,075 | | |
Superior Energy Services, Inc. | | | 1,653,975 | | | | 17,002,863 | | |
Weatherford International PLC(a) | | | 1,850,675 | | | | 11,844,320 | | |
Total | | | | | 62,318,233 | | |
Oil, Gas & Consumable Fuels 5.6% | |
Cabot Oil & Gas Corp. | | | 851,850 | | | | 17,147,740 | | |
Cimarex Energy Co. | | | 397,190 | | | | 33,375,876 | | |
Hess Corp. | | | 490,975 | | | | 21,406,510 | | |
Marathon Petroleum Corp. | | | 566,075 | | | | 19,388,069 | | |
Newfield Exploration Co.(a) | | | 623,775 | | | | 16,985,393 | | |
Noble Energy, Inc. | | | 1,285,450 | | | | 37,920,775 | | |
Total | | | | | 146,224,363 | | |
Total Energy | | | | | 208,542,596 | | |
FINANCIALS 28.9% | |
Banks 5.5% | |
BankUnited, Inc. | | | 911,350 | | | | 29,272,562 | | |
Fifth Third Bancorp | | | 3,735,451 | | | | 57,002,982 | | |
M&T Bank Corp. | | | 557,850 | | | | 57,207,518 | | |
Total | | | | | 143,483,062 | | |
Capital Markets 2.2% | |
E*TRADE Financial Corp.(a) | | | 1,414,800 | | | | 33,191,208 | | |
Northern Trust Corp. | | | 407,025 | | | | 24,169,144 | | |
Total | | | | | 57,360,352 | | |
Consumer Finance 2.5% | |
Synchrony Financial(a) | | | 2,437,900 | | | | 65,701,405 | | |
Diversified Financial Services 1.5% | |
Voya Financial, Inc. | | | 1,346,975 | | | | 39,547,186 | | |
Insurance 5.9% | |
Allstate Corp. (The) | | | 465,975 | | | | 29,570,774 | | |
Aon PLC | | | 378,725 | | | | 36,088,705 | | |
Hartford Financial Services
Group, Inc. (The) | | | 1,248,643 | | | | 52,592,843 | | |
Lincoln National Corp. | | | 958,875 | | | | 35,027,704 | | |
Total | | | | | 153,280,026 | | |
The accompanying Notes to Financial Statements are an integral part of this statement.
Annual Report 2016
8
COLUMBIA MID CAP VALUE FUND
PORTFOLIO OF INVESTMENTS (continued)
February 29, 2016
Common Stocks (continued)
Issuer | | Shares | | Value ($) | |
Real Estate Investment Trusts (REITs) 10.7% | |
Camden Property Trust | | | 360,925 | | | | 26,975,535 | | |
Extra Space Storage, Inc. | | | 228,379 | | | | 18,761,335 | | |
Host Hotels & Resorts, Inc. | | | 2,452,672 | | | | 37,550,408 | | |
Outfront Media, Inc. | | | 659,802 | | | | 13,492,951 | | |
ProLogis, Inc. | | | 748,950 | | | | 28,804,617 | | |
SL Green Realty Corp. | | | 397,375 | | | | 35,040,527 | | |
Taubman Centers, Inc. | | | 415,200 | | | | 29,404,464 | | |
UDR, Inc. | | | 1,275,375 | | | | 43,783,624 | | |
Welltower, Inc. | | | 700,775 | | | | 44,695,429 | | |
Total | | | | | 278,508,890 | | |
Real Estate Management & Development 0.6% | |
CBRE Group, Inc., Class A(a) | | | 659,961 | | | | 16,769,609 | | |
Total Financials | | | | | 754,650,530 | | |
HEALTH CARE 7.2% | |
Health Care Equipment & Supplies 4.7% | |
Boston Scientific Corp.(a) | | | 2,060,300 | | | | 34,983,894 | | |
Teleflex, Inc. | | | 281,150 | | | | 40,153,843 | | |
Zimmer Biomet Holdings, Inc. | | | 504,175 | | | | 48,809,182 | | |
Total | | | | | 123,946,919 | | |
Health Care Providers & Services 0.8% | |
WellCare Health Plans, Inc.(a) | | | 233,225 | | | | 20,959,931 | | |
Life Sciences Tools & Services 0.7% | |
PAREXEL International Corp.(a) | | | 305,175 | | | | 17,910,721 | | |
Pharmaceuticals 1.0% | |
Mallinckrodt PLC(a) | | | 392,550 | | | | 25,527,526 | | |
Total Health Care | | | | | 188,345,097 | | |
INDUSTRIALS 8.7% | |
Aerospace & Defense 1.0% | |
Textron, Inc. | | | 791,515 | | | | 27,030,237 | | |
Airlines 1.0% | |
United Continental Holdings, Inc.(a) | | | 461,900 | | | | 26,448,394 | | |
Commercial Services & Supplies 1.7% | |
Republic Services, Inc. | | | 966,550 | | | | 44,171,335 | | |
Industrial Conglomerates 1.4% | |
Carlisle Companies, Inc. | | | 402,800 | | | | 36,316,448 | | |
Common Stocks (continued)
Issuer | | Shares | | Value ($) | |
Machinery 2.8% | |
Ingersoll-Rand PLC | | | 844,300 | | | | 46,909,308 | | |
Xylem, Inc. | | | 695,225 | | | | 26,008,368 | | |
Total | | | | | 72,917,676 | | |
Trading Companies & Distributors 0.8% | |
AerCap Holdings NV(a) | | | 539,144 | | | | 19,263,615 | | |
Total Industrials | | | | | 226,147,705 | | |
INFORMATION TECHNOLOGY 8.2% | |
Communications Equipment 1.6% | |
F5 Networks, Inc.(a) | | | 107,750 | | | | 10,362,318 | | |
Harris Corp. | | | 401,075 | | | | 31,291,871 | | |
Total | | | | | 41,654,189 | | |
Electronic Equipment, Instruments & Components 1.6% | |
Arrow Electronics, Inc.(a) | | | 334,850 | | | | 19,140,026 | | |
FLIR Systems, Inc. | | | 696,225 | | | | 21,555,126 | | |
Total | | | | | 40,695,152 | | |
Semiconductors & Semiconductor Equipment 2.4% | |
Applied Materials, Inc. | | | 1,098,500 | | | | 20,728,695 | | |
Lam Research Corp. | | | 180,000 | | | | 13,194,000 | | |
NVIDIA Corp. | | | 218,800 | | | | 6,861,568 | | |
NXP Semiconductors NV(a) | | | 185,450 | | | | 13,211,458 | | |
Skyworks Solutions, Inc. | | | 153,150 | | | | 10,176,818 | | |
Total | | | | | 64,172,539 | | |
Software 2.6% | |
Activision Blizzard, Inc. | | | 1,186,700 | | | | 37,582,789 | | |
Electronic Arts, Inc.(a) | | | 274,575 | | | | 17,638,698 | | |
Synopsys, Inc.(a) | | | 292,500 | | | | 13,089,375 | | |
Total | | | | | 68,310,862 | | |
Total Information Technology | | | | | 214,832,742 | | |
MATERIALS 8.0% | |
Chemicals 3.3% | |
Albemarle Corp. | | | 399,600 | | | | 22,465,512 | | |
Ashland, Inc. | | | 184,675 | | | | 17,597,680 | | |
International Flavors & Fragrances, Inc. | | | 153,775 | | | | 15,883,420 | | |
PPG Industries, Inc. | | | 305,700 | | | | 29,509,221 | | |
Total | | | | | 85,455,833 | | |
The accompanying Notes to Financial Statements are an integral part of this statement.
Annual Report 2016
9
COLUMBIA MID CAP VALUE FUND
PORTFOLIO OF INVESTMENTS (continued)
February 29, 2016
Common Stocks (continued)
Issuer | | Shares | | Value ($) | |
Construction Materials 0.7% | |
Summit Materials, Inc., Class A(a) | | | 1,031,000 | | | | 18,826,060 | | |
Containers & Packaging 2.5% | |
Bemis Co., Inc. | | | 547,950 | | | | 26,887,906 | | |
Packaging Corp. of America | | | 237,425 | | | | 11,515,113 | | |
Sealed Air Corp. | | | 628,875 | | | | 28,758,454 | | |
Total | | | | | 67,161,473 | | |
Metals & Mining 1.5% | |
Steel Dynamics, Inc. | | | 2,126,750 | | | | 38,685,583 | | |
Total Materials | | | | | 210,128,949 | | |
TELECOMMUNICATION SERVICES 1.0% | |
Diversified Telecommunication Services 1.0% | |
SBA Communications Corp., Class A(a) | | | 267,525 | | | | 25,385,447 | | |
Total Telecommunication Services | | | | | 25,385,447 | | |
UTILITIES 11.9% | |
Electric Utilities 10.0% | |
Edison International | | | 963,675 | | | | 65,684,088 | | |
Great Plains Energy, Inc. | | | 1,932,650 | | | | 56,703,951 | | |
Pinnacle West Capital Corp. | | | 627,800 | | | | 43,211,474 | | |
Portland General Electric Co. | | | 1,294,700 | | | | 49,263,335 | | |
PPL Corp. | | | 1,284,375 | | | | 44,940,281 | | |
Total | | | | | 259,803,129 | | |
Gas Utilities 0.5% | |
AGL Resources, Inc. | | | 193,852 | | | | 12,532,532 | | |
Common Stocks (continued)
Issuer | | Shares | | Value ($) | |
Multi-Utilities 1.4% | |
CMS Energy Corp. | | | 943,825 | | | | 37,337,717 | | |
Total Utilities | | | | | 309,673,378 | | |
Total Common Stocks
(Cost: $2,228,236,456) | | | | | 2,550,340,436 | | |
Convertible Preferred Stocks 0.8%
ENERGY 0.8% | |
Oil, Gas & Consumable Fuels 0.8% | |
Hess Corp., 8.000% | | | 385,448 | | | | 21,461,745 | | |
Total Energy | | | | | 21,461,745 | | |
Total Convertible Preferred Stocks
(Cost: $19,272,400) | | | | | 21,461,745 | | |
Money Market Funds 1.6%
| | | Shares | | Value ($) | |
Columbia Short-Term Cash Fund,
0.420%(b)(c) | | | 40,921,720 | | | | 40,921,720 | | |
Total Money Market Funds
(Cost: $40,921,720) | | | | | 40,921,720 | | |
Total Investments
(Cost: $2,288,430,576) | | | | | 2,612,723,901 | | |
Other Assets & Liabilities, Net | | | | | (2,273,090 | ) | |
Net Assets | | | | | 2,610,450,811 | | |
Notes to Portfolio of Investments
(a) Non-income producing investment.
(b) The rate shown is the seven-day current annualized yield at February 29, 2016.
(c) As defined in the Investment Company Act of 1940, an affiliated company is one in which the Fund owns 5% or more of the company's outstanding voting securities, or a company which is under common ownership or control with the Fund. Holdings and transactions in these affiliated companies during the year ended February 29, 2016 are as follows:
Issuer | | Beginning
Cost ($) | | Purchase
Cost ($) | | Proceeds
From Sales ($) | | Ending
Cost ($) | | Dividends —
Affiliated
Issuers ($) | | Value ($) | |
Columbia Short-Term Cash Fund | | | 179,304,267 | | | | 745,155,835 | | | | (883,538,382 | ) | | | 40,921,720 | | | | 129,165 | | | | 40,921,720 | | |
The accompanying Notes to Financial Statements are an integral part of this statement.
Annual Report 2016
10
COLUMBIA MID CAP VALUE FUND
PORTFOLIO OF INVESTMENTS (continued)
February 29, 2016
Fair Value Measurements
The Fund categorizes its fair value measurements according to a three-level hierarchy that maximizes the use of observable inputs and minimizes the use of unobservable inputs by prioritizing that the most observable input be used when available. Observable inputs are those that market participants would use in pricing an investment based on market data obtained from sources independent of the reporting entity. Unobservable inputs are those that reflect the Fund's assumptions about the information market participants would use in pricing an investment. An investment's level within the fair value hierarchy is based on the lowest level of any input that is deemed significant to the asset's or liability's fair value measurement. The input levels are not necessarily an indication of the risk or liquidity associated with investments at that level. For example, certain U.S. government securities are generally high quality and liquid, however, they are reflected as Level 2 because the inputs used to determine fair value may not always be quoted prices in an active market.
Fair value inputs are summarized in the three broad levels listed below:
> Level 1 — Valuations based on quoted prices for investments in active markets that the Fund has the ability to access at the measurement date (including NAV for open-end mutual funds). Valuation adjustments are not applied to Level 1 investments.
> Level 2 — Valuations based on other significant observable inputs (including quoted prices for similar securities, interest rates, prepayment speeds, credit risks, etc.).
> Level 3 — Valuations based on significant unobservable inputs (including the Fund's own assumptions and judgment in determining the fair value of investments).
Inputs that are used in determining fair value of an investment may include price information, credit data, volatility statistics, and other factors. These inputs can be either observable or unobservable. The availability of observable inputs can vary between investments, and is affected by various factors such as the type of investment, and the volume and level of activity for that investment or similar investments in the marketplace. The inputs will be considered by the Investment Manager, along with any other relevant factors in the calculation of an investment's fair value. The Fund uses prices and inputs that are current as of the measurement date, which may include periods of market dislocations. During these periods, the availability of prices and inputs may be reduced for many investments. This condition could cause an investment to be reclassified between the various levels within the hierarchy.
Investments falling into the Level 3 category are primarily supported by quoted prices from brokers and dealers participating in the market for those investments. However, these may be classified as Level 3 investments due to lack of market transparency and corroboration to support these quoted prices. Additionally, valuation models may be used as the pricing source for any remaining investments classified as Level 3. These models may rely on one or more significant unobservable inputs and/or significant assumptions by the Investment Manager. Inputs used in valuations may include, but are not limited to, financial statement analysis, capital account balances, discount rates and estimated cash flows, and comparable company data.
Under the direction of the Fund's Board of Trustees (the Board), the Investment Manager's Valuation Committee (the Committee) is responsible for overseeing the valuation procedures approved by the Board. The Committee consists of voting and non-voting members from various groups within the Investment Manager's organization, including operations and accounting, trading and investments, compliance, risk management and legal.
The Committee meets at least monthly to review and approve valuation matters, which may include a description of specific valuation determinations, data regarding pricing information received from approved pricing vendors and brokers and the results of Board-approved valuation control policies and procedures (the Policies). The Policies address, among other things, instances when market quotations are or are not readily available, including recommendations of third party pricing vendors and a determination of appropriate pricing methodologies; events that require specific valuation determinations and assessment of fair value techniques; securities with a potential for stale pricing, including those that are illiquid, restricted, or in default; and the effectiveness of third party pricing vendors, including periodic reviews of vendors. The Committee meets more frequently, as needed, to discuss additional valuation matters, which may include the need to review back-testing results, review time-sensitive information or approve related valuation actions. The Committee reports to the Board, with members of the Committee meeting with the Board at each of its regularly scheduled meetings to discuss valuation matters and actions during the period, similar to those described earlier.
For investments categorized as Level 3, the Committee monitors information similar to that described above, which may include: (i) data specific to the issuer or comparable issuers, (ii) general market or specific sector news and (iii) quoted prices and specific or similar security transactions. The Committee considers this data and any changes from prior periods in order to assess the reasonableness of observable and unobservable inputs, any assumptions or internal models used to value those securities and changes in fair value. This data is also used to corroborate, when available, information received from approved pricing vendors and brokers. Various factors impact the frequency of monitoring this information (which may occur as often as daily). However, the Committee may determine that changes to inputs, assumptions and models are not required as a result of the monitoring procedures performed.
The accompanying Notes to Financial Statements are an integral part of this statement.
Annual Report 2016
11
COLUMBIA MID CAP VALUE FUND
PORTFOLIO OF INVESTMENTS (continued)
February 29, 2016
Fair Value Measurements (continued)
The following table is a summary of the inputs used to value the Fund's investments at February 29, 2016:
| | | Level 1
Quoted Prices in Active
Markets for Identical
Assets ($) | | Level 2
Other Significant
Observable Inputs ($) | | Level 3
Significant
Unobservable Inputs ($) | | Total ($) | |
Investments | |
Common Stocks | |
Consumer Discretionary | | | 281,112,478 | | | | — | | | | — | | | | 281,112,478 | | |
Consumer Staples | | | 131,521,514 | | | | — | | | | — | | | | 131,521,514 | | |
Energy | | | 208,542,596 | | | | — | | | | — | | | | 208,542,596 | | |
Financials | | | 754,650,530 | | | | — | | | | — | | | | 754,650,530 | | |
Health Care | | | 188,345,097 | | | | — | | | | — | | | | 188,345,097 | | |
Industrials | | | 226,147,705 | | | | — | | | | — | | | | 226,147,705 | | |
Information Technology | | | 214,832,742 | | | | — | | | | — | | | | 214,832,742 | | |
Materials | | | 210,128,949 | | | | — | | | | — | | | | 210,128,949 | | |
Telecommunication Services | | | 25,385,447 | | | | — | | | | — | | | | 25,385,447 | | |
Utilities | | | 309,673,378 | | | | — | | | | — | | | | 309,673,378 | | |
Total Common Stocks | | | 2,550,340,436 | | | | — | | | | — | | | | 2,550,340,436 | | |
Convertible Preferred Stocks | |
Energy | | | 21,461,745 | | | | — | | | | — | | | | 21,461,745 | | |
Money Market Funds | | | — | | | | 40,921,720 | | | | — | | | | 40,921,720 | | |
Total Investments | | | 2,571,802,181 | | | | 40,921,720 | | | | — | | | | 2,612,723,901 | | |
See the Portfolio of Investments for all investment classifications not indicated in the table.
The Fund's assets assigned to the Level 2 input category are valued based upon utilizing observable market inputs, in which a security's value is determined through reference to prices and information from market transactions for similar or identical assets and/or fund per share market values which are not considered publicly available.
Financial assets were transferred from Level 1 to Level 2 as the market for these assets is not considered publicly available. Fund per share market values were obtained using observable market inputs.
The following table shows transfers between Level 1 and Level 2 of the fair value hierarchy:
Transfers In | | Transfers Out | |
| Level 1 ($) | | Level 2 ($) | | Level 1 ($) | | Level 2 ($) | |
| | — | | | | 179,304,267 | | | | 179,304,267 | | | | — | | |
Transfers between Level 1 and Level 2 are determined based on the fair value at the beginning of the period for security positions held throughout the period.
There were no transfers of financial assets between Levels 2 and 3 during the period.
The accompanying Notes to Financial Statements are an integral part of this statement.
Annual Report 2016
12
COLUMBIA MID CAP VALUE FUND
STATEMENT OF ASSETS AND LIABILITIES
February 29, 2016
Assets | |
Investments, at value | |
Unaffiliated issuers (identified cost $2,247,508,856) | | $ | 2,571,802,181 | | |
Affiliated issuers (identified cost $40,921,720) | | | 40,921,720 | | |
Total investments (identified cost $2,288,430,576) | | | 2,612,723,901 | | |
Receivable for: | |
Investments sold | | | 22,512,529 | | |
Capital shares sold | | | 1,480,262 | | |
Dividends | | | 4,015,933 | | |
Prepaid expenses | | | 6,048 | | |
Total assets | | | 2,640,738,673 | | |
Liabilities | |
Payable for: | |
Investments purchased | | | 26,527,552 | | |
Capital shares purchased | | | 2,683,124 | | |
Investment management fees | | | 156,551 | | |
Distribution and/or service fees | | | 27,864 | | |
Transfer agent fees | | | 569,299 | | |
Plan administration fees | | | 1 | | |
Compensation of board members | | | 172,884 | | |
Other expenses | | | 150,587 | | |
Total liabilities | | | 30,287,862 | | |
Net assets applicable to outstanding capital stock | | $ | 2,610,450,811 | | |
Represented by | |
Paid-in capital | | $ | 2,229,146,855 | | |
Undistributed net investment income | | | 1,431,965 | | |
Accumulated net realized gain | | | 55,578,666 | | |
Unrealized appreciation (depreciation) on: | |
Investments | | | 324,293,325 | | |
Total — representing net assets applicable to outstanding capital stock | | $ | 2,610,450,811 | | |
The accompanying Notes to Financial Statements are an integral part of this statement.
Annual Report 2016
13
COLUMBIA MID CAP VALUE FUND
STATEMENT OF ASSETS AND LIABILITIES (continued)
February 29, 2016
Class A | |
Net assets | | $ | 837,676,126 | | |
Shares outstanding | | | 65,020,500 | | |
Net asset value per share | | $ | 12.88 | | |
Maximum offering price per share(a) | | $ | 13.67 | | |
Class B | |
Net assets | | $ | 2,748,835 | | |
Shares outstanding | | | 226,661 | | |
Net asset value per share | | $ | 12.13 | | |
Class C | |
Net assets | | $ | 99,371,797 | | |
Shares outstanding | | | 8,145,938 | | |
Net asset value per share | | $ | 12.20 | | |
Class I | |
Net assets | | $ | 2,234 | | |
Shares outstanding | | | 173 | | |
Net asset value per share(b) | | $ | 12.89 | | |
Class K | |
Net assets | | $ | 5,025 | | |
Shares outstanding | | | 388 | | |
Net asset value per share(b) | | $ | 12.93 | | |
Class R | |
Net assets | | $ | 52,549,819 | | |
Shares outstanding | | | 4,091,566 | | |
Net asset value per share | | $ | 12.84 | | |
Class R4 | |
Net assets | | $ | 63,910,257 | | |
Shares outstanding | | | 4,849,507 | | |
Net asset value per share | | $ | 13.18 | | |
Class R5 | |
Net assets | | $ | 58,924,054 | | |
Shares outstanding | | | 4,470,594 | | |
Net asset value per share | | $ | 13.18 | | |
Class W | |
Net assets | | $ | 281,171 | | |
Shares outstanding | | | 21,826 | | |
Net asset value per share | | $ | 12.88 | | |
Class Y | |
Net assets | | $ | 44,147,191 | | |
Shares outstanding | | | 3,425,987 | | |
Net asset value per share | | $ | 12.89 | | |
The accompanying Notes to Financial Statements are an integral part of this statement.
Annual Report 2016
14
COLUMBIA MID CAP VALUE FUND
STATEMENT OF ASSETS AND LIABILITIES (continued)
February 29, 2016
Class Z | |
Net assets | | $ | 1,450,834,302 | | |
Shares outstanding | | | 112,382,332 | | |
Net asset value per share | | $ | 12.91 | | |
(a) The maximum offering price per share is calculated by dividing the net asset value per share by 1.0 minus the maximum sales charge of 5.75%.
(b) Net asset value per share rounds to this amount due to fractional shares outstanding.
The accompanying Notes to Financial Statements are an integral part of this statement.
Annual Report 2016
15
COLUMBIA MID CAP VALUE FUND
STATEMENT OF OPERATIONS
Year Ended February 29, 2016
Net investment income | |
Income: | |
Dividends — unaffiliated issuers | | $ | 49,420,341 | | |
Dividends — affiliated issuers | | | 129,165 | | |
Total income | | | 49,549,506 | | |
Expenses: | |
Investment management fees | | | 23,016,097 | | |
Distribution and/or service fees | |
Class A | | | 2,499,530 | | |
Class B | | | 56,294 | | |
Class C | | | 1,250,054 | | |
Class R | | | 330,775 | | |
Class W | | | 973 | | |
Transfer agent fees | |
Class A | | | 1,931,562 | | |
Class B | | | 10,886 | | |
Class C | | | 241,463 | | |
Class K | | | 3 | | |
Class R | | | 127,831 | | |
Class R4 | | | 113,076 | | |
Class R5 | | | 33,385 | | |
Class W | | | 752 | | |
Class Z | | | 3,579,678 | | |
Plan administration fees | |
Class K | | | 14 | | |
Compensation of board members | | | 41,009 | | |
Custodian fees | | | 23,793 | | |
Printing and postage fees | | | 311,223 | | |
Registration fees | | | 150,958 | | |
Audit fees | | | 26,073 | | |
Legal fees | | | 29,444 | | |
Other | | | 62,253 | | |
Total expenses | | | 33,837,126 | | |
Expense reductions | | | (4,916 | ) | |
Total net expenses | | | 33,832,210 | | |
Net investment income | | | 15,717,296 | | |
Realized and unrealized gain (loss) — net | |
Net realized gain (loss) on: | |
Investments | | | 383,185,951 | | |
Options contracts written | | | 32,274 | | |
Net realized gain | | | 383,218,225 | | |
Net change in unrealized appreciation (depreciation) on: | |
Investments | | | (791,569,372 | ) | |
Net change in unrealized depreciation | | | (791,569,372 | ) | |
Net realized and unrealized loss | | | (408,351,147 | ) | |
Net decrease in net assets from operations | | $ | (392,633,851 | ) | |
The accompanying Notes to Financial Statements are an integral part of this statement.
Annual Report 2016
16
COLUMBIA MID CAP VALUE FUND
STATEMENT OF CHANGES IN NET ASSETS
| | | Year Ended
February 29, 2016 | | Year Ended
February 28, 2015 | |
Operations | |
Net investment income | | $ | 15,717,296 | | | $ | 20,044,514 | | |
Net realized gain | | | 383,218,225 | | | | 412,908,820 | | |
Net change in unrealized depreciation | | | (791,569,372 | ) | | | (110,322,816 | ) | |
Net increase (decrease) in net assets resulting from operations | | | (392,633,851 | ) | | | 322,630,518 | | |
Distributions to shareholders | |
Net investment income | |
Class A | | | (2,894,764 | ) | | | (4,766,548 | ) | |
Class B | | | — | | | | (12,726 | ) | |
Class C | | | — | | | | (163,650 | ) | |
Class I | | | (21 | ) | | | (358,705 | ) | |
Class K | | | (27 | ) | | | (44 | ) | |
Class R | | | (28,136 | ) | | | (170,576 | ) | |
Class R4 | | | (313,226 | ) | | | (111,541 | ) | |
Class R5 | | | (449,037 | ) | | | (335,311 | ) | |
Class W | | | (1,169 | ) | | | (2,270 | ) | |
Class Y | | | (277,579 | ) | | | (143,886 | ) | |
Class Z | | | (10,152,175 | ) | | | (16,189,669 | ) | |
Net realized gains | |
Class A | | | (138,790,436 | ) | | | (172,737,080 | ) | |
Class B | | | (706,465 | ) | | | (1,889,298 | ) | |
Class C | | | (18,200,240 | ) | | | (21,894,748 | ) | |
Class I | | | (395 | ) | | | (6,596,744 | ) | |
Class K | | | (830 | ) | | | (974 | ) | |
Class R | | | (9,070,971 | ) | | | (10,764,812 | ) | |
Class R4 | | | (9,492,882 | ) | | | (2,419,482 | ) | |
Class R5 | | | (9,124,575 | ) | | | (6,259,682 | ) | |
Class W | | | (54,382 | ) | | | (81,199 | ) | |
Class Y | | | (5,870,035 | ) | | | (2,476,273 | ) | |
Class Z | | | (247,781,294 | ) | | | (370,349,851 | ) | |
Total distributions to shareholders | | | (453,208,639 | ) | | | (617,725,069 | ) | |
Increase (decrease) in net assets from capital stock activity | | | (350,006,177 | ) | | | 230,753,029 | | |
Total decrease in net assets | | | (1,195,848,667 | ) | | | (64,341,522 | ) | |
Net assets at beginning of year | | | 3,806,299,478 | | | | 3,870,641,000 | | |
Net assets at end of year | | $ | 2,610,450,811 | | | $ | 3,806,299,478 | | |
Undistributed (excess of distributions over) net investment income | | $ | 1,431,965 | | | $ | (169,198 | ) | |
The accompanying Notes to Financial Statements are an integral part of this statement.
Annual Report 2016
17
COLUMBIA MID CAP VALUE FUND
STATEMENT OF CHANGES IN NET ASSETS (continued)
| | | Year Ended February 29, 2016 | | Year Ended February 28, 2015 | |
| | | Shares | | Dollars ($) | | Shares | | Dollars ($) | |
Capital stock activity | |
Class A shares | |
Subscriptions(a) | | | 8,526,155 | | | | 132,322,357 | | | | 13,415,112 | | | | 241,409,995 | | |
Distributions reinvested | | | 8,922,795 | | | | 131,224,473 | | | | 9,391,185 | | | | 164,243,740 | | |
Redemptions | | | (17,183,718 | ) | | | (269,026,144 | ) | | | (17,000,791 | ) | | | (305,632,557 | ) | |
Net increase | | | 265,232 | | | | (5,479,314 | ) | | | 5,805,506 | | | | 100,021,178 | | |
Class B shares | |
Subscriptions | | | 6,719 | | | | 101,447 | | | | 28,457 | | | | 498,264 | | |
Distributions reinvested | | | 46,480 | | | | 655,848 | | | | 103,025 | | | | 1,732,090 | | |
Redemptions(a) | | | (391,091 | ) | | | (5,938,818 | ) | | | (403,330 | ) | | | (6,952,178 | ) | |
Net decrease | | | (337,892 | ) | | | (5,181,523 | ) | | | (271,848 | ) | | | (4,721,824 | ) | |
Class C shares | |
Subscriptions | | | 736,957 | | | | 10,983,540 | | | | 1,199,715 | | | | 20,665,929 | | |
Distributions reinvested | | | 1,045,042 | | | | 14,591,093 | | | | 1,027,022 | | | | 17,262,321 | | |
Redemptions | | | (2,040,473 | ) | | | (29,633,792 | ) | | | (1,205,653 | ) | | | (20,857,272 | ) | |
Net increase (decrease) | | | (258,474 | ) | | | (4,059,159 | ) | | | 1,021,084 | | | | 17,070,978 | | |
Class I shares | |
Subscriptions | | | — | | | | — | | | | 2,050 | | | | 36,815 | | |
Distributions reinvested | | | — | | | | — | | | | 380,150 | | | | 6,954,904 | | |
Redemptions | | | — | | | | — | | | | (5,083,873 | ) | | | (93,280,205 | ) | |
Net decrease | | | — | | | | — | | | | (4,701,673 | ) | | | (86,288,486 | ) | |
Class K shares | |
Distributions reinvested | | | 30 | | | | 449 | | | | 28 | | | | 490 | | |
Redemptions | | | — | | | | — | | | | (548 | ) | | | (10,400 | ) | |
Net increase (decrease) | | | 30 | | | | 449 | | | | (520 | ) | | | (9,910 | ) | |
Class R shares | |
Subscriptions | | | 1,020,963 | | | | 15,819,083 | | | | 2,100,075 | | | | 37,594,686 | | |
Distributions reinvested | | | 580,991 | | | | 8,540,344 | | | | 563,949 | | | | 9,798,979 | | |
Redemptions | | | (2,036,070 | ) | | | (31,844,026 | ) | | | (1,474,651 | ) | | | (26,513,817 | ) | |
Net increase (decrease) | | | (434,116 | ) | | | (7,484,599 | ) | | | 1,189,373 | | | | 20,879,848 | | |
Class R4 shares | |
Subscriptions | | | 3,296,730 | | | | 55,092,459 | | | | 1,479,348 | | | | 26,228,312 | | |
Distributions reinvested | | | 655,311 | | | | 9,806,108 | | | | 143,482 | | | | 2,531,020 | | |
Redemptions | | | (1,018,196 | ) | | | (15,883,661 | ) | | | (265,407 | ) | | | (4,804,666 | ) | |
Net increase | | | 2,933,845 | | | | 49,014,906 | | | | 1,357,423 | | | | 23,954,666 | | |
Class R5 shares | |
Subscriptions | | | 1,934,097 | | | | 29,660,205 | | | | 2,742,088 | | | | 49,385,390 | | |
Distributions reinvested | | | 634,869 | | | | 9,573,018 | | | | 372,305 | | | | 6,561,008 | | |
Redemptions | | | (2,215,655 | ) | | | (34,902,596 | ) | | | (487,196 | ) | | | (8,921,619 | ) | |
Net increase | | | 353,311 | | | | 4,330,627 | | | | 2,627,197 | | | | 47,024,779 | | |
The accompanying Notes to Financial Statements are an integral part of this statement.
Annual Report 2016
18
COLUMBIA MID CAP VALUE FUND
STATEMENT OF CHANGES IN NET ASSETS (continued)
| | | Year Ended February 29, 2016 | | Year Ended February 28, 2015 | |
| | | Shares | | Dollars ($) | | Shares | | Dollars ($) | |
Capital stock activity (continued) | |
Class W shares | |
Distributions reinvested | | | 3,753 | | | | 55,185 | | | | 4,736 | | | | 83,001 | | |
Redemptions | | | (10,548 | ) | | | (163,053 | ) | | | (10,721 | ) | | | (195,568 | ) | |
Net decrease | | | (6,795 | ) | | | (107,868 | ) | | | (5,985 | ) | | | (112,567 | ) | |
Class Y shares | |
Subscriptions | | | 2,235,750 | | | | 35,123,742 | | | | 1,173,529 | | | | 20,826,179 | | |
Distributions reinvested | | | 423,848 | | | | 6,147,145 | | | | 151,708 | | | | 2,619,536 | | |
Redemptions | | | (854,642 | ) | | | (13,132,247 | ) | | | (249,909 | ) | | | (4,477,660 | ) | |
Net increase | | | 1,804,956 | | | | 28,138,640 | | | | 1,075,328 | | | | 18,968,055 | | |
Class Z shares | |
Subscriptions | | | 8,604,760 | | | | 132,927,848 | | | | 17,182,452 | | | | 310,691,377 | | |
Distributions reinvested | | | 14,227,858 | | | | 209,768,433 | | | | 18,119,784 | | | | 317,379,875 | | |
Redemptions | | | (46,053,685 | ) | | | (751,874,617 | ) | | | (29,519,885 | ) | | | (534,104,940 | ) | |
Net increase (decrease) | | | (23,221,067 | ) | | | (409,178,336 | ) | | | 5,782,351 | | | | 93,966,312 | | |
Total net increase (decrease) | | | (18,900,970 | ) | | | (350,006,177 | ) | | | 13,878,236 | | | | 230,753,029 | | |
(a) Includes conversions of Class B shares to Class A shares, if any.
The accompanying Notes to Financial Statements are an integral part of this statement.
Annual Report 2016
19
COLUMBIA MID CAP VALUE FUND
The following tables are intended to help you understand the Fund's financial performance. Certain information reflects financial results for a single share of a class held for the periods shown. Per share net investment income (loss) amounts are calculated based on average shares outstanding during the period. Total return assumes reinvestment of all dividends and distributions, if any. Total return does not reflect payment of sales charges, if any. Total return and portfolio turnover are not annualized for periods of less than one year. The portfolio turnover rate is calculated without regard to purchase and sales transactions of short-term instruments and certain derivatives, if any. If such transactions were included, the Fund's portfolio turnover rate may be higher.
| | | Year Ended
February 29, | | Year Ended February 28, | | Year Ended
February 29, | |
Class A | | 2016 | | 2015 | | 2014 | | 2013 | | 2012 | |
Per share data | |
Net asset value, beginning of period | | $ | 17.18 | | | $ | 18.64 | | | $ | 16.02 | | | $ | 13.91 | | | $ | 14.24 | | |
Income from investment operations: | |
Net investment income | | | 0.06 | | | | 0.07 | | | | 0.05 | | | | 0.11 | | | | 0.07 | | |
Net realized and unrealized gain (loss) | | | (2.03 | ) | | | 1.44 | | | | 4.60 | | | | 2.10 | | | | (0.33 | ) | |
Total from investment operations | | | (1.97 | ) | | | 1.51 | | | | 4.65 | | | | 2.21 | | | | (0.26 | ) | |
Less distributions to shareholders: | |
Net investment income | | | (0.05 | ) | | | (0.07 | ) | | | (0.07 | ) | | | (0.10 | ) | | | (0.07 | ) | |
Net realized gains | | | (2.28 | ) | | | (2.90 | ) | | | (1.96 | ) | | | — | | | | — | | |
Total distributions to shareholders | | | (2.33 | ) | | | (2.97 | ) | | | (2.03 | ) | | | (0.10 | ) | | | (0.07 | ) | |
Proceeds from regulatory settlements | | | — | | | | — | | | | — | | | | — | | | | 0.00 | (a) | |
Net asset value, end of period | | $ | 12.88 | | | $ | 17.18 | | | $ | 18.64 | | | $ | 16.02 | | | $ | 13.91 | | |
Total return | | | (12.77 | %) | | | 8.50 | % | | | 30.10 | % | | | 16.03 | % | | | (1.75 | %) | |
Ratios to average net assets(b) | |
Total gross expenses | | | 1.18 | % | | | 1.16 | % | | | 1.17 | % | | | 1.19 | % | | | 1.18 | % | |
Total net expenses(c) | | | 1.18 | %(d) | | | 1.16 | %(d) | | | 1.17 | %(d) | | | 1.19 | %(d) | | | 1.18 | %(d) | |
Net investment income | | | 0.37 | % | | | 0.39 | % | | | 0.27 | % | | | 0.75 | % | | | 0.59 | % | |
Supplemental data | |
Net assets, end of period (in thousands) | | $ | 837,676 | | | $ | 1,112,701 | | | $ | 1,098,949 | | | $ | 991,510 | | | $ | 1,135,303 | | |
Portfolio turnover | | | 47 | % | | | 25 | % | | | 48 | % | | | 36 | % | | | 39 | % | |
Notes to Financial Highlights
(a) Rounds to zero.
(b) In addition to the fees and expenses that the Fund bears directly, the Fund indirectly bears a pro rata share of the fees and expenses of any other funds in which it invests. Such indirect expenses are not included in the Fund's reported expense ratios.
(c) Total net expenses include the impact of certain fee waivers/expense reimbursements made by the Investment Manager and certain of its affiliates, if applicable.
(d) The benefits derived from expense reductions had an impact of less than 0.01%.
The accompanying Notes to Financial Statements are an integral part of this statement.
Annual Report 2016
20
COLUMBIA MID CAP VALUE FUND
FINANCIAL HIGHLIGHTS (continued)
| | | Year Ended
February 29, | | Year Ended February 28, | | Year Ended
February 29, | |
Class B | | 2016 | | 2015 | | 2014 | | 2013 | | 2012 | |
Per share data | |
Net asset value, beginning of period | | $ | 16.38 | | | $ | 17.98 | | | $ | 15.56 | | | $ | 13.52 | | | $ | 13.89 | | |
Income from investment operations: | |
Net investment income (loss) | | | (0.06 | ) | | | (0.07 | ) | | | (0.08 | ) | | | 0.00 | (a) | | | (0.02 | ) | |
Net realized and unrealized gain (loss) | | | (1.91 | ) | | | 1.39 | | | | 4.46 | | | | 2.06 | | | | (0.34 | ) | |
Total from investment operations | | | (1.97 | ) | | | 1.32 | | | | 4.38 | | | | 2.06 | | | | (0.36 | ) | |
Less distributions to shareholders: | |
Net investment income | | | — | | | | (0.02 | ) | | | — | | | | (0.02 | ) | | | (0.01 | ) | |
Net realized gains | | | (2.28 | ) | | | (2.90 | ) | | | (1.96 | ) | | | — | | | | — | | |
Total distributions to shareholders | | | (2.28 | ) | | | (2.92 | ) | | | (1.96 | ) | | | (0.02 | ) | | | (0.01 | ) | |
Proceeds from regulatory settlements | | | — | | | | — | | | | — | | | | — | | | | 0.00 | (a) | |
Net asset value, end of period | | $ | 12.13 | | | $ | 16.38 | | | $ | 17.98 | | | $ | 15.56 | | | $ | 13.52 | | |
Total return | | | (13.37 | %) | | | 7.64 | % | | | 29.16 | % | | | 15.22 | % | | | (2.55 | %) | |
Ratios to average net assets(b) | |
Total gross expenses | | | 1.93 | % | | | 1.91 | % | | | 1.92 | % | | | 1.94 | % | | | 1.93 | % | |
Total net expenses(c) | | | 1.93 | %(d) | | | 1.91 | %(d) | | | 1.92 | %(d) | | | 1.94 | %(d) | | | 1.93 | %(d) | |
Net investment income (loss) | | | (0.40 | %) | | | (0.40 | %) | | | (0.48 | %) | | | 0.01 | % | | | (0.19 | %) | |
Supplemental data | |
Net assets, end of period (in thousands) | | $ | 2,749 | | | $ | 9,250 | | | $ | 15,034 | | | $ | 16,759 | | | $ | 22,740 | | |
Portfolio turnover | | | 47 | % | | | 25 | % | | | 48 | % | | | 36 | % | | | 39 | % | |
Notes to Financial Highlights
(a) Rounds to zero.
(b) In addition to the fees and expenses that the Fund bears directly, the Fund indirectly bears a pro rata share of the fees and expenses of any other funds in which it invests. Such indirect expenses are not included in the Fund's reported expense ratios.
(c) Total net expenses include the impact of certain fee waivers/expense reimbursements made by the Investment Manager and certain of its affiliates, if applicable.
(d) The benefits derived from expense reductions had an impact of less than 0.01%.
The accompanying Notes to Financial Statements are an integral part of this statement.
Annual Report 2016
21
COLUMBIA MID CAP VALUE FUND
FINANCIAL HIGHLIGHTS (continued)
| | | Year Ended
February 29, | | Year Ended February 28, | | Year Ended
February 29, | |
Class C | | 2016 | | 2015 | | 2014 | | 2013 | | 2012 | |
Per share data | |
Net asset value, beginning of period | | $ | 16.47 | | | $ | 18.05 | | | $ | 15.62 | | | $ | 13.57 | | | $ | 13.94 | | |
Income from investment operations: | |
Net investment income (loss) | | | (0.06 | ) | | | (0.06 | ) | | | (0.08 | ) | | | 0.00 | (a) | | | (0.02 | ) | |
Net realized and unrealized gain (loss) | | | (1.93 | ) | | | 1.40 | | | | 4.47 | | | | 2.07 | | | | (0.34 | ) | |
Total from investment operations | | | (1.99 | ) | | | 1.34 | | | | 4.39 | | | | 2.07 | | | | (0.36 | ) | |
Less distributions to shareholders: | |
Net investment income | | | — | | | | (0.02 | ) | | | — | | | | (0.02 | ) | | | (0.01 | ) | |
Net realized gains | | | (2.28 | ) | | | (2.90 | ) | | | (1.96 | ) | | | — | | | | — | | |
Total distributions to shareholders | | | (2.28 | ) | | | (2.92 | ) | | | (1.96 | ) | | | (0.02 | ) | | | (0.01 | ) | |
Proceeds from regulatory settlements | | | — | | | | — | | | | — | | | | — | | | | 0.00 | (a) | |
Net asset value, end of period | | $ | 12.20 | | | $ | 16.47 | | | $ | 18.05 | | | $ | 15.62 | | | $ | 13.57 | | |
Total return | | | (13.42 | %) | | | 7.73 | % | | | 29.11 | % | | | 15.24 | % | | | (2.54 | %) | |
Ratios to average net assets(b) | |
Total gross expenses | | | 1.93 | % | | | 1.91 | % | | | 1.92 | % | | | 1.94 | % | | | 1.93 | % | |
Total net expenses(c) | | | 1.93 | %(d) | | | 1.91 | %(d) | | | 1.92 | %(d) | | | 1.94 | %(d) | | | 1.93 | %(d) | |
Net investment income (loss) | | | (0.38 | %) | | | (0.36 | %) | | | (0.49 | %) | | | 0.00 | %(a) | | | (0.17 | %) | |
Supplemental data | |
Net assets, end of period (in thousands) | | $ | 99,372 | | | $ | 138,393 | | | $ | 133,282 | | | $ | 115,248 | | | $ | 125,463 | | |
Portfolio turnover | | | 47 | % | | | 25 | % | | | 48 | % | | | 36 | % | | | 39 | % | |
Notes to Financial Highlights
(a) Rounds to zero.
(b) In addition to the fees and expenses that the Fund bears directly, the Fund indirectly bears a pro rata share of the fees and expenses of any other funds in which it invests. Such indirect expenses are not included in the Fund's reported expense ratios.
(c) Total net expenses include the impact of certain fee waivers/expense reimbursements made by the Investment Manager and certain of its affiliates, if applicable.
(d) The benefits derived from expense reductions had an impact of less than 0.01%.
The accompanying Notes to Financial Statements are an integral part of this statement.
Annual Report 2016
22
COLUMBIA MID CAP VALUE FUND
FINANCIAL HIGHLIGHTS (continued)
| | | Year Ended
February 29, | | Year Ended February 28, | | Year Ended
February 29, | |
Class I | | 2016 | | 2015 | | 2014 | | 2013 | | 2012 | |
Per share data | |
Net asset value, beginning of period | | $ | 17.19 | | | $ | 18.64 | | | $ | 16.03 | | | $ | 13.91 | | | $ | 14.24 | | |
Income from investment operations: | |
Net investment income | | | 0.13 | | | | 0.09 | | | | 0.12 | | | | 0.17 | | | | 0.13 | | |
Net realized and unrealized gain (loss) | | | (2.03 | ) | | | 1.51 | | | | 4.59 | | | | 2.12 | | | | (0.33 | ) | |
Total from investment operations | | | (1.90 | ) | | | 1.60 | | | | 4.71 | | | | 2.29 | | | | (0.20 | ) | |
Less distributions to shareholders: | |
Net investment income | | | (0.12 | ) | | | (0.15 | ) | | | (0.14 | ) | | | (0.17 | ) | | | (0.13 | ) | |
Net realized gains | | | (2.28 | ) | | | (2.90 | ) | | | (1.96 | ) | | | — | | | | — | | |
Total distributions to shareholders | | | (2.40 | ) | | | (3.05 | ) | | | (2.10 | ) | | | (0.17 | ) | | | (0.13 | ) | |
Proceeds from regulatory settlements | | | — | | | | — | | | | — | | | | — | | | | 0.00 | (a) | |
Net asset value, end of period | | $ | 12.89 | | | $ | 17.19 | | | $ | 18.64 | | | $ | 16.03 | | | $ | 13.91 | | |
Total return | | | (12.35 | %) | | | 9.03 | % | | | 30.59 | % | | | 16.61 | % | | | (1.32 | %) | |
Ratios to average net assets(b) | |
Total gross expenses | | | 0.72 | % | | | 0.72 | % | | | 0.73 | % | | | 0.74 | % | | | 0.73 | % | |
Total net expenses(c) | | | 0.72 | % | | | 0.72 | % | | | 0.73 | % | | | 0.74 | % | | | 0.73 | % | |
Net investment income | | | 0.83 | % | | | 0.51 | % | | | 0.69 | % | | | 1.19 | % | | | 1.03 | % | |
Supplemental data | |
Net assets, end of period (in thousands) | | $ | 2 | | | $ | 3 | | | $ | 87,662 | | | $ | 160,368 | | | $ | 143,562 | | |
Portfolio turnover | | | 47 | % | | | 25 | % | | | 48 | % | | | 36 | % | | | 39 | % | |
Notes to Financial Highlights
(a) Rounds to zero.
(b) In addition to the fees and expenses that the Fund bears directly, the Fund indirectly bears a pro rata share of the fees and expenses of any other funds in which it invests. Such indirect expenses are not included in the Fund's reported expense ratios.
(c) Total net expenses include the impact of certain fee waivers/expense reimbursements made by the Investment Manager and certain of its affiliates, if applicable.
The accompanying Notes to Financial Statements are an integral part of this statement.
Annual Report 2016
23
COLUMBIA MID CAP VALUE FUND
FINANCIAL HIGHLIGHTS (continued)
| | | Year Ended
February 29, | | Year Ended February 28, | | Year Ended
February 29, | |
Class K | | 2016 | | 2015 | | 2014 | | 2013 | | 2012(a) | |
Per share data | |
Net asset value, beginning of period | | $ | 17.24 | | | $ | 18.70 | | | $ | 16.07 | | | $ | 13.94 | | | $ | 14.06 | | |
Income from investment operations: | |
Net investment income | | | 0.08 | | | | 0.10 | | | | 0.07 | | | | 0.13 | | | | 0.11 | | |
Net realized and unrealized gain (loss) | | | (2.04 | ) | | | 1.44 | | | | 4.61 | | | | 2.13 | | | | (0.15 | ) | |
Total from investment operations | | | (1.96 | ) | | | 1.54 | | | | 4.68 | | | | 2.26 | | | | (0.04 | ) | |
Less distributions to shareholders: | |
Net investment income | | | (0.07 | ) | | | (0.10 | ) | | | (0.09 | ) | | | (0.13 | ) | | | (0.08 | ) | |
Net realized gains | | | (2.28 | ) | | | (2.90 | ) | | | (1.96 | ) | | | — | | | | — | | |
Total distributions to shareholders | | | (2.35 | ) | | | (3.00 | ) | | | (2.05 | ) | | | (0.13 | ) | | | (0.08 | ) | |
Proceeds from regulatory settlements | | | — | | | | — | | | | — | | | | — | | | | 0.00 | (b) | |
Net asset value, end of period | | $ | 12.93 | | | $ | 17.24 | | | $ | 18.70 | | | $ | 16.07 | | | $ | 13.94 | | |
Total return | | | (12.63 | %) | | | 8.63 | % | | | 30.26 | % | | | 16.31 | % | | | (0.23 | %) | |
Ratios to average net assets(c) | |
Total gross expenses | | | 1.02 | % | | | 1.01 | % | | | 1.03 | % | | | 1.04 | % | | | 1.05 | %(d) | |
Total net expenses(e) | | | 1.02 | % | | | 1.01 | % | | | 1.03 | % | | | 1.01 | % | | | 1.03 | %(d) | |
Net investment income | | | 0.53 | % | | | 0.57 | % | | | 0.40 | % | | | 0.93 | % | | | 0.86 | %(d) | |
Supplemental data | |
Net assets, end of period (in thousands) | | $ | 5 | | | $ | 6 | | | $ | 16 | | | $ | 14 | | | $ | 12 | | |
Portfolio turnover | | | 47 | % | | | 25 | % | | | 48 | % | | | 36 | % | | | 39 | % | |
Notes to Financial Highlights
(a) Based on operations from March 7, 2011 (commencement of operations) through the stated period end.
(b) Rounds to zero.
(c) In addition to the fees and expenses that the Fund bears directly, the Fund indirectly bears a pro rata share of the fees and expenses of any other funds in which it invests. Such indirect expenses are not included in the Fund's reported expense ratios.
(d) Annualized.
(e) Total net expenses include the impact of certain fee waivers/expense reimbursements made by the Investment Manager and certain of its affiliates, if applicable.
The accompanying Notes to Financial Statements are an integral part of this statement.
Annual Report 2016
24
COLUMBIA MID CAP VALUE FUND
FINANCIAL HIGHLIGHTS (continued)
| | | Year Ended
February 29, | | Year Ended February 28, | | Year Ended
February 29, | |
Class R | | 2016 | | 2015 | | 2014 | | 2013 | | 2012 | |
Per share data | |
Net asset value, beginning of period | | $ | 17.14 | | | $ | 18.61 | | | $ | 16.00 | | | $ | 13.89 | | | $ | 14.23 | | |
Income from investment operations: | |
Net investment income | | | 0.02 | | | | 0.03 | | | | 0.00 | (a) | | | 0.07 | | | | 0.01 | | |
Net realized and unrealized gain (loss) | | | (2.03 | ) | | | 1.44 | | | | 4.59 | | | | 2.11 | | | | (0.31 | ) | |
Total from investment operations | | | (2.01 | ) | | | 1.47 | | | | 4.59 | | | | 2.18 | | | | (0.30 | ) | |
Less distributions to shareholders: | |
Net investment income | | | (0.01 | ) | | | (0.04 | ) | | | (0.02 | ) | | | (0.07 | ) | | | (0.04 | ) | |
Net realized gains | | | (2.28 | ) | | | (2.90 | ) | | | (1.96 | ) | | | — | | | | — | | |
Total distributions to shareholders | | | (2.29 | ) | | | (2.94 | ) | | | (1.98 | ) | | | (0.07 | ) | | | (0.04 | ) | |
Proceeds from regulatory settlements | | | — | | | | — | | | | — | | | | — | | | | 0.00 | (a) | |
Net asset value, end of period | | $ | 12.84 | | | $ | 17.14 | | | $ | 18.61 | | | $ | 16.00 | | | $ | 13.89 | | |
Total return | | | (13.02 | %) | | | 8.25 | % | | | 29.77 | % | | | 15.76 | % | | | (2.04 | %) | |
Ratios to average net assets(b) | |
Total gross expenses | | | 1.43 | % | | | 1.41 | % | | | 1.42 | % | | | 1.44 | % | | | 1.45 | % | |
Total net expenses(c) | | | 1.43 | %(d) | | | 1.41 | %(d) | | | 1.42 | %(d) | | | 1.44 | %(d) | | | 1.43 | %(d) | |
Net investment income | | | 0.11 | % | | | 0.15 | % | | | 0.02 | % | | | 0.50 | % | | | 0.15 | % | |
Supplemental data | |
Net assets, end of period (in thousands) | | $ | 52,550 | | | $ | 77,556 | | | $ | 62,085 | | | $ | 58,923 | | | $ | 80,096 | | |
Portfolio turnover | | | 47 | % | | | 25 | % | | | 48 | % | | | 36 | % | | | 39 | % | |
Notes to Financial Highlights
(a) Rounds to zero.
(b) In addition to the fees and expenses that the Fund bears directly, the Fund indirectly bears a pro rata share of the fees and expenses of any other funds in which it invests. Such indirect expenses are not included in the Fund's reported expense ratios.
(c) Total net expenses include the impact of certain fee waivers/expense reimbursements made by the Investment Manager and certain of its affiliates, if applicable.
(d) The benefits derived from expense reductions had an impact of less than 0.01%.
The accompanying Notes to Financial Statements are an integral part of this statement.
Annual Report 2016
25
COLUMBIA MID CAP VALUE FUND
FINANCIAL HIGHLIGHTS (continued)
| | | Year Ended
February 29, | | Year Ended February 28, | |
Class R4 | | 2016 | | 2015 | | 2014 | | 2013(a) | |
Per share data | |
Net asset value, beginning of period | | $ | 17.52 | | | $ | 18.95 | | | $ | 16.26 | | | $ | 14.24 | | |
Income from investment operations: | |
Net investment income | | | 0.10 | | | | 0.12 | | | | 0.09 | | | | 0.06 | | |
Net realized and unrealized gain (loss) | | | (2.07 | ) | | | 1.47 | | | | 4.67 | | | | 2.00 | | |
Total from investment operations | | | (1.97 | ) | | | 1.59 | | | | 4.76 | | | | 2.06 | | |
Less distributions to shareholders: | |
Net investment income | | | (0.09 | ) | | | (0.12 | ) | | | (0.11 | ) | | | (0.04 | ) | |
Net realized gains | | | (2.28 | ) | | | (2.90 | ) | | | (1.96 | ) | | | — | | |
Total distributions to shareholders | | | (2.37 | ) | | | (3.02 | ) | | | (2.07 | ) | | | (0.04 | ) | |
Net asset value, end of period | | $ | 13.18 | | | $ | 17.52 | | | $ | 18.95 | | | $ | 16.26 | | |
Total return | | | (12.53 | %) | | | 8.79 | % | | | 30.40 | % | | | 14.49 | % | |
Ratios to average net assets(b) | |
Total gross expenses | | | 0.94 | % | | | 0.92 | % | | | 0.92 | % | | | 0.85 | %(c) | |
Total net expenses(d) | | | 0.94 | %(e) | | | 0.92 | %(e) | | | 0.92 | %(e) | | | 0.85 | %(c) | |
Net investment income | | | 0.64 | % | | | 0.68 | % | | | 0.48 | % | | | 1.19 | %(c) | |
Supplemental data | |
Net assets, end of period (in thousands) | | $ | 63,910 | | | $ | 33,559 | | | $ | 10,580 | | | $ | 3 | | |
Portfolio turnover | | | 47 | % | | | 25 | % | | | 48 | % | | | 36 | % | |
Notes to Financial Highlights
(a) Based on operations from November 8, 2012 (commencement of operations) through the stated period end.
(b) In addition to the fees and expenses that the Fund bears directly, the Fund indirectly bears a pro rata share of the fees and expenses of any other funds in which it invests. Such indirect expenses are not included in the Fund's reported expense ratios.
(c) Annualized.
(d) Total net expenses include the impact of certain fee waivers/expense reimbursements made by the Investment Manager and certain of its affiliates, if applicable.
(e) The benefits derived from expense reductions had an impact of less than 0.01%.
The accompanying Notes to Financial Statements are an integral part of this statement.
Annual Report 2016
26
COLUMBIA MID CAP VALUE FUND
FINANCIAL HIGHLIGHTS (continued)
| | | Year Ended
February 29, | | Year Ended February 28, | |
Class R5 | | 2016 | | 2015 | | 2014 | | 2013(a) | |
Per share data | |
Net asset value, beginning of period | | $ | 17.52 | | | $ | 18.96 | | | $ | 16.26 | | | $ | 14.24 | | |
Income from investment operations: | |
Net investment income | | | 0.12 | | | | 0.15 | | | | 0.12 | | | | 0.06 | | |
Net realized and unrealized gain (loss) | | | (2.07 | ) | | | 1.45 | | | | 4.67 | | | | 2.00 | | |
Total from investment operations | | | (1.95 | ) | | | 1.60 | | | | 4.79 | | | | 2.06 | | |
Less distributions to shareholders: | |
Net investment income | | | (0.11 | ) | | | (0.14 | ) | | | (0.13 | ) | | | (0.04 | ) | |
Net realized gains | | | (2.28 | ) | | | (2.90 | ) | | | (1.96 | ) | | | — | | |
Total distributions to shareholders | | | (2.39 | ) | | | (3.04 | ) | | | (2.09 | ) | | | (0.04 | ) | |
Net asset value, end of period | | $ | 13.18 | | | $ | 17.52 | | | $ | 18.96 | | | $ | 16.26 | | |
Total return | | | (12.40 | %) | | | 8.87 | % | | | 30.64 | % | | | 14.52 | % | |
Ratios to average net assets(b) | |
Total gross expenses | | | 0.79 | % | | | 0.78 | % | | | 0.80 | % | | | 0.77 | %(c) | |
Total net expenses(d) | | | 0.79 | % | | | 0.78 | % | | | 0.80 | % | | | 0.77 | %(c) | |
Net investment income | | | 0.76 | % | | | 0.84 | % | | | 0.67 | % | | | 1.28 | %(c) | |
Supplemental data | |
Net assets, end of period (in thousands) | | $ | 58,924 | | | $ | 72,152 | | | $ | 28,245 | | | $ | 3 | | |
Portfolio turnover | | | 47 | % | | | 25 | % | | | 48 | % | | | 36 | % | |
Notes to Financial Highlights
(a) Based on operations from November 8, 2012 (commencement of operations) through the stated period end.
(b) In addition to the fees and expenses that the Fund bears directly, the Fund indirectly bears a pro rata share of the fees and expenses of any other funds in which it invests. Such indirect expenses are not included in the Fund's reported expense ratios.
(c) Annualized.
(d) Total net expenses include the impact of certain fee waivers/expense reimbursements made by the Investment Manager and certain of its affiliates, if applicable.
The accompanying Notes to Financial Statements are an integral part of this statement.
Annual Report 2016
27
COLUMBIA MID CAP VALUE FUND
FINANCIAL HIGHLIGHTS (continued)
| | | Year Ended
February 29, | | Year Ended February 28, | | Year Ended
February 29, | |
Class W | | 2016 | | 2015 | | 2014 | | 2013 | | 2012 | |
Per share data | |
Net asset value, beginning of period | | $ | 17.18 | | | $ | 18.64 | | | $ | 16.03 | | | $ | 13.91 | | | $ | 14.24 | | |
Income from investment operations: | |
Net investment income | | | 0.06 | | | | 0.07 | | | | 0.04 | | | | 0.11 | | | | 0.09 | | |
Net realized and unrealized gain (loss) | | | (2.03 | ) | | | 1.45 | | | | 4.60 | | | | 2.11 | | | | (0.35 | ) | |
Total from investment operations | | | (1.97 | ) | | | 1.52 | | | | 4.64 | | | | 2.22 | | | | (0.26 | ) | |
Less distributions to shareholders: | |
Net investment income | | | (0.05 | ) | | | (0.08 | ) | | | (0.07 | ) | | | (0.10 | ) | | | (0.07 | ) | |
Net realized gains | | | (2.28 | ) | | | (2.90 | ) | | | (1.96 | ) | | | — | | | | — | | |
Total distributions to shareholders | | | (2.33 | ) | | | (2.98 | ) | | | (2.03 | ) | | | (0.10 | ) | | | (0.07 | ) | |
Proceeds from regulatory settlements | | | — | | | | — | | | | — | | | | — | | | | 0.00 | (a) | |
Net asset value, end of period | | $ | 12.88 | | | $ | 17.18 | | | $ | 18.64 | | | $ | 16.03 | | | $ | 13.91 | | |
Total return | | | (12.77 | %) | | | 8.50 | % | | | 30.02 | % | | | 16.09 | % | | | (1.74 | %) | |
Ratios to average net assets(b) | |
Total gross expenses | | | 1.18 | % | | | 1.16 | % | | | 1.16 | % | | | 1.19 | % | | | 1.19 | % | |
Total net expenses(c) | | | 1.18 | %(d) | | | 1.16 | %(d) | | | 1.16 | %(d) | | | 1.19 | %(d) | | | 1.19 | %(d) | |
Net investment income | | | 0.37 | % | | | 0.37 | % | | | 0.21 | % | | | 0.74 | % | | | 0.69 | % | |
Supplemental data | |
Net assets, end of period (in thousands) | | $ | 281 | | | $ | 492 | | | $ | 645 | | | $ | 79,581 | | | $ | 77,367 | | |
Portfolio turnover | | | 47 | % | | | 25 | % | | | 48 | % | | | 36 | % | | | 39 | % | |
Notes to Financial Highlights
(a) Rounds to zero.
(b) In addition to the fees and expenses that the Fund bears directly, the Fund indirectly bears a pro rata share of the fees and expenses of any other funds in which it invests. Such indirect expenses are not included in the Fund's reported expense ratios.
(c) Total net expenses include the impact of certain fee waivers/expense reimbursements made by the Investment Manager and certain of its affiliates, if applicable.
(d) The benefits derived from expense reductions had an impact of less than 0.01%.
The accompanying Notes to Financial Statements are an integral part of this statement.
Annual Report 2016
28
COLUMBIA MID CAP VALUE FUND
FINANCIAL HIGHLIGHTS (continued)
| | | Year Ended
February 29, | | Year Ended February 28, | | Year Ended
February 29, | |
Class Y | | 2016 | | 2015 | | 2014 | | 2013 | | 2012 | |
Per share data | |
Net asset value, beginning of period | | $ | 17.19 | | | $ | 18.65 | | | $ | 16.03 | | | $ | 13.91 | | | $ | 14.24 | | |
Income from investment operations: | |
Net investment income | | | 0.13 | | | | 0.16 | | | | 0.12 | | | | 0.18 | | | | 0.13 | | |
Net realized and unrealized gain (loss) | | | (2.03 | ) | | | 1.43 | | | | 4.60 | | | | 2.09 | | | | (0.34 | ) | |
Total from investment operations | | | (1.90 | ) | | | 1.59 | | | | 4.72 | | | | 2.27 | | | | (0.21 | ) | |
Less distributions to shareholders: | |
Net investment income | | | (0.12 | ) | | | (0.15 | ) | | | (0.14 | ) | | | (0.15 | ) | | | (0.12 | ) | |
Net realized gains | | | (2.28 | ) | | | (2.90 | ) | | | (1.96 | ) | | | — | | | | — | | |
Total distributions to shareholders | | | (2.40 | ) | | | (3.05 | ) | | | (2.10 | ) | | | (0.15 | ) | | | (0.12 | ) | |
Proceeds from regulatory settlements | | | — | | | | — | | | | — | | | | — | | | | 0.00 | (a) | |
Net asset value, end of period | | $ | 12.89 | | | $ | 17.19 | | | $ | 18.65 | | | $ | 16.03 | | | $ | 13.91 | | |
Total return | | | (12.35 | %) | | | 8.97 | % | | | 30.65 | % | | | 16.50 | % | | | (1.40 | %) | |
Ratios to average net assets(b) | |
Total gross expenses | | | 0.74 | % | | | 0.73 | % | | | 0.73 | % | | | 0.77 | % | | | 0.82 | % | |
Total net expenses(c) | | | 0.74 | % | | | 0.73 | % | | | 0.73 | % | | | 0.77 | % | | | 0.82 | % | |
Net investment income | | | 0.81 | % | | | 0.88 | % | | | 0.69 | % | | | 1.19 | % | | | 0.97 | % | |
Supplemental data | |
Net assets, end of period (in thousands) | | $ | 44,147 | | | $ | 27,860 | | | $ | 10,175 | | | $ | 4,975 | | | $ | 32 | | |
Portfolio turnover | | | 47 | % | | | 25 | % | | | 48 | % | | | 36 | % | | | 39 | % | |
Notes to Financial Highlights
(a) Rounds to zero.
(b) In addition to the fees and expenses that the Fund bears directly, the Fund indirectly bears a pro rata share of the fees and expenses of any other funds in which it invests. Such indirect expenses are not included in the Fund's reported expense ratios.
(c) Total net expenses include the impact of certain fee waivers/expense reimbursements made by the Investment Manager and certain of its affiliates, if applicable.
The accompanying Notes to Financial Statements are an integral part of this statement.
Annual Report 2016
29
COLUMBIA MID CAP VALUE FUND
FINANCIAL HIGHLIGHTS (continued)
| | | Year Ended
February 29, | | Year Ended February 28, | | Year Ended
February 29, | |
Class Z | | 2016 | | 2015 | | 2014 | | 2013 | | 2012 | |
Per share data | |
Net asset value, beginning of period | | $ | 17.21 | | | $ | 18.67 | | | $ | 16.05 | | | $ | 13.93 | | | $ | 14.26 | | |
Income from investment operations: | |
Net investment income | | | 0.10 | | | | 0.12 | | | | 0.09 | | | | 0.14 | | | | 0.11 | | |
Net realized and unrealized gain (loss) | | | (2.03 | ) | | | 1.44 | | | | 4.60 | | | | 2.12 | | | | (0.33 | ) | |
Total from investment operations | | | (1.93 | ) | | | 1.56 | | | | 4.69 | | | | 2.26 | | | | (0.22 | ) | |
Less distributions to shareholders: | |
Net investment income | | | (0.09 | ) | | | (0.12 | ) | | | (0.11 | ) | | | (0.14 | ) | | | (0.11 | ) | |
Net realized gains | | | (2.28 | ) | | | (2.90 | ) | | | (1.96 | ) | | | — | | | | — | | |
Total distributions to shareholders | | | (2.37 | ) | | | (3.02 | ) | | | (2.07 | ) | | | (0.14 | ) | | | (0.11 | ) | |
Proceeds from regulatory settlements | | | — | | | | — | | | | — | | | | — | | | | 0.00 | (a) | |
Net asset value, end of period | | $ | 12.91 | | | $ | 17.21 | | | $ | 18.67 | | | $ | 16.05 | | | $ | 13.93 | | |
Total return | | | (12.51 | %) | | | 8.76 | % | | | 30.37 | % | | | 16.36 | % | | | (1.50 | %) | |
Ratios to average net assets(b) | |
Total gross expenses | | | 0.93 | % | | | 0.91 | % | | | 0.92 | % | | | 0.94 | % | | | 0.93 | % | |
Total net expenses(c) | | | 0.93 | %(d) | | | 0.91 | %(d) | | | 0.92 | %(d) | | | 0.94 | %(d) | | | 0.93 | %(d) | |
Net investment income | | | 0.61 | % | | | 0.64 | % | | | 0.52 | % | | | 1.01 | % | | | 0.85 | % | |
Supplemental data | |
Net assets, end of period (in thousands) | | $ | 1,450,834 | | | $ | 2,334,328 | | | $ | 2,423,967 | | | $ | 2,298,515 | | | $ | 2,460,299 | | |
Portfolio turnover | | | 47 | % | | | 25 | % | | | 48 | % | | | 36 | % | | | 39 | % | |
Notes to Financial Highlights
(a) Rounds to zero.
(b) In addition to the fees and expenses that the Fund bears directly, the Fund indirectly bears a pro rata share of the fees and expenses of any other funds in which it invests. Such indirect expenses are not included in the Fund's reported expense ratios.
(c) Total net expenses include the impact of certain fee waivers/expense reimbursements made by the Investment Manager and certain of its affiliates, if applicable.
(d) The benefits derived from expense reductions had an impact of less than 0.01%.
The accompanying Notes to Financial Statements are an integral part of this statement.
Annual Report 2016
30
COLUMBIA MID CAP VALUE FUND
NOTES TO FINANCIAL STATEMENTS
February 29, 2016
Note 1. Organization
Columbia Mid Cap Value Fund (the Fund), a series of Columbia Funds Series Trust (the Trust), is a diversified fund. The Trust is registered under the Investment Company Act of 1940, as amended (the 1940 Act), as an open-end management investment company organized as a Delaware statutory trust.
Fund Shares
The Trust may issue an unlimited number of shares (without par value). The Fund offers Class A, Class B, Class C, Class I, Class K, Class R, Class R4, Class R5, Class W, Class Y and Class Z shares. Although all share classes generally have identical voting, dividend and liquidation rights, each share class votes separately when required by the Trust's organizational documents or by law. Different share classes pay different distribution amounts to the extent the expenses of such share classes differ, and distributions in liquidation will be proportional to the net asset value of each share class. Each share class has its own expense and sales charge structure.
Class A shares are subject to a maximum front-end sales charge of 5.75% based on the initial investment amount. Class A shares purchased without an initial sales charge in accounts aggregating $1 million to $50 million at the time of purchase are subject to a contingent deferred sales charge (CDSC) if the shares are sold within 18 months after purchase, charged as follows: 1.00% CDSC if redeemed within 12 months after purchase, and 0.50% CDSC if redeemed more than 12, but less than 18, months after purchase.
Class B shares may be subject to a maximum CDSC of 5.00% based upon the holding period after purchase. Class B shares will generally convert to Class A shares eight years after purchase. The Fund no longer accepts investments by new or existing investors in the Fund's Class B shares, except in connection with the reinvestment of any dividend and/or capital gain distributions in Class B shares of the Fund and exchanges by existing Class B shareholders of certain other funds within the Columbia Family of Funds.
Class C shares are subject to a 1.00% CDSC on shares redeemed within 12 months after purchase.
Class I shares are not subject to sales charges and are available only to the Columbia Family of Funds.
Class K shares are not subject to sales charges, however this share class is closed to new investors.
Class R shares are not subject to sales charges and are generally available only to certain retirement plans and other investors as described in the Fund's prospectus.
Class R4 shares are not subject to sales charges and are generally available only to omnibus retirement plans and certain investors as described in the Fund's prospectus.
Class R5 shares are not subject to sales charges and are generally available only to investors purchasing through authorized investment professionals and omnibus retirement plans.
Class W shares are not subject to sales charges and are available only to investors purchasing through authorized investment programs managed by investment professionals, including discretionary managed account programs.
Class Y shares are not subject to sales charges and are generally available only to certain retirement plans as described in the Fund's prospectus.
Class Z shares are not subject to sales charges and are available only to eligible investors, which are subject to different investment minimums as described in the Fund's prospectus.
Note 2. Summary of Significant Accounting Policies
Basis of Preparation
The Fund is an investment company that applies the accounting and reporting guidance in the Financial Accounting Standards Board (FASB) Accounting Standards Codification Topic 946, Financial Services — Investment Companies (ASC 946). The financial statements are prepared in accordance with U.S. generally accepted accounting principles (GAAP), which requires management to make certain estimates and assumptions that affect the reported amounts of assets and liabilities, the disclosure of contingent assets and liabilities at the date of the financial statements and the reported amounts of income and expenses during the reporting period. Actual results could differ from those estimates.
The following is a summary of significant accounting policies followed by the Fund in the preparation of its financial statements.
Security Valuation
All equity securities are valued at the close of business of the New York Stock Exchange (NYSE). Equity securities are valued at the last quoted sales price on the principal
Annual Report 2016
31
COLUMBIA MID CAP VALUE FUND
NOTES TO FINANCIAL STATEMENTS (continued)
February 29, 2016
exchange or market on which they trade, except for securities traded on the NASDAQ Stock Market, which are valued at the NASDAQ official close price. Unlisted securities or listed securities for which there were no sales during the day are valued at the mean of the latest quoted bid and ask prices on such exchanges or markets.
Foreign equity securities are valued based on the closing price on the foreign exchange in which such securities are primarily traded. If any foreign equity security closing prices are not readily available, the securities are valued at the mean of the latest quoted bid and ask prices on such exchanges or markets. Foreign currency exchange rates are generally determined at 4:00 p.m. Eastern (U.S.) time. Many securities markets and exchanges outside the U.S. close prior to the close of the NYSE; therefore, the closing prices for securities in such markets or on such exchanges may not fully reflect events that occur after such close but before the close of the NYSE. In those situations, foreign securities will be fair valued pursuant to a policy adopted by the Board of Trustees (the Board), including, if available, utilizing a third party pricing service to determine these fair values. The third party pricing service takes into account multiple factors, including, but not limited to, movements in the U.S. securities markets, certain depositary receipts, futures contracts and foreign exchange rates that have occurred subsequent to the close of the foreign exchange or market, to determine a good faith estimate that reasonably reflects the current market conditions as of the close of the NYSE. The fair value of a security is likely to be different from the quoted or published price, if available.
Investments in open-end investment companies, including money market funds, are valued at their latest net asset value.
Option contracts are valued at the mean of the latest quoted bid and ask prices on their primary exchanges. Option contracts, including over-the-counter option contracts, with no readily available market quotations are valued using quotes obtained from independent brokers as of the close of the NYSE.
Investments for which market quotations are not readily available, or that have quotations which management believes are not reflective of market value or reliable, are valued at fair value as determined in good faith under procedures approved by and under the general supervision of the Board. If a security or class of securities (such as foreign securities) is valued at fair value, such value is likely to be different from the quoted or published price for the security.
The determination of fair value often requires significant judgment. To determine fair value, management may use assumptions including but not limited to future cash flows and estimated risk premiums. Multiple inputs from various sources may be used to determine fair value.
GAAP requires disclosure regarding the inputs and valuation techniques used to measure fair value and any changes in valuation inputs or techniques. In addition, investments shall be disclosed by major category. This information is disclosed following the Fund's Portfolio of Investments.
Derivative Instruments
The Fund invests in certain derivative instruments, as detailed below, to meet its investment objectives. Derivatives are instruments whose values depend on, or are derived from, in whole or in part, the value of one or more securities, currencies, commodities, indices, or other assets or instruments. Derivatives may be used to increase investment flexibility (including to maintain cash reserves while maintaining desired exposure to certain assets), for risk management (hedging) purposes, to facilitate trading, to reduce transaction costs and to pursue higher investment returns. The Fund may also use derivative instruments to mitigate certain investment risks, such as foreign currency exchange rate risk, interest rate risk and credit risk. Derivatives may involve various risks, including the potential inability of the counterparty to fulfill its obligation under the terms of the contract, the potential for an illiquid secondary market (making it difficult for the Fund to sell, including at favorable prices) and the potential for market movements which may expose the Fund to gains or losses in excess of the amount shown in the Statement of Assets and Liabilities. The notional amounts of derivative instruments, if applicable, are not recorded in the financial statements.
A derivative instrument may suffer a marked-to-market loss if the value of the contract decreases due to an unfavorable change in the market rates or values of the underlying instrument. Losses can also occur if the counterparty does not perform under the contract. The Fund's risk of loss from counterparty credit risk on over-the-counter derivatives is generally limited to the aggregate unrealized gain netted against any collateral held by the Fund and the amount of any variation margin held by the counterparty. With exchange-traded or centrally cleared derivatives, there is reduced counterparty credit risk to the Fund since the exchange's clearinghouse, as counterparty to such instruments,
Annual Report 2016
32
COLUMBIA MID CAP VALUE FUND
NOTES TO FINANCIAL STATEMENTS (continued)
February 29, 2016
guarantees against a possible default. The clearinghouse stands between the buyer and the seller of the contract; therefore, the counterparty credit risk is failure of the clearinghouse. However, credit risk still exists in exchange-traded or centrally cleared derivatives with respect to initial and variation margin that is held in a broker's customer account. While brokers are required to segregate customer margin from their own assets, in the event that a broker becomes insolvent or goes into bankruptcy and at that time there is a shortfall in the aggregate amount of margin held by the broker for all its clients, U.S. bankruptcy laws will typically allocate that shortfall on a pro-rata basis across all the broker's customers (including the Fund), potentially resulting in losses to the Fund.
In order to better define its contractual rights and to secure rights that will help the Fund mitigate its counterparty risk, the Fund may enter into an International Swaps and Derivatives Association, Inc. Master Agreement (ISDA Master Agreement) or similar agreement with its derivatives contract counterparties. An ISDA Master Agreement is an agreement between the Fund and a counterparty that governs over-the-counter derivatives and forward foreign currency exchange contracts and typically contains, among other things, collateral posting terms and netting provisions in the event of a default and/or termination event. Under an ISDA Master Agreement, the Fund may, under certain circumstances, offset with the counterparty certain derivative instrument's payables and/or receivables with collateral held and/or posted and create one single net payment. The provisions of the ISDA Master Agreement typically permit a single net payment in the event of default (close-out netting) including the bankruptcy or insolvency of the counterparty. Note, however, that bankruptcy or insolvency laws of a particular jurisdiction may impose restrictions on or prohibitions against the right of offset in bankruptcy, insolvency or other events.
Collateral (margin) requirements differ by type of derivative. Margin requirements are established by the exchange or clearinghouse for exchange-traded and centrally cleared derivatives. Brokers can ask for margin in excess of the minimum in certain circumstances. Collateral terms are contract specific for over-the-counter derivatives. For over-the-counter derivatives traded under an ISDA Master Agreement, the collateral requirements are typically calculated by netting the marked-to-market amount for each transaction under such agreement and comparing that amount to the value of any variation margin currently pledged by the Fund and/or the
counterparty. Generally, the amount of collateral due from or to a party has to exceed a minimum transfer amount threshold (e.g., $500,000) before a transfer has to be made. To the extent amounts due to the Fund from its counterparties are not fully collateralized, contractually or otherwise, the Fund bears the risk of loss from counterparty nonperformance. The Fund attempts to mitigate counterparty risk by only entering into agreements with counterparties that it believes have the financial resources to honor their obligations and by monitoring the financial stability of those counterparties.
Certain ISDA Master Agreements allow counterparties to over-the-counter derivatives transactions to terminate derivatives contracts prior to maturity in the event the Fund's net asset value declines by a stated percentage over a specified time period or if the Fund fails to meet certain terms of the ISDA Master Agreement, which would cause the Fund to accelerate payment of any net liability owed to the counterparty. The Fund also has termination rights if the counterparty fails to meet certain terms of the ISDA Master Agreement. In addition to considering counterparty credit risk, the Fund would consider terminating the derivatives contracts based on whether termination would result in a net liability owed from the counterparty.
For financial reporting purposes, the Fund does not offset derivative assets and derivative liabilities that are subject to netting arrangements in the Statement of Assets and Liabilities.
Options Contracts
Options are contracts which entitle the holder to purchase or sell securities or other identified assets at a specified price, or in the case of index option contracts, to receive or pay the difference between the index value and the strike price of the index option contract. Option contracts can be either exchange-traded or over-the-counter. The Fund purchased and wrote option contracts to decrease the Fund's exposure to equity market risk and to increase return on investments. These instruments may be used for other purposes in future periods. Completion of transactions for option contracts traded in the over-the-counter market depends upon the performance of the other party. Cash collateral may be collected or posted by the Fund to secure certain over-the-counter option contract trades. Cash collateral held or posted by the Fund for such option contract trades must be returned to the counterparty or the Fund upon closure, exercise or expiration of the contract.
Annual Report 2016
33
COLUMBIA MID CAP VALUE FUND
NOTES TO FINANCIAL STATEMENTS (continued)
February 29, 2016
Options contracts purchased are recorded as investments. When the Fund writes an options contract, the premium received is recorded as an asset and an amount equivalent to the premium is recorded as a liability in the Statement of Assets and Liabilities and is subsequently adjusted to reflect the current fair value of the option written. Changes in the fair value of the written option are recorded as unrealized appreciation or depreciation until the contract is exercised or has expired. The Fund will realize a gain or loss when the option contract is closed or expires. When option contracts are exercised, the proceeds on sales for a written call or purchased put option contract, or the purchase cost for a written put or purchased call option contract, is adjusted by the amount of premium received or paid.
For over-the-counter options purchased, the Fund bears the risk of loss of the amount of the premiums paid plus the positive change in market values net of any collateral held by the Fund should the counterparty fail to perform under the contracts. Option contracts written by the Fund do not typically give rise to counterparty credit risk, as options written generally obligate the Fund and not the counterparty to perform. The risk in writing a call option contract is that the Fund gives up the opportunity for profit if the market price of the security increases above the strike price and the option contract is exercised. The risk in writing a put option contract is that the Fund may incur a loss if the market price of the security decreases below the strike price and the option contract is exercised. Exercise of a written option could result in the Fund purchasing or selling a security or foreign currency when it otherwise would not, or at a price different from the current market value. In purchasing and writing options, the Fund bears the risk of an unfavorable change in the value of the underlying instrument or the risk that the Fund may not be able to enter into a closing transaction due to an illiquid market.
Contracts and premiums associated with options contracts written for the year ended February 29, 2016 are as follows:
| | | Calls | |
| | | Contracts | | Premiums ($) | |
Balance at February 28, 2015 | | | — | | | | — | | |
Opened | | | 394 | | | | (37,019 | ) | |
Closed | | | (394 | ) | | | 37,019 | | |
Expired | | | — | | | | — | | |
Exercised | | | — | | | | — | | |
Balance at February 29, 2016 | | | — | | | | — | | |
Effects of Derivative Transactions in the Financial Statements
The following tables are intended to provide additional information about the effect of derivatives on the financial statements of the Fund, including: the fair value of derivatives by risk category and the location of those fair values in the Statement of Assets and Liabilities; and the impact of derivative transactions over the period in the Statement of Operations, including realized and unrealized gains (losses). The derivative instrument schedules following the Portfolio of Investments present additional information regarding derivative instruments outstanding at the end of the period, if any.
At February 29, 2016, the Fund had no outstanding derivatives.
The following table indicates the effect of derivative instruments (not considered to be hedging instruments for accounting disclosure purposes) in the Statement of Operations for the year ended February 29, 2016:
Amount of Realized Gain (Loss) on Derivatives Recognized in Income | |
Risk Exposure Category | | Options Contracts Written ($) | |
Equity risk | | | 32,274 | | |
The following table provides a summary of the average outstanding volume by derivative instrument for the year ended February 29, 2016:
Derivative Instrument | | Average market value ($)* | |
Options contracts — Written | | | — | | |
*Based on the ending quarterly outstanding amounts for the year ended February 29, 2016. While there was no market value of options outstanding at any quarter end, the Fund did enter into options during the year; the gain (loss) associated with this activity is presented in the Statement of Operations.
Security Transactions
Security transactions are accounted for on the trade date. Cost is determined and gains (losses) are based upon the specific identification method for both financial statement and federal income tax purposes.
Income Recognition
Corporate actions and dividend income are generally recorded net of any non-reclaimable tax withholdings, on the ex-dividend date or upon receipt of ex-dividend notification in the case of certain foreign securities.
The Fund may receive distributions from holdings in equity securities, business development companies (BDCs), exchange-traded funds, other regulated investment companies (RICs), and real estate investment
Annual Report 2016
34
COLUMBIA MID CAP VALUE FUND
NOTES TO FINANCIAL STATEMENTS (continued)
February 29, 2016
trusts (REITs), which report information on the tax character of their distributions annually. These distributions are allocated to dividend income, capital gain and return of capital based on actual information reported. Return of capital is recorded as a reduction of the cost basis of securities held. If the Fund no longer owns the applicable securities, return of capital is recorded as a realized gain. With respect to REITs, to the extent actual information has not yet been reported, estimates for return of capital are made by the Fund's management. Management's estimates are subsequently adjusted when the actual character of the distributions is disclosed by the REITs, which could result in a proportionate change in return of capital to shareholders.
Awards from class action litigation are recorded as a reduction of cost basis if the Fund still owns the applicable securities on the payment date. If the Fund no longer owns the applicable securities, the proceeds are recorded as realized gains.
Expenses
General expenses of the Trust are allocated to the Fund and other funds of the Trust based upon relative net assets or other expense allocation methodologies determined by the nature of the expense. Expenses directly attributable to the Fund are charged to the Fund. Expenses directly attributable to a specific class of shares are charged to that share class.
Determination of Class Net Asset Value
All income, expenses (other than class-specific expenses, which are charged to that share class, as shown in the Statement of Operations) and realized and unrealized gains (losses) are allocated to each class of the Fund on a daily basis, based on the relative net assets of each class, for purposes of determining the net asset value of each class.
Federal Income Tax Status
The Fund intends to qualify each year as a regulated investment company under Subchapter M of the Internal Revenue Code, as amended, and will distribute substantially all of its taxable income (including net short-term capital gains), if any, for its tax year, and as such will not be subject to federal income taxes. In addition, the Fund intends to distribute in each calendar year substantially all of its net investment income, capital gains and certain other amounts, if any, such that the Fund should not be subject to federal excise tax.
Therefore, no federal income or excise tax provision is recorded.
Distributions to Shareholders
Distributions from net investment income, if any, are declared and paid each calendar quarter. Net realized capital gains, if any, are distributed at least annually. Income distributions and capital gain distributions are determined in accordance with federal income tax regulations, which may differ from GAAP.
Guarantees and Indemnifications
Under the Trust's organizational documents and, in some cases, by contract, its officers and trustees are indemnified against certain liabilities arising out of the performance of their duties to the Trust or its funds. In addition, certain of the Fund's contracts with its service providers contain general indemnification clauses. The Fund's maximum exposure under these arrangements is unknown since the amount of any future claims that may be made against the Fund cannot be determined, and the Fund has no historical basis for predicting the likelihood of any such claims.
Recent Accounting Pronouncement
Fair Value Measurement (Topic 820), Disclosure for Investments in Certain Entities That Calculate Net Asset Value per Share (or Its Equivalent)
In May 2015, FASB issued Accounting Standards Update (ASU) No. 2015-07, Fair Value Measurement (Topic 820), Disclosure for Investments in Certain Entities That Calculate Net Asset Value per Share (or Its Equivalent). ASU No. 2015-07 changes the disclosure requirements for investments for which fair value is measured using the net asset value per share practical expedient. The disclosure requirements are effective for annual periods beginning after December 15, 2015 and interim periods within those fiscal years. At this time, management is evaluating the implications of this guidance and the impact it will have on the financial statement amounts and footnote disclosures, if any.
Note 3. Fees and Other Transactions with Affiliates
Management Fees
Effective July 1, 2015, the Fund entered into a Management Agreement with Columbia Management Investment Advisers, LLC (the Investment Manager), a wholly-owned subsidiary of Ameriprise Financial, Inc. (Ameriprise Financial). Under the Management
Annual Report 2016
35
COLUMBIA MID CAP VALUE FUND
NOTES TO FINANCIAL STATEMENTS (continued)
February 29, 2016
Agreement, the Investment Manager provides the Fund with investment research and advice, as well as administrative and accounting services. The management services fee is an annual fee that is equal to a percentage of the Fund's average daily net assets that declines from 0.82% to 0.65% as the Fund's net assets increase. The effective management services fee rate for the year ended February 29, 2016 was 0.72% of the Fund's average daily net assets.
Prior to July 1, 2015, the Fund paid the Investment Manager an annual fee for advisory services under an Investment Management Services Agreement and a separate annual fee for administrative and accounting services under an Administrative Services Agreement. For the period from March 1, 2015 through June 30, 2015, the investment advisory services fee paid to the Investment Manager was $8,110,237, and the administrative services fee paid to the Investment Manager was $618,630.
Participating Affiliates
The Investment Manager and its investment advisory affiliates (Participating Affiliates) around the world may coordinate in providing services to their clients. Such coordination may include functional leadership of the business (the "Global" business). From time to time the Investment Manager (or any affiliated investment subadviser to the Fund, as the case may be) may engage its Participating Affiliates to provide a variety of services such as investment research, investment monitoring, trading and discretionary investment management (including portfolio management) to certain accounts managed by the Investment Manager, including the Fund. These Participating Affiliates will provide services to the Investment Manager (or any affiliated investment subadviser to the Fund as the case may be) either pursuant to subadvisory agreements, personnel-sharing agreements or similar inter-company arrangements and the Fund will pay no additional fees and expenses as a result of any such arrangements.
These Participating Affiliates, like the Investment Manager, are direct or indirect subsidiaries of Ameriprise Financial and are registered with appropriate respective regulators in their home jurisdictions and, where required, the Securities and Exchange Commission and the Commodity Futures Trading Commission in the United States.
Pursuant to some of these arrangements, certain employees of these Participating Affiliates may serve as "associated persons" of the Investment Manager and, in
this capacity, subject to the oversight and supervision of the Investment Manager and consistent with the investment objectives, policies and limitations set forth in the Fund's prospectus and Statement of Additional Information (SAI), may provide such services to the Fund on behalf of the Investment Manager.
Other Expenses
Other expenses are for, among other things, miscellaneous expenses of the Fund or the Board, including payments to Board Services Corp., a company providing limited administrative services to the Fund and the Board. That company's expenses include boardroom and office expense, employee compensation, employee health and retirement benefits, and certain other expenses. For the year ended February 29, 2016, other expenses paid by the Fund to this company were $6,551.
Compensation of Board Members
Board members, who are not officers or employees of the Investment Manager or Ameriprise Financial, are compensated for their services to the Fund as disclosed in the Statement of Operations. Under a Deferred Compensation Plan (the Plan), these Board members may elect to defer payment of up to 100% of their compensation. Deferred amounts are treated as though equivalent dollar amounts had been invested in shares of certain funds managed by the Investment Manager. The Fund's liability for these amounts is adjusted for market value changes and remains in the Fund until distributed in accordance with the Plan. All amounts payable under the Plan constitute a general unsecured obligation of the Fund.
Transfer Agency Fees
Under a Transfer and Dividend Disbursing Agent Agreement, Columbia Management Investment Services Corp. (the Transfer Agent), an affiliate of the Investment Manager and a wholly-owned subsidiary of Ameriprise Financial, is responsible for providing transfer agency services to the Fund. The Transfer Agent has contracted with Boston Financial Data Services (BFDS) to serve as sub-transfer agent.
The Transfer Agent receives a monthly transfer agency fee based on the number or the average value of accounts, depending on the type of account. In addition, the Transfer Agent also receives sub-transfer agency fees based on a percentage of the average aggregate value of the Fund's shares maintained in omnibus accounts (other than omnibus accounts for which American
Annual Report 2016
36
COLUMBIA MID CAP VALUE FUND
NOTES TO FINANCIAL STATEMENTS (continued)
February 29, 2016
Enterprise Investment Services Inc. is the broker of record or accounts where the beneficial shareholder is a customer of Ameriprise Financial Services, Inc., for which the Transfer Agent receives a per account fee). The Transfer Agent pays the fees of BFDS for services as sub-transfer agent and is not entitled to reimbursement for such fees from the Fund (with the exception of out-of-pocket fees).
The Transfer Agent also receives compensation from the Fund for various shareholder services and reimbursements for certain out-of-pocket fees. Total transfer agency fees for Class K and Class R5 shares are subject to an annual limitation of not more than 0.05% of the average daily net assets attributable to each share class. Class I and Class Y shares do not pay transfer agency fees.
For the year ended February 29, 2016, the Fund's effective transfer agency fee rates as a percentage of average daily net assets of each class were as follows:
Class A | | | 0.19 | % | |
Class B | | | 0.19 | | |
Class C | | | 0.19 | | |
Class K | | | 0.05 | | |
Class R | | | 0.19 | | |
Class R4 | | | 0.19 | | |
Class R5 | | | 0.05 | | |
Class W | | | 0.19 | | |
Class Z | | | 0.19 | | |
An annual minimum account balance fee of $20 may apply to certain accounts with a value below the applicable share class's initial minimum investment requirements to reduce the impact of small accounts on transfer agency fees. These minimum account balance fees are remitted to the Fund and recorded as part of expense reductions in the Statement of Operations. For the year ended February 29, 2016, these minimum account balance fees reduced total expenses of the Fund by $4,916.
Plan Administration Fees
Under a Plan Administration Services Agreement with the Transfer Agent, the Fund pays an annual fee at a rate of 0.25% of the Fund's average daily net assets attributable to Class K shares for the provision of various administrative, recordkeeping, communication and educational services.
Distribution and Service Fees
The Fund has an agreement with Columbia Management Investment Distributors, Inc. (the Distributor), an affiliate of the Investment Manager and a wholly-owned subsidiary of Ameriprise Financial, for distribution and shareholder services. The Board has approved, and the Fund has adopted, distribution and shareholder service plans (the Plans) applicable to certain share classes, which set the distribution and service fees for the Fund. These fees are calculated daily and are intended to compensate the Distributor and/or eligible selling and/or servicing agents for selling shares of the Fund and providing services to investors.
Under the Plans, the Fund pays a monthly combined distribution and service fee to the Distributor at the maximum annual rate of 0.25% of the average daily net assets attributable to Class A shares of the Fund. Also under the Plans, the Fund pays a monthly service fee at the maximum annual rate of 0.25% of the average daily net assets attributable to Class B, Class C and Class W shares of the Fund and a monthly distribution fee at the maximum annual rate of 0.75%, 0.75%, 0.50% and 0.25% of the average daily net assets attributable to Class B, Class C, Class R and Class W shares of the Fund, respectively.
Although the Fund may pay a distribution fee up to 0.25% of the Fund's average daily net assets attributable to Class W shares and a service fee of up to 0.25% of the Fund's average daily net assets attributable to Class W shares, the aggregate fee shall not exceed 0.25% of the Fund's average daily net assets attributable to Class W shares.
Sales Charges
Sales charges, including front-end charges and CDSCs, received by the Distributor for distributing Fund shares were $294,947 for Class A, $137 for Class B and $4,458 for Class C shares for the year ended February 29, 2016.
Expenses Waived/Reimbursed by the Investment Manager and its Affiliates
The Fund's expense ratio is subject to an expense reimbursement arrangement pursuant to which fees will be waived and/or expenses reimbursed (excluding certain fees and expenses described below), so that the Fund's net operating expenses, after giving effect to fees waived/expenses reimbursed and any balance credits
Annual Report 2016
37
COLUMBIA MID CAP VALUE FUND
NOTES TO FINANCIAL STATEMENTS (continued)
February 29, 2016
and/or overdraft charges from the Fund's custodian, do not exceed the annual rates of:
| | | Contractual
Expense Cap
July 1, 2015
Through
June 30, 2016 | | Voluntary
Expense Cap
Prior to
July 1, 2015 | |
Class A | | | 1.26 | % | | | 1.28 | % | |
Class B | | | 2.01 | | | | 2.03 | | |
Class C | | | 2.01 | | | | 2.03 | | |
Class I | | | 0.86 | | | | 0.89 | | |
Class K | | | 1.16 | | | | 1.19 | | |
Class R | | | 1.51 | | | | 1.53 | | |
Class R4 | | | 1.01 | | | | 1.03 | | |
Class R5 | | | 0.91 | | | | 0.94 | | |
Class W | | | 1.26 | | | | 1.28 | | |
Class Y | | | 0.86 | | | | 0.89 | | |
Class Z | | | 1.01 | | | | 1.03 | | |
The contractual agreement may be modified or amended only with approval from the Investment Manager, certain of its affiliates and the Fund. Under the arrangements, the following fees and expenses are excluded from the waiver/reimbursement commitment, and therefore will be paid by the Fund, if applicable: taxes (including foreign transaction taxes), expenses associated with investments in affiliated and non-affiliated pooled investment vehicles (including mutual funds and exchange-traded funds), transaction costs and brokerage commissions, costs related to any securities lending program, dividend and interest expenses associated with securities sold short, inverse floater program fees and expenses, transaction charges and interest on borrowed money, interest and extraordinary expenses. Any fees waived and/or expenses reimbursed under the expense reimbursement arrangements described above are not recoverable by the Investment Manager or its affiliates in future periods.
Note 4. Federal Tax Information
The timing and character of income and capital gain distributions are determined in accordance with income tax regulations, which may differ from GAAP because of temporary or permanent book to tax differences.
At February 29, 2016, these differences are primarily due to differing treatment for deferral/reversal of wash sale losses and Trustees' deferred compensation. To the extent these differences are permanent, reclassifications are made among the components of the Fund's net assets in the Statement of Assets and Liabilities.
Temporary differences do not require reclassifications. In the Statement of Assets and Liabilities the following reclassifications were made:
Undistributed net investment income | | $ | 1 | | |
Paid-in capital | | | (1 | ) | |
Net investment income (loss) and net realized gains (losses), as disclosed in the Statement of Operations, and net assets were not affected by this reclassification.
The tax character of distributions paid during the years indicated was as follows:
Year Ended | | February 29,
2016 | | February 28,
2015 | |
Ordinary income | | $ | 14,116,134 | | | $ | 107,032,132 | | |
Long-term capital gains | | | 439,092,505 | | | | 510,692,937 | | |
Total | | $ | 453,208,639 | | | $ | 617,725,069 | | |
Short-term capital gain distributions, if any, are considered ordinary income distributions for tax purposes.
At February 29, 2016, the components of distributable earnings on a tax basis were as follows:
Undistributed ordinary income | | $ | 1,601,268 | | |
Undistributed long-term capital gains | | | 56,247,121 | | |
Net unrealized appreciation | | | 323,624,870 | | |
At February 29, 2016, the cost of investments for federal income tax purposes was $2,289,099,031 and the aggregate gross unrealized appreciation and depreciation based on that cost was:
Unrealized appreciation | | $ | 510,368,789 | | |
Unrealized depreciation | | | (186,743,919 | ) | |
Net unrealized appreciation | | $ | 323,624,870 | | |
Management of the Fund has concluded that there are no significant uncertain tax positions in the Fund that would require recognition in the financial statements. However, management's conclusion may be subject to review and adjustment at a later date based on factors including, but not limited to, new tax laws, regulations, and administrative interpretations (including relevant court decisions). Generally, the Fund's federal tax returns for the prior three fiscal years remain subject to examination by the Internal Revenue Service.
Note 5. Portfolio Information
The cost of purchases and proceeds from sales of securities, excluding short-term investments and derivatives, if any, aggregated to $1,446,762,461 and $2,090,348,657, respectively, for the year ended
Annual Report 2016
38
COLUMBIA MID CAP VALUE FUND
NOTES TO FINANCIAL STATEMENTS (continued)
February 29, 2016
February 29, 2016. The amount of purchase and sale activity impacts the portfolio turnover rate reported in the Financial Highlights.
Note 6. Affiliated Money Market Fund
The Fund invests in Columbia Short-Term Cash Fund, an affiliated money market fund established for the exclusive use by the Fund and other affiliated funds. The income earned by the Fund from such investments is included as Dividends — affiliated issuers in the Statement of Operations. As an investing fund, the Fund indirectly bears its proportionate share of the expenses of Columbia Short-Term Cash Fund.
Note 7. Line of Credit
The Fund has access to a revolving credit facility whereby the Fund may borrow for the temporary funding of shareholder redemptions or for other temporary or emergency purposes. Effective December 8, 2015, Citibank, N.A. and HSBC Bank USA, N.A. joined JPMorgan Chase Bank, N.A. (JPMorgan) as lead of a syndicate of banks under the credit facility, which is a collective agreement between the Fund and certain other funds managed by the Investment Manager, severally and not jointly, that permits collective borrowings up to $1 billion. Interest is charged to each participating fund based on its borrowings at a rate equal to the higher of (i) the overnight federal funds rate plus 1.00% or (ii) the one-month LIBOR rate plus 1.00%. Each borrowing under the credit facility matures no later than 60 days after the date of borrowing. The Fund also pays a commitment fee equal to its pro rata share of the amount of the credit facility at a rate of 0.15% per annum. The commitment fee is included in other expenses in the Statement of Operations. Prior to December 8, 2015, JPMorgan was the sole lead bank under the credit facility agreement that permitted borrowings up to $550 million under the same terms and interest rates as described above with the exception of the commitment fee which was charged at a rate of 0.075% per annum.
The Fund had no borrowings during the year ended February 29, 2016.
Note 8. Significant Risks
Shareholder Concentration Risk
At February 29, 2016, two unaffiliated shareholders of record owned 29.2% of the outstanding shares of the Fund in one or more accounts. The Fund has no knowledge about whether any portion of those shares was owned beneficially. Subscription and redemption
activity by concentrated accounts may have a significant effect on the operations of the Fund. In the case of a large redemption, the Fund may be forced to sell investments at inopportune times, including its liquid or more liquid positions, resulting in Fund losses and the Fund holding a higher percentage of less liquid or illiquid securities. Large redemptions could result in decreased economies of scale and increased operating expenses for non-redeeming Fund shareholders.
Financial Sector Risk
The Fund may be more susceptible to the particular risks that may affect companies in the financial services sector than if it were invested in a wider variety of companies in unrelated sectors. Companies in the financial services sector are subject to certain risks, including the risk of regulatory change, decreased liquidity in credit markets and unstable interest rates. Such companies may have concentrated portfolios, such as a high level of loans to real estate developers, which makes them vulnerable to economic conditions that affect that industry. Performance of such companies may be affected by competitive pressures and exposure to investments or agreements that, under certain circumstances, may lead to losses (e.g., subprime loans). Companies in the financial services sector are subject to extensive governmental regulation that may limit the amount and types of loans and other financial commitments they can make, and interest rates and fees that they may charge. In addition, profitability of such companies is largely dependent upon the availability and the cost of capital.
Note 9. Subsequent Events
Management has evaluated the events and transactions that have occurred through the date the financial statements were issued and noted no items requiring adjustment of the financial statements or additional disclosure.
Note 10. Information Regarding Pending and Settled Legal Proceedings
In December 2005, without admitting or denying the allegations, American Express Financial Corporation (AEFC, which is now known as Ameriprise Financial, Inc. (Ameriprise Financial)) entered into settlement agreements with the Securities and Exchange Commission (SEC) and Minnesota Department of Commerce (MDOC) related to market timing activities. As a result, AEFC was censured and ordered to cease and desist from committing or causing any violations of
Annual Report 2016
39
COLUMBIA MID CAP VALUE FUND
NOTES TO FINANCIAL STATEMENTS (continued)
February 29, 2016
certain provisions of the Investment Advisers Act of 1940, the Investment Company Act of 1940, and various Minnesota laws. AEFC agreed to pay disgorgement of $10 million and civil money penalties of $7 million. AEFC also agreed to retain an independent distribution consultant to assist in developing a plan for distribution of all disgorgement and civil penalties ordered by the SEC in accordance with various undertakings detailed at http://www.sec.gov/litigation/admin/ia-2451.pdf. Ameriprise Financial and its affiliates have cooperated with the SEC and the MDOC in these legal proceedings, and have made regular reports to the Funds' Boards of Trustees.
Ameriprise Financial and certain of its affiliates have historically been involved in a number of legal, arbitration and regulatory proceedings, including routine litigation, class actions, and governmental actions, concerning matters arising in connection with the conduct of their business activities. Ameriprise Financial believes that the Funds are not currently the subject of, and that neither Ameriprise Financial nor any of its affiliates are the subject of, any pending legal, arbitration or regulatory proceedings that are likely to have a material adverse effect on the Funds or the ability of Ameriprise Financial or its affiliates to perform under their contracts with the Funds. Ameriprise Financial is required to make quarterly (10-Q), annual (10-K) and, as necessary, 8-K filings with the SEC on legal and regulatory matters that relate to Ameriprise Financial and its affiliates. Copies of these filings may be obtained by accessing the SEC website at www.sec.gov.
There can be no assurance that these matters, or the adverse publicity associated with them, will not result in increased fund redemptions, reduced sale of fund shares or other adverse consequences to the Funds. Further, although we believe proceedings are not likely to have a material adverse effect on the Funds or the ability of Ameriprise Financial or its affiliates to perform under their contracts with the Funds, these proceedings are subject to uncertainties and, as such, we are unable to estimate the possible loss or range of loss that may result. An adverse outcome in one or more of these proceedings could result in adverse judgments, settlements, fines, penalties or other relief that could have a material adverse effect on the consolidated financial condition or results of operations of Ameriprise Financial.
Annual Report 2016
40
COLUMBIA MID CAP VALUE FUND
REPORT OF INDEPENDENT REGISTERED PUBLIC ACCOUNTING FIRM
To the Trustees of Columbia Funds Series Trust and the Shareholders of
Columbia Mid Cap Value Fund
In our opinion, the accompanying statement of assets and liabilities, including the portfolio of investments, and the related statements of operations and of changes in net assets and the financial highlights present fairly, in all material respects, the financial position of Columbia Mid Cap Value Fund (the "Fund," a series of Columbia Funds Series Trust) at February 29, 2016, and the results of its operations, the changes in its net assets and the financial highlights for each of the periods indicated, in conformity with accounting principles generally accepted in the United States of America. These financial statements and financial highlights (hereafter referred to as "financial statements") are the responsibility of the Fund's management. Our responsibility is to express an opinion on these financial statements based on our audits. We conducted our audits of these financial statements in accordance with the standards of the Public Company Accounting Oversight Board (United States). Those standards require that we plan and perform the audit to obtain reasonable assurance about whether the financial statements are free of material misstatement. An audit includes examining, on a test basis, evidence supporting the amounts and disclosures in the financial statements, assessing the accounting principles used and significant estimates made by management, and evaluating the overall financial statement presentation. We believe that our audits, which included confirmation of securities at February 29, 2016 by correspondence with the custodian, brokers and transfer agent, and the application of alternative auditing procedures where such confirmations had not been received, provide a reasonable basis for our opinion.
PricewaterhouseCoopers LLP
Minneapolis, MN
April 21, 2016
Annual Report 2016
41
COLUMBIA MID CAP VALUE FUND
FEDERAL INCOME TAX INFORMATION
(Unaudited)
The Fund hereby designates the following tax attributes for the fiscal year ended February 29, 2016. Shareholders will be notified in early 2017 of the amounts for use in preparing 2016 income tax returns.
Tax Designations
| Qualified Dividend Income | | | 100.00 | % | |
| Dividends Received Deduction | | | 100.00 | % | |
Capital Gain Dividend | | $ | 376,174,862 | | |
Qualified Dividend Income. For taxable, non-corporate shareholders, the percentage of ordinary income distributed during the fiscal year that represents qualified dividend income subject to reduced tax rates.
Dividends Received Deduction. The percentage of ordinary income distributed during the fiscal year that qualifies for the corporate dividends received deduction.
Capital Gain Dividend. The Fund designates as a capital gain dividend the amount reflected above, or if subsequently determined to be different, the net capital gain of such fiscal period.
Annual Report 2016
42
COLUMBIA MID CAP VALUE FUND
Shareholders elect the Board that oversees the Fund's operations. The Board appoints officers who are responsible for day-to-day business decisions based on policies set by the Board. The following table provides basic biographical information about the Fund's Trustees, including their principal occupations during the past five years, although specific titles for individuals may have varied over the period. Under current Board policy, members generally may serve through the end of the calendar year in which they reach either the mandatory retirement age established by the Board or the fifteenth anniversary of the first Board meeting they attended as a member of the Board.
Trustees
Independent Trustees
Name,
Address,
Year of Birth | | Position Held With
the Funds and Length of
Service | | Principal Occupation(s)
During the Past Five Years
and Other Relevant
Professional Experience | | Number of
Funds in the
Columbia
Funds Complex
Overseen | | Other Directorships
Held by Trustee
During the Past
Five Years | |
Kathleen Blatz
901 S. Marquette Ave.
Minneapolis, MN 55402
1954 | | Trustee since 1/06 for RiverSource Funds and since 6/11 for Nations Funds | | Attorney; specializing in arbitration and mediation; Chief Justice, Minnesota Supreme Court, 1998-2006; Associate Justice, Minnesota Supreme Court, 1996-1998; Fourth Judicial District Court Judge, Hennepin County, 1994-1996; Attorney in private practice and public service, 1984-1993; State Representative, Minnesota House of Representatives, 1979-1993, which included service on the Tax and Financial Institutions and Insurance Committees | | | 124 | | | Trustee, BlueCross BlueShield of Minnesota (Chair of the Business Development Committee) since 2009; Chair of the Robina Foundation since August 2013 | |
Edward J. Boudreau, Jr.
901 S. Marquette Ave.
Minneapolis, MN 55402
1944 | | Trustee since 6/11 for RiverSource Funds and since 1/05 for Nations Funds | | Managing Director, E.J. Boudreau & Associates (consulting) since 2000; FINRA Industry Arbitrator, 2002-present; Chairman and Chief Executive Officer, John Hancock Funds (asset management), Chairman and Interested Trustee for open-end and closed-end funds offered by John Hancock, 1989-2000; John Hancock Life Insurance Company, including SVP and Treasurer and SVP Information Technology, 1968-1988 | | | 122 | | | Former Trustee, Boston Museum of Science (Chair of Finance Committee), 1985-2013; former Trustee, BofA Funds Series Trust (11 funds), 2005-2011 | |
Pamela G. Carlton
901 S. Marquette Ave.
Minneapolis, MN 55402
1954 | | Trustee since 7/07 for RiverSource Funds and since 6/11 for Nations Funds | | President, Springboard-Partners in Cross Cultural Leadership (consulting company) since 2003; Managing Director of US Equity Research, JP Morgan Chase, 1999-2003; Director of US Equity Research, Chase Asset Management, 1996-1999; Co-Director Latin America Research, 1993-1996, COO Global Research, 1992-1996, Co-Director of US Research, 1991-1992, Investment Banker, Morgan Stanley, 1982-1991 | | | 124 | | | Trustee, New York Presbyterian Hospital Board (Executive Committee and Chair of Human Resources Committee) since 1996 | |
Annual Report 2016
43
COLUMBIA MID CAP VALUE FUND
TRUSTEES AND OFFICERS (continued)
Independent Trustees (continued)
Name,
Address,
Year of Birth | | Position Held With
the Funds and Length of
Service | | Principal Occupation(s)
During the Past Five Years
and Other Relevant
Professional Experience | | Number of
Funds in the
Columbia
Funds Complex
Overseen | | Other Directorships
Held by Trustee
During the Past
Five Years | |
William P. Carmichael
901 S. Marquette Ave.
Minneapolis, MN 55402
1943 | | Trustee since 6/11 for RiverSource Funds and since 2003 for Nations Funds; Chair of the Board from 1/14-11/15 | | Retired; Co-founder, The Succession Fund (provides exit strategies to owners of privately held companies), 1998-2007; Adjunct Professor of Finance, Kelley School of Business, Indiana University, 1993-2007; Senior Vice President, Sara Lee Corporation, 1991-1993; Senior Vice President and Chief Financial Officer, Beatrice Foods Company, 1984-1990; Vice President, Esmark, Inc., 1973-1984; Associate, Price Waterhouse, 1968-1972 | | | 124 | | | Director, The Finish Line (athletic shoes and apparel) since July 2003; Director, International Textile Corp. since 2012; Director, hhgregg since May, 2015; former Director, Cobra Electronics Corporation (electronic equipment manufacturer), 1994-August 2014; former Director, Spectrum Brands, Inc. (consumer products), 2002-2009; former Director, Simmons Company (bedding), 2004-2010; former Trustee, BofA Funds Series Trust (11 funds), 2009-2011; former Director, McMoRan Exploration Company (oil and gas exploration and development), 2010-2013 | |
Patricia M. Flynn
901 S. Marquette Ave.
Minneapolis, MN 55402
1950 | | Trustee since 11/04 for RiverSource Funds and since 6/11 for Nations Funds | | Trustee Professor of Economics and Management, Bentley University since 1976 (also teaches and conducts research on corporate governance); Dean, McCallum Graduate School of Business, Bentley University, 1992-2002 | | | 124 | | | Trustee, MA Taxpayers Foundation since 1997; Board of Governors, Innovation Institute, MA Technology Collaborative since 2010 | |
William A. Hawkins
901 S. Marquette Ave.
Minneapolis, MN 55402
1942 | | Chair of the Board since 11/15; Trustee since 6/11 for RiverSource Funds and since 1/05 for Nations Funds | | Managing Director, Overton Partners (financial consulting) since August 2010; President and Chief Executive Officer, California General Bank, N.A., January 2008-August 2010; Operation Hope, COO, 2004-2007; IndyMac Bancorp, President, CBG, 1999-2003; American General Bank, President, 1997-1999; Griffin Financial Services, CEO, 1981-1997; The Griffin Funds, CEO, 1992-1998 | | | 124 | | | Former Trustee, BofA Funds Series Trust (11 funds), 2009-2015 | |
R. Glenn Hilliard
901 S. Marquette Ave.
Minneapolis, MN 55402
1943 | | Trustee since 6/11 for RiverSource Funds and since 1/05 for Nations Funds | | Chairman and Chief Executive Officer, Hilliard Group LLC (investing and consulting) since April 2003; Non-Executive Director & Chairman, CNO Financial Group, Inc. (insurance), 2003-2011; Chair & CEO, ING Americas, 1996-2003 | | | 122 | | | Chairman, BofA Funds Series Trust (11 funds); former Director, CNO Financial Group, Inc. (insurance), 2003-2011 | |
Annual Report 2016
44
COLUMBIA MID CAP VALUE FUND
TRUSTEES AND OFFICERS (continued)
Independent Trustees (continued)
Name,
Address,
Year of Birth | | Position Held With
the Funds and Length of
Service | | Principal Occupation(s)
During the Past Five Years
and Other Relevant
Professional Experience | | Number of
Funds in the
Columbia
Funds Complex
Overseen | | Other Directorships
Held by Trustee
During the Past
Five Years | |
Catherine James Paglia
901 S. Marquette Ave.
Minneapolis, MN 55402
1952 | | Trustee since 11/04 for RiverSource Funds and since 6/11 for Nations Funds | | Director, Enterprise Asset Management, Inc. (private real estate and asset management company) since September 1998; Managing Director and Partner, Interlaken Capital, Inc., 1989-1997; Managing Director, Morgan Stanley, 1982-1989; Vice President, Investment Banking, 1980-1982, Associate, Investment Banking, 1976-1980, Dean Witter Reynolds, Inc. | | | 124 | | | Director, Valmont Industries, Inc. (irrigation systems manufacturer) since 2012; Trustee, Carleton College (on the Investment Committee); Trustee, Carnegie Endowment for International Peace (on the Investment Committee) | |
Leroy C. Richie
901 S. Marquette Ave.
Minneapolis, MN 55402
1941 | | Trustee since 2000 for Seligman Funds, since 11/08 for RiverSource Funds and since 6/11 for Nations Funds | | Counsel, Lewis & Munday, P.C. (law firm) since 2004; Vice President and General Counsel, Automotive Legal Affairs, Chrysler Corporation, 1993-1997 | | | 122 | | | Lead Outside Director, Infinity Resources, Inc. (oil and gas exploration and production) since 1994; Lead Outside Director, Digital Ally, Inc. (digital imaging) since September 2005; Trustee, Marygrove College (Chair of Finance Committee) since 2007; former Director, OGE Energy Corp. (energy and energy services), 2007-2014 | |
Minor M. Shaw
901 S. Marquette Ave.
Minneapolis, MN 55402
1947 | | Trustee since 6/11 for RiverSource Funds and since 2003 for Nations Funds | | President, Micco LLC (private investments) since 2011; President, Micco Corp. (family investment business), 1998-2011 | | | 124 | | | Director, Piedmont Natural Gas; Director, BlueCross BlueShield of South Carolina since April 2008; Chair of the Duke Endowment; Director, National Association of Corporate Directors, Carolinas Chapter since 2013; Chair of Greenville — Spartanburg Airport Commission; former Trustee, BofA Funds Series Trust (11 funds), 2003-2011 | |
Alison Taunton-Rigby
901 S. Marquette Ave.
Minneapolis, MN 55402
1944 | | Trustee since 11/02 for RiverSource Funds and since 6/11 for Nations Funds | | Managing Director, Forester Biotech (consulting), 2001-2003; Chief Executive Officer and Director, RiboNovix, Inc., (biotechnology), 2003-2010; President and Chief Executive Officer of CMT Inc., 2001-2003; Aquila Biopharmaceuticals Inc., 1996-2000; Cambridge Biotech Corporation, 1995-1996; Mitotix Inc., 1993-1994 | | | 124 | | | Director, Abt Associates (government contractor) since 2001; Director, Boston Children's Hospital since 2002; Director, Healthways, Inc. (health and well-being solutions) since 2005; Director, ICI Mutual Insurance Company since 2011 | |
Annual Report 2016
45
COLUMBIA MID CAP VALUE FUND
TRUSTEES AND OFFICERS (continued)
Interested Trustee Not Affiliated with Investment Manager*
Name,
Address,
Year of Birth | | Position Held With
Funds and Length of
Service | | Principal Occupation(s)
During Past Five Years
and Other Relevant
Professional Experience | | Number of
Funds in the
Fund Family
Overseen by
Board Member | | Other Present or Past
Directorships/
Trusteeships
(Within Past 5 Years) | |
Anthony M. Santomero
901 S. Marquette Ave.
Minneapolis, MN 55402
1946 | | Trustee since 6/11 for RiverSource Funds and since 1/08 for Nations Funds | | Richard K. Mellon Professor Emeritus of Finance, The Wharton School, University of Pennsylvania since 2002; Senior Advisor, McKinsey & Company (consulting), 2006-2008; President, Federal Reserve Bank of Philadelphia, 2000-2006; Professor of Finance, The Wharton School, University of Pennsylvania, 1972-2002 | | | 122 | | | Trustee, Penn Mutual Life Insurance Company since March 2008; Director, Renaissance Reinsurance Ltd. since May 2008; Director, Citigroup Inc. since 2009; Director, Citibank, N.A. since 2009; former Trustee, BofA Funds Series Trust (11 funds), 2008-2011 | |
* Dr. Santomero is not an affiliated person of the Investment Manager or Ameriprise Financial. However, he is currently deemed by the Funds to be an "interested person" (as defined in the 1940 Act) of the Funds because he serves as a Director of Citigroup Inc. and Citibank, N.A., companies that may directly or through subsidiaries and affiliates engage from time-to-time in brokerage execution, principal transactions and lending relationships with the Funds or accounts advised/managed by the Investment Manager.
Annual Report 2016
46
COLUMBIA MID CAP VALUE FUND
TRUSTEES AND OFFICERS (continued)
Interested Trustee Affiliated with Investment Manager*
Name,
Address,
Year of Birth | | Position Held With
the Funds and Length of
Service | | Principal Occupation(s)
During Past Five Years
and Other Relevant
Professional Experience | | Number of
Funds in the
Columbia
Funds Complex
Overseen | | Other Directorships
Held by Trustee
During the Past
Five Years | |
William F. Truscott
c/o Columbia Management Investment Advisers, LLC,
225 Franklin St.
Boston, MA 02110
1960 | | Trustee since 11/01 for RiverSource Funds and since 6/11 for Nations Funds; Senior Vice President since 2002 for RiverSource Funds and since 5/10 for Nations Funds | | Chairman of the Board and President, Columbia Management Investment Advisers, LLC since May 2010 and February 2012, respectively (previously President and Chief Investment Officer, 2001-April 2010); Chief Executive Officer, Global Asset Management, Ameriprise Financial, Inc. since September 2012 (previously Chief Executive Officer, U.S. Asset Management & President, Annuities, May 2010-September 2012 and President — U.S. Asset Management and Chief Investment Officer, 2005-April 2010); Director and Chief Executive Officer, Columbia Management Investment Distributors, Inc. since May 2010 and February 2012, respectively (previously Chairman of the Board and Chief Executive Officer, 2006-April 2010); Chairman of the Board and Chief Executive Officer, RiverSource Distributors, Inc. since 2006; Director, Threadneedle Asset Management Holdings, SARL since 2014; President and Chief Executive Officer, Ameriprise Certificate Company, 2006-August 2012. | | | 182 | | | Chairman of the Board, Columbia Management Investment Advisers, LLC since May 2010; Director, Columbia Management Investment Distributors, Inc. since May 2010; Former Director, Ameriprise Certificate Company, 2006-January 2013 | |
* Interested person (as defined under the 1940 Act) by reason of being an officer, director, security holder and/or employee of the Investment Manager or Ameriprise Financial.
The Statement of Additional Information has additional information about the Fund's Board members and is available, without charge, upon request by calling 800.345.6611; contacting your financial intermediary; or visiting columbiathreadneedle.com/us.
Annual Report 2016
47
COLUMBIA MID CAP VALUE FUND
TRUSTEES AND OFFICERS (continued)
The Board has appointed officers who are responsible for day-to-day business decisions based on policies it has established. The officers serve at the pleasure of the Board. The following table provides basic information about the Officers of the Fund, including principal occupations during the past five years, although their specific titles may have varied over the period. In addition to Mr. Truscott, who is Senior Vice President, the Fund's other officers are:
Fund Officers
Name,
Address and
Year of Birth | | Position and Year
First Appointed to
Position for any Fund
in the Columbia
Funds Complex or a
Predecessor Thereof | | Principal Occupation(s) During Past Five Years | |
Christopher O. Petersen
5228 Ameriprise
Financial Center
Minneapolis, MN 55474
Born 1970 | | President and Principal Executive Officer (2015) | | Vice President and Lead Chief Counsel, Ameriprise Financial, Inc. since January 2015 (previously, Vice President and Chief Counsel January 2010-December 2014; and Vice President and Group Counsel or Counsel 2004-January 2010); officer of Columbia Funds and affiliated funds since 2007. | |
Michael G. Clarke
225 Franklin Street
Boston, MA 02110
Born 1969 | | Treasurer (2011), Chief Financial Officer (2009) and Chief Accounting Officer (2015) | | Vice President — Mutual Fund Administration, Columbia Management Investment Advisers, LLC, since May 2010; Managing Director of Fund Administration, Columbia Management Advisors, LLC, September 2004-April 2010; senior officer of Columbia Funds and affiliated funds since 2002. | |
Paul B. Goucher
100 Park Avenue
New York, NY 10017
Born 1968 | | Senior Vice President (2011), Chief Legal Officer (2015) and Assistant Secretary (2008) | | Vice President and Lead Chief Counsel, Ameriprise Financial, Inc. since November 2008 and January 2013, respectively (previously Chief Counsel, January 2010-January 2013 and Group Counsel, November 2008-January 2010). | |
Thomas P. McGuire
225 Franklin Street
Boston, MA 02110
Born 1972 | | Senior Vice President and Chief Compliance Officer (2012) | | Vice President — Asset Management Compliance, Ameriprise Financial, Inc., since May 2010; Chief Compliance Officer, Ameriprise Certificate Company since September 2010; Compliance Executive, Bank of America, 2005-April 2010. | |
Colin Moore
225 Franklin Street
Boston, MA 02110
Born 1958 | | Senior Vice President (2010) | | Executive Vice President and Global Chief Investment Officer, Ameriprise Financial, Inc., since July 2013; Director and Global Chief Investment Officer, Columbia Management Investment Advisers, LLC since May 2010; Manager, Managing Director and Chief Investment Officer, Columbia Management Advisors, LLC, 2007-April 2010. | |
Michael E. DeFao
225 Franklin Street
Boston, MA 02110
Born 1968 | | Vice President (2011) and Assistant Secretary (2010) | | Vice President and Chief Counsel, Ameriprise Financial, Inc. since May 2010; Associate General Counsel, Bank of America, 2005-April 2010. | |
Amy Johnson
5228 Ameriprise
Financial Center
Minneapolis, MN 55474
Born 1965 | | Vice President (2006) | | Managing Director and Chief Operating Officer, Columbia Management Investment Advisers, LLC since May 2010 (previously Chief Administrative Officer, 2009-April 2010, and Vice President — Asset Management and Trust Company Services, 2006-2009). | |
Lyn Kephart-Strong
5228 Ameriprise
Financial Center
Minneapolis, MN 55474
Born 1960 | | Vice President (2015) | | President, Columbia Management Investment Services Corp. since October 2014; Vice President & Resolution Officer, Ameriprise Trust Company since August 2009; President, RiverSource Service Corporation 2004-2010. | |
Ryan C. Larrenaga
225 Franklin Street
Boston, MA 02110
Born 1970 | | Vice President and Secretary (2015) | | Vice President and Group Counsel, Ameriprise Financial, Inc. since August 2011 (previously, Counsel from May 2010 to August 2011); Assistant General Counsel, Bank of America, 2005-April 2010; officer of Columbia Funds and affiliated funds since 2005. | |
Annual Report 2016
48
COLUMBIA MID CAP VALUE FUND
IMPORTANT INFORMATION ABOUT THIS REPORT
Each fund mails one shareholder report to each shareholder address. If you would like more than one report, please call shareholder services at 800.345.6611 and additional reports will be sent to you.
The policy of the Board is to vote the proxies of the companies in which each fund holds investments consistent with the procedures as stated in the Statement of Additional Information (SAI). You may obtain a copy of the SAI without charge by calling 800.345.6611; contacting your financial intermediary; visiting columbiathreadneedle.com/us; or searching the website of the Securities and Exchange Commission (SEC) at sec.gov. Information regarding how each fund voted proxies relating to portfolio securities is filed with the SEC by August 31st for the most recent 12-month period ending June 30th of that year, and is available without charge by visiting columbiathreadneedle.com/us, or searching the website of the SEC at sec.gov.
Each fund files a complete schedule of portfolio holdings with the SEC for the first and third quarters of each fiscal year on Form N-Q. Each fund's Form N-Q is available on the SEC's website at sec.gov and may be reviewed and copied at the SEC's Public Reference Room in Washington, D.C. Information on the operation of the Public Reference Room may be obtained by calling 800.SEC.0330. Each fund's complete schedule of portfolio holdings, as filed on Form N-Q, can also be obtained without charge, upon request, by calling 800.345.6611.
Annual Report 2016
49
Columbia Mid Cap Value Fund
P.O. Box 8081
Boston, MA 02266-8081

This information is for use with concurrent or prior delivery of a fund prospectus. Please read and consider the investment objectives, risks, charges and expenses for any fund carefully before investing. For a prospectus and summary prospectus, which contains this and other important information about the Fund, go to columbiathreadneedle.com/us. The Fund is distributed by Columbia Management Investment Distributors, Inc., member FINRA, and managed by Columbia Management Investment Advisers, LLC.
Columbia Threadneedle Investments (Columbia Threadneedle) is the global brand name of the Columbia and Threadneedle group of companies.
All rights reserved. Columbia Management Investment Distributors, Inc., 225 Franklin Street, Boston, MA 02110-2804
© 2016 Columbia Management Investment Advisers, LLC.
columbiathreadneedle.com/us
ANN197_02_F01_(04/16)

ANNUAL REPORT
February 29, 2016

COLUMBIA SELECT INTERNATIONAL EQUITY FUND

ABOUT COLUMBIA THREADNEEDLE INVESTMENTS
Columbia Threadneedle Investments is a leading global asset management group that provides a broad range of actively managed investment strategies and solutions for individual, institutional and corporate clients around the world.
With more than 2,000 people, including over 450 investment professionals based in North America, Europe and Asia, we manage $472 billion* of assets across developed and emerging market equities, fixed income, asset allocation solutions and alternatives. We are the 13th largest manager of long-term mutual fund assets in the U.S.** and the 4th largest manager of retail funds in the U.K.***
Our priority is the investment success of our clients. We aim to deliver the investment outcomes they expect through an investment approach that is team-based, performance-driven and risk-aware. Our culture is dynamic and interactive. By sharing our insights across asset classes and geographies, we generate richer perspectives on global, regional and local investment landscapes. The ability to exchange and debate investment ideas in a collaborative environment enriches our teams' investment processes. More importantly, it results in better informed investment decisions for our clients.
Columbia funds are distributed by Columbia Management Investment Distributors, Inc., member FINRA, and managed by Columbia Management Investment Advisers, LLC.
Columbia Threadneedle Investments (Columbia Threadneedle) is the global brand name of the Columbia and Threadneedle group of companies.
* In U.S. dollars as of December 31, 2015. Source: Ameriprise Q4 Earnings Release. Includes all assets managed by entities in the Columbia and Threadneedle groups of companies. Contact us for more current data.
** Source: ICI as of December 31, 2015 for Columbia Management Investment Advisers, LLC.
*** Source: Investment Association as of September 2015 for Threadneedle Asset Management Limited.
© 2016 Columbia Management Investment Advisers, LLC. All rights reserved.
Not part of the shareholder report
Investment strategies to help meet investor needs
We are committed to helping investors navigate financial challenges to reach their desired outcomes. The possibilities are endless.
Your success is our priority.
Retire comfortably
Fund college or higher education
Leave a legacy
Generate an appropriate stream of income in retirement
Traditional approaches to income may no longer be adequate — and they may no longer provide the diversification benefits they once did. Investors need to rethink how they generate retirement income.
Worried about running out of income? You are not alone.
Navigate a changing interest rate environment
Even in today's challenging interest rate environment, it's still possible to navigate markets and achieve your goals.
Make investment choices designed specifically for this market environment.
Maximize after-tax returns
In an environment where what you keep is more important than what you earn, municipal bonds can help mitigate higher taxes while providing attractive yields compared to other investment options.
You've worked too hard building your wealth to lose it to taxes.
Grow assets to achieve financial goals
Finding growth opportunities in today's complex market environment requires strong research capabilities, creative thinking and a disciplined approach.
Do your investments deliver the portfolio growth you need?
Ease the impact of volatile markets
With increasing concerns about market volatility, investors should consider diversifying their portfolios with non-traditional holdings.
Interested in turning volatility into opportunity?
To find out more, contact your financial professional, call 800.426.3750 or visit columbiathreadneedle.com/us
Not part of the shareholder report
 Dear Shareholder,
Today's investors are typically focused on outcomes, like living a certain retirement lifestyle, paying for college education or building a legacy. But in today's complex global investment landscape, even simple goals are not easily achieved.
At Columbia Threadneedle Investments, we aspire to help satisfy five core needs of today's investors:
n Generate an appropriate stream of income in retirement
Traditional approaches to generating income may not provide the diversification benefits they once did, and they may actually introduce unwanted risk in today's market. To seek to improve your potential to live comfortably long term, we endeavor to pursue investments that explore less traveled paths to income.
n Navigate a changing interest rate environment
Today's uncertain market environment includes the prospect of a rise in interest rates. Blending traditional investments with non-traditional or alternative products may help protect your wealth during periods of volatility. We can attempt to help strengthen your portfolio with agile products designed to take on the market's ups and downs.
n Maximize after-tax returns
In an environment where what you keep may be more important than what you earn, municipal bonds can help mitigate high tax burdens while providing potentially attractive yields. Our state and federal tax-exempt products are aimed at helping investors manage risk, minimize the fluctuation of capital and grow wealth on a more tax-efficient basis.
n Grow assets to achieve financial goals
We believe that finding and protecting growth comes from a disciplined security selection process designed to create excess return. Our goal is to provide investment solutions built to help you face today's market challenges and grow your assets at each crossroad of your journey.
n Ease the impact of volatile markets
Despite a bull market run that has benefited many investors over the past several years, it's important to remember the lessons of 2008 and the value that a well-diversified portfolio may provide through times of market volatility. We are here to help you hold onto the savings you have worked tirelessly to amass, and to provide you the best opportunity to maintain your standard of living regardless of market conditions.
Find out today how we can help you confidently invest to realize your dreams. Please visit us at blog.columbiathreadneedleus.com/our-best-ideas to learn more about our unique investment solutions.
The world is constantly changing, but our priority remains the same: to help you secure your finances, meet your goals and achieve success. Thank you for your continued investment with us.
Sincerely,

Christopher O. Petersen
President, Columbia Funds
Investors should consider the investment objectives, risks, charges and expenses of a mutual fund carefully before investing. For a free prospectus and summary prospectus, which contains this and other important information about a fund, visit columbiathreadneedle.com/us. The prospectus should be read carefully before investing.
Columbia Funds are distributed by Columbia Management Investment Distributors, Inc., member FINRA, and managed by Columbia Management Investment Advisers, LLC.
© 2016 Columbia Management Investment Advisers, LLC. All rights reserved.
COLUMBIA SELECT INTERNATIONAL EQUITY FUND
Performance Overview | | | 2 | | |
Manager Discussion of Fund Performance | | | 4 | | |
Understanding Your Fund's Expenses | | | 7 | | |
Portfolio of Investments | | | 8 | | |
Statement of Assets and Liabilities | | | 13 | | |
Statement of Operations | | | 15 | | |
Statement of Changes in Net Assets | | | 16 | | |
Financial Highlights | | | 18 | | |
Notes to Financial Statements | | | 29 | | |
Report of Independent Registered Public Accounting Firm | | | 39 | | |
Federal Income Tax Information | | | 40 | | |
Trustees and Officers | | | 41 | | |
Important Information About This Report | | | 47 | | |
Fund Investment Manager
Columbia Management Investment
Advisers, LLC
225 Franklin Street
Boston, MA 02110
Fund Distributor
Columbia Management Investment
Distributors, Inc.
225 Franklin Street
Boston, MA 02110
Fund Transfer Agent
Columbia Management Investment
Services Corp.
P.O. Box 8081
Boston, MA 02266-8081
For more information about any of the funds, please visit columbiathreadneedle.com/us or call 800.345.6611. Customer Service Representatives are available to answer your questions Monday through Friday from 8 a.m. to 7 p.m. Eastern time.
The views expressed in this report reflect the current views of the respective parties. These views are not guarantees of future performance and involve certain risks, uncertainties and assumptions that are difficult to predict, so actual outcomes and results may differ significantly from the views expressed. These views are subject to change at any time based upon economic, market or other conditions and the respective parties disclaim any responsibility to update such views. These views may not be relied on as investment advice and, because investment decisions for a Columbia fund are based on numerous factors, may not be relied on as an indication of trading intent on behalf of any particular Columbia fund. References to specific securities should not be construed as a recommendation or investment advice.
COLUMBIA SELECT INTERNATIONAL EQUITY FUND
Performance Summary
n Columbia Select International Equity Fund (the Fund) Class A shares returned -16.65% excluding sales charges for the 12-month period that ended February 29, 2016.
n The Fund underperformed its benchmark, the MSCI EAFE Index (Net), which returned -15.18% for the same time period.
n The Fund benefited from underweight positions relative to the benchmark in energy and financials. The Fund's overweight in Japanese stocks, however, was a significant negative, as Japanese exporters and financials underperformed due to the yen's appreciation and concerns about the impact of negative interest rates.
Average Annual Total Returns (%) (for period ended February 29, 2016)
| | | Inception | | 1 Year | | 5 Years | | 10 Years | |
Class A | | 06/03/92 | | | | | | | |
Excluding sales charges | | | | | | | -16.65 | | | | -1.09 | | | | -0.06 | | |
Including sales charges | | | | | | | -21.47 | | | | -2.25 | | | | -0.65 | | |
Class B | | 06/07/93 | | | | | | | |
Excluding sales charges | | | | | | | -17.25 | | | | -1.82 | | | | -0.81 | | |
Including sales charges | | | | | | | -21.39 | | | | -2.21 | | | | -0.81 | | |
Class C | | 06/17/92 | | | | | | | |
Excluding sales charges | | | | | | | -17.22 | | | | -1.81 | | | | -0.80 | | |
Including sales charges | | | | | | | -18.05 | | | | -1.81 | | | | -0.80 | | |
Class I* | | 09/27/10 | | | -16.25 | | | | -0.60 | | | | 0.32 | | |
Class K* | | 03/07/11 | | | -16.56 | | | | -0.91 | | | | 0.10 | | |
Class R | | 01/23/06 | | | -16.89 | | | | -1.32 | | | | -0.30 | | |
Class R4* | | 11/08/12 | | | -16.45 | | | | -0.84 | | | | 0.19 | | |
Class R5* | | 11/08/12 | | | -16.26 | | | | -0.71 | | | | 0.26 | | |
Class W* | | 09/27/10 | | | -16.64 | | | | -1.07 | | | | -0.03 | | |
Class Y* | | 03/07/11 | | | -16.24 | | | | -0.61 | | | | 0.31 | | |
Class Z | | 12/02/91 | | | -16.48 | | | | -0.83 | | | | 0.20 | | |
MSCI EAFE Index (Net) | | | | | | | -15.18 | | | | 0.56 | | | | 1.49 | | |
Returns for Class A are shown with and without the maximum initial sales charge of 5.75%. Returns for Class B are shown with and without the applicable contingent deferred sales charge (CDSC) of 5.00% in the first year, declining to 1.00% in the sixth year and eliminated thereafter. Returns for Class C are shown with and without the 1.00% CDSC for the first year only. The Fund's other classes are not subject to sales charges and have limited eligibility. Please see the Fund's prospectus for details. Performance for different share classes will vary based on differences in sales charges and fees associated with each class. All results shown assume reinvestment of distributions during the period. Returns do not reflect the deduction of taxes that a shareholder may pay on Fund distributions or on the redemption of Fund shares. Performance results reflect the effect of any fee waivers or reimbursements of Fund expenses by Columbia Management Investment Advisers, LLC and/or any of its affiliates. Absent these fee waivers or expense reimbursement arrangements, performance results would have been lower.
The performance information shown represents past performance and is not a guarantee of future results. The investment return and principal value of your investment will fluctuate so that your shares, when redeemed, may be worth more or less than their original cost. Current performance may be lower or higher than the performance information shown. You may obtain performance information current to the most recent month-end by contacting your financial intermediary, visiting columbiathreadneedle.com/us or calling 800.345.6611.
*The returns shown for periods prior to the share class inception date (including returns for the Life of the Fund, if shown, which are since Fund inception) include the returns of the Fund's oldest share class. These returns are adjusted to reflect any higher class-related operating expenses of the newer share classes, as applicable. Please visit columbiathreadneedle.com/us/investment-products/mutual-funds/appended-performance for more information.
The MSCI EAFE Index (Net) is a free float-adjusted market capitalization index that is designed to measure the equity market performance of developed markets, excluding the U.S. and Canada. The index is compiled from a composite of securities markets of Europe, Australasia and the Far East and is widely recognized by investors in foreign markets as the measurement index for portfolios of non-North American securities.
Indices are not available for investment, are not professionally managed and do not reflect sales charges, fees, brokerage commissions, taxes (except the MSCI EAFE Index (Net), which reflects reinvested dividends net of withholding taxes) or other expenses of investing. Securities in the Fund may not match those in an index.
Annual Report 2016
2
COLUMBIA SELECT INTERNATIONAL EQUITY FUND
PERFORMANCE OVERVIEW (continued)
Performance of a Hypothetical $10,000 Investment (March 1, 2006 – February 29, 2016)
The chart above shows the change in value of a hypothetical $10,000 investment in Class A shares of Columbia Select International Equity Fund during the stated time period, and does not reflect the deduction of taxes that a shareholder may pay on Fund distributions or on the redemption of Fund shares.
Annual Report 2016
3
COLUMBIA SELECT INTERNATIONAL EQUITY FUND
MANAGER DISCUSSION OF FUND PERFORMANCE
Portfolio Management
Simon Haines, CFA
William Davies
David Dudding, CFA
Morningstar Style BoxTM

The Morningstar Style BoxTM is based on a fund's portfolio holdings. For equity funds, the vertical axis shows the market capitalization of the stocks owned, and the horizontal axis shows investment style (value, blend, or growth). Information shown is based on the most recent data provided by Morningstar.
© 2016 Morningstar, Inc. All rights reserved. The Morningstar information contained herein: (1) is proprietary to Morningstar and/or its content providers; (2) may not be copied or distributed; and (3) is not warranted to be accurate, complete or timely. Neither Morningstar nor its content providers are responsible for any damages or losses arising from any use of this information.
Top Ten Holdings (%)
(at February 29, 2016) | |
AstraZeneca PLC
(United Kingdom) | | | 3.4 | | |
UBS AG (Switzerland) | | | 3.3 | | |
Unilever PLC (United Kingdom) | | | 3.2 | | |
Roche Holding AG, Genusschein
Shares (Switzerland) | | | 3.2 | | |
ASML Holding NV (Netherlands) | | | 3.0 | | |
Shimano, Inc. (Japan) | | | 2.9 | | |
Continental AG (Germany) | | | 2.8 | | |
Royal Dutch Shell PLC, Class A
(United Kingdom) | | | 2.5 | | |
Bayer AG, Registered Shares
(Germany) | | | 2.5 | | |
Berendsen PLC
(United Kingdom) | | | 2.5 | | |
Percentages indicated are based upon total investments (excluding Money Market Funds and short term cash equivalents).
For the 12-month period that ended February 29, 2016, the Fund's Class A shares returned -16.65% excluding sales charges. The Fund underperformed its benchmark, the MSCI EAFE Index (Net), which returned -15.18% over the same period. The Fund benefited from underweight positions relative to the benchmark in energy and financials. The Fund's overweight in Japanese stocks, however, was a significant negative, as Japanese exporters and financials underperformed due to the yen's appreciation and concerns about the impact of negative interest rates.
World's Investors on Interest-Rate Watch
For much of the period, the world's investors watched for signs of when the United States would finally lift interest rates from their historic lows. Volatility in emerging markets and slow growth in Europe complicated the decision by the Federal Reserve Board (the Fed), as did persistently underwhelming industrial production numbers in the United States itself. However, solid U.S. jobs figures and hints of rising wage growth eventually led the Fed to raise rates in December. Investors in most equity markets initially reacted to the news with relief, but a slump throughout global markets at the beginning of 2016 raised questions over whether the Fed had acted too soon. In the eurozone, an agreement early in the period between Greece and its creditors over terms of a further bailout was greeted with relief by investors. After an initial boost to markets from the European Central Bank's program of quantitative easing (QE) in early 2015, persistent sluggishness raised expectations of further action, which ultimately took place toward the end of the period under review. However, the extra stimulus — moving the deposit rate further into negative territory and extending QE by six months — left markets unimpressed.
Although Japanese stocks performed well for much of the period, with Japan's corporations generally exhibiting strong earnings, Japanese stocks fell sharply towards the end of the period. As markets convulsed early in 2016, and despite the Bank of Japan taking interest rates into negative territory, investors parked their cash in the traditional "safe haven" asset of the Japanese yen, spooking the country's export-dependent stock market. Elsewhere, China fared poorly as a stock-market surge through the first half of 2015 was followed by a prolonged slump. In an attempt to offset persistently worrying economic data, China's central banks undertook a series of stimulatory measures, including lowering banks' reserve requirements. The Chinese authorities also implemented broader measures as part of a five-year plan aimed at rebalancing the Chinese economy away from manufacturing and exporting and towards domestic consumption.
Detractors and Contributors
The three market sectors that detracted most from Fund performance were industrials, due to our overweight position; consumer discretionary, another overweight coupled with sub-par stock selection; and consumer staples, where we were underweight relative to the benchmark. Individual detractors included Methanex, Mitsubishi UFJ Financial Group, and Bayer. Because the price of methanol is closely correlated to the price of oil, the
Annual Report 2016
4
COLUMBIA SELECT INTERNATIONAL EQUITY FUND
MANAGER DISCUSSION OF FUND PERFORMANCE (continued)
stock of methanol producer Methanex followed crude prices downwards during the period. We have sold the stock, which is consistent with our strategy of being underweight in the energy sector. Shares in the banking and financial holding company Mitsubishi UFJ Financial Group were weak along with the underperforming Japanese banking sector. Most notably, towards the end of the period, the stock fell heavily as the Bank of Japan's negative interest-rate policy announcement was set to impact earnings negatively. The Fund's position had been reduced prior to the announcement, but the stock is still in the Fund's portfolio. Bayer, the pharmaceutical and crop-science company, faced numerous problems during the period, including the adverse impact of El Niño on its agricultural-chemical businesses, and negative pricing policies on pharmaceuticals in the United States. The Fund still holds Bayer, as we believe there is a strong underpinning valuation, and the company's portfolio remains strong.
The three strongest-contributing market sectors to the Fund on a relative basis were energy and financials, where we had an underweight position; and information technology, which was an overweight. Asset allocation within these three sectors was positive, and particularly strong in energy. Among individual holdings, SCSK, Novo Nordisk and Shimadzu were the top performers. The Japanese software-services company SCSK benefited from strong spending on systems, particularly from financial sector clients. In addition, the stock benefited from positive earnings revisions throughout the year. Novo Nordisk, a Danish pharmaceutical company, which specializes in diabetes drugs, made good progress with the launch of its long-lasting insulin, Tresiba. The shares re-rated throughout calendar 2015. Finally, Shimadzu in Japan manufactures precision tooling and analysis equipment for medical and scientific research, such as chromatographs, x-ray and mass spectrometers. The Fund held the stock during the middle of the period under review, during which significant profits upgrades occurred thanks to strong trading across the company's range of products. We sold the position later in the period as the stock reached our price target and we had little conviction that the rating could expand further.
Portfolio Positioning
We increased the Fund's exposure to the consumer discretionary, telecommunication services and information technology sectors during the period. We also increased our weighting — though maintained our underweight — in energy toward the end of the period. At the same time, we reduced our weighting in materials, and moved to a zero weight in utilities. Among individual stocks, we added Roche to the portfolio; we consider it to be positively positioned, having attractive asset developments within immune-oncology. We also opened a new position in Shimano during the year. Shimano has a dominant position in the bicycle-component industry, which is expected to grow, supported by trends such as an increased awareness of health and wellness, and increased leisure-related spending. We also initiated a position in Royal Dutch Shell. Within the energy sector, we prefer defensive super-majors with strong balance sheets and cash flows, which may be used to acquire distressed assets.
For further detail about these holdings, please refer to the section entitled "Portfolio of Investments."
Fund holdings are as of the date given, are subject to change at any time, and are not recommendations to buy or sell any security.
Country Breakdown (%)
(at February 29, 2016) | |
Australia | | | 5.5 | | |
Belgium | | | 1.8 | | |
Canada | | | 0.8 | | |
China | | | 2.0 | | |
Denmark | | | 2.2 | | |
France | | | 6.6 | | |
Germany | | | 8.6 | | |
Hong Kong | | | 1.8 | | |
Ireland | | | 3.4 | | |
Japan | | | 28.5 | | |
Malta | | | 0.0 | (a) | |
Netherlands | | | 4.0 | | |
Singapore | | | 1.0 | | |
Spain | | | 2.4 | | |
Switzerland | | | 7.5 | | |
United Kingdom | | | 23.4 | | |
United States(b) | | | 0.5 | | |
Total | | | 100.0 | | |
Country Breakdown is based primarily on issuer's place of organization/incorporation. Percentages indicated are based upon total investments. The Fund's portfolio composition is subject to change.
(a) Rounds to zero.
(b) Includes investments in Money Market Funds.
Annual Report 2016
5
COLUMBIA SELECT INTERNATIONAL EQUITY FUND
MANAGER DISCUSSION OF FUND PERFORMANCE (continued)
Equity Sector Breakdown (%)
(at February 29, 2016) | |
Consumer Discretionary | | | 16.9 | | |
Consumer Staples | | | 9.6 | | |
Energy | | | 3.1 | | |
Financials | | | 18.5 | | |
Health Care | | | 12.6 | | |
Industrials | | | 17.3 | | |
Information Technology | | | 14.2 | | |
Materials | | | 5.4 | | |
Telecommunication Services | | | 2.4 | | |
Total | | | 100.0 | | |
Percentages indicated are based upon total equity investments. The Fund's portfolio composition is subject to change.
Investment Risks
Market risk may affect a single issuer, sector of the economy, industry or the market as a whole. Growth securities, at times, may not perform as well as value securities or the stock market in general and may be out of favor with investors. Value securities may be unprofitable if the market fails to recognize their intrinsic worth or the portfolio manager misgauged that worth. International investing involves certain risks and volatility due to potential political, economic or currency instabilities and different financial and accounting standards. Risks are enhanced for emerging market issuers. Investing in derivatives is a specialized activity that involves special risks that subject the Fund to significant loss potential, including when used as leverage, and may result in greater fluctuation in Fund value. The value of the Fund's portfolio may be more volatile due to concentrated investments in similar industries, sectors or geographical regions. Investments in a limited number of companies subject the Fund to greater risk of loss. See the Fund's prospectus for more information on these and other risks.
Meanwhile, we reduced our position in L'Oréal after recent gains. We sold Daikin, a Japanese manufacturer of air-conditioning units, on concerns about its significant exposure to the Chinese construction industry. We also sold the Japanese recruitment firm Recruit, switching the proceeds into FANUC, a Japanese company that manufactures automated products including robotics. We believe FANUC is the top company in its industry at this time and currently generates significant profit margins.
Annual Report 2016
6
COLUMBIA SELECT INTERNATIONAL EQUITY FUND
UNDERSTANDING YOUR FUND'S EXPENSES
(Unaudited)
As an investor, you incur two types of costs. There are transaction costs, which generally include sales charges on purchases and may include redemption fees. There are also ongoing costs, which generally include management fees, distribution and/or service fees, and other fund expenses. The following information is intended to help you understand your ongoing costs (in dollars) of investing in the Fund and to help you compare these costs with the ongoing costs of investing in other mutual funds.
Analyzing Your Fund's Expenses
To illustrate these ongoing costs, we have provided examples and calculated the expenses paid by investors in each share class of the Fund during the period. The actual and hypothetical information in the table is based on an initial investment of $1,000 at the beginning of the period indicated and held for the entire period. Expense information is calculated two ways and each method provides you with different information. The amount listed in the "Actual" column is calculated using the Fund's actual operating expenses and total return for the period. You may use the Actual information, together with the amount invested, to estimate the expenses that you paid over the period. Simply divide your account value by $1,000 (for example, an $8,600 account value divided by $1,000 = 8.6), then multiply the results by the expenses paid during the period under the "Actual" column. The amount listed in the "Hypothetical" column assumes a 5% annual rate of return before expenses (which is not the Fund's actual return) and then applies the Fund's actual expense ratio for the period to the hypothetical return. You should not use the hypothetical account values and expenses to estimate either your actual account balance at the end of the period or the expenses you paid during the period. See "Compare With Other Funds" below for details on how to use the hypothetical data.
Compare With Other Funds
Since all mutual funds are required to include the same hypothetical calculations about expenses in shareholder reports, you can use this information to compare the ongoing cost of investing in the Fund with other funds. To do so, compare the hypothetical example with the 5% hypothetical examples that appear in the shareholder reports of other funds. As you compare hypothetical examples of other funds, it is important to note that hypothetical examples are meant to highlight the ongoing costs of investing in a fund only and do not reflect any transaction costs, such as sales charges, or redemption or exchange fees. Therefore, the hypothetical calculations are useful in comparing ongoing costs only, and will not help you determine the relative total costs of owning different funds. If transaction costs were included in these calculations, your costs would be higher.
September 1, 2015 – February 29, 2016
| | | Account Value at the Beginning
of the Period ($) | | Account Value at the End of the
Period ($) | | Expenses Paid During the
Period ($) | | Fund's Annualized
Expense Ratio (%) | |
| | | Actual | | Hypothetical | | Actual | | Hypothetical | | Actual | | Hypothetical | | Actual | |
Class A | | | 1,000.00 | | | | 1,000.00 | | | | 881.80 | | | | 1,017.80 | | | | 6.64 | | | | 7.12 | | | | 1.42 | | |
Class B | | | 1,000.00 | | | | 1,000.00 | | | | 879.20 | | | | 1,014.07 | | | | 10.14 | | | | 10.87 | | | | 2.17 | | |
Class C | | | 1,000.00 | | | | 1,000.00 | | | | 879.50 | | | | 1,014.07 | | | | 10.14 | | | | 10.87 | | | | 2.17 | | |
Class I | | | 1,000.00 | | | | 1,000.00 | | | | 884.10 | | | | 1,019.99 | | | | 4.59 | | | | 4.92 | | | | 0.98 | | |
Class K | | | 1,000.00 | | | | 1,000.00 | | | | 882.50 | | | | 1,018.60 | | | | 5.90 | | | | 6.32 | | | | 1.26 | | |
Class R | | | 1,000.00 | | | | 1,000.00 | | | | 880.20 | | | | 1,016.56 | | | | 7.81 | | | | 8.37 | | | | 1.67 | | |
Class R4 | | | 1,000.00 | | | | 1,000.00 | | | | 883.30 | | | | 1,019.05 | | | | 5.48 | | | | 5.87 | | | | 1.17 | | |
Class R5 | | | 1,000.00 | | | | 1,000.00 | | | | 883.80 | | | | 1,019.79 | | | | 4.78 | | | | 5.12 | | | | 1.02 | | |
Class W | | | 1,000.00 | | | | 1,000.00 | | | | 882.50 | | | | 1,017.80 | | | | 6.65 | | | | 7.12 | | | | 1.42 | | |
Class Y | | | 1,000.00 | | | | 1,000.00 | | | | 884.20 | | | | 1,020.09 | | | | 4.50 | | | | 4.82 | | | | 0.96 | | |
Class Z | | | 1,000.00 | | | | 1,000.00 | | | | 883.30 | | | | 1,019.05 | | | | 5.48 | | | | 5.87 | | | | 1.17 | | |
Expenses paid during the period are equal to the annualized expense ratio for each class as indicated above, multiplied by the average account value over the period and then multiplied by the number of days in the Fund's most recent fiscal half year and divided by 366.
Expenses do not include fees and expenses incurred indirectly by the Fund from its investment in underlying funds, including affiliated and non-affiliated pooled investment vehicles, such as mutual funds and exchange-traded funds.
Had Columbia Management Investment Advisers, LLC and/or certain of its affiliates not waived/reimbursed certain fees and expenses, account value at the end of the period would have been reduced.
Annual Report 2016
7
COLUMBIA SELECT INTERNATIONAL EQUITY FUND
PORTFOLIO OF INVESTMENTS
February 29, 2016
(Percentages represent value of investments compared to net assets)
Common Stocks 97.7%
Issuer | | Shares | | Value ($) | |
AUSTRALIA 5.4% | |
BHP Billiton Ltd. | | | 210,124 | | | | 2,369,247 | | |
Commonwealth Bank of Australia | | | 94,657 | | | | 4,722,163 | | |
CSL Ltd. | | | 16,755 | | | | 1,225,212 | | |
Healthscope Ltd. | | | 2,622,072 | | | | 4,630,789 | | |
Rio Tinto Ltd. | | | 58,000 | | | | 1,664,121 | | |
Westpac Banking Corp. | | | 228,358 | | | | 4,670,550 | | |
Woodside Petroleum Ltd. | | | 145,621 | | | | 2,616,755 | | |
Woolworths Ltd. | | | 146,636 | | | | 2,389,540 | | |
Total | | | | | 24,288,377 | | |
BELGIUM 1.8% | |
Anheuser-Busch InBev SA/NV | | | 70,882 | | | | 7,930,046 | | |
CANADA 0.8% | |
Canadian National Railway Co. | | | 58,500 | | | | 3,398,448 | | |
CHINA 2.0% | |
Alibaba Group Holding Ltd., ADR(a) | | | 70,383 | | | | 4,843,054 | | |
Baidu, Inc., ADR(a) | | | 18,598 | | | | 3,225,265 | | |
China Milk Products Group Ltd.(a)(b)(c) | | | 7,426,000 | | | | 5 | | |
NetEase, Inc., ADR | | | 6,888 | | | | 927,194 | | |
Total | | | | | 8,995,518 | | |
DENMARK 2.1% | |
Novo Nordisk A/S, Class B | | | 187,383 | | | | 9,647,352 | | |
FRANCE 6.4% | |
Airbus Group SE | | | 170,230 | | | | 10,986,094 | | |
L'Oreal SA | | | 47,602 | | | | 8,011,898 | | |
Schneider Electric SE | | | 166,963 | | | | 9,951,907 | | |
Total | | | | | 28,949,899 | | |
GERMANY 8.4% | |
Allianz SE, Registered Shares | | | 27,320 | | | | 4,052,297 | | |
Bayer AG, Registered Shares | | | 107,360 | | | | 11,129,799 | | |
Brenntag AG | | | 99,289 | | | | 4,792,406 | | |
Continental AG | | | 61,897 | | | | 12,319,816 | | |
TUI AG | | | 371,776 | | | | 5,522,396 | | |
Total | | | | | 37,816,714 | | |
Common Stocks (continued)
Issuer | | Shares | | Value ($) | |
HONG KONG 1.7% | |
AIA Group Ltd. | | | 818,000 | | | | 4,176,150 | | |
BOC Hong Kong Holdings Ltd. | | | 650,000 | | | | 1,688,830 | | |
CK Hutchison Holdings Ltd. | | | 164,000 | | | | 1,977,326 | | |
Total | | | | | 7,842,306 | | |
IRELAND 3.4% | |
Bank of Ireland(a) | | | 38,092,651 | | | | 10,802,098 | | |
CRH PLC | | | 173,656 | | | | 4,454,374 | | |
Total | | | | | 15,256,472 | | |
JAPAN 28.0% | |
Alps Electric Co., Ltd. | | | 274,900 | | | | 4,511,257 | | |
Capcom Co., Ltd. | | | 523,800 | | | | 10,918,745 | | |
Dentsu, Inc. | | | 212,800 | | | | 9,890,854 | | |
FANUC Corp. | | | 32,700 | | | | 4,801,678 | | |
Hitachi High-Technologies Corp. | | | 213,400 | | | | 5,669,248 | | |
Japan Exchange Group, Inc. | | | 562,800 | | | | 8,717,517 | | |
Mazda Motor Corp. | | | 400,500 | | | | 5,573,653 | | |
Mitsubishi UFJ Financial Group, Inc. | | | 1,931,800 | | | | 8,336,314 | | |
Nomura Holdings, Inc. | | | 889,000 | | | | 3,756,704 | | |
OSG Corp. | | | 319,000 | | | | 5,384,175 | | |
Rakuten, Inc. | | | 613,900 | | | | 5,840,230 | | |
SCSK Corp. | | | 237,800 | | | | 9,126,673 | | |
Sekisui Chemical Co., Ltd. | | | 688,900 | | | | 7,630,075 | | |
Shimano, Inc. | | | 82,600 | | | | 12,916,988 | | |
Tadano Ltd. | | | 766,000 | | | | 6,557,853 | | |
Taiheiyo Cement Corp. | | | 3,013,000 | | | | 6,402,983 | | |
Yaskawa Electric Corp. | | | 796,600 | | | | 9,553,766 | | |
Total | | | | | 125,588,713 | | |
MALTA —% | |
BGP Holdings PLC(a)(b)(c) | | | 2,232,232 | | | | 2 | | |
NETHERLANDS 3.9% | |
| ASML Holding NV | | | 146,821 | | | | 13,375,083 | | |
ING Groep NV-CVA | | | 346,979 | | | | 4,136,455 | | |
Total | | | | | 17,511,538 | | |
SINGAPORE 1.0% | |
DBS Group Holdings Ltd. | | | 470,000 | | | | 4,526,819 | | |
The accompanying Notes to Financial Statements are an integral part of this statement.
Annual Report 2016
8
COLUMBIA SELECT INTERNATIONAL EQUITY FUND
PORTFOLIO OF INVESTMENTS (continued)
February 29, 2016
Common Stocks (continued)
Issuer | | Shares | | Value ($) | |
SPAIN 2.4% | |
Industria de Diseno Textil SA | | | 342,622 | | | | 10,571,586 | | |
SWITZERLAND 7.4% | |
Roche Holding AG, Genusschein Shares | | | 54,382 | | | | 13,944,379 | | |
Sika AG | | | 1,304 | | | | 4,951,840 | | |
UBS AG | | | 938,121 | | | | 14,331,667 | | |
Total | | | | | 33,227,886 | | |
UNITED KINGDOM 23.0% | |
AstraZeneca PLC | | | 258,745 | | | | 14,711,386 | | |
Berendsen PLC | | | 689,840 | | | | 11,068,310 | | |
BT Group PLC | | | 1,559,553 | | | | 10,502,283 | | |
Diageo PLC | | | 369,706 | | | | 9,501,587 | | |
GKN PLC | | | 1,073,233 | | | | 4,079,992 | | |
Hays PLC | | | 3,952,039 | | | | 6,290,045 | | |
Legal & General Group PLC | | | 2,311,669 | | | | 7,270,946 | | |
Rio Tinto PLC | | | 143,787 | | | | 3,782,009 | | |
Common Stocks (continued)
Issuer | | Shares | | Value ($) | |
Royal Dutch Shell PLC, Class A | | | 489,885 | | | | 11,176,257 | | |
Unilever PLC | | | 331,003 | | | | 14,141,297 | | |
Wolseley PLC | | | 206,655 | | | | 10,597,754 | | |
Total | | | | | 103,121,866 | | |
Total Common Stocks
(Cost: $459,673,384) | | | | | 438,673,542 | | |
Money Market Funds 0.5%
| | | Shares | | Value ($) | |
Columbia Short-Term Cash Fund,
0.420%(d)(e) | | | 2,355,893 | | | | 2,355,893 | | |
Total Money Market Funds
(Cost: $2,355,893) | | | | | 2,355,893 | | |
Total Investments
(Cost: $462,029,277) | | | | | 441,029,435 | | |
Other Assets & Liabilities, Net | | | | | 8,183,255 | | |
Net Assets | | | | | 449,212,690 | | |
Notes to Portfolio of Investments
(a) Non-income producing investment.
(b) Identifies securities considered by the Investment Manager to be illiquid and may be difficult to sell. The aggregate value of such securities at February 29, 2016 was $7, which represents less than 0.01% of net assets. Information concerning such security holdings at February 29, 2016 is as follows:
Security Description | | Acquisition Dates | | Cost ($) | |
BGP Holdings PLC | | 02/04/2009 – 05/14/2009 | | | — | | |
China Milk Products Group Ltd. | | 09/11/2006 – 07/02/2009 | | | 4,479,619 | | |
(c) Represents fair value as determined in good faith under procedures approved by the Board of Trustees. At February 29, 2016, the value of these securities amounted to $7, which represents less than 0.01% of net assets.
(d) The rate shown is the seven-day current annualized yield at February 29, 2016.
(e) As defined in the Investment Company Act of 1940, an affiliated company is one in which the Fund owns 5% or more of the company's outstanding voting securities, or a company which is under common ownership or control with the Fund. Holdings and transactions in these affiliated companies during the year ended February 29, 2016 are as follows:
Issuer | | Beginning
Cost ($) | | Purchase
Cost ($) | | Proceeds
From Sales ($) | | Ending
Cost ($) | | Dividends —
Affiliated
Issuers ($) | | Value ($) | |
Columbia Short-Term Cash Fund | | | 11,700,610 | | | | 280,237,693 | | | | (289,582,410 | ) | | | 2,355,893 | | | | 9,047 | | | | 2,355,893 | | |
Abbreviation Legend
ADR American Depositary Receipt
The accompanying Notes to Financial Statements are an integral part of this statement.
Annual Report 2016
9
COLUMBIA SELECT INTERNATIONAL EQUITY FUND
PORTFOLIO OF INVESTMENTS (continued)
February 29, 2016
The Fund categorizes its fair value measurements according to a three-level hierarchy that maximizes the use of observable inputs and minimizes the use of unobservable inputs by prioritizing that the most observable input be used when available. Observable inputs are those that market participants would use in pricing an investment based on market data obtained from sources independent of the reporting entity. Unobservable inputs are those that reflect the Fund's assumptions about the information market participants would use in pricing an investment. An investment's level within the fair value hierarchy is based on the lowest level of any input that is deemed significant to the asset's or liability's fair value measurement. The input levels are not necessarily an indication of the risk or liquidity associated with investments at that level. For example, certain U.S. government securities are generally high quality and liquid, however, they are reflected as Level 2 because the inputs used to determine fair value may not always be quoted prices in an active market.
Fair value inputs are summarized in the three broad levels listed below:
> Level 1 — Valuations based on quoted prices for investments in active markets that the Fund has the ability to access at the measurement date (including NAV for open-end mutual funds). Valuation adjustments are not applied to Level 1 investments.
> Level 2 — Valuations based on other significant observable inputs (including quoted prices for similar securities, interest rates, prepayment speeds, credit risks, etc.).
> Level 3 — Valuations based on significant unobservable inputs (including the Fund's own assumptions and judgment in determining the fair value of investments).
Inputs that are used in determining fair value of an investment may include price information, credit data, volatility statistics, and other factors. These inputs can be either observable or unobservable. The availability of observable inputs can vary between investments, and is affected by various factors such as the type of investment, and the volume and level of activity for that investment or similar investments in the marketplace. The inputs will be considered by the Investment Manager, along with any other relevant factors in the calculation of an investment's fair value. The Fund uses prices and inputs that are current as of the measurement date, which may include periods of market dislocations. During these periods, the availability of prices and inputs may be reduced for many investments. This condition could cause an investment to be reclassified between the various levels within the hierarchy.
Foreign equity securities actively traded in markets where there is a significant delay in the local close relative to the New York Stock Exchange (NYSE) are classified as Level 2. The values of these securities may include an adjustment to reflect the impact of significant market movements following the close of local trading, as described in Note 2 to the financial statements — Security Valuation.
Investments falling into the Level 3 category are primarily supported by quoted prices from brokers and dealers participating in the market for those investments. However, these may be classified as Level 3 investments due to lack of market transparency and corroboration to support these quoted prices. Additionally, valuation models may be used as the pricing source for any remaining investments classified as Level 3. These models may rely on one or more significant unobservable inputs and/or significant assumptions by the Investment Manager. Inputs used in valuations may include, but are not limited to, financial statement analysis, capital account balances, discount rates and estimated cash flows, and comparable company data.
Under the direction of the Fund's Board of Trustees (the Board), the Investment Manager's Valuation Committee (the Committee) is responsible for overseeing the valuation procedures approved by the Board. The Committee consists of voting and non-voting members from various groups within the Investment Manager's organization, including operations and accounting, trading and investments, compliance, risk management and legal.
The Committee meets at least monthly to review and approve valuation matters, which may include a description of specific valuation determinations, data regarding pricing information received from approved pricing vendors and brokers and the results of Board-approved valuation control policies and procedures (the Policies). The Policies address, among other things, instances when market quotations are or are not readily available, including recommendations of third party pricing vendors and a determination of appropriate pricing methodologies; events that require specific valuation determinations and assessment of fair value techniques; securities with a potential for stale pricing, including those that are illiquid, restricted, or in default; and the effectiveness of third party pricing vendors, including periodic reviews of vendors. The Committee meets more frequently, as needed, to discuss additional valuation matters, which may include the need to review back-testing results, review time-sensitive information or approve related valuation actions. The Committee reports to the Board, with members of the Committee meeting with the Board at each of its regularly scheduled meetings to discuss valuation matters and actions during the period, similar to those described earlier.
For investments categorized as Level 3, the Committee monitors information similar to that described above, which may include: (i) data specific to the issuer or comparable issuers, (ii) general market or specific sector news and (iii) quoted prices and specific or similar security transactions. The Committee considers this data and any changes from prior periods in order to assess the reasonableness of observable and unobservable inputs, any assumptions or internal models used to value those securities and changes in fair value. This data is also used to corroborate, when available, information received from approved pricing vendors and brokers. Various factors impact the frequency of monitoring this information (which may occur as often as daily). However, the Committee may determine that changes to inputs, assumptions and models are not required as a result of the monitoring procedures performed.
The accompanying Notes to Financial Statements are an integral part of this statement.
Annual Report 2016
10
COLUMBIA SELECT INTERNATIONAL EQUITY FUND
PORTFOLIO OF INVESTMENTS (continued)
February 29, 2016
Fair Value Measurements (continued)
The following table is a summary of the inputs used to value the Fund's investments at February 29, 2016:
| | | Level 1
Quoted Prices in Active
Markets for Identical
Assets ($) | | Level 2
Other Significant
Observable Inputs ($) | | Level 3
Significant
Unobservable Inputs ($) | | Total ($) | |
Investments | |
Common Stocks | |
Australia | | | — | | | | 24,288,377 | | | | — | | | | 24,288,377 | | |
Belgium | | | — | | | | 7,930,046 | | | | — | | | | 7,930,046 | | |
Canada | | | 3,398,448 | | | | — | | | | — | | | | 3,398,448 | | |
China | | | 8,995,513 | | | | — | | | | 5 | | | | 8,995,518 | | |
Denmark | | | — | | | | 9,647,352 | | | | — | | | | 9,647,352 | | |
France | | | — | | | | 28,949,899 | | | | — | | | | 28,949,899 | | |
Germany | | | — | | | | 37,816,714 | | | | — | | | | 37,816,714 | | |
Hong Kong | | | — | | | | 7,842,306 | | | | — | | | | 7,842,306 | | |
Ireland | | | — | | | | 15,256,472 | | | | — | | | | 15,256,472 | | |
Japan | | | — | | | | 125,588,713 | | | | — | | | | 125,588,713 | | |
Malta | | | — | | | | — | | | | 2 | | | | 2 | | |
Netherlands | | | — | | | | 17,511,538 | | | | — | | | | 17,511,538 | | |
Singapore | | | — | | | | 4,526,819 | | | | — | | | | 4,526,819 | | |
Spain | | | — | | | | 10,571,586 | | | | — | | | | 10,571,586 | | |
Switzerland | | | — | | | | 33,227,886 | | | | — | | | | 33,227,886 | | |
United Kingdom | | | — | | | | 103,121,866 | | | | — | | | | 103,121,866 | | |
Total Common Stocks | | | 12,393,961 | | | | 426,279,574 | | | | 7 | | | | 438,673,542 | | |
Money Market Funds | | | — | | | | 2,355,893 | | | | — | | | | 2,355,893 | | |
Total Investments | | | 12,393,961 | | | | 428,635,467 | | | | 7 | | | | 441,029,435 | | |
See the Portfolio of Investments for all investment classifications not indicated in the table.
The Fund's assets assigned to the Level 2 input category are generally valued using the market approach, in which a security's value is determined through reference to prices and information from market transactions for similar or identical assets and/or fund per share market values which are not considered publicly available. These assets include certain foreign securities for which a third party statistical pricing service may be employed for purposes of fair market valuation. The model utilized by such third party statistical pricing service takes into account a security's correlation to available market data including, but not limited to, intraday index, ADR, and exchange-traded fund movements.
Financial assets were transferred from Level 1 to Level 2 as the market for these assets is not considered publicly available. Fund per share market values were obtained using observable market inputs.
The following table shows transfers between Level 1 and Level 2 of the fair value hierarchy:
Transfers In | | Transfers Out | |
| Level 1 ($) | | Level 2 ($) | | Level 1 ($) | | Level 2 ($) | |
| | — | | | | 11,700,610 | | | | 11,700,610 | | | | — | | |
Transfers between Level 1 and Level 2 are determined based on the fair value at the beginning of the period for security positions held throughout the period.
The Fund does not hold any significant investments (greater than one percent of net assets) categorized as Level 3.
The accompanying Notes to Financial Statements are an integral part of this statement.
Annual Report 2016
11
COLUMBIA SELECT INTERNATIONAL EQUITY FUND
PORTFOLIO OF INVESTMENTS (continued)
February 29, 2016
Fair Value Measurements (continued)
The Fund's assets assigned to the Level 3 category are valued utilizing the valuation technique deemed the most appropriate in the circumstances. Certain common stocks classified as Level 3 securities are valued using the market approach. To determine fair value for these securities, management considered various factors which may have included, but were not limited to, the halt price of the security, the movement in observed market prices for other securities from the issuer, the movement in certain foreign or domestic market indices, and the position of the security within the respective company's capital structure. Significant increases (decreases) to any of these inputs would result in a significantly lower (higher) fair value measurement.
There were no transfers of financial assets between Levels 2 and 3 during the period.
The accompanying Notes to Financial Statements are an integral part of this statement.
Annual Report 2016
12
COLUMBIA SELECT INTERNATIONAL EQUITY FUND
STATEMENT OF ASSETS AND LIABILITIES
February 29, 2016
Assets | |
Investments, at value | |
Unaffiliated issuers (identified cost $459,673,384) | | $ | 438,673,542 | | |
Affiliated issuers (identified cost $2,355,893) | | | 2,355,893 | | |
Total investments (identified cost $462,029,277) | | | 441,029,435 | | |
Foreign currency (identified cost $51,927) | | | 51,836 | | |
Receivable for: | |
Investments sold | | | 5,559,563 | | |
Capital shares sold | | | 164,015 | | |
Regulatory settlements (Note 6) | | | 2,627,180 | | |
Dividends | | | 1,359,895 | | |
Foreign tax reclaims | | | 1,510,470 | | |
Expense reimbursement due from Investment Manager | | | 2,396 | | |
Prepaid expenses | | | 2,080 | | |
Trustees' deferred compensation plan | | | 85,595 | | |
Total assets | | | 452,392,465 | | |
Liabilities | |
Payable for: | |
Investments purchased | | | 2,129,310 | | |
Capital shares purchased | | | 587,000 | | |
Investment management fees | | | 32,198 | | |
Distribution and/or service fees | | | 8,242 | | |
Transfer agent fees | | | 74,691 | | |
Plan administration fees | | | 12 | | |
Compensation of board members | | | 162,808 | | |
Other expenses | | | 99,919 | | |
Trustees' deferred compensation plan | | | 85,595 | | |
Total liabilities | | | 3,179,775 | | |
Net assets applicable to outstanding capital stock | | $ | 449,212,690 | | |
Represented by | |
Paid-in capital | | $ | 1,221,473,661 | | |
Undistributed net investment income | | | 5,362,923 | | |
Accumulated net realized loss | | | (756,446,136 | ) | |
Unrealized appreciation (depreciation) on: | |
Investments | | | (20,999,842 | ) | |
Foreign currency translations | | | (177,916 | ) | |
Total — representing net assets applicable to outstanding capital stock | | $ | 449,212,690 | | |
The accompanying Notes to Financial Statements are an integral part of this statement.
Annual Report 2016
13
COLUMBIA SELECT INTERNATIONAL EQUITY FUND
STATEMENT OF ASSETS AND LIABILITIES (continued)
February 29, 2016
Class A | |
Net assets | | $ | 210,841,059 | | |
Shares outstanding | | | 18,475,428 | | |
Net asset value per share | | $ | 11.41 | | |
Maximum offering price per share(a) | | $ | 12.11 | | |
Class B | |
Net assets | | $ | 875,494 | | |
Shares outstanding | | | 86,516 | | |
Net asset value per share | | $ | 10.12 | | |
Class C | |
Net assets | | $ | 7,886,369 | | |
Shares outstanding | | | 789,010 | | |
Net asset value per share | | $ | 10.00 | | |
Class I | |
Net assets | | $ | 2,308 | | |
Shares outstanding | | | 196 | | |
Net asset value per share(b) | | $ | 11.75 | | |
Class K | |
Net assets | | $ | 55,347 | | |
Shares outstanding | | | 4,755 | | |
Net asset value per share | | $ | 11.64 | | |
Class R | |
Net assets | | $ | 807,938 | | |
Shares outstanding | | | 71,353 | | |
Net asset value per share | | $ | 11.32 | | |
Class R4 | |
Net assets | | $ | 21,801 | | |
Shares outstanding | | | 1,859 | | |
Net asset value per share | | $ | 11.73 | | |
Class R5 | |
Net assets | | $ | 59,121 | | |
Shares outstanding | | | 5,015 | | |
Net asset value per share | | $ | 11.79 | | |
Class W | |
Net assets | | $ | 152,720,854 | | |
Shares outstanding | | | 13,378,906 | | |
Net asset value per share | | $ | 11.42 | | |
Class Y | |
Net assets | | $ | 11,311,806 | | |
Shares outstanding | | | 961,881 | | |
Net asset value per share | | $ | 11.76 | | |
Class Z | |
Net assets | | $ | 64,630,593 | | |
Shares outstanding | | | 5,542,275 | | |
Net asset value per share | | $ | 11.66 | | |
(a) The maximum offering price per share is calculated by dividing the net asset value per share by 1.0 minus the maximum sales charge of 5.75%.
(b) Net asset value per share rounds to this amount due to fractional shares outstanding.
The accompanying Notes to Financial Statements are an integral part of this statement.
Annual Report 2016
14
COLUMBIA SELECT INTERNATIONAL EQUITY FUND
STATEMENT OF OPERATIONS
Year Ended February 29, 2016
Net investment income | |
Income: | |
Dividends — unaffiliated issuers | | $ | 14,014,674 | | |
Dividends — affiliated issuers | | | 9,047 | | |
Foreign taxes withheld | | | (1,337,103 | ) | |
Total income | | | 12,686,618 | | |
Expenses: | |
Investment management fees | | | 4,917,395 | | |
Distribution and/or service fees | |
Class A | | | 636,855 | | |
Class B | | | 15,431 | | |
Class C | | | 100,564 | | |
Class R | | | 6,605 | | |
Class W | | | 466,437 | | |
Transfer agent fees | |
Class A | | | 625,665 | | |
Class B | | | 3,785 | | |
Class C | | | 24,684 | | |
Class K | | | 33 | | |
Class R | | | 3,233 | | |
Class R4 | | | 19 | | |
Class R5 | | | 26 | | |
Class W | | | 458,223 | | |
Class Z | | | 246,363 | | |
Plan administration fees | |
Class K | | | 167 | | |
Compensation of board members | | | 11,921 | | |
Custodian fees | | | 75,188 | | |
Printing and postage fees | | | 172,933 | | |
Registration fees | | | 134,559 | | |
Audit fees | | | 63,788 | | |
Legal fees | | | 10,078 | | |
Line of credit interest expense | | | 333 | | |
Other | | | 22,075 | | |
Total expenses | | | 7,996,360 | | |
Fees waived or expenses reimbursed by Investment Manager and its affiliates | | | (121,134 | ) | |
Expense reductions | | | (14,642 | ) | |
Total net expenses | | | 7,860,584 | | |
Net investment income | | | 4,826,034 | | |
Realized and unrealized gain (loss) — net | |
Net realized gain (loss) on: | |
Investments | | | 36,101,088 | | |
Foreign currency translations | | | (565,806 | ) | |
Forward foreign currency exchange contracts | | | 42,973 | | |
Futures contracts | | | 171,900 | | |
Net realized gain | | | 35,750,155 | | |
Net change in unrealized appreciation (depreciation) on: | |
Investments | | | (136,807,335 | ) | |
Foreign currency translations | | | (45,634 | ) | |
Forward foreign currency exchange contracts | | | 352,813 | | |
Futures contracts | | | (320,772 | ) | |
Net change in unrealized depreciation | | | (136,820,928 | ) | |
Net realized and unrealized loss | | | (101,070,773 | ) | |
Net decrease in net assets from operations | | $ | (96,244,739 | ) | |
The accompanying Notes to Financial Statements are an integral part of this statement.
Annual Report 2016
15
COLUMBIA SELECT INTERNATIONAL EQUITY FUND
STATEMENT OF CHANGES IN NET ASSETS
| | | Year Ended
February 29,
2016 | | Year Ended
February 28,
2015 | |
Operations | |
Net investment income | | $ | 4,826,034 | | | $ | 6,349,396 | | |
Net realized gain | | | 35,750,155 | | | | 54,187,802 | | |
Net change in unrealized depreciation | | | (136,820,928 | ) | | | (66,542,542 | ) | |
Net decrease in net assets resulting from operations | | | (96,244,739 | ) | | | (6,005,344 | ) | |
Decrease in net assets from capital stock activity | | | (147,844,776 | ) | | | (58,818,743 | ) | |
Proceeds from regulatory settlements (Note 6) | | | 2,627,180 | | | | 633,636 | | |
Total decrease in net assets | | | (241,462,335 | ) | | | (64,190,451 | ) | |
Net assets at beginning of year | | | 690,675,025 | | | | 754,865,476 | | |
Net assets at end of year | | $ | 449,212,690 | | | $ | 690,675,025 | | |
Undistributed (excess of distributions over) net investment income | | $ | 5,362,923 | | | $ | (3,529,736 | ) | |
The accompanying Notes to Financial Statements are an integral part of this statement.
Annual Report 2016
16
COLUMBIA SELECT INTERNATIONAL EQUITY FUND
STATEMENT OF CHANGES IN NET ASSETS (continued)
| | | Year Ended February 29, 2016 | | Year Ended February 28, 2015 | |
| | | Shares | | Dollars ($) | | Shares | | Dollars ($) | |
Capital stock activity | |
Class A shares | |
Subscriptions(a) | | | 624,022 | | | | 8,266,914 | | | | 586,691 | | | | 7,782,084 | | |
Redemptions | | | (2,230,724 | ) | | | (29,466,229 | ) | | | (3,327,729 | ) | | | (44,322,491 | ) | |
Net decrease | | | (1,606,702 | ) | | | (21,199,315 | ) | | | (2,741,038 | ) | | | (36,540,407 | ) | |
Class B shares | |
Subscriptions | | | 6,819 | | | | 81,902 | | | | 2,838 | | | | 34,474 | | |
Redemptions(a) | | | (107,981 | ) | | | (1,275,975 | ) | | | (156,096 | ) | | | (1,846,235 | ) | |
Net decrease | | | (101,162 | ) | | | (1,194,073 | ) | | | (153,258 | ) | | | (1,811,761 | ) | |
Class C shares | |
Subscriptions | | | 63,742 | | | | 747,035 | | | | 65,342 | | | | 760,338 | | |
Redemptions | | | (188,505 | ) | | | (2,136,186 | ) | | | (169,333 | ) | | | (2,010,481 | ) | |
Net decrease | | | (124,763 | ) | | | (1,389,151 | ) | | | (103,991 | ) | | | (1,250,143 | ) | |
Class I shares | |
Redemptions | | | — | | | | — | | | | (1,134 | ) | | | (15,898 | ) | |
Net decrease | | | — | | | | — | | | | (1,134 | ) | | | (15,898 | ) | |
Class K shares | |
Redemptions | | | (2,617 | ) | | | (36,039 | ) | | | (507 | ) | | | (7,101 | ) | |
Net decrease | | | (2,617 | ) | | | (36,039 | ) | | | (507 | ) | | | (7,101 | ) | |
Class R shares | |
Subscriptions | | | 29,344 | | | | 364,529 | | | | 40,197 | | | | 528,291 | | |
Redemptions | | | (72,757 | ) | | | (923,213 | ) | | | (43,395 | ) | | | (585,626 | ) | |
Net decrease | | | (43,413 | ) | | | (558,684 | ) | | | (3,198 | ) | | | (57,335 | ) | |
Class R4 shares | |
Subscriptions | | | 1,679 | | | | 21,376 | | | | — | | | | — | | |
Redemptions | | | — | | | | — | | | | (285 | ) | | | (4,033 | ) | |
Net increase (decrease) | | | 1,679 | | | | 21,376 | | | | (285 | ) | | | (4,033 | ) | |
Class R5 shares | |
Subscriptions | | | 2,692 | | | | 36,346 | | | | 6,031 | | | | 81,262 | | |
Redemptions | | | (1,899 | ) | | | (26,403 | ) | | | (2,817 | ) | | | (37,545 | ) | |
Net increase | | | 793 | | | | 9,943 | | | | 3,214 | | | | 43,717 | | |
Class W shares | |
Subscriptions | | | 2,897,840 | | | | 38,249,148 | | | | 11,495,335 | | | | 150,023,731 | | |
Redemptions | | | (4,538,092 | ) | | | (59,173,866 | ) | | | (8,468,053 | ) | | | (115,361,849 | ) | |
Net increase (decrease) | | | (1,640,252 | ) | | | (20,924,718 | ) | | | 3,027,282 | | | | 34,661,882 | | |
Class Y shares | |
Redemptions | | | (146,628 | ) | | | (2,000,007 | ) | | | (21 | ) | | | (300 | ) | |
Net decrease | | | (146,628 | ) | | | (2,000,007 | ) | | | (21 | ) | | | (300 | ) | |
Class Z shares | |
Subscriptions | | | 97,216 | | | | 1,308,059 | | | | 145,230 | | | | 1,972,107 | | |
Redemptions | | | (7,403,059 | ) | | | (101,882,167 | ) | | | (4,106,022 | ) | | | (55,809,471 | ) | |
Net decrease | | | (7,305,843 | ) | | | (100,574,108 | ) | | | (3,960,792 | ) | | | (53,837,364 | ) | |
Total net decrease | | | (10,968,908 | ) | | | (147,844,776 | ) | | | (3,933,728 | ) | | | (58,818,743 | ) | |
(a) Includes conversions of Class B shares to Class A shares, if any.
The accompanying Notes to Financial Statements are an integral part of this statement.
Annual Report 2016
17
COLUMBIA SELECT INTERNATIONAL EQUITY FUND
The following tables are intended to help you understand the Fund's financial performance. Certain information reflects financial results for a single share of a class held for the periods shown. Per share net investment income (loss) amounts are calculated based on average shares outstanding during the period. Total return assumes reinvestment of all dividends and distributions, if any. Total return does not reflect payment of sales charges, if any. Total return and portfolio turnover are not annualized for periods of less than one year. The portfolio turnover rate is calculated without regard to purchase and sales transactions of short-term instruments and certain derivatives, if any. If such transactions were included, the Fund's portfolio turnover rate may be higher.
| | | Year Ended
February 29, | | Year Ended February 28, | | Year Ended
February 29, | |
Class A | | 2016 | | 2015 | | 2014 | | 2013 | | 2012 | |
Per share data | |
Net asset value, beginning of period | | $ | 13.69 | | | $ | 13.88 | | | $ | 12.02 | | | $ | 11.68 | | | $ | 12.46 | | |
Income from investment operations: | |
Net investment income | | | 0.10 | | | | 0.12 | | | | 0.15 | | | | 0.17 | | | | 0.14 | | |
Net realized and unrealized gain (loss) | | | (2.44 | ) | | | (0.32 | ) | | | 1.71 | | | | 0.56 | | | | (0.94 | ) | |
Total from investment operations | | | (2.34 | ) | | | (0.20 | ) | | | 1.86 | | | | 0.73 | | | | (0.80 | ) | |
Less distributions to shareholders: | |
Net investment income | | | — | | | | — | | | | — | | | | (0.39 | ) | | | — | | |
Total distributions to shareholders | | | — | | | | — | | | | — | | | | (0.39 | ) | | | — | | |
Proceeds from regulatory settlements | | | 0.06 | | | | 0.01 | | | | — | | | | — | | | | 0.02 | | |
Net asset value, end of period | | $ | 11.41 | | | $ | 13.69 | | | $ | 13.88 | | | $ | 12.02 | | | $ | 11.68 | | |
Total return | | | (16.65 | %)(a) | | | (1.37 | %)(b) | | | 15.47 | % | | | 6.41 | % | | | (6.26 | %)(c) | |
Ratios to average net assets(d) | |
Total gross expenses | | | 1.45 | %(e) | | | 1.49 | % | | | 1.42 | %(e) | | | 1.39 | %(e) | | | 1.36 | % | |
Total net expenses(f) | | | 1.42 | %(e)(g) | | | 1.47 | %(g) | | | 1.42 | %(e)(g) | | | 1.38 | %(e)(g) | | | 1.32 | %(g) | |
Net investment income | | | 0.78 | % | | | 0.94 | % | | | 1.20 | % | | | 1.46 | % | | | 1.20 | % | |
Supplemental data | |
Net assets, end of period (in thousands) | | $ | 210,841 | | | $ | 274,993 | | | $ | 316,823 | | | $ | 313,239 | | | $ | 356,708 | | |
Portfolio turnover | | | 131 | % | | | 96 | % | | | 125 | % | | | 100 | % | | | 112 | % | |
Notes to Financial Highlights
(a) The Fund received proceeds from regulatory settlements. Had the Fund not received these proceeds, the total return would have been lower by 0.44%.
(b) The Fund received proceeds from regulatory settlements. Had the Fund not received these proceeds, the total return would have been lower by 0.10%.
(c) The Fund received proceeds from regulatory settlements. Had the Fund not received these proceeds, the total return would have been lower by 0.19%.
(d) In addition to the fees and expenses that the Fund bears directly, the Fund indirectly bears a pro rata share of the fees and expenses of any other funds in which it invests. Such indirect expenses are not included in the Fund's reported expense ratios.
(e) Ratios include line of credit interest expense which is less than 0.01%.
(f) Total net expenses include the impact of certain fee waivers/expense reimbursements made by the Investment Manager and certain of its affiliates, if applicable.
(g) The benefits derived from expense reductions had an impact of less than 0.01%.
The accompanying Notes to Financial Statements are an integral part of this statement.
Annual Report 2016
18
COLUMBIA SELECT INTERNATIONAL EQUITY FUND
FINANCIAL HIGHLIGHTS (continued)
| | | Year Ended
February 29, | | Year Ended February 28, | | Year Ended
February 29, | |
Class B | | 2016 | | 2015 | | 2014 | | 2013 | | 2012 | |
Per share data | |
Net asset value, beginning of period | | $ | 12.23 | | | $ | 12.50 | | | $ | 10.90 | | | $ | 10.55 | | | $ | 11.34 | | |
Income from investment operations: | |
Net investment income | | | 0.02 | | | | 0.04 | | | | 0.06 | | | | 0.09 | | | | 0.06 | | |
Net realized and unrealized gain (loss) | | | (2.18 | ) | | | (0.32 | ) | | | 1.54 | | | | 0.49 | | | | (0.87 | ) | |
Total from investment operations | | | (2.16 | ) | | | (0.28 | ) | | | 1.60 | | | | 0.58 | | | | (0.81 | ) | |
Less distributions to shareholders: | |
Net investment income | | | — | | | | — | | | | — | | | | (0.23 | ) | | | — | | |
Total distributions to shareholders | | | — | | | | — | | | | — | | | | (0.23 | ) | | | — | | |
Proceeds from regulatory settlements | | | 0.05 | | | | 0.01 | | | | — | | | | — | | | | 0.02 | | |
Net asset value, end of period | | $ | 10.12 | | | $ | 12.23 | | | $ | 12.50 | | | $ | 10.90 | | | $ | 10.55 | | |
Total return | | | (17.25 | %)(a) | | | (2.16 | %)(b) | | | 14.68 | % | | | 5.59 | % | | | (6.97 | %)(c) | |
Ratios to average net assets(d) | |
Total gross expenses | | | 2.20 | %(e) | | | 2.24 | % | | | 2.17 | %(e) | | | 2.13 | %(e) | | | 2.11 | % | |
Total net expenses(f) | | | 2.18 | %(e)(g) | | | 2.22 | %(g) | | | 2.17 | %(e)(g) | | | 2.12 | %(e)(g) | | | 2.06 | %(g) | |
Net investment income | | | 0.16 | % | | | 0.33 | % | | | 0.52 | % | | | 0.91 | % | | | 0.62 | % | |
Supplemental data | |
Net assets, end of period (in thousands) | | $ | 875 | | | $ | 2,296 | | | $ | 4,260 | | | $ | 6,566 | | | $ | 11,838 | | |
Portfolio turnover | | | 131 | % | | | 96 | % | | | 125 | % | | | 100 | % | | | 112 | % | |
Notes to Financial Highlights
(a) The Fund received proceeds from regulatory settlements. Had the Fund not received these proceeds, the total return would have been lower by 0.44%.
(b) The Fund received proceeds from regulatory settlements. Had the Fund not received these proceeds, the total return would have been lower by 0.10%.
(c) The Fund received proceeds from regulatory settlements. Had the Fund not received these proceeds, the total return would have been lower by 0.20%.
(d) In addition to the fees and expenses that the Fund bears directly, the Fund indirectly bears a pro rata share of the fees and expenses of any other funds in which it invests. Such indirect expenses are not included in the Fund's reported expense ratios.
(e) Ratios include line of credit interest expense which is less than 0.01%.
(f) Total net expenses include the impact of certain fee waivers/expense reimbursements made by the Investment Manager and certain of its affiliates, if applicable.
(g) The benefits derived from expense reductions had an impact of less than 0.01%.
The accompanying Notes to Financial Statements are an integral part of this statement.
Annual Report 2016
19
COLUMBIA SELECT INTERNATIONAL EQUITY FUND
FINANCIAL HIGHLIGHTS (continued)
| | | Year Ended
February 29, | | Year Ended February 28, | | Year Ended
February 29, | |
Class C | | 2016 | | 2015 | | 2014 | | 2013 | | 2012 | |
Per share data | |
Net asset value, beginning of period | | $ | 12.08 | | | $ | 12.34 | | | $ | 10.77 | | | $ | 10.42 | | | $ | 11.20 | | |
Income from investment operations: | |
Net investment income | | | 0.00 | (a) | | | 0.02 | | | | 0.05 | | | | 0.07 | | | | 0.05 | | |
Net realized and unrealized gain (loss) | | | (2.13 | ) | | | (0.29 | ) | | | 1.52 | | | | 0.51 | | | | (0.85 | ) | |
Total from investment operations | | | (2.13 | ) | | | (0.27 | ) | | | 1.57 | | | | 0.58 | | | | (0.80 | ) | |
Net investment income | | | — | | | | — | | | | — | | | | (0.23 | ) | | | — | | |
Total distributions to shareholders | | | — | | | | — | | | | — | | | | (0.23 | ) | | | — | | |
Proceeds from regulatory settlements | | | 0.05 | | | | 0.01 | | | | — | | | | — | | | | 0.02 | | |
Net asset value, end of period | | $ | 10.00 | | | $ | 12.08 | | | $ | 12.34 | | | $ | 10.77 | | | $ | 10.42 | | |
Total return | | | (17.22 | %)(b) | | | (2.11 | %)(c) | | | 14.58 | % | | | 5.64 | % | | | (6.96 | %)(d) | |
Ratios to average net assets(e) | |
Total gross expenses | | | 2.20 | %(f) | | | 2.24 | % | | | 2.17 | %(f) | | | 2.14 | %(f) | | | 2.10 | % | |
Total net expenses(g) | | | 2.18 | %(f)(h) | | | 2.22 | %(h) | | | 2.17 | %(f)(h) | | | 2.13 | %(f)(h) | | | 2.07 | %(h) | |
Net investment income | | | 0.02 | % | | | 0.19 | % | | | 0.45 | % | | | 0.72 | % | | | 0.48 | % | |
Supplemental data | |
Net assets, end of period (in thousands) | | $ | 7,886 | | | $ | 11,042 | | | $ | 12,562 | | | $ | 12,619 | | | $ | 15,058 | | |
Portfolio turnover | | | 131 | % | | | 96 | % | | | 125 | % | | | 100 | % | | | 112 | % | |
Notes to Financial Highlights
(a) Rounds to zero.
(b) The Fund received proceeds from regulatory settlements. Had the Fund not received these proceeds, the total return would have been lower by 0.44%.
(c) The Fund received proceeds from regulatory settlements. Had the Fund not received these proceeds, the total return would have been lower by 0.10%.
(d) The Fund received proceeds from regulatory settlements. Had the Fund not received these proceeds, the total return would have been lower by 0.19%.
(e) In addition to the fees and expenses that the Fund bears directly, the Fund indirectly bears a pro rata share of the fees and expenses of any other funds in which it invests. Such indirect expenses are not included in the Fund's reported expense ratios.
(f) Ratios include line of credit interest expense which is less than 0.01%.
(g) Total net expenses include the impact of certain fee waivers/expense reimbursements made by the Investment Manager and certain of its affiliates, if applicable.
(h) The benefits derived from expense reductions had an impact of less than 0.01%.
The accompanying Notes to Financial Statements are an integral part of this statement.
Annual Report 2016
20
COLUMBIA SELECT INTERNATIONAL EQUITY FUND
FINANCIAL HIGHLIGHTS (continued)
| | | Year Ended
February 29, | | Year Ended February 28, | | Year Ended
February 29, | |
Class I | | 2016 | | 2015 | | 2014 | | 2013 | | 2012 | |
Per share data | |
Net asset value, beginning of period | | $ | 14.03 | | | $ | 14.15 | | | $ | 12.20 | | | $ | 11.89 | | | $ | 12.62 | | |
Income from investment operations: | |
Net investment income | | | 0.16 | | | | 0.27 | | | | 0.30 | | | | 0.22 | | | | 0.22 | | |
Net realized and unrealized gain (loss) | | | (2.50 | ) | | | (0.40 | ) | | | 1.65 | | | | 0.58 | | | | (0.97 | ) | |
Total from investment operations | | | (2.34 | ) | | | (0.13 | ) | | | 1.95 | | | | 0.80 | | | | (0.75 | ) | |
Less distributions to shareholders: | |
Net investment income | | | — | | | | — | | | | — | | | | (0.49 | ) | | | — | | |
Total distributions to shareholders | | | — | | | | — | | | | — | | | | (0.49 | ) | | | — | | |
Proceeds from regulatory settlements | | | 0.06 | | | | 0.01 | | | | — | | | | — | | | | 0.02 | | |
Net asset value, end of period | | $ | 11.75 | | | $ | 14.03 | | | $ | 14.15 | | | $ | 12.20 | | | $ | 11.89 | | |
Total return | | | (16.25 | %)(a) | | | (0.85 | %)(b) | | | 15.98 | % | | | 6.96 | % | | | (5.78 | %)(c) | |
Ratios to average net assets(d) | |
Total gross expenses | | | 1.00 | %(e) | | | 0.95 | % | | | 0.93 | %(e) | | | 0.93 | %(e) | | | 0.84 | % | |
Total net expenses(f) | | | 0.98 | %(e) | | | 0.95 | % | | | 0.93 | %(e) | | | 0.93 | %(e) | | | 0.84 | % | |
Net investment income | | | 1.20 | % | | | 1.98 | % | | | 2.38 | % | | | 1.90 | % | | | 1.87 | % | |
Supplemental data | |
Net assets, end of period (in thousands) | | $ | 2 | | | $ | 3 | | | $ | 19 | | | $ | 24,204 | | | $ | 78,467 | | |
Portfolio turnover | | | 131 | % | | | 96 | % | | | 125 | % | | | 100 | % | | | 112 | % | |
Notes to Financial Highlights
(a) The Fund received proceeds from regulatory settlements. Had the Fund not received these proceeds, the total return would have been lower by 0.44%.
(b) The Fund received proceeds from regulatory settlements. Had the Fund not received these proceeds, the total return would have been lower by 0.10%.
(c) The Fund received proceeds from regulatory settlements. Had the Fund not received these proceeds, the total return would have been lower by 0.19%.
(d) In addition to the fees and expenses that the Fund bears directly, the Fund indirectly bears a pro rata share of the fees and expenses of any other funds in which it invests. Such indirect expenses are not included in the Fund's reported expense ratios.
(e) Ratios include line of credit interest expense which is less than 0.01%.
(f) Total net expenses include the impact of certain fee waivers/expense reimbursements made by the Investment Manager and certain of its affiliates, if applicable.
The accompanying Notes to Financial Statements are an integral part of this statement.
Annual Report 2016
21
COLUMBIA SELECT INTERNATIONAL EQUITY FUND
FINANCIAL HIGHLIGHTS (continued)
| | | Year Ended
February 29, | | Year Ended February 28, | | Year Ended
February 29, | |
Class K | | 2016 | | 2015 | | 2014 | | 2013 | | 2012(a) | |
Per share data | |
Net asset value, beginning of period | | $ | 13.95 | | | $ | 14.11 | | | $ | 12.20 | | | $ | 11.85 | | | $ | 12.54 | | |
Income from investment operations: | |
Net investment income | | | 0.14 | | | | 0.15 | | | | 0.17 | | | | 0.18 | | | | 0.15 | | |
Net realized and unrealized gain (loss) | | | (2.51 | ) | | | (0.32 | ) | | | 1.74 | | | | 0.58 | | | | (0.86 | ) | |
Total from investment operations | | | (2.37 | ) | | | (0.17 | ) | | | 1.91 | | | | 0.76 | | | | (0.71 | ) | |
Less distributions to shareholders: | |
Net investment income | | | — | | | | — | | | | — | | | | (0.41 | ) | | | — | | |
Total distributions to shareholders | | | — | | | | — | | | | — | | | | (0.41 | ) | | | — | | |
Proceeds from regulatory settlements | | | 0.06 | | | | 0.01 | | | | — | | | | — | | | | 0.02 | | |
Net asset value, end of period | | $ | 11.64 | | | $ | 13.95 | | | $ | 14.11 | | | $ | 12.20 | | | $ | 11.85 | | |
Total return | | | (16.56 | %)(b) | | | (1.13 | %)(c) | | | 15.66 | % | | | 6.64 | % | | | (5.50 | %)(d) | |
Ratios to average net assets(e) | |
Total gross expenses | | | 1.25 | %(f) | | | 1.25 | % | | | 1.24 | %(f) | | | 1.24 | %(f) | | | 1.21 | %(g) | |
Total net expenses(h) | | | 1.25 | %(f) | | | 1.25 | % | | | 1.24 | %(f) | | | 1.24 | %(f) | | | 1.21 | %(g) | |
Net investment income | | | 1.06 | % | | | 1.12 | % | | | 1.32 | % | | | 1.61 | % | | | 1.33 | %(g) | |
Supplemental data | |
Net assets, end of period (in thousands) | | $ | 55 | | | $ | 103 | | | $ | 111 | | | $ | 122 | | | $ | 135 | | |
Portfolio turnover | | | 131 | % | | | 96 | % | | | 125 | % | | | 100 | % | | | 112 | % | |
Notes to Financial Highlights
(a) Based on operations from March 7, 2011 (commencement of operations) through the stated period end.
(b) The Fund received proceeds from regulatory settlements. Had the Fund not received these proceeds, the total return would have been lower by 0.44%.
(c) The Fund received proceeds from regulatory settlements. Had the Fund not received these proceeds, the total return would have been lower by 0.10%.
(d) The Fund received proceeds from regulatory settlements. Had the Fund not received these proceeds, the total return would have been lower by 0.19%.
(e) In addition to the fees and expenses that the Fund bears directly, the Fund indirectly bears a pro rata share of the fees and expenses of any other funds in which it invests. Such indirect expenses are not included in the Fund's reported expense ratios.
(f) Ratios include line of credit interest expense which is less than 0.01%.
(g) Annualized.
(h) Total net expenses include the impact of certain fee waivers/expense reimbursements made by the Investment Manager and certain of its affiliates, if applicable.
The accompanying Notes to Financial Statements are an integral part of this statement.
Annual Report 2016
22
COLUMBIA SELECT INTERNATIONAL EQUITY FUND
FINANCIAL HIGHLIGHTS (continued)
| | | Year Ended
February 29, | | Year Ended February 28, | | Year Ended
February 29, | |
Class R | | 2016 | | 2015 | | 2014 | | 2013 | | 2012 | |
Per share data | |
Net asset value, beginning of period | | $ | 13.62 | | | $ | 13.84 | | | $ | 12.01 | | | $ | 11.64 | | | $ | 12.45 | | |
Income from investment operations: | |
Net investment income | | | 0.07 | | | | 0.10 | | | | 0.11 | | | | 0.14 | | | | 0.11 | | |
Net realized and unrealized gain (loss) | | | (2.43 | ) | | | (0.33 | ) | | | 1.72 | | | | 0.57 | | | | (0.94 | ) | |
Total from investment operations | | | (2.36 | ) | | | (0.23 | ) | | | 1.83 | | | | 0.71 | | | | (0.83 | ) | |
Less distributions to shareholders: | |
Net investment income | | | — | | | | — | | | | — | | | | (0.34 | ) | | | — | | |
Total distributions to shareholders | | | — | | | | — | | | | — | | | | (0.34 | ) | | | — | | |
Proceeds from regulatory settlements | | | 0.06 | | | | 0.01 | | | | — | | | | — | | | | 0.02 | | |
Net asset value, end of period | | $ | 11.32 | | | $ | 13.62 | | | $ | 13.84 | | | $ | 12.01 | | | $ | 11.64 | | |
Total return | | | (16.89 | %)(a) | | | (1.59 | %)(b) | | | 15.24 | % | | | 6.20 | % | | | (6.51 | %)(c) | |
Ratios to average net assets(d) | |
Total gross expenses | | | 1.70 | %(e) | | | 1.74 | % | | | 1.67 | %(e) | | | 1.64 | %(e) | | | 1.62 | % | |
Total net expenses(f) | | | 1.67 | %(e)(g) | | | 1.72 | %(g) | | | 1.67 | %(e)(g) | | | 1.63 | %(e)(g) | | | 1.57 | %(g) | |
Net investment income | | | 0.54 | % | | | 0.72 | % | | | 0.87 | % | | | 1.22 | % | | | 0.98 | % | |
Supplemental data | |
Net assets, end of period (in thousands) | | $ | 808 | | | $ | 1,563 | | | $ | 1,632 | | | $ | 1,673 | | | $ | 1,899 | | |
Portfolio turnover | | | 131 | % | | | 96 | % | | | 125 | % | | | 100 | % | | | 112 | % | |
Notes to Financial Highlights
(a) The Fund received proceeds from regulatory settlements. Had the Fund not received these proceeds, the total return would have been lower by 0.44%.
(b) The Fund received proceeds from regulatory settlements. Had the Fund not received these proceeds, the total return would have been lower by 0.10%.
(c) The Fund received proceeds from regulatory settlements. Had the Fund not received these proceeds, the total return would have been lower by 0.19%.
(d) In addition to the fees and expenses that the Fund bears directly, the Fund indirectly bears a pro rata share of the fees and expenses of any other funds in which it invests. Such indirect expenses are not included in the Fund's reported expense ratios.
(e) Ratios include line of credit interest expense which is less than 0.01%.
(f) Total net expenses include the impact of certain fee waivers/expense reimbursements made by the Investment Manager and certain of its affiliates, if applicable.
(g) The benefits derived from expense reductions had an impact of less than 0.01%.
The accompanying Notes to Financial Statements are an integral part of this statement.
Annual Report 2016
23
COLUMBIA SELECT INTERNATIONAL EQUITY FUND
FINANCIAL HIGHLIGHTS (continued)
| | | Year Ended
February 29, | | Year Ended February 28, | |
Class R4 | | 2016 | | 2015 | | 2014 | | 2013(a) | |
Per share data | |
Net asset value, beginning of period | | $ | 14.04 | | | $ | 14.20 | | | $ | 12.27 | | | $ | 11.62 | | |
Income from investment operations: | |
Net investment income | | | 0.15 | | | | 0.24 | | | | 0.18 | | | | 0.02 | | |
Net realized and unrealized gain (loss) | | | (2.52 | ) | | | (0.41 | ) | | | 1.75 | | | | 0.92 | | |
Total from investment operations | | | (2.37 | ) | | | (0.17 | ) | | | 1.93 | | | | 0.94 | | |
Less distributions to shareholders: | |
Net investment income | | | — | | | | — | | | | — | | | | (0.29 | ) | |
Total distributions to shareholders | | | — | | | | — | | | | — | | | | (0.29 | ) | |
Proceeds from regulatory settlements | | | 0.06 | | | | 0.01 | | | | — | | | | — | | |
Net asset value, end of period | | $ | 11.73 | | | $ | 14.04 | | | $ | 14.20 | | | $ | 12.27 | | |
Total return | | | (16.45 | %)(b) | | | (1.13 | %)(c) | | | 15.73 | % | | | 8.17 | % | |
Ratios to average net assets(d) | |
Total gross expenses | | | 1.21 | %(e) | | | 1.25 | % | | | 1.19 | %(e) | | | 1.25 | %(f) | |
Total net expenses(g) | | | 1.18 | %(e)(h) | | | 1.21 | %(i) | | | 1.19 | %(e)(h) | | | 1.25 | %(f) | |
Net investment income | | | 1.16 | % | | | 1.77 | % | | | 1.35 | % | | | 0.55 | %(f) | |
Supplemental data | |
Net assets, end of period (in thousands) | | $ | 22 | | | $ | 3 | | | $ | 7 | | | $ | 3 | | |
Portfolio turnover | | | 131 | % | | | 96 | % | | | 125 | % | | | 100 | % | |
Notes to Financial Highlights
(a) Based on operations from November 8, 2012 (commencement of operations) through the stated period end.
(b) The Fund received proceeds from regulatory settlements. Had the Fund not received these proceeds, the total return would have been lower by 0.44%.
(c) The Fund received proceeds from regulatory settlements. Had the Fund not received these proceeds, the total return would have been lower by 0.10%.
(d) In addition to the fees and expenses that the Fund bears directly, the Fund indirectly bears a pro rata share of the fees and expenses of any other funds in which it invests. Such indirect expenses are not included in the Fund's reported expense ratios.
(e) Ratios include line of credit interest expense which is less than 0.01%.
(f) Annualized.
(g) Total net expenses include the impact of certain fee waivers/expense reimbursements made by the Investment Manager and certain of its affiliates, if applicable.
(h) The benefits derived from expense reductions had an impact of less than 0.01%.
(i) The benefits derived from expense reductions had an impact of 0.01%.
The accompanying Notes to Financial Statements are an integral part of this statement.
Annual Report 2016
24
COLUMBIA SELECT INTERNATIONAL EQUITY FUND
FINANCIAL HIGHLIGHTS (continued)
| | | Year Ended
February 29, | | Year Ended February 28, | |
Class R5 | | 2016 | | 2015 | | 2014 | | 2013(a) | |
Per share data | |
Net asset value, beginning of period | | $ | 14.08 | | | $ | 14.21 | | | $ | 12.26 | | | $ | 11.62 | | |
Income from investment operations: | |
Net investment income | | | 0.17 | | | | 0.12 | | | | 0.32 | | | | 0.03 | | |
Net realized and unrealized gain (loss) | | | (2.52 | ) | | | (0.26 | ) | | | 1.63 | | | | 0.92 | | |
Total from investment operations | | | (2.35 | ) | | | (0.14 | ) | | | 1.95 | | | | 0.95 | | |
Less distributions to shareholders: | |
Net investment income | | | — | | | | — | | | | — | | | | (0.31 | ) | |
Total distributions to shareholders | | | — | | | | — | | | | — | | | | (0.31 | ) | |
Proceeds from regulatory settlements | | | 0.06 | | | | 0.01 | | | | — | | | | — | | |
Net asset value, end of period | | $ | 11.79 | | | $ | 14.08 | | | $ | 14.21 | | | $ | 12.26 | | |
Total return | | | (16.26 | %)(b) | | | (0.91 | %)(c) | | | 15.91 | % | | | 8.20 | % | |
Ratios to average net assets(d) | |
Total gross expenses | | | 1.01 | %(e) | | | 1.01 | % | | | 1.04 | %(e) | | | 1.05 | %(f) | |
Total net expenses(g) | | | 1.01 | %(e) | | | 1.01 | % | | | 1.04 | %(e) | | | 1.05 | %(f) | |
Net investment income | | | 1.23 | % | | | 0.86 | % | | | 2.45 | % | | | 0.75 | %(f) | |
Supplemental data | |
Net assets, end of period (in thousands) | | $ | 59 | | | $ | 59 | | | $ | 14 | | | $ | 3 | | |
Portfolio turnover | | | 131 | % | | | 96 | % | | | 125 | % | | | 100 | % | |
Notes to Financial Highlights
(a) Based on operations from November 8, 2012 (commencement of operations) through the stated period end.
(b) The Fund received proceeds from regulatory settlements. Had the Fund not received these proceeds, the total return would have been lower by 0.44%.
(c) The Fund received proceeds from regulatory settlements. Had the Fund not received these proceeds, the total return would have been lower by 0.10%.
(d) In addition to the fees and expenses that the Fund bears directly, the Fund indirectly bears a pro rata share of the fees and expenses of any other funds in which it invests. Such indirect expenses are not included in the Fund's reported expense ratios.
(e) Ratios include line of credit interest expense which is less than 0.01%.
(f) Annualized.
(g) Total net expenses include the impact of certain fee waivers/expense reimbursements made by the Investment Manager and certain of its affiliates, if applicable.
The accompanying Notes to Financial Statements are an integral part of this statement.
Annual Report 2016
25
COLUMBIA SELECT INTERNATIONAL EQUITY FUND
FINANCIAL HIGHLIGHTS (continued)
| | | Year Ended
February 29, | | Year Ended February 28, | | Year Ended
February 29, | |
Class W | | 2016 | | 2015 | | 2014 | | 2013 | | 2012 | |
Per share data | |
Net asset value, beginning of period | | $ | 13.70 | | | $ | 13.88 | | | $ | 12.02 | | | $ | 11.68 | | | $ | 12.46 | | |
Income from investment operations: | |
Net investment income | | | 0.10 | | | | 0.13 | | | | 0.13 | | | | 0.16 | | | | 0.12 | | |
Net realized and unrealized gain (loss) | | | (2.44 | ) | | | (0.32 | ) | | | 1.73 | | | | 0.57 | | | | (0.92 | ) | |
Total from investment operations | | | (2.34 | ) | | | (0.19 | ) | | | 1.86 | | | | 0.73 | | | | (0.80 | ) | |
Less distributions to shareholders: | |
Net investment income | | | — | | | | — | | | | — | | | | (0.39 | ) | | | — | | |
Total distributions to shareholders | | | — | | | | — | | | | — | | | | (0.39 | ) | | | — | | |
Proceeds from regulatory settlements | | | 0.06 | | | | 0.01 | | | | — | | | | — | | | | 0.02 | | |
Net asset value, end of period | | $ | 11.42 | | | $ | 13.70 | | | $ | 13.88 | | | $ | 12.02 | | | $ | 11.68 | | |
Total return | | | (16.64 | %)(a) | | | (1.30 | %)(b) | | | 15.47 | % | | | 6.40 | % | | | (6.26 | %)(c) | |
Ratios to average net assets(d) | |
Total gross expenses | | | 1.45 | %(e) | | | 1.48 | % | | | 1.41 | %(e) | | | 1.40 | %(e) | | | 1.38 | % | |
Total net expenses(f) | | | 1.42 | %(e)(g) | | | 1.47 | %(g) | | | 1.41 | %(e)(g) | | | 1.39 | %(e)(g) | | | 1.33 | %(g) | |
Net investment income | | | 0.78 | % | | | 0.98 | % | | | 1.05 | % | | | 1.42 | % | | | 1.06 | % | |
Supplemental data | |
Net assets, end of period (in thousands) | | $ | 152,721 | | | $ | 205,715 | | | $ | 166,486 | | | $ | 270,144 | | | $ | 232,777 | | |
Portfolio turnover | | | 131 | % | | | 96 | % | | | 125 | % | | | 100 | % | | | 112 | % | |
Notes to Financial Highlights
(a) The Fund received proceeds from regulatory settlements. Had the Fund not received these proceeds, the total return would have been lower by 0.44%.
(b) The Fund received proceeds from regulatory settlements. Had the Fund not received these proceeds, the total return would have been lower by 0.10%.
(c) The Fund received proceeds from regulatory settlements. Had the Fund not received these proceeds, the total return would have been lower by 0.19%.
(d) In addition to the fees and expenses that the Fund bears directly, the Fund indirectly bears a pro rata share of the fees and expenses of any other funds in which it invests. Such indirect expenses are not included in the Fund's reported expense ratios.
(e) Ratios include line of credit interest expense which is less than 0.01%.
(f) Total net expenses include the impact of certain fee waivers/expense reimbursements made by the Investment Manager and certain of its affiliates, if applicable.
(g) The benefits derived from expense reductions had an impact of less than 0.01%.
The accompanying Notes to Financial Statements are an integral part of this statement.
Annual Report 2016
26
COLUMBIA SELECT INTERNATIONAL EQUITY FUND
FINANCIAL HIGHLIGHTS (continued)
| | | Year Ended
February 29, | | Year Ended February 28, | | Year Ended
February 29, | |
Class Y | | 2016 | | 2015 | | 2014 | | 2013 | | 2012(a) | |
Per share data | |
Net asset value, beginning of period | | $ | 14.04 | | | $ | 14.16 | | | $ | 12.21 | | | $ | 11.89 | | | $ | 12.55 | | |
Income from investment operations: | |
Net investment income | | | 0.17 | | | | 0.19 | | | | 0.22 | | | | 0.21 | | | | 0.18 | | |
Net realized and unrealized gain (loss) | | | (2.51 | ) | | | (0.32 | ) | | | 1.73 | | | | 0.59 | | | | (0.86 | ) | |
Total from investment operations | | | (2.34 | ) | | | (0.13 | ) | | | 1.95 | | | | 0.80 | | | | (0.68 | ) | |
Less distributions to shareholders: | |
Net investment income | | | — | | | | — | | | | — | | | | (0.48 | ) | | | — | | |
Total distributions to shareholders | | | — | | | | — | | | | — | | | | (0.48 | ) | | | — | | |
Proceeds from regulatory settlements | | | 0.06 | | | | 0.01 | | | | — | | | | — | | | | 0.02 | | |
Net asset value, end of period | | $ | 11.76 | | | $ | 14.04 | | | $ | 14.16 | | | $ | 12.21 | | | $ | 11.89 | | |
Total return | | | (16.24 | %)(b) | | | (0.85 | %)(c) | | | 15.97 | % | | | 6.98 | % | | | (5.26 | %)(d) | |
Ratios to average net assets(e) | |
Total gross expenses | | | 0.95 | %(f) | | | 0.96 | % | | | 0.94 | %(f) | | | 0.95 | %(f) | | | 0.88 | %(g) | |
Total net expenses(h) | | | 0.95 | %(f) | | | 0.96 | % | | | 0.94 | %(f) | | | 0.95 | %(f) | | | 0.88 | %(g) | |
Net investment income | | | 1.26 | % | | | 1.41 | % | | | 1.67 | % | | | 1.79 | % | | | 1.64 | %(g) | |
Supplemental data | |
Net assets, end of period (in thousands) | | $ | 11,312 | | | $ | 15,568 | | | $ | 15,701 | | | $ | 14,990 | | | $ | 12,780 | | |
Portfolio turnover | | | 131 | % | | | 96 | % | | | 125 | % | | | 100 | % | | | 112 | % | |
Notes to Financial Highlights
(a) Based on operations from March 7, 2011 (commencement of operations) through the stated period end.
(b) The Fund received proceeds from regulatory settlements. Had the Fund not received these proceeds, the total return would have been lower by 0.44%.
(c) The Fund received proceeds from regulatory settlements. Had the Fund not received these proceeds, the total return would have been lower by 0.10%.
(d) The Fund received proceeds from regulatory settlements. Had the Fund not received these proceeds, the total return would have been lower by 0.19%.
(e) In addition to the fees and expenses that the Fund bears directly, the Fund indirectly bears a pro rata share of the fees and expenses of any other funds in which it invests. Such indirect expenses are not included in the Fund's reported expense ratios.
(f) Ratios include line of credit interest expense which is less than 0.01%.
(g) Annualized.
(h) Total net expenses include the impact of certain fee waivers/expense reimbursements made by the Investment Manager and certain of its affiliates, if applicable.
The accompanying Notes to Financial Statements are an integral part of this statement.
Annual Report 2016
27
COLUMBIA SELECT INTERNATIONAL EQUITY FUND
FINANCIAL HIGHLIGHTS (continued)
| | | Year Ended
February 29, | | Year Ended February 28, | | Year Ended
February 29, | |
Class Z | | 2016 | | 2015 | | 2014 | | 2013 | | 2012 | |
Per share data | |
Net asset value, beginning of period | | $ | 13.96 | | | $ | 14.11 | | | $ | 12.19 | | | $ | 11.86 | | | $ | 12.62 | | |
Income from investment operations: | |
Net investment income | | | 0.16 | | | | 0.17 | | | | 0.19 | | | | 0.23 | | | | 0.18 | | |
Net realized and unrealized gain (loss) | | | (2.52 | ) | | | (0.33 | ) | | | 1.73 | | | | 0.54 | | | | (0.96 | ) | |
Total from investment operations | | | (2.36 | ) | | | (0.16 | ) | | | 1.92 | | | | 0.77 | | | | (0.78 | ) | |
Less distributions to shareholders: | |
Net investment income | | | — | | | | — | | | | — | | | | (0.44 | ) | | | — | | |
Total distributions to shareholders | | | — | | | | — | | | | — | | | | (0.44 | ) | | | — | | |
Proceeds from regulatory settlements | | | 0.06 | | | | 0.01 | | | | — | | | | — | | | | 0.02 | | |
Net asset value, end of period | | $ | 11.66 | | | $ | 13.96 | | | $ | 14.11 | | | $ | 12.19 | | | $ | 11.86 | | |
Total return | | | (16.48 | %)(a) | | | (1.06 | %)(b) | | | 15.75 | % | | | 6.72 | % | | | (6.02 | %)(c) | |
Ratios to average net assets(d) | |
Total gross expenses | | | 1.19 | %(e) | | | 1.24 | % | | | 1.17 | %(e) | | | 1.13 | %(e) | | | 1.11 | % | |
Total net expenses(f) | | | 1.17 | %(e)(g) | | | 1.22 | %(g) | | | 1.17 | %(e)(g) | | | 1.12 | %(e)(g) | | | 1.08 | %(g) | |
Net investment income | | | 1.20 | % | | | 1.23 | % | | | 1.50 | % | | | 2.00 | % | | | 1.53 | % | |
Supplemental data | |
Net assets, end of period (in thousands) | | $ | 64,631 | | | $ | 179,330 | | | $ | 237,249 | | | $ | 301,958 | | | $ | 1,093,867 | | |
Portfolio turnover | | | 131 | % | | | 96 | % | | | 125 | % | | | 100 | % | | | 112 | % | |
Notes to Financial Highlights
(a) The Fund received proceeds from regulatory settlements. Had the Fund not received these proceeds, the total return would have been lower by 0.44%.
(b) The Fund received proceeds from regulatory settlements. Had the Fund not received these proceeds, the total return would have been lower by 0.10%.
(c) The Fund received proceeds from regulatory settlements. Had the Fund not received these proceeds, the total return would have been lower by 0.19%.
(d) In addition to the fees and expenses that the Fund bears directly, the Fund indirectly bears a pro rata share of the fees and expenses of any other funds in which it invests. Such indirect expenses are not included in the Fund's reported expense ratios.
(e) Ratios include line of credit interest expense which is less than 0.01%.
(f) Total net expenses include the impact of certain fee waivers/expense reimbursements made by the Investment Manager and certain of its affiliates, if applicable.
(g) The benefits derived from expense reductions had an impact of less than 0.01%.
The accompanying Notes to Financial Statements are an integral part of this statement.
Annual Report 2016
28
COLUMBIA SELECT INTERNATIONAL EQUITY FUND
NOTES TO FINANCIAL STATEMENTS
February 29, 2016
Note 1. Organization
Columbia Select International Equity Fund (formerly known as Columbia Multi-Advisor International Equity Fund) (the Fund), a series of Columbia Funds Series Trust (the Trust), is a diversified fund. The Trust is registered under the Investment Company Act of 1940, as amended (the 1940 Act), as an open-end management investment company organized as a Delaware statutory trust. Effective May 1, 2015, Columbia Multi-Advisor International Equity Fund was renamed Columbia Select International Equity Fund.
Fund Shares
The Trust may issue an unlimited number of shares (without par value). The Fund offers Class A, Class B, Class C, Class I, Class K, Class R, Class R4, Class R5, Class W, Class Y and Class Z shares. Although all share classes generally have identical voting, dividend and liquidation rights, each share class votes separately when required by the Trust's organizational documents or by law. Different share classes pay different distribution amounts to the extent the expenses of such share classes differ, and distributions in liquidation will be proportional to the net asset value of each share class. Each share class has its own expense and sales charge structure.
Class A shares are subject to a maximum front-end sales charge of 5.75% based on the initial investment amount. Class A shares purchased without an initial sales charge in accounts aggregating $1 million to $50 million at the time of purchase are subject to a contingent deferred sales charge (CDSC) if the shares are sold within 18 months after purchase, charged as follows: 1.00% CDSC if redeemed within 12 months after purchase, and 0.50% CDSC if redeemed more than 12, but less than 18, months after purchase.
Class B shares may be subject to a maximum CDSC of 5.00% based upon the holding period after purchase. Class B shares will generally convert to Class A shares eight years after purchase. The Fund no longer accepts investments by new or existing investors in the Fund's Class B shares, except in connection with the reinvestment of any dividend and/or capital gain distributions in Class B shares of the Fund and exchanges by existing Class B shareholders of certain other funds within the Columbia Family of Funds.
Class C shares are subject to a 1.00% CDSC on shares redeemed within 12 months after purchase.
Class I shares are not subject to sales charges and are available only to the Columbia Family of Funds.
Class K shares are not subject to sales charges, however this share class is closed to new investors.
Class R shares are not subject to sales charges and are generally available only to certain retirement plans and other investors as described in the Fund's prospectus.
Class R4 shares are not subject to sales charges and are generally available only to omnibus retirement plans and certain investors as described in the Fund's prospectus.
Class R5 shares are not subject to sales charges and are generally available only to investors purchasing through authorized investment professionals and omnibus retirement plans.
Class W shares are not subject to sales charges and are available only to investors purchasing through authorized investment programs managed by investment professionals, including discretionary managed account programs.
Class Y shares are not subject to sales charges and are generally available only to certain retirement plans as described in the Fund's prospectus.
Class Z shares are not subject to sales charges and are available only to eligible investors, which are subject to different investment minimums as described in the Fund's prospectus.
Note 2. Summary of Significant Accounting Policies
Basis of Preparation
The Fund is an investment company that applies the accounting and reporting guidance in the Financial Accounting Standards Board (FASB) Accounting Standards Codification Topic 946, Financial Services — Investment Companies (ASC 946). The financial statements are prepared in accordance with U.S. generally accepted accounting principles (GAAP), which requires management to make certain estimates and assumptions that affect the reported amounts of assets and liabilities, the disclosure of contingent assets and liabilities at the date of the financial statements and the reported amounts of income and expenses during the reporting period. Actual results could differ from those estimates.
Annual Report 2016
29
COLUMBIA SELECT INTERNATIONAL EQUITY FUND
NOTES TO FINANCIAL STATEMENTS (continued)
February 29, 2016
The following is a summary of significant accounting policies followed by the Fund in the preparation of its financial statements.
Security Valuation
All equity securities are valued at the close of business of the New York Stock Exchange (NYSE). Equity securities are valued at the last quoted sales price on the principal exchange or market on which they trade, except for securities traded on the NASDAQ Stock Market, which are valued at the NASDAQ official close price. Unlisted securities or listed securities for which there were no sales during the day are valued at the mean of the latest quoted bid and ask prices on such exchanges or markets.
Foreign equity securities are valued based on the closing price on the foreign exchange in which such securities are primarily traded. If any foreign equity security closing prices are not readily available, the securities are valued at the mean of the latest quoted bid and ask prices on such exchanges or markets. Foreign currency exchange rates are generally determined at 4:00 p.m. Eastern (U.S.) time. Many securities markets and exchanges outside the U.S. close prior to the close of the NYSE; therefore, the closing prices for securities in such markets or on such exchanges may not fully reflect events that occur after such close but before the close of the NYSE. In those situations, foreign securities will be fair valued pursuant to a policy adopted by the Board of Trustees (the Board), including, if available, utilizing a third party pricing service to determine these fair values. The third party pricing service takes into account multiple factors, including, but not limited to, movements in the U.S. securities markets, certain depositary receipts, futures contracts and foreign exchange rates that have occurred subsequent to the close of the foreign exchange or market, to determine a good faith estimate that reasonably reflects the current market conditions as of the close of the NYSE. The fair value of a security is likely to be different from the quoted or published price, if available.
Investments in open-end investment companies, including money market funds, are valued at their latest net asset value.
Forward foreign currency exchange contracts are marked-to-market based upon foreign currency exchange rates provided by a pricing service.
Futures and options on futures contracts are valued based upon the settlement price at the close of regular trading on their principal exchanges or, in the absence of transactions, at the mean of the latest quoted bid and ask prices.
Investments for which market quotations are not readily available, or that have quotations which management believes are not reflective of market value or reliable, are valued at fair value as determined in good faith under procedures approved by and under the general supervision of the Board. If a security or class of securities (such as foreign securities) is valued at fair value, such value is likely to be different from the quoted or published price for the security.
The determination of fair value often requires significant judgment. To determine fair value, management may use assumptions including but not limited to future cash flows and estimated risk premiums. Multiple inputs from various sources may be used to determine fair value.
GAAP requires disclosure regarding the inputs and valuation techniques used to measure fair value and any changes in valuation inputs or techniques. In addition, investments shall be disclosed by major category. This information is disclosed following the Fund's Portfolio of Investments.
Foreign Currency Transactions and Translations
The values of all assets and liabilities denominated in foreign currencies are generally translated into U.S. dollars at exchange rates determined at the close of the NYSE on any given day. Net realized and unrealized gains (losses) on foreign currency transactions and translations include gains (losses) arising from the fluctuation in exchange rates between trade and settlement dates on securities transactions, gains (losses) arising from the disposition of foreign currency and currency gains (losses) between the accrual and payment dates on dividends, interest income and foreign withholding taxes.
For financial statement purposes, the Fund does not distinguish that portion of gains (losses) on investments which is due to changes in foreign exchange rates from that which is due to changes in market prices of the investments. Such fluctuations are included with the net realized and unrealized gains (losses) on investments in the Statement of Operations.
Derivative Instruments
The Fund invests in certain derivative instruments, as detailed below, to meet its investment objectives. Derivatives are instruments whose values depend on, or are derived from, in whole or in part, the value of one or more securities, currencies, commodities, indices, or other assets or instruments. Derivatives may be used to increase investment flexibility (including to maintain cash reserves while maintaining desired exposure to certain
Annual Report 2016
30
COLUMBIA SELECT INTERNATIONAL EQUITY FUND
NOTES TO FINANCIAL STATEMENTS (continued)
February 29, 2016
assets), for risk management (hedging) purposes, to facilitate trading, to reduce transaction costs and to pursue higher investment returns. The Fund may also use derivative instruments to mitigate certain investment risks, such as foreign currency exchange rate risk, interest rate risk and credit risk. Derivatives may involve various risks, including the potential inability of the counterparty to fulfill its obligation under the terms of the contract, the potential for an illiquid secondary market (making it difficult for the Fund to sell, including at favorable prices) and the potential for market movements which may expose the Fund to gains or losses in excess of the amount shown in the Statement of Assets and Liabilities. The notional amounts of derivative instruments, if applicable, are not recorded in the financial statements.
A derivative instrument may suffer a marked-to-market loss if the value of the contract decreases due to an unfavorable change in the market rates or values of the underlying instrument. Losses can also occur if the counterparty does not perform under the contract. The Fund's risk of loss from counterparty credit risk on over-the-counter derivatives is generally limited to the aggregate unrealized gain netted against any collateral held by the Fund and the amount of any variation margin held by the counterparty. With exchange-traded or centrally cleared derivatives, there is reduced counterparty credit risk to the Fund since the exchange's clearinghouse, as counterparty to such instruments, guarantees against a possible default. The clearinghouse stands between the buyer and the seller of the contract; therefore, the counterparty credit risk is failure of the clearinghouse. However, credit risk still exists in exchange-traded or centrally cleared derivatives with respect to initial and variation margin that is held in a broker's customer account. While brokers are required to segregate customer margin from their own assets, in the event that a broker becomes insolvent or goes into bankruptcy and at that time there is a shortfall in the aggregate amount of margin held by the broker for all its clients, U.S. bankruptcy laws will typically allocate that shortfall on a pro-rata basis across all the broker's customers (including the Fund), potentially resulting in losses to the Fund.
In order to better define its contractual rights and to secure rights that will help the Fund mitigate its counterparty risk, the Fund may enter into an International Swaps and Derivatives Association, Inc. Master Agreement (ISDA Master Agreement) or similar agreement with its derivatives contract counterparties.
An ISDA Master Agreement is an agreement between the Fund and a counterparty that governs over-the-counter derivatives and forward foreign currency exchange contracts and typically contains, among other things, collateral posting terms and netting provisions in the event of a default and/or termination event. Under an ISDA Master Agreement, the Fund may, under certain circumstances, offset with the counterparty certain derivative instrument's payables and/or receivables with collateral held and/or posted and create one single net payment. The provisions of the ISDA Master Agreement typically permit a single net payment in the event of default (close-out netting) including the bankruptcy or insolvency of the counterparty. Note, however, that bankruptcy or insolvency laws of a particular jurisdiction may impose restrictions on or prohibitions against the right of offset in bankruptcy, insolvency or other events.
Collateral (margin) requirements differ by type of derivative. Margin requirements are established by the exchange or clearinghouse for exchange-traded and centrally cleared derivatives. Brokers can ask for margin in excess of the minimum in certain circumstances. Collateral terms are contract specific for over-the-counter derivatives. For over-the-counter derivatives traded under an ISDA Master Agreement, the collateral requirements are typically calculated by netting the marked-to-market amount for each transaction under such agreement and comparing that amount to the value of any variation margin currently pledged by the Fund and/or the counterparty. Generally, the amount of collateral due from or to a party has to exceed a minimum transfer amount threshold (e.g., $500,000) before a transfer has to be made. To the extent amounts due to the Fund from its counterparties are not fully collateralized, contractually or otherwise, the Fund bears the risk of loss from counterparty nonperformance. The Fund attempts to mitigate counterparty risk by only entering into agreements with counterparties that it believes have the financial resources to honor their obligations and by monitoring the financial stability of those counterparties.
Certain ISDA Master Agreements allow counterparties to over-the-counter derivatives transactions to terminate derivatives contracts prior to maturity in the event the Fund's net asset value declines by a stated percentage over a specified time period or if the Fund fails to meet certain terms of the ISDA Master Agreement, which would cause the Fund to accelerate payment of any net liability owed to the counterparty. The Fund also has termination rights if the counterparty fails to meet certain terms of the ISDA Master Agreement. In addition
Annual Report 2016
31
COLUMBIA SELECT INTERNATIONAL EQUITY FUND
NOTES TO FINANCIAL STATEMENTS (continued)
February 29, 2016
to considering counterparty credit risk, the Fund would consider terminating the derivatives contracts based on whether termination would result in a net liability owed from the counterparty.
For financial reporting purposes, the Fund does not offset derivative assets and derivative liabilities that are subject to netting arrangements in the Statement of Assets and Liabilities.
Forward Foreign Currency Exchange Contracts
Forward foreign currency exchange contracts are over-the-counter agreements between two parties to buy and sell a currency at a set price on a future date. The Fund utilized forward foreign currency exchange contracts to hedge the currency exposure associated with some or all of the Fund's securities, to shift investment exposure from one currency to another and to shift U.S. dollar exposure to achieve a representative weighted mix of major currencies in its benchmark and/or to recover an underweight country exposure in its portfolio. These instruments may be used for other purposes in future periods.
The values of forward foreign currency exchange contracts fluctuate daily with changes in foreign currency exchange rates. Changes in the value of these contracts are recorded as unrealized appreciation or depreciation until the contract is exercised or has expired. The Fund will realize a gain or loss when the forward foreign currency exchange contract is closed or expires.
The use of forward foreign currency exchange contracts does not eliminate fluctuations in the prices of the Fund's portfolio securities. The risks of forward foreign currency exchange contracts include movement in the values of the foreign currencies relative to the U.S. dollar (or other foreign currencies) and the possibility that counterparties will not complete their contractual obligations, which may be in excess of the amount reflected, if any, in the Statement of Assets and Liabilities.
Futures Contracts
Futures contracts are exchange traded and represent commitments for the future purchase or sale of an asset at a specified price on a specified date. The Fund bought and sold futures contracts to manage exposure to the securities market and maintain appropriate equity market exposure while keeping sufficient cash to accommodate daily redemptions. These instruments may be used for other purposes in future periods. Upon entering into futures contracts, the Fund bears risks that it may not achieve the anticipated benefits of the futures contracts
and may realize a loss. Additional risks include counterparty credit risk, the possibility of an illiquid market, and that a change in the value of the contract or option may not correlate with changes in the value of the underlying asset.
Upon entering into a futures contract, the Fund pledges cash or securities with the broker in an amount sufficient to meet the initial margin requirement. The initial margin deposit must be maintained at an established level over the life of the contract. Cash deposited as initial margin is recorded in the Statement of Assets and Liabilities as margin deposits. Securities deposited as initial margin are designated in the Portfolio of Investments. Subsequent payments (variation margin) are made or received by the Fund each day. The variation margin payments are equal to the daily change in the contract value and are recorded as variation margin receivable or payable and are offset in unrealized gains or losses. The Fund recognizes a realized gain or loss when the contract is closed or expires. Futures contracts involve, to varying degrees, risk of loss in excess of the variation margin disclosed in the Statement of Assets and Liabilities.
Effects of Derivative Transactions in the Financial Statements
The following tables are intended to provide additional information about the effect of derivatives on the financial statements of the Fund, including: the fair value of derivatives by risk category and the location of those fair values in the Statement of Assets and Liabilities; and the impact of derivative transactions over the period in the Statement of Operations, including realized and unrealized gains (losses). The derivative instrument schedules following the Portfolio of Investments present additional information regarding derivative instruments outstanding at the end of the period, if any.
The following table indicates the effect of derivative instruments (not considered to be hedging instruments for accounting disclosure purposes) in the Statement of Operations for the year ended February 29, 2016:
Amount of Realized Gain (Loss) on Derivatives Recognized in Income | |
Risk Exposure
Category | | Forward Foreign
Currency Exchange
Contracts ($) | | Futures
Contracts ($) | | Total ($) | |
Equity risk | | | — | | | | 171,900 | | | | 171,900 | | |
Foreign exchange
risk | | | 42,973 | | | | — | | | | 42,973 | | |
Total | | | 42,973 | | | | 171,900 | | | | 214,873 | | |
Annual Report 2016
32
COLUMBIA SELECT INTERNATIONAL EQUITY FUND
NOTES TO FINANCIAL STATEMENTS (continued)
February 29, 2016
Change in Unrealized Appreciation (Depreciation) on
Derivatives Recognized in Income | |
Risk Exposure
Category | | Forward Foreign
Currency Exchange
Contracts ($) | | Futures
Contracts ($) | | Total ($) | |
Equity risk | | | — | | | | (320,772 | ) | | | (320,772 | ) | |
Foreign exchange
risk | | | 352,813 | | | | — | | | | 352,813 | | |
Total | | | 352,813 | | | | (320,772 | ) | | | 32,041 | | |
The following table provides a summary of the average outstanding volume by derivative instrument for the year ended February 29, 2016:
Derivative Instrument | | Average Notional
Amounts ($)* | |
Futures contracts — Long | | | 181,278 | | |
Derivative Instrument | | Average
Unrealized
Appreciation ($)* | | Average
Unrealized
Depreciation ($)* | |
Forward foreign currency
exchange contracts | | | 61,141 | | | | (65,407 | ) | |
*Based on the ending daily outstanding amounts for the year ended February 29, 2016.
Security Transactions
Security transactions are accounted for on the trade date. Cost is determined and gains (losses) are based upon the specific identification method for both financial statement and federal income tax purposes.
Income Recognition
Corporate actions and dividend income are generally recorded net of any non-reclaimable tax withholdings, on the ex-dividend date or upon receipt of ex-dividend notification in the case of certain foreign securities.
Awards from class action litigation are recorded as a reduction of cost basis if the Fund still owns the applicable securities on the payment date. If the Fund no longer owns the applicable securities, the proceeds are recorded as realized gains.
Expenses
General expenses of the Trust are allocated to the Fund and other funds of the Trust based upon relative net assets or other expense allocation methodologies determined by the nature of the expense. Expenses directly attributable to the Fund are charged to the Fund. Expenses directly attributable to a specific class of shares are charged to that share class.
Determination of Class Net Asset Value
All income, expenses (other than class-specific expenses, which are charged to that share class, as shown in the Statement of Operations) and realized and unrealized gains (losses) are allocated to each class of the Fund on a daily basis, based on the relative net assets of each class, for purposes of determining the net asset value of each class.
Federal Income Tax Status
The Fund intends to qualify each year as a regulated investment company under Subchapter M of the Internal Revenue Code, as amended, and will distribute substantially all of its taxable income (including net short-term capital gains), if any, for its tax year, and as such will not be subject to federal income taxes. In addition, the Fund intends to distribute in each calendar year substantially all of its net investment income, capital gains and certain other amounts, if any, such that the Fund should not be subject to federal excise tax. Therefore, no federal income or excise tax provision is recorded.
Foreign Taxes
The Fund may be subject to foreign taxes on income, gains on investments or currency repatriation, a portion of which may be recoverable. The Fund will accrue such taxes and recoveries, as applicable, based upon its current interpretation of tax rules and regulations that exist in the markets in which it invests.
Realized gains in certain countries may be subject to foreign taxes at the Fund level, based on statutory rates. The Fund accrues for such foreign taxes on realized and unrealized gains at the appropriate rate for each jurisdiction, as applicable. The amount, if any, is disclosed as a liability on the Statement of Assets and Liabilities.
Distributions to Shareholders
Distributions from net investment income, if any, are declared and paid semi-annually. Net realized capital gains, if any, are distributed at least annually. Income distributions and capital gain distributions are determined in accordance with federal income tax regulations, which may differ from GAAP.
Guarantees and Indemnifications
Under the Trust's organizational documents and, in some cases, by contract, its officers and trustees are indemnified against certain liabilities arising out of the
Annual Report 2016
33
COLUMBIA SELECT INTERNATIONAL EQUITY FUND
NOTES TO FINANCIAL STATEMENTS (continued)
February 29, 2016
performance of their duties to the Trust or its funds. In addition, certain of the Fund's contracts with its service providers contain general indemnification clauses. The Fund's maximum exposure under these arrangements is unknown since the amount of any future claims that may be made against the Fund cannot be determined, and the Fund has no historical basis for predicting the likelihood of any such claims.
Recent Accounting Pronouncement
Fair Value Measurement (Topic 820), Disclosure for Investments in Certain Entities That Calculate Net Asset Value per Share (or Its Equivalent)
In May 2015, FASB issued Accounting Standards Update (ASU) No. 2015-07, Fair Value Measurement (Topic 820), Disclosure for Investments in Certain Entities That Calculate Net Asset Value per Share (or Its Equivalent). ASU No. 2015-07 changes the disclosure requirements for investments for which fair value is measured using the net asset value per share practical expedient. The disclosure requirements are effective for annual periods beginning after December 15, 2015 and interim periods within those fiscal years. At this time, management is evaluating the implications of this guidance and the impact it will have on the financial statement amounts and footnote disclosures, if any.
Note 3. Fees and Other Transactions with Affiliates
Management Fees
Effective July 1, 2015, the Fund entered into a Management Agreement with Columbia Management Investment Advisers, LLC (the Investment Manager), a wholly-owned subsidiary of Ameriprise Financial, Inc. (Ameriprise Financial). Under the Management Agreement, the Investment Manager provides the Fund with investment research and advice, as well as administrative and accounting services. The Investment Manager is responsible for the ultimate oversight of investments made by the Fund. The Fund's subadviser (see Subadvisory Agreement below) has the primary responsibility for the day-to-day portfolio management of the Fund. The management services fee is an annual fee that is equal to a percentage of the Fund's average daily net assets that declines from 0.87% to 0.67% as the Fund's net assets increase. The effective management services fee rate for the year ended February 29, 2016 was 0.87% of the Fund's average daily net assets.
Prior to July 1, 2015, the Fund paid the Investment Manager an annual fee for advisory services under an Investment Management Services Agreement and a separate annual fee for administrative and accounting services under an Administrative Services Agreement. For the period from March 1, 2015 through June 30, 2015, the investment advisory services fee paid to the Investment Manager was $1,683,225, and the administrative services fee paid to the Investment Manager was $170,243.
Subadvisory Agreement
The Investment Manager has entered into a Subadvisory Agreement with Threadneedle International Limited (Threadneedle), an affiliate of the Investment Manager and an indirect wholly-owned subsidiary of Ameriprise Financial, to serve as the subadviser to the Fund. The Investment Manager compensates Threadneedle to manage the investment of the Fund's assets.
Other Expenses
Other expenses are for, among other things, miscellaneous expenses of the Fund or the Board, including payments to Board Services Corp., a company providing limited administrative services to the Fund and the Board. That company's expenses include boardroom and office expense, employee compensation, employee health and retirement benefits, and certain other expenses. For the year ended February 29, 2016, other expenses paid by the Fund to this company were $2,195.
Compensation of Board Members
Board members, who are not officers or employees of the Investment Manager or Ameriprise Financial, are compensated for their services to the Fund as disclosed in the Statement of Operations. Under a Deferred Compensation Plan (the Plan), these Board members may elect to defer payment of up to 100% of their compensation. Deferred amounts are treated as though equivalent dollar amounts had been invested in shares of certain funds managed by the Investment Manager. The Fund's liability for these amounts is adjusted for market value changes and remains in the Fund until distributed in accordance with the Plan. All amounts payable under the Plan constitute a general unsecured obligation of the Fund.
Transfer Agency Fees
Under a Transfer and Dividend Disbursing Agent Agreement, Columbia Management Investment
Annual Report 2016
34
COLUMBIA SELECT INTERNATIONAL EQUITY FUND
NOTES TO FINANCIAL STATEMENTS (continued)
February 29, 2016
Services Corp. (the Transfer Agent), an affiliate of the Investment Manager and a wholly-owned subsidiary of Ameriprise Financial, is responsible for providing transfer agency services to the Fund. The Transfer Agent has contracted with Boston Financial Data Services (BFDS) to serve as sub-transfer agent.
The Transfer Agent receives a monthly transfer agency fee based on the number or the average value of accounts, depending on the type of account. In addition, the Transfer Agent also receives sub-transfer agency fees based on a percentage of the average aggregate value of the Fund's shares maintained in omnibus accounts (other than omnibus accounts for which American Enterprise Investment Services Inc. is the broker of record or accounts where the beneficial shareholder is a customer of Ameriprise Financial Services, Inc., for which the Transfer Agent receives a per account fee). The Transfer Agent pays the fees of BFDS for services as sub-transfer agent and is not entitled to reimbursement for such fees from the Fund (with the exception of out-of-pocket fees).
The Transfer Agent also receives compensation from the Fund for various shareholder services and reimbursements for certain out-of-pocket fees. Total transfer agency fees for Class K and Class R5 shares are subject to an annual limitation of not more than 0.05% of the average daily net assets attributable to each share class. Class I and Class Y shares do not pay transfer agency fees.
For the year ended February 29, 2016, the Fund's effective transfer agency fee rates as a percentage of average daily net assets of each class were as follows:
Class A | | | 0.25 | % | |
Class B | | | 0.25 | | |
Class C | | | 0.25 | | |
Class K | | | 0.05 | | |
Class R | | | 0.25 | | |
Class R4 | | | 0.25 | | |
Class R5 | | | 0.05 | | |
Class W | | | 0.25 | | |
Class Z | | | 0.25 | | |
An annual minimum account balance fee of $20 may apply to certain accounts with a value below the applicable share class's initial minimum investment requirements to reduce the impact of small accounts on transfer agency fees. These minimum account balance fees are remitted to the Fund and recorded as part of
expense reductions in the Statement of Operations. For the year ended February 29, 2016, these minimum account balance fees reduced total expenses of the Fund by $14,642.
Plan Administration Fees
Under a Plan Administration Services Agreement with the Transfer Agent, the Fund pays an annual fee at a rate of 0.25% of the Fund's average daily net assets attributable to Class K shares for the provision of various administrative, recordkeeping, communication and educational services.
Distribution and Service Fees
The Fund has an agreement with Columbia Management Investment Distributors, Inc. (the Distributor), an affiliate of the Investment Manager and a wholly-owned subsidiary of Ameriprise Financial, for distribution and shareholder services. The Board has approved, and the Fund has adopted, distribution and shareholder service plans (the Plans) applicable to certain share classes, which set the distribution and service fees for the Fund. These fees are calculated daily and are intended to compensate the Distributor and/or eligible selling and/or servicing agents for selling shares of the Fund and providing services to investors.
Under the Plans, the Fund pays a monthly combined distribution and service fee to the Distributor at the maximum annual rate of 0.25% of the average daily net assets attributable to Class A shares of the Fund. Also under the Plans, the Fund pays a monthly service fee at the maximum annual rate of 0.25% of the average daily net assets attributable to Class B, Class C and Class W shares of the Fund and a monthly distribution fee at the maximum annual rate of 0.75%, 0.75%, 0.50% and 0.25% of the average daily net assets attributable to Class B, Class C, Class R and Class W shares of the Fund, respectively.
Although the Fund may pay a distribution fee up to 0.25% of the Fund's average daily net assets attributable to Class W shares and a service fee of up to 0.25% of the Fund's average daily net assets attributable to Class W shares, the aggregate fee shall not exceed 0.25% of the Fund's average daily net assets attributable to Class W shares.
Sales Charges
Sales charges, including front-end charges and CDSCs, received by the Distributor for distributing Fund shares
Annual Report 2016
35
COLUMBIA SELECT INTERNATIONAL EQUITY FUND
NOTES TO FINANCIAL STATEMENTS (continued)
February 29, 2016
were $72,626 for Class A, $193 for Class B and $255 for Class C shares for the year ended February 29, 2016.
Expenses Waived/Reimbursed by the Investment Manager and its Affiliates
The Fund's expense ratio is subject to an expense reimbursement arrangement pursuant to which fees will be waived and/or expenses reimbursed (excluding certain fees and expenses described below), so that the Fund's net operating expenses, after giving effect to fees waived/expenses reimbursed and any balance credits and/or overdraft charges from the Fund's custodian, do not exceed the annual rates of:
| | | Contractual
Expense Cap
July 1, 2015
through
June 30, 2016 | | Voluntary
Expense Cap
Prior to
July 1, 2015 | |
Class A | | | 1.42 | % | | | 1.49 | % | |
Class B | | | 2.17 | | | | 2.24 | | |
Class C | | | 2.17 | | | | 2.24 | | |
Class I | | | 0.98 | | | | 1.05 | | |
Class K | | | 1.28 | | | | 1.35 | | |
Class R | | | 1.67 | | | | 1.74 | | |
Class R4 | | | 1.17 | | | | 1.24 | | |
Class R5 | | | 1.03 | | | | 1.10 | | |
Class W | | | 1.42 | | | | 1.49 | | |
Class Y | | | 0.98 | | | | 1.05 | | |
Class Z | | | 1.17 | | | | 1.24 | | |
The contractual agreement may be modified or amended only with approval from the Investment Manager, certain of its affiliates and the Fund. Under the arrangements, the following fees and expenses are excluded from the waiver/reimbursement commitment, and therefore will be paid by the Fund, if applicable: taxes (including foreign transaction taxes), expenses associated with investments in affiliated and non-affiliated pooled investment vehicles (including mutual funds and exchange-traded funds), transaction costs and brokerage commissions, costs related to any securities lending program, dividend and interest expenses associated with securities sold short, inverse floater program fees and expenses, transaction charges and interest on borrowed money, interest and extraordinary expenses. Any fees waived and/or expenses reimbursed under the expense reimbursement arrangements described above are not recoverable by the Investment Manager or its affiliates in future periods.
Note 4. Federal Tax Information
The timing and character of income and capital gain distributions are determined in accordance with income tax regulations, which may differ from GAAP because of temporary or permanent book to tax differences.
At February 29, 2016, these differences are primarily due to differing treatment for capital loss carryforwards, deferral/reversal of wash sale losses, Trustees' deferred compensation, foreign currency transactions, passive foreign investment company (PFIC) holdings, post-October capital losses and proceeds from regulatory settlements. To the extent these differences are permanent, reclassifications are made among the components of the Fund's net assets in the Statement of Assets and Liabilities. Temporary differences do not require reclassifications. In the Statement of Assets and Liabilities the following reclassifications were made:
Undistributed net investment income | | $ | 4,066,625 | | |
Accumulated net realized loss | | | (2,496,320 | ) | |
Paid-in capital | | | (1,570,305 | ) | |
Net investment income (loss) and net realized gains (losses), as disclosed in the Statement of Operations, and net assets were not affected by this reclassification.
For the years ended February 29, 2016 and February 28, 2015, there were no distributions.
At February 29, 2016, the components of distributable earnings on a tax basis were as follows:
Undistributed ordinary income | | $ | 5,609,414 | | |
Capital loss carryforwards | | | (736,919,560 | ) | |
Net unrealized depreciation | | | (22,804,942 | ) | |
At February 29, 2016, the cost of investments for federal income tax purposes was $463,834,377 and the aggregate gross unrealized appreciation and depreciation based on that cost was:
Unrealized appreciation | | $ | 34,173,029 | | |
Unrealized depreciation | | | (56,977,971 | ) | |
Net unrealized depreciation | | | (22,804,942 | ) | |
The following capital loss carryforwards, determined at February 29, 2016, may be available to reduce taxable income arising from future net realized gains on
Annual Report 2016
36
COLUMBIA SELECT INTERNATIONAL EQUITY FUND
NOTES TO FINANCIAL STATEMENTS (continued)
February 29, 2016
investments, if any, to the extent permitted by the Internal Revenue Code:
Year of Expiration | | Amount ($) | |
2017 | | | 183,398,480 | | |
2018 | | | 553,521,080 | | |
Total | | | 736,919,560 | | |
For the year ended February 29, 2016, $46,800,013 of capital loss carryforward was utilized.
Under current tax rules, regulated investment companies can elect to treat certain late-year ordinary losses incurred and post-October capital losses (capital losses realized after October 31) as arising on the first day of the following taxable year. As of February 29, 2016, the Fund will elect to treat post-October capital losses of $17,721,480 as arising on March 1, 2016.
Management of the Fund has concluded that there are no significant uncertain tax positions in the Fund that would require recognition in the financial statements. However, management's conclusion may be subject to review and adjustment at a later date based on factors including, but not limited to, new tax laws, regulations, and administrative interpretations (including relevant court decisions). Generally, the Fund's federal tax returns for the prior three fiscal years remain subject to examination by the Internal Revenue Service.
Note 5. Portfolio Information
The cost of purchases and proceeds from sales of securities, excluding short-term investments and derivatives, if any, aggregated to $728,372,281 and $871,303,166, respectively, for the year ended February 29, 2016. The amount of purchase and sale activity impacts the portfolio turnover rate reported in the Financial Highlights.
Note 6. Regulatory Settlements
During the year ended February 29, 2016, the Fund recorded a receivable of $2,627,180 and during the year ended February 28, 2015, the Fund received $633,636 as a result of regulatory settlement proceedings brought by the Securities and Exchange Commission against an unaffiliated third party relating to market timing and/or late trading of mutual funds. These amounts represented the Fund's portion of the proceeds from the settlements (neither the Fund nor the Investment Manager were a party to the proceeding). The payments have been included in Proceeds from regulatory settlements in the Statement of Changes in Net Assets.
Note 7. Affiliated Money Market Fund
The Fund invests in Columbia Short-Term Cash Fund, an affiliated money market fund established for the exclusive use by the Fund and other affiliated funds. The income earned by the Fund from such investments is included as Dividends — affiliated issuers in the Statement of Operations. As an investing fund, the Fund indirectly bears its proportionate share of the expenses of Columbia Short-Term Cash Fund.
Note 8. Line of Credit
The Fund has access to a revolving credit facility whereby the Fund may borrow for the temporary funding of shareholder redemptions or for other temporary or emergency purposes. Effective December 8, 2015, Citibank, N.A. and HSBC Bank USA, N.A. joined JPMorgan Chase Bank, N.A. (JPMorgan) as lead of a syndicate of banks under the credit facility, which is a collective agreement between the Fund and certain other funds managed by the Investment Manager, severally and not jointly, that permits collective borrowings up to $1 billion. Interest is charged to each participating fund based on its borrowings at a rate equal to the higher of (i) the overnight federal funds rate plus 1.00% or (ii) the one-month LIBOR rate plus 1.00%. Each borrowing under the credit facility matures no later than 60 days after the date of borrowing. The Fund also pays a commitment fee equal to its pro rata share of the amount of the credit facility at a rate of 0.15% per annum. The commitment fee is included in other expenses in the Statement of Operations. Prior to December 8, 2015, JPMorgan was the sole lead bank under the credit facility agreement that permitted borrowings up to $550 million under the same terms and interest rates as described above with the exception of the commitment fee which was charged at a rate of 0.075% per annum.
For the year ended February 29, 2016, the average daily loan balance outstanding on days when borrowing existed was $2,550,000 at a weighted average interest rate of 1.17%. Interest expense incurred by the Fund is recorded as a line of credit interest expense in the Statement of Operations. The Fund had no outstanding borrowings at February 29, 2016.
Note 9. Significant Risks
Shareholder Concentration Risk
At February 29, 2016, affiliated shareholders of record owned 62.1% of the outstanding shares of the Fund in one or more accounts. Subscription and redemption
Annual Report 2016
37
COLUMBIA SELECT INTERNATIONAL EQUITY FUND
NOTES TO FINANCIAL STATEMENTS (continued)
February 29, 2016
activity by concentrated accounts may have a significant effect on the operations of the Fund. In the case of a large redemption, the Fund may be forced to sell investments at inopportune times, including its liquid or more liquid positions, resulting in Fund losses and the Fund holding a higher percentage of less liquid or illiquid securities. Large redemptions could result in decreased economies of scale and increased operating expenses for non-redeeming Fund shareholders.
Foreign Securities and Emerging Market Countries Risk
Investing in foreign securities may include certain risks and considerations not typically associated with investing in U.S. securities, such as fluctuating currency values and changing local and regional economic, political and social conditions, which may result in greater market volatility. In addition, certain foreign securities may not be as liquid as U.S. securities. Investing in emerging markets may accentuate these risks. These countries are also more likely to experience high levels of inflation, deflation or currency devaluation which could hurt their economies and securities markets. To the extent that the Fund concentrates its investment exposure to any one or a few specific countries, the Fund will be particularly susceptible to the various conditions, events or other factors impacting those countries and may, therefore, have a greater risk than that of a fund which is more geographically diversified.
Note 10. Subsequent Events
Management has evaluated the events and transactions that have occurred through the date the financial statements were issued and noted no items requiring adjustment of the financial statements or additional disclosure.
Note 11. Information Regarding Pending and Settled Legal Proceedings
In December 2005, without admitting or denying the allegations, American Express Financial Corporation (AEFC, which is now known as Ameriprise Financial, Inc. (Ameriprise Financial)) entered into settlement agreements with the Securities and Exchange Commission (SEC) and Minnesota Department of Commerce (MDOC) related to market timing activities. As a result, AEFC was censured and ordered to cease and desist from committing or causing any violations of certain provisions of the Investment Advisers Act of 1940, the Investment Company Act of 1940, and various Minnesota laws. AEFC agreed to pay disgorgement of
$10 million and civil money penalties of $7 million. AEFC also agreed to retain an independent distribution consultant to assist in developing a plan for distribution of all disgorgement and civil penalties ordered by the SEC in accordance with various undertakings detailed at http://www.sec.gov/litigation/admin/ia-2451.pdf. Ameriprise Financial and its affiliates have cooperated with the SEC and the MDOC in these legal proceedings, and have made regular reports to the Funds' Boards of Trustees.
Ameriprise Financial and certain of its affiliates have historically been involved in a number of legal, arbitration and regulatory proceedings, including routine litigation, class actions, and governmental actions, concerning matters arising in connection with the conduct of their business activities. Ameriprise Financial believes that the Funds are not currently the subject of, and that neither Ameriprise Financial nor any of its affiliates are the subject of, any pending legal, arbitration or regulatory proceedings that are likely to have a material adverse effect on the Funds or the ability of Ameriprise Financial or its affiliates to perform under their contracts with the Funds. Ameriprise Financial is required to make quarterly (10-Q), annual (10-K) and, as necessary, 8-K filings with the SEC on legal and regulatory matters that relate to Ameriprise Financial and its affiliates. Copies of these filings may be obtained by accessing the SEC website at www.sec.gov.
There can be no assurance that these matters, or the adverse publicity associated with them, will not result in increased fund redemptions, reduced sale of fund shares or other adverse consequences to the Funds. Further, although we believe proceedings are not likely to have a material adverse effect on the Funds or the ability of Ameriprise Financial or its affiliates to perform under their contracts with the Funds, these proceedings are subject to uncertainties and, as such, we are unable to estimate the possible loss or range of loss that may result. An adverse outcome in one or more of these proceedings could result in adverse judgments, settlements, fines, penalties or other relief that could have a material adverse effect on the consolidated financial condition or results of operations of Ameriprise Financial.
Annual Report 2016
38
COLUMBIA SELECT INTERNATIONAL EQUITY FUND
REPORT OF INDEPENDENT REGISTERED PUBLIC ACCOUNTING FIRM
To the Trustees of Columbia Funds Series Trust and the Shareholders of
Columbia Select International Equity Fund (formerly known as Columbia Multi-Advisor International Equity Fund)
In our opinion, the accompanying statement of assets and liabilities, including the portfolio of investments, and the related statements of operations and of changes in net assets and the financial highlights present fairly, in all material respects, the financial position of Columbia Select International Equity Fund (formerly known as Columbia Multi-Advisor International Equity Fund) (the "Fund," a series of Columbia Funds Series Trust) at February 29, 2016, and the results of its operations, the changes in its net assets and the financial highlights for each of the periods indicated, in conformity with accounting principles generally accepted in the United States of America. These financial statements and financial highlights (hereafter referred to as "financial statements") are the responsibility of the Fund's management. Our responsibility is to express an opinion on these financial statements based on our audits. We conducted our audits of these financial statements in accordance with the standards of the Public Company Accounting Oversight Board (United States). Those standards require that we plan and perform the audit to obtain reasonable assurance about whether the financial statements are free of material misstatement. An audit includes examining, on a test basis, evidence supporting the amounts and disclosures in the financial statements, assessing the accounting principles used and significant estimates made by management, and evaluating the overall financial statement presentation. We believe that our audits, which included confirmation of securities at February 29, 2016 by correspondence with the custodian, brokers and transfer agent, provide a reasonable basis for our opinion.
PricewaterhouseCoopers LLP
Minneapolis, MN
April 21, 2016
Annual Report 2016
39
COLUMBIA SELECT INTERNATIONAL EQUITY FUND
FEDERAL INCOME TAX INFORMATION
(Unaudited)
The Fund hereby designates the following tax attributes for the fiscal year ended February 29, 2016. Shareholders will be notified in early 2017 of the amounts for use in preparing 2016 income tax returns.
Tax Designations:
Foreign Taxes Paid | | $ | 934,706 | | |
Foreign Taxes Paid Per Share | | $ | 0.02 | | |
Foreign Source Income | | $ | 14,014,590 | | |
Foreign Source Income Per Share | | $ | 0.36 | | |
Foreign Taxes. The Fund makes the election to pass through to shareholders the foreign taxes paid. Eligible shareholders may claim a foreign tax credit. These taxes, and the corresponding foreign source income, are provided.
Annual Report 2016
40
COLUMBIA SELECT INTERNATIONAL EQUITY FUND
Shareholders elect the Board that oversees the Fund's operations. The Board appoints officers who are responsible for day-to-day business decisions based on policies set by the Board. The following table provides basic biographical information about the Fund's Trustees, including their principal occupations during the past five years, although specific titles for individuals may have varied over the period. Under current Board policy, members generally may serve through the end of the calendar year in which they reach either the mandatory retirement age established by the Board or the fifteenth anniversary of the first Board meeting they attended as a member of the Board.
Trustees
Independent Trustees
Name,
Address,
Year of Birth | | Position Held With
the Funds and Length of
Service | | Principal Occupation(s)
During the Past Five Years
and Other Relevant
Professional Experience | | Number of
Funds in the
Columbia
Funds Complex
Overseen | | Other Directorships
Held by Trustee
During the Past
Five Years | |
Kathleen Blatz
901 S. Marquette Ave.
Minneapolis, MN 55402
1954 | | Trustee since 1/06 for RiverSource Funds and since 6/11 for Nations Funds | | Attorney; specializing in arbitration and mediation; Chief Justice, Minnesota Supreme Court, 1998-2006; Associate Justice, Minnesota Supreme Court, 1996-1998; Fourth Judicial District Court Judge, Hennepin County, 1994-1996; Attorney in private practice and public service, 1984-1993; State Representative, Minnesota House of Representatives, 1979-1993, which included service on the Tax and Financial Institutions and Insurance Committees | | | 124 | | | Trustee, BlueCross BlueShield of Minnesota (Chair of the Business Development Committee) since 2009; Chair of the Robina Foundation since August 2013 | |
Edward J. Boudreau, Jr.
901 S. Marquette Ave.
Minneapolis, MN 55402
1944 | | Trustee since 6/11 for RiverSource Funds and since 1/05 for Nations Funds | | Managing Director, E.J. Boudreau & Associates (consulting) since 2000; FINRA Industry Arbitrator, 2002-present; Chairman and Chief Executive Officer, John Hancock Funds (asset management), Chairman and Interested Trustee for open-end and closed-end funds offered by John Hancock, 1989-2000; John Hancock Life Insurance Company, including SVP and Treasurer and SVP Information Technology, 1968-1988 | | | 122 | | | Former Trustee, Boston Museum of Science (Chair of Finance Committee), 1985-2013; former Trustee, BofA Funds Series Trust (11 funds), 2005-2011 | |
Pamela G. Carlton
901 S. Marquette Ave.
Minneapolis, MN 55402
1954 | | Trustee since 7/07 for RiverSource Funds and since 6/11 for Nations Funds | | President, Springboard-Partners in Cross Cultural Leadership (consulting company) since 2003; Managing Director of US Equity Research, JP Morgan Chase, 1999-2003; Director of US Equity Research, Chase Asset Management, 1996-1999; Co-Director Latin America Research, 1993-1996, COO Global Research, 1992-1996, Co-Director of US Research, 1991-1992, Investment Banker, Morgan Stanley, 1982-1991 | | | 124 | | | Trustee, New York Presbyterian Hospital Board (Executive Committee and Chair of Human Resources Committee) since 1996 | |
Annual Report 2016
41
COLUMBIA SELECT INTERNATIONAL EQUITY FUND
TRUSTEES AND OFFICERS (continued)
Independent Trustees (continued)
Name,
Address,
Year of Birth | | Position Held With
the Funds and Length of
Service | | Principal Occupation(s)
During the Past Five Years
and Other Relevant
Professional Experience | | Number of
Funds in the
Columbia
Funds Complex
Overseen | | Other Directorships
Held by Trustee
During the Past
Five Years | |
William P. Carmichael
901 S. Marquette Ave.
Minneapolis, MN 55402
1943 | | Trustee since 6/11 for RiverSource Funds and since 2003 for Nations Funds; Chair of the Board from 1/14-11/15 | | Retired; Co-founder, The Succession Fund (provides exit strategies to owners of privately held companies), 1998-2007; Adjunct Professor of Finance, Kelley School of Business, Indiana University, 1993-2007; Senior Vice President, Sara Lee Corporation, 1991-1993; Senior Vice President and Chief Financial Officer, Beatrice Foods Company, 1984-1990; Vice President, Esmark, Inc., 1973-1984; Associate, Price Waterhouse, 1968-1972 | | | 124 | | | Director, The Finish Line (athletic shoes and apparel) since July 2003; Director, International Textile Corp. since 2012; Director, hhgregg since May, 2015; former Director, Cobra Electronics Corporation (electronic equipment manufacturer), 1994-August 2014; former Director, Spectrum Brands, Inc. (consumer products), 2002-2009; former Director, Simmons Company (bedding), 2004-2010; former Trustee, BofA Funds Series Trust (11 funds), 2009-2011; former Director, McMoRan Exploration Company (oil and gas exploration and development), 2010-2013 | |
Patricia M. Flynn
901 S. Marquette Ave.
Minneapolis, MN 55402
1950 | | Trustee since 11/04 for RiverSource Funds and since 6/11 for Nations Funds | | Trustee Professor of Economics and Management, Bentley University since 1976 (also teaches and conducts research on corporate governance); Dean, McCallum Graduate School of Business, Bentley University, 1992-2002 | | | 124 | | | Trustee, MA Taxpayers Foundation since 1997; Board of Governors, Innovation Institute, MA Technology Collaborative since 2010 | |
William A. Hawkins
901 S. Marquette Ave.
Minneapolis, MN 55402
1942 | | Chair of the Board since 11/15; Trustee since 6/11 for RiverSource Funds and since 1/05 for Nations Funds | | Managing Director, Overton Partners (financial consulting) since August 2010; President and Chief Executive Officer, California General Bank, N.A., January 2008-August 2010; Operation Hope, COO, 2004-2007; IndyMac Bancorp, President, CBG, 1999-2003; American General Bank, President, 1997-1999; Griffin Financial Services, CEO, 1981-1997; The Griffin Funds, CEO, 1992-1998 | | | 124 | | | Former Trustee, BofA Funds Series Trust (11 funds), 2009-2015 | |
R. Glenn Hilliard
901 S. Marquette Ave.
Minneapolis, MN 55402
1943 | | Trustee since 6/11 for RiverSource Funds and since 1/05 for Nations Funds | | Chairman and Chief Executive Officer, Hilliard Group LLC (investing and consulting) since April 2003; Non-Executive Director & Chairman, CNO Financial Group, Inc. (insurance), 2003-2011; Chair & CEO, ING Americas, 1996-2003 | | | 122 | | | Chairman, BofA Funds Series Trust (11 funds); former Director, CNO Financial Group, Inc. (insurance), 2003-2011 | |
Annual Report 2016
42
COLUMBIA SELECT INTERNATIONAL EQUITY FUND
TRUSTEES AND OFFICERS (continued)
Independent Trustees (continued)
Name,
Address,
Year of Birth | | Position Held With
the Funds and Length of
Service | | Principal Occupation(s)
During the Past Five Years
and Other Relevant
Professional Experience | | Number of
Funds in the
Columbia
Funds Complex
Overseen | | Other Directorships
Held by Trustee
During the Past
Five Years | |
Catherine James Paglia
901 S. Marquette Ave.
Minneapolis, MN 55402
1952 | | Trustee since 11/04 for RiverSource Funds and since 6/11 for Nations Funds | | Director, Enterprise Asset Management, Inc. (private real estate and asset management company) since September 1998; Managing Director and Partner, Interlaken Capital, Inc., 1989-1997; Managing Director, Morgan Stanley, 1982-1989; Vice President, Investment Banking, 1980-1982, Associate, Investment Banking, 1976-1980, Dean Witter Reynolds, Inc. | | | 124 | | | Director, Valmont Industries, Inc. (irrigation systems manufacturer) since 2012; Trustee, Carleton College (on the Investment Committee); Trustee, Carnegie Endowment for International Peace (on the Investment Committee) | |
Leroy C. Richie
901 S. Marquette Ave.
Minneapolis, MN 55402
1941 | | Trustee since 2000 for Seligman Funds, since 11/08 for RiverSource Funds and since 6/11 for Nations Funds | | Counsel, Lewis & Munday, P.C. (law firm) since 2004; Vice President and General Counsel, Automotive Legal Affairs, Chrysler Corporation, 1993-1997 | | | 122 | | | Lead Outside Director, Infinity Resources, Inc. (oil and gas exploration and production) since 1994; Lead Outside Director, Digital Ally, Inc. (digital imaging) since September 2005; Trustee, Marygrove College (Chair of Finance Committee) since 2007; former Director, OGE Energy Corp. (energy and energy services), 2007-2014 | |
Minor M. Shaw
901 S. Marquette Ave.
Minneapolis, MN 55402
1947 | | Trustee since 6/11 for RiverSource Funds and since 2003 for Nations Funds | | President, Micco LLC (private investments) since 2011; President, Micco Corp. (family investment business), 1998-2011 | | | 124 | | | Director, Piedmont Natural Gas; Director, BlueCross BlueShield of South Carolina since April 2008; Chair of the Duke Endowment; Director, National Association of Corporate Directors, Carolinas Chapter since 2013; Chair of Greenville — Spartanburg Airport Commission; former Trustee, BofA Funds Series Trust (11 funds), 2003-2011 | |
Alison Taunton-Rigby
901 S. Marquette Ave.
Minneapolis, MN 55402
1944 | | Trustee since 11/02 for RiverSource Funds and since 6/11 for Nations Funds | | Managing Director, Forester Biotech (consulting), 2001-2003; Chief Executive Officer and Director, RiboNovix, Inc., (biotechnology), 2003-2010; President and Chief Executive Officer of CMT Inc., 2001-2003; Aquila Biopharmaceuticals Inc., 1996-2000; Cambridge Biotech Corporation, 1995-1996; Mitotix Inc., 1993-1994 | | | 124 | | | Director, Abt Associates (government contractor) since 2001; Director, Boston Children's Hospital since 2002; Director, Healthways, Inc. (health and well-being solutions) since 2005; Director, ICI Mutual Insurance Company since 2011 | |
Annual Report 2016
43
COLUMBIA SELECT INTERNATIONAL EQUITY FUND
TRUSTEES AND OFFICERS (continued)
Interested Trustee Not Affiliated with Investment Manager*
Name,
Address,
Year of Birth | | Position Held With
Funds and Length of
Service | | Principal Occupation(s)
During Past Five Years
and Other Relevant
Professional Experience | | Number of
Funds in the
Fund Family
Overseen by
Board Member | | Other Present or Past
Directorships/
Trusteeships
(Within Past 5 Years) | |
Anthony M. Santomero
901 S. Marquette Ave.
Minneapolis, MN 55402
1946 | | Trustee since 6/11 for RiverSource Funds and since 1/08 for Nations Funds | | Richard K. Mellon Professor Emeritus of Finance, The Wharton School, University of Pennsylvania since 2002; Senior Advisor, McKinsey & Company (consulting), 2006-2008; President, Federal Reserve Bank of Philadelphia, 2000-2006; Professor of Finance, The Wharton School, University of Pennsylvania, 1972-2002 | | | 122 | | | Trustee, Penn Mutual Life Insurance Company since March 2008; Director, Renaissance Reinsurance Ltd. since May 2008; Director, Citigroup Inc. since 2009; Director, Citibank, N.A. since 2009; former Trustee, BofA Funds Series Trust (11 funds), 2008-2011 | |
* Dr. Santomero is not an affiliated person of the Investment Manager or Ameriprise Financial. However, he is currently deemed by the Funds to be an "interested person" (as defined in the 1940 Act) of the Funds because he serves as a Director of Citigroup Inc. and Citibank, N.A., companies that may directly or through subsidiaries and affiliates engage from time-to-time in brokerage execution, principal transactions and lending relationships with the Funds or accounts advised/managed by the Investment Manager.
Annual Report 2016
44
COLUMBIA SELECT INTERNATIONAL EQUITY FUND
TRUSTEES AND OFFICERS (continued)
Interested Trustee Affiliated with Investment Manager*
Name,
Address,
Year of Birth | | Position Held With
the Funds and Length of
Service | | Principal Occupation(s)
During Past Five Years
and Other Relevant
Professional Experience | | Number of
Funds in the
Columbia
Funds Complex
Overseen | | Other Directorships
Held by Trustee
During the Past
Five Years | |
William F. Truscott
c/o Columbia Management Investment Advisers, LLC,
225 Franklin St.
Boston, MA 02110
1960 | | Trustee since 11/01 for RiverSource Funds and since 6/11 for Nations Funds; Senior Vice President since 2002 for RiverSource Funds and since 5/10 for Nations Funds | | Chairman of the Board and President, Columbia Management Investment Advisers, LLC since May 2010 and February 2012, respectively (previously President and Chief Investment Officer, 2001-April 2010); Chief Executive Officer, Global Asset Management, Ameriprise Financial, Inc. since September 2012 (previously Chief Executive Officer, U.S. Asset Management & President, Annuities, May 2010-September 2012 and President — U.S. Asset Management and Chief Investment Officer, 2005-April 2010); Director and Chief Executive Officer, Columbia Management Investment Distributors, Inc. since May 2010 and February 2012, respectively (previously Chairman of the Board and Chief Executive Officer, 2006-April 2010); Chairman of the Board and Chief Executive Officer, RiverSource Distributors, Inc. since 2006; Director, Threadneedle Asset Management Holdings, SARL since 2014; President and Chief Executive Officer, Ameriprise Certificate Company, 2006-August 2012. | | | 182 | | | Chairman of the Board, Columbia Management Investment Advisers, LLC since May 2010; Director, Columbia Management Investment Distributors, Inc. since May 2010; Former Director, Ameriprise Certificate Company, 2006-January 2013 | |
* Interested person (as defined under the 1940 Act) by reason of being an officer, director, security holder and/or employee of the Investment Manager or Ameriprise Financial.
The Statement of Additional Information has additional information about the Fund's Board members and is available, without charge, upon request by calling 800.345.6611; contacting your financial intermediary; or visiting columbiathreadneedle.com/us.
Annual Report 2016
45
COLUMBIA SELECT INTERNATIONAL EQUITY FUND
TRUSTEES AND OFFICERS (continued)
The Board has appointed officers who are responsible for day-to-day business decisions based on policies it has established. The officers serve at the pleasure of the Board. The following table provides basic information about the Officers of the Fund, including principal occupations during the past five years, although their specific titles may have varied over the period. In addition to Mr. Truscott, who is Senior Vice President, the Fund's other officers are:
Fund Officers
Name,
Address and
Year of Birth | | Position and Year
First Appointed to
Position for any Fund
in the Columbia
Funds Complex or a
Predecessor Thereof | | Principal Occupation(s) During Past Five Years | |
Christopher O. Petersen
5228 Ameriprise
Financial Center
Minneapolis, MN 55474
Born 1970 | | President and Principal Executive Officer (2015) | | Vice President and Lead Chief Counsel, Ameriprise Financial, Inc. since January 2015 (previously, Vice President and Chief Counsel January 2010-December 2014; and Vice President and Group Counsel or Counsel 2004-January 2010); officer of Columbia Funds and affiliated funds since 2007. | |
Michael G. Clarke
225 Franklin Street
Boston, MA 02110
Born 1969 | | Treasurer (2011), Chief Financial Officer (2009) and Chief Accounting Officer (2015) | | Vice President — Mutual Fund Administration, Columbia Management Investment Advisers, LLC, since May 2010; Managing Director of Fund Administration, Columbia Management Advisors, LLC, September 2004-April 2010; senior officer of Columbia Funds and affiliated funds since 2002. | |
Paul B. Goucher
100 Park Avenue
New York, NY 10017
Born 1968 | | Senior Vice President (2011), Chief Legal Officer (2015) and Assistant Secretary (2008) | | Vice President and Lead Chief Counsel, Ameriprise Financial, Inc. since November 2008 and January 2013, respectively (previously Chief Counsel, January 2010-January 2013 and Group Counsel, November 2008-January 2010). | |
Thomas P. McGuire
225 Franklin Street
Boston, MA 02110
Born 1972 | | Senior Vice President and Chief Compliance Officer (2012) | | Vice President — Asset Management Compliance, Ameriprise Financial, Inc., since May 2010; Chief Compliance Officer, Ameriprise Certificate Company since September 2010; Compliance Executive, Bank of America, 2005-April 2010. | |
Colin Moore
225 Franklin Street
Boston, MA 02110
Born 1958 | | Senior Vice President (2010) | | Executive Vice President and Global Chief Investment Officer, Ameriprise Financial, Inc., since July 2013; Director and Global Chief Investment Officer, Columbia Management Investment Advisers, LLC since May 2010; Manager, Managing Director and Chief Investment Officer, Columbia Management Advisors, LLC, 2007-April 2010. | |
Michael E. DeFao
225 Franklin Street
Boston, MA 02110
Born 1968 | | Vice President (2011) and Assistant Secretary (2010) | | Vice President and Chief Counsel, Ameriprise Financial, Inc. since May 2010; Associate General Counsel, Bank of America, 2005-April 2010. | |
Amy Johnson
5228 Ameriprise
Financial Center
Minneapolis, MN 55474
Born 1965 | | Vice President (2006) | | Managing Director and Chief Operating Officer, Columbia Management Investment Advisers, LLC since May 2010 (previously Chief Administrative Officer, 2009-April 2010, and Vice President — Asset Management and Trust Company Services, 2006-2009). | |
Lyn Kephart-Strong
5228 Ameriprise
Financial Center
Minneapolis, MN 55474
Born 1960 | | Vice President (2015) | | President, Columbia Management Investment Services Corp. since October 2014; Vice President & Resolution Officer, Ameriprise Trust Company since August 2009; President, RiverSource Service Corporation 2004-2010. | |
Ryan C. Larrenaga
225 Franklin Street
Boston, MA 02110
Born 1970 | | Vice President and Secretary (2015) | | Vice President and Group Counsel, Ameriprise Financial, Inc. since August 2011 (previously, Counsel from May 2010 to August 2011); Assistant General Counsel, Bank of America, 2005-April 2010; officer of Columbia Funds and affiliated funds since 2005. | |
Annual Report 2016
46
COLUMBIA SELECT INTERNATIONAL EQUITY FUND
IMPORTANT INFORMATION ABOUT THIS REPORT
Each fund mails one shareholder report to each shareholder address. If you would like more than one report, please call shareholder services at 800.345.6611 and additional reports will be sent to you.
The policy of the Board is to vote the proxies of the companies in which each fund holds investments consistent with the procedures as stated in the Statement of Additional Information (SAI). You may obtain a copy of the SAI without charge by calling 800.345.6611; contacting your financial intermediary; visiting columbiathreadneedle.com/us; or searching the website of the Securities and Exchange Commission (SEC) at sec.gov. Information regarding how each fund voted proxies relating to portfolio securities is filed with the SEC by August 31st for the most recent 12-month period ending June 30th of that year, and is available without charge by visiting columbiathreadneedle.com/us, or searching the website of the SEC at sec.gov.
Each fund files a complete schedule of portfolio holdings with the SEC for the first and third quarters of each fiscal year on Form N-Q. Each fund's Form N-Q is available on the SEC's website at sec.gov and may be reviewed and copied at the SEC's Public Reference Room in Washington, D.C. Information on the operation of the Public Reference Room may be obtained by calling 800.SEC.0330. Each fund's complete schedule of portfolio holdings, as filed on Form N-Q, can also be obtained without charge, upon request, by calling 800.345.6611.
Annual Report 2016
47
Columbia Select International Equity Fund
P.O. Box 8081
Boston, MA 02266-8081

This information is for use with concurrent or prior delivery of a fund prospectus. Please read and consider the investment objectives, risks, charges and expenses for any fund carefully before investing. For a prospectus and summary prospectus, which contains this and other important information about the Fund, go to columbiathreadneedle.com/us. The Fund is distributed by Columbia Management Investment Distributors, Inc., member FINRA, and managed by Columbia Management Investment Advisers, LLC.
Columbia Threadneedle Investments (Columbia Threadneedle) is the global brand name of the Columbia and Threadneedle group of companies.
All rights reserved. Columbia Management Investment Distributors, Inc., 225 Franklin Street, Boston, MA 02110-2804
© 2016 Columbia Management Investment Advisers, LLC.
columbiathreadneedle.com/us
ANN201_02_F01_(04/16)

ANNUAL REPORT
February 29, 2016

COLUMBIA SMALL CAP VALUE FUND II

ABOUT COLUMBIA THREADNEEDLE INVESTMENTS
Columbia Threadneedle Investments is a leading global asset management group that provides a broad range of actively managed investment strategies and solutions for individual, institutional and corporate clients around the world.
With more than 2,000 people, including over 450 investment professionals based in North America, Europe and Asia, we manage $472 billion* of assets across developed and emerging market equities, fixed income, asset allocation solutions and alternatives. We are the 13th largest manager of long-term mutual fund assets in the U.S.** and the 4th largest manager of retail funds in the U.K.***
Our priority is the investment success of our clients. We aim to deliver the investment outcomes they expect through an investment approach that is team-based, performance-driven and risk-aware. Our culture is dynamic and interactive. By sharing our insights across asset classes and geographies, we generate richer perspectives on global, regional and local investment landscapes. The ability to exchange and debate investment ideas in a collaborative environment enriches our teams' investment processes. More importantly, it results in better informed investment decisions for our clients.
Columbia funds are distributed by Columbia Management Investment Distributors, Inc., member FINRA, and managed by Columbia Management Investment Advisers, LLC.
Columbia Threadneedle Investments (Columbia Threadneedle) is the global brand name of the Columbia and Threadneedle group of companies.
* In U.S. dollars as of December 31, 2015. Source: Ameriprise Q4 Earnings Release. Includes all assets managed by entities in the Columbia and Threadneedle groups of companies. Contact us for more current data.
** Source: ICI as of December 31, 2015 for Columbia Management Investment Advisers, LLC.
*** Source: Investment Association as of September 2015 for Threadneedle Asset Management Limited.
© 2016 Columbia Management Investment Advisers, LLC. All rights reserved.
Not part of the shareholder report
Investment strategies to help meet investor needs
We are committed to helping investors navigate financial challenges to reach their desired outcomes. The possibilities are endless.
Your success is our priority.
Retire comfortably
Fund college or higher education
Leave a legacy
Generate an appropriate stream of income in retirement
Traditional approaches to income may no longer be adequate — and they may no longer provide the diversification benefits they once did. Investors need to rethink how they generate retirement income.
Worried about running out of income? You are not alone.
Navigate a changing interest rate environment
Even in today's challenging interest rate environment, it's still possible to navigate markets and achieve your goals.
Make investment choices designed specifically for this market environment.
Maximize after-tax returns
In an environment where what you keep is more important than what you earn, municipal bonds can help mitigate higher taxes while providing attractive yields compared to other investment options.
You've worked too hard building your wealth to lose it to taxes.
Grow assets to achieve financial goals
Finding growth opportunities in today's complex market environment requires strong research capabilities, creative thinking and a disciplined approach.
Do your investments deliver the portfolio growth you need?
Ease the impact of volatile markets
With increasing concerns about market volatility, investors should consider diversifying their portfolios with non-traditional holdings.
Interested in turning volatility into opportunity?
To find out more, contact your financial professional, call 800.426.3750 or visit columbiathreadneedle.com/us
Not part of the shareholder report
Get the market insight you need from our investment experts and subscribe to our latest publications
Stay informed with Columbia Threadneedle Investments
Investor insight
Find economic and market commentary, investment videos, white papers, mutual fund commentary and more at columbiathreadneedle.com/us.
Subscribe to the latest information from Columbia Threadneedle. Register your information online at columbiathreadneedle.com/us/subscribe and select the publications you would like to receive, including:
n Columbia Threadneedle Investor Newsletter, highlighting the latest macro- and micro-economic trends, investment themes, products, service changes and other items of interest to our investors
n Investment Strategy Outlook, showcasing the Columbia Threadneedle Asset Allocation Team's perspective on global economic investment conditions and markets
n MarketTrack, featuring straightforward insight on current investment opportunities
n White papers that delve deep into a variety of investment topics
n Quarterly portfolio manager commentary and fund fact sheets
Update your subscriptions at any time by accessing the email subscription center.
Social media
We offer you multiple ways to access our market commentary and investment insights.
n Perspectives blog at columbiathreadneedle.com/us
Read timely posts by our investment team, including our chief investment officer, chief economist and portfolio managers.
n Twitter.com/CTinvest_US
Follow us on Twitter for quick, up-to-the-minute comments on market news and more.
n Youtube.com/CTInvestUS
View our commentaries on the economy, markets and current investment opportunities.
n Linkedin.com/company/Columbia-Threadneedle-Investments-US
Connect with us on LinkedIn for updates from our thought leaders.
Not part of the shareholder report
 Dear Shareholder,
Today's investors are typically focused on outcomes, like living a certain retirement lifestyle, paying for college education or building a legacy. But in today's complex global investment landscape, even simple goals are not easily achieved.
At Columbia Threadneedle Investments, we aspire to help satisfy five core needs of today's investors:
n Generate an appropriate stream of income in retirement
Traditional approaches to generating income may not provide the diversification benefits they once did, and they may actually introduce unwanted risk in today's market. To seek to improve your potential to live comfortably long term, we endeavor to pursue investments that explore less traveled paths to income.
n Navigate a changing interest rate environment
Today's uncertain market environment includes the prospect of a rise in interest rates. Blending traditional investments with non-traditional or alternative products may help protect your wealth during periods of volatility. We can attempt to help strengthen your portfolio with agile products designed to take on the market's ups and downs.
n Maximize after-tax returns
In an environment where what you keep may be more important than what you earn, municipal bonds can help mitigate high tax burdens while providing potentially attractive yields. Our state and federal tax-exempt products are aimed at helping investors manage risk, minimize the fluctuation of capital and grow wealth on a more tax-efficient basis.
n Grow assets to achieve financial goals
We believe that finding and protecting growth comes from a disciplined security selection process designed to create excess return. Our goal is to provide investment solutions built to help you face today's market challenges and grow your assets at each crossroad of your journey.
n Ease the impact of volatile markets
Despite a bull market run that has benefited many investors over the past several years, it's important to remember the lessons of 2008 and the value that a well-diversified portfolio may provide through times of market volatility. We are here to help you hold onto the savings you have worked tirelessly to amass, and to provide you the best opportunity to maintain your standard of living regardless of market conditions.
Find out today how we can help you confidently invest to realize your dreams. Please visit us at blog.columbiathreadneedleus.com/our-best-ideas to learn more about our unique investment solutions.
The world is constantly changing, but our priority remains the same: to help you secure your finances, meet your goals and achieve success. Thank you for your continued investment with us.
Sincerely,

Christopher O. Petersen
President, Columbia Funds
Investors should consider the investment objectives, risks, charges and expenses of a mutual fund carefully before investing. For a free prospectus and summary prospectus, which contains this and other important information about a fund, visit columbiathreadneedle.com/us. The prospectus should be read carefully before investing.
Columbia Funds are distributed by Columbia Management Investment Distributors, Inc., member FINRA, and managed by Columbia Management Investment Advisers, LLC.
© 2016 Columbia Management Investment Advisers, LLC. All rights reserved.
COLUMBIA SMALL CAP VALUE FUND II
Fund Investment Manager
Columbia Management Investment
Advisers, LLC
225 Franklin Street
Boston, MA 02110
Fund Distributor
Columbia Management Investment
Distributors, Inc.
225 Franklin Street
Boston, MA 02110
Fund Transfer Agent
Columbia Management Investment
Services Corp.
P.O. Box 8081
Boston, MA 02266-8081
For more information about any of the funds, please visit columbiathreadneedle.com/us or call 800.345.6611. Customer Service Representatives are available to answer your questions Monday through Friday from 8 a.m. to 7 p.m. Eastern time.
The views expressed in this report reflect the current views of the respective parties. These views are not guarantees of future performance and involve certain risks, uncertainties and assumptions that are difficult to predict, so actual outcomes and results may differ significantly from the views expressed. These views are subject to change at any time based upon economic, market or other conditions and the respective parties disclaim any responsibility to update such views. These views may not be relied on as investment advice and, because investment decisions for a Columbia fund are based on numerous factors, may not be relied on as an indication of trading intent on behalf of any particular Columbia fund. References to specific securities should not be construed as a recommendation or investment advice.
Performance Overview | | | 3 | | |
Manager Discussion of Fund Performance | | | 5 | | |
Understanding Your Fund's Expenses | | | 7 | | |
Portfolio of Investments | | | 8 | | |
Statement of Assets and Liabilities | | | 13 | | |
Statement of Operations | | | 15 | | |
Statement of Changes in Net Assets | | | 16 | | |
Financial Highlights | | | 19 | | |
Notes to Financial Statements | | | 28 | | |
Report of Independent Registered Public Accounting Firm | | | 35 | | |
Federal Income Tax Information | | | 36 | | |
Trustees and Officers | | | 37 | | |
Important Information About This Report | | | 43 | | |
COLUMBIA SMALL CAP VALUE FUND II
Performance Summary
n Columbia Small Cap Value Fund II (the Fund) Class A shares returned -10.48% excluding sales charges for the 12-month period that ended February 29, 2016.
n Despite a difficult period for stocks worldwide, and particularly for small-cap value stocks, the Fund outperformed its benchmark, the Russell 2000 Value Index, which returned -13.35% for the same time period.
n Stock selection, especially in the utilities and health care sectors, generally accounted for the Fund's performance advantage over its benchmark.
Average Annual Total Returns (%) (for period ended February 29, 2016)
| | | Inception | | 1 Year | | 5 Years | | 10 Years | |
Class A | | 05/01/02 | | | | | | | |
Excluding sales charges | | | | | | | -10.48 | | | | 6.34 | | | | 5.36 | | |
Including sales charges | | | | | | | -15.61 | | | | 5.09 | | | | 4.73 | | |
Class B | | 05/01/02 | | | | | | | |
Excluding sales charges | | | | | | | -11.17 | | | | 5.55 | | | | 4.56 | | |
Including sales charges | | | | | | | -15.10 | | | | 5.26 | | | | 4.56 | | |
Class C | | 05/01/02 | | | | | | | |
Excluding sales charges | | | | | | | -11.18 | | | | 5.55 | | | | 4.57 | | |
Including sales charges | | | | | | | -11.96 | | | | 5.55 | | | | 4.57 | | |
Class I* | | 09/27/10 | | | -10.05 | | | | 6.85 | | | | 5.64 | | |
Class R | | 01/23/06 | | | -10.73 | | | | 6.07 | | | | 5.09 | | |
Class R4* | | 11/08/12 | | | -10.22 | | | | 6.53 | | | | 5.45 | | |
Class R5* | | 11/08/12 | | | -10.10 | | | | 6.63 | | | | 5.50 | | |
Class Y* | | 11/08/12 | | | -10.05 | | | | 6.66 | | | | 5.52 | | |
Class Z | | 05/01/02 | | | -10.22 | | | | 6.63 | | | | 5.63 | | |
Russell 2000 Value Index | | | | | | | -13.35 | | | | 5.27 | | | | 4.08 | | |
Returns for Class A are shown with and without the maximum initial sales charge of 5.75%. Returns for Class B are shown with and without the applicable contingent deferred sales charge (CDSC) of 5.00% in the first year, declining to 1.00% in the sixth year and eliminated thereafter. Returns for Class C are shown with and without the 1.00% CDSC for the first year only. The Fund's other classes are not subject to sales charges and have limited eligibility. Please see the Fund's prospectus for details. Performance for different share classes will vary based on differences in sales charges and fees associated with each class. All results shown assume reinvestment of distributions during the period. Returns do not reflect the deduction of taxes that a shareholder may pay on Fund distributions or on the redemption of Fund shares. Performance results reflect the effect of any fee waivers or reimbursements of Fund expenses by Columbia Management Investment Advisers, LLC and/or any of its affiliates. Absent these fee waivers or expense reimbursement arrangements, performance results would have been lower.
The performance information shown represents past performance and is not a guarantee of future results. The investment return and principal value of your investment will fluctuate so that your shares, when redeemed, may be worth more or less than their original cost. Current performance may be lower or higher than the performance information shown. You may obtain performance information current to the most recent month-end by contacting your financial intermediary, visiting columbiathreadneedle.com/us or calling 800.345.6611.
*The returns shown for periods prior to the share class inception date (including returns for the Life of the Fund, if shown, which are since Fund inception) include the returns of the Fund's oldest share class. Since the Fund launched more than one share class at its inception, Class A shares were used. These returns are adjusted to reflect any higher class-related operating expenses of the newer share classes, as applicable. Please visit columbiathreadneedle.com/us/investment-products/mutual-funds/appended-performance for more information.
The Russell 2000 Value Index, an unmanaged index, tracks the performance of those Russell 2000 Index companies with lower price-to-book ratios and lower forecasted growth values.
Indices are not available for investment, are not professionally managed and do not reflect sales charges, fees, brokerage commissions, taxes or other expenses of investing. Securities in the Fund may not match those in an index.
Annual Report 2016
3
COLUMBIA SMALL CAP VALUE FUND II
PERFORMANCE OVERVIEW (continued)
Performance of a Hypothetical $10,000 Investment (March 1, 2006 – February 29, 2016)
The chart above shows the change in value of a hypothetical $10,000 investment in Class A shares of Columbia Small Cap Value Fund II during the stated time period, and does not reflect the deduction of taxes that a shareholder may pay on Fund distributions or on the redemption of Fund shares.
Annual Report 2016
4
COLUMBIA SMALL CAP VALUE FUND II
MANAGER DISCUSSION OF FUND PERFORMANCE
For the 12-month period that ended February 29, 2016, the Fund's Class A shares returned -10.48% excluding sales charges. Despite a difficult market for stocks worldwide, and for small-cap value stocks in particular, the Fund outperformed its benchmark, the Russell 2000 Value Index, which returned -13.35% for the same time period. Stock selection, especially in the utilities and health care sectors, generally accounted for the Fund's performance advantage over its benchmark.
Mounting Global Pressures Weighed on Markets
Around the world, investors turned cautious over the 12-month period that ended February 29, 2016, as lackluster economic growth, contentious geopolitical conflicts and a shift in U.S. monetary policy weighed on confidence. Subpar global economic growth continued for a fourth straight year, with China's slowdown heading the list of disappointments. Conflicts in the Middle East and terrorism, both at home and abroad, heightened security fears. Plummeting oil prices and a rising U.S. dollar rounded the list of mounting pressures. A widening trade deficit also took a significant bite out of U.S. growth.
Despite these setbacks, the U.S. economy continued to expand for the seventh consecutive year. U.S. labor markets recovered and consumer spending strengthened. The housing market inched forward, although sales slipped near the end of the period as new industry regulation led to longer closing periods. Manufacturing activity softened, putting a damper on growth.
Modest stock market gains in the first half of the period were wiped out in the second half. The S&P 500 Index, a broad measure of U.S. stock market performance, returned -6.19%, including dividends. Large-cap stocks held up better than mid- and small-cap stocks and growth stocks outperformed value stocks. Small companies tend to lag large companies in turbulent times, which have marked the market over the past six to eight months. Growth stocks also benefited as valuations between growth and value stocks narrowed over the year.
In December 2015, the Federal Reserve (the Fed) raised the target range of its benchmark interest rate by a quarter of a point, ending a lengthy debate about whether the economy was strong enough to withstand higher borrowing costs. Mixed economic signals early in 2016 put additional rate hikes on hold — at least for now.
Contributors and Detractors
Utilities and health care were the top contributors to relative performance for the period. Within utilities, Avista, an electricity and natural gas utility company that generates, transmits, and distributes electricity and also distributes natural gas in the United States and Canada, generated positive results. PharMerica was the largest contributor to overall performance in health care. PharMerica operates as an institutional pharmacy services company. It offers services to health facilities, pharmacy management to hospitals, specialty infusion services to patients outside hospitals and oncology pharmacy services.
Portfolio Management
Christian Stadlinger, Ph.D., CFA
Jarl Ginsberg, CFA, CAIA
Morningstar Style BoxTM

The Morningstar Style BoxTM is based on a fund's portfolio holdings. For equity funds, the vertical axis shows the market capitalization of the stocks owned, and the horizontal axis shows investment style (value, blend, or growth). Information shown is based on the most recent data provided by Morningstar.
© 2016 Morningstar, Inc. All rights reserved. The Morningstar information contained herein: (1) is proprietary to Morningstar and/or its content providers; (2) may not be copied or distributed; and (3) is not warranted to be accurate, complete or timely. Neither Morningstar nor its content providers are responsible for any damages or losses arising from any use of this information.
Top Ten Holdings (%)
(at February 29, 2016) | |
Avista Corp. | | | 1.6 | | |
Argo Group International
Holdings Ltd. | | | 1.5 | | |
Independent Bank Corp. | | | 1.4 | | |
Southwest Gas Corp. | | | 1.3 | | |
Community Bank System, Inc. | | | 1.3 | | |
AMERISAFE, Inc. | | | 1.3 | | |
Renasant Corp. | | | 1.3 | | |
TreeHouse Foods, Inc. | | | 1.3 | | |
American Assets Trust, Inc. | | | 1.3 | | |
VCA, Inc. | | | 1.3 | | |
Percentages indicated are based upon total investments (excluding Money Market Funds).
For further detail about these holdings, please refer to the section entitled "Portfolio of Investments."
Fund holdings are as of the date given, are subject to change at any time, and are not recommendations to buy or sell any security.
Annual Report 2016
5
COLUMBIA SMALL CAP VALUE FUND II
MANAGER DISCUSSION OF FUND PERFORMANCE (continued)
Portfolio Breakdown (%)
(at February 29, 2016) | |
Common Stocks | | | 95.9 | | |
Exchange-Traded Funds | | | 0.3 | | |
Money Market Funds | | | 3.8 | | |
Total | | | 100.0 | | |
Percentages indicated are based upon total investments. The Fund's portfolio composition is subject to change.
Equity Sector Breakdown (%)
(at February 29, 2016) | |
Consumer Discretionary | | | 13.0 | | |
Consumer Staples | | | 4.8 | | |
Energy | | | 4.4 | | |
Financials | | | 35.1 | | |
Health Care | | | 6.6 | | |
Industrials | | | 13.8 | | |
Information Technology | | | 11.1 | | |
Materials | | | 4.7 | | |
Utilities | | | 6.5 | | |
Total | | | 100.0 | | |
Percentages indicated are based upon total equity investments. The Fund's portfolio composition is subject to change.
Investment Risks
Market risk may affect a single issuer, sector of the economy, industry or the market as a whole. Foreign investments subject the Fund to risks, including political, economic, market, social and others within a particular country, as well as to currency instabilities and less stringent financial and accounting standards generally applicable to U.S. issuers. Investments in small-cap companies involve risks and volatility greater than investments in larger, more established companies. Value securities may be unprofitable if the market fails to recognize their intrinsic worth or the portfolio manager misgauged that worth. The Fund may invest significantly in issuers within a particular sector, which may be negatively affected by market, economic or other conditions, making the Fund more vulnerable to unfavorable developments in the sector. See the Fund's prospectus for more information on these and other risks.
Within energy, which was down more than 53% for the period, the Fund outperformed its benchmark due to strong stock selection. Even though financials lost ground, the Fund held up better than the benchmark in the financials sector because of a slight underweight and strong stock selection.
Stock selection and an overweight in the underperforming materials sector was the major detractor from Fund results for the year. Energy and industrials also weighed on performance. Within materials, the hardest hit industry was metals and mining, as commodity prices sold off precipitously. The two largest individual detractors in the materials sector were AK Steel, an American steel company, and Carpenter Technology, an international developer, manufacturer and distributor of cast wrought and powder metallurgy specialty alloys/metals. A sharp decline in commodity prices drove the energy sector down. The Fund's position in Helix Energy Solutions, an American oil and gas service company, was the largest detractor in the energy sector and was ultimately sold from the Fund's portfolio.
Strategy and Positioning at Period's End
The Fund focuses on small-cap value companies with strong underlying earnings prospects and attractively priced shares. We seek those companies in which we believe the valuation gap is likely to shrink in the near term and look for upward inflection points and improving operating performance/metrics. As we do this, three types of opportunities typically come to light:
1. Companies with compressed near term operating fundamentals that we believe are poised to expand within a reasonable timeframe
2. Opportunities in industries that may be out of favor
3. "Out-of-the-limelight" companies we believe have been missed by the Wall Street research community.
At the end of the period, the Fund was overweight in health care, energy, materials and consumer discretionary stocks. The Fund was underweight relative to its benchmark in information technology, consumer staples, financials, utilities, industrials and telecommunication services.
Annual Report 2016
6
COLUMBIA SMALL CAP VALUE FUND II
UNDERSTANDING YOUR FUND'S EXPENSES
(Unaudited)
As an investor, you incur two types of costs. There are transaction costs, which generally include sales charges on purchases and may include redemption fees. There are also ongoing costs, which generally include management fees, distribution and/or service fees, and other fund expenses. The following information is intended to help you understand your ongoing costs (in dollars) of investing in the Fund and to help you compare these costs with the ongoing costs of investing in other mutual funds.
Analyzing Your Fund's Expenses
To illustrate these ongoing costs, we have provided examples and calculated the expenses paid by investors in each share class of the Fund during the period. The actual and hypothetical information in the table is based on an initial investment of $1,000 at the beginning of the period indicated and held for the entire period. Expense information is calculated two ways and each method provides you with different information. The amount listed in the "Actual" column is calculated using the Fund's actual operating expenses and total return for the period. You may use the Actual information, together with the amount invested, to estimate the expenses that you paid over the period. Simply divide your account value by $1,000 (for example, an $8,600 account value divided by $1,000 = 8.6), then multiply the results by the expenses paid during the period under the "Actual" column. The amount listed in the "Hypothetical" column assumes a 5% annual rate of return before expenses (which is not the Fund's actual return) and then applies the Fund's actual expense ratio for the period to the hypothetical return. You should not use the hypothetical account values and expenses to estimate either your actual account balance at the end of the period or the expenses you paid during the period. See "Compare With Other Funds" below for details on how to use the hypothetical data.
Compare With Other Funds
Since all mutual funds are required to include the same hypothetical calculations about expenses in shareholder reports, you can use this information to compare the ongoing cost of investing in the Fund with other funds. To do so, compare the hypothetical example with the 5% hypothetical examples that appear in the shareholder reports of other funds. As you compare hypothetical examples of other funds, it is important to note that hypothetical examples are meant to highlight the ongoing costs of investing in a fund only and do not reflect any transaction costs, such as sales charges, or redemption or exchange fees. Therefore, the hypothetical calculations are useful in comparing ongoing costs only, and will not help you determine the relative total costs of owning different funds. If transaction costs were included in these calculations, your costs would be higher.
September 1, 2015 – February 29, 2016
| | | Account Value at the Beginning
of the Period ($) | | Account Value at the End of the
Period ($) | | Expenses Paid During the
Period ($) | | Fund's Annualized
Expense Ratio (%) | |
| | | Actual | | Hypothetical | | Actual | | Hypothetical | | Actual | | Hypothetical | | Actual | |
Class A | | | 1,000.00 | | | | 1,000.00 | | | | 928.90 | | | | 1,018.45 | | | | 6.19 | | | | 6.47 | | | | 1.29 | | |
Class B | | | 1,000.00 | | | | 1,000.00 | | | | 925.10 | | | | 1,014.72 | | | | 9.76 | | | | 10.22 | | | | 2.04 | | |
Class C | | | 1,000.00 | | | | 1,000.00 | | | | 925.10 | | | | 1,014.72 | | | | 9.76 | | | | 10.22 | | | | 2.04 | | |
Class I | | | 1,000.00 | | | | 1,000.00 | | | | 931.20 | | | | 1,020.89 | | | | 3.84 | | | | 4.02 | | | | 0.80 | | |
Class R | | | 1,000.00 | | | | 1,000.00 | | | | 927.60 | | | | 1,017.21 | | | | 7.38 | | | | 7.72 | | | | 1.54 | | |
Class R4 | | | 1,000.00 | | | | 1,000.00 | | | | 930.60 | | | | 1,019.69 | | | | 4.99 | | | | 5.22 | | | | 1.04 | | |
Class R5 | | | 1,000.00 | | | | 1,000.00 | | | | 931.30 | | | | 1,020.44 | | | | 4.27 | | | | 4.47 | | | | 0.89 | | |
Class Y | | | 1,000.00 | | | | 1,000.00 | | | | 931.20 | | | | 1,020.69 | | | | 4.03 | | | | 4.22 | | | | 0.84 | | |
Class Z | | | 1,000.00 | | | | 1,000.00 | | | | 930.60 | | | | 1,019.69 | | | | 4.99 | | | | 5.22 | | | | 1.04 | | |
Expenses paid during the period are equal to the annualized expense ratio for each class as indicated above, multiplied by the average account value over the period and then multiplied by the number of days in the Fund's most recent fiscal half year and divided by 366.
Expenses do not include fees and expenses incurred indirectly by the Fund from its investment in underlying funds, including affiliated and non-affiliated pooled investment vehicles, such as mutual funds and exchange-traded funds.
Annual Report 2016
7
COLUMBIA SMALL CAP VALUE FUND II
PORTFOLIO OF INVESTMENTS
February 29, 2016
(Percentages represent value of investments compared to net assets)
Common Stocks 96.3%
Issuer | | Shares | | Value ($) | |
CONSUMER DISCRETIONARY 12.6% | |
Auto Components 1.6% | |
Tenneco, Inc.(a) | | | 270,000 | | | | 12,290,400 | | |
Tower International, Inc. | | | 465,873 | | | | 9,997,634 | | |
Total | | | | | 22,288,034 | | |
Diversified Consumer Services 0.9% | |
Nord Anglia Education, Inc.(a) | | | 650,000 | | | | 12,603,500 | | |
Hotels, Restaurants & Leisure 1.4% | |
Penn National Gaming, Inc.(a) | | | 680,000 | | | | 9,411,200 | | |
Red Robin Gourmet Burgers, Inc.(a) | | | 151,000 | | | | 9,830,100 | | |
Total | | | | | 19,241,300 | | |
Household Durables 1.8% | |
CalAtlantic Group, Inc. | | | 356,685 | | | | 10,821,823 | | |
Helen of Troy Ltd.(a) | | | 145,000 | | | | 13,827,200 | | |
Total | | | | | 24,649,023 | | |
Media 2.0% | |
AMC Entertainment Holdings, Inc.,
Class A | | | 385,000 | | | | 9,251,550 | | |
EW Scripps Co. (The), Class A | | | 360,000 | | | | 6,213,600 | | |
Sinclair Broadcast Group, Inc., Class A | | | 390,100 | | | | 12,042,387 | | |
Total | | | | | 27,507,537 | | |
Multiline Retail 0.8% | |
JCPenney Co., Inc.(a) | | | 1,170,000 | | | | 11,934,000 | | |
Specialty Retail 3.7% | |
American Eagle Outfitters, Inc. | | | 765,000 | | | | 11,673,900 | | |
Children's Place, Inc. (The) | | | 144,000 | | | | 9,812,160 | | |
Express, Inc.(a) | | | 555,000 | | | | 9,562,650 | | |
Finish Line, Inc., Class A (The) | | | 393,000 | | | | 7,160,460 | | |
Guess?, Inc. | | | 356,500 | | | | 7,611,275 | | |
TravelCenters of America LLC(a) | | | 786,400 | | | | 6,786,632 | | |
Total | | | | | 52,607,077 | | |
Textiles, Apparel & Luxury Goods 0.4% | |
Sequential Brands Group, Inc.(a) | | | 830,000 | | | | 5,785,100 | | |
Total Consumer Discretionary | | | | | 176,615,571 | | |
CONSUMER STAPLES 4.6% | |
Food & Staples Retailing 1.6% | |
Performance Food Group Co.(a) | | | 495,000 | | | | 12,241,350 | | |
SpartanNash Co. | | | 388,000 | | | | 10,650,600 | | |
Total | | | | | 22,891,950 | | |
Common Stocks (continued)
Issuer | | Shares | | Value ($) | |
Food Products 3.0% | |
Dean Foods Co. | | | 360,000 | | | | 6,944,400 | | |
Post Holdings, Inc.(a) | | | 145,000 | | | | 10,071,700 | | |
Sanderson Farms, Inc. | | | 79,000 | | | | 7,209,540 | | |
TreeHouse Foods, Inc.(a) | | | 212,000 | | | | 17,897,040 | | |
Total | | | | | 42,122,680 | | |
Total Consumer Staples | | | | | 65,014,630 | | |
ENERGY 4.2% | |
Energy Equipment & Services 1.2% | |
Patterson-UTI Energy, Inc. | | | 600,000 | | | | 9,324,000 | | |
Rowan Companies PLC, Class A | | | 535,000 | | | | 7,126,200 | | |
Total | | | | | 16,450,200 | | |
Oil, Gas & Consumable Fuels 3.0% | |
Aegean Marine Petroleum Network, Inc. | | | 669,600 | | | | 4,801,032 | | |
Matador Resources Co.(a) | | | 762,000 | | | | 12,298,680 | | |
Parsley Energy, Inc., Class A(a) | | | 580,000 | | | | 10,660,400 | | |
PDC Energy, Inc.(a) | | | 188,000 | | | | 9,420,680 | | |
Teekay Tankers Ltd., Class A | | | 1,425,000 | | | | 5,856,750 | | |
Total | | | | | 43,037,542 | | |
Total Energy | | | | | 59,487,742 | | |
FINANCIALS 33.8% | |
Banks 16.1% | |
Ameris Bancorp | | | 440,000 | | | | 11,875,600 | | |
Bank of the Ozarks, Inc. | | | 230,000 | | | | 8,703,200 | | |
Cathay General Bancorp | | | 305,000 | | | | 8,140,450 | | |
Community Bank System, Inc. | | | 493,000 | | | | 18,255,790 | | |
Customers Bancorp, Inc.(a) | | | 475,000 | | | | 10,758,750 | | |
FirstMerit Corp. | | | 840,000 | | | | 16,489,200 | | |
Independent Bank Corp. | | | 435,000 | | | | 18,792,000 | | |
PrivateBancorp, Inc. | | | 485,000 | | | | 16,664,600 | | |
Prosperity Bancshares, Inc. | | | 190,000 | | | | 7,685,500 | | |
Renasant Corp. | | | 575,000 | | | | 17,951,500 | | |
Sandy Spring Bancorp, Inc. | | | 575,000 | | | | 14,938,500 | | |
Sterling Bancorp | | | 1,150,000 | | | | 16,571,500 | | |
Umpqua Holdings Corp. | | | 470,000 | | | | 7,068,800 | | |
Union Bankshares Corp. | | | 600,000 | | | | 13,656,000 | | |
Western Alliance Bancorp(a) | | | 535,000 | | | | 15,900,200 | | |
The accompanying Notes to Financial Statements are an integral part of this statement.
Annual Report 2016
8
COLUMBIA SMALL CAP VALUE FUND II
PORTFOLIO OF INVESTMENTS (continued)
February 29, 2016
Common Stocks (continued)
Issuer | | Shares | | Value ($) | |
Wilshire Bancorp, Inc. | | | 1,352,400 | | | | 13,307,616 | | |
Wintrust Financial Corp. | | | 225,000 | | | | 9,562,500 | | |
Total | | | | | 226,321,706 | | |
Capital Markets 1.2% | |
Triplepoint Venture Growth BDC Corp. | | | 289,631 | | | | 2,907,895 | | |
Virtu Financial, Inc. Class A | | | 609,414 | | | | 13,596,027 | | |
Total | | | | | 16,503,922 | | |
Insurance 6.0% | |
American Equity Investment Life
Holding Co. | | | 605,000 | | | | 8,228,000 | | |
AMERISAFE, Inc. | | | 352,936 | | | | 18,176,204 | | |
Amtrust Financial Services, Inc. | | | 440,000 | | | | 10,758,000 | | |
Argo Group International Holdings Ltd. | | | 360,000 | | | | 20,062,800 | | |
CNO Financial Group, Inc. | | | 600,000 | | | | 10,458,000 | | |
First American Financial Corp. | | | 450,000 | | | | 16,663,500 | | |
Total | | | | | 84,346,504 | | |
Real Estate Investment Trusts (REITs) 9.3% | |
American Assets Trust, Inc. | | | 466,100 | | | | 17,287,649 | | |
Brandywine Realty Trust | | | 800,000 | | | | 9,848,000 | | |
Chesapeake Lodging Trust | | | 365,000 | | | | 9,274,650 | | |
CubeSmart | | | 500,000 | | | | 14,950,000 | | |
First Industrial Realty Trust, Inc. | | | 745,000 | | | | 16,032,400 | | |
Highwoods Properties, Inc. | | | 355,000 | | | | 15,460,250 | | |
Kilroy Realty Corp. | | | 122,000 | | | | 6,620,940 | | |
LaSalle Hotel Properties | | | 415,000 | | | | 10,105,250 | | |
Mack-Cali Realty Corp. | | | 500,000 | | | | 9,950,000 | | |
PS Business Parks, Inc. | | | 129,000 | | | | 11,843,490 | | |
Sun Communities, Inc. | | | 151,000 | | | | 10,197,030 | | |
Total | | | | | 131,569,659 | | |
Thrifts & Mortgage Finance 1.2% | |
EverBank Financial Corp. | | | 871,000 | | | | 11,340,420 | | |
MGIC Investment Corp.(a) | | | 760,000 | | | | 5,198,400 | | |
Total | | | | | 16,538,820 | | |
Total Financials | | | | | 475,280,611 | | |
HEALTH CARE 6.3% | |
Biotechnology 0.5% | |
Emergent Biosolutions, Inc.(a) | | | 190,000 | | | | 6,427,700 | | |
Health Care Equipment & Supplies 0.8% | |
Globus Medical, Inc., Class A(a) | | | 477,000 | | | | 11,591,100 | | |
Common Stocks (continued)
Issuer | | Shares | | Value ($) | |
Health Care Providers & Services 3.9% | |
Amsurg Corp.(a) | | | 96,900 | | | | 6,594,045 | | |
LHC Group, Inc.(a) | | | 320,000 | | | | 11,401,600 | | |
LifePoint Health, Inc.(a) | | | 110,000 | | | | 6,859,600 | | |
PharMerica Corp.(a) | | | 560,000 | | | | 12,941,600 | | |
VCA, Inc.(a) | | | 333,800 | | | | 17,033,814 | | |
Total | | | | | 54,830,659 | | |
Life Sciences Tools & Services 0.6% | |
PAREXEL International Corp.(a) | | | 144,000 | | | | 8,451,360 | | |
Pharmaceuticals 0.5% | |
Catalent, Inc.(a) | | | 310,000 | | | | 7,523,700 | | |
Total Health Care | | | | | 88,824,519 | | |
INDUSTRIALS 13.3% | |
Aerospace & Defense 0.6% | |
Curtiss-Wright Corp. | | | 118,000 | | | | 8,329,620 | | |
Airlines 1.9% | |
Alaska Air Group, Inc. | | | 116,900 | | | | 8,638,910 | | |
Skywest, Inc. | | | 457,000 | | | | 8,248,850 | | |
Spirit Airlines, Inc.(a) | | | 208,000 | | | | 9,932,000 | | |
Total | | | | | 26,819,760 | | |
Commercial Services & Supplies 3.2% | |
ABM Industries, Inc. | | | 415,000 | | | | 13,031,000 | | |
Deluxe Corp. | | | 253,000 | | | | 14,524,730 | | |
Steelcase, Inc., Class A | | | 508,000 | | | | 6,344,920 | | |
West Corp. | | | 500,000 | | | | 11,140,000 | | |
Total | | | | | 45,040,650 | | |
Construction & Engineering 2.5% | |
EMCOR Group, Inc. | | | 335,000 | | | | 15,366,450 | | |
Granite Construction, Inc. | | | 210,000 | | | | 8,704,500 | | |
MasTec, Inc.(a) | | | 645,000 | | | | 10,952,100 | | |
Total | | | | | 35,023,050 | | |
Electrical Equipment 0.6% | |
Franklin Electric Co., Inc. | | | 274,000 | | | | 8,178,900 | | |
Machinery 2.5% | |
Actuant Corp., Class A | | | 450,000 | | | | 10,534,500 | | |
Barnes Group, Inc. | | | 280,000 | | | | 9,606,800 | | |
Oshkosh Corp. | | | 187,500 | | | | 6,468,750 | | |
Wabash National Corp.(a) | | | 753,000 | | | | 8,832,690 | | |
Total | | | | | 35,442,740 | | |
The accompanying Notes to Financial Statements are an integral part of this statement.
Annual Report 2016
9
COLUMBIA SMALL CAP VALUE FUND II
PORTFOLIO OF INVESTMENTS (continued)
February 29, 2016
Common Stocks (continued)
Issuer | | Shares | | Value ($) | |
Professional Services 0.6% | |
TrueBlue, Inc.(a) | | | 380,000 | | | | 8,721,000 | | |
Trading Companies & Distributors 1.4% | |
Beacon Roofing Supply, Inc.(a) | | | 425,000 | | | | 15,342,500 | | |
Neff Corp. Class A(a)(b) | | | 714,047 | | | | 3,477,409 | | |
Total | | | | | 18,819,909 | | |
Total Industrials | | | | | 186,375,629 | | |
INFORMATION TECHNOLOGY 10.7% | |
Communications Equipment 0.8% | |
Finisar Corp.(a) | | | 725,000 | | | | 10,570,500 | | |
Electronic Equipment, Instruments & Components 3.1% | |
Fabrinet(a) | | | 241,000 | | | | 6,880,550 | | |
II-VI, Inc.(a) | | | 675,000 | | | | 14,816,250 | | |
Rogers Corp.(a) | | | 150,000 | | | | 8,013,000 | | |
SYNNEX Corp. | | | 146,000 | | | | 13,728,380 | | |
Total | | | | | 43,438,180 | | |
IT Services 0.6% | |
Science Applications International Corp. | | | 198,000 | | | | 8,840,700 | | |
Semiconductors & Semiconductor Equipment 3.6% | |
Cirrus Logic, Inc.(a) | | | 295,000 | | | | 10,392,850 | | |
Cypress Semiconductor Corp. | | | 1,050,000 | | | | 8,379,000 | | |
Fairchild Semiconductor
International, Inc.(a) | | | 335,000 | | | | 6,720,100 | | |
Integrated Device Technology, Inc.(a) | | | 338,000 | | | | 6,563,960 | | |
IXYS Corp. | | | 675,000 | | | | 7,614,000 | | |
Kulicke & Soffa Industries, Inc.(a) | | | 1,010,000 | | | | 11,413,000 | | |
Total | | | | | 51,082,910 | | |
Software 1.6% | |
AVG Technologies NV(a) | | | 400,000 | | | | 7,656,000 | | |
Take-Two Interactive Software, Inc.(a) | | | 420,000 | | | | 15,115,800 | | |
Total | | | | | 22,771,800 | | |
Technology Hardware, Storage & Peripherals 1.0% | |
Super Micro Computer, Inc.(a) | | | 405,000 | | | | 13,150,350 | | |
Total Information Technology | | | | | 149,854,440 | | |
MATERIALS 4.6% | |
Chemicals 1.4% | |
Cabot Corp. | | | 316,000 | | | | 14,071,480 | | |
Orion Engineered Carbons SA | | | 429,000 | | | | 5,512,650 | | |
Total | | | | | 19,584,130 | | |
Common Stocks (continued)
Issuer | | Shares | | Value ($) | |
Construction Materials 0.6% | |
US Concrete, Inc.(a) | | | 160,000 | | | | 8,600,000 | | |
Metals & Mining 1.4% | |
Carpenter Technology Corp. | | | 350,000 | | | | 10,402,000 | | |
Materion Corp. | | | 365,000 | | | | 9,519,200 | | |
Total | | | | | 19,921,200 | | |
Paper & Forest Products 1.2% | |
Neenah Paper, Inc. | | | 268,553 | | | | 16,263,570 | | |
Total Materials | | | | | 64,368,900 | | |
UTILITIES 6.2% | |
Gas Utilities 4.1% | |
New Jersey Resources Corp. | | | 485,000 | | | | 16,790,700 | | |
ONE Gas, Inc. | | | 165,000 | | | | 9,566,700 | | |
South Jersey Industries, Inc. | | | 531,630 | | | | 13,529,984 | | |
Southwest Gas Corp. | | | 300,000 | | | | 18,300,000 | | |
Total | | | | | 58,187,384 | | |
Multi-Utilities 2.1% | |
Avista Corp. | | | 570,000 | | | | 21,546,000 | | |
Black Hills Corp. | | | 140,000 | | | | 7,841,400 | | |
Total | | | | | 29,387,400 | | |
Total Utilities | | | | | 87,574,784 | | |
Total Common Stocks
(Cost: $1,152,663,316) | | | | | 1,353,396,826 | | |
Exchange-Traded Funds 0.3%
| | | Shares | | Value ($) | |
Market Vectors Biotech ETF | | | 36,900 | | | | 3,704,391 | | |
Total Exchange-Traded Funds
(Cost: $4,013,742) | | | | | 3,704,391 | | |
Money Market Funds 3.8%
Columbia Short-Term Cash Fund,
0.420%(b)(c) | | | 53,559,959 | | | | 53,559,959 | | |
Total Money Market Funds
(Cost: $53,559,959) | | | | | 53,559,959 | | |
Total Investments
(Cost: $1,210,237,017) | | | | | 1,410,661,176 | | |
Other Assets & Liabilities, Net | | | | | (5,070,859 | ) | |
Net Assets | | | | | 1,405,590,317 | | |
The accompanying Notes to Financial Statements are an integral part of this statement.
Annual Report 2016
10
COLUMBIA SMALL CAP VALUE FUND II
PORTFOLIO OF INVESTMENTS (continued)
February 29, 2016
Notes to Portfolio of Investments
(a) Non-income producing investment.
(b) As defined in the Investment Company Act of 1940, an affiliated company is one in which the Fund owns 5% or more of the company's outstanding voting securities, or a company which is under common ownership or control with the Fund. Holdings and transactions in these affiliated companies during the year ended February 29, 2016 are as follows:
Issuer | | Beginning
Cost ($) | | Purchase
Cost ($) | | Proceeds
From Sales ($) | | Realized
Gain (Loss) ($) | | Ending
Cost ($) | | Dividends —
Affiliated
Issuers ($) | | Value ($) | |
Columbia
Short-Term
Cash Fund | | | 67,987,849 | | | | 545,018,320 | | | | (559,446,210 | ) | | | — | | | | 53,559,959 | | | | 96,079 | | | | 53,559,959 | | |
Neff Corp.
Class A | | | 11,210,205 | | | | — | | | | (379,738 | ) | | | (119,762 | ) | | | 10,710,705 | | | | — | | | | 3,477,409 | | |
Total | | | 79,198,054 | | | | 545,018,320 | | | | (559,825,948 | ) | | | (119,762 | ) | | | 64,270,664 | | | | 96,079 | | | | 57,037,368 | | |
(c) The rate shown is the seven-day current annualized yield at February 29, 2016.
Fair Value Measurements
The Fund categorizes its fair value measurements according to a three-level hierarchy that maximizes the use of observable inputs and minimizes the use of unobservable inputs by prioritizing that the most observable input be used when available. Observable inputs are those that market participants would use in pricing an investment based on market data obtained from sources independent of the reporting entity. Unobservable inputs are those that reflect the Fund's assumptions about the information market participants would use in pricing an investment. An investment's level within the fair value hierarchy is based on the lowest level of any input that is deemed significant to the asset's or liability's fair value measurement. The input levels are not necessarily an indication of the risk or liquidity associated with investments at that level. For example, certain U.S. government securities are generally high quality and liquid, however, they are reflected as Level 2 because the inputs used to determine fair value may not always be quoted prices in an active market.
Fair value inputs are summarized in the three broad levels listed below:
> Level 1 — Valuations based on quoted prices for investments in active markets that the Fund has the ability to access at the measurement date (including NAV for open-end mutual funds). Valuation adjustments are not applied to Level 1 investments.
> Level 2 — Valuations based on other significant observable inputs (including quoted prices for similar securities, interest rates, prepayment speeds, credit risks, etc.).
> Level 3 — Valuations based on significant unobservable inputs (including the Fund's own assumptions and judgment in determining the fair value of investments).
Inputs that are used in determining fair value of an investment may include price information, credit data, volatility statistics, and other factors. These inputs can be either observable or unobservable. The availability of observable inputs can vary between investments, and is affected by various factors such as the type of investment, and the volume and level of activity for that investment or similar investments in the marketplace. The inputs will be considered by the Investment Manager, along with any other relevant factors in the calculation of an investment's fair value. The Fund uses prices and inputs that are current as of the measurement date, which may include periods of market dislocations. During these periods, the availability of prices and inputs may be reduced for many investments. This condition could cause an investment to be reclassified between the various levels within the hierarchy.
Investments falling into the Level 3 category are primarily supported by quoted prices from brokers and dealers participating in the market for those investments. However, these may be classified as Level 3 investments due to lack of market transparency and corroboration to support these quoted prices. Additionally, valuation models may be used as the pricing source for any remaining investments classified as Level 3. These models may rely on one or more significant unobservable inputs and/or significant assumptions by the Investment Manager. Inputs used in valuations may include, but are not limited to, financial statement analysis, capital account balances, discount rates and estimated cash flows, and comparable company data.
Under the direction of the Fund's Board of Trustees (the Board), the Investment Manager's Valuation Committee (the Committee) is responsible for overseeing the valuation procedures approved by the Board. The Committee consists of voting and non-voting members from various groups within the Investment Manager's organization, including operations and accounting, trading and investments, compliance, risk management and legal.
The Committee meets at least monthly to review and approve valuation matters, which may include a description of specific valuation determinations, data regarding pricing information received from approved pricing vendors and brokers and the results of Board-approved valuation control policies and procedures (the Policies). The Policies address, among other things, instances when market quotations are or are not readily
The accompanying Notes to Financial Statements are an integral part of this statement.
Annual Report 2016
11
COLUMBIA SMALL CAP VALUE FUND II
PORTFOLIO OF INVESTMENTS (continued)
February 29, 2016
Fair Value Measurements (continued)
available, including recommendations of third party pricing vendors and a determination of appropriate pricing methodologies; events that require specific valuation determinations and assessment of fair value techniques; securities with a potential for stale pricing, including those that are illiquid, restricted, or in default; and the effectiveness of third party pricing vendors, including periodic reviews of vendors. The Committee meets more frequently, as needed, to discuss additional valuation matters, which may include the need to review back-testing results, review time-sensitive information or approve related valuation actions. The Committee reports to the Board, with members of the Committee meeting with the Board at each of its regularly scheduled meetings to discuss valuation matters and actions during the period, similar to those described earlier.
For investments categorized as Level 3, the Committee monitors information similar to that described above, which may include: (i) data specific to the issuer or comparable issuers, (ii) general market or specific sector news and (iii) quoted prices and specific or similar security transactions. The Committee considers this data and any changes from prior periods in order to assess the reasonableness of observable and unobservable inputs, any assumptions or internal models used to value those securities and changes in fair value. This data is also used to corroborate, when available, information received from approved pricing vendors and brokers. Various factors impact the frequency of monitoring this information (which may occur as often as daily). However, the Committee may determine that changes to inputs, assumptions and models are not required as a result of the monitoring procedures performed.
The following table is a summary of the inputs used to value the Fund's investments at February 29, 2016:
| | | Level 1
Quoted Prices in Active
Markets for Identical
Assets ($) | | Level 2
Other Significant
Observable Inputs ($) | | Level 3
Significant
Unobservable Inputs ($) | | Total ($) | |
Investments | |
Common Stocks | |
Consumer Discretionary | | | 176,615,571 | | | | — | | | | — | | | | 176,615,571 | | |
Consumer Staples | | | 65,014,630 | | | | — | | | | — | | | | 65,014,630 | | |
Energy | | | 59,487,742 | | | | — | | | | — | | | | 59,487,742 | | |
Financials | | | 475,280,611 | | | | — | | | | — | | | | 475,280,611 | | |
Health Care | | | 88,824,519 | | | | — | | | | — | | | | 88,824,519 | | |
Industrials | | | 186,375,629 | | | | — | | | | — | | | | 186,375,629 | | |
Information Technology | | | 149,854,440 | | | | — | | | | — | | | | 149,854,440 | | |
Materials | | | 64,368,900 | | | | — | | | | — | | | | 64,368,900 | | |
Utilities | | | 87,574,784 | | | | — | | | | — | | | | 87,574,784 | | |
Total Common Stocks | | | 1,353,396,826 | | | | — | | | | — | | | | 1,353,396,826 | | |
Exchange-Traded Funds | | | 3,704,391 | | | | — | | | | — | | | | 3,704,391 | | |
Money Market Funds | | | — | | | | 53,559,959 | | | | — | | | | 53,559,959 | | |
Total Investments | | | 1,357,101,217 | | | | 53,559,959 | | | | — | | | | 1,410,661,176 | | |
See the Portfolio of Investments for all investment classifications not indicated in the table.
The Fund's assets assigned to the Level 2 input category are valued based upon utilizing observable market inputs, in which a security's value is determined through reference to prices and information from market transactions for similar or identical assets and/or fund per share market values which are not considered publicly available.
Financial assets were transferred from Level 1 to Level 2 as the market for these assets is not considered publicly available. Fund per share market values were obtained using observable market inputs.
The following table shows transfers between Level 1 and Level 2 of the fair value hierarchy:
Transfers In | | Transfers Out | |
| Level 1 ($) | | Level 2 ($) | | Level 1 ($) | | Level 2 ($) | |
| | — | | | | 67,987,849 | | | | 67,987,849 | | | | — | | |
Transfers between Level 1 and Level 2 are determined based on the fair value at the beginning of the period for security positions held throughout the period.
There were no transfers of financial assets between Levels 2 and 3 during the period.
The accompanying Notes to Financial Statements are an integral part of this statement.
Annual Report 2016
12
COLUMBIA SMALL CAP VALUE FUND II
STATEMENT OF ASSETS AND LIABILITIES
February 29, 2016
Assets | |
Investments, at value | |
Unaffiliated issuers (identified cost $1,145,966,353) | | $ | 1,353,623,808 | | |
Affiliated issuers (identified cost $64,270,664) | | | 57,037,368 | | |
Total investments (identified cost $1,210,237,017) | | | 1,410,661,176 | | |
Receivable for: | |
Investments sold | | | 9,483,897 | | |
Capital shares sold | | | 1,903,798 | | |
Dividends | | | 1,604,229 | | |
Prepaid expenses | | | 3,503 | | |
Total assets | | | 1,423,656,603 | | |
Liabilities | |
Payable for: | |
Investments purchased | | | 16,072,451 | | |
Capital shares purchased | | | 1,382,110 | | |
Investment management fees | | | 94,946 | | |
Distribution and/or service fees | | | 5,409 | | |
Transfer agent fees | | | 323,268 | | |
Compensation of board members | | | 111,485 | | |
Other expenses | | | 76,617 | | |
Total liabilities | | | 18,066,286 | | |
Net assets applicable to outstanding capital stock | | $ | 1,405,590,317 | | |
Represented by | |
Paid-in capital | | $ | 1,192,725,017 | | |
Undistributed net investment income | | | 2,338,602 | | |
Accumulated net realized gain | | | 10,102,539 | | |
Unrealized appreciation (depreciation) on: | |
Investments — unaffiliated issuers | | | 207,657,455 | | |
Investments — affiliated issuers | | | (7,233,296 | ) | |
Total — representing net assets applicable to outstanding capital stock | | $ | 1,405,590,317 | | |
The accompanying Notes to Financial Statements are an integral part of this statement.
Annual Report 2016
13
COLUMBIA SMALL CAP VALUE FUND II
STATEMENT OF ASSETS AND LIABILITIES (continued)
February 29, 2016
Class A | |
Net assets | | $ | 197,262,631 | | |
Shares outstanding | | | 14,016,540 | | |
Net asset value per share | | $ | 14.07 | | |
Maximum offering price per share(a) | | $ | 14.93 | | |
Class B | |
Net assets | | $ | 124,489 | | |
Shares outstanding | | | 9,754 | | |
Net asset value per share | | $ | 12.76 | | |
Class C | |
Net assets | | $ | 11,325,140 | | |
Shares outstanding | | | 888,068 | | |
Net asset value per share | | $ | 12.75 | | |
Class I | |
Net assets | | $ | 1,999 | | |
Shares outstanding | | | 140 | | |
Net asset value per share(b) | | $ | 14.27 | | |
Class R | |
Net assets | | $ | 10,108,650 | | |
Shares outstanding | | | 726,494 | | |
Net asset value per share | | $ | 13.91 | | |
Class R4 | |
Net assets | | $ | 26,487,145 | | |
Shares outstanding | | | 1,824,809 | | |
Net asset value per share | | $ | 14.52 | | |
Class R5 | |
Net assets | | $ | 19,297,999 | | |
Shares outstanding | | | 1,328,426 | | |
Net asset value per share | | $ | 14.53 | | |
Class Y | |
Net assets | | $ | 133,139,168 | | |
Shares outstanding | | | 9,143,097 | | |
Net asset value per share | | $ | 14.56 | | |
Class Z | |
Net assets | | $ | 1,007,843,096 | | |
Shares outstanding | | | 70,742,612 | | |
Net asset value per share | | $ | 14.25 | | |
(a) The maximum offering price per share is calculated by dividing the net asset value per share by 1.0 minus the maximum sales charge of 5.75%.
(b) Net asset value per share rounds to this amount due to fractional shares outstanding.
The accompanying Notes to Financial Statements are an integral part of this statement.
Annual Report 2016
14
COLUMBIA SMALL CAP VALUE FUND II
STATEMENT OF OPERATIONS
Year Ended February 29, 2016
Net investment income | |
Income: | |
Dividends — unaffiliated issuers | | $ | 22,638,881 | | |
Dividends — affiliated issuers | | | 96,079 | | |
Foreign taxes withheld | | | (60,587 | ) | |
Total income | | | 22,674,373 | | |
Expenses: | |
Investment management fees | | | 12,832,443 | | |
Distribution and/or service fees | |
Class A | | | 602,797 | | |
Class B | | | 6,320 | | |
Class C | | | 134,768 | | |
Class R | | | 64,520 | | |
Transfer agent fees | |
Class A | | | 487,179 | | |
Class B | | | 1,282 | | |
Class C | | | 27,228 | | |
Class R | | | 26,072 | | |
Class R4 | | | 52,708 | | |
Class R5 | | | 8,962 | | |
Class Z | | | 2,292,739 | | |
Compensation of board members | | | 23,198 | | |
Custodian fees | | | 17,634 | | |
Printing and postage fees | | | 131,990 | | |
Registration fees | | | 113,427 | | |
Audit fees | | | 24,073 | | |
Legal fees | | | 17,180 | | |
Other | | | 35,460 | | |
Total expenses | | | 16,899,980 | | |
Expense reductions | | | (40 | ) | |
Total net expenses | | | 16,899,940 | | |
Net investment income | | | 5,774,433 | | |
Realized and unrealized gain (loss) — net | |
Net realized gain (loss) on: | |
Investments — unaffiliated issuers | | | 158,446,506 | | |
Investments — affiliated issuers | | | (119,762 | ) | |
Net realized gain | | | 158,326,744 | | |
Net change in unrealized appreciation (depreciation) on: | |
Investments — unaffiliated issuers | | | (313,945,401 | ) | |
Investments — affiliated issuers | | | (3,832,867 | ) | |
Net change in unrealized depreciation | | | (317,778,268 | ) | |
Net realized and unrealized loss | | | (159,451,524 | ) | |
Net decrease in net assets from operations | | $ | (153,677,091 | ) | |
The accompanying Notes to Financial Statements are an integral part of this statement.
Annual Report 2016
15
COLUMBIA SMALL CAP VALUE FUND II
STATEMENT OF CHANGES IN NET ASSETS
| | | Year Ended
February 29,
2016 | | Year Ended
February 28,
2015 | |
Operations | |
Net investment income | | $ | 5,774,433 | | | $ | 5,521,245 | | |
Net realized gain | | | 158,326,744 | | | | 125,520,128 | | |
Net change in unrealized depreciation | | | (317,778,268 | ) | | | (60,576,676 | ) | |
Net increase (decrease) in net assets resulting from operations | | | (153,677,091 | ) | | | 70,464,697 | | |
Distributions to shareholders | |
Net investment income | |
Class A | | | — | | | | (539,877 | ) | |
Class I | | | (8 | ) | | | (15 | ) | |
Class R4 | | | (38,137 | ) | | | (59,418 | ) | |
Class R5 | | | (57,246 | ) | | | (54,734 | ) | |
Class Y | | | (397,704 | ) | | | (590,262 | ) | |
Class Z | | | (1,657,634 | ) | | | (5,155,947 | ) | |
Net realized gains | |
Class A | | | (25,755,898 | ) | | | (25,694,119 | ) | |
Class B | | | (49,484 | ) | | | (137,539 | ) | |
Class C | | | (1,590,584 | ) | | | (1,552,055 | ) | |
Class I | | | (267 | ) | | | (238 | ) | |
Class R | | | (1,396,237 | ) | | | (1,464,482 | ) | |
Class R4 | | | (2,777,190 | ) | | | (1,295,660 | ) | |
Class R5 | | | (2,194,538 | ) | | | (1,125,155 | ) | |
Class Y | | | (13,403,625 | ) | | | (9,112,109 | ) | |
Class Z | | | (121,388,953 | ) | | | (120,218,261 | ) | |
Total distributions to shareholders | | | (170,707,505 | ) | | | (166,999,871 | ) | |
Increase (decrease) in net assets from capital stock activity | | | 4,966,405 | | | | (11,341,529 | ) | |
Total decrease in net assets | | | (319,418,191 | ) | | | (107,876,703 | ) | |
Net assets at beginning of year | | | 1,725,008,508 | | | | 1,832,885,211 | | |
Net assets at end of year | | $ | 1,405,590,317 | | | $ | 1,725,008,508 | | |
Undistributed (excess of distributions over) net investment income | | $ | 2,338,602 | | | $ | (893,562 | ) | |
The accompanying Notes to Financial Statements are an integral part of this statement.
Annual Report 2016
16
COLUMBIA SMALL CAP VALUE FUND II
STATEMENT OF CHANGES IN NET ASSETS (continued)
| | | Year Ended February 29, 2016 | | Year Ended February 28, 2015 | |
| | | Shares | | Dollars ($) | | Shares | | Dollars ($) | |
Capital stock activity | |
Class A shares | |
Subscriptions(a) | | | 2,148,588 | | | | 35,593,526 | | | | 2,964,697 | | | | 53,088,142 | | |
Distributions reinvested | | | 1,498,513 | | | | 24,097,613 | | | | 1,377,419 | | | | 24,272,637 | | |
Redemptions | | | (4,625,562 | ) | | | (76,592,166 | ) | | | (5,451,104 | ) | | | (97,249,654 | ) | |
Net decrease | | | (978,461 | ) | | | (16,901,027 | ) | | | (1,108,988 | ) | | | (19,888,875 | ) | |
Class B shares | |
Subscriptions | | | 164 | | | | 2,707 | | | | 490 | | | | 8,099 | | |
Distributions reinvested | | | 3,286 | | | | 48,789 | | | | 7,770 | | | | 127,319 | | |
Redemptions(a) | | | (61,464 | ) | | | (944,921 | ) | | | (54,010 | ) | | | (900,885 | ) | |
Net decrease | | | (58,014 | ) | | | (893,425 | ) | | | (45,750 | ) | | | (765,467 | ) | |
Class C shares | |
Subscriptions | | | 37,568 | | | | 558,003 | | | | 28,441 | | | | 465,157 | | |
Distributions reinvested | | | 88,399 | | | | 1,291,415 | | | | 75,895 | | | | 1,240,581 | | |
Redemptions | | | (158,112 | ) | | | (2,460,446 | ) | | | (172,906 | ) | | | (2,878,072 | ) | |
Net decrease | | | (32,145 | ) | | | (611,028 | ) | | | (68,570 | ) | | | (1,172,334 | ) | |
Class I shares | |
Redemptions | | | — | | | | — | | | | (73 | ) | | | (1,400 | ) | |
Net (decrease) | | | — | | | | — | | | | (73 | ) | | | (1,400 | ) | |
Class R shares | |
Subscriptions | | | 126,745 | | | | 2,116,291 | | | | 178,767 | | | | 3,198,034 | | |
Distributions reinvested | | | 85,775 | | | | 1,365,243 | | | | 81,342 | | | | 1,424,081 | | |
Redemptions | | | (321,529 | ) | | | (5,266,900 | ) | | | (375,399 | ) | | | (6,709,725 | ) | |
Net decrease | | | (109,009 | ) | | | (1,785,366 | ) | | | (115,290 | ) | | | (2,087,610 | ) | |
Class R4 shares | |
Subscriptions | | | 579,521 | | | | 9,334,104 | | | | 1,225,333 | | | | 21,871,853 | | |
Distributions reinvested | | | 170,256 | | | | 2,815,072 | | | | 75,062 | | | | 1,354,842 | | |
Redemptions | | | (584,530 | ) | | | (10,281,340 | ) | | | (400,370 | ) | | | (7,454,528 | ) | |
Net increase | | | 165,247 | | | | 1,867,836 | | | | 900,025 | | | | 15,772,167 | | |
Class R5 shares | |
Subscriptions | | | 675,734 | | | | 11,749,756 | | | | 559,707 | | | | 10,173,911 | | |
Distributions reinvested | | | 136,437 | | | | 2,251,526 | | | | 64,823 | | | | 1,179,488 | | |
Redemptions | | | (277,132 | ) | | | (4,654,659 | ) | | | (651,459 | ) | | | (11,904,578 | ) | |
Net increase (decrease) | | | 535,039 | | | | 9,346,623 | | | | (26,929 | ) | | | (551,179 | ) | |
Class Y shares | |
Subscriptions | | | 3,276,972 | | | | 53,577,049 | | | | 5,572,228 | | | | 104,647,166 | | |
Distributions reinvested | | | 797,361 | | | | 13,204,024 | | | | 483,734 | | | | 8,734,940 | | |
Redemptions | | | (1,163,553 | ) | | | (20,168,987 | ) | | | (1,287,603 | ) | | | (23,759,971 | ) | |
Net increase | | | 2,910,780 | | | | 46,612,086 | | | | 4,768,359 | | | | 89,622,135 | | |
The accompanying Notes to Financial Statements are an integral part of this statement.
Annual Report 2016
17
COLUMBIA SMALL CAP VALUE FUND II
STATEMENT OF CHANGES IN NET ASSETS (continued)
| | | Year Ended February 29, 2016 | | Year Ended February 28, 2015 | |
| | | Shares | | Dollars ($) | | Shares | | Dollars ($) | |
Capital stock activity (continued) | |
Class Z shares | |
Subscriptions | | | 14,286,878 | | | | 235,632,019 | | | | 14,679,412 | | | | 266,602,507 | | |
Distributions reinvested | | | 6,061,323 | | | | 98,463,443 | | | | 5,745,785 | | | | 102,247,406 | | |
Redemptions | | | (21,215,912 | ) | | | (366,764,756 | ) | | | (25,427,789 | ) | | | (461,118,879 | ) | |
Net decrease | | | (867,711 | ) | | | (32,669,294 | ) | | | (5,002,592 | ) | | | (92,268,966 | ) | |
Total net increase (decrease) | | | 1,565,726 | | | | 4,966,405 | | | | (699,808 | ) | | | (11,341,529 | ) | |
(a) Includes conversions of Class B shares to Class A shares, if any.
The accompanying Notes to Financial Statements are an integral part of this statement.
Annual Report 2016
18
COLUMBIA SMALL CAP VALUE FUND II
The following tables are intended to help you understand the Fund's financial performance. Certain information reflects financial results for a single share of a class held for the periods shown. Per share net investment income (loss) amounts are calculated based on average shares outstanding during the period. Total return assumes reinvestment of all dividends and distributions, if any. Total return does not reflect payment of sales charges, if any. Total return and portfolio turnover are not annualized for periods of less than one year. The portfolio turnover rate is calculated without regard to purchase and sales transactions of short-term instruments and certain derivatives, if any. If such transactions were included, the Fund's portfolio turnover rate may be higher.
| | | Year Ended
February 29, | | Year Ended February 28, | | Year Ended
February 29, | |
Class A | | 2016 | | 2015 | | 2014 | | 2013 | | 2012 | |
Per share data | |
Net asset value, beginning of period | | $ | 17.60 | | | $ | 18.61 | | | $ | 16.07 | | | $ | 14.44 | | | $ | 14.77 | | |
Income from investment operations: | |
Net investment income | | | 0.02 | | | | 0.02 | | | | 0.03 | | | | 0.11 | | | | 0.02 | | |
Net realized and unrealized gain (loss) | | | (1.65 | ) | | | 0.71 | | | | 4.59 | | | | 1.96 | | | | (0.33 | ) | |
Total from investment operations | | | (1.63 | ) | | | 0.73 | | | | 4.62 | | | | 2.07 | | | | (0.31 | ) | |
Less distributions to shareholders: | |
Net investment income | | | — | | | | (0.04 | ) | | | (0.05 | ) | | | (0.12 | ) | | | (0.02 | ) | |
Net realized gains | | | (1.90 | ) | | | (1.70 | ) | | | (2.03 | ) | | | (0.32 | ) | | | — | | |
Total distributions to shareholders | | | (1.90 | ) | | | (1.74 | ) | | | (2.08 | ) | | | (0.44 | ) | | | (0.02 | ) | |
Net asset value, end of period | | $ | 14.07 | | | $ | 17.60 | | | $ | 18.61 | | | $ | 16.07 | | | $ | 14.44 | | |
Total return | | | (10.48 | %) | | | 4.10 | % | | | 29.93 | % | | | 14.70 | % | | | (2.08 | %) | |
Ratios to average net assets(a) | |
Total gross expenses | | | 1.30 | % | | | 1.30 | % | | | 1.29 | % | | | 1.33 | % | | | 1.37 | % | |
Total net expenses(b) | | | 1.30 | %(c) | | | 1.30 | %(c) | | | 1.29 | %(c) | | | 1.31 | %(c) | | | 1.31 | %(c) | |
Net investment income | | | 0.15 | % | | | 0.11 | % | | | 0.17 | % | | | 0.76 | % | | | 0.15 | % | |
Supplemental data | |
Net assets, end of period (in thousands) | | $ | 197,263 | | | $ | 263,946 | | | $ | 299,725 | | | $ | 257,083 | | | $ | 525,941 | | |
Portfolio turnover | | | 57 | % | | | 38 | % | | | 36 | % | | | 42 | % | | | 41 | % | |
Notes to Financial Highlights
(a) In addition to the fees and expenses that the Fund bears directly, the Fund indirectly bears a pro rata share of the fees and expenses of any other funds in which it invests. Such indirect expenses are not included in the Fund's reported expense ratios.
(b) Total net expenses include the impact of certain fee waivers/expense reimbursements made by the Investment Manager and certain of its affiliates, if applicable.
(c) The benefits derived from expense reductions had an impact of less than 0.01%.
The accompanying Notes to Financial Statements are an integral part of this statement.
Annual Report 2016
19
COLUMBIA SMALL CAP VALUE FUND II
FINANCIAL HIGHLIGHTS (continued)
| | | Year Ended
February 29, | | Year Ended February 28, | | Year Ended
February 29, | |
Class B | | 2016 | | 2015 | | 2014 | | 2013 | | 2012 | |
Per share data | |
Net asset value, beginning of period | | $ | 16.26 | | | $ | 17.41 | | | $ | 15.22 | | | $ | 13.70 | | | $ | 14.10 | | |
Income from investment operations: | |
Net investment income (loss) | | | (0.11 | ) | | | (0.11 | ) | | | (0.10 | ) | | | 0.00 | (a) | | | (0.08 | ) | |
Net realized and unrealized gain (loss) | | | (1.49 | ) | | | 0.66 | | | | 4.32 | | | | 1.87 | | | | (0.32 | ) | |
Total from investment operations | | | (1.60 | ) | | | 0.55 | | | | 4.22 | | | | 1.87 | | | | (0.40 | ) | |
Less distributions to shareholders: | |
Net investment income | | | — | | | | — | | | | — | | | | (0.03 | ) | | | — | | |
Net realized gains | | | (1.90 | ) | | | (1.70 | ) | | | (2.03 | ) | | | (0.32 | ) | | | — | | |
Total distributions to shareholders | | | (1.90 | ) | | | (1.70 | ) | | | (2.03 | ) | | | (0.35 | ) | | | — | | |
Net asset value, end of period | | $ | 12.76 | | | $ | 16.26 | | | $ | 17.41 | | | $ | 15.22 | | | $ | 13.70 | | |
Total return | | | (11.17 | %) | | | 3.34 | % | | | 28.91 | % | | | 13.94 | % | | | (2.84 | %) | |
Ratios to average net assets(b) | |
Total gross expenses | | | 2.05 | % | | | 2.04 | % | | | 2.04 | % | | | 2.08 | % | | | 2.10 | % | |
Total net expenses(c) | | | 2.05 | %(d) | | | 2.04 | %(d) | | | 2.04 | %(d) | | | 2.06 | %(d) | | | 2.05 | %(d) | |
Net investment income (loss) | | | (0.67 | %) | | | (0.65 | %) | | | (0.57 | %) | | | 0.01 | % | | | (0.62 | %) | |
Supplemental data | |
Net assets, end of period (in thousands) | | $ | 124 | | | $ | 1,102 | | | $ | 1,977 | | | $ | 2,010 | | | $ | 2,337 | | |
Portfolio turnover | | | 57 | % | | | 38 | % | | | 36 | % | | | 42 | % | | | 41 | % | |
Notes to Financial Highlights
(a) Rounds to zero.
(b) In addition to the fees and expenses that the Fund bears directly, the Fund indirectly bears a pro rata share of the fees and expenses of any other funds in which it invests. Such indirect expenses are not included in the Fund's reported expense ratios.
(c) Total net expenses include the impact of certain fee waivers/expense reimbursements made by the Investment Manager and certain of its affiliates, if applicable.
(d) The benefits derived from expense reductions had an impact of less than 0.01%.
The accompanying Notes to Financial Statements are an integral part of this statement.
Annual Report 2016
20
COLUMBIA SMALL CAP VALUE FUND II
FINANCIAL HIGHLIGHTS (continued)
| | | Year Ended
February 29, | | Year Ended February 28, | | Year Ended
February 29, | |
Class C | | 2016 | | 2015 | | 2014 | | 2013 | | 2012 | |
Per share data | |
Net asset value, beginning of period | | $ | 16.25 | | | $ | 17.40 | | | $ | 15.20 | | | $ | 13.69 | | | $ | 14.09 | | |
Income from investment operations: | |
Net investment income (loss) | | | (0.09 | ) | | | (0.11 | ) | | | (0.10 | ) | | | (0.00 | )(a) | | | (0.08 | ) | |
Net realized and unrealized gain (loss) | | | (1.51 | ) | | | 0.66 | | | | 4.33 | | | | 1.86 | | | | (0.32 | ) | |
Total from investment operations | | �� | (1.60 | ) | | | 0.55 | | | | 4.23 | | | | 1.86 | | | | (0.40 | ) | |
Less distributions to shareholders: | |
Net investment income | | | — | | | | — | | | | — | | | | (0.03 | ) | | | — | | |
Net realized gains | | | (1.90 | ) | | | (1.70 | ) | | | (2.03 | ) | | | (0.32 | ) | | | — | | |
Total distributions to shareholders | | | (1.90 | ) | | | (1.70 | ) | | | (2.03 | ) | | | (0.35 | ) | | | — | | |
Net asset value, end of period | | $ | 12.75 | | | $ | 16.25 | | | $ | 17.40 | | | $ | 15.20 | | | $ | 13.69 | | |
Total return | | | (11.18 | %) | | | 3.34 | % | | | 29.02 | % | | | 13.87 | % | | | (2.84 | %) | |
Ratios to average net assets(b) | |
Total gross expenses | | | 2.05 | % | | | 2.05 | % | | | 2.04 | % | | | 2.08 | % | | | 2.10 | % | |
Total net expenses(c) | | | 2.05 | %(d) | | | 2.05 | %(d) | | | 2.04 | %(d) | | | 2.06 | %(d) | | | 2.06 | %(d) | |
Net investment income (loss) | | | (0.60 | %) | | | (0.64 | %) | | | (0.58 | %) | | | (0.00 | %)(a) | | | (0.62 | %) | |
Supplemental data | |
Net assets, end of period (in thousands) | | $ | 11,325 | | | $ | 14,949 | | | $ | 17,203 | | | $ | 16,190 | | | $ | 18,191 | | |
Portfolio turnover | | | 57 | % | | | 38 | % | | | 36 | % | | | 42 | % | | | 41 | % | |
Notes to Financial Highlights
(a) Rounds to zero.
(b) In addition to the fees and expenses that the Fund bears directly, the Fund indirectly bears a pro rata share of the fees and expenses of any other funds in which it invests. Such indirect expenses are not included in the Fund's reported expense ratios.
(c) Total net expenses include the impact of certain fee waivers/expense reimbursements made by the Investment Manager and certain of its affiliates, if applicable.
(d) The benefits derived from expense reductions had an impact of less than 0.01%.
The accompanying Notes to Financial Statements are an integral part of this statement.
Annual Report 2016
21
COLUMBIA SMALL CAP VALUE FUND II
FINANCIAL HIGHLIGHTS (continued)
| | | Year Ended
February 29, | | Year Ended February 28, | | Year Ended
February 29, | |
Class I | | 2016 | | 2015 | | 2014 | | 2013 | | 2012 | |
Per share data | |
Net asset value, beginning of period | | $ | 17.80 | | | $ | 18.78 | | | $ | 16.20 | | | $ | 14.54 | | | $ | 14.87 | | |
Income from investment operations: | |
Net investment income | | | 0.10 | | | | 0.11 | | | | 0.11 | | | | 0.17 | | | | 0.07 | | |
Net realized and unrealized gain (loss) | | | (1.67 | ) | | | 0.72 | | | | 4.63 | | | | 1.99 | | | | (0.32 | ) | |
Total from investment operations | | | (1.57 | ) | | | 0.83 | | | | 4.74 | | | | 2.16 | | | | (0.25 | ) | |
Less distributions to shareholders: | |
Net investment income | | | (0.06 | ) | | | (0.11 | ) | | | (0.13 | ) | | | (0.18 | ) | | | (0.08 | ) | |
Net realized gains | | | (1.90 | ) | | | (1.70 | ) | | | (2.03 | ) | | | (0.32 | ) | | | — | | |
Total distributions to shareholders | | | (1.96 | ) | | | (1.81 | ) | | | (2.16 | ) | | | (0.50 | ) | | | (0.08 | ) | |
Net asset value, end of period | | $ | 14.27 | | | $ | 17.80 | | | $ | 18.78 | | | $ | 16.20 | | | $ | 14.54 | | |
Total return | | | (10.05 | %) | | | 4.63 | % | | | 30.48 | % | | | 15.31 | % | | | (1.64 | %) | |
Ratios to average net assets(a) | |
Total gross expenses | | | 0.83 | % | | | 0.83 | % | | | 0.84 | % | | | 0.86 | % | | | 0.87 | % | |
Total net expenses(b) | | | 0.83 | % | | | 0.83 | % | | | 0.84 | % | | | 0.86 | % | | | 0.87 | % | |
Net investment income | | | 0.61 | % | | | 0.59 | % | | | 0.60 | % | | | 1.18 | % | | | 0.52 | % | |
Supplemental data | |
Net assets, end of period (in thousands) | | $ | 2 | | | $ | 2 | | | $ | 4 | | | $ | 23,685 | | | $ | 12,055 | | |
Portfolio turnover | | | 57 | % | | | 38 | % | | | 36 | % | | | 42 | % | | | 41 | % | |
Notes to Financial Highlights
(a) In addition to the fees and expenses that the Fund bears directly, the Fund indirectly bears a pro rata share of the fees and expenses of any other funds in which it invests. Such indirect expenses are not included in the Fund's reported expense ratios.
(b) Total net expenses include the impact of certain fee waivers/expense reimbursements made by the Investment Manager and certain of its affiliates, if applicable.
The accompanying Notes to Financial Statements are an integral part of this statement.
Annual Report 2016
22
COLUMBIA SMALL CAP VALUE FUND II
FINANCIAL HIGHLIGHTS (continued)
| | | Year Ended
February 29, | | Year Ended February 28, | | Year Ended
February 29, | |
Class R | | 2016 | | 2015 | | 2014 | | 2013 | | 2012 | |
Per share data | |
Net asset value, beginning of period | | $ | 17.47 | | | $ | 18.49 | | | $ | 15.98 | | | $ | 14.36 | | | $ | 14.71 | | |
Income from investment operations: | |
Net investment income (loss) | | | (0.02 | ) | | | (0.02 | ) | | | (0.01 | ) | | | 0.07 | | | | (0.02 | ) | |
Net realized and unrealized gain (loss) | | | (1.64 | ) | | | 0.70 | | | | 4.56 | | | | 1.96 | | | | (0.33 | ) | |
Total from investment operations | | | (1.66 | ) | | | 0.68 | | | | 4.55 | | | | 2.03 | | | | (0.35 | ) | |
Less distributions to shareholders: | |
Net investment income | | | — | | | | — | | | | (0.01 | ) | | | (0.09 | ) | | | — | | |
Net realized gains | | | (1.90 | ) | | | (1.70 | ) | | | (2.03 | ) | | | (0.32 | ) | | | — | | |
Total distributions to shareholders | | | (1.90 | ) | | | (1.70 | ) | | | (2.04 | ) | | | (0.41 | ) | | | — | | |
Net asset value, end of period | | $ | 13.91 | | | $ | 17.47 | | | $ | 18.49 | | | $ | 15.98 | | | $ | 14.36 | | |
Total return | | | (10.73 | %) | | | 3.86 | % | | | 29.61 | % | | | 14.47 | % | | | (2.38 | %) | |
Ratios to average net assets(a) | |
Total gross expenses | | | 1.55 | % | | | 1.55 | % | | | 1.54 | % | | | 1.58 | % | | | 1.60 | % | |
Total net expenses(b) | | | 1.55 | %(c) | | | 1.55 | %(c) | | | 1.54 | %(c) | | | 1.56 | %(c) | | | 1.56 | %(c) | |
Net investment income (loss) | | | (0.10 | %) | | | (0.14 | %) | | | (0.08 | %) | | | 0.50 | % | | | (0.12 | %) | |
Supplemental data | |
Net assets, end of period (in thousands) | | $ | 10,109 | | | $ | 14,594 | | | $ | 17,582 | | | $ | 15,421 | | | $ | 20,081 | | |
Portfolio turnover | | | 57 | % | | | 38 | % | | | 36 | % | | | 42 | % | | | 41 | % | |
Notes to Financial Highlights
(a) In addition to the fees and expenses that the Fund bears directly, the Fund indirectly bears a pro rata share of the fees and expenses of any other funds in which it invests. Such indirect expenses are not included in the Fund's reported expense ratios.
(b) Total net expenses include the impact of certain fee waivers/expense reimbursements made by the Investment Manager and certain of its affiliates, if applicable.
(c) The benefits derived from expense reductions had an impact of less than 0.01%.
The accompanying Notes to Financial Statements are an integral part of this statement.
Annual Report 2016
23
COLUMBIA SMALL CAP VALUE FUND II
FINANCIAL HIGHLIGHTS (continued)
| | | Year Ended
February 29, | | Year Ended February 28, | |
Class R4 | | 2016 | | 2015 | | 2014 | | 2013(a) | |
Per share data | |
Net asset value, beginning of period | | $ | 18.08 | | | $ | 19.06 | | | $ | 16.42 | | | $ | 14.41 | | |
Income from investment operations: | |
Net investment income | | | 0.07 | | | | 0.05 | | | | 0.07 | | | | 0.08 | | |
Net realized and unrealized gain (loss) | | | (1.70 | ) | | | 0.75 | | | | 4.69 | | | | 2.40 | | |
Total from investment operations | | | (1.63 | ) | | | 0.80 | | | | 4.76 | | | | 2.48 | | |
Less distributions to shareholders: | |
Net investment income | | | (0.03 | ) | | | (0.08 | ) | | | (0.09 | ) | | | (0.15 | ) | |
Net realized gains | | | (1.90 | ) | | | (1.70 | ) | | | (2.03 | ) | | | (0.32 | ) | |
Total distributions to shareholders | | | (1.93 | ) | | | (1.78 | ) | | | (2.12 | ) | | | (0.47 | ) | |
Net asset value, end of period | | $ | 14.52 | | | $ | 18.08 | | | $ | 19.06 | | | $ | 16.42 | | |
Total return | | | (10.22 | %) | | | 4.39 | % | | | 30.18 | % | | | 17.60 | % | |
Ratios to average net assets(b) | |
Total gross expenses | | | 1.05 | % | | | 1.05 | % | | | 1.05 | % | | | 1.11 | %(c) | |
Total net expenses(d) | | | 1.05 | %(e) | | | 1.05 | %(e) | | | 1.05 | %(e) | | | 1.06 | %(c) | |
Net investment income | | | 0.41 | % | | | 0.28 | % | | | 0.38 | % | | | 1.73 | %(c) | |
Supplemental data | |
Net assets, end of period (in thousands) | | $ | 26,487 | | | $ | 30,000 | | | $ | 14,479 | | | $ | 3 | | |
Portfolio turnover | | | 57 | % | | | 38 | % | | | 36 | % | | | 42 | % | |
Notes to Financial Highlights
(a) Based on operations from November 8, 2012 (commencement of operations) through the stated period end.
(b) In addition to the fees and expenses that the Fund bears directly, the Fund indirectly bears a pro rata share of the fees and expenses of any other funds in which it invests. Such indirect expenses are not included in the Fund's reported expense ratios.
(c) Annualized.
(d) Total net expenses include the impact of certain fee waivers/expense reimbursements made by the Investment Manager and certain of its affiliates, if applicable.
(e) The benefits derived from expense reductions had an impact of less than 0.01%.
The accompanying Notes to Financial Statements are an integral part of this statement.
Annual Report 2016
24
COLUMBIA SMALL CAP VALUE FUND II
FINANCIAL HIGHLIGHTS (continued)
| | | Year Ended
February 29, | | Year Ended February 28, | |
Class R5 | | 2016 | | 2015 | | 2014 | | 2013(a) | |
Per share data | |
Net asset value, beginning of period | | $ | 18.09 | | | $ | 19.07 | | | $ | 16.42 | | | $ | 14.41 | | |
Income from investment operations: | |
Net investment income | | | 0.10 | | | | 0.09 | | | | 0.09 | | | | 0.09 | | |
Net realized and unrealized gain (loss) | | | (1.71 | ) | | | 0.73 | | | | 4.71 | | | | 2.39 | | |
Total from investment operations | | | (1.61 | ) | | | 0.82 | | | | 4.80 | | | | 2.48 | | |
Less distributions to shareholders: | |
Net investment income | | | (0.05 | ) | | | (0.10 | ) | | | (0.12 | ) | | | (0.15 | ) | |
Net realized gains | | | (1.90 | ) | | | (1.70 | ) | | | (2.03 | ) | | | (0.32 | ) | |
Total distributions to shareholders | | | (1.95 | ) | | | (1.80 | ) | | | (2.15 | ) | | | (0.47 | ) | |
Net asset value, end of period | | $ | 14.53 | | | $ | 18.09 | | | $ | 19.07 | | | $ | 16.42 | | |
Total return | | | (10.10 | %) | | | 4.51 | % | | | 30.43 | % | | | 17.63 | % | |
Ratios to average net assets(b) | |
Total gross expenses | | | 0.89 | % | | | 0.89 | % | | | 0.89 | % | | | 0.92 | %(c) | |
Total net expenses(d) | | | 0.89 | % | | | 0.89 | % | | | 0.89 | % | | | 0.92 | %(c) | |
Net investment income | | | 0.59 | % | | | 0.49 | % | | | 0.51 | % | | | 1.87 | %(c) | |
Supplemental data | |
Net assets, end of period (in thousands) | | $ | 19,298 | | | $ | 14,349 | | | $ | 15,640 | | | $ | 3 | | |
Portfolio turnover | | | 57 | % | | | 38 | % | | | 36 | % | | | 42 | % | |
Notes to Financial Highlights
(a) Based on operations from November 8, 2012 (commencement of operations) through the stated period end.
(b) In addition to the fees and expenses that the Fund bears directly, the Fund indirectly bears a pro rata share of the fees and expenses of any other funds in which it invests. Such indirect expenses are not included in the Fund's reported expense ratios.
(c) Annualized.
(d) Total net expenses include the impact of certain fee waivers/expense reimbursements made by the Investment Manager and certain of its affiliates, if applicable.
The accompanying Notes to Financial Statements are an integral part of this statement.
Annual Report 2016
25
COLUMBIA SMALL CAP VALUE FUND II
FINANCIAL HIGHLIGHTS (continued)
| | | Year Ended
February 29, | | Year Ended February 28, | |
Class Y | | 2016 | | 2015 | | 2014 | | 2013(a) | |
Per share data | |
Net asset value, beginning of period | | $ | 18.12 | | | $ | 19.10 | | | $ | 16.44 | | | $ | 14.43 | | |
Income from investment operations: | |
Net investment income | | | 0.11 | | | | 0.10 | | | | 0.10 | | | | 0.09 | | |
Net realized and unrealized gain (loss) | | | (1.71 | ) | | | 0.72 | | | | 4.72 | | | | 2.40 | | |
Total from investment operations | | | (1.60 | ) | | | 0.82 | | | | 4.82 | | | | 2.49 | | |
Less distributions to shareholders: | |
Net investment income | | | (0.06 | ) | | | (0.10 | ) | | | (0.13 | ) | | | (0.16 | ) | |
Net realized gains | | | (1.90 | ) | | | (1.70 | ) | | | (2.03 | ) | | | (0.32 | ) | |
Total distributions to shareholders | | | (1.96 | ) | | | (1.80 | ) | | | (2.16 | ) | | | (0.48 | ) | |
Net asset value, end of period | | $ | 14.56 | | | $ | 18.12 | | | $ | 19.10 | | | $ | 16.44 | | |
Total return | | | (10.05 | %) | | | 4.53 | % | | | 30.52 | % | | | 17.66 | % | |
Ratios to average net assets(b) | |
Total gross expenses | | | 0.84 | % | | | 0.85 | % | | | 0.84 | % | | | 0.87 | %(c) | |
Total net expenses(d) | | | 0.84 | % | | | 0.85 | % | | | 0.84 | % | | | 0.87 | %(c) | |
Net investment income | | | 0.62 | % | | | 0.56 | % | | | 0.53 | % | | | 1.92 | %(c) | |
Supplemental data | |
Net assets, end of period (in thousands) | | $ | 133,139 | | | $ | 112,949 | | | $ | 27,955 | | | $ | 3 | | |
Portfolio turnover | | | 57 | % | | | 38 | % | | | 36 | % | | | 42 | % | |
Notes to Financial Highlights
(a) Based on operations from November 8, 2012 (commencement of operations) through the stated period end.
(b) In addition to the fees and expenses that the Fund bears directly, the Fund indirectly bears a pro rata share of the fees and expenses of any other funds in which it invests. Such indirect expenses are not included in the Fund's reported expense ratios.
(c) Annualized.
(d) Total net expenses include the impact of certain fee waivers/expense reimbursements made by the Investment Manager and certain of its affiliates, if applicable.
The accompanying Notes to Financial Statements are an integral part of this statement.
Annual Report 2016
26
COLUMBIA SMALL CAP VALUE FUND II
FINANCIAL HIGHLIGHTS (continued)
| | | Year Ended
February 29, | | Year Ended February 28, | | Year Ended
February 29, | |
Class Z | | 2016 | | 2015 | | 2014 | | 2013 | | 2012 | |
Per share data | |
Net asset value, beginning of period | | $ | 17.78 | | | $ | 18.77 | | | $ | 16.19 | | | $ | 14.54 | | | $ | 14.87 | | |
Income from investment operations: | |
Net investment income | | | 0.07 | | | | 0.06 | | | | 0.07 | | | | 0.15 | | | | 0.05 | | |
Net realized and unrealized gain (loss) | | | (1.67 | ) | | | 0.72 | | | | 4.64 | | | | 1.97 | | | | (0.33 | ) | |
Total from investment operations | | | (1.60 | ) | | | 0.78 | | | | 4.71 | | | | 2.12 | | | | (0.28 | ) | |
Less distributions to shareholders: | |
Net investment income | | | (0.03 | ) | | | (0.07 | ) | | | (0.10 | ) | | | (0.15 | ) | | | (0.05 | ) | |
Net realized gains | | | (1.90 | ) | | | (1.70 | ) | | | (2.03 | ) | | | (0.32 | ) | | | — | | |
Total distributions to shareholders | | | (1.93 | ) | | | (1.77 | ) | | | (2.13 | ) | | | (0.47 | ) | | | (0.05 | ) | |
Net asset value, end of period | | $ | 14.25 | | | $ | 17.78 | | | $ | 18.77 | | | $ | 16.19 | | | $ | 14.54 | | |
Total return | | | (10.22 | %) | | | 4.39 | % | | | 30.26 | % | | | 15.02 | % | | | (1.84 | %) | |
Ratios to average net assets(a) | |
Total gross expenses | | | 1.05 | % | | | 1.05 | % | | | 1.04 | % | | | 1.08 | % | | | 1.11 | % | |
Total net expenses(b) | | | 1.05 | %(c) | | | 1.05 | %(c) | | | 1.04 | %(c) | | | 1.06 | %(c) | | | 1.06 | %(c) | |
Net investment income | | | 0.40 | % | | | 0.36 | % | | | 0.42 | % | | | 1.01 | % | | | 0.40 | % | |
Supplemental data | |
Net assets, end of period (in thousands) | | $ | 1,007,843 | | | $ | 1,273,117 | | | $ | 1,438,322 | | | $ | 1,140,319 | | | $ | 1,230,960 | | |
Portfolio turnover | | | 57 | % | | | 38 | % | | | 36 | % | | | 42 | % | | | 41 | % | |
Notes to Financial Highlights
(a) In addition to the fees and expenses that the Fund bears directly, the Fund indirectly bears a pro rata share of the fees and expenses of any other funds in which it invests. Such indirect expenses are not included in the Fund's reported expense ratios.
(b) Total net expenses include the impact of certain fee waivers/expense reimbursements made by the Investment Manager and certain of its affiliates, if applicable.
(c) The benefits derived from expense reductions had an impact of less than 0.01%.
The accompanying Notes to Financial Statements are an integral part of this statement.
Annual Report 2016
27
COLUMBIA SMALL CAP VALUE FUND II
NOTES TO FINANCIAL STATEMENTS
February 29, 2016
Note 1. Organization
Columbia Small Cap Value Fund II (the Fund), a series of Columbia Funds Series Trust (the Trust), is a diversified fund. The Trust is registered under the Investment Company Act of 1940, as amended (the 1940 Act), as an open-end management investment company organized as a Delaware statutory trust.
Fund Shares
The Trust may issue an unlimited number of shares (without par value). The Fund offers Class A, Class B, Class C, Class I, Class R, Class R4, Class R5, Class Y and Class Z shares. Although all share classes generally have identical voting, dividend and liquidation rights, each share class votes separately when required by the Trust's organizational documents or by law. Different share classes pay different distribution amounts to the extent the expenses of such share classes differ, and distributions in liquidation will be proportional to the net asset value of each share class. Each share class has its own expense and sales charge structure.
The Fund is closed to new investors and new accounts, subject to certain limited exceptions.
Class A shares are subject to a maximum front-end sales charge of 5.75% based on the initial investment amount. Class A shares purchased without an initial sales charge in accounts aggregating $1 million to $50 million at the time of purchase are subject to a contingent deferred sales charge (CDSC) if the shares are sold within 18 months after purchase, charged as follows: 1.00% CDSC if redeemed within 12 months after purchase, and 0.50% CDSC if redeemed more than 12, but less than 18, months after purchase.
Class B shares may be subject to a maximum CDSC of 5.00% based upon the holding period after purchase. Class B shares will generally convert to Class A shares eight years after purchase. The Fund no longer accepts investments by new or existing investors in the Fund's Class B shares, except in connection with the reinvestment of any dividend and/or capital gain distributions in Class B shares of the Fund and exchanges by existing Class B shareholders of certain other funds within the Columbia Family of Funds.
Class C shares are subject to a 1.00% CDSC on shares redeemed within 12 months after purchase.
Class I shares are not subject to sales charges and are available only to the Columbia Family of Funds.
Class R shares are not subject to sales charges and are generally available only to certain retirement plans and other investors as described in the Fund's prospectus.
Class R4 shares are not subject to sales charges and are generally available only to omnibus retirement plans and certain investors as described in the Fund's prospectus.
Class R5 shares are not subject to sales charges and are generally available only to investors purchasing through authorized investment professionals and omnibus retirement plans.
Class Y shares are not subject to sales charges and are generally available only to certain retirement plans as described in the Fund's prospectus.
Class Z shares are not subject to sales charges and are available only to eligible investors, which are subject to different investment minimums as described in the Fund's prospectus.
Note 2. Summary of Significant Accounting Policies
Basis of Preparation
The Fund is an investment company that applies the accounting and reporting guidance in the Financial Accounting Standards Board (FASB) Accounting Standards Codification Topic 946, Financial Services — Investment Companies (ASC 946). The financial statements are prepared in accordance with U.S. generally accepted accounting principles (GAAP), which requires management to make certain estimates and assumptions that affect the reported amounts of assets and liabilities, the disclosure of contingent assets and liabilities at the date of the financial statements and the reported amounts of income and expenses during the reporting period. Actual results could differ from those estimates.
The following is a summary of significant accounting policies followed by the Fund in the preparation of its financial statements.
Security Valuation
All equity securities are valued at the close of business of the New York Stock Exchange (NYSE). Equity securities are valued at the last quoted sales price on the principal exchange or market on which they trade, except for securities traded on the NASDAQ Stock Market, which are valued at the NASDAQ official close price. Unlisted securities or listed securities for which there were no sales during the day are valued at the mean of the latest
Annual Report 2016
28
COLUMBIA SMALL CAP VALUE FUND II
NOTES TO FINANCIAL STATEMENTS (continued)
February 29, 2016
quoted bid and ask prices on such exchanges or markets.
Foreign equity securities are valued based on the closing price on the foreign exchange in which such securities are primarily traded. If any foreign equity security closing prices are not readily available, the securities are valued at the mean of the latest quoted bid and ask prices on such exchanges or markets. Foreign currency exchange rates are generally determined at 4:00 p.m. Eastern (U.S.) time. Many securities markets and exchanges outside the U.S. close prior to the close of the NYSE; therefore, the closing prices for securities in such markets or on such exchanges may not fully reflect events that occur after such close but before the close of the NYSE. In those situations, foreign securities will be fair valued pursuant to a policy adopted by the Board of Trustees (the Board), including, if available, utilizing a third party pricing service to determine these fair values. The third party pricing service takes into account multiple factors, including, but not limited to, movements in the U.S. securities markets, certain depositary receipts, futures contracts and foreign exchange rates that have occurred subsequent to the close of the foreign exchange or market, to determine a good faith estimate that reasonably reflects the current market conditions as of the close of the NYSE. The fair value of a security is likely to be different from the quoted or published price, if available.
Investments in open-end investment companies, including money market funds, are valued at their latest net asset value.
Investments for which market quotations are not readily available, or that have quotations which management believes are not reflective of market value or reliable, are valued at fair value as determined in good faith under procedures approved by and under the general supervision of the Board. If a security or class of securities (such as foreign securities) is valued at fair value, such value is likely to be different from the quoted or published price for the security.
The determination of fair value often requires significant judgment. To determine fair value, management may use assumptions including but not limited to future cash flows and estimated risk premiums. Multiple inputs from various sources may be used to determine fair value.
GAAP requires disclosure regarding the inputs and valuation techniques used to measure fair value and any changes in valuation inputs or techniques. In addition, investments shall be disclosed by major category. This
information is disclosed following the Fund's Portfolio of Investments.
Security Transactions
Security transactions are accounted for on the trade date. Cost is determined and gains (losses) are based upon the specific identification method for both financial statement and federal income tax purposes.
Income Recognition
Corporate actions and dividend income are generally recorded net of any non-reclaimable tax withholdings, on the ex-dividend date or upon receipt of ex-dividend notification in the case of certain foreign securities.
The Fund may receive distributions from holdings in equity securities, business development companies (BDCs), exchange-traded funds, other regulated investment companies (RICs), and real estate investment trusts (REITs), which report information on the tax character of their distributions annually. These distributions are allocated to dividend income, capital gain and return of capital based on actual information reported. Return of capital is recorded as a reduction of the cost basis of securities held. If the Fund no longer owns the applicable securities, return of capital is recorded as a realized gain. With respect to REITs, to the extent actual information has not yet been reported, estimates for return of capital are made by the Fund's management. Management's estimates are subsequently adjusted when the actual character of the distributions is disclosed by the REITs, which could result in a proportionate change in return of capital to shareholders.
Awards from class action litigation are recorded as a reduction of cost basis if the Fund still owns the applicable securities on the payment date. If the Fund no longer owns the applicable securities, the proceeds are recorded as realized gains.
Expenses
General expenses of the Trust are allocated to the Fund and other funds of the Trust based upon relative net assets or other expense allocation methodologies determined by the nature of the expense. Expenses directly attributable to the Fund are charged to the Fund. Expenses directly attributable to a specific class of shares are charged to that share class.
Determination of Class Net Asset Value
All income, expenses (other than class-specific expenses, which are charged to that share class, as
Annual Report 2016
29
COLUMBIA SMALL CAP VALUE FUND II
NOTES TO FINANCIAL STATEMENTS (continued)
February 29, 2016
shown in the Statement of Operations) and realized and unrealized gains (losses) are allocated to each class of the Fund on a daily basis, based on the relative net assets of each class, for purposes of determining the net asset value of each class.
Federal Income Tax Status
The Fund intends to qualify each year as a regulated investment company under Subchapter M of the Internal Revenue Code, as amended, and will distribute substantially all of its taxable income (including net short-term capital gains), if any, for its tax year, and as such will not be subject to federal income taxes. In addition, the Fund intends to distribute in each calendar year substantially all of its net investment income, capital gains and certain other amounts, if any, such that the Fund should not be subject to federal excise tax. Therefore, no federal income or excise tax provision is recorded.
Distributions to Shareholders
Distributions from net investment income, if any, are declared and paid semi-annually. Net realized capital gains, if any, are distributed at least annually. Income distributions and capital gain distributions are determined in accordance with federal income tax regulations, which may differ from GAAP.
Guarantees and Indemnifications
Under the Trust's organizational documents and, in some cases, by contract, its officers and trustees are indemnified against certain liabilities arising out of the performance of their duties to the Trust or its funds. In addition, certain of the Fund's contracts with its service providers contain general indemnification clauses. The Fund's maximum exposure under these arrangements is unknown since the amount of any future claims that may be made against the Fund cannot be determined, and the Fund has no historical basis for predicting the likelihood of any such claims.
Recent Accounting Pronouncement
Fair Value Measurement (Topic 820), Disclosure for Investments in Certain Entities That Calculate Net Asset Value per Share (or Its Equivalent)
In May 2015, FASB issued Accounting Standards Update (ASU) No. 2015-07, Fair Value Measurement (Topic 820), Disclosure for Investments in Certain Entities That Calculate Net Asset Value per Share (or Its Equivalent). ASU No. 2015-07 changes the disclosure requirements for investments for which fair value is measured using
the net asset value per share practical expedient. The disclosure requirements are effective for annual periods beginning after December 15, 2015 and interim periods within those fiscal years. At this time, management is evaluating the implications of this guidance and the impact it will have on the financial statement amounts and footnote disclosures, if any.
Note 3. Fees and Other Transactions with Affiliates
Management Fees
Effective July 1, 2015, the Fund entered into a Management Agreement with Columbia Management Investment Advisers, LLC (the Investment Manager), a wholly-owned subsidiary of Ameriprise Financial, Inc. (Ameriprise Financial). Under the Management Agreement, the Investment Manager provides the Fund with investment research and advice, as well as administrative and accounting services. The management services fee is an annual fee that is equal to a percentage of the Fund's average daily net assets that declines from 0.87% to 0.75% as the Fund's net assets increase. The effective management services fee rate for the year ended February 29, 2016 was 0.82% of the Fund's average daily net assets.
Prior to July 1, 2015, the Fund paid the Investment Manager an annual fee for advisory services under an Investment Management Services Agreement and a separate annual fee for administrative and accounting services under an Administrative Services Agreement. For the period from March 1, 2015 through June 30, 2015, the investment advisory services fee paid to the Investment Manager was $4,226,817, and the administrative services fee paid to the Investment Manager was $425,209.
Other Expenses
Other expenses are for, among other things, miscellaneous expenses of the Fund or the Board, including payments to Board Services Corp., a company providing limited administrative services to the Fund and the Board. That company's expenses include boardroom and office expense, employee compensation, employee health and retirement benefits, and certain other expenses. For the year ended February 29, 2016, other expenses paid by the Fund to this company were $3,825.
Annual Report 2016
30
COLUMBIA SMALL CAP VALUE FUND II
NOTES TO FINANCIAL STATEMENTS (continued)
February 29, 2016
Compensation of Board Members
Board members, who are not officers or employees of the Investment Manager or Ameriprise Financial, are compensated for their services to the Fund as disclosed in the Statement of Operations. Under a Deferred Compensation Plan (the Plan), these Board members may elect to defer payment of up to 100% of their compensation. Deferred amounts are treated as though equivalent dollar amounts had been invested in shares of certain funds managed by the Investment Manager. The Fund's liability for these amounts is adjusted for market value changes and remains in the Fund until distributed in accordance with the Plan. All amounts payable under the Plan constitute a general unsecured obligation of the Fund.
Transactions with Affiliates
For the year ended February 29, 2016, the Fund engaged in purchase and/or sale transactions with affiliates and/or accounts that have a common investment manager (or affiliated investment managers), common directors/trustees, and/or common officers. Those sale transactions complied with provisions of Rule 17a-7 under the 1940 Act and were $45,421,849. The sale transactions resulted in a net realized gain of $8,849,066.
Transfer Agency Fees
Under a Transfer and Dividend Disbursing Agent Agreement, Columbia Management Investment Services Corp. (the Transfer Agent), an affiliate of the Investment Manager and a wholly-owned subsidiary of Ameriprise Financial, is responsible for providing transfer agency services to the Fund. The Transfer Agent has contracted with Boston Financial Data Services (BFDS) to serve as sub-transfer agent.
The Transfer Agent receives a monthly transfer agency fee based on the number or the average value of accounts, depending on the type of account. In addition, the Transfer Agent also receives sub-transfer agency fees based on a percentage of the average aggregate value of the Fund's shares maintained in omnibus accounts (other than omnibus accounts for which American Enterprise Investment Services Inc. is the broker of record or accounts where the beneficial shareholder is a customer of Ameriprise Financial Services, Inc., for which the Transfer Agent receives a per account fee). The Transfer Agent pays the fees of BFDS for services as sub-transfer agent and is not entitled to reimbursement for such fees from the Fund (with the exception of out-of-pocket fees).
The Transfer Agent also receives compensation from the Fund for various shareholder services and reimbursements for certain out-of-pocket fees. Total transfer agency fees for Class R5 shares are subject to an annual limitation of not more than 0.05% of the average daily net assets attributable to Class R5 shares. Class I and Class Y shares do not pay transfer agency fees.
For the year ended February 29, 2016, the Fund's effective transfer agency fee rates as a percentage of average daily net assets of each class were as follows:
Class A | | | 0.20 | % | |
Class B | | | 0.20 | | |
Class C | | | 0.20 | | |
Class R | | | 0.20 | | |
Class R4 | | | 0.20 | | |
Class R5 | | | 0.05 | | |
Class Z | | | 0.20 | | |
An annual minimum account balance fee of $20 may apply to certain accounts with a value below the applicable share class's initial minimum investment requirements to reduce the impact of small accounts on transfer agency fees. These minimum account balance fees are remitted to the Fund and recorded as part of expense reductions in the Statement of Operations. For the year ended February 29, 2016, these minimum account balance fees reduced total expenses of the Fund by $40.
Distribution and Service Fees
The Fund has an agreement with Columbia Management Investment Distributors, Inc. (the Distributor), an affiliate of the Investment Manager and a wholly-owned subsidiary of Ameriprise Financial, for distribution and shareholder services. The Board has approved, and the Fund has adopted, distribution and shareholder service plans (the Plans) applicable to certain share classes, which set the distribution and service fees for the Fund. These fees are calculated daily and are intended to compensate the Distributor and/or eligible selling and/or servicing agents for selling shares of the Fund and providing services to investors.
Under the Plans, the Fund pays a monthly combined distribution and service fee to the Distributor at the maximum annual rate of 0.25% of the average daily net assets attributable to Class A shares of the Fund. Also under the Plans, the Fund pays a monthly service fee at the maximum annual rate of 0.25% of the average daily net assets attributable to Class B and Class C shares of the Fund and a monthly distribution fee at the maximum
Annual Report 2016
31
COLUMBIA SMALL CAP VALUE FUND II
NOTES TO FINANCIAL STATEMENTS (continued)
February 29, 2016
annual rate of 0.75%, 0.75% and 0.50% of the average daily net assets attributable to Class B, Class C and Class R shares of the Fund, respectively.
Sales Charges
Sales charges, including front-end charges and CDSCs, received by the Distributor for distributing Fund shares were $5,263 for Class A and $8 for Class C shares for the year ended February 29, 2016.
Expenses Waived/Reimbursed by the Investment Manager and its Affiliates
The Fund's expense ratio is subject to an expense reimbursement arrangement pursuant to which fees will be waived and/or expenses reimbursed (excluding certain fees and expenses described below), so that the Fund's net operating expenses, after giving effect to fees waived/expenses reimbursed and any balance credits and/or overdraft charges from the Fund's custodian, do not exceed the annual rates of:
| | | Contractual
Expense Cap
July 1, 2015
through
June 30, 2016 | | Voluntary
Expense Cap
Prior to
July 1, 2015 | |
Class A | | | 1.36 | % | | | 1.38 | % | |
Class B | | | 2.11 | | | | 2.13 | | |
Class C | | | 2.11 | | | | 2.13 | | |
Class I | | | 0.95 | | | | 0.98 | | |
Class R | | | 1.61 | | | | 1.63 | | |
Class R4 | | | 1.11 | | | | 1.13 | | |
Class R5 | | | 1.00 | | | | 1.03 | | |
Class Y | | | 0.95 | | | | 0.98 | | |
Class Z | | | 1.11 | | | | 1.13 | | |
The contractual agreement may be modified or amended only with approval from the Investment Manager, certain of its affiliates and the Fund. Under the arrangements, the following fees and expenses are excluded from the waiver/reimbursement commitment, and therefore will be paid by the Fund, if applicable: taxes (including foreign transaction taxes), expenses associated with investments in affiliated and non-affiliated pooled investment vehicles (including mutual funds and exchange-traded funds), transaction costs and brokerage commissions, costs related to any securities lending program, dividend and interest expenses associated with securities sold short, inverse floater program fees and expenses, transaction charges and interest on borrowed money, interest and extraordinary expenses. Any fees waived and/or expenses reimbursed under the expense reimbursement arrangements described above are not recoverable by the Investment Manager or its affiliates in future periods.
Note 4. Federal Tax Information
The timing and character of income and capital gain distributions are determined in accordance with income tax regulations, which may differ from GAAP because of temporary or permanent book to tax differences.
At February 29, 2016, these differences are primarily due to differing treatment for deferral/reversal of wash sale losses, Trustees' deferred compensation and re-characterization of distributions for investments. To the extent these differences are permanent, reclassifications are made among the components of the Fund's net assets in the Statement of Assets and Liabilities. Temporary differences do not require reclassifications. In the Statement of Assets and Liabilities the following reclassifications were made:
Undistributed net investment income | | $ | (391,540 | ) | |
Accumulated net realized gain | | | 391,540 | | |
Net investment income (loss) and net realized gains (losses), as disclosed in the Statement of Operations, and net assets were not affected by this reclassification.
The tax character of distributions paid during the years indicated was as follows:
Year Ended | | February 29,
2016 | | February 28,
2015 | |
Ordinary income | | $ | 2,150,729 | | | $ | 5,639,262 | | |
Long-term capital gains | | | 168,556,776 | | | | 161,360,609 | | |
Total | | | 170,707,505 | | | | 166,999,871 | | |
Short-term capital gain distributions, if any, are considered ordinary income distributions for tax purposes.
At February 29, 2016, the components of distributable earnings on a tax basis were as follows:
Undistributed ordinary income | | $ | 2,447,953 | | |
Undistributed long-term capital gains | | | 13,806,378 | | |
Net unrealized appreciation | | | 196,720,320 | | |
At February 29, 2016, the cost of investments for federal income tax purposes was $1,213,940,856 and the aggregate gross unrealized appreciation and depreciation based on that cost was:
Unrealized appreciation | | $ | 272,668,106 | | |
Unrealized depreciation | | | (75,947,786 | ) | |
Net unrealized appreciation | | | 196,720,320 | | |
Management of the Fund has concluded that there are no significant uncertain tax positions in the Fund that would require recognition in the financial statements. However, management's conclusion may be subject to
Annual Report 2016
32
COLUMBIA SMALL CAP VALUE FUND II
NOTES TO FINANCIAL STATEMENTS (continued)
February 29, 2016
review and adjustment at a later date based on factors including, but not limited to, new tax laws, regulations, and administrative interpretations (including relevant court decisions). Generally, the Fund's federal tax returns for the prior three fiscal years remain subject to examination by the Internal Revenue Service.
Note 5. Portfolio Information
The cost of purchases and proceeds from sales of securities, excluding short-term investments and derivatives, if any, aggregated to $867,441,517 and $1,003,134,222, respectively, for the year ended February 29, 2016. The amount of purchase and sale activity impacts the portfolio turnover rate reported in the Financial Highlights.
Note 6. Affiliated Money Market Fund
The Fund invests in Columbia Short-Term Cash Fund, an affiliated money market fund established for the exclusive use by the Fund and other affiliated funds. The income earned by the Fund from such investments is included as Dividends — affiliated issuers in the Statement of Operations. As an investing fund, the Fund indirectly bears its proportionate share of the expenses of Columbia Short-Term Cash Fund.
Note 7. Line of Credit
The Fund has access to a revolving credit facility whereby the Fund may borrow for the temporary funding of shareholder redemptions or for other temporary or emergency purposes. Effective December 8, 2015, Citibank, N.A. and HSBC Bank USA, N.A. joined JPMorgan Chase Bank, N.A. (JPMorgan) as lead of a syndicate of banks under the credit facility, which is a collective agreement between the Fund and certain other funds managed by the Investment Manager, severally and not jointly, that permits collective borrowings up to $1 billion. Interest is charged to each participating fund based on its borrowings at a rate equal to the higher of (i) the overnight federal funds rate plus 1.00% or (ii) the one-month LIBOR rate plus 1.00%. Each borrowing under the credit facility matures no later than 60 days after the date of borrowing. The Fund also pays a commitment fee equal to its pro rata share of the amount of the credit facility at a rate of 0.15% per annum. The commitment fee is included in other expenses in the Statement of Operations. Prior to December 8, 2015, JPMorgan was the sole lead bank under the credit facility agreement that permitted borrowings up to $550 million under the same terms and interest rates as described above with the exception
of the commitment fee which was charged at a rate of 0.075% per annum.
The Fund had no borrowings during the year ended February 29, 2016.
Note 8. Significant Risks
Shareholder Concentration Risk
At February 29, 2016, three unaffiliated shareholders of record owned 50.4% of the outstanding shares of the Fund in one or more accounts. The Fund has no knowledge about whether any portion of those shares was owned beneficially. Subscription and redemption activity by concentrated accounts may have a significant effect on the operations of the Fund. In the case of a large redemption, the Fund may be forced to sell investments at inopportune times, including its liquid or more liquid positions, resulting in Fund losses and the Fund holding a higher percentage of less liquid or illiquid securities. Large redemptions could result in decreased economies of scale and increased operating expenses for non-redeeming Fund shareholders.
Financial Sector Risk
The Fund may be more susceptible to the particular risks that may affect companies in the financial services sector than if it were invested in a wider variety of companies in unrelated sectors. Companies in the financial services sector are subject to certain risks, including the risk of regulatory change, decreased liquidity in credit markets and unstable interest rates. Such companies may have concentrated portfolios, such as a high level of loans to real estate developers, which makes them vulnerable to economic conditions that affect that industry. Performance of such companies may be affected by competitive pressures and exposure to investments or agreements that, under certain circumstances, may lead to losses (e.g., subprime loans). Companies in the financial services sector are subject to extensive governmental regulation that may limit the amount and types of loans and other financial commitments they can make, and interest rates and fees that they may charge. In addition, profitability of such companies is largely dependent upon the availability and the cost of capital.
Note 9. Subsequent Events
Management has evaluated the events and transactions that have occurred through the date the financial statements were issued and noted no items requiring
Annual Report 2016
33
COLUMBIA SMALL CAP VALUE FUND II
NOTES TO FINANCIAL STATEMENTS (continued)
February 29, 2016
adjustment of the financial statements or additional disclosure.
Note 10. Information Regarding Pending and Settled Legal Proceedings
In December 2005, without admitting or denying the allegations, American Express Financial Corporation (AEFC, which is now known as Ameriprise Financial, Inc. (Ameriprise Financial)) entered into settlement agreements with the Securities and Exchange Commission (SEC) and Minnesota Department of Commerce (MDOC) related to market timing activities. As a result, AEFC was censured and ordered to cease and desist from committing or causing any violations of certain provisions of the Investment Advisers Act of 1940, the Investment Company Act of 1940, and various Minnesota laws. AEFC agreed to pay disgorgement of $10 million and civil money penalties of $7 million. AEFC also agreed to retain an independent distribution consultant to assist in developing a plan for distribution of all disgorgement and civil penalties ordered by the SEC in accordance with various undertakings detailed at http://www.sec.gov/litigation/admin/ia-2451.pdf. Ameriprise Financial and its affiliates have cooperated with the SEC and the MDOC in these legal proceedings, and have made regular reports to the Funds' Boards of Trustees.
Ameriprise Financial and certain of its affiliates have historically been involved in a number of legal, arbitration and regulatory proceedings, including routine litigation, class actions, and governmental actions, concerning matters arising in connection with the conduct of their business activities. Ameriprise Financial believes that the Funds are not currently the subject of, and that neither Ameriprise Financial nor any of its affiliates are the subject of, any pending legal, arbitration or regulatory proceedings that are likely to have a material adverse effect on the Funds or the ability of Ameriprise Financial or its affiliates to perform under their contracts with the Funds. Ameriprise Financial is required to make quarterly (10-Q), annual (10-K) and, as necessary, 8-K filings with the SEC on legal and regulatory matters that relate to Ameriprise Financial and its affiliates. Copies of these filings may be obtained by accessing the SEC website at www.sec.gov.
There can be no assurance that these matters, or the adverse publicity associated with them, will not result in increased fund redemptions, reduced sale of fund shares or other adverse consequences to the Funds. Further, although we believe proceedings are not likely to have a material adverse effect on the Funds or the ability of
Ameriprise Financial or its affiliates to perform under their contracts with the Funds, these proceedings are subject to uncertainties and, as such, we are unable to estimate the possible loss or range of loss that may result. An adverse outcome in one or more of these proceedings could result in adverse judgments, settlements, fines, penalties or other relief that could have a material adverse effect on the consolidated financial condition or results of operations of Ameriprise Financial.
Annual Report 2016
34
COLUMBIA SMALL CAP VALUE FUND II
REPORT OF INDEPENDENT REGISTERED PUBLIC ACCOUNTING FIRM
To the Trustees of Columbia Funds Series Trust and the Shareholders of
Columbia Small Cap Value Fund II
In our opinion, the accompanying statement of assets and liabilities, including the portfolio of investments, and the related statements of operations and of changes in net assets and the financial highlights present fairly, in all material respects, the financial position of Columbia Small Cap Value Fund II (the "Fund," a series of Columbia Funds Series Trust) at February 29, 2016, and the results of its operations, the changes in its net assets and the financial highlights for each of the periods indicated, in conformity with accounting principles generally accepted in the United States of America. These financial statements and financial highlights (hereafter referred to as "financial statements") are the responsibility of the Fund's management. Our responsibility is to express an opinion on these financial statements based on our audits. We conducted our audits of these financial statements in accordance with the standards of the Public Company Accounting Oversight Board (United States). Those standards require that we plan and perform the audit to obtain reasonable assurance about whether the financial statements are free of material misstatement. An audit includes examining, on a test basis, evidence supporting the amounts and disclosures in the financial statements, assessing the accounting principles used and significant estimates made by management, and evaluating the overall financial statement presentation. We believe that our audits, which included confirmation of securities at February 29, 2016 by correspondence with the custodian, brokers and transfer agent, and the application of alternative auditing procedures where such confirmations had not been received, provide a reasonable basis for our opinion.
PricewaterhouseCoopers LLP
Minneapolis, MN
April 21, 2016
Annual Report 2016
35
COLUMBIA SMALL CAP VALUE FUND II
FEDERAL INCOME TAX INFORMATION
(Unaudited)
The Fund hereby designates the following tax attributes for the fiscal year ended February 29, 2016. Shareholders will be notified in early 2017 of the amounts for use in preparing 2016 income tax returns.
Tax Designations:
| Qualified Dividend Income | | | 100.00 | % | |
| Dividends Received Deduction | | | 100.00 | % | |
Capital Gain Dividend | | $ | 168,524,661 | | |
Qualified Dividend Income. For taxable, non-corporate shareholders, the percentage of ordinary income distributed during the fiscal year that represents qualified dividend income subject to reduced tax rates.
Dividends Received Deduction. The percentage of ordinary income distributed during the fiscal year that qualifies for the corporate dividends received deduction.
Capital Gain Dividend. The Fund designates as a capital gain dividend the amount reflected above, or if subsequently determined to be different, the net capital gain of such fiscal period.
Annual Report 2016
36
COLUMBIA SMALL CAP VALUE FUND II
Shareholders elect the Board that oversees the Fund's operations. The Board appoints officers who are responsible for day-to-day business decisions based on policies set by the Board. The following table provides basic biographical information about the Fund's Trustees, including their principal occupations during the past five years, although specific titles for individuals may have varied over the period. Under current Board policy, members generally may serve through the end of the calendar year in which they reach either the mandatory retirement age established by the Board or the fifteenth anniversary of the first Board meeting they attended as a member of the Board.
Trustees
Independent Trustees
Name,
Address,
Year of Birth | | Position Held With
the Funds and Length of
Service | | Principal Occupation(s)
During the Past Five Years
and Other Relevant
Professional Experience | | Number of
Funds in the
Columbia
Funds Complex
Overseen | | Other Directorships
Held by Trustee
During the Past
Five Years | |
Kathleen Blatz
901 S. Marquette Ave.
Minneapolis, MN 55402
1954 | | Trustee since 1/06 for RiverSource Funds and since 6/11 for Nations Funds | | Attorney; specializing in arbitration and mediation; Chief Justice, Minnesota Supreme Court, 1998-2006; Associate Justice, Minnesota Supreme Court, 1996-1998; Fourth Judicial District Court Judge, Hennepin County, 1994-1996; Attorney in private practice and public service, 1984-1993; State Representative, Minnesota House of Representatives, 1979-1993, which included service on the Tax and Financial Institutions and Insurance Committees | | | 124 | | | Trustee, BlueCross BlueShield of Minnesota (Chair of the Business Development Committee) since 2009; Chair of the Robina Foundation since August 2013 | |
Edward J. Boudreau, Jr.
901 S. Marquette Ave.
Minneapolis, MN 55402
1944 | | Trustee since 6/11 for RiverSource Funds and since 1/05 for Nations Funds | | Managing Director, E.J. Boudreau & Associates (consulting) since 2000; FINRA Industry Arbitrator, 2002-present; Chairman and Chief Executive Officer, John Hancock Funds (asset management), Chairman and Interested Trustee for open-end and closed-end funds offered by John Hancock, 1989-2000; John Hancock Life Insurance Company, including SVP and Treasurer and SVP Information Technology, 1968-1988 | | | 122 | | | Former Trustee, Boston Museum of Science (Chair of Finance Committee), 1985-2013; former Trustee, BofA Funds Series Trust (11 funds), 2005-2011 | |
Pamela G. Carlton
901 S. Marquette Ave.
Minneapolis, MN 55402
1954 | | Trustee since 7/07 for RiverSource Funds and since 6/11 for Nations Funds | | President, Springboard-Partners in Cross Cultural Leadership (consulting company) since 2003; Managing Director of US Equity Research, JP Morgan Chase, 1999-2003; Director of US Equity Research, Chase Asset Management, 1996-1999; Co-Director Latin America Research, 1993-1996, COO Global Research, 1992-1996, Co-Director of US Research, 1991-1992, Investment Banker, Morgan Stanley, 1982-1991 | | | 124 | | | Trustee, New York Presbyterian Hospital Board (Executive Committee and Chair of Human Resources Committee) since 1996 | |
Annual Report 2016
37
COLUMBIA SMALL CAP VALUE FUND II
TRUSTEES AND OFFICERS (continued)
Independent Trustees (continued)
Name,
Address,
Year of Birth | | Position Held With
the Funds and Length of
Service | | Principal Occupation(s)
During the Past Five Years
and Other Relevant
Professional Experience | | Number of
Funds in the
Columbia
Funds Complex
Overseen | | Other Directorships
Held by Trustee
During the Past
Five Years | |
William P. Carmichael
901 S. Marquette Ave.
Minneapolis, MN 55402
1943 | | Trustee since 6/11 for RiverSource Funds and since 2003 for Nations Funds; Chair of the Board from 1/14-11/15 | | Retired; Co-founder, The Succession Fund (provides exit strategies to owners of privately held companies), 1998-2007; Adjunct Professor of Finance, Kelley School of Business, Indiana University, 1993-2007; Senior Vice President, Sara Lee Corporation, 1991-1993; Senior Vice President and Chief Financial Officer, Beatrice Foods Company, 1984-1990; Vice President, Esmark, Inc., 1973-1984; Associate, Price Waterhouse, 1968-1972 | | | 124 | | | Director, The Finish Line (athletic shoes and apparel) since July 2003; Director, International Textile Corp. since 2012; Director, hhgregg since May, 2015; former Director, Cobra Electronics Corporation (electronic equipment manufacturer), 1994-August 2014; former Director, Spectrum Brands, Inc. (consumer products), 2002-2009; former Director, Simmons Company (bedding), 2004-2010; former Trustee, BofA Funds Series Trust (11 funds), 2009-2011; former Director, McMoRan Exploration Company (oil and gas exploration and development), 2010-2013 | |
Patricia M. Flynn
901 S. Marquette Ave.
Minneapolis, MN 55402
1950 | | Trustee since 11/04 for RiverSource Funds and since 6/11 for Nations Funds | | Trustee Professor of Economics and Management, Bentley University since 1976 (also teaches and conducts research on corporate governance); Dean, McCallum Graduate School of Business, Bentley University, 1992-2002 | | | 124 | | | Trustee, MA Taxpayers Foundation since 1997; Board of Governors, Innovation Institute, MA Technology Collaborative since 2010 | |
William A. Hawkins
901 S. Marquette Ave.
Minneapolis, MN 55402
1942 | | Chair of the Board since 11/15; Trustee since 6/11 for RiverSource Funds and since 1/05 for Nations Funds | | Managing Director, Overton Partners (financial consulting) since August 2010; President and Chief Executive Officer, California General Bank, N.A., January 2008-August 2010; Operation Hope, COO, 2004-2007; IndyMac Bancorp, President, CBG, 1999-2003; American General Bank, President, 1997-1999; Griffin Financial Services, CEO, 1981-1997; The Griffin Funds, CEO, 1992-1998 | | | 124 | | | Former Trustee, BofA Funds Series Trust (11 funds), 2009-2015 | |
R. Glenn Hilliard
901 S. Marquette Ave.
Minneapolis, MN 55402
1943 | | Trustee since 6/11 for RiverSource Funds and since 1/05 for Nations Funds | | Chairman and Chief Executive Officer, Hilliard Group LLC (investing and consulting) since April 2003; Non-Executive Director & Chairman, CNO Financial Group, Inc. (insurance), 2003-2011; Chair & CEO, ING Americas, 1996-2003 | | | 122 | | | Chairman, BofA Funds Series Trust (11 funds); former Director, CNO Financial Group, Inc. (insurance), 2003-2011 | |
Annual Report 2016
38
COLUMBIA SMALL CAP VALUE FUND II
TRUSTEES AND OFFICERS (continued)
Independent Trustees (continued)
Name,
Address,
Year of Birth | | Position Held With
the Funds and Length of
Service | | Principal Occupation(s)
During the Past Five Years
and Other Relevant
Professional Experience | | Number of
Funds in the
Columbia
Funds Complex
Overseen | | Other Directorships
Held by Trustee
During the Past
Five Years | |
Catherine James Paglia
901 S. Marquette Ave.
Minneapolis, MN 55402
1952 | | Trustee since 11/04 for RiverSource Funds and since 6/11 for Nations Funds | | Director, Enterprise Asset Management, Inc. (private real estate and asset management company) since September 1998; Managing Director and Partner, Interlaken Capital, Inc., 1989-1997; Managing Director, Morgan Stanley, 1982-1989; Vice President, Investment Banking, 1980-1982, Associate, Investment Banking, 1976-1980, Dean Witter Reynolds, Inc. | | | 124 | | | Director, Valmont Industries, Inc. (irrigation systems manufacturer) since 2012; Trustee, Carleton College (on the Investment Committee); Trustee, Carnegie Endowment for International Peace (on the Investment Committee) | |
Leroy C. Richie
901 S. Marquette Ave.
Minneapolis, MN 55402
1941 | | Trustee since 2000 for Seligman Funds, since 11/08 for RiverSource Funds and since 6/11 for Nations Funds | | Counsel, Lewis & Munday, P.C. (law firm) since 2004; Vice President and General Counsel, Automotive Legal Affairs, Chrysler Corporation, 1993-1997 | | | 122 | | | Lead Outside Director, Infinity Resources, Inc. (oil and gas exploration and production) since 1994; Lead Outside Director, Digital Ally, Inc. (digital imaging) since September 2005; Trustee, Marygrove College (Chair of Finance Committee) since 2007; former Director, OGE Energy Corp. (energy and energy services), 2007-2014 | |
Minor M. Shaw
901 S. Marquette Ave.
Minneapolis, MN 55402
1947 | | Trustee since 6/11 for RiverSource Funds and since 2003 for Nations Funds | | President, Micco LLC (private investments) since 2011; President, Micco Corp. (family investment business), 1998-2011 | | | 124 | | | Director, Piedmont Natural Gas; Director, BlueCross BlueShield of South Carolina since April 2008; Chair of the Duke Endowment; Director, National Association of Corporate Directors, Carolinas Chapter since 2013; Chair of Greenville — Spartanburg Airport Commission; former Trustee, BofA Funds Series Trust (11 funds), 2003-2011 | |
Alison Taunton-Rigby
901 S. Marquette Ave.
Minneapolis, MN 55402
1944 | | Trustee since 11/02 for RiverSource Funds and since 6/11 for Nations Funds | | Managing Director, Forester Biotech (consulting), 2001-2003; Chief Executive Officer and Director, RiboNovix, Inc., (biotechnology), 2003-2010; President and Chief Executive Officer of CMT Inc., 2001-2003; Aquila Biopharmaceuticals Inc., 1996-2000; Cambridge Biotech Corporation, 1995-1996; Mitotix Inc., 1993-1994 | | | 124 | | | Director, Abt Associates (government contractor) since 2001; Director, Boston Children's Hospital since 2002; Director, Healthways, Inc. (health and well-being solutions) since 2005; Director, ICI Mutual Insurance Company since 2011 | |
Annual Report 2016
39
COLUMBIA SMALL CAP VALUE FUND II
TRUSTEES AND OFFICERS (continued)
Interested Trustee Not Affiliated with Investment Manager*
Name,
Address,
Year of Birth | | Position Held With
Funds and Length of
Service | | Principal Occupation(s)
During Past Five Years
and Other Relevant
Professional Experience | | Number of
Funds in the
Fund Family
Overseen by
Board Member | | Other Present or Past
Directorships/
Trusteeships
(Within Past 5 Years) | |
Anthony M. Santomero
901 S. Marquette Ave.
Minneapolis, MN 55402
1946 | | Trustee since 6/11 for RiverSource Funds and since 1/08 for Nations Funds | | Richard K. Mellon Professor Emeritus of Finance, The Wharton School, University of Pennsylvania since 2002; Senior Advisor, McKinsey & Company (consulting), 2006-2008; President, Federal Reserve Bank of Philadelphia, 2000-2006; Professor of Finance, The Wharton School, University of Pennsylvania, 1972-2002 | | | 122 | | | Trustee, Penn Mutual Life Insurance Company since March 2008; Director, Renaissance Reinsurance Ltd. since May 2008; Director, Citigroup Inc. since 2009; Director, Citibank, N.A. since 2009; former Trustee, BofA Funds Series Trust (11 funds), 2008-2011 | |
* Dr. Santomero is not an affiliated person of the Investment Manager or Ameriprise Financial. However, he is currently deemed by the Funds to be an "interested person" (as defined in the 1940 Act) of the Funds because he serves as a Director of Citigroup Inc. and Citibank, N.A., companies that may directly or through subsidiaries and affiliates engage from time-to-time in brokerage execution, principal transactions and lending relationships with the Funds or accounts advised/managed by the Investment Manager.
Annual Report 2016
40
COLUMBIA SMALL CAP VALUE FUND II
TRUSTEES AND OFFICERS (continued)
Interested Trustee Affiliated with Investment Manager*
Name,
Address,
Year of Birth | | Position Held With
the Funds and Length of
Service | | Principal Occupation(s)
During Past Five Years
and Other Relevant
Professional Experience | | Number of
Funds in the
Columbia
Funds Complex
Overseen | | Other Directorships
Held by Trustee
During the Past
Five Years | |
William F. Truscott
c/o Columbia Management Investment Advisers, LLC,
225 Franklin St.
Boston, MA 02110
1960 | | Trustee since 11/01 for RiverSource Funds and since 6/11 for Nations Funds; Senior Vice President since 2002 for RiverSource Funds and since 5/10 for Nations Funds | | Chairman of the Board and President, Columbia Management Investment Advisers, LLC since May 2010 and February 2012, respectively (previously President and Chief Investment Officer, 2001-April 2010); Chief Executive Officer, Global Asset Management, Ameriprise Financial, Inc. since September 2012 (previously Chief Executive Officer, U.S. Asset Management & President, Annuities, May 2010-September 2012 and President — U.S. Asset Management and Chief Investment Officer, 2005-April 2010); Director and Chief Executive Officer, Columbia Management Investment Distributors, Inc. since May 2010 and February 2012, respectively (previously Chairman of the Board and Chief Executive Officer, 2006-April 2010); Chairman of the Board and Chief Executive Officer, RiverSource Distributors, Inc. since 2006; Director, Threadneedle Asset Management Holdings, SARL since 2014; President and Chief Executive Officer, Ameriprise Certificate Company, 2006-August 2012. | | | 182 | | | Chairman of the Board, Columbia Management Investment Advisers, LLC since May 2010; Director, Columbia Management Investment Distributors, Inc. since May 2010; Former Director, Ameriprise Certificate Company, 2006-January 2013 | |
* Interested person (as defined under the 1940 Act) by reason of being an officer, director, security holder and/or employee of the Investment Manager or Ameriprise Financial.
The Statement of Additional Information has additional information about the Fund's Board members and is available, without charge, upon request by calling 800.345.6611; contacting your financial intermediary; or visiting columbiathreadneedle.com/us.
Annual Report 2016
41
COLUMBIA SMALL CAP VALUE FUND II
TRUSTEES AND OFFICERS (continued)
The Board has appointed officers who are responsible for day-to-day business decisions based on policies it has established. The officers serve at the pleasure of the Board. The following table provides basic information about the Officers of the Fund, including principal occupations during the past five years, although their specific titles may have varied over the period. In addition to Mr. Truscott, who is Senior Vice President, the Fund's other officers are:
Fund Officers
Name,
Address and
Year of Birth | | Position and Year
First Appointed to
Position for any Fund
in the Columbia
Funds Complex or a
Predecessor Thereof | | Principal Occupation(s) During Past Five Years | |
Christopher O. Petersen
5228 Ameriprise
Financial Center
Minneapolis, MN 55474
Born 1970 | | President and Principal Executive Officer (2015) | | Vice President and Lead Chief Counsel, Ameriprise Financial, Inc. since January 2015 (previously, Vice President and Chief Counsel January 2010-December 2014; and Vice President and Group Counsel or Counsel 2004-January 2010); officer of Columbia Funds and affiliated funds since 2007. | |
Michael G. Clarke
225 Franklin Street
Boston, MA 02110
Born 1969 | | Treasurer (2011), Chief Financial Officer (2009) and Chief Accounting Officer (2015) | | Vice President — Mutual Fund Administration, Columbia Management Investment Advisers, LLC, since May 2010; Managing Director of Fund Administration, Columbia Management Advisors, LLC, September 2004-April 2010; senior officer of Columbia Funds and affiliated funds since 2002. | |
Paul B. Goucher
100 Park Avenue
New York, NY 10017
Born 1968 | | Senior Vice President (2011), Chief Legal Officer (2015) and Assistant Secretary (2008) | | Vice President and Lead Chief Counsel, Ameriprise Financial, Inc. since November 2008 and January 2013, respectively (previously Chief Counsel, January 2010-January 2013 and Group Counsel, November 2008-January 2010). | |
Thomas P. McGuire
225 Franklin Street
Boston, MA 02110
Born 1972 | | Senior Vice President and Chief Compliance Officer (2012) | | Vice President — Asset Management Compliance, Ameriprise Financial, Inc., since May 2010; Chief Compliance Officer, Ameriprise Certificate Company since September 2010; Compliance Executive, Bank of America, 2005-April 2010. | |
Colin Moore
225 Franklin Street
Boston, MA 02110
Born 1958 | | Senior Vice President (2010) | | Executive Vice President and Global Chief Investment Officer, Ameriprise Financial, Inc., since July 2013; Director and Global Chief Investment Officer, Columbia Management Investment Advisers, LLC since May 2010; Manager, Managing Director and Chief Investment Officer, Columbia Management Advisors, LLC, 2007-April 2010. | |
Michael E. DeFao
225 Franklin Street
Boston, MA 02110
Born 1968 | | Vice President (2011) and Assistant Secretary (2010) | | Vice President and Chief Counsel, Ameriprise Financial, Inc. since May 2010; Associate General Counsel, Bank of America, 2005-April 2010. | |
Amy Johnson
5228 Ameriprise
Financial Center
Minneapolis, MN 55474
Born 1965 | | Vice President (2006) | | Managing Director and Chief Operating Officer, Columbia Management Investment Advisers, LLC since May 2010 (previously Chief Administrative Officer, 2009-April 2010, and Vice President — Asset Management and Trust Company Services, 2006-2009). | |
Lyn Kephart-Strong
5228 Ameriprise
Financial Center
Minneapolis, MN 55474
Born 1960 | | Vice President (2015) | | President, Columbia Management Investment Services Corp. since October 2014; Vice President & Resolution Officer, Ameriprise Trust Company since August 2009; President, RiverSource Service Corporation 2004-2010. | |
Ryan C. Larrenaga
225 Franklin Street
Boston, MA 02110
Born 1970 | | Vice President and Secretary (2015) | | Vice President and Group Counsel, Ameriprise Financial, Inc. since August 2011 (previously, Counsel from May 2010 to August 2011); Assistant General Counsel, Bank of America, 2005-April 2010; officer of Columbia Funds and affiliated funds since 2005. | |
Annual Report 2016
42
COLUMBIA SMALL CAP VALUE FUND II
IMPORTANT INFORMATION ABOUT THIS REPORT
Each fund mails one shareholder report to each shareholder address. If you would like more than one report, please call shareholder services at 800.345.6611 and additional reports will be sent to you.
The policy of the Board is to vote the proxies of the companies in which each fund holds investments consistent with the procedures as stated in the Statement of Additional Information (SAI). You may obtain a copy of the SAI without charge by calling 800.345.6611; contacting your financial intermediary; visiting columbiathreadneedle.com/us; or searching the website of the Securities and Exchange Commission (SEC) at sec.gov. Information regarding how each fund voted proxies relating to portfolio securities is filed with the SEC by August 31st for the most recent 12-month period ending June 30th of that year, and is available without charge by visiting columbiathreadneedle.com/us, or searching the website of the SEC at sec.gov.
Each fund files a complete schedule of portfolio holdings with the SEC for the first and third quarters of each fiscal year on Form N-Q. Each fund's Form N-Q is available on the SEC's website at sec.gov and may be reviewed and copied at the SEC's Public Reference Room in Washington, D.C. Information on the operation of the Public Reference Room may be obtained by calling 800.SEC.0330. Each fund's complete schedule of portfolio holdings, as filed on Form N-Q, can also be obtained without charge, upon request, by calling 800.345.6611.
Annual Report 2016
43
Columbia Small Cap Value Fund II
P.O. Box 8081
Boston, MA 02266-8081

This information is for use with concurrent or prior delivery of a fund prospectus. Please read and consider the investment objectives, risks, charges and expenses for any fund carefully before investing. For a prospectus and summary prospectus, which contains this and other important information about the Fund, go to columbiathreadneedle.com/us. The Fund is distributed by Columbia Management Investment Distributors, Inc., member FINRA, and managed by Columbia Management Investment Advisers, LLC.
Columbia Threadneedle Investments (Columbia Threadneedle) is the global brand name of the Columbia and Threadneedle group of companies.
All rights reserved. Columbia Management Investment Distributors, Inc., 225 Franklin Street, Boston, MA 02110-2804
© 2016 Columbia Management Investment Advisers, LLC.
columbiathreadneedle.com/us
ANN230_02_F01_(04/16)

ANNUAL REPORT
February 29, 2016

COLUMBIA LARGE CAP GROWTH FUND V
(formerly Columbia Marsico Growth Fund)

ABOUT COLUMBIA THREADNEEDLE INVESTMENTS
Columbia Threadneedle Investments is a leading global asset management group that provides a broad range of actively managed investment strategies and solutions for individual, institutional and corporate clients around the world.
With more than 2,000 people, including over 450 investment professionals based in North America, Europe and Asia, we manage $472 billion* of assets across developed and emerging market equities, fixed income, asset allocation solutions and alternatives. We are the 13th largest manager of long-term mutual fund assets in the U.S.** and the 4th largest manager of retail funds in the U.K.***
Our priority is the investment success of our clients. We aim to deliver the investment outcomes they expect through an investment approach that is team-based, performance-driven and risk-aware. Our culture is dynamic and interactive. By sharing our insights across asset classes and geographies, we generate richer perspectives on global, regional and local investment landscapes. The ability to exchange and debate investment ideas in a collaborative environment enriches our teams' investment processes. More importantly, it results in better informed investment decisions for our clients.
Columbia funds are distributed by Columbia Management Investment Distributors, Inc., member FINRA, and managed by Columbia Management Investment Advisers, LLC.
Columbia Threadneedle Investments (Columbia Threadneedle) is the global brand name of the Columbia and Threadneedle group of companies.
* In U.S. dollars as of December 31, 2015. Source: Ameriprise Q4 Earnings Release. Includes all assets managed by entities in the Columbia and Threadneedle groups of companies. Contact us for more current data.
** Source: ICI as of December 31, 2015 for Columbia Management Investment Advisers, LLC.
*** Source: Investment Association as of September 2015 for Threadneedle Asset Management Limited.
© 2016 Columbia Management Investment Advisers, LLC. All rights reserved.
Not part of the shareholder report
Investment strategies to help meet investor needs
We are committed to helping investors navigate financial challenges to reach their desired outcomes. The possibilities are endless.
Your success is our priority.
Retire comfortably
Fund college or higher education
Leave a legacy
Generate an appropriate stream of income in retirement
Traditional approaches to income may no longer be adequate — and they may no longer provide the diversification benefits they once did. Investors need to rethink how they generate retirement income.
Worried about running out of income? You are not alone.
Navigate a changing interest rate environment
Even in today's challenging interest rate environment, it's still possible to navigate markets and achieve your goals.
Make investment choices designed specifically for this market environment.
Maximize after-tax returns
In an environment where what you keep is more important than what you earn, municipal bonds can help mitigate higher taxes while providing attractive yields compared to other investment options.
You've worked too hard building your wealth to lose it to taxes.
Grow assets to achieve financial goals
Finding growth opportunities in today's complex market environment requires strong research capabilities, creative thinking and a disciplined approach.
Do your investments deliver the portfolio growth you need?
Ease the impact of volatile markets
With increasing concerns about market volatility, investors should consider diversifying their portfolios with non-traditional holdings.
Interested in turning volatility into opportunity?
To find out more, contact your financial professional, call 800.426.3750 or visit columbiathreadneedle.com/us
Not part of the shareholder report
 Dear Shareholder,
Today's investors are typically focused on outcomes, like living a certain retirement lifestyle, paying for college education or building a legacy. But in today's complex global investment landscape, even simple goals are not easily achieved.
At Columbia Threadneedle Investments, we aspire to help satisfy five core needs of today's investors:
n Generate an appropriate stream of income in retirement
Traditional approaches to generating income may not provide the diversification benefits they once did, and they may actually introduce unwanted risk in today's market. To seek to improve your potential to live comfortably long term, we endeavor to pursue investments that explore less traveled paths to income.
n Navigate a changing interest rate environment
Today's uncertain market environment includes the prospect of a rise in interest rates. Blending traditional investments with non-traditional or alternative products may help protect your wealth during periods of volatility. We can attempt to help strengthen your portfolio with agile products designed to take on the market's ups and downs.
n Maximize after-tax returns
In an environment where what you keep may be more important than what you earn, municipal bonds can help mitigate high tax burdens while providing potentially attractive yields. Our state and federal tax-exempt products are aimed at helping investors manage risk, minimize the fluctuation of capital and grow wealth on a more tax-efficient basis.
n Grow assets to achieve financial goals
We believe that finding and protecting growth comes from a disciplined security selection process designed to create excess return. Our goal is to provide investment solutions built to help you face today's market challenges and grow your assets at each crossroad of your journey.
n Ease the impact of volatile markets
Despite a bull market run that has benefited many investors over the past several years, it's important to remember the lessons of 2008 and the value that a well-diversified portfolio may provide through times of market volatility. We are here to help you hold onto the savings you have worked tirelessly to amass, and to provide you the best opportunity to maintain your standard of living regardless of market conditions.
Find out today how we can help you confidently invest to realize your dreams. Please visit us at blog.columbiathreadneedleus.com/our-best-ideas to learn more about our unique investment solutions.
The world is constantly changing, but our priority remains the same: to help you secure your finances, meet your goals and achieve success. Thank you for your continued investment with us.
Sincerely,

Christopher O. Petersen
President, Columbia Funds
Investors should consider the investment objectives, risks, charges and expenses of a mutual fund carefully before investing. For a free prospectus and summary prospectus, which contains this and other important information about a fund, visit columbiathreadneedle.com/us. The prospectus should be read carefully before investing.
Columbia Funds are distributed by Columbia Management Investment Distributors, Inc., member FINRA, and managed by Columbia Management Investment Advisers, LLC.
© 2016 Columbia Management Investment Advisers, LLC. All rights reserved.
COLUMBIA LARGE CAP GROWTH FUND V
Performance Overview | | | 2 | | |
Manager Discussion of Fund Performance | | | 4 | | |
Understanding Your Fund's Expenses | | | 6 | | |
Portfolio of Investments | | | 7 | | |
Statement of Assets and Liabilities | | | 12 | | |
Statement of Operations | | | 14 | | |
Statement of Changes in Net Assets | | | 15 | | |
Financial Highlights | | | 18 | | |
Notes to Financial Statements | | | 27 | | |
Report of Independent Registered Public Accounting Firm | | | 35 | | |
Federal Income Tax Information | | | 36 | | |
Trustees and Officers | | | 37 | | |
Important Information About This Report | | | 43 | | |
Fund Investment Manager
Columbia Management Investment
Advisers, LLC
225 Franklin Street
Boston, MA 02110
Fund Distributor
Columbia Management Investment
Distributors, Inc.
225 Franklin Street
Boston, MA 02110
Fund Transfer Agent
Columbia Management Investment
Services Corp.
P.O. Box 8081
Boston, MA 02266-8081
For more information about any of the funds, please visit columbiathreadneedle.com/us or call 800.345.6611. Customer Service Representatives are available to answer your questions Monday through Friday from 8 a.m. to 7 p.m. Eastern time.
The views expressed in this report reflect the current views of the respective parties. These views are not guarantees of future performance and involve certain risks, uncertainties and assumptions that are difficult to predict, so actual outcomes and results may differ significantly from the views expressed. These views are subject to change at any time based upon economic, market or other conditions and the respective parties disclaim any responsibility to update such views. These views may not be relied on as investment advice and, because investment decisions for a Columbia fund are based on numerous factors, may not be relied on as an indication of trading intent on behalf of any particular Columbia fund. References to specific securities should not be construed as a recommendation or investment advice.
COLUMBIA LARGE CAP GROWTH FUND V
Performance Summary
n Columbia Large Cap Growth Fund V (the Fund) Class A shares returned -11.70% excluding sales charges for the 12-month period that ended February 29, 2016.
n The Fund underperformed its benchmark, the Russell 1000 Growth Index, which returned -5.05% for the same time period.
n In a period of heightened market volatility, stock selection detracted from Fund results relative to its benchmark.
Average Annual Total Returns (%) (for period ended February 29, 2016)
| | | Inception | | 1 Year | | 5 Years | | 10 Years | |
Class A | | 12/31/97 | | | | | | | | | | | | | |
Excluding sales charges | | | | | -11.70 | | | | 7.45 | | | | 4.73 | | |
Including sales charges | | | | | | | -16.79 | | | | 6.18 | | | | 4.11 | | |
Class B | | 12/31/97 | | | | | | | | | | | | | |
Excluding sales charges | | | | | | | -12.35 | | | | 6.64 | | | | 3.94 | | |
Including sales charges | | | | | | | -15.26 | | | | 6.44 | | | | 3.94 | | |
Class C | | 12/31/97 | | | | | | | | | | | | | |
Excluding sales charges | | | | | | | -12.37 | | | | 6.64 | | | | 3.95 | | |
Including sales charges | | | | | | | -12.96 | | | | 6.64 | | | | 3.95 | | |
Class I* | | 09/27/10 | | | -11.30 | | | | 7.96 | | | | 4.99 | | |
Class R | | 01/23/06 | | | -11.88 | | | | 7.19 | | | | 4.45 | | |
Class R4* | | 11/08/12 | | | -11.49 | | | | 7.62 | | | | 4.81 | | |
Class R5* | | 11/08/12 | | | -11.34 | | | | 7.72 | | | | 4.86 | | |
Class W* | | 09/27/10 | | | -11.64 | | | | 7.47 | | | | 4.74 | | |
Class Z | | 12/31/97 | | | -11.45 | | | | 7.72 | | | | 4.99 | | |
Russell 1000 Growth Index | | | | | | | -5.05 | | | | 10.95 | | | | 7.74 | | |
Returns for Class A are shown with and without the maximum initial sales charge of 5.75%. Returns for Class B are shown with and without the applicable contingent deferred sales charge (CDSC) of 5.00% in the first year, declining to 1.00% in the sixth year and eliminated thereafter. Returns for Class C are shown with and without the 1.00% CDSC for the first year only. The Fund's other classes are not subject to sales charges and have limited eligibility. Please see the Fund's prospectus for details. Performance for different share classes will vary based on differences in sales charges and fees associated with each class. All results shown assume reinvestment of distributions during the period. Returns do not reflect the deduction of taxes that a shareholder may pay on Fund distributions or on the redemption of Fund shares. Performance results reflect the effect of any fee waivers or reimbursements of Fund expenses by Columbia Management Investment Advisers, LLC and/or any of its affiliates. Absent these fee waivers or expense reimbursement arrangements, performance results would have been lower.
The performance information shown represents past performance and is not a guarantee of future results. The investment return and principal value of your investment will fluctuate so that your shares, when redeemed, may be worth more or less than their original cost. Current performance may be lower or higher than the performance information shown. You may obtain performance information current to the most recent month-end by contacting your financial intermediary, visiting columbiathreadneedle.com/us or calling 800.345.6611.
*The returns shown for periods prior to the share class inception date (including returns for the Life of the Fund, if shown, which are since Fund inception) include the returns of the Fund's oldest share class. Since the Fund launched more than one class of shares at its inception, Class A shares were used. These returns are adjusted to reflect any higher class-related operating expenses of the newer share classes, as applicable. Please visit columbiathreadneedle.com/us/investment-products/mutual-funds/appended-performance for more information.
Effective November 20, 2015 the Fund compares its performance to that of the Russell 1000 Growth Index (replacing the S&P 500 Index). The Fund's investment manager believes that the new index provides a more appropriate basis for comparing the Fund's performance in light of the changes made to the Fund's name and principal investment strategies.
The Russell 1000 Growth Index, an unmanaged index, measures the performance of those Russell 1000 Index companies with higher price-to-book ratios and higher forecasted growth values.
The S&P 500 Index, an unmanaged index, measures the performance of 500 widely held, large-capitalization U.S. stocks and is frequently used as a general measure of market performance.
Indices are not available for investment, are not professionally managed and do not reflect sales charges, fees, brokerage commissions, taxes or other expenses of investing. Securities in the Fund may not match those in an index.
Annual Report 2016
2
COLUMBIA LARGE CAP GROWTH FUND V
PERFORMANCE OVERVIEW (continued)
Performance of a Hypothetical $10,000 Investment (March 1, 2006 – February 29, 2016)
The chart above shows the change in value of a hypothetical $10,000 investment in Class A shares of Columbia Large Cap Growth V Fund during the stated time period, and does not reflect the deduction of taxes that a shareholder may pay on Fund distributions or on the redemption of Fund shares.
Annual Report 2016
3
COLUMBIA LARGE CAP GROWTH FUND V
MANAGER DISCUSSION OF FUND PERFORMANCE
Portfolio Management
John Wilson, CFA
Peter Deininger, CFA, CAIA
Tchintcia Barros, CFA
Effective November 20, 2015, Marsico Capital Management, LLC (Marsico) no longer serves as the subadviser to the Fund and Columbia Management Investment Advisers, LLC assumed the day-to-day management of the Fund's portfolio.
Morningstar Style BoxTM

The Morningstar Style BoxTM is based on a fund's portfolio holdings. For equity funds, the vertical axis shows the market capitalization of the stocks owned, and the horizontal axis shows investment style (value, blend, or growth). Information shown is based on the most recent data provided by Morningstar.
© 2016 Morningstar, Inc. All rights reserved. The Morningstar information contained herein: (1) is proprietary to Morningstar and/or its content providers; (2) may not be copied or distributed; and (3) is not warranted to be accurate, complete or timely. Neither Morningstar nor its content providers are responsible for any damages or losses arising from any use of this information.
Investment Risks
Market risk may affect a single issuer, sector of the economy, industry or the market as a whole. Growth securities, at times, may not perform as well as value securities or the stock market in general and may be out of favor with investors. Foreign investments subject the fund to risks, including political, economic, market, social and others within a particular country, as well as to currency instabilities and less stringent financial and accounting standards generally applicable to U.S. issuers. See the Fund's prospectus for information on these and other risks.
For the 12-month period that ended February 29, 2016, the Fund's Class A shares returned -11.70% excluding sales charges. The Fund underperformed its new benchmark, the Russell 1000 Growth Index, which returned -5.05% over the same period. In a period of heightened market volatility, stock selection detracted from Fund results relative to its benchmark.
Mounting Global Pressures Weighed on Markets
Around the world, investors turned cautious over the 12-month period that ended February 29, 2016, as lackluster economic growth, contentious geopolitical conflicts and a shift in U.S. monetary policy weighed on confidence. Subpar global economic growth continued for a fourth straight year, with China's slowdown heading the list of disappointments. Conflicts in the Middle East and terrorism, both at home and abroad, heightened security fears. Plummeting oil prices and a rising dollar rounded the list of mounting pressures. A widening trade deficit also took a significant bite out of growth.
Despite these setbacks, the U.S. economy continued to expand for the seventh consecutive year. U.S. labor markets recovered to full employment and consumer spending strengthened. The housing market inched forward, although sales slipped near the end of the period as new industry regulation led to longer closing periods. Manufacturing activity softened, putting a damper on growth.
Modest stock market gains in the first half of the period were wiped out in the second half. The S&P 500 Index, a broad measure of U.S. stock market performance, returned -6.19%, including dividends. Large-cap stocks held up better than mid- and small-cap stocks and growth stocks outperformed value stocks.
In December 2015, the Federal Reserve (the Fed) raised the target range of its benchmark interest rate by a quarter of a point, ending a lengthy debate about whether the economy was strong enough to withstand higher borrowing costs. Mixed economic signals early in 2016 put additional rate hikes on hold — at least for now.
Marsico-Subadvised Portfolio
From March 1, 2015 through November 19, 2015, Marsico provided day-to-day portfolio management of the Fund and the Fund's performance was compared to that of the S&P 500 Index. This section discusses the contributors and detractors to the Fund's portfolio during the period in which Marsico subadvised the portfolio.
The Fund had more exposure than the S&P 500 Index to information technology and consumer discretionary stocks, the period's two strongest performing sectors. These sectors also accounted for the top three individual performers in the Fund: Facebook, Nike and Starbucks. Facebook, a social media company, benefited from the advertising shift from traditional to online media. Better-than-expected earnings were fueled by active user growth as Facebook continued to innovate ways to engage with its users. The company's new Premium Video product experienced strong growth by mobile users — a key, fast-growing
Annual Report 2016
4
COLUMBIA LARGE CAP GROWTH FUND V
MANAGER DISCUSSION OF FUND PERFORMANCE (continued)
advertising market. Athletic apparel company Nike shares rose on the heels of accelerated sales, particularly in North America, Europe and China. The company continued to innovate in its footwear line and in technical fabrics for sports apparel. Starbucks shares posted a sizeable gain as the company reported strong sales and continued its rollout of a mobile order and pay platform, which provides the company with a wealth of data and individualized marketing opportunities. The Fund's positions in all three stocks were trimmed. An underweight in energy, the weakest performing sector in the S&P 500 Index, aided comparative results.
Health care was the single biggest detractor from Fund performance during the period under Marsico Management. In particular, several of the Fund's pharmaceuticals, biotechnology and life sciences positions disappointed. Industrials and consumer staples stocks also detracted from the performance. Lack of exposure to the food, beverage and tobacco industry group within consumer staples was a drag on results. Within health care, Pacira Pharmaceuticals, a manufacturer of non-opioid post-surgical pain anesthetics, declined sharply on an uncertain approval outlook for its drug Exparel and a Department of Justice subpoena regarding Pacira's marketing practices. The position was sold. Illumina, a biotechnology company that delivers affordable genomic sequencing solutions for use in medical and pharmaceutical research was another major disappointment. The company announced lower-than-expected sales results. The Fund also lost ground on LinkedIn Class A shares and the position was reduced.
CMIA Portfolio
Effective November 20, 2015, Columbia Management Investment Advisers, LLC (CMIA), the Investment Manager, assumed day-to-day portfolio management of the Fund and the Fund began comparing its performance to that of the Russell 1000 Growth Index, which more accurately reflects the growth style of the new management team.
In a period of exceptional volatility, we began to transition the portfolio's holdings to bring it in line with our large-cap growth strategy, a process that has been underway since we assumed Fund management on November 20, 2015. We believe the Fund's new benchmark more accurately reflects our growth style. We increased the Fund's weighting in consumer staples and decreased weightings in consumer discretionary and health care. Overall, the Fund has become more diversified, with an expanded list of approximately 65 to 85 company names. At period's end, the portfolio was focused on high-quality growth companies with track records of consistent earnings growth and particular emphasis on both health care and information technology.
Top Ten Holdings (%)
(at February 29, 2016) | |
Alphabet, Inc., Class A | | | 6.8 | | |
Apple, Inc. | | | 4.5 | | |
Facebook, Inc., Class A | | | 4.0 | | |
Amazon.com, Inc. | | | 4.0 | | |
Microsoft Corp. | | | 3.9 | | |
Visa, Inc., Class A | | | 3.1 | | |
CVS Health Corp. | | | 3.1 | | |
PepsiCo, Inc. | | | 3.0 | | |
Comcast Corp., Class A | | | 2.9 | | |
Philip Morris International, Inc. | | | 2.7 | | |
Percentages indicated are based upon total investments (excluding Money Market Funds).
For further detail about these holdings, please refer to the section entitled "Portfolio of Investments."
Fund holdings are as of the date given, are subject to change at any time, and are not recommendations to buy or sell any security.
Portfolio Breakdown (%)
(at February 29, 2016) | |
Common Stocks | | | 92.2 | | |
Exchange-Traded Funds | | | 2.6 | | |
Money Market Funds | | | 5.2 | | |
Total | | | 100.0 | | |
Percentages indicated are based upon total investments. The Fund's portfolio composition is subject to change.
Equity Sector Breakdown (%)
(at February 29, 2016) | |
Consumer Discretionary | | | 23.9 | | |
Consumer Staples | | | 11.7 | | |
Energy | | | 0.9 | | |
Financials | | | 3.5 | | |
Health Care | | | 14.1 | | |
Industrials | | | 8.0 | | |
Information Technology | | | 35.6 | | |
Materials | | | 2.3 | | |
Total | | | 100.0 | | |
Percentages indicated are based upon total equity investments. The Fund's portfolio composition is subject to change.
Annual Report 2016
5
COLUMBIA LARGE CAP GROWTH FUND V
UNDERSTANDING YOUR FUND'S EXPENSES
(Unaudited)
As an investor, you incur two types of costs. There are transaction costs, which generally include sales charges on purchases and may include redemption fees. There are also ongoing costs, which generally include management fees, distribution and/or service fees, and other fund expenses. The following information is intended to help you understand your ongoing costs (in dollars) of investing in the Fund and to help you compare these costs with the ongoing costs of investing in other mutual funds.
Analyzing Your Fund's Expenses
To illustrate these ongoing costs, we have provided examples and calculated the expenses paid by investors in each share class of the Fund during the period. The actual and hypothetical information in the table is based on an initial investment of $1,000 at the beginning of the period indicated and held for the entire period. Expense information is calculated two ways and each method provides you with different information. The amount listed in the "Actual" column is calculated using the Fund's actual operating expenses and total return for the period. You may use the Actual information, together with the amount invested, to estimate the expenses that you paid over the period. Simply divide your account value by $1,000 (for example, an $8,600 account value divided by $1,000 = 8.6), then multiply the results by the expenses paid during the period under the "Actual" column. The amount listed in the "Hypothetical" column assumes a 5% annual rate of return before expenses (which is not the Fund's actual return) and then applies the Fund's actual expense ratio for the period to the hypothetical return. You should not use the hypothetical account values and expenses to estimate either your actual account balance at the end of the period or the expenses you paid during the period. See "Compare With Other Funds" below for details on how to use the hypothetical data.
Compare With Other Funds
Since all mutual funds are required to include the same hypothetical calculations about expenses in shareholder reports, you can use this information to compare the ongoing cost of investing in the Fund with other funds. To do so, compare the hypothetical example with the 5% hypothetical examples that appear in the shareholder reports of other funds. As you compare hypothetical examples of other funds, it is important to note that hypothetical examples are meant to highlight the ongoing costs of investing in a fund only and do not reflect any transaction costs, such as sales charges, or redemption or exchange fees. Therefore, the hypothetical calculations are useful in comparing ongoing costs only, and will not help you determine the relative total costs of owning different funds. If transaction costs were included in these calculations, your costs would be higher.
September 1, 2015 – February 29, 2016
| | | Account Value at the Beginning
of the Period ($) | | Account Value at the End of the
Period ($) | | Expenses Paid During the
Period ($) | | Fund's Annualized
Expense Ratio (%) | |
| | | Actual | | Hypothetical | | Actual | | Hypothetical | | Actual | | Hypothetical | | Actual | |
Class A | | | 1,000.00 | | | | 1,000.00 | | | | 926.40 | | | | 1,018.95 | | | | 5.70 | | | | 5.97 | | | | 1.19 | | |
Class B | | | 1,000.00 | | | | 1,000.00 | | | | 922.90 | | | | 1,015.22 | | | | 9.28 | | | | 9.72 | | | | 1.94 | | |
Class C | | | 1,000.00 | | | | 1,000.00 | | | | 923.00 | | | | 1,015.22 | | | | 9.28 | | | | 9.72 | | | | 1.94 | | |
Class I | | | 1,000.00 | | | | 1,000.00 | | | | 928.20 | | | | 1,021.38 | | | | 3.36 | | | | 3.52 | | | | 0.70 | | |
Class R | | | 1,000.00 | | | | 1,000.00 | | | | 925.50 | | | | 1,017.70 | | | | 6.89 | | | | 7.22 | | | | 1.44 | | |
Class R4 | | | 1,000.00 | | | | 1,000.00 | | | | 927.40 | | | | 1,020.19 | | | | 4.50 | | | | 4.72 | | | | 0.94 | | |
Class R5 | | | 1,000.00 | | | | 1,000.00 | | | | 927.90 | | | | 1,020.84 | | | | 3.88 | | | | 4.07 | | | | 0.81 | | |
Class W | | | 1,000.00 | | | | 1,000.00 | | | | 926.50 | | | | 1,019.10 | | | | 5.56 | | | | 5.82 | | | | 1.16 | | |
Class Z | | | 1,000.00 | | | | 1,000.00 | | | | 927.40 | | | | 1,020.19 | | | | 4.50 | | | | 4.72 | | | | 0.94 | | |
Expenses paid during the period are equal to the annualized expense ratio for each class as indicated above, multiplied by the average account value over the period and then multiplied by the number of days in the Fund's most recent fiscal half year and divided by 366.
Expenses do not include fees and expenses incurred indirectly by the Fund from its investment in underlying funds, including affiliated and non-affiliated pooled investment vehicles, such as mutual funds and exchange-traded funds.
Annual Report 2016
6
COLUMBIA LARGE CAP GROWTH FUND V
PORTFOLIO OF INVESTMENTS
February 29, 2016
(Percentages represent value of investments compared to net assets)
Common Stocks 92.6%
Issuer | | Shares | | Value ($) | |
CONSUMER DISCRETIONARY 22.1% | |
Auto Components 0.4% | |
Visteon Corp. | | | 54,445 | | | | 3,806,794 | | |
Hotels, Restaurants & Leisure 3.2% | |
Norwegian Cruise Line Holdings Ltd.(a) | | | 210,610 | | | | 10,347,269 | | |
Starbucks Corp. | | | 317,809 | | | | 18,499,662 | | |
Total | | | | | 28,846,931 | | |
Household Durables 0.5% | |
Jarden Corp.(a) | | | 88,211 | | | | 4,664,598 | | |
Internet & Catalog Retail 6.6% | |
Amazon.com, Inc.(a) | | | 62,256 | | | | 34,397,685 | | |
Ctrip.com International Ltd., ADR(a) | | | 156,744 | | | | 6,413,964 | | |
Expedia, Inc. | | | 40,469 | | | | 4,213,228 | | |
Priceline Group, Inc. (The)(a) | | | 11,919 | | | | 15,080,038 | | |
Total | | | | | 60,104,915 | | |
Media 3.6% | |
Comcast Corp., Class A | | | 435,905 | | | | 25,164,796 | | |
DISH Network Corp., Class A(a) | | | 156,350 | | | | 7,368,775 | | |
Total | | | | | 32,533,571 | | |
Multiline Retail 2.2% | |
Dollar General Corp. | | | 135,232 | | | | 10,040,976 | | |
Dollar Tree, Inc.(a) | | | 128,395 | | | | 10,303,699 | | |
Total | | | | | 20,344,675 | | |
Specialty Retail 3.3% | |
Lowe's Companies, Inc. | | | 277,266 | | | | 18,723,773 | | |
TJX Companies, Inc. (The) | | | 159,749 | | | | 11,837,401 | | |
Total | | | | | 30,561,174 | | |
Textiles, Apparel & Luxury Goods 2.3% | |
lululemon athletica, Inc.(a) | | | 68,949 | | | | 4,325,171 | | |
Nike, Inc., Class B | | | 275,587 | | | | 16,973,403 | | |
Total | | | | | 21,298,574 | | |
Total Consumer Discretionary | | | | | 202,161,232 | | |
CONSUMER STAPLES 10.8% | |
Beverages 4.9% | |
Constellation Brands, Inc., Class A | | | 51,913 | | | | 7,342,055 | | |
Molson Coors Brewing Co., Class B | | | 138,510 | | | | 11,810,748 | | |
PepsiCo, Inc. | | | 265,317 | | | | 25,953,309 | | |
Total | | | | | 45,106,112 | | |
Common Stocks (continued)
Issuer | | Shares | | Value ($) | |
Food & Staples Retailing 2.9% | |
CVS Health Corp. | | | 275,627 | | | | 26,782,675 | | |
Food Products 0.4% | |
Tyson Foods, Inc., Class A | | | 51,448 | | | | 3,331,258 | | |
Tobacco 2.6% | |
Philip Morris International, Inc. | | | 262,388 | | | | 23,885,180 | | |
Total Consumer Staples | | | | | 99,105,225 | | |
ENERGY 0.8% | |
Energy Equipment & Services 0.8% | |
Schlumberger Ltd. | | | 102,080 | | | | 7,321,178 | | |
Total Energy | | | | | 7,321,178 | | |
FINANCIALS 3.3% | |
Banks 0.4% | |
Wells Fargo & Co. | | | 79,857 | | | | 3,746,890 | | |
Capital Markets 2.2% | |
Bank of New York Mellon Corp. (The) | | | 308,900 | | | | 10,931,971 | | |
BlackRock, Inc. | | | 9,337 | | | | 2,912,770 | | |
Goldman Sachs Group, Inc. (The) | | | 17,701 | | | | 2,646,831 | | |
Invesco Ltd. | | | 132,340 | | | | 3,538,772 | | |
Total | | | | | 20,030,344 | | |
Real Estate Investment Trusts (REITs) 0.7% | |
Simon Property Group, Inc. | | | 31,833 | | | | 6,039,675 | | |
Total Financials | | | | | 29,816,909 | | |
HEALTH CARE 13.1% | |
Biotechnology 5.1% | |
Alexion Pharmaceuticals, Inc.(a) | | | 42,290 | | | | 5,954,432 | | |
Alkermes PLC(a) | | | 123,402 | | | | 3,982,183 | | |
Biogen, Inc.(a) | | | 28,656 | | | | 7,433,939 | | |
Celgene Corp.(a) | | | 170,214 | | | | 17,162,678 | | |
Incyte Corp.(a) | | | 45,704 | | | | 3,359,244 | | |
Intercept Pharmaceuticals, Inc.(a) | | | 7,352 | | | | 818,866 | | |
Novavax, Inc.(a) | | | 180,340 | | | | 786,282 | | |
Ultragenyx Pharmaceutical, Inc.(a) | | | 14,761 | | | | 900,273 | | |
Vertex Pharmaceuticals, Inc.(a) | | | 70,993 | | | | 6,069,192 | | |
Total | | | | | 46,467,089 | | |
Health Care Equipment & Supplies 1.5% | |
Medtronic PLC | | | 180,086 | | | | 13,936,856 | | |
The accompanying Notes to Financial Statements are an integral part of this statement.
Annual Report 2016
7
COLUMBIA LARGE CAP GROWTH FUND V
PORTFOLIO OF INVESTMENTS (continued)
February 29, 2016
Common Stocks (continued)
Issuer | | Shares | | Value ($) | |
Health Care Providers & Services 1.1% | |
Express Scripts Holding Co.(a) | | | 76,417 | | | | 5,378,228 | | |
Laboratory Corp. of America Holdings(a) | | | 44,500 | | | | 4,887,880 | | |
Total | | | | | 10,266,108 | | |
Life Sciences Tools & Services 1.8% | |
Thermo Fisher Scientific, Inc. | | | 126,223 | | | | 16,306,749 | | |
Pharmaceuticals 3.6% | |
Bristol-Myers Squibb Co. | | | 357,473 | | | | 22,138,303 | | |
Eli Lilly & Co. | | | 146,018 | | | | 10,513,296 | | |
Total | | | | | 32,651,599 | | |
Total Health Care | | | | | 119,628,401 | | |
INDUSTRIALS 7.4% | |
Aerospace & Defense 1.4% | |
Northrop Grumman Corp. | | | 67,978 | | | | 13,066,731 | | |
Air Freight & Logistics 1.6% | |
FedEx Corp. | | | 109,791 | | | | 15,028,192 | | |
Airlines 1.7% | |
Delta Air Lines, Inc. | | | 316,166 | | | | 15,251,848 | | |
Electrical Equipment 0.3% | |
AMETEK, Inc. | | | 52,730 | | | | 2,447,200 | | |
Machinery 1.7% | |
Ingersoll-Rand PLC | | | 154,657 | | | | 8,592,743 | | |
Stanley Black & Decker, Inc. | | | 74,528 | | | | 7,006,377 | | |
Total | | | | | 15,599,120 | | |
Road & Rail 0.7% | |
Kansas City Southern | | | 74,606 | | | | 6,096,056 | | |
Total Industrials | | | | | 67,489,147 | | |
INFORMATION TECHNOLOGY 33.0% | |
Communications Equipment 1.3% | |
Palo Alto Networks, Inc.(a) | | | 80,139 | | | | 11,603,326 | | |
Internet Software & Services 11.3% | |
Alibaba Group Holding Ltd., ADR(a) | | | 114,803 | | | | 7,899,594 | | |
Alphabet, Inc., Class A(a) | | | 82,503 | | | | 59,172,802 | | |
Facebook, Inc., Class A(a) | | | 322,667 | | | | 34,499,556 | | |
LinkedIn Corp., Class A(a) | | | 14,490 | | | | 1,698,083 | | |
Total | | | | | 103,270,035 | | |
Common Stocks (continued)
Issuer | | Shares | | Value ($) | |
IT Services 3.7% | |
PayPal Holdings, Inc.(a) | | | 172,920 | | | | 6,595,169 | | |
Visa, Inc., Class A | | | 378,724 | | | | 27,415,830 | | |
Total | | | | | 34,010,999 | | |
Semiconductors & Semiconductor Equipment 3.7% | |
Broadcom Ltd. | | | 94,252 | | | | 12,626,940 | | |
NVIDIA Corp. | | | 289,470 | | | | 9,077,779 | | |
NXP Semiconductors NV(a) | | | 118,503 | | | | 8,442,154 | | |
Qorvo, Inc.(a) | | | 71,156 | | | | 3,207,713 | | |
Total | | | | | 33,354,586 | | |
Software 8.7% | |
Electronic Arts, Inc.(a) | | | 307,198 | | | | 19,734,400 | | |
Microsoft Corp. | | | 664,754 | | | | 33,822,683 | | |
Red Hat, Inc.(a) | | | 115,218 | | | | 7,529,496 | | |
Salesforce.com, inc.(a) | | | 230,393 | | | | 15,609,126 | | |
ServiceNow, Inc.(a) | | | 58,469 | | | | 3,215,210 | | |
Total | | | | | 79,910,915 | | |
Technology Hardware, Storage & Peripherals 4.3% | |
Apple, Inc. | | | 408,301 | | | | 39,478,624 | | |
Total Information Technology | | | | | 301,628,485 | | |
MATERIALS 2.1% | |
Chemicals 2.1% | |
Eastman Chemical Co. | | | 124,013 | | | | 7,955,434 | | |
Sherwin-Williams Co. (The) | | | 43,258 | | | | 11,701,289 | | |
Total | | | | | 19,656,723 | | |
Total Materials | | | | | 19,656,723 | | |
Total Common Stocks
(Cost: $791,040,331) | | | | | 846,807,300 | | |
Exchange-Traded Funds 2.6%
| | | Shares | | Value ($) | |
iShares Russell 1000 Growth
Index Fund | | | 251,805 | | | | 23,626,863 | | |
Total Exchange-Traded Funds
(Cost: $25,358,074) | | | | | 23,626,863 | | |
The accompanying Notes to Financial Statements are an integral part of this statement.
Annual Report 2016
8
COLUMBIA LARGE CAP GROWTH FUND V
PORTFOLIO OF INVESTMENTS (continued)
February 29, 2016
Money Market Funds 5.2%
| | | Shares | | Value ($) | |
Columbia Short-Term Cash Fund,
0.420%(b)(c) | | | 47,937,938 | | | | 47,937,938 | | |
Total Money Market Funds
(Cost: $47,937,938) | | | | | 47,937,938 | | |
Total Investments
(Cost: $864,336,343) | | | | | 918,372,101 | | |
Other Assets & Liabilities, Net | | | | | (4,017,950 | ) | |
Net Assets | | | | | 914,354,151 | | |
Notes to Portfolio of Investments
(a) Non-income producing investment.
(b) The rate shown is the seven-day current annualized yield at February 29, 2016.
(c) As defined in the Investment Company Act of 1940, an affiliated company is one in which the Fund owns 5% or more of the company's outstanding voting securities, or a company which is under common ownership or control with the Fund. Holdings and transactions in these affiliated companies during the year ended February 29, 2016 are as follows:
Issuer | | Beginning
Cost ($) | | Purchase
Cost ($) | | Proceeds
From Sales ($) | | Ending
Cost ($) | | Dividends —
Affiliated
Issuers ($) | | Value ($) | |
Columbia Short-Term Cash Fund | | | 20,601 | | | | 915,403,999 | | | | (867,486,662 | ) | | | 47,937,938 | | | | 62,423 | | | | 47,937,938 | | |
Abbreviation Legend
ADR American Depositary Receipt
Fair Value Measurements
The Fund categorizes its fair value measurements according to a three-level hierarchy that maximizes the use of observable inputs and minimizes the use of unobservable inputs by prioritizing that the most observable input be used when available. Observable inputs are those that market participants would use in pricing an investment based on market data obtained from sources independent of the reporting entity. Unobservable inputs are those that reflect the Fund's assumptions about the information market participants would use in pricing an investment. An investment's level within the fair value hierarchy is based on the lowest level of any input that is deemed significant to the asset's or liability's fair value measurement. The input levels are not necessarily an indication of the risk or liquidity associated with investments at that level. For example, certain U.S. government securities are generally high quality and liquid, however, they are reflected as Level 2 because the inputs used to determine fair value may not always be quoted prices in an active market.
Fair value inputs are summarized in the three broad levels listed below:
> Level 1 — Valuations based on quoted prices for investments in active markets that the Fund has the ability to access at the measurement date (including NAV for open-end mutual funds). Valuation adjustments are not applied to Level 1 investments.
> Level 2 — Valuations based on other significant observable inputs (including quoted prices for similar securities, interest rates, prepayment speeds, credit risks, etc.).
> Level 3 — Valuations based on significant unobservable inputs (including the Fund's own assumptions and judgment in determining the fair value of investments).
Inputs that are used in determining fair value of an investment may include price information, credit data, volatility statistics, and other factors. These inputs can be either observable or unobservable. The availability of observable inputs can vary between investments, and is affected by various factors such as the type of investment, and the volume and level of activity for that investment or similar investments in the marketplace. The inputs will be considered by the Investment Manager, along with any other relevant factors in the calculation of an investment's fair value. The Fund uses prices and inputs that are current as of the measurement date, which may include periods of market dislocations. During these periods, the availability of prices and inputs may be reduced for many investments. This condition could cause an investment to be reclassified between the various levels within the hierarchy.
The accompanying Notes to Financial Statements are an integral part of this statement.
Annual Report 2016
9
COLUMBIA LARGE CAP GROWTH FUND V
PORTFOLIO OF INVESTMENTS (continued)
February 29, 2016
Fair Value Measurements (continued)
Investments falling into the Level 3 category are primarily supported by quoted prices from brokers and dealers participating in the market for those investments. However, these may be classified as Level 3 investments due to lack of market transparency and corroboration to support these quoted prices. Additionally, valuation models may be used as the pricing source for any remaining investments classified as Level 3. These models may rely on one or more significant unobservable inputs and/or significant assumptions by the Investment Manager. Inputs used in valuations may include, but are not limited to, financial statement analysis, capital account balances, discount rates and estimated cash flows, and comparable company data.
Under the direction of the Fund's Board of Trustees (the Board), the Investment Manager's Valuation Committee (the Committee) is responsible for overseeing the valuation procedures approved by the Board. The Committee consists of voting and non-voting members from various groups within the Investment Manager's organization, including operations and accounting, trading and investments, compliance, risk management and legal.
The Committee meets at least monthly to review and approve valuation matters, which may include a description of specific valuation determinations, data regarding pricing information received from approved pricing vendors and brokers and the results of Board-approved valuation control policies and procedures (the Policies). The Policies address, among other things, instances when market quotations are or are not readily available, including recommendations of third party pricing vendors and a determination of appropriate pricing methodologies; events that require specific valuation determinations and assessment of fair value techniques; securities with a potential for stale pricing, including those that are illiquid, restricted, or in default; and the effectiveness of third party pricing vendors, including periodic reviews of vendors. The Committee meets more frequently, as needed, to discuss additional valuation matters, which may include the need to review back-testing results, review time-sensitive information or approve related valuation actions. The Committee reports to the Board, with members of the Committee meeting with the Board at each of its regularly scheduled meetings to discuss valuation matters and actions during the period, similar to those described earlier.
For investments categorized as Level 3, the Committee monitors information similar to that described above, which may include: (i) data specific to the issuer or comparable issuers, (ii) general market or specific sector news and (iii) quoted prices and specific or similar security transactions. The Committee considers this data and any changes from prior periods in order to assess the reasonableness of observable and unobservable inputs, any assumptions or internal models used to value those securities and changes in fair value. This data is also used to corroborate, when available, information received from approved pricing vendors and brokers. Various factors impact the frequency of monitoring this information (which may occur as often as daily). However, the Committee may determine that changes to inputs, assumptions and models are not required as a result of the monitoring procedures performed.
The following table is a summary of the inputs used to value the Fund's investments at February 29, 2016:
| | | Level 1
Quoted Prices in Active
Markets for Identical
Assets ($) | | Level 2
Other Significant
Observable Inputs ($) | | Level 3
Significant
Unobservable Inputs ($) | | Total ($) | |
Investments | |
Common Stocks | |
Consumer Discretionary | | | 202,161,232 | | | | — | | | | — | | | | 202,161,232 | | |
Consumer Staples | | | 99,105,225 | | | | — | | | | — | | | | 99,105,225 | | |
Energy | | | 7,321,178 | | | | — | | | | — | | | | 7,321,178 | | |
Financials | | | 29,816,909 | | | | — | | | | — | | | | 29,816,909 | | |
Health Care | | | 119,628,401 | | | | — | | | | — | | | | 119,628,401 | | |
Industrials | | | 67,489,147 | | | | — | | | | — | | | | 67,489,147 | | |
Information Technology | | | 301,628,485 | | | | — | | | | — | | | | 301,628,485 | | |
Materials | | | 19,656,723 | | | | — | | | | — | | | | 19,656,723 | | |
Total Common Stocks | | | 846,807,300 | | | | — | | | | — | | | | 846,807,300 | | |
Exchange-Traded Funds | | | 23,626,863 | | | | — | | | | — | | | | 23,626,863 | | |
Money Market Funds | | | — | | | | 47,937,938 | | | | — | | | | 47,937,938 | | |
Total Investments | | | 870,434,163 | | | | 47,937,938 | | | | — | | | | 918,372,101 | | |
See the Portfolio of Investments for all investment classifications not indicated in the table.
The accompanying Notes to Financial Statements are an integral part of this statement.
Annual Report 2016
10
COLUMBIA LARGE CAP GROWTH FUND V
PORTFOLIO OF INVESTMENTS (continued)
February 29, 2016
Fair Value Measurements (continued)
The Fund's assets assigned to the Level 2 input category are valued based upon utilizing observable market inputs, in which a security's value is determined through reference to prices and information from market transactions for similar or identical assets and/or fund per share market values which are not considered publicly available.
Financial assets were transferred from Level 1 to Level 2 as the market for these assets is not considered publicly available. Fund per share market values were obtained using observable market inputs.
The following table shows transfers between Level 1 and Level 2 of the fair value hierarchy:
Transfers In | | Transfers Out | |
| Level 1 ($) | | Level 2 ($) | | Level 1 ($) | | Level 2 ($) | |
| | — | | | | 20,601 | | | | 20,601 | | | | — | | |
Transfers between Level 1 and Level 2 are determined based on the fair value at the beginning of the period for security positions held throughout the period.
There were no transfers of financial assets between Levels 2 and 3 during the period.
The accompanying Notes to Financial Statements are an integral part of this statement.
Annual Report 2016
11
COLUMBIA LARGE CAP GROWTH FUND V
STATEMENT OF ASSETS AND LIABILITIES
February 29, 2016
Assets | |
Investments, at value | |
Unaffiliated issuers (identified cost $816,398,405) | | $ | 870,434,163 | | |
Affiliated issuers (identified cost $47,937,938) | | | 47,937,938 | | |
Total investments (identified cost $864,336,343) | | | 918,372,101 | | |
Receivable for: | |
Capital shares sold | | | 121,008 | | |
Dividends | | | 936,985 | | |
Prepaid expenses | | | 3,333 | | |
Total assets | | | 919,433,427 | | |
Liabilities | |
Payable for: | |
Capital shares purchased | | | 4,463,354 | | |
Investment management fees | | | 57,602 | | |
Distribution and/or service fees | | | 21,786 | | |
Transfer agent fees | | | 233,420 | | |
Compensation of board members | | | 221,339 | | |
Other expenses | | | 81,775 | | |
Total liabilities | | | 5,079,276 | | |
Net assets applicable to outstanding capital stock | | $ | 914,354,151 | | |
Represented by | |
Paid-in capital | | $ | 787,774,912 | | |
Excess of distributions over net investment income | | | (456,625 | ) | |
Accumulated net realized gain | | | 73,000,106 | | |
Unrealized appreciation (depreciation) on: | |
Investments | | | 54,035,758 | | |
Total — representing net assets applicable to outstanding capital stock | | $ | 914,354,151 | | |
The accompanying Notes to Financial Statements are an integral part of this statement.
Annual Report 2016
12
COLUMBIA LARGE CAP GROWTH FUND V
STATEMENT OF ASSETS AND LIABILITIES (continued)
February 29, 2016
Class A | |
Net assets | | $ | 283,783,733 | | |
Shares outstanding | | | 18,309,243 | | |
Net asset value per share | | $ | 15.50 | | |
Maximum offering price per share(a) | | $ | 16.45 | | |
Class B | |
Net assets | | $ | 1,097,468 | | |
Shares outstanding | | | 88,848 | | |
Net asset value per share | | $ | 12.35 | | |
Class C | |
Net assets | | $ | 182,413,971 | | |
Shares outstanding | | | 14,723,285 | | |
Net asset value per share | | $ | 12.39 | | |
Class I | |
Net assets | | $ | 1,582 | | |
Shares outstanding | | | 97 | | |
Net asset value per share(b) | | $ | 16.24 | | |
Class R | |
Net assets | | $ | 16,625,263 | | |
Shares outstanding | | | 1,107,188 | | |
Net asset value per share | | $ | 15.02 | | |
Class R4 | |
Net assets | | $ | 18,455,513 | | |
Shares outstanding | | | 1,116,379 | | |
Net asset value per share | | $ | 16.53 | | |
Class R5 | |
Net assets | | $ | 6,173,523 | | |
Shares outstanding | | | 372,830 | | |
Net asset value per share | | $ | 16.56 | | |
Class W | |
Net assets | | $ | 1,594 | | |
Shares outstanding | | | 103 | | |
Net asset value per share(b) | | $ | 15.52 | | |
Class Z | |
Net assets | | $ | 405,801,504 | | |
Shares outstanding | | | 25,148,907 | | |
Net asset value per share | | $ | 16.14 | | |
(a) The maximum offering price per share is calculated by dividing the net asset value per share by 1.0 minus the maximum sales charge of 5.75%.
(b) Net asset value per share rounds to this amount due to fractional shares outstanding.
The accompanying Notes to Financial Statements are an integral part of this statement.
Annual Report 2016
13
COLUMBIA LARGE CAP GROWTH FUND V
STATEMENT OF OPERATIONS
Year Ended February 29, 2016
Net investment income | |
Income: | |
Dividends — unaffiliated issuers | | $ | 9,590,138 | | |
Dividends — affiliated issuers | | | 62,423 | | |
Foreign taxes withheld | | | (55,191 | ) | |
Total income | | | 9,597,370 | | |
Expenses: | |
Investment management fees | | | 9,963,981 | | |
Distribution and/or service fees | |
Class A | | | 936,451 | | |
Class B | | | 26,087 | | |
Class C | | | 2,541,896 | | |
Class R | | | 106,873 | | |
Class W | | | 5 | | |
Transfer agent fees | |
Class A | | | 678,037 | | |
Class B | | | 4,762 | | |
Class C | | | 460,416 | | |
Class R | | | 38,666 | | |
Class R4 | | | 42,817 | | |
Class R5 | | | 5,151 | | |
Class W | | | 4 | | |
Class Z | | | 1,251,768 | | |
Compensation of board members | | | 16,572 | | |
Custodian fees | | | 15,481 | | |
Printing and postage fees | | | 163,867 | | |
Registration fees | | | 116,220 | | |
Audit fees | | | 25,573 | | |
Legal fees | | | 15,798 | | |
Line of credit interest expense | | | 3,416 | | |
Other | | | 43,449 | | |
Total expenses | | | 16,457,290 | | |
Expense reductions | | | (1,016 | ) | |
Total net expenses | | | 16,456,274 | | |
Net investment loss | | | (6,858,904 | ) | |
Realized and unrealized gain (loss) — net | |
Net realized gain (loss) on: | |
Investments | | | 351,134,858 | | |
Foreign currency translations | | | (1,334 | ) | |
Net realized gain | | | 351,133,524 | | |
Net change in unrealized appreciation (depreciation) on: | |
Investments | | | (482,944,432 | ) | |
Foreign currency translations | | | (186 | ) | |
Net change in unrealized depreciation | | | (482,944,618 | ) | |
Net realized and unrealized loss | | | (131,811,094 | ) | |
Net decrease in net assets from operations | | $ | (138,669,998 | ) | |
The accompanying Notes to Financial Statements are an integral part of this statement.
Annual Report 2016
14
COLUMBIA LARGE CAP GROWTH FUND V
STATEMENT OF CHANGES IN NET ASSETS
| | | Year Ended
February 29,
2016 | | Year Ended
February 28,
2015 | |
Operations | |
Net investment loss | | $ | (6,858,904 | ) | | $ | (1,759,617 | ) | |
Net realized gain | | | 351,133,524 | | | | 311,831,507 | | |
Net change in unrealized depreciation | | | (482,944,618 | ) | | | (155,835,167 | ) | |
Net increase (decrease) in net assets resulting from operations | | | (138,669,998 | ) | | | 154,236,723 | | |
Distributions to shareholders | |
Net realized gains | |
Class A | | | (116,223,676 | ) | | | (59,446,481 | ) | |
Class B | | | (853,895 | ) | | | (856,422 | ) | |
Class C | | | (92,946,796 | ) | | | (39,610,075 | ) | |
Class I | | | (702 | ) | | | (318 | ) | |
Class R | | | (6,939,537 | ) | | | (2,833,023 | ) | |
Class R4 | | | (6,954,855 | ) | | | (3,258,966 | ) | |
Class R5 | | | (3,347,623 | ) | | | (531,605 | ) | |
Class W | | | (739 | ) | | | (327 | ) | |
Class Z | | | (206,872,288 | ) | | | (111,607,180 | ) | |
Total distributions to shareholders | | | (434,140,111 | ) | | | (218,144,397 | ) | |
Decrease in net assets from capital stock activity | | | (149,295,385 | ) | | | (425,886,658 | ) | |
Total decrease in net assets | | | (722,105,494 | ) | | | (489,794,332 | ) | |
Net assets at beginning of year | | | 1,636,459,645 | | | | 2,126,253,977 | | |
Net assets at end of year | | $ | 914,354,151 | | | $ | 1,636,459,645 | | |
Excess of distributions over net investment income | | $ | (456,625 | ) | | $ | (229,307 | ) | |
The accompanying Notes to Financial Statements are an integral part of this statement.
Annual Report 2016
15
COLUMBIA LARGE CAP GROWTH FUND V
STATEMENT OF CHANGES IN NET ASSETS (continued)
| | | Year Ended February 29, 2016 | | Year Ended February 28, 2015 | |
| | | Shares | | Dollars ($) | | Shares | | Dollars ($) | |
Capital stock activity | |
Class A shares | |
Subscriptions(a) | | | 3,092,117 | | | | 62,040,479 | | | | 2,745,485 | | | | 68,040,942 | | |
Distributions reinvested | | | 4,606,335 | | | | 88,185,755 | | | | 1,922,587 | | | | 46,709,309 | | |
Redemptions | | | (6,879,801 | ) | | | (141,109,666 | ) | | | (12,670,417 | ) | | | (321,341,633 | ) | |
Net increase (decrease) | | | 818,651 | | | | 9,116,568 | | | | (8,002,345 | ) | | | (206,591,382 | ) | |
Class B shares | |
Subscriptions | | | 21,593 | | | | 345,738 | | | | 19,730 | | | | 418,438 | | |
Distributions reinvested | | | 29,825 | | | | 467,440 | | | | 23,539 | | | | 494,255 | | |
Redemptions(a) | | | (181,248 | ) | | | (3,253,648 | ) | | | (297,475 | ) | | | (6,394,233 | ) | |
Net decrease | | | (129,830 | ) | | | (2,440,470 | ) | | | (254,206 | ) | | | (5,481,540 | ) | |
Class C shares | |
Subscriptions | | | 2,881,153 | | | | 45,304,125 | | | | 1,286,356 | | | | 27,259,461 | | |
Distributions reinvested | | | 3,158,446 | | | | 49,121,456 | | | | 988,355 | | | | 20,751,106 | | |
Redemptions | | | (5,216,049 | ) | | | (86,634,228 | ) | | | (2,384,191 | ) | | | (51,508,491 | ) | |
Net increase (decrease) | | | 823,550 | | | | 7,791,353 | | | | (109,480 | ) | | | (3,497,924 | ) | |
Class I shares | |
Redemptions | | | — | | | | — | | | | (40 | ) | | | (1,000 | ) | |
Net decrease | | | — | | | | — | | | | (40 | ) | | | (1,000 | ) | |
Class R shares | |
Subscriptions | | | 148,925 | | | | 3,001,733 | | | | 181,188 | | | | 4,444,414 | | |
Distributions reinvested | | | 344,409 | | | | 6,388,329 | | | | 111,209 | | | | 2,643,325 | | |
Redemptions | | | (366,551 | ) | | | (7,061,713 | ) | | | (195,809 | ) | | | (4,768,450 | ) | |
Net increase | | | 126,783 | | | | 2,328,349 | | | | 96,588 | | | | 2,319,289 | | |
Class R4 shares | |
Subscriptions | | | 85,071 | | | | 1,685,110 | | | | 168,369 | | | | 4,413,563 | | |
Distributions reinvested | | | 342,075 | | | | 6,952,769 | | | | 128,632 | | | | 3,255,753 | | |
Redemptions | | | (380,317 | ) | | | (8,353,313 | ) | | | (215,478 | ) | | | (5,586,759 | ) | |
Net increase | | | 46,829 | | | | 284,566 | | | | 81,523 | | | | 2,082,557 | | |
Class R5 shares | |
Subscriptions | | | 375,142 | | | | 9,491,960 | | | | 154,062 | | | | 3,967,730 | | |
Distributions reinvested | | | 163,797 | | | | 3,346,920 | | | | 21,004 | | | | 531,288 | | |
Redemptions | | | (356,836 | ) | | | (7,374,789 | ) | | | (88,392 | ) | | | (2,261,019 | ) | |
Net increase | | | 182,103 | | | | 5,464,091 | | | | 86,674 | | | | 2,237,999 | | |
Class W shares | |
Redemptions | | | — | | | | — | | | | (36 | ) | | | (900 | ) | |
Net decrease | | | — | | | | — | | | | (36 | ) | | | (900 | ) | |
The accompanying Notes to Financial Statements are an integral part of this statement.
Annual Report 2016
16
COLUMBIA LARGE CAP GROWTH FUND V
STATEMENT OF CHANGES IN NET ASSETS (continued)
| | | Year Ended February 29, 2016 | | Year Ended February 28, 2015 | |
| | | Shares | | Dollars ($) | | Shares | | Dollars ($) | |
Capital stock activity (continued) | |
Class Z shares | |
Subscriptions | | | 3,233,532 | | | | 68,075,752 | | | | 11,602,560 | | | | 302,594,839 | | |
Distributions reinvested | | | 8,815,958 | | | | 175,729,285 | | | | 3,862,420 | | | | 96,163,976 | | |
Redemptions | | | (20,367,065 | ) | | | (415,644,879 | ) | | | (23,689,528 | ) | | | (615,712,572 | ) | |
Net decrease | | | (8,317,575 | ) | | | (171,839,842 | ) | | | (8,224,548 | ) | | | (216,953,757 | ) | |
Total net decrease | | | (6,449,489 | ) | | | (149,295,385 | ) | | | (16,325,870 | ) | | | (425,886,658 | ) | |
(a) Includes conversions of Class B shares to Class A shares, if any.
The accompanying Notes to Financial Statements are an integral part of this statement.
Annual Report 2016
17
COLUMBIA LARGE CAP GROWTH FUND V
The following tables are intended to help you understand the Fund's financial performance. Certain information reflects financial results for a single share of a class held for the periods shown. Per share net investment income (loss) amounts are calculated based on average shares outstanding during the period. Total return assumes reinvestment of all dividends and distributions, if any. Total return does not reflect payment of sales charges, if any. Total return and portfolio turnover are not annualized for periods of less than one year. The portfolio turnover rate is calculated without regard to purchase and sales transactions of short-term instruments and certain derivatives, if any. If such transactions were included, the Fund's portfolio turnover rate may be higher.
| | | Year Ended
February 29, | | Year Ended February 28, | | Year Ended
February 29, | |
Class A | | 2016 | | 2015 | | 2014 | | 2013 | | 2012 | |
Per share data | |
Net asset value, beginning of period | | $ | 24.68 | | | $ | 25.65 | | | $ | 23.69 | | | $ | 22.25 | | | $ | 21.19 | | |
Income from investment operations: | |
Net investment income (loss) | | | (0.10 | ) | | | (0.02 | ) | | | (0.05 | ) | | | 0.05 | | | | 0.02 | | |
Net realized and unrealized gain (loss) | | | (1.89 | ) | | | 2.22 | | | | 7.14 | | | | 1.45 | | | | 1.04 | | |
Total from investment operations | | | (1.99 | ) | | | 2.20 | | | | 7.09 | | | | 1.50 | | | | 1.06 | | |
Less distributions to shareholders: | |
Net investment income | | | — | | | | — | | | | — | | | | (0.06 | ) | | | — | | |
Net realized gains | | | (7.19 | ) | | | (3.17 | ) | | | (5.13 | ) | | | — | | | | — | | |
Total distributions to shareholders | | | (7.19 | ) | | | (3.17 | ) | | | (5.13 | ) | | | (0.06 | ) | | | — | | |
Net asset value, end of period | | $ | 15.50 | | | $ | 24.68 | | | $ | 25.65 | | | $ | 23.69 | | | $ | 22.25 | | |
Total return | | | (11.70 | %) | | | 9.11 | % | | | 32.56 | % | | | 6.78 | % | | | 5.00 | % | |
Ratios to average net assets(a) | |
Total gross expenses | | | 1.19 | %(b) | | | 1.17 | %(b) | | | 1.18 | %(b) | | | 1.36 | % | | | 1.33 | %(b) | |
Total net expenses(c) | | | 1.19 | %(b)(d) | | | 1.17 | %(b)(d) | | | 1.18 | %(b)(d) | | | 1.26 | %(d) | | | 1.28 | %(b)(d) | |
Net investment income (loss) | | | (0.48 | %) | | | (0.10 | %) | | | (0.20 | %) | | | 0.24 | % | | | 0.08 | % | |
Supplemental data | |
Net assets, end of period (in thousands) | | $ | 283,784 | | | $ | 431,633 | | | $ | 653,959 | | | $ | 593,794 | | | $ | 728,788 | | |
Portfolio turnover | | | 106 | % | | | 69 | % | | | 97 | % | | | 90 | % | | | 65 | % | |
Notes to Financial Highlights
(a) In addition to the fees and expenses that the Fund bears directly, the Fund indirectly bears a pro rata share of the fees and expenses of any other funds in which it invests. Such indirect expenses are not included in the Fund's reported expense ratios.
(b) Ratios include line of credit interest expense which is less than 0.01%.
(c) Total net expenses include the impact of certain fee waivers/expense reimbursements made by the Investment Manager and certain of its affiliates, if applicable.
(d) The benefits derived from expense reductions had an impact of less than 0.01%.
The accompanying Notes to Financial Statements are an integral part of this statement.
Annual Report 2016
18
COLUMBIA LARGE CAP GROWTH FUND V
FINANCIAL HIGHLIGHTS (continued)
| | | Year Ended
February 29, | | Year Ended February 28, | | Year Ended
February 29, | |
Class B | | 2016 | | 2015 | | 2014 | | 2013 | | 2012 | |
Per share data | |
Net asset value, beginning of period | | $ | 21.22 | | | $ | 22.50 | | | $ | 21.33 | | | $ | 20.13 | | | $ | 19.31 | | |
Income from investment operations: | |
Net investment loss | | | (0.23 | ) | | | (0.18 | ) | | | (0.21 | ) | | | (0.10 | ) | | | (0.13 | ) | |
Net realized and unrealized gain (loss) | | | (1.47 | ) | | | 1.92 | | | | 6.35 | | | | 1.30 | | | | 0.95 | | |
Total from investment operations | | | (1.70 | ) | | | 1.74 | | | | 6.14 | | | | 1.20 | | | | 0.82 | | |
Less distributions to shareholders: | |
Net realized gains | | | (7.17 | ) | | | (3.02 | ) | | | (4.97 | ) | | | — | | | | — | | |
Total distributions to shareholders | | | (7.17 | ) | | | (3.02 | ) | | | (4.97 | ) | | | — | | | | — | | |
Net asset value, end of period | | $ | 12.35 | | | $ | 21.22 | | | $ | 22.50 | | | $ | 21.33 | | | $ | 20.13 | | |
Total return | | | (12.35 | %) | | | 8.26 | % | | | 31.58 | % | | | 5.96 | % | | | 4.25 | % | |
Ratios to average net assets(a) | |
Total gross expenses | | | 1.94 | %(b) | | | 1.92 | %(b) | | | 1.92 | %(b) | | | 2.10 | % | | | 2.09 | %(b) | |
Total net expenses(c) | | | 1.94 | %(b)(d) | | | 1.92 | %(b)(d) | | | 1.92 | %(b)(d) | | | 2.01 | %(d) | | | 2.03 | %(b)(d) | |
Net investment loss | | | (1.27 | %) | | | (0.85 | %) | | | (0.93 | %) | | | (0.52 | %) | | | (0.68 | %) | |
Supplemental data | |
Net assets, end of period (in thousands) | | $ | 1,097 | | | $ | 4,641 | | | $ | 10,639 | | | $ | 18,659 | | | $ | 27,041 | | |
Portfolio turnover | | | 106 | % | | | 69 | % | | | 97 | % | | | 90 | % | | | 65 | % | |
Notes to Financial Highlights
(a) In addition to the fees and expenses that the Fund bears directly, the Fund indirectly bears a pro rata share of the fees and expenses of any other funds in which it invests. Such indirect expenses are not included in the Fund's reported expense ratios.
(b) Ratios include line of credit interest expense which is less than 0.01%.
(c) Total net expenses include the impact of certain fee waivers/expense reimbursements made by the Investment Manager and certain of its affiliates, if applicable.
(d) The benefits derived from expense reductions had an impact of less than 0.01%.
The accompanying Notes to Financial Statements are an integral part of this statement.
Annual Report 2016
19
COLUMBIA LARGE CAP GROWTH FUND V
FINANCIAL HIGHLIGHTS (continued)
| | | Year Ended
February 29, | | Year Ended February 28, | | Year Ended
February 29, | |
Class C | | 2016 | | 2015 | | 2014 | | 2013 | | 2012 | |
Per share data | |
Net asset value, beginning of period | | $ | 21.27 | | | $ | 22.54 | | | $ | 21.35 | | | $ | 20.15 | | | $ | 19.34 | | |
Income from investment operations: | |
Net investment loss | | | (0.22 | ) | | | (0.18 | ) | | | (0.22 | ) | | | (0.10 | ) | | | (0.13 | ) | |
Net realized and unrealized gain (loss) | | | (1.49 | ) | | | 1.93 | | | | 6.38 | | | | 1.30 | | | | 0.94 | | |
Total from investment operations | | | (1.71 | ) | | | 1.75 | | | | 6.16 | | | | 1.20 | | | | 0.81 | | |
Less distributions to shareholders: | |
Net realized gains | | | (7.17 | ) | | | (3.02 | ) | | | (4.97 | ) | | | — | | | | — | | |
Total distributions to shareholders | | | (7.17 | ) | | | (3.02 | ) | | | (4.97 | ) | | | — | | | | — | | |
Net asset value, end of period | | $ | 12.39 | | | $ | 21.27 | | | $ | 22.54 | | | $ | 21.35 | | | $ | 20.15 | | |
Total return | | | (12.37 | %) | | | 8.30 | % | | | 31.64 | % | | | 5.96 | % | | | 4.19 | % | |
Ratios to average net assets(a) | |
Total gross expenses | | | 1.94 | %(b) | | | 1.92 | %(b) | | | 1.93 | %(b) | | | 2.10 | % | | | 2.09 | %(b) | |
Total net expenses(c) | | | 1.94 | %(b)(d) | | | 1.92 | %(b)(d) | | | 1.93 | %(b)(d) | | | 2.01 | %(d) | | | 2.03 | %(b)(d) | |
Net investment loss | | | (1.23 | %) | | | (0.84 | %) | | | (0.95 | %) | | | (0.51 | %) | | | (0.67 | %) | |
Supplemental data | |
Net assets, end of period (in thousands) | | $ | 182,414 | | | $ | 295,583 | | | $ | 315,734 | | | $ | 276,437 | | | $ | 330,213 | | |
Portfolio turnover | | | 106 | % | | | 69 | % | | | 97 | % | | | 90 | % | | | 65 | % | |
Notes to Financial Highlights
(a) In addition to the fees and expenses that the Fund bears directly, the Fund indirectly bears a pro rata share of the fees and expenses of any other funds in which it invests. Such indirect expenses are not included in the Fund's reported expense ratios.
(b) Ratios include line of credit interest expense which is less than 0.01%.
(c) Total net expenses include the impact of certain fee waivers/expense reimbursements made by the Investment Manager and certain of its affiliates, if applicable.
(d) The benefits derived from expense reductions had an impact of less than 0.01%.
The accompanying Notes to Financial Statements are an integral part of this statement.
Annual Report 2016
20
COLUMBIA LARGE CAP GROWTH FUND V
FINANCIAL HIGHLIGHTS (continued)
| | | Year Ended
February 29, | | Year Ended February 28, | | Year Ended
February 29, | |
Class I | | 2016 | | 2015 | | 2014 | | 2013 | | 2012 | |
Per share data | |
Net asset value, beginning of period | | $ | 25.43 | | | $ | 26.31 | | | $ | 24.17 | | | $ | 22.77 | | | $ | 21.55 | | |
Income from investment operations: | |
Net investment income (loss) | | | (0.00 | )(a) | | | 0.09 | | | | 0.07 | | | | 0.15 | | | | 0.13 | | |
Net realized and unrealized gain (loss) | | | (1.98 | ) | | | 2.29 | | | | 7.31 | | | | 1.47 | | | | 1.09 | | |
Total from investment operations | | | (1.98 | ) | | | 2.38 | | | | 7.38 | | | | 1.62 | | | | 1.22 | | |
Less distributions to shareholders: | |
Net investment income | | | — | | | | — | | | | (0.01 | ) | | | (0.22 | ) | | | — | | |
Net realized gains | | | (7.21 | ) | | | (3.26 | ) | | | (5.23 | ) | | | — | | | | — | | |
Total distributions to shareholders | | | (7.21 | ) | | | (3.26 | ) | | | (5.24 | ) | | | (0.22 | ) | | | — | | |
Net asset value, end of period | | $ | 16.24 | | | $ | 25.43 | | | $ | 26.31 | | | $ | 24.17 | | | $ | 22.77 | | |
Total return | | | (11.30 | %) | | | 9.60 | % | | | 33.18 | % | | | 7.20 | % | | | 5.66 | % | |
Ratios to average net assets(b) | |
Total gross expenses | | | 0.72 | %(c) | | | 0.73 | %(c) | | | 0.70 | %(c) | | | 0.87 | % | | | 0.89 | %(c) | |
Total net expenses(d) | | | 0.72 | %(c) | | | 0.73 | %(c) | | | 0.70 | %(c) | | | 0.87 | % | | | 0.88 | %(c)(e) | |
Net investment income (loss) | | | (0.02 | %) | | | 0.35 | % | | | 0.28 | % | | | 0.65 | % | | | 0.64 | % | |
Supplemental data | |
Net assets, end of period (in thousands) | | $ | 2 | | | $ | 2 | | | $ | 4 | | | $ | 3 | | | $ | 3 | | |
Portfolio turnover | | | 106 | % | | | 69 | % | | | 97 | % | | | 90 | % | | | 65 | % | |
Notes to Financial Highlights
(a) Rounds to zero.
(b) In addition to the fees and expenses that the Fund bears directly, the Fund indirectly bears a pro rata share of the fees and expenses of any other funds in which it invests. Such indirect expenses are not included in the Fund's reported expense ratios.
(c) Ratios include line of credit interest expense which is less than 0.01%.
(d) Total net expenses include the impact of certain fee waivers/expense reimbursements made by the Investment Manager and certain of its affiliates, if applicable.
(e) The benefits derived from expense reductions had an impact of less than 0.01%.
The accompanying Notes to Financial Statements are an integral part of this statement.
Annual Report 2016
21
COLUMBIA LARGE CAP GROWTH FUND V
FINANCIAL HIGHLIGHTS (continued)
| | | Year Ended
February 29, | | Year Ended February 28, | | Year Ended
February 29, | |
Class R | | 2016 | | 2015 | | 2014 | | 2013 | | 2012 | |
Per share data | |
Net asset value, beginning of period | | $ | 24.17 | | | $ | 25.20 | | | $ | 23.36 | | | $ | 21.94 | | | $ | 20.94 | | |
Income from investment operations: | |
Net investment income (loss) | | | (0.15 | ) | | | (0.08 | ) | | | (0.11 | ) | | | (0.00 | )(a) | | | (0.03 | ) | |
Net realized and unrealized gain (loss) | | | (1.81 | ) | | | 2.17 | | | | 7.02 | | | | 1.43 | | | | 1.03 | | |
Total from investment operations | | | (1.96 | ) | | | 2.09 | | | | 6.91 | | | | 1.43 | | | | 1.00 | | |
Less distributions to shareholders: | |
Net investment income | | | — | | | | — | | | | — | | | | (0.01 | ) | | | — | | |
Net realized gains | | | (7.19 | ) | | | (3.12 | ) | | | (5.07 | ) | | | — | | | | — | | |
Total distributions to shareholders | | | (7.19 | ) | | | (3.12 | ) | | | (5.07 | ) | | | (0.01 | ) | | | — | | |
Net asset value, end of period | | $ | 15.02 | | | $ | 24.17 | | | $ | 25.20 | | | $ | 23.36 | | | $ | 21.94 | | |
Total return | | | (11.88 | %) | | | 8.81 | % | | | 32.24 | % | | | 6.50 | % | | | 4.78 | % | |
Ratios to average net assets(b) | |
Total gross expenses | | | 1.44 | %(c) | | | 1.42 | %(c) | | | 1.43 | %(c) | | | 1.61 | % | | | 1.58 | %(c) | |
Total net expenses(d) | | | 1.44 | %(c)(e) | | | 1.42 | %(c)(e) | | | 1.43 | %(c)(e) | | | 1.51 | %(e) | | | 1.53 | %(c)(e) | |
Net investment income (loss) | | | (0.73 | %) | | | (0.34 | %) | | | (0.45 | %) | | | (0.00 | %)(a) | | | (0.16 | %) | |
Supplemental data | |
Net assets, end of period (in thousands) | | $ | 16,625 | | | $ | 23,700 | | | $ | 22,273 | | | $ | 19,530 | | | $ | 21,166 | | |
Portfolio turnover | | | 106 | % | | | 69 | % | | | 97 | % | | | 90 | % | | | 65 | % | |
Notes to Financial Highlights
(a) Rounds to zero.
(b) In addition to the fees and expenses that the Fund bears directly, the Fund indirectly bears a pro rata share of the fees and expenses of any other funds in which it invests. Such indirect expenses are not included in the Fund's reported expense ratios.
(c) Ratios include line of credit interest expense which is less than 0.01%.
(d) Total net expenses include the impact of certain fee waivers/expense reimbursements made by the Investment Manager and certain of its affiliates, if applicable.
(e) The benefits derived from expense reductions had an impact of less than 0.01%.
The accompanying Notes to Financial Statements are an integral part of this statement.
Annual Report 2016
22
COLUMBIA LARGE CAP GROWTH FUND V
FINANCIAL HIGHLIGHTS (continued)
| | | Year Ended
February 29, | | Year Ended February 28, | |
Class R4 | | 2016 | | 2015 | | 2014 | | 2013(a) | |
Per share data | |
Net asset value, beginning of period | | $ | 25.80 | | | $ | 26.66 | | | $ | 24.44 | | | $ | 22.14 | | |
Income from investment operations: | |
Net investment income (loss) | | | (0.05 | ) | | | 0.04 | | | | 0.02 | | | | 0.08 | | |
Net realized and unrealized gain (loss) | | | (2.02 | ) | | | 2.32 | | | | 7.38 | | | | 2.32 | | |
Total from investment operations | | | (2.07 | ) | | | 2.36 | | | | 7.40 | | | | 2.40 | | |
Less distributions to shareholders: | |
Net investment income | | | — | | | | — | | | | (0.00 | )(b) | | | (0.10 | ) | |
Net realized gains | | | (7.20 | ) | | | (3.22 | ) | | | (5.18 | ) | | | — | | |
Total distributions to shareholders | | | (7.20 | ) | | | (3.22 | ) | | | (5.18 | ) | | | (0.10 | ) | |
Net asset value, end of period | | $ | 16.53 | | | $ | 25.80 | | | $ | 26.66 | | | $ | 24.44 | | |
Total return | | | (11.49 | %) | | | 9.39 | % | | | 32.88 | % | | | 10.89 | % | |
Ratios to average net assets(c) | |
Total gross expenses | | | 0.94 | %(d) | | | 0.92 | %(d) | | | 0.93 | %(d) | | | 1.01 | %(e) | |
Total net expenses(f) | | | 0.94 | %(d)(g) | | | 0.92 | %(d)(g) | | | 0.93 | %(d)(g) | | | 1.00 | %(e) | |
Net investment income (loss) | | | (0.23 | %) | | | 0.16 | % | | | 0.07 | % | | | 1.11 | %(e) | |
Supplemental data | |
Net assets, end of period (in thousands) | | $ | 18,456 | | | $ | 27,591 | | | $ | 26,343 | | | $ | 66 | | |
Portfolio turnover | | | 106 | % | | | 69 | % | | | 97 | % | | | 90 | % | |
Notes to Financial Highlights
(a) Based on operations from November 8, 2012 (commencement of operations) through the stated period end.
(b) Rounds to zero.
(c) In addition to the fees and expenses that the Fund bears directly, the Fund indirectly bears a pro rata share of the fees and expenses of any other funds in which it invests. Such indirect expenses are not included in the Fund's reported expense ratios.
(d) Ratios include line of credit interest expense which is less than 0.01%.
(e) Annualized.
(f) Total net expenses include the impact of certain fee waivers/expense reimbursements made by the Investment Manager and certain of its affiliates, if applicable.
(g) The benefits derived from expense reductions had an impact of less than 0.01%.
The accompanying Notes to Financial Statements are an integral part of this statement.
Annual Report 2016
23
COLUMBIA LARGE CAP GROWTH FUND V
FINANCIAL HIGHLIGHTS (continued)
| | | Year Ended
February 29, | | Year Ended February 28, | |
Class R5 | | 2016 | | 2015 | | 2014 | | 2013(a) | |
Per share data | |
Net asset value, beginning of period | | $ | 25.80 | | | $ | 26.66 | | | $ | 24.43 | | | $ | 22.14 | | |
Income from investment operations: | |
Net investment income (loss) | | | (0.02 | ) | | | 0.08 | | | | 0.05 | | | | 0.09 | | |
Net realized and unrealized gain (loss) | | | (2.01 | ) | | | 2.31 | | | | 7.40 | | | | 2.32 | | |
Total from investment operations | | | (2.03 | ) | | | 2.39 | | | | 7.45 | | | | 2.41 | | |
Less distributions to shareholders: | |
Net investment income | | | — | | | | — | | | | (0.01 | ) | | | (0.12 | ) | |
Net realized gains | | | (7.21 | ) | | | (3.25 | ) | | | (5.21 | ) | | | — | | |
Total distributions to shareholders | | | (7.21 | ) | | | (3.25 | ) | | | (5.22 | ) | | | (0.12 | ) | |
Net asset value, end of period | | $ | 16.56 | | | $ | 25.80 | | | $ | 26.66 | | | $ | 24.43 | | |
Total return | | | (11.34 | %) | | | 9.51 | % | | | 33.12 | % | | | 10.92 | % | |
Ratios to average net assets(b) | |
Total gross expenses | | | 0.81 | %(c) | | | 0.78 | %(c) | | | 0.77 | %(c) | | | 0.89 | %(d) | |
Total net expenses(e) | | | 0.81 | %(c) | | | 0.78 | %(c) | | | 0.77 | %(c) | | | 0.89 | %(d) | |
Net investment income (loss) | | | (0.11 | %) | | | 0.31 | % | | | 0.18 | % | | | 1.22 | %(d) | |
Supplemental data | |
Net assets, end of period (in thousands) | | $ | 6,174 | | | $ | 4,922 | | | $ | 2,774 | | | $ | 3 | | |
Portfolio turnover | | | 106 | % | | | 69 | % | | | 97 | % | | | 90 | % | |
Notes to Financial Highlights
(a) Based on operations from November 8, 2012 (commencement of operations) through the stated period end.
(b) In addition to the fees and expenses that the Fund bears directly, the Fund indirectly bears a pro rata share of the fees and expenses of any other funds in which it invests. Such indirect expenses are not included in the Fund's reported expense ratios.
(c) Ratios include line of credit interest expense which is less than 0.01%.
(d) Annualized.
(e) Total net expenses include the impact of certain fee waivers/expense reimbursements made by the Investment Manager and certain of its affiliates, if applicable.
The accompanying Notes to Financial Statements are an integral part of this statement.
Annual Report 2016
24
COLUMBIA LARGE CAP GROWTH FUND V
FINANCIAL HIGHLIGHTS (continued)
| | | Year Ended
February 29, | | Year Ended February 28, | | Year Ended
February 29, | |
Class W | | 2016 | | 2015 | | 2014 | | 2013 | | 2012 | |
Per share data | |
Net asset value, beginning of period | | $ | 24.69 | | | $ | 25.66 | | | $ | 23.69 | | | $ | 22.26 | | | $ | 21.20 | | |
Income from investment operations: | |
Net investment income (loss) | | | (0.10 | ) | | | (0.01 | ) | | | (0.04 | ) | | | 0.06 | | | | 0.02 | | |
Net realized and unrealized gain (loss) | | | (1.87 | ) | | | 2.22 | | | | 7.14 | | | | 1.44 | | | | 1.04 | | |
Total from investment operations | | | (1.97 | ) | | | 2.21 | | | | 7.10 | | | | 1.50 | | | | 1.06 | | |
Less distributions to shareholders: | |
Net investment income | | | — | | | | — | | | | — | | | | (0.07 | ) | | | — | | |
Net realized gains | | | (7.20 | ) | | | (3.18 | ) | | | (5.13 | ) | | | — | | | | — | | |
Total distributions to shareholders | | | (7.20 | ) | | | (3.18 | ) | | | (5.13 | ) | | | (0.07 | ) | | | — | | |
Net asset value, end of period | | $ | 15.52 | | | $ | 24.69 | | | $ | 25.66 | | | $ | 23.69 | | | $ | 22.26 | | |
Total return | | | (11.64 | %) | | | 9.14 | % | | | 32.63 | % | | | 6.76 | % | | | 5.00 | % | |
Ratios to average net assets(a) | |
Total gross expenses | | | 1.15 | %(b) | | | 1.12 | %(b) | | | 1.15 | %(b) | | | 1.35 | % | | | 1.29 | %(b) | |
Total net expenses(c) | | | 1.15 | %(b)(d) | | | 1.12 | %(b)(d) | | | 1.15 | %(b)(d) | | | 1.26 | % | | | 1.26 | %(b)(d) | |
Net investment income (loss) | | | (0.45 | %) | | | (0.04 | %) | | | (0.17 | %) | | | 0.25 | % | | | 0.11 | % | |
Supplemental data | |
Net assets, end of period (in thousands) | | $ | 2 | | | $ | 3 | | | $ | 4 | | | $ | 3 | | | $ | 3 | | |
Portfolio turnover | | | 106 | % | | | 69 | % | | | 97 | % | | | 90 | % | | | 65 | % | |
Notes to Financial Highlights
(a) In addition to the fees and expenses that the Fund bears directly, the Fund indirectly bears a pro rata share of the fees and expenses of any other funds in which it invests. Such indirect expenses are not included in the Fund's reported expense ratios.
(b) Ratios include line of credit interest expense which is less than 0.01%.
(c) Total net expenses include the impact of certain fee waivers/expense reimbursements made by the Investment Manager and certain of its affiliates, if applicable.
(d) The benefits derived from expense reductions had an impact of less than 0.01%.
The accompanying Notes to Financial Statements are an integral part of this statement.
Annual Report 2016
25
COLUMBIA LARGE CAP GROWTH FUND V
FINANCIAL HIGHLIGHTS (continued)
| | | Year Ended
February 29, | | Year Ended February 28, | | Year Ended
February 29, | |
Class Z | | 2016 | | 2015 | | 2014 | | 2013 | | 2012 | |
Per share data | |
Net asset value, beginning of period | | $ | 25.35 | | | $ | 26.25 | | | $ | 24.13 | | | $ | 22.71 | | | $ | 21.57 | | |
Income from investment operations: | |
Net investment income (loss) | | | (0.05 | ) | | | 0.03 | | | | 0.02 | | | | 0.10 | | | | 0.07 | | |
Net realized and unrealized gain (loss) | | | (1.96 | ) | | | 2.29 | | | | 7.28 | | | | 1.48 | | | | 1.07 | | |
Total from investment operations | | | (2.01 | ) | | | 2.32 | | | | 7.30 | | | | 1.58 | | | | 1.14 | | |
Less distributions to shareholders: | |
Net investment income | | | — | | | | — | | | | (0.00 | )(a) | | | (0.16 | ) | | | — | | |
Net realized gains | | | (7.20 | ) | | | (3.22 | ) | | | (5.18 | ) | | | — | | | | — | | |
Total distributions to shareholders | | | (7.20 | ) | | | (3.22 | ) | | | (5.18 | ) | | | (0.16 | ) | | | — | | |
Net asset value, end of period | | $ | 16.14 | | | $ | 25.35 | | | $ | 26.25 | | | $ | 24.13 | | | $ | 22.71 | | |
Total return | | | (11.45 | %) | | | 9.39 | % | | | 32.89 | % | | | 7.02 | % | | | 5.29 | % | |
Ratios to average net assets(b) | |
Total gross expenses | | | 0.94 | %(c) | | | 0.92 | %(c) | | | 0.92 | %(c) | | | 1.10 | % | | | 1.08 | %(c) | |
Total net expenses(d) | | | 0.94 | %(c)(e) | | | 0.92 | %(c)(e) | | | 0.92 | %(c)(e) | | | 1.02 | %(e) | | | 1.03 | %(c)(e) | |
Net investment income (loss) | | | (0.24 | %) | | | 0.13 | % | | | 0.07 | % | | | 0.43 | % | | | 0.34 | % | |
Supplemental data | |
Net assets, end of period (in thousands) | | $ | 405,802 | | | $ | 848,385 | | | $ | 1,094,525 | | | $ | 1,237,679 | | | $ | 2,108,304 | | |
Portfolio turnover | | | 106 | % | | | 69 | % | | | 97 | % | | | 90 | % | | | 65 | % | |
Notes to Financial Highlights
(a) Rounds to zero.
(b) In addition to the fees and expenses that the Fund bears directly, the Fund indirectly bears a pro rata share of the fees and expenses of any other funds in which it invests. Such indirect expenses are not included in the Fund's reported expense ratios.
(c) Ratios include line of credit interest expense which is less than 0.01%.
(d) Total net expenses include the impact of certain fee waivers/expense reimbursements made by the Investment Manager and certain of its affiliates, if applicable.
(e) The benefits derived from expense reductions had an impact of less than 0.01%.
The accompanying Notes to Financial Statements are an integral part of this statement.
Annual Report 2016
26
COLUMBIA LARGE CAP GROWTH FUND V
NOTES TO FINANCIAL STATEMENTS
February 29, 2016
Note 1. Organization
Columbia Large Cap Growth Fund V (formerly known as Columbia Marsico Growth Fund) (the Fund), a series of Columbia Funds Series Trust (the Trust), is a diversified fund. The Trust is registered under the Investment Company Act of 1940, as amended (the 1940 Act), as an open-end management investment company organized as a Delaware statutory trust. Effective November 20, 2015, Columbia Marsico Growth Fund was renamed Columbia Large Cap Growth Fund V.
Fund Shares
The Trust may issue an unlimited number of shares (without par value). The Fund offers Class A, Class B, Class C, Class I, Class R, Class R4, Class R5, Class W and Class Z shares. Although all share classes generally have identical voting, dividend and liquidation rights, each share class votes separately when required by the Trust's organizational documents or by law. Different share classes pay different distribution amounts to the extent the expenses of such share classes differ, and distributions in liquidation will be proportional to the net asset value of each share class. Each share class has its own expense and sales charge structure.
Class A shares are subject to a maximum front-end sales charge of 5.75% based on the initial investment amount. Class A shares purchased without an initial sales charge in accounts aggregating $1 million to $50 million at the time of purchase are subject to a contingent deferred sales charge (CDSC) if the shares are sold within 18 months after purchase, charged as follows: 1.00% CDSC if redeemed within 12 months after purchase, and 0.50% CDSC if redeemed more than 12, but less than 18, months after purchase.
Class B shares may be subject to a maximum CDSC of 5.00% based upon the holding period after purchase. Class B shares will generally convert to Class A shares eight years after purchase. The Fund no longer accepts investments by new or existing investors in the Fund's Class B shares, except in connection with the reinvestment of any dividend and/or capital gain distributions in Class B shares of the Fund and exchanges by existing Class B shareholders of certain other funds within the Columbia Family of Funds.
Class C shares are subject to a 1.00% CDSC on shares redeemed within 12 months after purchase.
Class I shares are not subject to sales charges and are available only to the Columbia Family of Funds.
Class R shares are not subject to sales charges and are generally available only to certain retirement plans and other investors as described in the Fund's prospectus.
Class R4 shares are not subject to sales charges and are generally available only to omnibus retirement plans and certain investors as described in the Fund's prospectus.
Class R5 shares are not subject to sales charges and are generally available only to investors purchasing through authorized investment professionals and omnibus retirement plans.
Class W shares are not subject to sales charges and are available only to investors purchasing through authorized investment programs managed by investment professionals, including discretionary managed account programs.
Class Z shares are not subject to sales charges and are available only to eligible investors, which are subject to different investment minimums as described in the Fund's prospectus.
Note 2. Summary of Significant Accounting Policies
Basis of Preparation
The Fund is an investment company that applies the accounting and reporting guidance in the Financial Accounting Standards Board (FASB) Accounting Standards Codification Topic 946, Financial Services — Investment Companies (ASC 946). The financial statements are prepared in accordance with U.S. generally accepted accounting principles (GAAP), which requires management to make certain estimates and assumptions that affect the reported amounts of assets and liabilities, the disclosure of contingent assets and liabilities at the date of the financial statements and the reported amounts of income and expenses during the reporting period. Actual results could differ from those estimates.
The following is a summary of significant accounting policies followed by the Fund in the preparation of its financial statements.
Security Valuation
All equity securities and exchange-traded funds are valued at the close of business of the New York Stock Exchange (NYSE). Equity securities and exchange-traded funds are valued at the last quoted sales price on the principal exchange or market on which they trade, except for securities traded on the NASDAQ Stock Market, which are valued at the NASDAQ official close price. Unlisted
Annual Report 2016
27
COLUMBIA LARGE CAP GROWTH FUND V
NOTES TO FINANCIAL STATEMENTS (continued)
February 29, 2016
securities or listed securities for which there were no sales during the day are valued at the mean of the latest quoted bid and ask prices on such exchanges or markets.
Foreign equity securities are valued based on the closing price on the foreign exchange in which such securities are primarily traded. If any foreign equity security closing prices are not readily available, the securities are valued at the mean of the latest quoted bid and ask prices on such exchanges or markets. Foreign currency exchange rates are generally determined at 4:00 p.m. Eastern (U.S.) time. Many securities markets and exchanges outside the U.S. close prior to the close of the NYSE; therefore, the closing prices for securities in such markets or on such exchanges may not fully reflect events that occur after such close but before the close of the NYSE. In those situations, foreign securities will be fair valued pursuant to a policy adopted by the Board of Trustees (the Board), including, if available, utilizing a third party pricing service to determine these fair values. The third party pricing service takes into account multiple factors, including, but not limited to, movements in the U.S. securities markets, certain depositary receipts, futures contracts and foreign exchange rates that have occurred subsequent to the close of the foreign exchange or market, to determine a good faith estimate that reasonably reflects the current market conditions as of the close of the NYSE. The fair value of a security is likely to be different from the quoted or published price, if available.
Investments in open-end investment companies, including money market funds, are valued at their latest net asset value.
Investments for which market quotations are not readily available, or that have quotations which management believes are not reflective of market value or reliable, are valued at fair value as determined in good faith under procedures approved by and under the general supervision of the Board. If a security or class of securities (such as foreign securities) is valued at fair value, such value is likely to be different from the quoted or published price for the security.
The determination of fair value often requires significant judgment. To determine fair value, management may use assumptions including but not limited to future cash flows and estimated risk premiums. Multiple inputs from various sources may be used to determine fair value.
GAAP requires disclosure regarding the inputs and valuation techniques used to measure fair value and any changes in valuation inputs or techniques. In addition,
investments shall be disclosed by major category. This information is disclosed following the Fund's Portfolio of Investments.
Foreign Currency Transactions and Translations
The values of all assets and liabilities denominated in foreign currencies are generally translated into U.S. dollars at exchange rates determined at the close of the NYSE on any given day. Net realized and unrealized gains (losses) on foreign currency transactions and translations include gains (losses) arising from the fluctuation in exchange rates between trade and settlement dates on securities transactions, gains (losses) arising from the disposition of foreign currency and currency gains (losses) between the accrual and payment dates on dividends, interest income and foreign withholding taxes.
For financial statement purposes, the Fund does not distinguish that portion of gains (losses) on investments which is due to changes in foreign exchange rates from that which is due to changes in market prices of the investments. Such fluctuations are included with the net realized and unrealized gains (losses) on investments in the Statement of Operations.
Security Transactions
Security transactions are accounted for on the trade date. Cost is determined and gains (losses) are based upon the specific identification method for both financial statement and federal income tax purposes.
Income Recognition
Corporate actions and dividend income are generally recorded net of any non-reclaimable tax withholdings, on the ex-dividend date or upon receipt of ex-dividend notification in the case of certain foreign securities.
The Fund may receive distributions from holdings in equity securities, business development companies (BDCs), exchange-traded funds, other regulated investment companies (RICs), and real estate investment trusts (REITs), which report information on the tax character of their distributions annually. These distributions are allocated to dividend income, capital gain and return of capital based on actual information reported. Return of capital is recorded as a reduction of the cost basis of securities held. If the Fund no longer owns the applicable securities, return of capital is recorded as a realized gain. With respect to REITs, to the extent actual information has not yet been reported, estimates for return of capital are made by the Fund's management. Management's estimates are
Annual Report 2016
28
COLUMBIA LARGE CAP GROWTH FUND V
NOTES TO FINANCIAL STATEMENTS (continued)
February 29, 2016
subsequently adjusted when the actual character of the distributions is disclosed by the REITs, which could result in a proportionate change in return of capital to shareholders.
Awards from class action litigation are recorded as a reduction of cost basis if the Fund still owns the applicable securities on the payment date. If the Fund no longer owns the applicable securities, the proceeds are recorded as realized gains.
Expenses
General expenses of the Trust are allocated to the Fund and other funds of the Trust based upon relative net assets or other expense allocation methodologies determined by the nature of the expense. Expenses directly attributable to the Fund are charged to the Fund. Expenses directly attributable to a specific class of shares are charged to that share class.
Determination of Class Net Asset Value
All income, expenses (other than class-specific expenses, which are charged to that share class, as shown in the Statement of Operations) and realized and unrealized gains (losses) are allocated to each class of the Fund on a daily basis, based on the relative net assets of each class, for purposes of determining the net asset value of each class.
Federal Income Tax Status
The Fund intends to qualify each year as a regulated investment company under Subchapter M of the Internal Revenue Code, as amended, and will distribute substantially all of its taxable income (including net short-term capital gains), if any, for its tax year, and as such will not be subject to federal income taxes. In addition, the Fund intends to distribute in each calendar year substantially all of its net investment income, capital gains and certain other amounts, if any, such that the Fund should not be subject to federal excise tax. Therefore, no federal income or excise tax provision is recorded.
Foreign Taxes
The Fund may be subject to foreign taxes on income, gains on investments or currency repatriation, a portion of which may be recoverable. The Fund will accrue such taxes and recoveries, as applicable, based upon its current interpretation of tax rules and regulations that exist in the markets in which it invests.
Realized gains in certain countries may be subject to foreign taxes at the Fund level, based on statutory rates.
The Fund accrues for such foreign taxes on realized and unrealized gains at the appropriate rate for each jurisdiction, as applicable. The amount, if any, is disclosed as a liability on the Statement of Assets and Liabilities.
Distributions to Shareholders
Distributions from net investment income, if any, are declared and paid semi-annually. Net realized capital gains, if any, are distributed at least annually. Income distributions and capital gain distributions are determined in accordance with federal income tax regulations, which may differ from GAAP.
Guarantees and Indemnifications
Under the Trust's organizational documents and, in some cases, by contract, its officers and trustees are indemnified against certain liabilities arising out of the performance of their duties to the Trust or its funds. In addition, certain of the Fund's contracts with its service providers contain general indemnification clauses. The Fund's maximum exposure under these arrangements is unknown since the amount of any future claims that may be made against the Fund cannot be determined, and the Fund has no historical basis for predicting the likelihood of any such claims.
Recent Accounting Pronouncement
Fair Value Measurement (Topic 820), Disclosure for Investments in Certain Entities That Calculate Net Asset Value per Share (or Its Equivalent)
In May 2015, FASB issued Accounting Standards Update (ASU) No. 2015-07, Fair Value Measurement (Topic 820), Disclosure for Investments in Certain Entities That Calculate Net Asset Value per Share (or Its Equivalent). ASU No. 2015-07 changes the disclosure requirements for investments for which fair value is measured using the net asset value per share practical expedient. The disclosure requirements are effective for annual periods beginning after December 15, 2015 and interim periods within those fiscal years. At this time, management is evaluating the implications of this guidance and the impact it will have on the financial statement amounts and footnote disclosures, if any.
Note 3. Fees and Other Transactions with Affiliates
Management Fees
Effective July 1, 2015, the Fund entered into a Management Agreement with Columbia Management Investment Advisers, LLC (the Investment Manager), a
Annual Report 2016
29
COLUMBIA LARGE CAP GROWTH FUND V
NOTES TO FINANCIAL STATEMENTS (continued)
February 29, 2016
wholly-owned subsidiary of Ameriprise Financial, Inc. (Ameriprise Financial). Under the Management Agreement, the Investment Manager provides the Fund with investment research and advice, as well as administrative and accounting services. The management services fee is an annual fee that is equal to a percentage of the Fund's average daily net assets that declines from 0.77% to 0.57% as the Fund's net assets increase. The effective management services fee rate for the year ended February 29, 2016 was 0.73% of the Fund's average daily net assets.
Prior to July 1, 2015, the Fund paid the Investment Manager an annual fee for advisory services under an Investment Management Services Agreement and a separate annual fee for administrative and accounting services under an Administrative Services Agreement. For the period from March 1, 2015 through June 30, 2015, the investment advisory services fee paid to the Investment Manager was $3,497,170, and the administrative services fee paid to the Investment Manager was $289,936.
Subadvisory Agreement
Prior to November 20, 2015, the Investment Manager entered into a Subadvisory Agreement with Marsico Capital Management, LLC (Marsico) to serve as the subadviser to the Fund. The Investment Manager compensated Marsico to manage the investment of the Fund's assets. Effective November 20, 2015, Marsico no longer serves as the subadviser to the Fund and the Investment Manager has assumed the day-to-day portfolio management of the Fund.
Other Expenses
Other expenses are for, among other things, miscellaneous expenses of the Fund or the Board, including payments to Board Services Corp., a company providing limited administrative services to the Fund and the Board. That company's expenses include boardroom and office expense, employee compensation, employee health and retirement benefits, and certain other expenses. For the year ended February 29, 2016, other expenses paid by the Fund to this company were $3,533.
Compensation of Board Members
Board members, who are not officers or employees of the Investment Manager or Ameriprise Financial, are compensated for their services to the Fund as disclosed in the Statement of Operations. Under a Deferred
Compensation Plan (the Plan), these Board members may elect to defer payment of up to 100% of their compensation. Deferred amounts are treated as though equivalent dollar amounts had been invested in shares of certain funds managed by the Investment Manager. The Fund's liability for these amounts is adjusted for market value changes and remains in the Fund until distributed in accordance with the Plan. All amounts payable under the Plan constitute a general unsecured obligation of the Fund.
Transfer Agency Fees
Under a Transfer and Dividend Disbursing Agent Agreement, Columbia Management Investment Services Corp. (the Transfer Agent), an affiliate of the Investment Manager and a wholly-owned subsidiary of Ameriprise Financial, is responsible for providing transfer agency services to the Fund. The Transfer Agent has contracted with Boston Financial Data Services (BFDS) to serve as sub-transfer agent.
The Transfer Agent receives a monthly transfer agency fee based on the number or the average value of accounts, depending on the type of account. In addition, the Transfer Agent also receives sub-transfer agency fees based on a percentage of the average aggregate value of the Fund's shares maintained in omnibus accounts (other than omnibus accounts for which American Enterprise Investment Services Inc. is the broker of record or accounts where the beneficial shareholder is a customer of Ameriprise Financial Services, Inc., for which the Transfer Agent receives a per account fee). The Transfer Agent pays the fees of BFDS for services as sub-transfer agent and is not entitled to reimbursement for such fees from the Fund (with the exception of out-of-pocket fees).
The Transfer Agent also receives compensation from the Fund for various shareholder services and reimbursements for certain out-of-pocket fees. Class I shares do not pay transfer agency fees. Total transfer agency fees for Class R5 shares are subject to an annual limitation of not more than 0.05% of the average daily net assets attributable to Class R5 shares.
Annual Report 2016
30
COLUMBIA LARGE CAP GROWTH FUND V
NOTES TO FINANCIAL STATEMENTS (continued)
February 29, 2016
For the year ended February 29, 2016, the Fund's effective transfer agency fee rates as a percentage of average daily net assets of each class were as follows:
Class A | | | 0.18 | % | |
Class B | | | 0.18 | | |
Class C | | | 0.18 | | |
Class R | | | 0.18 | | |
Class R4 | | | 0.18 | | |
Class R5 | | | 0.05 | | |
Class W | | | 0.17 | | |
Class Z | | | 0.18 | | |
An annual minimum account balance fee of $20 may apply to certain accounts with a value below the applicable share class's initial minimum investment requirements to reduce the impact of small accounts on transfer agency fees. These minimum account balance fees are remitted to the Fund and recorded as part of expense reductions in the Statement of Operations. For the year ended February 29, 2016, these minimum account balance fees reduced total expenses of the Fund by $1,016.
Distribution and Service Fees
The Fund has an agreement with Columbia Management Investment Distributors, Inc. (the Distributor), an affiliate of the Investment Manager and a wholly-owned subsidiary of Ameriprise Financial, for distribution and shareholder services. The Board has approved, and the Fund has adopted, distribution and shareholder service plans (the Plans) applicable to certain share classes, which set the distribution and service fees for the Fund. These fees are calculated daily and are intended to compensate the Distributor and/or eligible selling and/or servicing agents for selling shares of the Fund and providing services to investors.
Under the Plans, the Fund pays a monthly combined distribution and service fee to the Distributor at the maximum annual rate of 0.25% of the average daily net assets attributable to Class A shares of the Fund. Also under the Plans, the Fund pays a monthly service fee at the maximum annual rate of 0.25% of the average daily net assets attributable to Class B, Class C and Class W shares of the Fund and a monthly distribution fee at the maximum annual rate of 0.75%, 0.75%, 0.50% and 0.25% of the average daily net assets attributable to Class B, Class C, Class R and Class W shares of the Fund, respectively.
Although the Fund may pay a distribution fee up to 0.25% of the Fund's average daily net assets attributable to Class W shares and a service fee of up to 0.25% of the
Fund's average daily net assets attributable to Class W shares, the aggregate fee shall not exceed 0.25% of the Fund's average daily net assets attributable to Class W shares.
Sales Charges
Sales charges, including front-end charges and CDSCs, received by the Distributor for distributing Fund shares were $94,052 for Class A, $84 for Class B and $5,233 for Class C shares for the year ended February 29, 2016.
Expenses Waived/Reimbursed by the Investment Manager and its Affiliates
The Fund's expense ratio is subject to an expense reimbursement arrangement pursuant to which fees will be waived and/or expenses reimbursed (excluding certain fees and expenses described below), so that the Fund's net operating expenses, after giving effect to fees waived/expenses reimbursed and any balance credits and/or overdraft charges from the Fund's custodian, do not exceed the annual rates of:
| | | Contractual
Expense Cap
July 1, 2015
through
June 30, 2016 | | Voluntary
Expense Cap
Prior to
July 1, 2015 | |
Class A | | | 1.20 | % | | | 1.22 | % | |
Class B | | | 1.95 | | | | 1.97 | | |
Class C | | | 1.95 | | | | 1.97 | | |
Class I | | | 0.81 | | | | 0.83 | | |
Class R | | | 1.45 | | | | 1.47 | | |
Class R4 | | | 0.95 | | | | 0.97 | | |
Class R5 | | | 0.86 | | | | 0.88 | | |
Class W | | | 1.20 | | | | 1.22 | | |
Class Z | | | 0.95 | | | | 0.97 | | |
The contractual agreement may be modified or amended only with approval from the Investment Manager, certain of its affiliates and the Fund. Under the arrangements, the following fees and expenses are excluded from the waiver/reimbursement commitment, and therefore will be paid by the Fund, if applicable: taxes (including foreign transaction taxes), expenses associated with investments in affiliated and non-affiliated pooled investment vehicles (including mutual funds and exchange-traded funds), transaction costs and brokerage commissions, costs related to any securities lending program, dividend and interest expenses associated with securities sold short, inverse floater program fees and expenses, transaction charges and interest on borrowed money, interest and extraordinary expenses. Any fees waived and/or expenses reimbursed under the expense
Annual Report 2016
31
COLUMBIA LARGE CAP GROWTH FUND V
NOTES TO FINANCIAL STATEMENTS (continued)
February 29, 2016
reimbursement arrangements described above are not recoverable by the Investment Manager or its affiliates in future periods.
Note 4. Federal Tax Information
The timing and character of income and capital gain distributions are determined in accordance with income tax regulations, which may differ from GAAP because of temporary or permanent book to tax differences.
At February 29, 2016, these differences are primarily due to differing treatment for deferral/reversal of wash sale losses, Trustees' deferred compensation, foreign currency transactions, net operating loss reclassification and late-year ordinary losses. To the extent these differences are permanent, reclassifications are made among the components of the Fund's net assets in the Statement of Assets and Liabilities. Temporary differences do not require reclassifications. In the Statement of Assets and Liabilities the following reclassifications were made:
Excess of distributions over net investment income | | $ | 6,631,586 | | |
Accumulated net realized gain | | | 1,334 | | |
Paid-in capital | | | (6,632,920 | ) | |
Net investment income (loss) and net realized gains (losses), as disclosed in the Statement of Operations, and net assets were not affected by this reclassification.
The tax character of distributions paid during the years indicated was as follows:
Year Ended | | February 29,
2016 | | February 28,
2015 | |
Ordinary income | | $ | 9,338,807 | | | $ | 15,000,020 | | |
Long-term capital gains | | | 424,801,304 | | | | 203,144,377 | | |
Total | | $ | 434,140,111 | | | $ | 218,144,397 | | |
Short-term capital gain distributions, if any, are considered ordinary income distributions for tax purposes.
At February 29, 2016, the components of distributable earnings on a tax basis were as follows:
Undistributed long-term capital gains | | $ | 73,054,930 | | |
Net unrealized appreciation | | | 53,980,934 | | |
At February 29, 2016, the cost of investments for federal income tax purposes was $864,391,167 and the
aggregate gross unrealized appreciation and depreciation based on that cost was:
Unrealized appreciation | | $ | 98,883,585 | | |
Unrealized depreciation | | | (44,902,651 | ) | |
Net unrealized appreciation | | $ | 53,980,934 | | |
Under current tax rules, regulated investment companies can elect to treat certain late-year ordinary losses incurred and post-October capital losses (capital losses realized after October 31) as arising on the first day of the following taxable year. As of February 29, 2016, the Fund will elect to treat late-year ordinary losses of $237,252 as arising on March 1, 2016.
Management of the Fund has concluded that there are no significant uncertain tax positions in the Fund that would require recognition in the financial statements. However, management's conclusion may be subject to review and adjustment at a later date based on factors including, but not limited to, new tax laws, regulations, and administrative interpretations (including relevant court decisions). Generally, the Fund's federal tax returns for the prior three fiscal years remain subject to examination by the Internal Revenue Service.
Note 5. Portfolio Information
The cost of purchases and proceeds from sales of securities, excluding short-term investments and derivatives, if any, aggregated to $1,404,699,084 and $2,027,624,596, respectively, for the year ended February 29, 2016. The amount of purchase and sale activity impacts the portfolio turnover rate reported in the Financial Highlights.
Note 6. Affiliated Money Market Fund
The Fund invests in Columbia Short-Term Cash Fund, an affiliated money market fund established for the exclusive use by the Fund and other affiliated funds. The income earned by the Fund from such investments is included as Dividends — affiliated issuers in the Statement of Operations. As an investing fund, the Fund indirectly bears its proportionate share of the expenses of Columbia Short-Term Cash Fund.
Note 7. Line of Credit
The Fund has access to a revolving credit facility whereby the Fund may borrow for the temporary funding of shareholder redemptions or for other temporary or emergency purposes. Effective December 8, 2015, Citibank, N.A. and HSBC Bank USA, N.A. joined JPMorgan
Annual Report 2016
32
COLUMBIA LARGE CAP GROWTH FUND V
NOTES TO FINANCIAL STATEMENTS (continued)
February 29, 2016
Chase Bank, N.A. (JPMorgan) as lead of a syndicate of banks under the credit facility, which is a collective agreement between the Fund and certain other funds managed by the Investment Manager, severally and not jointly, that permits collective borrowings up to $1 billion. Interest is charged to each participating fund based on its borrowings at a rate equal to the higher of (i) the overnight federal funds rate plus 1.00% or (ii) the one-month LIBOR rate plus 1.00%. Each borrowing under the credit facility matures no later than 60 days after the date of borrowing. The Fund also pays a commitment fee equal to its pro rata share of the amount of the credit facility at a rate of 0.15% per annum. The commitment fee is included in other expenses in the Statement of Operations. Prior to December 8, 2015, JPMorgan was the sole lead bank under the credit facility agreement that permitted borrowings up to $550 million under the same terms and interest rates as described above with the exception of the commitment fee which was charged at a rate of 0.075% per annum.
For the year ended February 29, 2016, the average daily loan balance outstanding on days when borrowing existed was $6,237,500 at a weighted average interest rate of 1.20%. Interest expense incurred by the Fund is recorded as a line of credit interest expense in the Statement of Operations. The Fund had no outstanding borrowings at February 29, 2016.
Note 8. Significant Risks
Shareholder Concentration Risk
At February 29, 2016, three unaffiliated shareholders of record owned 52.5% of the outstanding shares of the Fund in one or more accounts. The Fund has no knowledge about whether any portion of those shares was owned beneficially. Subscription and redemption activity by concentrated accounts may have a significant effect on the operations of the Fund. In the case of a large redemption, the Fund may be forced to sell investments at inopportune times, including its liquid or more liquid positions, resulting in Fund losses and the Fund holding a higher percentage of less liquid or illiquid securities. Large redemptions could result in decreased economies of scale and increased operating expenses for non-redeeming Fund shareholders.
Consumer Discretionary Sector Risk
The Fund may be more susceptible to the particular risks that may affect companies in the consumer discretionary sector than if it were invested in a wider variety of companies in unrelated sectors. Companies in the
consumer discretionary sector are subject to certain risks, including fluctuations in the performance of the overall domestic and international economy, interest rate changes, increased competition and consumer confidence. Performance of such companies may be affected by factors including reduced disposable household income, reduced consumer spending, changing demographics and consumer tastes.
Technology and Technology-related Investment Risk
The Fund may be more susceptible to the particular risks that may affect companies in the information technology sector, as well as other technology-related sectors (collectively, the technology sectors) than if it were invested in a wider variety of companies in unrelated sectors. Companies in the technology sectors are subject to certain risks, including the risk that new services, equipment or technologies will not be accepted by consumers and businesses or will become rapidly obsolete. Performance of such companies may be affected by factors including obtaining and protecting patents (or the failure to do so) and significant competitive pressures, including aggressive pricing of their products or services, new market entrants, competition for market share and short product cycles due to an accelerated rate of technological developments. Such competitive pressures may lead to limited earnings and/or falling profit margins. As a result, the value of their securities may fall or fail to rise. In addition, many technology sector companies have limited operating histories and prices of these companies' securities historically have been more volatile than other securities, especially over the short term.
Note 9. Subsequent Events
Management has evaluated the events and transactions that have occurred through the date the financial statements were issued. Other than as noted below, there were no items requiring adjustment of the financial statements or additional disclosure.
In December 2015, the Board approved a proposal to merge the Fund into Columbia Large Cap Growth Fund. Shareholders of the Fund will vote on the proposed merger at a special meeting of shareholders to be held during the first half of 2016. If approved by shareholders, the merger is expected to take place shortly thereafter.
Annual Report 2016
33
COLUMBIA LARGE CAP GROWTH FUND V
NOTES TO FINANCIAL STATEMENTS (continued)
February 29, 2016
Note 10. Information Regarding Pending and Settled Legal Proceedings
In December 2005, without admitting or denying the allegations, American Express Financial Corporation (AEFC, which is now known as Ameriprise Financial, Inc. (Ameriprise Financial)) entered into settlement agreements with the Securities and Exchange Commission (SEC) and Minnesota Department of Commerce (MDOC) related to market timing activities. As a result, AEFC was censured and ordered to cease and desist from committing or causing any violations of certain provisions of the Investment Advisers Act of 1940, the Investment Company Act of 1940, and various Minnesota laws. AEFC agreed to pay disgorgement of $10 million and civil money penalties of $7 million. AEFC also agreed to retain an independent distribution consultant to assist in developing a plan for distribution of all disgorgement and civil penalties ordered by the SEC in accordance with various undertakings detailed at http://www.sec.gov/litigation/admin/ia-2451.pdf. Ameriprise Financial and its affiliates have cooperated with the SEC and the MDOC in these legal proceedings, and have made regular reports to the Funds' Boards of Trustees.
Ameriprise Financial and certain of its affiliates have historically been involved in a number of legal, arbitration and regulatory proceedings, including routine litigation, class actions, and governmental actions, concerning matters arising in connection with the conduct of their business activities. Ameriprise Financial believes that the Funds are not currently the subject of, and that neither Ameriprise Financial nor any of its affiliates are the subject of, any pending legal, arbitration or regulatory proceedings that are likely to have a material adverse effect on the Funds or the ability of Ameriprise Financial or its affiliates to perform under their contracts with the Funds. Ameriprise Financial is required to make quarterly (10-Q), annual (10-K) and, as necessary, 8-K filings with the SEC on legal and regulatory matters that relate to Ameriprise Financial and its affiliates. Copies of these filings may be obtained by accessing the SEC website at www.sec.gov.
There can be no assurance that these matters, or the adverse publicity associated with them, will not result in increased fund redemptions, reduced sale of fund shares or other adverse consequences to the Funds. Further, although we believe proceedings are not likely to have a material adverse effect on the Funds or the ability of Ameriprise Financial or its affiliates to perform under their contracts with the Funds, these proceedings are
subject to uncertainties and, as such, we are unable to estimate the possible loss or range of loss that may result. An adverse outcome in one or more of these proceedings could result in adverse judgments, settlements, fines, penalties or other relief that could have a material adverse effect on the consolidated financial condition or results of operations of Ameriprise Financial.
Annual Report 2016
34
COLUMBIA LARGE CAP GROWTH FUND V
REPORT OF INDEPENDENT REGISTERED PUBLIC ACCOUNTING FIRM
To the Trustees of Columbia Funds Series Trust and the Shareholders of
Columbia Large Cap Growth Fund V (formerly known as Columbia Marsico Growth Fund)
In our opinion, the accompanying statement of assets and liabilities, including the portfolio of investments, and the related statements of operations and of changes in net assets and the financial highlights present fairly, in all material respects, the financial position of Columbia Large Cap Growth Fund V (formerly known as Columbia Marsico Growth Fund) (the "Fund," a series of Columbia Funds Series Trust) at February 29, 2016, and the results of its operations, the changes in its net assets and the financial highlights for each of the periods indicated, in conformity with accounting principles generally accepted in the United States of America. These financial statements and financial highlights (hereafter referred to as "financial statements") are the responsibility of the Fund's management. Our responsibility is to express an opinion on these financial statements based on our audits. We conducted our audits of these financial statements in accordance with the standards of the Public Company Accounting Oversight Board (United States). Those standards require that we plan and perform the audit to obtain reasonable assurance about whether the financial statements are free of material misstatement. An audit includes examining, on a test basis, evidence supporting the amounts and disclosures in the financial statements, assessing the accounting principles used and significant estimates made by management, and evaluating the overall financial statement presentation. We believe that our audits, which included confirmation of securities at February 29, 2016 by correspondence with the custodian, brokers and transfer agent, provide a reasonable basis for our opinion.
PricewaterhouseCoopers LLP
Minneapolis, MN
April 21, 2016
Annual Report 2016
35
COLUMBIA LARGE CAP GROWTH FUND V
FEDERAL INCOME TAX INFORMATION
(Unaudited)
The Fund hereby designates the following tax attributes for the fiscal year ended February 29, 2016. Shareholders will be notified in early 2017 of the amounts for use in preparing 2016 income tax returns.
Tax Designations:
| Qualified Dividend Income | | | 79.37 | % | |
| Dividends Received Deduction | | | 72.33 | % | |
Capital Gain Dividend | | $ | 368,618,450 | | |
Qualified Dividend Income. For taxable, non-corporate shareholders, the percentage of ordinary income distributed during the fiscal year that represents qualified dividend income subject to reduced tax rates.
Dividends Received Deduction. The percentage of ordinary income distributed during the fiscal year that qualifies for the corporate dividends received deduction.
Capital Gain Dividend. The Fund designates as a capital gain dividend the amount reflected above, or if subsequently determined to be different, the net capital gain of such fiscal period.
Annual Report 2016
36
COLUMBIA LARGE CAP GROWTH FUND V
Shareholders elect the Board that oversees the Fund's operations. The Board appoints officers who are responsible for day-to-day business decisions based on policies set by the Board. The following table provides basic biographical information about the Fund's Trustees, including their principal occupations during the past five years, although specific titles for individuals may have varied over the period. Under current Board policy, members generally may serve through the end of the calendar year in which they reach either the mandatory retirement age established by the Board or the fifteenth anniversary of the first Board meeting they attended as a member of the Board.
Trustees
Independent Trustees
Name,
Address,
Year of Birth | | Position Held With
the Funds and Length of
Service | | Principal Occupation(s)
During the Past Five Years
and Other Relevant
Professional Experience | | Number of
Funds in the
Columbia
Funds Complex
Overseen | | Other Directorships
Held by Trustee
During the Past
Five Years | |
Kathleen Blatz
901 S. Marquette Ave.
Minneapolis, MN 55402
1954 | | Trustee since 1/06 for RiverSource Funds and since 6/11 for Nations Funds | | Attorney; specializing in arbitration and mediation; Chief Justice, Minnesota Supreme Court, 1998-2006; Associate Justice, Minnesota Supreme Court, 1996-1998; Fourth Judicial District Court Judge, Hennepin County, 1994-1996; Attorney in private practice and public service, 1984-1993; State Representative, Minnesota House of Representatives, 1979-1993, which included service on the Tax and Financial Institutions and Insurance Committees | | | 124 | | | Trustee, BlueCross BlueShield of Minnesota (Chair of the Business Development Committee) since 2009; Chair of the Robina Foundation since August 2013 | |
Edward J. Boudreau, Jr.
901 S. Marquette Ave.
Minneapolis, MN 55402
1944 | | Trustee since 6/11 for RiverSource Funds and since 1/05 for Nations Funds | | Managing Director, E.J. Boudreau & Associates (consulting) since 2000; FINRA Industry Arbitrator, 2002-present; Chairman and Chief Executive Officer, John Hancock Funds (asset management), Chairman and Interested Trustee for open-end and closed-end funds offered by John Hancock, 1989-2000; John Hancock Life Insurance Company, including SVP and Treasurer and SVP Information Technology, 1968-1988 | | | 122 | | | Former Trustee, Boston Museum of Science (Chair of Finance Committee), 1985-2013; former Trustee, BofA Funds Series Trust (11 funds), 2005-2011 | |
Pamela G. Carlton
901 S. Marquette Ave.
Minneapolis, MN 55402
1954 | | Trustee since 7/07 for RiverSource Funds and since 6/11 for Nations Funds | | President, Springboard-Partners in Cross Cultural Leadership (consulting company) since 2003; Managing Director of US Equity Research, JP Morgan Chase, 1999-2003; Director of US Equity Research, Chase Asset Management, 1996-1999; Co-Director Latin America Research, 1993-1996, COO Global Research, 1992-1996, Co-Director of US Research, 1991-1992, Investment Banker, Morgan Stanley, 1982-1991 | | | 124 | | | Trustee, New York Presbyterian Hospital Board (Executive Committee and Chair of Human Resources Committee) since 1996 | |
Annual Report 2016
37
COLUMBIA LARGE CAP GROWTH FUND V
TRUSTEES AND OFFICERS (continued)
Independent Trustees (continued)
Name,
Address,
Year of Birth | | Position Held With
the Funds and Length of
Service | | Principal Occupation(s)
During the Past Five Years
and Other Relevant
Professional Experience | | Number of
Funds in the
Columbia
Funds Complex
Overseen | | Other Directorships
Held by Trustee
During the Past
Five Years | |
William P. Carmichael
901 S. Marquette Ave.
Minneapolis, MN 55402
1943 | | Trustee since 6/11 for RiverSource Funds and since 2003 for Nations Funds; Chair of the Board from 1/14-11/15 | | Retired; Co-founder, The Succession Fund (provides exit strategies to owners of privately held companies), 1998-2007; Adjunct Professor of Finance, Kelley School of Business, Indiana University, 1993-2007; Senior Vice President, Sara Lee Corporation, 1991-1993; Senior Vice President and Chief Financial Officer, Beatrice Foods Company, 1984-1990; Vice President, Esmark, Inc., 1973-1984; Associate, Price Waterhouse, 1968-1972 | | | 124 | | | Director, The Finish Line (athletic shoes and apparel) since July 2003; Director, International Textile Corp. since 2012; Director, hhgregg since May, 2015; former Director, Cobra Electronics Corporation (electronic equipment manufacturer), 1994-August 2014; former Director, Spectrum Brands, Inc. (consumer products), 2002-2009; former Director, Simmons Company (bedding), 2004-2010; former Trustee, BofA Funds Series Trust (11 funds), 2009-2011; former Director, McMoRan Exploration Company (oil and gas exploration and development), 2010-2013 | |
Patricia M. Flynn
901 S. Marquette Ave.
Minneapolis, MN 55402
1950 | | Trustee since 11/04 for RiverSource Funds and since 6/11 for Nations Funds | | Trustee Professor of Economics and Management, Bentley University since 1976 (also teaches and conducts research on corporate governance); Dean, McCallum Graduate School of Business, Bentley University, 1992-2002 | | | 124 | | | Trustee, MA Taxpayers Foundation since 1997; Board of Governors, Innovation Institute, MA Technology Collaborative since 2010 | |
William A. Hawkins
901 S. Marquette Ave.
Minneapolis, MN 55402
1942 | | Chair of the Board since 11/15; Trustee since 6/11 for RiverSource Funds and since 1/05 for Nations Funds | | Managing Director, Overton Partners (financial consulting) since August 2010; President and Chief Executive Officer, California General Bank, N.A., January 2008-August 2010; Operation Hope, COO, 2004-2007; IndyMac Bancorp, President, CBG, 1999-2003; American General Bank, President, 1997-1999; Griffin Financial Services, CEO, 1981-1997; The Griffin Funds, CEO, 1992-1998 | | | 124 | | | Former Trustee, BofA Funds Series Trust (11 funds), 2009-2015 | |
R. Glenn Hilliard
901 S. Marquette Ave.
Minneapolis, MN 55402
1943 | | Trustee since 6/11 for RiverSource Funds and since 1/05 for Nations Funds | | Chairman and Chief Executive Officer, Hilliard Group LLC (investing and consulting) since April 2003; Non-Executive Director & Chairman, CNO Financial Group, Inc. (insurance), 2003-2011; Chair & CEO, ING Americas, 1996-2003 | | | 122 | | | Chairman, BofA Funds Series Trust (11 funds); former Director, CNO Financial Group, Inc. (insurance), 2003-2011 | |
Annual Report 2016
38
COLUMBIA LARGE CAP GROWTH FUND V
TRUSTEES AND OFFICERS (continued)
Independent Trustees (continued)
Name,
Address,
Year of Birth | | Position Held With
the Funds and Length of
Service | | Principal Occupation(s)
During the Past Five Years
and Other Relevant
Professional Experience | | Number of
Funds in the
Columbia
Funds Complex
Overseen | | Other Directorships
Held by Trustee
During the Past
Five Years | |
Catherine James Paglia
901 S. Marquette Ave.
Minneapolis, MN 55402
1952 | | Trustee since 11/04 for RiverSource Funds and since 6/11 for Nations Funds | | Director, Enterprise Asset Management, Inc. (private real estate and asset management company) since September 1998; Managing Director and Partner, Interlaken Capital, Inc., 1989-1997; Managing Director, Morgan Stanley, 1982-1989; Vice President, Investment Banking, 1980-1982, Associate, Investment Banking, 1976-1980, Dean Witter Reynolds, Inc. | | | 124 | | | Director, Valmont Industries, Inc. (irrigation systems manufacturer) since 2012; Trustee, Carleton College (on the Investment Committee); Trustee, Carnegie Endowment for International Peace (on the Investment Committee) | |
Leroy C. Richie
901 S. Marquette Ave.
Minneapolis, MN 55402
1941 | | Trustee since 2000 for Seligman Funds, since 11/08 for RiverSource Funds and since 6/11 for Nations Funds | | Counsel, Lewis & Munday, P.C. (law firm) since 2004; Vice President and General Counsel, Automotive Legal Affairs, Chrysler Corporation, 1993-1997 | | | 122 | | | Lead Outside Director, Infinity Resources, Inc. (oil and gas exploration and production) since 1994; Lead Outside Director, Digital Ally, Inc. (digital imaging) since September 2005; Trustee, Marygrove College (Chair of Finance Committee) since 2007; former Director, OGE Energy Corp. (energy and energy services), 2007-2014 | |
Minor M. Shaw
901 S. Marquette Ave.
Minneapolis, MN 55402
1947 | | Trustee since 6/11 for RiverSource Funds and since 2003 for Nations Funds | | President, Micco LLC (private investments) since 2011; President, Micco Corp. (family investment business), 1998-2011 | | | 124 | | | Director, Piedmont Natural Gas; Director, BlueCross BlueShield of South Carolina since April 2008; Chair of the Duke Endowment; Director, National Association of Corporate Directors, Carolinas Chapter since 2013; Chair of Greenville — Spartanburg Airport Commission; former Trustee, BofA Funds Series Trust (11 funds), 2003-2011 | |
Alison Taunton-Rigby
901 S. Marquette Ave.
Minneapolis, MN 55402
1944 | | Trustee since 11/02 for RiverSource Funds and since 6/11 for Nations Funds | | Managing Director, Forester Biotech (consulting), 2001-2003; Chief Executive Officer and Director, RiboNovix, Inc., (biotechnology), 2003-2010; President and Chief Executive Officer of CMT Inc., 2001-2003; Aquila Biopharmaceuticals Inc., 1996-2000; Cambridge Biotech Corporation, 1995-1996; Mitotix Inc., 1993-1994 | | | 124 | | | Director, Abt Associates (government contractor) since 2001; Director, Boston Children's Hospital since 2002; Director, Healthways, Inc. (health and well-being solutions) since 2005; Director, ICI Mutual Insurance Company since 2011 | |
Annual Report 2016
39
COLUMBIA LARGE CAP GROWTH FUND V
TRUSTEES AND OFFICERS (continued)
Interested Trustee Not Affiliated with Investment Manager*
Name,
Address,
Year of Birth | | Position Held With
Funds and Length of
Service | | Principal Occupation(s)
During Past Five Years
and Other Relevant
Professional Experience | | Number of
Funds in the
Fund Family
Overseen by
Board Member | | Other Present or Past
Directorships/
Trusteeships
(Within Past 5 Years) | |
Anthony M. Santomero
901 S. Marquette Ave.
Minneapolis, MN 55402
1946 | | Trustee since 6/11 for RiverSource Funds and since 1/08 for Nations Funds | | Richard K. Mellon Professor Emeritus of Finance, The Wharton School, University of Pennsylvania since 2002; Senior Advisor, McKinsey & Company (consulting), 2006-2008; President, Federal Reserve Bank of Philadelphia, 2000-2006; Professor of Finance, The Wharton School, University of Pennsylvania, 1972-2002 | | | 122 | | | Trustee, Penn Mutual Life Insurance Company since March 2008; Director, Renaissance Reinsurance Ltd. since May 2008; Director, Citigroup Inc. since 2009; Director, Citibank, N.A. since 2009; former Trustee, BofA Funds Series Trust (11 funds), 2008-2011 | |
* Dr. Santomero is not an affiliated person of the Investment Manager or Ameriprise Financial. However, he is currently deemed by the Funds to be an "interested person" (as defined in the 1940 Act) of the Funds because he serves as a Director of Citigroup Inc. and Citibank, N.A., companies that may directly or through subsidiaries and affiliates engage from time-to-time in brokerage execution, principal transactions and lending relationships with the Funds or accounts advised/managed by the Investment Manager.
Annual Report 2016
40
COLUMBIA LARGE CAP GROWTH FUND V
TRUSTEES AND OFFICERS (continued)
Interested Trustee Affiliated with Investment Manager*
Name,
Address,
Year of Birth | | Position Held With
the Funds and Length of
Service | | Principal Occupation(s)
During Past Five Years
and Other Relevant
Professional Experience | | Number of
Funds in the
Columbia
Funds Complex
Overseen | | Other Directorships
Held by Trustee
During the Past
Five Years | |
William F. Truscott
c/o Columbia Management Investment Advisers, LLC,
225 Franklin St.
Boston, MA 02110
1960 | | Trustee since 11/01 for RiverSource Funds and since 6/11 for Nations Funds; Senior Vice President since 2002 for RiverSource Funds and since 5/10 for Nations Funds | | Chairman of the Board and President, Columbia Management Investment Advisers, LLC since May 2010 and February 2012, respectively (previously President and Chief Investment Officer, 2001-April 2010); Chief Executive Officer, Global Asset Management, Ameriprise Financial, Inc. since September 2012 (previously Chief Executive Officer, U.S. Asset Management & President, Annuities, May 2010-September 2012 and President — U.S. Asset Management and Chief Investment Officer, 2005-April 2010); Director and Chief Executive Officer, Columbia Management Investment Distributors, Inc. since May 2010 and February 2012, respectively (previously Chairman of the Board and Chief Executive Officer, 2006-April 2010); Chairman of the Board and Chief Executive Officer, RiverSource Distributors, Inc. since 2006; Director, Threadneedle Asset Management Holdings, SARL since 2014; President and Chief Executive Officer, Ameriprise Certificate Company, 2006-August 2012. | | | 182 | | | Chairman of the Board, Columbia Management Investment Advisers, LLC since May 2010; Director, Columbia Management Investment Distributors, Inc. since May 2010; Former Director, Ameriprise Certificate Company, 2006-January 2013 | |
* Interested person (as defined under the 1940 Act) by reason of being an officer, director, security holder and/or employee of the Investment Manager or Ameriprise Financial.
The Statement of Additional Information has additional information about the Fund's Board members and is available, without charge, upon request by calling 800.345.6611; contacting your financial intermediary; or visiting columbiathreadneedle.com/us.
Annual Report 2016
41
COLUMBIA LARGE CAP GROWTH FUND V
TRUSTEES AND OFFICERS (continued)
The Board has appointed officers who are responsible for day-to-day business decisions based on policies it has established. The officers serve at the pleasure of the Board. The following table provides basic information about the Officers of the Fund, including principal occupations during the past five years, although their specific titles may have varied over the period. In addition to Mr. Truscott, who is Senior Vice President, the Fund's other officers are:
Fund Officers
Name,
Address and
Year of Birth | | Position and Year
First Appointed to
Position for any Fund
in the Columbia
Funds Complex or a
Predecessor Thereof | | Principal Occupation(s) During Past Five Years | |
Christopher O. Petersen
5228 Ameriprise
Financial Center
Minneapolis, MN 55474
Born 1970 | | President and Principal Executive Officer (2015) | | Vice President and Lead Chief Counsel, Ameriprise Financial, Inc. since January 2015 (previously, Vice President and Chief Counsel January 2010-December 2014; and Vice President and Group Counsel or Counsel 2004-January 2010); officer of Columbia Funds and affiliated funds since 2007. | |
Michael G. Clarke
225 Franklin Street
Boston, MA 02110
Born 1969 | | Treasurer (2011), Chief Financial Officer (2009) and Chief Accounting Officer (2015) | | Vice President — Mutual Fund Administration, Columbia Management Investment Advisers, LLC, since May 2010; Managing Director of Fund Administration, Columbia Management Advisors, LLC, September 2004-April 2010; senior officer of Columbia Funds and affiliated funds since 2002. | |
Paul B. Goucher
100 Park Avenue
New York, NY 10017
Born 1968 | | Senior Vice President (2011), Chief Legal Officer (2015) and Assistant Secretary (2008) | | Vice President and Lead Chief Counsel, Ameriprise Financial, Inc. since November 2008 and January 2013, respectively (previously Chief Counsel, January 2010-January 2013 and Group Counsel, November 2008-January 2010). | |
Thomas P. McGuire
225 Franklin Street
Boston, MA 02110
Born 1972 | | Senior Vice President and Chief Compliance Officer (2012) | | Vice President — Asset Management Compliance, Ameriprise Financial, Inc., since May 2010; Chief Compliance Officer, Ameriprise Certificate Company since September 2010; Compliance Executive, Bank of America, 2005-April 2010. | |
Colin Moore
225 Franklin Street
Boston, MA 02110
Born 1958 | | Senior Vice President (2010) | | Executive Vice President and Global Chief Investment Officer, Ameriprise Financial, Inc., since July 2013; Director and Global Chief Investment Officer, Columbia Management Investment Advisers, LLC since May 2010; Manager, Managing Director and Chief Investment Officer, Columbia Management Advisors, LLC, 2007-April 2010. | |
Michael E. DeFao
225 Franklin Street
Boston, MA 02110
Born 1968 | | Vice President (2011) and Assistant Secretary (2010) | | Vice President and Chief Counsel, Ameriprise Financial, Inc. since May 2010; Associate General Counsel, Bank of America, 2005-April 2010. | |
Amy Johnson
5228 Ameriprise
Financial Center
Minneapolis, MN 55474
Born 1965 | | Vice President (2006) | | Managing Director and Chief Operating Officer, Columbia Management Investment Advisers, LLC since May 2010 (previously Chief Administrative Officer, 2009-April 2010, and Vice President — Asset Management and Trust Company Services, 2006-2009). | |
Lyn Kephart-Strong
5228 Ameriprise
Financial Center
Minneapolis, MN 55474
Born 1960 | | Vice President (2015) | | President, Columbia Management Investment Services Corp. since October 2014; Vice President & Resolution Officer, Ameriprise Trust Company since August 2009; President, RiverSource Service Corporation 2004-2010. | |
Ryan C. Larrenaga
225 Franklin Street
Boston, MA 02110
Born 1970 | | Vice President and Secretary (2015) | | Vice President and Group Counsel, Ameriprise Financial, Inc. since August 2011 (previously, Counsel from May 2010 to August 2011); Assistant General Counsel, Bank of America, 2005-April 2010; officer of Columbia Funds and affiliated funds since 2005. | |
Annual Report 2016
42
COLUMBIA LARGE CAP GROWTH FUND V
IMPORTANT INFORMATION ABOUT THIS REPORT
Each fund mails one shareholder report to each shareholder address. If you would like more than one report, please call shareholder services at 800.345.6611 and additional reports will be sent to you.
The policy of the Board is to vote the proxies of the companies in which each fund holds investments consistent with the procedures as stated in the Statement of Additional Information (SAI). You may obtain a copy of the SAI without charge by calling 800.345.6611; contacting your financial intermediary; visiting columbiathreadneedle.com/us; or searching the website of the Securities and Exchange Commission (SEC) at sec.gov. Information regarding how each fund voted proxies relating to portfolio securities is filed with the SEC by August 31st for the most recent 12-month period ending June 30th of that year, and is available without charge by visiting columbiathreadneedle.com/us, or searching the website of the SEC at sec.gov.
Each fund files a complete schedule of portfolio holdings with the SEC for the first and third quarters of each fiscal year on Form N-Q. Each fund's Form N-Q is available on the SEC's website at sec.gov and may be reviewed and copied at the SEC's Public Reference Room in Washington, D.C. Information on the operation of the Public Reference Room may be obtained by calling 800.SEC.0330. Each fund's complete schedule of portfolio holdings, as filed on Form N-Q, can also be obtained without charge, upon request, by calling 800.345.6611.
Annual Report 2016
43
Columbia Large Cap Growth Fund V
P.O. Box 8081
Boston, MA 02266-8081

This information is for use with concurrent or prior delivery of a fund prospectus. Please read and consider the investment objectives, risks, charges and expenses for any fund carefully before investing. For a prospectus and summary prospectus, which contains this and other important information about the Fund, go to columbiathreadneedle.com/us. The Fund is distributed by Columbia Management Investment Distributors, Inc., member FINRA, and managed by Columbia Management Investment Advisers, LLC.
Columbia Threadneedle Investments (Columbia Threadneedle) is the global brand name of the Columbia and Threadneedle group of companies.
All rights reserved. Columbia Management Investment Distributors, Inc., 225 Franklin Street, Boston, MA 02110-2804
© 2016 Columbia Management Investment Advisers, LLC.
columbiathreadneedle.com/us
ANN188_02_F01_(04/16)

ANNUAL REPORT
February 29, 2016

COLUMBIA SELECT GLOBAL GROWTH FUND

ABOUT COLUMBIA THREADNEEDLE INVESTMENTS
Columbia Threadneedle Investments is a leading global asset management group that provides a broad range of actively managed investment strategies and solutions for individual, institutional and corporate clients around the world.
With more than 2,000 people, including over 450 investment professionals based in North America, Europe and Asia, we manage $472 billion* of assets across developed and emerging market equities, fixed income, asset allocation solutions and alternatives. We are the 13th largest manager of long-term mutual fund assets in the U.S.** and the 4th largest manager of retail funds in the U.K.***
Our priority is the investment success of our clients. We aim to deliver the investment outcomes they expect through an investment approach that is team-based, performance-driven and risk-aware. Our culture is dynamic and interactive. By sharing our insights across asset classes and geographies, we generate richer perspectives on global, regional and local investment landscapes. The ability to exchange and debate investment ideas in a collaborative environment enriches our teams' investment processes. More importantly, it results in better informed investment decisions for our clients.
Columbia funds are distributed by Columbia Management Investment Distributors, Inc., member FINRA, and managed by Columbia Management Investment Advisers, LLC.
Columbia Threadneedle Investments (Columbia Threadneedle) is the global brand name of the Columbia and Threadneedle group of companies.
* In U.S. dollars as of December 31, 2015. Source: Ameriprise Q4 Earnings Release. Includes all assets managed by entities in the Columbia and Threadneedle groups of companies. Contact us for more current data.
** Source: ICI as of December 31, 2015 for Columbia Management Investment Advisers, LLC.
*** Source: Investment Association as of September 2015 for Threadneedle Asset Management Limited.
© 2016 Columbia Management Investment Advisers, LLC. All rights reserved.
Not part of the shareholder report
Investment strategies to help meet investor needs
We are committed to helping investors navigate financial challenges to reach their desired outcomes. The possibilities are endless.
Your success is our priority.
Retire comfortably
Fund college or higher education
Leave a legacy
Generate an appropriate stream of income in retirement
Traditional approaches to income may no longer be adequate — and they may no longer provide the diversification benefits they once did. Investors need to rethink how they generate retirement income.
Worried about running out of income? You are not alone.
Navigate a changing interest rate environment
Even in today's challenging interest rate environment, it's still possible to navigate markets and achieve your goals.
Make investment choices designed specifically for this market environment.
Maximize after-tax returns
In an environment where what you keep is more important than what you earn, municipal bonds can help mitigate higher taxes while providing attractive yields compared to other investment options.
You've worked too hard building your wealth to lose it to taxes.
Grow assets to achieve financial goals
Finding growth opportunities in today's complex market environment requires strong research capabilities, creative thinking and a disciplined approach.
Do your investments deliver the portfolio growth you need?
Ease the impact of volatile markets
With increasing concerns about market volatility, investors should consider diversifying their portfolios with non-traditional holdings.
Interested in turning volatility into opportunity?
To find out more, contact your financial professional, call 800.426.3750 or visit columbiathreadneedle.com/us
Not part of the shareholder report
 Dear Shareholder,
Today's investors are typically focused on outcomes, like living a certain retirement lifestyle, paying for college education or building a legacy. But in today's complex global investment landscape, even simple goals are not easily achieved.
At Columbia Threadneedle Investments, we aspire to help satisfy five core needs of today's investors:
n Generate an appropriate stream of income in retirement
Traditional approaches to generating income may not provide the diversification benefits they once did, and they may actually introduce unwanted risk in today's market. To seek to improve your potential to live comfortably long term, we endeavor to pursue investments that explore less traveled paths to income.
n Navigate a changing interest rate environment
Today's uncertain market environment includes the prospect of a rise in interest rates. Blending traditional investments with non-traditional or alternative products may help protect your wealth during periods of volatility. We can attempt to help strengthen your portfolio with agile products designed to take on the market's ups and downs.
n Maximize after-tax returns
In an environment where what you keep may be more important than what you earn, municipal bonds can help mitigate high tax burdens while providing potentially attractive yields. Our state and federal tax-exempt products are aimed at helping investors manage risk, minimize the fluctuation of capital and grow wealth on a more tax-efficient basis.
n Grow assets to achieve financial goals
We believe that finding and protecting growth comes from a disciplined security selection process designed to create excess return. Our goal is to provide investment solutions built to help you face today's market challenges and grow your assets at each crossroad of your journey.
n Ease the impact of volatile markets
Despite a bull market run that has benefited many investors over the past several years, it's important to remember the lessons of 2008 and the value that a well-diversified portfolio may provide through times of market volatility. We are here to help you hold onto the savings you have worked tirelessly to amass, and to provide you the best opportunity to maintain your standard of living regardless of market conditions.
Find out today how we can help you confidently invest to realize your dreams. Please visit us at blog.columbiathreadneedleus.com/our-best-ideas to learn more about our unique investment solutions.
The world is constantly changing, but our priority remains the same: to help you secure your finances, meet your goals and achieve success. Thank you for your continued investment with us.
Sincerely,

Christopher O. Petersen
President, Columbia Funds
Investors should consider the investment objectives, risks, charges and expenses of a mutual fund carefully before investing. For a free prospectus and summary prospectus, which contains this and other important information about a fund, visit columbiathreadneedle.com/us. The prospectus should be read carefully before investing.
Columbia Funds are distributed by Columbia Management Investment Distributors, Inc., member FINRA, and managed by Columbia Management Investment Advisers, LLC.
© 2016 Columbia Management Investment Advisers, LLC. All rights reserved.
COLUMBIA SELECT GLOBAL GROWTH FUND
Performance Overview | | | 2 | | |
Manager Discussion of Fund Performance | | | 4 | | |
Understanding Your Fund's Expenses | | | 7 | | |
Portfolio of Investments | | | 8 | | |
Statement of Assets and Liabilities | | | 14 | | |
Statement of Operations | | | 16 | | |
Statement of Changes in Net Assets | | | 17 | | |
Financial Highlights | | | 19 | | |
Notes to Financial Statements | | | 25 | | |
Report of Independent Registered Public Accounting Firm | | | 35 | | |
Federal Income Tax Information | | | 36 | | |
Trustees and Officers | | | 37 | | |
Important Information About This Report | | | 43 | | |
Fund Investment Manager
Columbia Management Investment
Advisers, LLC
225 Franklin Street
Boston, MA 02110
Fund Distributor
Columbia Management Investment
Distributors, Inc.
225 Franklin Street
Boston, MA 02110
Fund Transfer Agent
Columbia Management Investment
Services Corp.
P.O. Box 8081
Boston, MA 02266-8081
For more information about any of the funds, please visit columbiathreadneedle.com/us or call 800.345.6611. Customer Service Representatives are available to answer your questions Monday through Friday from 8 a.m. to 7 p.m. Eastern time.
The views expressed in this report reflect the current views of the respective parties. These views are not guarantees of future performance and involve certain risks, uncertainties and assumptions that are difficult to predict, so actual outcomes and results may differ significantly from the views expressed. These views are subject to change at any time based upon economic, market or other conditions and the respective parties disclaim any responsibility to update such views. These views may not be relied on as investment advice and, because investment decisions for a Columbia fund are based on numerous factors, may not be relied on as an indication of trading intent on behalf of any particular Columbia fund. References to specific securities should not be construed as a recommendation or investment advice.
COLUMBIA SELECT GLOBAL GROWTH FUND
Performance Summary
n Columbia Select Global Growth Fund (the Fund) returned -16.49% excluding sales charges for the 12-month period that ended February 29, 2016.
n During the same time period, the Fund underperformed both the MSCI ACWI (Net), which returned -12.32%, and the MSCI ACWI Growth Net (USD), which returned -10.38%.
n Stock selection generally detracted from performance, particularly in the health care and information technology sectors.
Average Annual Total Returns (%) (for period ended February 29, 2016)
| | | Inception | | 1 Year | | 5 Years | | Life | |
Class A | | 04/30/08 | | | | | | | |
Excluding sales charges | | | | | -16.49 | | | | 5.42 | | | | 3.77 | | |
Including sales charges | | | | | -21.30 | | | | 4.18 | | | | 2.99 | | |
Class C | | 04/30/08 | | | | | | | |
Excluding sales charges | | | | | -17.06 | | | | 4.66 | | | | 3.01 | | |
Including sales charges | | | | | -17.87 | | | | 4.66 | | | | 3.01 | | |
Class R | | 04/30/08 | | | -16.70 | | | | 5.15 | | | | 3.51 | | |
Class R4* | | 01/08/14 | | | -16.28 | | | | 5.53 | | | | 3.84 | | |
Class R5* | | 01/08/14 | | | -16.20 | | | | 5.57 | | | | 3.86 | | |
Class Z | | 04/30/08 | | | -16.29 | | | | 5.68 | | | | 4.03 | | |
MSCI ACWI (Net) | | | | | -12.32 | | | | 3.71 | | | | 1.78 | | |
MSCI ACWI Growth Net (USD) | | | | | -10.38 | | | | 5.17 | | | | 2.87 | | |
Returns for Class A are shown with and without the maximum initial sales charge of 5.75%. Returns for Class C are shown with and without the 1.00% contingent deferred sales charges for the first year only. The Fund's other classes are not subject to sales charges and have limited eligibility. Please see the Fund's prospectus for details. Performance for different share classes will vary based on differences in sales charges and fees associated with each class. All results shown assume reinvestment of distributions during the period. Returns do not reflect the deduction of taxes that a shareholder may pay on Fund distributions or on the redemption of Fund shares. Performance results reflect the effect of any fee waivers or reimbursements of Fund expenses by Columbia Management Investment Advisers, LLC and/or any of its affiliates. Absent these fee waivers or expense reimbursement arrangements, performance results would have been lower.
The performance information shown represents past performance and is not a guarantee of future results. The investment return and principal value of your investment will fluctuate so that your shares, when redeemed, may be worth more or less than their original cost. Current performance may be lower or higher than the performance information shown. You may obtain performance information current to the most recent month-end by contacting your financial intermediary, visiting columbiathreadneedle.com/us or calling 800.345.6611.
*The returns shown for periods prior to the share class inception date (including returns for the Life of the Fund, if shown, which are since Fund inception) include the returns of the Fund's oldest share class. Since the Fund launched more than one class of shares at its inception, Class A shares were used. These returns are adjusted to reflect any higher class-related operating expenses of the newer share classes, as applicable. Please visit columbiathreadneedle.com/us/investment-products/mutual-funds/appended-performance for more information.
The MSCI ACWI (Net) is a free float-adjusted market capitalization weighted index that is designed to measure the equity market performance of developed and emerging markets. The index consists of 46 country indices comprising 23 developed and 23 emerging market country indices.
The MSCI ACWI Growth Net (USD) captures large and mid-cap securities exhibiting overall growth style characteristics across 23 developed markets countries and 23 emerging markets countries. The growth investment style characteristics for index construction are defined using five variables: long-term forward EPS growth rate, short-term forward EPS growth rate, current internal growth rate and long-term historical EPS growth trend and long-term historical sales per share growth trend.
Indices are not available for investment, are not professionally managed and do not reflect sales charges, fees, brokerage commissions, taxes (except the MSCI ACWI (Net) and the MSCI ACWI Growth Net (USD), which reflects reinvested dividends net of withholding taxes) or other expenses of investing. Securities in the Fund may not match those in an index.
Annual Report 2016
2
COLUMBIA SELECT GLOBAL GROWTH FUND
PERFORMANCE OVERVIEW (continued)
Performance of a Hypothetical $10,000 Investment (April 30, 2008 – February 29, 2016)

The chart above shows the change in value of a hypothetical $10,000 investment in Class A shares of Columbia Select Global Growth Fund during the stated time period, and does not reflect the deduction of taxes that a shareholder may pay on Fund distributions or on the redemption of Fund shares.
Annual Report 2016
3
COLUMBIA SELECT GLOBAL GROWTH FUND
MANAGER DISCUSSION OF FUND PERFORMANCE
Portfolio Management
Thomas Galvin, CFA
Richard Carter
Todd Herget
Effective November 20, 2015, Marsico Capital Management, LLC no longer serves as the subadviser to the Fund and Columbia Management Investment Advisers, LLC assumed the day-to-day management of the Fund's portfolio.
Morningstar Style BoxTM

The Morningstar Style BoxTM is based on a fund's portfolio holdings. For equity funds, the vertical axis shows the market capitalization of the stocks owned, and the horizontal axis shows investment style (value, blend, or growth). Information shown is based on the most recent data provided by Morningstar.
© 2016 Morningstar, Inc. All rights reserved. The Morningstar information contained herein: (1) is proprietary to Morningstar and/or its content providers; (2) may not be copied or distributed; and (3) is not warranted to be accurate, complete or timely. Neither Morningstar nor its content providers are responsible for any damages or losses arising from any use of this information.
For the 12-month period that ended February 29, 2016, the Fund's Class A shares returned -16.49% excluding sales charges. In a difficult period for equity markets worldwide, the Fund underperformed both the MSCI ACWI (Net), which returned -12.32%, and the MSCI ACWI Growth Net (USD), which returned -10.38%. Stock selection in the health care and information technology sectors hampered results relative to the MSCI ACWI (Net).
Market Concerns Weighed on Global Stock Markets
Equity markets in developed countries began the 12-month period with modestly positive performance against a favorable backdrop of improving growth across Europe and Japan. Oil's dramatic price decline, which began in the second half of 2014, provided a boost to importing countries and weaker currencies helped the export segment of the market. These tailwinds were more than sufficient to overcome concerns about Greek solvency, civil war in the Ukraine and unrest in the Middle East. However, the center of concern during much of the reporting period was China, whose economy has been slowing for some time. An unexpected devaluation of China's currency and a sharp downturn in Chinese equity market performance stoked fears of a prolonged slowdown in the Chinese economy. The anticipation of higher interest rates in the United States also drove investor anxiety. Foreign stock markets began to sell off during the summer of 2015. Despite a brief rally in the fourth quarter of 2015, most markets finished the period down sharply. The U.S. equity market held up somewhat better. However, U.S. stocks fell in the final three months of the period, as the weight of global concerns dampened U.S. market sentiment despite a reasonably steady economy.
Contributors and Detractors
Despite overall weakness in the equity markets, stock selection in the consumer discretionary sector made a positive contribution to the Fund's results. Positions in Domino's Pizza and online travel booking site Priceline.com outperformed relative to the benchmark. Exceptional growth in the United Kingdom and in Germany drove Domino's Pizza to a double-digit gain for the period. Priceline shares closed the year on a strong note after the company announced acceleration in gross bookings and notable strength in hotel and international bookings.
The Fund experienced mixed results in the information technology sector for the year, and the sector ultimately detracted from relative returns. Health care, most notably in the pharmaceuticals and biotechnology industries, produced the Fund's biggest losses for the period. Pacira Pharmaceuticals, a manufacturer of non-opioid post-surgical pain anesthetics, declined sharply on an uncertain approval outlook for its drug Exparel and a Department of Justice subpoena regarding Pacira's marketing practices. The stock was sold.
Portfolio Management Change
On November 20, 2015, the Fund's name was changed and Columbia Management Investment Advisers, LLC (CMIA) assumed management of the Fund from Marsico Capital Management.
Annual Report 2016
4
COLUMBIA SELECT GLOBAL GROWTH FUND
MANAGER DISCUSSION OF FUND PERFORMANCE (continued)
In a period of exceptional volatility, we transitioned the portfolio's holdings to bring it in line with CMIA's global growth strategy. At period's end, the portfolio was focused on what we believe are high quality global growth companies with strong levels of projected earnings growth. Through a stock selection process that is driven by bottom-up, fundamental analysis, the Fund was overweight relative to the benchmark in the information technology, health care and consumer discretionary sectors.
At Period's End
Risk averse market sentiment placed daily, downward pressure on growth-oriented stocks at the beginning of 2016. While these periods are challenging for growth investors, they are not unprecedented. However, history has demonstrated the wisdom of keeping a long-term perspective. We believe that a volatile market can create compelling opportunities. Against that backdrop, we will continue to focus on bottom-up stock selection in managing the portfolio.
Top Ten Holdings (%)
(at February 29, 2016) | |
Novo Nordisk A/S, Class B
(Denmark) | | | 3.9 | | |
Tencent Holdings Ltd. (China) | | | 3.4 | | |
Alibaba Group Holding Ltd.,
ADR (China) | | | 3.4 | | |
Intercontinental Exchange, Inc.
(United States) | | | 3.1 | | |
MercadoLibre, Inc. (Argentina) | | | 2.8 | | |
Ain Holdings, Inc. (Japan) | | | 2.8 | | |
Domino's Pizza Enterprises
Ltd. (Australia) | | | 2.7 | | |
Mobileye NV (Netherlands) | | | 2.7 | | |
CVS Health Corp.
(United States) | | | 2.7 | | |
Adobe Systems, Inc.
(United States) | | | 2.5 | | |
Percentages indicated are based upon total investments (excluding Money Market Funds).
For further detail about these holdings, please refer to the section entitled "Portfolio of Investments."
Fund holdings are as of the date given, are subject to change at any time, and are not recommendations to buy or sell any security.
Country Breakdown (%)
(at February 29, 2016) | |
Argentina | | | 2.8 | | |
Australia | | | 2.7 | | |
China | | | 13.4 | | |
Denmark | | | 3.8 | | |
Germany | | | 1.1 | | |
India | | | 1.6 | | |
Ireland | | | 4.4 | | |
Japan | | | 2.8 | | |
Netherlands | | | 4.9 | | |
Portugal | | | 1.8 | | |
South Korea | | | 1.9 | | |
Spain | | | 2.0 | | |
Thailand | | | 4.7 | | |
United Kingdom | | | 2.8 | | |
United States(a) | | | 49.3 | | |
Total | | | 100.0 | | |
Country Breakdown is based primarily on issuer's place of organization/incorporation. Percentages indicated are based upon total investments. The Fund's portfolio composition is subject to change.
(a) Includes investments in Money Market Funds.
Annual Report 2016
5
COLUMBIA SELECT GLOBAL GROWTH FUND
MANAGER DISCUSSION OF FUND PERFORMANCE (continued)
Equity Sector Breakdown (%)
(at February 29, 2016) | |
Consumer Discretionary | | | 18.8 | | |
Consumer Staples | | | 14.5 | | |
Energy | | | 3.6 | | |
Financials | | | 8.9 | | |
Health Care | | | 21.3 | | |
Industrials | | | 2.1 | | |
Information Technology | | | 30.2 | | |
Materials | | | 0.6 | | |
Total | | | 100.0 | | |
Percentages indicated are based upon total equity investments. The Fund's portfolio composition is subject to change.
Investment Risks
Market risk may affect a single issuer, sector of the economy, industry or the market as a whole. Growth securities, at times, may not perform as well as value securities or the stock market in general and may be out of favor with investors. International investing involves certain risks and volatility due to potential political, economic or currency instabilities and different financial and accounting standards. Risks are enhanced for emerging market issuers. Investing in derivatives is a specialized activity that involves special risks, which may result in significant losses. Investments in a limited number of companies subject the Fund to greater risk of loss. See the Fund's prospectus for more information on these and other risks.
Annual Report 2016
6
COLUMBIA SELECT GLOBAL GROWTH FUND
UNDERSTANDING YOUR FUND'S EXPENSES
(Unaudited)
As an investor, you incur two types of costs. There are transaction costs, which generally include sales charges on purchases and may include redemption fees. There are also ongoing costs, which generally include management fees, distribution and/or service fees, and other fund expenses. The following information is intended to help you understand your ongoing costs (in dollars) of investing in the Fund and to help you compare these costs with the ongoing costs of investing in other mutual funds.
Analyzing Your Fund's Expenses
To illustrate these ongoing costs, we have provided examples and calculated the expenses paid by investors in each share class of the Fund during the period. The actual and hypothetical information in the table is based on an initial investment of $1,000 at the beginning of the period indicated and held for the entire period. Expense information is calculated two ways and each method provides you with different information. The amount listed in the "Actual" column is calculated using the Fund's actual operating expenses and total return for the period. You may use the Actual information, together with the amount invested, to estimate the expenses that you paid over the period. Simply divide your account value by $1,000 (for example, an $8,600 account value divided by $1,000 = 8.6), then multiply the results by the expenses paid during the period under the "Actual" column. The amount listed in the "Hypothetical" column assumes a 5% annual rate of return before expenses (which is not the Fund's actual return) and then applies the Fund's actual expense ratio for the period to the hypothetical return. You should not use the hypothetical account values and expenses to estimate either your actual account balance at the end of the period or the expenses you paid during the period. See "Compare With Other Funds" below for details on how to use the hypothetical data.
Compare With Other Funds
Since all mutual funds are required to include the same hypothetical calculations about expenses in shareholder reports, you can use this information to compare the ongoing cost of investing in the Fund with other funds. To do so, compare the hypothetical example with the 5% hypothetical examples that appear in the shareholder reports of other funds. As you compare hypothetical examples of other funds, it is important to note that hypothetical examples are meant to highlight the ongoing costs of investing in a fund only and do not reflect any transaction costs, such as sales charges, or redemption or exchange fees. Therefore, the hypothetical calculations are useful in comparing ongoing costs only, and will not help you determine the relative total costs of owning different funds. If transaction costs were included in these calculations, your costs would be higher.
September 1, 2015 – February 29, 2016
| | | Account Value at the Beginning
of the Period ($) | | Account Value at the End
of the Period ($) | | Expenses Paid During the
Period ($) | | Fund's Annualized
Expense Ratio (%) | |
| | | Actual | | Hypothetical | | Actual | | Hypothetical | | Actual | | Hypothetical | | Actual | |
Class A | | | 1,000.00 | | | | 1,000.00 | | | | 884.80 | | | | 1,017.60 | | | | 6.84 | | | | 7.32 | | | | 1.46 | | |
Class C | | | 1,000.00 | | | | 1,000.00 | | | | 882.30 | | | | 1,013.87 | | | | 10.34 | | | | 11.07 | | | | 2.21 | | |
Class R | | | 1,000.00 | | | | 1,000.00 | | | | 883.90 | | | | 1,016.36 | | | | 8.01 | | | | 8.57 | | | | 1.71 | | |
Class R4 | | | 1,000.00 | | | | 1,000.00 | | | | 886.30 | | | | 1,018.85 | | | | 5.67 | | | | 6.07 | | | | 1.21 | | |
Class R5 | | | 1,000.00 | | | | 1,000.00 | | | | 886.50 | | | | 1,019.24 | | | | 5.30 | | | | 5.67 | | | | 1.13 | | |
Class Z | | | 1,000.00 | | | | 1,000.00 | | | | 886.30 | | | | 1,018.85 | | | | 5.67 | | | | 6.07 | | | | 1.21 | | |
Expenses paid during the period are equal to the annualized expense ratio for each class as indicated above, multiplied by the average account value over the period and then multiplied by the number of days in the Fund's most recent fiscal half year and divided by 366.
Expenses do not include fees and expenses incurred indirectly by the Fund from its investment in underlying funds, including affiliated and non-affiliated pooled investment vehicles, such as mutual funds and exchange-traded funds.
Had Columbia Management Investment Advisers, LLC and/or certain of its affiliates not waived/reimbursed certain fees and expenses, account value at the end of the period would have been reduced.
Annual Report 2016
7
COLUMBIA SELECT GLOBAL GROWTH FUND
PORTFOLIO OF INVESTMENTS
February 29, 2016
(Percentages represent value of investments compared to net assets)
Common Stocks 99.6%
Issuer | | Shares | | Value ($) | |
ARGENTINA 2.8% | |
MercadoLibre, Inc. | | | 17,060 | | | | 1,736,026 | | |
AUSTRALIA 2.7% | |
Domino's Pizza Enterprises Ltd. | | | 40,089 | | | | 1,673,412 | | |
CHINA 13.3% | |
Alibaba Group Holding Ltd., ADR(a) | | | 30,551 | | | | 2,102,214 | | |
Ctrip.com International Ltd., ADR(a) | | | 26,390 | | | | 1,079,879 | | |
JD.com, Inc., ADR(a) | | | 39,250 | | | | 1,009,117 | | |
Noah Holdings Ltd., ADR(a) | | | 21,760 | | | | 515,712 | | |
Sinopharm Group Co. Class H | | | 174,400 | | | | 637,298 | | |
Tencent Holdings Ltd. | | | 115,200 | | | | 2,107,875 | | |
Vipshop Holdings Ltd., ADR(a) | | | 65,930 | | | | 732,482 | | |
Total | | | | | 8,184,577 | | |
DENMARK 3.8% | |
Novo Nordisk A/S, Class B | | | 45,822 | | | | 2,359,131 | | |
GERMANY 1.1% | |
Deutsche Boerse AG | | | 8,300 | | | | 682,418 | | |
INDIA 1.6% | |
HDFC Bank Ltd., ADR | | | 18,050 | | | | 953,401 | | |
IRELAND 4.4% | |
ICON PLC(a) | | | 9,990 | | | | 710,888 | | |
Shire PLC, ADR | | | 7,170 | | | | 1,119,309 | | |
Weatherford International PLC(a) | | | 135,720 | | | | 868,608 | | |
Total | | | | | 2,698,805 | | |
JAPAN 2.8% | |
Ain Holdings, Inc. | | | 37,400 | | | | 1,698,768 | | |
NETHERLANDS 4.9% | |
Core Laboratories NV | | | 12,710 | | | | 1,333,788 | | |
Mobileye NV(a) | | | 51,270 | | | | 1,664,224 | | |
Total | | | | | 2,998,012 | | |
PORTUGAL 1.8% | |
Jeronimo Martins SGPS SA | | | 77,470 | | | | 1,093,459 | | |
SOUTH KOREA 1.9% | |
LG Household & Health Care Ltd. | | | 1,620 | | | | 1,137,189 | | |
SPAIN 2.0% | |
Industria de Diseno Textil SA | | | 40,370 | | | | 1,245,614 | | |
Common Stocks (continued)
Issuer | | Shares | | Value ($) | |
THAILAND 4.7% | |
CP ALL PCL, Foreign Registered
Shares | | | 1,262,700 | | | | 1,530,375 | | |
Srisawad Power 1979 PCL | | | 1,075,800 | | | | 1,371,333 | | |
Total | | | | | 2,901,708 | | |
UNITED KINGDOM 2.8% | |
Associated British Foods PLC | | | 13,636 | | | | 642,345 | | |
Signet Jewelers Ltd. | | | 10,173 | | | | 1,102,753 | | |
Total | | | | | 1,745,098 | | |
UNITED STATES 49.0% | |
Acuity Brands, Inc. | | | 6,230 | | | | 1,304,749 | | |
Adobe Systems, Inc.(a) | | | 18,230 | | | | 1,552,284 | | |
Alexion Pharmaceuticals, Inc.(a) | | | 8,310 | | | | 1,170,048 | | |
Amazon.com, Inc.(a) | | | 1,820 | | | | 1,005,586 | | |
Biogen, Inc.(a) | | | 2,990 | | | | 775,666 | | |
Bristol-Myers Squibb Co. | | | 18,470 | | | | 1,143,847 | | |
Celgene Corp.(a) | | | 11,790 | | | | 1,188,786 | | |
Cognizant Technology Solutions Corp.,
Class A(a) | | | 24,310 | | | | 1,385,184 | | |
CVS Health Corp. | | | 16,719 | | | | 1,624,585 | | |
DexCom, Inc.(a) | | | 12,360 | | | | 804,142 | | |
Edwards Lifesciences Corp.(a) | | | 4,210 | | | | 366,270 | | |
Facebook, Inc., Class A(a) | | | 14,156 | | | | 1,513,560 | | |
Illumina, Inc.(a) | | | 6,110 | | | | 917,966 | | |
Intercept Pharmaceuticals, Inc.(a) | | | 9,320 | | | | 1,038,062 | | |
Intercontinental Exchange, Inc. | | | 8,070 | | | | 1,924,372 | | |
LinkedIn Corp., Class A(a) | | | 7,230 | | | | 847,284 | | |
Monster Beverage Corp.(a) | | | 9,170 | | | | 1,150,835 | | |
Nike, Inc., Class B | | | 19,322 | | | | 1,190,042 | | |
Palo Alto Networks, Inc.(a) | | | 7,560 | | | | 1,094,612 | | |
Priceline Group, Inc. (The)(a) | | | 1,036 | | | | 1,310,758 | | |
Salesforce.com, inc.(a) | | | 10,250 | | | | 694,437 | | |
ServiceNow, Inc.(a) | | | 18,530 | | | | 1,018,965 | | |
Sherwin-Williams Co. (The) | | | 1,310 | | | | 354,355 | | |
Splunk, Inc.(a) | | | 29,970 | | | | 1,306,692 | | |
Tesla Motors, Inc.(a) | | | 6,040 | | | | 1,159,257 | | |
Vertex Pharmaceuticals, Inc.(a) | | | 9,447 | | | | 807,624 | | |
Visa, Inc., Class A | | | 20,262 | | | | 1,466,766 | | |
Total | | | | | 30,116,734 | | |
Total Common Stocks
(Cost: $69,765,045) | | | | | 61,224,352 | | |
The accompanying Notes to Financial Statements are an integral part of this statement.
Annual Report 2016
8
COLUMBIA SELECT GLOBAL GROWTH FUND
PORTFOLIO OF INVESTMENTS (continued)
February 29, 2016
Money Market Funds 0.1%
| | | Shares | | Value ($) | |
Columbia Short-Term Cash Fund,
0.420%(b)(c) | | | 91,186 | | | | 91,186 | | |
Total Money Market Funds
(Cost: $91,186) | | | | | 91,186 | | |
Total Investments
(Cost: $69,856,231) | | | | | 61,315,538 | | |
Other Assets & Liabilities, Net | | | | | 184,427 | | |
Net Assets | | | | | 61,499,965 | | |
Investments in Derivatives
Forward Foreign Currency Exchange Contracts Open at February 29, 2016
Counterparty | | Exchange Date | | Currency to
be Delivered | |
| | Currency to be
Received | |
| | Unrealized
Appreciation ($) | | Unrealized
Depreciation ($) | |
Citi | | 4/20/16 | | | 425,000 | | | AUD | | | | | 305,317 | | | USD | | | | | 2,673 | | | | — | | |
Citi | | 4/20/16 | | | 12,702,000 | | | DKK | | | | | 1,877,189 | | | USD | | | | | 21,609 | | | | — | | |
Citi | | 4/20/16 | | | 4,984,000 | | | ILS | | | | | 1,277,719 | | | USD | | | | | — | | | | (1,240 | ) | |
Citi | | 4/20/16 | | | 12,613,000 | | | INR | | | | | 181,202 | | | USD | | | | | — | | | | (1,874 | ) | |
Citi | | 4/20/16 | | | 225,499,000 | | | KRW | | | | | 181,851 | | | USD | | | | | 154 | | | | — | | |
Citi | | 4/20/16 | | | 93,171,000 | | | THB | | | | | 2,605,453 | | | USD | | | | | — | | | | (5,995 | ) | |
Citi | | 4/20/16 | | | 370,491 | | | USD | | | | | 1,479,000 | | | BRL | | | | | — | | | | (7,097 | ) | |
Citi | | 4/20/16 | | | 1,725,582 | | | USD | | | | | 2,349,000 | | | CAD | | | | | 10,647 | | | | — | | |
Citi | | 4/20/16 | | | 1,867,471 | | | USD | | | | | 1,851,000 | | | CHF | | | | | — | | | | (8,999 | ) | |
Citi | | 4/20/16 | | | 2,420,303 | | | USD | | | | | 2,197,000 | | | EUR | | | | | — | | | | (26,633 | ) | |
Citi | | 4/20/16 | | | 2,179,959 | | | USD | | | | | 1,565,000 | | | GBP | | | | | — | | | | (1,323 | ) | |
Citi | | 4/20/16 | | | 182,358 | | | USD | | | | | 2,471,040,000 | | | IDR | | | | | 902 | | | | — | | |
Citi | | 4/20/16 | | | 3,053,419 | | | USD | | | | | 343,644,000 | | | JPY | | | | | — | | | | (838 | ) | |
Citi | | 4/20/16 | | | 306,185 | | | USD | | | | | 5,579,000 | | | MXN | | | | | 254 | | | | — | | |
Citi | | 4/20/16 | | | 183,098 | | | USD | | | | | 774,000 | | | MYR | | | | | 1,259 | | | | — | | |
Citi | | 4/20/16 | | | 121,790 | | | USD | | | | | 1,055,000 | | | NOK | | | | | — | | | | (599 | ) | |
Citi | | 4/20/16 | | | 247,126 | | | USD | | | | | 19,058,000 | | | RUB | | | | | 2,541 | | | | — | | |
Citi | | 4/20/16 | | | 604,177 | | | USD | | | | | 5,143,000 | | | SEK | | | | | — | | | | (2,319 | ) | |
Citi | | 4/20/16 | | | 303,995 | | | USD | | | | | 427,000 | | | SGD | | | | | — | | | | (661 | ) | |
Citi | | 4/20/16 | | | 789,712 | | | USD | | | | | 26,267,000 | | | TWD | | | | | — | | | | (2,520 | ) | |
Citi | | 4/20/16 | | | 427,176 | | | USD | | | | | 6,715,000 | | | ZAR | | | | | — | | | | (8,184 | ) | |
Total | | | | | | | | | | | | | 40,039 | | | | (68,282 | ) | |
The accompanying Notes to Financial Statements are an integral part of this statement.
Annual Report 2016
9
COLUMBIA SELECT GLOBAL GROWTH FUND
PORTFOLIO OF INVESTMENTS (continued)
February 29, 2016
Notes to Portfolio of Investments
(a) Non-income producing investment.
(b) The rate shown is the seven-day current annualized yield at February 29, 2016.
(c) As defined in the Investment Company Act of 1940, an affiliated company is one in which the Fund owns 5% or more of the company's outstanding voting securities, or a company which is under common ownership or control with the Fund. Holdings and transactions in these affiliated companies during the year ended February 29, 2016 are as follows:
Issuer | | Beginning
Cost ($) | | Purchase
Cost ($) | | Proceeds
From Sales ($) | | Ending
Cost ($) | | Dividends —
Affiliated
Issuers ($) | | Value ($) | |
Columbia Short-Term Cash Fund | | | 5,141,885 | | | | 85,871,115 | | | | (90,921,814 | ) | | | 91,186 | | | | 6,052 | | | | 91,186 | | |
Abbreviation Legend
ADR American Depositary Receipt
Currency Legend
AUD Australian Dollar
BRL Brazilian Real
CAD Canadian Dollar
CHF Swiss Franc
DKK Danish Krone
EUR Euro
GBP British Pound
IDR Indonesian Rupiah
ILS Israeli Shekel
INR Indian Rupee
JPY Japanese Yen
KRW Korean Won
MXN Mexican Peso
MYR Malaysia Ringgits
NOK Norwegian Krone
RUB Russian Rouble
SEK Swedish Krona
SGD Singapore Dollar
THB Thailand Baht
TWD Taiwan Dollar
USD US Dollar
ZAR South African Rand
The accompanying Notes to Financial Statements are an integral part of this statement.
Annual Report 2016
10
COLUMBIA SELECT GLOBAL GROWTH FUND
PORTFOLIO OF INVESTMENTS (continued)
February 29, 2016
Fair Value Measurements
The Fund categorizes its fair value measurements according to a three-level hierarchy that maximizes the use of observable inputs and minimizes the use of unobservable inputs by prioritizing that the most observable input be used when available. Observable inputs are those that market participants would use in pricing an investment based on market data obtained from sources independent of the reporting entity. Unobservable inputs are those that reflect the Fund's assumptions about the information market participants would use in pricing an investment. An investment's level within the fair value hierarchy is based on the lowest level of any input that is deemed significant to the asset's or liability's fair value measurement. The input levels are not necessarily an indication of the risk or liquidity associated with investments at that level. For example, certain U.S. government securities are generally high quality and liquid, however, they are reflected as Level 2 because the inputs used to determine fair value may not always be quoted prices in an active market.
Fair value inputs are summarized in the three broad levels listed below:
> Level 1 — Valuations based on quoted prices for investments in active markets that the Fund has the ability to access at the measurement date (including NAV for open-end mutual funds). Valuation adjustments are not applied to Level 1 investments.
> Level 2 — Valuations based on other significant observable inputs (including quoted prices for similar securities, interest rates, prepayment speeds, credit risks, etc.).
> Level 3 — Valuations based on significant unobservable inputs (including the Fund's own assumptions and judgment in determining the fair value of investments).
Inputs that are used in determining fair value of an investment may include price information, credit data, volatility statistics, and other factors. These inputs can be either observable or unobservable. The availability of observable inputs can vary between investments, and is affected by various factors such as the type of investment, and the volume and level of activity for that investment or similar investments in the marketplace. The inputs will be considered by the Investment Manager, along with any other relevant factors in the calculation of an investment's fair value. The Fund uses prices and inputs that are current as of the measurement date, which may include periods of market dislocations. During these periods, the availability of prices and inputs may be reduced for many investments. This condition could cause an investment to be reclassified between the various levels within the hierarchy.
Foreign equity securities actively traded in markets where there is a significant delay in the local close relative to the New York Stock Exchange (NYSE) are classified as Level 2. The values of these securities may include an adjustment to reflect the impact of significant market movements following the close of local trading, as described in Note 2 to the financial statements — Security Valuation.
Investments falling into the Level 3 category are primarily supported by quoted prices from brokers and dealers participating in the market for those investments. However, these may be classified as Level 3 investments due to lack of market transparency and corroboration to support these quoted prices. Additionally, valuation models may be used as the pricing source for any remaining investments classified as Level 3. These models may rely on one or more significant unobservable inputs and/or significant assumptions by the Investment Manager. Inputs used in valuations may include, but are not limited to, financial statement analysis, capital account balances, discount rates and estimated cash flows, and comparable company data.
Under the direction of the Fund's Board of Trustees (the Board), the Investment Manager's Valuation Committee (the Committee) is responsible for overseeing the valuation procedures approved by the Board. The Committee consists of voting and non-voting members from various groups within the Investment Manager's organization, including operations and accounting, trading and investments, compliance, risk management and legal.
The Committee meets at least monthly to review and approve valuation matters, which may include a description of specific valuation determinations, data regarding pricing information received from approved pricing vendors and brokers and the results of Board-approved valuation control policies and procedures (the Policies). The Policies address, among other things, instances when market quotations are or are not readily available, including recommendations of third party pricing vendors and a determination of appropriate pricing methodologies; events that require specific valuation determinations and assessment of fair value techniques; securities with a potential for stale pricing, including those that are illiquid, restricted, or in default; and the effectiveness of third party pricing vendors, including periodic reviews of vendors. The Committee meets more frequently, as needed, to discuss additional valuation matters, which may include the need to review back-testing results, review time-sensitive information or approve related valuation actions. The Committee reports to the Board, with members of the Committee meeting with the Board at each of its regularly scheduled meetings to discuss valuation matters and actions during the period, similar to those described earlier.
For investments categorized as Level 3, the Committee monitors information similar to that described above, which may include: (i) data specific to the issuer or comparable issuers, (ii) general market or specific sector news and (iii) quoted prices and specific or similar security transactions. The Committee considers this data and any changes from prior periods in order to assess the reasonableness of observable and unobservable inputs, any assumptions or internal models used to value those securities and changes in fair value. This data is also used to corroborate, when available, information received from approved pricing vendors and brokers. Various factors impact the frequency of monitoring this information (which may occur as often as daily). However, the Committee may determine that changes to inputs, assumptions and models are not required as a result of the monitoring procedures performed.
The accompanying Notes to Financial Statements are an integral part of this statement.
Annual Report 2016
11
COLUMBIA SELECT GLOBAL GROWTH FUND
PORTFOLIO OF INVESTMENTS (continued)
February 29, 2016
Fair Value Measurements (continued)
The following table is a summary of the inputs used to value the Fund's investments at February 29, 2016:
| | | Level 1
Quoted Prices in Active
Markets for Identical
Assets ($) | | Level 2
Other Significant
Observable Inputs ($) | | Level 3
Significant
Unobservable Inputs ($) | | Total ($) | |
Investments | |
Common Stocks | |
Argentina | | | 1,736,026 | | | | — | | | | — | | | | 1,736,026 | | |
Australia | | | — | | | | 1,673,412 | | | | — | | | | 1,673,412 | | |
China | | | 5,439,404 | | | | 2,745,173 | | | | — | | | | 8,184,577 | | |
Denmark | | | — | | | | 2,359,131 | | | | — | | | | 2,359,131 | | |
Germany | | | — | | | | 682,418 | | | | — | | | | 682,418 | | |
India | | | 953,401 | | | | — | | | | — | | | | 953,401 | | |
Ireland | | | 2,698,805 | | | | — | | | | — | | | | 2,698,805 | | |
Japan | | | — | | | | 1,698,768 | | | | — | | | | 1,698,768 | | |
Netherlands | | | 2,998,012 | | | | — | | | | — | | | | 2,998,012 | | |
Portugal | | | — | | | | 1,093,459 | | | | — | | | | 1,093,459 | | |
South Korea | | | — | | | | 1,137,189 | | | | — | | | | 1,137,189 | | |
Spain | | | — | | | | 1,245,614 | | | | — | | | | 1,245,614 | | |
Thailand | | | — | | | | 2,901,708 | | | | — | | | | 2,901,708 | | |
United Kingdom | | | 1,102,753 | | | | 642,345 | | | | — | | | | 1,745,098 | | |
United States | | | 30,116,734 | | | | — | | | | — | | | | 30,116,734 | | |
Total Common Stocks | | | 45,045,135 | | | | 16,179,217 | | | | — | | | | 61,224,352 | | |
Money Market Funds | | | — | | | | 91,186 | | | | — | | | | 91,186 | | |
Total Investments | | | 45,045,135 | | | | 16,270,403 | | | | — | | | | 61,315,538 | | |
Derivatives | |
Assets | |
Forward Foreign Currency
Exchange Contracts | | | — | | | | 40,039 | | | | — | | | | 40,039 | | |
Liabilities | |
Forward Foreign Currency
Exchange Contracts | | | — | | | | (68,282 | ) | | | — | | | | (68,282 | ) | |
Total | | | 45,045,135 | | | | 16,242,160 | | | | — | | | | 61,287,295 | | |
See the Portfolio of Investments for all investment classifications not indicated in the table.
The Fund's assets assigned to the Level 2 input category are generally valued using the market approach, in which a security's value is determined through reference to prices and information from market transactions for similar or identical assets and/or fund per share market values which are not considered publicly available. These assets include certain foreign securities for which a third party statistical pricing service may be employed for purposes of fair market valuation. The model utilized by such third party statistical pricing service takes into account a security's correlation to available market data including, but not limited to, intraday index, ADR, and exchange-traded fund movements.
Derivative instruments are valued at unrealized appreciation (depreciation).
Financial assets were transferred from Level 1 to Level 2 as the market for these assets is not considered publicly available. Fund per share market values were obtained using observable market inputs.
The accompanying Notes to Financial Statements are an integral part of this statement.
Annual Report 2016
12
COLUMBIA SELECT GLOBAL GROWTH FUND
PORTFOLIO OF INVESTMENTS (continued)
February 29, 2016
Fair Value Measurements (continued)
The following table shows transfers between Level 1 and Level 2 of the fair value hierarchy:
Transfers In | | Transfers Out | |
| Level 1 ($) | | Level 2 ($) | | Level 1 ($) | | Level 2 ($) | |
| | — | | | | 5,141,885 | | | | 5,141,885 | | | | — | | |
Transfers between Level 1 and Level 2 are determined based on the fair value at the beginning of the period for security positions held throughout the period.
There were no transfers of financial assets between Levels 2 and 3 during the period.
The accompanying Notes to Financial Statements are an integral part of this statement.
Annual Report 2016
13
COLUMBIA SELECT GLOBAL GROWTH FUND
STATEMENT OF ASSETS AND LIABILITIES
February 29, 2016
Assets | |
Investments, at value | |
Unaffiliated issuers (identified cost $69,765,045) | | $ | 61,224,352 | | |
Affiliated issuers (identified cost $91,186) | | | 91,186 | | |
Total investments (identified cost $69,856,231) | | | 61,315,538 | | |
Unrealized appreciation on forward foreign currency exchange contracts | | | 40,039 | | |
Receivable for: | |
Investments sold | | | 376,176 | | |
Capital shares sold | | | 209,611 | | |
Dividends | | | 22,440 | | |
Foreign tax reclaims | | | 34,530 | | |
Expense reimbursement due from Investment Manager | | | 798 | | |
Prepaid expenses | | | 1,281 | | |
Other assets | | | 3,345 | | |
Total assets | | | 62,003,758 | | |
Liabilities | |
Unrealized depreciation on forward foreign currency exchange contracts | | | 68,282 | | |
Payable for: | |
Investments purchased | | | 221,838 | | |
Capital shares purchased | | | 121,865 | | |
Investment management fees | | | 4,401 | | |
Distribution and/or service fees | | | 1,928 | | |
Transfer agent fees | | | 8,926 | | |
Compensation of board members | | | 35,324 | | |
Audit fees | | | 27,710 | | |
Other expenses | | | 10,808 | | |
Other liabilities | | | 2,711 | | |
Total liabilities | | | 503,793 | | |
Net assets applicable to outstanding capital stock | | $ | 61,499,965 | | |
Represented by | |
Paid-in capital | | $ | 66,762,631 | | |
Excess of distributions over net investment income | | | (178,112 | ) | |
Accumulated net realized gain | | | 3,488,246 | | |
Unrealized appreciation (depreciation) on: | |
Investments | | | (8,540,693 | ) | |
Foreign currency translations | | | (3,864 | ) | |
Forward foreign currency exchange contracts | | | (28,243 | ) | |
Total — representing net assets applicable to outstanding capital stock | | $ | 61,499,965 | | |
The accompanying Notes to Financial Statements are an integral part of this statement.
Annual Report 2016
14
COLUMBIA SELECT GLOBAL GROWTH FUND
STATEMENT OF ASSETS AND LIABILITIES (continued)
February 29, 2016
Class A | |
Net assets | | $ | 40,251,514 | | |
Shares outstanding | | | 3,612,340 | | |
Net asset value per share | | $ | 11.14 | | |
Maximum offering price per share(a) | | $ | 11.82 | | |
Class C | |
Net assets | | $ | 13,110,918 | | |
Shares outstanding | | | 1,232,784 | | |
Net asset value per share | | $ | 10.64 | | |
Class R | |
Net assets | | $ | 542,604 | | |
Shares outstanding | | | 49,443 | | |
Net asset value per share | | $ | 10.97 | | |
Class R4 | |
Net assets | | $ | 1,451,034 | | |
Shares outstanding | | | 128,259 | | |
Net asset value per share | | $ | 11.31 | | |
Class R5 | |
Net assets | | $ | 194,161 | | |
Shares outstanding | | | 17,135 | | |
Net asset value per share | | $ | 11.33 | | |
Class Z | |
Net assets | | $ | 5,949,734 | | |
Shares outstanding | | | 525,827 | | |
Net asset value per share(b) | | $ | 11.31 | | |
(a) The maximum offering price per share is calculated by dividing the net asset value per share by 1.0 minus the maximum sales charge of 5.75%.
(b) Net asset value per share rounds to this amount due to fractional shares outstanding.
The accompanying Notes to Financial Statements are an integral part of this statement.
Annual Report 2016
15
COLUMBIA SELECT GLOBAL GROWTH FUND
STATEMENT OF OPERATIONS
Year Ended February 29, 2016
Net investment income | |
Income: | |
Dividends — unaffiliated issuers | | $ | 553,575 | | |
Dividends — affiliated issuers | | | 6,052 | | |
Foreign taxes withheld | | | (42,187 | ) | |
Total income | | | 517,440 | | |
Expenses: | |
Investment management fees | | | 579,671 | | |
Distribution and/or service fees | |
Class A | | | 105,634 | | |
Class C | | | 132,774 | | |
Class R | | | 3,822 | | |
Transfer agent fees | |
Class A | | | 73,380 | | |
Class C | | | 23,050 | | |
Class R | | | 1,326 | | |
Class R4 | | | 3,144 | | |
Class R5 | | | 67 | | |
Class Z | | | 14,688 | | |
Compensation of board members | | | 8,424 | | |
Custodian fees | | | 9,232 | | |
Printing and postage fees | | | 34,347 | | |
Registration fees | | | 79,386 | | |
Audit fees | | | 31,995 | | |
Legal fees | | | 6,345 | | |
Other | | | 12,187 | | |
Total expenses | | | 1,119,472 | | |
Fees waived or expenses reimbursed by Investment Manager and its affiliates | | | (67,388 | ) | |
Total net expenses | | | 1,052,084 | | |
Net investment loss | | | (534,644 | ) | |
Realized and unrealized gain (loss) — net | |
Net realized gain (loss) on: | |
Investments | | | 4,829,507 | | |
Foreign currency translations | | | 4,130 | | |
Forward foreign currency exchange contracts | | | (9,536 | ) | |
Net realized gain | | | 4,824,101 | | |
Net change in unrealized appreciation (depreciation) on: | |
Investments | | | (16,685,654 | ) | |
Foreign currency translations | | | (1,310 | ) | |
Forward foreign currency exchange contracts | | | (28,243 | ) | |
Net change in unrealized depreciation | | | (16,715,207 | ) | |
Net realized and unrealized loss | | | (11,891,106 | ) | |
Net decrease in net assets from operations | | $ | (12,425,750 | ) | |
The accompanying Notes to Financial Statements are an integral part of this statement.
Annual Report 2016
16
COLUMBIA SELECT GLOBAL GROWTH FUND
STATEMENT OF CHANGES IN NET ASSETS
| | | Year Ended
February 29,
2016 | | Year Ended
February 28,
2015 | |
Operations | |
Net investment loss | | $ | (534,644 | ) | | $ | (230,966 | ) | |
Net realized gain | | | 4,824,101 | | | | 1,425,646 | | |
Net change in unrealized appreciation (depreciation) | | | (16,715,207 | ) | | | 2,415,716 | | |
Net increase (decrease) in net assets resulting from operations | | | (12,425,750 | ) | | | 3,610,396 | | |
Distributions to shareholders | |
Net realized gains | |
Class A | | | (803,670 | ) | | | (2,764,186 | ) | |
Class C | | | (279,405 | ) | | | (887,467 | ) | |
Class R | | | (16,700 | ) | | | (182,013 | ) | |
Class R4 | | | (28,269 | ) | | | (459,456 | ) | |
Class R5 | | | (3,602 | ) | | | (947 | ) | |
Class Z | | | (124,325 | ) | | | (961,963 | ) | |
Total distributions to shareholders | | | (1,255,971 | ) | | | (5,256,032 | ) | |
Increase in net assets from capital stock activity | | | 19,985,559 | | | | 6,284,927 | | |
Total increase in net assets | | | 6,303,838 | | | | 4,639,291 | | |
Net assets at beginning of year | | | 55,196,127 | | | | 50,556,836 | | |
Net assets at end of year | | $ | 61,499,965 | | | $ | 55,196,127 | | |
Excess of distributions over net investment income | | $ | (178,112 | ) | | $ | (128,079 | ) | |
The accompanying Notes to Financial Statements are an integral part of this statement.
Annual Report 2016
17
COLUMBIA SELECT GLOBAL GROWTH FUND
STATEMENT OF CHANGES IN NET ASSETS (continued)
| | | Year Ended February 29, 2016 | | Year Ended February 28, 2015 | |
| �� | | Shares | | Dollars ($) | | Shares | | Dollars ($) | |
Capital stock activity | |
Class A shares | |
Subscriptions | | | 2,391,917 | | | | 31,704,787 | | | | 1,148,935 | | | | 15,263,367 | | |
Distributions reinvested | | | 60,162 | | | | 768,340 | | | | 189,257 | | | | 2,462,861 | | |
Redemptions | | | (1,210,123 | ) | | | (15,498,132 | ) | | | (811,624 | ) | | | (10,777,832 | ) | |
Net increase | | | 1,241,956 | | | | 16,974,995 | | | | 526,568 | | | | 6,948,396 | | |
Class C shares | |
Subscriptions | | | 607,844 | | | | 7,774,948 | | | | 346,459 | | | | 4,469,314 | | |
Distributions reinvested | | | 20,535 | | | | 250,483 | | | | 52,657 | | | | 662,210 | | |
Redemptions | | | (124,201 | ) | | | (1,500,431 | ) | | | (213,551 | ) | | | (2,732,087 | ) | |
Net increase | | | 504,178 | | | | 6,525,000 | | | | 185,565 | | | | 2,399,437 | | |
Class R shares | |
Subscriptions | | | 37,427 | | | | 474,380 | | | | 12,829 | | | | 166,892 | | |
Distributions reinvested | | | 1,313 | | | | 16,514 | | | | 4,350 | | | | 56,032 | | |
Redemptions | | | (37,562 | ) | | | (418,421 | ) | | | (137,884 | ) | | | (1,808,527 | ) | |
Net increase (decrease) | | | 1,178 | | | | 72,473 | | | | (120,705 | ) | | | (1,585,603 | ) | |
Class R4 shares | |
Subscriptions | | | 104,134 | | | | 1,378,842 | | | | 282,964 | | | | 3,943,393 | | |
Distributions reinvested | | | 2,179 | | | | 28,228 | | | | 34,739 | | | | 458,438 | | |
Redemptions | | | (262,903 | ) | | | (3,552,132 | ) | | | (137,419 | ) | | | (1,819,453 | ) | |
Net increase (decrease) | | | (156,590 | ) | | | (2,145,062 | ) | | | 180,284 | | | | 2,582,378 | | |
Class R5 shares | |
Subscriptions | | | 15,317 | | | | 207,106 | | | | 3,476 | | | | 46,139 | | |
Distributions reinvested | | | 275 | | | | 3,561 | | | | 54 | | | | 690 | | |
Redemptions | | | (2,147 | ) | | | (25,519 | ) | | | (19 | ) | | | (239 | ) | |
Net increase | | | 13,445 | | | | 185,148 | | | | 3,511 | | | | 46,590 | | |
Class Z shares | |
Subscriptions | | | 437,805 | | | | 5,807,208 | | | | 278,958 | | | | 3,651,945 | | |
Distributions reinvested | | | 8,376 | | | | 108,710 | | | | 53,219 | | | | 700,855 | | |
Redemptions | | | (565,686 | ) | | | (7,542,913 | ) | | | (631,949 | ) | | | (8,459,071 | ) | |
Net decrease | | | (119,505 | ) | | | (1,626,995 | ) | | | (299,772 | ) | | | (4,106,271 | ) | |
Total net increase | | | 1,484,662 | | | | 19,985,559 | | | | 475,451 | | | | 6,284,927 | | |
The accompanying Notes to Financial Statements are an integral part of this statement.
Annual Report 2016
18
COLUMBIA SELECT GLOBAL GROWTH FUND
The following tables are intended to help you understand the Fund's financial performance. Certain information reflects financial results for a single share of a class held for the periods shown. Per share net investment income (loss) amounts are calculated based on average shares outstanding during the period. Total return assumes reinvestment of all dividends and distributions, if any. Total return does not reflect payment of sales charges, if any. Total return and portfolio turnover are not annualized for periods of less than one year. The portfolio turnover rate is calculated without regard to purchase and sales transactions of short-term instruments and certain derivatives, if any. If such transactions were included, the Fund's portfolio turnover rate may be higher.
| | | Year Ended
February 29, | | Year Ended February 28, | | Year Ended
February 29, | |
Class A | | 2016 | | 2015 | | 2014 | | 2013 | | 2012 | |
Per share data | |
Net asset value, beginning of period | | $ | 13.58 | | | $ | 14.05 | | | $ | 10.78 | | | $ | 9.71 | | | $ | 10.16 | | |
Income from investment operations: | |
Net investment loss | | | (0.09 | ) | | | (0.06 | ) | | | (0.06 | ) | | | (0.04 | ) | | | (0.05 | ) | |
Net realized and unrealized gain (loss) | | | (2.12 | ) | | | 1.02 | | | | 3.82 | | | | 1.11 | | | | (0.28 | ) | |
Total from investment operations | | | (2.21 | ) | | | 0.96 | | | | 3.76 | | | | 1.07 | | | | (0.33 | ) | |
Less distributions to shareholders: | |
Net investment income | | | — | | | | — | | | | — | | | | — | | | | (0.01 | ) | |
Net realized gains | | | (0.23 | ) | | | (1.43 | ) | | | (0.49 | ) | | | — | | | | (0.10 | ) | |
Tax return of capital | | | — | | | | — | | | | — | | | | — | | | | (0.01 | ) | |
Total distributions to shareholders | | | (0.23 | ) | | | (1.43 | ) | | | (0.49 | ) | | | — | | | | (0.12 | ) | |
Net asset value, end of period | | $ | 11.14 | | | $ | 13.58 | | | $ | 14.05 | | | $ | 10.78 | | | $ | 9.71 | | |
Total return | | | (16.49 | %) | | | 7.53 | % | | | 35.05 | % | | | 11.02 | % | | | (3.27 | %) | |
Ratios to average net assets(a) | |
Total gross expenses | | | 1.57 | % | | | 1.71 | %(b) | | | 1.80 | % | | | 2.18 | % | | | 3.58 | % | |
Total net expenses(c) | | | 1.47 | % | | | 1.49 | %(b) | | | 1.51 | % | | | 1.57 | % | | | 1.60 | % | |
Net investment loss | | | (0.71 | %) | | | (0.44 | %) | | | (0.50 | %) | | | (0.41 | %) | | | (0.50 | %) | |
Supplemental data | |
Net assets, end of period (in thousands) | | $ | 40,252 | | | $ | 32,186 | | | $ | 25,902 | | | $ | 10,610 | | | $ | 3,786 | | |
Portfolio turnover | | | 154 | % | | | 98 | % | | | 149 | % | | | 98 | % | | | 112 | % | |
Notes to Financial Highlights
(a) In addition to the fees and expenses that the Fund bears directly, the Fund indirectly bears a pro rata share of the fees and expenses of any other funds in which it invests. Such indirect expenses are not included in the Fund's reported expense ratios.
(b) Ratios include line of credit interest expense which is less than 0.01%.
(c) Total net expenses include the impact of certain fee waivers/expense reimbursements made by the Investment Manager and certain of its affiliates, if applicable.
The accompanying Notes to Financial Statements are an integral part of this statement.
Annual Report 2016
19
COLUMBIA SELECT GLOBAL GROWTH FUND
FINANCIAL HIGHLIGHTS (continued)
| | | Year Ended
February 29, | | Year Ended February 28, | | Year Ended
February 29, | |
Class C | | 2016 | | 2015 | | 2014 | | 2013 | | 2012 | |
Per share data | |
Net asset value, beginning of period | | $ | 13.07 | | | $ | 13.67 | | | $ | 10.51 | | | $ | 9.53 | | | $ | 10.04 | | |
Income from investment operations: | |
Net investment loss | | | (0.18 | ) | | | (0.15 | ) | | | (0.15 | ) | | | (0.11 | ) | | | (0.11 | ) | |
Net realized and unrealized gain (loss) | | | (2.02 | ) | | | 0.98 | | | | 3.71 | | | | 1.09 | | | | (0.30 | ) | |
Total from investment operations | | | (2.20 | ) | | | 0.83 | | | | 3.56 | | | | 0.98 | | | | (0.41 | ) | |
Less distributions to shareholders: | |
Net investment income | | | — | | | | — | | | | — | | | | — | | | | (0.00 | )(a) | |
Net realized gains | | | (0.23 | ) | | | (1.43 | ) | | | (0.40 | ) | | | — | | | | (0.10 | ) | |
Tax return of capital | | | — | | | | — | | | | — | | | | — | | | | (0.00 | )(a) | |
Total distributions to shareholders | | | (0.23 | ) | | | (1.43 | ) | | | (0.40 | ) | | | — | | | | (0.10 | ) | |
Net asset value, end of period | | $ | 10.64 | | | $ | 13.07 | | | $ | 13.67 | | | $ | 10.51 | | | $ | 9.53 | | |
Total return | | | (17.06 | %) | | | 6.74 | % | | | 34.01 | % | | | 10.28 | % | | | (4.04 | %) | |
Ratios to average net assets(b) | |
Total gross expenses | | | 2.32 | % | | | 2.46 | %(c) | | | 2.54 | % | | | 3.03 | % | | | 4.32 | % | |
Total net expenses(d) | | | 2.22 | % | | | 2.24 | %(c) | | | 2.26 | % | | | 2.32 | % | | | 2.35 | % | |
Net investment loss | | | (1.45 | %) | | | (1.18 | %) | | | (1.24 | %) | | | (1.10 | %) | | | (1.25 | %) | |
Supplemental data | |
Net assets, end of period (in thousands) | | $ | 13,111 | | | $ | 9,521 | | | $ | 7,423 | | | $ | 2,586 | | | $ | 2,012 | | |
Portfolio turnover | | | 154 | % | | | 98 | % | | | 149 | % | | | 98 | % | | | 112 | % | |
Notes to Financial Highlights
(a) Rounds to zero.
(b) In addition to the fees and expenses that the Fund bears directly, the Fund indirectly bears a pro rata share of the fees and expenses of any other funds in which it invests. Such indirect expenses are not included in the Fund's reported expense ratios.
(c) Ratios include line of credit interest expense which is less than 0.01%.
(d) Total net expenses include the impact of certain fee waivers/expense reimbursements made by the Investment Manager and certain of its affiliates, if applicable.
The accompanying Notes to Financial Statements are an integral part of this statement.
Annual Report 2016
20
COLUMBIA SELECT GLOBAL GROWTH FUND
FINANCIAL HIGHLIGHTS (continued)
| | | Year Ended
February 29, | | Year Ended February 28, | | Year Ended
February 29, | |
Class R | | 2016 | | 2015 | | 2014 | | 2013 | | 2012 | |
Per share data | |
Net asset value, beginning of period | | $ | 13.41 | | | $ | 13.92 | | | $ | 10.70 | | | $ | 9.65 | | | $ | 10.13 | | |
Income from investment operations: | |
Net investment loss | | | (0.12 | ) | | | (0.06 | ) | | | (0.09 | ) | | | (0.06 | ) | | | (0.07 | ) | |
Net realized and unrealized gain (loss) | | | (2.09 | ) | | | 0.98 | | | | 3.77 | | | | 1.11 | | | | (0.30 | ) | |
Total from investment operations | | | (2.21 | ) | | | 0.92 | | | | 3.68 | | | | 1.05 | | | | (0.37 | ) | |
Less distributions to shareholders: | |
Net investment income | | | — | | | | — | | | | — | | | | — | | | | (0.00 | )(a) | |
Net realized gains | | | (0.23 | ) | | | (1.43 | ) | | | (0.46 | ) | | | — | | | | (0.10 | ) | |
Tax return of capital | | | — | | | | — | | | | — | | | | — | | | | (0.01 | ) | |
Total distributions to shareholders | | | (0.23 | ) | | | (1.43 | ) | | | (0.46 | ) | | | — | | | | (0.11 | ) | |
Net asset value, end of period | | $ | 10.97 | | | $ | 13.41 | | | $ | 13.92 | | | $ | 10.70 | | | $ | 9.65 | | |
Total return | | | (16.70 | %) | | | 7.30 | % | | | 34.55 | % | | | 10.88 | % | | | (3.62 | %) | |
Ratios to average net assets(b) | |
Total gross expenses | | | 1.82 | % | | | 1.92 | %(c) | | | 2.06 | % | | | 2.53 | % | | | 3.82 | % | |
Total net expenses(d) | | | 1.72 | % | | | 1.75 | %(c) | | | 1.77 | % | | | 1.82 | % | | | 1.85 | % | |
Net investment loss | | | (0.93 | %) | | | (0.41 | %) | | | (0.69 | %) | | | (0.61 | %) | | | (0.75 | %) | |
Supplemental data | |
Net assets, end of period (in thousands) | | $ | 543 | | | $ | 647 | | | $ | 2,353 | | | $ | 1,645 | | | $ | 1,195 | | |
Portfolio turnover | | | 154 | % | | | 98 | % | | | 149 | % | | | 98 | % | | | 112 | % | |
Notes to Financial Highlights
(a) Rounds to zero.
(b) In addition to the fees and expenses that the Fund bears directly, the Fund indirectly bears a pro rata share of the fees and expenses of any other funds in which it invests. Such indirect expenses are not included in the Fund's reported expense ratios.
(c) Ratios include line of credit interest expense which is less than 0.01%.
(d) Total net expenses include the impact of certain fee waivers/expense reimbursements made by the Investment Manager and certain of its affiliates, if applicable.
The accompanying Notes to Financial Statements are an integral part of this statement.
Annual Report 2016
21
COLUMBIA SELECT GLOBAL GROWTH FUND
FINANCIAL HIGHLIGHTS (continued)
| | | Year Ended
February 29, | | Year Ended February 28, | |
Class R4 | | 2016 | | 2015 | | 2014(a) | |
Per share data | |
Net asset value, beginning of period | | $ | 13.75 | | | $ | 14.17 | | | $ | 13.95 | | |
Income from investment operations: | |
Net investment loss | | | (0.03 | ) | | | (0.02 | ) | | | (0.01 | ) | |
Net realized and unrealized gain (loss) | | | (2.18 | ) | | | 1.03 | | | | 0.23 | | |
Total from investment operations | | | (2.21 | ) | | | 1.01 | | | | 0.22 | | |
Less distributions to shareholders: | |
Net realized gains | | | (0.23 | ) | | | (1.43 | ) | | | — | | |
Total distributions to shareholders | | | (0.23 | ) | | | (1.43 | ) | | | — | | |
Net asset value, end of period | | $ | 11.31 | | | $ | 13.75 | | | $ | 14.17 | | |
Total return | | | (16.28 | %) | | | 7.83 | % | | | 1.58 | % | |
Ratios to average net assets(b) | |
Total gross expenses | | | 1.32 | % | | | 1.45 | %(c) | | | 1.47 | %(d) | |
Total net expenses(e) | | | 1.22 | % | | | 1.24 | %(c) | | | 1.25 | %(d) | |
Net investment loss | | | (0.26 | %) | | | (0.12 | %) | | | (0.33 | %)(d) | |
Supplemental data | |
Net assets, end of period (in thousands) | | $ | 1,451 | | | $ | 3,917 | | | $ | 1,482 | | |
Portfolio turnover | | | 154 | % | | | 98 | % | | | 149 | % | |
Notes to Financial Highlights
(a) Based on operations from January 8, 2014 (commencement of operations) through the stated period end.
(b) In addition to the fees and expenses that the Fund bears directly, the Fund indirectly bears a pro rata share of the fees and expenses of any other funds in which it invests. Such indirect expenses are not included in the Fund's reported expense ratios.
(c) Ratios include line of credit interest expense which is less than 0.01%.
(d) Annualized.
(e) Total net expenses include the impact of certain fee waivers/expense reimbursements made by the Investment Manager and certain of its affiliates, if applicable.
The accompanying Notes to Financial Statements are an integral part of this statement.
Annual Report 2016
22
COLUMBIA SELECT GLOBAL GROWTH FUND
FINANCIAL HIGHLIGHTS (continued)
| | | Year Ended
February 29, | | Year Ended February 28, | |
Class R5 | | 2016 | | 2015 | | 2014(a) | |
Per share data | |
Net asset value, beginning of period | | $ | 13.76 | | | $ | 14.17 | | | $ | 13.95 | | |
Income from investment operations: | |
Net investment loss | | | (0.06 | ) | | | (0.07 | ) | | | (0.01 | ) | |
Net realized and unrealized gain (loss) | | | (2.14 | ) | | | 1.09 | | | | 0.23 | | |
Total from investment operations | | | (2.20 | ) | | | 1.02 | | | | 0.22 | | |
Less distributions to shareholders: | |
Net realized gains | | | (0.23 | ) | | | (1.43 | ) | | | — | | |
Total distributions to shareholders | | | (0.23 | ) | | | (1.43 | ) | | | — | | |
Net asset value, end of period | | $ | 11.33 | | | $ | 13.76 | | | $ | 14.17 | | |
Total return | | | (16.20 | %) | | | 7.90 | % | | | 1.58 | % | |
Ratios to average net assets(b) | |
Total gross expenses | | | 1.21 | % | | | 1.37 | %(c) | | | 1.38 | %(d) | |
Total net expenses(e) | | | 1.14 | % | | | 1.18 | %(c) | | | 1.20 | %(d) | |
Net investment loss | | | (0.47 | %) | | | (0.55 | %) | | | (0.37 | %)(d) | |
Supplemental data | |
Net assets, end of period (in thousands) | | $ | 194 | | | $ | 51 | | | $ | 3 | | |
Portfolio turnover | | | 154 | % | | | 98 | % | | | 149 | % | |
Notes to Financial Highlights
(a) Based on operations from January 8, 2014 (commencement of operations) through the stated period end.
(b) In addition to the fees and expenses that the Fund bears directly, the Fund indirectly bears a pro rata share of the fees and expenses of any other funds in which it invests. Such indirect expenses are not included in the Fund's reported expense ratios.
(c) Ratios include line of credit interest expense which is less than 0.01%.
(d) Annualized.
(e) Total net expenses include the impact of certain fee waivers/expense reimbursements made by the Investment Manager and certain of its affiliates, if applicable.
The accompanying Notes to Financial Statements are an integral part of this statement.
Annual Report 2016
23
COLUMBIA SELECT GLOBAL GROWTH FUND
FINANCIAL HIGHLIGHTS (continued)
| | | Year Ended
February 29, | | Year Ended February 28, | | Year Ended
February 29, | |
Class Z | | 2016 | | 2015 | | 2014 | | 2013 | | 2012 | |
Per share data | |
Net asset value, beginning of period | | $ | 13.75 | | | $ | 14.17 | | | $ | 10.87 | | | $ | 9.76 | | | $ | 10.20 | | |
Income from investment operations: | |
Net investment loss | | | (0.05 | ) | | | (0.02 | ) | | | (0.04 | ) | | | (0.02 | ) | | | (0.02 | ) | |
Net realized and unrealized gain (loss) | | | (2.16 | ) | | | 1.03 | | | | 3.86 | | | | 1.13 | | | | (0.30 | ) | |
Total from investment operations | | | (2.21 | ) | | | 1.01 | | | | 3.82 | | | | 1.11 | | | | (0.32 | ) | |
Less distributions to shareholders: | |
Net investment income | | | — | | | | — | | | | — | | | | — | | | | (0.01 | ) | |
Net realized gains | | | (0.23 | ) | | | (1.43 | ) | | | (0.52 | ) | | | — | | | | (0.10 | ) | |
Tax return of capital | | | — | | | | — | | | | — | | | | — | | | | (0.01 | ) | |
Total distributions to shareholders | | | (0.23 | ) | | | (1.43 | ) | | | (0.52 | ) | | | — | | | | (0.12 | ) | |
Net asset value, end of period | | $ | 11.31 | | | $ | 13.75 | | | $ | 14.17 | | | $ | 10.87 | | | $ | 9.76 | | |
Total return | | | (16.29 | %) | | | 7.83 | % | | | 35.32 | % | | | 11.37 | % | | | (3.12 | %) | |
Ratios to average net assets(a) | |
Total gross expenses | | | 1.32 | % | | | 1.44 | %(b) | | | 1.54 | % | | | 1.88 | % | | | 3.32 | % | |
Total net expenses(c) | | | 1.22 | % | | | 1.24 | %(b) | | | 1.26 | % | | | 1.32 | % | | | 1.35 | % | |
Net investment loss | | | (0.39 | %) | | | (0.12 | %) | | | (0.29 | %) | | | (0.19 | %) | | | (0.25 | %) | |
Supplemental data | |
Net assets, end of period (in thousands) | | $ | 5,950 | | | $ | 8,874 | | | $ | 13,395 | | | $ | 4,263 | | | $ | 1,438 | | |
Portfolio turnover | | | 154 | % | | | 98 | % | | | 149 | % | | | 98 | % | | | 112 | % | |
Notes to Financial Highlights
(a) In addition to the fees and expenses that the Fund bears directly, the Fund indirectly bears a pro rata share of the fees and expenses of any other funds in which it invests. Such indirect expenses are not included in the Fund's reported expense ratios.
(b) Ratios include line of credit interest expense which is less than 0.01%.
(c) Total net expenses include the impact of certain fee waivers/expense reimbursements made by the Investment Manager and certain of its affiliates, if applicable.
The accompanying Notes to Financial Statements are an integral part of this statement.
Annual Report 2016
24
COLUMBIA SELECT GLOBAL GROWTH FUND
NOTES TO FINANCIAL STATEMENTS
February 29, 2016
Note 1. Organization
Columbia Select Global Growth Fund (formerly known as Columbia Marsico Global Fund) (the Fund), a series of Columbia Funds Series Trust (the Trust), is a diversified fund. The Trust is registered under the Investment Company Act of 1940, as amended (the 1940 Act), as an open-end management investment company organized as a Delaware statutory trust. Effective November 20, 2015, Columbia Marsico Global Fund was renamed Columbia Select Global Growth Fund.
Fund Shares
The Trust may issue an unlimited number of shares (without par value). The Fund offers Class A, Class C, Class R, Class R4, Class R5 and Class Z shares. Although all share classes generally have identical voting, dividend and liquidation rights, each share class votes separately when required by the Trust's organizational documents or by law. Different share classes pay different distribution amounts to the extent the expenses of such share classes differ, and distributions in liquidation will be proportional to the net asset value of each share class. Each share class has its own expense and sales charge structure.
Class A shares are subject to a maximum front-end sales charge of 5.75% based on the initial investment amount. Class A shares purchased without an initial sales charge in accounts aggregating $1 million to $50 million at the time of purchase are subject to a contingent deferred sales charge (CDSC) if the shares are sold within 18 months after purchase, charged as follows: 1.00% CDSC if redeemed within 12 months after purchase, and 0.50% CDSC if redeemed more than 12, but less than 18, months after purchase.
Class C shares are subject to a 1.00% CDSC on shares redeemed within 12 months after purchase.
Class R shares are not subject to sales charges and are generally available only to certain retirement plans and other investors as described in the Fund's prospectus.
Class R4 shares are not subject to sales charges and are generally available only to omnibus retirement plans and certain investors as described in the Fund's prospectus.
Class R5 shares are not subject to sales charges and are generally available only to investors purchasing through authorized investment professionals and omnibus retirement plans.
Class Z shares are not subject to sales charges and are available only to eligible investors, which are subject to
different investment minimums as described in the Fund's prospectus.
Note 2. Summary of Significant Accounting Policies
Basis of Preparation
The Fund is an investment company that applies the accounting and reporting guidance in the Financial Accounting Standards Board (FASB) Accounting Standards Codification Topic 946, Financial Services — Investment Companies (ASC 946). The financial statements are prepared in accordance with U.S. generally accepted accounting principles (GAAP), which requires management to make certain estimates and assumptions that affect the reported amounts of assets and liabilities, the disclosure of contingent assets and liabilities at the date of the financial statements and the reported amounts of income and expenses during the reporting period. Actual results could differ from those estimates.
The following is a summary of significant accounting policies followed by the Fund in the preparation of its financial statements.
Security Valuation
All equity securities are valued at the close of business of the New York Stock Exchange (NYSE). Equity securities are valued at the last quoted sales price on the principal exchange or market on which they trade, except for securities traded on the NASDAQ Stock Market, which are valued at the NASDAQ official close price. Unlisted securities or listed securities for which there were no sales during the day are valued at the mean of the latest quoted bid and ask prices on such exchanges or markets.
Foreign equity securities are valued based on the closing price on the foreign exchange in which such securities are primarily traded. If any foreign equity security closing prices are not readily available, the securities are valued at the mean of the latest quoted bid and ask prices on such exchanges or markets. Foreign currency exchange rates are generally determined at 4:00 p.m. Eastern (U.S.) time. Many securities markets and exchanges outside the U.S. close prior to the close of the NYSE; therefore, the closing prices for securities in such markets or on such exchanges may not fully reflect events that occur after such close but before the close of the NYSE. In those situations, foreign securities will be fair valued pursuant to a policy adopted by the Board of Trustees (the Board), including, if available, utilizing a third party pricing service to determine these fair values. The third party pricing service takes into account multiple
Annual Report 2016
25
COLUMBIA SELECT GLOBAL GROWTH FUND
NOTES TO FINANCIAL STATEMENTS (continued)
February 29, 2016
factors, including, but not limited to, movements in the U.S. securities markets, certain depositary receipts, futures contracts and foreign exchange rates that have occurred subsequent to the close of the foreign exchange or market, to determine a good faith estimate that reasonably reflects the current market conditions as of the close of the NYSE. The fair value of a security is likely to be different from the quoted or published price, if available.
Forward foreign currency exchange contracts are marked-to-market based upon foreign currency exchange rates provided by a pricing service.
Investments in open-end investment companies, including money market funds, are valued at their latest net asset value.
Investments for which market quotations are not readily available, or that have quotations which management believes are not reflective of market value or reliable, are valued at fair value as determined in good faith under procedures approved by and under the general supervision of the Board. If a security or class of securities (such as foreign securities) is valued at fair value, such value is likely to be different from the quoted or published price for the security.
The determination of fair value often requires significant judgment. To determine fair value, management may use assumptions including but not limited to future cash flows and estimated risk premiums. Multiple inputs from various sources may be used to determine fair value.
GAAP requires disclosure regarding the inputs and valuation techniques used to measure fair value and any changes in valuation inputs or techniques. In addition, investments shall be disclosed by major category. This information is disclosed following the Fund's Portfolio of Investments.
Foreign Currency Transactions and Translations
The values of all assets and liabilities denominated in foreign currencies are generally translated into U.S. dollars at exchange rates determined at the close of the NYSE on any given day. Net realized and unrealized gains (losses) on foreign currency transactions and translations include gains (losses) arising from the fluctuation in exchange rates between trade and settlement dates on securities transactions, gains (losses) arising from the disposition of foreign currency and currency gains (losses) between the accrual and payment dates on dividends, interest income and foreign withholding taxes.
For financial statement purposes, the Fund does not distinguish that portion of gains (losses) on investments which is due to changes in foreign exchange rates from that which is due to changes in market prices of the investments. Such fluctuations are included with the net realized and unrealized gains (losses) on investments in the Statement of Operations.
Derivative Instruments
The Fund invests in certain derivative instruments, as detailed below, to meet its investment objectives. Derivatives are instruments whose values depend on, or are derived from, in whole or in part, the value of one or more securities, currencies, commodities, indices, or other assets or instruments. Derivatives may be used to increase investment flexibility (including to maintain cash reserves while maintaining desired exposure to certain assets), for risk management (hedging) purposes, to facilitate trading, to reduce transaction costs and to pursue higher investment returns. The Fund may also use derivative instruments to mitigate certain investment risks, such as foreign currency exchange rate risk, interest rate risk and credit risk. Derivatives may involve various risks, including the potential inability of the counterparty to fulfill its obligation under the terms of the contract, the potential for an illiquid secondary market (making it difficult for the Fund to sell, including at favorable prices) and the potential for market movements which may expose the Fund to gains or losses in excess of the amount shown in the Statement of Assets and Liabilities. The notional amounts of derivative instruments, if applicable, are not recorded in the financial statements.
A derivative instrument may suffer a marked-to-market loss if the value of the contract decreases due to an unfavorable change in the market rates or values of the underlying instrument. Losses can also occur if the counterparty does not perform under the contract. The Fund's risk of loss from counterparty credit risk on over-the-counter derivatives is generally limited to the aggregate unrealized gain netted against any collateral held by the Fund and the amount of any variation margin held by the counterparty. With exchange-traded or centrally cleared derivatives, there is reduced counterparty credit risk to the Fund since the exchange's clearinghouse, as counterparty to such instruments, guarantees against a possible default. The clearinghouse stands between the buyer and the seller of the contract; therefore, the counterparty credit risk is failure of the clearinghouse. However, credit risk still exists in exchange-traded or centrally cleared derivatives with
Annual Report 2016
26
COLUMBIA SELECT GLOBAL GROWTH FUND
NOTES TO FINANCIAL STATEMENTS (continued)
February 29, 2016
respect to initial and variation margin that is held in a broker's customer account. While brokers are required to segregate customer margin from their own assets, in the event that a broker becomes insolvent or goes into bankruptcy and at that time there is a shortfall in the aggregate amount of margin held by the broker for all its clients, U.S. bankruptcy laws will typically allocate that shortfall on a pro-rata basis across all the broker's customers (including the Fund), potentially resulting in losses to the Fund.
In order to better define its contractual rights and to secure rights that will help the Fund mitigate its counterparty risk, the Fund may enter into an International Swaps and Derivatives Association, Inc. Master Agreement (ISDA Master Agreement) or similar agreement with its derivatives contract counterparties. An ISDA Master Agreement is an agreement between the Fund and a counterparty that governs over-the-counter derivatives and forward foreign currency exchange contracts and typically contains, among other things, collateral posting terms and netting provisions in the event of a default and/or termination event. Under an ISDA Master Agreement, the Fund may, under certain circumstances, offset with the counterparty certain derivative instrument's payables and/or receivables with collateral held and/or posted and create one single net payment. The provisions of the ISDA Master Agreement typically permit a single net payment in the event of default (close-out netting) including the bankruptcy or insolvency of the counterparty. Note, however, that bankruptcy or insolvency laws of a particular jurisdiction may impose restrictions on or prohibitions against the right of offset in bankruptcy, insolvency or other events.
Collateral (margin) requirements differ by type of derivative. Margin requirements are established by the exchange or clearinghouse for exchange-traded and centrally cleared derivatives. Brokers can ask for margin in excess of the minimum in certain circumstances. Collateral terms are contract specific for over-the-counter derivatives. For over-the-counter derivatives traded under an ISDA Master Agreement, the collateral requirements are typically calculated by netting the marked-to-market amount for each transaction under such agreement and comparing that amount to the value of any variation margin currently pledged by the Fund and/or the counterparty. Generally, the amount of collateral due from or to a party has to exceed a minimum transfer amount threshold (e.g., $500,000) before a transfer has to be made. To the extent amounts due to the Fund from its counterparties are not fully collateralized, contractually or
otherwise, the Fund bears the risk of loss from counterparty nonperformance. The Fund attempts to mitigate counterparty risk by only entering into agreements with counterparties that it believes have the financial resources to honor their obligations and by monitoring the financial stability of those counterparties.
Certain ISDA Master Agreements allow counterparties to over-the-counter derivatives transactions to terminate derivatives contracts prior to maturity in the event the Fund's net asset value declines by a stated percentage over a specified time period or if the Fund fails to meet certain terms of the ISDA Master Agreement, which would cause the Fund to accelerate payment of any net liability owed to the counterparty. The Fund also has termination rights if the counterparty fails to meet certain terms of the ISDA Master Agreement. In addition to considering counterparty credit risk, the Fund would consider terminating the derivatives contracts based on whether termination would result in a net liability owed from the counterparty.
For financial reporting purposes, the Fund does not offset derivative assets and derivative liabilities that are subject to netting arrangements in the Statement of Assets and Liabilities.
Forward Foreign Currency Exchange Contracts
Forward foreign currency exchange contracts are over-the-counter agreements between two parties to buy and sell a currency at a set price on a future date. The Fund utilized forward foreign currency exchange contracts to hedge the currency exposure associated with some or all of the Fund's securities, to shift investment exposure from one currency to another, to shift U.S. dollar exposure to achieve a representative weighted mix of major currencies in its benchmark and/or to recover an underweight country exposure in its portfolio. These instruments may be used for other purposes in future periods.
The values of forward foreign currency exchange contracts fluctuate daily with changes in foreign currency exchange rates. Changes in the value of these contracts are recorded as unrealized appreciation or depreciation until the contract is exercised or has expired. The Fund will realize a gain or loss when the forward foreign currency exchange contract is closed or expires.
The use of forward foreign currency exchange contracts does not eliminate fluctuations in the prices of the Fund's portfolio securities. The risks of forward foreign currency exchange contracts include movement in the values of the foreign currencies relative to the U.S. dollar (or other
Annual Report 2016
27
COLUMBIA SELECT GLOBAL GROWTH FUND
NOTES TO FINANCIAL STATEMENTS (continued)
February 29, 2016
foreign currencies) and the possibility that counterparties will not complete their contractual obligations, which may be in excess of the amount reflected, if any, in the Statement of Assets and Liabilities.
Effects of Derivative Transactions in the Financial Statements
The following tables are intended to provide additional information about the effect of derivatives on the financial statements of the Fund, including: the fair value of derivatives by risk category and the location of those fair values in the Statement of Assets and Liabilities; and the impact of derivative transactions over the period in the Statement of Operations, including realized and unrealized gains (losses). The derivative instrument schedules following the Portfolio of Investments present additional information regarding derivative instruments outstanding at the end of the period, if any.
The following table is a summary of the fair value of derivative instruments (not considered to be hedging instruments for accounting disclosure purposes) at February 29, 2016:
Asset Derivatives | |
Risk Exposure
Category | | Statement of Assets and
Liabilities Location | | Fair Value ($) | |
Foreign exchange
risk | | Unrealized appreciation on
forward foreign currency
exchange contracts | | | 40,039
| | |
Liability Derivatives | |
Risk Exposure
Category | | Statement of Assets and
Liabilities Location | | Fair Value ($) | |
Foreign exchange
risk | | Unrealized depreciation on
forward foreign currency
exchange contracts | | | 68,282
| | |
The following table indicates the effect of derivative instruments (not considered to be hedging instruments for accounting disclosure purposes) in the Statement of Operations for the year ended February 29, 2016:
Amount of Realized Gain (Loss) on Derivatives Recognized in Income | |
Risk Exposure
Category | | Forward Foreign Currency
Exchange Contracts ($) | |
Foreign exchange risk | | | (9,536 | ) | |
Change in Unrealized Appreciation (Depreciation) on
Derivatives Recognized in Income | |
Risk Exposure
Category | | Forward Foreign Currency
Exchange Contracts ($) | |
Foreign exchange risk | | | (28,243 | ) | |
The following table provides a summary of the average outstanding volume by derivative instrument for the year ended February 29, 2016:
Derivative Instrument | | Average unrealized
appreciation($)* | | Average unrealized
depreciation($)* | |
Forward foreign currency
exchange contracts | | | 11,603 | | | | (43,045) | | |
*Based on the ending quarterly outstanding amounts for the year ended February 29, 2016.
Offsetting of Assets and Liabilities
The following table presents the Fund's gross and net amount of assets and liabilities available for offset under netting arrangements as well as any related collateral received or pledged by the Fund as of February 29, 2016:
| | | Citi ($) | |
Assets | |
Forward foreign currency exchange contracts | | | 40,039 | | |
Liabilities | |
Forward foreign currency exchange contracts | | | 68,282 | | |
Total Financial and Derivative Net Assets | | | (28,243 | ) | |
Total collateral received (pledged)(a) | | | — | | |
Net Amount(b) | | | (28,243 | ) | |
(a) In some instances, the actual collateral received and/or pledged may be more than the amount shown due to overcollateralization.
(b) Represents the net amount due from/(to) counterparties in the event of default.
Security Transactions
Security transactions are accounted for on the trade date. Cost is determined and gains (losses) are based upon the specific identification method for both financial statement and federal income tax purposes.
Income Recognition
Corporate actions and dividend income are generally recorded net of any non-reclaimable tax withholdings, on the ex-dividend date or upon receipt of ex-dividend notification in the case of certain foreign securities.
The Fund may receive distributions from holdings in equity securities, business development companies (BDCs), exchange-traded funds, other regulated investment companies (RICs), and real estate investment trusts (REITs), which report information on the tax character of their distributions annually. These distributions are allocated to dividend income, capital gain and return of capital based on actual information reported. Return of capital is recorded as a reduction of the cost basis of securities held. If the Fund no longer owns the applicable securities, return of capital is recorded as a realized gain.
Annual Report 2016
28
COLUMBIA SELECT GLOBAL GROWTH FUND
NOTES TO FINANCIAL STATEMENTS (continued)
February 29, 2016
With respect to REITs, to the extent actual information has not yet been reported, estimates for return of capital are made by the Fund's management. Management's estimates are subsequently adjusted when the actual character of the distributions is disclosed by the REITs, which could result in a proportionate change in return of capital to shareholders.
Awards from class action litigation are recorded as a reduction of cost basis if the Fund still owns the applicable securities on the payment date. If the Fund no longer owns the applicable securities, the proceeds are recorded as realized gains.
Expenses
General expenses of the Trust are allocated to the Fund and other funds of the Trust based upon relative net assets or other expense allocation methodologies determined by the nature of the expense. Expenses directly attributable to the Fund are charged to the Fund. Expenses directly attributable to a specific class of shares are charged to that share class.
Determination of Class Net Asset Value
All income, expenses (other than class-specific expenses, which are charged to that share class, as shown in the Statement of Operations) and realized and unrealized gains (losses) are allocated to each class of the Fund on a daily basis, based on the relative net assets of each class, for purposes of determining the net asset value of each class.
Federal Income Tax Status
The Fund intends to qualify each year as a regulated investment company under Subchapter M of the Internal Revenue Code, as amended, and will distribute substantially all of its taxable income (including net short-term capital gains), if any, for its tax year, and as such will not be subject to federal income taxes. In addition, the Fund intends to distribute in each calendar year substantially all of its net investment income, capital gains and certain other amounts, if any, such that the Fund should not be subject to federal excise tax. Therefore, no federal income or excise tax provision is recorded.
Foreign Taxes
The Fund may be subject to foreign taxes on income, gains on investments or currency repatriation, a portion of which may be recoverable. The Fund will accrue such taxes and recoveries, as applicable, based upon its current interpretation of tax rules and regulations that exist in the markets in which it invests.
Realized gains in certain countries may be subject to foreign taxes at the Fund level, based on statutory rates.
The Fund accrues for such foreign taxes on realized and unrealized gains at the appropriate rate for each jurisdiction, as applicable. The amount, if any, is disclosed as a liability on the Statement of Assets and Liabilities.
Distributions to Shareholders
Distributions from net investment income, if any, are declared and paid semi-annually. Net realized capital gains, if any, are distributed at least annually. Income distributions and capital gain distributions are determined in accordance with federal income tax regulations, which may differ from GAAP.
Guarantees and Indemnifications
Under the Trust's organizational documents and, in some cases, by contract, its officers and trustees are indemnified against certain liabilities arising out of the performance of their duties to the Trust or its funds. In addition, certain of the Fund's contracts with its service providers contain general indemnification clauses. The Fund's maximum exposure under these arrangements is unknown since the amount of any future claims that may be made against the Fund cannot be determined, and the Fund has no historical basis for predicting the likelihood of any such claims.
Recent Accounting Pronouncement
Fair Value Measurement (Topic 820), Disclosure for Investments in Certain Entities That Calculate Net Asset Value per Share (or Its Equivalent)
In May 2015, FASB issued Accounting Standards Update (ASU) No. 2015-07, Fair Value Measurement (Topic 820), Disclosure for Investments in Certain Entities That Calculate Net Asset Value per Share (or Its Equivalent). ASU No. 2015-07 changes the disclosure requirements for investments for which fair value is measured using the net asset value per share practical expedient. The disclosure requirements are effective for annual periods beginning after December 15, 2015 and interim periods within those fiscal years. At this time, management is evaluating the implications of this guidance and the impact it will have on the financial statement amounts and footnote disclosures, if any.
Note 3. Fees and Other Transactions with Affiliates
Management Fees
Effective July 1, 2015, the Fund entered into a Management Agreement with Columbia Management Investment Advisers, LLC (the Investment Manager), a wholly-owned subsidiary of Ameriprise Financial, Inc.
Annual Report 2016
29
COLUMBIA SELECT GLOBAL GROWTH FUND
NOTES TO FINANCIAL STATEMENTS (continued)
February 29, 2016
(Ameriprise Financial). Under the Management Agreement, the Investment Manager provides the Fund with investment research and advice, as well as administrative and accounting services. The management services fee is an annual fee that is equal to a percentage of the Fund's average daily net assets that declines from 0.87% to 0.67% as the Fund's net assets increase. The effective management services fee rate for the year ended February 29, 2016 was 0.87% of the Fund's average daily net assets.
Prior to July 1, 2015, the Fund paid the Investment Manager an annual fee for advisory services under an Investment Management Services Agreement and a separate annual fee for administrative and accounting services under an Administrative Services Agreement. For the period from March 1, 2015 through June 30, 2015, the investment advisory services fee paid to the Investment Manager was $162,765, and the administrative services fee paid to the Investment Manager was $16,483.
Subadvisory Agreement
Prior to November 20, 2015, The Investment Manager entered into a Subadvisory Agreement with Marsico Capital Management, LLC (Marsico) to serve as the subadviser to the Fund. The Investment Manager compensated Marsico to manage the investment of the Fund's assets. Effective November 20, 2015, Marsico no longer serves as the subadviser to the Fund and the Investment Manager has assumed the day-to-day portfolio management of the Fund.
Other Expenses
Other expenses are for, among other things, miscellaneous expenses of the Fund or the Board, including payments to Board Services Corp., a company providing limited administrative services to the Fund and the Board. That company's expenses include boardroom and office expense, employee compensation, employee health and retirement benefits, and certain other expenses. For the year ended February 29, 2016, other expenses paid by the Fund to this company were $1,365.
Compensation of Board Members
Board members, who are not officers or employees of the Investment Manager or Ameriprise Financial, are compensated for their services to the Fund as disclosed in the Statement of Operations. Under a Deferred Compensation Plan (the Plan), these Board members may elect to defer payment of up to 100% of their compensation. Deferred amounts are treated as though
equivalent dollar amounts had been invested in shares of certain funds managed by the Investment Manager. The Fund's liability for these amounts is adjusted for market value changes and remains in the Fund until distributed in accordance with the Plan. All amounts payable under the Plan constitute a general unsecured obligation of the Fund.
Transfer Agency Fees
Under a Transfer and Dividend Disbursing Agent Agreement, Columbia Management Investment Services Corp. (the Transfer Agent), an affiliate of the Investment Manager and a wholly-owned subsidiary of Ameriprise Financial, is responsible for providing transfer agency services to the Fund. The Transfer Agent has contracted with Boston Financial Data Services (BFDS) to serve as sub-transfer agent.
The Transfer Agent receives a monthly transfer agency fee based on the number or the average value of accounts, depending on the type of account. In addition, the Transfer Agent also receives sub-transfer agency fees based on a percentage of the average aggregate value of the Fund's shares maintained in omnibus accounts (other than omnibus accounts for which American Enterprise Investment Services Inc. is the broker of record or accounts where the beneficial shareholder is a customer of Ameriprise Financial Services, Inc., for which the Transfer Agent receives a per account fee). The Transfer Agent pays the fees of BFDS for services as sub-transfer agent and is not entitled to reimbursement for such fees from the Fund (with the exception of out-of-pocket fees).
The Transfer Agent also receives compensation from the Fund for various shareholder services and reimbursements for certain out-of-pocket fees. Total transfer agency fees for Class R5 shares are subject to an annual limitation of not more than 0.05% of the average daily net assets attributable to Class R5 shares.
For the year ended February 29, 2016, the Fund's effective transfer agency fee rates as a percentage of average daily net assets of each class were as follows:
Class A | | | 0.17 | % | |
Class C | | | 0.17 | | |
Class R | | | 0.17 | | |
Class R4 | | | 0.18 | | |
Class R5 | | | 0.05 | | |
Class Z | | | 0.18 | | |
An annual minimum account balance fee of $20 may apply to certain accounts with a value below the
Annual Report 2016
30
COLUMBIA SELECT GLOBAL GROWTH FUND
NOTES TO FINANCIAL STATEMENTS (continued)
February 29, 2016
applicable share class's initial minimum investment requirements to reduce the impact of small accounts on transfer agency fees. These minimum account balance fees are remitted to the Fund and recorded as part of expense reductions in the Statement of Operations. For the year ended February 29, 2016, no minimum account balance fees were charged by the Fund.
Distribution and Service Fees
The Fund has an agreement with Columbia Management Investment Distributors, Inc. (the Distributor), an affiliate of the Investment Manager and a wholly-owned subsidiary of Ameriprise Financial, for distribution and shareholder services. The Board has approved, and the Fund has adopted, distribution and shareholder service plans (the Plans) applicable to certain share classes, which set the distribution and service fees for the Fund. These fees are calculated daily and are intended to compensate the Distributor and/or eligible selling and/or servicing agents for selling shares of the Fund and providing services to investors.
Under the Plans, the Fund pays a monthly combined distribution and service fee to the Distributor at the maximum annual rate of 0.25% of the average daily net assets attributable to Class A shares of the Fund. Also under the Plans, the Fund pays a monthly service fee at the maximum annual rate of 0.25% of the average daily net assets attributable to Class C shares of the Fund and a monthly distribution fee at the maximum annual rate of 0.75% and 0.50% of the average daily net assets attributable to Class C and Class R shares of the Fund, respectively.
Sales Charges
Sales charges, including front-end charges and CDSCs, received by the Distributor for distributing Fund shares were $191,368 for Class A and $1,964 for Class C shares for the year ended February 29, 2016.
Expenses Waived/Reimbursed by the Investment Manager and its Affiliates
The Fund's expense ratio is subject to an expense reimbursement arrangement pursuant to which fees will be waived and/or expenses reimbursed (excluding certain fees and expenses described below), so that the Fund's net operating expenses, after giving effect to fees waived/expenses reimbursed and any balance credits and/or overdraft charges from the Fund's custodian, do
not exceed the following annual rates as a percentage of the class' average daily net assets:
| | | Contractual
Expense Cap
July 1, 2015
through
June 30, 2016 | | Contractual
Expense Cap
Prior to
July 1, 2015 | |
Class A | | | 1.46 | % | | | 1.64 | % | |
Class C | | | 2.21 | | | | 2.39 | | |
Class R | | | 1.71 | | | | 1.89 | | |
Class R4 | | | 1.21 | | | | 1.39 | | |
Class R5 | | | 1.13 | | | | 1.33 | | |
Class Z | | | 1.21 | | | | 1.39 | | |
The contractual agreement may be modified or amended only with approval from the Investment Manager, certain of its affiliates and the Fund. Under the arrangements, the following fees and expenses are excluded from the waiver/reimbursement commitment, and therefore will be paid by the Fund, if applicable: taxes (including foreign transaction taxes), expenses associated with investments in affiliated and non-affiliated pooled investment vehicles (including mutual funds and exchange-traded funds), transaction costs and brokerage commissions, costs related to any securities lending program, dividend and interest expenses associated with securities sold short, inverse floater program fees and expenses, transaction charges and interest on borrowed money, interest and extraordinary expenses.
Prior to July 1, 2015, the Fund's expense ratio was subject to a voluntary expense reimbursement arrangement pursuant to which fees were waived and/or expenses reimbursed (excluding certain fees and expenses immediately described above), so that the Fund's net operating expenses, after giving effect to fees waived/expenses reimbursed and any balance credits and/or overdraft charges from the Fund's custodian, did not exceed the annual rates of 1.49% for Class A, 2.24% for Class C, 1.74% for Class R, 1.24% for Class R4, 1.18% for Class R5 and 1.24% for Class Z.
Any fees waived and/or expenses reimbursed under the expense reimbursement arrangements described above are not recoverable by the Investment Manager or its affiliates in future periods.
Note 4. Federal Tax Information
The timing and character of income and capital gain distributions are determined in accordance with income tax regulations, which may differ from GAAP because of temporary or permanent book to tax differences.
Annual Report 2016
31
COLUMBIA SELECT GLOBAL GROWTH FUND
NOTES TO FINANCIAL STATEMENTS (continued)
February 29, 2016
At February 29, 2016, these differences are primarily due to differing treatment for deferral/reversal of wash sale losses, Trustees' deferred compensation, foreign currency transactions, net operating loss reclassification, late-year ordinary losses and derivative investments. To the extent these differences are permanent, reclassifications are made among the components of the Fund's net assets in the Statement of Assets and Liabilities. Temporary differences do not require reclassifications. In the Statement of Assets and Liabilities the following reclassifications were made:
Excess of distributions over net investment income | | $ | 484,611 | | |
Accumulated net realized gain | | | 5,406 | | |
Paid-in capital | | | (490,017 | ) | |
Net investment income (loss) and net realized gains (losses), as disclosed in the Statement of Operations, and net assets were not affected by this reclassification.
The tax character of distributions paid during the years indicated was as follows:
Year Ended | | February 29,
2016 | | February 28,
2015 | |
Ordinary income | | $ | — | | | $ | 1,608,339 | | |
Long-term capital gains | | | 1,255,971 | | | | 3,647,693 | | |
Total | | $ | 1,255,971 | | | $ | 5,256,032 | | |
Short-term capital gain distributions, if any, are considered ordinary income distributions for tax purposes.
At February 29, 2016, the components of distributable earnings on a tax basis were as follows:
Undistributed long-term capital gains | | $ | 3,852,236 | | |
Net unrealized depreciation | | | (8,904,683 | ) | |
At February 29, 2016, the cost of investments for federal income tax purposes was $70,220,221 and the aggregate gross unrealized appreciation and depreciation based on that cost was:
Unrealized appreciation | | $ | 1,748,830 | | |
Unrealized depreciation | | | (10,653,513 | ) | |
Net unrealized depreciation | | | (8,904,683 | ) | |
Under current tax rules, regulated investment companies can elect to treat certain late-year ordinary losses incurred and post-October capital losses (capital losses realized after October 31) as arising on the first day of the following taxable year. As of February 29, 2016, the Fund will elect to treat late-year ordinary losses of $186,390 as arising on March 1, 2016.
Management of the Fund has concluded that there are no significant uncertain tax positions in the Fund that would require recognition in the financial statements. However, management's conclusion may be subject to review and adjustment at a later date based on factors including, but not limited to, new tax laws, regulations, and administrative interpretations (including relevant court decisions). Generally, the Fund's federal tax returns for the prior three fiscal years remain subject to examination by the Internal Revenue Service.
Note 5. Portfolio Information
The cost of purchases and proceeds from sales of securities, excluding short-term investments and derivatives, if any, aggregated to $120,363,107 and $95,631,056, respectively, for the year ended February 29, 2016. The amount of purchase and sale activity impacts the portfolio turnover rate reported in the Financial Highlights.
Note 6. Affiliated Money Market Fund
The Fund invests in Columbia Short-Term Cash Fund, an affiliated money market fund established for the exclusive use by the Fund and other affiliated funds. The income earned by the Fund from such investments is included as Dividends — affiliated issuers in the Statement of Operations. As an investing fund, the Fund indirectly bears its proportionate share of the expenses of Columbia Short-Term Cash Fund.
Note 7. Line of Credit
The Fund has access to a revolving credit facility whereby the Fund may borrow for the temporary funding of shareholder redemptions or for other temporary or emergency purposes. Effective December 8, 2015, Citibank, N.A. and HSBC Bank USA, N.A. joined JPMorgan Chase Bank, N.A. (JPMorgan) as lead of a syndicate of banks under the credit facility, which is a collective agreement between the Fund and certain other funds managed by the Investment Manager, severally and not jointly, that permits collective borrowings up to $1 billion. Interest is charged to each participating fund based on its borrowings at a rate equal to the higher of (i) the overnight federal funds rate plus 1.00% or (ii) the one-month LIBOR rate plus 1.00%. Each borrowing under the credit facility matures no later than 60 days after the date of borrowing. The Fund also pays a commitment fee equal to its pro rata share of the amount of the credit facility at a rate of 0.15% per annum. The commitment fee is included in other expenses in the Statement of Operations. Prior to December 8, 2015, JPMorgan was
Annual Report 2016
32
COLUMBIA SELECT GLOBAL GROWTH FUND
NOTES TO FINANCIAL STATEMENTS (continued)
February 29, 2016
the sole lead bank under the credit facility agreement that permitted borrowings up to $550 million under the same terms and interest rates as described above with the exception of the commitment fee which was charged at a rate of 0.075% per annum.
The Fund had no borrowings during the year ended February 29, 2016.
Note 8. Significant Risks
Shareholder Concentration Risk
At February 29, 2016, affiliated shareholders of record owned 51.9% of the outstanding shares of the Fund in one or more accounts. Subscription and redemption activity by concentrated accounts may have a significant effect on the operations of the Fund. In the case of a large redemption, the Fund may be forced to sell investments at inopportune times, including its liquid or more liquid positions, resulting in Fund losses and the Fund holding a higher percentage of less liquid or illiquid securities. Large redemptions could result in decreased economies of scale and increased operating expenses for non-redeeming Fund shareholders.
Foreign Securities and Emerging Market Countries Risk
Investing in foreign securities may include certain risks and considerations not typically associated with investing in U.S. securities, such as fluctuating currency values and changing local and regional economic, political and social conditions, which may result in greater market volatility. In addition, certain foreign securities may not be as liquid as U.S. securities. Investing in emerging markets may accentuate these risks. These countries are also more likely to experience high levels of inflation, deflation or currency devaluation which could hurt their economies and securities markets. To the extent that the Fund concentrates its investment exposure to any one or a few specific countries, the Fund will be particularly susceptible to the various conditions, events or other factors impacting those countries and may, therefore, have a greater risk than that of a fund which is more geographically diversified.
Health Care Sector Risk
The Fund may be more susceptible to the particular risks that may affect companies in the health care sector than if it were invested in a wider variety of companies in unrelated sectors. Companies in the health care sector are subject to certain risks, including restrictions on government reimbursement for medical expenses,
government approval of medical products and services, competitive pricing pressures, and the rising cost of medical products and services (especially for companies dependent upon a relatively limited number of products or services). Performance of such companies may be affected by factors including, government regulation, obtaining and protecting patents (or the failure to do so), product liability and other similar litigation as well as product obsolescence.
Technology and Technology-related Investment Risk
The Fund may be more susceptible to the particular risks that may affect companies in the information technology sector, as well as other technology-related sectors (collectively, the technology sectors) than if it were invested in a wider variety of companies in unrelated sectors. Companies in the technology sectors are subject to certain risks, including the risk that new services, equipment or technologies will not be accepted by consumers and businesses or will become rapidly obsolete. Performance of such companies may be affected by factors including obtaining and protecting patents (or the failure to do so) and significant competitive pressures, including aggressive pricing of their products or services, new market entrants, competition for market share and short product cycles due to an accelerated rate of technological developments. Such competitive pressures may lead to limited earnings and/or falling profit margins. As a result, the value of their securities may fall or fail to rise. In addition, many technology sector companies have limited operating histories and prices of these companies' securities historically have been more volatile than other securities, especially over the short term.
Note 9. Subsequent Events
Management has evaluated the events and transactions that have occurred through the date the financial statements were issued and noted no items requiring adjustment of the financial statements or additional disclosure.
Note 10. Information Regarding Pending and Settled Legal Proceedings
In December 2005, without admitting or denying the allegations, American Express Financial Corporation (AEFC, which is now known as Ameriprise Financial, Inc. (Ameriprise Financial)) entered into settlement agreements with the Securities and Exchange Commission (SEC) and Minnesota Department of
Annual Report 2016
33
COLUMBIA SELECT GLOBAL GROWTH FUND
NOTES TO FINANCIAL STATEMENTS (continued)
February 29, 2016
Commerce (MDOC) related to market timing activities. As a result, AEFC was censured and ordered to cease and desist from committing or causing any violations of certain provisions of the Investment Advisers Act of 1940, the Investment Company Act of 1940, and various Minnesota laws. AEFC agreed to pay disgorgement of $10 million and civil money penalties of $7 million. AEFC also agreed to retain an independent distribution consultant to assist in developing a plan for distribution of all disgorgement and civil penalties ordered by the SEC in accordance with various undertakings detailed at http://www.sec.gov/litigation/admin/ia-2451.pdf. Ameriprise Financial and its affiliates have cooperated with the SEC and the MDOC in these legal proceedings, and have made regular reports to the Funds' Boards of Trustees.
Ameriprise Financial and certain of its affiliates have historically been involved in a number of legal, arbitration and regulatory proceedings, including routine litigation, class actions, and governmental actions, concerning matters arising in connection with the conduct of their business activities. Ameriprise Financial believes that the Funds are not currently the subject of, and that neither Ameriprise Financial nor any of its affiliates are the subject of, any pending legal, arbitration or regulatory proceedings that are likely to have a material adverse effect on the Funds or the ability of Ameriprise Financial or its affiliates to perform under their contracts with the Funds. Ameriprise Financial is required to make quarterly (10-Q), annual (10-K) and, as necessary, 8-K filings with the SEC on legal and regulatory matters that relate to Ameriprise Financial and its affiliates. Copies of these filings may be obtained by accessing the SEC website at www.sec.gov.
There can be no assurance that these matters, or the adverse publicity associated with them, will not result in increased fund redemptions, reduced sale of fund shares or other adverse consequences to the Funds. Further, although we believe proceedings are not likely to have a material adverse effect on the Funds or the ability of Ameriprise Financial or its affiliates to perform under their contracts with the Funds, these proceedings are subject to uncertainties and, as such, we are unable to estimate the possible loss or range of loss that may result. An adverse outcome in one or more of these proceedings could result in adverse judgments, settlements, fines, penalties or other relief that could have a material adverse effect on the consolidated financial condition or results of operations of Ameriprise Financial.
Annual Report 2016
34
COLUMBIA SELECT GLOBAL GROWTH FUND
REPORT OF INDEPENDENT REGISTERED PUBLIC ACCOUNTING FIRM
To the Trustees of Columbia Funds Series Trust and the Shareholders of
Columbia Select Global Growth Fund (formerly known as Columbia Marsico Global Fund)
In our opinion, the accompanying statement of assets and liabilities, including the portfolio of investments, and the related statements of operations and of changes in net assets and the financial highlights present fairly, in all material respects, the financial position of Columbia Select Global Growth Fund (formerly known as Columbia Marsico Global Fund) (the "Fund," a series of Columbia Funds Series Trust) at February 29, 2016, and the results of its operations, the changes in its net assets and the financial highlights for each of the periods indicated, in conformity with accounting principles generally accepted in the United States of America. These financial statements and financial highlights (hereafter referred to as "financial statements") are the responsibility of the Fund's management. Our responsibility is to express an opinion on these financial statements based on our audits. We conducted our audits of these financial statements in accordance with the standards of the Public Company Accounting Oversight Board (United States). Those standards require that we plan and perform the audit to obtain reasonable assurance about whether the financial statements are free of material misstatement. An audit includes examining, on a test basis, evidence supporting the amounts and disclosures in the financial statements, assessing the accounting principles used and significant estimates made by management, and evaluating the overall financial statement presentation. We believe that our audits, which included confirmation of securities at February 29, 2016 by correspondence with the custodian, brokers and transfer agent, and the application of alternative auditing procedures where such confirmations had not been received, provide a reasonable basis for our opinion.
PricewaterhouseCoopers LLP
Minneapolis, MN
April 21, 2016
Annual Report 2016
35
COLUMBIA SELECT GLOBAL GROWTH FUND
FEDERAL INCOME TAX INFORMATION
(Unaudited)
The Fund hereby designates the following tax attributes for the fiscal year ended February 29, 2016. Shareholders will be notified in early 2017 of the amounts for use in preparing 2016 income tax returns.
Tax Designations:
Capital Gain Dividend | | $ | 5,340,170 | | |
Capital Gain Dividend. The Fund designates as a capital gain dividend the amount reflected above, or if subsequently determined to be different, the net capital gain of such fiscal period.
Annual Report 2016
36
COLUMBIA SELECT GLOBAL GROWTH FUND
Shareholders elect the Board that oversees the Fund's operations. The Board appoints officers who are responsible for day-to-day business decisions based on policies set by the Board. The following table provides basic biographical information about the Fund's Trustees, including their principal occupations during the past five years, although specific titles for individuals may have varied over the period. Under current Board policy, members generally may serve through the end of the calendar year in which they reach either the mandatory retirement age established by the Board or the fifteenth anniversary of the first Board meeting they attended as a member of the Board.
Trustees
Independent Trustees
Name,
Address,
Year of Birth | | Position Held With
the Funds and Length of
Service | | Principal Occupation(s)
During the Past Five Years
and Other Relevant
Professional Experience | | Number of
Funds in the
Columbia
Funds Complex
Overseen | | Other Directorships
Held by Trustee
During the Past
Five Years | |
Kathleen Blatz
901 S. Marquette Ave.
Minneapolis, MN 55402
1954 | | Trustee since 1/06 for RiverSource Funds and since 6/11 for Nations Funds | | Attorney; specializing in arbitration and mediation; Chief Justice, Minnesota Supreme Court, 1998-2006; Associate Justice, Minnesota Supreme Court, 1996-1998; Fourth Judicial District Court Judge, Hennepin County, 1994-1996; Attorney in private practice and public service, 1984-1993; State Representative, Minnesota House of Representatives, 1979-1993, which included service on the Tax and Financial Institutions and Insurance Committees | | | 124 | | | Trustee, BlueCross BlueShield of Minnesota (Chair of the Business Development Committee) since 2009; Chair of the Robina Foundation since August 2013 | |
Edward J. Boudreau, Jr.
901 S. Marquette Ave.
Minneapolis, MN 55402
1944 | | Trustee since 6/11 for RiverSource Funds and since 1/05 for Nations Funds | | Managing Director, E.J. Boudreau & Associates (consulting) since 2000; FINRA Industry Arbitrator, 2002-present; Chairman and Chief Executive Officer, John Hancock Funds (asset management), Chairman and Interested Trustee for open-end and closed-end funds offered by John Hancock, 1989-2000; John Hancock Life Insurance Company, including SVP and Treasurer and SVP Information Technology, 1968-1988 | | | 122 | | | Former Trustee, Boston Museum of Science (Chair of Finance Committee), 1985-2013; former Trustee, BofA Funds Series Trust (11 funds), 2005-2011 | |
Pamela G. Carlton
901 S. Marquette Ave.
Minneapolis, MN 55402
1954 | | Trustee since 7/07 for RiverSource Funds and since 6/11 for Nations Funds | | President, Springboard-Partners in Cross Cultural Leadership (consulting company) since 2003; Managing Director of US Equity Research, JP Morgan Chase, 1999-2003; Director of US Equity Research, Chase Asset Management, 1996-1999; Co-Director Latin America Research, 1993-1996, COO Global Research, 1992-1996, Co-Director of US Research, 1991-1992, Investment Banker, Morgan Stanley, 1982-1991 | | | 124 | | | Trustee, New York Presbyterian Hospital Board (Executive Committee and Chair of Human Resources Committee) since 1996 | |
Annual Report 2016
37
COLUMBIA SELECT GLOBAL GROWTH FUND
TRUSTEES AND OFFICERS (continued)
Independent Trustees (continued)
Name,
Address,
Year of Birth | | Position Held With
the Funds and Length of
Service | | Principal Occupation(s)
During the Past Five Years
and Other Relevant
Professional Experience | | Number of
Funds in the
Columbia
Funds Complex
Overseen | | Other Directorships
Held by Trustee
During the Past
Five Years | |
William P. Carmichael
901 S. Marquette Ave.
Minneapolis, MN 55402
1943 | | Trustee since 6/11 for RiverSource Funds and since 2003 for Nations Funds; Chair of the Board from 1/14-11/15 | | Retired; Co-founder, The Succession Fund (provides exit strategies to owners of privately held companies), 1998-2007; Adjunct Professor of Finance, Kelley School of Business, Indiana University, 1993-2007; Senior Vice President, Sara Lee Corporation, 1991-1993; Senior Vice President and Chief Financial Officer, Beatrice Foods Company, 1984-1990; Vice President, Esmark, Inc., 1973-1984; Associate, Price Waterhouse, 1968-1972 | | | 124 | | | Director, The Finish Line (athletic shoes and apparel) since July 2003; Director, International Textile Corp. since 2012; Director, hhgregg since May, 2015; former Director, Cobra Electronics Corporation (electronic equipment manufacturer), 1994-August 2014; former Director, Spectrum Brands, Inc. (consumer products), 2002-2009; former Director, Simmons Company (bedding), 2004-2010; former Trustee, BofA Funds Series Trust (11 funds), 2009-2011; former Director, McMoRan Exploration Company (oil and gas exploration and development), 2010-2013 | |
Patricia M. Flynn
901 S. Marquette Ave.
Minneapolis, MN 55402
1950 | | Trustee since 11/04 for RiverSource Funds and since 6/11 for Nations Funds | | Trustee Professor of Economics and Management, Bentley University since 1976 (also teaches and conducts research on corporate governance); Dean, McCallum Graduate School of Business, Bentley University, 1992-2002 | | | 124 | | | Trustee, MA Taxpayers Foundation since 1997; Board of Governors, Innovation Institute, MA Technology Collaborative since 2010 | |
William A. Hawkins
901 S. Marquette Ave.
Minneapolis, MN 55402
1942 | | Chair of the Board since 11/15; Trustee since 6/11 for RiverSource Funds and since 1/05 for Nations Funds | | Managing Director, Overton Partners (financial consulting) since August 2010; President and Chief Executive Officer, California General Bank, N.A., January 2008-August 2010; Operation Hope, COO, 2004-2007; IndyMac Bancorp, President, CBG, 1999-2003; American General Bank, President, 1997-1999; Griffin Financial Services, CEO, 1981-1997; The Griffin Funds, CEO, 1992-1998 | | | 124 | | | Former Trustee, BofA Funds Series Trust (11 funds), 2009-2015 | |
R. Glenn Hilliard
901 S. Marquette Ave.
Minneapolis, MN 55402
1943 | | Trustee since 6/11 for RiverSource Funds and since 1/05 for Nations Funds | | Chairman and Chief Executive Officer, Hilliard Group LLC (investing and consulting) since April 2003; Non-Executive Director & Chairman, CNO Financial Group, Inc. (insurance), 2003-2011; Chair & CEO, ING Americas, 1996-2003 | | | 122 | | | Chairman, BofA Funds Series Trust (11 funds); former Director, CNO Financial Group, Inc. (insurance), 2003-2011 | |
Annual Report 2016
38
COLUMBIA SELECT GLOBAL GROWTH FUND
TRUSTEES AND OFFICERS (continued)
Independent Trustees (continued)
Name,
Address,
Year of Birth | | Position Held With
the Funds and Length of
Service | | Principal Occupation(s)
During the Past Five Years
and Other Relevant
Professional Experience | | Number of
Funds in the
Columbia
Funds Complex
Overseen | | Other Directorships
Held by Trustee
During the Past
Five Years | |
Catherine James Paglia
901 S. Marquette Ave.
Minneapolis, MN 55402
1952 | | Trustee since 11/04 for RiverSource Funds and since 6/11 for Nations Funds | | Director, Enterprise Asset Management, Inc. (private real estate and asset management company) since September 1998; Managing Director and Partner, Interlaken Capital, Inc., 1989-1997; Managing Director, Morgan Stanley, 1982-1989; Vice President, Investment Banking, 1980-1982, Associate, Investment Banking, 1976-1980, Dean Witter Reynolds, Inc. | | | 124 | | | Director, Valmont Industries, Inc. (irrigation systems manufacturer) since 2012; Trustee, Carleton College (on the Investment Committee); Trustee, Carnegie Endowment for International Peace (on the Investment Committee) | |
Leroy C. Richie
901 S. Marquette Ave.
Minneapolis, MN 55402
1941 | | Trustee since 2000 for Seligman Funds, since 11/08 for RiverSource Funds and since 6/11 for Nations Funds | | Counsel, Lewis & Munday, P.C. (law firm) since 2004; Vice President and General Counsel, Automotive Legal Affairs, Chrysler Corporation, 1993-1997 | | | 122 | | | Lead Outside Director, Infinity Resources, Inc. (oil and gas exploration and production) since 1994; Lead Outside Director, Digital Ally, Inc. (digital imaging) since September 2005; Trustee, Marygrove College (Chair of Finance Committee) since 2007; former Director, OGE Energy Corp. (energy and energy services), 2007-2014 | |
Minor M. Shaw
901 S. Marquette Ave.
Minneapolis, MN 55402
1947 | | Trustee since 6/11 for RiverSource Funds and since 2003 for Nations Funds | | President, Micco LLC (private investments) since 2011; President, Micco Corp. (family investment business), 1998-2011 | | | 124 | | | Director, Piedmont Natural Gas; Director, BlueCross BlueShield of South Carolina since April 2008; Chair of the Duke Endowment; Director, National Association of Corporate Directors, Carolinas Chapter since 2013; Chair of Greenville — Spartanburg Airport Commission; former Trustee, BofA Funds Series Trust (11 funds), 2003-2011 | |
Alison Taunton-Rigby
901 S. Marquette Ave.
Minneapolis, MN 55402
1944 | | Trustee since 11/02 for RiverSource Funds and since 6/11 for Nations Funds | | Managing Director, Forester Biotech (consulting), 2001-2003; Chief Executive Officer and Director, RiboNovix, Inc., (biotechnology), 2003-2010; President and Chief Executive Officer of CMT Inc., 2001-2003; Aquila Biopharmaceuticals Inc., 1996-2000; Cambridge Biotech Corporation, 1995-1996; Mitotix Inc., 1993-1994 | | | 124 | | | Director, Abt Associates (government contractor) since 2001; Director, Boston Children's Hospital since 2002; Director, Healthways, Inc. (health and well-being solutions) since 2005; Director, ICI Mutual Insurance Company since 2011 | |
Annual Report 2016
39
COLUMBIA SELECT GLOBAL GROWTH FUND
TRUSTEES AND OFFICERS (continued)
Interested Trustee Not Affiliated with Investment Manager*
Name,
Address,
Year of Birth | | Position Held With
Funds and Length of
Service | | Principal Occupation(s)
During Past Five Years
and Other Relevant
Professional Experience | | Number of
Funds in the
Fund Family
Overseen by
Board Member | | Other Present or Past
Directorships/
Trusteeships
(Within Past 5 Years) | |
Anthony M. Santomero
901 S. Marquette Ave.
Minneapolis, MN 55402
1946 | | Trustee since 6/11 for RiverSource Funds and since 1/08 for Nations Funds | | Richard K. Mellon Professor Emeritus of Finance, The Wharton School, University of Pennsylvania since 2002; Senior Advisor, McKinsey & Company (consulting), 2006-2008; President, Federal Reserve Bank of Philadelphia, 2000-2006; Professor of Finance, The Wharton School, University of Pennsylvania, 1972-2002 | | | 122 | | | Trustee, Penn Mutual Life Insurance Company since March 2008; Director, Renaissance Reinsurance Ltd. since May 2008; Director, Citigroup Inc. since 2009; Director, Citibank, N.A. since 2009; former Trustee, BofA Funds Series Trust (11 funds), 2008-2011 | |
* Dr. Santomero is not an affiliated person of the Investment Manager or Ameriprise Financial. However, he is currently deemed by the Funds to be an "interested person" (as defined in the 1940 Act) of the Funds because he serves as a Director of Citigroup Inc. and Citibank, N.A., companies that may directly or through subsidiaries and affiliates engage from time-to-time in brokerage execution, principal transactions and lending relationships with the Funds or accounts advised/managed by the Investment Manager.
Annual Report 2016
40
COLUMBIA SELECT GLOBAL GROWTH FUND
TRUSTEES AND OFFICERS (continued)
Interested Trustee Affiliated with Investment Manager*
Name,
Address,
Year of Birth | | Position Held With
the Funds and Length of
Service | | Principal Occupation(s)
During Past Five Years
and Other Relevant
Professional Experience | | Number of
Funds in the
Columbia
Funds Complex
Overseen | | Other Directorships
Held by Trustee
During the Past
Five Years | |
William F. Truscott
c/o Columbia Management Investment Advisers, LLC,
225 Franklin St.
Boston, MA 02110
1960 | | Trustee since 11/01 for RiverSource Funds and since 6/11 for Nations Funds; Senior Vice President since 2002 for RiverSource Funds and since 5/10 for Nations Funds | | Chairman of the Board and President, Columbia Management Investment Advisers, LLC since May 2010 and February 2012, respectively (previously President and Chief Investment Officer, 2001-April 2010); Chief Executive Officer, Global Asset Management, Ameriprise Financial, Inc. since September 2012 (previously Chief Executive Officer, U.S. Asset Management & President, Annuities, May 2010-September 2012 and President — U.S. Asset Management and Chief Investment Officer, 2005-April 2010); Director and Chief Executive Officer, Columbia Management Investment Distributors, Inc. since May 2010 and February 2012, respectively (previously Chairman of the Board and Chief Executive Officer, 2006-April 2010); Chairman of the Board and Chief Executive Officer, RiverSource Distributors, Inc. since 2006; Director, Threadneedle Asset Management Holdings, SARL since 2014; President and Chief Executive Officer, Ameriprise Certificate Company, 2006-August 2012. | | | 182 | | | Chairman of the Board, Columbia Management Investment Advisers, LLC since May 2010; Director, Columbia Management Investment Distributors, Inc. since May 2010; Former Director, Ameriprise Certificate Company, 2006-January 2013 | |
* Interested person (as defined under the 1940 Act) by reason of being an officer, director, security holder and/or employee of the Investment Manager or Ameriprise Financial.
The Statement of Additional Information has additional information about the Fund's Board members and is available, without charge, upon request by calling 800.345.6611; contacting your financial intermediary; or visiting columbiathreadneedle.com/us.
Annual Report 2016
41
COLUMBIA SELECT GLOBAL GROWTH FUND
TRUSTEES AND OFFICERS (continued)
The Board has appointed officers who are responsible for day-to-day business decisions based on policies it has established. The officers serve at the pleasure of the Board. The following table provides basic information about the Officers of the Fund, including principal occupations during the past five years, although their specific titles may have varied over the period. In addition to Mr. Truscott, who is Senior Vice President, the Fund's other officers are:
Fund Officers
Name,
Address and
Year of Birth | | Position and Year
First Appointed to
Position for any Fund
in the Columbia
Funds Complex or a
Predecessor Thereof | | Principal Occupation(s) During Past Five Years | |
Christopher O. Petersen
5228 Ameriprise
Financial Center
Minneapolis, MN 55474
Born 1970 | | President and Principal Executive Officer (2015) | | Vice President and Lead Chief Counsel, Ameriprise Financial, Inc. since January 2015 (previously, Vice President and Chief Counsel January 2010-December 2014; and Vice President and Group Counsel or Counsel 2004-January 2010); officer of Columbia Funds and affiliated funds since 2007. | |
Michael G. Clarke
225 Franklin Street
Boston, MA 02110
Born 1969 | | Treasurer (2011), Chief Financial Officer (2009) and Chief Accounting Officer (2015) | | Vice President — Mutual Fund Administration, Columbia Management Investment Advisers, LLC, since May 2010; Managing Director of Fund Administration, Columbia Management Advisors, LLC, September 2004-April 2010; senior officer of Columbia Funds and affiliated funds since 2002. | |
Paul B. Goucher
100 Park Avenue
New York, NY 10017
Born 1968 | | Senior Vice President (2011), Chief Legal Officer (2015) and Assistant Secretary (2008) | | Vice President and Lead Chief Counsel, Ameriprise Financial, Inc. since November 2008 and January 2013, respectively (previously Chief Counsel, January 2010-January 2013 and Group Counsel, November 2008-January 2010). | |
Thomas P. McGuire
225 Franklin Street
Boston, MA 02110
Born 1972 | | Senior Vice President and Chief Compliance Officer (2012) | | Vice President — Asset Management Compliance, Ameriprise Financial, Inc., since May 2010; Chief Compliance Officer, Ameriprise Certificate Company since September 2010; Compliance Executive, Bank of America, 2005-April 2010. | |
Colin Moore
225 Franklin Street
Boston, MA 02110
Born 1958 | | Senior Vice President (2010) | | Executive Vice President and Global Chief Investment Officer, Ameriprise Financial, Inc., since July 2013; Director and Global Chief Investment Officer, Columbia Management Investment Advisers, LLC since May 2010; Manager, Managing Director and Chief Investment Officer, Columbia Management Advisors, LLC, 2007-April 2010. | |
Michael E. DeFao
225 Franklin Street
Boston, MA 02110
Born 1968 | | Vice President (2011) and Assistant Secretary (2010) | | Vice President and Chief Counsel, Ameriprise Financial, Inc. since May 2010; Associate General Counsel, Bank of America, 2005-April 2010. | |
Amy Johnson
5228 Ameriprise
Financial Center
Minneapolis, MN 55474
Born 1965 | | Vice President (2006) | | Managing Director and Chief Operating Officer, Columbia Management Investment Advisers, LLC since May 2010 (previously Chief Administrative Officer, 2009-April 2010, and Vice President — Asset Management and Trust Company Services, 2006-2009). | |
Lyn Kephart-Strong
5228 Ameriprise
Financial Center
Minneapolis, MN 55474
Born 1960 | | Vice President (2015) | | President, Columbia Management Investment Services Corp. since October 2014; Vice President & Resolution Officer, Ameriprise Trust Company since August 2009; President, RiverSource Service Corporation 2004-2010. | |
Ryan C. Larrenaga
225 Franklin Street
Boston, MA 02110
Born 1970 | | Vice President and Secretary (2015) | | Vice President and Group Counsel, Ameriprise Financial, Inc. since August 2011 (previously, Counsel from May 2010 to August 2011); Assistant General Counsel, Bank of America, 2005-April 2010; officer of Columbia Funds and affiliated funds since 2005. | |
Annual Report 2016
42
COLUMBIA SELECT GLOBAL GROWTH FUND
IMPORTANT INFORMATION ABOUT THIS REPORT
Each fund mails one shareholder report to each shareholder address. If you would like more than one report, please call shareholder services at 800.345.6611 and additional reports will be sent to you.
The policy of the Board is to vote the proxies of the companies in which each fund holds investments consistent with the procedures as stated in the Statement of Additional Information (SAI). You may obtain a copy of the SAI without charge by calling 800.345.6611; contacting your financial intermediary; visiting columbiathreadneedle.com/us; or searching the website of the Securities and Exchange Commission (SEC) at sec.gov. Information regarding how each fund voted proxies relating to portfolio securities is filed with the SEC by August 31st for the most recent 12-month period ending June 30th of that year, and is available without charge by visiting columbiathreadneedle.com/us, or searching the website of the SEC at sec.gov.
Each fund files a complete schedule of portfolio holdings with the SEC for the first and third quarters of each fiscal year on Form N-Q. Each fund's Form N-Q is available on the SEC's website at sec.gov and may be reviewed and copied at the SEC's Public Reference Room in Washington, D.C. Information on the operation of the Public Reference Room may be obtained by calling 800.SEC.0330. Each fund's complete schedule of portfolio holdings, as filed on Form N-Q, can also be obtained without charge, upon request, by calling 800.345.6611.
Annual Report 2016
43
Columbia Select Global Growth Fund
P.O. Box 8081
Boston, MA 02266-8081

This information is for use with concurrent or prior delivery of a fund prospectus. Please read and consider the investment objectives, risks, charges and expenses for any fund carefully before investing. For a prospectus and summary prospectus, which contains this and other important information about the Fund, go to columbiathreadneedle.com/us. The Fund is distributed by Columbia Management Investment Distributors, Inc., member FINRA, and managed by Columbia Management Investment Advisers, LLC.
Columbia Threadneedle Investments (Columbia Threadneedle) is the global brand name of the Columbia and Threadneedle group of companies.
All rights reserved. Columbia Management Investment Distributors, Inc., 225 Franklin Street, Boston, MA 02110-2804
© 2016 Columbia Management Investment Advisers, LLC.
columbiathreadneedle.com/us
ANN187_02_F01_(04/16)

ANNUAL REPORT
February 29, 2016

COLUMBIA SELECT LARGE CAP EQUITY FUND

ABOUT COLUMBIA THREADNEEDLE INVESTMENTS
Columbia Threadneedle Investments is a leading global asset management group that provides a broad range of actively managed investment strategies and solutions for individual, institutional and corporate clients around the world.
With more than 2,000 people, including over 450 investment professionals based in North America, Europe and Asia, we manage $472 billion* of assets across developed and emerging market equities, fixed income, asset allocation solutions and alternatives. We are the 13th largest manager of long-term mutual fund assets in the U.S.** and the 4th largest manager of retail funds in the U.K.***
Our priority is the investment success of our clients. We aim to deliver the investment outcomes they expect through an investment approach that is team-based, performance-driven and risk-aware. Our culture is dynamic and interactive. By sharing our insights across asset classes and geographies, we generate richer perspectives on global, regional and local investment landscapes. The ability to exchange and debate investment ideas in a collaborative environment enriches our teams' investment processes. More importantly, it results in better informed investment decisions for our clients.
Columbia funds are distributed by Columbia Management Investment Distributors, Inc., member FINRA, and managed by Columbia Management Investment Advisers, LLC.
Columbia Threadneedle Investments (Columbia Threadneedle) is the global brand name of the Columbia and Threadneedle group of companies.
* In U.S. dollars as of December 31, 2015. Source: Ameriprise Q4 Earnings Release. Includes all assets managed by entities in the Columbia and Threadneedle groups of companies. Contact us for more current data.
** Source: ICI as of December 31, 2015 for Columbia Management Investment Advisers, LLC.
*** Source: Investment Association as of September 2015 for Threadneedle Asset Management Limited.
© 2016 Columbia Management Investment Advisers, LLC. All rights reserved.
Not part of the shareholder report
Investment strategies to help meet investor needs
We are committed to helping investors navigate financial challenges to reach their desired outcomes. The possibilities are endless.
Your success is our priority.
Retire comfortably
Fund college or higher education
Leave a legacy
Generate an appropriate stream of income in retirement
Traditional approaches to income may no longer be adequate — and they may no longer provide the diversification benefits they once did. Investors need to rethink how they generate retirement income.
Worried about running out of income? You are not alone.
Navigate a changing interest rate environment
Even in today's challenging interest rate environment, it's still possible to navigate markets and achieve your goals.
Make investment choices designed specifically for this market environment.
Maximize after-tax returns
In an environment where what you keep is more important than what you earn, municipal bonds can help mitigate higher taxes while providing attractive yields compared to other investment options.
You've worked too hard building your wealth to lose it to taxes.
Grow assets to achieve financial goals
Finding growth opportunities in today's complex market environment requires strong research capabilities, creative thinking and a disciplined approach.
Do your investments deliver the portfolio growth you need?
Ease the impact of volatile markets
With increasing concerns about market volatility, investors should consider diversifying their portfolios with non-traditional holdings.
Interested in turning volatility into opportunity?
To find out more, contact your financial professional, call 800.426.3750 or visit columbiathreadneedle.com/us
Not part of the shareholder report
 Dear Shareholder,
Today's investors are typically focused on outcomes, like living a certain retirement lifestyle, paying for college education or building a legacy. But in today's complex global investment landscape, even simple goals are not easily achieved.
At Columbia Threadneedle Investments, we aspire to help satisfy five core needs of today's investors:
n Generate an appropriate stream of income in retirement
Traditional approaches to generating income may not provide the diversification benefits they once did, and they may actually introduce unwanted risk in today's market. To seek to improve your potential to live comfortably long term, we endeavor to pursue investments that explore less traveled paths to income.
n Navigate a changing interest rate environment
Today's uncertain market environment includes the prospect of a rise in interest rates. Blending traditional investments with non-traditional or alternative products may help protect your wealth during periods of volatility. We can attempt to help strengthen your portfolio with agile products designed to take on the market's ups and downs.
n Maximize after-tax returns
In an environment where what you keep may be more important than what you earn, municipal bonds can help mitigate high tax burdens while providing potentially attractive yields. Our state and federal tax-exempt products are aimed at helping investors manage risk, minimize the fluctuation of capital and grow wealth on a more tax-efficient basis.
n Grow assets to achieve financial goals
We believe that finding and protecting growth comes from a disciplined security selection process designed to create excess return. Our goal is to provide investment solutions built to help you face today's market challenges and grow your assets at each crossroad of your journey.
n Ease the impact of volatile markets
Despite a bull market run that has benefited many investors over the past several years, it's important to remember the lessons of 2008 and the value that a well-diversified portfolio may provide through times of market volatility. We are here to help you hold onto the savings you have worked tirelessly to amass, and to provide you the best opportunity to maintain your standard of living regardless of market conditions.
Find out today how we can help you confidently invest to realize your dreams. Please visit us at blog.columbiathreadneedleus.com/our-best-ideas to learn more about our unique investment solutions.
The world is constantly changing, but our priority remains the same: to help you secure your finances, meet your goals and achieve success. Thank you for your continued investment with us.
Sincerely,

Christopher O. Petersen
President, Columbia Funds
Investors should consider the investment objectives, risks, charges and expenses of a mutual fund carefully before investing. For a free prospectus and summary prospectus, which contains this and other important information about a fund, visit columbiathreadneedle.com/us. The prospectus should be read carefully before investing.
Columbia Funds are distributed by Columbia Management Investment Distributors, Inc., member FINRA, and managed by Columbia Management Investment Advisers, LLC.
© 2016 Columbia Management Investment Advisers, LLC. All rights reserved.
COLUMBIA SELECT LARGE CAP EQUITY FUND
Performance Overview | | | 2 | | |
Manager Discussion of Fund Performance | | | 4 | | |
Understanding Your Fund's Expenses | | | 6 | | |
Portfolio of Investments | | | 7 | | |
Statement of Assets and Liabilities | | | 12 | | |
Statement of Operations | | | 14 | | |
Statement of Changes in Net Assets | | | 15 | | |
Financial Highlights | | | 17 | | |
Notes to Financial Statements | | | 24 | | |
Report of Independent Registered Public Accounting Firm | | | 31 | | |
Federal Income Tax Information | | | 32 | | |
Trustees and Officers | | | 33 | | |
Important Information About This Report | | | 39 | | |
Fund Investment Manager
Columbia Management Investment
Advisers, LLC
225 Franklin Street
Boston, MA 02110
Fund Distributor
Columbia Management Investment
Distributors, Inc.
225 Franklin Street
Boston, MA 02110
Fund Transfer Agent
Columbia Management Investment
Services Corp.
P.O. Box 8081
Boston, MA 02266-8081
For more information about any of the funds, please visit columbiathreadneedle.com/us or call 800.345.6611. Customer Service Representatives are available to answer your questions Monday through Friday from 8 a.m. to 7 p.m. Eastern time.
The views expressed in this report reflect the current views of the respective parties. These views are not guarantees of future performance and involve certain risks, uncertainties and assumptions that are difficult to predict, so actual outcomes and results may differ significantly from the views expressed. These views are subject to change at any time based upon economic, market or other conditions and the respective parties disclaim any responsibility to update such views. These views may not be relied on as investment advice and, because investment decisions for a Columbia fund are based on numerous factors, may not be relied on as an indication of trading intent on behalf of any particular Columbia fund. References to specific securities should not be construed as a recommendation or investment advice.
COLUMBIA SELECT LARGE CAP EQUITY FUND
Performance Summary
n Columbia Select Large Cap Equity Fund (the Fund) Class A shares returned -5.38% excluding sales charges for the 12-month period that ended February 29, 2016.
n The Fund outperformed its benchmark, the S&P 500 Index, which returned -6.19% for the same period.
n Stock selection in a difficult market environment enabled the Fund to outperform its benchmark.
Average Annual Total Returns (%) (for period ended February 29, 2016)
| | | Inception | | 1 Year | | 5 Years | | 10 Years | |
Class A | | 08/02/99 | | | | | | | | | | | | | |
Excluding sales charges | | | | | | | -5.38 | | | | 9.35 | | | | 6.13 | | |
Including sales charges | | | | | | | -10.79 | | | | 8.06 | | | | 5.51 | | |
Class B | | 08/02/99 | | | | | | | | | | | | | |
Excluding sales charges | | | | | | | -6.04 | | | | 8.54 | | | | 5.34 | | |
Including sales charges | | | | | | | -10.23 | | | | 8.32 | | | | 5.34 | | |
Class C | | 08/02/99 | | | | | | | | | | | | | |
Excluding sales charges | | | | | | | -6.05 | | | | 8.53 | | | | 5.33 | | |
Including sales charges | | | | | | | -6.89 | | | | 8.53 | | | | 5.33 | | |
Class I* | | 09/27/10 | | | -4.95 | | | | 9.79 | | | | 6.49 | | |
Class R5* | | 11/08/12 | | | -5.05 | | | | 9.69 | | | | 6.43 | | |
Class W* | | 09/27/10 | | | -5.36 | | | | 9.38 | | | | 6.16 | | |
Class Z | | 10/02/98 | | | -5.09 | | | | 9.63 | | | | 6.39 | | |
S&P 500 Index | | | | | | | -6.19 | | | | 10.13 | | | | 6.44 | | |
Returns for Class A are shown with and without the maximum initial sales charge of 5.75%. Returns for Class B are shown with and without the applicable contingent deferred sales charge (CDSC) of 5.00% in the first year, declining to 1.00% in the sixth year and eliminated thereafter. Returns for Class C are shown with and without the 1.00% CDSC for the first year only. The Fund's other classes are not subject to sales charges and have limited eligibility. Please see the Fund's prospectus for details. Performance for different share classes will vary based on differences in sales charges and fees associated with each class. All results shown assume reinvestment of distributions during the period. Returns do not reflect the deduction of taxes that a shareholder may pay on Fund distributions or on the redemption of Fund shares. Performance results reflect the effect of any fee waivers or reimbursements of Fund expenses by Columbia Management Investment Advisers, LLC and/or any of its affiliates. Absent these fee waivers or expense reimbursement arrangements, performance results would have been lower.
The performance information shown represents past performance and is not a guarantee of future results. The investment return and principal value of your investment will fluctuate so that your shares, when redeemed, may be worth more or less than their original cost. Current performance may be lower or higher than the performance information shown. You may obtain performance information current to the most recent month-end by contacting your financial intermediary, visiting columbiathreadneedle.com/us or calling 800.345.6611.
*The returns shown for periods prior to the share class inception date (including returns for the Life of the Fund, if shown, which are since Fund inception) include the returns of the Fund's oldest share class. These returns are adjusted to reflect any higher class-related operating expenses of the newer share classes, as applicable. Please visit columbiathreadneedle.com/us/investment-products/mutual-funds/appended-performance for more information.
The S&P 500 Index, an unmanaged index, measures the performance of 500 widely held, large-capitalization U.S. stocks and is frequently used as a general measure of market performance.
Indices are not available for investment, are not professionally managed and do not reflect sales charges, fees, brokerage commissions, taxes or other expenses of investing. Securities in the Fund may not match those in an index.
Annual Report 2016
2
COLUMBIA SELECT LARGE CAP EQUITY FUND
PERFORMANCE OVERVIEW (continued)
Performance of a Hypothetical $10,000 Investment (March 1, 2006 – February 29, 2016)
The chart above shows the change in value of a hypothetical $10,000 investment in Class A shares of Columbia Select Large Cap Equity Fund during the stated time period, and does not reflect the deduction of taxes that a shareholder may pay on Fund distributions or on the redemption of Fund shares.
Annual Report 2016
3
COLUMBIA SELECT LARGE CAP EQUITY FUND
MANAGER DISCUSSION OF FUND PERFORMANCE
Portfolio Management
Peter Santoro, CFA
Melda Mergen, CFA, CAIA
Morningstar Style BoxTM
The Morningstar Style BoxTM is based on a fund's portfolio holdings. For equity funds, the vertical axis shows the market capitalization of the stocks owned, and the horizontal axis shows investment style (value, blend, or growth). Information shown is based on the most recent data provided by Morningstar.
© 2016 Morningstar, Inc. All rights reserved. The Morningstar information contained herein: (1) is proprietary to Morningstar and/or its content providers; (2) may not be copied or distributed; and (3) is not warranted to be accurate, complete or timely. Neither Morningstar nor its content providers are responsible for any damages or losses arising from any use of this information.
Top Ten Holdings (%)
(at February 29, 2016) | |
Microsoft Corp. | | | 4.2 | | |
Exxon Mobil Corp. | | | 3.0 | | |
Philip Morris International, Inc. | | | 2.9 | | |
JPMorgan Chase & Co. | | | 2.9 | | |
Home Depot, Inc. (The) | | | 2.8 | | |
Alphabet, Inc., Class C | | | 2.6 | | |
CVS Health Corp. | | | 2.6 | | |
PepsiCo, Inc. | | | 2.5 | | |
Berkshire Hathaway, Inc.,
Class B | | | 2.5 | | |
Comcast Corp., Class A | | | 2.5 | | |
Percentages indicated are based upon total investments (excluding Money Market Funds).
For further detail about these holdings, please refer to the section entitled "Portfolio of Investments."
Fund holdings are as of the date given, are subject to change at any time, and are not recommendations to buy or sell any security.
At February 29, 2016, approximately 43.9% of the Fund's shares were owned in the aggregate by affiliated funds-of-funds managed by Columbia Management Investment Advisers, LLC (the Investment Manager). As a result of asset allocation decisions by the Investment Manager, it is possible that the Fund may experience relatively large purchases or redemptions from affiliated funds-of-funds. The Investment Manager seeks to minimize the impact of these transactions by structuring them over a reasonable period of time. The Fund may experience increased expenses as it buys and sells securities as a result of purchases or redemptions by affiliated funds-of-funds.
For the 12-month period that ended February 29, 2016, the Fund's Class A shares returned -5.38% excluding sales charges. The Fund outperformed its benchmark, the S&P 500 Index, which returned -6.19% for the same period. Stock selection in a difficult market environment enabled the Fund to outperform its benchmark.
Mounting Global Pressures Weighed on Markets
Around the world, investors turned cautious over the 12-month period that ended February 29, 2016, as lackluster economic growth, contentious geopolitical conflicts and a shift in U.S. monetary policy weighed on confidence. Subpar global economic growth continued for a fourth straight year, with China's slowdown heading the list of disappointments. Conflicts in the Middle East and terrorism, both at home and abroad, heightened security fears. Plummeting oil prices and a rising dollar rounded the list of mounting pressures. A widening trade deficit also took a significant bite out of growth.
Despite these setbacks, the U.S. economy continued to expand for the seventh consecutive year. U.S. labor markets recovered and consumer spending strengthened. The housing market inched forward, although sales slipped near the end of the period as new industry regulation led to longer closing periods. Manufacturing activity softened, putting a damper on growth.
Modest stock market gains in the first half of the period were wiped out in the second half. The S&P 500 Index, a broad measure of U.S. stock market performance, returned -6.19%, including dividends. Large-cap stocks held up better than mid- and small-cap stocks, and growth stocks outperformed value stocks.
In December 2015, the Federal Reserve (the Fed) raised the target range of its benchmark interest rate by a quarter of a point, ending a lengthy debate about whether the economy was strong enough to withstand higher borrowing costs. Mixed economic signals early in 2016 put additional rate hikes on hold — at least for now.
Contributors and Detractors
Stock selection in the consumer staples sector produced strong results for the Fund, led by Tyson Foods, Altria Group and Phillip Morris International. Tyson Foods consistently outperformed expectations, delivering productivity gains associated with the company's integration of Hillshire Brands, which it acquired in 2014. The company also has benefited from the consumer shift to more protein-based diets. Lower
Annual Report 2016
4
COLUMBIA SELECT LARGE CAP EQUITY FUND
MANAGER DISCUSSION OF FUND PERFORMANCE (continued)
grain prices resulted in lower material costs, which helped boost earnings. Altria Group and Phillip Morris International appealed to investors looking for a bond-proxy in a low-rate environment. Both are high-yielding names. Altria Group and Phillip Morris International kept costs under control and benefited from pricing gains and innovations that led to market share gains. Altria Group had an added benefit: it owns more than 25% of SABMiller, the world's second largest brewer of beer. SABMiller received a takeover bid from Anheuser Busch InBev, which bolstered Altria Group's gains.
In the financials sector, positions in two real estate investment trusts (REITs) contributed solid returns for the period. Public Storage, a storage REIT, used its sizeable market share to raise prices. American Tower, which owns and operates communication towers for wireless and broadcast companies, has been the beneficiary of increased data usage among consumers. In the information technology sector, Microsoft, Alphabet (formerly Google) and Facebook were strong performers. A substantial position in Microsoft aided returns, as investors rewarded the company's healthy balance sheet, solid cash flow and adaptation to new technologies under the leadership of its relatively new CEO. At Google, a new CFO increased transparency by breaking up business lines and operations under the new Alphabet holding company, making it easier for investors to analyze the company. Both Google and Facebook have been clear beneficiaries of a shift from traditional to digital advertising.
In a difficult period for stock markets around the world, the gains from these positions were not enough to offset losses, especially in the weak-performing energy sector. Kinder Morgan, a pipeline company, lost ground as investors took a dim view of the company's added leverage. It accessed the capital markets to meet its growth targets. We sold the stock. Also in energy, BP, an integrated gas and oil company, and Anadarko Petroleum, an American petroleum and natural gas exploration and production company, were hit hard by falling commodity prices. In the consumer discretionary sector, a position in DISH Network disappointed. The company's basic satellite broadcasting business has been struggling and investors lost patience waiting for the company to monetize the considerable wireless spectrum it owns. In the construction and engineering segment of the industrials sector, Quanta Services lost ground as contracts that the company expected to have signed were delayed, and it lowered earnings estimates dramatically — and somewhat unexpectedly. We exited the position.
The Fund aims to deliver long-term capital growth by investing in both growth and value companies that are believed to demonstrate some form of innovation, that are re-structuring or streamlining operations, that have powerful free cash flow generation, that have strong or improving balance sheets and that are committed to returning capital in the form of increasing dividend payouts and share buybacks. We remain comfortable with this approach in any market environment.
Portfolio Breakdown (%)
(at February 29, 2016) | |
Common Stocks | | | 92.8 | | |
Convertible Preferred Stocks | | | 4.1 | | |
Money Market Funds | | | 3.1 | | |
Total | | | 100.0 | | |
Percentages indicated are based upon total investments. The Fund's portfolio composition is subject to change.
Equity Sector Breakdown (%)
(at February 29, 2016) | |
Consumer Discretionary | | | 12.5 | | |
Consumer Staples | | | 11.6 | | |
Energy | | | 7.4 | | |
Financials | | | 16.7 | | |
Health Care | | | 13.9 | | |
Industrials | | | 11.9 | | |
Information Technology | | | 21.1 | | |
Materials | | | 1.5 | | |
Utilities | | | 3.4 | | |
Total | | | 100.0 | | |
Percentages indicated are based upon total equity investments. The Fund's portfolio composition is subject to change.
Investment Risks
Market risk may affect a single issuer, sector of the economy, industry or the market as a whole. Growth securities, at times, may not perform as well as value securities or the stock market in general and may be out of favor with investors. Value securities may be unprofitable if the market fails to recognize their intrinsic worth or the portfolio manager misgauged that worth. Foreign investments subject the Fund to risks, including political, economic, market, social and others within a particular country, as well as to currency instabilities and less stringent financial and accounting standards generally applicable to U.S. issuers. Investments in a limited number of companies or sectors, subject the Fund to greater risk of loss. The Fund may invest significantly in issuers within a particular sector, which may be negatively affected by market, economic or other conditions, making the Fund more vulnerable to unfavorable developments in the sector. Investing in derivatives is a specialized activity that involves special risks, which may result in significant losses. See the Fund's prospectus for information on these and other risks.
Annual Report 2016
5
COLUMBIA SELECT LARGE CAP EQUITY FUND
UNDERSTANDING YOUR FUND'S EXPENSES
(Unaudited)
As an investor, you incur two types of costs. There are transaction costs, which generally include sales charges on purchases and may include redemption fees. There are also ongoing costs, which generally include management fees, distribution and/or service fees, and other fund expenses. The following information is intended to help you understand your ongoing costs (in dollars) of investing in the Fund and to help you compare these costs with the ongoing costs of investing in other mutual funds.
Analyzing Your Fund's Expenses
To illustrate these ongoing costs, we have provided examples and calculated the expenses paid by investors in each share class of the Fund during the period. The actual and hypothetical information in the table is based on an initial investment of $1,000 at the beginning of the period indicated and held for the entire period. Expense information is calculated two ways and each method provides you with different information. The amount listed in the "Actual" column is calculated using the Fund's actual operating expenses and total return for the period. You may use the Actual information, together with the amount invested, to estimate the expenses that you paid over the period. Simply divide your account value by $1,000 (for example, an $8,600 account value divided by $1,000 = 8.6), then multiply the results by the expenses paid during the period under the "Actual" column. The amount listed in the "Hypothetical" column assumes a 5% annual rate of return before expenses (which is not the Fund's actual return) and then applies the Fund's actual expense ratio for the period to the hypothetical return. You should not use the hypothetical account values and expenses to estimate either your actual account balance at the end of the period or the expenses you paid during the period. See "Compare With Other Funds" below for details on how to use the hypothetical data.
Compare With Other Funds
Since all mutual funds are required to include the same hypothetical calculations about expenses in shareholder reports, you can use this information to compare the ongoing cost of investing in the Fund with other funds. To do so, compare the hypothetical example with the 5% hypothetical examples that appear in the shareholder reports of other funds. As you compare hypothetical examples of other funds, it is important to note that hypothetical examples are meant to highlight the ongoing costs of investing in a fund only and do not reflect any transaction costs, such as sales charges, or redemption or exchange fees. Therefore, the hypothetical calculations are useful in comparing ongoing costs only, and will not help you determine the relative total costs of owning different funds. If transaction costs were included in these calculations, your costs would be higher.
September 1, 2015 – February 29, 2016
| | | Account Value at the Beginning
of the Period ($) | | Account Value at the End of the
Period ($) | | Expenses Paid During the
Period ($) | | Fund's Annualized
Expense Ratio (%) | |
| | | Actual | | Hypothetical | | Actual | | Hypothetical | | Actual | | Hypothetical | | Actual | |
Class A | | | 1,000.00 | | | | 1,000.00 | | | | 985.30 | | | | 1,019.00 | | | | 5.82 | | | | 5.92 | | | | 1.18 | | |
Class B | | | 1,000.00 | | | | 1,000.00 | | | | 982.40 | | | | 1,015.27 | | | | 9.51 | | | | 9.67 | | | | 1.93 | | |
Class C | | | 1,000.00 | | | | 1,000.00 | | | | 981.40 | | | | 1,015.27 | | | | 9.51 | | | | 9.67 | | | | 1.93 | | |
Class I | | | 1,000.00 | | | | 1,000.00 | | | | 988.50 | | | | 1,020.98 | | | | 3.86 | | | | 3.92 | | | | 0.78 | | |
Class R5 | | | 1,000.00 | | | | 1,000.00 | | | | 987.50 | | | | 1,020.74 | | | | 4.10 | | | | 4.17 | | | | 0.83 | | |
Class W | | | 1,000.00 | | | | 1,000.00 | | | | 986.20 | | | | 1,019.00 | | | | 5.83 | | | | 5.92 | | | | 1.18 | | |
Class Z | | | 1,000.00 | | | | 1,000.00 | | | | 987.30 | | | | 1,020.24 | | | | 4.60 | | | | 4.67 | | | | 0.93 | | |
Expenses paid during the period are equal to the annualized expense ratio for each class as indicated above, multiplied by the average account value over the period and then multiplied by the number of days in the Fund's most recent fiscal half year and divided by 366.
Expenses do not include fees and expenses incurred indirectly by the Fund from its investment in underlying funds, including affiliated and non-affiliated pooled investment vehicles, such as mutual funds and exchange-traded funds.
Had Columbia Management Investment Advisers, LLC and/or certain of its affiliates not waived/reimbursed certain fees and expenses, account value at the end of the period would have been reduced.
Annual Report 2016
6
COLUMBIA SELECT LARGE CAP EQUITY FUND
PORTFOLIO OF INVESTMENTS
February 29, 2016
(Percentages represent value of investments compared to net assets)
Common Stocks 93.0%
Issuer | | Shares | | Value ($) | |
CONSUMER DISCRETIONARY 12.2% | |
Internet & Catalog Retail 2.4% | |
Amazon.com, Inc.(a) | | | 21,000 | | | | 11,602,920 | | |
Media 3.5% | |
Comcast Corp., Class A | | | 207,644 | | | | 11,987,288 | | |
DISH Network Corp., Class A(a) | | | 112,530 | | | | 5,303,539 | | |
Total | | | | | 17,290,827 | | |
Specialty Retail 4.9% | |
Foot Locker, Inc. | | | 39,390 | | | | 2,461,875 | | |
Home Depot, Inc. (The) | | | 109,034 | | | | 13,533,300 | | |
TJX Companies, Inc. (The) | | | 110,983 | | | | 8,223,841 | | |
Total | | | | | 24,219,016 | | |
Textiles, Apparel & Luxury Goods 1.4% | |
Coach, Inc. | | | 168,750 | | | | 6,571,125 | | |
Total Consumer Discretionary | | | | | 59,683,888 | | |
CONSUMER STAPLES 9.7% | |
Beverages 2.5% | |
PepsiCo, Inc. | | | 123,890 | | | | 12,118,920 | | |
Food & Staples Retailing 2.5% | |
CVS Health Corp. | | | 125,344 | | | | 12,179,676 | | |
Tobacco 4.7% | |
Altria Group, Inc. | | | 151,222 | | | | 9,310,739 | | |
Philip Morris International, Inc. | | | 150,513 | | | | 13,701,198 | | |
Total | | | | | 23,011,937 | | |
Total Consumer Staples | | | | | 47,310,533 | | |
ENERGY 6.1% | |
Energy Equipment & Services 1.1% | |
Schlumberger Ltd. | | | 73,881 | | | | 5,298,745 | | |
Oil, Gas & Consumable Fuels 5.0% | |
| BP PLC, ADR | | | 166,070 | | | | 4,830,976 | | |
EOG Resources, Inc. | | | 85,840 | | | | 5,557,282 | | |
Exxon Mobil Corp. | | | 179,240 | | | | 14,366,086 | | |
Total | | | | | 24,754,344 | | |
Total Energy | | | | | 30,053,089 | | |
FINANCIALS 16.2% | |
Banks 4.6% | |
Citigroup, Inc. | | | 234,400 | | | | 9,106,440 | | |
JPMorgan Chase & Co. | | | 242,733 | | | | 13,665,868 | | |
Total | | | | | 22,772,308 | | |
Common Stocks (continued)
Issuer | | Shares | | Value ($) | |
Capital Markets 4.3% | |
Bank of New York Mellon Corp. (The) | | | 231,470 | | | | 8,191,723 | | |
BlackRock, Inc. | | | 24,488 | | | | 7,639,277 | | |
Invesco Ltd. | | | 198,950 | | | | 5,319,923 | | |
Total | | | | | 21,150,923 | | |
Diversified Financial Services 2.5% | |
Berkshire Hathaway, Inc., Class B(a) | | | 90,276 | | | | 12,112,331 | | |
Real Estate Investment Trusts (REITs) 4.8% | |
American Tower Corp. | | | 76,510 | | | | 7,054,222 | | |
AvalonBay Communities, Inc. | | | 40,110 | | | | 6,884,480 | | |
Public Storage | | | 24,955 | | | | 6,226,023 | | |
Simon Property Group, Inc. | | | 18,154 | | | | 3,444,359 | | |
Total | | | | | 23,609,084 | | |
Total Financials | | | | | 79,644,646 | | |
HEALTH CARE 12.1% | |
Biotechnology 3.1% | |
Alexion Pharmaceuticals, Inc.(a) | | | 25,721 | | | | 3,621,517 | | |
Biogen, Inc.(a) | | | 11,950 | | | | 3,100,069 | | |
BioMarin Pharmaceutical, Inc.(a) | | | 17,030 | | | | 1,394,246 | | |
Celgene Corp.(a) | | | 44,390 | | | | 4,475,843 | | |
Vertex Pharmaceuticals, Inc.(a) | | | 29,545 | | | | 2,525,802 | | |
Total | | | | | 15,117,477 | | |
Health Care Equipment & Supplies 2.2% | |
Medtronic PLC | | | 135,312 | | | | 10,471,796 | | |
Health Care Providers & Services 3.7% | |
Aetna, Inc. | | | 58,766 | | | | 6,383,751 | | |
Express Scripts Holding Co.(a) | | | 77,706 | | | | 5,468,948 | | |
Laboratory Corp. of America Holdings(a) | | | 58,407 | | | | 6,415,425 | | |
Total | | | | | 18,268,124 | | |
Life Sciences Tools & Services 1.8% | |
Thermo Fisher Scientific, Inc. | | | 69,667 | | | | 9,000,280 | | |
Pharmaceuticals 1.3% | |
Bristol-Myers Squibb Co. | | | 103,186 | | | | 6,390,309 | | |
Total Health Care | | | | | 59,247,986 | | |
INDUSTRIALS 11.5% | |
Aerospace & Defense 5.8% | |
Honeywell International, Inc. | | | 71,040 | | | | 7,199,904 | | |
Lockheed Martin Corp. | | | 33,742 | | | | 7,281,186 | | |
The accompanying Notes to Financial Statements are an integral part of this statement.
Annual Report 2016
7
COLUMBIA SELECT LARGE CAP EQUITY FUND
PORTFOLIO OF INVESTMENTS (continued)
February 29, 2016
Common Stocks (continued)
Issuer | | Shares | | Value ($) | |
Northrop Grumman Corp. | | | 33,320 | | | | 6,404,770 | | |
United Technologies Corp. | | | 75,780 | | | | 7,321,864 | | |
Total | | | | | 28,207,724 | | |
Air Freight & Logistics 1.9% | |
United Parcel Service, Inc., Class B | | | 94,830 | | | | 9,155,836 | | |
Airlines 1.5% | |
Delta Air Lines, Inc. | | | 157,680 | | | | 7,606,483 | | |
Industrial Conglomerates 1.1% | |
Carlisle Companies, Inc. | | | 61,260 | | | | 5,523,202 | | |
Machinery 1.2% | |
Xylem, Inc. | | | 161,150 | | | | 6,028,622 | | |
Total Industrials | | | | | 56,521,867 | | |
INFORMATION TECHNOLOGY 20.5% | |
Communications Equipment 3.0% | |
Cisco Systems, Inc. | | | 362,670 | | | | 9,494,700 | | |
Palo Alto Networks, Inc.(a) | | | 34,840 | | | | 5,044,484 | | |
Total | | | | | 14,539,184 | | |
Internet Software & Services 6.6% | |
Alibaba Group Holding Ltd., ADR(a) | | | 23,620 | | | | 1,625,292 | | |
Alphabet, Inc., Class A(a) | | | 9,164 | | | | 6,572,604 | | |
Alphabet, Inc., Class C(a) | | | 18,051 | | | | 12,595,446 | | |
Facebook, Inc., Class A(a) | | | 108,070 | | | | 11,554,845 | | |
Total | | | | | 32,348,187 | | |
IT Services 1.6% | |
MasterCard, Inc., Class A | | | 92,913 | | | | 8,075,998 | | |
Semiconductors & Semiconductor Equipment 1.4% | |
Lam Research Corp. | | | 95,920 | | | | 7,030,936 | | |
Software 6.3% | |
Electronic Arts, Inc.(a) | | | 93,324 | | | | 5,995,133 | | |
Microsoft Corp. | | | 390,443 | | | | 19,865,740 | | |
Red Hat, Inc.(a) | | | 74,300 | | | | 4,855,505 | | |
Total | | | | | 30,716,378 | | |
Technology Hardware, Storage & Peripherals 1.6% | |
Apple, Inc. | | | 82,727 | | | | 7,998,874 | | |
Total Information Technology | | | | | 100,709,557 | | |
MATERIALS 1.4% | |
Chemicals 1.4% | |
Eastman Chemical Co. | | | 108,740 | | | | 6,975,671 | | |
Total Materials | | | | | 6,975,671 | | |
Common Stocks (continued)
Issuer | | Shares | | Value ($) | |
UTILITIES 3.3% | |
Electric Utilities 1.3% | |
Edison International | | | 91,750 | | | | 6,253,680 | | |
Multi-Utilities 2.0% | |
PG&E Corp. | | | 170,877 | | | | 9,693,852 | | |
Total Utilities | | | | | 15,947,532 | | |
Total Common Stocks
(Cost: $419,703,151) | | | | | 456,094,769 | | |
Convertible Preferred Stocks 4.1%
CONSUMER STAPLES 1.6% | |
Food Products 1.6% | |
Tyson Foods, Inc., 4.750% | | | 108,000 | | | | 7,786,800 | | |
Total Consumer Staples | | | | | 7,786,800 | | |
ENERGY 1.0% | |
Oil, Gas & Consumable Fuels 1.0% | |
Hess Corp., 8.000% | | | 90,000 | | | | 5,011,200 | | |
Total Energy | | | | | 5,011,200 | | |
HEALTH CARE 1.5% | |
Pharmaceuticals 1.5% | |
Allergan PLC, 5.500% | | | 7,400 | | | | 7,148,252 | | |
Total Health Care | | | | | 7,148,252 | | |
Total Convertible Preferred Stocks
(Cost: $18,561,380) | | | | | 19,946,252 | | |
Money Market Funds 3.1%
| | | Shares | | Value ($) | |
Columbia Short-Term Cash Fund,
0.420%(b)(c) | | | 15,435,397 | | | | 15,435,397 | | |
Total Money Market Funds
(Cost: $15,435,397) | | | | | 15,435,397 | | |
Total Investments
(Cost: $453,699,928) | | | | | 491,476,418 | | |
Other Assets & Liabilities, Net | | | | | (1,188,249 | ) | |
Net Assets | | | | | 490,288,169 | | |
The accompanying Notes to Financial Statements are an integral part of this statement.
Annual Report 2016
8
COLUMBIA SELECT LARGE CAP EQUITY FUND
PORTFOLIO OF INVESTMENTS (continued)
February 29, 2016
Notes to Portfolio of Investments
(a) Non-income producing investment.
(b) The rate shown is the seven-day current annualized yield at February 29, 2016.
(c) As defined in the Investment Company Act of 1940, an affiliated company is one in which the Fund owns 5% or more of the company's outstanding voting securities, or a company which is under common ownership or control with the Fund. Holdings and transactions in these affiliated companies during the year ended February 29, 2016 are as follows:
Issuer | | Beginning
Cost ($) | | Purchase
Cost ($) | | Proceeds
From Sales ($) | | Ending
Cost ($) | | Dividends —
Affiliated
Issuers ($) | | Value ($) | |
Columbia Short-Term Cash Fund | | | 13,232,791 | | | | 252,003,944 | | | | (249,801,338 | ) | | | 15,435,397 | | | | 27,438 | | | | 15,435,397 | | |
Abbreviation Legend
ADR American Depositary Receipt
Fair Value Measurements
The Fund categorizes its fair value measurements according to a three-level hierarchy that maximizes the use of observable inputs and minimizes the use of unobservable inputs by prioritizing that the most observable input be used when available. Observable inputs are those that market participants would use in pricing an investment based on market data obtained from sources independent of the reporting entity. Unobservable inputs are those that reflect the Fund's assumptions about the information market participants would use in pricing an investment. An investment's level within the fair value hierarchy is based on the lowest level of any input that is deemed significant to the asset's or liability's fair value measurement. The input levels are not necessarily an indication of the risk or liquidity associated with investments at that level. For example, certain U.S. government securities are generally high quality and liquid, however, they are reflected as Level 2 because the inputs used to determine fair value may not always be quoted prices in an active market.
Fair value inputs are summarized in the three broad levels listed below:
> Level 1 — Valuations based on quoted prices for investments in active markets that the Fund has the ability to access at the measurement date (including NAV for open-end mutual funds). Valuation adjustments are not applied to Level 1 investments.
> Level 2 — Valuations based on other significant observable inputs (including quoted prices for similar securities, interest rates, prepayment speeds, credit risks, etc.).
> Level 3 — Valuations based on significant unobservable inputs (including the Fund's own assumptions and judgment in determining the fair value of investments).
Inputs that are used in determining fair value of an investment may include price information, credit data, volatility statistics, and other factors. These inputs can be either observable or unobservable. The availability of observable inputs can vary between investments, and is affected by various factors such as the type of investment, and the volume and level of activity for that investment or similar investments in the marketplace. The inputs will be considered by the Investment Manager, along with any other relevant factors in the calculation of an investment's fair value. The Fund uses prices and inputs that are current as of the measurement date, which may include periods of market dislocations. During these periods, the availability of prices and inputs may be reduced for many investments. This condition could cause an investment to be reclassified between the various levels within the hierarchy.
Investments falling into the Level 3 category are primarily supported by quoted prices from brokers and dealers participating in the market for those investments. However, these may be classified as Level 3 investments due to lack of market transparency and corroboration to support these quoted prices. Additionally, valuation models may be used as the pricing source for any remaining investments classified as Level 3. These models may rely on one or more significant unobservable inputs and/or significant assumptions by the Investment Manager. Inputs used in valuations may include, but are not limited to, financial statement analysis, capital account balances, discount rates and estimated cash flows, and comparable company data.
Under the direction of the Fund's Board of Trustees (the Board), the Investment Manager's Valuation Committee (the Committee) is responsible for overseeing the valuation procedures approved by the Board. The Committee consists of voting and non-voting members from various groups within the Investment Manager's organization, including operations and accounting, trading and investments, compliance, risk management and legal.
The accompanying Notes to Financial Statements are an integral part of this statement.
Annual Report 2016
9
COLUMBIA SELECT LARGE CAP EQUITY FUND
PORTFOLIO OF INVESTMENTS (continued)
February 29, 2016
Fair Value Measurements (continued)
The Committee meets at least monthly to review and approve valuation matters, which may include a description of specific valuation determinations, data regarding pricing information received from approved pricing vendors and brokers and the results of Board-approved valuation control policies and procedures (the Policies). The Policies address, among other things, instances when market quotations are or are not readily available, including recommendations of third party pricing vendors and a determination of appropriate pricing methodologies; events that require specific valuation determinations and assessment of fair value techniques; securities with a potential for stale pricing, including those that are illiquid, restricted, or in default; and the effectiveness of third party pricing vendors, including periodic reviews of vendors. The Committee meets more frequently, as needed, to discuss additional valuation matters, which may include the need to review back-testing results, review time-sensitive information or approve related valuation actions. The Committee reports to the Board, with members of the Committee meeting with the Board at each of its regularly scheduled meetings to discuss valuation matters and actions during the period, similar to those described earlier.
For investments categorized as Level 3, the Committee monitors information similar to that described above, which may include: (i) data specific to the issuer or comparable issuers, (ii) general market or specific sector news and (iii) quoted prices and specific or similar security transactions. The Committee considers this data and any changes from prior periods in order to assess the reasonableness of observable and unobservable inputs, any assumptions or internal models used to value those securities and changes in fair value. This data is also used to corroborate, when available, information received from approved pricing vendors and brokers. Various factors impact the frequency of monitoring this information (which may occur as often as daily). However, the Committee may determine that changes to inputs, assumptions and models are not required as a result of the monitoring procedures performed.
The following table is a summary of the inputs used to value the Fund's investments at February 29, 2016:
| | | Level 1
Quoted Prices in Active
Markets for Identical
Assets ($) | | Level 2
Other Significant
Observable Inputs ($) | | Level 3
Significant
Unobservable Inputs ($) | | Total ($) | |
Investments | |
Common Stocks | |
Consumer Discretionary | | | 59,683,888 | | | | — | | | | — | | | | 59,683,888 | | |
Consumer Staples | | | 47,310,533 | | | | — | | | | — | | | | 47,310,533 | | |
Energy | | | 30,053,089 | | | | — | | | | — | | | | 30,053,089 | | |
Financials | | | 79,644,646 | | | | — | | | | — | | | | 79,644,646 | | |
Health Care | | | 59,247,986 | | | | — | | | | — | | | | 59,247,986 | | |
Industrials | | | 56,521,867 | | | | — | | | | — | | | | 56,521,867 | | |
Information Technology | | | 100,709,557 | | | | — | | | | — | | | | 100,709,557 | | |
Materials | | | 6,975,671 | | | | — | | | | — | | | | 6,975,671 | | |
Utilities | | | 15,947,532 | | | | — | | | | — | | | | 15,947,532 | | |
Total Common Stocks | | | 456,094,769 | | | | — | | | | — | | | | 456,094,769 | | |
Convertible Preferred Stocks | |
Consumer Staples | | | 7,786,800 | | | | — | | | | — | | | | 7,786,800 | | |
Energy | | | 5,011,200 | | | | — | | | | — | | | | 5,011,200 | | |
Health Care | | | 7,148,252 | | | | — | | | | — | | | | 7,148,252 | | |
Total Convertible Preferred Stocks | | | 19,946,252 | | | | — | | | | — | | | | 19,946,252 | | |
Money Market Funds | | | — | | | | 15,435,397 | | | | — | | | | 15,435,397 | | |
Total Investments | | | 476,041,021 | | | | 15,435,397 | | | | — | | | | 491,476,418 | | |
See the Portfolio of Investments for all investment classifications not indicated in the table.
The Fund's assets assigned to the Level 2 input category are valued based upon utilizing observable market inputs, in which a security's value is determined through reference to prices and information from market transactions for similar or identical assets and/or fund per share market values which are not considered publicly available.
Financial assets were transferred from Level 1 to Level 2 as the market for these assets is not considered publicly available. Fund per share market values were obtained using observable market inputs.
The accompanying Notes to Financial Statements are an integral part of this statement.
Annual Report 2016
10
COLUMBIA SELECT LARGE CAP EQUITY FUND
PORTFOLIO OF INVESTMENTS (continued)
February 29, 2016
Fair Value Measurements (continued)
The following table shows transfers between Level 1 and Level 2 of the fair value hierarchy:
Transfers In | | Transfers Out | |
| Level 1 ($) | | Level 2 ($) | | Level 1 ($) | | Level 2 ($) | |
| | — | | | | 13,232,791 | | | | 13,232,791 | | | | — | | |
Transfers between Level 1 and Level 2 are determined based on the fair value at the beginning of the period for security positions held throughout the period.
There were no transfers of financial assets between Levels 2 and 3 during the period.
The accompanying Notes to Financial Statements are an integral part of this statement.
Annual Report 2016
11
COLUMBIA SELECT LARGE CAP EQUITY FUND
STATEMENT OF ASSETS AND LIABILITIES
February 29, 2016
Assets | |
Investments, at value | |
Unaffiliated issuers (identified cost $438,264,531) | | $ | 476,041,021 | | |
Affiliated issuers (identified cost $15,435,397) | | | 15,435,397 | | |
Total investments (identified cost $453,699,928) | | | 491,476,418 | | |
Receivable for: | |
Investments sold | | | 8,603,136 | | |
Capital shares sold | | | 44,200 | | |
Regulatory settlements (Note 6) | | | 387,115 | | |
Dividends | | | 972,187 | | |
Expense reimbursement due from Investment Manager | | | 1,703 | | |
Prepaid expenses | | | 1,917 | | |
Trustees' deferred compensation plan | | | 9,785 | | |
Total assets | | | 501,496,461 | | |
Liabilities | |
Payable for: | |
Investments purchased | | | 10,252,645 | | |
Capital shares purchased | | | 698,196 | | |
Investment management fees | | | 31,242 | | |
Distribution and/or service fees | | | 2,891 | | |
Transfer agent fees | | | 43,370 | | |
Compensation of board members | | | 132,685 | | |
Other expenses | | | 37,478 | | |
Trustees' deferred compensation plan | | | 9,785 | | |
Total liabilities | | | 11,208,292 | | |
Net assets applicable to outstanding capital stock | | $ | 490,288,169 | | |
Represented by | |
Paid-in capital | | $ | 455,252,776 | | |
Undistributed net investment income | | | 261,666 | | |
Accumulated net realized loss | | | (3,002,763 | ) | |
Unrealized appreciation (depreciation) on: | |
Investments | | | 37,776,490 | | |
Total — representing net assets applicable to outstanding capital stock | | $ | 490,288,169 | | |
The accompanying Notes to Financial Statements are an integral part of this statement.
Annual Report 2016
12
COLUMBIA SELECT LARGE CAP EQUITY FUND
STATEMENT OF ASSETS AND LIABILITIES (continued)
February 29, 2016
Class A | |
Net assets | | $ | 119,928,262 | | |
Shares outstanding | | | 11,048,839 | | |
Net asset value per share | | $ | 10.85 | | |
Maximum offering price per share(a) | | $ | 11.51 | | |
Class B | |
Net assets | | $ | 197,042 | | |
Shares outstanding | | | 19,545 | | |
Net asset value per share | | $ | 10.08 | | |
Class C | |
Net assets | | $ | 4,739,428 | | |
Shares outstanding | | | 470,486 | | |
Net asset value per share | | $ | 10.07 | | |
Class I | |
Net assets | | $ | 215,503,915 | | |
Shares outstanding | | | 19,978,470 | | |
Net asset value per share | | $ | 10.79 | | |
Class R5 | |
Net assets | | $ | 152,805 | | |
Shares outstanding | | | 13,823 | | |
Net asset value per share | | $ | 11.05 | | |
Class W | |
Net assets | | $ | 2,052 | | |
Shares outstanding | | | 189 | | |
Net asset value per share(b) | | $ | 10.85 | | |
Class Z | |
Net assets | | $ | 149,764,665 | | |
Shares outstanding | | | 13,895,000 | | |
Net asset value per share | | $ | 10.78 | | |
(a) The maximum offering price per share is calculated by dividing the net asset value per share by 1.0 minus the maximum sales charge of 5.75%.
(b) Net asset value per share rounds to this amount due to fractional shares outstanding.
The accompanying Notes to Financial Statements are an integral part of this statement.
Annual Report 2016
13
COLUMBIA SELECT LARGE CAP EQUITY FUND
STATEMENT OF OPERATIONS
Year Ended February 29, 2016
Net investment income | |
Income: | |
Dividends — unaffiliated issuers | | $ | 9,140,773 | | |
Dividends — affiliated issuers | | | 27,438 | | |
Foreign taxes withheld | | | (17,085 | ) | |
Total income | | | 9,151,126 | | |
Expenses: | |
Investment management fees | | | 3,985,877 | | |
Distribution and/or service fees | |
Class A | | | 331,296 | | |
Class B | | | 2,856 | | |
Class C | | | 53,597 | | |
Class W | | | 6 | | |
Transfer agent fees | |
Class A | | | 260,111 | | |
Class B | | | 562 | | |
Class C | | | 10,530 | | |
Class R5 | | | 74 | | |
Class W | | | 4 | | |
Class Z | | | 362,752 | | |
Compensation of board members | | | 9,558 | | |
Custodian fees | | | 9,035 | | |
Printing and postage fees | | | 43,047 | | |
Registration fees | | | 74,876 | | |
Audit fees | | | 23,573 | | |
Legal fees | | | 9,523 | | |
Other | | | 19,415 | | |
Total expenses | | | 5,196,692 | | |
Fees waived or expenses reimbursed by Investment Manager and its affiliates | | | (275,109 | ) | |
Expense reductions | | | (2,278 | ) | |
Total net expenses | | | 4,919,305 | | |
Net investment income | | | 4,231,821 | | |
Realized and unrealized gain (loss) — net | |
Net realized gain (loss) on: | |
Investments | | | 3,774,299 | | |
Net realized gain | | | 3,774,299 | | |
Net change in unrealized appreciation (depreciation) on: | |
Investments | | | (36,117,272 | ) | |
Net change in unrealized depreciation | | | (36,117,272 | ) | |
Net realized and unrealized loss | | | (32,342,973 | ) | |
Net decrease in net assets from operations | | $ | (28,111,152 | ) | |
The accompanying Notes to Financial Statements are an integral part of this statement.
Annual Report 2016
14
COLUMBIA SELECT LARGE CAP EQUITY FUND
STATEMENT OF CHANGES IN NET ASSETS
| | | Year Ended
February 29,
2016 | | Year Ended
February 28,
2015 | |
Operations | |
Net investment income | | $ | 4,231,821 | | | $ | 9,755,468 | | |
Net realized gain | | | 3,774,299 | | | | 83,744,865 | | |
Net change in unrealized depreciation | | | (36,117,272 | ) | | | (25,198,870 | ) | |
Net increase (decrease) in net assets resulting from operations | | | (28,111,152 | ) | | | 68,301,463 | | |
Distributions to shareholders | |
Net investment income | |
Class A | | | (2,157,840 | ) | | | (1,007,247 | ) | |
Class B | | | (2,831 | ) | | | (319 | ) | |
Class C | | | (58,616 | ) | | | (4,534 | ) | |
Class I | | | (3,806,332 | ) | | | (1,503,373 | ) | |
Class R5 | | | (2,735 | ) | | | (2,007 | ) | |
Class W | | | (38 | ) | | | (19 | ) | |
Class Z | | | (3,520,854 | ) | | | (2,231,957 | ) | |
Net realized gains | |
Class A | | | (13,244,121 | ) | | | (18,823,467 | ) | |
Class B | | | (28,656 | ) | | | (61,089 | ) | |
Class C | | | (589,227 | ) | | | (763,718 | ) | |
Class I | | | (16,367,228 | ) | | | (19,951,363 | ) | |
Class R5 | | | (12,505 | ) | | | (20,851 | ) | |
Class W | | | (235 | ) | | | (359 | ) | |
Class Z | | | (19,375,941 | ) | | | (32,532,189 | ) | |
Total distributions to shareholders | | | (59,167,159 | ) | | | (76,902,492 | ) | |
Increase (decrease) in net assets from capital stock activity | | | 90,025,405 | | | | (53,221,887 | ) | |
Proceeds from regulatory settlements (Note 6) | | | 387,115 | | | | — | | |
Total increase (decrease) in net assets | | | 3,134,209 | | | | (61,822,916 | ) | |
Net assets at beginning of year | | | 487,153,960 | | | | 548,976,876 | | |
Net assets at end of year | | $ | 490,288,169 | | | $ | 487,153,960 | | |
Undistributed net investment income | | $ | 261,666 | | | $ | 5,364,902 | | |
The accompanying Notes to Financial Statements are an integral part of this statement.
Annual Report 2016
15
COLUMBIA SELECT LARGE CAP EQUITY FUND
STATEMENT OF CHANGES IN NET ASSETS (continued)
| | | Year Ended February 29, 2016 | | Year Ended February 28, 2015 | |
| | | Shares | | Dollars ($) | | Shares | | Dollars ($) | |
Capital stock activity | |
Class A shares | |
Subscriptions(a) | | | 1,267,110 | | | | 15,168,328 | | | | 1,552,952 | | | | 19,641,450 | | |
Distributions reinvested | | | 347,159 | | | | 4,177,094 | | | | 382,635 | | | | 4,838,784 | | |
Redemptions | | | (1,397,306 | ) | | | (16,457,586 | ) | | | (1,288,515 | ) | | | (16,664,333 | ) | |
Net increase | | | 216,963 | | | | 2,887,836 | | | | 647,072 | | | | 7,815,901 | | |
Class B shares | |
Subscriptions | | | 5,915 | | | | 65,647 | | | | 5,143 | | | | 61,605 | | |
Distributions reinvested | | | 1,583 | | | | 17,729 | | | | 3,352 | | | | 39,857 | | |
Redemptions(a) | | | (20,707 | ) | | | (233,823 | ) | | | (11,828 | ) | | | (144,290 | ) | |
Net decrease | | | (13,209 | ) | | | (150,447 | ) | | | (3,333 | ) | | | (42,828 | ) | |
Class C shares | |
Subscriptions | | | 117,647 | | | | 1,284,557 | | | | 118,976 | | | | 1,449,094 | | |
Distributions reinvested | | | 44,637 | | | | 499,652 | | | | 47,306 | | | | 561,416 | | |
Redemptions | | | (171,003 | ) | | | (1,878,832 | ) | | | (29,610 | ) | | | (356,496 | ) | |
Net increase (decrease) | | | (8,719 | ) | | | (94,623 | ) | | | 136,672 | | | | 1,654,014 | | |
Class I shares | |
Subscriptions | | | 11,418,065 | | | | 137,538,318 | | | | 11,943 | | | | 151,296 | | |
Distributions reinvested | | | 1,691,738 | | | | 20,173,266 | | | | 1,704,373 | | | | 21,454,332 | | |
Redemptions | | | (3,423,806 | ) | | | (40,949,781 | ) | | | (3,360,476 | ) | | | (43,470,520 | ) | |
Net increase (decrease) | | | 9,685,997 | | | | 116,761,803 | | | | (1,644,160 | ) | | | (21,864,892 | ) | |
Class R5 shares | |
Subscriptions | | | 15,948 | | | | 188,477 | | | | 9,787 | | | | 133,111 | | |
Distributions reinvested | | | 1,224 | | | | 14,962 | | | | 1,760 | | | | 22,474 | | |
Redemptions | | | (14,294 | ) | | | (171,161 | ) | | | (5,563 | ) | | | (72,865 | ) | |
Net increase | | | 2,878 | | | | 32,278 | | | | 5,984 | | | | 82,720 | | |
Class W shares | |
Redemptions | | | — | | | | — | | | | (23 | ) | | | (300 | ) | |
Net decrease | | | — | | | | — | | | | (23 | ) | | | (300 | ) | |
Class Z shares | |
Subscriptions | | | 614,817 | | | | 7,109,286 | | | | 736,523 | | | | 9,333,855 | | |
Distributions reinvested | | | 907,917 | | | | 10,846,354 | | | | 1,180,060 | | | | 14,824,535 | | |
Redemptions | | | (4,051,783 | ) | | | (47,367,082 | ) | | | (5,070,986 | ) | | | (65,024,892 | ) | |
Net decrease | | | (2,529,049 | ) | | | (29,411,442 | ) | | | (3,154,403 | ) | | | (40,866,502 | ) | |
Total net increase (decrease) | | | 7,354,861 | | | | 90,025,405 | | | | (4,012,191 | ) | | | (53,221,887 | ) | |
(a) Includes conversions of Class B shares to Class A shares, if any.
The accompanying Notes to Financial Statements are an integral part of this statement.
Annual Report 2016
16
COLUMBIA SELECT LARGE CAP EQUITY FUND
The following tables are intended to help you understand the Fund's financial performance. Certain information reflects financial results for a single share of a class held for the periods shown. Per share net investment income (loss) amounts are calculated based on average shares outstanding during the period. Total return assumes reinvestment of all dividends and distributions, if any. Total return does not reflect payment of sales charges, if any. Total return and portfolio turnover are not annualized for periods of less than one year. The portfolio turnover rate is calculated without regard to purchase and sales transactions of short-term instruments and certain derivatives, if any. If such transactions were included, the Fund's portfolio turnover rate may be higher.
| | | Year Ended
February 29, | | Year Ended February 28, | | Year Ended
February 29, | |
Class A | | 2016 | | 2015 | | 2014 | | 2013 | | 2012 | |
Per share data | |
Net asset value, beginning of period | | $ | 12.86 | | | $ | 13.10 | | | $ | 15.21 | | | $ | 14.09 | | | $ | 13.73 | | |
Income from investment operations: | |
Net investment income | | | 0.05 | | | | 0.23 | | | | 0.11 | | | | 0.10 | | | | 0.10 | | |
Net realized and unrealized gain (loss) | | | (0.62 | ) | | | 1.53 | | | | 3.03 | | | | 1.66 | | | | 0.36 | | |
Total from investment operations | | | (0.57 | ) | | | 1.76 | | | | 3.14 | | | | 1.76 | | | | 0.46 | | |
Less distributions to shareholders: | |
Net investment income | | | (0.20 | ) | | | (0.10 | ) | | | (0.13 | ) | | | (0.13 | ) | | | (0.10 | ) | |
Net realized gains | | | (1.24 | ) | | | (1.90 | ) | | | (5.12 | ) | | | (0.51 | ) | | | — | | |
Total distributions to shareholders | | | (1.44 | ) | | | (2.00 | ) | | | (5.25 | ) | | | (0.64 | ) | | | (0.10 | ) | |
Proceeds from regulatory settlements | | | 0.00 | (a) | | | — | | | | — | | | | — | | | | 0.00 | (a) | |
Net asset value, end of period | | $ | 10.85 | | | $ | 12.86 | | | $ | 13.10 | | | $ | 15.21 | | | $ | 14.09 | | |
Total return | | | (5.38 | %)(b) | | | 14.26 | % | | | 23.89 | % | | | 12.83 | % | | | 3.45 | % | |
Ratios to average net assets(c) | |
Total gross expenses | | | 1.25 | % | | | 1.25 | % | | | 1.25 | % | | | 1.23 | % | | | 1.21 | %(d) | |
Total net expenses(e) | | | 1.18 | %(f) | | | 1.18 | %(f) | | | 1.19 | %(f) | | | 1.19 | %(f) | | | 1.16 | %(d)(f) | |
Net investment income | | | 0.41 | % | | | 1.79 | % | | | 0.75 | % | | | 0.70 | % | | | 0.77 | % | |
Supplemental data | |
Net assets, end of period (in thousands) | | $ | 119,928 | | | $ | 139,311 | | | $ | 133,450 | | | $ | 120,365 | | | $ | 119,434 | | |
Portfolio turnover | | | 102 | % | | | 150 | % | | | 184 | % | | | 147 | % | | | 197 | % | |
Notes to Financial Highlights
(a) Rounds to zero.
(b) The Fund received proceeds from regulatory settlements. Had the Fund not received these proceeds, the total return would have been lower by 0.07%.
(c) In addition to the fees and expenses that the Fund bears directly, the Fund indirectly bears a pro rata share of the fees and expenses of any other funds in which it invests. Such indirect expenses are not included in the Fund's reported expense ratios.
(d) Ratios include line of credit interest expense which is less than 0.01%.
(e) Total net expenses include the impact of certain fee waivers/expense reimbursements made by the Investment Manager and certain of its affiliates, if applicable.
(f) The benefits derived from expense reductions had an impact of less than 0.01%.
The accompanying Notes to Financial Statements are an integral part of this statement.
Annual Report 2016
17
COLUMBIA SELECT LARGE CAP EQUITY FUND
FINANCIAL HIGHLIGHTS (continued)
| | | Year Ended
February 29, | | Year Ended February 28, | | Year Ended
February 29, | |
Class B | | 2016 | | 2015 | | 2014 | | 2013 | | 2012 | |
Per share data | |
Net asset value, beginning of period | | $ | 12.05 | | | $ | 12.40 | | | $ | 14.64 | | | $ | 13.59 | | | $ | 13.25 | | |
Income from investment operations: | |
Net investment income (loss) | | | (0.09 | ) | | | 0.12 | | | | (0.00 | )(a) | | | (0.01 | ) | | | (0.00 | )(a) | |
Net realized and unrealized gain (loss) | | | (0.52 | ) | | | 1.44 | | | | 2.89 | | | | 1.60 | | | | 0.36 | | |
Total from investment operations | | | (0.61 | ) | | | 1.56 | | | | 2.89 | | | | 1.59 | | | | 0.36 | | |
Less distributions to shareholders: | |
Net investment income | | | (0.12 | ) | | | (0.01 | ) | | | (0.01 | ) | | | (0.03 | ) | | | (0.02 | ) | |
Net realized gains | | | (1.24 | ) | | | (1.90 | ) | | | (5.12 | ) | | | (0.51 | ) | | | — | | |
Total distributions to shareholders | | | (1.36 | ) | | | (1.91 | ) | | | (5.13 | ) | | | (0.54 | ) | | | (0.02 | ) | |
Proceeds from regulatory settlements | | | 0.00 | (a) | | | — | | | | — | | | | — | | | | 0.00 | (a) | |
Net asset value, end of period | | $ | 10.08 | | | $ | 12.05 | | | $ | 12.40 | | | $ | 14.64 | | | $ | 13.59 | | |
Total return | | | (6.04 | %)(b) | | | 13.38 | % | | | 22.99 | % | | | 11.93 | % | | | 2.72 | % | |
Ratios to average net assets(c) | |
Total gross expenses | | | 2.00 | % | | | 2.00 | % | | | 2.00 | % | | | 1.98 | % | | | 1.96 | %(d) | |
Total net expenses(e) | | | 1.93 | %(f) | | | 1.93 | %(f) | | | 1.94 | %(f) | | | 1.94 | %(f) | | | 1.91 | %(d)(f) | |
Net investment income (loss) | | | (0.78 | %) | | | 0.96 | % | | | (0.01 | %) | | | (0.05 | %) | | | (0.04 | %) | |
Supplemental data | |
Net assets, end of period (in thousands) | | $ | 197 | | | $ | 395 | | | $ | 448 | | | $ | 700 | | | $ | 813 | | |
Portfolio turnover | | | 102 | % | | | 150 | % | | | 184 | % | | | 147 | % | | | 197 | % | |
Notes to Financial Highlights
(a) Rounds to zero.
(b) The Fund received proceeds from regulatory settlements. Had the Fund not received these proceeds, the total return would have been lower by 0.07%.
(c) In addition to the fees and expenses that the Fund bears directly, the Fund indirectly bears a pro rata share of the fees and expenses of any other funds in which it invests. Such indirect expenses are not included in the Fund's reported expense ratios.
(d) Ratios include line of credit interest expense which is less than 0.01%.
(e) Total net expenses include the impact of certain fee waivers/expense reimbursements made by the Investment Manager and certain of its affiliates, if applicable.
(f) The benefits derived from expense reductions had an impact of less than 0.01%.
The accompanying Notes to Financial Statements are an integral part of this statement.
Annual Report 2016
18
COLUMBIA SELECT LARGE CAP EQUITY FUND
FINANCIAL HIGHLIGHTS (continued)
| | | Year Ended
February 29, | | Year Ended February 28, | | Year Ended
February 29, | |
Class C | | 2016 | | 2015 | | 2014 | | 2013 | | 2012 | |
Per share data | |
Net asset value, beginning of period | | $ | 12.04 | | | $ | 12.39 | | | $ | 14.63 | | | $ | 13.58 | | | $ | 13.25 | | |
Income from investment operations: | |
Net investment income (loss) | | | (0.04 | ) | | | 0.14 | | | | 0.00 | (a) | | | (0.01 | ) | | | 0.00 | (a) | |
Net realized and unrealized gain (loss) | | | (0.57 | ) | | | 1.42 | | | | 2.89 | | | | 1.60 | | | | 0.35 | | |
Total from investment operations | | | (0.61 | ) | | | 1.56 | | | | 2.89 | | | | 1.59 | | | | 0.35 | | |
Less distributions to shareholders: | |
Net investment income | | | (0.12 | ) | | | (0.01 | ) | | | (0.01 | ) | | | (0.03 | ) | | | (0.02 | ) | |
Net realized gains | | | (1.24 | ) | | | (1.90 | ) | | | (5.12 | ) | | | (0.51 | ) | | | — | | |
Total distributions to shareholders | | | (1.36 | ) | | | (1.91 | ) | | | (5.13 | ) | | | (0.54 | ) | | | (0.02 | ) | |
Proceeds from regulatory settlements | | | 0.00 | (a) | | | — | | | | — | | | | — | | | | 0.00 | (a) | |
Net asset value, end of period | | $ | 10.07 | | | $ | 12.04 | | | $ | 12.39 | | | $ | 14.63 | | | $ | 13.58 | | |
Total return | | | (6.05 | %)(b) | | | 13.38 | % | | | 23.01 | % | | | 11.94 | % | | | 2.64 | % | |
Ratios to average net assets(c) | |
Total gross expenses | | | 2.00 | % | | | 2.00 | % | | | 2.00 | % | | | 1.98 | % | | | 1.96 | %(d) | |
Total net expenses(e) | | | 1.93 | %(f) | | | 1.93 | %(f) | | | 1.94 | %(f) | | | 1.94 | %(f) | | | 1.91 | %(d)(f) | |
Net investment income (loss) | | | (0.35 | %) | | | 1.16 | % | | | 0.01 | % | | | (0.04 | %) | | | 0.02 | % | |
Supplemental data | |
Net assets, end of period (in thousands) | | $ | 4,739 | | | $ | 5,772 | | | $ | 4,245 | | | $ | 3,436 | | | $ | 2,649 | | |
Portfolio turnover | | | 102 | % | | | 150 | % | | | 184 | % | | | 147 | % | | | 197 | % | |
Notes to Financial Highlights
(a) Rounds to zero.
(b) The Fund received proceeds from regulatory settlements. Had the Fund not received these proceeds, the total return would have been lower by 0.07%.
(c) In addition to the fees and expenses that the Fund bears directly, the Fund indirectly bears a pro rata share of the fees and expenses of any other funds in which it invests. Such indirect expenses are not included in the Fund's reported expense ratios.
(d) Ratios include line of credit interest expense which is less than 0.01%.
(e) Total net expenses include the impact of certain fee waivers/expense reimbursements made by the Investment Manager and certain of its affiliates, if applicable.
(f) The benefits derived from expense reductions had an impact of less than 0.01%.
The accompanying Notes to Financial Statements are an integral part of this statement.
Annual Report 2016
19
COLUMBIA SELECT LARGE CAP EQUITY FUND
FINANCIAL HIGHLIGHTS (continued)
| | | Year Ended
February 29, | | Year Ended February 28, | | Year Ended
February 29, | |
Class I | | 2016 | | 2015 | | 2014 | | 2013 | | 2012 | |
Per share data | |
Net asset value, beginning of period | | $ | 12.79 | | | $ | 13.04 | | | $ | 15.15 | | | $ | 14.04 | | | $ | 13.69 | | |
Income from investment operations: | |
Net investment income | | | 0.16 | | | | 0.26 | | | | 0.17 | | | | 0.16 | | | | 0.15 | | |
Net realized and unrealized gain (loss) | | | (0.67 | ) | | | 1.54 | | | | 3.03 | | | | 1.65 | | | | 0.36 | | |
Total from investment operations | | | (0.51 | ) | | | 1.80 | | | | 3.20 | | | | 1.81 | | | | 0.51 | | |
Less distributions to shareholders: | |
Net investment income | | | (0.25 | ) | | | (0.15 | ) | | | (0.19 | ) | | | (0.19 | ) | | | (0.16 | ) | |
Net realized gains | | | (1.24 | ) | | | (1.90 | ) | | | (5.12 | ) | | | (0.51 | ) | | | — | | |
Total distributions to shareholders | | | (1.49 | ) | | | (2.05 | ) | | | (5.31 | ) | | | (0.70 | ) | | | (0.16 | ) | |
Proceeds from regulatory settlements | | | 0.00 | (a) | | | — | | | | — | | | | — | | | | 0.00 | (a) | |
Net asset value, end of period | | $ | 10.79 | | | $ | 12.79 | | | $ | 13.04 | | | $ | 15.15 | | | $ | 14.04 | | |
Total return | | | (4.95 | %)(b) | | | 14.68 | % | | | 24.51 | % | | | 13.24 | % | | | 3.82 | % | |
Ratios to average net assets(c) | |
Total gross expenses | | | 0.81 | % | | | 0.81 | % | | | 0.81 | % | | | 0.79 | % | | | 0.76 | %(d) | |
Total net expenses(e) | | | 0.78 | % | | | 0.79 | % | | | 0.79 | % | | | 0.79 | % | | | 0.76 | %(d)(f) | |
Net investment income | | | 1.38 | % | | | 2.03 | % | | | 1.16 | % | | | 1.11 | % | | | 1.18 | % | |
Supplemental data | |
Net assets, end of period (in thousands) | | $ | 215,504 | | | $ | 131,622 | | | $ | 155,624 | | | $ | 128,241 | | | $ | 122,828 | | |
Portfolio turnover | | | 102 | % | | | 150 | % | | | 184 | % | | | 147 | % | | | 197 | % | |
Notes to Financial Highlights
(a) Rounds to zero.
(b) The Fund received proceeds from regulatory settlements. Had the Fund not received these proceeds, the total return would have been lower by 0.07%.
(c) In addition to the fees and expenses that the Fund bears directly, the Fund indirectly bears a pro rata share of the fees and expenses of any other funds in which it invests. Such indirect expenses are not included in the Fund's reported expense ratios.
(d) Ratios include line of credit interest expense which is less than 0.01%.
(e) Total net expenses include the impact of certain fee waivers/expense reimbursements made by the Investment Manager and certain of its affiliates, if applicable.
(f) The benefits derived from expense reductions had an impact of less than 0.01%.
The accompanying Notes to Financial Statements are an integral part of this statement.
Annual Report 2016
20
COLUMBIA SELECT LARGE CAP EQUITY FUND
FINANCIAL HIGHLIGHTS (continued)
| | | Year Ended
February 29, | | Year Ended February 28, | |
Class R5 | | 2016 | | 2015 | | 2014 | | 2013(a) | |
Per share data | |
Net asset value, beginning of period | | $ | 13.07 | | | $ | 13.28 | | | $ | 15.35 | | | $ | 14.45 | | |
Income from investment operations: | |
Net investment income | | | 0.06 | | | | 0.39 | | | | 0.23 | | | | 0.06 | | |
Net realized and unrealized gain (loss) | | | (0.60 | ) | | | 1.44 | | | | 3.00 | | | | 1.51 | | |
Total from investment operations | | | (0.54 | ) | | | 1.83 | | | | 3.23 | | | | 1.57 | | |
Less distributions to shareholders: | |
Net investment income | | | (0.24 | ) | | | (0.14 | ) | | | (0.18 | ) | | | (0.16 | ) | |
Net realized gains | | | (1.24 | ) | | | (1.90 | ) | | | (5.12 | ) | | | (0.51 | ) | |
Total distributions to shareholders | | | (1.48 | ) | | | (2.04 | ) | | | (5.30 | ) | | | (0.67 | ) | |
Proceeds from regulatory settlements | | | 0.00 | (b) | | | — | | | | — | | | | — | | |
Net asset value, end of period | | $ | 11.05 | | | $ | 13.07 | | | $ | 13.28 | | | $ | 15.35 | | |
Total return | | | (5.05 | %)(c) | | | 14.67 | % | | | 24.40 | % | | | 11.15 | % | |
Ratios to average net assets(d) | |
Total gross expenses | | | 0.86 | % | | | 0.86 | % | | | 0.86 | % | | | 0.79 | %(e) | |
Total net expenses(f) | | | 0.84 | % | | | 0.85 | % | | | 0.83 | % | | | 0.79 | %(e) | |
Net investment income | | | 0.47 | % | | | 2.98 | % | | | 1.77 | % | | | 1.37 | %(e) | |
Supplemental data | |
Net assets, end of period (in thousands) | | $ | 153 | | | $ | 143 | | | $ | 66 | | | $ | 3 | | |
Portfolio turnover | | | 102 | % | | | 150 | % | | | 184 | % | | | 147 | % | |
Notes to Financial Highlights
(a) Based on operations from November 8, 2012 (commencement of operations) through the stated period end.
(b) Rounds to zero.
(c) The Fund received proceeds from regulatory settlements. Had the Fund not received these proceeds, the total return would have been lower by 0.07%.
(d) In addition to the fees and expenses that the Fund bears directly, the Fund indirectly bears a pro rata share of the fees and expenses of any other funds in which it invests. Such indirect expenses are not included in the Fund's reported expense ratios.
(e) Annualized.
(f) Total net expenses include the impact of certain fee waivers/expense reimbursements made by the Investment Manager and certain of its affiliates, if applicable.
The accompanying Notes to Financial Statements are an integral part of this statement.
Annual Report 2016
21
COLUMBIA SELECT LARGE CAP EQUITY FUND
FINANCIAL HIGHLIGHTS (continued)
| | | Year Ended
February 29, | | Year Ended February 28, | | Year Ended
February 29, | |
Class W | | 2016 | | 2015 | | 2014 | | 2013 | | 2012 | |
Per share data | |
Net asset value, beginning of period | | $ | 12.86 | | | $ | 13.10 | | | $ | 15.20 | | | $ | 14.09 | | | $ | 13.73 | | |
Income from investment operations: | |
Net investment income | | | 0.04 | | | | 0.23 | | | | 0.11 | | | | 0.10 | | | | 0.11 | | |
Net realized and unrealized gain (loss) | | | (0.61 | ) | | | 1.53 | | | | 3.04 | | | | 1.66 | | | | 0.36 | | |
Total from investment operations | | | (0.57 | ) | | | 1.76 | | | | 3.15 | | | | 1.76 | | | | 0.47 | | |
Less distributions to shareholders: | |
Net investment income | | | (0.20 | ) | | | (0.10 | ) | | | (0.13 | ) | | | (0.14 | ) | | | (0.11 | ) | |
Net realized gains | | | (1.24 | ) | | | (1.90 | ) | | | (5.12 | ) | | | (0.51 | ) | | | — | | |
Total distributions to shareholders | | | (1.44 | ) | | | (2.00 | ) | | | (5.25 | ) | | | (0.65 | ) | | | (0.11 | ) | |
Proceeds from regulatory settlements | | | 0.00 | (a) | | | — | | | | — | | | | — | | | | 0.00 | (a) | |
Net asset value, end of period | | $ | 10.85 | | | $ | 12.86 | | | $ | 13.10 | | | $ | 15.20 | | | $ | 14.09 | | |
Total return | | | (5.36 | %)(b) | | | 14.29 | % | | | 24.01 | % | | | 12.78 | % | | | 3.48 | % | |
Ratios to average net assets(c) | |
Total gross expenses | | | 1.20 | % | | | 1.16 | % | | | 1.21 | % | | | 1.20 | % | | | 1.18 | %(d) | |
Total net expenses(e) | | | 1.18 | %(f) | | | 1.16 | %(f) | | | 1.19 | %(f) | | | 1.17 | %(f) | | | 1.14 | %(d)(f) | |
Net investment income | | | 0.37 | % | | | 1.74 | % | | | 0.75 | % | | | 0.72 | % | | | 0.81 | % | |
Supplemental data | |
Net assets, end of period (in thousands) | | $ | 2 | | | $ | 2 | | | $ | 3 | | | $ | 3 | | | $ | 3 | | |
Portfolio turnover | | | 102 | % | | | 150 | % | | | 184 | % | | | 147 | % | | | 197 | % | |
Notes to Financial Highlights
(a) Rounds to zero.
(b) The Fund received proceeds from regulatory settlements. Had the Fund not received these proceeds, the total return would have been lower by 0.07%.
(c) In addition to the fees and expenses that the Fund bears directly, the Fund indirectly bears a pro rata share of the fees and expenses of any other funds in which it invests. Such indirect expenses are not included in the Fund's reported expense ratios.
(d) Ratios include line of credit interest expense which is less than 0.01%.
(e) Total net expenses include the impact of certain fee waivers/expense reimbursements made by the Investment Manager and certain of its affiliates, if applicable.
(f) The benefits derived from expense reductions had an impact of less than 0.01%.
The accompanying Notes to Financial Statements are an integral part of this statement.
Annual Report 2016
22
COLUMBIA SELECT LARGE CAP EQUITY FUND
FINANCIAL HIGHLIGHTS (continued)
| | | Year Ended
February 29, | | Year Ended February 28, | | Year Ended
February 29, | |
Class Z | | 2016 | | 2015 | | 2014 | | 2013 | | 2012 | |
Per share data | |
Net asset value, beginning of period | | $ | 12.78 | | | $ | 13.03 | | | $ | 15.15 | | | $ | 14.04 | | | $ | 13.69 | | |
Income from investment operations: | |
Net investment income | | | 0.07 | | | | 0.25 | | | | 0.15 | | | | 0.13 | | | | 0.13 | | |
Net realized and unrealized gain (loss) | | | (0.60 | ) | | | 1.53 | | | | 3.02 | | | | 1.66 | | | | 0.36 | | |
Total from investment operations | | | (0.53 | ) | | | 1.78 | | | | 3.17 | | | | 1.79 | | | | 0.49 | | |
Less distributions to shareholders: | |
Net investment income | | | (0.23 | ) | | | (0.13 | ) | | | (0.17 | ) | | | (0.17 | ) | | | (0.14 | ) | |
Net realized gains | | | (1.24 | ) | | | (1.90 | ) | | | (5.12 | ) | | | (0.51 | ) | | | — | | |
Total distributions to shareholders | | | (1.47 | ) | | | (2.03 | ) | | | (5.29 | ) | | | (0.68 | ) | | | (0.14 | ) | |
Proceeds from regulatory settlements | | | 0.00 | (a) | | | — | | | | — | | | | — | | | | 0.00 | (a) | |
Net asset value, end of period | | $ | 10.78 | | | $ | 12.78 | | | $ | 13.03 | | | $ | 15.15 | | | $ | 14.04 | | |
Total return | | | (5.09 | %)(b) | | | 14.54 | % | | | 24.25 | % | | | 13.08 | % | | | 3.65 | % | |
Ratios to average net assets(c) | |
Total gross expenses | | | 1.00 | % | | | 1.00 | % | | | 1.00 | % | | | 0.98 | % | | | 0.95 | %(d) | |
Total net expenses(e) | | | 0.93 | %(f) | | | 0.93 | %(f) | | | 0.94 | %(f) | | | 0.93 | %(f) | | | 0.91 | %(d)(f) | |
Net investment income | | | 0.55 | % | | | 1.92 | % | | | 1.00 | % | | | 0.90 | % | | | 0.99 | % | |
Supplemental data | |
Net assets, end of period (in thousands) | | $ | 149,765 | | | $ | 209,909 | | | $ | 255,142 | | | $ | 373,397 | | | $ | 825,292 | | |
Portfolio turnover | | | 102 | % | | | 150 | % | | | 184 | % | | | 147 | % | | | 197 | % | |
Notes to Financial Highlights
(a) Rounds to zero.
(b) The Fund received proceeds from regulatory settlements. Had the Fund not received these proceeds, the total return would have been lower by 0.07%.
(c) In addition to the fees and expenses that the Fund bears directly, the Fund indirectly bears a pro rata share of the fees and expenses of any other funds in which it invests. Such indirect expenses are not included in the Fund's reported expense ratios.
(d) Ratios include line of credit interest expense which is less than 0.01%.
(e) Total net expenses include the impact of certain fee waivers/expense reimbursements made by the Investment Manager and certain of its affiliates, if applicable.
(f) The benefits derived from expense reductions had an impact of less than 0.01%.
The accompanying Notes to Financial Statements are an integral part of this statement.
Annual Report 2016
23
COLUMBIA SELECT LARGE CAP EQUITY FUND
NOTES TO FINANCIAL STATEMENTS
February 29, 2016
Note 1. Organization
Columbia Select Large Cap Equity Fund (the Fund), a series of Columbia Funds Series Trust (the Trust), is a diversified fund. The Trust is registered under the Investment Company Act of 1940, as amended (the 1940 Act), as an open-end management investment company organized as a Delaware statutory trust.
Fund Shares
The Trust may issue an unlimited number of shares (without par value). The Fund offers Class A, Class B, Class C, Class I, Class R5, Class W and Class Z shares. Although all share classes generally have identical voting, dividend and liquidation rights, each share class votes separately when required by the Trust's organizational documents or by law. Different share classes pay different distribution amounts to the extent the expenses of such share classes differ, and distributions in liquidation will be proportional to the net asset value of each share class. Each share class has its own expense and sales charge structure.
Class A shares are subject to a maximum front-end sales charge of 5.75% based on the initial investment amount. Class A shares purchased without an initial sales charge in accounts aggregating $1 million to $50 million at the time of purchase are subject to a contingent deferred sales charge (CDSC) if the shares are sold within 18 months after purchase, charged as follows: 1.00% CDSC if redeemed within 12 months after purchase, and 0.50% CDSC if redeemed more than 12, but less than 18, months after purchase.
Class B shares may be subject to a maximum CDSC of 5.00% based upon the holding period after purchase. Class B shares will generally convert to Class A shares eight years after purchase. The Fund no longer accepts investments by new or existing investors in the Fund's Class B shares, except in connection with the reinvestment of any dividend and/or capital gain distributions in Class B shares of the Fund and exchanges by existing Class B shareholders of certain other funds within the Columbia Family of Funds.
Class C shares are subject to a 1.00% CDSC on shares redeemed within 12 months after purchase.
Class I shares are not subject to sales charges and are available only to the Columbia Family of Funds.
Class R5 shares are not subject to sales charges and are generally available only to investors purchasing through authorized investment professionals and omnibus retirement plans.
Class W shares are not subject to sales charges and are available only to investors purchasing through authorized investment programs managed by investment professionals, including discretionary managed account programs.
Class Z shares are not subject to sales charges and are available only to eligible investors, which are subject to different investment minimums as described in the Fund's prospectus.
Note 2. Summary of Significant Accounting Policies
Basis of Preparation
The Fund is an investment company that applies the accounting and reporting guidance in the Financial Accounting Standards Board (FASB) Accounting Standards Codification Topic 946, Financial Services — Investment Companies (ASC 946). The financial statements are prepared in accordance with U.S. generally accepted accounting principles (GAAP), which requires management to make certain estimates and assumptions that affect the reported amounts of assets and liabilities, the disclosure of contingent assets and liabilities at the date of the financial statements and the reported amounts of income and expenses during the reporting period. Actual results could differ from those estimates.
The following is a summary of significant accounting policies followed by the Fund in the preparation of its financial statements.
Security Valuation
All equity securities are valued at the close of business of the New York Stock Exchange (NYSE). Equity securities are valued at the last quoted sales price on the principal exchange or market on which they trade, except for securities traded on the NASDAQ Stock Market, which are valued at the NASDAQ official close price. Unlisted securities or listed securities for which there were no sales during the day are valued at the mean of the latest quoted bid and ask prices on such exchanges or markets.
Foreign equity securities are valued based on the closing price on the foreign exchange in which such securities are primarily traded. If any foreign equity security closing prices are not readily available, the securities are valued at the mean of the latest quoted bid and ask prices on such exchanges or markets. Foreign currency exchange rates are generally determined at 4:00 p.m. Eastern (U.S.) time. Many securities markets and exchanges outside the U.S. close prior to the close of the NYSE;
Annual Report 2016
24
COLUMBIA SELECT LARGE CAP EQUITY FUND
NOTES TO FINANCIAL STATEMENTS (continued)
February 29, 2016
therefore, the closing prices for securities in such markets or on such exchanges may not fully reflect events that occur after such close but before the close of the NYSE. In those situations, foreign securities will be fair valued pursuant to a policy adopted by the Board of Trustees (the Board), including, if available, utilizing a third party pricing service to determine these fair values. The third party pricing service takes into account multiple factors, including, but not limited to, movements in the U.S. securities markets, certain depositary receipts, futures contracts and foreign exchange rates that have occurred subsequent to the close of the foreign exchange or market, to determine a good faith estimate that reasonably reflects the current market conditions as of the close of the NYSE. The fair value of a security is likely to be different from the quoted or published price, if available.
Investments in open-end investment companies, including money market funds, are valued at their latest net asset value.
Investments for which market quotations are not readily available, or that have quotations which management believes are not reflective of market value or reliable, are valued at fair value as determined in good faith under procedures approved by and under the general supervision of the Board. If a security or class of securities (such as foreign securities) is valued at fair value, such value is likely to be different from the quoted or published price for the security.
The determination of fair value often requires significant judgment. To determine fair value, management may use assumptions including but not limited to future cash flows and estimated risk premiums. Multiple inputs from various sources may be used to determine fair value.
GAAP requires disclosure regarding the inputs and valuation techniques used to measure fair value and any changes in valuation inputs or techniques. In addition, investments shall be disclosed by major category. This information is disclosed following the Fund's Portfolio of Investments.
Security Transactions
Security transactions are accounted for on the trade date. Cost is determined and gains (losses) are based upon the specific identification method for both financial statement and federal income tax purposes.
Income Recognition
Corporate actions and dividend income are generally recorded net of any non-reclaimable tax withholdings, on
the ex-dividend date or upon receipt of ex-dividend notification in the case of certain foreign securities.
The Fund may receive distributions from holdings in equity securities, business development companies (BDCs), exchange-traded funds, other regulated investment companies (RICs), and real estate investment trusts (REITs), which report information on the tax character of their distributions annually. These distributions are allocated to dividend income, capital gain and return of capital based on actual information reported. Return of capital is recorded as a reduction of the cost basis of securities held. If the Fund no longer owns the applicable securities, return of capital is recorded as a realized gain. With respect to REITs, to the extent actual information has not yet been reported, estimates for return of capital are made by the Fund's management. Management's estimates are subsequently adjusted when the actual character of the distributions is disclosed by the REITs, which could result in a proportionate change in return of capital to shareholders.
Awards from class action litigation are recorded as a reduction of cost basis if the Fund still owns the applicable securities on the payment date. If the Fund no longer owns the applicable securities, the proceeds are recorded as realized gains.
Expenses
General expenses of the Trust are allocated to the Fund and other funds of the Trust based upon relative net assets or other expense allocation methodologies determined by the nature of the expense. Expenses directly attributable to the Fund are charged to the Fund. Expenses directly attributable to a specific class of shares are charged to that share class.
Determination of Class Net Asset Value
All income, expenses (other than class-specific expenses, which are charged to that share class, as shown in the Statement of Operations) and realized and unrealized gains (losses) are allocated to each class of the Fund on a daily basis, based on the relative net assets of each class, for purposes of determining the net asset value of each class.
Federal Income Tax Status
The Fund intends to qualify each year as a regulated investment company under Subchapter M of the Internal Revenue Code, as amended, and will distribute substantially all of its taxable income (including net short-term capital gains), if any, for its tax year, and as such will not be subject to federal income taxes. In
Annual Report 2016
25
COLUMBIA SELECT LARGE CAP EQUITY FUND
NOTES TO FINANCIAL STATEMENTS (continued)
February 29, 2016
addition, the Fund intends to distribute in each calendar year substantially all of its net investment income, capital gains and certain other amounts, if any, such that the Fund should not be subject to federal excise tax. Therefore, no federal income or excise tax provision is recorded.
Foreign Taxes
The Fund may be subject to foreign taxes on income, gains on investments or currency repatriation, a portion of which may be recoverable. The Fund will accrue such taxes and recoveries, as applicable, based upon its current interpretation of tax rules and regulations that exist in the markets in which it invests.
Realized gains in certain countries may be subject to foreign taxes at the Fund level, based on statutory rates. The Fund accrues for such foreign taxes on realized and unrealized gains at the appropriate rate for each jurisdiction, as applicable. The amount, if any, is disclosed as a liability on the Statement of Assets and Liabilities.
Distributions to Shareholders
Distributions from net investment income, if any, are declared and paid semi-annually. Net realized capital gains, if any, are distributed at least annually. Income distributions and capital gain distributions are determined in accordance with federal income tax regulations, which may differ from GAAP.
Guarantees and Indemnifications
Under the Trust's organizational documents and, in some cases, by contract, its officers and trustees are indemnified against certain liabilities arising out of the performance of their duties to the Trust or its funds. In addition, certain of the Fund's contracts with its service providers contain general indemnification clauses. The Fund's maximum exposure under these arrangements is unknown since the amount of any future claims that may be made against the Fund cannot be determined, and the Fund has no historical basis for predicting the likelihood of any such claims.
Recent Accounting Pronouncement
Fair Value Measurement (Topic 820), Disclosure for Investments in Certain Entities That Calculate Net Asset Value per Share (or Its Equivalent)
In May 2015, FASB issued Accounting Standards Update (ASU) No. 2015-07, Fair Value Measurement (Topic 820), Disclosure for Investments in Certain Entities That Calculate Net Asset Value per Share (or Its Equivalent).
ASU No. 2015-07 changes the disclosure requirements for investments for which fair value is measured using the net asset value per share practical expedient. The disclosure requirements are effective for annual periods beginning after December 15, 2015 and interim periods within those fiscal years. At this time, management is evaluating the implications of this guidance and the impact it will have on the financial statement amounts and footnote disclosures, if any.
Note 3. Fees and Other Transactions with Affiliates
Management Fees
Effective July 1, 2015, the Fund entered into a Management Agreement with Columbia Management Investment Advisers, LLC (the Investment Manager), a wholly-owned subsidiary of Ameriprise Financial, Inc. (Ameriprise Financial). Under the Management Agreement, the Investment Manager provides the Fund with investment research and advice, as well as administrative and accounting services. The management services fee is an annual fee that is equal to a percentage of the Fund's average daily net assets that declines from 0.77% to 0.57% as the Fund's net assets increase. The effective management services fee rate for the year ended February 29, 2016 was 0.77% of the Fund's average daily net assets.
Prior to July 1, 2015, the Fund paid the Investment Manager an annual fee for advisory services under an Investment Management Services Agreement and a separate annual fee for administrative and accounting services under an Administrative Services Agreement. For the period from March 1, 2015 through June 30, 2015, the investment advisory services fee paid to the Investment Manager was $1,176,823, and the administrative services fee paid to the Investment Manager was $99,434.
Other Expenses
Other expenses are for, among other things, miscellaneous expenses of the Fund or the Board, including payments to Board Services Corp., a company providing limited administrative services to the Fund and the Board. That company's expenses include boardroom and office expense, employee compensation, employee health and retirement benefits, and certain other expenses. For the year ended February 29, 2016, other expenses paid by the Fund to this company were $2,097.
Annual Report 2016
26
COLUMBIA SELECT LARGE CAP EQUITY FUND
NOTES TO FINANCIAL STATEMENTS (continued)
February 29, 2016
Compensation of Board Members
Board members, who are not officers or employees of the Investment Manager or Ameriprise Financial, are compensated for their services to the Fund as disclosed in the Statement of Operations. Under a Deferred Compensation Plan (the Plan), these Board members may elect to defer payment of up to 100% of their compensation. Deferred amounts are treated as though equivalent dollar amounts had been invested in shares of certain funds managed by the Investment Manager. The Fund's liability for these amounts is adjusted for market value changes and remains in the Fund until distributed in accordance with the Plan. All amounts payable under the Plan constitute a general unsecured obligation of the Fund.
Transfer Agency Fees
Under a Transfer and Dividend Disbursing Agent Agreement, Columbia Management Investment Services Corp. (the Transfer Agent), an affiliate of the Investment Manager and a wholly-owned subsidiary of Ameriprise Financial, is responsible for providing transfer agency services to the Fund. The Transfer Agent has contracted with Boston Financial Data Services (BFDS) to serve as sub-transfer agent.
The Transfer Agent receives a monthly transfer agency fee based on the number or the average value of accounts, depending on the type of account. In addition, the Transfer Agent also receives sub-transfer agency fees based on a percentage of the average aggregate value of the Fund's shares maintained in omnibus accounts (other than omnibus accounts for which American Enterprise Investment Services Inc. is the broker of record or accounts where the beneficial shareholder is a customer of Ameriprise Financial Services, Inc., for which the Transfer Agent receives a per account fee). The Transfer Agent pays the fees of BFDS for services as sub-transfer agent and is not entitled to reimbursement for such fees from the Fund (with the exception of out-of-pocket fees).
The Transfer Agent also receives compensation from the Fund for various shareholder services and reimbursements for certain out-of-pocket fees. Class I shares do not pay transfer agency fees. Total transfer agency fees for Class R5 shares are subject to an annual limitation of not more than 0.05% of the average daily net assets attributable to Class R5 shares.
For the year ended February 29, 2016, the Fund's effective transfer agency fee rates as a percentage of average daily net assets of each class were as follows:
Class A | | | 0.20 | % | |
Class B | | | 0.20 | | |
Class C | | | 0.20 | | |
Class R5 | | | 0.05 | | |
Class W | | | 0.18 | | |
Class Z | | | 0.20 | | |
An annual minimum account balance fee of $20 may apply to certain accounts with a value below the applicable share class's initial minimum investment requirements to reduce the impact of small accounts on transfer agency fees. These minimum account balance fees are remitted to the Fund and recorded as part of expense reductions in the Statement of Operations. For the year ended February 29, 2016, these minimum account balance fees reduced total expenses of the Fund by $2,278.
Distribution and Service Fees
The Fund has an agreement with Columbia Management Investment Distributors, Inc. (the Distributor), an affiliate of the Investment Manager and a wholly-owned subsidiary of Ameriprise Financial, for distribution and shareholder services. The Board has approved, and the Fund has adopted, distribution and shareholder service plans (the Plans) applicable to certain share classes, which set the distribution and service fees for the Fund. These fees are calculated daily and are intended to compensate the Distributor and/or eligible selling and/or servicing agents for selling shares of the Fund and providing services to investors.
Under the Plans, the Fund pays a monthly combined distribution and service fee to the Distributor at the maximum annual rate of 0.25% of the average daily net assets attributable to Class A shares of the Fund. Also under the Plans, the Fund pays a monthly service fee at the maximum annual rate of 0.25% of the average daily net assets attributable to Class B, Class C and Class W shares of the Fund and a monthly distribution fee at the maximum annual rate of 0.75%, 0.75% and 0.25% of the average daily net assets attributable to Class B, Class C and Class W shares of the Fund, respectively.
Although the Fund may pay a distribution fee up to 0.25% of the Fund's average daily net assets attributable to Class W shares and a service fee of up to 0.25% of the
Annual Report 2016
27
COLUMBIA SELECT LARGE CAP EQUITY FUND
NOTES TO FINANCIAL STATEMENTS (continued)
February 29, 2016
Fund's average daily net assets attributable to Class W shares, the aggregate fee shall not exceed 0.25% of the Fund's average daily net assets attributable to Class W shares.
Sales Charges
Sales charges, including front-end charges and CDSCs, received by the Distributor for distributing Fund shares were $61,322 for Class A and $778 for Class C shares for the year ended February 29, 2016.
Expenses Waived/Reimbursed by the Investment Manager and its Affiliates
The Fund's expense ratio is subject to an expense reimbursement arrangement pursuant to which fees will be waived and/or expenses reimbursed (excluding certain fees and expenses described below), so that the Fund's net operating expenses, after giving effect to fees waived/expenses reimbursed and any balance credits and/or overdraft charges from the Fund's custodian, do not exceed the annual rates of:
| | | Contractual
Expense Cap
July 1, 2015
through
June 30, 2016 | | Voluntary
Expense Cap
Prior to
July 1, 2015 | |
Class A | | | 1.18 | % | | | 1.18 | % | |
Class B | | | 1.93 | | | | 1.93 | | |
Class C | | | 1.93 | | | | 1.93 | | |
Class I | | | 0.78 | | | | 0.80 | | |
Class R5 | | | 0.83 | | | | 0.85 | | |
Class W | | | 1.18 | | | | 1.18 | | |
Class Z | | | 0.93 | | | | 0.93 | | |
The contractual agreement may be modified or amended only with approval from the Investment Manager, certain of its affiliates and the Fund. Under the arrangements, the following fees and expenses are excluded from the waiver/reimbursement commitment, and therefore will be paid by the Fund, if applicable: taxes (including foreign transaction taxes), expenses associated with investments in affiliated and non-affiliated pooled investment vehicles (including mutual funds and exchange-traded funds), transaction costs and brokerage commissions, costs related to any securities lending program, dividend and interest expenses associated with securities sold short, inverse floater program fees and expenses, transaction charges and interest on borrowed money, interest and extraordinary expenses. Any fees
waived and/or expenses reimbursed under the expense reimbursement arrangements described above are not recoverable by the Investment Manager or its affiliates in future periods.
Note 4. Federal Tax Information
The timing and character of income and capital gain distributions are determined in accordance with income tax regulations, which may differ from GAAP because of temporary or permanent book to tax differences.
At February 29, 2016, these differences are primarily due to differing treatment for deferral/reversal of wash sale losses, Trustees' deferred compensation, distribution reclassifications, post-October capital losses, re-characterization of distributions for investments, proceeds from regulatory settlements and amortization/accretion on certain convertible securities. To the extent these differences are permanent, reclassifications are made among the components of the Fund's net assets in the Statement of Assets and Liabilities. Temporary differences do not require reclassifications. In the Statement of Assets and Liabilities the following reclassifications were made:
Undistributed net investment income | | $ | 214,189 | | |
Accumulated net realized loss | | | 222,832 | | |
Paid-in capital | | | (437,021 | ) | |
Net investment income (loss) and net realized gains (losses), as disclosed in the Statement of Operations, and net assets were not affected by this reclassification.
The tax character of distributions paid during the years indicated was as follows:
Year Ended, | | February 29, 2016 | | February 28, 2015 | |
Ordinary income | | $ | 26,737,479 | | | $ | 39,200,579 | | |
Long-term capital gains | | | 32,429,680 | | | | 37,701,913 | | |
Total | | | 59,167,159 | | | | 76,902,492 | | |
Short-term capital gain distributions, if any, are considered ordinary income distributions for tax purposes.
At February 29, 2016, the components of distributable earnings on a tax basis were as follows:
Undistributed ordinary income | | $ | 402,929 | | |
Net unrealized appreciation | | | 37,048,923 | | |
At February 29, 2016, the cost of investments for federal income tax purposes was $454,427,495 and the
Annual Report 2016
28
COLUMBIA SELECT LARGE CAP EQUITY FUND
NOTES TO FINANCIAL STATEMENTS (continued)
February 29, 2016
aggregate gross unrealized appreciation and depreciation based on that cost was:
Unrealized appreciation | | $ | 57,494,785 | | |
Unrealized depreciation | | | (20,445,862 | ) | |
Net unrealized appreciation | | | 37,048,923 | | |
Under current tax rules, regulated investment companies can elect to treat certain late-year ordinary losses incurred and post-October capital losses (capital losses realized after October 31) as arising on the first day of the following taxable year. As of February 29, 2016, the Fund will elect to treat post-October capital losses of $2,275,196 as arising on March 1, 2016.
Management of the Fund has concluded that there are no significant uncertain tax positions in the Fund that would require recognition in the financial statements. However, management's conclusion may be subject to review and adjustment at a later date based on factors including, but not limited to, new tax laws, regulations, and administrative interpretations (including relevant court decisions). Generally, the Fund's federal tax returns for the prior three fiscal years remain subject to examination by the Internal Revenue Service.
Note 5. Portfolio Information
The cost of purchases and proceeds from sales of securities, excluding short-term investments and derivatives, if any, aggregated to $547,517,805 and $506,616,433, respectively, for the year ended February 29, 2016. The amount of purchase and sale activity impacts the portfolio turnover rate reported in the Financial Highlights.
Note 6. Regulatory Settlements
During the year ended February 29, 2016, the Fund recorded a receivable of $387,115 as a result of a regulatory settlement proceeding brought by the Securities and Exchange Commission against an unaffiliated third party relating to market timing and/or late trading of mutual funds. This amount represented the Fund's portion of the proceeds from the settlements (neither the Fund nor the Investment Manager were a party to the proceeding). The payments have been included in Proceeds from regulatory settlements in the Statement of Changes in Net Assets.
Note 7. Affiliated Money Market Fund
The Fund invests in Columbia Short-Term Cash Fund, an affiliated money market fund established for the exclusive use by the Fund and other affiliated funds. The
income earned by the Fund from such investments is included as Dividends — affiliated issuers in the Statement of Operations. As an investing fund, the Fund indirectly bears its proportionate share of the expenses of Columbia Short-Term Cash Fund.
Note 8. Line of Credit
The Fund has access to a revolving credit facility whereby the Fund may borrow for the temporary funding of shareholder redemptions or for other temporary or emergency purposes. Effective December 8, 2015, Citibank, N.A. and HSBC Bank USA, N.A. joined JPMorgan Chase Bank, N.A. (JPMorgan) as lead of a syndicate of banks under the credit facility, which is a collective agreement between the Fund and certain other funds managed by the Investment Manager, severally and not jointly, that permits collective borrowings up to $1 billion. Interest is charged to each participating fund based on its borrowings at a rate equal to the higher of (i) the overnight federal funds rate plus 1.00% or (ii) the one-month LIBOR rate plus 1.00%. Each borrowing under the credit facility matures no later than 60 days after the date of borrowing. The Fund also pays a commitment fee equal to its pro rata share of the amount of the credit facility at a rate of 0.15% per annum. The commitment fee is included in other expenses in the Statement of Operations. Prior to December 8, 2015, JPMorgan was the sole lead bank under the credit facility agreement that permitted borrowings up to $550 million under the same terms and interest rates as described above with the exception of the commitment fee which was charged at a rate of 0.075% per annum.
The Fund had no borrowings during the year ended February 29, 2016.
Note 9. Significant Risks
Shareholder Concentration Risk
At February 29, 2016, one unaffiliated shareholder of record owned 32.3% of the outstanding shares of the Fund in one or more accounts. The Fund has no knowledge about whether any portion of those shares was owned beneficially. Affiliated shareholders of record owned 45.6% of the outstanding shares of the Fund in one or more accounts. Subscription and redemption activity by concentrated accounts may have a significant effect on the operations of the Fund. In the case of a large redemption, the Fund may be forced to sell investments at inopportune times, including its liquid or more liquid positions, resulting in Fund losses and the
Annual Report 2016
29
COLUMBIA SELECT LARGE CAP EQUITY FUND
NOTES TO FINANCIAL STATEMENTS (continued)
February 29, 2016
Fund holding a higher percentage of less liquid or illiquid securities. Large redemptions could result in decreased economies of scale and increased operating expenses for non-redeeming Fund shareholders.
Technology and Technology-related Investment Risk
The Fund may be more susceptible to the particular risks that may affect companies in the information technology sector, as well as other technology-related sectors (collectively, the technology sectors) than if it were invested in a wider variety of companies in unrelated sectors. Companies in the technology sectors are subject to certain risks, including the risk that new services, equipment or technologies will not be accepted by consumers and businesses or will become rapidly obsolete. Performance of such companies may be affected by factors including obtaining and protecting patents (or the failure to do so) and significant competitive pressures, including aggressive pricing of their products or services, new market entrants, competition for market share and short product cycles due to an accelerated rate of technological developments. Such competitive pressures may lead to limited earnings and/or falling profit margins. As a result, the value of their securities may fall or fail to rise. In addition, many technology sector companies have limited operating histories and prices of these companies' securities historically have been more volatile than other securities, especially over the short term.
Note 10. Subsequent Events
Management has evaluated the events and transactions that have occurred through the date the financial statements were issued and noted no items requiring adjustment of the financial statements or additional disclosure.
Note 11. Information Regarding Pending and Settled Legal Proceedings
In December 2005, without admitting or denying the allegations, American Express Financial Corporation (AEFC, which is now known as Ameriprise Financial, Inc. (Ameriprise Financial)) entered into settlement agreements with the Securities and Exchange Commission (SEC) and Minnesota Department of Commerce (MDOC) related to market timing activities. As a result, AEFC was censured and ordered to cease and desist from committing or causing any violations of certain provisions of the Investment Advisers Act of 1940, the Investment Company Act of 1940, and various
Minnesota laws. AEFC agreed to pay disgorgement of $10 million and civil money penalties of $7 million. AEFC also agreed to retain an independent distribution consultant to assist in developing a plan for distribution of all disgorgement and civil penalties ordered by the SEC in accordance with various undertakings detailed at http://www.sec.gov/litigation/admin/ia-2451.pdf. Ameriprise Financial and its affiliates have cooperated with the SEC and the MDOC in these legal proceedings, and have made regular reports to the Funds' Boards of Trustees.
Ameriprise Financial and certain of its affiliates have historically been involved in a number of legal, arbitration and regulatory proceedings, including routine litigation, class actions, and governmental actions, concerning matters arising in connection with the conduct of their business activities. Ameriprise Financial believes that the Funds are not currently the subject of, and that neither Ameriprise Financial nor any of its affiliates are the subject of, any pending legal, arbitration or regulatory proceedings that are likely to have a material adverse effect on the Funds or the ability of Ameriprise Financial or its affiliates to perform under their contracts with the Funds. Ameriprise Financial is required to make quarterly (10-Q), annual (10-K) and, as necessary, 8-K filings with the SEC on legal and regulatory matters that relate to Ameriprise Financial and its affiliates. Copies of these filings may be obtained by accessing the SEC website at www.sec.gov.
There can be no assurance that these matters, or the adverse publicity associated with them, will not result in increased fund redemptions, reduced sale of fund shares or other adverse consequences to the Funds. Further, although we believe proceedings are not likely to have a material adverse effect on the Funds or the ability of Ameriprise Financial or its affiliates to perform under their contracts with the Funds, these proceedings are subject to uncertainties and, as such, we are unable to estimate the possible loss or range of loss that may result. An adverse outcome in one or more of these proceedings could result in adverse judgments, settlements, fines, penalties or other relief that could have a material adverse effect on the consolidated financial condition or results of operations of Ameriprise Financial.
Annual Report 2016
30
COLUMBIA SELECT LARGE CAP EQUITY FUND
REPORT OF INDEPENDENT REGISTERED PUBLIC ACCOUNTING FIRM
To the Trustees of Columbia Funds Series Trust and the Shareholders of
Columbia Select Large Cap Equity Fund
In our opinion, the accompanying statement of assets and liabilities, including the portfolio of investments, and the related statements of operations and of changes in net assets and the financial highlights present fairly, in all material respects, the financial position of Columbia Select Large Cap Equity Fund (the "Fund," a series of Columbia Funds Series Trust) at February 29, 2016, and the results of its operations, the changes in its net assets and the financial highlights for each of the periods indicated, in conformity with accounting principles generally accepted in the United States of America. These financial statements and financial highlights (hereafter referred to as "financial statements") are the responsibility of the Fund's management. Our responsibility is to express an opinion on these financial statements based on our audits. We conducted our audits of these financial statements in accordance with the standards of the Public Company Accounting Oversight Board (United States). Those standards require that we plan and perform the audit to obtain reasonable assurance about whether the financial statements are free of material misstatement. An audit includes examining, on a test basis, evidence supporting the amounts and disclosures in the financial statements, assessing the accounting principles used and significant estimates made by management, and evaluating the overall financial statement presentation. We believe that our audits, which included confirmation of securities at February 29, 2016 by correspondence with the custodian, brokers and transfer agent, and the application of alternative auditing procedures where such confirmations had not been received, provide a reasonable basis for our opinion.
PricewaterhouseCoopers LLP
Minneapolis, MN
April 21, 2016
Annual Report 2016
31
COLUMBIA SELECT LARGE CAP EQUITY FUND
FEDERAL INCOME TAX INFORMATION
(Unaudited)
The Fund hereby designates the following tax attributes for the fiscal year ended February 29, 2016. Shareholders will be notified in early 2017 of the amounts for use in preparing 2016 income tax returns.
Tax Designations:
| Qualified Dividend Income | | | 41.99 | % | |
| Dividends Received Deduction | | | 40.10 | % | |
Capital Gain Dividend | | $ | 7,038,536 | | |
Qualified Dividend Income. For taxable, non-corporate shareholders, the percentage of ordinary income distributed during the fiscal year that represents qualified dividend income subject to reduced tax rates.
Dividends Received Deduction. The percentage of ordinary income distributed during the fiscal year that qualifies for the corporate dividends received deduction.
Capital Gain Dividend. The Fund designates as a capital gain dividend the amount reflected above, or if subsequently determined to be different, the net capital gain of such fiscal period.
Annual Report 2016
32
COLUMBIA SELECT LARGE CAP EQUITY FUND
Shareholders elect the Board that oversees the Fund's operations. The Board appoints officers who are responsible for day-to-day business decisions based on policies set by the Board. The following table provides basic biographical information about the Fund's Trustees, including their principal occupations during the past five years, although specific titles for individuals may have varied over the period. Under current Board policy, members generally may serve through the end of the calendar year in which they reach either the mandatory retirement age established by the Board or the fifteenth anniversary of the first Board meeting they attended as a member of the Board.
Trustees
Independent Trustees
Name,
Address,
Year of Birth | | Position Held With
the Funds and Length of
Service | | Principal Occupation(s)
During the Past Five Years
and Other Relevant
Professional Experience | | Number of
Funds in the
Columbia
Funds Complex
Overseen | | Other Directorships
Held by Trustee
During the Past
Five Years | |
Kathleen Blatz
901 S. Marquette Ave.
Minneapolis, MN 55402
1954 | | Trustee since 1/06 for RiverSource Funds and since 6/11 for Nations Funds | | Attorney; specializing in arbitration and mediation; Chief Justice, Minnesota Supreme Court, 1998-2006; Associate Justice, Minnesota Supreme Court, 1996-1998; Fourth Judicial District Court Judge, Hennepin County, 1994-1996; Attorney in private practice and public service, 1984-1993; State Representative, Minnesota House of Representatives, 1979-1993, which included service on the Tax and Financial Institutions and Insurance Committees | | | 124 | | | Trustee, BlueCross BlueShield of Minnesota (Chair of the Business Development Committee) since 2009; Chair of the Robina Foundation since August 2013 | |
Edward J. Boudreau, Jr.
901 S. Marquette Ave.
Minneapolis, MN 55402
1944 | | Trustee since 6/11 for RiverSource Funds and since 1/05 for Nations Funds | | Managing Director, E.J. Boudreau & Associates (consulting) since 2000; FINRA Industry Arbitrator, 2002-present; Chairman and Chief Executive Officer, John Hancock Funds (asset management), Chairman and Interested Trustee for open-end and closed-end funds offered by John Hancock, 1989-2000; John Hancock Life Insurance Company, including SVP and Treasurer and SVP Information Technology, 1968-1988 | | | 122 | | | Former Trustee, Boston Museum of Science (Chair of Finance Committee), 1985-2013; former Trustee, BofA Funds Series Trust (11 funds), 2005-2011 | |
Pamela G. Carlton
901 S. Marquette Ave.
Minneapolis, MN 55402
1954 | | Trustee since 7/07 for RiverSource Funds and since 6/11 for Nations Funds | | President, Springboard-Partners in Cross Cultural Leadership (consulting company) since 2003; Managing Director of US Equity Research, JP Morgan Chase, 1999-2003; Director of US Equity Research, Chase Asset Management, 1996-1999; Co-Director Latin America Research, 1993-1996, COO Global Research, 1992-1996, Co-Director of US Research, 1991-1992, Investment Banker, Morgan Stanley, 1982-1991 | | | 124 | | | Trustee, New York Presbyterian Hospital Board (Executive Committee and Chair of Human Resources Committee) since 1996 | |
Annual Report 2016
33
COLUMBIA SELECT LARGE CAP EQUITY FUND
TRUSTEES AND OFFICERS (continued)
Independent Trustees (continued)
Name,
Address,
Year of Birth | | Position Held With
the Funds and Length of
Service | | Principal Occupation(s)
During the Past Five Years
and Other Relevant
Professional Experience | | Number of
Funds in the
Columbia
Funds Complex
Overseen | | Other Directorships
Held by Trustee
During the Past
Five Years | |
William P. Carmichael
901 S. Marquette Ave.
Minneapolis, MN 55402
1943 | | Trustee since 6/11 for RiverSource Funds and since 2003 for Nations Funds; Chair of the Board from 1/14-11/15 | | Retired; Co-founder, The Succession Fund (provides exit strategies to owners of privately held companies), 1998-2007; Adjunct Professor of Finance, Kelley School of Business, Indiana University, 1993-2007; Senior Vice President, Sara Lee Corporation, 1991-1993; Senior Vice President and Chief Financial Officer, Beatrice Foods Company, 1984-1990; Vice President, Esmark, Inc., 1973-1984; Associate, Price Waterhouse, 1968-1972 | | | 124 | | | Director, The Finish Line (athletic shoes and apparel) since July 2003; Director, International Textile Corp. since 2012; Director, hhgregg since May, 2015; former Director, Cobra Electronics Corporation (electronic equipment manufacturer), 1994-August 2014; former Director, Spectrum Brands, Inc. (consumer products), 2002-2009; former Director, Simmons Company (bedding), 2004-2010; former Trustee, BofA Funds Series Trust (11 funds), 2009-2011; former Director, McMoRan Exploration Company (oil and gas exploration and development), 2010-2013 | |
Patricia M. Flynn
901 S. Marquette Ave.
Minneapolis, MN 55402
1950 | | Trustee since 11/04 for RiverSource Funds and since 6/11 for Nations Funds | | Trustee Professor of Economics and Management, Bentley University since 1976 (also teaches and conducts research on corporate governance); Dean, McCallum Graduate School of Business, Bentley University, 1992-2002 | | | 124 | | | Trustee, MA Taxpayers Foundation since 1997; Board of Governors, Innovation Institute, MA Technology Collaborative since 2010 | |
William A. Hawkins
901 S. Marquette Ave.
Minneapolis, MN 55402
1942 | | Chair of the Board since 11/15; Trustee since 6/11 for RiverSource Funds and since 1/05 for Nations Funds | | Managing Director, Overton Partners (financial consulting) since August 2010; President and Chief Executive Officer, California General Bank, N.A., January 2008-August 2010; Operation Hope, COO, 2004-2007; IndyMac Bancorp, President, CBG, 1999-2003; American General Bank, President, 1997-1999; Griffin Financial Services, CEO, 1981-1997; The Griffin Funds, CEO, 1992-1998 | | | 124 | | | Former Trustee, BofA Funds Series Trust (11 funds), 2009-2015 | |
R. Glenn Hilliard
901 S. Marquette Ave.
Minneapolis, MN 55402
1943 | | Trustee since 6/11 for RiverSource Funds and since 1/05 for Nations Funds | | Chairman and Chief Executive Officer, Hilliard Group LLC (investing and consulting) since April 2003; Non-Executive Director & Chairman, CNO Financial Group, Inc. (insurance), 2003-2011; Chair & CEO, ING Americas, 1996-2003 | | | 122 | | | Chairman, BofA Funds Series Trust (11 funds); former Director, CNO Financial Group, Inc. (insurance), 2003-2011 | |
Annual Report 2016
34
COLUMBIA SELECT LARGE CAP EQUITY FUND
TRUSTEES AND OFFICERS (continued)
Independent Trustees (continued)
Name,
Address,
Year of Birth | | Position Held With
the Funds and Length of
Service | | Principal Occupation(s)
During the Past Five Years
and Other Relevant
Professional Experience | | Number of
Funds in the
Columbia
Funds Complex
Overseen | | Other Directorships
Held by Trustee
During the Past
Five Years | |
Catherine James Paglia
901 S. Marquette Ave.
Minneapolis, MN 55402
1952 | | Trustee since 11/04 for RiverSource Funds and since 6/11 for Nations Funds | | Director, Enterprise Asset Management, Inc. (private real estate and asset management company) since September 1998; Managing Director and Partner, Interlaken Capital, Inc., 1989-1997; Managing Director, Morgan Stanley, 1982-1989; Vice President, Investment Banking, 1980-1982, Associate, Investment Banking, 1976-1980, Dean Witter Reynolds, Inc. | | | 124 | | | Director, Valmont Industries, Inc. (irrigation systems manufacturer) since 2012; Trustee, Carleton College (on the Investment Committee); Trustee, Carnegie Endowment for International Peace (on the Investment Committee) | |
Leroy C. Richie
901 S. Marquette Ave.
Minneapolis, MN 55402
1941 | | Trustee since 2000 for Seligman Funds, since 11/08 for RiverSource Funds and since 6/11 for Nations Funds | | Counsel, Lewis & Munday, P.C. (law firm) since 2004; Vice President and General Counsel, Automotive Legal Affairs, Chrysler Corporation, 1993-1997 | | | 122 | | | Lead Outside Director, Infinity Resources, Inc. (oil and gas exploration and production) since 1994; Lead Outside Director, Digital Ally, Inc. (digital imaging) since September 2005; Trustee, Marygrove College (Chair of Finance Committee) since 2007; former Director, OGE Energy Corp. (energy and energy services), 2007-2014 | |
Minor M. Shaw
901 S. Marquette Ave.
Minneapolis, MN 55402
1947 | | Trustee since 6/11 for RiverSource Funds and since 2003 for Nations Funds | | President, Micco LLC (private investments) since 2011; President, Micco Corp. (family investment business), 1998-2011 | | | 124 | | | Director, Piedmont Natural Gas; Director, BlueCross BlueShield of South Carolina since April 2008; Chair of the Duke Endowment; Director, National Association of Corporate Directors, Carolinas Chapter since 2013; Chair of Greenville — Spartanburg Airport Commission; former Trustee, BofA Funds Series Trust (11 funds), 2003-2011 | |
Alison Taunton-Rigby
901 S. Marquette Ave.
Minneapolis, MN 55402
1944 | | Trustee since 11/02 for RiverSource Funds and since 6/11 for Nations Funds | | Managing Director, Forester Biotech (consulting), 2001-2003; Chief Executive Officer and Director, RiboNovix, Inc., (biotechnology), 2003-2010; President and Chief Executive Officer of CMT Inc., 2001-2003; Aquila Biopharmaceuticals Inc., 1996-2000; Cambridge Biotech Corporation, 1995-1996; Mitotix Inc., 1993-1994 | | | 124 | | | Director, Abt Associates (government contractor) since 2001; Director, Boston Children's Hospital since 2002; Director, Healthways, Inc. (health and well-being solutions) since 2005; Director, ICI Mutual Insurance Company since 2011 | |
Annual Report 2016
35
COLUMBIA SELECT LARGE CAP EQUITY FUND
TRUSTEES AND OFFICERS (continued)
Interested Trustee Not Affiliated with Investment Manager*
Name,
Address,
Year of Birth | | Position Held With
Funds and Length of
Service | | Principal Occupation(s)
During Past Five Years
and Other Relevant
Professional Experience | | Number of
Funds in the
Fund Family
Overseen by
Board Member | | Other Present or Past
Directorships/
Trusteeships
(Within Past 5 Years) | |
Anthony M. Santomero
901 S. Marquette Ave.
Minneapolis, MN 55402
1946 | | Trustee since 6/11 for RiverSource Funds and since 1/08 for Nations Funds | | Richard K. Mellon Professor Emeritus of Finance, The Wharton School, University of Pennsylvania since 2002; Senior Advisor, McKinsey & Company (consulting), 2006-2008; President, Federal Reserve Bank of Philadelphia, 2000-2006; Professor of Finance, The Wharton School, University of Pennsylvania, 1972-2002 | | | 122 | | | Trustee, Penn Mutual Life Insurance Company since March 2008; Director, Renaissance Reinsurance Ltd. since May 2008; Director, Citigroup Inc. since 2009; Director, Citibank, N.A. since 2009; former Trustee, BofA Funds Series Trust (11 funds), 2008-2011 | |
* Dr. Santomero is not an affiliated person of the Investment Manager or Ameriprise Financial. However, he is currently deemed by the Funds to be an "interested person" (as defined in the 1940 Act) of the Funds because he serves as a Director of Citigroup Inc. and Citibank, N.A., companies that may directly or through subsidiaries and affiliates engage from time-to-time in brokerage execution, principal transactions and lending relationships with the Funds or accounts advised/managed by the Investment Manager.
Annual Report 2016
36
COLUMBIA SELECT LARGE CAP EQUITY FUND
TRUSTEES AND OFFICERS (continued)
Interested Trustee Affiliated with Investment Manager*
Name,
Address,
Year of Birth | | Position Held With
the Funds and Length of
Service | | Principal Occupation(s)
During Past Five Years
and Other Relevant
Professional Experience | | Number of
Funds in the
Columbia
Funds Complex
Overseen | | Other Directorships
Held by Trustee
During the Past
Five Years | |
William F. Truscott
c/o Columbia Management Investment Advisers, LLC,
225 Franklin St.
Boston, MA 02110
1960 | | Trustee since 11/01 for RiverSource Funds and since 6/11 for Nations Funds; Senior Vice President since 2002 for RiverSource Funds and since 5/10 for Nations Funds | | Chairman of the Board and President, Columbia Management Investment Advisers, LLC since May 2010 and February 2012, respectively (previously President and Chief Investment Officer, 2001-April 2010); Chief Executive Officer, Global Asset Management, Ameriprise Financial, Inc. since September 2012 (previously Chief Executive Officer, U.S. Asset Management & President, Annuities, May 2010-September 2012 and President — U.S. Asset Management and Chief Investment Officer, 2005-April 2010); Director and Chief Executive Officer, Columbia Management Investment Distributors, Inc. since May 2010 and February 2012, respectively (previously Chairman of the Board and Chief Executive Officer, 2006-April 2010); Chairman of the Board and Chief Executive Officer, RiverSource Distributors, Inc. since 2006; Director, Threadneedle Asset Management Holdings, SARL since 2014; President and Chief Executive Officer, Ameriprise Certificate Company, 2006-August 2012. | | | 182 | | | Chairman of the Board, Columbia Management Investment Advisers, LLC since May 2010; Director, Columbia Management Investment Distributors, Inc. since May 2010; Former Director, Ameriprise Certificate Company, 2006-January 2013 | |
* Interested person (as defined under the 1940 Act) by reason of being an officer, director, security holder and/or employee of the Investment Manager or Ameriprise Financial.
The Statement of Additional Information has additional information about the Fund's Board members and is available, without charge, upon request by calling 800.345.6611; contacting your financial intermediary; or visiting columbiathreadneedle.com/us.
Annual Report 2016
37
COLUMBIA SELECT LARGE CAP EQUITY FUND
TRUSTEES AND OFFICERS (continued)
The Board has appointed officers who are responsible for day-to-day business decisions based on policies it has established. The officers serve at the pleasure of the Board. The following table provides basic information about the Officers of the Fund, including principal occupations during the past five years, although their specific titles may have varied over the period. In addition to Mr. Truscott, who is Senior Vice President, the Fund's other officers are:
Fund Officers
Name,
Address and
Year of Birth | | Position and Year
First Appointed to
Position for any Fund
in the Columbia
Funds Complex or a
Predecessor Thereof | | Principal Occupation(s) During Past Five Years | |
Christopher O. Petersen
5228 Ameriprise
Financial Center
Minneapolis, MN 55474
Born 1970 | | President and Principal Executive Officer (2015) | | Vice President and Lead Chief Counsel, Ameriprise Financial, Inc. since January 2015 (previously, Vice President and Chief Counsel January 2010-December 2014; and Vice President and Group Counsel or Counsel 2004-January 2010); officer of Columbia Funds and affiliated funds since 2007. | |
Michael G. Clarke
225 Franklin Street
Boston, MA 02110
Born 1969 | | Treasurer (2011), Chief Financial Officer (2009) and Chief Accounting Officer (2015) | | Vice President — Mutual Fund Administration, Columbia Management Investment Advisers, LLC, since May 2010; Managing Director of Fund Administration, Columbia Management Advisors, LLC, September 2004-April 2010; senior officer of Columbia Funds and affiliated funds since 2002. | |
Paul B. Goucher
100 Park Avenue
New York, NY 10017
Born 1968 | | Senior Vice President (2011), Chief Legal Officer (2015) and Assistant Secretary (2008) | | Vice President and Lead Chief Counsel, Ameriprise Financial, Inc. since November 2008 and January 2013, respectively (previously Chief Counsel, January 2010-January 2013 and Group Counsel, November 2008-January 2010). | |
Thomas P. McGuire
225 Franklin Street
Boston, MA 02110
Born 1972 | | Senior Vice President and Chief Compliance Officer (2012) | | Vice President — Asset Management Compliance, Ameriprise Financial, Inc., since May 2010; Chief Compliance Officer, Ameriprise Certificate Company since September 2010; Compliance Executive, Bank of America, 2005-April 2010. | |
Colin Moore
225 Franklin Street
Boston, MA 02110
Born 1958 | | Senior Vice President (2010) | | Executive Vice President and Global Chief Investment Officer, Ameriprise Financial, Inc., since July 2013; Director and Global Chief Investment Officer, Columbia Management Investment Advisers, LLC since May 2010; Manager, Managing Director and Chief Investment Officer, Columbia Management Advisors, LLC, 2007-April 2010. | |
Michael E. DeFao
225 Franklin Street
Boston, MA 02110
Born 1968 | | Vice President (2011) and Assistant Secretary (2010) | | Vice President and Chief Counsel, Ameriprise Financial, Inc. since May 2010; Associate General Counsel, Bank of America, 2005-April 2010. | |
Amy Johnson
5228 Ameriprise
Financial Center
Minneapolis, MN 55474
Born 1965 | | Vice President (2006) | | Managing Director and Chief Operating Officer, Columbia Management Investment Advisers, LLC since May 2010 (previously Chief Administrative Officer, 2009-April 2010, and Vice President — Asset Management and Trust Company Services, 2006-2009). | |
Lyn Kephart-Strong
5228 Ameriprise
Financial Center
Minneapolis, MN 55474
Born 1960 | | Vice President (2015) | | President, Columbia Management Investment Services Corp. since October 2014; Vice President & Resolution Officer, Ameriprise Trust Company since August 2009; President, RiverSource Service Corporation 2004-2010. | |
Ryan C. Larrenaga
225 Franklin Street
Boston, MA 02110
Born 1970 | | Vice President and Secretary (2015) | | Vice President and Group Counsel, Ameriprise Financial, Inc. since August 2011 (previously, Counsel from May 2010 to August 2011); Assistant General Counsel, Bank of America, 2005-April 2010; officer of Columbia Funds and affiliated funds since 2005. | |
Annual Report 2016
38
COLUMBIA SELECT LARGE CAP EQUITY FUND
IMPORTANT INFORMATION ABOUT THIS REPORT
Each fund mails one shareholder report to each shareholder address. If you would like more than one report, please call shareholder services at 800.345.6611 and additional reports will be sent to you.
The policy of the Board is to vote the proxies of the companies in which each fund holds investments consistent with the procedures as stated in the Statement of Additional Information (SAI). You may obtain a copy of the SAI without charge by calling 800.345.6611; contacting your financial intermediary; visiting columbiathreadneedle.com/us; or searching the website of the Securities and Exchange Commission (SEC) at sec.gov. Information regarding how each fund voted proxies relating to portfolio securities is filed with the SEC by August 31st for the most recent 12-month period ending June 30th of that year, and is available without charge by visiting columbiathreadneedle.com/us, or searching the website of the SEC at sec.gov.
Each fund files a complete schedule of portfolio holdings with the SEC for the first and third quarters of each fiscal year on Form N-Q. Each fund's Form N-Q is available on the SEC's website at sec.gov and may be reviewed and copied at the SEC's Public Reference Room in Washington, D.C. Information on the operation of the Public Reference Room may be obtained by calling 800.SEC.0330. Each fund's complete schedule of portfolio holdings, as filed on Form N-Q, can also be obtained without charge, upon request, by calling 800.345.6611.
Annual Report 2016
39
Columbia Select Large Cap Equity Fund
P.O. Box 8081
Boston, MA 02266-8081

This information is for use with concurrent or prior delivery of a fund prospectus. Please read and consider the investment objectives, risks, charges and expenses for any fund carefully before investing. For a prospectus and summary prospectus, which contains this and other important information about the Fund, go to columbiathreadneedle.com/us. The Fund is distributed by Columbia Management Investment Distributors, Inc., member FINRA, and managed by Columbia Management Investment Advisers, LLC.
Columbia Threadneedle Investments (Columbia Threadneedle) is the global brand name of the Columbia and Threadneedle group of companies.
All rights reserved. Columbia Management Investment Distributors, Inc., 225 Franklin Street, Boston, MA 02110-2804
© 2016 Columbia Management Investment Advisers, LLC.
columbiathreadneedle.com/us
ANN172_02_F01_(04/16)
Item 2. Code of Ethics.
(a) The registrant has adopted a code of ethics that applies to the registrant’s principal executive officer, principal financial officer, principal accounting officer or controller, or persons performing similar functions, regardless of whether these individuals are employed by the registrant or a third party.
(b) During the period covered by this report, there were not any amendments to a provision of the code of ethics adopted in 2(a) above.
(c) During the period covered by this report, there were no waivers, including any implicit waivers, from a provision of the code of ethics described in 2(a) above that relates to one or more of the items set forth in paragraph (b) of this item’s instructions.
Item 3. Audit Committee Financial Expert.
The registrant’s Board of Trustees has determined that Edward J. Boudreau, Pamela G. Carlton, William P. Carmichael and Alison Taunton-Rigby, each of whom are members of the registrant’s Board of Trustees and Audit Committee, each qualify as an audit committee financial expert. Mr. Boudreau, Ms. Carlton, Mr. Carmichael and Ms. Taunton-Rigby are each independent trustees, as defined in paragraph (a)(2) of this item’s instructions.
Item 4. Principal Accountant Fees and Services.
Fee information below is disclosed for the sixteen series of the registrant whose report to stockholders are included in this annual filing.
(a) Audit Fees. Aggregate Audit Fees billed by the principal accountant for professional services rendered during the fiscal years ended February 29, 2016 and February 28, 2015 are approximately as follows:
2016 | | 2015 | |
$ | 341,000 | | $ | 339,000 | |
| | | | | |
Audit Fees include amounts related to the audit of the registrant’s annual financial statements or services that are normally provided by the accountant in connection with statutory and regulatory filings or engagements for those fiscal years.
(b) Audit-Related Fees. Aggregate Audit-Related Fees billed to the registrant by the principal accountant for professional services rendered during the fiscal years ended February 29, 2016 and February 28, 2015 are approximately as follows:
Audit-Related Fees include amounts for assurance and related services by the principal accountant that are reasonably related to the performance of the audit of the registrant’s financial statements and are not reported in Audit Fees above. In both fiscal years 2016 and 2015, Audit-Related Fees consist of agreed-upon procedures performed for semi-annual shareholder reports. Fiscal year 2016 also includes agreed-upon procedures for the review of Form N-14 and provision of consent in connection with fund mergers.
During the fiscal years ended February 29, 2016 and February 28, 2015, there were no Audit-Related Fees billed by the registrant’s principal accountant to the registrant’s investment adviser (not including any sub-adviser whose role is primarily portfolio management and is subcontracted with or overseen by another investment adviser) and any entity controlling, controlled by, or under common control with the adviser that provides ongoing services to the registrant for an engagement that related directly to the operations and financial reporting of the registrant.
(c) Tax Fees. Aggregate Tax Fees billed by the principal accountant to the registrant for professional services rendered during the fiscal years ended February 29, 2016 and February 28, 2015 are approximately as follows:
2016 | | 2015 | |
$ | 79,200 | | $ | 98,000 | |
| | | | | |
Tax Fees include amounts for the review of annual tax returns, the review of required shareholder distribution calculations and typically include amounts for professional services by the principal accountant for tax compliance, tax advice and tax planning. Fiscal years 2016 and 2015 also include Tax Fees for foreign tax filings.
During the fiscal years ended February 29, 2016 and February 28, 2015, there were no Tax Fees billed by the registrant’s principal accountant to the registrant’s investment adviser (not including any sub-adviser whose role is primarily portfolio management and is subcontracted with or overseen by another investment adviser) and any entity controlling, controlled by, or under common control with the adviser that provides ongoing services to the registrant for an engagement that related directly to the operations and financial reporting of the registrant.
(d) All Other Fees. Aggregate All Other Fees billed by the principal accountant to the registrant for professional services rendered during the fiscal years ended February 29, 2016 and February 28, 2015 are approximately as follows:
All Other Fees include amounts for products and services provided by the principal accountant, other than the services reported in paragraphs (a) through (c) above.
Aggregate All Other Fees billed by the registrant’s principal accountant to the registrant’s investment adviser (not including any sub-adviser whose role is primarily portfolio management and is subcontracted with or overseen by another investment adviser) and any entity controlling, controlled by, or under common control with the adviser that provides ongoing services to the registrant for an engagement that related directly to the operations and financial reporting of the registrant during the fiscal years ended February 29, 2016 and February 28, 2015 are approximately as follows:
2016 | | 2015 | |
$ | 110,000 | | $ | 440,000 | |
| | | | | |
In fiscal years 2016 and 2015, All Other Fees primarily consists of fees billed for internal control examinations of the registrant’s transfer agent and investment adviser.
(e)(1) Audit Committee Pre-Approval Policies and Procedures
The registrant’s Audit Committee is required to pre-approve the engagement of the registrant’s independent auditors to provide audit and non-audit services to the registrant and non-audit services to its investment adviser (excluding any sub-adviser whose role is primarily portfolio management and is sub-contracted or overseen by another investment adviser (the “Adviser”) or any entity controlling, controlled by or under common control with the Adviser that provides ongoing services to the Fund (a “Control Affiliate”) if the engagement relates directly to the operations and financial reporting of the registrant.
The Audit Committee has adopted a Policy for Engagement of Independent Auditors for Audit and Non-Audit Services (the “Policy”). The Policy sets forth the understanding of the Audit Committee regarding the engagement of the registrant’s independent accountants to provide (i) audit and permissible audit-related, tax and other services to the registrant (“Fund Services”); (ii) non-audit services to the registrant’s Adviser and any Control Affiliates, that relates directly to the operations and financial reporting of a Fund (“Fund-related Adviser Services”); and (iii) certain other audit and non-audit services to the registrant’s Adviser and its Control Affiliates. A service will require specific pre-approval by the Audit Committee if it is to be provided by the Fund’s independent auditor; provided, however, that pre-approval of non-audit services to the Fund, the Adviser or Control Affiliates may be waived if certain de minimis requirements set forth in the SEC’s rules are met.
Under the Policy, the Audit Committee may delegate pre-approval authority to any pre-designated member or members who are independent board members. The member(s) to whom such authority is delegated must report, for informational purposes only, any pre-approval decisions to the Audit Committee at its next regular meeting. The Audit Committee’s responsibilities with respect to the pre-approval of services performed by the independent auditor may not be delegated to management.
On an annual basis, at a regularly scheduled Audit Committee meeting, the Fund’s Treasurer or other Fund officer shall submit to the Audit Committee a schedule of the types of Fund Services and Fund-related Adviser Services that are subject to specific pre-approval. This schedule will provide a description of each type of service that is subject to specific pre-approval, along with total projected fees for each service. The pre-approval will generally cover a one-year period. The Audit Committee will review and approve the types of services and the projected fees for the next one-year period and may add to, or subtract from, the list of pre-approved services from time to time, based on subsequent determinations. This specific approval acknowledges that the Audit Committee is in agreement with the specific types of services that the independent auditor will be permitted to perform and the projected fees for each service.
The Fund’s Treasurer or other Fund officer shall report to the Audit Committee at each of its regular meetings regarding all Fund Services or Fund-related Adviser Services provided since the last such report was rendered, including a description of the services, by category, with forecasted fees for the annual reporting period, proposed changes requiring specific pre-approval and a description of services provided by the independent auditor, by category, with actual fees during the current reporting period.
*****
(e)(2) 100% of the services performed for items (b) through (d) above during 2016 and 2015 were pre-approved by the registrant’s Audit Committee.
(f) Not applicable.
(g) The aggregate non-audit fees billed by the registrant’s accountant for services rendered to the registrant, and rendered to the registrant’s investment adviser (not including any sub-adviser whose role is primarily portfolio management and is subcontracted with or overseen by another investment adviser), and any entity controlling, controlled by, or under common control with the adviser that provides ongoing services to the registrant for the fiscal years ended February 29, 2016 and February 28, 2015 are approximately as follows:
2016 | | 2015 | |
$ | 222,600 | | $ | 544,400 | |
| | | | | |
(h) The registrant’s Audit Committee of the Board of Directors has considered whether the provision of non-audit services that were rendered to the registrant’s adviser (not including any sub-adviser whose role is primarily portfolio management and is subcontracted with or overseen by another investment adviser), and any entity
controlling, controlled by, or under common control with the investment adviser that provides ongoing services to the registrant that were not pre-approved pursuant to paragraph (c)(7)(ii) of Rule 2-01 of Regulation S-X, is compatible with maintaining the principal accountant’s independence.
Item 5. Audit Committee of Listed Registrants.
Not applicable.
Item 6. Investments
(a) The registrant’s “Schedule I — Investments in securities of unaffiliated issuers” (as set forth in 17 CFR 210.12-12) is included in Item 1 of this Form N-CSR.
(b) Not applicable.
Item 7. Disclosure of Proxy Voting Policies and Procedures for Closed-End Management Investment Companies.
Not applicable.
Item 8. Portfolio Managers of Closed-End Management Investment Companies.
Not applicable.
Item 9. Purchases of Equity Securities by Closed-End Management Investment Company and Affiliated Purchasers.
Not applicable.
Item 10. Submission of Matters to a Vote of Security Holders.
There were no material changes to the procedures by which shareholders may recommend nominees to the registrant’s board of directors.
Item 11. Controls and Procedures.
(a) The registrant’s principal executive officer and principal financial officers, based on their evaluation of the registrant’s disclosure controls and procedures as of a date within 90 days of the filing of this report, have concluded that such controls and procedures are adequately designed to ensure that material information required to be disclosed by the registrant in Form N-CSR is accumulated and communicated to the registrant’s management, including the principal executive officer and principal financial officer, or persons performing similar functions, as appropriate to allow timely decisions regarding required disclosure.
(b) There was no change in the registrant’s internal control over financial reporting that occurred during the registrant’s second fiscal quarter of the period covered by this report that has materially affected, or is reasonably likely to materially affect, the registrant’s internal control over financial reporting.
Item 12. Exhibits.
(a)(1) Code of ethics required to be disclosed under Item 2 of Form N-CSR attached hereto as Exhibit 99.CODE ETH.
(a)(2) Certifications pursuant to Rule 30a-2(a) under the Investment Company Act of 1940 (17 CFR 270.30a-2(a)) attached hereto as Exhibit 99.CERT.
(a)(3) Not applicable.
(b) Certification pursuant to Rule 30a-2(b) under the Investment Company Act of 1940 (17 CFR 270.30a-2(b)) attached hereto as Exhibit 99.906CERT.
SIGNATURES
Pursuant to the requirements of the Securities Exchange Act of 1934 and the Investment Company Act of 1940, the registrant has duly caused this report to be signed on its behalf by the undersigned, thereunto duly authorized.
(registrant) | | Columbia Funds Series Trust | |
| | |
| | |
By (Signature and Title) | | /s/ Christopher O. Petersen | |
| Christopher O. Petersen, President and Principal Executive Officer | |
| | |
| | |
Date | | April 21, 2016 | |
| | | | | |
Pursuant to the requirements of the Securities Exchange Act of 1934 and the Investment Company Act of 1940, this report has been signed below by the following persons on behalf of the registrant and in the capacities and on the dates indicated.
By (Signature and Title) | | /s/ Christopher O. Petersen | |
| Christopher O. Petersen, President and Principal Executive Officer | |
| | |
| | |
Date | | April 21, 2016 | |
| | | |
| | | |
By (Signature and Title) | | /s/ Michael G. Clarke | |
| | Michael G. Clarke, Treasurer and Chief Financial Officer | |
| | |
| | |
Date | | April 21, 2016 | |
| | | | |