UNITED STATES
SECURITIES AND EXCHANGE COMMISSION
Washington, D.C. 20549
FORM N-CSR
CERTIFIED SHAREHOLDER REPORT OF REGISTERED
MANAGEMENT INVESTMENT COMPANIES
Investment Company Act file number | 811-09645 |
|
Columbia Funds Series Trust |
(Exact name of registrant as specified in charter) |
|
50606 Ameriprise Financial Center
Minneapolis, MN | | 55474 |
(Address of principal executive offices) | | (Zip code) |
|
Ryan Larrenaga c/o Columbia Management Investment Advisers, LLC 225 Franklin Street Boston, MA 02110 |
(Name and address of agent for service) |
|
Registrant’s telephone number, including area code: | (800) 345-6611 | |
|
Date of fiscal year end: | April 30 | |
|
Date of reporting period: | April 30, 2015 | |
| | | | | | | | |
Form N-CSR is to be used by management investment companies to file reports with the Commission not later than 10 days after the transmission to stockholders of any report that is required to be transmitted to stockholders under Rule 30e-1 under the Investment Company Act of 1940 (17 CFR 270.30e-1). The Commission may use the information provided on Form N-CSR in its regulatory, disclosure review, inspection, and policymaking roles.
A registrant is required to disclose the information specified by Form N-CSR, and the Commission will make this information public. A registrant is not required to respond to the collection of information contained in Form N-CSR unless the Form displays a currently valid Office of Management and Budget (“OMB”) control number. Please direct comments concerning the accuracy of the information collection burden estimate and any suggestions for reducing the burden to Secretary, Securities and Exchange Commission, 450 Fifth Street, NW, Washington, DC 20549-0609. The OMB has reviewed this collection of information under the clearance requirements of 44 U.S.C. § 3507.
Item 1. Reports to Stockholders.

ANNUAL REPORT
April 30, 2015

COLUMBIA AMT-FREE VIRGINIA INTERMEDIATE MUNI BOND FUND


ABOUT COLUMBIA THREADNEEDLE INVESTMENTS
Columbia Threadneedle Investments is a leading global asset management group that provides a broad range of actively managed investment strategies and solutions for individual, institutional and corporate clients around the world.
With more than 2,000 people, including over 450 investment professionals based in North America, Europe and Asia, we manage $506 billion* of assets across developed and emerging market equities, fixed income, asset allocation solutions and alternatives. We are the 12th largest manager of long-term mutual fund assets in the U.S.** and the 5th largest manager of retail funds in the U.K.***
Our priority is the investment success of our clients. We aim to deliver the investment outcomes they expect through an investment approach that is team-based, performance-driven and risk-aware. Our culture is dynamic and interactive. By sharing our insights across asset classes and geographies, we generate richer perspectives on global, regional and local investment landscapes. The ability to exchange and debate investment ideas in a collaborative environment enriches our teams' investment processes. More importantly, it results in better informed investment decisions for our clients.
Columbia funds are distributed by Columbia Management Investment Distributors, Inc., member FINRA, and managed by Columbia Management Investment Advisers, LLC.
Columbia Threadneedle Investments (Columbia Threadneedle) is the global brand name of the Columbia and Threadneedle group of companies.
* In U.S. dollars as of March 31, 2015. Source: Ameriprise Q1 Earnings Release. Includes all assets managed by entities in the Columbia and Threadneedle groups of companies. Contact us for more current data.
** Source: ICI as of March 31, 2015 for Columbia Management Investment Advisers, LLC.
*** Source: Investment Association as of March 2015 for Threadneedle Asset Management Limited.
© 2015 Columbia Management Investment Advisers, LLC. All rights reserved.
Not part of the shareholder report
Get the market insight you need from our investment experts
Connect with Columbia Threadneedle Investments
Investor insight
Find economic and market commentary, investment videos, white papers, mutual fund commentary and more at columbiathreadneedle.com/us.
 Columbia Threadneedle Investor Newsletter (e-newsletter)
Read our award-winning* shareholder newsletter. Our quarterly newsletter is available online and provides timely and relevant content about economic trends, fund news, service enhancements and changes. Sign up to receive the newsletter electronically at columbiathreadneedle.com/
us/newsletter.

 Investment videos
Get analysis of current events and trends that may affect your investments. Visit our online video library to watch and discover what our thought leaders are saying about the financial markets and economy.
 Social media
We offer you multiple ways to access our market commentary and investment insights.
n Perspectives blog at columbiathreadneedle.com/us
Read timely posts by our investment team, including our chief investment officer, chief economist and portfolio managers.
n twitter.com/CTinvest_US
Follow us on Twitter for quick, up-to-the-minute comments on market news and more.
n youtube.com/CTinvestUS
View our commentaries on the economy, markets and current investment opportunities.
n linkedin.com/company/columbia-threadneedle-investments-us
Connect with us on LinkedIn for updates from our thought leaders.
*Columbia Threadneedle Investor Newsletter was awarded top honors in the Mutual Fund Education Alliance STAR Awards competition for excellence in mutual fund marketing and communications in 2011, 2012 and 2013. Materials in the competition were evaluated on educational value, message comprehension, effective design and objectives.
Not part of the shareholder report
 Dear Shareholder,
In a world that is changing faster than ever before, investors want asset managers who offer a global perspective while generating strong and sustainable returns. To that end, Columbia Management, in conjunction with its U.K.-based affiliate, Threadneedle Investments, has rebranded to Columbia Threadneedle Investments. The new global brand represents the combined capabilities, resources and reach of the global group, offering investors access to the best of both firms.
With a presence in 18 countries and more than 450 investment professionals*, our collective perspective and world view as Columbia Threadneedle Investments gives us deeper insight into what might affect the real-life financial outcomes clients are seeking. Putting our views into a global context enables us to build richer perspectives and create the right solutions, and provides us with enhanced capabilities to deliver consistent investment performance, which may ultimately lead to better investor outcomes.
As a result of the rebrand, you will begin to see our new logo and colors reflected in printed materials, such as this shareholder report, as well as on our new website — columbiathreadneedle.com/us. We encourage you to visit us online and view a new video on the "About Us" tab that speaks to the strength of the firm.
While we are introducing a new brand, in many ways, the investment company you know well has not changed. The following remain in effect:
n Fund and strategy names
n Established investment teams, philosophies and processes
n Account services, features, servicing phone numbers and mailing addresses
n Columbia Management Investment Distributors as distributor and Columbia Management Investment Advisers as investment adviser
We recognize that the money we manage represents the hard work and savings of people like you, and that everyone has different ambitions and different definitions of success. Investors have varying goals — funding their children's education, enjoying their retirement, putting money aside for unexpected events, and more. Whatever your ambitions, we believe our wide range of investment products and solutions can help give you confidence that you will reach your goals.
The world is constantly changing, but our priority remains the same: to help you secure your finances, meet your goals and achieve success. Thank you for your continued investment with us. Our service representatives are available at 800.345.6611 to help with any questions.
Sincerely,

Christopher O. Petersen
President, Columbia Funds
Investors should consider the investment objectives, risks, charges and expenses of a mutual fund carefully before investing. For a free prospectus and summary prospectus, which contains this and other important information about a fund, visit columbiathreadneedle.com/us. The prospectus should be read carefully before investing.
* Source: Ameriprise as of December 1, 2014
Columbia Funds are distributed by Columbia Management Investment Distributors, Inc., member FINRA, and managed by Columbia Management Investment Advisers, LLC.
© 2015 Columbia Management Investment Advisers, LLC. All rights reserved.
COLUMBIA AMT-FREE VIRGINIA INTERMEDIATE MUNI BOND FUND
Performance Overview | | | 2 | | |
Manager Discussion of Fund Performance | | | 4 | | |
Understanding Your Fund's Expenses | | | 6 | | |
Portfolio of Investments | | | 7 | | |
Statement of Assets and Liabilities | | | 14 | | |
Statement of Operations | | | 16 | | |
Statement of Changes in Net Assets | | | 17 | | |
Financial Highlights | | | 19 | | |
Notes to Financial Statements | | | 24 | | |
Report of Independent Registered
Public Accounting Firm | | | 30 | | |
Federal Income Tax Information | | | 31 | | |
Trustees and Officers | | | 32 | | |
Approval of Investment Management Services Agreement | | | 37 | | |
Important Information About This Report | | | 39 | | |
Fund Investment Manager
Columbia Management Investment
Advisers, LLC
225 Franklin Street
Boston, MA 02110
Fund Distributor
Columbia Management Investment
Distributors, Inc.
225 Franklin Street
Boston, MA 02110
Fund Transfer Agent
Columbia Management Investment
Services Corp.
P.O. Box 8081
Boston, MA 02266-8081
For more information about any of the funds, please visit columbiathreadneedle.com/us or call 800.345.6611. Customer Service Representatives are available to answer your questions Monday through Friday from 8 a.m. to 7 p.m. Eastern time.
The views expressed in this report reflect the current views of the respective parties. These views are not guarantees of future performance and involve certain risks, uncertainties and assumptions that are difficult to predict, so actual outcomes and results may differ significantly from the views expressed. These views are subject to change at any time based upon economic, market or other conditions and the respective parties disclaim any responsibility to update such views. These views may not be relied on as investment advice and, because investment decisions for a Columbia fund are based on numerous factors, may not be relied on as an indication of trading intent on behalf of any particular Columbia fund. References to specific securities should not be construed as a recommendation or investment advice.
COLUMBIA AMT-FREE VIRGINIA INTERMEDIATE MUNI BOND FUND
Performance Summary
n Columbia AMT-Free Virginia Intermediate Muni Bond Fund (the Fund) Class A shares returned 3.21% excluding sales charges for the 12-month period that ended April 30, 2015. Class Z shares of the Fund returned 3.47% for the same time period.
n The Fund's benchmark, the Barclays 3-15 Year Blend Municipal Bond Index, returned 3.76% during the 12-month period.
n The Fund's yield curve positioning was the largest factor in its underperformance.
Average Annual Total Returns (%) (for period ended April 30, 2015)
| | | Inception | | 1 Year | | 5 Years | | 10 Years | |
Class A | | 12/05/89 | | | | | | | | | | | | | |
Excluding sales charges | | | | | | | 3.21 | | | | 3.25 | | | | 3.51 | | |
Including sales charges | | | | | | | 0.14 | | | | 2.63 | | | | 3.19 | | |
Class B | | 06/07/93 | | | | | | | | | | | | | |
Excluding sales charges | | | | | | | 2.35 | | | | 2.48 | | | | 2.74 | | |
Including sales charges | | | | | | | -0.65 | | | | 2.48 | | | | 2.74 | | |
Class C | | 06/17/92 | | | | | | | | | | | | | |
Excluding sales charges | | | | | | | 2.35 | | | | 2.48 | | | | 2.73 | | |
Including sales charges | | | | | | | 1.35 | | | | 2.48 | | | | 2.73 | | |
Class R4* | | 03/19/13 | | | 3.47 | | | | 3.50 | | | | 3.76 | | |
Class Z | | 09/20/89 | | | 3.47 | | | | 3.51 | | | | 3.76 | | |
Barclays 3-15 Year Blend Municipal Bond Index | | | | | | | 3.76 | | | | 4.35 | | | | 4.54 | | |
Returns for Class A are shown with and without the maximum initial sales charge of 3.00%. The maximum applicable sales charge was reduced from 3.25% to 3.00% on Class A share purchases made on or after February 19, 2015. Class A returns (including sales charges) for all periods reflect the current maximum applicable sales charge of 3.00%. Returns for Class B are shown with and without the applicable contingent deferred sales charge (CDSC) of 3.00% in the first year, declining to 1.00% in the fourth year and eliminated thereafter. Returns for Class C are shown with and without the 1.00% CDSC for the first year only. The Fund's other classes are not subject to sales charges and have limited eligibility. Please see the Fund's prospectus for details. Performance for different share classes will vary based on differences in sales charges and fees associated with each class. All results shown assume reinvestment of distributions during the period. Returns do not reflect the deduction of taxes that a shareholder may pay on Fund distributions or on the redemption of Fund shares. Performance results reflect the effect of any fee waivers or reimbursements of Fund expenses by Columbia Management Investment Advisers, LLC and/or any of its affiliates. Absent these fee waivers or expense reimbursement arrangements, performance results would have been lower.
The performance information shown represents past performance and is not a guarantee of future results. The investment return and principal value of your investment will fluctuate so that your shares, when redeemed, may be worth more or less than their original cost. Current performance may be lower or higher than the performance information shown. You may obtain performance information current to the most recent month-end by contacting your financial intermediary, visiting columbiathreadneedle.com/us or calling 800.345.6611.
*The returns shown for periods prior to the share class inception date (including returns for the Life of the Fund, if shown, which are since Fund inception) include the returns of the Fund's oldest share class. These returns are adjusted to reflect any higher class-related operating expenses of the newer share classes, as applicable. Please visit columbiathreadneedle.com/us/investment-products/mutual-funds/appended-performance for more information.
The Barclays 3-15 Year Blend Municipal Bond Index is an unmanaged index that tracks the performance of municipal bonds issued after December 31, 1990, with remaining maturities between 2 and 17 years and at least $7 million in principal amount outstanding.
Indices are not available for investment, are not professionally managed and do not reflect sales charges, fees, brokerage commissions, taxes or other expenses of investing. Securities in the Fund may not match those in an index.
Annual Report 2015
2
COLUMBIA AMT-FREE VIRGINIA INTERMEDIATE MUNI BOND FUND
PERFORMANCE OVERVIEW (continued)
Performance of a Hypothetical $10,000 Investment (May 1, 2005 – April 30, 2015)
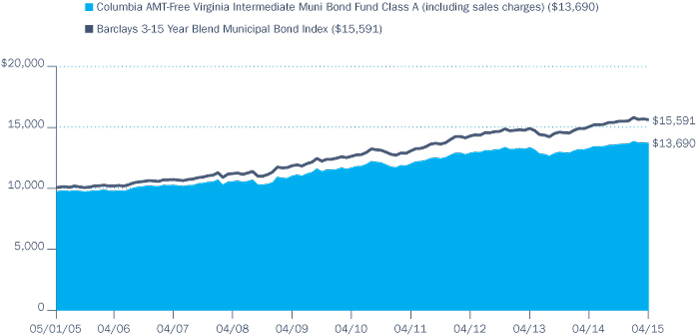
The chart above shows the change in value of a hypothetical $10,000 investment in Class A shares of Columbia AMT-Free Virginia Intermediate Muni Bond Fund during the stated time period, and does not reflect the deduction of taxes that a shareholder may pay on Fund distributions or on the redemption of Fund shares.
Annual Report 2015
3
COLUMBIA AMT-FREE VIRGINIA INTERMEDIATE MUNI BOND FUND
MANAGER DISCUSSION OF FUND PERFORMANCE
Portfolio Management
Brian McGreevy
Quality Breakdown (%)
(at April 30, 2015) | |
AAA rating | | | 17.8 | | |
AA rating | | | 51.1 | | |
A rating | | | 18.8 | | |
BBB rating | | | 8.0 | | |
B rating | | | 0.4 | | |
Not rated | | | 3.9 | | |
Total | | | 100.0 | | |
Percentages indicated are based upon total fixed income investments (excluding Money Market Funds).
Bond ratings apply to the underlying holdings of the Fund and not the Fund itself and are divided into categories ranging from highest to lowest credit quality, determined by using the middle rating of Moody's, S&P and Fitch, after dropping the highest and lowest available ratings. When ratings are available from only two rating agencies, the lower rating is used. When a rating is available from only one rating agency, that rating is used. When a bond is not rated by any rating agency, it is designated as "Not rated." Credit quality ratings assigned by a rating agency are subjective opinions, not statements of fact, and are subject to change, including daily. The ratings assigned by credit rating agencies are but one of the considerations that the Investment Manager and/or Fund's subadviser incorporates into its credit analysis process, along with such other issuer-specific factors as cash flows, capital structure and leverage ratios, ability to de-leverage (repay) through free cash flow, quality of management, market positioning and access to capital, as well as such security-specific factors as the terms of the security (e.g., interest rate and time to maturity) and the amount and type of any collateral.
For the 12-month period that ended April 30, 2015, the Fund's Class A shares returned 3.21% excluding sales charges. Class Z shares of the Fund returned 3.47% for the same time period. The Fund's benchmark, the Barclays 3-15 Year Blend Municipal Bond Index, returned 3.76% during the 12-month period. The Fund's yield curve positioning was the largest factor in its underperformance.
Market Overview
The U.S. municipal bond market generated positive performance during the past 12 months, with intermediate- and longer term debt generating the best results. While short-term bonds were pressured by the possibility that the U.S. Federal Reserve may begin to increase interest rates before the end of 2015, longer term issues were aided by the environment of slow growth, low inflation and investors' continued search for yield. Lower rated investment-grade bonds — those rated A and BBB — delivered the best returns and soundly outperformed high-rated AAA debt. On a sector basis, hospital and transportation issues outperformed. State and local general obligation bonds, which tend to be higher quality, lagged the returns of revenue bonds during the period.
Beginning in the fourth quarter of 2014, the supply of new municipal issues began to increase. The number of current and advanced refundings jumped considerably, and that trend continued into 2015 as issuers took advantage of lower rates to refinance older, higher yielding bonds. This is positive for issuers' credit outlook, as it allows them to reduce their interest costs. For bond holders, however, the refundings often cause higher yielding bonds to be called away from their portfolios, with the proceeds needing to be reinvested in lower yielding securities. Supply expectations for 2015 had risen to $400 billion by the close of the period, with the largest increase in refunding volume. On the demand side, continued flows into municipal bond funds provided firm support for the market throughout the past year.
Virginia Underperformed the National Municipal Market
The Virginia economy accelerated during the past 12 months, but at a rate well below the national average. The state has been hit hard by federal budget cuts, and while this is fading as a factor, uncertainty regarding the budget outlook continues to hamper growth and restrict both employment gains and average hourly earnings. In addition, population growth has been weak and the commercial property market has lagged the rest of the country due to reduced spending by federal contractors. Trade has been a positive factor, though much of the benefit has been a result of the West Coast port strike. Virginia's longer term outlook remains positive, as the state offers a business-friendly environment, but recent economic performance has been sub-par nonetheless.
Virginia's municipal bond market underperformed during the period due to the higher credit quality of local and state general obligation bonds. Virginia's debt is AAA rated, and many of the large municipalities are rated AA2 or higher. At a time in which lower quality bonds outperformed, Virginia's higher credit quality was a headwind to relative performance.
Annual Report 2015
4
COLUMBIA AMT-FREE VIRGINIA INTERMEDIATE MUNI BOND FUND
MANAGER DISCUSSION OF FUND PERFORMANCE (continued)
Contributors and Detractors
The Fund underperformed its benchmark during the 12-month period. We had a neutral duration positioning relative to the benchmark, meaning that its interest-rate sensitivity was approximately the same. The Fund also had more exposure to shorter maturities, which was a detractor from performance given that longer term issues delivered the best results. We did have an overweight position in the eight- to 12-year maturity range, which generated solid results and outperformed the broader market. The Fund was slightly underweight in the 12- to 17-year range, which outperformed, but it made up for some of the resulting shortfall through its exposure to bonds with maturities of 17 years and up.
In terms of credit quality, the Fund had a slightly higher weighting in AAA rated bonds than the benchmark. At a time in which lower quality market segments produced the strongest results, AAA bonds proved to be the weakest credit tier in the market. On the plus side, the Fund held an overweight position in A rated bonds, and our individual holdings outperformed the A rated bonds within the benchmark. Our positions in BBB rated bonds also performed very well during the period.
The Fund's positions in electric revenue and hospital issues outperformed, and transportation and special tax were also solid contributors. Water & sewer issues, which are a small component of the portfolio, lagged the overall market.
Sweet Briar College, in which the Fund had a small investment, announced it will be closing at the end of this term. The announcement came as somewhat of a surprise to the market given the college's overall financial status, but the administrators felt the declining enrollment, coupled with sizable growth in tuition discounts, decreased revenues to a level that made the school less viable in the future. We will continue to monitor the situation at Sweet Briar. Overall, we remain cautious with schools such as Sweet Briar, as we do not feel the yields adequately compensate investors for the risks.
Fund Positioning
Going forward, we currently intend to take a cautious stance on interest rates by maintaining a roughly neutral duration. Our overall quality positioning, along with the purchases we made during the period, continued to emphasize A and BBB rated issues for the additional income they offer. While yield spreads in these credit tiers have tightened considerably (meaning that investors are being paid less for the associated risks), we believe they still offer the most compelling relative value. Given the steep yield curve, we see value at this time in bonds maturing in the seven- to 12-year range.
Investment Risks
Fixed-income securities present issuer default risk. The Fund invests substantially in municipal securities and will be affected by tax, legislative, regulatory, demographic or political changes, as well as changes impacting a state's financial, economic or other conditions. A relatively small number of tax-exempt issuers may necessitate the Fund investing more heavily in a single issuer and, therefore, be more exposed to the risk of loss than a fund that invests more broadly. The value of the Fund's portfolio may be more volatile than a more geographically diversified fund. Prepayment and extension risk exists as a loan, bond or other investment may be called, prepaid or redeemed before maturity and that similar yielding investments may not be available for purchase. A rise in interest rates may result in a price decline of fixed-income instruments held by the Fund, negatively impacting its performance and NAV. Falling rates may result in the Fund investing in lower yielding debt instruments, lowering the Fund's income and yield. These risks may be heightened for longer maturity and duration securities. Non-investment-grade (high-yield or junk) securities present greater price volatility and more risk to principal and income than higher rated securities. Market risk may affect a single issuer, sector of the economy, industry or the market as a whole. Federal and state tax rules apply to capital gain distributions and any gains or losses on sales. Income may be subject to state or local taxes. Liquidity risk is associated with the difficulty of selling underlying investments at a desirable time or price. See the Fund's prospectus for more information on these and other risks.
Annual Report 2015
5
COLUMBIA AMT-FREE VIRGINIA INTERMEDIATE MUNI BOND FUND
UNDERSTANDING YOUR FUND'S EXPENSES
(Unaudited)
As an investor, you incur two types of costs. There are transaction costs, which generally include sales charges on purchases and may include redemption fees. There are also ongoing costs, which generally include management fees, distribution and/or service fees, and other fund expenses. The following information is intended to help you understand your ongoing costs (in dollars) of investing in the Fund and to help you compare these costs with the ongoing costs of investing in other mutual funds.
Analyzing Your Fund's Expenses
To illustrate these ongoing costs, we have provided examples and calculated the expenses paid by investors in each share class of the Fund during the period. The actual and hypothetical information in the table is based on an initial investment of $1,000 at the beginning of the period indicated and held for the entire period. Expense information is calculated two ways and each method provides you with different information. The amount listed in the "Actual" column is calculated using the Fund's actual operating expenses and total return for the period. You may use the Actual information, together with the amount invested, to estimate the expenses that you paid over the period. Simply divide your account value by $1,000 (for example, an $8,600 account value divided by $1,000 = 8.6), then multiply the results by the expenses paid during the period under the "Actual" column. The amount listed in the "Hypothetical" column assumes a 5% annual rate of return before expenses (which is not the Fund's actual return) and then applies the Fund's actual expense ratio for the period to the hypothetical return. You should not use the hypothetical account values and expenses to estimate either your actual account balance at the end of the period or the expenses you paid during the period. See "Compare With Other Funds" below for details on how to use the hypothetical data.
Compare With Other Funds
Since all mutual funds are required to include the same hypothetical calculations about expenses in shareholder reports, you can use this information to compare the ongoing cost of investing in the Fund with other funds. To do so, compare the hypothetical example with the 5% hypothetical examples that appear in the shareholder reports of other funds. As you compare hypothetical examples of other funds, it is important to note that hypothetical examples are meant to highlight the ongoing costs of investing in a fund only and do not reflect any transaction costs, such as sales charges, or redemption or exchange fees. Therefore, the hypothetical calculations are useful in comparing ongoing costs only, and will not help you determine the relative total costs of owning different funds. If transaction costs were included in these calculations, your costs would be higher.
November 1, 2014 – April 30, 2015
| | | Account Value at the Beginning
of the Period ($) | | Account Value at the End of the
Period ($) | | Expenses Paid During the
Period ($) | | Fund's Annualized
Expense Ratio (%) | |
| | | Actual | | Hypothetical | | Actual | | Hypothetical | | Actual | | Hypothetical | | Actual | |
Class A | | | 1,000.00 | | | | 1,000.00 | | | | 1,006.70 | | | | 1,020.78 | | | | 4.03 | | | | 4.06 | | | | 0.81 | | |
Class B | | | 1,000.00 | | | | 1,000.00 | | | | 1,002.10 | | | | 1,017.06 | | | | 7.74 | | | | 7.80 | | | | 1.56 | | |
Class C | | | 1,000.00 | | | | 1,000.00 | | | | 1,002.10 | | | | 1,017.06 | | | | 7.74 | | | | 7.80 | | | | 1.56 | | |
Class R4 | | | 1,000.00 | | | | 1,000.00 | | | | 1,007.10 | | | | 1,022.02 | | | | 2.79 | | | | 2.81 | | | | 0.56 | | |
Class Z | | | 1,000.00 | | | | 1,000.00 | | | | 1,008.00 | | | | 1,022.02 | | | | 2.79 | | | | 2.81 | | | | 0.56 | | |
Expenses paid during the period are equal to the annualized expense ratio for each class as indicated above, multiplied by the average account value over the period and then multiplied by the number of days in the Fund's most recent fiscal half year and divided by 365.
Expenses do not include fees and expenses incurred indirectly by the Fund from its investment in underlying funds, including affiliated and non-affiliated pooled investment vehicles, such as mutual funds and exchange-traded funds.
Had Columbia Management Investment Advisers, LLC and/or certain of its affiliates not waived/reimbursed certain fees and expenses, account value at the end of the period would have been reduced.
Annual Report 2015
6
COLUMBIA AMT-FREE VIRGINIA INTERMEDIATE MUNI BOND FUND
PORTFOLIO OF INVESTMENTS
April 30, 2015
(Percentages represent value of investments compared to net assets)
Municipal Bonds 98.4%
Issue
Description | | Coupon
Rate | | Principal
Amount ($) | |
Value ($) | |
AIRPORT 6.2% | |
Metropolitan Washington Airports Authority
Refunding Revenue Bonds
Series 2010F-1
10/01/21 | | | 5.000 | % | | | 1,000,000 | | | | 1,184,510 | | |
Revenue Bonds
Series 2009B
10/01/21 | | | 5.000 | % | | | 3,000,000 | | | | 3,452,400 | | |
Series 2009C
10/01/23 | | | 5.000 | % | | | 3,000,000 | | | | 3,362,370 | | |
Series 2010A
10/01/23 | | | 5.000 | % | | | 2,475,000 | | | | 2,896,443 | | |
10/01/27 | | | 5.000 | % | | | 1,515,000 | | | | 1,747,507 | | |
Norfolk Airport Authority
Refunding Revenue Bonds
Series 2011 (AGM)
07/01/24 | | | 5.000 | % | | | 1,000,000 | | | | 1,145,470 | | |
Total | | | | | | | 13,788,700 | | |
HIGHER EDUCATION 7.5% | |
Amherst Industrial Development Authority
Refunding Revenue Bonds
Educational Facilities Sweet Briar Institute
Series 2006
09/01/26 | | | 5.000 | % | | | 1,000,000 | | | | 983,800 | | |
Lexington Industrial Development Authority
Revenue Bonds
VMI Development Board, Inc. Project
Series 2006A(a)
12/01/20 | | | 5.000 | % | | | 1,400,000 | | | | 1,662,010 | | |
Virginia College Building Authority
Refunding Revenue Bonds
University of Richmond Project
Series 2011A
03/01/22 | | | 5.000 | % | | | 1,245,000 | | | | 1,482,870 | | |
Series 2011B
03/01/21 | | | 5.000 | % | | | 2,250,000 | | | | 2,666,880 | | |
Revenue Bonds
Liberty University Projects
Series 2010
03/01/19 | | | 5.000 | % | | | 1,000,000 | | | | 1,141,390 | | |
03/01/22 | | | 5.000 | % | | | 1,455,000 | | | | 1,681,645 | | |
03/01/23 | | | 5.000 | % | | | 2,000,000 | | | | 2,306,340 | | |
Roanoke College
Series 2007
04/01/23 | | | 5.000 | % | | | 1,000,000 | | | | 1,077,530 | | |
Washington & Lee University Project
Series 1998 (NPFGC)
01/01/26 | | | 5.250 | % | | | 3,115,000 | | | | 3,814,131 | | |
Total | | | | | | | 16,816,596 | | |
Municipal Bonds (continued)
Issue
Description | | Coupon
Rate | | Principal
Amount ($) | |
Value ($) | |
HOSPITAL 9.5% | |
Augusta County Economic Development Authority
Refunding Revenue Bonds
Augusta Health Care, Inc.
Series 2003
09/01/19 | | | 5.250 | % | | | 905,000 | | | | 1,043,221 | | |
Fairfax County Industrial Development Authority
Refunding Revenue Bonds
Inova Health System Project
Series 1993
08/15/19 | | | 5.250 | % | | | 1,000,000 | | | | 1,105,120 | | |
Series 1993I (NPFGC)
08/15/19 | | | 5.250 | % | | | 1,000,000 | | | | 1,086,650 | | |
Revenue Bonds
Inova Health System
Series 2009C
05/15/25 | | | 5.000 | % | | | 1,000,000 | | | | 1,137,500 | | |
Fredericksburg Economic Development Authority
Refunding Revenue Bonds
MediCorp Health Systems Obligation
Series 2007
06/15/18 | | | 5.250 | % | | | 1,000,000 | | | | 1,089,630 | | |
06/15/20 | | | 5.250 | % | | | 4,000,000 | | | | 4,486,680 | | |
Norfolk Economic Development Authority
Refunding Revenue Bonds
Sentara Healthcare
Series 2012B
11/01/27 | | | 5.000 | % | | | 1,735,000 | | | | 1,981,804 | | |
Roanoke Economic Development Authority
Refunding Revenue Bonds
Carilion Clinic Obligation Group
Series 2010
07/01/25 | | | 5.000 | % | | | 3,500,000 | | | | 3,949,820 | | |
Revenue Bonds
Carilion Clinic Obligation Group
Series 2012
07/01/22 | | | 5.000 | % | | | 2,000,000 | | | | 2,347,080 | | |
07/01/23 | | | 5.000 | % | | | 1,000,000 | | | | 1,162,790 | | |
Virginia Small Business Financing Authority
Revenue Bonds
Wellmont Health System Project
Series 2007A
09/01/22 | | | 5.125 | % | | | 710,000 | | | | 753,012 | | |
Winchester Economic Development Authority
Revenue Bonds
Valley Health System Obligation Group
Series 2007
01/01/26 | | | 5.000 | % | | | 1,170,000 | | | | 1,243,452 | | |
Total | | | | | | | 21,386,759 | | |
The accompanying Notes to Financial Statements are an integral part of this statement.
Annual Report 2015
7
COLUMBIA AMT-FREE VIRGINIA INTERMEDIATE MUNI BOND FUND
PORTFOLIO OF INVESTMENTS (continued)
April 30, 2015
Municipal Bonds (continued)
Issue
Description | | Coupon
Rate | | Principal
Amount ($) | |
Value ($) | |
INVESTOR OWNED 1.0% | |
Chesterfield County Economic Development Authority
Refunding Revenue Bonds
Virginia Electric & Power Co.
Series 2009A
05/01/23 | | | 5.000 | % | | | 2,000,000 | | | | 2,284,760 | | |
LOCAL APPROPRIATION 4.8% | |
Appomattox County Economic Development Authority
Refunding Revenue Bonds
Series 2010
05/01/22 | | | 5.000 | % | | | 1,490,000 | | | | 1,684,385 | | |
Fairfax County Economic Development Authority
Revenue Bonds
Six Public Facilities Projects
Series 2010
04/01/24 | | | 4.000 | % | | | 1,340,000 | | | | 1,426,966 | | |
Henrico County Economic Development Authority
Refunding Revenue Bonds
Series 2009B
08/01/21 | | | 4.500 | % | | | 1,770,000 | | | | 1,984,683 | | |
James City County Economic Development Authority
Revenue Bonds
Public Facilities Projects
Series 2006 (AGM)
06/15/23 | | | 5.000 | % | | | 2,000,000 | | | | 2,159,220 | | |
Loudoun County Economic Development Authority
Revenue Bonds
Series 2015
12/01/28 | | | 5.000 | % | | | 1,035,000 | | | | 1,218,102 | | |
Montgomery County Industrial Development Authority
Revenue Bonds
Public Projects
Series 2008
02/01/29 | | | 5.000 | % | | | 1,000,000 | | | | 1,088,560 | | |
Prince William County Industrial Development Authority
Refunding Revenue Bonds
ATCC Project
Series 2005
02/01/17 | | | 5.250 | % | | | 1,115,000 | | | | 1,206,096 | | |
Total | | | | | | | 10,768,012 | | |
LOCAL GENERAL OBLIGATION 13.9% | |
City of Hampton
Limited General Obligation Refunding & Public Improvement Bonds
Series 2010A
01/15/19 | | | 4.000 | % | | | 2,000,000 | | | | 2,202,900 | | |
City of Lynchburg
Unlimited General Obligation Public Improvement Bonds
Series 2009A
08/01/20 | | | 5.000 | % | | | 525,000 | | | | 606,380 | | |
08/01/21 | | | 5.000 | % | | | 530,000 | | | | 609,574 | | |
Municipal Bonds (continued)
Issue
Description | | Coupon
Rate | | Principal
Amount ($) | |
Value ($) | |
City of Manassas Park
Unlimited General Obligation Refunding Bonds
Series 2008 (AGM)
01/01/22 | | | 5.000 | % | | | 1,205,000 | | | | 1,324,259 | | |
City of Manassas
Unlimited General Obligation Refunding Bonds
Series 2014C
07/01/25 | | | 5.000 | % | | | 2,000,000 | | | | 2,461,760 | | |
City of Newport News
Unlimited General Obligation Refunding & Improvement Bonds
Water
Series 2007B
07/01/20 | | | 5.250 | % | | | 2,000,000 | | | | 2,380,480 | | |
Unlimited General Obligation Refunding Bonds
Series 2006B
02/01/18 | | | 5.250 | % | | | 3,030,000 | | | | 3,386,904 | | |
City of Portsmouth
Unlimited General Obligation Refunding Bonds
Public Utilities
Series 2012A
07/15/21 | | | 5.000 | % | | | 3,000,000 | | | | 3,593,460 | | |
City of Richmond
Unlimited General Obligation Public Improvement Bonds
Series 2010D
07/15/22 | | | 5.000 | % | | | 575,000 | | | | 677,310 | | |
07/15/24 | | | 5.000 | % | | | 1,000,000 | | | | 1,173,320 | | |
City of Suffolk
Unlimited General Obligation Refunding Bonds
Series 2014
02/01/29 | | | 4.000 | % | | | 2,000,000 | | | | 2,180,220 | | |
City of Virginia Beach
Unlimited General Obligation Refunding & Public Improvement Bonds
Series 2004B
05/01/17 | | | 5.000 | % | | | 1,000,000 | | | | 1,067,780 | | |
County of Arlington
Unlimited General Obligation Refunding Bonds
Public Improvement
Series 2006
08/01/17 | | | 5.000 | % | | | 2,400,000 | | | | 2,540,496 | | |
County of Pittsylvania
Unlimited General Obligation Bonds
Series 2008B
02/01/23 | | | 5.500 | % | | | 1,030,000 | | | | 1,181,348 | | |
County of Smyth
Unlimited General Obligation Bonds
Public Improvement
Series 2011A
11/01/31 | | | 5.000 | % | | | 4,000,000 | | | | 4,469,440 | | |
The accompanying Notes to Financial Statements are an integral part of this statement.
Annual Report 2015
8
COLUMBIA AMT-FREE VIRGINIA INTERMEDIATE MUNI BOND FUND
PORTFOLIO OF INVESTMENTS (continued)
April 30, 2015
Municipal Bonds (continued)
Issue
Description | | Coupon
Rate | | Principal
Amount ($) | |
Value ($) | |
Town of Leesburg
Unlimited General Obligation Refunding Bonds
Series 2006B
09/15/17 | | | 5.000 | % | | | 1,145,000 | | | | 1,260,645 | | |
Total | | | | | | | 31,116,276 | | |
OTHER BOND ISSUE 0.7% | |
Virginia Beach Development Authority
Revenue Bonds
Series 2010C
08/01/23 | | | 5.000 | % | | | 1,380,000 | | | | 1,603,422 | | |
POOL/BOND BANK 14.4% | |
Virginia Public School Authority
Refunding Revenue Bonds
School Financing
Series 2009C
08/01/25 | | | 4.000 | % | | | 2,560,000 | | | | 2,741,478 | | |
School Financing 1997 Resolution
Series 2004C
08/01/16 | | | 5.000 | % | | | 3,500,000 | | | | 3,702,755 | | |
Virginia Resources Authority
Refunding Revenue Bonds
Revolving Fund
Series 2011A
08/01/24 | | | 5.000 | % | | | 1,395,000 | | | | 1,612,188 | | |
Series 2015
10/01/27 | | | 5.000 | % | | | 1,500,000 | | | | 1,841,310 | | |
State Revolving Fund
Subordinated Series 2005
10/01/19 | | | 5.500 | % | | | 4,000,000 | | | | 4,726,720 | | |
10/01/20 | | | 5.500 | % | | | 3,500,000 | | | | 4,247,880 | | |
10/01/21 | | | 5.500 | % | | | 6,475,000 | | | | 8,013,007 | | |
Unrefunded Revenue Bonds
Series 2009B
11/01/18 | | | 4.000 | % | | | 3,870,000 | | | | 4,261,063 | | |
St. Moral
Series 2009B
11/01/18 | | | 4.000 | % | | | 965,000 | | | | 1,059,821 | | |
Total | | | | | | | 32,206,222 | | |
REFUNDED/ESCROWED 12.0% | |
City of Newport News
Prerefunded 07/01/20 Unlimited General Obligation
Improvement Bonds
Series 2011A
07/01/23 | | | 5.000 | % | | | 1,380,000 | | | | 1,627,655 | | |
City of Portsmouth
Unlimited General Obligation Refunding Bonds
Series 2006A Escrowed to Maturity (NPFGC)
07/01/16 | | | 5.000 | % | | | 340,000 | | | | 358,598 | | |
07/01/16 | | | 5.000 | % | | | 660,000 | | | | 696,102 | | |
Municipal Bonds (continued)
Issue
Description | | Coupon
Rate | | Principal
Amount ($) | |
Value ($) | |
County of Fairfax
Prerefunded 04/01/21 Unlimited General Obligation
Refunding Bonds
Public Improvement
Series 2011A
04/01/24 | | | 4.000 | % | | | 2,000,000 | | | | 2,276,760 | | |
County of Henrico
Prerefunded 12/01/18 Unlimited General Obligation
Public Improvement Bonds
Series 2008A
12/01/21 | | | 5.000 | % | | | 1,000,000 | | | | 1,138,580 | | |
County of Prince William
Prerefunded 09/01/16 Certificate of Participation
Prince William County Facilities
Series 2006A (AMBAC)
09/01/17 | | | 5.000 | % | | | 800,000 | | | | 849,272 | | |
09/01/21 | | | 5.000 | % | | | 1,625,000 | | | | 1,725,084 | | |
Hampton Roads Sanitation District
Prerefunded 04/01/18 Revenue Bonds
Series 2008
04/01/22 | | | 5.000 | % | | | 1,000,000 | | | | 1,117,110 | | |
04/01/24 | | | 5.000 | % | | | 3,000,000 | | | | 3,351,330 | | |
Prerefunded 11/01/19 Revenue Bonds
Series 2011
11/01/24 | | | 5.000 | % | | | 1,750,000 | | | | 2,036,965 | | |
11/01/25 | | | 5.000 | % | | | 1,380,000 | | | | 1,606,292 | | |
New Kent County Economic Development Authority
Prerefunded 02/01/17 Revenue Bonds
School & Governmental Projects
Series 2006 (AGM)
02/01/21 | | | 5.000 | % | | | 2,075,000 | | | | 2,231,642 | | |
Newport News Economic Development Authority
Prerefunded 01/15/16 Revenue Bonds
Series 2005A
01/15/23 | | | 5.250 | % | | | 1,510,000 | | | | 1,562,835 | | |
Richmond Metropolitan Authority
Refunding Revenue Bonds
Series 1998 Escrowed to Maturity (NPFGC)
07/15/17 | | | 5.250 | % | | | 420,000 | | | | 442,966 | | |
Virginia Resources Authority
Prerefunded 10/01/18 Revenue Bonds
State Revolving Fund
Subordinated Series 2008
10/01/29 | | | 5.000 | % | | | 5,000,000 | | | | 5,658,850 | | |
Prerefunded Revenue Bonds
Series 2009B Escrowed to Maturity
11/01/18 | | | 4.000 | % | | | 130,000 | | | | 143,043 | | |
St. Moral
Series 2009B Escrowed to Maturity
11/01/18 | | | 4.000 | % | | | 35,000 | | | | 38,511 | | |
Total | | | | | | | 26,861,595 | | |
The accompanying Notes to Financial Statements are an integral part of this statement.
Annual Report 2015
9
COLUMBIA AMT-FREE VIRGINIA INTERMEDIATE MUNI BOND FUND
PORTFOLIO OF INVESTMENTS (continued)
April 30, 2015
Municipal Bonds (continued)
Issue
Description | | Coupon
Rate | | Principal
Amount ($) | |
Value ($) | |
RETIREMENT COMMUNITIES 4.2% | |
Albermarle County Economic Development Authority
Revenue Bonds
Westminster-Canterbury of the Blue Ridge
Series 2012
01/01/32 | | | 4.625 | % | | | 2,000,000 | | | | 2,034,120 | | |
Fairfax County Economic Development Authority
Refunding Revenue Bonds
Retirement-Greenspring Village, Inc.
Series 2006A
10/01/26 | | | 4.750 | % | | | 2,000,000 | | | | 2,043,120 | | |
Revenue Bonds
Goodwin House, Inc.
Series 2007
10/01/22 | | | 5.000 | % | | | 2,500,000 | | | | 2,662,950 | | |
Hanover County Economic Development Authority
Revenue Bonds
Covenant Woods
Series 2012A
07/01/22 | | | 4.000 | % | | | 1,320,000 | | | | 1,346,347 | | |
Henrico County Economic Development Authority
Refunding Revenue Bonds
Westminster-Canterbury Corp.
Series 2015
10/01/35 | | | 4.000 | % | | | 1,320,000 | | | | 1,256,152 | | |
Total | | | | | | | 9,342,689 | | |
SALES TAX 1.0% | |
Northern Virginia Transportation Authority
Revenue Bonds
Series 2014
06/01/32 | | | 5.000 | % | | | 2,000,000 | | | | 2,328,120 | | |
SPECIAL NON PROPERTY TAX 7.7% | |
Greater Richmond Convention Center Authority
Refunding Revenue Bonds
Series 2005 (NPFGC)
06/15/25 | | | 5.000 | % | | | 2,000,000 | | | | 2,011,660 | | |
Series 2015
06/15/29 | | | 5.000 | % | | | 1,350,000 | | | | 1,562,490 | | |
06/15/30 | | | 5.000 | % | | | 1,540,000 | | | | 1,769,445 | | |
Riverside Regional Jail Authority
Refunding Revenue Bonds
Series 2015
07/01/28 | | | 5.000 | % | | | 2,685,000 | | | | 3,174,529 | | |
Shops at White Oak Village Community Development
Authority (The)
Special Assessment Bonds
Series 2007
03/01/17 | | | 5.300 | % | | | 888,000 | | | | 927,507 | | |
Municipal Bonds (continued)
Issue
Description | | Coupon
Rate | | Principal
Amount ($) | |
Value ($) | |
Territory of Guam
Revenue Bonds
Series 2011A(b)
01/01/31 | | | 5.000 | % | | | 850,000 | | | | 936,904 | | |
Virgin Islands Public Finance Authority(b)
Revenue Bonds
Matching Fund Loan Notes-Senior Lien
Series 2010A
10/01/25 | | | 5.000 | % | | | 2,450,000 | | | | 2,755,931 | | |
Series 2012-A
10/01/32 | | | 5.000 | % | | | 2,210,000 | | | | 2,405,320 | | |
Western Regional Jail Authority
Refunding Revenue Bonds
Series 2015(c)
12/01/27 | | | 5.000 | % | | | 1,500,000 | | | | 1,804,155 | | |
Total | | | | | | | 17,347,941 | | |
SPECIAL PROPERTY TAX 5.5% | |
Dulles Town Center Community Development Authority
Refunding Special Assessment Bonds
Dulles Town Center Project
Series 2012
03/01/23 | | | 4.000 | % | | | 1,000,000 | | | | 990,670 | | |
Fairfax County Economic Development Authority
Special Tax Bonds
Silver Line Phase I Project
Series 2011
04/01/19 | | | 5.000 | % | | | 3,000,000 | | | | 3,417,870 | | |
04/01/26 | | | 5.000 | % | | | 4,185,000 | | | | 4,808,481 | | |
Marquis Community Development Authority of York County(d)(e)
Tax Allocation Bonds
Series 2007C
09/01/41 | | | 0.000 | % | | | 3,164,000 | | | | 423,976 | | |
Marquis Community Development Authority of York County(e)
Tax Allocation Bonds
Series 2007B
09/01/41 | | | 5.625 | % | | | 2,084,000 | | | | 1,883,374 | | |
Virginia Gateway Community Development Authority
Refunding Special Assessment Bonds
Series 2012
03/01/25 | | | 5.000 | % | | | 690,000 | | | | 724,562 | | |
Total | | | | | | | 12,248,933 | | |
TRANSPORTATION 1.5% | |
Virginia Commonwealth Transportation Board
Revenue Bonds
Capital Projects
Series 2012
05/15/29 | | | 5.000 | % | | | 3,000,000 | | | | 3,439,740 | | |
The accompanying Notes to Financial Statements are an integral part of this statement.
Annual Report 2015
10
COLUMBIA AMT-FREE VIRGINIA INTERMEDIATE MUNI BOND FUND
PORTFOLIO OF INVESTMENTS (continued)
April 30, 2015
Municipal Bonds (continued)
Issue
Description | | Coupon
Rate | | Principal
Amount ($) | |
Value ($) | |
TURNPIKE/BRIDGE/TOLL ROAD 4.9% | |
Chesapeake Bay Bridge & Tunnel District
Refunding Revenue Bonds
General Resolution
Series 1998 (NPFGC)
07/01/25 | | | 5.500 | % | | | 4,000,000 | | | | 4,717,000 | | |
City of Chesapeake Expressway Toll Road
Revenue Bonds
Transportation System
Senior Series 2012A
07/15/23 | | | 5.000 | % | | | 1,025,000 | | | | 1,167,669 | | |
07/15/27 | | | 5.000 | % | | | 1,000,000 | | | | 1,074,500 | | |
Metropolitan Washington Airports Authority Dulles Toll Road
Revenue Bonds
Capital Appreciation-2nd Senior Lien
Series 2009B (AGM)(d)
10/01/23 | | | 0.000 | % | | | 5,000,000 | | | | 3,775,300 | | |
Richmond Metropolitan Authority
Refunding Revenue Bonds
Series 1998 (NPFGC)
07/15/17 | | | 5.250 | % | | | 225,000 | | | | 235,105 | | |
Total | | | | | | | 10,969,574 | | |
WATER & SEWER 3.6% | |
City of Newport News Water
Revenue Bonds
Series 2007 (AGM)
06/01/19 | | | 5.000 | % | | | 1,035,000 | | | | 1,124,796 | | |
Municipal Bonds (continued)
Issue
Description | | Coupon
Rate | | Principal
Amount ($) | |
Value ($) | |
City of Norfolk Water
Refunding Revenue Bonds
Series 2012
11/01/19 | | | 5.000 | % | | | 1,000,000 | | | | 1,159,540 | | |
City of Richmond
Revenue Bonds
Series 2007 (AGM)
01/15/21 | | | 4.500 | % | | | 1,000,000 | | | | 1,062,170 | | |
County of Spotsylvania Water & Sewer
Revenue Bonds
Series 2007 (AGM)
06/01/19 | | | 5.000 | % | | | 1,030,000 | | | | 1,119,929 | | |
Fairfax County Water Authority
Refunding Revenue Bonds
Subordinated Series 2005B
04/01/19 | | | 5.250 | % | | | 1,835,000 | | | | 2,120,985 | | |
Upper Occoquan Sewage Authority
Revenue Bonds
Series 1995A (NPFGC)
07/01/20 | | | 5.150 | % | | | 1,295,000 | | | | 1,453,068 | | |
Total | | | | | | | 8,040,488 | | |
Total Municipal Bonds
(Cost: $206,174,310) | | | | | | | 220,549,827 | | |
Total Investments
(Cost: $206,174,310) | | | | | | | 220,549,827 | | |
Other Assets & Liabilities, Net | | | | | | | 3,636,678 | | |
Net Assets | | | | | | | 224,186,505 | | |
Notes to Portfolio of Investments
(a) Variable rate security.
(b) Municipal obligations include debt obligations issued by or on behalf of territories, possessions, or sovereign nations within the territorial boundaries of the United States. At April 30, 2015, the value of these securities amounted to $6,098,155 or 2.72% of net assets.
(c) Security, or a portion thereof, has been purchased on a when-issued or delayed delivery basis.
(d) Zero coupon bond.
(e) Identifies securities considered by the Investment Manager to be illiquid as to their marketability. The aggregate value of such securities at April 30, 2015 was $2,307,350, which represents 1.03% of net assets. Information concerning such security holdings at April 30, 2015 is as follows:
Security Description | | Acquisition Dates | | Cost ($) | |
Marquis Community Development Authority of York County
Tax Allocation Bonds
Series 2007B
09/01/41 5.625% | | 11/30/07 | | | 2,084,000 | | |
Marquis Community Development Authority of York County
Tax Allocation Bonds
Series 2007C
09/01/41 0.000% | | 11/30/07 | | | 882,663 | | |
The accompanying Notes to Financial Statements are an integral part of this statement.
Annual Report 2015
11
COLUMBIA AMT-FREE VIRGINIA INTERMEDIATE MUNI BOND FUND
PORTFOLIO OF INVESTMENTS (continued)
April 30, 2015
AGM Assured Guaranty Municipal Corporation
AMBAC Ambac Assurance Corporation
NPFGC National Public Finance Guarantee Corporation
Fair Value Measurements
Generally accepted accounting principles (GAAP) require disclosure regarding the inputs and valuation techniques used to measure fair value and any changes in valuation inputs or techniques. In addition, investments shall be disclosed by major category.
The Fund categorizes its fair value measurements according to a three-level hierarchy that maximizes the use of observable inputs and minimizes the use of unobservable inputs by prioritizing that the most observable input be used when available. Observable inputs are those that market participants would use in pricing an investment based on market data obtained from sources independent of the reporting entity. Unobservable inputs are those that reflect the Fund's assumptions about the information market participants would use in pricing an investment. An investment's level within the fair value hierarchy is based on the lowest level of any input that is deemed significant to the asset or liability's fair value measurement. The input levels are not necessarily an indication of the risk or liquidity associated with investments at that level. For example, certain U.S. government securities are generally high quality and liquid, however, they are reflected as Level 2 because the inputs used to determine fair value may not always be quoted prices in an active market.
Fair value inputs are summarized in the three broad levels listed below:
> Level 1 — Valuations based on quoted prices for investments in active markets that the Fund has the ability to access at the measurement date (including NAV for open-end mutual funds). Valuation adjustments are not applied to Level 1 investments.
> Level 2 — Valuations based on other significant observable inputs (including quoted prices for similar securities, interest rates, prepayment speeds, credit risks, etc.).
> Level 3 — Valuations based on significant unobservable inputs (including the Fund's own assumptions and judgment in determining the fair value of investments).
Inputs that are used in determining fair value of an investment may include price information, credit data, volatility statistics, and other factors. These inputs can be either observable or unobservable. The availability of observable inputs can vary between investments, and is affected by various factors such as the type of investment, and the volume and level of activity for that investment or similar investments in the marketplace. The inputs will be considered by the Investment Manager, along with any other relevant factors in the calculation of an investment's fair value. The Fund uses prices and inputs that are current as of the measurement date, which may include periods of market dislocations. During these periods, the availability of prices and inputs may be reduced for many investments. This condition could cause an investment to be reclassified between the various levels within the hierarchy.
Investments falling into the Level 3 category are primarily supported by quoted prices from brokers and dealers participating in the market for those investments. However, these may be classified as Level 3 investments due to lack of market transparency and corroboration to support these quoted prices. Additionally, valuation models may be used as the pricing source for any remaining investments classified as Level 3. These models may rely on one or more significant unobservable inputs and/or significant assumptions by the Investment Manager. Inputs used in valuations may include, but are not limited to, financial statement analysis, capital account balances, discount rates and estimated cash flows, and comparable company data.
Under the direction of the Fund's Board of Trustees (the Board), the Investment Manager's Valuation Committee (the Committee) is responsible for overseeing the valuation procedures approved by the Board. The Committee consists of voting and non-voting members from various groups within the Investment Manager's organization, including operations and accounting, trading and investments, compliance, risk management and legal.
The Committee meets at least monthly to review and approve valuation matters, which may include a description of specific valuation determinations, data regarding pricing information received from approved pricing vendors and brokers and the results of Board-approved valuation control policies and procedures (the Policies). The Policies address, among other things, instances when market quotations are or are not readily available, including recommendations of third party pricing vendors and a determination of appropriate pricing methodologies; events that require specific valuation determinations and assessment of fair value techniques; securities with a potential for stale pricing, including those that are illiquid, restricted, or in default; and the effectiveness of third party pricing vendors, including periodic reviews of vendors. The Committee meets more frequently, as needed, to discuss additional valuation matters, which may include the need to review back-testing results, review time-sensitive information or approve related valuation actions. The Committee reports to the Board, with members of the Committee meeting with the Board at each of its regularly scheduled meetings to discuss valuation matters and actions during the period, similar to those described earlier.
The accompanying Notes to Financial Statements are an integral part of this statement.
Annual Report 2015
12
COLUMBIA AMT-FREE VIRGINIA INTERMEDIATE MUNI BOND FUND
PORTFOLIO OF INVESTMENTS (continued)
April 30, 2015
Fair Value Measurements (continued)
For investments categorized as Level 3, the Committee monitors information similar to that described above, which may include: (i) data specific to the issuer or comparable issuers, (ii) general market or specific sector news and (iii) quoted prices and specific or similar security transactions. The Committee considers this data and any changes from prior periods in order to assess the reasonableness of observable and unobservable inputs, any assumptions or internal models used to value those securities and changes in fair value. This data is also used to corroborate, when available, information received from approved pricing vendors and brokers. Various factors impact the frequency of monitoring this information (which may occur as often as daily). However, the Committee may determine that changes to inputs, assumptions and models are not required as a result of the monitoring procedures performed.
The following table is a summary of the inputs used to value the Fund's investments at April 30, 2015:
Description | | Level 1
Quoted Prices in Active
Markets for Identical
Assets ($) | |
Level 2
Other Significant
Observable Inputs ($) | |
Level 3
Significant
Unobservable Inputs ($) | |
Total ($) | |
Bonds | |
Municipal Bonds | | | — | | | | 220,549,827 | | | | — | | | | 220,549,827 | | |
Total Bonds | | | — | | | | 220,549,827 | | | | — | | | | 220,549,827 | | |
Total | | | — | | | | 220,549,827 | | | | — | | | | 220,549,827 | | |
See the Portfolio of Investments for all investment classifications not indicated in the table.
The Fund's assets assigned to the Level 2 input category are generally valued using the market approach, in which a security's value is determined through reference to prices and information from market transactions for similar or identical assets.
There were no transfers of financial assets between levels during the period.
The accompanying Notes to Financial Statements are an integral part of this statement.
Annual Report 2015
13
COLUMBIA AMT-FREE VIRGINIA INTERMEDIATE MUNI BOND FUND
STATEMENT OF ASSETS AND LIABILITIES
April 30, 2015
Assets | |
Investments, at value | |
(identified cost $206,174,310) | | $ | 220,549,827 | | |
Cash | | | 3,831,485 | | |
Receivable for: | |
Capital shares sold | | | 151,126 | | |
Interest | | | 2,256,167 | | |
Expense reimbursement due from Investment Manager | | | 900 | | |
Prepaid expenses | | | 728 | | |
Total assets | | | 226,790,233 | | |
Liabilities | |
Payable for: | |
Investments purchased on a delayed delivery basis | | | 1,808,325 | | |
Capital shares purchased | | | 54,575 | | |
Dividend distributions to shareholders | | | 540,834 | | |
Investment management fees | | | 2,462 | | |
Distribution and/or service fees | | | 446 | | |
Transfer agent fees | | | 39,292 | | |
Administration fees | | | 431 | | |
Compensation of board members | | | 125,985 | | |
Other expenses | | | 31,378 | | |
Total liabilities | | | 2,603,728 | | |
Net assets applicable to outstanding capital stock | | $ | 224,186,505 | | |
Represented by | |
Paid-in capital | | $ | 208,599,495 | | |
Undistributed net investment income | | | 822,052 | | |
Accumulated net realized gain | | | 389,441 | | |
Unrealized appreciation (depreciation) on: | |
Investments | | | 14,375,517 | | |
Total — representing net assets applicable to outstanding capital stock | | $ | 224,186,505 | | |
The accompanying Notes to Financial Statements are an integral part of this statement.
Annual Report 2015
14
COLUMBIA AMT-FREE VIRGINIA INTERMEDIATE MUNI BOND FUND
STATEMENT OF ASSETS AND LIABILITIES (continued)
April 30, 2015
Class A | |
Net assets | | $ | 47,323,535 | | |
Shares outstanding | | | 4,252,572 | | |
Net asset value per share | | $ | 11.13 | | |
Maximum offering price per share(a) | | $ | 11.47 | | |
Class B | |
Net assets | | $ | 13,824 | | |
Shares outstanding | | | 1,242 | | |
Net asset value per share | | $ | 11.13 | | |
Class C | |
Net assets | | $ | 4,418,981 | | |
Shares outstanding | | | 396,953 | | |
Net asset value per share | | $ | 11.13 | | |
Class R4 | |
Net assets | | $ | 655,629 | | |
Shares outstanding | | | 58,951 | | |
Net asset value per share | | $ | 11.12 | | |
Class Z | |
Net assets | | $ | 171,774,536 | | |
Shares outstanding | | | 15,438,491 | | |
Net asset value per share | | $ | 11.13 | | |
(a) The maximum offering price per share is calculated by dividing the net asset value per share by 1.0 minus the maximum sales charge of 3.00%.
The accompanying Notes to Financial Statements are an integral part of this statement.
Annual Report 2015
15
COLUMBIA AMT-FREE VIRGINIA INTERMEDIATE MUNI BOND FUND
STATEMENT OF OPERATIONS
Year Ended April 30, 2015
Net investment income | |
Income: | |
Dividends | | $ | 86 | | |
Interest | | | 8,151,176 | | |
Total income | | | 8,151,262 | | |
Expenses: | |
Investment management fees | | | 906,282 | | |
Distribution and/or service fees | |
Class A | | | 118,485 | | |
Class B | | | 159 | | |
Class C | | | 40,606 | | |
Transfer agent fees | |
Class A | | | 91,925 | | |
Class B | | | 31 | | |
Class C | | | 7,885 | | |
Class R4 | | | 1,118 | | |
Class Z | | | 338,469 | | |
Administration fees | | | 158,599 | | |
Compensation of board members | | | 21,904 | | |
Custodian fees | | | 2,343 | | |
Printing and postage fees | | | 25,760 | | |
Registration fees | | | 23,032 | | |
Professional fees | | | 36,017 | | |
Other | | | 10,828 | | |
Total expenses | | | 1,783,443 | | |
Fees waived or expenses reimbursed by Investment Manager and its affiliates | | | (355,377 | ) | |
Expense reductions | | | (20 | ) | |
Total net expenses | | | 1,428,046 | | |
Net investment income | | | 6,723,216 | | |
Realized and unrealized gain (loss) — net | |
Net realized gain (loss) on: | |
Investments | | | 693,450 | | |
Net realized gain | | | 693,450 | | |
Net change in unrealized appreciation (depreciation) on: | |
Investments | | | 62,174 | | |
Net change in unrealized appreciation | | | 62,174 | | |
Net realized and unrealized gain | | | 755,624 | | |
Net increase in net assets resulting from operations | | $ | 7,478,840 | | |
The accompanying Notes to Financial Statements are an integral part of this statement.
Annual Report 2015
16
COLUMBIA AMT-FREE VIRGINIA INTERMEDIATE MUNI BOND FUND
STATEMENT OF CHANGES IN NET ASSETS
| | | Year Ended
April 30,
2015 | | Year Ended
April 30,
2014 | |
Operations | |
Net investment income | | $ | 6,723,216 | | | $ | 8,384,233 | | |
Net realized gain (loss) | | | 693,450 | | | | (263,997 | ) | |
Net change in unrealized appreciation (depreciation) | | | 62,174 | | | | (12,235,891 | ) | |
Net increase (decrease) in net assets resulting from operations | | | 7,478,840 | | | | (4,115,655 | ) | |
Distributions to shareholders | |
Net investment income | |
Class A | | | (1,321,460 | ) | | | (1,412,916 | ) | |
Class B | | | (324 | ) | | | (487 | ) | |
Class C | | | (82,606 | ) | | | (94,734 | ) | |
Class R4 | | | (17,434 | ) | | | (499 | ) | |
Class Z | | | (5,301,392 | ) | | | (6,879,789 | ) | |
Net realized gains | |
Class A | | | (8,343 | ) | | | (296,837 | ) | |
Class B | | | (3 | ) | | | (117 | ) | |
Class C | | | (710 | ) | | | (26,739 | ) | |
Class R4 | | | (120 | ) | | | (15 | ) | |
Class Z | | | (30,836 | ) | | | (1,201,281 | ) | |
Total distributions to shareholders | | | (6,763,228 | ) | | | (9,913,414 | ) | |
Decrease in net assets from capital stock activity | | | (5,282,696 | ) | | | (98,997,385 | ) | |
Total decrease in net assets | | | (4,567,084 | ) | | | (113,026,454 | ) | |
Net assets at beginning of year | | | 228,753,589 | | | | 341,780,043 | | |
Net assets at end of year | | $ | 224,186,505 | | | $ | 228,753,589 | | |
Undistributed net investment income | | $ | 822,052 | | | $ | 822,052 | | |
The accompanying Notes to Financial Statements are an integral part of this statement.
Annual Report 2015
17
COLUMBIA AMT-FREE VIRGINIA INTERMEDIATE MUNI BOND FUND
STATEMENT OF CHANGES IN NET ASSETS (continued)
| | | Year Ended April 30, 2015 | | Year Ended April 30, 2014 | |
| | | Shares | | Dollars ($) | | Shares | | Dollars ($) | |
Capital stock activity | |
Class A shares | |
Subscriptions(a) | | | 483,758 | | | | 5,406,217 | | | | 631,769 | | | | 6,980,196 | | |
Distributions reinvested | | | 63,844 | | | | 714,560 | | | | 74,024 | | | | 814,424 | | |
Redemptions | | | (541,572 | ) | | | (6,069,753 | ) | | | (1,226,704 | ) | | | (13,521,020 | ) | |
Net increase (decrease) | | | 6,030 | | | | 51,024 | | | | (520,911 | ) | | | (5,726,400 | ) | |
Class B shares | |
Subscriptions | | | 1 | | | | 13 | | | | 4 | | | | 43 | | |
Distributions reinvested | | | 28 | | | | 314 | | | | 49 | | | | 544 | | |
Redemptions(a) | | | (394 | ) | | | (4,411 | ) | | | (2,550 | ) | | | (28,434 | ) | |
Net decrease | | | (365 | ) | | | (4,084 | ) | | | (2,497 | ) | | | (27,847 | ) | |
Class C shares | |
Subscriptions | | | 86,090 | | | | 963,758 | | | | 43,250 | | | | 479,174 | | |
Distributions reinvested | | | 5,177 | | | | 57,944 | | | | 7,690 | | | | 84,594 | | |
Redemptions | | | (58,671 | ) | | | (656,965 | ) | | | (171,876 | ) | | | (1,897,990 | ) | |
Net increase (decrease) | | | 32,596 | | | | 364,737 | | | | (120,936 | ) | | | (1,334,222 | ) | |
Class R4 shares | |
Subscriptions | | | 98,421 | | | | 1,094,475 | | | | 6,690 | | | | 73,716 | | |
Distributions reinvested | | | 1,541 | | | | 17,243 | | | | 36 | | | | 401 | | |
Redemptions | | | (47,956 | ) | | | (532,480 | ) | | | — | | | | — | | |
Net increase | | | 52,006 | | | | 579,238 | | | | 6,726 | | | | 74,117 | | |
Class Z shares | |
Subscriptions | | | 1,816,960 | | | | 20,329,214 | | | | 1,434,444 | | | | 15,949,872 | | |
Distributions reinvested | | | 38,271 | | | | 428,179 | | | | 53,225 | | | | 585,778 | | |
Redemptions | | | (2,418,718 | ) | | | (27,031,004 | ) | | | (9,855,070 | ) | | | (108,518,683 | ) | |
Net decrease | | | (563,487 | ) | | | (6,273,611 | ) | | | (8,367,401 | ) | | | (91,983,033 | ) | |
Total net decrease | | | (473,220 | ) | | | (5,282,696 | ) | | | (9,005,019 | ) | | | (98,997,385 | ) | |
(a) Includes conversions of Class B shares to Class A shares, if any.
The accompanying Notes to Financial Statements are an integral part of this statement.
Annual Report 2015
18
COLUMBIA AMT-FREE VIRGINIA INTERMEDIATE MUNI BOND FUND
The following tables are intended to help you understand the Fund's financial performance. Certain information reflects financial results for a single share of a class held for the periods shown. Per share net investment income (loss) amounts are calculated based on average shares outstanding during the period. Total return assumes reinvestment of all dividends and distributions, if any. Total return does not reflect payment of sales charges, if any. Total return and portfolio turnover are not annualized for periods of less than one year. The portfolio turnover rate is calculated without regard to purchase and sales transactions of short-term instruments and certain derivatives, if any. If such transactions were included, the Fund's portfolio turnover rate may be higher.
| | | Year Ended April 30, | | Year Ended March 31, | |
Class A | | 2015 | | 2014 | | 2013 | | 2012(a) | | 2012 | | 2011 | |
Per share data | |
Net asset value, beginning of period | | $ | 11.09 | | | $ | 11.54 | | | $ | 11.47 | | | $ | 11.38 | | | $ | 10.86 | | | $ | 10.94 | | |
Income from investment operations: | |
Net investment income | | | 0.31 | | | | 0.32 | | | | 0.31 | | | | 0.03 | | | | 0.33 | | | | 0.34 | | |
Net realized and unrealized gain (loss) | | | 0.04 | | | | (0.39 | ) | | | 0.09 | | | | 0.09 | | | | 0.52 | | | | (0.08 | ) | |
Total from investment operations | | | 0.35 | | | | (0.07 | ) | | | 0.40 | | | | 0.12 | | | | 0.85 | | | | 0.26 | | |
Less distributions to shareholders: | |
Net investment income | | | (0.31 | ) | | | (0.31 | ) | | | (0.31 | ) | | | (0.03 | ) | | | (0.33 | ) | | | (0.34 | ) | |
Net realized gains | | | (0.00 | )(b) | | | (0.07 | ) | | | (0.02 | ) | | | — | | | | — | | | | — | | |
Total distributions to shareholders | | | (0.31 | ) | | | (0.38 | ) | | | (0.33 | ) | | | (0.03 | ) | | | (0.33 | ) | | | (0.34 | ) | |
Net asset value, end of period | | $ | 11.13 | | | $ | 11.09 | | | $ | 11.54 | | | $ | 11.47 | | | $ | 11.38 | | | $ | 10.86 | | |
Total return | | | 3.21 | % | | | (0.51 | %) | | | 3.49 | % | | | 1.06 | % | | | 7.87 | % | | | 2.40 | % | |
Ratios to average net assets(c) | |
Total gross expenses | | | 0.97 | % | | | 0.97 | % | | | 0.95 | % | | | 0.94 | %(d) | | | 0.98 | % | | | 0.92 | % | |
Total net expenses(e) | | | 0.81 | %(f) | | | 0.81 | %(f) | | | 0.80 | %(f) | | | 0.79 | %(d) | | | 0.79 | %(f) | | | 0.80 | %(f) | |
Net investment income | | | 2.79 | % | | | 2.86 | % | | | 2.68 | % | | | 3.04 | %(d) | | | 2.92 | % | | | 3.11 | % | |
Supplemental data | |
Net assets, end of period (in thousands) | | $ | 47,324 | | | $ | 47,113 | | | $ | 55,003 | | | $ | 54,025 | | | $ | 53,775 | | | $ | 51,196 | | |
Portfolio turnover | | | 9 | % | | | 2 | % | | | 11 | % | | | 0 | % | | | 8 | % | | | 14 | % | |
Notes to Financial Highlights
(a) For the period from April 1, 2012 to April 30, 2012. During the period, the Fund's fiscal year end was changed from March 31 to April 30.
(b) Rounds to zero.
(c) In addition to the fees and expenses that the Fund bears directly, the Fund indirectly bears a pro rata share of the fees and expenses of any other funds in which it invests. Such indirect expenses are not included in the Fund's reported expense ratios.
(d) Annualized.
(e) Total net expenses include the impact of certain fee waivers/expense reimbursements made by the Investment Manager and certain of its affiliates, if applicable.
(f) The benefits derived from expense reductions had an impact of less than 0.01%.
The accompanying Notes to Financial Statements are an integral part of this statement.
Annual Report 2015
19
COLUMBIA AMT-FREE VIRGINIA INTERMEDIATE MUNI BOND FUND
FINANCIAL HIGHLIGHTS (continued)
| | | Year Ended April 30, | | Year Ended March 31, | |
Class B | | 2015 | | 2014 | | 2013 | | 2012(a) | | 2012 | | 2011 | |
Per share data | |
Net asset value, beginning of period | | $ | 11.10 | | | $ | 11.54 | | | $ | 11.48 | | | $ | 11.38 | | | $ | 10.86 | | | $ | 10.95 | | |
Income from investment operations: | |
Net investment income | | | 0.23 | | | | 0.23 | | | | 0.22 | | | | 0.02 | | | | 0.25 | | | | 0.26 | | |
Net realized and unrealized gain (loss) | | | 0.03 | | | | (0.37 | ) | | | 0.08 | | | | 0.10 | | | | 0.51 | | | | (0.09 | ) | |
Total from investment operations | | | 0.26 | | | | (0.14 | ) | | | 0.30 | | | | 0.12 | | | | 0.76 | | | | 0.17 | | |
Less distributions to shareholders: | |
Net investment income | | | (0.23 | ) | | | (0.23 | ) | | | (0.22 | ) | | | (0.02 | ) | | | (0.24 | ) | | | (0.26 | ) | |
Net realized gains | | | (0.00 | )(b) | | | (0.07 | ) | | | (0.02 | ) | | | — | | | | — | | | | — | | |
Total distributions to shareholders | | | (0.23 | ) | | | (0.30 | ) | | | (0.24 | ) | | | (0.02 | ) | | | (0.24 | ) | | | (0.26 | ) | |
Net asset value, end of period | | $ | 11.13 | | | $ | 11.10 | | | $ | 11.54 | | | $ | 11.48 | | | $ | 11.38 | | | $ | 10.86 | | |
Total return | | | 2.35 | % | | | (1.16 | %) | | | 2.62 | % | | | 1.08 | % | | | 7.06 | % | | | 1.55 | % | |
Ratios to average net assets(c) | |
Total gross expenses | | | 1.72 | % | | | 1.71 | % | | | 1.70 | % | | | 1.69 | %(d) | | | 1.81 | % | | | 1.67 | % | |
Total net expenses(e) | | | 1.56 | %(f) | | | 1.56 | %(f) | | | 1.55 | %(f) | | | 1.54 | %(d) | | | 1.54 | %(f) | | | 1.55 | %(f) | |
Net investment income | | | 2.04 | % | | | 2.08 | % | | | 1.92 | % | | | 2.29 | %(d) | | | 2.19 | % | | | 2.34 | % | |
Supplemental data | |
Net assets, end of period (in thousands) | | $ | 14 | | | $ | 18 | | | $ | 47 | | | $ | 161 | | | $ | 182 | | | $ | 392 | | |
Portfolio turnover | | | 9 | % | | | 2 | % | | | 11 | % | | | 0 | % | | | 8 | % | | | 14 | % | |
Notes to Financial Highlights
(a) For the period from April 1, 2012 to April 30, 2012. During the period, the Fund's fiscal year end was changed from March 31 to April 30.
(b) Rounds to zero.
(c) In addition to the fees and expenses that the Fund bears directly, the Fund indirectly bears a pro rata share of the fees and expenses of any other funds in which it invests. Such indirect expenses are not included in the Fund's reported expense ratios.
(d) Annualized.
(e) Total net expenses include the impact of certain fee waivers/expense reimbursements made by the Investment Manager and certain of its affiliates, if applicable.
(f) The benefits derived from expense reductions had an impact of less than 0.01%.
The accompanying Notes to Financial Statements are an integral part of this statement.
Annual Report 2015
20
COLUMBIA AMT-FREE VIRGINIA INTERMEDIATE MUNI BOND FUND
FINANCIAL HIGHLIGHTS (continued)
| | | Year Ended April 30, | | Year Ended March 31, | |
Class C | | 2015 | | 2014 | | 2013 | | 2012(a) | | 2012 | | 2011 | |
Per share data | |
Net asset value, beginning of period | | $ | 11.10 | | | $ | 11.54 | | | $ | 11.48 | | | $ | 11.38 | | | $ | 10.86 | | | $ | 10.95 | | |
Income from investment operations: | |
Net investment income | | | 0.23 | | | | 0.23 | | | | 0.22 | | | | 0.02 | | | | 0.24 | | | | 0.26 | | |
Net realized and unrealized gain (loss) | | | 0.03 | | | | (0.37 | ) | | | 0.08 | | | | 0.10 | | | | 0.52 | | | | (0.09 | ) | |
Total from investment operations | | | 0.26 | | | | (0.14 | ) | | | 0.30 | | | | 0.12 | | | | 0.76 | | | | 0.17 | | |
Less distributions to shareholders: | |
Net investment income | | | (0.23 | ) | | | (0.23 | ) | | | (0.22 | ) | | | (0.02 | ) | | | (0.24 | ) | | | (0.26 | ) | |
Net realized gains | | | (0.00 | )(b) | | | (0.07 | ) | | | (0.02 | ) | | | — | | | | — | | | | — | | |
Total distributions to shareholders | | | (0.23 | ) | | | (0.30 | ) | | | (0.24 | ) | | | (0.02 | ) | | | (0.24 | ) | | | (0.26 | ) | |
Net asset value, end of period | | $ | 11.13 | | | $ | 11.10 | | | $ | 11.54 | | | $ | 11.48 | | | $ | 11.38 | | | $ | 10.86 | | |
Total return | | | 2.35 | % | | | (1.16 | %) | | | 2.63 | % | | | 1.08 | % | | | 7.06 | % | | | 1.54 | % | |
Ratios to average net assets(c) | |
Total gross expenses | | | 1.72 | % | | | 1.72 | % | | | 1.70 | % | | | 1.70 | %(d) | | | 1.73 | % | | | 1.67 | % | |
Total net expenses(e) | | | 1.56 | %(f) | | | 1.56 | %(f) | | | 1.55 | %(f) | | | 1.54 | %(d) | | | 1.54 | %(f) | | | 1.55 | %(f) | |
Net investment income | | | 2.03 | % | | | 2.11 | % | | | 1.93 | % | | | 2.29 | %(d) | | | 2.15 | % | | | 2.35 | % | |
Supplemental data | |
Net assets, end of period (in thousands) | | $ | 4,419 | | | $ | 4,044 | | | $ | 5,601 | | | $ | 4,694 | | | $ | 4,739 | | | $ | 3,544 | | |
Portfolio turnover | | | 9 | % | | | 2 | % | | | 11 | % | | | 0 | % | | | 8 | % | | | 14 | % | |
Notes to Financial Highlights
(a) For the period from April 1, 2012 to April 30, 2012. During the period, the Fund's fiscal year end was changed from March 31 to April 30.
(b) Rounds to zero.
(c) In addition to the fees and expenses that the Fund bears directly, the Fund indirectly bears a pro rata share of the fees and expenses of any other funds in which it invests. Such indirect expenses are not included in the Fund's reported expense ratios.
(d) Annualized.
(e) Total net expenses include the impact of certain fee waivers/expense reimbursements made by the Investment Manager and certain of its affiliates, if applicable.
(f) The benefits derived from expense reductions had an impact of less than 0.01%.
The accompanying Notes to Financial Statements are an integral part of this statement.
Annual Report 2015
21
COLUMBIA AMT-FREE VIRGINIA INTERMEDIATE MUNI BOND FUND
FINANCIAL HIGHLIGHTS (continued)
| | | Year Ended April 30, | |
Class R4 | | 2015 | | 2014 | | 2013(a) | |
Per share data | |
Net asset value, beginning of period | | $ | 11.08 | | | $ | 11.52 | | | $ | 11.43 | | |
Income from investment operations: | |
Net investment income | | | 0.34 | | | | 0.35 | | | | 0.04 | | |
Net realized and unrealized gain (loss) | | | 0.04 | | | | (0.38 | ) | | | 0.09 | | |
Total from investment operations | | | 0.38 | | | | (0.03 | ) | | | 0.13 | | |
Less distributions to shareholders: | |
Net investment income | | | (0.34 | ) | | | (0.34 | ) | | | (0.04 | ) | |
Net realized gains | | | (0.00 | )(b) | | | (0.07 | ) | | | — | | |
Total distributions to shareholders | | | (0.34 | ) | | | (0.41 | ) | | | (0.04 | ) | |
Net asset value, end of period | | $ | 11.12 | | | $ | 11.08 | | | $ | 11.52 | | |
Total return | | | 3.47 | % | | | (0.19 | %) | | | 1.12 | % | |
Ratios to average net assets(c) | |
Total gross expenses | | | 0.72 | % | | | 0.72 | % | | | 0.56 | %(d) | |
Total net expenses(e) | | | 0.56 | %(f) | | | 0.56 | %(f) | | | 0.52 | %(d) | |
Net investment income | | | 3.06 | % | | | 3.18 | % | | | 2.98 | %(d) | |
Supplemental data | |
Net assets, end of period (in thousands) | | $ | 656 | | | $ | 77 | | | $ | 3 | | |
Portfolio turnover | | | 9 | % | | | 2 | % | | | 11 | % | |
Notes to Financial Highlights
(a) Based on operations from March 19, 2013 (commencement of operations) through the stated period end.
(b) Rounds to zero.
(c) In addition to the fees and expenses that the Fund bears directly, the Fund indirectly bears a pro rata share of the fees and expenses of any other funds in which it invests. Such indirect expenses are not included in the Fund's reported expense ratios.
(d) Annualized.
(e) Total net expenses include the impact of certain fee waivers/expense reimbursements made by the Investment Manager and certain of its affiliates, if applicable.
(f) The benefits derived from expense reductions had an impact of less than 0.01%.
The accompanying Notes to Financial Statements are an integral part of this statement.
Annual Report 2015
22
COLUMBIA AMT-FREE VIRGINIA INTERMEDIATE MUNI BOND FUND
FINANCIAL HIGHLIGHTS (continued)
| | | Year Ended April 30, | | Year Ended March 31, | |
Class Z | | 2015 | | 2014 | | 2013 | | 2012(a) | | 2012 | | 2011 | |
Per share data | |
Net asset value, beginning of period | | $ | 11.09 | | | $ | 11.54 | | | $ | 11.47 | | | $ | 11.38 | | | $ | 10.85 | | | $ | 10.94 | | |
Income from investment operations: | |
Net investment income | | | 0.34 | | | | 0.34 | | | | 0.34 | | | | 0.03 | | | | 0.35 | | | | 0.37 | | |
Net realized and unrealized gain (loss) | | | 0.04 | | | | (0.38 | ) | | | 0.08 | | | | 0.09 | | | | 0.53 | | | | (0.09 | ) | |
Total from investment operations | | | 0.38 | | | | (0.04 | ) | | | 0.42 | | | | 0.12 | | | | 0.88 | | | | 0.28 | | |
Less distributions to shareholders: | |
Net investment income | | | (0.34 | ) | | | (0.34 | ) | | | (0.33 | ) | | | (0.03 | ) | | | (0.35 | ) | | | (0.37 | ) | |
Net realized gains | | | (0.00 | )(b) | | | (0.07 | ) | | | (0.02 | ) | | | — | | | | — | | | | — | | |
Total distributions to shareholders | | | (0.34 | ) | | | (0.41 | ) | | | (0.35 | ) | | | (0.03 | ) | | | (0.35 | ) | | | (0.37 | ) | |
Net asset value, end of period | | $ | 11.13 | | | $ | 11.09 | | | $ | 11.54 | | | $ | 11.47 | | | $ | 11.38 | | | $ | 10.85 | | |
Total return | | | 3.47 | % | | | (0.26 | %) | | | 3.75 | % | | | 1.08 | % | | | 8.23 | % | | | 2.56 | % | |
Ratios to average net assets(c) | |
Total gross expenses | | | 0.72 | % | | | 0.72 | % | | | 0.70 | % | | | 0.69 | %(d) | | | 0.73 | % | | | 0.67 | % | |
Total net expenses(e) | | | 0.56 | %(f) | | | 0.56 | %(f) | | | 0.55 | %(f) | | | 0.54 | %(d) | | | 0.54 | %(f) | | | 0.55 | %(f) | |
Net investment income | | | 3.04 | % | | | 3.09 | % | | | 2.93 | % | | | 3.29 | %(d) | | | 3.16 | % | | | 3.36 | % | |
Supplemental data | |
Net assets, end of period (in thousands) | | $ | 171,775 | | | $ | 177,502 | | | $ | 281,126 | | | $ | 308,836 | | | $ | 306,166 | | | $ | 264,505 | | |
Portfolio turnover | | | 9 | % | | | 2 | % | | | 11 | % | | | 0 | % | | | 8 | % | | | 14 | % | |
Notes to Financial Highlights
(a) For the period from April 1, 2012 to April 30, 2012. During the period, the Fund's fiscal year end was changed from March 31 to April 30.
(b) Rounds to zero.
(c) In addition to the fees and expenses that the Fund bears directly, the Fund indirectly bears a pro rata share of the fees and expenses of any other funds in which it invests. Such indirect expenses are not included in the Fund's reported expense ratios.
(d) Annualized.
(e) Total net expenses include the impact of certain fee waivers/expense reimbursements made by the Investment Manager and certain of its affiliates, if applicable.
(f) The benefits derived from expense reductions had an impact of less than 0.01%.
The accompanying Notes to Financial Statements are an integral part of this statement.
Annual Report 2015
23
COLUMBIA AMT-FREE VIRGINIA INTERMEDIATE MUNI BOND FUND
NOTES TO FINANCIAL STATEMENTS
April 30, 2015
Note 1. Organization
Columbia AMT-Free Virginia Intermediate Muni Bond Fund (formerly known as Columbia Virginia Intermediate Municipal Bond Fund) (the Fund), a series of Columbia Funds Series Trust (the Trust), is a diversified fund. The Trust is registered under the Investment Company Act of 1940, as amended (the 1940 Act), as an open-end management investment company organized as a Delaware statutory trust. Effective July 7, 2014, Columbia Virginia Intermediate Municipal Bond Fund was renamed Columbia AMT-Free Virginia Intermediate Muni Bond Fund.
Fund Shares
The Trust may issue an unlimited number of shares (without par value). The Fund offers Class A, Class B, Class C, Class R4 and Class Z shares. Although all share classes generally have identical voting, dividend and liquidation rights, each share class votes separately when required by the Trust's organizational documents or by law. Different share classes pay different distribution amounts to the extent the expenses of such share classes differ, and distributions in liquidation will be proportional to the net asset value of each share class. Each share class has its own expense structure and sales charges.
Class A shares are subject to a maximum front-end sales charge of 3.00% based on the initial investment amount. In addition, Class A shares purchased on or after February 19, 2015 are subject to a contingent deferred sales charge (CDSC) of 0.75% on certain investments of $500,000 or more if redeemed within 12 months after purchase. Redemptions of Class A shares purchased prior to February 19, 2015, without an initial sales charge in accounts aggregating $1 million to $50 million at the time of purchase, are subject to a CDSC of 1.00% if redeemed within 12 months after purchase, and 0.50% if redeemed more than 12, but less than 18, months after purchase.
Class B shares may be subject to a maximum CDSC of 3.00% based upon the holding period after purchase. Class B shares will generally convert to Class A shares eight years after purchase. The Fund no longer accepts investments by new or existing investors in the Fund's Class B shares, except in connection with the reinvestment of any dividend and/or capital gain distributions in Class B shares of the Fund and exchanges by existing Class B shareholders of certain other funds within the Columbia Family of Funds.
Class C shares are subject to a 1.00% CDSC on shares redeemed within one year after purchase.
Class R4 shares are not subject to sales charges and are generally available only to omnibus retirement plans and certain investors as described in the Fund's prospectus.
Class Z shares are not subject to sales charges and are available only to eligible investors, which are subject to different investment minimums as described in the Fund's prospectus.
Note 2. Summary of Significant Accounting Policies
Basis of Preparation
The Fund is an investment company that applies the accounting and reporting guidance in the Financial Accounting Standards Board (FASB) Accounting Standards Codification Topic 946, Financial Services — Investment Companies (ASC 946). The financial statements are prepared in accordance with U.S. generally accepted accounting principles (GAAP), which requires management to make certain estimates and assumptions that affect the reported amounts of assets and liabilities, the disclosure of contingent assets and liabilities at the date of the financial statements and the reported amounts of income and expenses during the reporting period. Actual results could differ from those estimates.
The following is a summary of significant accounting policies followed by the Fund in the preparation of its financial statements.
Security Valuation
Debt securities generally are valued by pricing services approved by the Board of Trustees (the Board) based upon market transactions for normal, institutional-size trading units of similar securities. The services may use various pricing techniques that take into account, as applicable, factors such as yield, quality, coupon rate, maturity, type of issue, trading characteristics and other data, as well as broker quotes. Debt securities for which quotations are readily available may also be valued based upon an over-the-counter or exchange bid quotation.
Investments for which market quotations are not readily available, or that have quotations which management believes are not reliable, are valued at fair value as determined in good faith under procedures established by and under the general supervision of the Board. If a
Annual Report 2015
24
COLUMBIA AMT-FREE VIRGINIA INTERMEDIATE MUNI BOND FUND
NOTES TO FINANCIAL STATEMENTS (continued)
April 30, 2015
security or class of securities (such as foreign securities) is valued at fair value, such value is likely to be different from the quoted or published price for the security.
The determination of fair value often requires significant judgment. To determine fair value, management may use assumptions including but not limited to future cash flows and estimated risk premiums. Multiple inputs from various sources may be used to determine fair value.
Delayed Delivery Securities
The Fund may trade securities on other than normal settlement terms, including securities purchased or sold on a "when-issued" basis. This may increase risk to the Fund since the other party to the transaction may fail to deliver which could cause the Fund to subsequently invest at less advantageous prices. The Fund designates cash or liquid securities in an amount equal to the delayed delivery commitment.
Security Transactions
Security transactions are accounted for on the trade date. Cost is determined and gains (losses) are based upon the specific identification method for both financial statement and federal income tax purposes.
Income Recognition
Interest income is recorded on an accrual basis. Market premiums and discounts, including original issue discounts, are amortized and accreted, respectively, over the expected life of the security on all debt securities, unless otherwise noted.
The Fund may place a debt security on non-accrual status and reduce related interest income when it becomes probable that the interest will not be collected and the amount of uncollectible interest can be reasonably estimated. A defaulted debt security is removed from non-accrual status when the issuer resumes interest payments or when collectability of interest is reasonably assured.
Dividend income is recorded on the ex-dividend date.
Expenses
General expenses of the Trust are allocated to the Fund and other funds of the Trust based upon relative net assets or other expense allocation methodologies determined by the nature of the expense. Expenses directly attributable to the Fund are charged to the Fund. Expenses directly attributable to a specific class of shares are charged to that share class.
Determination of Class Net Asset Value
All income, expenses (other than class-specific expenses, which are charged to that share class, as shown in the Statement of Operations) and realized and unrealized gains (losses) are allocated to each class of the Fund on a daily basis, based on the relative net assets of each class, for purposes of determining the net asset value of each class.
Federal Income Tax Status
The Fund intends to qualify each year as a regulated investment company under Subchapter M of the Internal Revenue Code, as amended, and will distribute substantially all of its tax exempt and taxable income (including net short-term capital gains), if any, for its tax year, and as such will not be subject to federal income taxes. In addition, the Fund intends to distribute in each calendar year substantially all of its net investment income, capital gains and certain other amounts, if any, such that the Fund should not be subject to federal excise tax. Therefore, no federal income or excise tax provision is recorded.
Distributions to Shareholders
Distributions from net investment income, if any, are declared daily and paid monthly. Net realized capital gains, if any, are distributed at least annually. Income distributions and capital gain distributions are determined in accordance with federal income tax regulations, which may differ from GAAP.
Guarantees and Indemnifications
Under the Trust's organizational documents and, in some cases, by contract, its officers and trustees are indemnified against certain liabilities arising out of the performance of their duties to the Trust or its funds. In addition, certain of the Fund's contracts with its service providers contain general indemnification clauses. The Fund's maximum exposure under these arrangements is unknown since the amount of any future claims that may be made against the Fund cannot be determined, and the Fund has no historical basis for predicting the likelihood of any such claims.
Note 3. Fees and Compensation Paid to Affiliates
Investment Management Fees
Under an Investment Management Services Agreement, Columbia Management Investment Advisers, LLC (the Investment Manager), a wholly-owned subsidiary of
Annual Report 2015
25
COLUMBIA AMT-FREE VIRGINIA INTERMEDIATE MUNI BOND FUND
NOTES TO FINANCIAL STATEMENTS (continued)
April 30, 2015
Ameriprise Financial, Inc. (Ameriprise Financial), determines which securities will be purchased, held or sold. The investment management fee is an annual fee that is equal to a percentage of the Fund's average daily net assets that declines from 0.40% to 0.27% as the Fund's net assets increase. The effective investment management fee rate for the year ended April 30, 2015 was 0.40% of the Fund's average daily net assets.
Administration Fees
Under an Administrative Services Agreement, the Investment Manager also serves as the Fund Administrator. The Fund pays the Fund Administrator an annual fee for administration and accounting services equal to a percentage of the Fund's average daily net assets that declines from 0.07% to 0.04% as the Fund's net assets increase. The effective administration fee rate for the year ended April 30, 2015 was 0.07% of the Fund's average daily net assets.
Other Expenses
Other expenses are for, among other things, miscellaneous expenses of the Fund or the Board, including payments to a company providing limited administrative services to the Fund and the Board. That company's expenses include boardroom and office expense, employee compensation, employee health and retirement benefits, and certain other expenses. For the year ended April 30, 2015, other expenses paid by the Fund to this company were $1,484.
Compensation of Board Members
Board members are compensated for their services to the Fund as disclosed in the Statement of Operations. Under a Deferred Compensation Plan (the Plan), the Board members who are not "interested persons" of the Fund, as defined under the 1940 Act, may elect to defer payment of up to 100% of their compensation. Deferred amounts are treated as though equivalent dollar amounts had been invested in shares of certain funds managed by the Investment Manager. The Fund's liability for these amounts is adjusted for market value changes and remains in the Fund until distributed in accordance with the Plan.
Transfer Agent Fees
Under a Transfer and Dividend Disbursing Agent Agreement, Columbia Management Investment Services Corp. (the Transfer Agent), an affiliate of the Investment Manager and a wholly-owned subsidiary of Ameriprise Financial, is responsible for providing transfer agency
services to the Fund. The Transfer Agent has contracted with Boston Financial Data Services (BFDS) to serve as sub-transfer agent.
Effective November 1, 2014, the Transfer Agent receives a monthly transfer agency fee based on the number or the average value of accounts, depending on the type of account. Prior to November 1, 2014, the Transfer Agent received a monthly account-based service fee based on the number of open accounts. In addition, the Transfer Agent also receives sub-transfer agency fees based on a percentage of the average aggregate value of the Fund's shares maintained in omnibus accounts (other than omnibus accounts for which American Enterprise Investment Services Inc. is the broker of record or accounts where the beneficial shareholder is a customer of Ameriprise Financial Services, Inc., for which the Transfer Agent receives a per account fee). The Transfer Agent pays the fees of BFDS for services as sub-transfer agent and is not entitled to reimbursement for such fees from the Fund (with the exception of out-of-pocket fees).
The Transfer Agent also receives compensation from the Fund for various shareholder services and reimbursements for certain out-of-pocket fees.
For the year ended April 30, 2015, the Fund's effective transfer agent fee rates as a percentage of average daily net assets of each class were as follows:
Class A | | | 0.19 | % | |
Class B | | | 0.20 | | |
Class C | | | 0.19 | | |
Class R4 | | | 0.20 | | |
Class Z | | | 0.19 | | |
An annual minimum account balance fee of $20 may apply to certain accounts with a value below the applicable share class's initial minimum investment requirements to reduce the impact of small accounts on transfer agent fees. These minimum account balance fees are remitted to the Fund and recorded as part of expense reductions in the Statement of Operations. For the year ended April 30, 2015, these minimum account balance fees reduced total expenses of the Fund by $20.
Distribution and Service Fees
The Fund has an agreement with Columbia Management Investment Distributors, Inc. (the Distributor), an affiliate of the Investment Manager and a wholly-owned subsidiary of Ameriprise Financial, for distribution and shareholder services. The Board has approved, and the Fund has adopted, distribution and shareholder service
Annual Report 2015
26
COLUMBIA AMT-FREE VIRGINIA INTERMEDIATE MUNI BOND FUND
NOTES TO FINANCIAL STATEMENTS (continued)
April 30, 2015
plans (the Plans) applicable to certain share classes, which set the distribution and service fees for the Fund. These fees are calculated daily and are intended to compensate the Distributor and/or eligible selling and/or servicing agents for selling shares of the Fund and providing services to investors.
Under the Plans, the Fund pays a monthly combined distribution and service fee to the Distributor at the maximum annual rate of 0.25% of the average daily net assets attributable to Class A shares of the Fund. Also under the Plans, the Fund pays a monthly service fee at the maximum annual rate of 0.25% of the average daily net assets attributable to Class B and Class C shares of the Fund and the payment of a monthly distribution fee at the maximum annual rate of 0.75% of the average daily net assets attributable to Class B and Class C shares of the Fund.
Sales Charges
Sales charges, including front-end charges and CDSCs, received by the Distributor for distributing Fund shares were $20,565 for Class A and $82 for Class C shares for the year ended April 30, 2015.
Expenses Waived/Reimbursed by the Investment Manager and its Affiliates
The Investment Manager and certain of its affiliates have contractually agreed to waive fees and/or reimburse expenses (excluding certain fees and expenses described below) for the period disclosed below, unless sooner terminated at the sole discretion of the Board, so that the Fund's net operating expenses, after giving effect to fees waived/expenses reimbursed and any balance credits and/or overdraft charges from the Fund's custodian, do not exceed the following annual rates as a percentage of the class' average daily net assets:
| | | Fee Rates Contractual
through
August 31, 2015 | |
Class A | | | 0.81 | % | |
Class B | | | 1.56 | | |
Class C | | | 1.56 | | |
Class R4 | | | 0.56 | | |
Class Z | | | 0.56 | | |
Under the agreement governing these fee waivers and/or expense reimbursement arrangements, the following fees and expenses are excluded from the waiver/reimbursement commitment, and therefore will be paid by the Fund, if applicable: taxes (including foreign transaction taxes), expenses associated with
investments in affiliated and non-affiliated pooled investment vehicles (including mutual funds and exchange-traded funds), transaction costs and brokerage commissions, costs related to any securities lending program, dividend expenses associated with securities sold short, inverse floater program fees and expenses, transaction charges and interest on borrowed money, interest, extraordinary expenses and any other expenses the exclusion of which is specifically approved by the Board. Any fees waived and/or expenses reimbursed under the expense reimbursement arrangements described above are not recoverable by the Investment Manager or its affiliates in future periods. This agreement may be modified or amended only with approval from all parties.
Note 4. Federal Tax Information
The timing and character of income and capital gain distributions are determined in accordance with income tax regulations, which may differ from GAAP because of temporary or permanent book to tax differences.
At April 30, 2015, these differences are primarily due to differing treatment for Trustees' deferred compensation and distributions. To the extent these differences are permanent, reclassifications are made among the components of the Fund's net assets in the Statement of Assets and Liabilities. Temporary differences do not require reclassifications.
The Fund did not have any permanent differences; therefore, no reclassifications were made to the Statement of Assets and Liabilities.
The tax character of distributions paid during the years indicated was as follows:
Year Ended April 30, | | 2015 | | 2014 | |
Ordinary income | | $ | 37,088 | | | $ | 42,435 | | |
Tax-exempt income | | | 6,686,128 | | | | 8,371,081 | | |
Long-term capital gains | | | 40,012 | | | | 1,499,898 | | |
Total | | $ | 6,763,228 | | | $ | 9,913,414 | | |
Short-term capital gain distributions, if any, are considered ordinary income distributions for tax purposes.
At April 30, 2015, the components of distributable earnings on a tax basis were as follows:
Undistributed tax-exempt income | | | 1,488,108 | | |
Undistributed long-term capital gains | | | 389,441 | | |
Net unrealized appreciation | | | 14,375,517 | | |
Annual Report 2015
27
COLUMBIA AMT-FREE VIRGINIA INTERMEDIATE MUNI BOND FUND
NOTES TO FINANCIAL STATEMENTS (continued)
April 30, 2015
At April 30, 2015, the cost of investments for federal income tax purposes was $206,174,310 and the aggregate gross unrealized appreciation and depreciation based on that cost was:
Unrealized appreciation | | $ | 15,196,882 | | |
Unrealized depreciation | | | (821,365 | ) | |
Net unrealized appreciation | | $ | 14,375,517 | | |
For the year ended April 30, 2015, $263,997 of capital loss carryforward was utilized.
Management of the Fund has concluded that there are no significant uncertain tax positions in the Fund that would require recognition in the financial statements. However, management's conclusion may be subject to review and adjustment at a later date based on factors including, but not limited to, new tax laws, regulations, and administrative interpretations (including relevant court decisions). Generally, the Fund's federal tax returns for the prior three fiscal years remain subject to examination by the Internal Revenue Service.
Note 5. Portfolio Information
The cost of purchases and proceeds from sales of securities, excluding short-term investments and derivatives, if any, aggregated to $19,701,882 and $23,842,586, respectively, for the year ended April 30, 2015. The amount of purchase and sale activity impacts the portfolio turnover rate reported in the Financial Highlights.
Note 6. Shareholder Concentration
At April 30, 2015, one unaffiliated shareholder of record owned 79.0% of the outstanding shares of the Fund in one or more accounts. The Fund has no knowledge about whether any portion of those shares was owned beneficially. Subscription and redemption activity by concentrated accounts may have a significant effect on the operations of the Fund.
Note 7. Line of Credit
The Fund has entered into a revolving credit facility with a syndicate of banks led by JPMorgan Chase Bank, N.A. whereby the Fund may borrow for the temporary funding of shareholder redemptions or for other temporary or emergency purposes. Pursuant to a December 9, 2014 amendment, the credit facility agreement, which is a collective agreement between the Fund and certain other funds managed by the Investment Manager, severally and not jointly, permits collective borrowings up to $550 million. Interest is charged to each participating fund
based on its borrowings at a rate equal to the higher of (i) the overnight federal funds rate plus 1.00% or (ii) the one-month LIBOR rate plus 1.00%. Each borrowing under the credit facility matures no later than 60 days after the date of borrowing. The Fund also pays a commitment fee equal to its pro rata share of the amount of the credit facility at a rate of 0.075% per annum. The commitment fee is included in other expenses in the Statement of Operations. Prior to the December 9, 2014 amendment, the credit facility agreement permitted borrowings up to $500 million under the same terms and interest rates as described above.
The Fund had no borrowings during the year ended April 30, 2015.
Note 8. Significant Risks
Credit Risk
Credit risk is the risk that the value of debt securities in the Fund's portfolio may decline because the issuer may default and fail to pay interest or repay principal when due. Rating agencies assign credit ratings to debt securities to indicate their credit risk. Lower rated or unrated debt securities held by the Fund may present increased credit risk as compared to higher-rated debt securities.
Interest Rate Risk
Interest rate risk is the risk of losses attributable to changes in interest rates. In general, if prevailing interest rates rise, the values of debt securities tend to fall, and if interest rates fall, the values of debt securities tend to rise. Actions by governments and central banking authorities can result in increases in interest rates. Increasing interest rates may negatively affect the value of debt securities held by the Fund, resulting in a negative impact on the Fund's performance and net asset value per share. In general, the longer the maturity or duration of a debt security, the greater its sensitivity to changes in interest rates.
Liquidity Risk
Liquidity risk is the risk associated with a lack of marketability of investments which may make it difficult to sell the investment at a desirable time or price. Changing regulatory, market or other conditions or environments (for example, the interest rate or credit environments) may adversely affect the liquidity of the Fund's investments. The Fund may have to accept a lower selling price for the holding, sell other investments, or forego another, more appealing investment
Annual Report 2015
28
COLUMBIA AMT-FREE VIRGINIA INTERMEDIATE MUNI BOND FUND
NOTES TO FINANCIAL STATEMENTS (continued)
April 30, 2015
opportunity. Generally, the less liquid the market at the time the Fund sells a portfolio investment, the greater the risk of loss or decline of value to the Fund. A less liquid market can lead to an increase in Fund redemptions, which may negatively impact Fund performance and net asset value per share, including, for example, if the Fund is forced to sell securities in a down market.
Geographic Concentration Risk
Because state-specific tax-exempt funds invest primarily in the municipal securities issued by the state and political sub-divisions of the state, the Fund will be particularly affected by political and economic conditions and developments in the state in which it invests. The Fund may, therefore, have a greater risk than that of a municipal bond fund which is more geographically diversified. The value of the municipal securities owned by the Fund also may be adversely affected by future changes in federal or state income tax laws.
Note 9. Subsequent Events
Management has evaluated the events and transactions that have occurred through the date the financial statements were issued and noted no items requiring adjustment of the financial statements or additional disclosure.
Note 10. Information Regarding Pending and Settled Legal Proceedings
In December 2005, without admitting or denying the allegations, American Express Financial Corporation (AEFC, which is now known as Ameriprise Financial, Inc. (Ameriprise Financial)) entered into settlement agreements with the Securities and Exchange Commission (SEC) and Minnesota Department of Commerce (MDOC) related to market timing activities. As a result, AEFC was censured and ordered to cease and desist from committing or causing any violations of certain provisions of the Investment Advisers Act of 1940, the Investment Company Act of 1940, and various Minnesota laws. AEFC agreed to pay disgorgement of $10 million and civil money penalties of $7 million. AEFC also agreed to retain an independent distribution consultant to assist in developing a plan for distribution of all disgorgement and civil penalties ordered by the SEC in accordance with various undertakings detailed at www.sec.gov/litigation/admin/ia-2451.pdf. Ameriprise Financial and its affiliates have cooperated with the SEC and the MDOC in these legal proceedings, and have made regular reports to the Funds' Boards of Trustees.
Ameriprise Financial and certain of its affiliates have historically been involved in a number of legal, arbitration and regulatory proceedings, including routine litigation, class actions, and governmental actions, concerning matters arising in connection with the conduct of their business activities. Ameriprise Financial believes that the Funds are not currently the subject of, and that neither Ameriprise Financial nor any of its affiliates are the subject of, any pending legal, arbitration or regulatory proceedings that are likely to have a material adverse effect on the Funds or the ability of Ameriprise Financial or its affiliates to perform under their contracts with the Funds. Ameriprise Financial is required to make quarterly (10-Q), annual (10-K) and, as necessary, 8-K filings with the Securities and Exchange Commission on legal and regulatory matters that relate to Ameriprise Financial and its affiliates. Copies of these filings may be obtained by accessing the SEC website at www.sec.gov.
There can be no assurance that these matters, or the adverse publicity associated with them, will not result in increased fund redemptions, reduced sale of fund shares or other adverse consequences to the Funds. Further, although we believe proceedings are not likely to have a material adverse effect on the Funds or the ability of Ameriprise Financial or its affiliates to perform under their contracts with the Funds, these proceedings are subject to uncertainties and, as such, we are unable to estimate the possible loss or range of loss that may result. An adverse outcome in one or more of these proceedings could result in adverse judgments, settlements, fines, penalties or other relief that could have a material adverse effect on the consolidated financial condition or results of operations of Ameriprise Financial.
Annual Report 2015
29
COLUMBIA AMT-FREE VIRGINIA INTERMEDIATE MUNI BOND FUND
REPORT OF INDEPENDENT REGISTERED PUBLIC ACCOUNTING FIRM
To the Trustees of Columbia Funds Series Trust and the Shareholders of
Columbia AMT-Free Virginia Intermediate Muni Bond Fund (formerly known as Columbia Virginia Intermediate Municipal Bond Fund)
In our opinion, the accompanying statement of assets and liabilities, including the portfolio of investments, and the related statements of operations and of changes in net assets and the financial highlights present fairly, in all material respects, the financial position of Columbia AMT-Free Virginia Intermediate Muni Bond Fund (formerly known as Columbia Virginia Intermediate Municipal Bond Fund) (the "Fund", a series of Columbia Funds Series Trust) at April 30, 2015, and the results of its operations, the changes in its net assets and the financial highlights for each of the periods indicated, in conformity with accounting principles generally accepted in the United States of America. These financial statements and financial highlights (hereafter referred to as "financial statements") are the responsibility of the Fund's management. Our responsibility is to express an opinion on these financial statements based on our audits. We conducted our audits of these financial statements in accordance with the standards of the Public Company Accounting Oversight Board (United States). Those standards require that we plan and perform the audit to obtain reasonable assurance about whether the financial statements are free of material misstatement. An audit includes examining, on a test basis, evidence supporting the amounts and disclosures in the financial statements, assessing the accounting principles used and significant estimates made by management, and evaluating the overall financial statement presentation. We believe that our audits, which included confirmation of securities at April 30, 2015 by correspondence with the custodian and brokers, and the application of alternative auditing procedures where such confirmations had not been received, provide a reasonable basis for our opinion.
PricewaterhouseCoopers LLP
Minneapolis, Minnesota
June 19, 2015
Annual Report 2015
30
COLUMBIA AMT-FREE VIRGINIA INTERMEDIATE MUNI BOND FUND
FEDERAL INCOME TAX INFORMATION
(Unaudited)
The Fund hereby designates the following tax attributes for the fiscal year ended April 30, 2015. Shareholders will be notified in early 2016 of the amounts for use in preparing 2015 income tax returns.
Tax Designations
Capital Gain Dividend | | $ | 450,926 | | |
| Exempt-Interest Dividends | | | 99.45 | % | |
Capital Gain Dividend. The Fund designates as a capital gain dividend the amount reflected above, or if subsequently determined to be different, the net capital gain of such fiscal period.
Exempt-Interest Dividends. The percentage of net investment income distributed during the fiscal year that qualifies as exempt-interest dividends for federal income tax purposes.
Annual Report 2015
31
COLUMBIA AMT-FREE VIRGINIA INTERMEDIATE MUNI BOND FUND
Shareholders elect the Board that oversees the Funds' operations. The Board appoints officers who are responsible for day-to-day business decisions based on policies set by the Board. The following table provides basic biographical information about the Funds' Board members, including their principal occupations during the past five years, although specific titles for individuals may have varied over the period. Under current Board policy, members may serve through the end of the calendar year in which he or she reaches either the mandatory retirement age established by the Board or the fifteenth anniversary of the first Board meeting they attended as a member of the Board.
Independent Trustees
Name,
Address,
Year of Birth | | Position Held
With Funds and
Length of Service | | Principal Occupation(s)
During Past Five Years
and Other Relevant
Professional Experience | | Number of
Funds in the
Fund Family
Overseen by
Board Member | | Other Present or Past
Directorships/
Trusteeships
(Within Past 5 Years) | |
Kathleen Blatz
901 S. Marquette Ave.
Minneapolis, MN 55402
1954 | | Board member since 1/06 for RiverSource Funds and since 6/11 for Nations Funds | | Attorney; specializing in arbitration and mediation; Chief Justice, Minnesota Supreme Court, 1998-2006; Associate Justice, Minnesota Supreme Court, 1996-1998; Fourth Judicial District Court Judge, Hennepin County, 1994-1996; Attorney in private practice and public service, 1984-1993; State Representative, Minnesota House of Representatives, 1979-1993, which included service on the Tax and Financial Institutions and Insurance Committees | | | 127 | | | Trustee, BlueCross BlueShield of Minnesota (Chair of the Business Development Committee) since 2009; Chair of the Robina Foundation since August 2013 | |
Edward J. Boudreau, Jr.
901 S. Marquette Ave.
Minneapolis, MN 55402
1944 | | Board member since 6/11 for RiverSource Funds and since 1/05 for Nations Funds | | Managing Director, E.J. Boudreau & Associates (consulting) since 2000; FINRA Industry Arbitrator, 2002-present; Chairman and Chief Executive Officer, John Hancock Funds (asset management), Chairman and Interested Trustee for open-end and closed-end funds offered by John Hancock, 1989-2000; John Hancock Life Insurance Company, including SVP and Treasurer and SVP Information Technology, 1968-1988 | | | 125 | | | Former Trustee, BofA Funds Series Trust (11 funds), 2005-2011; Trustee, Boston Museum of Science (Chair of Finance Committee), 1985-2013 | |
Pamela G. Carlton
901 S. Marquette Ave.
Minneapolis, MN 55402
1954 | | Board member since 7/07 for RiverSource Funds and since 6/11 for Nations Funds | | President, Springboard — Partners in Cross Cultural Leadership (consulting company) since 2003; Managing Director of US Equity Research, JP Morgan Chase, 1999-2003; Director of US Equity Research, Chase Asset Management, 1996-1999; Co-Director Latin America Research, 1993-1996, COO Global Research, 1992-1996, Co-Director of US Research, 1991-1992, Investment Banker, Morgan Stanley, 1982-1991 | | | 127 | | | None | |
Annual Report 2015
32
COLUMBIA AMT-FREE VIRGINIA INTERMEDIATE MUNI BOND FUND
TRUSTEES AND OFFICERS (continued)
Independent Trustees (continued)
Name,
Address,
Year of Birth | | Position Held
With Funds and
Length of Service | | Principal Occupation(s)
During Past Five Years
and Other Relevant
Professional Experience | | Number of
Funds in the
Fund Family
Overseen by
Board Member | | Other Present or Past
Directorships/
Trusteeships
(Within Past 5 Years) | |
William P. Carmichael
901 S. Marquette Ave.
Minneapolis, MN 55402
1943 | | Chair of the Board since 1/14, Board member since 6/11 for RiverSource Funds and since 2003 for Nations Funds | | Retired; Co-founder, The Succession Fund (provides exit strategies to owners of privately held companies) 1998-2007; Adjunct Professor of Finances, Kelley School of Business, Indiana University, 1993-2007; Senior Vice President, Sara Lee Corporation, 1991-1993; Senior Vice President and Chief Financial Officer, Beatrice Foods Company, 1984-1990; Vice President, Esmark, Inc., 1973-1984; Associate, Price Waterhouse, 1968-1972 | | | 127 | | | Director, Cobra Electronics Corporation (electronic equipment manufacturer), 1994-August 2014; The Finish Line (athletic shoes and apparel) since July 2003; Director, International Textile Corp. since 2012; former Director, McMoRan Exploration Company (oil and gas exploration and development) 2010-2013; former Trustee, BofA Funds Series Trust (11 funds) 2009-2011; Director, Spectrum Brands, Inc. (consumer products), 2002-2009; Director, Simmons Company (bedding), 2004-2010 | |
Patricia M. Flynn
901 S. Marquette Ave.
Minneapolis, MN 55402
1950 | | Board member since 11/04 for RiverSource Funds and since 6/11 for Nations Funds | | Trustee Professor of Economics and Management, Bentley University since 1976 (also teaches and conducts research on corporate governance); Dean, McCallum Graduate School of Business, Bentley University, 1992-2002 | | | 127 | | | Trustee, MA Taxpayers Foundation since 1997; Board of Governors, Innovation Institute, MA Technology Collaborative since 2010 | |
William A. Hawkins
901 S. Marquette Ave.
Minneapolis, MN 55402
1942 | | Board member since 6/11 for RiverSource Funds and since 1/05 for Nations Funds | | Managing Director, Overton Partners (financial consulting), since August 2010; President and Chief Executive Officer, California General Bank, N.A., January 2008-August 2010; Operation Hope, COO, 2004-2007; IndyMac Bancorp, President, CBG, 1999-2003; American General Bank, President, 1997-1999; Griffin Financial Services, CEO, 1981-1997; The Griffin Funds, CEO, 1992-1998 | | | 125 | | | Trustee, BofA Funds Series Trust (11 funds) | |
R. Glenn Hilliard
901 S. Marquette Ave.
Minneapolis, MN 55402
1943 | | Board member since 6/11 for RiverSource Funds and since 1/05 for Nations Funds | | Chairman and Chief Executive Officer, Hilliard Group LLC (investing and consulting) since April 2003; Non-Executive Director & Chairman, CNO Financial Group, Inc. (insurance), September 2003-May 2011 | | | 125 | | | Chairman, BofA Funds Series Trust (11 funds); former Director, CNO Financial Group, Inc. (insurance) 2003-2011 | |
Annual Report 2015
33
COLUMBIA AMT-FREE VIRGINIA INTERMEDIATE MUNI BOND FUND
TRUSTEES AND OFFICERS (continued)
Independent Trustees (continued)
Name,
Address,
Year of Birth | | Position Held
With Funds and
Length of Service | | Principal Occupation(s)
During Past Five Years
and Other Relevant
Professional Experience | | Number of
Funds in the
Fund Family
Overseen by
Board Member | | Other Present or Past
Directorships/
Trusteeships
(Within Past 5 Years) | |
Catherine James Paglia
901 S. Marquette Ave.
Minneapolis, MN 55402
1952 | | Board member since 11/04 for RiverSource Funds and since 6/11 for Nations Funds | | Director, Enterprise Asset Management, Inc. (private real estate and asset management company) since September 1998; Managing Director and Partner, Interlaken Capital, Inc., 1989-1997; Managing Director, Morgan Stanley, 1982-1989; Vice President, Investment Banking, 1980-1982, Associate, Investment Banking, 1976-1980, Dean Witter Reynolds, Inc. | | | 127 | | | Director, Valmont Industries, Inc. (irrigation systems manufacturer) since 2012; Trustee, Carleton College (on the Investment Committee); Trustee, Carnegie Endowment for International Peace (on the Investment Committee) | |
Leroy C. Richie
901 S. Marquette Ave.
Minneapolis, MN 55402
1941 | | Board member since 2000 for Seligman Funds, since 11/08 for RiverSource Funds and since 6/11 for Nations Funds | | Counsel, Lewis & Munday, P.C. (law firm) since 2004; Vice President and General Counsel, Automotive Legal Affairs, Chrysler Corporation, 1993-1997 | | | 127 | | | Lead Outside Director, Digital Ally, Inc. (digital imaging) since September 2005; Director, Infinity, Inc. (oil and gas exploration and production) since 1994; Director, OGE Energy Corp. (energy and energy services) 2007-2014 | |
Minor M. Shaw
901 S. Marquette Ave.
Minneapolis, MN 55402
1947 | | Board member since 6/11 for RiverSource Funds and since 2003 for Nations Funds | | President, Micco LLC (private investments) since 2011; President, Micco Corp. (family investment business) 1998-2011 | | | 125 | | | Director, Piedmont Natural Gas; Director, BlueCross BlueShield of South Carolina since April 2008; Chair of the Duke Endowment; Director, National Association of Corporate Directors, Carolinas Chapter, since 2013; Chair of Greenville-Spartanburg Airport Commission; former Trustee, BofA Funds Series Trust (11 funds), 2003-2011 | |
Alison Taunton-Rigby
901 S. Marquette Ave.
Minneapolis, MN 55402
1944 | | Board member since 11/02 for RiverSource Funds and since 6/11 for Nations Funds | | Managing Director, Forester Biotech (consulting) since 2001; Chief Executive Officer and Director, RiboNovix, Inc., (biotechnology) 2003-2010; President and Chief Executive Officer of CMT Inc., 2001-2003; Aquila Biopharmaceuticals Inc., 1996-2000; Cambridge Biotech Corporation, 1995-1996, Mitotix Inc., 1993-1994 | | | 127 | | | Director, Healthways, Inc. (health and well-being solutions) since 2005; Director, ICI Mutual Insurance Company, since 2011; Director, Abt Associates (government contractor) since 2001; Director, Boston Children's Hospital since 2002 | |
Annual Report 2015
34
COLUMBIA AMT-FREE VIRGINIA INTERMEDIATE MUNI BOND FUND
TRUSTEES AND OFFICERS (continued)
Interested Trustee Not Affiliated with Investment Manager*
Name,
Address,
Year of Birth | | Position Held
With Funds and
Length of Service | | Principal Occupation
During Past Five Years | | Number of
Funds in the
Fund Family
Overseen by
Board Member | | Other Present or Past
Directorships/
Trusteeships
(Within Past 5 Years) | |
Anthony M. Santomero
901 S. Marquette Ave.
Minneapolis, MN 55402
1946 | | Board member since 6/11 for RiverSource Funds and since 1/08 for Nations Funds | | Richard K. Mellon Professor Emeritus of Finance, The Wharton School, University of Pennsylvania, since 2002; Senior Advisor, McKinsey & Company (consulting), 2006-2008; President, Federal Reserve Bank of Philadelphia, 2000-2006, Professor of Finance, The Wharton School, University of Pennsylvania, 1972-2002 | | | 125 | | | Director, Renaissance Reinsurance Ltd. since May 2008; Trustee, Penn Mutual Life Insurance Company since March 2008; Director, Citigroup Inc. since 2009; Director, Citibank, N.A. since 2009; former Trustee, BofA Funds Series Trust (11 funds), 2008-2011 | |
* Dr. Santomero is not an affiliated person of the Investment Manager or Ameriprise Financial. However, he is currently deemed by the Funds to be an "interested person" (as defined in the 1940 Act) of the Funds because he serves as a Director of Citigroup Inc. and Citibank, N.A., companies that may directly or through subsidiaries and affiliates engage from time-to-time in brokerage execution, principal transactions and lending relationships with the Funds or accounts advised/managed by the Investment Manager.
Interested Trustee Affiliated with Investment Manager*
Name,
Address,
Year of Birth | | Position Held
With Funds and
Length of Service | | Principal Occupation
During Past Five Years | | Number of
Funds in the
Fund Family
Overseen by
Board Member | | Other Present or Past
Directorships/
Trusteeships
(Within Past 5 Years) | |
William F. Truscott
53600 Ameriprise Financial Center
Minneapolis, MN 55474
1960 | | Board member since 11/01 for RiverSource Funds and since 6/11 for Nations Funds; Senior Vice President since 2002 for RiverSource Funds and since 5/10 for Nations Funds | | Chairman of the Board and President, Columbia Management Investment Advisers, LLC since May 2010 and February 2012, respectively (previously President and Chief Investment Officer, 2001-April 2010); Chief Executive Officer, Global Asset Management, Ameriprise Financial, Inc. since September 2012 (previously Chief Executive Officer, U.S. Asset Management & President, Annuities, May 2010-September 2012 and President — U.S. Asset Management and Chief Investment Officer, 2005-April 2010); Director and Chief Executive Officer, Columbia Management Investment Distributors, Inc. since May 2010 and February 2012, respectively (previously Chairman of the Board and Chief Executive Officer, 2006-April 2010); Chairman of the Board and Chief Executive Officer, RiverSource Distributors, Inc. since 2006; Director, Threadneedle Asset Management Holdings, SARL since 2014; President and Chief Executive Officer, Ameriprise Certificate Company, 2006-August 2012 | | | 186 | | | Former Director, Ameriprise Certificate Company, 2006-January 2013 | |
* Interested person (as defined under the 1940 Act) by reason of being an officer, director, security holder and/or employee of the Investment Manager or Ameriprise Financial.
Annual Report 2015
35
COLUMBIA AMT-FREE VIRGINIA INTERMEDIATE MUNI BOND FUND
TRUSTEES AND OFFICERS (continued)
The Statement of Additional Information has additional information about the Fund's Board members and is available, without charge, upon request by calling 800.345.6611; contacting your financial intermediary or visiting columbiathreadneedle.com/us.
The Board has appointed officers who are responsible for day-to-day business decisions based on policies it has established. The officers serve at the pleasure of the Board. In addition to Mr. Truscott, who is Senior Vice President, the Funds' other officers are:
Fund Officers
Name,
Address and
Year of Birth | | Position and Year
First Appointed to
Position for any Fund
in the Columbia
Funds Complex or a
Predecessor Thereof | | Principal Occupation(s) During Past Five Years | |
Christopher O. Petersen
5228 Ameriprise
Financial Center
Minneapolis, MN 55474
Born 1970 | | President and Principal Executive Officer (2015) | | Vice President and Lead Chief Counsel, Ameriprise Financial, Inc. since January 2015 (previously, Vice President and Chief Counsel January 2010-December 2014; and Vice President and Group Counsel or Counsel 2004-January 2010); officer of Columbia Funds and affiliated funds since 2007. | |
Michael G. Clarke
225 Franklin Street
Boston, MA 02110
Born 1969 | | Treasurer (2011) and Chief Financial Officer (2009) | | Vice President — Mutual Fund Administration, Columbia Management Investment Advisers, LLC, since May 2010; Managing Director of Fund Administration, Columbia Management Advisors, LLC, September 2004-April 2010; senior officer of Columbia Funds and affiliated funds since 2002. | |
Paul B. Goucher
100 Park Avenue
New York, NY 10017
Born 1968 | | Senior Vice President (2011), Chief Legal Officer (2015) and Assistant Secretary (2008) | | Vice President and Lead Chief Counsel, Ameriprise Financial, Inc. since November 2008 and January 2013, respectively (previously Chief Counsel, January 2010-January 2013 and Group Counsel, November 2008-January 2010). | |
Thomas P. McGuire
225 Franklin Street
Boston, MA 02110
Born 1972 | | Vice President and Chief Compliance Officer (2012) | | Vice President — Asset Management Compliance, Ameriprise Financial, Inc., since May 2010; Chief Compliance Officer, Ameriprise Certificate Company since September 2010; Compliance Executive, Bank of America, 2005-April 2010. | |
Colin Moore
225 Franklin Street
Boston, MA 02110
Born 1958 | | Senior Vice President (2010) | | Executive Vice President and Global Chief Investment Officer, Ameriprise Financial, Inc., since July 2013; Director and Global Chief Investment Officer, Columbia Management Investment Advisers, LLC since May 2010; Manager, Managing Director and Chief Investment Officer, Columbia Management Advisors, LLC, 2007-April 2010. | |
Michael E. DeFao
225 Franklin Street
Boston, MA 02110
Born 1968 | | Vice President (2011) and Assistant Secretary (2010) | | Vice President and Chief Counsel, Ameriprise Financial, Inc. since May 2010; Associate General Counsel, Bank of America, 2005-April 2010. | |
Joseph F. DiMaria
225 Franklin Street
Boston, MA 02110
Born 1968 | | Vice President (2011), Assistant Treasurer (2012) and Chief Accounting Officer (2008) | | Vice President — Mutual Fund Treasurer, Columbia Management Investment Advisers, LLC since May 2010; Director of Fund Administration, Columbia Management Advisors, LLC, 2006-April 2010. | |
Amy Johnson
5228 Ameriprise
Financial Center
Minneapolis, MN 55474
Born 1965 | | Vice President (2006) | | Managing Director and Chief Operating Officer, Columbia Management Investment Advisers, LLC since May 2010 (previously Chief Administrative Officer, 2009-April 2010, and Vice President — Asset Management and Trust Company Services, 2006-2009). | |
Lyn Kephart-Strong
5228 Ameriprise
Financial Center
Minneapolis, MN 55474
Born 1960 | | Vice President (2015) | | President, Columbia Management Investment Services Corp. since October 2014; Vice President & Resolution Officer, Ameriprise Trust Company since August 2009; President, RiverSource Service Corporation 2004-2010. | |
Ryan C. Larrenaga
225 Franklin Street
Boston, MA 02110
Born 1970 | | Vice President and Secretary (2015) | | Vice President and Group Counsel, Ameriprise Financial, Inc. since August 2011 (previously, Counsel from May 2010 to August 2011); Assistant General Counsel, Bank of America, 2005-April 2010; officer of Columbia Funds and affiliated funds since 2005. | |
Annual Report 2015
36
COLUMBIA AMT-FREE VIRGINIA INTERMEDIATE MUNI BOND FUND
APPROVAL OF INVESTMENT MANAGEMENT SERVICES AGREEMENT
Columbia Management Investment Advisers, LLC (Columbia Management or the Investment Manager), a wholly-owned subsidiary of Ameriprise Financial, Inc. (Ameriprise Financial), serves as the investment manager to Columbia AMT-Free Virginia Intermediate Muni Bond Fund (the Fund). Under an investment management services agreement (the IMS Agreement), Columbia Management provides investment advice and other services to the Fund and other funds distributed by Columbia Management Investment Distributors, Inc. (collectively, the Funds).
The Fund's Board of Trustees (the Board), including the independent Board members (the Independent Trustees), considered the renewal of the IMS Agreement for a two-month period (Short-Term Period) in order to align the IMS Agreement with the review cycle of other funds in the Columbia family of funds. Columbia Management prepared detailed reports for the Board and its Contracts Committee in January, March and April 2015, including reports based on analyses of data provided by an independent organization (Lipper) and a comprehensive response to each item of information requested by independent legal counsel to the Independent Trustees (Independent Legal Counsel) in a letter to the Investment Manager, to assist the Board in making this determination. In addition, throughout the year, the Board (or its committees) regularly meets with portfolio management teams and senior management personnel, and reviews information prepared by Columbia Management addressing the services Columbia Management provides and Fund performance. The Board also accords appropriate weight to the work, deliberations and conclusions of the Contracts Committee, the Investment Review Committee and the Compliance Committee in determining whether to continue the IMS Agreement.
The Board, at its April 13-15, 2015 in-person Board meeting (the April Meeting), considered the renewal of the IMS Agreement for the Short-Term Period. At the April Meeting, Independent Legal Counsel reviewed with the Independent Trustees various factors relevant to the Board's consideration of advisory agreements and the Board's legal responsibilities related to such consideration. Following an analysis and discussion of the factors identified below, the Board, including all of the Independent Trustees, approved the renewal of the IMS Agreement for the Short-Term Period.
Nature, Extent and Quality of Services Provided by Columbia Management
The Independent Trustees analyzed various reports and presentations they had received detailing the services performed by Columbia Management, as well as its expertise, resources and capabilities. The Independent Trustees specifically considered many developments during the past year concerning the services provided by Columbia Management. The Independent Trustees noted the information they received concerning Columbia Management's ability to retain its key portfolio management personnel. In evaluating the quality of services provided under the IMS Agreement and the Fund's Administrative Services Agreement, the Independent Trustees also took into account the organization and strength of the Fund's and its service providers' compliance programs. In addition, the Board also reviewed the financial condition of Columbia Management (and its affiliates) and each entity's ability to carry out its responsibilities under the IMS Agreement and the Fund's other services agreements with affiliates of Ameriprise Financial, observing the financial strength of Ameriprise Financial, with its solid balance sheet. The Board also discussed the acceptability of the terms of the IMS Agreement for the Short-Term Period.
Based on the foregoing, and based on other information received (both oral and written, including the information on investment performance referenced below) and other considerations, the Board concluded that the services being performed by Columbia Management and its affiliates were acceptable for the Short-Term Period.
Investment Performance
For purposes of evaluating the nature, extent and quality of services provided under the IMS Agreement, the Board carefully reviewed the investment performance of the Fund. In this regard, the Board considered detailed reports providing the results of analyses performed by an independent organization showing, for various periods, the performance of the Fund, the performance of a benchmark index, the percentage ranking of the Fund among its comparison group and the net assets of the Fund. The Board observed that for purposes of approving the IMS Agreement for the Short-Term Period, the Fund's performance was acceptable.
Annual Report 2015
37
COLUMBIA AMT-FREE VIRGINIA INTERMEDIATE MUNI BOND FUND
APPROVAL OF INVESTMENT MANAGEMENT SERVICES AGREEMENT (continued)
Comparative Fees, Costs of Services Provided and the Profits Realized by Columbia Management and its Affiliates from their Relationships with the Fund
The Board reviewed comparative fees and the costs of services provided under the IMS Agreement. The Board members considered detailed comparative information set forth in an annual report on fees and expenses, including, among other things, data (based on analyses conducted by an independent organization) showing a comparison of the Fund's expenses with median expenses paid by funds in its comparative peer universe, as well as data showing the Fund's contribution to Columbia Management's profitability.
The Board accorded particular weight to the notion that the level of fees should reflect a rational pricing model applied consistently across the various product lines in the Fund family, while assuring that the overall fees for each Fund (with few defined exceptions) are generally in line with the "pricing philosophy" currently in effect (i.e., that the total expense ratio of the Fund is no higher than the median expense ratio of funds in the same comparison universe of the Fund).
The Board also considered the expected profitability of Columbia Management and its affiliates in connection with Columbia Management providing investment management services to the Fund. In this regard, the Board referred to a detailed profitability report, discussing the profitability to Columbia Management and Ameriprise Financial from managing, operating and distributing the Funds. For purposes of approving the IMS Agreement for the Short-Term Period, the Board concluded that the investment management service fees were fair and reasonable, observing that the profitability levels also seemed reasonable.
Economies of Scale to be Realized
The Board also considered the economies of scale that might be realized by Columbia Management as the Fund grows and took note of the extent to which Fund shareholders might also benefit from such growth. In this regard, the Independent Trustees took into account that IMS fees decline as Fund assets exceed various breakpoints.
Based on the foregoing, the Board, including all of the Independent Trustees, concluded that, for purposes of its consideration of the renewal of the IMS Agreement for the Short-Term Period, the investment management service fees were fair and reasonable in light of the extent and quality of services provided. In reaching this conclusion, no single factor was determinative. The Board noted its understanding that it would undertake the full consideration of renewal of the IMS Agreement for the full annual period at its June 2015 meetings. On April 15, 2015, the Board, including all of the Independent Trustees, approved the renewal of the IMS Agreement for the Short-Term Period.
Annual Report 2015
38
COLUMBIA AMT-FREE VIRGINIA INTERMEDIATE MUNI BOND FUND
IMPORTANT INFORMATION ABOUT THIS REPORT
Each fund mails one shareholder report to each shareholder address. If you would like more than one report, please call shareholder services at 800.345.6611 and additional reports will be sent to you.
The policy of the Board is to vote the proxies of the companies in which each fund holds investments consistent with the procedures as stated in the Statement of Additional Information (SAI). You may obtain a copy of the SAI without charge by calling 800.345.6611; contacting your financial intermediary; visiting columbiathreadneedle.com/us; or searching the website of the Securities and Exchange Commission (SEC) at sec.gov. Information regarding how each fund voted proxies relating to portfolio securities is filed with the SEC by August 31st for the most recent 12-month period ending June 30th of that year, and is available without charge by visiting columbiathreadneedle.com/us, or searching the website of the SEC at sec.gov.
Each fund files a complete schedule of portfolio holdings with the SEC for the first and third quarters of each fiscal year on Form N-Q. Each fund's Form N-Q is available on the SEC's website at sec.gov and may be reviewed and copied at the SEC's Public Reference Room in Washington, D.C. Information on the operation of the Public Reference Room may be obtained by calling 800.SEC.0330. Each fund's complete schedule of portfolio holdings, as filed on Form N-Q, can also be obtained without charge, upon request, by calling 800.345.6611.
Annual Report 2015
39
Columbia AMT-Free Virginia Intermediate Muni Bond Fund
P.O. Box 8081
Boston, MA 02266-8081

This information is for use with concurrent or prior delivery of a fund prospectus. Please read and consider the investment objectives, risks, charges and expenses for any fund carefully before investing. For a prospectus and summary prospectus, which contains this and other important information about the Fund, go to columbiathreadneedle.com/us. The Fund is distributed by Columbia Management Investment Distributors, Inc., member FINRA, and managed by Columbia Management Investment Advisers, LLC.
Columbia Threadneedle Investments (Columbia Threadneedle) is the global brand name of the Columbia and Threadneedle group of companies.
All rights reserved. Columbia Management Investment Distributors, Inc., 225 Franklin Street, Boston, MA 02110-2804
© 2015 Columbia Management Investment Advisers, LLC.
columbiathreadneedle.com/us
ANN239_04_E01_(06/15)

ANNUAL REPORT
April 30, 2015

COLUMBIA SHORT TERM MUNICIPAL BOND FUND

 Dear Shareholder,
In a world that is changing faster than ever before, investors want asset managers who offer a global perspective while generating strong and sustainable returns. To that end, Columbia Management, in conjunction with its U.K.-based affiliate, Threadneedle Investments, has rebranded to Columbia Threadneedle Investments. The new global brand represents the combined capabilities, resources and reach of the global group, offering investors access to the best of both firms.
With a presence in 18 countries and more than 450 investment professionals*, our collective perspective and world view as Columbia Threadneedle Investments gives us deeper insight into what might affect the real-life financial outcomes clients are seeking. Putting our views into a global context enables us to build richer perspectives and create the right solutions, and provides us with enhanced capabilities to deliver consistent investment performance, which may ultimately lead to better investor outcomes.
As a result of the rebrand, you will begin to see our new logo and colors reflected in printed materials, such as this shareholder report, as well as on our new website — columbiathreadneedle.com/us. We encourage you to visit us online and view a new video on the "About Us" tab that speaks to the strength of the firm.
While we are introducing a new brand, in many ways, the investment company you know well has not changed. The following remain in effect:
n Fund and strategy names
n Established investment teams, philosophies and processes
n Account services, features, servicing phone numbers and mailing addresses
n Columbia Management Investment Distributors as distributor and Columbia Management Investment Advisers as investment adviser
We recognize that the money we manage represents the hard work and savings of people like you, and that everyone has different ambitions and different definitions of success. Investors have varying goals — funding their children's education, enjoying their retirement, putting money aside for unexpected events, and more. Whatever your ambitions, we believe our wide range of investment products and solutions can help give you confidence that you will reach your goals.
The world is constantly changing, but our priority remains the same: to help you secure your finances, meet your goals and achieve success. Thank you for your continued investment with us. Our service representatives are available at 800.345.6611 to help with any questions.
Sincerely,

Christopher O. Petersen
President, Columbia Funds
Investors should consider the investment objectives, risks, charges and expenses of a mutual fund carefully before investing. For a free prospectus and summary prospectus, which contains this and other important information about a fund, visit columbiathreadneedle.com/us. The prospectus should be read carefully before investing.
* Source: Ameriprise as of December 1, 2014
Columbia Funds are distributed by Columbia Management Investment Distributors, Inc., member FINRA, and managed by Columbia Management Investment Advisers, LLC.
© 2015 Columbia Management Investment Advisers, LLC. All rights reserved.
COLUMBIA SHORT TERM MUNICIPAL BOND FUND
Performance Overview | | | 2 | | |
Manager Discussion of Fund Performance | | | 4 | | |
Understanding Your Fund's Expenses | | | 7 | | |
Portfolio of Investments | | | 8 | | |
Statement of Assets and Liabilities | | | 25 | | |
Statement of Operations | | | 27 | | |
Statement of Changes in Net Assets | | | 28 | | |
Financial Highlights | | | 30 | | |
Notes to Financial Statements | | | 36 | | |
Report of Independent Registered
Public Accounting Firm | | | 43 | | |
Federal Income Tax Information | | | 44 | | |
Trustees and Officers | | | 45 | | |
Approval of Investment Management Services Agreement | | | 51 | | |
Important Information About This Report | | | 53 | | |
Fund Investment Manager
Columbia Management Investment
Advisers, LLC
225 Franklin Street
Boston, MA 02110
Fund Distributor
Columbia Management Investment
Distributors, Inc.
225 Franklin Street
Boston, MA 02110
Fund Transfer Agent
Columbia Management Investment
Services Corp.
P.O. Box 8081
Boston, MA 02266-8081
For more information about any of the funds, please visit columbiathreadneedle.com/us or call 800.345.6611. Customer Service Representatives are available to answer your questions Monday through Friday from 8 a.m. to 7 p.m. Eastern time.
The views expressed in this report reflect the current views of the respective parties. These views are not guarantees of future performance and involve certain risks, uncertainties and assumptions that are difficult to predict, so actual outcomes and results may differ significantly from the views expressed. These views are subject to change at any time based upon economic, market or other conditions and the respective parties disclaim any responsibility to update such views. These views may not be relied on as investment advice and, because investment decisions for a Columbia fund are based on numerous factors, may not be relied on as an indication of trading intent on behalf of any particular Columbia fund. References to specific securities should not be construed as a recommendation or investment advice.
COLUMBIA SHORT TERM MUNICIPAL BOND FUND
Performance Summary
n Columbia Short Term Municipal Bond Fund (the Fund) Class A shares returned 0.22% excluding sales charges for the 12-month period that ended April 30, 2015. The Fund's Class Z shares returned 0.47% during the same time period.
n The Fund's benchmark, the Barclays 1-3 Year Municipal Bond Index, returned 0.64% for the same 12 months.
n The positive contributions of sector, credit quality and yield curve positioning overall were offset by the negative impact of exposure to select credits that were downgraded during the annual period.
Average Annual Total Returns (%) (for period ended April 30, 2015)
| | | Inception | | 1 Year | | 5 Years | | 10 Years | |
Class A | | 11/02/93 | | | | | | | | | | | | | |
Excluding sales charges | | | | | | | 0.22 | | | | 0.89 | | | | 2.06 | | |
Including sales charges | | | | | | | -0.82 | | | | 0.69 | | | | 1.96 | | |
Class B | | 10/12/93 | | | -0.43 | | | | 0.14 | | | | 1.30 | | |
Class C | | 05/19/94 | | | | | | | | | | | | | |
Excluding sales charges | | | | | | | -0.53 | | | | 0.14 | | | | 1.30 | | |
Including sales charges | | | | | | | -1.52 | | | | 0.14 | | | | 1.30 | | |
Class R4* | | 03/19/13 | | | 0.47 | | | | 1.13 | | | | 2.31 | | |
Class R5* | | 11/08/12 | | | 0.57 | | | | 1.18 | | | | 2.34 | | |
Class Z | | 10/07/93 | | | 0.47 | | | | 1.15 | | | | 2.32 | | |
Barclays 1-3 Year Municipal Bond Index | | | | | | | 0.64 | | | | 1.23 | | | | 2.49 | | |
Returns for Class A are shown with and without the maximum initial sales charge of 1.00%. Returns for Class C are shown with and without the applicable contingent deferred sales charge (CDSC) of 1.00% in the first year. The Fund's other classes are not subject to sales charges and have limited eligibility. Please see the Fund's prospectus for details. Performance for different share classes will vary based on differences in sales charges and fees associated with each class. All results shown assume reinvestment of distributions during the period. Returns do not reflect the deduction of taxes that a shareholder may pay on Fund distributions or on the redemption of Fund shares. Performance results reflect the effect of any fee waivers or reimbursements of Fund expenses by Columbia Management Investment Advisers, LLC and/or any of its affiliates. Absent these fee waivers or expense reimbursement arrangements, performance results would have been lower.
The performance information shown represents past performance and is not a guarantee of future results. The investment return and principal value of your investment will fluctuate so that your shares, when redeemed, may be worth more or less than their original cost. Current performance may be lower or higher than the performance information shown. You may obtain performance information current to the most recent month-end by contacting your financial intermediary, visiting columbiathreadneedle.com/us or calling 800.345.6611.
*The returns shown for periods prior to the share class inception date (including returns for the Life of the Fund, if shown, which are since Fund inception) include the returns of the Fund's oldest share class. These returns are adjusted to reflect any higher class-related operating expenses of the newer share classes, as applicable. Please visit columbiathreadneedle.com/us/investment-products/mutual-funds/appended-performance for more information.
The Barclays 1-3 Year Municipal Bond Index is an unmanaged index which consists of a broad selection of investment grade general obligation and revenue bonds of maturities ranging from one year to three years.
Indices are not available for investment, are not professionally managed and do not reflect sales charges, fees, brokerage commissions, taxes or other expenses of investing. Securities in the Fund may not match those in an index.
Annual Report 2015
2
COLUMBIA SHORT TERM MUNICIPAL BOND FUND
PERFORMANCE OVERVIEW (continued)
Performance of a Hypothetical $10,000 Investment (May 1, 2005 – April 30, 2015)
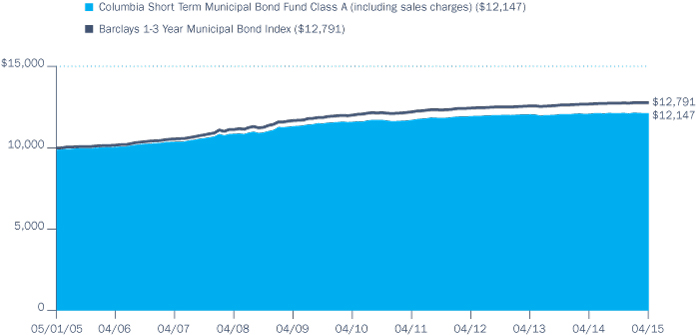
The chart above shows the change in value of a hypothetical $10,000 investment in Class A shares of Columbia Short Term Municipal Bond Fund during the stated time period, and does not reflect the deduction of taxes that a shareholder may pay on Fund distributions or on the redemption of Fund shares.
Annual Report 2015
3
COLUMBIA SHORT TERM MUNICIPAL BOND FUND
MANAGER DISCUSSION OF FUND PERFORMANCE
Portfolio Management
Catherine Stienstra
Anders Myhran, CFA*
*Effective April 15, 2015, Mr. Myhran was named a Portfolio Manager of the Fund.
Top Ten States (%)
(at April 30, 2015) | |
New York | | | 23.4 | | |
Illinois | | | 11.5 | | |
California | | | 6.7 | | |
Texas | | | 6.1 | | |
New Jersey | | | 5.7 | | |
Florida | | | 4.4 | | |
Washington | | | 4.3 | | |
Connecticut | | | 4.1 | | |
Pennsylvania | | | 3.7 | | |
Michigan | | | 2.4 | | |
Percentages indicated are based upon total investments (excluding Money Market Funds).
For further detail about these holdings, please refer to the section entitled "Portfolio of Investments."
Fund holdings are as of the date given, are subject to change at any time, and are not recommendations to buy or sell any security.
For the 12-month period that ended April 30, 2015, the Fund's Class A shares returned 0.22% excluding sales charges. Class Z shares of the Fund returned 0.47% for the same time period. The Fund's benchmark, the Barclays 1-3 Year Municipal Bond Index, returned 0.64% for the 12 months. The positive contributions of sector, credit quality and yield curve positioning overall were offset by the negative impact of exposure to select credits that were downgraded during the annual period.
Short-Term Tax-Exempt Bond Market Advanced Modestly
The tax-exempt fixed-income market posted solid gains during the annual period, although the short-term end of the yield curve, or spectrum of maturities, was pressured and advanced only modestly. Yields on short-term maturities, i.e., five years and under, rose, even as yields on longer term maturities, i.e., ten years and more, declined. (Remember, there is usually an inverse relationship between bond prices and yield movements, so that bond prices fall when yields rise and vice versa.) In turn, the municipal bond yield curve flattened.
Short-term municipal bond yields were volatile during the annual period. For example, the yield on the five-year AAA-rated municipal bond rose significantly in December 2014, then fell dramatically in January 2015 before rising again through the remaining months of the annual period. Such volatility was due primarily to anticipation of interest rate hikes by the Federal Reserve (the Fed) beginning sooner rather than later following the end of its quantitative easing program in October 2014. Also, as expected, the Fed removed a reference to being "patient" about raising rates from its policy statement in March 2015, giving it the flexibility to start raising rates in the upcoming months. However, its tone concerning the overall health of the economy was cautious, noting it must be reasonably confident inflation will move back toward its target before raising rates. This messaging caused further volatility in the short-term municipal bond market and heightened speculation regarding the timing of the Fed's first tightening move.
From a fundamental perspective, states saw greater revenue — topping pre-recession peaks — on the back of increasing sales, income and property taxes along with lower expenses following recent austerity measures taken, as state and local government spending remained constrained. Select negative credit stories made headlines, including the state of Illinois' pension and budgetary turmoil, Puerto Rico's multi-notch downgrade, Detroit's Chapter 9 bankruptcy filing and the state of New Jersey's multiple downgrades. However, such issues were not representative of the broad municipal bond market. There was momentum towards resolution in the Detroit bankruptcy case, and New York and California experienced rating upgrades. Overall default rates trended down. The technical, or supply and demand, landscape for the annual period overall also remained favorable. Supply on the national and state levels declined for much of the first half of the annual period before picking up toward the second half of the fiscal year. Year-to-date 2015 through April 30, approximately 50% of the new issue supply was due to refunding activity. For the same time period, demand, as evidenced by nearly $11.4 billion of municipal bond mutual fund inflows, was positive.
Annual Report 2015
4
COLUMBIA SHORT TERM MUNICIPAL BOND FUND
MANAGER DISCUSSION OF FUND PERFORMANCE (continued)
Exposure to New Jersey and Chicago Credits Hampered Returns
Detracting from Fund results was exposure to New Jersey state-appropriated bonds and Chicago credits, as these issues' spreads, or yield differentials to AAA-rated municipal bonds, widened. Chicago credits detracted from performance, as headlines around its local elections and failed attempts to implement a plan to stabilize its pension reform drove a downgrade by Moody's to Baa2 with a negative outlook. New Jersey was downgraded by Standard & Poor's and Fitch in September 2014 and Moody's in April 2015 due to ongoing structural imbalances, large and growing unfunded pension liability and above-average debt and other post-employment benefit liabilities. To a lesser extent, having an underweighted allocation to Puerto Rico bonds also detracted. While Puerto Rico credit was downgraded, its short-term bonds, most of which are insured, still outperformed the benchmark during the annual period.
Sector and Credit Quality Allocation Overall Boosted Results
The prerefunded sector, generally a higher quality sector, underperformed lower quality sectors during the annual period and the Fund benefited from its underweight allocation. Effective issue selection among the local general obligation, transportation, resource recovery and New York-based credit sectors contributed positively as well. In terms of credit quality, having overweight allocations to bonds rated A and BBB and to non-rated securities and underweighted allocations to bonds rated AAA and AA added value, as lower quality securities overall decidedly outperformed higher quality securities during the annual period.
The Fund also benefited from its yield curve positioning. The Fund had exposure to bonds with maturities of more than three years, which, although not part of the Barclays Index, contributed positively, as longer-dated maturities outperformed shorter-term maturities even within the short-term segment, i.e. one to five year range, of the municipal bond yield curve.
Fundamental Analysis Drove Portfolio Changes
The Fund began the annual period with a duration modestly longer than that of the benchmark. As the months progressed, we incrementally shortened the Fund's relative duration, usually in advance of Fed activity or other important economic data releases that had the potential to increase short-term rate volatility. Also, the Fund's barbell structure became less pronounced — becoming more overweight in bonds with maturities of one year and under and less overweight in bonds with longer maturities — as we allowed the barbell structure to drift in along with duration. At the same time, we reduced exposure to some higher quality, state general obligation positions in the three-year segment of the yield curve and sought lower quality four-year maturities to help build and maintain an income advantage. From a geographical perspective, we increased the Fund's allocation to Pennsylvania state and local general obligation bonds and reduced its exposure to New Jersey state-appropriated debt.
Quality Breakdown (%)
(at April 30, 2015) | |
AAA rating | | | 3.6 | | |
AA rating | | | 29.9 | | |
A rating | | | 47.2 | | |
BBB rating | | | 4.9 | | |
Not rated | | | 14.4 | | |
Total | | | 100.0 | | |
Percentages indicated are based upon total fixed income investments (excluding Money Market Funds).
Bond ratings apply to the underlying holdings of the Fund and not the Fund itself and are divided into categories ranging from highest to lowest credit quality, determined by using the middle rating of Moody's, S&P and Fitch, after dropping the highest and lowest available ratings. When ratings are available from only two rating agencies, the lower rating is used. When a rating is available from only one rating agency, that rating is used. When a bond is not rated by any rating agency, it is designated as "Not rated". Credit quality ratings assigned by a rating agency are subjective opinions, not statements of fact, and are subject to change, including daily. The ratings assigned by credit rating agencies are but one of the considerations that the Investment Manager and/or Fund's subadviser incorporates into its credit analysis process, along with such other issuer-specific factors as cash flows, capital structure and leverage ratios, ability to de-leverage (repay) through free cash flow, quality of management, market positioning and access to capital, as well as such security-specific factors as the terms of the security (e.g., interest rate, and time to maturity) and the amount and type of any collateral.
Annual Report 2015
5
COLUMBIA SHORT TERM MUNICIPAL BOND FUND
MANAGER DISCUSSION OF FUND PERFORMANCE (continued)
Investment Risks
Fixed-income securities present issuer default risk. The fund invests substantially in municipal securities and will be affected by tax, legislative, regulatory, demographic or political changes, as well as changes impacting a state's financial, economic or other conditions. A relatively small number of tax-exempt issuers may necessitate the fund investing more heavily in a single issuer and, therefore, be more exposed to the risk of loss than a fund that invests more broadly. Prepayment and extension risk exists as a loan, bond or other investment may be called, prepaid or redeemed before maturity and that similar yielding investments may not be available for purchase. Market risk may affect a single issuer, sector of the economy, industry or the market as a whole. A rise in interest rates may result in a price decline of fixed-income instruments held by the fund, negatively impacting its performance and NAV. Falling rates may result in the fund investing in lower yielding debt instruments, lowering the fund's income and yield. These risks may be heightened for longer maturity and duration securities. Federal and state tax rules apply to capital gain distributions and any gains or losses on sales. Income may be subject to state, local or alternative minimum taxes. See the Fund's prospectus for more information on these and other risks.
Looking Ahead
As we get closer to the Fed's first possible interest rate increase since the financial crisis, we expect to see a continuation of volatility in the short-term municipal bond market, with the potential for heightened and more frequent movements in yields. At the end of the annual period, the market was pricing in an initial move in the targeted federal funds rate for later this year, with gradual increases thereafter. While the risk to this consensus may be for the Fed to start moving sooner, we currently believe its tightening cycle will likely be slow and methodical by historical standards.
In an environment where rates are expected to shift gradually higher but with some uncertainty around timing, we intend to manage the fund's duration to remain neutral to modestly short compared to that of the benchmark. We also currently intend to maintain the fund's overweight to lower quality investment-grade credits. We expect at this time to maintain the fund's barbell maturity profile as a strategy to mitigate volatility risk as well as to seek to take advantage of potentially higher short-term rates going forward. Finally, we currently intend to continue to seek yield one security at a time, relying heavily on the strength of our in-house municipal credit research team to help us evaluate the risk and return potential of each issue. As always, the fund's emphasis remains on seeking current income exempt from federal income tax, consistent with minimal fluctuation of principal.
Annual Report 2015
6
COLUMBIA SHORT TERM MUNICIPAL BOND FUND
UNDERSTANDING YOUR FUND'S EXPENSES
(Unaudited)
As an investor, you incur two types of costs. There are transaction costs, which generally include sales charges on purchases and may include redemption fees. There are also ongoing costs, which generally include management fees, distribution and/or service fees, and other fund expenses. The following information is intended to help you understand your ongoing costs (in dollars) of investing in the Fund and to help you compare these costs with the ongoing costs of investing in other mutual funds.
Analyzing Your Fund's Expenses
To illustrate these ongoing costs, we have provided examples and calculated the expenses paid by investors in each share class of the Fund during the period. The actual and hypothetical information in the table is based on an initial investment of $1,000 at the beginning of the period indicated and held for the entire period. Expense information is calculated two ways and each method provides you with different information. The amount listed in the "Actual" column is calculated using the Fund's actual operating expenses and total return for the period. You may use the Actual information, together with the amount invested, to estimate the expenses that you paid over the period. Simply divide your account value by $1,000 (for example, an $8,600 account value divided by $1,000 = 8.6), then multiply the results by the expenses paid during the period under the "Actual" column. The amount listed in the "Hypothetical" column assumes a 5% annual rate of return before expenses (which is not the Fund's actual return) and then applies the Fund's actual expense ratio for the period to the hypothetical return. You should not use the hypothetical account values and expenses to estimate either your actual account balance at the end of the period or the expenses you paid during the period. See "Compare With Other Funds" below for details on how to use the hypothetical data.
Compare With Other Funds
Since all mutual funds are required to include the same hypothetical calculations about expenses in shareholder reports, you can use this information to compare the ongoing cost of investing in the Fund with other funds. To do so, compare the hypothetical example with the 5% hypothetical examples that appear in the shareholder reports of other funds. As you compare hypothetical examples of other funds, it is important to note that hypothetical examples are meant to highlight the ongoing costs of investing in a fund only and do not reflect any transaction costs, such as sales charges, or redemption or exchange fees. Therefore, the hypothetical calculations are useful in comparing ongoing costs only, and will not help you determine the relative total costs of owning different funds. If transaction costs were included in these calculations, your costs would be higher.
November 1, 2014 – April 30, 2015
| | | Account Value at the Beginning
of the Period ($) | | Account Value at the End of the
Period ($) | | Expenses Paid During the
Period ($) | | Fund's Annualized
Expense Ratio (%) | |
| | | Actual | | Hypothetical | | Actual | | Hypothetical | | Actual | | Hypothetical | | Actual | |
Class A | | | 1,000.00 | | | | 1,000.00 | | | | 1,000.00 | | | | 1,021.17 | | | | 3.62 | | | | 3.66 | | | | 0.73 | | |
Class B | | | 1,000.00 | | | | 1,000.00 | | | | 996.20 | | | | 1,017.46 | | | | 7.33 | | | | 7.40 | | | | 1.48 | | |
Class C | | | 1,000.00 | | | | 1,000.00 | | | | 995.30 | | | | 1,017.46 | | | | 7.32 | | | | 7.40 | | | | 1.48 | | |
Class R4 | | | 1,000.00 | | | | 1,000.00 | | | | 1,000.20 | | | | 1,022.41 | | | | 2.38 | | | | 2.41 | | | | 0.48 | | |
Class R5 | | | 1,000.00 | | | | 1,000.00 | | | | 1,000.70 | | | | 1,022.91 | | | | 1.89 | | | | 1.91 | | | | 0.38 | | |
Class Z | | | 1,000.00 | | | | 1,000.00 | | | | 1,000.20 | | | | 1,022.41 | | | | 2.38 | | | | 2.41 | | | | 0.48 | | |
Expenses paid during the period are equal to the annualized expense ratio for each class as indicated above, multiplied by the average account value over the period and then multiplied by the number of days in the Fund's most recent fiscal half year and divided by 365.
Expenses do not include fees and expenses incurred indirectly by the Fund from its investment in underlying funds, including affiliated and non-affiliated pooled investment vehicles, such as mutual funds and exchange-traded funds.
Had Columbia Management Investment Advisers, LLC and/or certain of its affiliates not waived/reimbursed certain fees and expenses, account value at the end of the period would have been reduced.
Annual Report 2015
7
COLUMBIA SHORT TERM MUNICIPAL BOND FUND
PORTFOLIO OF INVESTMENTS
April 30, 2015
(Percentages represent value of investments compared to net assets)
Municipal Bonds 82.9%
Issue
Description | | Coupon
Rate | | Principal
Amount ($) | |
Value ($) | |
ALABAMA 0.7% | |
Alabama 21st Century Authority
Revenue Bonds
Series 2012A
06/01/18 | | | 5.000 | % | | | 1,250,000 | | | | 1,388,775 | | |
Alabama Public School & College Authority
Refunding Revenue Bonds
Pool
Series 2012A
03/01/18 | | | 5.000 | % | | | 7,510,000 | | | | 8,362,911 | | |
Auburn University
Revenue Bonds
Series 2012A
06/01/16 | | | 5.000 | % | | | 3,000,000 | | | | 3,151,740 | | |
Total | | | | | | | 12,903,426 | | |
ALASKA 0.9% | |
Alaska Industrial Development & Export Authority
Refunding Revenue Bonds
Revolving Fund
Series 2010A
04/01/16 | | | 5.000 | % | | | 2,500,000 | | | | 2,606,975 | | |
City of Valdez
Refunding Revenue Bonds
BP Pipelines, Inc. Project
Series 2003
01/01/16 | | | 5.000 | % | | | 9,200,000 | | | | 9,479,404 | | |
Municipality of Anchorage
Unlimited General Obligation Refunding Bonds
General Purpose
Series 2014B
09/01/19 | | | 5.000 | % | | | 3,645,000 | | | | 4,220,582 | | |
Total | | | | | | | 16,306,961 | | |
ARIZONA 1.2% | |
Arizona School Facilities Board
Certificate of Participation
Series 2008
09/01/18 | | | 5.750 | % | | | 5,935,000 | | | | 6,815,279 | | |
Refunding Certificate of Participation
Series 2013A-1
09/01/16 | | | 4.000 | % | | | 1,500,000 | | | | 1,571,310 | | |
Arizona Transportation Board
Refunding Revenue Bonds
Series 2014
07/01/19 | | | 5.000 | % | | | 4,250,000 | | | | 4,901,058 | | |
City of Glendale
Limited General Obligation Refunding Bonds
Series 2015 (AGM)
07/01/19 | | | 4.000 | % | | | 1,350,000 | | | | 1,473,309 | | |
Municipal Bonds (continued)
Issue
Description | | Coupon
Rate | | Principal
Amount ($) | |
Value ($) | |
County of Pima Sewer System
Revenue Bonds
Series 2012A
07/01/16 | | | 3.000 | % | | | 450,000 | | | | 464,013 | | |
07/01/16 | | | 4.000 | % | | | 500,000 | | | | 521,400 | | |
Maricopa County Industrial Development Authority
Revenue Bonds
Catholic Healthcare West
Series 2007A
07/01/18 | | | 5.000 | % | | | 1,845,000 | | | | 1,994,242 | | |
State of Arizona
Certificate of Participation
Department of Administration
Series 2010A (AGM)
10/01/15 | | | 5.000 | % | | | 5,000,000 | | | | 5,100,800 | | |
Refunding Certificate of Participation
Department of Administration
Series 2013B
10/01/15 | | | 4.000 | % | | | 200,000 | | | | 203,100 | | |
10/01/16 | | | 5.000 | % | | | 175,000 | | | | 185,633 | | |
Total | | | | | | | 23,230,144 | | |
CALIFORNIA 6.0% | |
Brea Redevelopment Agency
Refunding Tax Allocation Bonds
Redevelopment Project
Series 2013
08/01/17 | | | 5.000 | % | | | 950,000 | | | | 1,040,820 | | |
08/01/18 | | | 5.000 | % | | | 995,000 | | | | 1,117,773 | | |
California Health Facilities Financing Authority
Revenue Bonds
St. Joseph Health Systems
Series 2013B(a)
07/01/43 | | | 5.000 | % | | | 4,000,000 | | | | 4,418,920 | | |
California State Public Works Board
Refunding Revenue Bonds
Department of Corrections
Series 2012
06/01/15 | | | 5.000 | % | | | 2,080,000 | | | | 2,088,849 | | |
Richmond Laboratory Project
Series 2012
11/01/15 | | | 4.000 | % | | | 2,035,000 | | | | 2,074,683 | | |
Series 2014G
01/01/19 | | | 5.000 | % | | | 13,500,000 | | | | 15,304,680 | | |
Revenue Bonds
Various Capital Projects
Series 2011A
10/01/16 | | | 4.000 | % | | | 2,000,000 | | | | 2,101,640 | | |
Series 2013I
11/01/17 | | | 5.000 | % | | | 750,000 | | | | 827,355 | | |
Subordinated Series 2010A-1
03/01/16 | | | 5.000 | % | | | 1,325,000 | | | | 1,377,656 | | |
The accompanying Notes to Financial Statements are an integral part of this statement.
Annual Report 2015
8
COLUMBIA SHORT TERM MUNICIPAL BOND FUND
PORTFOLIO OF INVESTMENTS (continued)
April 30, 2015
Municipal Bonds (continued)
Issue
Description | | Coupon
Rate | | Principal
Amount ($) | |
Value ($) | |
City of San Jose Airport
Revenue Bonds
Series 2007A (AMBAC) AMT(b)
03/01/17 | | | 5.000 | % | | | 5,415,000 | | | | 5,826,648 | | |
County of Sacramento
Revenue Bonds
GNMA Mortgage Issue
Series 1998A Escrowed to Maturity AMT(b)
07/01/16 | | | 8.000 | % | | | 12,810,000 | | | | 13,946,247 | | |
Glendale Redevelopment Agency Successor Agency
Refunding Tax Allocation Bonds
Central Glendale Redevelopment
Subordinated Series 2013 (AGM)
12/01/15 | | | 3.000 | % | | | 1,000,000 | | | | 1,016,390 | | |
12/01/16 | | | 4.000 | % | | | 1,000,000 | | | | 1,054,780 | | |
12/01/17 | | | 4.000 | % | | | 1,235,000 | | | | 1,332,738 | | |
Northern California Power Agency
Revenue Bonds
Series 2010A
07/01/15 | | | 4.000 | % | | | 1,355,000 | | | | 1,363,902 | | |
Oakland Redevelopment Successor Agency
Refunding Tax Allocation Bonds
Subordinated Series 2013
09/01/15 | | | 5.000 | % | | | 4,500,000 | | | | 4,571,595 | | |
09/01/16 | | | 5.000 | % | | | 3,300,000 | | | | 3,495,294 | | |
Oakland Unified School District/Alameda County
Unlimited General Obligation Bonds
Election of 2012
Series 2013
08/01/15 | | | 4.000 | % | | | 1,470,000 | | | | 1,481,819 | | |
Sacramento City Financing Authority
Refunding Revenue Bonds
EPA Building
Series 2013A
05/01/15 | | | 4.000 | % | | | 1,250,000 | | | | 1,250,140 | | |
05/01/16 | | | 4.000 | % | | | 750,000 | | | | 778,305 | | |
State of California
Unlimited General Obligation Bonds
Various Purpose
Series 2011
10/01/16 | | | 5.000 | % | | | 10,000,000 | | | | 10,657,700 | | |
Series 2013
02/01/18 | | | 5.000 | % | | | 10,000,000 | | | | 11,128,000 | | |
02/01/19 | | | 5.000 | % | | | 6,650,000 | | | | 7,577,874 | | |
Series 2014
10/01/18 | | | 5.000 | % | | | 5,000,000 | | | | 5,672,400 | | |
10/01/19 | | | 5.000 | % | | | 8,460,000 | | | | 9,798,034 | | |
Total | | | | | | | 111,304,242 | | |
Municipal Bonds (continued)
Issue
Description | | Coupon
Rate | | Principal
Amount ($) | |
Value ($) | |
COLORADO 0.7% | |
Denver Urban Renewal Authority
Tax Allocation Bonds
Stapleton
Senior Series 2013A-1
12/01/15 | | | 5.000 | % | | | 1,670,000 | | | | 1,715,407 | | |
E-470 Public Highway Authority
Revenue Bonds
Capital Appreciation
Senior Series 1997B (NPFGC)(c)
09/01/16 | | | 0.000 | % | | | 4,460,000 | | | | 4,382,441 | | |
Regional Transportation District
Certificate of Participation
Series 2010A
06/01/15 | | | 5.000 | % | | | 1,420,000 | | | | 1,425,982 | | |
06/01/16 | | | 5.000 | % | | | 2,010,000 | | | | 2,111,364 | | |
Refunding Certificate of Participation
Series 2013A
06/01/16 | | | 5.000 | % | | | 3,045,000 | | | | 3,198,559 | | |
Total | | | | | | | 12,833,753 | | |
CONNECTICUT 3.0% | |
City of Bridgeport
Unlimited General Obligation Refunding Bonds
Series 2012B
08/15/15 | | | 4.000 | % | | | 2,500,000 | | | | 2,527,625 | | |
08/15/17 | | | 5.000 | % | | | 5,000,000 | | | | 5,458,000 | | |
City of New Haven
Unlimited General Obligation Bonds
Series 2013A
08/01/15 | | | 5.000 | % | | | 3,135,000 | | | | 3,170,896 | | |
Unlimited General Obligation Refunding Bonds
Series 2006 (AMBAC)
11/01/15 | | | 5.000 | % | | | 2,325,000 | | | | 2,377,313 | | |
Connecticut Housing Finance Authority
Refunding Revenue Bonds
Series 2014
11/15/44 | | | 4.000 | % | | | 4,750,000 | | | | 5,124,537 | | |
Revenue Bonds
Subordinated Series 2012D-1
11/15/15 | | | 1.200 | % | | | 3,710,000 | | | | 3,726,843 | | |
State of Connecticut
Unlimited General Obligation Refunding Bonds
Series 2014C
12/15/18 | | | 5.000 | % | | | 5,200,000 | | | | 5,888,168 | | |
Series 2014H
11/15/19 | | | 5.000 | % | | | 13,500,000 | | | | 15,583,050 | | |
State of Connecticut(a)
Unlimited General Obligation Bonds
Series 2011A
05/15/15 | | | 0.610 | % | | | 11,265,000 | | | | 11,266,745 | | |
Total | | | | | | | 55,123,177 | | |
The accompanying Notes to Financial Statements are an integral part of this statement.
Annual Report 2015
9
COLUMBIA SHORT TERM MUNICIPAL BOND FUND
PORTFOLIO OF INVESTMENTS (continued)
April 30, 2015
Municipal Bonds (continued)
Issue
Description | | Coupon
Rate | | Principal
Amount ($) | |
Value ($) | |
DISTRICT OF COLUMBIA 0.3% | |
District of Columbia
Prerefunded 01/01/16 Certificate of Participation
Series 2006 (NPFGC)
01/01/17 | | | 5.250 | % | | | 5,925,000 | | | | 6,121,355 | | |
FLORIDA 4.3% | |
Citizens Property Insurance Corp.
Revenue Bonds
High Risk Senior Secured
Series 2010A-1
06/01/15 | | | 5.000 | % | | | 13,750,000 | | | | 13,807,921 | | |
Series 2010A-1 (AGM)
06/01/15 | | | 5.000 | % | | | 6,155,000 | | | | 6,180,928 | | |
Senior Secured
Series 2012A-1
06/01/17 | | | 5.000 | % | | | 15,000,000 | | | | 16,287,000 | | |
City of Jacksonville
Refunding Revenue Bonds
Better Jacksonville
Series 2012
10/01/17 | | | 5.000 | % | | | 2,000,000 | | | | 2,200,340 | | |
Series 2012C
10/01/15 | | | 5.000 | % | | | 1,000,000 | | | | 1,020,310 | | |
City of Tampa
Revenue Bonds
Baycare Health Systems
Series 2010
11/15/16 | | | 5.000 | % | | | 2,000,000 | | | | 2,139,800 | | |
Florida Department of Environmental Protection
Refunding Revenue Bonds
Florida Forever
Series 2012A
07/01/16 | | | 4.000 | % | | | 13,915,000 | | | | 14,510,562 | | |
Florida HomeLoan Corp.
Revenue Bonds
Homeowner Mortgage Special Program
Series 2010A (GNMA/FNMA/FHLMC)
07/01/28 | | | 5.000 | % | | | 1,775,000 | | | | 1,886,310 | | |
Florida Municipal Loan Council
Revenue Bonds
9B Design-Build-Finance Project
Series 2012
08/15/16 | | | 1.750 | % | | | 9,250,000 | | | | 9,349,715 | | |
Miami-Dade County School Board Foundation, Inc.
Refunding Certificate of Participation
Series 2015A
05/01/19 | | | 5.000 | % | | | 2,000,000 | | | | 2,274,620 | | |
Pasco County School Board
Revenue Bonds
Series 2013
10/01/18 | | | 5.000 | % | | | 1,000,000 | | | | 1,125,660 | | |
Municipal Bonds (continued)
Issue
Description | | Coupon
Rate | | Principal
Amount ($) | |
Value ($) | |
Southeast Overtown Park West Community
Redevelopment Agency Tax Allocation Bonds
Series 2014A-2(d)
03/01/16 | | | 4.000 | % | | | 2,000,000 | | | | 2,044,400 | | |
St. Johns County School Board
Refunding Certificate of Participation
Series 2015
07/01/19 | | | 5.000 | % | | | 1,000,000 | | | | 1,143,980 | | |
07/01/20 | | | 5.000 | % | | | 2,000,000 | | | | 2,323,120 | | |
St. Johns River Power Park
Refunding Revenue Bonds
Issue 2
Series 2011-23
10/01/17 | | | 5.000 | % | | | 3,000,000 | | | | 3,302,040 | | |
Total | | | | | | | 79,596,706 | | |
GEORGIA 1.0% | |
Burke County Development Authority
Revenue Bonds
Georgia Power Co. Plant Vogtle Project
Series 2012(a)
11/01/48 | | | 1.550 | % | | | 5,000,000 | | | | 5,043,550 | | |
City of Atlanta Department of Aviation
Refunding Revenue Bonds
General
Series 2011A
01/01/19 | | | 5.000 | % | | | 4,000,000 | | | | 4,536,280 | | |
Floyd County Development Authority
Revenue Bonds
Georgia Power Company Plant Hammond Project
Series 2012(a)
07/01/22 | | | 0.850 | % | | | 4,750,000 | | | | 4,759,262 | | |
Municipal Electric Authority of Georgia
Revenue Bonds
Combined Cycle Project
Series 2012A
11/01/15 | | | 4.000 | % | | | 3,045,000 | | | | 3,104,317 | | |
Unrefunded Revenue Bonds
Series 1998Y (AGM)
01/01/17 | | | 6.500 | % | | | 1,605,000 | | | | 1,692,071 | | |
Total | | | | | | | 19,135,480 | | |
GUAM 0.1% | |
Antonio B. Won Pat International Airport Authority
Revenue Bonds
General
Series 2013C AMT(b)(e)
10/01/15 | | | 4.000 | % | | | 1,000,000 | | | | 1,014,640 | | |
The accompanying Notes to Financial Statements are an integral part of this statement.
Annual Report 2015
10
COLUMBIA SHORT TERM MUNICIPAL BOND FUND
PORTFOLIO OF INVESTMENTS (continued)
April 30, 2015
Municipal Bonds (continued)
Issue
Description | | Coupon
Rate | | Principal
Amount ($) | |
Value ($) | |
HAWAII 0.2% | |
State of Hawaii
Unlimited General Obligation
Series 2014 EO
08/01/19 | | | 5.000 | % | | | 3,000,000 | | | | 3,462,180 | | |
ILLINOIS 11.3% | |
Chicago Board of Education
Unlimited General Obligation Refunding Bonds
Series 2004A (NPFGC)
12/01/15 | | | 5.000 | % | | | 1,700,000 | | | | 1,701,360 | | |
Series 2010F
12/01/15 | | | 5.000 | % | | | 2,000,000 | | | | 2,027,100 | | |
Chicago Midway International Airport
Refunding Revenue Bonds
2nd Lien
Series 2004B (AMBAC)
01/01/18 | | | 5.000 | % | | | 5,120,000 | | | | 5,140,787 | | |
Chicago O'Hare International Airport
Revenue Bonds
General 3rd Lien
Series 2011B
01/01/17 | | | 5.000 | % | | | 2,500,000 | | | | 2,678,075 | | |
Chicago O'Hare International Airport(b)
Refunding Revenue Bonds
General 2nd Lien
Series 2012A AMT
01/01/17 | | | 5.000 | % | | | 8,000,000 | | | | 8,544,960 | | |
01/01/18 | | | 5.000 | % | | | 11,340,000 | | | | 12,449,732 | | |
General Senior Lien
Series 2013A AMT
01/01/16 | | | 5.000 | % | | | 3,875,000 | | | | 3,991,637 | | |
Passenger Facility Charge
Series 2012 AMT
01/01/17 | | | 5.000 | % | | | 13,125,000 | | | | 14,019,075 | | |
Chicago Public Building Commission
Refunding Revenue Bonds
Chicago School Reform
Series 1999B (NPFGC)
12/01/15 | | | 5.250 | % | | | 3,165,000 | | | | 3,249,221 | | |
Chicago Transit Authority
Revenue Bonds
Federal Transit Administration Section 5307
Series 2006 (AMBAC)
06/01/15 | | | 5.000 | % | | | 2,615,000 | | | | 2,625,645 | | |
Unrefunded Revenue Bonds
Federal Transit Administration
Series 2006 (AMBAC)
06/01/17 | | | 5.000 | % | | | 2,875,000 | | | | 3,044,136 | | |
City of Chicago Wastewater Transmission
Refunding Revenue Bonds
2nd Lien
Series 2001 (NPFGC)
01/01/18 | | | 5.500 | % | | | 1,750,000 | | | | 1,938,773 | | |
Municipal Bonds (continued)
Issue
Description | | Coupon
Rate | | Principal
Amount ($) | |
Value ($) | |
City of Chicago Waterworks
Revenue Bonds
2nd Lien Project
Series 2014
11/01/18 | | | 4.000 | % | | | 1,000,000 | | | | 1,071,400 | | |
City of Chicago
Unlimited General Obligation Bonds
Series 2007D (AMBAC)
12/01/16 | | | 5.000 | % | | | 2,695,000 | | | | 2,781,671 | | |
Series 2010A
12/01/16 | | | 5.000 | % | | | 2,500,000 | | | | 2,580,400 | | |
Unlimited General Obligation Refunding Bonds
Project
Series 2006A (AGM)
01/01/18 | | | 4.250 | % | | | 1,350,000 | | | | 1,376,528 | | |
Series 1996A-2 (AMBAC)
01/01/18 | | | 5.500 | % | | | 7,125,000 | | | | 7,554,637 | | |
Series 2005A (AGM)
01/01/16 | | | 5.000 | % | | | 4,000,000 | | | | 4,000,520 | | |
Cook County Community High School District No. 228 Bremen
Limited General Obligation Bonds
Series 2014B
12/01/16 | | | 5.000 | % | | | 1,250,000 | | | | 1,333,763 | | |
12/01/17 | | | 5.000 | % | | | 2,000,000 | | | | 2,188,980 | | |
Illinois Finance Authority
Refunding Revenue Bonds
Advocate Health Care
Series 2014
08/01/19 | | | 5.000 | % | | | 600,000 | | | | 685,836 | | |
DePaul University
Series 2004A
10/01/15 | | | 5.375 | % | | | 2,000,000 | | | | 2,042,640 | | |
Illinois Finance Authority(a)
Revenue Bonds
Ascension Health
Series 2012E
11/15/42 | | | 5.000 | % | | | 2,750,000 | | | | 2,750,000 | | |
11/15/42 | | | 5.000 | % | | | 2,000,000 | | | | 2,167,140 | | |
Kane Cook & DuPage Counties School District No. U-46 Elgin
Unlimited General Obligation Refunding Bonds
Series 2015C
01/01/19 | | | 5.000 | % | | | 1,250,000 | | | | 1,411,338 | | |
01/01/20 | | | 5.000 | % | | | 1,500,000 | | | | 1,726,365 | | |
Railsplitter Tobacco Settlement Authority
Revenue Bonds
Series 2010
06/01/15 | | | 5.000 | % | | | 3,615,000 | | | | 3,629,470 | | |
06/01/16 | | | 5.000 | % | | | 8,280,000 | | | | 8,673,466 | | |
Regional Transportation Authority
Revenue Bonds
Series 2003B
06/01/19 | | | 5.500 | % | | | 3,945,000 | | | | 4,582,275 | | |
Series 2006A (NPFGC)
07/01/18 | | | 5.000 | % | | | 4,970,000 | | | | 5,241,909 | | |
The accompanying Notes to Financial Statements are an integral part of this statement.
Annual Report 2015
11
COLUMBIA SHORT TERM MUNICIPAL BOND FUND
PORTFOLIO OF INVESTMENTS (continued)
April 30, 2015
Municipal Bonds (continued)
Issue
Description | | Coupon
Rate | | Principal
Amount ($) | |
Value ($) | |
State of Illinois Unemployment Compensation Trust Fund
Revenue Bonds
Series 2012B
06/15/17 | | | 5.000 | % | | | 9,000,000 | | | | 9,658,980 | | |
State of Illinois
Unlimited General Obligation Bonds
Series 2014
02/01/18 | | | 4.000 | % | | | 2,750,000 | | | | 2,905,815 | | |
04/01/18 | | | 5.000 | % | | | 10,000,000 | | | | 10,867,400 | | |
04/01/19 | | | 5.000 | % | | | 10,000,000 | | | | 11,012,300 | | |
Unlimited General Obligation Refunding Bonds
1st Series 2002 (XLCA)
08/01/15 | | | 5.500 | % | | | 7,825,000 | | | | 7,920,856 | | |
Series 2006
01/01/16 | | | 5.000 | % | | | 4,655,000 | | | | 4,783,292 | | |
Series 2010
01/01/16 | | | 5.000 | % | | | 14,600,000 | | | | 15,002,376 | | |
Series 2010 (AGM)
01/01/16 | | | 5.000 | % | | | 4,250,000 | | | | 4,374,440 | | |
Series 2012
08/01/15 | | | 5.000 | % | | | 5,450,000 | | | | 5,509,895 | | |
08/01/16 | | | 5.000 | % | | | 20,000,000 | | | | 20,997,400 | | |
Total | | | | | | | 210,241,593 | | |
INDIANA 1.4% | |
Indiana Finance Authority
Refunding Revenue Bonds
Indianapolis Power & Light Co.
Series 2009C
01/01/16 | | | 4.900 | % | | | 10,000,000 | | | | 10,288,100 | | |
Series 2008A-1
11/01/16 | | | 5.000 | % | | | 2,665,000 | | | | 2,842,489 | | |
Revenue Bonds
2nd Lien-CWA Authority, Inc.
Series 2011C
10/01/16 | | | 3.000 | % | | | 10,000,000 | | | | 10,335,000 | | |
Beacon Health System Obligation Group
Series 2013
08/15/15 4.000% 500,000 505,610
08/15/16 | | | 5.000 | % | | | 1,000,000 | | | | 1,057,930 | | |
Ivy Tech Community College
Revenue Bonds
Student Fee
Series 2013R-1
07/01/17 | | | 5.000 | % | | | 1,000,000 | | | | 1,091,730 | | |
Total | | | | | | | 26,120,859 | | |
IOWA 0.9% | |
Iowa Finance Authority
Revenue Bonds
Genesis Health System
Series 2010
07/01/15 | | | 5.000 | % | | | 1,075,000 | | | | 1,083,675 | | |
07/01/16 | | | 5.000 | % | | | 1,150,000 | | | | 1,207,903 | | |
Municipal Bonds (continued)
Issue
Description | | Coupon
Rate | | Principal
Amount ($) | |
Value ($) | |
Iowa Student Loan Liquidity Corp.
Revenue Bonds
Senior Series 2011A-1 AMT(b)
12/01/15 | | | 3.500 | % | | | 15,070,000 | | | | 15,209,397 | | |
Total | | | | | | | 17,500,975 | | |
KENTUCKY 0.5% | |
Kentucky Public Transportation Infrastructure Authority
Revenue Bonds
Downtown Crossing Project
BAN Subordinated Series 2013
07/01/17 | | | 5.000 | % | | | 5,550,000 | | | | 6,030,186 | | |
Kentucky State Property & Building Commission
Refunding Revenue Bonds
Project No. 100
Series 2011A
08/01/18 | | | 5.000 | % | | | 2,500,000 | | | | 2,807,225 | | |
Total | | | | | | | 8,837,411 | | |
LOUISIANA 1.5% | |
Louisiana Office Facilities Corp.
Refunding Revenue Bonds
State Capitol
Series 2010A
05/01/16 | | | 5.000 | % | | | 4,505,000 | | | | 4,708,446 | | |
Louisiana Public Facilities Authority
Revenue Bonds
Entergy Gulf States
Series 2010B
11/01/15 | | | 2.875 | % | | | 2,750,000 | | | | 2,783,495 | | |
Louisiana State Citizens Property Insurance Corp.
Revenue Bonds
Series 2006B (AMBAC)
06/01/17 | | | 5.000 | % | | | 6,090,000 | | | | 6,386,887 | | |
Orleans Parish Parishwide School District
Unlimited General Obligation Refunding Bonds
Series 2010 (AGM)
09/01/15 | | | 4.000 | % | | | 8,240,000 | | | | 8,337,974 | | |
09/01/16 | | | 5.000 | % | | | 3,785,000 | | | | 3,996,998 | | |
Regional Transit Authority
Revenue Bonds
Sales Tax
Series 2010 (AGM)
12/01/15 | | | 4.000 | % | | | 1,150,000 | | | | 1,174,196 | | |
12/01/16 | | | 4.000 | % | | | 1,000,000 | | | | 1,051,270 | | |
Total | | | | | | | 28,439,266 | | |
The accompanying Notes to Financial Statements are an integral part of this statement.
Annual Report 2015
12
COLUMBIA SHORT TERM MUNICIPAL BOND FUND
PORTFOLIO OF INVESTMENTS (continued)
April 30, 2015
Municipal Bonds (continued)
Issue
Description | | Coupon
Rate | | Principal
Amount ($) | |
Value ($) | |
MAINE 0.4% | |
Maine Health & Higher Educational Facilities Authority
Revenue Bonds
Series 2010B Escrowed to Maturity
07/01/15 | | | 5.000 | % | | | 50,000 | | | | 50,404 | | |
07/01/15 | | | 5.000 | % | | | 330,000 | | | | 332,680 | | |
07/01/16 | | | 4.000 | % | | | 50,000 | | | | 52,116 | | |
07/01/16 | | | 4.000 | % | | | 335,000 | | | | 349,298 | | |
Unrefunded Revenue Bonds
Series 2010B
07/01/15 | | | 5.000 | % | | | 3,075,000 | | | | 3,100,030 | | |
07/01/16 | | | 4.000 | % | | | 3,170,000 | | | | 3,304,535 | | |
Total | | | | | | | 7,189,063 | | |
MARYLAND 1.5% | |
County of Charles
Unlimited General Obligation Refunding Bonds
Consolidated Public Improvement
Series 2012
03/01/18 | | | 5.000 | % | | | 4,395,000 | | | | 4,903,326 | | |
State of Maryland
Unlimited General Obligation Bonds
1st Series 2014A
03/01/19 | | | 5.000 | % | | | 6,465,000 | | | | 7,393,827 | | |
Series 2011B
08/01/18 | | | 5.000 | % | | | 11,000,000 | | | | 12,410,750 | | |
University System of Maryland
Revenue Bonds
Series 2012C
04/01/18 | | | 5.000 | % | | | 3,605,000 | | | | 4,032,156 | | |
Total | | | | | | | 28,740,059 | | |
MASSACHUSETTS 1.8% | |
Massachusetts Development Finance Agency
Prerefunded Revenue Bonds
Boston Medical Center
Series 2012 Escrowed to Maturity
07/01/15 | | | 5.000 | % | | | 995,000 | | | | 1,003,030 | | |
07/01/16 | | | 5.000 | % | | | 800,000 | | | | 843,080 | | |
Unrefunded Revenue Bonds
Boston Medical Center
Series 2012
07/01/15 | | | 5.000 | % | | | 1,005,000 | | | | 1,011,613 | | |
07/01/16 | | | 5.000 | % | | | 800,000 | | | | 832,896 | | |
Massachusetts Development Finance Agency(a)
Revenue Bonds
Tufts University
Series 2011P
02/15/36 | | | 3.000 | % | | | 3,700,000 | | | | 3,775,998 | | |
Massachusetts Educational Financing Authority
Revenue Bonds
Series 2009I
01/01/16 | | | 5.250 | % | | | 12,500,000 | | | | 12,892,750 | | |
Municipal Bonds (continued)
Issue
Description | | Coupon
Rate | | Principal
Amount ($) | |
Value ($) | |
Massachusetts Educational Financing Authority(b)
Revenue Bonds
Education Loan
Series 2014-I AMT
01/01/18 | | | 4.000 | % | | | 1,500,000 | | | | 1,596,525 | | |
01/01/19 | | | 5.000 | % | | | 2,000,000 | | | | 2,205,240 | | |
Massachusetts Municipal Wholesale Electric Co.
Revenue Bonds
Project No. 6
Series 2012A
07/01/15 | | | 5.000 | % | | | 1,500,000 | | | | 1,512,270 | | |
Massachusetts Port Authority
Refunding Revenue Bonds
Passenger Facility Charge
Series 2010E AMT(b)
07/01/15 | | | 5.000 | % | | | 4,000,000 | | | | 4,032,760 | | |
University of Massachusetts Building Authority
Refunding Revenue Bonds
Senior Series 2005-2 (AMBAC)
11/01/15 | | | 5.000 | % | | | 3,000,000 | | | | 3,072,990 | | |
Total | | | | | | | 32,779,152 | | |
MICHIGAN 2.2% | |
Michigan Finance Authority
Refunding Revenue Bonds
Senior Lien-Detroit Water & Sewer
Series 2014C-5
07/01/18 | | | 5.000 | % | | | 2,165,000 | | | | 2,388,017 | | |
Series 2014H-1
10/01/19 | | | 5.000 | % | | | 1,415,000 | | | | 1,605,204 | | |
State Revolving Fund Drinking Water
Series 2012
10/01/18 | | | 5.000 | % | | | 3,640,000 | | | | 4,122,264 | | |
Trinity Health Corp.
Series 2015
12/01/19 | | | 5.000 | % | | | 2,000,000 | | | | 2,298,060 | | |
Revenue Bonds
Unemployment Obligation Assessment
Series 2012
07/01/19 | | | 5.000 | % | | | 5,000,000 | | | | 5,761,550 | | |
Michigan Finance Authority(b)
Refunding Revenue Bonds
Student Loan
Series 2014 25-A AMT
11/01/18 | | | 5.000 | % | | | 1,180,000 | | | | 1,299,853 | | |
11/01/19 | | | 5.000 | % | | | 1,250,000 | | | | 1,391,475 | | |
Michigan State Building Authority
Refunding Revenue Bonds
Facilities Program
Series 2013I-A
10/15/15 | | | 5.000 | % | | | 5,550,000 | | | | 5,673,099 | | |
The accompanying Notes to Financial Statements are an integral part of this statement.
Annual Report 2015
13
COLUMBIA SHORT TERM MUNICIPAL BOND FUND
PORTFOLIO OF INVESTMENTS (continued)
April 30, 2015
Municipal Bonds (continued)
Issue
Description | | Coupon
Rate | | Principal
Amount ($) | |
Value ($) | |
Michigan State Hospital Finance Authority
Revenue Bonds
Ascension Health Senior Care Group
Series 2010
11/15/15 | | | 5.000 | % | | | 2,000,000 | | | | 2,051,280 | | |
Royal Oak Hospital Finance Authority
Refunding Revenue Bonds
William Beaumont Hospital
Series 2014D
09/01/17 | | | 5.000 | % | | | 1,400,000 | | | | 1,532,244 | | |
Royal Oak School District
Unlimited General Obligation Refunding Bonds
Series 2014
05/01/18 | | | 5.000 | % | | | 1,000,000 | | | | 1,113,220 | | |
05/01/19 | | | 5.000 | % | | | 450,000 | | | | 512,226 | | |
State of Michigan Trunk Line
Refunding Revenue Bonds
Series 2014
11/15/18 | | | 5.000 | % | | | 5,180,000 | | | | 5,873,550 | | |
Wayne County Airport Authority
Refunding Revenue Bonds
Detroit Metropolitan Airport
Series 2010C (AGM)
12/01/15 | | | 5.000 | % | | | 4,780,000 | | | | 4,911,067 | | |
Total | | | | | | | 40,533,109 | | |
MINNESOTA 1.5% | |
Minneapolis Special School District No. 1
Certificate of Participation
Series 2014D (School District Credit Enhancement Program)
02/01/20 | | | 5.000 | % | | | 7,170,000 | | | | 8,332,902 | | |
Minneapolis-St. Paul Metropolitan Airports Commission
Refunding Revenue Bonds
Subordinated Series 2010D AMT(b)
01/01/16 | | | 5.000 | % | | | 5,160,000 | | | | 5,309,279 | | |
Moorhead Independent School District No. 152
Unlimited General Obligation Refunding Bonds
School Buildings
Series 2014A
04/01/18 | | | 5.000 | % | | | 3,285,000 | | | | 3,672,236 | | |
State of Minnesota
Refunding Revenue Bonds
Appropriation
Series 2012B
03/01/16 | | | 4.000 | % | | | 9,820,000 | | | | 10,129,919 | | |
Total | | | | | | | 27,444,336 | | |
MISSISSIPPI 0.1% | |
Mississippi Development Bank
Revenue Bonds
Marshall County Industrial Development Authority
Series 2012
01/01/16 | | | 4.000 | % | | | 1,500,000 | | | | 1,537,185 | | |
Municipal Bonds (continued)
Issue
Description | | Coupon
Rate | | Principal
Amount ($) | |
Value ($) | |
MISSOURI 0.8% | |
City of St. Louis Airport
Refunding Revenue Bonds
Lambert-St. Louis International Airport
Series 2013
07/01/16 | | | 5.000 | % | | | 1,325,000 | | | | 1,393,463 | | |
07/01/17 | | | 5.000 | % | | | 715,000 | | | | 779,450 | | |
07/01/18 | | | 5.000 | % | | | 765,000 | | | | 855,125 | | |
Kansas City Airport Revenue
Refunding Revenue Bonds
General Improvement
Series 2013B
09/01/16 | | | 5.000 | % | | | 410,000 | | | | 435,063 | | |
Missouri Joint Municipal Electric Utility Commission
Refunding Revenue Bonds
Series 2014
01/01/19 | | | 5.000 | % | | | 2,150,000 | | | | 2,429,156 | | |
01/01/20 | | | 5.000 | % | | | 7,825,000 | | | | 9,021,051 | | |
Total | | | | | | | 14,913,308 | | |
NEBRASKA 1.6% | |
Central Plains Energy Project
Refunding Revenue Bonds
Series 2014 (Royal Bank of Canada)(a)
08/01/39 | | | 5.000 | % | | | 14,500,000 | | | | 16,664,560 | | |
Nebraska Investment Finance Authority
Revenue Bonds
Series 2014A
03/01/44 | | | 3.000 | % | | | 4,245,000 | | | | 4,396,589 | | |
Nebraska Public Power District
Refunding Revenue Bonds
Series 2014
01/01/19 | | | 5.000 | % | | | 2,000,000 | | | | 2,263,520 | | |
Public Power Generation Agency(f)
Refunding Revenue Bonds
Whelan Energy Center Unit
Series 2015
01/01/19 | | | 5.000 | % | | | 2,250,000 | | | | 2,524,950 | | |
01/01/20 | | | 5.000 | % | | | 3,030,000 | | | | 3,452,109 | | |
Total | | | | | | | 29,301,728 | | |
NEVADA 2.2% | |
Clark County School District
Limited General Obligation Refunding Bonds
Series 2014A
06/15/18 | | | 5.000 | % | | | 10,000,000 | | | | 11,192,200 | | |
Unlimited General Obligation Refunding Bonds
Series 2014B
06/15/18 | | | 5.000 | % | | | 15,000,000 | | | | 16,788,300 | | |
The accompanying Notes to Financial Statements are an integral part of this statement.
Annual Report 2015
14
COLUMBIA SHORT TERM MUNICIPAL BOND FUND
PORTFOLIO OF INVESTMENTS (continued)
April 30, 2015
Municipal Bonds (continued)
Issue
Description | | Coupon
Rate | | Principal
Amount ($) | |
Value ($) | |
County of Clark Department of Aviation
Revenue Bonds
Series 2014B
07/01/18 | | | 5.000 | % | | | 5,000,000 | | | | 5,597,350 | | |
Las Vegas Convention & Visitors Authority
Refunding Revenue Bonds
Series 2005 (AMBAC)
07/01/17 | | | 5.000 | % | | | 8,380,000 | | | | 8,446,202 | | |
Total | | | | | | | 42,024,052 | | |
NEW JERSEY 3.4% | |
City of Newark
Unlimited General Obligation Refunding Bonds
Qualified General Improvement
Series 2013A
07/15/15 | | | 5.000 | % | | | 2,000,000 | | | | 2,019,720 | | |
07/15/16 | | | 5.000 | % | | | 5,845,000 | | | | 6,141,341 | | |
City of Trenton
Unlimited General Obligation Refunding Bonds
Series 2013
07/15/15 | | | 3.000 | % | | | 1,000,000 | | | | 1,005,690 | | |
07/15/16 | | | 4.000 | % | | | 1,100,000 | | | | 1,144,121 | | |
County of Union
Prerefunded Unlimited General Obligation Bonds
Series 2012B Escrowed to Maturity
03/01/16 | | | 3.000 | % | | | 75,000 | | | | 76,703 | | |
Unrefunded Unlimited General Obligation Bonds
Series 2012B
03/01/16 | | | 3.000 | % | | | 4,005,000 | | | | 4,093,751 | | |
New Brunswick Parking Authority
Refunding Revenue Bonds
City Guaranteed Parking
Series 2012
09/01/15 | | | 3.000 | % | | | 1,500,000 | | | | 1,512,915 | | |
New Jersey Building Authority
Refunding Revenue Bonds
Series 2013A
06/15/17 | | | 5.000 | % | | | 5,500,000 | | | | 5,883,680 | | |
New Jersey Economic Development Authority
Refunding Revenue Bonds
School Facilities Construction
Series 2010DD-1
12/15/17 | | | 5.000 | % | | | 4,435,000 | | | | 4,797,561 | | |
New Jersey Higher Education Student Assistance Authority(b)
Revenue Bonds
Senior Series 2013-1A AMT
12/01/16 | | | 4.000 | % | | | 1,000,000 | | | | 1,049,400 | | |
12/01/17 | | | 5.000 | % | | | 2,780,000 | | | | 3,038,929 | | |
New Jersey State Turnpike Authority
Revenue Bonds
Series 2013D(a)
01/01/22 | | | 0.640 | % | | | 4,000,000 | | | | 4,004,680 | | |
Municipal Bonds (continued)
Issue
Description | | Coupon
Rate | | Principal
Amount ($) | |
Value ($) | |
New Jersey Transit Corp.
Certificate of Participation
Federal Transit Administration Grants
Subordinated Series 2005A Escrowed to Maturity (NPFGC)
09/15/17 | | | 5.000 | % | | | 8,770,000 | | | | 9,640,422 | | |
Prerefunded 09/15/15 Certificate of Participation
Federal Transit Administration Grants
Subordinated Series 2005A (NPFGC)
09/15/18 | | | 5.000 | % | | | 4,450,000 | | | | 4,529,700 | | |
New Jersey Transit Corp
Revenue Bonds
Grant Anticipation Note
Series 2014A
09/15/18 | | | 5.000 | % | | | 3,500,000 | | | | 3,905,300 | | |
New Jersey Transportation Trust Fund Authority
Unrefunded Revenue Bonds
Transportation System
Series 1999
06/15/16 | | | 5.750 | % | | | 4,860,000 | | | | 5,110,922 | | |
State of New Jersey
Certificate of Participation
Equipment Lease Purchase
Series 2004A
06/15/15 | | | 5.000 | % | | | 3,000,000 | | | | 3,012,691 | | |
Series 2008A
06/15/17 | | | 5.000 | % | | | 1,935,000 | | | | 2,069,986 | | |
Total | | | | | | | 63,037,512 | | |
NEW YORK 14.1% | |
City of New York
Prerefunded 02/01/16 Unlimited General Obligation Bonds
Series 2005G
08/01/18 | | | 5.000 | % | | | 15,000 | | | | 15,538 | | |
Prerefunded 09/01/15 Unlimited General Obligation Bonds
Subordinated Series 2005F-1
09/01/16 | | | 5.000 | % | | | 355,000 | | | | 360,620 | | |
Unlimited General Obligation Bonds
Series 2009C
08/01/17 | | | 5.000 | % | | | 12,000,000 | | | | 13,116,720 | | |
Series 2010B
08/01/17 | | | 5.000 | % | | | 5,000,000 | | | | 5,465,300 | | |
Series 2013E
08/01/18 | | | 5.000 | % | | | 4,000,000 | | | | 4,495,640 | | |
08/01/18 | | | 5.000 | % | | | 5,960,000 | | | | 6,698,504 | | |
Subordinated Series 2004H-B
03/01/19 | | | 5.000 | % | | | 8,500,000 | | | | 9,660,845 | | |
Subordinated Series 2008I-1
02/01/17 | | | 5.000 | % | | | 8,635,000 | | | | 9,275,026 | | |
Unlimited General Obligation Refunding Bonds
Fiscal 2015
Series 2014A
08/01/18 | | | 5.000 | % | | | 4,645,000 | | | | 5,220,562 | | |
Series 2012F
08/01/18 | | | 5.000 | % | | | 1,675,000 | | | | 1,882,549 | | |
The accompanying Notes to Financial Statements are an integral part of this statement.
Annual Report 2015
15
COLUMBIA SHORT TERM MUNICIPAL BOND FUND
PORTFOLIO OF INVESTMENTS (continued)
April 30, 2015
Municipal Bonds (continued)
Issue
Description | | Coupon
Rate | | Principal
Amount ($) | |
Value ($) | |
Unrefunded Unlimited General Obligation Bonds
Series 2005G
08/01/18 | | | 5.000 | % | | | 3,635,000 | | | | 3,767,350 | | |
Subordinated Series 2005F-1
09/01/16 | | | 5.000 | % | | | 2,995,000 | | | | 3,044,208 | | |
City of Yonkers
Limited General Obligation Refunding Bonds
Series 2012A
07/01/15 | | | 4.000 | % | | | 1,250,000 | | | | 1,257,938 | | |
County of Rockland
Limited General Obligation Bonds
Series 2014A (AGM)
03/01/17 | | | 5.000 | % | | | 1,825,000 | | | | 1,961,309 | | |
03/01/18 | | | 5.000 | % | | | 1,825,000 | | | | 2,012,610 | | |
03/01/19 | | | 5.000 | % | | | 2,000,000 | | | | 2,247,800 | | |
County of Suffolk
Limited General Obligation Bonds
Public Improvement
Series 2013B
10/15/15 | | | 3.000 | % | | | 3,870,000 | | | | 3,915,860 | | |
10/15/16 | | | 3.000 | % | | | 3,905,000 | | | | 4,034,021 | | |
Erie County Industrial Development Agency (The)
Revenue Bonds
Series 2012
05/01/15 | | | 5.000 | % | | | 2,000,000 | | | | 2,000,284 | | |
05/01/17 | | | 5.000 | % | | | 3,000,000 | | | | 3,259,680 | | |
Long Island Power Authority
Revenue Bonds
Series 2012B
09/01/16 | | | 5.000 | % | | | 6,755,000 | | | | 7,144,831 | | |
Metropolitan Transportation Authority
Revenue Bonds
Series 2005A (AMBAC)
11/15/18 | | | 5.500 | % | | | 5,000,000 | | | | 5,741,450 | | |
Series 2008A
11/15/18 | | | 5.000 | % | | | 2,125,000 | | | | 2,403,396 | | |
Series 2012E
11/15/16 | | | 4.000 | % | | | 1,000,000 | | | | 1,054,200 | | |
11/15/17 | | | 5.000 | % | | | 1,000,000 | | | | 1,104,930 | | |
Transportation
Series 2005G
11/15/18 | | | 5.000 | % | | | 2,900,000 | | | | 3,279,929 | | |
Series 2010D
11/15/18 | | | 5.000 | % | | | 1,890,000 | | | | 2,137,609 | | |
Series 2014B
11/15/18 | | | 5.000 | % | | | 1,000,000 | | | | 1,131,010 | | |
New York City Industrial Development Agency
Refunding Revenue Bonds
Trips Obligated Group
Senior Series 2012A AMT(b)
07/01/18 | | | 5.000 | % | | | 4,655,000 | | | | 5,091,453 | | |
Municipal Bonds (continued)
Issue
Description | | Coupon
Rate | | Principal
Amount ($) | |
Value ($) | |
New York City Transitional Finance Authority
Revenue Bonds
Future Tax Secured
Series 2012E-1
02/01/19 | | | 5.000 | % | | | 4,750,000 | | | | 5,404,028 | | |
New York State Dormitory Authority
Revenue Bonds
General Purpose
Series 2014A
02/15/18 | | | 5.000 | % | | | 14,250,000 | | | | 15,804,817 | | |
Mount Sinai School of Medicine
Series 2010A
07/01/15 | | | 5.000 | % | | | 1,000,000 | | | | 1,008,110 | | |
07/01/16 | | | 5.000 | % | | | 2,645,000 | | | | 2,786,798 | | |
Series 2012B
03/15/16 | | | 5.000 | % | | | 4,750,000 | | | | 4,944,988 | | |
New York State Housing Finance Agency
Revenue Bonds
Affordable Housing
Series 2012E
11/01/16 | | | 1.100 | % | | | 2,100,000 | | | | 2,117,178 | | |
New York State Thruway Authority
Prerefunded Revenue Bonds
Series 2012I Escrowed to Maturity
01/01/17 | | | 5.000 | % | | | 225,000 | | | | 241,535 | | |
Revenue Bonds
General
2nd Series 2005B
04/01/16 | | | 5.000 | % | | | 4,500,000 | | | | 4,591,395 | | |
Series 2007H (NPFGC)
01/01/19 | | | 5.000 | % | | | 6,240,000 | | | | 6,847,152 | | |
Series 2013A
05/01/19 | | | 5.000 | % | | | 15,000,000 | | | | 17,055,300 | | |
Series 2014J
01/01/19 | | | 5.000 | % | | | 1,200,000 | | | | 1,355,808 | | |
Transportation
Series 2008A
03/15/17 | | | 5.000 | % | | | 1,000,000 | | | | 1,080,760 | | |
Unrefunded Revenue Bonds
General
2nd Series 2005B (NPFGC)
04/01/17 5.000% 5,960,000 6,079,915
Series 2012I
01/01/17 | | | 5.000 | % | | | 775,000 | | | | 831,149 | | |
New York State Urban Development Corp.
Refunding Revenue Bonds
State Personal Income Tax
Series 2014
03/15/19 | | | 5.000 | % | | | 15,000,000 | | | | 17,107,500 | | |
Revenue Bonds
State Personal Income Tax
Series 2010A
03/15/19 | | | 5.000 | % | | | 13,235,000 | | | | 15,094,517 | | |
Series 2013E
03/15/17 | | | 5.000 | % | | | 15,000,000 | | | | 16,211,400 | | |
The accompanying Notes to Financial Statements are an integral part of this statement.
Annual Report 2015
16
COLUMBIA SHORT TERM MUNICIPAL BOND FUND
PORTFOLIO OF INVESTMENTS (continued)
April 30, 2015
Municipal Bonds (continued)
Issue
Description | | Coupon
Rate | | Principal
Amount ($) | |
Value ($) | |
Port Authority of New York & New Jersey
Revenue Bonds
Consolidated 172nd
Series 2012 AMT(b)
10/01/17 | | | 5.000 | % | | | 5,000,000 | | | | 5,494,500 | | |
Tobacco Settlement Financing Corp.
Asset-Backed Revenue Bonds
Series 2011B
06/01/16 | | | 5.000 | % | | | 20,000,000 | | | | 21,022,200 | | |
Triborough Bridge & Tunnel Authority
Refunding Revenue Bonds
Series 2012B
11/15/17 | | | 5.000 | % | | | 3,325,000 | | | | 3,675,655 | | |
Utica School District
Unlimited General Obligation Refunding Bonds
Series 2013
07/01/15 | | | 2.000 | % | | | 1,000,000 | | | | 1,002,430 | | |
07/01/16 | | | 3.000 | % | | | 1,000,000 | | | | 1,021,770 | | |
Total | | | | | | | 263,560,077 | | |
NORTH CAROLINA 0.8% | |
North Carolina Eastern Municipal Power Agency
Refunding Revenue Bonds
Series 2008A (AGM)
01/01/19 | | | 5.250 | % | | | 3,740,000 | | | | 4,152,373 | | |
Series 2012D
01/01/16 | | | 5.000 | % | | | 5,875,000 | | | | 6,059,886 | | |
State of North Carolina
Revenue Bonds
Grant Anticipation Revenue Vehicle
Series 2007 (NPFGC)
03/01/18 | | | 5.000 | % | | | 4,500,000 | | | | 4,857,210 | | |
Total | | | | | | | 15,069,469 | | |
NORTH DAKOTA 1.2% | |
County of McLean
Revenue Bonds
Great River Energy
Series 2010C AMT(a)(b)
07/01/38 | | | 3.500 | % | | | 22,000,000 | | | | 22,090,640 | | |
OHIO 0.4% | |
Ohio Housing Finance Agency
Revenue Bonds
Series 2010-1 (GNMA/FNMA)
11/01/28 | | | 5.000 | % | | | 1,920,000 | | | | 2,025,811 | | |
State of Ohio
Refunding Revenue Bonds
Series 2014B
12/15/19 | | | 5.000 | % | | | 5,000,000 | | | | 5,822,550 | | |
Total | | | | | | | 7,848,361 | | |
Municipal Bonds (continued)
Issue
Description | | Coupon
Rate | | Principal
Amount ($) | |
Value ($) | |
OKLAHOMA 0.2% | |
Cleveland County Educational Facilities Authority
Revenue Bonds
Moore Public Schools Project
Series 2013
06/01/15 | | | 5.000 | % | | | 1,500,000 | | | | 1,506,279 | | |
Norman Public Schools Project
Series 2014
07/01/18 | | | 5.000 | % | | | 2,400,000 | | | | 2,681,952 | | |
Total | | | | | | | 4,188,231 | | |
PENNSYLVANIA 2.7% | |
City of Philadelphia Water & Wastewater
Revenue Bonds
Series 2010C (AGM)
08/01/16 | | | 5.000 | % | | | 3,440,000 | | | | 3,639,830 | | |
Commonwealth of Pennsylvania
Unlimited General Obligation Bonds
1st Series 2012
06/01/19 | | | 5.000 | % | | | 5,650,000 | | | | 6,434,050 | | |
Unlimited General Obligation Refunding Bonds
2nd Series 2009
07/01/19 | | | 5.000 | % | | | 10,980,000 | | | | 12,527,411 | | |
County of Allegheny
Unlimited General Obligation Refunding Bonds
Series 2014C-73
12/01/18 | | | 5.000 | % | | | 6,650,000 | | | | 7,519,221 | | |
Monroeville Finance Authority
Revenue Bonds
Series 2012
02/15/18 | | | 4.000 | % | | | 1,250,000 | | | | 1,347,763 | | |
Pennsylvania Higher Educational Facilities Authority
Revenue Bonds
University of Pittsburgh Medical Center
Series 2010E
05/15/15 | | | 5.000 | % | | | 4,250,000 | | | | 4,258,726 | | |
Pennsylvania Industrial Development Authority
Refunding Revenue Bonds
Economic Development
Series 2012 Escrowed to Maturity
07/01/15 | | | 5.000 | % | | | 2,000,000 | | | | 2,016,180 | | |
Philadelphia Municipal Authority
Refunding Revenue Bonds
City Agreement
Series 2013A
11/15/15 | | | 5.000 | % | | | 2,000,000 | | | | 2,050,660 | | |
11/15/16 | | | 5.000 | % | | | 1,750,000 | | | | 1,864,345 | | |
School District of Philadelphia (The)
Unlimited General Obligation Refunding Bonds
Series 2015D(f)
09/01/19 | | | 5.000 | % | | | 3,750,000 | | | | 4,258,275 | | |
The accompanying Notes to Financial Statements are an integral part of this statement.
Annual Report 2015
17
COLUMBIA SHORT TERM MUNICIPAL BOND FUND
PORTFOLIO OF INVESTMENTS (continued)
April 30, 2015
Municipal Bonds (continued)
Issue
Description | | Coupon
Rate | | Principal
Amount ($) | |
Value ($) | |
State Public School Building Authority
Refunding Revenue Bonds
The School District of Philadelphia Project
Series 2015
06/01/19 | | | 5.000 | % | | | 2,890,000 | | | | 3,251,684 | | |
Revenue Bonds
School District of Philadelphia
Series 2012
04/01/16 | | | 5.000 | % | | | 2,000,000 | | | | 2,083,680 | | |
Total | | | | | | | 51,251,825 | | |
RHODE ISLAND 0.9% | |
Rhode Island Economic Development Corp.
Revenue Bonds
Grant Anticipation-Department of Transportation
Series 2006A (NPFGC)
06/15/17 | | | 5.000 | % | | | 16,410,000 | | | | 17,161,414 | | |
SOUTH CAROLINA 1.8% | |
Berkeley County School District
Revenue Bonds
Series 2013
12/01/16 | | | 4.000 | % | | | 400,000 | | | | 421,488 | | |
12/01/17 | | | 5.000 | % | | | 500,000 | | | | 549,665 | | |
Piedmont Municipal Power Agency
Refunding Revenue Bonds
Series 2009A-3
01/01/18 | | | 5.000 | % | | | 5,080,000 | | | | 5,599,684 | | |
Series 2009A-4
01/01/19 | | | 5.000 | % | | | 6,645,000 | | | | 7,497,620 | | |
SCAGO Educational Facilities Corp. for Pickens School District
Refunding Revenue Bonds
Series 2015
12/01/18 | | | 5.000 | % | | | 1,100,000 | | | | 1,238,622 | | |
12/01/19 | | | 5.000 | % | | | 1,250,000 | | | | 1,434,588 | | |
South Carolina Jobs-Economic Development Authority
Refunding Revenue Bonds
Palmetto Health
Series 2013A
08/01/15 | | | 3.000 | % | | | 1,000,000 | | | | 1,004,960 | | |
South Carolina State Public Service Authority
Refunding Revenue Bonds
Santee Cooper
Series 2012C
12/01/16 | | | 5.000 | % | | | 5,065,000 | | | | 5,419,550 | | |
Revenue Bonds
Santee Cooper
Series 2006A Escrowed to Maturity (NPFGC)
01/01/16 | | | 5.000 | % | | | 4,295,000 | | | | 4,432,268 | | |
South Carolina Transportation Infrastructure Bank
Refunding Revenue Bonds
Series 2012A
10/01/15 | | | 4.000 | % | | | 6,000,000 | | | | 6,096,420 | | |
Total | | | | | | | 33,694,865 | | |
Municipal Bonds (continued)
Issue
Description | | Coupon
Rate | | Principal
Amount ($) | |
Value ($) | |
TENNESSEE 0.2% | |
Memphis-Shelby County Airport Authority(b)
Refunding Revenue Bonds
Series 2010B AMT
07/01/15 | | | 4.000 | % | | | 2,060,000 | | | | 2,072,710 | | |
07/01/16 | | | 5.000 | % | | | 1,000,000 | | | | 1,049,740 | | |
Metropolitan Government of Nashville & Davidson County
Water & Sewer
Refunding Revenue Bonds
Subordinated Lien
Series 2012
07/01/16 | | | 5.000 | % | | | 1,250,000 | | | | 1,318,225 | | |
Total | | | | | | | 4,440,675 | | |
TEXAS 5.9% | |
Central Texas Regional Mobility Authority
Refunding Revenue Bonds
Senior Lien
Series 2013A
01/01/17 | | | 5.000 | % | | | 925,000 | | | | 991,693 | | |
City Public Service Board of San Antonio
Refunding Revenue Bonds
Junior Lien
Series 2014
02/01/19 | | | 5.000 | % | | | 13,865,000 | | | | 15,817,885 | | |
Systems
Series 2011
02/01/16 | | | 5.000 | % | | | 4,000,000 | | | | 4,144,320 | | |
City of El Paso Water & Sewer
Refunding Revenue Bonds
Series 2014
03/01/19 | | | 4.000 | % | | | 1,000,000 | | | | 1,102,040 | | |
City of Houston Combined Utility System(a)
Refunding Revenue Bonds
Combined 1st Lien-SIFMA
Series 2012
05/15/34 | | | 0.710 | % | | | 6,000,000 | | | | 6,012,360 | | |
SIFMA Index
Series 2012
05/15/34 | | | 0.660 | % | | | 3,500,000 | | | | 3,500,140 | | |
City of Houston
Limited General Obligation Refunding Bonds
Series 2011A
03/01/16 | | | 5.000 | % | | | 11,470,000 | | | | 11,924,786 | | |
Clear Creek Independent School District
Unlimited General Obligation Refunding Bonds
Series 2012A (Permanent School Fund Guarantee)
02/15/16 | | | 5.000 | % | | | 5,130,000 | | | | 5,322,785 | | |
Dallas/Fort Worth International Airport
Refunding Revenue Bonds
Series 2013D
11/01/16 | | | 5.000 | % | | | 1,000,000 | | | | 1,067,690 | | |
The accompanying Notes to Financial Statements are an integral part of this statement.
Annual Report 2015
18
COLUMBIA SHORT TERM MUNICIPAL BOND FUND
PORTFOLIO OF INVESTMENTS (continued)
April 30, 2015
Municipal Bonds (continued)
Issue
Description | | Coupon
Rate | | Principal
Amount ($) | |
Value ($) | |
Dallas/Fort Worth International Airport(b)
Refunding Revenue Bonds
Series 2013E AMT
11/01/18 | | | 5.000 | % | | | 20,980,000 | | | | 23,631,662 | | |
Harris County-Houston Sports Authority
Refunding Revenue Bonds
Senior Lien
Series 2014A
11/15/19 | | | 5.000 | % | | | 3,000,000 | | | | 3,451,140 | | |
Houston Independent School District
Revenue Bonds
Series 2014
09/15/19 | | | 5.000 | % | | | 4,100,000 | | | | 4,714,508 | | |
Houston Independent School District(a)
Limited General Obligation Refunding Bonds
Limited Tax
Series 2012 (Permanent School Fund Guarantee)
06/01/30 | | | 2.500 | % | | | 7,500,000 | | | | 7,513,050 | | |
Lower Colorado River Authority
Prerefunded Revenue Bonds
Series 2010 Escrowed to Maturity
05/15/15 | | | 5.000 | % | | | 5,000 | | | | 5,010 | | |
05/15/15 | | | 5.000 | % | | | 10,000 | | | | 10,020 | | |
Unrefunded Revenue Bonds
Series 2010
05/15/16 | | | 5.000 | % | | | 6,320,000 | | | | 6,625,193 | | |
North Texas Tollway Authority
Refunding Revenue Bonds
Series 2015A
01/01/19 | | | 5.000 | % | | | 1,350,000 | | | | 1,517,535 | | |
01/01/20 | | | 5.000 | % | | | 1,105,000 | | | | 1,264,794 | | |
Sam Rayburn Municipal Power Agency
Refunding Revenue Bonds
Series 2012
10/01/15 | | | 5.000 | % | | | 2,110,000 | | | | 2,151,567 | | |
10/01/16 | | | 5.000 | % | | | 1,925,000 | | | | 2,042,541 | | |
10/01/17 | | | 5.000 | % | | | 2,865,000 | | | | 3,134,940 | | |
Tarrant County Cultural Education Facilities Finance Corp.
Refunding Revenue Bonds
Trinity Terrace Project
Series 2014
12/01/18 | | | 2.500 | % | | | 4,995,000 | | | | 5,087,707 | | |
Total | | | | | | | 111,033,366 | | |
UTAH 0.3% | |
Utah Associated Municipal Power Systems
Refunding Revenue Bonds
Payson Power Project
Series 2012
04/01/16 | | | 4.000 | % | | | 4,690,000 | | | | 4,837,078 | | |
Municipal Bonds (continued)
Issue
Description | | Coupon
Rate | | Principal
Amount ($) | |
Value ($) | |
VIRGINIA 0.2% | |
Peninsula Ports Authority
Refunding Revenue Bonds
Dominion Term Association Project
Series 2003(a)
10/01/33 | | | 2.375 | % | | | 3,335,000 | | | | 3,393,262 | | |
WASHINGTON 4.2% | |
Energy Northwest
Refunding Revenue Bonds
Project 1
Series 2012B
07/01/17 | | | 5.000 | % | | | 30,220,000 | | | | 33,005,680 | | |
Wind Project
Series 2014
07/01/16 | | | 5.000 | % | | | 1,000,000 | | | | 1,053,490 | | |
07/01/17 | | | 5.000 | % | | | 1,000,000 | | | | 1,088,780 | | |
07/01/18 | | | 5.000 | % | | | 1,425,000 | | | | 1,589,117 | | |
Port of Seattle
Refunding Revenue Bonds
Series 2010B AMT(b)
12/01/15 | | | 5.000 | % | | | 5,500,000 | | | | 5,652,680 | | |
Snohomish County School District No. 15 Edmonds
Unlimited General Obligation Refunding Bonds
Series 2012
12/01/17 | | | 4.000 | % | | | 2,000,000 | | | | 2,162,480 | | |
State of Washington
Certificate of Participation
State & Local Agencies
Series 2012
07/01/16 | | | 4.000 | % | | | 3,500,000 | | | | 3,649,800 | | |
State & Local Agency Personal Property
Series 2014B
07/01/18 | | | 5.000 | % | | | 5,000,000 | | | | 5,599,050 | | |
Revenue Bonds
520 Corridor Program
Senior Series 2013
09/01/16 | | | 5.000 | % | | | 2,000,000 | | | | 2,119,480 | | |
Senior Series 2013C
09/01/19 | | | 5.000 | % | | | 2,000,000 | | | | 2,295,740 | | |
Unlimited General Obligation Bonds
Motor Vehicle Fuel Tax
Series 2014E
02/01/18 | | | 5.000 | % | | | 4,410,000 | | | | 4,900,833 | | |
Various Purpose
Series 2013D
02/01/18 | | | 5.000 | % | | | 2,810,000 | | | | 3,122,753 | | |
Unlimited General Obligation Refunding Bonds
Series 2010A
01/01/19 | | | 5.000 | % | | | 5,780,000 | | | | 6,568,277 | | |
Various Purpose
Series 2009R
01/01/18 | | | 5.000 | % | | | 4,940,000 | | | | 5,475,743 | | |
The accompanying Notes to Financial Statements are an integral part of this statement.
Annual Report 2015
19
COLUMBIA SHORT TERM MUNICIPAL BOND FUND
PORTFOLIO OF INVESTMENTS (continued)
April 30, 2015
Municipal Bonds (continued)
Issue
Description | | Coupon
Rate | | Principal
Amount ($) | |
Value ($) | |
Washington State Housing Finance Commission
Revenue Bonds
Series 2010A (GNMA/FNMA/FHLMC)
10/01/28 | | | 4.700 | % | | | 690,000 | | | | 730,696 | | |
Total | | | | | | | 79,014,599 | | |
WEST VIRGINIA 0.2% | |
West Virginia Economic Development Authority
Revenue Bonds
Appalachian Power Co.-Amos Project
Series 2011A AMT(a)(b)
01/01/41 | | | 2.250 | % | | | 3,750,000 | | | | 3,789,525 | | |
WISCONSIN —% | |
University of Wisconsin Hospitals & Clinics Authority
Revenue Bonds
Series 2013A
04/01/16 | | | 4.000 | % | | | 185,000 | | | | 191,201 | | |
WYOMING 0.3% | |
County of Sweetwater
Revenue Bonds
Series 2013
06/15/15 | | | 4.000 | % | | | 1,485,000 | | | | 1,491,473 | | |
12/15/15 | | | 5.000 | % | | | 2,000,000 | | | | 2,054,420 | | |
12/15/16 | | | 5.000 | % | | | 2,500,000 | | | | 2,658,550 | | |
Total | | | | | | | 6,204,443 | | |
Total Municipal Bonds
(Cost: $1,540,607,254) | | | | | | | 1,547,440,703 | | |
Municipal Short Term 15.0%
Issue
Description | | Effective
Yield | | Principal
Amount ($) | |
Value ($) | |
CALIFORNIA 0.6% | |
California Pollution Control Financing Authority
Revenue Bonds
Republic Services, Inc.
VRDN Series 2010B(a)(d)
08/01/24 | | | 0.300 | % | | | 5,000,000 | | | | 5,000,000 | | |
Charter Oak Unified School District
Unlimited General Obligation Bonds
BAN Series 2012
10/01/15 | | | 0.730 | % | | | 4,600,000 | | | | 4,682,064 | | |
Monterey Peninsula Unified School District
Unlimited General Obligation Bonds
BAN Series 2012
11/01/15 | | | 0.340 | % | | | 1,700,000 | | | | 1,718,462 | | |
Total | | | | | | | 11,400,526 | | |
Municipal Short Term (continued)
Issue
Description | | Effective
Yield | | Principal
Amount ($) | |
Value ($) | |
CONNECTICUT 1.1% | |
City of Hartford
General Obligation Unlimited Notes
BAN Series 2014
10/27/15 | | | 0.400 | % | | | 10,000,000 | | | | 10,078,500 | | |
City of New Britain
Unlimited General Obligation Notes
BAN Series 2015
03/25/16 | | | 0.460 | % | | | 10,000,000 | | | | 10,183,200 | | |
Total | | | | | | | 20,261,700 | | |
INDIANA 0.3% | |
Indiana Finance Authority
Revenue Bonds
Republic Services, Inc. Project
Series 2010B(a)
05/01/28 | | | 0.300 | % | | | 6,000,000 | | | | 5,999,820 | | |
KENTUCKY 0.2% | |
Kentucky Economic Development Finance Authority
Refunding Revenue Bonds
Republic Services, Inc. Project
Series 2010B(a)
04/01/31 | | | 0.300 | % | | | 4,000,000 | | | | 4,000,000 | | |
LOUISIANA 0.7% | |
Louisiana Public Facilities Authority
Revenue Bonds
Louisiana Pellets, Inc. Project
Series 2013 AMT(b)
08/01/15 | | | 7.980 | % | | | 12,095,000 | | | | 12,142,170 | | |
MICHIGAN 0.2% | |
Michigan Finance Authority
Revenue Notes
State Aid Withholdings School District
Series 2014E
08/20/15 | | | 1.800 | % | | | 3,920,000 | | | | 3,932,113 | | |
NEW JERSEY 2.2% | |
City of Newark
General Obligation Unlimited Notes
BAN Series 2014B
06/24/15 | | | 0.910 | % | | | 7,000,000 | | | | 7,008,647 | | |
Refunding General Obligation Unlimited Notes
Series 2014D
12/08/15 0.840% 1,316,000 1,323,172
Series 2014F
12/08/15 | | | 0.940 | % | | | 1,000,000 | | | | 1,004,840 | | |
Unlimited General Obligation Notes
TAN Series 2015A
02/19/16 | | | 1.490 | % | | | 5,000,000 | | | | 5,010,350 | | |
The accompanying Notes to Financial Statements are an integral part of this statement.
Annual Report 2015
20
COLUMBIA SHORT TERM MUNICIPAL BOND FUND
PORTFOLIO OF INVESTMENTS (continued)
April 30, 2015
Municipal Short Term (continued)
Issue
Description | | Effective
Yield | | Principal
Amount ($) | |
Value ($) | |
City of Trenton
General Obligation Unlimited Notes
BAN Series 2014
06/17/15 | | | 0.610 | % | | | 15,268,500 | | | | 15,276,190 | | |
Township of Berkeley
General Obligation Unlimited Notes
BAN Series 2014A
08/25/15 | | | 0.800 | % | | | 11,409,928 | | | | 11,435,258 | | |
Total | | | | | | | 41,058,457 | | |
NEW YORK 8.8% | |
Board of Cooperative Educational Services First
Supervisory District
Revenue Notes
RAN Series 2014
06/26/15 | | | 0.610 | % | | | 6,000,000 | | | | 6,003,588 | | |
Board of Cooperative Educational Services for the Sole
Supervisory District
Revenue Notes
RAN Series 2014
06/18/15 | | | 0.530 | % | | | 10,800,000 | | | | 10,806,680 | | |
07/24/15 | | | 0.680 | % | | | 10,000,000 | | | | 10,019,000 | | |
City of Long Beach
General Obligation Limited Notes
RAN Series 2014A
09/18/15 | | | 1.370 | % | | | 2,120,000 | | | | 2,120,954 | | |
City of Rome
General Obligation Limited Notes
BAN Series 2014
09/04/15 | | | 0.660 | % | | | 12,932,539 | | | | 12,958,404 | | |
County of Rockland
General Obligation Limited Notes
RAN Series 2014
08/12/15 | | | 0.850 | % | | | 9,900,000 | | | | 9,917,820 | | |
County of Suffolk
General Obligation Limited Notes
TAN Series 2014
09/11/15 | | | 0.460 | % | | | 15,000,000 | | | | 15,056,550 | | |
Delhi Central School District
General Obligation Unlimited Notes
BAN Series 2014
07/31/15 | | | 0.510 | % | | | 7,750,000 | | | | 7,759,455 | | |
Ellicottville Central School District
General Obligation Unlimited Notes
BAN Series 2014
06/19/15 | | | 0.640 | % | | | 6,600,000 | | | | 6,607,682 | | |
Jamestown City School District
General Obligation Unlimited Notes
BAN Series 2014B
07/30/15 | | | 0.500 | % | | | 9,390,000 | | | | 9,401,738 | | |
Municipal Short Term (continued)
Issue
Description | | Effective
Yield | | Principal
Amount ($) | |
Value ($) | |
Lewiston-Porter Central School District
General Obligation Unlimited Notes
BAN Series 2014A
07/23/15 | | | 0.700 | % | | | 6,080,000 | | | | 6,091,126 | | |
Orange & Ulster Counties Board Cooperative Educational
Services Sole Supervisory District
Revenue Notes
RAN Series 2014B
07/31/15 | | | 0.690 | % | | | 11,000,000 | | | | 11,008,360 | | |
Salmon River Central School District
General Obligation Unlimited Notes
RAN Series 2014
06/18/15 | | | 0.660 | % | | | 9,000,000 | | | | 9,003,976 | | |
Shoreham-Wading River Central School District
General Obligation Unlimited Notes
TAN Series 2014
06/25/15 | | | 0.570 | % | | | 4,000,000 | | | | 4,005,655 | | |
Town of Ramapo
Limited General Obligation Notes
BAN Series 2014B(d)
05/27/15 | | | 2.720 | % | | | 3,860,000 | | | | 3,863,417 | | |
Utica School District
General Obligation Unlimited Notes
BAN Series 2015
07/23/15 | | | 0.750 | % | | | 5,000,000 | | | | 5,002,900 | | |
RAN Series 2014
06/24/15 | | | 0.820 | % | | | 10,000,000 | | | | 10,006,311 | | |
Village of Arcade
General Obligation Limited Notes
BAN Series 2014
08/20/15 | | | 0.810 | % | | | 4,770,000 | | | | 4,779,969 | | |
Village of East Rochester
General Obligation Limited Notes
BAN Series 2014
05/29/15 | | | 0.600 | % | | | 6,500,000 | | | | 6,503,400 | | |
Watervliet City School District
General Obligation Unlimited Notes
BAN Series 2014
06/25/15 | | | 0.700 | % | | | 10,450,000 | | | | 10,454,701 | | |
06/26/15 | | | 0.680 | % | | | 3,420,000 | | | | 3,426,967 | | |
Total | | | | | | | 164,798,653 | | |
PENNSYLVANIA 0.9% | |
Clarion County Industrial Development Authority
Revenue Bonds
Student Housing
BAN Series 2014
05/01/16 | | | 0.880 | % | | | 5,000,000 | | | | 5,008,450 | | |
The accompanying Notes to Financial Statements are an integral part of this statement.
Annual Report 2015
21
COLUMBIA SHORT TERM MUNICIPAL BOND FUND
PORTFOLIO OF INVESTMENTS (continued)
April 30, 2015
Municipal Short Term (continued)
Issue
Description | | Effective
Yield | | Principal
Amount ($) | |
Value ($) | |
School District of the City of Erie (The)
General Obligation Limited Notes
TRAN Series 2014
06/30/15 | | | 0.650 | % | | | 11,500,000 | | | | 11,506,670 | | |
Total | | | | | | | 16,515,120 | | |
Total Municipal Short Term
(Cost: $280,031,587) | | | | | | | 280,108,559 | | |
Money Market Funds 1.4%
| | | Shares | |
Value ($) | |
JPMorgan Tax-Free Money Market Fund,
0.010%(g) | | | 26,047,721 | | | | 26,047,721 | | |
Total Money Market Funds
(Cost: $26,047,721) | | | | | 26,047,721 | | |
Total Investments
(Cost: $1,846,686,562) | | | | | 1,853,596,983 | | |
Other Assets & Liabilities, Net | | | | | 13,830,642 | | |
Net Assets | | | | | 1,867,427,625 | | |
Notes to Portfolio of Investments
(a) Variable rate security.
(b) Income from this security may be subject to alternative minimum tax.
(c) Zero coupon bond.
(d) Security exempt from registration pursuant to Rule 144A under the Securities Act of 1933. This security may be resold in transactions exempt from registration, normally to qualified institutional buyers. At April 30, 2015, the value of these securities amounted to $10,907,817 or 0.58% of net assets.
(e) Municipal obligations include debt obligations issued by or on behalf of territories, possessions, or sovereign nations within the territorial boundaries of the United States. At April 30, 2015, the value of these securities amounted to $1,014,640 or 0.05% of net assets.
(f) Security, or a portion thereof, has been purchased on a when-issued or delayed delivery basis.
(g) The rate shown is the seven-day current annualized yield at April 30, 2015.
Abbreviation Legend
AGM Assured Guaranty Municipal Corporation
AMBAC Ambac Assurance Corporation
AMT Alternative Minimum Tax
BAN Bond Anticipation Note
FHLMC Federal Home Loan Mortgage Corporation
FNMA Federal National Mortgage Association
GNMA Government National Mortgage Association
NPFGC National Public Finance Guarantee Corporation
RAN Revenue Anticipation Note
TAN Tax Anticipation Note
TRAN Tax & Revenue Anticipation Note
VRDN Variable Rate Demand Note
XLCA XL Capital Assurance
The accompanying Notes to Financial Statements are an integral part of this statement.
Annual Report 2015
22
COLUMBIA SHORT TERM MUNICIPAL BOND FUND
PORTFOLIO OF INVESTMENTS (continued)
April 30, 2015
Fair Value Measurements
Generally accepted accounting principles (GAAP) require disclosure regarding the inputs and valuation techniques used to measure fair value and any changes in valuation inputs or techniques. In addition, investments shall be disclosed by major category.
The Fund categorizes its fair value measurements according to a three-level hierarchy that maximizes the use of observable inputs and minimizes the use of unobservable inputs by prioritizing that the most observable input be used when available. Observable inputs are those that market participants would use in pricing an investment based on market data obtained from sources independent of the reporting entity. Unobservable inputs are those that reflect the Fund's assumptions about the information market participants would use in pricing an investment. An investment's level within the fair value hierarchy is based on the lowest level of any input that is deemed significant to the asset or liability's fair value measurement. The input levels are not necessarily an indication of the risk or liquidity associated with investments at that level. For example, certain U.S. government securities are generally high quality and liquid, however, they are reflected as Level 2 because the inputs used to determine fair value may not always be quoted prices in an active market.
Fair value inputs are summarized in the three broad levels listed below:
> Level 1 — Valuations based on quoted prices for investments in active markets that the Fund has the ability to access at the measurement date (including NAV for open-end mutual funds). Valuation adjustments are not applied to Level 1 investments.
> Level 2 — Valuations based on other significant observable inputs (including quoted prices for similar securities, interest rates, prepayment speeds, credit risks, etc.).
> Level 3 — Valuations based on significant unobservable inputs (including the Fund's own assumptions and judgment in determining the fair value of investments).
Inputs that are used in determining fair value of an investment may include price information, credit data, volatility statistics, and other factors. These inputs can be either observable or unobservable. The availability of observable inputs can vary between investments, and is affected by various factors such as the type of investment, and the volume and level of activity for that investment or similar investments in the marketplace. The inputs will be considered by the Investment Manager, along with any other relevant factors in the calculation of an investment's fair value. The Fund uses prices and inputs that are current as of the measurement date, which may include periods of market dislocations. During these periods, the availability of prices and inputs may be reduced for many investments. This condition could cause an investment to be reclassified between the various levels within the hierarchy.
Investments falling into the Level 3 category are primarily supported by quoted prices from brokers and dealers participating in the market for those investments. However, these may be classified as Level 3 investments due to lack of market transparency and corroboration to support these quoted prices. Additionally, valuation models may be used as the pricing source for any remaining investments classified as Level 3. These models may rely on one or more significant unobservable inputs and/or significant assumptions by the Investment Manager. Inputs used in valuations may include, but are not limited to, financial statement analysis, capital account balances, discount rates and estimated cash flows, and comparable company data.
Under the direction of the Fund's Board of Trustees (the Board), the Investment Manager's Valuation Committee (the Committee) is responsible for overseeing the valuation procedures approved by the Board. The Committee consists of voting and non-voting members from various groups within the Investment Manager's organization, including operations and accounting, trading and investments, compliance, risk management and legal.
The Committee meets at least monthly to review and approve valuation matters, which may include a description of specific valuation determinations, data regarding pricing information received from approved pricing vendors and brokers and the results of Board-approved valuation control policies and procedures (the Policies). The Policies address, among other things, instances when market quotations are or are not readily available, including recommendations of third party pricing vendors and a determination of appropriate pricing methodologies; events that require specific valuation determinations and assessment of fair value techniques; securities with a potential for stale pricing, including those that are illiquid, restricted, or in default; and the effectiveness of third party pricing vendors, including periodic reviews of vendors. The Committee meets more frequently, as needed, to discuss additional valuation matters, which may include the need to review back-testing results, review time-sensitive information or approve related valuation actions. The Committee reports to the Board, with members of the Committee meeting with the Board at each of its regularly scheduled meetings to discuss valuation matters and actions during the period, similar to those described earlier.
For investments categorized as Level 3, the Committee monitors information similar to that described above, which may include: (i) data specific to the issuer or comparable issuers, (ii) general market or specific sector news and (iii) quoted prices and specific or similar security transactions. The Committee considers this data and any changes from prior periods in order to assess the reasonableness of observable and unobservable inputs, any assumptions or internal models used to value those securities and changes in fair value. This data is also used to corroborate, when available, information received from approved pricing vendors and brokers. Various factors impact the frequency of monitoring this information (which may occur as often as daily). However, the Committee may determine that changes to inputs, assumptions and models are not required as a result of the monitoring procedures performed.
The accompanying Notes to Financial Statements are an integral part of this statement.
Annual Report 2015
23
COLUMBIA SHORT TERM MUNICIPAL BOND FUND
PORTFOLIO OF INVESTMENTS (continued)
April 30, 2015
Fair Value Measurements (continued)
The following table is a summary of the inputs used to value the Fund's investments at April 30, 2015:
Description | | Level 1
Quoted Prices in Active
Markets for Identical
Assets ($) | |
Level 2
Other Significant
Observable Inputs ($) | |
Level 3
Significant
Unobservable Inputs ($) | |
Total ($) | |
Bonds | |
Municipal Bonds | | | — | | | | 1,547,440,703 | | | | — | | | | 1,547,440,703 | | |
Total Bonds | | | — | | | | 1,547,440,703 | | | | — | | | | 1,547,440,703 | | |
Short-Term Securities | |
Municipal Short Term | | | — | | | | 280,108,559 | | | | — | | | | 280,108,559 | | |
Total Short-Term Securities | | | — | | | | 280,108,559 | | | | — | | | | 280,108,559 | | |
Mutual Funds | |
Money Market Funds | | | 26,047,721 | | | | — | | | | — | | | | 26,047,721 | | |
Total Mutual Funds | | | 26,047,721 | | | | — | | | | — | | | | 26,047,721 | | |
Total | | | 26,047,721 | | | | 1,827,549,262 | | | | — | | | | 1,853,596,983 | | |
See the Portfolio of Investments for all investment classifications not indicated in the table.
The Fund's assets assigned to the Level 2 input category are generally valued using the market approach, in which a security's value is determined through reference to prices and information from market transactions for similar or identical assets.
There were no transfers of financial assets between levels during the period.
The accompanying Notes to Financial Statements are an integral part of this statement.
Annual Report 2015
24
COLUMBIA SHORT TERM MUNICIPAL BOND FUND
STATEMENT OF ASSETS AND LIABILITIES
April 30, 2015
Assets | |
Investments, at value | |
(identified cost $1,846,686,562) | | $ | 1,853,596,983 | | |
Receivable for: | |
Investments sold | | | 4,449,722 | | |
Capital shares sold | | | 1,809,394 | | |
Interest | | | 22,314,740 | | |
Expense reimbursement due from Investment Manager | | | 7,907 | | |
Prepaid expenses | | | 2,018 | | |
Total assets | | | 1,882,180,764 | | |
Liabilities | |
Disbursements in excess of cash | | | 342 | | |
Payable for: | |
Investments purchased on a delayed delivery basis | | | 10,220,467 | | |
Capital shares purchased | | | 2,459,576 | | |
Dividend distributions to shareholders | | | 1,513,516 | | |
Investment management fees | | | 18,343 | | |
Distribution and/or service fees | | | 1,480 | | |
Transfer agent fees | | | 345,009 | | |
Administration fees | | | 3,283 | | |
Compensation of board members | | | 150,164 | | |
Other expenses | | | 40,959 | | |
Total liabilities | | | 14,753,139 | | |
Net assets applicable to outstanding capital stock | | $ | 1,867,427,625 | | |
Represented by | |
Paid-in capital | | $ | 1,859,428,337 | | |
Undistributed net investment income | | | 2,226,025 | | |
Accumulated net realized loss | | | (1,137,158 | ) | |
Unrealized appreciation (depreciation) on: | |
Investments | | | 6,910,421 | | |
Total — representing net assets applicable to outstanding capital stock | | $ | 1,867,427,625 | | |
The accompanying Notes to Financial Statements are an integral part of this statement.
Annual Report 2015
25
COLUMBIA SHORT TERM MUNICIPAL BOND FUND
STATEMENT OF ASSETS AND LIABILITIES (continued)
April 30, 2015
Class A | |
Net assets | | $ | 130,876,030 | | |
Shares outstanding | | | 12,565,820 | | |
Net asset value per share | | $ | 10.42 | | |
Maximum offering price per share(a) | | $ | 10.53 | | |
Class B | |
Net assets | | $ | 125,704 | | |
Shares outstanding | | | 12,069 | | |
Net asset value per share | | $ | 10.42 | | |
Class C | |
Net assets | | $ | 21,184,007 | | |
Shares outstanding | | | 2,033,309 | | |
Net asset value per share | | $ | 10.42 | | |
Class R4 | |
Net assets | | $ | 567,781 | | |
Shares outstanding | | | 54,517 | | |
Net asset value per share | | $ | 10.41 | | |
Class R5 | |
Net assets | | $ | 15,023,740 | | |
Shares outstanding | | | 1,442,622 | | |
Net asset value per share | | $ | 10.41 | | |
Class Z | |
Net assets | | $ | 1,699,650,363 | | |
Shares outstanding | | | 163,163,568 | | |
Net asset value per share | | $ | 10.42 | | |
(a) The maximum offering price per share is calculated by dividing the net asset value per share by 1.0 minus the maximum sales charge of 1.00%.
The accompanying Notes to Financial Statements are an integral part of this statement.
Annual Report 2015
26
COLUMBIA SHORT TERM MUNICIPAL BOND FUND
STATEMENT OF OPERATIONS
Year Ended April 30, 2015
Net investment income | |
Income: | |
Dividends | | $ | 3,114 | | |
Interest | | | 30,888,747 | | |
Total income | | | 30,891,861 | | |
Expenses: | |
Investment management fees | | | 7,245,916 | | |
Distribution and/or service fees | |
Class A | | | 378,887 | | |
Class B | | | 1,275 | | |
Class C | | | 240,930 | | |
Transfer agent fees | |
Class A | | | 307,642 | | |
Class B | | | 260 | | |
Class C | | | 49,018 | | |
Class R4 | | | 404 | | |
Class R5 | | | 10,941 | | |
Class Z | | | 3,725,068 | | |
Administration fees | | | 1,291,573 | | |
Compensation of board members | | | 45,384 | | |
Custodian fees | | | 14,131 | | |
Printing and postage fees | | | 38,439 | | |
Registration fees | | | 167,401 | | |
Professional fees | | | 47,254 | | |
Other | | | 32,178 | | |
Total expenses | | | 13,596,701 | | |
Fees waived or expenses reimbursed by Investment Manager and its affiliates | | | (3,264,887 | ) | |
Expense reductions | | | (20 | ) | |
Total net expenses | | | 10,331,794 | | |
Net investment income | | | 20,560,067 | | |
Realized and unrealized gain (loss) — net | |
Net realized gain (loss) on: | |
Investments | | | 305,753 | | |
Net realized gain | | | 305,753 | | |
Net change in unrealized appreciation (depreciation) on: | |
Investments | | | (11,444,000 | ) | |
Net change in unrealized depreciation | | | (11,444,000 | ) | |
Net realized and unrealized loss | | | (11,138,247 | ) | |
Net increase in net assets resulting from operations | | $ | 9,421,820 | | |
The accompanying Notes to Financial Statements are an integral part of this statement.
Annual Report 2015
27
COLUMBIA SHORT TERM MUNICIPAL BOND FUND
STATEMENT OF CHANGES IN NET ASSETS
| | | Year Ended
April 30,
2015 | | Year Ended
April 30,
2014 | |
Operations | |
Net investment income | | $ | 20,560,067 | | | $ | 22,969,091 | | |
Net realized gain | | | 305,753 | | | | 1,106,359 | | |
Net change in unrealized depreciation | | | (11,444,000 | ) | | | (13,485,395 | ) | |
Net increase in net assets resulting from operations | | | 9,421,820 | | | | 10,590,055 | | |
Distributions to shareholders | |
Net investment income | |
Class A | | | (1,205,953 | ) | | | (1,655,269 | ) | |
Class B | | | (55 | ) | | | (267 | ) | |
Class C | | | (10,293 | ) | | | (50,886 | ) | |
Class R4 | | | (1,992 | ) | | | (8,004 | ) | |
Class R5 | | | (250,660 | ) | | | (199,259 | ) | |
Class Z | | | (19,125,663 | ) | | | (21,055,406 | ) | |
Total distributions to shareholders | | | (20,594,616 | ) | | | (22,969,091 | ) | |
Increase (decrease) in net assets from capital stock activity | | | (157,962,302 | ) | | | 4,176,179 | | |
Total decrease in net assets | | | (169,135,098 | ) | | | (8,202,857 | ) | |
Net assets at beginning of year | | | 2,036,562,723 | | | | 2,044,765,580 | | |
Net assets at end of year | | $ | 1,867,427,625 | | | $ | 2,036,562,723 | | |
Undistributed net investment income | | $ | 2,226,025 | | | $ | 2,260,574 | | |
The accompanying Notes to Financial Statements are an integral part of this statement.
Annual Report 2015
28
COLUMBIA SHORT TERM MUNICIPAL BOND FUND
STATEMENT OF CHANGES IN NET ASSETS (continued)
| | | Year Ended April 30, 2015 | | Year Ended April 30, 2014 | |
| | | Shares | | Dollars ($) | | Shares | | Dollars ($) | |
Capital stock activity | |
Class A shares | |
Subscriptions(a) | | | 4,800,943 | | | | 50,219,992 | | | | 5,785,792 | | | | 60,627,189 | | |
Distributions reinvested | | | 80,067 | | | | 837,472 | | | | 102,700 | | | | 1,076,572 | | |
Redemptions | | | (8,140,884 | ) | | | (85,145,912 | ) | | | (7,635,941 | ) | | | (80,074,932 | ) | |
Net decrease | | | (3,259,874 | ) | | | (34,088,448 | ) | | | (1,747,449 | ) | | | (18,371,171 | ) | |
Class B shares | |
Subscriptions | | | 3 | | | | 44 | | | | 21 | | | | 227 | | |
Distributions reinvested | | | 1 | | | | 3 | | | | 3 | | | | 27 | | |
Redemptions(a) | | | (162 | ) | | | (1,696 | ) | | | (3,844 | ) | | | (40,316 | ) | |
Net decrease | | | (158 | ) | | | (1,649 | ) | | | (3,820 | ) | | | (40,062 | ) | |
Class C shares | |
Subscriptions | | | 987,898 | | | | 10,337,603 | | | | 647,212 | | | | 6,789,165 | | |
Distributions reinvested | | | 513 | | | | 5,373 | | | | 2,574 | | | | 26,988 | | |
Redemptions | | | (1,286,309 | ) | | | (13,455,885 | ) | | | (949,374 | ) | | | (9,954,093 | ) | |
Net decrease | | | (297,898 | ) | | | (3,112,909 | ) | | | (299,588 | ) | | | (3,137,940 | ) | |
Class R4 shares | |
Subscriptions | | | 51,079 | | | | 534,275 | | | | 12,627 | | | | 132,429 | | |
Distributions reinvested | | | 181 | | | | 1,888 | | | | 761 | | | | 7,974 | | |
Redemptions | | | (4,814 | ) | | | (50,294 | ) | | | (199,368 | ) | | | (2,086,668 | ) | |
Net increase (decrease) | | | 46,446 | | | | 485,869 | | | | (185,980 | ) | | | (1,946,265 | ) | |
Class R5 shares | |
Subscriptions | | | 1,065,038 | | | | 11,142,196 | | | | 2,411,637 | | | | 25,292,684 | | |
Distributions reinvested | | | 23,955 | | | | 250,543 | | | | 18,981 | | | | 198,924 | | |
Redemptions | | | (1,858,884 | ) | | | (19,429,265 | ) | | | (267,678 | ) | | | (2,805,823 | ) | |
Net increase (decrease) | | | (769,891 | ) | | | (8,036,526 | ) | | | 2,162,940 | | | | 22,685,785 | | |
Class Z shares | |
Subscriptions | | | 59,806,951 | | | | 625,714,831 | | | | 75,675,898 | | | | 793,602,619 | | |
Distributions reinvested | | | 123,155 | | | | 1,288,390 | | | | 160,250 | | | | 1,679,903 | | |
Redemptions | | | (70,778,267 | ) | | | (740,211,860 | ) | | | (75,359,133 | ) | | | (790,296,690 | ) | |
Net increase (decrease) | | | (10,848,161 | ) | | | (113,208,639 | ) | | | 477,015 | | | | 4,985,832 | | |
Total net increase (decrease) | | | (15,129,536 | ) | | | (157,962,302 | ) | | | 403,118 | | | | 4,176,179 | | |
(a) Includes conversions of Class B shares to Class A shares, if any.
The accompanying Notes to Financial Statements are an integral part of this statement.
Annual Report 2015
29
COLUMBIA SHORT TERM MUNICIPAL BOND FUND
The following tables are intended to help you understand the Fund's financial performance. Certain information reflects financial results for a single share of a class held for the periods shown. Per share net investment income (loss) amounts are calculated based on average shares outstanding during the period. Total return assumes reinvestment of all dividends and distributions, if any. Total return does not reflect payment of sales charges, if any. Total return and portfolio turnover are not annualized for periods of less than one year. The portfolio turnover rate is calculated without regard to purchase and sales transactions of short-term instruments and certain derivatives, if any. If such transactions were included, the Fund's portfolio turnover rate may be higher.
| | | Year Ended April 30, | | Year Ended March 31, | |
Class A | | 2015 | | 2014 | | 2013 | | 2012(a) | | 2012 | | 2011 | |
Per share data | |
Net asset value, beginning of period | | $ | 10.48 | | | $ | 10.54 | | | $ | 10.55 | | | $ | 10.54 | | | $ | 10.47 | | | $ | 10.55 | | |
Income from investment operations: | |
Net investment income | | | 0.08 | | | | 0.10 | | | | 0.11 | | | | 0.01 | | | | 0.16 | | | | 0.16 | | |
Net realized and unrealized gain (loss) | | | (0.06 | ) | | | (0.06 | ) | | | (0.01 | ) | | | 0.01 | | | | 0.06 | | | | (0.08 | ) | |
Total from investment operations | | | 0.02 | | | | 0.04 | | | | 0.10 | | | | 0.02 | | | | 0.22 | | | | 0.08 | | |
Less distributions to shareholders: | |
Net investment income | | | (0.08 | ) | | | (0.10 | ) | | | (0.11 | ) | | | (0.01 | ) | | | (0.15 | ) | | | (0.16 | ) | |
Total distributions to shareholders | | | (0.08 | ) | | | (0.10 | ) | | | (0.11 | ) | | | (0.01 | ) | | | (0.15 | ) | | | (0.16 | ) | |
Net asset value, end of period | | $ | 10.42 | | | $ | 10.48 | | | $ | 10.54 | | | $ | 10.55 | | | $ | 10.54 | | | $ | 10.47 | | |
Total return | | | 0.22 | % | | | 0.37 | % | | | 0.96 | % | | | 0.19 | % | | | 2.12 | % | | | 0.75 | % | |
Ratios to average net assets(b) | |
Total gross expenses | | | 0.89 | % | | | 0.89 | % | | | 0.89 | % | | | 0.88 | %(c) | | | 0.90 | % | | | 0.78 | %(d) | |
Total net expenses(e) | | | 0.73 | %(f) | | | 0.73 | %(f) | | | 0.73 | %(f) | | | 0.72 | %(c) | | | 0.73 | %(f) | | | 0.75 | %(d)(f) | |
Net investment income | | | 0.79 | % | | | 0.94 | % | | | 1.05 | % | | | 1.17 | %(c) | | | 1.54 | % | | | 1.50 | % | |
Supplemental data | |
Net assets, end of period (in thousands) | | $ | 130,876 | | | $ | 165,777 | | | $ | 185,205 | | | $ | 209,557 | | | $ | 216,298 | | | $ | 281,009 | | |
Portfolio turnover | | | 28 | % | | | 31 | % | | | 37 | % | | | 2 | % | | | 39 | % | | | 38 | % | |
Notes to Financial Highlights
(a) For the period from April 1, 2012 to April 30, 2012. During the period, the Fund's fiscal year end was changed from March 31 to April 30.
(b) In addition to the fees and expenses that the Fund bears directly, the Fund indirectly bears a pro rata share of the fees and expenses of any other funds in which it invests. Such indirect expenses are not included in the Fund's reported expense ratios.
(c) Annualized.
(d) Ratios include line of credit interest expense which is less than 0.01%.
(e) Total net expenses include the impact of certain fee waivers/expense reimbursements made by the Investment Manager and certain of its affiliates, if applicable.
(f) The benefits derived from expense reductions had an impact of less than 0.01%.
The accompanying Notes to Financial Statements are an integral part of this statement.
Annual Report 2015
30
COLUMBIA SHORT TERM MUNICIPAL BOND FUND
FINANCIAL HIGHLIGHTS (continued)
| | | Year Ended April 30, | | Year Ended March 31, | |
Class B | | 2015 | | 2014 | | 2013 | | 2012(a) | | 2012 | | 2011 | |
Per share data | |
Net asset value, beginning of period | | $ | 10.47 | | | $ | 10.54 | | | $ | 10.55 | | | $ | 10.54 | | | $ | 10.47 | | | $ | 10.55 | | |
Income from investment operations: | |
Net investment income | | | 0.00 | (b) | | | 0.02 | | | | 0.03 | | | | 0.00 | (b) | | | 0.08 | | | | 0.08 | | |
Net realized and unrealized gain (loss) | | | (0.05 | ) | | | (0.07 | ) | | | (0.01 | ) | | | 0.01 | | | | 0.06 | | | | (0.08 | ) | |
Total from investment operations | | | (0.05 | ) | | | (0.05 | ) | | | 0.02 | | | | 0.01 | | | | 0.14 | | | | — | | |
Less distributions to shareholders: | |
Net investment income | | | (0.00 | )(b) | | | (0.02 | ) | | | (0.03 | ) | | | (0.00 | )(b) | | | (0.07 | ) | | | (0.08 | ) | |
Total distributions to shareholders | | | (0.00 | )(b) | | | (0.02 | ) | | | (0.03 | ) | | | (0.00 | )(b) | | | (0.07 | ) | | | (0.08 | ) | |
Net asset value, end of period | | $ | 10.42 | | | $ | 10.47 | | | $ | 10.54 | | | $ | 10.55 | | | $ | 10.54 | | | $ | 10.47 | | |
Total return | | | (0.43 | %) | | | (0.47 | %) | | | 0.20 | % | | | 0.12 | % | | | 1.35 | % | | | 0.00 | %(b) | |
Ratios to average net assets(c) | |
Total gross expenses | | | 1.64 | % | | | 1.64 | % | | | 1.64 | % | | | 1.63 | %(d) | | | 1.63 | % | | | 1.53 | %(e) | |
Total net expenses(f) | | | 1.48 | %(g) | | | 1.48 | %(g) | | | 1.48 | % | | | 1.47 | %(d) | | | 1.48 | %(g) | | | 1.50 | %(e)(g) | |
Net investment income | | | 0.04 | % | | | 0.19 | % | | | 0.30 | % | | | 0.41 | %(d) | | | 0.79 | % | | | 0.76 | % | |
Supplemental data | |
Net assets, end of period (in thousands) | | $ | 126 | | | $ | 128 | | | $ | 169 | | | $ | 243 | | | $ | 243 | | | $ | 325 | | |
Portfolio turnover | | | 28 | % | | | 31 | % | | | 37 | % | | | 2 | % | | | 39 | % | | | 38 | % | |
Notes to Financial Highlights
(a) For the period from April 1, 2012 to April 30, 2012. During the period, the Fund's fiscal year end was changed from March 31 to April 30.
(b) Rounds to zero.
(c) In addition to the fees and expenses that the Fund bears directly, the Fund indirectly bears a pro rata share of the fees and expenses of any other funds in which it invests. Such indirect expenses are not included in the Fund's reported expense ratios.
(d) Annualized.
(e) Ratios include line of credit interest expense which is less than 0.01%.
(f) Total net expenses include the impact of certain fee waivers/expense reimbursements made by the Investment Manager and certain of its affiliates, if applicable.
(g) The benefits derived from expense reductions had an impact of less than 0.01%.
The accompanying Notes to Financial Statements are an integral part of this statement.
Annual Report 2015
31
COLUMBIA SHORT TERM MUNICIPAL BOND FUND
FINANCIAL HIGHLIGHTS (continued)
| | | Year Ended April 30, | | Year Ended March 31, | |
Class C | | 2015 | | 2014 | | 2013 | | 2012(a) | | 2012 | | 2011 | |
Per share data | |
Net asset value, beginning of period | | $ | 10.48 | | | $ | 10.54 | | | $ | 10.55 | | | $ | 10.54 | | | $ | 10.47 | | | $ | 10.55 | | |
Income from investment operations: | |
Net investment income | | | 0.00 | (b) | | | 0.02 | | | | 0.03 | | | | 0.00 | (b) | | | 0.08 | | | | 0.08 | | |
Net realized and unrealized gain (loss) | | | (0.06 | ) | | | (0.06 | ) | | | (0.01 | ) | | | 0.01 | | | | 0.06 | | | | (0.08 | ) | |
Total from investment operations | | | (0.06 | ) | | | (0.04 | ) | | | 0.02 | | | | 0.01 | | | | 0.14 | | | | — | | |
Less distributions to shareholders: | |
Net investment income | | | (0.00 | )(b) | | | (0.02 | ) | | | (0.03 | ) | | | (0.00 | )(b) | | | (0.07 | ) | | | (0.08 | ) | |
Total distributions to shareholders | | | (0.00 | )(b) | | | (0.02 | ) | | | (0.03 | ) | | | (0.00 | )(b) | | | (0.07 | ) | | | (0.08 | ) | |
Net asset value, end of period | | $ | 10.42 | | | $ | 10.48 | | | $ | 10.54 | | | $ | 10.55 | | | $ | 10.54 | | | $ | 10.47 | | |
Total return | | | (0.53 | %) | | | (0.38 | %) | | | 0.20 | % | | | 0.12 | % | | | 1.35 | % | | | 0.00 | %(b) | |
Ratios to average net assets(c) | |
Total gross expenses | | | 1.64 | % | | | 1.64 | % | | | 1.64 | % | | | 1.63 | %(d) | | | 1.64 | % | | | 1.53 | %(e) | |
Total net expenses(f) | | | 1.48 | %(g) | | | 1.48 | %(g) | | | 1.48 | %(g) | | | 1.47 | %(d) | | | 1.48 | %(g) | | | 1.50 | %(e)(g) | |
Net investment income | | | 0.04 | % | | | 0.19 | % | | | 0.30 | % | | | 0.42 | %(d) | | | 0.79 | % | | | 0.75 | % | |
Supplemental data | |
Net assets, end of period (in thousands) | | $ | 21,184 | | | $ | 24,424 | | | $ | 27,730 | | | $ | 32,953 | | | $ | 33,176 | | | $ | 40,603 | | |
Portfolio turnover | | | 28 | % | | | 31 | % | | | 37 | % | | | 2 | % | | | 39 | % | | | 38 | % | |
Notes to Financial Highlights
(a) For the period from April 1, 2012 to April 30, 2012. During the period, the Fund's fiscal year end was changed from March 31 to April 30.
(b) Rounds to zero.
(c) In addition to the fees and expenses that the Fund bears directly, the Fund indirectly bears a pro rata share of the fees and expenses of any other funds in which it invests. Such indirect expenses are not included in the Fund's reported expense ratios.
(d) Annualized.
(e) Ratios include line of credit interest expense which is less than 0.01%.
(f) Total net expenses include the impact of certain fee waivers/expense reimbursements made by the Investment Manager and certain of its affiliates, if applicable.
(g) The benefits derived from expense reductions had an impact of less than 0.01%.
The accompanying Notes to Financial Statements are an integral part of this statement.
Annual Report 2015
32
COLUMBIA SHORT TERM MUNICIPAL BOND FUND
FINANCIAL HIGHLIGHTS (continued)
| | | Year Ended April 30, | |
Class R4 | | 2015 | | 2014 | | 2013(a) | |
Per share data | |
Net asset value, beginning of period | | $ | 10.47 | | | $ | 10.54 | | | $ | 10.54 | | |
Income from investment operations: | |
Net investment income | | | 0.11 | | | | 0.13 | | | | 0.02 | | |
Net realized and unrealized loss | | | (0.06 | ) | | | (0.08 | ) | | | (0.01 | ) | |
Total from investment operations | | | 0.05 | | | | 0.05 | | | | 0.01 | | |
Less distributions to shareholders: | |
Net investment income | | | (0.11 | ) | | | (0.12 | ) | | | (0.01 | ) | |
Total distributions to shareholders | | | (0.11 | ) | | | (0.12 | ) | | | (0.01 | ) | |
Net asset value, end of period | | $ | 10.41 | | | $ | 10.47 | | | $ | 10.54 | | |
Total return | | | 0.47 | % | | | 0.53 | % | | | 0.14 | % | |
Ratios to average net assets(b) | |
Total gross expenses | | | 0.65 | % | | | 0.64 | % | | | 0.66 | %(c) | |
Total net expenses(d) | | | 0.48 | %(e) | | | 0.48 | %(e) | | | 0.48 | %(c) | |
Net investment income | | | 1.04 | % | | | 1.19 | % | | | 1.32 | %(c) | |
Supplemental data | |
Net assets, end of period (in thousands) | | $ | 568 | | | $ | 85 | | | $ | 2,044 | | |
Portfolio turnover | | | 28 | % | | | 31 | % | | | 37 | % | |
Notes to Financial Highlights
(a) Based on operations from March 19, 2013 (commencement of operations) through the stated period end.
(b) In addition to the fees and expenses that the Fund bears directly, the Fund indirectly bears a pro rata share of the fees and expenses of any other funds in which it invests. Such indirect expenses are not included in the Fund's reported expense ratios.
(c) Annualized.
(d) Total net expenses include the impact of certain fee waivers/expense reimbursements made by the Investment Manager and certain of its affiliates, if applicable.
(e) The benefits derived from expense reductions had an impact of less than 0.01%.
The accompanying Notes to Financial Statements are an integral part of this statement.
Annual Report 2015
33
COLUMBIA SHORT TERM MUNICIPAL BOND FUND
FINANCIAL HIGHLIGHTS (continued)
| | | Year Ended April 30, | |
Class R5 | | 2015 | | 2014 | | 2013(a) | |
Per share data | |
Net asset value, beginning of period | | $ | 10.47 | | | $ | 10.54 | | | $ | 10.55 | | |
Income from investment operations: | |
Net investment income | | | 0.12 | | | | 0.14 | | | | 0.07 | | |
Net realized and unrealized loss | | | (0.06 | ) | | | (0.07 | ) | | | (0.01 | ) | |
Total from investment operations | | | 0.06 | | | | 0.07 | | | | 0.06 | | |
Less distributions to shareholders: | |
Net investment income | | | (0.12 | ) | | | (0.14 | ) | | | (0.07 | ) | |
Total distributions to shareholders | | | (0.12 | ) | | | (0.14 | ) | | | (0.07 | ) | |
Net asset value, end of period | | $ | 10.41 | | | $ | 10.47 | | | $ | 10.54 | | |
Total return | | | 0.57 | % | | | 0.67 | % | | | 0.54 | % | |
Ratios to average net assets(b) | |
Total gross expenses | | | 0.49 | % | | | 0.48 | % | | | 0.48 | %(c) | |
Total net expenses(d) | | | 0.38 | % | | | 0.37 | % | | | 0.39 | %(c) | |
Net investment income | | | 1.14 | % | | | 1.31 | % | | | 1.40 | %(c) | |
Supplemental data | |
Net assets, end of period (in thousands) | | $ | 15,024 | | | $ | 23,173 | | | $ | 522 | | |
Portfolio turnover | | | 28 | % | | | 31 | % | | | 37 | % | |
Notes to Financial Highlights
(a) Based on operations from November 8, 2012 (commencement of operations) through the stated period end.
(b) In addition to the fees and expenses that the Fund bears directly, the Fund indirectly bears a pro rata share of the fees and expenses of any other funds in which it invests. Such indirect expenses are not included in the Fund's reported expense ratios.
(c) Annualized.
(d) Total net expenses include the impact of certain fee waivers/expense reimbursements made by the Investment Manager and certain of its affiliates, if applicable.
The accompanying Notes to Financial Statements are an integral part of this statement.
Annual Report 2015
34
COLUMBIA SHORT TERM MUNICIPAL BOND FUND
FINANCIAL HIGHLIGHTS (continued)
| | | Year Ended April 30, | | Year Ended March 31, | |
Class Z | | 2015 | | 2014 | | 2013 | | 2012(a) | | 2012 | | 2011 | |
Per share data | |
Net asset value, beginning of period | | $ | 10.48 | | | $ | 10.54 | | | $ | 10.55 | | | $ | 10.54 | | | $ | 10.47 | | | $ | 10.55 | | |
Income from investment operations: | |
Net investment income | | | 0.11 | | | | 0.13 | | | | 0.14 | | | | 0.01 | | | | 0.19 | | | | 0.18 | | |
Net realized and unrealized gain (loss) | | | (0.06 | ) | | | (0.06 | ) | | | (0.01 | ) | | | 0.01 | | | | 0.06 | | | | (0.07 | ) | |
Total from investment operations | | | 0.05 | | | | 0.07 | | | | 0.13 | | | | 0.02 | | | | 0.25 | | | | 0.11 | | |
Less distributions to shareholders: | |
Net investment income | | | (0.11 | ) | | | (0.13 | ) | | | (0.14 | ) | | | (0.01 | ) | | | (0.18 | ) | | | (0.19 | ) | |
Total distributions to shareholders | | | (0.11 | ) | | | (0.13 | ) | | | (0.14 | ) | | | (0.01 | ) | | | (0.18 | ) | | | (0.19 | ) | |
Net asset value, end of period | | $ | 10.42 | | | $ | 10.48 | | | $ | 10.54 | | | $ | 10.55 | | | $ | 10.54 | | | $ | 10.47 | | |
Total return | | | 0.47 | % | | | 0.62 | % | | | 1.21 | % | | | 0.21 | % | | | 2.37 | % | | | 1.00 | % | |
Ratios to average net assets(b) | |
Total gross expenses | | | 0.64 | % | | | 0.64 | % | | | 0.64 | % | | | 0.63 | %(c) | | | 0.63 | % | | | 0.53 | %(d) | |
Total net expenses(e) | | | 0.48 | %(f) | | | 0.48 | %(f) | | | 0.48 | %(f) | | | 0.47 | %(c) | | | 0.48 | %(f) | | | 0.50 | %(d)(f) | |
Net investment income | | | 1.04 | % | �� | | 1.19 | % | | | 1.30 | % | | | 1.41 | %(c) | | | 1.77 | % | | | 1.75 | % | |
Supplemental data | |
Net assets, end of period (in thousands) | | $ | 1,699,650 | | | $ | 1,822,976 | | | $ | 1,829,096 | | | $ | 1,986,836 | | | $ | 2,040,417 | | | $ | 1,703,560 | | |
Portfolio turnover | | | 28 | % | | | 31 | % | | | 37 | % | | | 2 | % | | | 39 | % | | | 38 | % | |
Notes to Financial Highlights
(a) For the period from April 1, 2012 to April 30, 2012. During the period, the Fund's fiscal year end was changed from March 31 to April 30.
(b) In addition to the fees and expenses that the Fund bears directly, the Fund indirectly bears a pro rata share of the fees and expenses of any other funds in which it invests. Such indirect expenses are not included in the Fund's reported expense ratios.
(c) Annualized.
(d) Ratios include line of credit interest expense which is less than 0.01%.
(e) Total net expenses include the impact of certain fee waivers/expense reimbursements made by the Investment Manager and certain of its affiliates, if applicable.
(f) The benefits derived from expense reductions had an impact of less than 0.01%.
The accompanying Notes to Financial Statements are an integral part of this statement.
Annual Report 2015
35
COLUMBIA SHORT TERM MUNICIPAL BOND FUND
NOTES TO FINANCIAL STATEMENTS
April 30, 2015
Note 1. Organization
Columbia Short Term Municipal Bond Fund (the Fund), a series of Columbia Funds Series Trust (the Trust), is a diversified fund. The Trust is registered under the Investment Company Act of 1940, as amended (the 1940 Act), as an open-end management investment company organized as a Delaware statutory trust.
Fund Shares
The Trust may issue an unlimited number of shares (without par value). The Fund offers Class A, Class B, Class C, Class R4, Class R5 and Class Z shares. Although all share classes generally have identical voting, dividend and liquidation rights, each share class votes separately when required by the Trust's organizational documents or by law. Different share classes pay different distribution amounts to the extent the expenses of such share classes differ, and distributions in liquidation will be proportional to the net asset value of each share class. Each share class has its own expense structure and sales charges.
Class A shares are subject to a maximum front-end sales charge of 1.00% based on the initial investment amount. In addition, Class A shares purchased on or after February 19, 2015 are subject to a contingent deferred sales charge (CDSC) of 0.50% on certain investments of $500,000 or more if redeemed within 12 months after purchase. Redemptions of Class A shares purchased prior to February 19, 2015, without an initial sales charge in accounts aggregating $1 million to $50 million at the time of purchase, are subject to a CDSC of 1.00% if redeemed within 12 months after purchase, and 0.50% if redeemed more than 12, but less than 18, months after purchase.
Class B shares are not subject to sales charges and will generally convert to Class A shares eight years after purchase. The Fund no longer accepts investments by new or existing investors in the Fund's Class B shares, except in connection with the reinvestment of any dividend and/or capital gain distributions in Class B shares of the Fund and exchanges by existing Class B shareholders of certain other funds within the Columbia Family of Funds.
Class C shares are subject to a 1.00% CDSC on shares redeemed within one year after purchase.
Class R4 shares are not subject to sales charges and are generally available only to omnibus retirement plans and certain investors as described in the Fund's prospectus.
Class R5 shares are not subject to sales charges and are generally available only to investors purchasing through authorized investment professionals and omnibus retirement plans.
Class Z shares are not subject to sales charges and are available only to eligible investors, which are subject to different investment minimums as described in the Fund's prospectus.
Note 2. Summary of Significant Accounting Policies
Basis of Preparation
The Fund is an investment company that applies the accounting and reporting guidance in the Financial Accounting Standards Board (FASB) Accounting Standards Codification Topic 946, Financial Services — Investment Companies (ASC 946). The financial statements are prepared in accordance with U.S. generally accepted accounting principles (GAAP), which requires management to make certain estimates and assumptions that affect the reported amounts of assets and liabilities, the disclosure of contingent assets and liabilities at the date of the financial statements and the reported amounts of income and expenses during the reporting period. Actual results could differ from those estimates.
The following is a summary of significant accounting policies followed by the Fund in the preparation of its financial statements.
Security Valuation
Debt securities generally are valued by pricing services approved by the Board of Trustees (the Board) based upon market transactions for normal, institutional-size trading units of similar securities. The services may use various pricing techniques that take into account, as applicable, factors such as yield, quality, coupon rate, maturity, type of issue, trading characteristics and other data, as well as broker quotes. Debt securities for which quotations are readily available may also be valued based upon an over-the-counter or exchange bid quotation.
Investments in open-end investment companies, including money market funds, are valued at their net asset value.
Short-term securities within 60 days to maturity are valued at amortized cost, which approximates market value. Short-term securities maturing in more than 60 days from the valuation date are valued at the market
Annual Report 2015
36
COLUMBIA SHORT TERM MUNICIPAL BOND FUND
NOTES TO FINANCIAL STATEMENTS (continued)
April 30, 2015
price or approximate market value based on current interest rates.
Investments for which market quotations are not readily available, or that have quotations which management believes are not reliable, are valued at fair value as determined in good faith under procedures established by and under the general supervision of the Board. If a security or class of securities (such as foreign securities) is valued at fair value, such value is likely to be different from the quoted or published price for the security.
The determination of fair value often requires significant judgment. To determine fair value, management may use assumptions including but not limited to future cash flows and estimated risk premiums. Multiple inputs from various sources may be used to determine fair value.
Delayed Delivery Securities
The Fund may trade securities on other than normal settlement terms, including securities purchased or sold on a "when-issued" basis. This may increase risk to the Fund since the other party to the transaction may fail to deliver which could cause the Fund to subsequently invest at less advantageous prices. The Fund designates cash or liquid securities in an amount equal to the delayed delivery commitment.
Security Transactions
Security transactions are accounted for on the trade date. Cost is determined and gains (losses) are based upon the specific identification method for both financial statement and federal income tax purposes.
Income Recognition
Interest income is recorded on an accrual basis. Market premiums and discounts, including original issue discounts, are amortized and accreted, respectively, over the expected life of the security on all debt securities, unless otherwise noted.
The Fund may place a debt security on non-accrual status and reduce related interest income when it becomes probable that the interest will not be collected and the amount of uncollectible interest can be reasonably estimated. A defaulted debt security is removed from non-accrual status when the issuer resumes interest payments or when collectability of interest is reasonably assured.
Dividend income is recorded on the ex-dividend date.
Expenses
General expenses of the Trust are allocated to the Fund and other funds of the Trust based upon relative net assets or other expense allocation methodologies determined by the nature of the expense. Expenses directly attributable to the Fund are charged to the Fund. Expenses directly attributable to a specific class of shares are charged to that share class.
Determination of Class Net Asset Value
All income, expenses (other than class-specific expenses, which are charged to that share class, as shown in the Statement of Operations) and realized and unrealized gains (losses) are allocated to each class of the Fund on a daily basis, based on the relative net assets of each class, for purposes of determining the net asset value of each class.
Federal Income Tax Status
The Fund intends to qualify each year as a regulated investment company under Subchapter M of the Internal Revenue Code, as amended, and will distribute substantially all of its tax exempt and taxable income (including net short-term capital gains), if any, for its tax year, and as such will not be subject to federal income taxes. In addition, the Fund intends to distribute in each calendar year substantially all of its net investment income, capital gains and certain other amounts, if any, such that the Fund should not be subject to federal excise tax. Therefore, no federal income or excise tax provision is recorded.
Distributions to Shareholders
Distributions from net investment income, if any, are declared daily and paid monthly. Net realized capital gains, if any, are distributed at least annually. Income distributions and capital gain distributions are determined in accordance with federal income tax regulations, which may differ from GAAP.
Guarantees and Indemnifications
Under the Trust's organizational documents and, in some cases, by contract, its officers and trustees are indemnified against certain liabilities arising out of the performance of their duties to the Trust or its funds. In addition, certain of the Fund's contracts with its service providers contain general indemnification clauses. The Fund's maximum exposure under these arrangements is unknown since the amount of any future claims that may be made against the Fund cannot be determined, and
Annual Report 2015
37
COLUMBIA SHORT TERM MUNICIPAL BOND FUND
NOTES TO FINANCIAL STATEMENTS (continued)
April 30, 2015
the Fund has no historical basis for predicting the likelihood of any such claims.
Note 3. Fees and Compensation Paid to Affiliates
Investment Management Fees
Under an Investment Management Services Agreement, Columbia Management Investment Advisers, LLC (the Investment Manager), a wholly-owned subsidiary of Ameriprise Financial, Inc. (Ameriprise Financial), determines which securities will be purchased, held or sold. The investment management fee is an annual fee that is equal to a percentage of the Fund's average daily net assets that declines from 0.36% to 0.24% as the Fund's net assets increase. The effective investment management fee rate for the year ended April 30, 2015 was 0.36% of the Fund's average daily net assets.
Administration Fees
Under an Administrative Services Agreement, the Investment Manager also serves as the Fund Administrator. The Fund pays the Fund Administrator an annual fee for administration and accounting services equal to a percentage of the Fund's average daily net assets that declines from 0.07% to 0.04% as the Fund's net assets increase. The effective administration fee rate for the year ended April 30, 2015 was 0.06% of the Fund's average daily net assets.
Other Expenses
Other expenses are for, among other things, miscellaneous expenses of the Fund or the Board, including payments to a company providing limited administrative services to the Fund and the Board. That company's expenses include boardroom and office expense, employee compensation, employee health and retirement benefits, and certain other expenses. For the year ended April 30, 2015, other expenses paid by the Fund to this company were $4,180.
Compensation of Board Members
Board members are compensated for their services to the Fund as disclosed in the Statement of Operations. Under a Deferred Compensation Plan (the Plan), the Board members who are not "interested persons" of the Fund, as defined under the 1940 Act, may elect to defer payment of up to 100% of their compensation. Deferred amounts are treated as though equivalent dollar amounts had been invested in shares of certain funds managed by the Investment Manager. The Fund's liability
for these amounts is adjusted for market value changes and remains in the Fund until distributed in accordance with the Plan.
Transfer Agent Fees
Under a Transfer and Dividend Disbursing Agent Agreement, Columbia Management Investment Services Corp. (the Transfer Agent), an affiliate of the Investment Manager and a wholly-owned subsidiary of Ameriprise Financial, is responsible for providing transfer agency services to the Fund. The Transfer Agent has contracted with Boston Financial Data Services (BFDS) to serve as sub-transfer agent.
Effective November 1, 2014, the Transfer Agent receives a monthly transfer agency fee based on the number or the average value of accounts, depending on the type of account. Prior to November 1, 2014, the Transfer Agent received a monthly account-based service fee based on the number of open accounts. In addition, the Transfer Agent also receives sub-transfer agency fees based on a percentage of the average aggregate value of the Fund's shares maintained in omnibus accounts (other than omnibus accounts for which American Enterprise Investment Services Inc. is the broker of record or accounts where the beneficial shareholder is a customer of Ameriprise Financial Services, Inc., for which the Transfer Agent receives a per account fee). The Transfer Agent pays the fees of BFDS for services as sub-transfer agent and is not entitled to reimbursement for such fees from the Fund (with the exception of out-of-pocket fees).
The Transfer Agent also receives compensation from the Fund for various shareholder services and reimbursements for certain out-of-pocket fees. Total transfer agent fees for Class R5 shares are subject to an annual limitation of not more than 0.05% of the average daily net assets attributable to Class R5 shares.
For the year ended April 30, 2015, the Fund's effective transfer agent fee rates as a percentage of average daily net assets of each class were as follows:
Class A | | | 0.20 | % | |
Class B | | | 0.20 | | |
Class C | | | 0.20 | | |
Class R4 | | | 0.21 | | |
Class R5 | | | 0.05 | | |
Class Z | | | 0.20 | | |
An annual minimum account balance fee of $20 may apply to certain accounts with a value below the applicable share class's initial minimum investment
Annual Report 2015
38
COLUMBIA SHORT TERM MUNICIPAL BOND FUND
NOTES TO FINANCIAL STATEMENTS (continued)
April 30, 2015
requirements to reduce the impact of small accounts on transfer agent fees. These minimum account balance fees are remitted to the Fund and recorded as part of expense reductions in the Statement of Operations. For the year ended April 30, 2015, these minimum account balance fees reduced total expenses of the Fund by $20.
Distribution and Service Fees
The Fund has an agreement with Columbia Management Investment Distributors, Inc. (the Distributor), an affiliate of the Investment Manager and a wholly-owned subsidiary of Ameriprise Financial, for distribution and shareholder services. The Board has approved, and the Fund has adopted, distribution and shareholder service plans (the Plans) applicable to certain share classes, which set the distribution and service fees for the Fund. These fees are calculated daily and are intended to compensate the Distributor and/or eligible selling and/or servicing agents for selling shares of the Fund and providing services to investors.
Under the Plans, the Fund pays a monthly combined distribution and service fee to the Distributor at the maximum annual rate of 0.25% of the average daily net assets attributable to Class A shares of the Fund. Also under the Plans, the Fund pays a monthly service fee at the maximum annual rate of 0.25% of the average daily net assets attributable to Class B and Class C shares of the Fund and the payment of a monthly distribution fee at the maximum annual rate of 0.75% of the average daily net assets attributable to Class B and Class C shares of the Fund.
Sales Charges
Sales charges, including front-end charges and CDSCs, received by the Distributor for distributing Fund shares were $30,338 for Class A and $5,949 for Class C shares for the year ended April 30, 2015.
Expenses Waived/Reimbursed by the Investment Manager and its Affiliates
The Investment Manager and certain of its affiliates have contractually agreed to waive fees and/or reimburse expenses (excluding certain fees and expenses described below) for the period disclosed below, unless sooner terminated at the sole discretion of the Board, so that the Fund's net operating expenses, after giving effect to fees waived/expenses reimbursed and any balance credits and/or overdraft charges from the Fund's
custodian, do not exceed the following annual rates as a percentage of the class' average daily net assets:
| | | Fee Rates Contractual
through
August 31, 2015 | |
Class A | | | 0.73 | % | |
Class B | | | 1.48 | | |
Class C | | | 1.48 | | |
Class R4 | | | 0.48 | | |
Class R5 | | | 0.38 | | |
Class Z | | | 0.48 | | |
Under the agreement governing these fee waivers and/or expense reimbursement arrangements, the following fees and expenses are excluded from the waiver/reimbursement commitment, and therefore will be paid by the Fund, if applicable: taxes (including foreign transaction taxes), expenses associated with investments in affiliated and non-affiliated pooled investment vehicles (including mutual funds and exchange-traded funds), transaction costs and brokerage commissions, costs related to any securities lending program, dividend expenses associated with securities sold short, inverse floater program fees and expenses, transaction charges and interest on borrowed money, interest, extraordinary expenses and any other expenses the exclusion of which is specifically approved by the Board. Any fees waived and/or expenses reimbursed under the expense reimbursement arrangements described above are not recoverable by the Investment Manager or its affiliates in future periods. This agreement may be modified or amended only with approval from all parties.
Note 4. Federal Tax Information
The timing and character of income and capital gain distributions are determined in accordance with income tax regulations, which may differ from GAAP because of temporary or permanent book to tax differences.
At April 30, 2015, these differences are primarily due to differing treatment for capital loss carryforwards, Trustees' deferred compensation and distributions. To the extent these differences are permanent, reclassifications are made among the components of the Fund's net assets in the Statement of Assets and Liabilities. Temporary differences do not require reclassifications. In the Statement of Assets and Liabilities the following reclassifications were made:
Accumulated net realized loss | | $ | 1,181,270 | | |
Paid-in capital | | | (1,181,270 | ) | |
Annual Report 2015
39
COLUMBIA SHORT TERM MUNICIPAL BOND FUND
NOTES TO FINANCIAL STATEMENTS (continued)
April 30, 2015
Net investment income (loss) and net realized gains (losses), as disclosed in the Statement of Operations, and net assets were not affected by this reclassification.
The tax character of distributions paid during the years indicated was as follows:
Year Ended April 30, | | 2015 | | 2014 | |
Ordinary income | | $ | 314 | | | $ | 674 | | |
Tax-exempt income | | | 20,594,302 | | | | 22,968,417 | | |
Total | | $ | 20,594,616 | | | $ | 22,969,091 | | |
Short-term capital gain distributions, if any, are considered ordinary income distributions for tax purposes.
At April 30, 2015, the components of distributable earnings on a tax basis were as follows:
Undistributed tax-exempt income | | $ | 3,887,563 | | |
Capital loss carryforwards | | | (1,137,158 | ) | |
Net unrealized appreciation | | | 6,910,421 | | |
At April 30, 2015, the cost of investments for federal income tax purposes was $1,846,686,562 and the aggregate gross unrealized appreciation and depreciation based on that cost was:
Unrealized appreciation | | $ | 9,750,594 | | |
Unrealized depreciation | | | (2,840,173 | ) | |
Net unrealized appreciation | | $ | 6,910,421 | | |
The following capital loss carryforwards, determined at April 30, 2015, may be available to reduce taxable income arising from future net realized gains on investments, if any, to the extent permitted by the Internal Revenue Code:
Year of Expiration | | Amount ($) | |
2018 | | | 602,849 | | |
No expiration — long-term | | | 534,309 | | |
Total | | | 1,137,158 | | |
Capital loss carryforwards with no expiration are required to be utilized prior to any capital losses which carry an expiration date. As a result of this ordering rule, capital loss carryforwards which carry an expiration date may be more likely to expire unused.
For the year ended April 30, 2015, $305,753 of capital loss carryforward was utilized and $1,181,270 expired unused.
Management of the Fund has concluded that there are no significant uncertain tax positions in the Fund that would require recognition in the financial statements. However, management's conclusion may be subject to
review and adjustment at a later date based on factors including, but not limited to, new tax laws, regulations, and administrative interpretations (including relevant court decisions). Generally, the Fund's federal tax returns for the prior three fiscal years remain subject to examination by the Internal Revenue Service.
Note 5. Portfolio Information
The cost of purchases and proceeds from sales of securities, excluding short-term investments and derivatives, if any, aggregated to $486,373,432 and $760,657,533, respectively, for the year ended April 30, 2015. The amount of purchase and sale activity impacts the portfolio turnover rate reported in the Financial Highlights.
Note 6. Shareholder Concentration
At April 30, 2015, one unaffiliated shareholder of record owned 85.7% of the outstanding shares of the Fund in one or more accounts. The Fund has no knowledge about whether any portion of those shares was owned beneficially. Subscription and redemption activity by concentrated accounts may have a significant effect on the operations of the Fund.
Note 7. Line of Credit
The Fund has entered into a revolving credit facility with a syndicate of banks led by JPMorgan Chase Bank, N.A. whereby the Fund may borrow for the temporary funding of shareholder redemptions or for other temporary or emergency purposes. Pursuant to a December 9, 2014 amendment, the credit facility agreement, which is a collective agreement between the Fund and certain other funds managed by the Investment Manager, severally and not jointly, permits collective borrowings up to $550 million. Interest is charged to each participating fund based on its borrowings at a rate equal to the higher of (i) the overnight federal funds rate plus 1.00% or (ii) the one-month LIBOR rate plus 1.00%. Each borrowing under the credit facility matures no later than 60 days after the date of borrowing. The Fund also pays a commitment fee equal to its pro rata share of the amount of the credit facility at a rate of 0.075% per annum. The commitment fee is included in other expenses in the Statement of Operations. Prior to the December 9, 2014 amendment, the credit facility agreement permitted borrowings up to $500 million under the same terms and interest rates as described above.
The Fund had no borrowings during the year ended April 30, 2015.
Annual Report 2015
40
COLUMBIA SHORT TERM MUNICIPAL BOND FUND
NOTES TO FINANCIAL STATEMENTS (continued)
April 30, 2015
Note 8. Significant Risks
Credit Risk
Credit risk is the risk that the value of debt securities in the Fund's portfolio may decline because the issuer may default and fail to pay interest or repay principal when due. Rating agencies assign credit ratings to debt securities to indicate their credit risk. Lower rated or unrated debt securities held by the Fund may present increased credit risk as compared to higher-rated debt securities.
Interest Rate Risk
Interest rate risk is the risk of losses attributable to changes in interest rates. In general, if prevailing interest rates rise, the values of debt securities tend to fall, and if interest rates fall, the values of debt securities tend to rise. Actions by governments and central banking authorities can result in increases in interest rates. Increasing interest rates may negatively affect the value of debt securities held by the Fund, resulting in a negative impact on the Fund's performance and net asset value per share. In general, the longer the maturity or duration of a debt security, the greater its sensitivity to changes in interest rates.
Liquidity Risk
Liquidity risk is the risk associated with a lack of marketability of investments which may make it difficult to sell the investment at a desirable time or price. Changing regulatory, market or other conditions or environments (for example, the interest rate or credit environments) may adversely affect the liquidity of the Fund's investments. The Fund may have to accept a lower selling price for the holding, sell other investments, or forego another, more appealing investment opportunity. Generally, the less liquid the market at the time the Fund sells a portfolio investment, the greater the risk of loss or decline of value to the Fund. A less liquid market can lead to an increase in Fund redemptions, which may negatively impact Fund performance and net asset value per share, including, for example, if the Fund is forced to sell securities in a down market.
Municipal Securities Risk
Securities issued by a particular state and its instrumentalities are subject to the risk of unfavorable developments in such state. A municipal security can be significantly affected by adverse tax, legislative, regulatory, demographic or political changes as well as
changes in a particular state's (state and its instrumentalities') financial, economic or other condition and prospects.
Note 9. Subsequent Events
Management has evaluated the events and transactions that have occurred through the date the financial statements were issued and noted no items requiring adjustment of the financial statements or additional disclosure.
Note 10. Information Regarding Pending and Settled Legal Proceedings
In December 2005, without admitting or denying the allegations, American Express Financial Corporation (AEFC, which is now known as Ameriprise Financial, Inc. (Ameriprise Financial)) entered into settlement agreements with the Securities and Exchange Commission (SEC) and Minnesota Department of Commerce (MDOC) related to market timing activities. As a result, AEFC was censured and ordered to cease and desist from committing or causing any violations of certain provisions of the Investment Advisers Act of 1940, the Investment Company Act of 1940, and various Minnesota laws. AEFC agreed to pay disgorgement of $10 million and civil money penalties of $7 million. AEFC also agreed to retain an independent distribution consultant to assist in developing a plan for distribution of all disgorgement and civil penalties ordered by the SEC in accordance with various undertakings detailed at www.sec.gov/litigation/admin/ia-2451.pdf. Ameriprise Financial and its affiliates have cooperated with the SEC and the MDOC in these legal proceedings, and have made regular reports to the Funds' Boards of Trustees.
Ameriprise Financial and certain of its affiliates have historically been involved in a number of legal, arbitration and regulatory proceedings, including routine litigation, class actions, and governmental actions, concerning matters arising in connection with the conduct of their business activities. Ameriprise Financial believes that the Funds are not currently the subject of, and that neither Ameriprise Financial nor any of its affiliates are the subject of, any pending legal, arbitration or regulatory proceedings that are likely to have a material adverse effect on the Funds or the ability of Ameriprise Financial or its affiliates to perform under their contracts with the Funds. Ameriprise Financial is required to make quarterly (10-Q), annual (10-K) and, as necessary, 8-K filings with the Securities and Exchange Commission on legal and regulatory matters that relate to Ameriprise
Annual Report 2015
41
COLUMBIA SHORT TERM MUNICIPAL BOND FUND
NOTES TO FINANCIAL STATEMENTS (continued)
April 30, 2015
Financial and its affiliates. Copies of these filings may be obtained by accessing the SEC website at www.sec.gov.
There can be no assurance that these matters, or the adverse publicity associated with them, will not result in increased fund redemptions, reduced sale of fund shares or other adverse consequences to the Funds. Further, although we believe proceedings are not likely to have a material adverse effect on the Funds or the ability of Ameriprise Financial or its affiliates to perform under their contracts with the Funds, these proceedings are subject to uncertainties and, as such, we are unable to estimate the possible loss or range of loss that may result. An adverse outcome in one or more of these proceedings could result in adverse judgments, settlements, fines, penalties or other relief that could have a material adverse effect on the consolidated financial condition or results of operations of Ameriprise Financial.
Annual Report 2015
42
COLUMBIA SHORT TERM MUNICIPAL BOND FUND
REPORT OF INDEPENDENT REGISTERED PUBLIC ACCOUNTING FIRM
To the Trustees of Columbia Funds Series Trust and the Shareholders of
Columbia Short Term Municipal Bond Fund
In our opinion, the accompanying statement of assets and liabilities, including the portfolio of investments, and the related statements of operations and of changes in net assets and the financial highlights present fairly, in all material respects, the financial position of Columbia Short Term Municipal Bond Fund (the "Fund", a series of Columbia Funds Series Trust) at April 30, 2015, and the results of its operations, the changes in its net assets and the financial highlights for each of the periods indicated, in conformity with accounting principles generally accepted in the United States of America. These financial statements and financial highlights (hereafter referred to as "financial statements") are the responsibility of the Fund's management. Our responsibility is to express an opinion on these financial statements based on our audits. We conducted our audits of these financial statements in accordance with the standards of the Public Company Accounting Oversight Board (United States). Those standards require that we plan and perform the audit to obtain reasonable assurance about whether the financial statements are free of material misstatement. An audit includes examining, on a test basis, evidence supporting the amounts and disclosures in the financial statements, assessing the accounting principles used and significant estimates made by management, and evaluating the overall financial statement presentation. We believe that our audits, which included confirmation of securities at April 30, 2015 by correspondence with the custodian and brokers, and the application of alternative auditing procedures where such confirmations had not been received, provide a reasonable basis for our opinion.
PricewaterhouseCoopers LLP
Minneapolis, Minnesota
June 19, 2015
Annual Report 2015
43
COLUMBIA SHORT TERM MUNICIPAL BOND FUND
FEDERAL INCOME TAX INFORMATION
(Unaudited)
The Fund hereby designates the following tax attributes for the fiscal year ended April 30, 2015. Shareholders will be notified in early 2016 of the amounts for use in preparing 2015 income tax returns.
Tax Designations:
| Exempt-Interest Dividends | | | 100.00 | % | |
Exempt-Interest Dividends. The percentage of net investment income distributed during the fiscal year that qualifies as exempt-interest dividends for federal income tax purposes. A portion of the income may be subject to federal alternative minimum tax.
Annual Report 2015
44
COLUMBIA SHORT TERM MUNICIPAL BOND FUND
Shareholders elect the Board that oversees the Funds' operations. The Board appoints officers who are responsible for day-to-day business decisions based on policies set by the Board. The following table provides basic biographical information about the Funds' Board members, including their principal occupations during the past five years, although specific titles for individuals may have varied over the period. Under current Board policy, members may serve through the end of the calendar year in which he or she reaches either the mandatory retirement age established by the Board or the fifteenth anniversary of the first Board meeting they attended as a member of the Board.
Independent Trustees
Name,
Address,
Year of Birth | | Position Held With
Funds and Length of
Service | | Principal Occupation(s)
During Past Five Years
and Other Relevant
Professional Experience | | Number of
Funds in the
Fund Family
Overseen by
Board Member | | Other Present or Past
Directorships/
Trusteeships
(Within Past 5 Years) | |
Kathleen Blatz
901 S. Marquette Ave.
Minneapolis, MN 55402
1954 | | Board member since 1/06 for RiverSource Funds and since 6/11 for Nations Funds | | Attorney; specializing in arbitration and mediation; Chief Justice, Minnesota Supreme Court, 1998-2006; Associate Justice, Minnesota Supreme Court, 1996-1998; Fourth Judicial District Court Judge, Hennepin County, 1994-1996; Attorney in private practice and public service, 1984-1993; State Representative, Minnesota House of Representatives, 1979-1993, which included service on the Tax and Financial Institutions and Insurance Committees | | | 127 | | | Trustee, BlueCross BlueShield of Minnesota (Chair of the Business Development Committee) since 2009; Chair of the Robina Foundation since August 2013 | |
Edward J. Boudreau, Jr.
901 S. Marquette Ave.
Minneapolis, MN 55402
1944 | | Board member since 6/11 for RiverSource Funds and since 1/05 for Nations Funds | | Managing Director, E.J. Boudreau & Associates (consulting) since 2000; FINRA Industry Arbitrator, 2002-present; Chairman and Chief Executive Officer, John Hancock Funds (asset management), Chairman and Interested Trustee for open-end and closed-end funds offered by John Hancock, 1989-2000; John Hancock Life Insurance Company, including SVP and Treasurer and SVP Information Technology, 1968-1988 | | | 125 | | | Former Trustee, BofA Funds Series Trust (11 funds), 2005-2011; Trustee, Boston Museum of Science (Chair of Finance Committee), 1985-2013 | |
Pamela G. Carlton
901 S. Marquette Ave.
Minneapolis, MN 55402
1954 | | Board member since 7/07 for RiverSource Funds and since 6/11 for Nations Funds | | President, Springboard — Partners in Cross Cultural Leadership (consulting company) since 2003; Managing Director of US Equity Research, JP Morgan Chase, 1999-2003; Director of US Equity Research, Chase Asset Management, 1996-1999; Co-Director Latin America Research, 1993-1996, COO Global Research, 1992-1996, Co-Director of US Research, 1991-1992, Investment Banker, Morgan Stanley, 1982-1991 | | | 127 | | | None | |
Annual Report 2015
45
COLUMBIA SHORT TERM MUNICIPAL BOND FUND
TRUSTEES AND OFFICERS (continued)
Independent Trustees (continued)
Name,
Address,
Year of Birth | | Position Held With
Funds and Length of
Service | | Principal Occupation(s)
During Past Five Years
and Other Relevant
Professional Experience | | Number of
Funds in the
Fund Family
Overseen by
Board Member | | Other Present or Past
Directorships/
Trusteeships
(Within Past 5 Years) | |
William P. Carmichael
901 S. Marquette Ave.
Minneapolis, MN 55402
1943 | | Chair of the Board since 1/14, Board member since 6/11 for RiverSource Funds and since 2003 for Nations Funds | | Retired; Co-founder, The Succession Fund (provides exit strategies to owners of privately held companies) 1998-2007; Adjunct Professor of Finances, Kelley School of Business, Indiana University, 1993-2007; Senior Vice President, Sara Lee Corporation, 1991-1993; Senior Vice President and Chief Financial Officer, Beatrice Foods Company, 1984-1990; Vice President, Esmark, Inc., 1973-1984; Associate, Price Waterhouse, 1968-1972 | | | 127 | | | Director, Cobra Electronics Corporation (electronic equipment manufacturer), 1994-August 2014; The Finish Line (athletic shoes and apparel) since July 2003; Director, International Textile Corp. since 2012; former Director, McMoRan Exploration Company (oil and gas exploration and development) 2010-2013; former Trustee, BofA Funds Series Trust (11 funds) 2009-2011; Director, Spectrum Brands, Inc. (consumer products), 2002-2009; Director, Simmons Company (bedding), 2004-2010 | |
Patricia M. Flynn
901 S. Marquette Ave.
Minneapolis, MN 55402
1950 | | Board member since 11/04 for RiverSource Funds and since 6/11 for Nations Funds | | Trustee Professor of Economics and Management, Bentley University since 1976 (also teaches and conducts research on corporate governance); Dean, McCallum Graduate School of Business, Bentley University, 1992-2002 | | | 127 | | | Trustee, MA Taxpayers Foundation since 1997; Board of Governors, Innovation Institute, MA Technology Collaborative since 2010 | |
William A. Hawkins
901 S. Marquette Ave.
Minneapolis, MN 55402
1942 | | Board member since 6/11 for RiverSource Funds and since 1/05 for Nations Funds | | Managing Director, Overton Partners (financial consulting), since August 2010; President and Chief Executive Officer, California General Bank, N.A., January 2008-August 2010; Operation Hope, COO, 2004-2007; IndyMac Bancorp, President, CBG, 1999-2003; American General Bank, President, 1997-1999; Griffin Financial Services, CEO, 1981-1997; The Griffin Funds, CEO, 1992-1998 | | | 125 | | | Trustee, BofA Funds Series Trust (11 funds) | |
R. Glenn Hilliard
901 S. Marquette Ave.
Minneapolis, MN 55402
1943 | | Board member since 6/11 for RiverSource Funds and since 1/05 for Nations Funds | | Chairman and Chief Executive Officer, Hilliard Group LLC (investing and consulting) since April 2003; Non-Executive Director & Chairman, CNO Financial Group, Inc. (insurance), September 2003-May 2011 | | | 125 | | | Chairman, BofA Funds Series Trust (11 funds); former Director, CNO Financial Group, Inc. (insurance) 2003-2011 | |
Annual Report 2015
46
COLUMBIA SHORT TERM MUNICIPAL BOND FUND
TRUSTEES AND OFFICERS (continued)
Independent Trustees (continued)
Name,
Address,
Year of Birth | | Position Held With
Funds and Length of
Service | | Principal Occupation(s)
During Past Five Years
and Other Relevant
Professional Experience | | Number of
Funds in the
Fund Family
Overseen by
Board Member | | Other Present or Past
Directorships/
Trusteeships
(Within Past 5 Years) | |
Catherine James Paglia
901 S. Marquette Ave.
Minneapolis, MN 55402
1952 | | Board member since 11/04 for RiverSource Funds and since 6/11 for Nations Funds | | Director, Enterprise Asset Management, Inc. (private real estate and asset management company) since September 1998; Managing Director and Partner, Interlaken Capital, Inc., 1989-1997; Managing Director, Morgan Stanley, 1982-1989; Vice President, Investment Banking, 1980-1982, Associate, Investment Banking, 1976-1980, Dean Witter Reynolds, Inc. | | | 127 | | | Director, Valmont Industries, Inc. (irrigation systems manufacturer) since 2012; Trustee, Carleton College (on the Investment Committee); Trustee, Carnegie Endowment for International Peace (on the Investment Committee) | |
Leroy C. Richie
901 S. Marquette Ave.
Minneapolis, MN 55402
1941 | | Board member since 2000 for Seligman Funds, since 11/08 for RiverSource Funds and since 6/11 for Nations Funds | | Counsel, Lewis & Munday, P.C. (law firm) since 2004; Vice President and General Counsel, Automotive Legal Affairs, Chrysler Corporation, 1993-1997 | | | 127 | | | Lead Outside Director, Digital Ally, Inc. (digital imaging) since September 2005; Director, Infinity, Inc. (oil and gas exploration and production) since 1994; Director, OGE Energy Corp. (energy and energy services) 2007-2014 | |
Minor M. Shaw
901 S. Marquette Ave.
Minneapolis, MN 55402
1947 | | Board member since 6/11 for RiverSource Funds and since 2003 for Nations Funds | | President, Micco LLC (private investments) since 2011; President, Micco Corp. (family investment business) 1998-2011 | | | 125 | | | Director, Piedmont Natural Gas; Director, BlueCross BlueShield of South Carolina since April 2008; Chair of the Duke Endowment; Director, National Association of Corporate Directors, Carolinas Chapter, since 2013; Chair of Greenville-Spartanburg Airport Commission; former Trustee, BofA Funds Series Trust (11 funds), 2003-2011 | |
Alison Taunton-Rigby
901 S. Marquette Ave.
Minneapolis, MN 55402
1944 | | Board member since 11/02 for RiverSource Funds and since 6/11 for Nations Funds | | Managing Director, Forester Biotech (consulting) since 2001; Chief Executive Officer and Director, RiboNovix, Inc., (biotechnology) 2003-2010; President and Chief Executive Officer of CMT Inc., 2001-2003; Aquila Biopharmaceuticals Inc., 1996-2000; Cambridge Biotech Corporation, 1995-1996, Mitotix Inc., 1993-1994 | | | 127 | | | Director, Healthways, Inc. (health and well-being solutions) since 2005; Director, ICI Mutual Insurance Company, since 2011; Director, Abt Associates (government contractor) since 2001; Director, Boston Children's Hospital since 2002 | |
Annual Report 2015
47
COLUMBIA SHORT TERM MUNICIPAL BOND FUND
TRUSTEES AND OFFICERS (continued)
Interested Trustee Not Affiliated with Investment Manager*
Name,
Address,
Year of Birth | | Position Held With
Funds and Length of
Service | | Principal Occupation
During Past Five Years | | Number of
Funds in the
Fund Family
Overseen by
Board Member | | Other Present or Past
Directorships/
Trusteeships
(Within Past 5 Years) | |
Anthony M. Santomero
901 S. Marquette Ave.
Minneapolis, MN 55402
1946 | | Board member since 6/11 for RiverSource Funds and since 1/08 for Nations Funds | | Richard K. Mellon Professor Emeritus of Finance, The Wharton School, University of Pennsylvania, since 2002; Senior Advisor, McKinsey & Company (consulting), 2006-2008; President, Federal Reserve Bank of Philadelphia, 2000-2006, Professor of Finance, The Wharton School, University of Pennsylvania, 1972-2002 | | | 125 | | | Director, Renaissance Reinsurance Ltd. since May 2008; Trustee, Penn Mutual Life Insurance Company since March 2008; Director, Citigroup Inc. since 2009; Director, Citibank, N.A. since 2009; former Trustee, BofA Funds Series Trust (11 funds), 2008-2011 | |
* Dr. Santomero is not an affiliated person of the Investment Manager or Ameriprise Financial. However, he is currently deemed by the Funds to be an "interested person" (as defined in the 1940 Act) of the Funds because he serves as a Director of Citigroup Inc. and Citibank, N.A., companies that may directly or through subsidiaries and affiliates engage from time-to-time in brokerage execution, principal transactions and lending relationships with the Funds or accounts advised/managed by the Investment Manager.
Annual Report 2015
48
COLUMBIA SHORT TERM MUNICIPAL BOND FUND
TRUSTEES AND OFFICERS (continued)
Interested Trustee Affiliated with Investment Manager*
Name,
Address,
Year of Birth | | Position Held With
Funds and Length of
Service | | Principal Occupation
During Past Five Years | | Number of
Funds in the
Fund Family
Overseen by
Board Member | | Other Present or Past
Directorships/
Trusteeships
(Within Past 5 Years) | |
William F. Truscott
53600 Ameriprise
Financial Center
Minneapolis, MN 55474
1960 | | Board member since 11/01 for RiverSource Funds and since 6/11 for Nations Funds; Senior Vice President since 2002 for RiverSource Funds and since 5/10 for Nations Funds | | Chairman of the Board and President, Columbia Management Investment Advisers, LLC since May 2010 and February 2012, respectively (previously President and Chief Investment Officer, 2001-April 2010); Chief Executive Officer, Global Asset Management, Ameriprise Financial, Inc. since September 2012 (previously Chief Executive Officer, U.S. Asset Management & President, Annuities, May 2010-September 2012 and President — U.S. Asset Management and Chief Investment Officer, 2005-April 2010); Director and Chief Executive Officer, Columbia Management Investment Distributors, Inc. since May 2010 and February 2012, respectively (previously Chairman of the Board and Chief Executive Officer, 2006-April 2010); Chairman of the Board and Chief Executive Officer, RiverSource Distributors, Inc. since 2006; Director, Threadneedle Asset Management Holdings, SARL since 2014; President and Chief Executive Officer, Ameriprise Certificate Company, 2006-August 2012 | | | 186 | | | Former Director, Ameriprise Certificate Company, 2006-January 2013 | |
* Interested person (as defined under the 1940 Act) by reason of being an officer, director, security holder and/or employee of the Investment Manager or Ameriprise Financial.
The Statement of Additional Information has additional information about the Fund's Board members and is available, without charge, upon request by calling 800.345.6611; contacting your financial intermediary or visiting columbiathreadneedle.com/us.
Annual Report 2015
49
COLUMBIA SHORT TERM MUNICIPAL BOND FUND
TRUSTEES AND OFFICERS (continued)
The Board has appointed officers who are responsible for day-to-day business decisions based on policies it has established. The officers serve at the pleasure of the Board. In addition to Mr. Truscott, who is Senior Vice President, the Funds' other officers are:
Fund Officers
Name,
Address and
Year of Birth | | Position and Year
First Appointed to
Position for any Fund
in the Columbia
Funds Complex or a
Predecessor Thereof | | Principal Occupation(s) During Past Five Years | |
Christopher O. Petersen
5228 Ameriprise
Financial Center
Minneapolis, MN 55474
Born 1970 | | President and Principal Executive Officer (2015) | | Vice President and Lead Chief Counsel, Ameriprise Financial, Inc. since January 2015 (previously, Vice President and Chief Counsel January 2010-December 2014; and Vice President and Group Counsel or Counsel 2004-January 2010); officer of Columbia Funds and affiliated funds since 2007. | |
Michael G. Clarke
225 Franklin Street
Boston, MA 02110
Born 1969 | | Treasurer (2011) and Chief Financial Officer (2009) | | Vice President — Mutual Fund Administration, Columbia Management Investment Advisers, LLC, since May 2010; Managing Director of Fund Administration, Columbia Management Advisors, LLC, September 2004-April 2010; senior officer of Columbia Funds and affiliated funds since 2002. | |
Paul B. Goucher
100 Park Avenue
New York, NY 10017
Born 1968 | | Senior Vice President (2011), Chief Legal Officer (2015) and Assistant Secretary (2008) | | Vice President and Lead Chief Counsel, Ameriprise Financial, Inc. since November 2008 and January 2013, respectively (previously Chief Counsel, January 2010-January 2013 and Group Counsel, November 2008-January 2010). | |
Thomas P. McGuire
225 Franklin Street
Boston, MA 02110
Born 1972 | | Vice President and Chief Compliance Officer (2012) | | Vice President — Asset Management Compliance, Ameriprise Financial, Inc., since May 2010; Chief Compliance Officer, Ameriprise Certificate Company since September 2010; Compliance Executive, Bank of America, 2005-April 2010. | |
Colin Moore
225 Franklin Street
Boston, MA 02110
Born 1958 | | Senior Vice President (2010) | | Executive Vice President and Global Chief Investment Officer, Ameriprise Financial, Inc., since July 2013; Director and Global Chief Investment Officer, Columbia Management Investment Advisers, LLC since May 2010; Manager, Managing Director and Chief Investment Officer, Columbia Management Advisors, LLC, 2007-April 2010. | |
Michael E. DeFao
225 Franklin Street
Boston, MA 02110
Born 1968 | | Vice President (2011) and Assistant Secretary (2010) | | Vice President and Chief Counsel, Ameriprise Financial, Inc. since May 2010; Associate General Counsel, Bank of America, 2005-April 2010. | |
Joseph F. DiMaria
225 Franklin Street
Boston, MA 02110
Born 1968 | | Vice President (2011), Assistant Treasurer (2012) and Chief Accounting Officer (2008) | | Vice President — Mutual Fund Treasurer, Columbia Management Investment Advisers, LLC since May 2010; Director of Fund Administration, Columbia Management Advisors, LLC, 2006-April 2010. | |
Amy Johnson
5228 Ameriprise
Financial Center
Minneapolis, MN 55474
Born 1965 | | Vice President (2006) | | Managing Director and Chief Operating Officer, Columbia Management Investment Advisers, LLC since May 2010 (previously Chief Administrative Officer, 2009-April 2010, and Vice President — Asset Management and Trust Company Services, 2006-2009). | |
Lyn Kephart-Strong
5228 Ameriprise
Financial Center
Minneapolis, MN 55474
Born 1960 | | Vice President (2015) | | President, Columbia Management Investment Services Corp. since October 2014; Vice President & Resolution Officer, Ameriprise Trust Company since August 2009; President, RiverSource Service Corporation 2004-2010. | |
Ryan C. Larrenaga
225 Franklin Street
Boston, MA 02110
Born 1970 | | Vice President and Secretary (2015) | | Vice President and Group Counsel, Ameriprise Financial, Inc. since August 2011 (previously, Counsel from May 2010 to August 2011); Assistant General Counsel, Bank of America, 2005-April 2010; officer of Columbia Funds and affiliated funds since 2005. | |
Annual Report 2015
50
COLUMBIA SHORT TERM MUNICIPAL BOND FUND
APPROVAL OF INVESTMENT MANAGEMENT SERVICES AGREEMENT
Columbia Management Investment Advisers, LLC (Columbia Management or the Investment Manager), a wholly-owned subsidiary of Ameriprise Financial, Inc. (Ameriprise Financial), serves as the investment manager to Columbia Short Term Municipal Bond Fund (the Fund). Under an investment management services agreement (the IMS Agreement), Columbia Management provides investment advice and other services to the Fund and other funds distributed by Columbia Management Investment Distributors, Inc. (collectively, the Funds).
The Fund's Board of Trustees (the Board), including the independent Board members (the Independent Trustees), considered the renewal of the IMS Agreement for a two-month period (Short-Term Period) in order to align the IMS Agreement with the review cycle of other funds in the Columbia family of funds. Columbia Management prepared detailed reports for the Board and its Contracts Committee in January, March and April 2015, including reports based on analyses of data provided by an independent organization (Lipper) and a comprehensive response to each item of information requested by independent legal counsel to the Independent Trustees (Independent Legal Counsel) in a letter to the Investment Manager, to assist the Board in making this determination. In addition, throughout the year, the Board (or its committees) regularly meets with portfolio management teams and senior management personnel, and reviews information prepared by Columbia Management addressing the services Columbia Management provides and Fund performance. The Board also accords appropriate weight to the work, deliberations and conclusions of the Contracts Committee, the Investment Review Committee and the Compliance Committee in determining whether to continue the IMS Agreement.
The Board, at its April 13-15, 2015 in-person Board meeting (the April Meeting), considered the renewal of the IMS Agreement for the Short-Term Period. At the April Meeting, Independent Legal Counsel reviewed with the Independent Trustees various factors relevant to the Board's consideration of advisory agreements and the Board's legal responsibilities related to such consideration. Following an analysis and discussion of the factors identified below, the Board, including all of the Independent Trustees, approved the renewal of the IMS Agreement for the Short-Term Period.
Nature, Extent and Quality of Services Provided by Columbia Management
The Independent Trustees analyzed various reports and presentations they had received detailing the services performed by Columbia Management, as well as its expertise, resources and capabilities. The Independent Trustees specifically considered many developments during the past year concerning the services provided by Columbia Management. The Independent Trustees noted the information they received concerning Columbia Management's ability to retain its key portfolio management personnel. In evaluating the quality of services provided under the IMS Agreement and the Fund's Administrative Services Agreement, the Independent Trustees also took into account the organization and strength of the Fund's and its service providers' compliance programs. In addition, the Board also reviewed the financial condition of Columbia Management (and its affiliates) and each entity's ability to carry out its responsibilities under the IMS Agreement and the Fund's other services agreements with affiliates of Ameriprise Financial, observing the financial strength of Ameriprise Financial, with its solid balance sheet. The Board also discussed the acceptability of the terms of the IMS Agreement for the Short-Term Period.
Based on the foregoing, and based on other information received (both oral and written, including the information on investment performance referenced below) and other considerations, the Board concluded that the services being performed by Columbia Management and its affiliates were acceptable for the Short-Term Period.
Investment Performance
For purposes of evaluating the nature, extent and quality of services provided under the IMS Agreement, the Board carefully reviewed the investment performance of the Fund. In this regard, the Board considered detailed reports providing the results of analyses performed by an independent organization showing, for various periods, the performance of the Fund, the performance of a benchmark index, the percentage ranking of the Fund among its comparison group and the net assets of the Fund. The Board observed that for purposes of approving the IMS Agreement for the Short-Term Period, the Fund's performance was acceptable.
Annual Report 2015
51
COLUMBIA SHORT TERM MUNICIPAL BOND FUND
APPROVAL OF INVESTMENT MANAGEMENT SERVICES AGREEMENT (continued)
Comparative Fees, Costs of Services Provided and the Profits Realized By Columbia Management and its Affiliates from their Relationships with the Fund
The Board reviewed comparative fees and the costs of services provided under the IMS Agreement. The Board members considered detailed comparative information set forth in an annual report on fees and expenses, including, among other things, data (based on analyses conducted by an independent organization) showing a comparison of the Fund's expenses with median expenses paid by funds in its comparative peer universe, as well as data showing the Fund's contribution to Columbia Management's profitability.
The Board accorded particular weight to the notion that the level of fees should reflect a rational pricing model applied consistently across the various product lines in the Fund family, while assuring that the overall fees for each Fund (with few defined exceptions) are generally in line with the "pricing philosophy" currently in effect (i.e., that the total expense ratio of the Fund is no higher than the median expense ratio of funds in the same comparison universe of the Fund).
The Board also considered the expected profitability of Columbia Management and its affiliates in connection with Columbia Management providing investment management services to the Fund. In this regard, the Board referred to a detailed profitability report, discussing the profitability to Columbia Management and Ameriprise Financial from managing, operating and distributing the Funds. For purposes of approving the IMS Agreement for the Short-Term Period, the Board concluded that the investment management service fees were fair and reasonable, observing that the profitability levels also seemed reasonable.
Economies of Scale to be Realized
The Board also considered the economies of scale that might be realized by Columbia Management as the Fund grows and took note of the extent to which Fund shareholders might also benefit from such growth. In this regard, the Independent Trustees took into account that IMS fees decline as Fund assets exceed various breakpoints.
Based on the foregoing, the Board, including all of the Independent Trustees, concluded that, for purposes of its consideration of the renewal of the IMS Agreement for the Short-Term Period, the investment management service fees were fair and reasonable in light of the extent and quality of services provided. In reaching this conclusion, no single factor was determinative. The Board noted its understanding that it would undertake the full consideration of renewal of the IMS Agreement for the full annual period at its June 2015 meetings. On April 15, 2015, the Board, including all of the Independent Trustees, approved the renewal of the IMS Agreement for the Short-Term Period.
Annual Report 2015
52
COLUMBIA SHORT TERM MUNICIPAL BOND FUND
IMPORTANT INFORMATION ABOUT THIS REPORT
Each fund mails one shareholder report to each shareholder address. If you would like more than one report, please call shareholder services at 800.345.6611 and additional reports will be sent to you.
The policy of the Board is to vote the proxies of the companies in which each fund holds investments consistent with the procedures as stated in the Statement of Additional Information (SAI). You may obtain a copy of the SAI without charge by calling 800.345.6611; contacting your financial intermediary; visiting columbiathreadneedle.com/us; or searching the website of the Securities and Exchange Commission (SEC) at sec.gov. Information regarding how each fund voted proxies relating to portfolio securities is filed with the SEC by August 31st for the most recent 12-month period ending June 30th of that year, and is available without charge by visiting columbiathreadneedle.com/us, or searching the website of the SEC at sec.gov.
Each fund files a complete schedule of portfolio holdings with the SEC for the first and third quarters of each fiscal year on Form N-Q. Each fund's Form N-Q is available on the SEC's website at sec.gov and may be reviewed and copied at the SEC's Public Reference Room in Washington, D.C. Information on the operation of the Public Reference Room may be obtained by calling 800.SEC.0330. Each fund's complete schedule of portfolio holdings, as filed on Form N-Q, can also be obtained without charge, upon request, by calling 800.345.6611.
Annual Report 2015
53
Columbia Short Term Municipal Bond Fund
P.O. Box 8081
Boston, MA 02266-8081

This information is for use with concurrent or prior delivery of a fund prospectus. Please read and consider the investment objectives, risks, charges and expenses for any fund carefully before investing. For a prospectus and summary prospectus, which contains this and other important information about the Fund, go to columbiathreadneedle.com/us. The Fund is distributed by Columbia Management Investment Distributors, Inc., member FINRA, and managed by Columbia Management Investment Advisers, LLC.
Columbia Threadneedle Investments (Columbia Threadneedle) is the global brand name of the Columbia and Threadneedle group of companies.
All rights reserved. Columbia Management Investment Distributors, Inc., 225 Franklin Street, Boston, MA 02110-2804
© 2015 Columbia Management Investment Advisers, LLC.
columbiathreadneedle.com/us
ANN223_04_E01_(06/15)

ANNUAL REPORT
April 30, 2015

COLUMBIA AMT-FREE MARYLAND INTERMEDIATE MUNI BOND FUND

 Dear Shareholder,
In a world that is changing faster than ever before, investors want asset managers who offer a global perspective while generating strong and sustainable returns. To that end, Columbia Management, in conjunction with its U.K.-based affiliate, Threadneedle Investments, has rebranded to Columbia Threadneedle Investments. The new global brand represents the combined capabilities, resources and reach of the global group, offering investors access to the best of both firms.
With a presence in 18 countries and more than 450 investment professionals*, our collective perspective and world view as Columbia Threadneedle Investments gives us deeper insight into what might affect the real-life financial outcomes clients are seeking. Putting our views into a global context enables us to build richer perspectives and create the right solutions, and provides us with enhanced capabilities to deliver consistent investment performance, which may ultimately lead to better investor outcomes.
As a result of the rebrand, you will begin to see our new logo and colors reflected in printed materials, such as this shareholder report, as well as on our new website — columbiathreadneedle.com/us. We encourage you to visit us online and view a new video on the "About Us" tab that speaks to the strength of the firm.
While we are introducing a new brand, in many ways, the investment company you know well has not changed. The following remain in effect:
n Fund and strategy names
n Established investment teams, philosophies and processes
n Account services, features, servicing phone numbers and mailing addresses
n Columbia Management Investment Distributors as distributor and Columbia Management Investment Advisers as investment adviser
We recognize that the money we manage represents the hard work and savings of people like you, and that everyone has different ambitions and different definitions of success. Investors have varying goals — funding their children's education, enjoying their retirement, putting money aside for unexpected events, and more. Whatever your ambitions, we believe our wide range of investment products and solutions can help give you confidence that you will reach your goals.
The world is constantly changing, but our priority remains the same: to help you secure your finances, meet your goals and achieve success. Thank you for your continued investment with us. Our service representatives are available at 800.345.6611 to help with any questions.
Sincerely,

Christopher O. Petersen
President, Columbia Funds
Investors should consider the investment objectives, risks, charges and expenses of a mutual fund carefully before investing. For a free prospectus and summary prospectus, which contains this and other important information about a fund, visit columbiathreadneedle.com/us. The prospectus should be read carefully before investing.
* Source: Ameriprise as of December 1, 2014
Columbia Funds are distributed by Columbia Management Investment Distributors, Inc., member FINRA, and managed by Columbia Management Investment Advisers, LLC.
© 2015 Columbia Management Investment Advisers, LLC. All rights reserved.
COLUMBIA AMT-FREE MARYLAND INTERMEDIATE MUNI BOND FUND
Performance Overview | | | 2 | | |
Manager Discussion of Fund Performance | | | 4 | | |
Understanding Your Fund's Expenses | | | 6 | | |
Portfolio of Investments | | | 7 | | |
Statement of Assets and Liabilities | | | 12 | | |
Statement of Operations | | | 14 | | |
Statement of Changes in Net Assets | | | 15 | | |
Financial Highlights | | | 17 | | |
Notes to Financial Statements | | | 22 | | |
Report of Independent Registered
Public Accounting Firm | | | 28 | | |
Federal Income Tax Information | | | 29 | | |
Trustees and Officers | | | 30 | | |
Approval of Investment Management Services Agreement | | | 35 | | |
Important Information About This Report | | | 37 | | |
Fund Investment Manager
Columbia Management Investment
Advisers, LLC
225 Franklin Street
Boston, MA 02110
Fund Distributor
Columbia Management Investment
Distributors, Inc.
225 Franklin Street
Boston, MA 02110
Fund Transfer Agent
Columbia Management Investment
Services Corp.
P.O. Box 8081
Boston, MA 02266-8081
For more information about any of the funds, please visit columbiathreadneedle.com/us or call 800.345.6611. Customer Service Representatives are available to answer your questions Monday through Friday from 8 a.m. to 7 p.m. Eastern time.
The views expressed in this report reflect the current views of the respective parties. These views are not guarantees of future performance and involve certain risks, uncertainties and assumptions that are difficult to predict, so actual outcomes and results may differ significantly from the views expressed. These views are subject to change at any time based upon economic, market or other conditions and the respective parties disclaim any responsibility to update such views. These views may not be relied on as investment advice and, because investment decisions for a Columbia fund are based on numerous factors, may not be relied on as an indication of trading intent on behalf of any particular Columbia fund. References to specific securities should not be construed as a recommendation or investment advice.
COLUMBIA AMT-FREE MARYLAND INTERMEDIATE MUNI BOND FUND
Performance Summary
n Columbia AMT-Free Maryland Intermediate Muni Bond Fund (the Fund) Class A shares returned 3.00% excluding sales charges for the 12-month period that ended April 30, 2015. Class Z shares of the Fund returned 3.26% for the same time period.
n The Fund's benchmark, the Barclays 3-15 Year Blend Municipal Bond Index, returned 3.76% for the 12-month period.
n The Fund's yield curve positioning was the largest factor in its underperformance.
Average Annual Total Returns (%) (for period ended April 30, 2015)
| | | Inception | | 1 Year | | 5 Years | | 10 Years | |
Class A | | 09/01/90 | | | | | | | | | | | | | |
Excluding sales charges | | | | | | | 3.00 | | | | 3.37 | | | | 3.29 | | |
Including sales charges | | | | | | | -0.06 | | | | 2.74 | | | | 2.97 | | |
Class B | | 06/08/93 | | | | | | | | | | | | | |
Excluding sales charges | | | | | | | 2.22 | | | | 2.62 | | | | 2.53 | | |
Including sales charges | | | | | | | -0.78 | | | | 2.62 | | | | 2.53 | | |
Class C | | 06/17/92 | | | | | | | | | | | | | |
Excluding sales charges | | | | | | | 2.23 | | | | 2.60 | | | | 2.52 | | |
Including sales charges | | | | | | | 1.23 | | | | 2.60 | | | | 2.52 | | |
Class R4* | | 03/19/13 | | | 3.25 | | | | 3.48 | | | | 3.34 | | |
Class Z | | 09/01/90 | | | 3.26 | | | | 3.63 | | | | 3.54 | | |
Barclays 3-15 Year Blend Municipal Bond Index | | | | | | | 3.76 | | | | 4.35 | | | | 4.54 | | |
Returns for Class A are shown with and without the maximum initial sales charge of 3.00%. The maximum applicable sales charge was reduced from 3.25% to 3.00% on Class A share purchases made on or after February 19, 2015. Class A returns (including sales charges) for all periods reflect the current maximum applicable sales charge of 3.00%. Returns for Class B are shown with and without the applicable contingent deferred sales charge (CDSC) of 3.00% in the first year, declining to 1.00% in the fourth year and eliminated thereafter. Returns for Class C are shown with and without the 1.00% CDSC for the first year only. The Fund's other classes are not subject to sales charges and have limited eligibility. Please see the Fund's prospectus for details. Performance for different share classes will vary based on differences in sales charges and fees associated with each class. All results shown assume reinvestment of distributions during the period. Returns do not reflect the deduction of taxes that a shareholder may pay on Fund distributions or on the redemption of Fund shares. Performance results reflect the effect of any fee waivers or reimbursements of Fund expenses by Columbia Management Investment Advisers, LLC and/or any of its affiliates. Absent these fee waivers or expense reimbursement arrangements, performance results would have been lower.
The performance information shown represents past performance and is not a guarantee of future results. The investment return and principal value of your investment will fluctuate so that your shares, when redeemed, may be worth more or less than their original cost. Current performance may be lower or higher than the performance information shown. You may obtain performance information current to the most recent month-end by contacting your financial intermediary, visiting columbiathreadneedle.com/us or calling 800.345.6611.
*The returns shown for periods prior to the share class inception date (including returns for the Life of the Fund, if shown, which are since Fund inception) include the returns of the Fund's oldest share class. These returns are adjusted to reflect any higher class-related operating expenses of the newer share classes, as applicable. Please visit columbiathreadneedle.com/us/investment-products/mutual-funds/appended-performance for more information.
The Barclays 3-15 Year Blend Municipal Bond Index is an unmanaged index that tracks the performance of municipal bonds issued after December 31, 1990, with remaining maturities between 2 and 17 years and at least $7 million in principal amount outstanding.
Indices are not available for investment, are not professionally managed and do not reflect sales charges, fees, brokerage commissions, taxes or other expenses of investing. Securities in the Fund may not match those in an index.
Annual Report 2015
2
COLUMBIA AMT-FREE MARYLAND INTERMEDIATE MUNI BOND FUND
PERFORMANCE OVERVIEW (continued)
Performance of a Hypothetical $10,000 Investment (May 1, 2005 – April 30, 2015)

The chart above shows the change in value of a hypothetical $10,000 investment in Class A shares of Columbia AMT-Free Maryland Intermediate Muni Bond Fund during the stated time period, and does not reflect the deduction of taxes that a shareholder may pay on Fund distributions or on the redemption of Fund shares.
Annual Report 2015
3
COLUMBIA AMT-FREE MARYLAND INTERMEDIATE MUNI BOND FUND
MANAGER DISCUSSION OF FUND PERFORMANCE
Portfolio Management
Brian McGreevy
Quality Breakdown (%)
(at April 30, 2015) | |
AAA rating | | | 17.3 | | |
AA rating | | | 38.5 | | |
A rating | | | 26.6 | | |
BBB rating | | | 14.0 | | |
BB rating | | | 1.8 | | |
Not rated | | | 1.8 | | |
Total | | | 100.0 | | |
Percentages indicated are based upon total fixed income investments (excluding Money Market Funds).
Bond ratings apply to the underlying holdings of the Fund and not the Fund itself and are divided into categories ranging from highest to lowest credit quality, determined by using the middle rating of Moody's, S&P and Fitch, after dropping the highest and lowest available ratings. When ratings are available from only two rating agencies, the lower rating is used. When a rating is available from only one rating agency, that rating is used. When a bond is not rated by any rating agency, it is designated as "Not rated". Credit quality ratings assigned by a rating agency are subjective opinions, not statements of fact, and are subject to change, including daily. The ratings assigned by credit rating agencies are but one of the considerations that the Investment Manager and/or Fund's subadviser incorporates into its credit analysis process, along with such other issuer-specific factors as cash flows, capital structure and leverage ratios, ability to de-leverage (repay) through free cash flow, quality of management, market positioning and access to capital, as well as such security-specific factors as the terms of the security (e.g., interest rate, and time to maturity) and the amount and type of any collateral.
For the 12-month period that ended April 30, 2015, the Fund's Class A shares returned 3.00% excluding sales charges. Class Z shares of the Fund returned 3.26% for the same time period. The Fund's benchmark, the Barclays 3-15 Year Blend Municipal Bond Index, returned 3.76% during the 12-month period. The Fund's yield curve positioning was the largest factor in its underperformance.
Market Overview
The U.S. municipal bond market generated positive performance during the past 12 months, with intermediate- and longer-term debt generating the best results. While short-term bonds were pressured by the possibility that the U.S. Federal Reserve may begin to increase interest rates before the end of 2015, longer term issues were aided by the environment of slow growth, low inflation and investors' continued search for yield. Lower rated investment-grade bonds — those rated A and BBB — delivered the best returns and soundly outperformed high-rated AAA debt. On a sector basis, hospital and transportation issues outperformed. State and local general obligation bonds, which tend to be higher quality, lagged the returns of revenue bonds during the period.
Beginning in the fourth quarter of 2014, the supply of new municipal issues began to increase. The number of current and advanced refundings jumped considerably, and that trend continued into 2015 as issuers took advantage of lower rates to refinance older, higher yielding bonds. This is positive for issuers' credit outlook, as it allows them to reduce their interest costs. For bond holders, however, the refundings often cause higher yielding bonds to be called away from their portfolios, with the proceeds needing to be reinvested in lower yielding securities. Supply expectations for 2015 had risen to $400 billion by the close of the period, with the largest increase in refunding volume. On the demand side, continued flows into municipal bond funds provided firm support for the market throughout the past year.
Maryland Underperformed the National Municipal Market
While Maryland's economic growth has been uneven during the past year, the state has nonetheless recovered all of the jobs it lost in the recession that followed the 2008 financial crisis. Still, the pace of hiring remained tepid and much of the drop in the unemployment rates has been the result of a decline in the state's labor force. The result has been relative weakness in consumer balance sheets relative to the rest of the country, which has put a lid on the state's housing market. On the plus side, strength in the health care sector and the introduction of two major infrastructure projects have the potential to provide longer-term support to Maryland's economy. In addition, the reduced headwind of federal budget cuts should aid the employment market, consumer spending and the longer term outlook for the housing market.
Maryland's municipal bond market underperformed during the period due to the higher credit quality of local and state general obligations bonds. Maryland's debt is AAA rated, and many of the large municipalities are rated AA2 or higher. At a time in which lower quality bonds outperformed, Maryland's higher credit quality was a headwind to relative performance.
Annual Report 2015
4
COLUMBIA AMT-FREE MARYLAND INTERMEDIATE MUNI BOND FUND
MANAGER DISCUSSION OF FUND PERFORMANCE (continued)
Contributors and Detractors
The Fund underperformed its benchmark during the 12-month period. The Fund had a below-benchmark weighting in the longer end of the intermediate-term segment (bonds with maturities of 12 to 17 years), which was a drag on performance given that this was the best performing maturity area. However, the Fund's positions in bonds within the seven- to 12-year maturity range added to results. In addition, our holdings in this range delivered better performance than the components of the benchmark.
The Fund's exposure to the short end of the yield curve, or bonds with maturities of zero to three years, detracted from performance as this segment of the market delivered weak results. We sought to decrease the Fund's exposure to the very short end of the yield curve during the course of the period, while increasing its position in A and BBB rated bonds in the hospitals, transportation and housing sectors. The reduction in shorter term bonds in favor of longer term issues helped keep the Fund's duration (interest rate sensitivity) close to neutral, and it added yield to the portfolio.
At a time in which higher quality securities underperformed their lower quality counterparts, the Fund's exposure to AAA and AA rated local general obligation bonds (GOs) detracted from returns. GOs also tend to have shorter maturities than bonds in the benchmark, which was an additional headwind to their results. We sought to offset the weighting in higher quality GO debt with exposure to BBB rated securities. BBBs outperformed the broader market by a comfortable margin, so this aspect of our positioning aided performance.
On a sector basis, hospitals, education and electric revenue bonds all performed well during the period. Hospital bonds, which represent a large overweight in the Fund relative to the benchmark, outperformed the broader market by a comfortable margin during the period. Water & sewer and transportation issues lagged during the year due to their shorter average maturities relative to the benchmark. Pre-refunded issues, which have a meaningful weight within the Fund also underperformed due to their higher quality and shorter maturities. Still, pre-refunded bonds can play a valuable role since they can provide liquidity at times of market stress.
Fund Positioning
We maintained a duration (interest-rate sensitivity) that was neutral to slightly long vs. the benchmark during the past year. Going forward, we currently intend to take a cautious stance on interest rates by maintaining a roughly neutral duration. Our overall quality positioning, along with the purchases we made during the period, continued to emphasize A and BBB rated issues for the additional income they offer. While yield spreads in these credit tiers have tightened considerably (meaning that investors are being paid less for the associated risks), we currently believe they still offer the most compelling relative value. Given the steep yield curve, we see value at this time in bonds maturing in the seven- to 12-year range.
Investment Risks
Fixed-income securities present issuer default risk. The Fund invests substantially in municipal securities and will be affected by tax, legislative, regulatory, demographic or political changes, as well as changes impacting a state's financial, economic or other conditions. A relatively small number of tax-exempt issuers may necessitate the Fund investing more heavily in a single issuer and, therefore, be more exposed to the risk of loss than a fund that invests more broadly. The value of the Fund's portfolio may be more volatile than a more geographically diversified fund. Prepayment and extension risk exists as a loan, bond or other investment may be called, prepaid or redeemed before maturity and that similar yielding investments may not be available for purchase. A rise in interest rates may result in a price decline of fixed-income instruments held by the Fund, negatively impacting its performance and NAV. Falling rates may result in the Fund investing in lower yielding debt instruments, lowering the Fund's income and yield. These risks may be heightened for longer maturity and duration securities. Non-investment-grade (high-yield or junk) securities present greater price volatility and more risk to principal and income than higher rated securities. Market risk may affect a single issuer, sector of the economy, industry or the market as a whole. Federal and state tax rules apply to capital gain distributions and any gains or losses on sales. Income may be subject to state or local taxes. Liquidity risk is associated with the difficulty of selling underlying investments at a desirable time or price. See the Fund's prospectus for information on these and other risks.
Annual Report 2015
5
COLUMBIA AMT-FREE MARYLAND INTERMEDIATE MUNI BOND FUND
UNDERSTANDING YOUR FUND'S EXPENSES
(Unaudited)
As an investor, you incur two types of costs. There are transaction costs, which generally include sales charges on purchases and may include redemption fees. There are also ongoing costs, which generally include management fees, distribution and/or service fees, and other fund expenses. The following information is intended to help you understand your ongoing costs (in dollars) of investing in the Fund and to help you compare these costs with the ongoing costs of investing in other mutual funds.
Analyzing Your Fund's Expenses
To illustrate these ongoing costs, we have provided examples and calculated the expenses paid by investors in each share class of the Fund during the period. The actual and hypothetical information in the table is based on an initial investment of $1,000 at the beginning of the period indicated and held for the entire period. Expense information is calculated two ways and each method provides you with different information. The amount listed in the "Actual" column is calculated using the Fund's actual operating expenses and total return for the period. You may use the Actual information, together with the amount invested, to estimate the expenses that you paid over the period. Simply divide your account value by $1,000 (for example, an $8,600 account value divided by $1,000 = 8.6), then multiply the results by the expenses paid during the period under the "Actual" column. The amount listed in the "Hypothetical" column assumes a 5% annual rate of return before expenses (which is not the Fund's actual return) and then applies the Fund's actual expense ratio for the period to the hypothetical return. You should not use the hypothetical account values and expenses to estimate either your actual account balance at the end of the period or the expenses you paid during the period. See "Compare With Other Funds" below for details on how to use the hypothetical data.
Compare With Other Funds
Since all mutual funds are required to include the same hypothetical calculations about expenses in shareholder reports, you can use this information to compare the ongoing cost of investing in the Fund with other funds. To do so, compare the hypothetical example with the 5% hypothetical examples that appear in the shareholder reports of other funds. As you compare hypothetical examples of other funds, it is important to note that hypothetical examples are meant to highlight the ongoing costs of investing in a fund only and do not reflect any transaction costs, such as sales charges, or redemption or exchange fees. Therefore, the hypothetical calculations are useful in comparing ongoing costs only, and will not help you determine the relative total costs of owning different funds. If transaction costs were included in these calculations, your costs would be higher.
November 1, 2014 – April 30, 2015
| | | Account Value at the Beginning
of the Period ($) | | Account Value at the End of the
Period ($) | | Expenses Paid During the
Period ($) | | Fund's Annualized
Expense Ratio (%) | |
| | | Actual | | Hypothetical | | Actual | | Hypothetical | | Actual | | Hypothetical | | Actual | |
Class A | | | 1,000.00 | | | | 1,000.00 | | | | 1,005.70 | | | | 1,020.78 | | | | 4.03 | | | | 4.06 | | | | 0.81 | | |
Class B | | | 1,000.00 | | | | 1,000.00 | | | | 1,002.00 | | | | 1,017.06 | | | | 7.74 | | | | 7.80 | | | | 1.56 | | |
Class C | | | 1,000.00 | | | | 1,000.00 | | | | 1,002.00 | | | | 1,017.06 | | | | 7.74 | | | | 7.80 | | | | 1.56 | | |
Class R4 | | | 1,000.00 | | | | 1,000.00 | | | | 1,007.90 | | | | 1,022.02 | | | | 2.79 | | | | 2.81 | | | | 0.56 | | |
Class Z | | | 1,000.00 | | | | 1,000.00 | | | | 1,006.90 | | | | 1,022.02 | | | | 2.79 | | | | 2.81 | | | | 0.56 | | |
Expenses paid during the period are equal to the annualized expense ratio for each class as indicated above, multiplied by the average account value over the period and then multiplied by the number of days in the Fund's most recent fiscal half year and divided by 365.
Expenses do not include fees and expenses incurred indirectly by the Fund from its investment in underlying funds, including affiliated and non-affiliated pooled investment vehicles, such as mutual funds and exchange-traded funds.
Had Columbia Management Investment Advisers, LLC and/or certain of its affiliates not waived/reimbursed certain fees and expenses, account value at the end of the period would have been reduced.
Annual Report 2015
6
COLUMBIA AMT-FREE MARYLAND INTERMEDIATE MUNI BOND FUND
PORTFOLIO OF INVESTMENTS
April 30, 2015
(Percentages represent value of investments compared to net assets)
Municipal Bonds 98.1%
Issue
Description | | Coupon
Rate | | Principal
Amount ($) | | Value ($) | |
DISPOSAL 1.3% | |
Maryland Environmental Service
Revenue Bonds
Mid Shore II Regional Landfill
Series 2011
11/01/24 | | | 5.000 | % | | | 1,030,000 | | | | 1,186,653 | | |
HIGHER EDUCATION 4.6% | |
Maryland Health & Higher Educational Facilities Authority
Revenue Bonds
Maryland Institute College of Art
Series 2012
06/01/29 | | | 5.000 | % | | | 1,000,000 | | | | 1,101,960 | | |
Notre Dame of Maryland University
Series 2012
10/01/32 | | | 5.000 | % | | | 1,000,000 | | | | 1,070,250 | | |
Montgomery County Authority
Refunding Revenue Bonds
Series 2014
05/01/27 | | | 5.000 | % | | | 500,000 | | | | 584,550 | | |
Morgan State University
Refunding Revenue Bonds
Series 2012
07/01/30 | | | 5.000 | % | | | 150,000 | | | | 168,497 | | |
University System of Maryland
Refunding Revenue Bonds
Series 2015A
04/01/24 | | | 5.000 | % | | | 1,000,000 | | | | 1,234,750 | | |
Total | | | | | | | 4,160,007 | | |
HOSPITAL 13.7% | |
Maryland Health & Higher Educational Facilities Authority
Refunding Revenue Bonds
Anne Arundel Health System
Series 2014
07/01/29 | | | 5.000 | % | | | 750,000 | | | | 845,077 | | |
MedStar Health, Inc.
Series 2015
08/15/33 | | | 5.000 | % | | | 1,000,000 | | | | 1,119,870 | | |
Peninsula Regional Medical Center
Series 2015
07/01/32 | | | 5.000 | % | | | 1,000,000 | | | | 1,112,590 | | |
Western Maryland Health System
Series 2014
07/01/34 | | | 5.250 | % | | | 1,500,000 | | | | 1,673,145 | | |
Revenue Bonds
Carroll Hospital
Series 2012A
07/01/26 | | | 5.000 | % | | | 1,210,000 | | | | 1,359,641 | | |
07/01/27 | | | 5.000 | % | | | 1,000,000 | | | | 1,115,150 | | |
Johns Hopkins Health System
Series 2012
07/01/28 | | | 5.000 | % | | | 1,000,000 | | | | 1,153,200 | | |
Municipal Bonds (continued)
Issue
Description | | Coupon
Rate | | Principal
Amount ($) | | Value ($) | |
Johns Hopkins Health System
Series 2013C
05/15/33 | | | 5.000 | % | | | 1,500,000 | | | | 1,702,605 | | |
MedStar Health
Series 2011
08/15/22 | | | 5.000 | % | | | 1,620,000 | | | | 1,895,416 | | |
Maryland Health & Higher Educational Facilities Authority(a)
Refunding Revenue Bonds
University of Maryland Medical System
Series 2015
07/01/28 | | | 5.000 | % | | | 500,000 | | | | 572,090 | | |
Total | | | | | | | 12,548,784 | | |
INVESTOR OWNED 3.2% | |
Maryland Economic Development Corp.
Refunding Revenue Bonds
Potomac
Series 2009
09/01/22 | | | 6.200 | % | | | 2,500,000 | | | | 2,942,375 | | |
LOCAL APPROPRIATION 3.5% | |
City of Baltimore
Refunding Certificate of Participation
Series 2010A
10/01/17 | | | 5.000 | % | | | 1,500,000 | | | | 1,643,415 | | |
Howard County Housing Commission
Revenue Bonds
Roger Carter Recreation Center Project
Series 2011
06/01/26 | | | 5.000 | % | | | 585,000 | | | | 661,799 | | |
Maryland State Transportation Authority
Refunding Revenue Bonds
Metrorail Parking Projects
Series 2014
07/01/23 | | | 4.000 | % | | | 750,000 | | | | 849,195 | | |
Total | | | | | | | 3,154,409 | | |
LOCAL GENERAL OBLIGATION 12.2% | |
City of Baltimore
Unlimited General Obligation Bonds
Consolidated Public Improvement
Series 2008A (AGM)
10/15/22 | | | 5.000 | % | | | 2,000,000 | | | | 2,253,040 | | |
County of Anne Arundel
Limited General Obligation Bonds
Consolidated General Improvement
Series 2015
04/01/27 | | | 5.000 | % | | | 1,500,000 | | | | 1,838,715 | | |
County of Baltimore
Unlimited General Obligation Bonds
Consolidated Public Improvement
Series 2008
02/01/18 | | | 5.000 | % | | | 1,000,000 | | | | 1,112,600 | | |
The accompanying Notes to Financial Statements are an integral part of this statement.
Annual Report 2015
7
COLUMBIA AMT-FREE MARYLAND INTERMEDIATE MUNI BOND FUND
PORTFOLIO OF INVESTMENTS (continued)
April 30, 2015
Municipal Bonds (continued)
Issue
Description | | Coupon
Rate | | Principal
Amount ($) | | Value ($) | |
County of Frederick
Unlimited General Obligation Refunding Bonds
Public Facilities
Series 2006
11/01/18 | | | 5.250 | % | | | 2,005,000 | | | | 2,291,334 | | |
11/01/21 | | | 5.250 | % | | | 2,500,000 | | | | 3,046,700 | | |
County of Prince George's
Limited General Obligation Refunding & Public
Improvement Bonds
Consolidated
Series 2011B
09/15/20 | | | 5.000 | % | | | 500,000 | | | | 593,800 | | |
Total | | | | | | | 11,136,189 | | |
MULTI-FAMILY 6.0% | |
Maryland Economic Development Corp.
Refunding Revenue Bonds
Morgan State University Project
Senior Series 2012
07/01/20 | | | 4.000 | % | | | 550,000 | | | | 584,683 | | |
University of Maryland-Baltimore County Project
Series 2006 (XLCA)
07/01/20 | | | 5.000 | % | | | 600,000 | | | | 620,514 | | |
University of Maryland-College Park Projects
Series 2006 (AGCP)
06/01/19 | | | 5.000 | % | | | 1,000,000 | | | | 1,047,420 | | |
Revenue Bonds
Salisbury University Project
Series 2012
06/01/27 | | | 5.000 | % | | | 1,100,000 | | | | 1,202,729 | | |
Towson University Project
Senior Series 2007A
07/01/24 | | | 5.250 | % | | | 1,185,000 | | | | 1,241,690 | | |
Senior Series 2012
07/01/27 | | | 5.000 | % | | | 700,000 | | | | 759,801 | | |
Total | | | | | | | 5,456,837 | | |
MUNICIPAL POWER 0.3% | |
Guam Power Authority
Refunding Revenue Bonds
Series 2012A (AGM)(b)
10/01/24 | | | 5.000 | % | | | 220,000 | | | | 260,630 | | |
OTHER BOND ISSUE 3.9% | |
County of Montgomery
Revenue Bonds
Department of Liquor Control
Series 2009A
04/01/22 | | | 5.000 | % | | | 2,055,000 | | | | 2,321,698 | | |
Maryland Community Development Administration
Revenue Bonds
Capital Fund Securitization
Series 2003 (AGM)
07/01/21 | | | 4.400 | % | | | 535,000 | | | | 536,107 | | |
Municipal Bonds (continued)
Issue
Description | | Coupon
Rate | | Principal
Amount ($) | | Value ($) | |
Marlborough Apartments
Series 2014
12/15/31 | | | 3.450 | % | | | 750,000 | | | | 733,238 | | |
Total | | | | | | | 3,591,043 | | |
OTHER INDUSTRIAL DEVELOPMENT BOND 1.7% | |
Maryland Economic Development Corp.
Refunding Revenue Bonds
CNX Marine Terminals, Inc.
Series 2010
09/01/25 | | | 5.750 | % | | | 1,425,000 | | | | 1,579,898 | | |
POOL/BOND BANK 1.2% | |
Maryland Water Quality Financing Administration
Revolving Loan Fund
Revenue Bonds
Series 2008A
03/01/23 | | | 5.000 | % | | | 1,000,000 | | | | 1,109,270 | | |
REFUNDED / ESCROWED 8.6% | |
City of Baltimore
Prerefunded 07/01/17 Revenue Bonds
Wastewater Projects
Series 2007D (AMBAC)
07/01/19 | | | 5.000 | % | | | 1,250,000 | | | | 1,366,363 | | |
Prerefunded 07/01/18 Revenue Bonds
Wastewater Projects
Series 2008A (AGM)
07/01/21 | | | 5.000 | % | | | 1,250,000 | | | | 1,406,425 | | |
Revenue Bonds
Water Project
Series 1994A Escrowed to Maturity (FGIC)
07/01/24 | | | 5.000 | % | | | 1,400,000 | | | | 1,675,506 | | |
Maryland Health & Higher Educational Facilities Authority
Prerefunded 07/01/16 Revenue Bonds
FHA Insured Mortgage-Western Health
Series 2006A
01/01/20 | | | 5.000 | % | | | 1,450,000 | | | | 1,527,386 | | |
Maryland State Transportation Authority
Revenue Bonds
Series 1978 Escrowed to Maturity
07/01/16 | | | 6.800 | % | | | 165,000 | | | | 171,509 | | |
State of Maryland
Prerefunded 03/01/19 Unlimited General Obligation
Bonds
State & Local Facilities
1st Series 2009C
03/01/21 | | | 5.000 | % | | | 1,500,000 | | | | 1,719,345 | | |
Total | | | | | | | 7,866,534 | | |
The accompanying Notes to Financial Statements are an integral part of this statement.
Annual Report 2015
8
COLUMBIA AMT-FREE MARYLAND INTERMEDIATE MUNI BOND FUND
PORTFOLIO OF INVESTMENTS (continued)
April 30, 2015
Municipal Bonds (continued)
Issue
Description | | Coupon
Rate | | Principal
Amount ($) | | Value ($) | |
RETIREMENT COMMUNITIES 6.1% | |
City of Gaithersburg
Refunding Revenue Bonds
Asbury Obligation Group
Series 2009B
01/01/23 | | | 6.000 | % | | | 1,250,000 | | | | 1,402,925 | | |
County of Baltimore
Revenue Bonds
Oak Crest Village, Inc. Facility
Series 2007A
01/01/22 | | | 5.000 | % | | | 1,045,000 | | | | 1,099,904 | | |
01/01/27 | | | 5.000 | % | | | 2,000,000 | | | | 2,080,520 | | |
Maryland Health & Higher Educational Facilities Authority
Revenue Bonds
King Farm Presbyterian Community
Series 2007A
01/01/27 | | | 5.250 | % | | | 1,000,000 | | | | 1,029,730 | | |
Total | | | | | | | 5,613,079 | | |
SPECIAL NON PROPERTY TAX 7.2% | |
State of Maryland Department of Transportation
Revenue Bonds
Series 2008
02/15/22 | | | 5.000 | % | | | 3,125,000 | | | | 3,484,906 | | |
Series 2009
06/15/21 | | | 4.000 | % | | | 1,495,000 | | | | 1,649,000 | | |
Territory of Guam
Revenue Bonds
Series 2011A(b)
01/01/31 | | | 5.000 | % | | | 350,000 | | | | 385,784 | | |
Virgin Islands Public Finance Authority
Revenue Bonds
Matching Fund Loan Notes-Senior Lien
Series 2010A(b)
10/01/17 | | | 5.000 | % | | | 1,000,000 | | | | 1,080,720 | | |
Total | | | | | | | 6,600,410 | | |
SPECIAL PROPERTY TAX 4.6% | |
Anne Arundel County Consolidated District
Special Tax Refunding Bonds
Villages of Dorchester & Farmington
Series 2013
07/01/23 | | | 5.000 | % | | | 225,000 | | | | 264,150 | | |
07/01/24 | | | 5.000 | % | | | 500,000 | | | | 596,115 | | |
County of Frederick
Special Tax Bonds
Urbana Community Development Authority
Series 2010A
07/01/25 | | | 5.000 | % | | | 2,500,000 | | | | 2,829,125 | | |
Municipal Bonds (continued)
Issue
Description | | Coupon
Rate | | Principal
Amount ($) | | Value ($) | |
County of Montgomery
Refunding Special Tax Bonds
West Germantown Development District
Series 2014
07/01/25 | | | 4.000 | % | | | 485,000 | | | | 529,722 | | |
Total | | | | | | | 4,219,112 | | |
STATE APPROPRIATED 4.0% | |
Maryland Economic Development Corp.
Refunding Revenue Bonds
Department of Transportation Headquarters
Series 2010
06/01/22 | | | 4.500 | % | | | 2,675,000 | | | | 3,132,933 | | |
New Jersey Transportation Trust Fund Authority
Revenue Bonds
Transportation System
Series 2006A
12/15/19 | | | 5.250 | % | | | 500,000 | | | | 560,840 | | |
Total | | | | | | | 3,693,773 | | |
STATE GENERAL OBLIGATION 4.2% | |
State of Maryland
Unlimited General Obligation Bonds
Series 2015A
03/01/27 | | | 4.000 | % | | | 1,500,000 | | | | 1,655,835 | | |
State & Local Facilities-Capital Improvement
1st Series 2003A
03/01/17 | | | 5.250 | % | | | 2,000,000 | | | | 2,170,480 | | |
Total | | | | | | | 3,826,315 | | |
TRANSPORTATION 3.8% | |
Washington Metropolitan Area Transit Authority
Revenue Bonds
Transit
Series 2009
07/01/23 | | | 5.250 | % | | | 3,000,000 | | | | 3,448,980 | | |
TURNPIKE/BRIDGE/TOLL ROAD 2.5% | |
Maryland State Transportation Authority
Revenue Bonds
Series 2009A
07/01/22 | | | 5.000 | % | | | 2,000,000 | | | | 2,294,260 | | |
WATER & SEWER 5.5% | |
City of Baltimore
Revenue Bonds
Subordinated Series 2014A
07/01/32 | | | 5.000 | % | | | 1,000,000 | | | | 1,154,940 | | |
Maryland Water Quality Financing Administration
Revolving Loan Fund
Revenue Bonds
Series 2008
03/01/21 | | | 5.000 | % | | | 2,500,000 | | | | 2,770,950 | | |
The accompanying Notes to Financial Statements are an integral part of this statement.
Annual Report 2015
9
COLUMBIA AMT-FREE MARYLAND INTERMEDIATE MUNI BOND FUND
PORTFOLIO OF INVESTMENTS (continued)
April 30, 2015
Municipal Bonds (continued)
Issue
Description | | Coupon
Rate | | Principal
Amount ($) | | Value ($) | |
Washington Suburban Sanitary Commission
Unlimited General Obligation Refunding & Public
Improvement Bonds
Series 2009
06/01/21 | | | 4.000 | % | | | 1,000,000 | | | | 1,099,880 | | |
Total | | | | | | | 5,025,770 | | |
Total Municipal Bonds
(Cost: $84,045,448) | | | | | | | 89,714,328 | | |
Total Investments
(Cost: $84,045,448) | | | | | | | 89,714,328 | | |
Other Assets & Liabilities, Net | | | | | | | 1,758,311 | | |
Net Assets | | | | | | | 91,472,639 | | |
Notes to Portfolio of Investments
(a) Security, or a portion thereof, has been purchased on a when-issued or delayed delivery basis.
(b) Municipal obligations include debt obligations issued by or on behalf of territories, possessions, or sovereign nations within the territorial boundaries of the United States. At April 30, 2015, the value of these securities amounted to $1,727,134 or 1.89% of net assets.
Abbreviation Legend
AGCP Assured Guaranty Corporation
AGM Assured Guaranty Municipal Corporation
AMBAC Ambac Assurance Corporation
FGIC Financial Guaranty Insurance Company
FHA Federal Housing Authority
XLCA XL Capital Assurance
Fair Value Measurements
Generally accepted accounting principles (GAAP) require disclosure regarding the inputs and valuation techniques used to measure fair value and any changes in valuation inputs or techniques. In addition, investments shall be disclosed by major category.
The Fund categorizes its fair value measurements according to a three-level hierarchy that maximizes the use of observable inputs and minimizes the use of unobservable inputs by prioritizing that the most observable input be used when available. Observable inputs are those that market participants would use in pricing an investment based on market data obtained from sources independent of the reporting entity. Unobservable inputs are those that reflect the Fund's assumptions about the information market participants would use in pricing an investment. An investment's level within the fair value hierarchy is based on the lowest level of any input that is deemed significant to the asset or liability's fair value measurement. The input levels are not necessarily an indication of the risk or liquidity associated with investments at that level. For example, certain U.S. government securities are generally high quality and liquid, however, they are reflected as Level 2 because the inputs used to determine fair value may not always be quoted prices in an active market.
Fair value inputs are summarized in the three broad levels listed below:
> Level 1 — Valuations based on quoted prices for investments in active markets that the Fund has the ability to access at the measurement date (including NAV for open-end mutual funds). Valuation adjustments are not applied to Level 1 investments.
> Level 2 — Valuations based on other significant observable inputs (including quoted prices for similar securities, interest rates, prepayment speeds, credit risks, etc.).
> Level 3 — Valuations based on significant unobservable inputs (including the Fund's own assumptions and judgment in determining the fair value of investments).
The accompanying Notes to Financial Statements are an integral part of this statement.
Annual Report 2015
10
COLUMBIA AMT-FREE MARYLAND INTERMEDIATE MUNI BOND FUND
PORTFOLIO OF INVESTMENTS (continued)
April 30, 2015
Fair Value Measurements (continued)
Inputs that are used in determining fair value of an investment may include price information, credit data, volatility statistics, and other factors. These inputs can be either observable or unobservable. The availability of observable inputs can vary between investments, and is affected by various factors such as the type of investment, and the volume and level of activity for that investment or similar investments in the marketplace. The inputs will be considered by the Investment Manager, along with any other relevant factors in the calculation of an investment's fair value. The Fund uses prices and inputs that are current as of the measurement date, which may include periods of market dislocations. During these periods, the availability of prices and inputs may be reduced for many investments. This condition could cause an investment to be reclassified between the various levels within the hierarchy.
Investments falling into the Level 3 category are primarily supported by quoted prices from brokers and dealers participating in the market for those investments. However, these may be classified as Level 3 investments due to lack of market transparency and corroboration to support these quoted prices. Additionally, valuation models may be used as the pricing source for any remaining investments classified as Level 3. These models may rely on one or more significant unobservable inputs and/or significant assumptions by the Investment Manager. Inputs used in valuations may include, but are not limited to, financial statement analysis, capital account balances, discount rates and estimated cash flows, and comparable company data.
Under the direction of the Fund's Board of Trustees (the Board), the Investment Manager's Valuation Committee (the Committee) is responsible for overseeing the valuation procedures approved by the Board. The Committee consists of voting and non-voting members from various groups within the Investment Manager's organization, including operations and accounting, trading and investments, compliance, risk management and legal.
The Committee meets at least monthly to review and approve valuation matters, which may include a description of specific valuation determinations, data regarding pricing information received from approved pricing vendors and brokers and the results of Board-approved valuation control policies and procedures (the Policies). The Policies address, among other things, instances when market quotations are or are not readily available, including recommendations of third party pricing vendors and a determination of appropriate pricing methodologies; events that require specific valuation determinations and assessment of fair value techniques; securities with a potential for stale pricing, including those that are illiquid, restricted, or in default; and the effectiveness of third party pricing vendors, including periodic reviews of vendors. The Committee meets more frequently, as needed, to discuss additional valuation matters, which may include the need to review back-testing results, review time-sensitive information or approve related valuation actions. The Committee reports to the Board, with members of the Committee meeting with the Board at each of its regularly scheduled meetings to discuss valuation matters and actions during the period, similar to those described earlier.
For investments categorized as Level 3, the Committee monitors information similar to that described above, which may include: (i) data specific to the issuer or comparable issuers, (ii) general market or specific sector news and (iii) quoted prices and specific or similar security transactions. The Committee considers this data and any changes from prior periods in order to assess the reasonableness of observable and unobservable inputs, any assumptions or internal models used to value those securities and changes in fair value. This data is also used to corroborate, when available, information received from approved pricing vendors and brokers. Various factors impact the frequency of monitoring this information (which may occur as often as daily). However, the Committee may determine that changes to inputs, assumptions and models are not required as a result of the monitoring procedures performed.
The following table is a summary of the inputs used to value the Fund's investments at April 30, 2015:
| Description | | Level 1
Quoted Prices in Active
Markets for Identical
Assets ($) | | Level 2
Other Significant
Observable Inputs ($) | | Level 3
Significant
Unobservable Inputs ($) | |
Total ($) | |
Bonds | |
Municipal Bonds | | | — | | | | 89,714,328 | | | | — | | | | 89,714,328 | | |
Total Bonds | | | — | | | | 89,714,328 | | | | — | | | | 89,714,328 | | |
Total | | | — | | | | 89,714,328 | | | | — | | | | 89,714,328 | | |
See the Portfolio of Investments for all investment classifications not indicated in the table.
The Fund's assets assigned to the Level 2 input category are generally valued using the market approach, in which a security's value is determined through reference to prices and information from market transactions for similar or identical assets.
There were no transfers of financial assets between levels during the period.
The accompanying Notes to Financial Statements are an integral part of this statement.
Annual Report 2015
11
COLUMBIA AMT-FREE MARYLAND INTERMEDIATE MUNI BOND FUND
STATEMENT OF ASSETS AND LIABILITIES
April 30, 2015
Assets | |
Investments, at value | |
(identified cost $84,045,448) | | $ | 89,714,328 | | |
Cash | | | 1,035,471 | | |
Receivable for: | |
Investments sold | | | 777,795 | | |
Capital shares sold | | | 87,281 | | |
Interest | | | 1,141,580 | | |
Expense reimbursement due from Investment Manager | | | 460 | | |
Prepaid expenses | | | 636 | | |
Total assets | | | 92,757,551 | | |
Liabilities | |
Payable for: | |
Investments purchased on a delayed delivery basis | | | 572,090 | | |
Capital shares purchased | | | 324,255 | | |
Dividend distributions to shareholders | | | 223,107 | | |
Investment management fees | | | 1,006 | | |
Distribution and/or service fees | | | 219 | | |
Transfer agent fees | | | 16,300 | | |
Administration fees | | | 176 | | |
Compensation of board members | | | 117,638 | | |
Other expenses | | | 30,121 | | |
Total liabilities | | | 1,284,912 | | |
Net assets applicable to outstanding capital stock | | $ | 91,472,639 | | |
Represented by | |
Paid-in capital | | $ | 87,501,532 | | |
Undistributed net investment income | | | 238,389 | | |
Accumulated net realized loss | | | (1,936,162 | ) | |
Unrealized appreciation (depreciation) on: | |
Investments | | | 5,668,880 | | |
Total — representing net assets applicable to outstanding capital stock | | $ | 91,472,639 | | |
The accompanying Notes to Financial Statements are an integral part of this statement.
Annual Report 2015
12
COLUMBIA AMT-FREE MARYLAND INTERMEDIATE MUNI BOND FUND
STATEMENT OF ASSETS AND LIABILITIES (continued)
April 30, 2015
Class A | |
Net assets | | $ | 20,593,005 | | |
Shares outstanding | | | 1,905,541 | | |
Net asset value per share | | $ | 10.81 | | |
Maximum offering price per share(a) | | $ | 11.14 | | |
Class B | |
Net assets | | $ | 39,890 | | |
Shares outstanding | | | 3,688 | | |
Net asset value per share | | $ | 10.82 | | |
Class C | |
Net assets | | $ | 2,796,489 | | |
Shares outstanding | | | 258,729 | | |
Net asset value per share | | $ | 10.81 | | |
Class R4 | |
Net assets | | $ | 10,111 | | |
Shares outstanding | | | 936 | | |
Net asset value per share(b) | | $ | 10.81 | | |
Class Z | |
Net assets | | $ | 68,033,144 | | |
Shares outstanding | | | 6,294,336 | | |
Net asset value per share | | $ | 10.81 | | |
(a) The maximum offering price per share is calculated by dividing the net asset value per share by 1.0 minus the maximum sales charge of 3.00%.
(b) Net asset value per share rounds to this amount due to fractional shares outstanding.
The accompanying Notes to Financial Statements are an integral part of this statement.
Annual Report 2015
13
COLUMBIA AMT-FREE MARYLAND INTERMEDIATE MUNI BOND FUND
STATEMENT OF OPERATIONS
Year Ended April 30, 2015
Net investment income | |
Income: | |
Dividends | | $ | 46 | | |
Interest | | | 3,274,695 | | |
Total income | | | 3,274,741 | | |
Expenses: | |
Investment management fees | | | 356,411 | | |
Distribution and/or service fees | |
Class A | | | 51,518 | | |
Class B | | | 513 | | |
Class C | | | 28,315 | | |
Transfer agent fees | |
Class A | | | 41,790 | | |
Class B | | | 103 | | |
Class C | | | 5,750 | | |
Class R4 | | | 20 | | |
Class Z | | | 133,204 | | |
Administration fees | | | 62,372 | | |
Compensation of board members | | | 19,693 | | |
Custodian fees | | | 1,608 | | |
Printing and postage fees | | | 22,390 | | |
Registration fees | | | 21,751 | | |
Professional fees | | | 32,241 | | |
Other | | | 9,291 | | |
Total expenses | | | 786,970 | | |
Fees waived or expenses reimbursed by Investment Manager and its affiliates | | | (207,608 | ) | |
Expense reductions | | | (40 | ) | |
Total net expenses | | | 579,322 | | |
Net investment income | | | 2,695,419 | | |
Realized and unrealized gain (loss) — net | |
Net realized gain (loss) on: | |
Investments | | | 387,814 | | |
Net realized gain | | | 387,814 | | |
Net change in unrealized appreciation (depreciation) on: | |
Investments | | | (373,834 | ) | |
Net change in unrealized depreciation | | | (373,834 | ) | |
Net realized and unrealized gain | | | 13,980 | | |
Net increase in net assets resulting from operations | | $ | 2,709,399 | | |
The accompanying Notes to Financial Statements are an integral part of this statement.
Annual Report 2015
14
COLUMBIA AMT-FREE MARYLAND INTERMEDIATE MUNI BOND FUND
STATEMENT OF CHANGES IN NET ASSETS
| | | Year Ended
April 30,
2015 | | Year Ended
April 30,
2014 | |
Operations | |
Net investment income | | $ | 2,695,419 | | | $ | 3,286,933 | | |
Net realized gain | | | 387,814 | | | | 34,332 | | |
Net change in unrealized depreciation | | | (373,834 | ) | | | (4,767,002 | ) | |
Net increase (decrease) in net assets resulting from operations | | | 2,709,399 | | | | (1,445,737 | ) | |
Distributions to shareholders | |
Net investment income | |
Class A | | | (590,612 | ) | | | (643,382 | ) | |
Class B | | | (1,088 | ) | | | (2,171 | ) | |
Class C | | | (59,853 | ) | | | (56,542 | ) | |
Class R4 | | | (317 | ) | | | (95 | ) | |
Class Z | | | (2,043,611 | ) | | | (2,584,743 | ) | |
Total distributions to shareholders | | | (2,695,481 | ) | | | (3,286,933 | ) | |
Increase (decrease) in net assets from capital stock activity | | | 3,951,978 | | | | (44,693,945 | ) | |
Total increase (decrease) in net assets | | | 3,965,896 | | | | (49,426,615 | ) | |
Net assets at beginning of year | | | 87,506,743 | | | | 136,933,358 | | |
Net assets at end of year | | $ | 91,472,639 | | | $ | 87,506,743 | | |
Undistributed net investment income | | $ | 238,389 | | | $ | 238,451 | | |
The accompanying Notes to Financial Statements are an integral part of this statement.
Annual Report 2015
15
COLUMBIA AMT-FREE MARYLAND INTERMEDIATE MUNI BOND FUND
STATEMENT OF CHANGES IN NET ASSETS (continued)
| | | Year Ended April 30, 2015 | | Year Ended April 30, 2014 | |
| | | Shares | | Dollars ($) | | Shares | | Dollars ($) | |
Capital stock activity | |
Class A shares | |
Subscriptions(a) | | | 171,905 | | | | 1,869,867 | | | | 141,386 | | | | 1,520,318 | | |
Distributions reinvested | | | 18,908 | | | | 205,688 | | | | 19,255 | | | | 206,011 | | |
Redemptions | | | (227,030 | ) | | | (2,469,501 | ) | | | (352,147 | ) | | | (3,751,151 | ) | |
Net decrease | | | (36,217 | ) | | | (393,946 | ) | | | (191,506 | ) | | | (2,024,822 | ) | |
Class B shares | |
Subscriptions | | | 37 | | | | 401 | | | | 51 | | | | 547 | | |
Distributions reinvested | | | 61 | | | | 664 | | | | 152 | | | | 1,624 | | |
Redemptions(a) | | | (4,968 | ) | | | (54,095 | ) | | | (2,341 | ) | | | (24,948 | ) | |
Net decrease | | | (4,870 | ) | | | (53,030 | ) | | | (2,138 | ) | | | (22,777 | ) | |
Class C shares | |
Subscriptions | | | 71,282 | | | | 775,231 | | | | 72,895 | | | | 778,361 | | |
Distributions reinvested | | | 4,191 | | | | 45,591 | | | | 4,373 | | | | 46,796 | | |
Redemptions | | | (63,582 | ) | | | (693,430 | ) | | | (94,158 | ) | | | (1,005,515 | ) | |
Net increase (decrease) | | | 11,891 | | | | 127,392 | | | | (16,890 | ) | | | (180,358 | ) | |
Class R4 shares | |
Subscriptions | | | — | | | | — | | | | 710 | | | | 7,600 | | |
Distributions reinvested | | | — | | | | — | | | | (1 | ) | | | (6 | ) | |
Net increase | | | — | | | | — | | | | 709 | | | | 7,594 | | |
Class Z shares | |
Subscriptions | | | 1,253,645 | | | | 13,656,825 | | | | 393,787 | | | | 4,210,648 | | |
Distributions reinvested | | | 15,889 | | | | 172,841 | | | | 15,083 | | | | 161,405 | | |
Redemptions | | | (877,880 | ) | | | (9,558,104 | ) | | | (4,386,820 | ) | | | (46,845,635 | ) | |
Net increase (decrease) | | | 391,654 | | | | 4,271,562 | | | | (3,977,950 | ) | | | (42,473,582 | ) | |
Total net increase (decrease) | | | 362,458 | | | | 3,951,978 | | | | (4,187,775 | ) | | | (44,693,945 | ) | |
(a) Includes conversions of Class B shares to Class A shares, if any.
The accompanying Notes to Financial Statements are an integral part of this statement.
Annual Report 2015
16
COLUMBIA AMT-FREE MARYLAND INTERMEDIATE MUNI BOND FUND
The following tables are intended to help you understand the Fund's financial performance. Certain information reflects financial results for a single share of a class held for the periods shown. Per share net investment income (loss) amounts are calculated based on average shares outstanding during the period. Total return assumes reinvestment of all dividends and distributions, if any. Total return does not reflect payment of sales charges, if any. Total return and portfolio turnover are not annualized for periods of less than one year. The portfolio turnover rate is calculated without regard to purchase and sales transactions of short-term instruments and certain derivatives, if any. If such transactions were included, the Fund's portfolio turnover rate may be higher.
| | | Year Ended April 30, | | Year Ended March 31, | |
Class A | | 2015 | | 2014 | | 2013 | | 2012(a) | | 2012 | | 2011 | |
Per share data | |
Net asset value, beginning of period | | $ | 10.80 | | | $ | 11.14 | | | $ | 11.05 | | | $ | 10.96 | | | $ | 10.41 | | | $ | 10.53 | | |
Income from investment operations: | |
Net investment income | | | 0.31 | | | | 0.32 | | | | 0.30 | | | | 0.03 | | | | 0.33 | | | | 0.34 | | |
Net realized and unrealized gain (loss) | | | 0.01 | | | | (0.34 | ) | | | 0.09 | | | | 0.09 | | | | 0.55 | | | | (0.12 | ) | |
Total from investment operations | | | 0.32 | | | | (0.02 | ) | | | 0.39 | | | | 0.12 | | | | 0.88 | | | | 0.22 | | |
Less distributions to shareholders: | |
Net investment income | | | (0.31 | ) | | | (0.32 | ) | | | (0.30 | ) | | | (0.03 | ) | | | (0.33 | ) | | | (0.34 | ) | |
Total distributions to shareholders | | | (0.31 | ) | | | (0.32 | ) | | | (0.30 | ) | | | (0.03 | ) | | | (0.33 | ) | | | (0.34 | ) | |
Net asset value, end of period | | $ | 10.81 | | | $ | 10.80 | | | $ | 11.14 | | | $ | 11.05 | | | $ | 10.96 | | | $ | 10.41 | | |
Total return | | | 3.00 | % | | | (0.16 | %) | | | 3.58 | % | | | 1.05 | % | | | 8.55 | % | | | 2.05 | % | |
Ratios to average net assets(b) | |
Total gross expenses | | | 1.04 | % | | | 1.05 | % | | | 1.01 | % | | | 1.05 | %(c) | | | 1.03 | % | | | 0.97 | % | |
Total net expenses(d) | | | 0.81 | %(e) | | | 0.81 | %(e) | | | 0.81 | %(e) | | | 0.80 | %(c) | | | 0.80 | %(e) | | | 0.80 | %(e) | |
Net investment income | | | 2.87 | % | | | 2.94 | % | | | 2.72 | % | | | 2.83 | %(c) | | | 3.07 | % | | | 3.18 | % | |
Supplemental data | |
Net assets, end of period (in thousands) | | $ | 20,593 | | | $ | 20,973 | | | $ | 23,767 | | | $ | 24,781 | | | $ | 24,708 | | | $ | 23,454 | | |
Portfolio turnover | | | 10 | % | | | 2 | % | | | 15 | % | | | 1 | % | | | 7 | % | | | 11 | % | |
Notes to Financial Highlights
(a) For the period from April 1, 2012 to April 30, 2012. During the period, the Fund's fiscal year end was changed from March 31 to April 30.
(b) In addition to the fees and expenses that the Fund bears directly, the Fund indirectly bears a pro rata share of the fees and expenses of any other funds in which it invests. Such indirect expenses are not included in the Fund's reported expense ratios.
(c) Annualized.
(d) Total net expenses include the impact of certain fee waivers/expense reimbursements made by the Investment Manager and certain of its affiliates, if applicable.
(e) The benefits derived from expense reductions had an impact of less than 0.01%.
The accompanying Notes to Financial Statements are an integral part of this statement.
Annual Report 2015
17
COLUMBIA AMT-FREE MARYLAND INTERMEDIATE MUNI BOND FUND
FINANCIAL HIGHLIGHTS (continued)
| | | Year Ended April 30, | | Year Ended March 31, | |
Class B | | 2015 | | 2014 | | 2013 | | 2012(a) | | 2012 | | 2011 | |
Per share data | |
Net asset value, beginning of period | | $ | 10.81 | | | $ | 11.15 | | | $ | 11.06 | | | $ | 10.97 | | | $ | 10.42 | | | $ | 10.54 | | |
Income from investment operations: | |
Net investment income | | | 0.23 | | | | 0.23 | | | | 0.22 | | | | 0.02 | | | | 0.25 | | | | 0.26 | | |
Net realized and unrealized gain (loss) | | | 0.01 | | | | (0.34 | ) | | | 0.09 | | | | 0.09 | | | | 0.55 | | | | (0.12 | ) | |
Total from investment operations | | | 0.24 | | | | (0.11 | ) | | | 0.31 | | | | 0.11 | | | | 0.80 | | | | 0.14 | | |
Less distributions to shareholders: | |
Net investment income | | | (0.23 | ) | | | (0.23 | ) | | | (0.22 | ) | | | (0.02 | ) | | | (0.25 | ) | | | (0.26 | ) | |
Total distributions to shareholders | | | (0.23 | ) | | | (0.23 | ) | | | (0.22 | ) | | | (0.02 | ) | | | (0.25 | ) | | | (0.26 | ) | |
Net asset value, end of period | | $ | 10.82 | | | $ | 10.81 | | | $ | 11.15 | | | $ | 11.06 | | | $ | 10.97 | | | $ | 10.42 | | |
Total return | | | 2.22 | % | | | (0.90 | %) | | | 2.81 | % | | | 0.99 | % | | | 7.73 | % | | | 1.30 | % | |
Ratios to average net assets(b) | |
Total gross expenses | | | 1.79 | % | | | 1.79 | % | | | 1.75 | % | | | 1.80 | %(c) | | | 1.81 | % | | | 1.72 | % | |
Total net expenses(d) | | | 1.56 | %(e) | | | 1.56 | %(e) | | | 1.56 | %(e) | | | 1.55 | %(c) | | | 1.55 | %(e) | | | 1.55 | %(e) | |
Net investment income | | | 2.13 | % | | | 2.18 | % | | | 1.96 | % | | | 2.08 | %(c) | | | 2.34 | % | | | 2.43 | % | |
Supplemental data | |
Net assets, end of period (in thousands) | | $ | 40 | | | $ | 93 | | | $ | 119 | | | $ | 166 | | | $ | 164 | | | $ | 371 | | |
Portfolio turnover | | | 10 | % | | | 2 | % | | | 15 | % | | | 1 | % | | | 7 | % | | | 11 | % | |
Notes to Financial Highlights
(a) For the period from April 1, 2012 to April 30, 2012. During the period, the Fund's fiscal year end was changed from March 31 to April 30.
(b) In addition to the fees and expenses that the Fund bears directly, the Fund indirectly bears a pro rata share of the fees and expenses of any other funds in which it invests. Such indirect expenses are not included in the Fund's reported expense ratios.
(c) Annualized.
(d) Total net expenses include the impact of certain fee waivers/expense reimbursements made by the Investment Manager and certain of its affiliates, if applicable.
(e) The benefits derived from expense reductions had an impact of less than 0.01%.
The accompanying Notes to Financial Statements are an integral part of this statement.
Annual Report 2015
18
COLUMBIA AMT-FREE MARYLAND INTERMEDIATE MUNI BOND FUND
FINANCIAL HIGHLIGHTS (continued)
| | | Year Ended April 30, | | Year Ended March 31, | |
Class C | | 2015 | | 2014 | | 2013 | | 2012(a) | | 2012 | | 2011 | |
Per share data | |
Net asset value, beginning of period | | $ | 10.80 | | | $ | 11.14 | | | $ | 11.05 | | | $ | 10.96 | | | $ | 10.41 | | | $ | 10.53 | | |
Income from investment operations: | |
Net investment income | | | 0.23 | | | | 0.24 | | | | 0.22 | | | | 0.02 | | | | 0.25 | | | | 0.26 | | |
Net realized and unrealized gain (loss) | | | 0.01 | | | | (0.34 | ) | | | 0.09 | | | | 0.09 | | | | 0.55 | | | | (0.12 | ) | |
Total from investment operations | | | 0.24 | | | | (0.10 | ) | | | 0.31 | | | | 0.11 | | | | 0.80 | | | | 0.14 | | |
Less distributions to shareholders: | |
Net investment income | | | (0.23 | ) | | | (0.24 | ) | | | (0.22 | ) | | | (0.02 | ) | | | (0.25 | ) | | | (0.26 | ) | |
Total distributions to shareholders | | | (0.23 | ) | | | (0.24 | ) | | | (0.22 | ) | | | (0.02 | ) | | | (0.25 | ) | | | (0.26 | ) | |
Net asset value, end of period | | $ | 10.81 | | | $ | 10.80 | | | $ | 11.14 | | | $ | 11.05 | | | $ | 10.96 | | | $ | 10.41 | | |
Total return | | | 2.23 | % | | | (0.90 | %) | | | 2.81 | % | | | 0.99 | % | | | 7.74 | % | | | 1.29 | % | |
Ratios to average net assets(b) | |
Total gross expenses | | | 1.79 | % | | | 1.80 | % | | | 1.76 | % | | | 1.80 | %(c) | | | 1.78 | % | | | 1.72 | % | |
Total net expenses(d) | | | 1.56 | %(e) | | | 1.56 | %(e) | | | 1.56 | %(e) | | | 1.55 | %(c) | | | 1.55 | %(e) | | | 1.55 | %(e) | |
Net investment income | | | 2.11 | % | | | 2.19 | % | | | 1.96 | % | | | 2.09 | %(c) | | | 2.33 | % | | | 2.42 | % | |
Supplemental data | |
Net assets, end of period (in thousands) | | $ | 2,796 | | | $ | 2,666 | | | $ | 2,939 | | | $ | 2,822 | | | $ | 2,838 | | | $ | 3,705 | | |
Portfolio turnover | | | 10 | % | | | 2 | % | | | 15 | % | | | 1 | % | | | 7 | % | | | 11 | % | |
Notes to Financial Highlights
(a) For the period from April 1, 2012 to April 30, 2012. During the period, the Fund's fiscal year end was changed from March 31 to April 30.
(b) In addition to the fees and expenses that the Fund bears directly, the Fund indirectly bears a pro rata share of the fees and expenses of any other funds in which it invests. Such indirect expenses are not included in the Fund's reported expense ratios.
(c) Annualized.
(d) Total net expenses include the impact of certain fee waivers/expense reimbursements made by the Investment Manager and certain of its affiliates, if applicable.
(e) The benefits derived from expense reductions had an impact of less than 0.01%.
The accompanying Notes to Financial Statements are an integral part of this statement.
Annual Report 2015
19
COLUMBIA AMT-FREE MARYLAND INTERMEDIATE MUNI BOND FUND
FINANCIAL HIGHLIGHTS (continued)
| | | Year Ended April 30, | |
Class R4 | | 2015 | | 2014 | | 2013(a) | |
Per share data | |
Net asset value, beginning of period | | $ | 10.80 | | | $ | 11.14 | | | $ | 11.06 | | |
Income from investment operations: | |
Net investment income | | | 0.34 | | | | 0.34 | | | | 0.04 | | |
Net realized and unrealized gain (loss) | | | 0.01 | | | | (0.34 | ) | | | 0.08 | | |
Total from investment operations | | | 0.35 | | | | — | | | | 0.12 | | |
Less distributions to shareholders: | |
Net investment income | | | (0.34 | ) | | | (0.34 | ) | | | (0.04 | ) | |
Total distributions to shareholders | | | (0.34 | ) | | | (0.34 | ) | | | (0.04 | ) | |
Net asset value, end of period | | $ | 10.81 | | | $ | 10.80 | | | $ | 11.14 | | |
Total return | | | 3.25 | % | | | 0.08 | % | | | 1.06 | % | |
Ratios to average net assets(b) | |
Total gross expenses | | | 0.78 | % | | | 0.81 | % | | | 0.71 | %(c) | |
Total net expenses(d) | | | 0.56 | %(e) | | | 0.56 | %(e) | | | 0.55 | %(c) | |
Net investment income | | | 3.12 | % | | | 3.24 | % | | | 2.97 | %(c) | |
Supplemental data | |
Net assets, end of period (in thousands) | | $ | 10 | | | $ | 10 | | | $ | 3 | | |
Portfolio turnover | | | 10 | % | | | 2 | % | | | 15 | % | |
Notes to Financial Highlights
(a) Based on operations from March 19, 2013 (commencement of operations) through the stated period end.
(b) In addition to the fees and expenses that the Fund bears directly, the Fund indirectly bears a pro rata share of the fees and expenses of any other funds in which it invests. Such indirect expenses are not included in the Fund's reported expense ratios.
(c) Annualized.
(d) Total net expenses include the impact of certain fee waivers/expense reimbursements made by the Investment Manager and certain of its affiliates, if applicable.
(e) The benefits derived from expense reductions had an impact of less than 0.01%.
The accompanying Notes to Financial Statements are an integral part of this statement.
Annual Report 2015
20
COLUMBIA AMT-FREE MARYLAND INTERMEDIATE MUNI BOND FUND
FINANCIAL HIGHLIGHTS (continued)
| | | Year Ended April 30, | | Year Ended March 31, | |
Class Z | | 2015 | | 2014 | | 2013 | | 2012(a) | | 2012 | | 2011 | |
Per share data | |
Net asset value, beginning of period | | $ | 10.80 | | | $ | 11.14 | | | $ | 11.05 | | | $ | 10.96 | | | $ | 10.41 | | | $ | 10.53 | | |
Income from investment operations: | |
Net investment income | | | 0.34 | | | | 0.34 | | | | 0.33 | | | | 0.03 | | | | 0.36 | | | | 0.36 | | |
Net realized and unrealized gain (loss) | | | 0.01 | | | | (0.34 | ) | | | 0.09 | | | | 0.09 | | | | 0.55 | | | | (0.11 | ) | |
Total from investment operations | | | 0.35 | | | | — | | | | 0.42 | | | | 0.12 | | | | 0.91 | | | | 0.25 | | |
Less distributions to shareholders: | |
Net investment income | | | (0.34 | ) | | | (0.34 | ) | | | (0.33 | ) | | | (0.03 | ) | | | (0.36 | ) | | | (0.37 | ) | |
Total distributions to shareholders | | | (0.34 | ) | | | (0.34 | ) | | | (0.33 | ) | | | (0.03 | ) | | | (0.36 | ) | | | (0.37 | ) | |
Net asset value, end of period | | $ | 10.81 | | | $ | 10.80 | | | $ | 11.14 | | | $ | 11.05 | | | $ | 10.96 | | | $ | 10.41 | | |
Total return | | | 3.26 | % | | | 0.09 | % | | | 3.84 | % | | | 1.07 | % | | | 8.82 | % | | | 2.31 | % | |
Ratios to average net assets(b) | |
Total gross expenses | | | 0.79 | % | | | 0.79 | % | | | 0.76 | % | | | 0.80 | %(c) | | | 0.77 | % | | | 0.72 | % | |
Total net expenses(d) | | | 0.56 | %(e) | | | 0.56 | %(e) | | | 0.56 | %(e) | | | 0.55 | %(c) | | | 0.55 | %(e) | | | 0.55 | %(e) | |
Net investment income | | | 3.12 | % | | | 3.17 | % | | | 2.96 | % | | | 3.07 | %(c) | | | 3.31 | % | | | 3.43 | % | |
Supplemental data | |
Net assets, end of period (in thousands) | | $ | 68,033 | | | $ | 63,765 | | | $ | 110,105 | | | $ | 110,126 | | | $ | 109,482 | | | $ | 103,031 | | |
Portfolio turnover | | | 10 | % | | | 2 | % | | | 15 | % | | | 1 | % | | | 7 | % | | | 11 | % | |
Notes to Financial Highlights
(a) For the period from April 1, 2012 to April 30, 2012. During the period, the Fund's fiscal year end was changed from March 31 to April 30.
(b) In addition to the fees and expenses that the Fund bears directly, the Fund indirectly bears a pro rata share of the fees and expenses of any other funds in which it invests. Such indirect expenses are not included in the Fund's reported expense ratios.
(c) Annualized.
(d) Total net expenses include the impact of certain fee waivers/expense reimbursements made by the Investment Manager and certain of its affiliates, if applicable.
(e) The benefits derived from expense reductions had an impact of less than 0.01%.
The accompanying Notes to Financial Statements are an integral part of this statement.
Annual Report 2015
21
COLUMBIA AMT-FREE MARYLAND INTERMEDIATE MUNI BOND FUND
NOTES TO FINANCIAL STATEMENTS
April 30, 2015
Note 1. Organization
Columbia AMT-Free Maryland Intermediate Muni Bond Fund (formerly known as Columbia Maryland Intermediate Municipal Bond Fund) (the Fund), a series of Columbia Funds Series Trust (the Trust), is a non-diversified fund. The Trust is registered under the Investment Company Act of 1940, as amended (the 1940 Act), as an open-end management investment company organized as a Delaware statutory trust. Effective July 7, 2014, Columbia Maryland Intermediate Municipal Bond Fund was renamed Columbia AMT-Free Maryland Intermediate Muni Bond Fund.
Fund Shares
The Trust may issue an unlimited number of shares (without par value). The Fund offers Class A, Class B, Class C, Class R4 and Class Z shares. Although all share classes generally have identical voting, dividend and liquidation rights, each share class votes separately when required by the Trust's organizational documents or by law. Different share classes pay different distribution amounts to the extent the expenses of such share classes differ, and distributions in liquidation will be proportional to the net asset value of each share class. Each share class has its own expense structure and sales charges.
Class A shares are subject to a maximum front-end sales charge of 3.00% based on the initial investment amount. In addition, Class A shares purchased on or after February 19, 2015 are subject to a contingent deferred sales charge (CDSC) of 0.75% on certain investments of $500,000 or more if redeemed within 12 months after purchase. Redemptions of Class A shares purchased prior to February 19, 2015, without an initial sales charge in accounts aggregating $1 million to $50 million at the time of purchase, are subject to a CDSC of 1.00% if redeemed within 12 months after purchase, and 0.50% if redeemed more than 12, but less than 18, months after purchase.
Class B shares may be subject to a maximum CDSC of 3.00% based upon the holding period after purchase. Class B shares will generally convert to Class A shares eight years after purchase. The Fund no longer accepts investments by new or existing investors in the Fund's Class B shares, except in connection with the reinvestment of any dividend and/or capital gain distributions in Class B shares of the Fund and exchanges by existing Class B shareholders of certain other funds within the Columbia Family of Funds.
Class C shares are subject to a 1.00% CDSC on shares redeemed within one year after purchase.
Class R4 shares are not subject to sales charges and are generally available only to omnibus retirement plans and certain investors as described in the Fund's prospectus.
Class Z shares are not subject to sales charges and are available only to eligible investors, which are subject to different investment minimums as described in the Fund's prospectus.
Note 2. Summary of Significant Accounting Policies
Basis of Preparation
The Fund is an investment company that applies the accounting and reporting guidance in the Financial Accounting Standards Board (FASB) Accounting Standards Codification Topic 946, Financial Services — Investment Companies (ASC 946). The financial statements are prepared in accordance with U.S. generally accepted accounting principles (GAAP), which requires management to make certain estimates and assumptions that affect the reported amounts of assets and liabilities, the disclosure of contingent assets and liabilities at the date of the financial statements and the reported amounts of income and expenses during the reporting period. Actual results could differ from those estimates.
The following is a summary of significant accounting policies followed by the Fund in the preparation of its financial statements.
Security Valuation
Debt securities generally are valued by pricing services approved by the Board of Trustees (the Board) based upon market transactions for normal, institutional-size trading units of similar securities. The services may use various pricing techniques that take into account, as applicable, factors such as yield, quality, coupon rate, maturity, type of issue, trading characteristics and other data, as well as broker quotes. Debt securities for which quotations are readily available may also be valued based upon an over-the-counter or exchange bid quotation.
Investments for which market quotations are not readily available, or that have quotations which management believes are not reliable, are valued at fair value as determined in good faith under procedures established by and under the general supervision of the Board. If a
Annual Report 2015
22
COLUMBIA AMT-FREE MARYLAND INTERMEDIATE MUNI BOND FUND
NOTES TO FINANCIAL STATEMENTS (continued)
April 30, 2015
security or class of securities (such as foreign securities) is valued at fair value, such value is likely to be different from the quoted or published price for the security.
The determination of fair value often requires significant judgment. To determine fair value, management may use assumptions including but not limited to future cash flows and estimated risk premiums. Multiple inputs from various sources may be used to determine fair value.
Delayed Delivery Securities
The Fund may trade securities on other than normal settlement terms, including securities purchased or sold on a "when-issued" basis. This may increase risk to the Fund since the other party to the transaction may fail to deliver which could cause the Fund to subsequently invest at less advantageous prices. The Fund designates cash or liquid securities in an amount equal to the delayed delivery commitment.
Security Transactions
Security transactions are accounted for on the trade date. Cost is determined and gains (losses) are based upon the specific identification method for both financial statement and federal income tax purposes.
Income Recognition
Interest income is recorded on an accrual basis. Market premiums and discounts, including original issue discounts, are amortized and accreted, respectively, over the expected life of the security on all debt securities, unless otherwise noted.
The Fund may place a debt security on non-accrual status and reduce related interest income when it becomes probable that the interest will not be collected and the amount of uncollectible interest can be reasonably estimated. A defaulted debt security is removed from non-accrual status when the issuer resumes interest payments or when collectability of interest is reasonably assured.
Dividend income is recorded on the ex-dividend date.
Expenses
General expenses of the Trust are allocated to the Fund and other funds of the Trust based upon relative net assets or other expense allocation methodologies determined by the nature of the expense. Expenses directly attributable to the Fund are charged to the Fund. Expenses directly attributable to a specific class of shares are charged to that share class.
Determination of Class Net Asset Value
All income, expenses (other than class-specific expenses, which are charged to that share class, as shown in the Statement of Operations) and realized and unrealized gains (losses) are allocated to each class of the Fund on a daily basis, based on the relative net assets of each class, for purposes of determining the net asset value of each class.
Federal Income Tax Status
The Fund intends to qualify each year as a regulated investment company under Subchapter M of the Internal Revenue Code, as amended, and will distribute substantially all of its tax exempt and taxable income (including net short-term capital gains), if any, for its tax year, and as such will not be subject to federal income taxes. In addition, the Fund intends to distribute in each calendar year substantially all of its net investment income, capital gains and certain other amounts, if any, such that the Fund should not be subject to federal excise tax. Therefore, no federal income or excise tax provision is recorded.
Distributions to Shareholders
Distributions from net investment income, if any, are declared daily and paid monthly. Net realized capital gains, if any, are distributed at least annually. Income distributions and capital gain distributions are determined in accordance with federal income tax regulations, which may differ from GAAP.
Guarantees and Indemnifications
Under the Trust's organizational documents and, in some cases, by contract, its officers and trustees are indemnified against certain liabilities arising out of the performance of their duties to the Trust or its funds. In addition, certain of the Fund's contracts with its service providers contain general indemnification clauses. The Fund's maximum exposure under these arrangements is unknown since the amount of any future claims that may be made against the Fund cannot be determined, and the Fund has no historical basis for predicting the likelihood of any such claims.
Note 3. Fees and Compensation Paid to Affiliates
Investment Management Fees
Under an Investment Management Services Agreement, Columbia Management Investment Advisers, LLC (the Investment Manager), a wholly-owned subsidiary of
Annual Report 2015
23
COLUMBIA AMT-FREE MARYLAND INTERMEDIATE MUNI BOND FUND
NOTES TO FINANCIAL STATEMENTS (continued)
April 30, 2015
Ameriprise Financial, Inc. (Ameriprise Financial), determines which securities will be purchased, held or sold. The investment management fee is an annual fee that is equal to a percentage of the Fund's average daily net assets that declines from 0.40% to 0.27% as the Fund's net assets increase. The effective investment management fee rate for the year ended April 30, 2015 was 0.40% of the Fund's average daily net assets.
Administration Fees
Under an Administrative Services Agreement, the Investment Manager also serves as the Fund Administrator. The Fund pays the Fund Administrator an annual fee for administration and accounting services equal to a percentage of the Fund's average daily net assets that declines from 0.07% to 0.04% as the Fund's net assets increase. The effective administration fee rate for the year ended April 30, 2015 was 0.07% of the Fund's average daily net assets.
Other Expenses
Other expenses are for, among other things, miscellaneous expenses of the Fund or the Board, including payments to a company providing limited administrative services to the Fund and the Board. That company's expenses include boardroom and office expense, employee compensation, employee health and retirement benefits, and certain other expenses. For the year ended April 30, 2015, other expenses paid by the Fund to this company were $1,279.
Compensation of Board Members
Board members are compensated for their services to the Fund as disclosed in the Statement of Operations. Under a Deferred Compensation Plan (the Plan), the Board members who are not "interested persons" of the Fund, as defined under the 1940 Act, may elect to defer payment of up to 100% of their compensation. Deferred amounts are treated as though equivalent dollar amounts had been invested in shares of certain funds managed by the Investment Manager. The Fund's liability for these amounts is adjusted for market value changes and remains in the Fund until distributed in accordance with the Plan.
Transfer Agent Fees
Under a Transfer and Dividend Disbursing Agent Agreement, Columbia Management Investment Services Corp. (the Transfer Agent), an affiliate of the Investment Manager and a wholly-owned subsidiary of Ameriprise Financial, is responsible for providing transfer agency
services to the Fund. The Transfer Agent has contracted with Boston Financial Data Services (BFDS) to serve as sub-transfer agent.
Effective November 1, 2014, the Transfer Agent receives a monthly transfer agency fee based on the number or the average value of accounts, depending on the type of account. Prior to November 1, 2014, the Transfer Agent received a monthly account-based service fee based on the number of open accounts. In addition, the Transfer Agent also receives sub-transfer agency fees based on a percentage of the average aggregate value of the Fund's shares maintained in omnibus accounts (other than omnibus accounts for which American Enterprise Investment Services Inc. is the broker of record or accounts where the beneficial shareholder is a customer of Ameriprise Financial Services, Inc., for which the Transfer Agent receives a per account fee). The Transfer Agent pays the fees of BFDS for services as sub-transfer agent and is not entitled to reimbursement for such fees from the Fund (with the exception of out-of-pocket fees).
The Transfer Agent also receives compensation from the Fund for various shareholder services and reimbursements for certain out-of-pocket fees.
For the year ended April 30, 2015, the Fund's effective transfer agent fee rates as a percentage of average daily net assets of each class were as follows:
Class A | | | 0.20 | % | |
Class B | | | 0.20 | | |
Class C | | | 0.20 | | |
Class R4 | | | 0.19 | | |
Class Z | | | 0.20 | | |
An annual minimum account balance fee of $20 may apply to certain accounts with a value below the applicable share class's initial minimum investment requirements to reduce the impact of small accounts on transfer agent fees. These minimum account balance fees are remitted to the Fund and recorded as part of expense reductions in the Statement of Operations. For the year ended April 30, 2015, these minimum account balance fees reduced total expenses of the Fund by $40.
Distribution and Service Fees
The Fund has an agreement with Columbia Management Investment Distributors, Inc. (the Distributor), an affiliate of the Investment Manager and a wholly-owned subsidiary of Ameriprise Financial, for distribution and shareholder services. The Board has approved, and the Fund has adopted, distribution and shareholder service
Annual Report 2015
24
COLUMBIA AMT-FREE MARYLAND INTERMEDIATE MUNI BOND FUND
NOTES TO FINANCIAL STATEMENTS (continued)
April 30, 2015
plans (the Plans) applicable to certain share classes, which set the distribution and service fees for the Fund. These fees are calculated daily and are intended to compensate the Distributor and/or eligible selling and/or servicing agents for selling shares of the Fund and providing services to investors.
Under the Plans, the Fund pays a monthly combined distribution and service fee to the Distributor at the maximum annual rate of 0.25% of the average daily net assets attributable to Class A shares of the Fund. Also under the Plans, the Fund pays a monthly service fee at the maximum annual rate of 0.25% of the average daily net assets attributable to Class B and Class C shares of the Fund and the payment of a monthly distribution fee at the maximum annual rate of 0.75% of the average daily net assets attributable to Class B and Class C shares of the Fund.
Sales Charges
Sales charges, including front-end charges and CDSCs, received by the Distributor for distributing Fund shares were $16,230 for Class A and $606 for Class C shares for the year ended April 30, 2015.
Expenses Waived/Reimbursed by the Investment Manager and its Affiliates
The Investment Manager and certain of its affiliates have contractually agreed to waive fees and/or reimburse expenses (excluding certain fees and expenses described below) for the period disclosed below, unless sooner terminated at the sole discretion of the Board, so that the Fund's net operating expenses, after giving effect to fees waived/expenses reimbursed and any balance credits and/or overdraft charges from the Fund's custodian, do not exceed the following annual rates as a percentage of the class' average daily net assets:
| | | Fee Rates Contractual
through
August 31, 2015 | |
Class A | | | 0.81 | % | |
Class B | | | 1.56 | | |
Class C | | | 1.56 | | |
Class R4 | | | 0.56 | | |
Class Z | | | 0.56 | | |
Under the agreement governing these fee waivers and/or expense reimbursement arrangements, the following fees and expenses are excluded from the waiver/reimbursement commitment, and therefore will be paid by the Fund, if applicable: taxes (including foreign transaction taxes), expenses associated with
investments in affiliated and non-affiliated pooled investment vehicles (including mutual funds and exchange-traded funds), transaction costs and brokerage commissions, costs related to any securities lending program, dividend expenses associated with securities sold short, inverse floater program fees and expenses, transaction charges and interest on borrowed money, interest, extraordinary expenses and any other expenses the exclusion of which is specifically approved by the Board. Any fees waived and/or expenses reimbursed under the expense reimbursement arrangements described above are not recoverable by the Investment Manager or its affiliates in future periods. This agreement may be modified or amended only with approval from all parties.
Note 4. Federal Tax Information
The timing and character of income and capital gain distributions are determined in accordance with income tax regulations, which may differ from GAAP because of temporary or permanent book to tax differences.
At April 30, 2015, these differences are primarily due to differing treatment for capital loss carryforwards, Trustees' deferred compensation and distributions. To the extent these differences are permanent, reclassifications are made among the components of the Fund's net assets in the Statement of Assets and Liabilities. Temporary differences do not require reclassifications.
The Fund did not have any permanent differences; therefore, no reclassifications were made to the Statement of Assets and Liabilities.
The tax character of distributions paid during the years indicated was as follows:
Year Ended April 30, | | 2015 | | 2014 | |
Ordinary income | | $ | 13,518 | | | $ | 57,964 | | |
Tax-exempt income | | | 2,681,963 | | | | 3,228,969 | | |
Total | | $ | 2,695,481 | | | $ | 3,286,933 | | |
Short-term capital gain distributions, if any, are considered ordinary income distributions for tax purposes.
At April 30, 2015, the components of distributable earnings on a tax basis were as follows:
Undistributed tax-exempt income | | $ | 578,491 | | |
Capital loss carryforwards | | | (1,936,162 | ) | |
Net unrealized appreciation | | | 5,668,880 | | |
Annual Report 2015
25
COLUMBIA AMT-FREE MARYLAND INTERMEDIATE MUNI BOND FUND
NOTES TO FINANCIAL STATEMENTS (continued)
April 30, 2015
At April 30, 2015, the cost of investments for federal income tax purposes was $84,045,448 and the aggregate gross unrealized appreciation and depreciation based on that cost was:
Unrealized appreciation | | $ | 5,827,685 | | |
Unrealized depreciation | | | (158,805 | ) | |
Net unrealized appreciation | | | 5,668,880 | | |
The following capital loss carryforwards, determined at April 30, 2015, may be available to reduce taxable income arising from future net realized gains on investments, if any, to the extent permitted by the Internal Revenue Code:
Year of Expiration | | Amount ($) | |
2017 | | | 1,936,162 | | |
For the year ended April 30, 2015, $387,814 of capital loss carryforward was utilized.
Management of the Fund has concluded that there are no significant uncertain tax positions in the Fund that would require recognition in the financial statements. However, management's conclusion may be subject to review and adjustment at a later date based on factors including, but not limited to, new tax laws, regulations, and administrative interpretations (including relevant court decisions). Generally, the Fund's federal tax returns for the prior three fiscal years remain subject to examination by the Internal Revenue Service.
Note 5. Portfolio Information
The cost of purchases and proceeds from sales of securities, excluding short-term investments and derivatives, if any, aggregated to $14,076,932 and $9,124,100, respectively, for the year ended April 30, 2015. The amount of purchase and sale activity impacts the portfolio turnover rate reported in the Financial Highlights.
Note 6. Shareholder Concentration
At April 30, 2015, one unaffiliated shareholder of record owned 81.8% of the outstanding shares of the Fund in one or more accounts. The Fund has no knowledge about whether any portion of those shares was owned beneficially. Subscription and redemption activity by concentrated accounts may have a significant effect on the operations of the Fund.
Note 7. Line of Credit
The Fund has entered into a revolving credit facility with a syndicate of banks led by JPMorgan Chase Bank, N.A.
whereby the Fund may borrow for the temporary funding of shareholder redemptions or for other temporary or emergency purposes. Pursuant to a December 9, 2014 amendment, the credit facility agreement, which is a collective agreement between the Fund and certain other funds managed by the Investment Manager, severally and not jointly, permits collective borrowings up to $550 million. Interest is charged to each participating fund based on its borrowings at a rate equal to the higher of (i) the overnight federal funds rate plus 1.00% or (ii) the one-month LIBOR rate plus 1.00%. Each borrowing under the credit facility matures no later than 60 days after the date of borrowing. The Fund also pays a commitment fee equal to its pro rata share of the amount of the credit facility at a rate of 0.075% per annum. The commitment fee is included in other expenses in the Statement of Operations. Prior to the December 9, 2014 amendment, the credit facility agreement permitted borrowings up to $500 million under the same terms and interest rates as described above.
The Fund had no borrowings during the year ended April 30, 2015.
Note 8. Significant Risks
Credit Risk
Credit risk is the risk that the value of debt securities in the Fund's portfolio may decline because the issuer may default and fail to pay interest or repay principal when due. Rating agencies assign credit ratings to debt securities to indicate their credit risk. Lower rated or unrated debt securities held by the Fund may present increased credit risk as compared to higher-rated debt securities.
Interest Rate Risk
Interest rate risk is the risk of losses attributable to changes in interest rates. In general, if prevailing interest rates rise, the values of debt securities tend to fall, and if interest rates fall, the values of debt securities tend to rise. Actions by governments and central banking authorities can result in increases in interest rates. Increasing interest rates may negatively affect the value of debt securities held by the Fund, resulting in a negative impact on the Fund's performance and net asset value per share. In general, the longer the maturity or duration of a debt security, the greater its sensitivity to changes in interest rates.
Annual Report 2015
26
COLUMBIA AMT-FREE MARYLAND INTERMEDIATE MUNI BOND FUND
NOTES TO FINANCIAL STATEMENTS (continued)
April 30, 2015
Liquidity Risk
Liquidity risk is the risk associated with a lack of marketability of investments which may make it difficult to sell the investment at a desirable time or price. Changing regulatory, market or other conditions or environments (for example, the interest rate or credit environments) may adversely affect the liquidity of the Fund's investments. The Fund may have to accept a lower selling price for the holding, sell other investments, or forego another, more appealing investment opportunity. Generally, the less liquid the market at the time the Fund sells a portfolio investment, the greater the risk of loss or decline of value to the Fund. A less liquid market can lead to an increase in Fund redemptions, which may negatively impact Fund performance and net asset value per share, including, for example, if the Fund is forced to sell securities in a down market.
Geographic Concentration Risk
Because state-specific tax-exempt funds invest primarily in the municipal securities issued by the state and political sub-divisions of the state, the Fund will be particularly affected by political and economic conditions and developments in the state in which it invests. The Fund may, therefore, have a greater risk than that of a municipal bond fund which is more geographically diversified. The value of the municipal securities owned by the Fund also may be adversely affected by future changes in federal or state income tax laws.
Non-Diversification Risk
A non-diversified fund is permitted to invest a greater percentage of its total assets in fewer issuers than a diversified fund. The Fund may, therefore, have a greater risk of loss from a few issuers than a similar fund that invests more broadly.
Note 9. Subsequent Events
Management has evaluated the events and transactions that have occurred through the date the financial statements were issued and noted no items requiring adjustment of the financial statements or additional disclosure.
Note 10. Information Regarding Pending and Settled Legal Proceedings
In December 2005, without admitting or denying the allegations, American Express Financial Corporation (AEFC, which is now known as Ameriprise Financial, Inc. (Ameriprise Financial)) entered into settlement
agreements with the Securities and Exchange Commission (SEC) and Minnesota Department of Commerce (MDOC) related to market timing activities. As a result, AEFC was censured and ordered to cease and desist from committing or causing any violations of certain provisions of the Investment Advisers Act of 1940, the Investment Company Act of 1940, and various Minnesota laws. AEFC agreed to pay disgorgement of $10 million and civil money penalties of $7 million. AEFC also agreed to retain an independent distribution consultant to assist in developing a plan for distribution of all disgorgement and civil penalties ordered by the SEC in accordance with various undertakings detailed at www.sec.gov/litigation/admin/ia-2451.pdf. Ameriprise Financial and its affiliates have cooperated with the SEC and the MDOC in these legal proceedings, and have made regular reports to the Funds' Boards of Trustees.
Ameriprise Financial and certain of its affiliates have historically been involved in a number of legal, arbitration and regulatory proceedings, including routine litigation, class actions, and governmental actions, concerning matters arising in connection with the conduct of their business activities. Ameriprise Financial believes that the Funds are not currently the subject of, and that neither Ameriprise Financial nor any of its affiliates are the subject of, any pending legal, arbitration or regulatory proceedings that are likely to have a material adverse effect on the Funds or the ability of Ameriprise Financial or its affiliates to perform under their contracts with the Funds. Ameriprise Financial is required to make quarterly (10-Q), annual (10-K) and, as necessary, 8-K filings with the Securities and Exchange Commission on legal and regulatory matters that relate to Ameriprise Financial and its affiliates. Copies of these filings may be obtained by accessing the SEC website at www.sec.gov.
There can be no assurance that these matters, or the adverse publicity associated with them, will not result in increased fund redemptions, reduced sale of fund shares or other adverse consequences to the Funds. Further, although we believe proceedings are not likely to have a material adverse effect on the Funds or the ability of Ameriprise Financial or its affiliates to perform under their contracts with the Funds, these proceedings are subject to uncertainties and, as such, we are unable to estimate the possible loss or range of loss that may result. An adverse outcome in one or more of these proceedings could result in adverse judgments, settlements, fines, penalties or other relief that could have a material adverse effect on the consolidated financial condition or results of operations of Ameriprise Financial.
Annual Report 2015
27
COLUMBIA AMT-FREE MARYLAND INTERMEDIATE MUNI BOND FUND
REPORT OF INDEPENDENT REGISTERED PUBLIC ACCOUNTING FIRM
To the Trustees of Columbia Funds Series Trust and the Shareholders of
Columbia AMT-Free Maryland Intermediate Muni Bond Fund (formerly known as Columbia Maryland Intermediate Municipal Bond Fund)
In our opinion, the accompanying statement of assets and liabilities, including the portfolio of investments, and the related statements of operations and of changes in net assets and the financial highlights present fairly, in all material respects, the financial position of Columbia AMT-Free Maryland Intermediate Muni Bond Fund (formerly known as Columbia Maryland Intermediate Municipal Bond Fund) (the "Fund", a series of Columbia Funds Series Trust) at April 30, 2015, and the results of its operations, the changes in its net assets and the financial highlights for each of the periods indicated, in conformity with accounting principles generally accepted in the United States of America. These financial statements and financial highlights (hereafter referred to as "financial statements") are the responsibility of the Fund's management. Our responsibility is to express an opinion on these financial statements based on our audits. We conducted our audits of these financial statements in accordance with the standards of the Public Company Accounting Oversight Board (United States). Those standards require that we plan and perform the audit to obtain reasonable assurance about whether the financial statements are free of material misstatement. An audit includes examining, on a test basis, evidence supporting the amounts and disclosures in the financial statements, assessing the accounting principles used and significant estimates made by management, and evaluating the overall financial statement presentation. We believe that our audits, which included confirmation of securities at April 30, 2015 by correspondence with the custodian and brokers, provide a reasonable basis for our opinion.
PricewaterhouseCoopers LLP
Minneapolis, Minnesota
June 19, 2015
Annual Report 2015
28
COLUMBIA AMT-FREE MARYLAND INTERMEDIATE MUNI BOND FUND
FEDERAL INCOME TAX INFORMATION
(Unaudited)
The Fund hereby designates the following tax attributes for the fiscal year ended April 30, 2015. Shareholders will be notified in early 2016 of the amounts for use in preparing 2015 income tax returns.
Tax Designations
| Exempt-Interest Dividends | | | 99.50 | % | |
Exempt-Interest Dividends. The percentage of net investment income distributed during the fiscal year that qualifies as exempt-interest dividends for federal income tax purposes.
Annual Report 2015
29
COLUMBIA AMT-FREE MARYLAND INTERMEDIATE MUNI BOND FUND
Shareholders elect the Board that oversees the Funds' operations. The Board appoints officers who are responsible for day-to-day business decisions based on policies set by the Board. The following table provides basic biographical information about the Funds' Board members, including their principal occupations during the past five years, although specific titles for individuals may have varied over the period. Under current Board policy, members may serve through the end of the calendar year in which he or she reaches either the mandatory retirement age established by the Board or the fifteenth anniversary of the first Board meeting they attended as a member of the Board.
Independent Trustees
Name,
Address,
Year of Birth | | Position Held
With Funds and
Length of Service | | Principal Occupation(s)
During Past Five Years
and Other Relevant
Professional Experience | | Number of
Funds in the
Fund Family
Overseen by
Board Member | | Other Present or Past
Directorships/
Trusteeships
(Within Past 5 Years) | |
Kathleen Blatz
901 S. Marquette Ave.
Minneapolis, MN 55402
1954 | | Board member since 1/06 for RiverSource Funds and since 6/11 for Nations Funds | | Attorney; specializing in arbitration and mediation; Chief Justice, Minnesota Supreme Court, 1998-2006; Associate Justice, Minnesota Supreme Court, 1996-1998; Fourth Judicial District Court Judge, Hennepin County, 1994-1996; Attorney in private practice and public service, 1984-1993; State Representative, Minnesota House of Representatives, 1979-1993, which included service on the Tax and Financial Institutions and Insurance Committees | | | 127 | | | Trustee, BlueCross BlueShield of Minnesota (Chair of the Business Development Committee) since 2009; Chair of the Robina Foundation since August 2013 | |
Edward J. Boudreau, Jr.
901 S. Marquette Ave.
Minneapolis, MN 55402
1944 | | Board member since 6/11 for RiverSource Funds and since 1/05 for Nations Funds | | Managing Director, E.J. Boudreau & Associates (consulting) since 2000; FINRA Industry Arbitrator, 2002-present; Chairman and Chief Executive Officer, John Hancock Funds (asset management), Chairman and Interested Trustee for open-end and closed-end funds offered by John Hancock, 1989-2000; John Hancock Life Insurance Company, including SVP and Treasurer and SVP Information Technology, 1968-1988 | | | 125 | | | Former Trustee, BofA Funds Series Trust (11 funds), 2005-2011; Trustee, Boston Museum of Science (Chair of Finance Committee), 1985-2013 | |
Pamela G. Carlton
901 S. Marquette Ave.
Minneapolis, MN 55402
1954 | | Board member since 7/07 for RiverSource Funds and since 6/11 for Nations Funds | | President, Springboard — Partners in Cross Cultural Leadership (consulting company) since 2003; Managing Director of US Equity Research, JP Morgan Chase, 1999-2003; Director of US Equity Research, Chase Asset Management, 1996-1999; Co-Director Latin America Research, 1993-1996, COO Global Research, 1992-1996, Co-Director of US Research, 1991-1992, Investment Banker, Morgan Stanley, 1982-1991 | | | 127 | | | None | |
Annual Report 2015
30
COLUMBIA AMT-FREE MARYLAND INTERMEDIATE MUNI BOND FUND
TRUSTEES AND OFFICERS (continued)
Independent Trustees (continued)
Name,
Address,
Year of Birth | | Position Held
With Funds and
Length of Service | | Principal Occupation(s)
During Past Five Years
and Other Relevant
Professional Experience | | Number of
Funds in the
Fund Family
Overseen by
Board Member | | Other Present or Past
Directorships/
Trusteeships
(Within Past 5 Years) | |
William P. Carmichael
901 S. Marquette Ave.
Minneapolis, MN 55402
1943 | | Chair of the Board since 1/14, Board member since 6/11 for RiverSource Funds and since 2003 for Nations Funds | | Retired; Co-founder, The Succession Fund (provides exit strategies to owners of privately held companies) 1998-2007; Adjunct Professor of Finances, Kelley School of Business, Indiana University, 1993-2007; Senior Vice President, Sara Lee Corporation, 1991-1993; Senior Vice President and Chief Financial Officer, Beatrice Foods Company, 1984-1990; Vice President, Esmark, Inc., 1973-1984; Associate, Price Waterhouse, 1968-1972 | | | 127 | | | Director, Cobra Electronics Corporation (electronic equipment manufacturer), 1994-August 2014; The Finish Line (athletic shoes and apparel) since July 2003; Director, International Textile Corp. since 2012; former Director, McMoRan Exploration Company (oil and gas exploration and development) 2010-2013; former Trustee, BofA Funds Series Trust (11 funds) 2009-2011; Director, Spectrum Brands, Inc. (consumer products), 2002-2009; Director, Simmons Company (bedding), 2004-2010 | |
Patricia M. Flynn
901 S. Marquette Ave.
Minneapolis, MN 55402
1950 | | Board member since 11/04 for RiverSource Funds and since 6/11 for Nations Funds | | Trustee Professor of Economics and Management, Bentley University since 1976 (also teaches and conducts research on corporate governance); Dean, McCallum Graduate School of Business, Bentley University, 1992-2002 | | | 127 | | | Trustee, MA Taxpayers Foundation since 1997; Board of Governors, Innovation Institute, MA Technology Collaborative since 2010 | |
William A. Hawkins
901 S. Marquette Ave.
Minneapolis, MN 55402
1942 | | Board member since 6/11 for RiverSource Funds and since 1/05 for Nations Funds | | Managing Director, Overton Partners (financial consulting), since August 2010; President and Chief Executive Officer, California General Bank, N.A., January 2008-August 2010; Operation Hope, COO, 2004-2007; IndyMac Bancorp, President, CBG, 1999-2003; American General Bank, President, 1997-1999; Griffin Financial Services, CEO, 1981-1997; The Griffin Funds, CEO, 1992-1998 | | | 125 | | | Trustee, BofA Funds Series Trust (11 funds) | |
R. Glenn Hilliard
901 S. Marquette Ave.
Minneapolis, MN 55402
1943 | | Board member since 6/11 for RiverSource Funds and since 1/05 for Nations Funds | | Chairman and Chief Executive Officer, Hilliard Group LLC (investing and consulting) since April 2003; Non-Executive Director & Chairman, CNO Financial Group, Inc. (insurance), September 2003-May 2011 | | | 125 | | | Chairman, BofA Funds Series Trust (11 funds); former Director, CNO Financial Group, Inc. (insurance) 2003-2011 | |
Annual Report 2015
31
COLUMBIA AMT-FREE MARYLAND INTERMEDIATE MUNI BOND FUND
TRUSTEES AND OFFICERS (continued)
Independent Trustees (continued)
Name,
Address,
Year of Birth | | Position Held
With Funds and
Length of Service | | Principal Occupation(s)
During Past Five Years
and Other Relevant
Professional Experience | | Number of
Funds in the
Fund Family
Overseen by
Board Member | | Other Present or Past
Directorships/
Trusteeships
(Within Past 5 Years) | |
Catherine James Paglia
901 S. Marquette Ave.
Minneapolis, MN 55402
1952 | | Board member since 11/04 for RiverSource Funds and since 6/11 for Nations Funds | | Director, Enterprise Asset Management, Inc. (private real estate and asset management company) since September 1998; Managing Director and Partner, Interlaken Capital, Inc., 1989-1997; Managing Director, Morgan Stanley, 1982-1989; Vice President, Investment Banking, 1980-1982, Associate, Investment Banking, 1976-1980, Dean Witter Reynolds, Inc. | | | 127 | | | Director, Valmont Industries, Inc. (irrigation systems manufacturer) since 2012; Trustee, Carleton College (on the Investment Committee); Trustee, Carnegie Endowment for International Peace (on the Investment Committee) | |
Leroy C. Richie
901 S. Marquette Ave.
Minneapolis, MN 55402
1941 | | Board member since 2000 for Seligman Funds, since 11/08 for RiverSource Funds and since 6/11 for Nations Funds | | Counsel, Lewis & Munday, P.C. (law firm) since 2004; Vice President and General Counsel, Automotive Legal Affairs, Chrysler Corporation, 1993-1997 | | | 127 | | | Lead Outside Director, Digital Ally, Inc. (digital imaging) since September 2005; Director, Infinity, Inc. (oil and gas exploration and production) since 1994; Director, OGE Energy Corp. (energy and energy services) 2007-2014 | |
Minor M. Shaw
901 S. Marquette Ave.
Minneapolis, MN 55402
1947 | | Board member since 6/11 for RiverSource Funds and since 2003 for Nations Funds | | President, Micco LLC (private investments) since 2011; President, Micco Corp. (family investment business) 1998-2011 | | | 125 | | | Director, Piedmont Natural Gas; Director, BlueCross BlueShield of South Carolina since April 2008; Chair of the Duke Endowment; Director, National Association of Corporate Directors, Carolinas Chapter, since 2013; Chair of Greenville-Spartanburg Airport Commission; former Trustee, BofA Funds Series Trust (11 funds), 2003-2011 | |
Alison Taunton-Rigby
901 S. Marquette Ave.
Minneapolis, MN 55402
1944 | | Board member since 11/02 for RiverSource Funds and since 6/11 for Nations Funds | | Managing Director, Forester Biotech (consulting) since 2001; Chief Executive Officer and Director, RiboNovix, Inc., (biotechnology) 2003-2010; President and Chief Executive Officer of CMT Inc., 2001-2003; Aquila Biopharmaceuticals Inc., 1996-2000; Cambridge Biotech Corporation, 1995-1996, Mitotix Inc., 1993-1994 | | | 127 | | | Director, Healthways, Inc. (health and well-being solutions) since 2005; Director, ICI Mutual Insurance Company since 2011; Director, Abt Associates (government contractor) since 2001; Director, Boston Children's Hospital since 2002 | |
Annual Report 2015
32
COLUMBIA AMT-FREE MARYLAND INTERMEDIATE MUNI BOND FUND
TRUSTEES AND OFFICERS (continued)
Interested Trustee Not Affiliated with Investment Manager*
Name,
Address,
Year of Birth | | Position Held
With Funds and
Length of Service | | Principal Occupation
During Past Five Years | | Number of
Funds in the
Fund Family
Overseen by
Board Member | | Other Present or Past
Directorships/
Trusteeships
(Within Past 5 Years) | |
Anthony M. Santomero
901 S. Marquette Ave.
Minneapolis, MN 55402
1946 | | Board member since 6/11 for RiverSource Funds and since 1/08 for Nations Funds | | Richard K. Mellon Professor Emeritus of Finance, The Wharton School, University of Pennsylvania, since 2002; Senior Advisor, McKinsey & Company (consulting), 2006-2008; President, Federal Reserve Bank of Philadelphia, 2000-2006, Professor of Finance, The Wharton School, University of Pennsylvania, 1972-2002 | | | 125 | | | Director, Renaissance Reinsurance Ltd. since May 2008; Trustee, Penn Mutual Life Insurance Company since March 2008; Director, Citigroup Inc. since 2009; Director, Citibank, N.A. since 2009; former Trustee, BofA Funds Series Trust (11 funds), 2008-2011 | |
* Dr. Santomero is not an affiliated person of the Investment Manager or Ameriprise Financial. However, he is currently deemed by the Funds to be an "interested person" (as defined in the 1940 Act) of the Funds because he serves as a Director of Citigroup Inc. and Citibank, N.A., companies that may directly or through subsidiaries and affiliates engage from time-to-time in brokerage execution, principal transactions and lending relationships with the Funds or accounts advised/managed by the Investment Manager.
Interested Trustee Affiliated with Investment Manager*
Name,
Address,
Year of Birth | | Position Held
With Funds and
Length of Service | | Principal Occupation
During Past Five Years | | Number of
Funds in the
Fund Family
Overseen by
Board Member | | Other Present or Past
Directorships/
Trusteeships
(Within Past 5 Years) | |
William F. Truscott
53600 Ameriprise
Financial Center
Minneapolis, MN 55474
1960 | | Board member since 11/01 for RiverSource Funds and since 6/11 for Nations Funds; Senior Vice President since 2002 for RiverSource Funds and since 5/10 for Nations Funds | | Chairman of the Board and President, Columbia Management Investment Advisers, LLC since May 2010 and February 2012, respectively (previously President and Chief Investment Officer, 2001-April 2010); Chief Executive Officer, Global Asset Management, Ameriprise Financial, Inc. since September 2012 (previously Chief Executive Officer, U.S. Asset Management & President, Annuities, May 2010-September 2012 and President — U.S. Asset Management and Chief Investment Officer, 2005-April 2010); Director and Chief Executive Officer, Columbia Management Investment Distributors, Inc. since May 2010 and February 2012, respectively (previously Chairman of the Board and Chief Executive Officer, 2006-April 2010); Chairman of the Board and Chief Executive Officer, RiverSource Distributors, Inc. since 2006; Director, Threadneedle Asset Management Holdings, SARL since 2014; President and Chief Executive Officer, Ameriprise Certificate Company, 2006-August 2012 | | | 186 | | | Former Director, Ameriprise Certificate Company, 2006-January 2013 | |
* Interested person (as defined under the 1940 Act) by reason of being an officer, director, security holder and/or employee of the Investment Manager or Ameriprise Financial.
Annual Report 2015
33
COLUMBIA AMT-FREE MARYLAND INTERMEDIATE MUNI BOND FUND
TRUSTEES AND OFFICERS (continued)
The Statement of Additional Information has additional information about the Fund's Board members and is available, without charge, upon request by calling 800.345.6611; contacting your financial intermediary or visiting columbiathreadneedle.com/us.
The Board has appointed officers who are responsible for day-to-day business decisions based on policies it has established. The officers serve at the pleasure of the Board. In addition to Mr. Truscott, who is Senior Vice President, the Funds' other officers are:
Fund Officers
Name,
Address and
Year of Birth | | Position and Year
First Appointed to
Position for any Fund
in the Columbia
Funds Complex or a
Predecessor Thereof | | Principal Occupation(s) During Past Five Years | |
Christopher O. Petersen
5228 Ameriprise
Financial Center
Minneapolis, MN 55474
Born 1970 | | President and Principal Executive Officer (2015) | | Vice President and Lead Chief Counsel, Ameriprise Financial, Inc. since January 2015 (previously, Vice President and Chief Counsel January 2010-December 2014; and Vice President and Group Counsel or Counsel 2004-January 2010); officer of Columbia Funds and affiliated funds since 2007. | |
Michael G. Clarke
225 Franklin Street
Boston, MA 02110
Born 1969 | | Treasurer (2011) and Chief Financial Officer (2009) | | Vice President — Mutual Fund Administration, Columbia Management Investment Advisers, LLC, since May 2010; Managing Director of Fund Administration, Columbia Management Advisors, LLC, September 2004-April 2010; senior officer of Columbia Funds and affiliated funds since 2002. | |
Paul B. Goucher
100 Park Avenue
New York, NY 10017
Born 1968 | | Senior Vice President (2011), Chief Legal Officer (2015) and Assistant Secretary (2008) | | Vice President and Lead Chief Counsel, Ameriprise Financial, Inc. since November 2008 and January 2013, respectively (previously Chief Counsel, January 2010-January 2013 and Group Counsel, November 2008-January 2010). | |
Thomas P. McGuire
225 Franklin Street
Boston, MA 02110
Born 1972 | | Vice President and Chief Compliance Officer (2012) | | Vice President — Asset Management Compliance, Ameriprise Financial, Inc., since May 2010; Chief Compliance Officer, Ameriprise Certificate Company since September 2010; Compliance Executive, Bank of America, 2005-April 2010. | |
Colin Moore
225 Franklin Street
Boston, MA 02110
Born 1958 | | Senior Vice President (2010) | | Executive Vice President and Global Chief Investment Officer, Ameriprise Financial, Inc., since July 2013; Director and Global Chief Investment Officer, Columbia Management Investment Advisers, LLC since May 2010; Manager, Managing Director and Chief Investment Officer, Columbia Management Advisors, LLC, 2007-April 2010. | |
Michael E. DeFao
225 Franklin Street
Boston, MA 02110
Born 1968 | | Vice President (2011) and Assistant Secretary (2010) | | Vice President and Chief Counsel, Ameriprise Financial, Inc. since May 2010; Associate General Counsel, Bank of America, 2005-April 2010. | |
Joseph F. DiMaria
225 Franklin Street
Boston, MA 02110
Born 1968 | | Vice President (2011), Assistant Treasurer (2012) and Chief Accounting Officer (2008) | | Vice President — Mutual Fund Treasurer, Columbia Management Investment Advisers, LLC since May 2010; Director of Fund Administration, Columbia Management Advisors, LLC, 2006-April 2010. | |
Amy Johnson
5228 Ameriprise
Financial Center
Minneapolis, MN 55474
Born 1965 | | Vice President (2006) | | Managing Director and Chief Operating Officer, Columbia Management Investment Advisers, LLC since May 2010 (previously Chief Administrative Officer, 2009-April 2010, and Vice President — Asset Management and Trust Company Services, 2006-2009). | |
Lyn Kephart-Strong
5228 Ameriprise
Financial Center
Minneapolis, MN 55474
Born 1960 | | Vice President (2015) | | President, Columbia Management Investment Services Corp. since October 2014; Vice President & Resolution Officer, Ameriprise Trust Company since August 2009; President, RiverSource Service Corporation 2004-2010. | |
Ryan C. Larrenaga
225 Franklin Street
Boston, MA 02110
Born 1970 | | Vice President and Secretary (2015) | | Vice President and Group Counsel, Ameriprise Financial, Inc. since August 2011 (previously, Counsel from May 2010 to August 2011); Assistant General Counsel, Bank of America, 2005-April 2010; officer of Columbia Funds and affiliated funds since 2005. | |
Annual Report 2015
34
COLUMBIA AMT-FREE MARYLAND INTERMEDIATE MUNI BOND FUND
APPROVAL OF INVESTMENT MANAGEMENT SERVICES AGREEMENT
Columbia Management Investment Advisers, LLC (Columbia Management or the Investment Manager), a wholly-owned subsidiary of Ameriprise Financial, Inc. (Ameriprise Financial), serves as the investment manager to Columbia AMT-Free Maryland Intermediate Muni Bond Fund (the Fund). Under an investment management services agreement (the IMS Agreement), Columbia Management provides investment advice and other services to the Fund and other funds distributed by Columbia Management Investment Distributors, Inc. (collectively, the Funds).
The Fund's Board of Trustees (the Board), including the independent Board members (the Independent Trustees), considered the renewal of the IMS Agreement for a two-month period (Short-Term Period) in order to align the IMS Agreement with the review cycle of other funds in the Columbia family of funds. Columbia Management prepared detailed reports for the Board and its Contracts Committee in January, March and April 2015, including reports based on analyses of data provided by an independent organization (Lipper) and a comprehensive response to each item of information requested by independent legal counsel to the Independent Trustees (Independent Legal Counsel) in a letter to the Investment Manager, to assist the Board in making this determination. In addition, throughout the year, the Board (or its committees) regularly meets with portfolio management teams and senior management personnel, and reviews information prepared by Columbia Management addressing the services Columbia Management provides and Fund performance. The Board also accords appropriate weight to the work, deliberations and conclusions of the Contracts Committee, the Investment Review Committee and the Compliance Committee in determining whether to continue the IMS Agreement.
The Board, at its April 13-15, 2015 in-person Board meeting (the April Meeting), considered the renewal of the IMS Agreement for the Short-Term Period. At the April Meeting, Independent Legal Counsel reviewed with the Independent Trustees various factors relevant to the Board's consideration of advisory agreements and the Board's legal responsibilities related to such consideration. Following an analysis and discussion of the factors identified below, the Board, including all of the Independent Trustees, approved the renewal of the IMS Agreement for the Short-Term Period.
Nature, Extent and Quality of Services Provided by Columbia Management
The Independent Trustees analyzed various reports and presentations they had received detailing the services performed by Columbia Management, as well as its expertise, resources and capabilities. The Independent Trustees specifically considered many developments during the past year concerning the services provided by Columbia Management. The Independent Trustees noted the information they received concerning Columbia Management's ability to retain its key portfolio management personnel. In evaluating the quality of services provided under the IMS Agreement and the Fund's Administrative Services Agreement, the Independent Trustees also took into account the organization and strength of the Fund's and its service providers' compliance programs. In addition, the Board also reviewed the financial condition of Columbia Management (and its affiliates) and each entity's ability to carry out its responsibilities under the IMS Agreement and the Fund's other services agreements with affiliates of Ameriprise Financial, observing the financial strength of Ameriprise Financial, with its solid balance sheet. The Board also discussed the acceptability of the terms of the IMS Agreement for the Short-Term Period.
Based on the foregoing, and based on other information received (both oral and written, including the information on investment performance referenced below) and other considerations, the Board concluded that the services being performed by Columbia Management and its affiliates were acceptable for the Short-Term Period.
Investment Performance
For purposes of evaluating the nature, extent and quality of services provided under the IMS Agreement, the Board carefully reviewed the investment performance of the Fund. In this regard, the Board considered detailed reports providing the results of analyses performed by an independent organization showing, for various periods, the performance of the Fund, the performance of a benchmark index, the percentage ranking of the Fund among its comparison group and the net assets of the Fund. The Board observed that for purposes of approving the IMS Agreement for the Short-Term Period, the Fund's performance was acceptable.
Annual Report 2015
35
COLUMBIA AMT-FREE MARYLAND INTERMEDIATE MUNI BOND FUND
APPROVAL OF INVESTMENT MANAGEMENT SERVICES AGREEMENT (continued)
Comparative Fees, Costs of Services Provided and the Profits Realized By Columbia Management and its Affiliates from their Relationships with the Fund
The Board reviewed comparative fees and the costs of services provided under the IMS Agreement. The Board members considered detailed comparative information set forth in an annual report on fees and expenses, including, among other things, data (based on analyses conducted by an independent organization) showing a comparison of the Fund's expenses with median expenses paid by funds in its comparative peer universe, as well as data showing the Fund's contribution to Columbia Management's profitability.
The Board accorded particular weight to the notion that the level of fees should reflect a rational pricing model applied consistently across the various product lines in the Fund family, while assuring that the overall fees for each Fund (with few defined exceptions) are generally in line with the "pricing philosophy" currently in effect (i.e., that the total expense ratio of the Fund is no higher than the median expense ratio of funds in the same comparison universe of the Fund).
The Board also considered the expected profitability of Columbia Management and its affiliates in connection with Columbia Management providing investment management services to the Fund. In this regard, the Board referred to a detailed profitability report, discussing the profitability to Columbia Management and Ameriprise Financial from managing, operating and distributing the Funds. For purposes of approving the IMS Agreement for the Short-Term Period, the Board concluded that the investment management service fees were fair and reasonable, observing that the profitability levels also seemed reasonable.
Economies of Scale to be Realized
The Board also considered the economies of scale that might be realized by Columbia Management as the Fund grows and took note of the extent to which Fund shareholders might also benefit from such growth. In this regard, the Independent Trustees took into account that IMS fees decline as Fund assets exceed various breakpoints.
Based on the foregoing, the Board, including all of the Independent Trustees, concluded that, for purposes of its consideration of the renewal of the IMS Agreement for the Short-Term Period, the investment management service fees were fair and reasonable in light of the extent and quality of services provided. In reaching this conclusion, no single factor was determinative. The Board noted its understanding that it would undertake the full consideration of renewal of the IMS Agreement for the full annual period at its June 2015 meetings. On April 15, 2015, the Board, including all of the Independent Trustees, approved the renewal of the IMS Agreement for the Short-Term Period.
Annual Report 2015
36
COLUMBIA AMT-FREE MARYLAND INTERMEDIATE MUNI BOND FUND
IMPORTANT INFORMATION ABOUT THIS REPORT
Each fund mails one shareholder report to each shareholder address. If you would like more than one report, please call shareholder services at 800.345.6611 and additional reports will be sent to you.
The policy of the Board is to vote the proxies of the companies in which each fund holds investments consistent with the procedures as stated in the Statement of Additional Information (SAI). You may obtain a copy of the SAI without charge by calling 800.345.6611; contacting your financial intermediary; visiting columbiathreadneedle.com/us; or searching the website of the Securities and Exchange Commission (SEC) at sec.gov. Information regarding how each fund voted proxies relating to portfolio securities is filed with the SEC by August 31st for the most recent 12-month period ending June 30th of that year, and is available without charge by visiting columbiathreadneedle.com/us, or searching the website of the SEC at sec.gov.
Each fund files a complete schedule of portfolio holdings with the SEC for the first and third quarters of each fiscal year on Form N-Q. Each fund's Form N-Q is available on the SEC's website at sec.gov and may be reviewed and copied at the SEC's Public Reference Room in Washington, D.C. Information on the operation of the Public Reference Room may be obtained by calling 800.SEC.0330. Each fund's complete schedule of portfolio holdings, as filed on Form N-Q, can also be obtained without charge, upon request, by calling 800.345.6611.
Annual Report 2015
37
Columbia AMT-Free Maryland Intermediate Muni Bond Fund
P.O. Box 8081
Boston, MA 02266-8081

This information is for use with concurrent or prior delivery of a fund prospectus. Please read and consider the investment objectives, risks, charges and expenses for any fund carefully before investing. For a prospectus and summary prospectus, which contains this and other important information about the Fund, go to columbiathreadneedle.com/us. The Fund is distributed by Columbia Management Investment Distributors, Inc., member FINRA, and managed by Columbia Management Investment Advisers, LLC.
Columbia Threadneedle Investments (Columbia Threadneedle) is the global brand name of the Columbia and Threadneedle group of companies.
All rights reserved. Columbia Management Investment Distributors, Inc., 225 Franklin Street, Boston, MA 02110-2804
© 2015 Columbia Management Investment Advisers, LLC.
columbiathreadneedle.com/us
ANN190_04_E01_(06/15)

ANNUAL REPORT
April 30, 2015

COLUMBIA AMT-FREE SOUTH CAROLINA INTERMEDIATE MUNI BOND FUND

ABOUT COLUMBIA THREADNEEDLE INVESTMENTS
Columbia Threadneedle Investments is a leading global asset management group that provides a broad range of actively managed investment strategies and solutions for individual, institutional and corporate clients around the world.
With more than 2,000 people, including over 450 investment professionals based in North America, Europe and Asia, we manage $506 billion* of assets across developed and emerging market equities, fixed income, asset allocation solutions and alternatives. We are the 12th largest manager of long-term mutual fund assets in the U.S.** and the 5th largest manager of retail funds in the U.K.***
Our priority is the investment success of our clients. We aim to deliver the investment outcomes they expect through an investment approach that is team-based, performance-driven and risk-aware. Our culture is dynamic and interactive. By sharing our insights across asset classes and geographies, we generate richer perspectives on global, regional and local investment landscapes. The ability to exchange and debate investment ideas in a collaborative environment enriches our teams' investment processes. More importantly, it results in better informed investment decisions for our clients.
Columbia funds are distributed by Columbia Management Investment Distributors, Inc., member FINRA, and managed by Columbia Management Investment Advisers, LLC.
Columbia Threadneedle Investments (Columbia Threadneedle) is the global brand name of the Columbia and Threadneedle group of companies.
* In U.S. dollars as of March 31, 2015. Source: Ameriprise Q1 Earnings Release. Includes all assets managed by entities in the Columbia and Threadneedle groups of companies. Contact us for more current data.
** Source: ICI as of March 31, 2015 for Columbia Management Investment Advisers, LLC.
*** Source: Investment Association as of March 2015 for Threadneedle Asset Management Limited.
© 2015 Columbia Management Investment Advisers, LLC. All rights reserved.
Not part of the shareholder report
Get the market insight you need from our investment experts
Connect with Columbia Threadneedle Investments
Investor insight
Find economic and market commentary, investment videos, white papers, mutual fund commentary and more at columbiathreadneedle.com/us.
Columbia Threadneedle Investor Newsletter (e-newsletter)
Read our award-winning* shareholder newsletter. Our quarterly newsletter is available online and provides timely and relevant content about economic trends, fund news, service enhancements and changes. Sign up to receive the newsletter electronically at columbiathreadneedle.com/
us/newsletter.
Investment videos
Get analysis of current events and trends that may affect your investments. Visit our online video library to watch and discover what our thought leaders are saying about the financial markets and economy.
Social media
We offer you multiple ways to access our market commentary and investment insights.
n Perspectives blog at columbiathreadneedle.com/us
Read timely posts by our investment team, including our chief investment officer, chief economist and portfolio managers.
n twitter.com/CTinvest_US
Follow us on Twitter for quick, up-to-the-minute comments on market news and more.
n youtube.com/CTinvestUS
View our commentaries on the economy, markets and current investment opportunities.
n linkedin.com/company/columbia-threadneedle-investments-us
Connect with us on LinkedIn for updates from our thought leaders.
*Columbia Threadneedle Investor Newsletter was awarded top honors in the Mutual Fund Education Alliance STAR Awards competition for excellence in mutual fund marketing and communications in 2011, 2012 and 2013. Materials in the competition were evaluated on educational value, message comprehension, effective design and objectives.
Not part of the shareholder report
Stay informed
Become a subscriber to receive the latest investment publications and mutual fund commentaries
Subscribe to Columbia Threadneedle Investments
Email subscription center
Subscribe to the latest information from Columbia Threadneedle. Visit our email subscription center at columbiathreadneedle.com/us/subscribe to register for economic and market commentary, product and service updates, white papers and more.
n Columbia Threadneedle Investor Newsletter
Quarterly newsletter featuring the latest macro- and micro-economic trends, investment themes, products, service changes and other items of interest to our investors
n Investment Strategy Outlook
Quarterly publication featuring the Columbia Threadneedle Asset Allocation Team's perspective on global economic investment conditions and markets
n MarketTrack
Quarterly publication featuring more than 40 charts and graphs that highlight the current state of the economy and the markets; includes straightforward insight on current investment opportunities
n White papers
Frequent articles that delve deep into a variety of investment topics
n Mutual fund updates
Quarterly portfolio manager commentary and fund fact sheets available for Columbia funds. (Not all funds have a commentary.)
Register your information online at columbiathreadneedle.com/us/subscribe and select the publications you would like to receive. Update your subscriptions at any time by accessing the email subscription center.

 Dear Shareholder,
In a world that is changing faster than ever before, investors want asset managers who offer a global perspective while generating strong and sustainable returns. To that end, Columbia Management, in conjunction with its U.K.-based affiliate, Threadneedle Investments, has rebranded to Columbia Threadneedle Investments. The new global brand represents the combined capabilities, resources and reach of the global group, offering investors access to the best of both firms.
With a presence in 18 countries and more than 450 investment professionals*, our collective perspective and world view as Columbia Threadneedle Investments gives us deeper insight into what might affect the real-life financial outcomes clients are seeking. Putting our views into a global context enables us to build richer perspectives and create the right solutions, and provides us with enhanced capabilities to deliver consistent investment performance, which may ultimately lead to better investor outcomes.
As a result of the rebrand, you will begin to see our new logo and colors reflected in printed materials, such as this shareholder report, as well as on our new website — columbiathreadneedle.com/us. We encourage you to visit us online and view a new video on the "About Us" tab that speaks to the strength of the firm.
While we are introducing a new brand, in many ways, the investment company you know well has not changed. The following remain in effect:
n Fund and strategy names
n Established investment teams, philosophies and processes
n Account services, features, servicing phone numbers and mailing addresses
n Columbia Management Investment Distributors as distributor and Columbia Management Investment Advisers as investment adviser
We recognize that the money we manage represents the hard work and savings of people like you, and that everyone has different ambitions and different definitions of success. Investors have varying goals — funding their children's education, enjoying their retirement, putting money aside for unexpected events, and more. Whatever your ambitions, we believe our wide range of investment products and solutions can help give you confidence that you will reach your goals.
The world is constantly changing, but our priority remains the same: to help you secure your finances, meet your goals and achieve success. Thank you for your continued investment with us. Our service representatives are available at 800.345.6611 to help with any questions.
Sincerely,

Christopher O. Petersen
President, Columbia Funds
Investors should consider the investment objectives, risks, charges and expenses of a mutual fund carefully before investing. For a free prospectus and summary prospectus, which contains this and other important information about a fund, visit columbiathreadneedle.com/us. The prospectus should be read carefully before investing.
* Source: Ameriprise as of December 1, 2014
Columbia Funds are distributed by Columbia Management Investment Distributors, Inc., member FINRA, and managed by Columbia Management Investment Advisers, LLC.
© 2015 Columbia Management Investment Advisers, LLC. All rights reserved.
COLUMBIA AMT-FREE SOUTH CAROLINA INTERMEDIATE MUNI BOND FUND
Fund Investment Manager
Columbia Management Investment
Advisers, LLC
225 Franklin Street
Boston, MA 02110
Fund Distributor
Columbia Management Investment
Distributors, Inc.
225 Franklin Street
Boston, MA 02110
Fund Transfer Agent
Columbia Management Investment
Services Corp.
P.O. Box 8081
Boston, MA 02266-8081
For more information about any of the funds, please visit columbiathreadneedle.com/us or call 800.345.6611. Customer Service Representatives are available to answer your questions Monday through Friday from 8 a.m. to 7 p.m. Eastern time.
The views expressed in this report reflect the current views of the respective parties. These views are not guarantees of future performance and involve certain risks, uncertainties and assumptions that are difficult to predict, so actual outcomes and results may differ significantly from the views expressed. These views are subject to change at any time based upon economic, market or other conditions and the respective parties disclaim any responsibility to update such views. These views may not be relied on as investment advice and, because investment decisions for a Columbia fund are based on numerous factors, may not be relied on as an indication of trading intent on behalf of any particular Columbia fund. References to specific securities should not be construed as a recommendation or investment advice.
Performance Overview | | | 3 | | |
Manager Discussion of Fund Performance | | | 5 | | |
Understanding Your Fund's Expenses | | | 7 | | |
Portfolio of Investments | | | 8 | | |
Statement of Assets and Liabilities | | | 14 | | |
Statement of Operations | | | 16 | | |
Statement of Changes in Net Assets | | | 17 | | |
Financial Highlights | | | 19 | | |
Notes to Financial Statements | | | 24 | | |
Report of Independent Registered
Public Accounting Firm | | | 30 | | |
Federal Income Tax Information | | | 31 | | |
Trustees and Officers | | | 32 | | |
Approval of Investment Management Services Agreement | | | 37 | | |
Important Information About This Report | | | 39 | | |
COLUMBIA AMT-FREE SOUTH CAROLINA INTERMEDIATE MUNI BOND FUND
Performance Summary
n Columbia AMT-Free South Carolina Intermediate Muni Bond Fund (the Fund) Class A shares returned 3.05% excluding sales charges for the 12-month period that ended April 30, 2015. Class Z shares of the Fund returned 3.21% for the same time period.
n The Fund's benchmark, the Barclays 3-15 Year Blend Municipal Bond Index, returned 3.76% during the 12-month period.
n The Fund's duration positioning was the largest factor in its underperformance. Duration is a measure of interest rate sensitivity.
Average Annual Total Returns (%) (for period ended April 30, 2015)
| | | Inception | | 1 Year | | 5 Years | | 10 Years | |
Class A | | 05/05/92 | | | | | | | | | | | | | |
Excluding sales charges | | | | | | | 3.05 | | | | 3.63 | | | | 3.49 | | |
Including sales charges | | | | | | | 0.00 | | | | 3.00 | | | | 3.17 | | |
Class B | | 06/08/93 | | | | | | | | | | | | | |
Excluding sales charges | | | | | | | 2.27 | | | | 2.88 | | | | 2.73 | | |
Including sales charges | | | | | | | -0.71 | | | | 2.88 | | | | 2.73 | | |
Class C | | 06/17/92 | | | | | | | | | | | | | |
Excluding sales charges | | | | | | | 2.18 | | | | 2.86 | | | | 2.72 | | |
Including sales charges | | | | | | | 1.18 | | | | 2.86 | | | | 2.72 | | |
Class R4* | | 03/19/13 | | | 3.21 | | | | 3.89 | | | | 3.75 | | |
Class Z | | 01/06/92 | | | 3.21 | | | | 3.89 | | | | 3.75 | | |
Barclays 3-15 Year Blend Municipal Bond Index | | | | | | | 3.76 | | | | 4.35 | | | | 4.54 | | |
Returns for Class A are shown with and without the maximum initial sales charge of 3.00%. The maximum applicable sales charge was reduced from 3.25% to 3.00% on Class A share purchases made on or after February 19, 2015. Class A returns (including sales charges) for all periods reflect the current maximum applicable sales charge of 3.00%. Returns for Class B are shown with and without the applicable contingent deferred sales charge (CDSC) of 3.00% in the first year, declining to 1.00% in the fourth year and eliminated thereafter. Returns for Class C are shown with and without the 1.00% CDSC for the first year only. The Fund's other classes are not subject to sales charges and have limited eligibility. Please see the Fund's prospectus for details. Performance for different share classes will vary based on differences in sales charges and fees associated with each class. All results shown assume reinvestment of distributions during the period. Returns do not reflect the deduction of taxes that a shareholder may pay on Fund distributions or on the redemption of Fund shares. Performance results reflect the effect of any fee waivers or reimbursements of Fund expenses by Columbia Management Investment Advisers, LLC and/or any of its affiliates. Absent these fee waivers or expense reimbursement arrangements, performance results would have been lower.
The performance information shown represents past performance and is not a guarantee of future results. The investment return and principal value of your investment will fluctuate so that your shares, when redeemed, may be worth more or less than their original cost. Current performance may be lower or higher than the performance information shown. You may obtain performance information current to the most recent month-end by contacting your financial intermediary, visiting columbiathreadneedle.com/us or calling 800.345.6611.
*The returns shown for periods prior to the share class inception date (including returns for the Life of the Fund, if shown, which are since Fund inception) include the returns of the Fund's oldest share class. These returns are adjusted to reflect any higher class-related operating expenses of the newer share classes, as applicable. Please visit columbiathreadneedle.com/us/investment-products/mutual-funds/appended-performance for more information.
The Barclays 3-15 Year Blend Municipal Bond Index is an unmanaged index that tracks the performance of municipal bonds issued after December 31, 1990, with remaining maturities between 2 and 17 years and at least $7 million in principal amount outstanding.
Indices are not available for investment, are not professionally managed and do not reflect sales charges, fees, brokerage commissions, taxes or other expenses of investing. Securities in the Fund may not match those in an index.
Annual Report 2015
3
COLUMBIA AMT-FREE SOUTH CAROLINA INTERMEDIATE MUNI BOND FUND
PERFORMANCE OVERVIEW (continued)
Performance of a Hypothetical $10,000 Investment (May 1, 2005 – April 30, 2015)

The chart above shows the change in value of a hypothetical $10,000 investment in Class A shares of Columbia AMT-Free South Carolina Intermediate Muni Bond Fund during the stated time period, and does not reflect the deduction of taxes that a shareholder may pay on Fund distributions or on the redemption of Fund shares.
Annual Report 2015
4
COLUMBIA AMT-FREE SOUTH CAROLINA INTERMEDIATE MUNI BOND FUND
MANAGER DISCUSSION OF FUND PERFORMANCE
For the 12-month period that ended April 30, 2015, the Fund's Class A shares returned 3.05% excluding sales charges. Class Z shares of the Fund returned 3.21% for the same time period. The Fund's benchmark, the Barclays 3-15 Year Blend Municipal Bond Index, returned 3.76% during the 12-month period. The Fund's duration positioning was the largest factor in its underperformance. Duration is a measure of interest rate sensitivity.
Market Overview
The U.S. municipal bond market generated positive performance during the past 12 months, with intermediate- and longer term debt generating the best results. While short-term bonds were pressured by the possibility that the U.S. Federal Reserve may begin to increase interest rates before the end of 2015, longer term issues were aided by the environment of slow growth, low inflation and investors' continued search for yield. Lower rated investment-grade bonds — those rated A and BBB — delivered the best returns and soundly outperformed high-rated AAA debt. On a sector basis, hospital and transportation issues outperformed. State and local general obligation bonds, which tend to be higher quality, lagged the returns of revenue bonds during the period.
Beginning in the fourth quarter of 2014, the supply of new municipal issues began to increase. The number of current and advanced refundings jumped considerably, and that trend continued into 2015 as issuers took advantage of lower rates to refinance older, higher yielding bonds. This is positive for issuers' credit outlook, as it allows them to reduce their interest costs. For bond holders, however, the refundings often cause higher yielding bonds to be called away from their portfolios, with the proceeds needing to be reinvested in lower yielding securities. Supply expectations for 2015 had risen to $400 billion by the close of the period, with the largest increase in refunding volume. On the demand side, continued flows into municipal bond funds provided firm support for the market throughout the past year.
South Carolina's Market Underperformed Despite Robust Economy
South Carolina's economy is recovering at a stronger pace than that of the United States, and the state has recovered all of the employment losses that occurred during the recession that followed the 2008 financial crisis. Strength in the auto and manufacturing sectors has propelled the state to one of the highest rates of payroll growth in the country. Low energy and business costs, together with South Carolina's business-friendly policies, are supporting both the outlook for both employment and investment. Further, the state's ports have benefited from the shipping disruptions that occurred in West Coast ports early in 2015. The state is also experiencing healthy population growth, which should provide a firm underpinning for its economy over time. Still, South Carolina municipal bonds — while finishing with a positive absolute return — nonetheless modestly underperformed the national municipal bond market.
Portfolio Management
Brian McGreevy
Quality Breakdown (%)
(at April 30, 2015) | |
AAA rating | | | 3.1 | | |
AA rating | | | 46.9 | | |
A rating | | | 43.2 | | |
BBB rating | | | 1.4 | | |
BB rating | | | 2.3 | | |
Not rated | | | 3.1 | | |
Total | | | 100.0 | | |
Percentages indicated are based upon total fixed income investments (excluding Money Market Funds).
Bond ratings apply to the underlying holdings of the Fund and not the Fund itself and are divided into categories ranging from highest to lowest credit quality, determined by using the middle rating of Moody's, S&P and Fitch, after dropping the highest and lowest available ratings. When ratings are available from only two rating agencies, the lower rating is used. When a rating is available from only one rating agency, that rating is used. When a bond is not rated by any rating agency, it is designated as "Not rated." Credit quality ratings assigned by a rating agency are subjective opinions, not statements of fact, and are subject to change, including daily. The ratings assigned by credit rating agencies are but one of the considerations that the Investment Manager and/or Fund's subadviser incorporates into its credit analysis process, along with such other issuer-specific factors as cash flows, capital structure and leverage ratios, ability to de-leverage (repay) through free cash flow, quality of management, market positioning and access to capital, as well as such security-specific factors as the terms of the security (e.g., interest rate and time to maturity) and the amount and type of any collateral.
Annual Report 2015
5
COLUMBIA AMT-FREE SOUTH CAROLINA INTERMEDIATE MUNI BOND FUND
MANAGER DISCUSSION OF FUND PERFORMANCE (continued)
Investment Risks
Fixed-income securities present issuer default risk. The Fund invests substantially in municipal securities and will be affected by tax, legislative, regulatory, demographic or political changes, as well as changes impacting a state's financial, economic or other conditions. A relatively small number of tax-exempt issuers may necessitate the Fund investing more heavily in a single issuer and, therefore, be more exposed to the risk of loss than a fund that invests more broadly. The value of the Fund's portfolio may be more volatile than a more geographically diversified fund. Prepayment and extension risk exists as a loan, bond or other investment may be called, prepaid or redeemed before maturity and that similar yielding investments may not be available for purchase. A rise in interest rates may result in a price decline of fixed-income instruments held by the Fund, negatively impacting its performance and NAV. Falling rates may result in the Fund investing in lower yielding debt instruments, lowering the Fund's income and yield. These risks may be heightened for longer maturity and duration securities. Non-investment-grade (high-yield or junk) securities present greater price volatility and more risk to principal and income than higher rated securities. Market risk may affect a single issuer, sector of the economy, industry or the market as a whole. Federal and state tax rules apply to capital gain distributions and any gains or losses on sales. Income may be subject to state or local taxes. Liquidity risk is associated with the difficulty of selling underlying investments at a desirable time or price. See the Fund's prospectus for information on these and other risks.
Contributors and Detractors
The Fund underperformed its benchmark during the 12-month period. The Fund began the period with slightly shorter duration (lower interest-rate sensitivity) relative to the benchmark. Given that rates fell during the period, this positioning was a headwind to performance. During the course of the period, we decreased the Fund exposure to very short maturities and added bonds with maturities in the 12- to 17-year range, which added to results. An addition to the six- to 12-year maturity segment also contributed positively to performance. The Fund is overweight in this segment and underweight in the two- to six-year range. This aspect of our positioning was a positive for performance, as longer maturities outperformed during the period.
The Fund's overweight position in A rated bonds, which performed better than higher rated AAA and AA issues, was an additional positive for performance. The Fund's positions in BBB rated bonds, the lowest rated credit tier within the investment-grade market, were the strongest performers for the period.
The Fund has a larger allocation to pre-refunded bonds than the benchmark, which detracted from performance given that this segment lagged the overall market due to its shorter average maturities. However, the pre-refunded bonds held in the Fund outperformed the pre-refunded bonds in the benchmark, a positive for relative performance.
Our positions in hospital issues, special tax bonds and education issues all performed well during the 12-month period. Transportation issues matched the overall results of the benchmark, while water & sewer issues, which tend to be of higher quality, lagged.
Fund Positioning
Going forward, we currently intend to take a cautious stance on interest rates by maintaining a roughly neutral duration. Our overall quality positioning, along with the purchases we made during the period, continued to emphasize A and BBB rated issues for the additional income they offer. While yield spreads in these credit tiers have tightened considerably (meaning that investors are being paid less for the associated risks), we currently believe they still offer the most compelling relative value. Given the steep yield curve, we see value at this time in bonds maturing in the seven- to 12-year range.
Annual Report 2015
6
COLUMBIA AMT-FREE SOUTH CAROLINA INTERMEDIATE MUNI BOND FUND
UNDERSTANDING YOUR FUND'S EXPENSES
(Unaudited)
As an investor, you incur two types of costs. There are transaction costs, which generally include sales charges on purchases and may include redemption fees. There are also ongoing costs, which generally include management fees, distribution and/or service fees, and other fund expenses. The following information is intended to help you understand your ongoing costs (in dollars) of investing in the Fund and to help you compare these costs with the ongoing costs of investing in other mutual funds.
Analyzing Your Fund's Expenses
To illustrate these ongoing costs, we have provided examples and calculated the expenses paid by investors in each share class of the Fund during the period. The actual and hypothetical information in the table is based on an initial investment of $1,000 at the beginning of the period indicated and held for the entire period. Expense information is calculated two ways and each method provides you with different information. The amount listed in the "Actual" column is calculated using the Fund's actual operating expenses and total return for the period. You may use the Actual information, together with the amount invested, to estimate the expenses that you paid over the period. Simply divide your account value by $1,000 (for example, an $8,600 account value divided by $1,000 = 8.6), then multiply the results by the expenses paid during the period under the "Actual" column. The amount listed in the "Hypothetical" column assumes a 5% annual rate of return before expenses (which is not the Fund's actual return) and then applies the Fund's actual expense ratio for the period to the hypothetical return. You should not use the hypothetical account values and expenses to estimate either your actual account balance at the end of the period or the expenses you paid during the period. See "Compare With Other Funds" below for details on how to use the hypothetical data.
Compare With Other Funds
Since all mutual funds are required to include the same hypothetical calculations about expenses in shareholder reports, you can use this information to compare the ongoing cost of investing in the Fund with other funds. To do so, compare the hypothetical example with the 5% hypothetical examples that appear in the shareholder reports of other funds. As you compare hypothetical examples of other funds, it is important to note that hypothetical examples are meant to highlight the ongoing costs of investing in a fund only and do not reflect any transaction costs, such as sales charges, or redemption or exchange fees. Therefore, the hypothetical calculations are useful in comparing ongoing costs only, and will not help you determine the relative total costs of owning different funds. If transaction costs were included in these calculations, your costs would be higher.
November 1, 2014 – April 30, 2015
| | | Account Value at the Beginning
of the Period ($) | | Account Value at the End of the
Period ($) | | Expenses Paid During the
Period ($) | | Fund's Annualized
Expense Ratio (%) | |
| | | Actual | | Hypothetical | | Actual | | Hypothetical | | Actual | | Hypothetical | | Actual | |
Class A | | | 1,000.00 | | | | 1,000.00 | | | | 1,005.90 | | | | 1,020.78 | | | | 4.03 | | | | 4.06 | | | | 0.81 | | |
Class B | | | 1,000.00 | | | | 1,000.00 | | | | 1,002.10 | | | | 1,017.06 | | | | 7.74 | | | | 7.80 | | | | 1.56 | | |
Class C | | | 1,000.00 | | | | 1,000.00 | | | | 1,001.10 | | | | 1,017.06 | | | | 7.74 | | | | 7.80 | | | | 1.56 | | |
Class R4 | | | 1,000.00 | | | | 1,000.00 | | | | 1,006.20 | | | | 1,022.02 | | | | 2.79 | | | | 2.81 | | | | 0.56 | | |
Class Z | | | 1,000.00 | | | | 1,000.00 | | | | 1,006.20 | | | | 1,022.02 | | | | 2.79 | | | | 2.81 | | | | 0.56 | | |
Expenses paid during the period are equal to the annualized expense ratio for each class as indicated above, multiplied by the average account value over the period and then multiplied by the number of days in the Fund's most recent fiscal half year and divided by 365.
Expenses do not include fees and expenses incurred indirectly by the Fund from its investment in underlying funds, including affiliated and non-affiliated pooled investment vehicles, such as mutual funds and exchange-traded funds.
Had Columbia Management Investment Advisers, LLC and/or certain of its affiliates not waived/reimbursed certain fees and expenses, account value at the end of the period would have been reduced.
Annual Report 2015
7
COLUMBIA AMT-FREE SOUTH CAROLINA INTERMEDIATE MUNI BOND FUND
PORTFOLIO OF INVESTMENTS
April 30, 2015
(Percentages represent value of investments compared to net assets)
Municipal Bonds 97.7%
Issue
Description | | Coupon
Rate | | Principal
Amount ($) | |
Value ($) | |
AIRPORT 2.0% | |
County of Horry
Revenue Bonds
Series 2010A
07/01/18 | | | 5.000 | % | | | 1,315,000 | | | | 1,453,470 | | |
07/01/20 | | | 5.000 | % | | | 1,150,000 | | | | 1,315,278 | | |
Total | | | | | | | 2,768,748 | | |
HIGHER EDUCATION 4.5% | |
Clemson University
Revenue Bonds
Athletic Facility
Series 2014A
05/01/28 | | | 5.000 | % | | | 1,170,000 | | | | 1,382,027 | | |
Coastal Carolina University
Revenue Bonds
Series 2015
06/01/24 | | | 5.000 | % | | | 1,500,000 | | | | 1,808,280 | | |
University of South Carolina
Revenue Bonds
Moore School of Business Project
Series 2012
05/01/26 | | | 5.000 | % | | | 1,500,000 | | | | 1,750,380 | | |
Series 2008A (AGM)
06/01/21 | | | 5.000 | % | | | 1,060,000 | | | | 1,180,469 | | |
Total | | | | | | | 6,121,156 | | |
HOSPITAL 16.0% | |
County of Florence
Refunding Revenue Bonds
McLeod Regional Medical Center Project
Series 2014
11/01/31 | | | 5.000 | % | | | 1,500,000 | | | | 1,725,045 | | |
County of Greenwood
Refunding Revenue Bonds
Self Regional Healthcare
Series 2012B
10/01/27 | | | 5.000 | % | | | 1,750,000 | | | | 1,972,425 | | |
10/01/31 | | | 5.000 | % | | | 2,000,000 | | | | 2,208,740 | | |
Greenville Health System
Refunding Revenue Bonds
Series 2008A
05/01/21 | | | 5.250 | % | | | 2,750,000 | | | | 3,065,810 | | |
Lexington County Health Services District, Inc.
Refunding Revenue Bonds
Series 2007
11/01/17 | | | 5.000 | % | | | 1,230,000 | | | | 1,353,972 | | |
11/01/18 | | | 5.000 | % | | | 1,000,000 | | | | 1,097,220 | | |
South Carolina Jobs-Economic Development Authority
Refunding Revenue Bonds
Anmed Health Project
Series 2010
02/01/17 | | | 5.000 | % | | | 500,000 | | | | 535,075 | | |
Municipal Bonds (continued)
Issue
Description | | Coupon
Rate | | Principal
Amount ($) | |
Value ($) | |
Palmetto Health
Series 2005A (AGM)
08/01/21 | | | 5.250 | % | | | 3,000,000 | | | | 3,334,890 | | |
Revenue Bonds
Bon Secours Health System, Inc.
Series 2013
11/01/20 | | | 5.000 | % | | | 2,000,000 | | | | 2,319,040 | | |
11/01/24 | | | 5.000 | % | | | 450,000 | | | | 520,965 | | |
Kershaw County Medical Center Project
Series 2008
09/15/25 | | | 5.500 | % | | | 1,925,000 | | | | 2,103,582 | | |
Spartanburg Regional Health Services District
Revenue Bonds
Series 2008A
04/15/19 | | | 5.000 | % | | | 1,225,000 | | | | 1,353,417 | | |
Total | | | | | | | 21,590,181 | | |
JOINT POWER AUTHORITY 7.6% | |
Easley Combined Utility System
Refunding Revenue Bonds
Series 2011 (AGM)
12/01/28 | | | 5.000 | % | | | 1,000,000 | | | | 1,115,060 | | |
Piedmont Municipal Power Agency
Refunding Revenue Bonds
Series 2008A-3 (AGM)
01/01/17 | | | 5.000 | % | | | 2,000,000 | | | | 2,141,420 | | |
01/01/18 | | | 5.000 | % | | | 3,050,000 | | | | 3,365,431 | | |
South Carolina State Public Service Authority
Refunding Revenue Bonds
Series 2009A
01/01/28 | | | 5.000 | % | | | 2,000,000 | | | | 2,222,460 | | |
Series 2014B
12/01/32 | | | 5.000 | % | | | 1,250,000 | | | | 1,407,250 | | |
Total | | | | | | | 10,251,621 | | |
LOCAL APPROPRIATION 14.9% | |
Berkeley County School District
Refunding Revenue Bonds
Securing Assets for Education
Series 2015A
12/01/27 | | | 5.000 | % | | | 1,500,000 | | | | 1,738,380 | | |
Charleston Educational Excellence Finance Corp.
Refunding Revenue Bonds
Charleston County School
Series 2013
12/01/25 | | | 5.000 | % | | | 2,000,000 | | | | 2,393,820 | | |
City of North Charleston
Revenue Bonds
Series 2012
06/01/29 | | | 5.000 | % | | | 2,280,000 | | | | 2,561,352 | | |
The accompanying Notes to Financial Statements are an integral part of this statement.
Annual Report 2015
8
COLUMBIA AMT-FREE SOUTH CAROLINA INTERMEDIATE MUNI BOND FUND
PORTFOLIO OF INVESTMENTS (continued)
April 30, 2015
Municipal Bonds (continued)
Issue
Description | | Coupon
Rate | | Principal
Amount ($) | |
Value ($) | |
Dorchester County School District No. 2
Refunding Revenue Bonds
Growth Installment Purchase
Series 2013
12/01/27 | | | 5.000 | % | | | 1,000,000 | | | | 1,158,920 | | |
Greenville County School District
Refunding Revenue Bonds
Building Equity Sooner
Series 2006
12/01/27 | | | 5.000 | % | | | 1,300,000 | | | | 1,386,307 | | |
Lexington One School Facilities Corp.
Refunding Revenue Bonds
Lexington County School District
Series 2015
12/01/26 | | | 5.000 | % | | | 835,000 | | | | 972,525 | | |
Lexington School District No. 2 Educational Facilities
Corp. Refunding Revenue Bonds
Series 2015B
12/01/26 | | | 5.000 | % | | | 1,815,000 | | | | 2,128,269 | | |
Newberry Investing in Children's Education
Refunding Revenue Bonds
Newberry County School District
Series 2014
12/01/29 | | | 5.000 | % | | | 1,500,000 | | | | 1,725,345 | | |
SCAGO Educational Facilities Corp. for Cherokee School
District No. 1 Refunding Revenue Bonds
Series 2015(a)
12/01/28 | | | 5.000 | % | | | 1,830,000 | | | | 2,102,487 | | |
SCAGO Educational Facilities Corp. for Pickens School
District Refunding Revenue Bonds
Series 2015
12/01/30 | | | 5.000 | % | | | 1,275,000 | | | | 1,459,633 | | |
Sumter Two School Facilities, Inc.
Refunding Revenue Bonds
Sumter County School District No. 2
Series 2007
12/01/17 | | | 5.000 | % | | | 1,000,000 | | | | 1,098,740 | | |
Town of Hilton Head Island
Revenue Bonds
Series 2011A
06/01/23 | | | 5.000 | % | | | 555,000 | | | | 659,495 | | |
06/01/24 | | | 5.000 | % | | | 580,000 | | | | 685,548 | | |
Total | | | | | | | 20,070,821 | | |
LOCAL GENERAL OBLIGATION 8.9% | |
Anderson County School District No. 4
Unlimited General Obligation Refunding Bonds
Series 2015A
03/01/25 | | | 5.000 | % | | | 1,255,000 | | | | 1,556,150 | | |
Municipal Bonds (continued)
Issue
Description | | Coupon
Rate | | Principal
Amount ($) | |
Value ($) | |
Beaufort County School District
Unlimited General Obligation Bonds
Series 2014B
03/01/23 | | | 5.000 | % | | | 1,190,000 | | | | 1,450,336 | | |
Unlimited General Obligation Refunding Bonds
Series 2015A
03/01/24 | | | 5.000 | % | | | 2,000,000 | | | | 2,453,440 | | |
County of Charleston
Unlimited General Obligation Bonds
Improvement
Series 2009A
08/01/23 | | | 5.000 | % | | | 2,000,000 | | | | 2,305,420 | | |
Horry County School District
Unlimited General Obligation Refunding Bonds
South Carolina School District
Series 2015A
03/01/27 | | | 5.000 | % | | | 2,630,000 | | | | 3,210,862 | | |
South Carolina Jobs-Economic Development Authority
Refunding Revenue Bonds
Series 2015
04/01/34 | | | 5.000 | % | | | 940,000 | | | | 1,065,715 | | |
Total | | | | | | | 12,041,923 | | |
MUNICIPAL POWER 1.6% | |
City of Rock Hill Combined Utility System
Refunding Revenue Bonds
Series 2012A (AGM)
01/01/23 | | | 5.000 | % | | | 1,560,000 | | | | 1,827,041 | | |
Guam Power Authority
Refunding Revenue Bonds
Series 2012A (AGM)(b)
10/01/24 | | | 5.000 | % | | | 315,000 | | | | 373,174 | | |
Total | | | | | | | 2,200,215 | | |
PORTS 0.9% | |
South Carolina Ports Authority
Revenue Bonds
Series 2010
07/01/23 | | | 5.250 | % | | | 1,000,000 | | | | 1,171,450 | | |
PREP SCHOOL 1.1% | |
South Carolina Jobs-Economic Development Authority
Revenue Bonds
Series 2015A
08/15/35 | | | 5.125 | % | | | 1,000,000 | | | | 1,001,450 | | |
York Preparatory Academy Project
Series 2014A
11/01/33 | | | 7.000 | % | | | 500,000 | | | | 548,725 | | |
Total | | | | | | | 1,550,175 | | |
The accompanying Notes to Financial Statements are an integral part of this statement.
Annual Report 2015
9
COLUMBIA AMT-FREE SOUTH CAROLINA INTERMEDIATE MUNI BOND FUND
PORTFOLIO OF INVESTMENTS (continued)
April 30, 2015
Municipal Bonds (continued)
Issue
Description | | Coupon
Rate | | Principal
Amount ($) | |
Value ($) | |
REFUNDED / ESCROWED 10.1% | |
Berkeley County School District
Prerefunded 12/01/16 Revenue Bonds
Securing Assets for Education
Series 2006
12/01/21 | | | 5.000 | % | | | 2,000,000 | | | | 2,142,040 | | |
12/01/22 | | | 5.000 | % | | | 3,545,000 | | | | 3,796,766 | | |
Charleston Educational Excellence Finance Corp.
Prerefunded 12/01/16 Revenue Bonds
Charleston County School District Project
Series 2006
12/01/19 | | | 5.000 | % | | | 1,000,000 | | | | 1,070,500 | | |
County of Charleston
Revenue Bonds
Care Alliance Health Services
Series 1999A Escrowed to Maturity (AGM)
08/15/15 | | | 5.125 | % | | | 750,000 | | | | 760,763 | | |
Puerto Rico Highways & Transportation Authority
Refunding Revenue Bonds
Series 2003AA Escrowed to Maturity (NPFGC)(b)
07/01/18 | | | 5.500 | % | | | 1,050,000 | | | | 1,195,267 | | |
SCAGO Educational Facilities Corp. for Pickens School
District Prerefunded 12/01/16 Revenue Bonds
Pickens County Project
Series 2006 (AGM)
12/01/23 | | | 5.000 | % | | | 3,000,000 | | | | 3,211,500 | | |
South Carolina State Public Service Authority
Prerefunded 01/01/19 Revenue Bonds
Series 2009B
01/01/24 | | | 5.000 | % | | | 1,250,000 | | | | 1,421,450 | | |
Total | | | | | | | 13,598,286 | | |
RESOURCE RECOVERY 2.0% | |
Three Rivers Solid Waste Authority(c)
Revenue Bonds
Capital Appreciation-Landfill Gas Project
Series 2007
10/01/24 | | | 0.000 | % | | | 1,835,000 | | | | 1,351,276 | | |
10/01/25 | | | 0.000 | % | | | 1,835,000 | | | | 1,292,776 | | |
Total | | | | | | | 2,644,052 | | |
RETIREMENT COMMUNITIES 3.0% | |
South Carolina Jobs-Economic Development Authority
Refunding Revenue Bonds
1st Mortgage-Episcopal Church
Series 2007
04/01/16 | | | 5.000 | % | | | 600,000 | | | | 617,256 | | |
1st Mortgage-Lutheran Homes
Series 2007
05/01/16 | | | 5.000 | % | | | 1,245,000 | | | | 1,279,511 | | |
05/01/21 | | | 5.375 | % | | | 1,650,000 | | | | 1,714,202 | | |
Municipal Bonds (continued)
Issue
Description | | Coupon
Rate | | Principal
Amount ($) | |
Value ($) | |
1st Mortgage-Wesley Commons
Series 2006
10/01/36 | | | 5.300 | % | | | 500,000 | | | | 501,520 | | |
Total | | | | | | | 4,112,489 | | |
SINGLE FAMILY 0.4% | |
South Carolina State Housing Finance & Development
Authority Revenue Bonds
Series 2010-1 (GNMA/FNMA/FHLMC)
01/01/28 | | | 5.000 | % | | | 480,000 | | | | 515,141 | | |
SPECIAL NON PROPERTY TAX 5.2% | |
City of Columbia
Revenue Bonds
Series 2014
02/01/33 | | | 5.000 | % | | | 1,195,000 | | | | 1,354,114 | | |
City of Greenville Hospitality Tax
Improvement Refunding Revenue Bonds
Series 2011 (AGM)
04/01/21 | | | 5.000 | % | | | 1,290,000 | | | | 1,498,193 | | |
City of Myrtle Beach
Revenue Bonds
Hospitality Fee
Series 2014B
06/01/30 | | | 5.000 | % | | | 560,000 | | | | 635,135 | | |
City of Rock Hill
Revenue Bonds
Hospitality Fee Pledge
Series 2013
04/01/23 | | | 5.000 | % | | | 695,000 | | | | 822,428 | | |
Greenville County Public Facilities Corp.
Refunding Certificate of Participation
Series 2014
04/01/26 | | | 5.000 | % | | | 890,000 | | | | 1,042,066 | | |
Territory of Guam
Revenue Bonds
Series 2011A(b)
01/01/31 | | | 5.000 | % | | | 400,000 | | | | 440,896 | | |
Virgin Islands Public Finance Authority
Revenue Bonds
Matching Fund Loan Notes-Senior Lien
Series 2010A(b)
10/01/25 | | | 5.000 | % | | | 1,060,000 | | | | 1,192,362 | | |
Total | | | | | | | 6,985,194 | | |
STATE GENERAL OBLIGATION 0.9% | |
State of South Carolina
Unlimited General Obligation Bonds
Series 2014B
04/01/25 | | | 5.000 | % | | | 1,000,000 | | | | 1,234,770 | | |
The accompanying Notes to Financial Statements are an integral part of this statement.
Annual Report 2015
10
COLUMBIA AMT-FREE SOUTH CAROLINA INTERMEDIATE MUNI BOND FUND
PORTFOLIO OF INVESTMENTS (continued)
April 30, 2015
Municipal Bonds (continued)
Issue
Description | | Coupon
Rate | | Principal
Amount ($) | |
Value ($) | |
STUDENT LOAN 1.4% | |
South Carolina State Education Assistance Authority
Revenue Bonds
Student Loan
Series 2009I
10/01/24 | | | 5.000 | % | | | 1,825,000 | | | | 1,964,594 | | |
TRANSPORTATION 4.3% | |
South Carolina Transportation Infrastructure Bank
Refunding Revenue Bonds
Series 2005A (AMBAC)
10/01/20 | | | 5.250 | % | | | 4,880,000 | | | | 5,757,961 | | |
WATER & SEWER 12.9% | |
Anderson Regional Joint Water System
Refunding Revenue Bonds
Series 2012
07/15/28 | | | 5.000 | % | | | 2,000,000 | | | | 2,264,840 | | |
Beaufort-Jasper Water & Sewer Authority
Improvement Refunding Revenue Bonds
Series 2006 (AGM)
03/01/23 | | | 5.000 | % | | | 1,500,000 | | | | 1,632,735 | | |
03/01/25 | | | 4.750 | % | | | 3,000,000 | | | | 3,244,140 | | |
City of Charleston Waterworks & Sewer System
Refunding Revenue Bonds
Series 2009A
01/01/21 | | | 5.000 | % | | | 2,500,000 | | | | 2,828,450 | | |
Municipal Bonds (continued)
Issue
Description | | Coupon
Rate | | Principal
Amount ($) | |
Value ($) | |
City of Columbia Waterworks & Sewer System
Refunding Revenue Bonds
Series 2011A
02/01/27 | | | 5.000 | % | | | 1,000,000 | | | | 1,151,600 | | |
County of Berkeley Water & Sewer
Refunding Revenue Bonds
Series 2008A (AGM)
06/01/21 | | | 5.000 | % | | | 1,000,000 | | | | 1,115,590 | | |
Renewable Water Resources
Refunding Revenue Bonds
Series 2005B (AGM)
03/01/19 | | | 5.250 | % | | | 1,000,000 | | | | 1,149,640 | | |
Series 2010A
01/01/20 | | | 5.000 | % | | | 1,500,000 | | | | 1,732,935 | | |
Series 2012
01/01/24 | | | 5.000 | % | | | 1,000,000 | | | | 1,178,890 | | |
Spartanburg Sanitation Sewer District
Refunding Revenue Bonds
Series 2014B
03/01/34 | | | 5.000 | % | | | 1,000,000 | | | | 1,138,150 | | |
Total | | | | | | | 17,436,970 | | |
Total Municipal Bonds
(Cost: $125,331,831) | | | | | | | 132,015,747 | | |
Total Investments
(Cost: $125,331,831) | | | | | | | 132,015,747 | | |
Other Assets & Liabilities, Net | | | | | | | 3,055,834 | | |
Net Assets | | | | | | | 135,071,581 | | |
Notes to Portfolio of Investments
(a) Security, or a portion thereof, has been purchased on a when-issued or delayed delivery basis.
(b) Municipal obligations include debt obligations issued by or on behalf of territories, possessions, or sovereign nations within the territorial boundaries of the United States. At April 30, 2015, the value of these securities amounted to $3,201,699 or 2.37% of net assets.
(c) Zero coupon bond.
Abbreviation Legend
AGM Assured Guaranty Municipal Corporation
AMBAC Ambac Assurance Corporation
FHLMC Federal Home Loan Mortgage Corporation
FNMA Federal National Mortgage Association
GNMA Government National Mortgage Association
NPFGC National Public Finance Guarantee Corporation
The accompanying Notes to Financial Statements are an integral part of this statement.
Annual Report 2015
11
COLUMBIA AMT-FREE SOUTH CAROLINA INTERMEDIATE MUNI BOND FUND
PORTFOLIO OF INVESTMENTS (continued)
April 30, 2015
Generally accepted accounting principles (GAAP) require disclosure regarding the inputs and valuation techniques used to measure fair value and any changes in valuation inputs or techniques. In addition, investments shall be disclosed by major category.
The Fund categorizes its fair value measurements according to a three-level hierarchy that maximizes the use of observable inputs and minimizes the use of unobservable inputs by prioritizing that the most observable input be used when available. Observable inputs are those that market participants would use in pricing an investment based on market data obtained from sources independent of the reporting entity. Unobservable inputs are those that reflect the Fund's assumptions about the information market participants would use in pricing an investment. An investment's level within the fair value hierarchy is based on the lowest level of any input that is deemed significant to the asset or liability's fair value measurement. The input levels are not necessarily an indication of the risk or liquidity associated with investments at that level. For example, certain U.S. government securities are generally high quality and liquid, however, they are reflected as Level 2 because the inputs used to determine fair value may not always be quoted prices in an active market.
Fair value inputs are summarized in the three broad levels listed below:
> Level 1 — Valuations based on quoted prices for investments in active markets that the Fund has the ability to access at the measurement date (including NAV for open-end mutual funds). Valuation adjustments are not applied to Level 1 investments.
> Level 2 — Valuations based on other significant observable inputs (including quoted prices for similar securities, interest rates, prepayment speeds, credit risks, etc.).
> Level 3 — Valuations based on significant unobservable inputs (including the Fund's own assumptions and judgment in determining the fair value of investments).
Inputs that are used in determining fair value of an investment may include price information, credit data, volatility statistics, and other factors. These inputs can be either observable or unobservable. The availability of observable inputs can vary between investments, and is affected by various factors such as the type of investment, and the volume and level of activity for that investment or similar investments in the marketplace. The inputs will be considered by the Investment Manager, along with any other relevant factors in the calculation of an investment's fair value. The Fund uses prices and inputs that are current as of the measurement date, which may include periods of market dislocations. During these periods, the availability of prices and inputs may be reduced for many investments. This condition could cause an investment to be reclassified between the various levels within the hierarchy.
Investments falling into the Level 3 category are primarily supported by quoted prices from brokers and dealers participating in the market for those investments. However, these may be classified as Level 3 investments due to lack of market transparency and corroboration to support these quoted prices. Additionally, valuation models may be used as the pricing source for any remaining investments classified as Level 3. These models may rely on one or more significant unobservable inputs and/or significant assumptions by the Investment Manager. Inputs used in valuations may include, but are not limited to, financial statement analysis, capital account balances, discount rates and estimated cash flows, and comparable company data.
Under the direction of the Fund's Board of Trustees (the Board), the Investment Manager's Valuation Committee (the Committee) is responsible for overseeing the valuation procedures approved by the Board. The Committee consists of voting and non-voting members from various groups within the Investment Manager's organization, including operations and accounting, trading and investments, compliance, risk management and legal.
The Committee meets at least monthly to review and approve valuation matters, which may include a description of specific valuation determinations, data regarding pricing information received from approved pricing vendors and brokers and the results of Board-approved valuation control policies and procedures (the Policies). The Policies address, among other things, instances when market quotations are or are not readily available, including recommendations of third party pricing vendors and a determination of appropriate pricing methodologies; events that require specific valuation determinations and assessment of fair value techniques; securities with a potential for stale pricing, including those that are illiquid, restricted, or in default; and the effectiveness of third party pricing vendors, including periodic reviews of vendors. The Committee meets more frequently, as needed, to discuss additional valuation matters, which may include the need to review back-testing results, review time-sensitive information or approve related valuation actions. The Committee reports to the Board, with members of the Committee meeting with the Board at each of its regularly scheduled meetings to discuss valuation matters and actions during the period, similar to those described earlier.
For investments categorized as Level 3, the Committee monitors information similar to that described above, which may include: (i) data specific to the issuer or comparable issuers, (ii) general market or specific sector news and (iii) quoted prices and specific or similar security transactions. The Committee considers this data and any changes from prior periods in order to assess the reasonableness of observable and unobservable inputs, any assumptions or internal models used to value those securities and changes in fair value. This data is also used to corroborate, when available, information received from approved pricing vendors and brokers. Various factors impact the frequency of monitoring this information (which may occur as often as daily). However, the Committee may determine that changes to inputs, assumptions and models are not required as a result of the monitoring procedures performed.
The accompanying Notes to Financial Statements are an integral part of this statement.
Annual Report 2015
12
COLUMBIA AMT-FREE SOUTH CAROLINA INTERMEDIATE MUNI BOND FUND
PORTFOLIO OF INVESTMENTS (continued)
April 30, 2015
Fair Value Measurements (continued)
The following table is a summary of the inputs used to value the Fund's investments at April 30, 2015:
Description | | Level 1
Quoted Prices in Active
Markets for Identical
Assets ($) | | Level 2
Other Significant
Observable Inputs ($) | | Level 3
Significant
Unobservable Inputs ($) | | Total ($) | |
Bonds | |
Municipal Bonds | | | — | | | | 132,015,747 | | | | — | | | | 132,015,747 | | |
Total Bonds | | | — | | | | 132,015,747 | | | | — | | | | 132,015,747 | | |
Total | | | — | | | | 132,015,747 | | | | — | | | | 132,015,747 | | |
See the Portfolio of Investments for all investment classifications not indicated in the table.
The Fund's assets assigned to the Level 2 input category are generally valued using the market approach, in which a security's value is determined through reference to prices and information from market transactions for similar or identical assets.
There were no transfers of financial assets between levels during the period.
The accompanying Notes to Financial Statements are an integral part of this statement.
Annual Report 2015
13
COLUMBIA AMT-FREE SOUTH CAROLINA INTERMEDIATE MUNI BOND FUND
STATEMENT OF ASSETS AND LIABILITIES
April 30, 2015
Assets | |
Investments, at value | |
(identified cost $125,331,831) | | $ | 132,015,747 | | |
Cash | | | 3,835,294 | | |
Receivable for: | |
Investments sold | | | 10,167 | | |
Capital shares sold | | | 296,894 | | |
Interest | | | 1,619,949 | | |
Expense reimbursement due from Investment Manager | | | 584 | | |
Prepaid expenses | | | 663 | | |
Total assets | | | 137,779,298 | | |
Liabilities | |
Payable for: | |
Investments purchased on a delayed delivery basis | | | 2,120,147 | | |
Capital shares purchased | | | 100,996 | | |
Dividend distributions to shareholders | | | 307,438 | | |
Investment management fees | | | 1,480 | | |
Distribution and/or service fees | | | 592 | | |
Transfer agent fees | | | 28,727 | | |
Administration fees | | | 259 | | |
Compensation of board members | | | 117,255 | | |
Other expenses | | | 30,823 | | |
Total liabilities | | | 2,707,717 | | |
Net assets applicable to outstanding capital stock | | $ | 135,071,581 | | |
Represented by | |
Paid-in capital | | $ | 126,984,560 | | |
Undistributed net investment income | | | 1,096,315 | | |
Accumulated net realized gain | | | 306,790 | | |
Unrealized appreciation (depreciation) on: | |
Investments | | | 6,683,916 | | |
Total — representing net assets applicable to outstanding capital stock | | $ | 135,071,581 | | |
The accompanying Notes to Financial Statements are an integral part of this statement.
Annual Report 2015
14
COLUMBIA AMT-FREE SOUTH CAROLINA INTERMEDIATE MUNI BOND FUND
STATEMENT OF ASSETS AND LIABILITIES (continued)
April 30, 2015
Class A | |
Net assets | | $ | 23,975,469 | | |
Shares outstanding | | | 2,297,264 | | |
Net asset value per share | | $ | 10.44 | | |
Maximum offering price per share(a) | | $ | 10.76 | | |
Class B | |
Net assets | | $ | 19,516 | | |
Shares outstanding | | | 1,868 | | |
Net asset value per share | | $ | 10.45 | | |
Class C | |
Net assets | | $ | 15,677,182 | | |
Shares outstanding | | | 1,501,104 | | |
Net asset value per share | | $ | 10.44 | | |
Class R4 | |
Net assets | | $ | 702,636 | | |
Shares outstanding | | | 67,360 | | |
Net asset value per share | | $ | 10.43 | | |
Class Z | |
Net assets | | $ | 94,696,778 | | |
Shares outstanding | | | 9,069,130 | | |
Net asset value per share | | $ | 10.44 | | |
(a) The maximum offering price per share is calculated by dividing the net asset value per share by 1.0 minus the maximum sales charge of 3.00%.
The accompanying Notes to Financial Statements are an integral part of this statement.
Annual Report 2015
15
COLUMBIA AMT-FREE SOUTH CAROLINA INTERMEDIATE MUNI BOND FUND
STATEMENT OF OPERATIONS
Year Ended April 30, 2015
Net investment income | |
Income: | |
Dividends | | $ | 120 | | |
Interest | | | 4,572,112 | | |
Total income | | | 4,572,232 | | |
Expenses: | |
Investment management fees | | | 499,365 | | |
Distribution and/or service fees | |
Class A | | | 57,714 | | |
Class B | | | 223 | | |
Class C | | | 145,789 | | |
Transfer agent fees | |
Class A | | | 45,475 | | |
Class B | | | 43 | | |
Class C | | | 28,735 | | |
Class R4 | | | 1,402 | | |
Class Z | | | 170,150 | | |
Administration fees | | | 87,389 | | |
Compensation of board members | | | 20,083 | | |
Custodian fees | | | 1,949 | | |
Printing and postage fees | | | 24,727 | | |
Registration fees | | | 14,578 | | |
Professional fees | | | 35,315 | | |
Other | | | 9,654 | | |
Total expenses | | | 1,142,591 | | |
Fees waived or expenses reimbursed by Investment Manager and its affiliates | | | (239,755 | ) | |
Total net expenses | | | 902,836 | | |
Net investment income | | | 3,669,396 | | |
Realized and unrealized gain (loss) — net | |
Net realized gain (loss) on: | |
Investments | | | 1,177,178 | | |
Net realized gain | | | 1,177,178 | | |
Net change in unrealized appreciation (depreciation) on: | |
Investments | | | (1,287,146 | ) | |
Net change in unrealized depreciation | | | (1,287,146 | ) | |
Net realized and unrealized loss | | | (109,968 | ) | |
Net increase in net assets resulting from operations | | $ | 3,559,428 | | |
The accompanying Notes to Financial Statements are an integral part of this statement.
Annual Report 2015
16
COLUMBIA AMT-FREE SOUTH CAROLINA INTERMEDIATE MUNI BOND FUND
STATEMENT OF CHANGES IN NET ASSETS
| | | Year Ended
April 30,
2015 | | Year Ended
April 30,
2014 | |
Operations | |
Net investment income | | $ | 3,669,396 | | | $ | 4,117,709 | | |
Net realized gain (loss) | | | 1,177,178 | | | | (97,074 | ) | |
Net change in unrealized depreciation | | | (1,287,146 | ) | | | (5,891,627 | ) | |
Net increase (decrease) in net assets resulting from operations | | | 3,559,428 | | | | (1,870,992 | ) | |
Distributions to shareholders | |
Net investment income | |
Class A | | | (658,269 | ) | | | (687,610 | ) | |
Class B | | | (469 | ) | | | (1,645 | ) | |
Class C | | | (304,726 | ) | | | (318,131 | ) | |
Class R4 | | | (22,206 | ) | | | (8,876 | ) | |
Class Z | | | (2,683,726 | ) | | | (3,101,447 | ) | |
Net realized gains | |
Class A | | | (152,738 | ) | | | (10,759 | ) | |
Class B | | | (123 | ) | | | (37 | ) | |
Class C | | | (92,934 | ) | | | (6,762 | ) | |
Class R4 | | | (4,860 | ) | | | (192 | ) | |
Class Z | | | (522,659 | ) | | | (43,423 | ) | |
Total distributions to shareholders | | | (4,442,710 | ) | | | (4,178,882 | ) | |
Increase (decrease) in net assets from capital stock activity | | | 11,769,274 | | | | (35,895,298 | ) | |
Total increase (decrease) in net assets | | | 10,885,992 | | | | (41,945,172 | ) | |
Net assets at beginning of year | | | 124,185,589 | | | | 166,130,761 | | |
Net assets at end of year | | $ | 135,071,581 | | | $ | 124,185,589 | | |
Undistributed net investment income | | $ | 1,096,315 | | | $ | 1,096,315 | | |
The accompanying Notes to Financial Statements are an integral part of this statement.
Annual Report 2015
17
COLUMBIA AMT-FREE SOUTH CAROLINA INTERMEDIATE MUNI BOND FUND
STATEMENT OF CHANGES IN NET ASSETS (continued)
| | | Year Ended April 30, 2015 | | Year Ended April 30, 2014 | |
| | | Shares | | Dollars ($) | | Shares | | Dollars ($) | |
Capital stock activity | |
Class A shares | |
Subscriptions(a) | | | 521,276 | | | | 5,498,534 | | | | 400,356 | | | | 4,172,250 | | |
Distributions reinvested | | | 58,334 | | | | 614,589 | | | | 49,193 | | | | 512,200 | | |
Redemptions | | | (349,709 | ) | | | (3,681,579 | ) | | | (930,682 | ) | | | (9,756,565 | ) | |
Net increase (decrease) | | | 229,901 | | | | 2,431,544 | | | | (481,133 | ) | | | (5,072,115 | ) | |
Class B shares | |
Distributions reinvested | | | 41 | | | | 434 | | | | 138 | | | | 1,442 | | |
Redemptions(a) | | | (506 | ) | | | (5,352 | ) | | | (8,167 | ) | | | (85,336 | ) | |
Net decrease | | | (465 | ) | | | (4,918 | ) | | | (8,029 | ) | | | (83,894 | ) | |
Class C shares | |
Subscriptions | | | 368,504 | | | | 3,888,533 | | | | 289,043 | | | | 3,023,842 | | |
Distributions reinvested | | | 26,324 | | | | 277,418 | | | | 19,889 | | | | 207,157 | | |
Redemptions | | | (214,770 | ) | | | (2,262,894 | ) | | | (428,686 | ) | | | (4,467,197 | ) | |
Net increase (decrease) | | | 180,058 | | | | 1,903,057 | | | | (119,754 | ) | | | (1,236,198 | ) | |
Class R4 shares | |
Subscriptions | | | 21,378 | | | | 224,983 | | | | 57,136 | | | | 591,829 | | |
Distributions reinvested | | | 2,534 | | | | 26,687 | | | | 861 | | | | 8,962 | | |
Redemptions | | | (14,167 | ) | | | (148,643 | ) | | | (614 | ) | | | (6,369 | ) | |
Net increase | | | 9,745 | | | | 103,027 | | | | 57,383 | | | | 594,422 | | |
Class Z shares | |
Subscriptions | | | 2,504,284 | | | | 26,481,416 | | | | 1,282,166 | | | | 13,381,814 | | |
Distributions reinvested | | | 40,482 | | | | 426,727 | | | | 39,092 | | | | 407,323 | | |
Redemptions | | | (1,856,834 | ) | | | (19,571,579 | ) | | | (4,194,741 | ) | | | (43,886,650 | ) | |
Net increase (decrease) | | | 687,932 | | | | 7,336,564 | | | | (2,873,483 | ) | | | (30,097,513 | ) | |
Total net increase (decrease) | | | 1,107,171 | | | | 11,769,274 | | | | (3,425,016 | ) | | | (35,895,298 | ) | |
(a) Includes conversions of Class B shares to Class A shares, if any.
The accompanying Notes to Financial Statements are an integral part of this statement.
Annual Report 2015
18
COLUMBIA AMT-FREE SOUTH CAROLINA INTERMEDIATE MUNI BOND FUND
The following tables are intended to help you understand the Fund's financial performance. Certain information reflects financial results for a single share of a class held for the periods shown. Per share net investment income (loss) amounts are calculated based on average shares outstanding during the period. Total return assumes reinvestment of all dividends and distributions, if any. Total return does not reflect payment of sales charges, if any. Total return and portfolio turnover are not annualized for periods of less than one year. The portfolio turnover rate is calculated without regard to purchase and sales transactions of short-term instruments and certain derivatives, if any. If such transactions were included, the Fund's portfolio turnover rate may be higher.
| | | Year Ended April 30, | | Year Ended March 31, | |
Class A | | 2015 | | 2014 | | 2013 | | 2012(a) | | 2012 | | 2011 | |
Per share data | |
Net asset value, beginning of period | | $ | 10.49 | | | $ | 10.89 | | | $ | 10.74 | | | $ | 10.64 | | | $ | 10.08 | | | $ | 10.17 | | |
Income from investment operations: | |
Net investment income | | | 0.30 | | | | 0.32 | | | | 0.30 | | | | 0.03 | | | | 0.33 | | | | 0.35 | | |
Net realized and unrealized gain (loss) | | | 0.02 | (b) | | | (0.40 | ) | | | 0.15 | | | | 0.10 | | | | 0.56 | | | | (0.09 | ) | |
Total from investment operations | | | 0.32 | | | | (0.08 | ) | | | 0.45 | | | | 0.13 | | | | 0.89 | | | | 0.26 | | |
Less distributions to shareholders: | |
Net investment income | | | (0.30 | ) | | | (0.31 | ) | | | (0.30 | ) | | | (0.03 | ) | | | (0.33 | ) | | | (0.35 | ) | |
Net realized gains | | | (0.07 | ) | | | (0.01 | ) | | | — | | | | — | | | | — | | | | — | | |
Total distributions to shareholders | | | (0.37 | ) | | | (0.32 | ) | | | (0.30 | ) | | | (0.03 | ) | | | (0.33 | ) | | | (0.35 | ) | |
Net asset value, end of period | | $ | 10.44 | | | $ | 10.49 | | | $ | 10.89 | | | $ | 10.74 | | | $ | 10.64 | | | $ | 10.08 | | |
Total return | | | 3.05 | % | | | (0.66 | %) | | | 4.28 | % | | | 1.18 | % | | | 8.97 | % | | | 2.54 | % | |
Ratios to average net assets(c) | |
Total gross expenses | | | 1.00 | % | | | 1.01 | % | | | 0.97 | % | | | 0.99 | %(d) | | | 1.04 | % | | | 0.95 | % | |
Total net expenses(e) | | | 0.81 | % | | | 0.81 | % | | | 0.81 | %(f) | | | 0.79 | %(d) | | | 0.79 | %(f) | | | 0.80 | %(f) | |
Net investment income | | | 2.85 | % | | | 3.02 | % | | | 2.81 | % | | | 2.95 | %(d) | | | 3.16 | % | | | 3.41 | % | |
Supplemental data | |
Net assets, end of period (in thousands) | | $ | 23,975 | | | $ | 21,694 | | | $ | 27,743 | | | $ | 24,707 | | | $ | 24,748 | | | $ | 18,513 | | |
Portfolio turnover | | | 16 | % | | | 6 | % | | | 14 | % | | | 0 | % | | | 9 | % | | | 15 | % | |
Notes to Financial Highlights
(a) For the period from April 1, 2012 to April 30, 2012. During the period, the Fund's fiscal year end was changed from March 31 to April 30.
(b) Calculation of the net gain (loss) per share (both realized and unrealized) does not correlate to the aggregate realized and unrealized gain (loss) presented in the Statement of Operations due to the timing of subscriptions and redemptions of Fund shares in relation to fluctuations in the market value of the portfolio.
(c) In addition to the fees and expenses that the Fund bears directly, the Fund indirectly bears a pro rata share of the fees and expenses of any other funds in which it invests. Such indirect expenses are not included in the Fund's reported expense ratios.
(d) Annualized.
(e) Total net expenses include the impact of certain fee waivers/expense reimbursements made by the Investment Manager and certain of its affiliates, if applicable.
(f) The benefits derived from expense reductions had an impact of less than 0.01%.
The accompanying Notes to Financial Statements are an integral part of this statement.
Annual Report 2015
19
COLUMBIA AMT-FREE SOUTH CAROLINA INTERMEDIATE MUNI BOND FUND
FINANCIAL HIGHLIGHTS (continued)
| | | Year Ended April 30, | | Year Ended March 31, | |
Class B | | 2015 | | 2014 | | 2013 | | 2012(a) | | 2012 | | 2011 | |
Per share data | |
Net asset value, beginning of period | | $ | 10.50 | | | $ | 10.89 | | | $ | 10.75 | | | $ | 10.65 | | | $ | 10.08 | | | $ | 10.18 | | |
Income from investment operations: | |
Net investment income | | | 0.22 | | | | 0.24 | | | | 0.22 | | | | 0.02 | | | | 0.25 | | | | 0.27 | | |
Net realized and unrealized gain (loss) | | | 0.02 | (b) | | | (0.39 | ) | | | 0.14 | | | | 0.10 | | | | 0.58 | | | | (0.09 | ) | |
Total from investment operations | | | 0.24 | | | | (0.15 | ) | | | 0.36 | | | | 0.12 | | | | 0.83 | | | | 0.18 | | |
Less distributions to shareholders: | |
Net investment income | | | (0.22 | ) | | | (0.23 | ) | | | (0.22 | ) | | | (0.02 | ) | | | (0.26 | ) | | | (0.28 | ) | |
Net realized gains | | | (0.07 | ) | | | (0.01 | ) | | | — | | | | — | | | | — | | | | — | | |
Total distributions to shareholders | | | (0.29 | ) | | | (0.24 | ) | | | (0.22 | ) | | | (0.02 | ) | | | (0.26 | ) | | | (0.28 | ) | |
Net asset value, end of period | | $ | 10.45 | | | $ | 10.50 | | | $ | 10.89 | | | $ | 10.75 | | | $ | 10.65 | | | $ | 10.08 | | |
Total return | | | 2.27 | % | | | (1.31 | %) | | | 3.41 | % | | | 1.12 | % | | | 8.25 | % | | | 1.70 | % | |
Ratios to average net assets(c) | |
Total gross expenses | | | 1.75 | % | | | 1.76 | % | | | 1.72 | % | | | 1.74 | %(d) | | | 1.84 | % | | | 1.70 | % | |
Total net expenses(e) | | | 1.56 | % | | | 1.56 | % | | | 1.55 | %(f) | | | 1.54 | %(d) | | | 1.54 | %(f) | | | 1.55 | %(f) | |
Net investment income | | | 2.11 | % | | | 2.29 | % | | | 2.07 | % | | | 2.20 | %(d) | | | 2.43 | % | | | 2.65 | % | |
Supplemental data | |
Net assets, end of period (in thousands) | | $ | 20 | | | $ | 24 | | | $ | 113 | | | $ | 155 | | | $ | 154 | | | $ | 246 | | |
Portfolio turnover | | | 16 | % | | | 6 | % | | | 14 | % | | | 0 | % | | | 9 | % | | | 15 | % | |
Notes to Financial Highlights
(a) For the period from April 1, 2012 to April 30, 2012. During the period, the Fund's fiscal year end was changed from March 31 to April 30.
(b) Calculation of the net gain (loss) per share (both realized and unrealized) does not correlate to the aggregate realized and unrealized gain (loss) presented in the Statement of Operations due to the timing of subscriptions and redemptions of Fund shares in relation to fluctuations in the market value of the portfolio.
(c) In addition to the fees and expenses that the Fund bears directly, the Fund indirectly bears a pro rata share of the fees and expenses of any other funds in which it invests. Such indirect expenses are not included in the Fund's reported expense ratios.
(d) Annualized.
(e) Total net expenses include the impact of certain fee waivers/expense reimbursements made by the Investment Manager and certain of its affiliates, if applicable.
(f) The benefits derived from expense reductions had an impact of less than 0.01%.
The accompanying Notes to Financial Statements are an integral part of this statement.
Annual Report 2015
20
COLUMBIA AMT-FREE SOUTH CAROLINA INTERMEDIATE MUNI BOND FUND
FINANCIAL HIGHLIGHTS (continued)
| | | Year Ended April 30, | | Year Ended March 31, | |
Class C | | 2015 | | 2014 | | 2013 | | 2012(a) | | 2012 | | 2011 | |
Per share data | |
Net asset value, beginning of period | | $ | 10.50 | | | $ | 10.89 | | | $ | 10.75 | | | $ | 10.65 | | | $ | 10.08 | | | $ | 10.18 | | |
Income from investment operations: | |
Net investment income | | | 0.22 | | | | 0.24 | | | | 0.22 | | | | 0.02 | | | | 0.25 | | | | 0.27 | | |
Net realized and unrealized gain (loss) | | | 0.01 | (b) | | | (0.39 | ) | | | 0.14 | | | | 0.10 | | | | 0.58 | | | | (0.10 | ) | |
Total from investment operations | | | 0.23 | | | | (0.15 | ) | | | 0.36 | | | | 0.12 | | | | 0.83 | | | | 0.17 | | |
Less distributions to shareholders: | |
Net investment income | | | (0.22 | ) | | | (0.23 | ) | | | (0.22 | ) | | | (0.02 | ) | | | (0.26 | ) | | | (0.27 | ) | |
Net realized gains | | | (0.07 | ) | | | (0.01 | ) | | | — | | | | — | | | | — | | | | — | | |
Total distributions to shareholders | | | (0.29 | ) | | | (0.24 | ) | | | (0.22 | ) | | | (0.02 | ) | | | (0.26 | ) | | | (0.27 | ) | |
Net asset value, end of period | | $ | 10.44 | | | $ | 10.50 | | | $ | 10.89 | | | $ | 10.75 | | | $ | 10.65 | | | $ | 10.08 | | |
Total return | | | 2.18 | % | | | (1.31 | %) | | | 3.41 | % | | | 1.12 | % | | | 8.27 | % | | | 1.68 | % | |
Ratios to average net assets(c) | |
Total gross expenses | | | 1.75 | % | | | 1.76 | % | | | 1.72 | % | | | 1.73 | %(d) | | | 1.78 | % | | | 1.70 | % | |
Total net expenses(e) | | | 1.56 | % | | | 1.56 | % | | | 1.55 | %(f) | | | 1.54 | %(d) | | | 1.54 | %(f) | | | 1.55 | %(f) | |
Net investment income | | | 2.10 | % | | | 2.28 | % | | | 2.06 | % | | | 2.19 | %(d) | | | 2.41 | % | | | 2.65 | % | |
Supplemental data | |
Net assets, end of period (in thousands) | | $ | 15,677 | | | $ | 13,871 | | | $ | 15,694 | | | $ | 14,041 | | | $ | 13,093 | | | $ | 10,031 | | |
Portfolio turnover | | | 16 | % | | | 6 | % | | | 14 | % | | | 0 | % | | | 9 | % | | | 15 | % | |
Notes to Financial Highlights
(a) For the period from April 1, 2012 to April 30, 2012. During the period, the Fund's fiscal year end was changed from March 31 to April 30.
(b) Calculation of the net gain (loss) per share (both realized and unrealized) does not correlate to the aggregate realized and unrealized gain (loss) presented in the Statement of Operations due to the timing of subscriptions and redemptions of Fund shares in relation to fluctuations in the market value of the portfolio.
(c) In addition to the fees and expenses that the Fund bears directly, the Fund indirectly bears a pro rata share of the fees and expenses of any other funds in which it invests. Such indirect expenses are not included in the Fund's reported expense ratios.
(d) Annualized.
(e) Total net expenses include the impact of certain fee waivers/expense reimbursements made by the Investment Manager and certain of its affiliates, if applicable.
(f) The benefits derived from expense reductions had an impact of less than 0.01%.
The accompanying Notes to Financial Statements are an integral part of this statement.
Annual Report 2015
21
COLUMBIA AMT-FREE SOUTH CAROLINA INTERMEDIATE MUNI BOND FUND
FINANCIAL HIGHLIGHTS (continued)
| | | Year Ended April 30, | |
Class R4 | | 2015 | | 2014 | | 2013(a) | |
Per share data | |
Net asset value, beginning of period | | $ | 10.49 | | | $ | 10.88 | | | $ | 10.80 | | |
Income from investment operations: | |
Net investment income | | | 0.33 | | | | 0.34 | | | | 0.04 | | |
Net realized and unrealized gain (loss) | | | 0.00 | (b)(c) | | | (0.38 | ) | | | 0.08 | | |
Total from investment operations | | | 0.33 | | | | (0.04 | ) | | | 0.12 | | |
Less distributions to shareholders: | |
Net investment income | | | (0.32 | ) | | | (0.34 | ) | | | (0.04 | ) | |
Net realized gains | | | (0.07 | ) | | | (0.01 | ) | | | — | | |
Total distributions to shareholders | | | (0.39 | ) | | | (0.35 | ) | | | (0.04 | ) | |
Net asset value, end of period | | $ | 10.43 | | | $ | 10.49 | | | $ | 10.88 | | |
Total return | | | 3.21 | % | | | (0.32 | %) | | | 1.09 | % | |
Ratios to average net assets(d) | |
Total gross expenses | | | 0.75 | % | | | 0.79 | % | | | 0.58 | %(e) | |
Total net expenses(f) | | | 0.56 | % | | | 0.56 | % | | | 0.53 | %(e) | |
Net investment income | | | 3.11 | % | | | 3.34 | % | | | 3.12 | %(e) | |
Supplemental data | |
Net assets, end of period (in thousands) | | $ | 703 | | | $ | 604 | | | $ | 3 | | |
Portfolio turnover | | | 16 | % | | | 6 | % | | | 14 | % | |
Notes to Financial Highlights
(a) Based on operations from March 19, 2013 (commencement of operations) through the stated period end.
(b) Rounds to zero.
(c) Calculation of the net gain (loss) per share (both realized and unrealized) does not correlate to the aggregate realized and unrealized gain (loss) presented in the Statement of Operations due to the timing of subscriptions and redemptions of Fund shares in relation to fluctuations in the market value of the portfolio.
(d) In addition to the fees and expenses that the Fund bears directly, the Fund indirectly bears a pro rata share of the fees and expenses of any other funds in which it invests. Such indirect expenses are not included in the Fund's reported expense ratios.
(e) Annualized.
(f) Total net expenses include the impact of certain fee waivers/expense reimbursements made by the Investment Manager and certain of its affiliates, if applicable.
The accompanying Notes to Financial Statements are an integral part of this statement.
Annual Report 2015
22
COLUMBIA AMT-FREE SOUTH CAROLINA INTERMEDIATE MUNI BOND FUND
FINANCIAL HIGHLIGHTS (continued)
| | | Year Ended April 30, | | Year Ended March 31, | |
Class Z | | 2015 | | 2014 | | 2013 | | 2012(a) | | 2012 | | 2011 | |
Per share data | |
Net asset value, beginning of period | | $ | 10.50 | | | $ | 10.89 | | | $ | 10.75 | | | $ | 10.65 | | | $ | 10.08 | | | $ | 10.18 | | |
Income from investment operations: | |
Net investment income | | | 0.33 | | | | 0.34 | | | | 0.33 | | | | 0.03 | | | | 0.36 | | | | 0.38 | | |
Net realized and unrealized gain (loss) | | | 0.00 | (b)(c) | | | (0.38 | ) | | | 0.14 | | | | 0.10 | | | | 0.57 | | | | (0.10 | ) | |
Total from investment operations | | | 0.33 | | | | (0.04 | ) | | | 0.47 | | | | 0.13 | | | | 0.93 | | | | 0.28 | | |
Less distributions to shareholders: | |
Net investment income | | | (0.32 | ) | | | (0.34 | ) | | | (0.33 | ) | | | (0.03 | ) | | | (0.36 | ) | | | (0.38 | ) | |
Net realized gains | | | (0.07 | ) | | | (0.01 | ) | | | — | | | | — | | | | — | | | | — | | |
Total distributions to shareholders | | | (0.39 | ) | | | (0.35 | ) | | | (0.33 | ) | | | (0.03 | ) | | | (0.36 | ) | | | (0.38 | ) | |
Net asset value, end of period | | $ | 10.44 | | | $ | 10.50 | | | $ | 10.89 | | | $ | 10.75 | | | $ | 10.65 | | | $ | 10.08 | | |
Total return | | | 3.21 | % | | | (0.32 | %) | | | 4.45 | % | | | 1.20 | % | | | 9.33 | % | | | 2.70 | % | |
Ratios to average net assets(d) | |
Total gross expenses | | | 0.75 | % | | | 0.76 | % | | | 0.72 | % | | | 0.73 | %(e) | | | 0.78 | % | | | 0.70 | % | |
Total net expenses(f) | | | 0.56 | % | | | 0.56 | % | | | 0.55 | %(g) | | | 0.54 | %(e) | | | 0.54 | %(g) | | | 0.55 | %(g) | |
Net investment income | | | 3.10 | % | | | 3.27 | % | | | 3.06 | % | | | 3.20 | %(e) | | | 3.42 | % | | | 3.65 | % | |
Supplemental data | |
Net assets, end of period (in thousands) | | $ | 94,697 | | | $ | 87,992 | | | $ | 122,578 | | | $ | 135,227 | | | $ | 131,663 | | | $ | 127,101 | | |
Portfolio turnover | | | 16 | % | | | 6 | % | | | 14 | % | | | 0 | % | | | 9 | % | | | 15 | % | |
Notes to Financial Highlights
(a) For the period from April 1, 2012 to April 30, 2012. During the period, the Fund's fiscal year end was changed from March 31 to April 30.
(b) Rounds to zero.
(c) Calculation of the net gain (loss) per share (both realized and unrealized) does not correlate to the aggregate realized and unrealized gain (loss) presented in the Statement of Operations due to the timing of subscriptions and redemptions of Fund shares in relation to fluctuations in the market value of the portfolio.
(d) In addition to the fees and expenses that the Fund bears directly, the Fund indirectly bears a pro rata share of the fees and expenses of any other funds in which it invests. Such indirect expenses are not included in the Fund's reported expense ratios.
(e) Annualized.
(f) Total net expenses include the impact of certain fee waivers/expense reimbursements made by the Investment Manager and certain of its affiliates, if applicable.
(g) The benefits derived from expense reductions had an impact of less than 0.01%.
The accompanying Notes to Financial Statements are an integral part of this statement.
Annual Report 2015
23
COLUMBIA AMT-FREE SOUTH CAROLINA INTERMEDIATE MUNI BOND FUND
NOTES TO FINANCIAL STATEMENTS
April 30, 2015
Note 1. Organization
Columbia AMT-Free South Carolina Intermediate Muni Bond Fund (formerly known as Columbia South Carolina Intermediate Municipal Bond Fund) (the Fund), a series of Columbia Funds Series Trust (the Trust), is a diversified fund. The Trust is registered under the Investment Company Act of 1940, as amended (the 1940 Act), as an open-end management investment company organized as a Delaware statutory trust. Effective July 7, 2014, Columbia South Carolina Intermediate Municipal Bond Fund was renamed Columbia AMT-Free South Carolina Intermediate Muni Bond Fund.
Fund Shares
The Trust may issue an unlimited number of shares (without par value). The Fund offers Class A, Class B, Class C, Class R4 and Class Z shares. Although all share classes generally have identical voting, dividend and liquidation rights, each share class votes separately when required by the Trust's organizational documents or by law. Different share classes pay different distribution amounts to the extent the expenses of such share classes differ, and distributions in liquidation will be proportional to the net asset value of each share class. Each share class has its own expense structure and sales charges.
Class A shares are subject to a maximum front-end sales charge of 3.00% based on the initial investment amount. In addition, Class A shares purchased on or after February 19, 2015 are subject to a contingent deferred sales charge (CDSC) of 0.75% on certain investments of $500,000 or more if redeemed within 12 months after purchase. Redemptions of Class A shares purchased prior to February 19, 2015, without an initial sales charge in accounts aggregating $1 million to $50 million at the time of purchase, are subject to a CDSC of 1.00% if redeemed within 12 months after purchase, and 0.50% if redeemed more than 12, but less than 18, months after purchase.
Class B shares may be subject to a maximum CDSC of 3.00% based upon the holding period after purchase. Class B shares will generally convert to Class A shares eight years after purchase. The Fund no longer accepts investments by new or existing investors in the Fund's Class B shares, except in connection with the reinvestment of any dividend and/or capital gain distributions in Class B shares of the Fund and exchanges by existing Class B shareholders of certain other funds within the Columbia Family of Funds.
Class C shares are subject to a 1.00% CDSC on shares redeemed within one year after purchase.
Class R4 shares are not subject to sales charges and are generally available only to omnibus retirement plans and certain investors as described in the Fund's prospectus.
Class Z shares are not subject to sales charges and are available only to eligible investors, which are subject to different investment minimums as described in the Fund's prospectus.
Note 2. Summary of Significant Accounting Policies
Basis of Preparation
The Fund is an investment company that applies the accounting and reporting guidance in the Financial Accounting Standards Board (FASB) Accounting Standards Codification Topic 946, Financial Services — Investment Companies (ASC 946). The financial statements are prepared in accordance with U.S. generally accepted accounting principles (GAAP), which requires management to make certain estimates and assumptions that affect the reported amounts of assets and liabilities, the disclosure of contingent assets and liabilities at the date of the financial statements and the reported amounts of income and expenses during the reporting period. Actual results could differ from those estimates.
The following is a summary of significant accounting policies followed by the Fund in the preparation of its financial statements.
Security Valuation
Debt securities generally are valued by pricing services approved by the Board of Trustees (the Board) based upon market transactions for normal, institutional-size trading units of similar securities. The services may use various pricing techniques that take into account, as applicable, factors such as yield, quality, coupon rate, maturity, type of issue, trading characteristics and other data, as well as broker quotes. Debt securities for which quotations are readily available may also be valued based upon an over-the-counter or exchange bid quotation.
Investments for which market quotations are not readily available, or that have quotations which management believes are not reliable, are valued at fair value as determined in good faith under procedures established by and under the general supervision of the Board. If a
Annual Report 2015
24
COLUMBIA AMT-FREE SOUTH CAROLINA INTERMEDIATE MUNI BOND FUND
NOTES TO FINANCIAL STATEMENTS (continued)
April 30, 2015
security or class of securities (such as foreign securities) is valued at fair value, such value is likely to be different from the quoted or published price for the security.
The determination of fair value often requires significant judgment. To determine fair value, management may use assumptions including but not limited to future cash flows and estimated risk premiums. Multiple inputs from various sources may be used to determine fair value.
Security Transactions
Security transactions are accounted for on the trade date. Cost is determined and gains (losses) are based upon the specific identification method for both financial statement and federal income tax purposes.
Income Recognition
Interest income is recorded on an accrual basis. Market premiums and discounts, including original issue discounts, are amortized and accreted, respectively, over the expected life of the security on all debt securities, unless otherwise noted.
The Fund may place a debt security on non-accrual status and reduce related interest income when it becomes probable that the interest will not be collected and the amount of uncollectible interest can be reasonably estimated. A defaulted debt security is removed from non-accrual status when the issuer resumes interest payments or when collectability of interest is reasonably assured.
Dividend income is recorded on the ex-dividend date.
Expenses
General expenses of the Trust are allocated to the Fund and other funds of the Trust based upon relative net assets or other expense allocation methodologies determined by the nature of the expense. Expenses directly attributable to the Fund are charged to the Fund. Expenses directly attributable to a specific class of shares are charged to that share class.
Determination of Class Net Asset Value
All income, expenses (other than class-specific expenses, which are charged to that share class, as shown in the Statement of Operations) and realized and unrealized gains (losses) are allocated to each class of the Fund on a daily basis, based on the relative net assets of each class, for purposes of determining the net asset value of each class.
Federal Income Tax Status
The Fund intends to qualify each year as a regulated investment company under Subchapter M of the Internal Revenue Code, as amended, and will distribute substantially all of its tax exempt and taxable income (including net short-term capital gains), if any, for its tax year, and as such will not be subject to federal income taxes. In addition, the Fund intends to distribute in each calendar year substantially all of its net investment income, capital gains and certain other amounts, if any, such that the Fund should not be subject to federal excise tax. Therefore, no federal income or excise tax provision is recorded.
Distributions to Shareholders
Distributions from net investment income, if any, are declared daily and paid monthly. Net realized capital gains, if any, are distributed at least annually. Income distributions and capital gain distributions are determined in accordance with federal income tax regulations, which may differ from GAAP.
Guarantees and Indemnifications
Under the Trust's organizational documents and, in some cases, by contract, its officers and trustees are indemnified against certain liabilities arising out of the performance of their duties to the Trust or its funds. In addition, certain of the Fund's contracts with its service providers contain general indemnification clauses. The Fund's maximum exposure under these arrangements is unknown since the amount of any future claims that may be made against the Fund cannot be determined, and the Fund has no historical basis for predicting the likelihood of any such claims.
Note 3. Fees and Compensation Paid to Affiliates
Investment Management Fees
Under an Investment Management Services Agreement, Columbia Management Investment Advisers, LLC (the Investment Manager), a wholly-owned subsidiary of Ameriprise Financial, Inc. (Ameriprise Financial), determines which securities will be purchased, held or sold. The investment management fee is an annual fee that is equal to a percentage of the Fund's average daily net assets that declines from 0.40% to 0.27% as the Fund's net assets increase. The effective investment management fee rate for the year ended April 30, 2015 was 0.40% of the Fund's average daily net assets.
Annual Report 2015
25
COLUMBIA AMT-FREE SOUTH CAROLINA INTERMEDIATE MUNI BOND FUND
NOTES TO FINANCIAL STATEMENTS (continued)
April 30, 2015
Administration Fees
Under an Administrative Services Agreement, the Investment Manager also serves as the Fund Administrator. The Fund pays the Fund Administrator an annual fee for administration and accounting services equal to a percentage of the Fund's average daily net assets that declines from 0.07% to 0.04% as the Fund's net assets increase. The effective administration fee rate for the year ended April 30, 2015 was 0.07% of the Fund's average daily net assets.
Other Expenses
Other expenses are for, among other things, miscellaneous expenses of the Fund or the Board, including payments to a company providing limited administrative services to the Fund and the Board. That company's expenses include boardroom and office expense, employee compensation, employee health and retirement benefits, and certain other expenses. For the year ended April 30, 2015, other expenses paid by the Fund to this company were $1,331.
Compensation of Board Members
Board members are compensated for their services to the Fund as disclosed in the Statement of Operations. Under a Deferred Compensation Plan (the Plan), the Board members who are not "interested persons" of the Fund, as defined under the 1940 Act, may elect to defer payment of up to 100% of their compensation. Deferred amounts are treated as though equivalent dollar amounts had been invested in shares of certain funds managed by the Investment Manager. The Fund's liability for these amounts is adjusted for market value changes and remains in the Fund until distributed in accordance with the Plan.
Transfer Agent Fees
Under a Transfer and Dividend Disbursing Agent Agreement, Columbia Management Investment Services Corp. (the Transfer Agent), an affiliate of the Investment Manager and a wholly-owned subsidiary of Ameriprise Financial, is responsible for providing transfer agency services to the Fund. The Transfer Agent has contracted with Boston Financial Data Services (BFDS) to serve as sub-transfer agent.
Effective November 1, 2014, the Transfer Agent receives a monthly transfer agency fee based on the number or the average value of accounts, depending on the type of account. Prior to November 1, 2014, the Transfer Agent received a monthly account-based service fee based on the number of open accounts. In addition, the Transfer Agent also receives sub-transfer agency fees based on a
percentage of the average aggregate value of the Fund's shares maintained in omnibus accounts (other than omnibus accounts for which American Enterprise Investment Services Inc. is the broker of record or accounts where the beneficial shareholder is a customer of Ameriprise Financial Services, Inc., for which the Transfer Agent receives a per account fee). The Transfer Agent pays the fees of BFDS for services as sub-transfer agent and is not entitled to reimbursement for such fees from the Fund (with the exception of out-of-pocket fees).
The Transfer Agent also receives compensation from the Fund for various shareholder services and reimbursements for certain out-of-pocket fees.
For the year ended April 30, 2015, the Fund's effective transfer agent fee rates as a percentage of average daily net assets of each class were as follows:
Class A | | | 0.20 | % | |
Class B | | | 0.19 | | |
Class C | | | 0.20 | | |
Class R4 | | | 0.20 | | |
Class Z | | | 0.20 | | |
An annual minimum account balance fee of $20 may apply to certain accounts with a value below the applicable share class's initial minimum investment requirements to reduce the impact of small accounts on transfer agent fees. These minimum account balance fees are remitted to the Fund and recorded as part of expense reductions in the Statement of Operations. For the year ended April 30, 2015, no minimum account balance fees were charged by the Fund.
Distribution and Service Fees
The Fund has an agreement with Columbia Management Investment Distributors, Inc. (the Distributor), an affiliate of the Investment Manager and a wholly-owned subsidiary of Ameriprise Financial, for distribution and shareholder services. The Board has approved, and the Fund has adopted, distribution and shareholder service plans (the Plans) applicable to certain share classes, which set the distribution and service fees for the Fund. These fees are calculated daily and are intended to compensate the Distributor and/or eligible selling and/or servicing agents for selling shares of the Fund and providing services to investors.
Under the Plans, the Fund pays a monthly combined distribution and service fee to the Distributor at the maximum annual rate of 0.25% of the average daily net assets attributable to Class A shares of the Fund. Also under the Plans, the Fund pays a monthly service fee at the maximum annual rate of 0.25% of the average daily
Annual Report 2015
26
COLUMBIA AMT-FREE SOUTH CAROLINA INTERMEDIATE MUNI BOND FUND
NOTES TO FINANCIAL STATEMENTS (continued)
April 30, 2015
net assets attributable to Class B and Class C shares of the Fund and the payment of a monthly distribution fee at the maximum annual rate of 0.75% of the average daily net assets attributable to Class B and Class C shares of the Fund.
Sales Charges
Sales charges, including front-end charges and CDSCs, received by the Distributor for distributing Fund shares were $47,864 for Class A and $931 for Class C shares for the year ended April 30, 2015.
Expenses Waived/Reimbursed by the Investment Manager and its Affiliates
The Investment Manager and certain of its affiliates have contractually agreed to waive fees and/or reimburse expenses (excluding certain fees and expenses described below) for the period disclosed below, unless sooner terminated at the sole discretion of the Board, so that the Fund's net operating expenses, after giving effect to fees waived/expenses reimbursed and any balance credits and/or overdraft charges from the Fund's custodian, do not exceed the following annual rates as a percentage of the class' average daily net assets:
| | | Fee Rates Contractual
through
August 31, 2015 | |
Class A | | | 0.81 | % | |
Class B | | | 1.56 | | |
Class C | | | 1.56 | | |
Class R4 | | | 0.56 | | |
Class Z | | | 0.56 | | |
Under the agreement governing these fee waivers and/or expense reimbursement arrangements, the following fees and expenses are excluded from the waiver/reimbursement commitment, and therefore will be paid by the Fund, if applicable: taxes (including foreign transaction taxes), expenses associated with investments in affiliated and non-affiliated pooled investment vehicles (including mutual funds and exchange-traded funds), transaction costs and brokerage commissions, costs related to any securities lending program, dividend expenses associated with securities sold short, inverse floater program fees and expenses, transaction charges and interest on borrowed money, interest, extraordinary expenses and any other expenses the exclusion of which is specifically approved by the Board. Any fees waived and/or expenses reimbursed under the expense reimbursement arrangements described above are not recoverable by the Investment
Manager or its affiliates in future periods. This agreement may be modified or amended only with approval from all parties.
Note 4. Federal Tax Information
The timing and character of income and capital gain distributions are determined in accordance with income tax regulations, which may differ from GAAP because of temporary or permanent book to tax differences.
At April 30, 2015, these differences are primarily due to differing treatment for deferral/reversal of wash sale losses, Trustees' deferred compensation and distributions. To the extent these differences are permanent, reclassifications are made among the components of the Fund's net assets in the Statement of Assets and Liabilities. Temporary differences do not require reclassifications.
The Fund did not have any permanent differences; therefore, no reclassifications were made to the Statement of Assets and Liabilities.
The tax character of distributions paid during the years indicated was as follows:
Year Ended April 30, | | 2015 | | 2014 | |
Ordinary income | | $ | 9,789 | | | $ | 14,472 | | |
Tax-exempt income | | | 3,659,607 | | | | 4,108,296 | | |
Long-term capital gains | | | 773,314 | | | | 56,114 | | |
Total | | $ | 4,442,710 | | | $ | 4,178,882 | | |
Short-term capital gain distributions, if any, are considered ordinary income distributions for tax purposes.
At April 30, 2015, the components of distributable earnings on a tax basis were as follows:
Undistributed tax-exempt income | | | 1,520,334 | | |
Undistributed long-term capital gains | | | 373,205 | | |
Net unrealized appreciation | | | 6,617,501 | | |
At April 30, 2015, the cost of investments for federal income tax purposes was $125,398,246 and the aggregate gross unrealized appreciation and depreciation based on that cost was:
Unrealized appreciation | | $ | 7,071,943 | | |
Unrealized depreciation | | | (454,442 | ) | |
Net unrealized appreciation | | $ | 6,617,501 | | |
For the year ended April 30, 2015, $30,659 of capital loss carryforward was utilized.
Management of the Fund has concluded that there are no significant uncertain tax positions in the Fund that
Annual Report 2015
27
COLUMBIA AMT-FREE SOUTH CAROLINA INTERMEDIATE MUNI BOND FUND
NOTES TO FINANCIAL STATEMENTS (continued)
April 30, 2015
would require recognition in the financial statements. However, management's conclusion may be subject to review and adjustment at a later date based on factors including, but not limited to, new tax laws, regulations, and administrative interpretations (including relevant court decisions). Generally, the Fund's federal tax returns for the prior three fiscal years remain subject to examination by the Internal Revenue Service.
Note 5. Portfolio Information
The cost of purchases and proceeds from sales of securities, excluding short-term investments and derivatives, if any, aggregated to $34,306,663 and $20,140,535, respectively, for the year ended April 30, 2015. The amount of purchase and sale activity impacts the portfolio turnover rate reported in the Financial Highlights.
Note 6. Shareholder Concentration
At April 30, 2015, one unaffiliated shareholder of record owned 61.9% of the outstanding shares of the Fund in one or more accounts. The Fund has no knowledge about whether any portion of those shares was owned beneficially. Subscription and redemption activity by concentrated accounts may have a significant effect on the operations of the Fund.
Note 7. Line of Credit
The Fund has entered into a revolving credit facility with a syndicate of banks led by JPMorgan Chase Bank, N.A. whereby the Fund may borrow for the temporary funding of shareholder redemptions or for other temporary or emergency purposes. Pursuant to a December 9, 2014 amendment, the credit facility agreement, which is a collective agreement between the Fund and certain other funds managed by the Investment Manager, severally and not jointly, permits collective borrowings up to $550 million. Interest is charged to each participating fund based on its borrowings at a rate equal to the higher of (i) the overnight federal funds rate plus 1.00% or (ii) the one-month LIBOR rate plus 1.00%. Each borrowing under the credit facility matures no later than 60 days after the date of borrowing. The Fund also pays a commitment fee equal to its pro rata share of the amount of the credit facility at a rate of 0.075% per annum. The commitment fee is included in other expenses in the Statement of Operations. Prior to the December 9, 2014 amendment, the credit facility agreement permitted borrowings up to $500 million under the same terms and interest rates as described above.
The Fund had no borrowings during the year ended April 30, 2015.
Note 8. Significant Risks
Credit Risk
Credit risk is the risk that the value of debt securities in the Fund's portfolio may decline because the issuer may default and fail to pay interest or repay principal when due. Rating agencies assign credit ratings to debt securities to indicate their credit risk. Lower rated or unrated debt securities held by the Fund may present increased credit risk as compared to higher-rated debt securities.
Interest Rate Risk
Interest rate risk is the risk of losses attributable to changes in interest rates. In general, if prevailing interest rates rise, the values of debt securities tend to fall, and if interest rates fall, the values of debt securities tend to rise. Actions by governments and central banking authorities can result in increases in interest rates. Increasing interest rates may negatively affect the value of debt securities held by the Fund, resulting in a negative impact on the Fund's performance and net asset value per share. In general, the longer the maturity or duration of a debt security, the greater its sensitivity to changes in interest rates.
Liquidity Risk
Liquidity risk is the risk associated with a lack of marketability of investments which may make it difficult to sell the investment at a desirable time or price. Changing regulatory, market or other conditions or environments (for example, the interest rate or credit environments) may adversely affect the liquidity of the Fund's investments. The Fund may have to accept a lower selling price for the holding, sell other investments, or forego another, more appealing investment opportunity. Generally, the less liquid the market at the time the Fund sells a portfolio investment, the greater the risk of loss or decline of value to the Fund. A less liquid market can lead to an increase in Fund redemptions, which may negatively impact Fund performance and net asset value per share, including, for example, if the Fund is forced to sell securities in a down market.
Geographic Concentration Risk
Because state-specific tax-exempt funds invest primarily in the municipal securities issued by the state and political sub-divisions of the state, the Fund will be
Annual Report 2015
28
COLUMBIA AMT-FREE SOUTH CAROLINA INTERMEDIATE MUNI BOND FUND
NOTES TO FINANCIAL STATEMENTS (continued)
April 30, 2015
particularly affected by political and economic conditions and developments in the state in which it invests. The Fund may, therefore, have a greater risk than that of a municipal bond fund which is more geographically diversified. The value of the municipal securities owned by the Fund also may be adversely affected by future changes in federal or state income tax laws.
Note 9. Subsequent Events
Management has evaluated the events and transactions that have occurred through the date the financial statements were issued and noted no items requiring adjustment of the financial statements or additional disclosure.
Note 10. Information Regarding Pending and Settled Legal Proceedings
In December 2005, without admitting or denying the allegations, American Express Financial Corporation (AEFC, which is now known as Ameriprise Financial, Inc. (Ameriprise Financial)) entered into settlement agreements with the Securities and Exchange Commission (SEC) and Minnesota Department of Commerce (MDOC) related to market timing activities. As a result, AEFC was censured and ordered to cease and desist from committing or causing any violations of certain provisions of the Investment Advisers Act of 1940, the Investment Company Act of 1940, and various Minnesota laws. AEFC agreed to pay disgorgement of $10 million and civil money penalties of $7 million. AEFC also agreed to retain an independent distribution consultant to assist in developing a plan for distribution of all disgorgement and civil penalties ordered by the SEC in accordance with various undertakings detailed at www.sec.gov/litigation/admin/ia-2451.pdf. Ameriprise Financial and its affiliates have cooperated with the SEC and the MDOC in these legal proceedings, and have made regular reports to the Funds' Boards of Trustees.
Ameriprise Financial and certain of its affiliates have historically been involved in a number of legal, arbitration and regulatory proceedings, including routine litigation, class actions, and governmental actions, concerning matters arising in connection with the conduct of their business activities. Ameriprise Financial believes that the Funds are not currently the subject of, and that neither Ameriprise Financial nor any of its affiliates are the subject of, any pending legal, arbitration or regulatory proceedings that are likely to have a material adverse effect on the Funds or the ability of Ameriprise Financial or its affiliates to perform under their contracts with the
Funds. Ameriprise Financial is required to make quarterly (10-Q), annual (10-K) and, as necessary, 8-K filings with the Securities and Exchange Commission on legal and regulatory matters that relate to Ameriprise Financial and its affiliates. Copies of these filings may be obtained by accessing the SEC website at www.sec.gov.
There can be no assurance that these matters, or the adverse publicity associated with them, will not result in increased fund redemptions, reduced sale of fund shares or other adverse consequences to the Funds. Further, although we believe proceedings are not likely to have a material adverse effect on the Funds or the ability of Ameriprise Financial or its affiliates to perform under their contracts with the Funds, these proceedings are subject to uncertainties and, as such, we are unable to estimate the possible loss or range of loss that may result. An adverse outcome in one or more of these proceedings could result in adverse judgments, settlements, fines, penalties or other relief that could have a material adverse effect on the consolidated financial condition or results of operations of Ameriprise Financial.
Annual Report 2015
29
COLUMBIA AMT-FREE SOUTH CAROLINA INTERMEDIATE MUNI BOND FUND
REPORT OF INDEPENDENT REGISTERED PUBLIC ACCOUNTING FIRM
To the Trustees of Columbia Funds Series Trust and the Shareholders of
Columbia AMT-Free South Carolina Intermediate Muni Bond Fund (formerly known as Columbia South Carolina Intermediate Municipal Bond Fund)
In our opinion, the accompanying statement of assets and liabilities, including the portfolio of investments, and the related statements of operations and of changes in net assets and the financial highlights present fairly, in all material respects, the financial position of Columbia AMT-Free South Carolina Intermediate Muni Bond Fund (formerly known as Columbia South Carolina Intermediate Municipal Bond Fund) (the "Fund", a series of Columbia Funds Series Trust) at April 30, 2015, and the results of its operations, the changes in its net assets and the financial highlights for each of the periods indicated, in conformity with accounting principles generally accepted in the United States of America. These financial statements and financial highlights (hereafter referred to as "financial statements") are the responsibility of the Fund's management. Our responsibility is to express an opinion on these financial statements based on our audits. We conducted our audits of these financial statements in accordance with the standards of the Public Company Accounting Oversight Board (United States). Those standards require that we plan and perform the audit to obtain reasonable assurance about whether the financial statements are free of material misstatement. An audit includes examining, on a test basis, evidence supporting the amounts and disclosures in the financial statements, assessing the accounting principles used and significant estimates made by management, and evaluating the overall financial statement presentation. We believe that our audits, which included confirmation of securities at April 30, 2015 by correspondence with the custodian and brokers, and the application of alternative auditing procedures where such confirmations had not been received, provide a reasonable basis for our opinion.
PricewaterhouseCoopers LLP
Minneapolis, Minnesota
June 19, 2015
Annual Report 2015
30
COLUMBIA AMT-FREE SOUTH CAROLINA INTERMEDIATE MUNI BOND FUND
FEDERAL INCOME TAX INFORMATION
(Unaudited)
The Fund hereby designates the following tax attributes for the fiscal year ended April 30, 2015. Shareholders will be notified in early 2016 of the amounts for use in preparing 2015 income tax returns.
Tax Designations:
Capital Gain Dividend | | $ | 1,203,845 | | |
| Exempt-Interest Dividends | | | 99.73 | % | |
Capital Gain Dividend. The Fund designates as a capital gain dividend the amount reflected above, or if subsequently determined to be different, the net capital gain of such fiscal period.
Exempt-Interest Dividends. The percentage of net investment income distributed during the fiscal year that qualifies as exempt-interest dividends for federal income tax purposes.
Annual Report 2015
31
COLUMBIA AMT-FREE SOUTH CAROLINA INTERMEDIATE MUNI BOND FUND
Shareholders elect the Board that oversees the Funds' operations. The Board appoints officers who are responsible for day-to-day business decisions based on policies set by the Board. The following table provides basic biographical information about the Funds' Board members, including their principal occupations during the past five years, although specific titles for individuals may have varied over the period. Under current Board policy, members may serve through the end of the calendar year in which he or she reaches either the mandatory retirement age established by the Board or the fifteenth anniversary of the first Board meeting they attended as a member of the Board.
Independent Trustees
Name,
Address,
Year of Birth | | Position Held
With Funds and
Length of Service | | Principal Occupation(s)
During Past Five Years
and Other Relevant
Professional Experience | | Number of
Funds in the
Fund Family
Overseen by
Board Member | | Other Present or Past
Directorships/
Trusteeships
(Within Past 5 Years) | |
Kathleen Blatz
901 S. Marquette Ave.
Minneapolis, MN 55402
1954 | | Board member since 1/06 for RiverSource Funds and since 6/11 for Nations Funds | | Attorney; specializing in arbitration and mediation; Chief Justice, Minnesota Supreme Court, 1998-2006; Associate Justice, Minnesota Supreme Court, 1996-1998; Fourth Judicial District Court Judge, Hennepin County, 1994-1996; Attorney in private practice and public service, 1984-1993; State Representative, Minnesota House of Representatives, 1979-1993, which included service on the Tax and Financial Institutions and Insurance Committees | | | 127 | | | Trustee, BlueCross BlueShield of Minnesota (Chair of the Business Development Committee) since 2009; Chair of the Robina Foundation since August 2013 | |
Edward J. Boudreau, Jr.
901 S. Marquette Ave.
Minneapolis, MN 55402
1944 | | Board member since 6/11 for RiverSource Funds and since 1/05 for Nations Funds | | Managing Director, E.J. Boudreau & Associates (consulting) since 2000; FINRA Industry Arbitrator, 2002-present; Chairman and Chief Executive Officer, John Hancock Funds (asset management), Chairman and Interested Trustee for open-end and closed-end funds offered by John Hancock, 1989-2000; John Hancock Life Insurance Company, including SVP and Treasurer and SVP Information Technology, 1968-1988 | | | 125 | | | Former Trustee, BofA Funds Series Trust (11 funds), 2005-2011; Trustee, Boston Museum of Science (Chair of Finance Committee), 1985-2013 | |
Pamela G. Carlton
901 S. Marquette Ave.
Minneapolis, MN 55402
1954 | | Board member since 7/07 for RiverSource Funds and since 6/11 for Nations Funds | | President, Springboard — Partners in Cross Cultural Leadership (consulting company) since 2003; Managing Director of US Equity Research, JP Morgan Chase, 1999-2003; Director of US Equity Research, Chase Asset Management, 1996-1999; Co-Director Latin America Research, 1993-1996, COO Global Research, 1992-1996, Co-Director of US Research, 1991-1992, Investment Banker, Morgan Stanley, 1982-1991 | | | 127 | | | None | |
Annual Report 2015
32
COLUMBIA AMT-FREE SOUTH CAROLINA INTERMEDIATE MUNI BOND FUND
TRUSTEES AND OFFICERS (continued)
Independent Trustees (continued)
Name,
Address,
Year of Birth | | Position Held
With Funds and
Length of Service | | Principal Occupation(s)
During Past Five Years
and Other Relevant
Professional Experience | | Number of
Funds in the
Fund Family
Overseen by
Board Member | | Other Present or Past
Directorships/
Trusteeships
(Within Past 5 Years) | |
William P. Carmichael
901 S. Marquette Ave.
Minneapolis, MN 55402
1943 | | Chair of the Board since 1/14, Board member since 6/11 for RiverSource Funds and since 2003 for Nations Funds | | Retired; Co-founder, The Succession Fund (provides exit strategies to owners of privately held companies) 1998-2007; Adjunct Professor of Finances, Kelley School of Business, Indiana University, 1993-2007; Senior Vice President, Sara Lee Corporation, 1991-1993; Senior Vice President and Chief Financial Officer, Beatrice Foods Company, 1984-1990; Vice President, Esmark, Inc., 1973-1984; Associate, Price Waterhouse, 1968-1972 | | | 127 | | | Director, Cobra Electronics Corporation (electronic equipment manufacturer), 1994-August 2014; The Finish Line (athletic shoes and apparel) since July 2003; Director, International Textile Corp. since 2012; former Director, McMoRan Exploration Company (oil and gas exploration and development) 2010-2013; former Trustee, BofA Funds Series Trust (11 funds) 2009-2011; Director, Spectrum Brands, Inc. (consumer products), 2002-2009; Director, Simmons Company (bedding), 2004-2010 | |
Patricia M. Flynn
901 S. Marquette Ave.
Minneapolis, MN 55402
1950 | | Board member since 11/04 for RiverSource Funds and since 6/11 for Nations Funds | | Trustee Professor of Economics and Management, Bentley University since 1976 (also teaches and conducts research on corporate governance); Dean, McCallum Graduate School of Business, Bentley University, 1992-2002 | | | 127 | | | Trustee, MA Taxpayers Foundation since 1997; Board of Governors, Innovation Institute, MA Technology Collaborative since 2010 | |
William A. Hawkins
901 S. Marquette Ave.
Minneapolis, MN 55402
1942 | | Board member since 6/11 for RiverSource Funds and since 1/05 for Nations Funds | | Managing Director, Overton Partners (financial consulting), since August 2010; President and Chief Executive Officer, California General Bank, N.A., January 2008-August 2010; Operation Hope, COO, 2004-2007; IndyMac Bancorp, President, CBG, 1999-2003; American General Bank, President, 1997-1999; Griffin Financial Services, CEO, 1981-1997; The Griffin Funds, CEO, 1992-1998 | | | 125 | | | Trustee, BofA Funds Series Trust (11 funds) | |
R. Glenn Hilliard
901 S. Marquette Ave.
Minneapolis, MN 55402
1943 | | Board member since 6/11 for RiverSource Funds and since 1/05 for Nations Funds | | Chairman and Chief Executive Officer, Hilliard Group LLC (investing and consulting) since April 2003; Non-Executive Director & Chairman, CNO Financial Group, Inc. (insurance), September 2003-May 2011 | | | 125 | | | Chairman, BofA Funds Series Trust (11 funds); former Director, CNO Financial Group, Inc. (insurance) 2003-2011 | |
Annual Report 2015
33
COLUMBIA AMT-FREE SOUTH CAROLINA INTERMEDIATE MUNI BOND FUND
TRUSTEES AND OFFICERS (continued)
Independent Trustees (continued)
Name,
Address,
Year of Birth | | Position Held
With Funds and
Length of Service | | Principal Occupation(s)
During Past Five Years
and Other Relevant
Professional Experience | | Number of
Funds in the
Fund Family
Overseen by
Board Member | | Other Present or Past
Directorships/
Trusteeships
(Within Past 5 Years) | |
Catherine James Paglia
901 S. Marquette Ave.
Minneapolis, MN 55402
1952 | | Board member since 11/04 for RiverSource Funds and since 6/11 for Nations Funds | | Director, Enterprise Asset Management, Inc. (private real estate and asset management company) since September 1998; Managing Director and Partner, Interlaken Capital, Inc., 1989-1997; Managing Director, Morgan Stanley, 1982-1989; Vice President, Investment Banking, 1980-1982, Associate, Investment Banking, 1976-1980, Dean Witter Reynolds, Inc. | | | 127 | | | Director, Valmont Industries, Inc. (irrigation systems manufacturer) since 2012; Trustee, Carleton College (on the Investment Committee); Trustee, Carnegie Endowment for International Peace (on the Investment Committee) | |
Leroy C. Richie
901 S. Marquette Ave.
Minneapolis, MN 55402
1941 | | Board member since 2000 for Seligman Funds, since 11/08 for RiverSource Funds and since 6/11 for Nations Funds | | Counsel, Lewis & Munday, P.C. (law firm) since 2004; Vice President and General Counsel, Automotive Legal Affairs, Chrysler Corporation, 1993-1997 | | | 127 | | | Lead Outside Director, Digital Ally, Inc. (digital imaging) since September 2005; Director, Infinity, Inc. (oil and gas exploration and production) since 1994; Director, OGE Energy Corp. (energy and energy services) 2007-2014 | |
Minor M. Shaw
901 S. Marquette Ave.
Minneapolis, MN 55402
1947 | | Board member since 6/11 for RiverSource Funds and since 2003 for Nations Funds | | President, Micco LLC (private investments) since 2011; President, Micco Corp. (family investment business) 1998-2011 | | | 125 | | | Director, Piedmont Natural Gas; Director, BlueCross BlueShield of South Carolina since April 2008; Chair of the Duke Endowment; Director, National Association of Corporate Directors, Carolinas Chapter, since 2013; Chair of Greenville-Spartanburg Airport Commission; former Trustee, BofA Funds Series Trust (11 funds), 2003-2011 | |
Alison Taunton-Rigby
901 S. Marquette Ave.
Minneapolis, MN 55402
1944 | | Board member since 11/02 for RiverSource Funds and since 6/11 for Nations Funds | | Managing Director, Forester Biotech (consulting) since 2001; Chief Executive Officer and Director, RiboNovix, Inc., (biotechnology) 2003-2010; President and Chief Executive Officer of CMT Inc., 2001-2003; Aquila Biopharmaceuticals Inc., 1996-2000; Cambridge Biotech Corporation, 1995-1996, Mitotix Inc., 1993-1994 | | | 127 | | | Director, Healthways, Inc. (health and well-being solutions) since 2005; Director, ICI Mutual Insurance Company, since 2011; Director, Abt Associates (government contractor) since 2001; Director, Boston Children's Hospital since 2002 | |
Annual Report 2015
34
COLUMBIA AMT-FREE SOUTH CAROLINA INTERMEDIATE MUNI BOND FUND
TRUSTEES AND OFFICERS (continued)
Interested Trustee Not Affiliated with Investment Manager*
Name,
Address,
Year of Birth | | Position Held
With Funds and
Length of Service | | Principal Occupation
During Past Five Years | | Number of
Funds in the
Fund Family
Overseen by
Board Member | | Other Present or Past
Directorships/
Trusteeships
(Within Past 5 Years) | |
Anthony M. Santomero
901 S. Marquette Ave.
Minneapolis, MN 55402
1946 | | Board member since 6/11 for RiverSource Funds and since 1/08 for Nations Funds | | Richard K. Mellon Professor Emeritus of Finance, The Wharton School, University of Pennsylvania, since 2002; Senior Advisor, McKinsey & Company (consulting), 2006-2008; President, Federal Reserve Bank of Philadelphia, 2000-2006, Professor of Finance, The Wharton School, University of Pennsylvania, 1972-2002 | | | 125 | | | Director, Renaissance Reinsurance Ltd. since May 2008; Trustee, Penn Mutual Life Insurance Company since March 2008; Director, Citigroup Inc. since 2009; Director, Citibank, N.A. since 2009; former Trustee, BofA Funds Series Trust (11 funds), 2008-2011 | |
* Dr. Santomero is not an affiliated person of the Investment Manager or Ameriprise Financial. However, he is currently deemed by the Funds to be an "interested person" (as defined in the 1940 Act) of the Funds because he serves as a Director of Citigroup Inc. and Citibank, N.A., companies that may directly or through subsidiaries and affiliates engage from time-to-time in brokerage execution, principal transactions and lending relationships with the Funds or accounts advised/managed by the Investment Manager.
Interested Trustee Affiliated with Investment Manager*
Name,
Address,
Year of Birth | | Position Held
With Funds and
Length of Service | | Principal Occupation
During Past Five Years | | Number of
Funds in the
Fund Family
Overseen by
Board Member | | Other Present or Past
Directorships/
Trusteeships
(Within Past 5 Years) | |
William F. Truscott
53600 Ameriprise
Financial Center
Minneapolis, MN 55474
1960 | | Board member since 11/01 for RiverSource Funds and since 6/11 for Nations Funds; Senior Vice President since 2002 for RiverSource Funds and since 5/10 for Nations Funds | | Chairman of the Board and President, Columbia Management Investment Advisers, LLC since May 2010 and February 2012, respectively (previously President and Chief Investment Officer, 2001-April 2010); Chief Executive Officer, Global Asset Management, Ameriprise Financial, Inc. since September 2012 (previously Chief Executive Officer, U.S. Asset Management & President, Annuities, May 2010-September 2012 and President — U.S. Asset Management and Chief Investment Officer, 2005-April 2010); Director and Chief Executive Officer, Columbia Management Investment Distributors, Inc. since May 2010 and February 2012, respectively (previously Chairman of the Board and Chief Executive Officer, 2006-April 2010); Chairman of the Board and Chief Executive Officer, RiverSource Distributors, Inc. since 2006; Director, Threadneedle Asset Management Holdings, SARL since 2014; President and Chief Executive Officer, Ameriprise Certificate Company, 2006-August 2012 | | | 186 | | | Former Director, Ameriprise Certificate Company, 2006-January 2013 | |
* Interested person (as defined under the 1940 Act) by reason of being an officer, director, security holder and/or employee of the Investment Manager or Ameriprise Financial.
Annual Report 2015
35
COLUMBIA AMT-FREE SOUTH CAROLINA INTERMEDIATE MUNI BOND FUND
TRUSTEES AND OFFICERS (continued)
The Statement of Additional Information has additional information about the Fund's Board members and is available, without charge, upon request by calling 800.345.6611; contacting your financial intermediary or visiting columbiathreadneedle.com/us.
The Board has appointed officers who are responsible for day-to-day business decisions based on policies it has established. The officers serve at the pleasure of the Board. In addition to Mr. Truscott, who is Senior Vice President, the Funds' other officers are:
Fund Officers
Name,
Address and
Year of Birth | | Position and Year
First Appointed to
Position for any Fund
in the Columbia
Funds Complex or a
Predecessor Thereof | | Principal Occupation(s) During Past Five Years | |
Christopher O. Petersen
5228 Ameriprise
Financial Center
Minneapolis, MN 55474
Born 1970 | | President and Principal Executive Officer (2015) | | Vice President and Lead Chief Counsel, Ameriprise Financial, Inc. since January 2015 (previously, Vice President and Chief Counsel January 2010-December 2014; and Vice President and Group Counsel or Counsel 2004-January 2010); officer of Columbia Funds and affiliated funds since 2007. | |
Michael G. Clarke
225 Franklin Street
Boston, MA 02110
Born 1969 | | Treasurer (2011) and Chief Financial Officer (2009) | | Vice President — Mutual Fund Administration, Columbia Management Investment Advisers, LLC, since May 2010; Managing Director of Fund Administration, Columbia Management Advisors, LLC, September 2004-April 2010; senior officer of Columbia Funds and affiliated funds since 2002. | |
Paul B. Goucher
100 Park Avenue
New York, NY 10017
Born 1968 | | Senior Vice President (2011), Chief Legal Officer (2015) and Assistant Secretary (2008) | | Vice President and Lead Chief Counsel, Ameriprise Financial, Inc. since November 2008 and January 2013, respectively (previously Chief Counsel, January 2010-January 2013 and Group Counsel, November 2008-January 2010). | |
Thomas P. McGuire
225 Franklin Street
Boston, MA 02110
Born 1972 | | Vice President and Chief Compliance Officer (2012) | | Vice President — Asset Management Compliance, Ameriprise Financial, Inc., since May 2010; Chief Compliance Officer, Ameriprise Certificate Company since September 2010; Compliance Executive, Bank of America, 2005-April 2010. | |
Colin Moore
225 Franklin Street
Boston, MA 02110
Born 1958 | | Senior Vice President (2010) | | Executive Vice President and Global Chief Investment Officer, Ameriprise Financial, Inc., since July 2013; Director and Global Chief Investment Officer, Columbia Management Investment Advisers, LLC since May 2010; Manager, Managing Director and Chief Investment Officer, Columbia Management Advisors, LLC, 2007-April 2010. | |
Michael E. DeFao
225 Franklin Street
Boston, MA 02110
Born 1968 | | Vice President (2011) and Assistant Secretary (2010) | | Vice President and Chief Counsel, Ameriprise Financial, Inc. since May 2010; Associate General Counsel, Bank of America, 2005-April 2010. | |
Joseph F. DiMaria
225 Franklin Street
Boston, MA 02110
Born 1968 | | Vice President (2011), Assistant Treasurer (2012) and Chief Accounting Officer (2008) | | Vice President — Mutual Fund Treasurer, Columbia Management Investment Advisers, LLC since May 2010; Director of Fund Administration, Columbia Management Advisors, LLC, 2006-April 2010. | |
Amy Johnson
5228 Ameriprise
Financial Center
Minneapolis, MN 55474
Born 1965 | | Vice President (2006) | | Managing Director and Chief Operating Officer, Columbia Management Investment Advisers, LLC since May 2010 (previously Chief Administrative Officer, 2009-April 2010, and Vice President — Asset Management and Trust Company Services, 2006-2009). | |
Lyn Kephart-Strong
5228 Ameriprise
Financial Center
Minneapolis, MN 55474
Born 1960 | | Vice President (2015) | | President, Columbia Management Investment Services Corp. since October 2014; Vice President & Resolution Officer, Ameriprise Trust Company since August 2009; President, RiverSource Service Corporation 2004-2010. | |
Ryan C. Larrenaga
225 Franklin Street
Boston, MA 02110
Born 1970 | | Vice President and Secretary (2015) | | Vice President and Group Counsel, Ameriprise Financial, Inc. since August 2011 (previously, Counsel from May 2010 to August 2011); Assistant General Counsel, Bank of America, 2005-April 2010; officer of Columbia Funds and affiliated funds since 2005. | |
Annual Report 2015
36
COLUMBIA AMT-FREE SOUTH CAROLINA INTERMEDIATE MUNI BOND FUND
APPROVAL OF INVESTMENT MANAGEMENT SERVICES AGREEMENT
Columbia Management Investment Advisers, LLC (Columbia Management or the Investment Manager), a wholly-owned subsidiary of Ameriprise Financial, Inc. (Ameriprise Financial), serves as the investment manager to Columbia AMT-Free South Carolina Intermediate Muni Bond Fund (the Fund). Under an investment management services agreement (the IMS Agreement), Columbia Management provides investment advice and other services to the Fund and other funds distributed by Columbia Management Investment Distributors, Inc. (collectively, the Funds).
The Fund's Board of Trustees (the Board), including the independent Board members (the Independent Trustees), considered the renewal of the IMS Agreement for a two-month period (Short-Term Period) in order to align the IMS Agreement with the review cycle of other funds in the Columbia family of funds. Columbia Management prepared detailed reports for the Board and its Contracts Committee in January, March and April 2015, including reports based on analyses of data provided by an independent organization (Lipper) and a comprehensive response to each item of information requested by independent legal counsel to the Independent Trustees (Independent Legal Counsel) in a letter to the Investment Manager, to assist the Board in making this determination. In addition, throughout the year, the Board (or its committees) regularly meets with portfolio management teams and senior management personnel, and reviews information prepared by Columbia Management addressing the services Columbia Management provides and Fund performance. The Board also accords appropriate weight to the work, deliberations and conclusions of the Contracts Committee, the Investment Review Committee and the Compliance Committee in determining whether to continue the IMS Agreement.
The Board, at its April 13-15, 2015 in-person Board meeting (the April Meeting), considered the renewal of the IMS Agreement for the Short-Term Period. At the April Meeting, Independent Legal Counsel reviewed with the Independent Trustees various factors relevant to the Board's consideration of advisory agreements and the Board's legal responsibilities related to such consideration. Following an analysis and discussion of the factors identified below, the Board, including all of the Independent Trustees, approved the renewal of the IMS Agreement for the Short-Term Period.
Nature, Extent and Quality of Services Provided by Columbia Management
The Independent Trustees analyzed various reports and presentations they had received detailing the services performed by Columbia Management, as well as its expertise, resources and capabilities. The Independent Trustees specifically considered many developments during the past year concerning the services provided by Columbia Management. The Independent Trustees noted the information they received concerning Columbia Management's ability to retain its key portfolio management personnel. In evaluating the quality of services provided under the IMS Agreement and the Fund's Administrative Services Agreement, the Independent Trustees also took into account the organization and strength of the Fund's and its service providers' compliance programs. In addition, the Board also reviewed the financial condition of Columbia Management (and its affiliates) and each entity's ability to carry out its responsibilities under the IMS Agreement and the Fund's other services agreements with affiliates of Ameriprise Financial, observing the financial strength of Ameriprise Financial, with its solid balance sheet. The Board also discussed the acceptability of the terms of the IMS Agreement for the Short-Term Period.
Based on the foregoing, and based on other information received (both oral and written, including the information on investment performance referenced below) and other considerations, the Board concluded that the services being performed by Columbia Management and its affiliates were acceptable for the Short-Term Period.
Investment Performance
For purposes of evaluating the nature, extent and quality of services provided under the IMS Agreement, the Board carefully reviewed the investment performance of the Fund. In this regard, the Board considered detailed reports providing the results of analyses performed by an independent organization showing, for various periods, the performance of the Fund, the performance of a benchmark index, the percentage ranking of the Fund among its comparison group and the net assets of the Fund. The Board observed that for purposes of approving the IMS Agreement for the Short-Term Period, the Fund's performance was acceptable.
Annual Report 2015
37
COLUMBIA AMT-FREE SOUTH CAROLINA INTERMEDIATE MUNI BOND FUND
APPROVAL OF INVESTMENT MANAGEMENT SERVICES AGREEMENT (continued)
Comparative Fees, Costs of Services Provided and the Profits Realized By Columbia Management and its Affiliates from their Relationships with the Fund
The Board reviewed comparative fees and the costs of services provided under the IMS Agreement. The Board members considered detailed comparative information set forth in an annual report on fees and expenses, including, among other things, data (based on analyses conducted by an independent organization) showing a comparison of the Fund's expenses with median expenses paid by funds in its comparative peer universe, as well as data showing the Fund's contribution to Columbia Management's profitability.
The Board accorded particular weight to the notion that the level of fees should reflect a rational pricing model applied consistently across the various product lines in the Fund family, while assuring that the overall fees for each Fund (with few defined exceptions) are generally in line with the "pricing philosophy" currently in effect (i.e., that the total expense ratio of the Fund is no higher than the median expense ratio of funds in the same comparison universe of the Fund).
The Board also considered the expected profitability of Columbia Management and its affiliates in connection with Columbia Management providing investment management services to the Fund. In this regard, the Board referred to a detailed profitability report, discussing the profitability to Columbia Management and Ameriprise Financial from managing, operating and distributing the Funds. For purposes of approving the IMS Agreement for the Short-Term Period, the Board concluded that the investment management service fees were fair and reasonable, observing that the profitability levels also seemed reasonable.
Economies of Scale to be Realized
The Board also considered the economies of scale that might be realized by Columbia Management as the Fund grows and took note of the extent to which Fund shareholders might also benefit from such growth. In this regard, the Independent Trustees took into account that IMS fees decline as Fund assets exceed various breakpoints.
Based on the foregoing, the Board, including all of the Independent Trustees, concluded that, for purposes of its consideration of the renewal of the IMS Agreement for the Short-Term Period, the investment management service fees were fair and reasonable in light of the extent and quality of services provided. In reaching this conclusion, no single factor was determinative. The Board noted its understanding that it would undertake the full consideration of renewal of the IMS Agreement for the full annual period at its June 2015 meetings. On April 15, 2015, the Board, including all of the Independent Trustees, approved the renewal of the IMS Agreement for the Short-Term Period.
Annual Report 2015
38
COLUMBIA AMT-FREE SOUTH CAROLINA INTERMEDIATE MUNI BOND FUND
IMPORTANT INFORMATION ABOUT THIS REPORT
Each fund mails one shareholder report to each shareholder address. If you would like more than one report, please call shareholder services at 800.345.6611 and additional reports will be sent to you.
The policy of the Board is to vote the proxies of the companies in which each fund holds investments consistent with the procedures as stated in the Statement of Additional Information (SAI). You may obtain a copy of the SAI without charge by calling 800.345.6611; contacting your financial intermediary; visiting columbiathreadneedle.com/us; or searching the website of the Securities and Exchange Commission (SEC) at sec.gov. Information regarding how each fund voted proxies relating to portfolio securities is filed with the SEC by August 31st for the most recent 12-month period ending June 30th of that year, and is available without charge by visiting columbiathreadneedle.com/us, or searching the website of the SEC at sec.gov.
Each fund files a complete schedule of portfolio holdings with the SEC for the first and third quarters of each fiscal year on Form N-Q. Each fund's Form N-Q is available on the SEC's website at sec.gov and may be reviewed and copied at the SEC's Public Reference Room in Washington, D.C. Information on the operation of the Public Reference Room may be obtained by calling 800.SEC.0330. Each fund's complete schedule of portfolio holdings, as filed on Form N-Q, can also be obtained without charge, upon request, by calling 800.345.6611.
Annual Report 2015
39
Columbia AMT-Free South Carolina Intermediate Muni Bond Fund
P.O. Box 8081
Boston, MA 02266-8081

This information is for use with concurrent or prior delivery of a fund prospectus. Please read and consider the investment objectives, risks, charges and expenses for any fund carefully before investing. For a prospectus and summary prospectus, which contains this and other important information about the Fund, go to columbiathreadneedle.com/us. The Fund is distributed by Columbia Management Investment Distributors, Inc., member FINRA, and managed by Columbia Management Investment Advisers, LLC.
Columbia Threadneedle Investments (Columbia Threadneedle) is the global brand name of the Columbia and Threadneedle group of companies.
All rights reserved. Columbia Management Investment Distributors, Inc., 225 Franklin Street, Boston, MA 02110-2804
© 2015 Columbia Management Investment Advisers, LLC.
columbiathreadneedle.com/us
ANN231_04_E01_(06/15)

ANNUAL REPORT
April 30, 2015

COLUMBIA AMT-FREE CALIFORNIA INTERMEDIATE MUNI BOND FUND

 Dear Shareholder,
In a world that is changing faster than ever before, investors want asset managers who offer a global perspective while generating strong and sustainable returns. To that end, Columbia Management, in conjunction with its U.K.-based affiliate, Threadneedle Investments, has rebranded to Columbia Threadneedle Investments. The new global brand represents the combined capabilities, resources and reach of the global group, offering investors access to the best of both firms.
With a presence in 18 countries and more than 450 investment professionals*, our collective perspective and world view as Columbia Threadneedle Investments gives us deeper insight into what might affect the real-life financial outcomes clients are seeking. Putting our views into a global context enables us to build richer perspectives and create the right solutions, and provides us with enhanced capabilities to deliver consistent investment performance, which may ultimately lead to better investor outcomes.
As a result of the rebrand, you will begin to see our new logo and colors reflected in printed materials, such as this shareholder report, as well as on our new website — columbiathreadneedle.com/us. We encourage you to visit us online and view a new video on the "About Us" tab that speaks to the strength of the firm.
While we are introducing a new brand, in many ways, the investment company you know well has not changed. The following remain in effect:
n Fund and strategy names
n Established investment teams, philosophies and processes
n Account services, features, servicing phone numbers and mailing addresses
n Columbia Management Investment Distributors as distributor and Columbia Management Investment Advisers as investment adviser
We recognize that the money we manage represents the hard work and savings of people like you, and that everyone has different ambitions and different definitions of success. Investors have varying goals — funding their children's education, enjoying their retirement, putting money aside for unexpected events, and more. Whatever your ambitions, we believe our wide range of investment products and solutions can help give you confidence that you will reach your goals.
The world is constantly changing, but our priority remains the same: to help you secure your finances, meet your goals and achieve success. Thank you for your continued investment with us. Our service representatives are available at 800.345.6611 to help with any questions.
Sincerely,

Christopher O. Petersen
President, Columbia Funds
Investors should consider the investment objectives, risks, charges and expenses of a mutual fund carefully before investing. For a free prospectus and summary prospectus, which contains this and other important information about a fund, visit columbiathreadneedle.com/us. The prospectus should be read carefully before investing.
* Source: Ameriprise as of December 1, 2014
Columbia Funds are distributed by Columbia Management Investment Distributors, Inc., member FINRA, and managed by Columbia Management Investment Advisers, LLC.
© 2015 Columbia Management Investment Advisers, LLC. All rights reserved.
COLUMBIA AMT-FREE CALIFORNIA INTERMEDIATE MUNI BOND FUND
Performance Overview | | | 2 | | |
Manager Discussion of Fund Performance | | | 4 | | |
Understanding Your Fund's Expenses | | | 6 | | |
Portfolio of Investments | | | 7 | | |
Statement of Assets and Liabilities | | | 18 | | |
Statement of Operations | | | 20 | | |
Statement of Changes in Net Assets | | | 21 | | |
Financial Highlights | | | 23 | | |
Notes to Financial Statements | | | 29 | | |
Report of Independent Registered
Public Accounting Firm | | | 36 | | |
Federal Income Tax Information | | | 37 | | |
Trustees and Officers | | | 38 | | |
Approval of Investment Management Services Agreement | | | 43 | | |
Important Information About This Report | | | 45 | | |
Fund Investment Manager
Columbia Management Investment
Advisers, LLC
225 Franklin Street
Boston, MA 02110
Fund Distributor
Columbia Management Investment
Distributors, Inc.
225 Franklin Street
Boston, MA 02110
Fund Transfer Agent
Columbia Management Investment
Services Corp.
P.O. Box 8081
Boston, MA 02266-8081
For more information about any of the funds, please visit columbiathreadneedle.com/us or call 800.345.6611. Customer Service Representatives are available to answer your questions Monday through Friday from 8 a.m. to 7 p.m. Eastern time.
The views expressed in this report reflect the current views of the respective parties. These views are not guarantees of future performance and involve certain risks, uncertainties and assumptions that are difficult to predict, so actual outcomes and results may differ significantly from the views expressed. These views are subject to change at any time based upon economic, market or other conditions and the respective parties disclaim any responsibility to update such views. These views may not be relied on as investment advice and, because investment decisions for a Columbia fund are based on numerous factors, may not be relied on as an indication of trading intent on behalf of any particular Columbia fund. References to specific securities should not be construed as a recommendation or investment advice.
COLUMBIA AMT-FREE CALIFORNIA INTERMEDIATE MUNI BOND FUND
Performance Summary
n Columbia AMT-Free California Intermediate Muni Bond Fund (the Fund) Class A shares returned 3.60% excluding sales charges for the 12-month period that ended April 30, 2015. Class Z shares of the Fund returned 3.76% for the same time period.
n During the same time period, the Barclays California 3-15 Year Blend Municipal Bond Index returned 3.82% and the Barclays 3-15 Year Blend Municipal Bond Index returned 3.76%.
n The Fund was helped by its allocation to lower-rated investment-grade bonds, but the positive impact was offset by its positions in shorter-term debt.
Average Annual Total Returns (%) (for period ended April 30, 2015)
| | | Inception | | 1 Year | | 5 Years | | 10 Years | |
Class A | | 09/09/02 | | | | | | | | | | | | | |
Excluding sales charges | | | | | | | 3.60 | | | | 4.45 | | | | 4.08 | | |
Including sales charges | | | | | | | 0.51 | | | | 3.82 | | | | 3.76 | | |
Class B | | 08/29/02 | | | | | | | | | | | | | |
Excluding sales charges | | | | | | | 2.82 | | | | 3.67 | | | | 3.30 | | |
Including sales charges | | | | | | | -0.18 | | | | 3.67 | | | | 3.30 | | |
Class C | | 09/11/02 | | | | | | | | | | | | | |
Excluding sales charges | | | | | | | 2.72 | | | | 3.65 | | | | 3.29 | | |
Including sales charges | | | | | | | 1.72 | | | | 3.65 | | | | 3.29 | | |
Class R4* | | 03/19/13 | | | 3.76 | | | | 4.69 | | | | 4.33 | | |
Class R5* | | 11/08/12 | | | 3.85 | | | | 4.74 | | | | 4.35 | | |
Class Z | | 08/19/02 | | | 3.76 | | | | 4.69 | | | | 4.33 | | |
Barclays California 3-15 Year Blend Municipal Bond Index | | | | | | | 3.82 | | | | 4.89 | | | | 4.78 | | |
Barclays 3-15 Year Blend Municipal Bond Index | | | | | | | 3.76 | | | | 4.35 | | | | 4.54 | | |
Returns for Class A are shown with and without the maximum initial sales charge of 3.00%. The maximum applicable sales charge was reduced from 3.25% to 3.00% on Class A share purchases made on or after February 19, 2015. Class A returns (including sales charges) for all periods reflect the current maximum applicable sales charge of 3.00%. Returns for Class B are shown with and without the applicable contingent deferred sales charge (CDSC) of 3.00% in the first year, declining to 1.00% in the fourth year and eliminated thereafter. Returns for Class C are shown with and without the 1.00% CDSC for the first year only. The Fund's other classes are not subject to sales charges and have limited eligibility. Please see the Fund's prospectus for details. Performance for different share classes will vary based on differences in sales charges and fees associated with each class. All results shown assume reinvestment of distributions during the period. Returns do not reflect the deduction of taxes that a shareholder may pay on Fund distributions or on the redemption of Fund shares. Performance results reflect the effect of any fee waivers or reimbursements of Fund expenses by Columbia Management Investment Advisers, LLC and/or any of its affiliates. Absent these fee waivers or expense reimbursement arrangements, performance results would have been lower.
The performance information shown represents past performance and is not a guarantee of future results. The investment return and principal value of your investment will fluctuate so that your shares, when redeemed, may be worth more or less than their original cost. Current performance may be lower or higher than the performance information shown. You may obtain performance information current to the most recent month-end by contacting your financial intermediary, visiting columbiathreadneedle.com/us or calling 800.345.6611.
*The returns shown for periods prior to the share class inception date (including returns for the Life of the Fund, if shown, which are since Fund inception) include the returns of the Fund's oldest share class. These returns are adjusted to reflect any higher class-related operating expenses of the newer share classes, as applicable. Please visit columbiathreadneedle.com/us/investment-products/mutual-funds/appended-performance for more information.
The Barclays California 3-15 Year Blend Municipal Bond Index tracks investment grade bonds issued from the state of California and its municipalities.
The Barclays 3-15 Year Blend Municipal Bond Index is an unmanaged index that tracks the performance of municipal bonds issued after December 31, 1990, with remaining maturities between 2 and 17 years and at least $7 million in principal amount outstanding.
Indices are not available for investment, are not professionally managed and do not reflect sales charges, fees, brokerage commissions, taxes or other expenses of investing. Securities in the Fund may not match those in an index.
Annual Report 2015
2
COLUMBIA AMT-FREE CALIFORNIA INTERMEDIATE MUNI BOND FUND
PERFORMANCE OVERVIEW (continued)
Performance of a Hypothetical $10,000 Investment (May 1, 2005 – April 30, 2015)

The chart above shows the change in value of a hypothetical $10,000 investment in Class A shares of Columbia AMT-Free California Intermediate Muni Bond Fund during the stated time period, and does not reflect the deduction of taxes that a shareholder may pay on Fund distributions or on the redemption of Fund shares.
Annual Report 2015
3
COLUMBIA AMT-FREE CALIFORNIA INTERMEDIATE MUNI BOND FUND
MANAGER DISCUSSION OF FUND PERFORMANCE
Portfolio Management
Brian McGreevy
Paul Fuchs, CFA
Quality Breakdown (%)
(at April 30, 2015) | |
AAA rating | | | 1.2 | | |
AA rating | | | 35.0 | | |
A rating | | | 46.9 | | |
BBB rating | | | 13.2 | | |
BB rating | | | 0.9 | | |
Not rated | | | 2.8 | | |
Total | | | 100.0 | | |
Percentages indicated are based upon total fixed income investments (excluding Money Market Funds).
Bond ratings apply to the underlying holdings of the Fund and not the Fund itself and are divided into categories ranging from highest to lowest credit quality, determined by using the middle rating of Moody's, S&P and Fitch, after dropping the highest and lowest available ratings. When ratings are available from only two rating agencies, the lower rating is used. When a rating is available from only one rating agency, that rating is used. When a bond is not rated by any rating agency, it is designated as "Not rated". Credit quality ratings assigned by a rating agency are subjective opinions, not statements of fact, and are subject to change, including daily. The ratings assigned by credit rating agencies are but one of the considerations that the Investment Manager and/or Fund's subadviser incorporates into its credit analysis process, along with such other issuer-specific factors as cash flows, capital structure and leverage ratios, ability to de-leverage (repay) through free cash flow, quality of management, market positioning and access to capital, as well as such security-specific factors as the terms of the security (e.g., interest rate, and time to maturity) and the amount and type of any collateral.
During the 12-month period that ended April 30, 2015, the Fund's Class A shares returned 3.60% excluding sales charges. Class Z shares of the Fund returned 3.76%. During the same time period, the Barclays California 3-15 Year Blend Municipal Bond Index returned 3.82% and the Barclays 3-15 Year Blend Municipal Bond Index returned 3.76%. The Fund was helped by its allocation to lower-rated investment-grade bonds, but the positive impact was offset by its positions in shorter-term debt.
Market Overview
The U.S. municipal bond market generated positive performance during the 12 months ended April 30, 2015, with intermediate- and longer-term debt generating the best results. While short-term bonds were pressured by the possibility that the U.S. Federal Reserve may begin to increase interest rates before the end of 2015, longer term issues were aided by the environment of slow growth, low inflation and investors' continued search for yield. Lower rated investment-grade bonds — those rated A and BBB — delivered the best returns and soundly outperformed high-rated AAA debt. On a sector basis, hospital and transportation issues outperformed. State and local general obligation bonds, which tend to be higher quality, lagged the returns of revenue bonds during the period.
Beginning in the fourth quarter of 2014, the supply of new municipal issues began to increase. The number of current and advanced refundings jumped considerably, and that trend continued into 2015 as issuers took advantage of lower rates to refinance older, higher yielding bonds. This is positive for issuers' credit outlook, as it allows them to reduce their interest costs. For bond holders, however, the refundings often cause higher yielding bonds to be called away from their portfolios, with the proceeds needing to be reinvested in lower yielding securities. Supply expectations for 2015 had risen to $400 billion by the close of the period, with the largest increase in refunding volume. On the demand side, continued flows into municipal bond funds provided firm support for the market throughout the past year.
Improving Fundamentals for California
California municipal debt performed well during the 12-month period, as a continued economic improvement led to rising government revenues at both the state and local levels. The strength of the technology industry led to a healthy increase in the state's labor force participation rate, indicating rising optimism among workers. Robust population growth and rising property prices also contributed to the improvement in the state's economy. In addition, voters approved a restructuring of California's Rainy Day Fund during November 2014, which should help the state weather the ups and downs of economic cycles. The state's improving financial condition has led to a budget surplus, and the major rating agencies lifting their ratings from the A-/Baa1 range in 2009 to the current range of Aa3/A+. In fact, all three of the major rating agencies upgraded California's debt in the last eight months. Looking ahead, the construction of a high-speed rail line linking Los Angeles and San Francisco is expected to result in significant infrastructure spending and higher growth in communities that are near the line.
Annual Report 2015
4
COLUMBIA AMT-FREE CALIFORNIA INTERMEDIATE MUNI BOND FUND
MANAGER DISCUSSION OF FUND PERFORMANCE (continued)
Contributors and Detractors
At a time in which the lower rated and longer maturity segments of the municipal market outperformed, the Fund's exposure to lower rated investment-grade bonds (those rated A and BBB) and holdings in bonds maturing eight years and beyond made positive contributions to performance. The top-performing sectors in the Fund were hospitals and special tax-related issues. Within this special-tax sector, positions in tax-allocation bonds benefitted from rising assessed property values in California.
The Fund's positions in bonds maturing in less than two years detracted from performance during the period, as these positions contributed virtually nothing to total return given the extremely low yields on short-term bonds. In addition, the timing of certain purchases we made in early 2015 hurt performance since they coincided with a short-term low in yields. (Prices and yields move in opposite directions).
Fund Positioning
We maintained a duration (interest-rate sensitivity) that was neutral to slightly long vs. the benchmark during the past year. Going forward, we currently intend to take a cautious stance on interest rates by maintaining a roughly neutral duration. We believe our overall quality positioning, along with the purchases we made during the period, continue to emphasize A and BBB rated issues for the additional income they offer. While yield spreads in these credit tiers have tightened considerably (meaning that investors are being paid less for the associated risks), we believe they still offer the most compelling relative value. Given the steep yield curve, we currently see value in bonds maturing in the seven- to 12-year range.
Investment Risks
Fixed-income securities present issuer default risk. The Fund invests substantially in municipal securities and will be affected by tax, legislative, regulatory, demographic or political changes, as well as changes impacting a state's financial, economic or other conditions. A relatively small number of tax-exempt issuers may necessitate the Fund investing more heavily in a single issuer and, therefore, be more exposed to the risk of loss than a fund that invests more broadly. The value of the Fund's portfolio may be more volatile than a more geographically diversified fund. Prepayment and extension risk exists as a loan, bond or other investment may be called, prepaid or redeemed before maturity and that similar yielding investments may not be available for purchase. A rise in interest rates may result in a price decline of fixed-income instruments held by the Fund, negatively impacting its performance and NAV. Falling rates may result in the Fund investing in lower yielding debt instruments, lowering the Fund's income and yield. These risks may be heightened for longer maturity and duration securities. Non-investment-grade (high-yield or junk) securities present greater price volatility and more risk to principal and income than higher rated securities. Market risk may affect a single issuer, sector of the economy, industry or the market as a whole. Federal and state tax rules apply to capital gain distributions and any gains or losses on sales. Income may be subject to state or local taxes. Liquidity risk is associated with the difficulty of selling underlying investments at a desirable time or price. See the Fund's prospectus for information on these and other risks.
Annual Report 2015
5
COLUMBIA AMT-FREE CALIFORNIA INTERMEDIATE MUNI BOND FUND
UNDERSTANDING YOUR FUND'S EXPENSES
(Unaudited)
As an investor, you incur two types of costs. There are transaction costs, which generally include sales charges on purchases and may include redemption fees. There are also ongoing costs, which generally include management fees, distribution and/or service fees, and other fund expenses. The following information is intended to help you understand your ongoing costs (in dollars) of investing in the Fund and to help you compare these costs with the ongoing costs of investing in other mutual funds.
Analyzing Your Fund's Expenses
To illustrate these ongoing costs, we have provided examples and calculated the expenses paid by investors in each share class of the Fund during the period. The actual and hypothetical information in the table is based on an initial investment of $1,000 at the beginning of the period indicated and held for the entire period. Expense information is calculated two ways and each method provides you with different information. The amount listed in the "Actual" column is calculated using the Fund's actual operating expenses and total return for the period. You may use the Actual information, together with the amount invested, to estimate the expenses that you paid over the period. Simply divide your account value by $1,000 (for example, an $8,600 account value divided by $1,000 = 8.6), then multiply the results by the expenses paid during the period under the "Actual" column. The amount listed in the "Hypothetical" column assumes a 5% annual rate of return before expenses (which is not the Fund's actual return) and then applies the Fund's actual expense ratio for the period to the hypothetical return. You should not use the hypothetical account values and expenses to estimate either your actual account balance at the end of the period or the expenses you paid during the period. See "Compare With Other Funds" below for details on how to use the hypothetical data.
Compare With Other Funds
Since all mutual funds are required to include the same hypothetical calculations about expenses in shareholder reports, you can use this information to compare the ongoing cost of investing in the Fund with other funds. To do so, compare the hypothetical example with the 5% hypothetical examples that appear in the shareholder reports of other funds. As you compare hypothetical examples of other funds, it is important to note that hypothetical examples are meant to highlight the ongoing costs of investing in a fund only and do not reflect any transaction costs, such as sales charges, or redemption or exchange fees. Therefore, the hypothetical calculations are useful in comparing ongoing costs only, and will not help you determine the relative total costs of owning different funds. If transaction costs were included in these calculations, your costs would be higher.
November 1, 2014 – April 30, 2015
| | | Account Value at the Beginning
of the Period ($) | | Account Value at the End of the
Period ($) | | Expenses Paid During the
Period ($) | | Fund's Annualized
Expense Ratio (%) | |
| | | Actual | | Hypothetical | | Actual | | Hypothetical | | Actual | | Hypothetical | | Actual | |
Class A | | | 1,000.00 | | | | 1,000.00 | | | | 1,005.80 | | | | 1,021.12 | | | | 3.68 | | | | 3.71 | | | | 0.74 | | |
Class B | | | 1,000.00 | | | | 1,000.00 | | | | 1,002.00 | | | | 1,017.41 | | | | 7.40 | | | | 7.45 | | | | 1.49 | | |
Class C | | | 1,000.00 | | | | 1,000.00 | | | | 1,001.10 | | | | 1,017.41 | | | | 7.39 | | | | 7.45 | | | | 1.49 | | |
Class R4 | | | 1,000.00 | | | | 1,000.00 | | | | 1,006.10 | | | | 1,022.36 | | | | 2.44 | | | | 2.46 | | | | 0.49 | | |
Class R5 | | | 1,000.00 | | | | 1,000.00 | | | | 1,006.50 | | | | 1,022.81 | | | | 1.99 | | | | 2.01 | | | | 0.40 | | |
Class Z | | | 1,000.00 | | | | 1,000.00 | | | | 1,006.10 | | | | 1,022.36 | | | | 2.44 | | | | 2.46 | | | | 0.49 | | |
Expenses paid during the period are equal to the annualized expense ratio for each class as indicated above, multiplied by the average account value over the period and then multiplied by the number of days in the Fund's most recent fiscal half year and divided by 365.
Expenses do not include fees and expenses incurred indirectly by the Fund from its investment in underlying funds, including affiliated and non-affiliated pooled investment vehicles, such as mutual funds and exchange-traded funds.
Had Columbia Management Investment Advisers, LLC and/or certain of its affiliates not waived/reimbursed certain fees and expenses, account value at the end of the period would have been reduced.
Annual Report 2015
6
COLUMBIA AMT-FREE CALIFORNIA INTERMEDIATE MUNI BOND FUND
PORTFOLIO OF INVESTMENTS
April 30, 2015
(Percentages represent value of investments compared to net assets)
Municipal Bonds 93.3%
Issue
Description | | Coupon
Rate | | Principal
Amount ($) | |
Value ($) | |
AIRPORT 4.5% | |
City of Los Angeles Department of Airports
Subordinated Refunding Revenue Bonds
Series 2015C | |
05/15/29 | | | 5.000 | % | | | 2,410,000 | | | | 2,832,063 | | |
City of San Jose Airport
Refunding Revenue Bonds
Series 2014B
03/01/27 | | | 5.000 | % | | | 2,000,000 | | | | 2,331,800 | | |
Series 2014C | |
03/01/30 | | | 5.000 | % | | | 2,500,000 | | | | 2,850,075 | | |
Revenue Bonds
Series 2007B (AMBAC)
03/01/22 | | | 5.000 | % | | | 1,000,000 | | | | 1,052,010 | | |
County of Orange Airport
Revenue Bonds
Series 2009A
07/01/25 | | | 5.250 | % | | | 1,500,000 | | | | 1,718,310 | | |
County of Sacramento Airport System
Revenue Bonds
Senior Series 2008A (AGM)
07/01/23 | | | 5.000 | % | | | 1,000,000 | | | | 1,115,370 | | |
San Diego County Regional Airport Authority
Revenue Bonds
Subordinated Series 2010A
07/01/24 | | | 5.000 | % | | | 1,000,000 | | | | 1,155,400 | | |
San Francisco City & County Airports Commission-San Francisco
International Airport
Refunding Revenue Bonds
2nd Series 2009C (AGM)
05/01/18 | | | 5.000 | % | | | 1,825,000 | | | | 2,049,676 | | |
Revenue Bonds
Series 2011G
05/01/26 | | | 5.250 | % | | | 2,000,000 | | | | 2,380,540 | | |
Total | | | | | | | 17,485,244 | | |
HIGHER EDUCATION 4.1% | |
California Educational Facilities Authority
Revenue Bonds
California Lutheran University
Series 2008
10/01/21 | | | 5.250 | % | | | 1,500,000 | | | | 1,654,305 | | |
Pitzer College
Series 2009
04/01/19 | | | 5.000 | % | | | 1,610,000 | | | | 1,828,976 | | |
University of Southern California
Series 2009C
10/01/24 | | | 5.250 | % | | | 3,000,000 | | | | 3,831,000 | | |
California Municipal Finance Authority
Refunding Revenue Bonds
Azusa Pacific University
Series 2015B
04/01/25 | | | 5.000 | % | | | 395,000 | | | | 450,683 | | |
04/01/26 | | | 5.000 | % | | | 1,000,000 | | | | 1,125,660 | | |
Municipal Bonds (continued)
Issue
Description | | Coupon
Rate | | Principal
Amount ($) | |
Value ($) | |
Revenue Bonds
Biola University
Series 2013
10/01/24 | | | 5.000 | % | | | 505,000 | | | | 578,326 | | |
10/01/28 | | | 5.000 | % | | | 840,000 | | | | 930,367 | | |
California State Public Works Board
Refunding Revenue Bonds
California State University
Series 2006A (NPFGC)
10/01/16 | | | 5.000 | % | | | 1,000,000 | | | | 1,064,810 | | |
California State University
Revenue Bonds
Systemwide
Series 2009A
11/01/22 | | | 5.250 | % | | | 2,500,000 | | | | 2,900,375 | | |
California Statewide Communities Development Authority
Revenue Bonds
California Baptist University
Series 2014A
11/01/23 | | | 5.125 | % | | | 715,000 | | | | 781,924 | | |
Lancer Plaza Project
Series 2013
11/01/23 | | | 5.125 | % | | | 940,000 | | | | 1,017,353 | | |
Total | | | | | | | 16,163,779 | | |
HOSPITAL 8.6% | |
ABAG Finance Authority for Nonprofit Corps.
Revenue Bonds
Sharp Healthcare
Series 2011A
08/01/24 | | | 5.250 | % | | | 2,750,000 | | | | 3,202,155 | | |
California Health Facilities Financing Authority
Refunding Revenue Bonds
Marshall Medical Center
Series 2015
11/01/23 | | | 5.000 | % | | | 325,000 | | | | 385,109 | | |
Sutter Health Obligation Group
Series 2011D
08/15/26 | | | 5.000 | % | | | 2,250,000 | | | | 2,578,342 | | |
Revenue Bonds
Catholic Healthcare West
Series 2009A
07/01/29 | | | 6.000 | % | | | 1,250,000 | | | | 1,461,038 | | |
Series 2009E
07/01/25 | | | 5.625 | % | | | 1,500,000 | | | | 1,705,155 | | |
Children's Hospital of Orange County
Series 2009
11/01/21 | | | 6.000 | % | | | 2,000,000 | | | | 2,387,700 | | |
City of Hope Obligation Group
Series 2012A
11/15/21 | | | 5.000 | % | | | 600,000 | | | | 715,134 | | |
Lucile Salter Packard Children's Hospital
Series 2014
08/15/28 | | | 5.000 | % | | | 300,000 | | | | 353,118 | | |
The accompanying Notes to Financial Statements are an integral part of this statement.
Annual Report 2015
7
COLUMBIA AMT-FREE CALIFORNIA INTERMEDIATE MUNI BOND FUND
PORTFOLIO OF INVESTMENTS (continued)
April 30, 2015
Municipal Bonds (continued)
Issue
Description | | Coupon
Rate | | Principal
Amount ($) | |
Value ($) | |
Providence Health & Services
Series 2014A
10/01/30 | | | 5.000 | % | | | 1,500,000 | | | | 1,733,880 | | |
California Health Facilities Financing Authority(a)
Refunding Revenue Bonds
El Camino Hospital
Series 2015A
02/01/27 | | | 5.000 | % | | | 1,500,000 | | | | 1,755,420 | | |
California Statewide Communities Development Authority
Refunding Revenue Bonds
Cottage Health System Obligation
Series 2015
11/01/30 | | | 5.000 | % | | | 1,000,000 | | | | 1,148,260 | | |
11/01/31 | | | 5.000 | % | | | 805,000 | | | | 918,674 | | |
11/01/33 | | | 5.000 | % | | | 750,000 | | | | 850,005 | | |
Huntington Memorial Hospital
Series 2014B
07/01/33 | | | 5.000 | % | | | 2,300,000 | | | | 2,576,161 | | |
Revenue Bonds
Health Facility Adventist Health System West
Series 2005A
03/01/17 | | | 5.000 | % | | | 1,000,000 | | | | 1,003,950 | | |
Henry Mayo Newhall Memorial
Series 2014A (AGM)
10/01/27 | | | 5.000 | % | | | 1,000,000 | | | | 1,127,580 | | |
John Muir Health
Series 2006A
08/15/17 | | | 5.000 | % | | | 3,000,000 | | | | 3,175,410 | | |
Kaiser Permanente
Series 2009A
04/01/19 | | | 5.000 | % | | | 2,000,000 | | | | 2,289,300 | | |
Loma Linda University Medical Center
Series 2014
12/01/34 | | | 5.250 | % | | | 3,000,000 | | | | 3,311,130 | | |
Sutter Health
Series 2011A
08/15/26 | | | 5.500 | % | | | 1,000,000 | | | | 1,167,220 | | |
Total | | | | | | | 33,844,741 | | |
INDEPENDENT POWER 1.6% | |
Sacramento Municipal Utility District
Revenue Bonds
Cosumnes Project
Series 2006 (NPFGC)
07/01/15 | | | 5.000 | % | | | 1,000,000 | | | | 1,008,260 | | |
07/01/29 | | | 5.125 | % | | | 2,000,000 | | | | 2,091,220 | | |
Sacramento Power Authority
Refunding Revenue Bonds
Series 2005 (AMBAC)
07/01/15 | | | 5.250 | % | | | 3,000,000 | | | | 3,024,600 | | |
Total | | | | | | | 6,124,080 | | |
Municipal Bonds (continued)
Issue
Description | | Coupon
Rate | | Principal
Amount ($) | |
Value ($) | |
JOINT POWER AUTHORITY 3.7% | |
M-S-R Public Power Agency
Revenue Bonds
Subordinated Lien
Series 2008L (AGM)
07/01/21 | | | 5.000 | % | | | 2,500,000 | | | | 2,767,775 | | |
Northern California Power Agency
Refunding Revenue Bonds
Hydroelectric Project No. 1
Series 2008C (AGM)
07/01/22 | | | 5.000 | % | | | 3,000,000 | | | | 3,355,050 | | |
Southern California Public Power Authority
Refunding Revenue Bonds
Series 2008A
07/01/22 | | | 5.000 | % | | | 2,000,000 | | | | 2,256,400 | | |
Series 2015C
07/01/26 | | | 5.000 | % | | | 5,000,000 | | | | 6,079,700 | | |
Total | | | | | | | 14,458,925 | | |
LOCAL APPROPRIATION 6.4% | |
City & County of San Francisco
Certificate of Participation
Multiple Capital Improvement Projects
Series 2009B
04/01/24 | | | 5.000 | % | | | 1,495,000 | | | | 1,687,810 | | |
City of Vista
Certificate of Participation
Community Projects
Series 2007 (NPFGC)
05/01/21 | | | 4.750 | % | | | 750,000 | | | | 793,590 | | |
County of Monterey
Certificate of Participation
Refinancing Project
Series 2009 (AGM)
08/01/17 | | | 5.000 | % | | | 1,000,000 | | | | 1,093,200 | | |
Los Angeles Community Redevelopment Agency
Revenue Bonds
VT Manchester Social Services Project
Series 2005 (AMBAC)
09/01/15 | | | 5.000 | % | | | 1,095,000 | | | | 1,112,892 | | |
Los Angeles County Public Works Financing Authority
Revenue Bonds
Series 2015A
12/01/31 | | | 5.000 | % | | | 2,000,000 | | | | 2,289,800 | | |
12/01/32 | | | 5.000 | % | | | 2,000,000 | | | | 2,280,940 | | |
Oakland Joint Powers Financing Authority
Refunding Revenue Bonds
Oakland Administration Buildings
Series 2008B (AGM)
08/01/22 | | | 5.000 | % | | | 2,000,000 | | | | 2,227,220 | | |
The accompanying Notes to Financial Statements are an integral part of this statement.
Annual Report 2015
8
COLUMBIA AMT-FREE CALIFORNIA INTERMEDIATE MUNI BOND FUND
PORTFOLIO OF INVESTMENTS (continued)
April 30, 2015
Municipal Bonds (continued)
Issue
Description | | Coupon
Rate | | Principal
Amount ($) | |
Value ($) | |
Pasadena Public Financing Authority
Revenue Bonds
Rose Bowl Renovation
Series 2010A
03/01/26 | | | 5.000 | % | | | 2,500,000 | | | | 2,820,050 | | |
Pico Rivera Public Financing Authority
Revenue Bonds
Series 2009
09/01/26 | | | 5.250 | % | | | 1,085,000 | | | | 1,233,276 | | |
Richmond Joint Powers Financing Authority
Refunding Revenue Bonds
Lease-Civic Center Project
Series 2009 (AGM)
08/01/17 | | | 5.000 | % | | | 1,570,000 | | | | 1,715,288 | | |
Riverside Public Financing Authority
Refunding Revenue Bonds
Series 2012-A
11/01/27 | | | 5.000 | % | | | 2,145,000 | | | | 2,390,367 | | |
11/01/28 | | | 5.000 | % | | | 1,155,000 | | | | 1,277,395 | | |
San Mateo Joint Powers Financing Authority
Refunding Revenue Bonds
Youth Services Campus
Series 2008A
07/15/20 | | | 5.000 | % | | | 435,000 | | | | 483,655 | | |
07/15/28 | | | 5.250 | % | | | 2,275,000 | | | | 2,539,036 | | |
Santa Clara County Financing Authority
Refunding Revenue Bonds
Multiple Facilities Projects
Series 2010N
05/15/17 | | | 5.000 | % | | | 1,000,000 | | | | 1,089,010 | | |
Total | | | | | | | 25,033,529 | | |
LOCAL GENERAL OBLIGATION 8.5% | |
City of Los Angeles
Unlimited General Obligation Bonds
Series 2011A
09/01/25 | | | 5.000 | % | | | 3,000,000 | | | | 3,603,510 | | |
Compton Community College District
Unlimited General Obligation Refunding Bonds
Series 2012
07/01/22 | | | 5.000 | % | | | 2,095,000 | | | | 2,447,274 | | |
Compton Unified School District(b)
Unlimited General Obligation Bonds
Election of 2002 — Capital Appreciation
Series 2006C (AMBAC)
06/01/23 | | | 0.000 | % | | | 2,025,000 | | | | 1,493,498 | | |
06/01/24 | | | 0.000 | % | | | 1,925,000 | | | | 1,349,117 | | |
Culver City School Facilities Financing Authority
Revenue Bonds
Unified School District
Series 2005 (AGM)
08/01/23 | | | 5.500 | % | | | 1,490,000 | | | | 1,865,793 | | |
Municipal Bonds (continued)
Issue
Description | | Coupon
Rate | | Principal
Amount ($) | |
Value ($) | |
East Side Union High School District
Unlimited General Obligation Refunding Bonds
2012 Crossover
Series 2006 (AGM)
09/01/20 | | | 5.250 | % | | | 1,280,000 | | | | 1,525,453 | | |
Long Beach Community College District
Unlimited General Obligation Bonds
2008 Election
Series 2012B
08/01/23 | | | 5.000 | % | | | 700,000 | | | | 843,290 | | |
Long Beach Unified School District
Unlimited General Obligation Bonds
Series 2015D-1(b)
08/01/31 | | | 0.000 | % | | | 1,375,000 | | | | 718,121 | | |
Palomar Community College District
Unlimited General Obligation Bonds
Capital Appreciation-Election of 2006
Series 2010B(b)
08/01/22 | | | 0.000 | % | | | 2,140,000 | | | | 1,810,782 | | |
Rancho Santiago Community College District
Unlimited General Obligation Refunding Bonds
Series 2005 (AGM)
09/01/19 | | | 5.250 | % | | | 1,000,000 | | | | 1,170,740 | | |
Rancho Santiago Community College District(b)
Unlimited General Obligation Bonds
Capital Appreciation-Election of 2002
Series 2006C (AGM)
09/01/31 | | | 0.000 | % | | | 3,785,000 | | | | 2,007,451 | | |
Rescue Union School District
Unlimited General Obligation Bonds
Capital Appreciation-Election of 1998
Series 2005 (NPFGC)(b)
09/01/26 | | | 0.000 | % | | | 1,100,000 | | | | 740,355 | | |
San Mateo County Community College District
Unlimited General Obligation Bonds
Capital Appreciation-Election of 2005
Series 2006A (NPFGC)(b)
09/01/15 | | | 0.000 | % | | | 1,000,000 | | | | 998,900 | | |
San Mateo Foster City School District
Revenue Bonds
Series 2005 (AGM)
08/15/19 | | | 5.500 | % | | | 2,000,000 | | | | 2,354,100 | | |
Saugus Union School District
Unlimited General Obligation Refunding Bonds
Series 2006 (NPFGC)
08/01/21 | | | 5.250 | % | | | 2,375,000 | | | | 2,871,518 | | |
Simi Valley School Financing Authority
Refunding Revenue Bonds
Simi Valley Unified School District
Series 2007
08/01/18 | | | 5.000 | % | | | 1,045,000 | | | | 1,166,565 | | |
The accompanying Notes to Financial Statements are an integral part of this statement.
Annual Report 2015
9
COLUMBIA AMT-FREE CALIFORNIA INTERMEDIATE MUNI BOND FUND
PORTFOLIO OF INVESTMENTS (continued)
April 30, 2015
Municipal Bonds (continued)
Issue
Description | | Coupon
Rate | | Principal
Amount ($) | |
Value ($) | |
West Contra Costa Unified School District
Unlimited General Obligation Refunding Bonds
Series 2011 (AGM)
08/01/23 | | | 5.250 | % | | | 3,000,000 | | | | 3,606,300 | | |
Series 2012
08/01/27 | | | 5.000 | % | | | 2,365,000 | | | | 2,699,411 | | |
Total | | | | | | | 33,272,178 | | |
MULTI-FAMILY 1.2% | |
California Municipal Finance Authority
Revenue Bonds
Caritas Affordable Housing
Senior Series 2014
08/15/30 | | | 5.000 | % | | | 1,000,000 | | | | 1,099,730 | | |
California Statewide Communities Development Authority
Refunding Revenue Bonds
University of California Irvine East Campus Apartments
Series 2012 | |
05/15/19 | | | 5.000 | % | | | 1,000,000 | | | | 1,117,290 | | |
05/15/20 | | | 5.000 | % | | | 750,000 | | | | 850,725 | | |
Revenue Bonds
University of California Irvine East Campus Apartments
Series 2008
05/15/17 | | | 5.000 | % | | | 1,500,000 | | | | 1,615,920 | | |
Total | | | | | | | 4,683,665 | | |
MUNICIPAL POWER 6.8% | |
City of Riverside Electric
Revenue Bonds
Series 2008D (AGM)
10/01/23 | | | 5.000 | % | | | 1,000,000 | | | | 1,122,220 | | |
City of Santa Clara Electric
Refunding Revenue Bonds
Series 2011A
07/01/29 | | | 5.375 | % | | | 1,000,000 | | | | 1,134,020 | | |
City of Vernon Electric System
Revenue Bonds
Series 2009A
08/01/21 | | | 5.125 | % | | | 3,900,000 | | | | 4,371,120 | | |
Imperial Irrigation District
Refunding Revenue Bonds
Systems
Series 2008
11/01/21 | | | 5.250 | % | | | 2,500,000 | | | | 2,840,650 | | |
Series 2011D
11/01/22 | | | 5.000 | % | | | 2,860,000 | | | | 3,348,688 | | |
11/01/23 | | | 5.000 | % | | | 1,040,000 | | | | 1,211,195 | | |
Los Angeles Department of Water & Power
Revenue Bonds
Power System
Series 2009B
07/01/23 | | | 5.250 | % | | | 2,000,000 | | | | 2,341,880 | | |
Municipal Bonds (continued)
Issue
Description | | Coupon
Rate | | Principal
Amount ($) | |
Value ($) | |
Series 2014D
07/01/33 | | | 5.000 | % | | | 1,700,000 | | | | 1,963,347 | | |
Subordinated Series 2007A-1 (AMBAC)
07/01/19 | | | 5.000 | % | | | 1,000,000 | | | | 1,096,590 | | |
Sacramento Municipal Utility District
Revenue Bonds
Series 2008U (AGM)
08/15/21 | | | 5.000 | % | | | 1,500,000 | | | | 1,696,800 | | |
State of California Department of Water Resources
Revenue Bonds
Subordinated Series 2005G-11
05/01/18 | | | 5.000 | % | | | 2,000,000 | | | | 2,238,840 | | |
Tuolumne Wind Project Authority
Revenue Bonds
Tuolumne Co. Project
Series 2009
01/01/22 | | | 5.000 | % | | | 1,000,000 | | | | 1,124,490 | | |
Turlock Irrigation District
Refunding Revenue Bonds
First Priority
Subordinated Series 2014
01/01/30 | | | 5.000 | % | | | 850,000 | | | | 978,741 | | |
01/01/31 | | | 5.000 | % | | | 1,000,000 | | | | 1,143,730 | | |
Total | | | | | | | 26,612,311 | | |
OTHER BOND ISSUE 0.6% | |
Long Beach Bond Finance Authority
Refunding Revenue Bonds
Aquarium of the Pacific
Series 2012
11/01/27 | | | 5.000 | % | | | 2,210,000 | | | | 2,515,267 | | |
PORTS 1.5% | |
Port of Los Angeles
Revenue Bonds
Series 2009A
08/01/23 | | | 5.250 | % | | | 2,000,000 | | | | 2,351,440 | | |
Port of Oakland
Refunding Revenue Bonds
Intermediate Lien
Series 2007B (NPFGC)
11/01/29 | | | 5.000 | % | | | 1,165,000 | | | | 1,267,637 | | |
San Diego Unified Port District
Refunding Revenue Bonds
Series 2013A
09/01/27 | | | 5.000 | % | | | 1,000,000 | | | | 1,155,540 | | |
09/01/28 | | | 5.000 | % | | | 1,100,000 | | | | 1,254,462 | | |
Total | | | | | | | 6,029,079 | | |
The accompanying Notes to Financial Statements are an integral part of this statement.
Annual Report 2015
10
COLUMBIA AMT-FREE CALIFORNIA INTERMEDIATE MUNI BOND FUND
PORTFOLIO OF INVESTMENTS (continued)
April 30, 2015
Municipal Bonds (continued)
Issue
Description | | Coupon
Rate | | Principal
Amount ($) | |
Value ($) | |
PREP SCHOOL 0.6% | |
California School Finance Authority
Revenue Bonds
KIPP Los Angeles Projects
Series 2014A
07/01/34 | | | 5.000 | % | | | 600,000 | | | | 635,244 | | |
California School Finance Authority(c)
Revenue Bonds
Alliance College-Ready Public Schools
Series 2015
07/01/30 | | | 5.000 | % | | | 1,700,000 | | | | 1,842,290 | | |
Total | | | | | | | 2,477,534 | | |
PREPAID GAS 0.6% | |
M-S-R Energy Authority
Revenue Bonds
Series 2009B
11/01/29 | | | 6.125 | % | | | 2,000,000 | | | | 2,466,760 | | |
REFUNDED / ESCROWED 4.3% | |
Bay Area Toll Authority
Prerefunded 04/01/16 Revenue Bonds
San Francisco Bay Area
Series 2006F (FHLMC/FNMA)
04/01/22 | | | 5.000 | % | | | 1,100,000 | | | | 1,147,696 | | |
California Health Facilities Financing Authority
Revenue Bonds
Insured Episcopal Home
Series 2010B Escrowed to Maturity
02/01/19 | | | 5.100 | % | | | 500,000 | | | | 545,695 | | |
California State Public Works Board
Revenue Bonds
Various University of California Projects
Series 2005D Escrowed to Maturity
05/01/15 | | | 5.000 | % | | | 1,000,000 | | | | 1,000,142 | | |
City & County of San Francisco
Prerefunded 06/15/20 Unlimited General Obligation Bonds
Earthquake Safety
Series 2010E
06/15/27 | | | 5.000 | % | | | 3,380,000 | | | | 4,003,745 | | |
City of Newport Beach
Prerefunded 12/01/21 Revenue Bonds
Hoag Memorial Hospital Presbyterian
Series 2011
12/01/30 | | | 5.875 | % | | | 1,000,000 | | | | 1,263,460 | | |
Los Alamitos Unified School District
Unlimited General Obligation Bonds
School Facilities Improvement
BAN Series 2011 Escrowed to Maturity(b)
09/01/16 | | | 0.000 | % | | | 2,000,000 | | | | 1,990,840 | | |
Municipal Bonds (continued)
Issue
Description | | Coupon
Rate | | Principal
Amount ($) | |
Value ($) | |
Los Angeles Unified School District
Prerefunded 07/01/16 Unlimited General Obligation Bonds
Election of 2004
Series 2006G (AMBAC)
07/01/20 | | | 5.000 | % | | | 1,000,000 | | | | 1,055,310 | | |
Sacramento County Sanitation Districts Financing Authority
Prerefunded 06/01/16 Revenue Bonds
Sacramento Regional County Sanitation
Series 2006 (NPFGC)
12/01/17 | | | 5.000 | % | | | 1,000,000 | | | | 1,051,540 | | |
Southern California Public Power Authority
Prerefunded 07/01/18 Revenue Bonds
Southern Transmission Project
Series 2008
07/01/27 | | | 6.000 | % | | | 1,000,000 | | | | 1,158,990 | | |
State of California
Prerefunded Unlimited General Obligation Bonds
Series 2009A Escrowed to Maturity
07/01/18 | | | 5.000 | % | | | 2,320,000 | | | | 2,605,662 | | |
University of California
Prerefunded 05/15/19 Revenue Bonds
Series 2009O
05/15/20 | | | 5.000 | % | | | 1,000,000 | | | | 1,156,540 | | |
Total | | | | | | | 16,979,620 | | |
RETIREMENT COMMUNITIES 5.0% | |
ABAG Finance Authority for Nonprofit Corps.
Refunding Revenue Bonds
Episcopal Senior Communities
Series 2011
07/01/24 | | | 5.375 | % | | | 2,795,000 | | | | 3,166,232 | | |
Series 2012
07/01/21 | | | 5.000 | % | | | 1,000,000 | | | | 1,139,040 | | |
Revenue Bonds
Casa de las Campanas, Inc.
Series 2010
09/01/15 | | | 4.000 | % | | | 520,000 | | | | 525,569 | | |
Odd Fellows Home of California
Series 2012-A
04/01/32 | | | 5.000 | % | | | 4,750,000 | | | | 5,340,282 | | |
California Health Facilities Financing Authority
Refunding Revenue Bonds
Northern California Presbyterian Homes
Series 2015
07/01/28 | | | 5.000 | % | | | 310,000 | | | | 359,414 | | |
07/01/29 | | | 5.000 | % | | | 300,000 | | | | 344,022 | | |
Revenue Bonds
Insured California Nevada-Methodist
Series 2006
07/01/26 | | | 5.000 | % | | | 1,000,000 | | | | 1,049,130 | | |
The accompanying Notes to Financial Statements are an integral part of this statement.
Annual Report 2015
11
COLUMBIA AMT-FREE CALIFORNIA INTERMEDIATE MUNI BOND FUND
PORTFOLIO OF INVESTMENTS (continued)
April 30, 2015
Municipal Bonds (continued)
Issue
Description | | Coupon
Rate | | Principal
Amount ($) | |
Value ($) | |
California Statewide Communities Development Authority
Refunding Revenue Bonds
899 Charleston Project
Series 2014A
11/01/19 | | | 5.000 | % | | | 875,000 | | | | 947,809 | | |
Episcopal Communities and Services
Series 2012
05/15/27 | | | 5.000 | % | | | 1,520,000 | | | | 1,703,251 | | |
Revenue Bonds
Insured Redwoods Project
Series 2013
11/15/28 | | | 5.000 | % | | | 1,000,000 | | | | 1,136,590 | | |
City of La Verne
Refunding Certificate of Participation
Brethren Hillcrest Homes
Series 2014
05/15/24 | | | 5.000 | % | | | 310,000 | | | | 348,666 | | |
05/15/25 | | | 5.000 | % | | | 530,000 | | | | 592,323 | | |
05/15/26 | | | 5.000 | % | | | 700,000 | | | | 777,644 | | |
05/15/29 | | | 5.000 | % | | | 1,135,000 | | | | 1,235,221 | | |
Los Angeles County Regional Financing Authority
Revenue Bonds
Montecedro, Inc. Project
Series 2014A
11/15/34 | | | 5.000 | % | | | 1,000,000 | | | | 1,106,340 | | |
Total | | | | | | | 19,771,533 | | |
SALES TAX 0.2% | |
State of California
Unrefunded Unlimited General Obligation Bonds
Series 2009A
07/01/18 | | | 5.000 | % | | | 680,000 | | | | 769,427 | | |
SPECIAL NON PROPERTY TAX 0.9% | |
Virgin Islands Public Finance Authority(d)
Refunding Revenue Bonds
Series 2013B
10/01/24 | | | 5.000 | % | | | 1,740,000 | | | | 2,008,604 | | |
Revenue Bonds
Matching Fund Loan Notes-Senior Lien
Series 2010A
10/01/20 | | | 5.000 | % | | | 1,490,000 | | | | 1,683,908 | | |
Total | | | | | | | 3,692,512 | | |
SPECIAL PROPERTY TAX 13.0% | |
Chino Public Financing Authority
Refunding Special Tax Bonds
Series 2012
09/01/23 | | | 5.000 | % | | | 1,070,000 | | | | 1,223,299 | | |
Concord Redevelopment Agency Successor Agency
Refunding Tax Allocation Bonds
Build America Bonds
Series 2014
03/01/25 | | | 5.000 | % | | | 840,000 | | | | 1,012,091 | | |
Municipal Bonds (continued)
Issue
Description | | Coupon
Rate | | Principal
Amount ($) | |
Value ($) | |
County of El Dorado
Refunding Special Tax Bonds
Community Facilities District No. 92-1
Series 2012
09/01/26 | | | 5.000 | % | | | 630,000 | | | | 714,458 | | |
09/01/27 | | | 5.000 | % | | | 805,000 | | | | 906,140 | | |
Emeryville Redevelopment Agency Successor Agency
Refunding Tax Allocation Bonds
Series 2014A (AGM)
09/01/23 | | | 5.000 | % | | | 2,415,000 | | | | 2,930,771 | | |
09/01/26 | | | 5.000 | % | | | 1,000,000 | | | | 1,183,810 | | |
09/01/27 | | | 5.000 | % | | | 1,000,000 | | | | 1,167,670 | | |
09/01/30 | | | 5.000 | % | | | 815,000 | | | | 931,847 | | |
09/01/31 | | | 5.000 | % | | | 590,000 | | | | 673,568 | | |
Fontana Public Finance Authority
Tax Allocation Bonds
Subordinated Lien-North Fontana Redevelopment
Series 2005A (AMBAC)
10/01/20 | | | 5.000 | % | | | 1,515,000 | | | | 1,543,452 | | |
Glendale Redevelopment Agency Successor Agency
Refunding Tax Allocation Bonds
Central Glendale Redevelopment
Subordinated Series 2013 (AGM)
12/01/21 | | | 5.000 | % | | | 755,000 | | | | 898,329 | | |
Inglewood Redevelopment Agency
Refunding Tax Allocation Bonds
Merged Redevelopment Project
Series 1998A (AMBAC)
05/01/17 | | | 5.250 | % | | | 1,425,000 | | | | 1,493,101 | | |
Irvine Unified School District
Refunding Special Tax Bonds
Series 2015
09/01/30 | | | 5.000 | % | | | 2,065,000 | | | | 2,402,978 | | |
09/01/31 | | | 5.000 | % | | | 2,720,000 | | | | 3,150,141 | | |
Jurupa Public Financing Authority
Refunding Special Tax Bonds
Series 2014A
09/01/29 | | | 5.000 | % | | | 530,000 | | | | 600,045 | | |
09/01/30 | | | 5.000 | % | | | 625,000 | | | | 702,262 | | |
09/01/32 | | | 5.000 | % | | | 625,000 | | | | 695,400 | | |
La Quinta Redevelopment Agency Successor Agency
Refunding Tax Allocation Bonds
Redevelopment Project
Subordinated Series 2013A
09/01/30 | | | 5.000 | % | | | 1,500,000 | | | | 1,656,825 | | |
Long Beach Bond Finance Authority
Tax Allocation Bonds
Industrial Redevelopment Project Areas
Series 2002B (AMBAC)
11/01/19 | | | 5.500 | % | | | 1,070,000 | | | | 1,244,667 | | |
The accompanying Notes to Financial Statements are an integral part of this statement.
Annual Report 2015
12
COLUMBIA AMT-FREE CALIFORNIA INTERMEDIATE MUNI BOND FUND
PORTFOLIO OF INVESTMENTS (continued)
April 30, 2015
Municipal Bonds (continued)
Issue
Description | | Coupon
Rate | | Principal
Amount ($) | |
Value ($) | |
Los Angeles Community Facilities District
Refunding Special Tax Bonds
Playa Vista-Phase 1
Series 2014
09/01/30 | | | 5.000 | % | | | 1,000,000 | | | | 1,123,620 | | |
Los Angeles County Redevelopment Authority
Refunding Tax Allocation Bonds
Los Angeles Bunker Hill Project
Series 2014C (AGM)
12/01/28 | | | 5.000 | % | | | 3,000,000 | | | | 3,519,510 | | |
Oakland Redevelopment Successor Agency
Refunding Tax Allocation Bonds
Subordinated Series 2013
09/01/22 | | | 5.000 | % | | | 2,000,000 | | | | 2,380,880 | | |
Poway Unified School District
Special Tax Bonds
Community Facilities District No. 6-4S Ranch
Series 2012
09/01/28 | | | 5.000 | % | | | 1,785,000 | | | | 1,988,990 | | |
09/01/29 | | | 5.000 | % | | | 1,205,000 | | | | 1,339,116 | | |
Rancho Cucamonga Redevelopment Agency Successor Agency
Tax Allocation Bonds
Rancho Redevelopment Project Area
Series 2014
09/01/30 | | | 5.000 | % | | | 700,000 | | | | 807,072 | | |
Series 2014 (AGM) | |
09/01/27 | | | 5.000 | % | | | 2,200,000 | | | | 2,586,562 | | |
San Francisco City & County Redevelopment Agency
Tax Allocation Bonds
Mission Bay South Redevelopment Project
Series 2014A
08/01/29 | | | 5.000 | % | | | 225,000 | | | | 252,792 | | |
08/01/30 | | | 5.000 | % | | | 175,000 | | | | 196,469 | | |
San Francisco Redevelopment Projects
Series 2009B
08/01/18 | | | 5.000 | % | | | 1,255,000 | | | | 1,396,225 | | |
Semitropic Improvement District
Refunding Revenue Bonds
Series 2015A 2nd Lien (AGM)
12/01/23 | | | 5.000 | % | | | 300,000 | | | | 360,189 | | |
12/01/24 | | | 5.000 | % | | | 400,000 | | | | 482,800 | | |
Sulphur Springs Union School District
Refunding Special Tax Bonds
Community Facilities District No. 2002-1-SE
Series 2012
09/01/28 | | | 5.000 | % | | | 1,050,000 | | | | 1,169,994 | | |
09/01/29 | | | 5.000 | % | | | 1,180,000 | | | | 1,311,334 | | |
Temecula Valley Unified School District Financing Authority
Special Tax Bonds
Series 2015
09/01/32 | | | 5.000 | % | | | 1,465,000 | | | | 1,655,582 | | |
09/01/33 | | | 5.000 | % | | | 1,000,000 | | | | 1,129,200 | | |
09/01/34 | | | 5.000 | % | | | 1,000,000 | | | | 1,126,530 | | |
Municipal Bonds (continued)
Issue
Description | | Coupon
Rate | | Principal
Amount ($) | |
Value ($) | |
Tustin Community Redevelopment Agency
Tax Allocation Bonds
MCAS-Tustin Redevelopment Project Area
Series 2010
09/01/25 | | | 5.000 | % | | | 1,250,000 | | | | 1,416,800 | | |
Vista Redevelopment Agency Successor Agency
Tax Allocation Refunding Bonds
Series 2015B1 (AGM)
09/01/24 | | | 5.000 | % | | | 580,000 | | | | 702,194 | | |
09/01/26 | | | 5.000 | % | | | 700,000 | | | | 837,123 | | |
Total | | | | | | | 50,913,836 | | |
STATE APPROPRIATED 6.0% | |
California State Public Works Board
Refunding Revenue Bonds
Various Capital Projects
Series 2012G
11/01/28 | | | 5.000 | % | | | 1,500,000 | | | | 1,737,660 | | |
Revenue Bonds
Department of Corrections & Rehabilitation
Series 2014C
10/01/22 | | | 5.000 | % | | | 1,925,000 | | | | 2,315,814 | | |
Department of Corrections and Rehabilitation
Series 2015A
06/01/28 | | | 5.000 | % | | | 1,175,000 | | | | 1,388,192 | | |
Department of General Services
Series 2006A
04/01/28 | | | 5.000 | % | | | 1,000,000 | | | | 1,028,660 | | |
Department of General Services-Butterfield
Series 2005A
06/01/15 | | | 5.000 | % | | | 1,200,000 | | | | 1,205,105 | | |
Various Capital Projects
Series 2011A
10/01/20 | | | 5.000 | % | | | 2,000,000 | | | | 2,343,400 | | |
Series 2013I
11/01/28 | | | 5.250 | % | | | 3,000,000 | | | | 3,583,560 | | |
Series 2014E
09/01/30 | | | 5.000 | % | | | 1,500,000 | | | | 1,734,705 | | |
Subordinated Series 2009I-1
11/01/17 | | | 5.000 | % | | | 2,000,000 | | | | 2,206,280 | | |
Subordinated Series 2010A-1
03/01/22 | | | 5.250 | % | | | 2,000,000 | | | | 2,345,860 | | |
Various Correctional Facilities
Series 2014A
09/01/31 | | | 5.000 | % | | | 3,000,000 | | | | 3,448,380 | | |
Total | | | | | | | 23,337,616 | | |
STATE GENERAL OBLIGATION 6.2% | |
State of California
Unlimited General Obligation Bonds
Series 2010
11/01/24 | | | 5.000 | % | | | 5,000,000 | | | | 5,921,000 | | |
Various Purpose
Series 2007
12/01/26 | | | 5.000 | % | | | 2,000,000 | | | | 2,138,040 | | |
The accompanying Notes to Financial Statements are an integral part of this statement.
Annual Report 2015
13
COLUMBIA AMT-FREE CALIFORNIA INTERMEDIATE MUNI BOND FUND
PORTFOLIO OF INVESTMENTS (continued)
April 30, 2015
Municipal Bonds (continued)
Issue
Description | | Coupon
Rate | | Principal
Amount ($) | |
Value ($) | |
Series 2009
04/01/26 | | | 5.625 | % | | | 2,000,000 | | | | 2,322,820 | | |
10/01/29 | | | 5.250 | % | | | 1,500,000 | | | | 1,743,135 | | |
Series 2011
10/01/19 | | | 5.000 | % | | | 4,000,000 | | | | 4,632,640 | | |
Unlimited General Obligation Refunding Bonds
Series 2007
08/01/18 | | | 5.000 | % | | | 3,750,000 | | | | 4,043,587 | | |
Series 2014
08/01/32 | | | 5.000 | % | | | 3,000,000 | | | | 3,460,530 | | |
Total | | | | | | | 24,261,752 | | |
TOBACCO 1.2% | |
Golden State Tobacco Securitization Corp.
Asset-Backed Refunding Revenue Bonds
Series 2015A
06/01/33 | | | 5.000 | % | | | 4,000,000 | | | | 4,527,880 | | |
TURNPIKE / BRIDGE / TOLL ROAD 1.5% | |
Foothill-Eastern Transportation Corridor Agency(b)
Refunding Revenue Bonds
Series 2015
01/15/33 | | | 0.000 | % | | | 5,000,000 | | | | 2,226,150 | | |
Foothill-Eastern Transportation Corridor Agency(e)
Refunding Revenue Bonds
Subordinated Series 2014B-3
01/15/53 | | | 5.500 | % | | | 3,000,000 | | | | 3,472,260 | | |
Total | | | | | | | 5,698,410 | | |
WATER & SEWER 6.3% | |
City of Fresno Sewer System
Revenue Bonds
Series 2008A
09/01/23 | | | 5.000 | % | | | 1,000,000 | | | | 1,125,890 | | |
City of Los Angeles Wastewater System
Refunding Revenue Bonds
Series 2009A
06/01/25 | | | 5.750 | % | | | 2,000,000 | | | | 2,337,320 | | |
Clovis Public Financing Authority
Revenue Bonds
Series 2007 (AMBAC)
08/01/21 | | | 5.000 | % | | | 1,000,000 | | | | 1,084,240 | | |
Kern County Water Agency Improvement District No. 4
Certificate of Participation
Series 2008A
05/01/22 | | | 5.000 | % | | | 2,020,000 | | | | 2,243,473 | | |
Los Angeles County Sanitation Districts Financing Authority(a)
Subordinated Refunding Revenue Bonds
Capital Projects — District #14
Series 2015
10/01/24 | | | 5.000 | % | | | 1,050,000 | | | | 1,254,960 | | |
10/01/25 | | | 5.000 | % | | | 1,100,000 | | | | 1,317,239 | | |
Municipal Bonds (continued)
Issue
Description | | Coupon
Rate | | Principal
Amount ($) | |
Value ($) | |
Oxnard Financing Authority
Revenue Bonds
Project
Series 2006
06/01/31 | | | 5.000 | % | | | 4,315,000 | | | | 4,403,630 | | |
Sacramento County Sanitation Districts Financing Authority
Revenue Bonds
County Sanitation District 1
Series 2005 (NPFGC)
08/01/22 | | | 5.000 | % | | | 1,500,000 | | | | 1,518,015 | | |
San Diego Public Facilities Financing Authority Sewer
Refunding Revenue Bonds
Senior Series 2009B
05/15/25 | | | 5.250 | % | | | 1,500,000 | | | | 1,742,310 | | |
San Diego Public Facilities Financing Authority Water
Refunding Revenue Bonds
Series 2010A
08/01/24 | | | 5.000 | % | | | 2,000,000 | | | | 2,365,400 | | |
Semitropic Improvement District
Refunding Revenue Bonds
Series 2012A
12/01/23 | | | 5.000 | % | | | 2,850,000 | | | | 3,402,472 | | |
Stockton Public Financing Authority
Refunding Revenue Bonds
Build America Bonds
Series 2014
09/01/28 | | | 5.000 | % | | | 1,500,000 | | | | 1,725,060 | | |
Total | | | | | | | 24,520,009 | | |
Total Municipal Bonds
(Cost: $343,072,478) | | | | | | | 365,639,687 | | |
Floating Rate Notes 2.6%
Issue
Description | | Effective
Yield | | Principal
Amount ($) | |
Value ($) | |
California Infrastructure & Economic Development Bank(e)(f)
Refunding Revenue Bonds
Los Angeles Museum
VRDN Series 2008 (Wells Fargo Bank)
09/01/37 | | | 0.110 | % | | | 900,000 | | | | 900,000 | | |
VRDN Series 2008A (Wells Fargo Bank)
09/01/37 | | | 0.110 | % | | | 500,000 | | | | 500,000 | | |
California Pollution Control Financing Authority(e)(f)
Refunding Revenue Bonds
Pacific Gas & Electric Co.
VRDN Series 1996C (JPMorgan Chase Bank)
11/01/26 | | | 0.130 | % | | | 1,100,000 | | | | 1,100,000 | | |
VRDN Series 1996E (JPMorgan Chase Bank)
11/01/26 | | | 0.110 | % | | | 1,400,000 | | | | 1,400,000 | | |
The accompanying Notes to Financial Statements are an integral part of this statement.
Annual Report 2015
14
COLUMBIA AMT-FREE CALIFORNIA INTERMEDIATE MUNI BOND FUND
PORTFOLIO OF INVESTMENTS (continued)
April 30, 2015
Floating Rate Notes (continued)
Issue
Description | | Effective
Yield | | Principal
Amount ($) | |
Value ($) | |
California Statewide Communities Development Authority
Revenue Bonds
John Muir Health
VRDN Series 2008C (Wells Fargo Bank)(e)(f)
08/15/27 | | | 0.120 | % | | | 2,480,000 | | | | 2,480,000 | | |
Calleguas-Las Virgenes Public Financing Authority
Refunding Revenue Bonds
Municipal Water District Project
VRDN Series 2008A (Wells Fargo Bank)(e)(f)
07/01/37 | | | 0.120 | % | | | 3,000,000 | | | | 3,000,000 | | |
State of California
Unlimited General Obligation Bonds
VRDN Series 2003A-1 (JPMorgan Chase Bank)(e)(f)
05/01/33 | | | 0.110 | % | | | 900,000 | | | | 900,000 | | |
Total Floating Rate Notes
(Cost: $10,280,000) | | | | | | | 10,280,000 | | |
Municipal Short Term 2.8%
DISPOSAL 0.8% | |
California Pollution Control Financing Authority
Revenue Bonds
Republic Services, Inc.
VRDN Series 2010B(a)(e)
08/01/24 | | | 0.400 | % | | | 3,000,000 | | | | 3,000,000 | | |
Municipal Short Term (continued)
Issue
Description | | Effective
Yield | | Principal
Amount ($) | |
Value ($) | |
LOCAL APPROPRIATION 1.0% | |
Golden Empire Schools Financing Authority
Refunding Revenue Bonds
Kern High School District Project
VRDN Series 2015(e)
05/01/16 | | | 0.310 | % | | | 4,000,000 | | | | 4,000,280 | | |
WATER & SEWER 1.0% | |
Metropolitan Water District of Southern California
Refunding Revenue Bonds
VRDN Series 2011A-4(e)
07/01/36 | | | 0.260 | % | | | 4,000,000 | | | | 4,000,000 | | |
Total Municipal Short Term
(Cost: $11,000,000) | | | | | | | 11,000,280 | | |
Total Investments
(Cost: $364,352,478) | | | 386,919,967 | | |
Other Assets & Liabilities, Net | | | 5,174,756 | | |
Net Assets | | | 392,094,723 | | |
Notes to Portfolio of Investments
(a) Security, or a portion thereof, has been purchased on a when-issued or delayed delivery basis.
(b) Zero coupon bond.
(c) Security exempt from registration pursuant to Rule 144A under the Securities Act of 1933. This security may be resold in transactions exempt from registration, normally to qualified institutional buyers. At April 30, 2015, the value of these securities amounted to $1,842,290 or 0.47% of net assets.
(d) Municipal obligations include debt obligations issued by or on behalf of territories, possessions, or sovereign nations within the territorial boundaries of the United States. At April 30, 2015, the value of these securities amounted to $3,692,512 or 0.94% of net assets.
(e) Variable rate security.
(f) The Fund is entitled to receive principal and interest from the guarantor after a day or a week's notice or upon maturity. The maturity date disclosed represents the final maturity.
Abbreviation Legend
AGM Assured Guaranty Municipal Corporation
AMBAC Ambac Assurance Corporation
BAN Bond Anticipation Note
FHLMC Federal Home Loan Mortgage Corporation
FNMA Federal National Mortgage Association
NPFGC National Public Finance Guarantee Corporation
VRDN Variable Rate Demand Note
The accompanying Notes to Financial Statements are an integral part of this statement.
Annual Report 2015
15
COLUMBIA AMT-FREE CALIFORNIA INTERMEDIATE MUNI BOND FUND
PORTFOLIO OF INVESTMENTS (continued)
April 30, 2015
Fair Value Measurements
Generally accepted accounting principles (GAAP) require disclosure regarding the inputs and valuation techniques used to measure fair value and any changes in valuation inputs or techniques. In addition, investments shall be disclosed by major category.
The Fund categorizes its fair value measurements according to a three-level hierarchy that maximizes the use of observable inputs and minimizes the use of unobservable inputs by prioritizing that the most observable input be used when available. Observable inputs are those that market participants would use in pricing an investment based on market data obtained from sources independent of the reporting entity. Unobservable inputs are those that reflect the Fund's assumptions about the information market participants would use in pricing an investment. An investment's level within the fair value hierarchy is based on the lowest level of any input that is deemed significant to the asset or liability's fair value measurement. The input levels are not necessarily an indication of the risk or liquidity associated with investments at that level. For example, certain U.S. government securities are generally high quality and liquid, however, they are reflected as Level 2 because the inputs used to determine fair value may not always be quoted prices in an active market.
Fair value inputs are summarized in the three broad levels listed below:
> Level 1 — Valuations based on quoted prices for investments in active markets that the Fund has the ability to access at the measurement date (including NAV for open-end mutual funds). Valuation adjustments are not applied to Level 1 investments.
> Level 2 — Valuations based on other significant observable inputs (including quoted prices for similar securities, interest rates, prepayment speeds, credit risks, etc.).
> Level 3 — Valuations based on significant unobservable inputs (including the Fund's own assumptions and judgment in determining the fair value of investments).
Inputs that are used in determining fair value of an investment may include price information, credit data, volatility statistics, and other factors. These inputs can be either observable or unobservable. The availability of observable inputs can vary between investments, and is affected by various factors such as the type of investment, and the volume and level of activity for that investment or similar investments in the marketplace. The inputs will be considered by the Investment Manager, along with any other relevant factors in the calculation of an investment's fair value. The Fund uses prices and inputs that are current as of the measurement date, which may include periods of market dislocations. During these periods, the availability of prices and inputs may be reduced for many investments. This condition could cause an investment to be reclassified between the various levels within the hierarchy.
Short-term securities are valued using amortized cost, as permitted under Rule 2a-7 of the Investment Company Act of 1940, as amended. Generally, amortized cost approximates the current fair value of these securities, but because the value is not obtained from a quoted price in an active market, such securities are reflected as Level 2.
Investments falling into the Level 3 category are primarily supported by quoted prices from brokers and dealers participating in the market for those investments. However, these may be classified as Level 3 investments due to lack of market transparency and corroboration to support these quoted prices. Additionally, valuation models may be used as the pricing source for any remaining investments classified as Level 3. These models may rely on one or more significant unobservable inputs and/or significant assumptions by the Investment Manager. Inputs used in valuations may include, but are not limited to, financial statement analysis, capital account balances, discount rates and estimated cash flows, and comparable company data.
Under the direction of the Fund's Board of Trustees (the Board), the Investment Manager's Valuation Committee (the Committee) is responsible for overseeing the valuation procedures approved by the Board. The Committee consists of voting and non-voting members from various groups within the Investment Manager's organization, including operations and accounting, trading and investments, compliance, risk management and legal.
The Committee meets at least monthly to review and approve valuation matters, which may include a description of specific valuation determinations, data regarding pricing information received from approved pricing vendors and brokers and the results of Board-approved valuation control policies and procedures (the Policies). The Policies address, among other things, instances when market quotations are or are not readily available, including recommendations of third party pricing vendors and a determination of appropriate pricing methodologies; events that require specific valuation determinations and assessment of fair value techniques; securities with a potential for stale pricing, including those that are illiquid, restricted, or in default; and the effectiveness of third party pricing vendors, including periodic reviews of vendors. The Committee meets more frequently, as needed, to discuss additional valuation matters, which may include the need to review back-testing results, review time-sensitive information or approve related valuation actions. The Committee reports to the Board, with members of the Committee meeting with the Board at each of its regularly scheduled meetings to discuss valuation matters and actions during the period, similar to those described earlier.
For investments categorized as Level 3, the Committee monitors information similar to that described above, which may include: (i) data specific to the issuer or comparable issuers, (ii) general market or specific sector news and (iii) quoted prices and specific or similar security transactions. The Committee considers this data and any changes from prior periods in order to assess the reasonableness of observable and unobservable inputs, any assumptions or internal models used to value those securities and changes in fair value. This data is also used to corroborate, when available, information received from approved pricing vendors and brokers. Various factors impact the frequency of monitoring this information (which may occur as often as daily). However, the Committee may determine that changes to inputs, assumptions and models are not required as a result of the monitoring procedures performed.
The accompanying Notes to Financial Statements are an integral part of this statement.
Annual Report 2015
16
COLUMBIA AMT-FREE CALIFORNIA INTERMEDIATE MUNI BOND FUND
PORTFOLIO OF INVESTMENTS (continued)
April 30, 2015
Fair Value Measurements (continued)
The following table is a summary of the inputs used to value the Fund's investments at April 30, 2015:
Description | | Level 1
Quoted Prices in Active
Markets for Identical
Assets ($) | | Level 2
Other Significant
Observable Inputs ($) | | Level 3
Significant
Unobservable Inputs ($) | |
Total ($) | |
Bonds | |
Municipal Bonds | | | — | | | | 365,639,687 | | | | — | | | | 365,639,687 | | |
Total Bonds | | | — | | | | 365,639,687 | | | | — | | | | 365,639,687 | | |
Short-Term Securities | |
Floating Rate Notes | | | — | | | | 10,280,000 | | | | — | | | | 10,280,000 | | |
Municipal Short Term | | | — | | | | 11,000,280 | | | | — | | | | 11,000,280 | | |
Total Short-Term Securities | | | — | | | | 21,280,280 | | | | — | | | | 21,280,280 | | |
Total | | | — | | | | 386,919,967 | | | | — | | | | 386,919,967 | | |
See the Portfolio of Investments for all investment classifications not indicated in the table.
The Fund's assets assigned to the Level 2 input category are generally valued using the market approach, in which a security's value is determined through reference to prices and information from market transactions for similar or identical assets.
There were no transfers of financial assets between levels during the period.
The accompanying Notes to Financial Statements are an integral part of this statement.
Annual Report 2015
17
COLUMBIA AMT-FREE CALIFORNIA INTERMEDIATE MUNI BOND FUND
STATEMENT OF ASSETS AND LIABILITIES
April 30, 2015
Assets | |
Investments, at value | |
(identified cost $364,352,478) | | $ | 386,919,967 | | |
Cash | | | 8,377,043 | | |
Receivable for: | |
Capital shares sold | | | 1,238,875 | | |
Interest | | | 4,262,271 | | |
Expense reimbursement due from Investment Manager | | | 2,251 | | |
Prepaid expenses | | | 795 | | |
Total assets | | | 400,801,202 | | |
Liabilities | |
Payable for: | |
Investments purchased on a delayed delivery basis | | | 7,354,578 | | |
Capital shares purchased | | | 255,416 | | |
Dividend distributions to shareholders | | | 915,511 | | |
Investment management fees | | | 4,290 | | |
Distribution and/or service fees | | | 675 | | |
Transfer agent fees | | | 63,613 | | |
Administration fees | | | 731 | | |
Compensation of board members | | | 79,053 | | |
Other expenses | | | 32,612 | | |
Total liabilities | | | 8,706,479 | | |
Net assets applicable to outstanding capital stock | | $ | 392,094,723 | | |
Represented by | |
Paid-in capital | | $ | 371,959,097 | | |
Excess of distributions over net investment income | | | (51,814 | ) | |
Accumulated net realized loss | | | (2,380,049 | ) | |
Unrealized appreciation (depreciation) on: | |
Investments | | | 22,567,489 | | |
Total — representing net assets applicable to outstanding capital stock | | $ | 392,094,723 | | |
The accompanying Notes to Financial Statements are an integral part of this statement.
Annual Report 2015
18
COLUMBIA AMT-FREE CALIFORNIA INTERMEDIATE MUNI BOND FUND
STATEMENT OF ASSETS AND LIABILITIES (continued)
April 30, 2015
Class A | |
Net assets | | $ | 47,317,341 | | |
Shares outstanding | | | 4,508,020 | | |
Net asset value per share | | $ | 10.50 | | |
Maximum offering price per share(a) | | $ | 10.82 | | |
Class B | |
Net assets | | $ | 10,205 | | |
Shares outstanding | | | 972 | | |
Net asset value per share | | $ | 10.50 | | |
Class C | |
Net assets | | $ | 12,964,785 | | |
Shares outstanding | | | 1,235,875 | | |
Net asset value per share | | $ | 10.49 | | |
Class R4 | |
Net assets | | $ | 529,111 | | |
Shares outstanding | | | 50,568 | | |
Net asset value per share | | $ | 10.46 | | |
Class R5 | |
Net assets | | $ | 1,738,183 | | |
Shares outstanding | | | 166,466 | | |
Net asset value per share | | $ | 10.44 | | |
Class Z | |
Net assets | | $ | 329,535,098 | | |
Shares outstanding | | | 31,469,307 | | |
Net asset value per share | | $ | 10.47 | | |
(a) The maximum offering price per share is calculated by dividing the net asset value per share by 1.0 minus the maximum sales charge of 3.00%.
The accompanying Notes to Financial Statements are an integral part of this statement.
Annual Report 2015
19
COLUMBIA AMT-FREE CALIFORNIA INTERMEDIATE MUNI BOND FUND
STATEMENT OF OPERATIONS
Year Ended April 30, 2015
Net investment income | |
Income: | |
Dividends | | $ | 512 | | |
Interest | | | 11,852,033 | | |
Total income | | | 11,852,545 | | |
Expenses: | |
Investment management fees | | | 1,351,276 | | |
Distribution and/or service fees | |
Class A | | | 97,250 | | |
Class B | | | 206 | | |
Class C | | | 99,732 | | |
Transfer agent fees | |
Class A | | | 76,969 | | |
Class B | | | 40 | | |
Class C | | | 19,706 | | |
Class R4 | | | 857 | | |
Class R5 | | | 358 | | |
Class Z | | | 568,186 | | |
Administration fees | | | 232,082 | | |
Compensation of board members | | | 19,386 | | |
Custodian fees | | | 4,055 | | |
Printing and postage fees | | | 27,655 | | |
Registration fees | | | 19,617 | | |
Professional fees | | | 34,039 | | |
Other | | | 12,101 | | |
Total expenses | | | 2,563,515 | | |
Fees waived or expenses reimbursed by Investment Manager and its affiliates | | | (711,618 | ) | |
Expense reductions | | | (40 | ) | |
Total net expenses | | | 1,851,857 | | |
Net investment income | | | 10,000,688 | | |
Realized and unrealized gain (loss) — net | |
Net realized gain (loss) on: | |
Investments | | | (1,281 | ) | |
Net realized loss | | | (1,281 | ) | |
Net change in unrealized appreciation (depreciation) on: | |
Investments | | | 1,515,978 | | |
Net change in unrealized appreciation | | | 1,515,978 | | |
Net realized and unrealized gain | | | 1,514,697 | | |
Net increase in net assets resulting from operations | | $ | 11,515,385 | | |
The accompanying Notes to Financial Statements are an integral part of this statement.
Annual Report 2015
20
COLUMBIA AMT-FREE CALIFORNIA INTERMEDIATE MUNI BOND FUND
STATEMENT OF CHANGES IN NET ASSETS
| | | Year Ended
April 30,
2015 | | Year Ended
April 30,
2014 | |
Operations | |
Net investment income | | $ | 10,000,688 | | | $ | 9,581,170 | | |
Net realized loss | | | (1,281 | ) | | | (2,226,103 | ) | |
Net change in unrealized appreciation (depreciation) | | | 1,515,978 | | | | (6,035,349 | ) | |
Net increase in net assets resulting from operations | | | 11,515,385 | | | | 1,319,718 | | |
Distributions to shareholders | |
Net investment income | |
Class A | | | (1,074,583 | ) | | | (921,325 | ) | |
Class B | | | (421 | ) | | | (477 | ) | |
Class C | | | (200,400 | ) | | | (213,531 | ) | |
Class R4 | | | (12,902 | ) | | | (122 | ) | |
Class R5 | | | (22,116 | ) | | | (2,943 | ) | |
Class Z | | | (8,690,266 | ) | | | (8,442,772 | ) | |
Total distributions to shareholders | | | (10,000,688 | ) | | | (9,581,170 | ) | |
Increase (decrease) in net assets from capital stock activity | | | 87,667,644 | | | | (7,554,167 | ) | |
Total increase (decrease) in net assets | | | 89,182,341 | | | | (15,815,619 | ) | |
Net assets at beginning of year | | | 302,912,382 | | | | 318,728,001 | | |
Net assets at end of year | | $ | 392,094,723 | | | $ | 302,912,382 | | |
Excess of distributions over net investment income | | $ | (51,814 | ) | | $ | (51,814 | ) | |
The accompanying Notes to Financial Statements are an integral part of this statement.
Annual Report 2015
21
COLUMBIA AMT-FREE CALIFORNIA INTERMEDIATE MUNI BOND FUND
STATEMENT OF CHANGES IN NET ASSETS (continued)
| | | Year Ended April 30, 2015 | | Year Ended April 30, 2014 | |
| | | Shares | | Dollars ($) | | Shares | | Dollars ($) | |
Capital stock activity | |
Class A shares | |
Subscriptions(a) | | | 2,291,743 | | | | 24,199,329 | | | | 1,717,006 | | | | 17,569,379 | | |
Distributions reinvested | | | 90,286 | | | | 953,387 | | | | 71,345 | | | | 731,002 | | |
Redemptions | | | (1,053,451 | ) | | | (11,111,547 | ) | | | (1,361,863 | ) | | | (13,919,575 | ) | |
Net increase | | | 1,328,578 | | | | 14,041,169 | | | | 426,488 | | | | 4,380,806 | | |
Class B shares | |
Subscriptions | | | — | | | | — | | | | 1,425 | | | | 14,559 | | |
Distributions reinvested | | | 13 | | | | 138 | | | | 1 | | | | 11 | | |
Redemptions(a) | | | (1,595 | ) | | | (16,945 | ) | | | (700 | ) | | | (7,026 | ) | |
Net increase (decrease) | | | (1,582 | ) | | | (16,807 | ) | | | 726 | | | | 7,544 | | |
Class C shares | |
Subscriptions | | | 533,207 | | | | 5,625,853 | | | | 455,004 | | | | 4,626,484 | | |
Distributions reinvested | | | 11,379 | | | | 120,081 | | | | 10,883 | | | | 111,377 | | |
Redemptions | | | (196,967 | ) | | | (2,076,929 | ) | | | (327,675 | ) | | | (3,348,280 | ) | |
Net increase | | | 347,619 | | | | 3,669,005 | | | | 138,212 | | | | 1,389,581 | | |
Class R4 shares | |
Subscriptions | | | 49,334 | | | | 517,033 | | | | 4,736 | | | | 49,099 | | |
Distributions reinvested | | | 1,195 | | | | 12,592 | | | | 2 | | | | 16 | | |
Redemptions | | | (4,937 | ) | | | (51,942 | ) | | | — | | | | — | | |
Net increase | | | 45,592 | | | | 477,683 | | | | 4,738 | | | | 49,115 | | |
Class R5 shares | |
Subscriptions | | | 133,477 | | | | 1,402,820 | | | | 32,623 | | | | 333,474 | | |
Distributions reinvested | | | 2,074 | | | | 21,798 | | | | 275 | | | | 2,834 | | |
Redemptions | | | (1,943 | ) | | | (20,390 | ) | | | (276 | ) | | | (2,841 | ) | |
Net increase | | | 133,608 | | | | 1,404,228 | | | | 32,622 | | | | 333,467 | | |
Class Z shares | |
Subscriptions | | | 9,983,716 | | | | 105,228,613 | | | | 6,985,515 | | | | 71,643,063 | | |
Distributions reinvested | | | 144,640 | | | | 1,523,915 | | | | 121,320 | | | | 1,239,928 | | |
Redemptions | | | (3,672,605 | ) | | | (38,660,162 | ) | | | (8,497,884 | ) | | | (86,597,671 | ) | |
Net increase (decrease) | | | 6,455,751 | | | | 68,092,366 | | | | (1,391,049 | ) | | | (13,714,680 | ) | |
Total net increase (decrease) | | | 8,309,566 | | | | 87,667,644 | | | | (788,263 | ) | | | (7,554,167 | ) | |
(a) Includes conversions of Class B shares to Class A shares, if any.
The accompanying Notes to Financial Statements are an integral part of this statement.
Annual Report 2015
22
COLUMBIA AMT-FREE CALIFORNIA INTERMEDIATE MUNI BOND FUND
The following tables are intended to help you understand the Fund's financial performance. Certain information reflects financial results for a single share of a class held for the periods shown. Per share net investment income (loss) amounts are calculated based on average shares outstanding during the period. Total return assumes reinvestment of all dividends and distributions, if any. Total return does not reflect payment of sales charges, if any. Total return and portfolio turnover are not annualized for periods of less than one year. The portfolio turnover rate is calculated without regard to purchase and sales transactions of short-term instruments and certain derivatives, if any. If such transactions were included, the Fund's portfolio turnover rate may be higher.
| | | Year Ended April 30, | | Year Ended March 31, | |
Class A | | 2015 | | 2014 | | 2013 | | 2012(a) | | 2012 | | 2011 | |
Per share data | |
Net asset value, beginning of period | | $ | 10.42 | | | $ | 10.68 | | | $ | 10.47 | | | $ | 10.37 | | | $ | 9.65 | | | $ | 9.72 | | |
Income from investment operations: | |
Net investment income | | | 0.29 | | | | 0.32 | | | | 0.32 | | | | 0.03 | | | | 0.32 | | | | 0.31 | | |
Net realized and unrealized gain (loss) | | | 0.08 | | | | (0.26 | ) | | | 0.21 | | | | 0.10 | | | | 0.72 | | | | (0.07 | ) | |
Total from investment operations | | | 0.37 | | | | 0.06 | | | | 0.53 | | | | 0.13 | | | | 1.04 | | | | 0.24 | | |
Less distributions to shareholders: | |
Net investment income | | | (0.29 | ) | | | (0.32 | ) | | | (0.32 | ) | | | (0.03 | ) | | | (0.32 | ) | | | (0.31 | ) | |
Total distributions to shareholders | | | (0.29 | ) | | | (0.32 | ) | | | (0.32 | ) | | | (0.03 | ) | | | (0.32 | ) | | | (0.31 | ) | |
Net asset value, end of period | | $ | 10.50 | | | $ | 10.42 | | | $ | 10.68 | | | $ | 10.47 | | | $ | 10.37 | | | $ | 9.65 | | |
Total return | | | 3.60 | % | | | 0.64 | % | | | 5.12 | % | | | 1.22 | % | | | 10.87 | % | | | 2.48 | % | |
Ratios to average net assets(b) | |
Total gross expenses | | | 0.95 | % | | | 0.96 | % | | | 0.96 | % | | | 1.00 | %(c) | | | 1.00 | % | | | 0.94 | % | |
Total net expenses(d) | | | 0.74 | %(e) | | | 0.74 | %(e) | | | 0.73 | %(e) | | | 0.73 | %(c) | | | 0.74 | %(e) | | | 0.80 | %(e) | |
Net investment income | | | 2.76 | % | | | 3.10 | % | | | 3.01 | % | | | 3.11 | %(c) | | | 3.13 | % | | | 3.14 | % | |
Supplemental data | |
Net assets, end of period (in thousands) | | $ | 47,317 | | | $ | 33,140 | | | $ | 29,398 | | | $ | 20,180 | | | $ | 18,858 | | | $ | 11,613 | | |
Portfolio turnover | | | 6 | % | | | 12 | % | | | 8 | % | | | 0 | % | | | 9 | % | | | 26 | % | |
Notes to Financial Highlights
(a) For the period from April 1, 2012 to April 30, 2012. During the period, the Fund's fiscal year end was changed from March 31 to April 30.
(b) In addition to the fees and expenses that the Fund bears directly, the Fund indirectly bears a pro rata share of the fees and expenses of any other funds in which it invests. Such indirect expenses are not included in the Fund's reported expense ratios.
(c) Annualized.
(d) Total net expenses include the impact of certain fee waivers/expense reimbursements made by the Investment Manager and certain of its affiliates, if applicable.
(e) The benefits derived from expense reductions had an impact of less than 0.01%.
The accompanying Notes to Financial Statements are an integral part of this statement.
Annual Report 2015
23
COLUMBIA AMT-FREE CALIFORNIA INTERMEDIATE MUNI BOND FUND
FINANCIAL HIGHLIGHTS (continued)
| | | Year Ended April 30, | | Year Ended March 31, | |
Class B | | 2015 | | 2014 | | 2013 | | 2012(a) | | 2012 | | 2011 | |
Per share data | |
Net asset value, beginning of period | | $ | 10.42 | | | $ | 10.68 | | | $ | 10.47 | | | $ | 10.37 | | | $ | 9.64 | | | $ | 9.71 | | |
Income from investment operations: | |
Net investment income | | | 0.22 | | | | 0.24 | | | | 0.24 | | | | 0.02 | | | | 0.25 | | | | 0.24 | | |
Net realized and unrealized gain (loss) | | | 0.07 | | | | (0.26 | ) | | | 0.21 | | | | 0.10 | | | | 0.71 | | | | (0.07 | ) | |
Total from investment operations | | | 0.29 | | | | (0.02 | ) | | | 0.45 | | | | 0.12 | | | | 0.96 | | | | 0.17 | | |
Less distributions to shareholders: | |
Net investment income | | | (0.21 | ) | | | (0.24 | ) | | | (0.24 | ) | | | (0.02 | ) | | | (0.23 | ) | | | (0.24 | ) | |
Total distributions to shareholders | | | (0.21 | ) | | | (0.24 | ) | | | (0.24 | ) | | | (0.02 | ) | | | (0.23 | ) | | | (0.24 | ) | |
Net asset value, end of period | | $ | 10.50 | | | $ | 10.42 | | | $ | 10.68 | | | $ | 10.47 | | | $ | 10.37 | | | $ | 9.64 | | |
Total return | | | 2.82 | % | | | (0.11 | %) | | | 4.34 | % | | | 1.16 | % | | | 10.04 | % | | | 1.72 | % | |
Ratios to average net assets(b) | |
Total gross expenses | | | 1.70 | % | | | 1.71 | % | | | 1.70 | % | | | 1.78 | %(c) | | | 1.96 | % | | | 1.69 | % | |
Total net expenses(d) | | | 1.49 | %(e) | | | 1.49 | %(e) | | | 1.48 | % | | | 1.48 | %(c) | | | 1.56 | %(e) | | | 1.55 | %(e) | |
Net investment income | | | 2.04 | % | | | 2.36 | % | | | 2.26 | % | | | 2.38 | %(c) | | | 2.53 | % | | | 2.41 | % | |
Supplemental data | |
Net assets, end of period (in thousands) | | $ | 10 | | | $ | 27 | | | $ | 20 | | | $ | 3 | | | $ | 3 | | | $ | 144 | | |
Portfolio turnover | | | 6 | % | | | 12 | % | | | 8 | % | | | 0 | % | | | 9 | % | | | 26 | % | |
Notes to Financial Highlights
(a) For the period from April 1, 2012 to April 30, 2012. During the period, the Fund's fiscal year end was changed from March 31 to April 30.
(b) In addition to the fees and expenses that the Fund bears directly, the Fund indirectly bears a pro rata share of the fees and expenses of any other funds in which it invests. Such indirect expenses are not included in the Fund's reported expense ratios.
(c) Annualized.
(d) Total net expenses include the impact of certain fee waivers/expense reimbursements made by the Investment Manager and certain of its affiliates, if applicable.
(e) The benefits derived from expense reductions had an impact of less than 0.01%.
The accompanying Notes to Financial Statements are an integral part of this statement.
Annual Report 2015
24
COLUMBIA AMT-FREE CALIFORNIA INTERMEDIATE MUNI BOND FUND
FINANCIAL HIGHLIGHTS (continued)
| | | Year Ended April 30, | | Year Ended March 31, | |
Class C | | 2015 | | 2014 | | 2013 | | 2012(a) | | 2012 | | 2011 | |
Per share data | |
Net asset value, beginning of period | | $ | 10.42 | | | $ | 10.67 | | | $ | 10.47 | | | $ | 10.37 | | | $ | 9.64 | | | $ | 9.72 | | |
Income from investment operations: | |
Net investment income | | | 0.21 | | | | 0.24 | | | | 0.24 | | | | 0.02 | | | | 0.24 | | | | 0.24 | | |
Net realized and unrealized gain (loss) | | | 0.07 | | | | (0.25 | ) | | | 0.20 | | | | 0.10 | | | | 0.73 | | | | (0.08 | ) | |
Total from investment operations | | | 0.28 | | | | (0.01 | ) | | | 0.44 | | | | 0.12 | | | | 0.97 | | | | 0.16 | | |
Less distributions to shareholders: | |
Net investment income | | | (0.21 | ) | | | (0.24 | ) | | | (0.24 | ) | | | (0.02 | ) | | | (0.24 | ) | | | (0.24 | ) | |
Total distributions to shareholders | | | (0.21 | ) | | | (0.24 | ) | | | (0.24 | ) | | | (0.02 | ) | | | (0.24 | ) | | | (0.24 | ) | |
Net asset value, end of period | | $ | 10.49 | | | $ | 10.42 | | | $ | 10.67 | | | $ | 10.47 | | | $ | 10.37 | | | $ | 9.64 | | |
Total return | | | 2.72 | % | | | (0.02 | %) | | | 4.24 | % | | | 1.16 | % | | | 10.15 | % | | | 1.61 | % | |
Ratios to average net assets(b) | |
Total gross expenses | | | 1.70 | % | | | 1.71 | % | | | 1.71 | % | | | 1.75 | %(c) | | | 1.73 | % | | | 1.69 | % | |
Total net expenses(d) | | | 1.49 | %(e) | | | 1.49 | %(e) | | | 1.48 | %(e) | | | 1.48 | %(c) | | | 1.49 | %(e) | | | 1.55 | %(e) | |
Net investment income | | | 2.01 | % | | | 2.35 | % | | | 2.25 | % | | | 2.36 | %(c) | | | 2.38 | % | | | 2.42 | % | |
Supplemental data | |
Net assets, end of period (in thousands) | | $ | 12,965 | | | $ | 9,253 | | | $ | 8,004 | | | $ | 4,384 | | | $ | 4,223 | | | $ | 1,599 | | |
Portfolio turnover | | | 6 | % | | | 12 | % | | | 8 | % | | | 0 | % | | | 9 | % | | | 26 | % | |
Notes to Financial Highlights
(a) For the period from April 1, 2012 to April 30, 2012. During the period, the Fund's fiscal year end was changed from March 31 to April 30.
(b) In addition to the fees and expenses that the Fund bears directly, the Fund indirectly bears a pro rata share of the fees and expenses of any other funds in which it invests. Such indirect expenses are not included in the Fund's reported expense ratios.
(c) Annualized.
(d) Total net expenses include the impact of certain fee waivers/expense reimbursements made by the Investment Manager and certain of its affiliates, if applicable.
(e) The benefits derived from expense reductions had an impact of less than 0.01%.
The accompanying Notes to Financial Statements are an integral part of this statement.
Annual Report 2015
25
COLUMBIA AMT-FREE CALIFORNIA INTERMEDIATE MUNI BOND FUND
FINANCIAL HIGHLIGHTS (continued)
| | | Year Ended April 30, | |
Class R4 | | 2015 | | 2014 | | 2013(a) | |
Per share data | |
Net asset value, beginning of period | | $ | 10.39 | | | $ | 10.64 | | | $ | 10.54 | | |
Income from investment operations: | |
Net investment income | | | 0.32 | | | | 0.34 | | | | 0.04 | | |
Net realized and unrealized gain (loss) | | | 0.07 | | | | (0.25 | ) | | | 0.10 | | |
Total from investment operations | | | 0.39 | | | | 0.09 | | | | 0.14 | | |
Less distributions to shareholders: | |
Net investment income | | | (0.32 | ) | | | (0.34 | ) | | | (0.04 | ) | |
Total distributions to shareholders | | | (0.32 | ) | | | (0.34 | ) | | | (0.04 | ) | |
Net asset value, end of period | | $ | 10.46 | | | $ | 10.39 | | | $ | 10.64 | | |
Total return | | | 3.76 | % | | | 0.98 | % | | | 1.32 | % | |
Ratios to average net assets(b) | |
Total gross expenses | | | 0.70 | % | | | 0.70 | % | | | 0.56 | %(c) | |
Total net expenses(d) | | | 0.49 | %(e) | | | 0.49 | %(e) | | | 0.44 | %(c) | |
Net investment income | | | 3.02 | % | | | 3.46 | % | | | 3.27 | %(c) | |
Supplemental data | |
Net assets, end of period (in thousands) | | $ | 529 | | | $ | 52 | | | $ | 3 | | |
Portfolio turnover | | | 6 | % | | | 12 | % | | | 8 | % | |
Notes to Financial Highlights
(a) Based on operations from March 19, 2013 (commencement of operations) through the stated period end.
(b) In addition to the fees and expenses that the Fund bears directly, the Fund indirectly bears a pro rata share of the fees and expenses of any other funds in which it invests. Such indirect expenses are not included in the Fund's reported expense ratios.
(c) Annualized.
(d) Total net expenses include the impact of certain fee waivers/expense reimbursements made by the Investment Manager and certain of its affiliates, if applicable.
(e) The benefits derived from expense reductions had an impact of less than 0.01%.
The accompanying Notes to Financial Statements are an integral part of this statement.
Annual Report 2015
26
COLUMBIA AMT-FREE CALIFORNIA INTERMEDIATE MUNI BOND FUND
FINANCIAL HIGHLIGHTS (continued)
| | | Year Ended April 30, | |
Class R5 | | 2015 | | 2014 | | 2013(a) | |
Per share data | |
Net asset value, beginning of period | | $ | 10.37 | | | $ | 10.63 | | | $ | 10.63 | | |
Income from investment operations: | |
Net investment income | | | 0.32 | | | | 0.35 | | | | 0.16 | | |
Net realized and unrealized gain (loss) | | | 0.08 | | | | (0.26 | ) | | | 0.01 | | |
Total from investment operations | | | 0.40 | | | | 0.09 | | | | 0.17 | | |
Less distributions to shareholders: | |
Net investment income | | | (0.33 | ) | | | (0.35 | ) | | | (0.17 | ) | |
Total distributions to shareholders | | | (0.33 | ) | | | (0.35 | ) | | | (0.17 | ) | |
Net asset value, end of period | | $ | 10.44 | | | $ | 10.37 | | | $ | 10.63 | | |
Total return | | | 3.85 | % | | | 0.98 | % | | | 1.57 | % | |
Ratios to average net assets(b) | |
Total gross expenses | | | 0.55 | % | | | 0.58 | % | | | 0.50 | %(c) | |
Total net expenses(d) | | | 0.40 | % | | | 0.40 | % | | | 0.39 | %(c) | |
Net investment income | | | 3.09 | % | | | 3.47 | % | | | 3.28 | %(c) | |
Supplemental data | |
Net assets, end of period (in thousands) | | $ | 1,738 | | | $ | 341 | | | $ | 3 | | |
Portfolio turnover | | | 6 | % | | | 12 | % | | | 8 | % | |
Notes to Financial Highlights
(a) Based on operations from November 8, 2012 (commencement of operations) through the stated period end.
(b) In addition to the fees and expenses that the Fund bears directly, the Fund indirectly bears a pro rata share of the fees and expenses of any other funds in which it invests. Such indirect expenses are not included in the Fund's reported expense ratios.
(c) Annualized.
(d) Total net expenses include the impact of certain fee waivers/expense reimbursements made by the Investment Manager and certain of its affiliates, if applicable.
The accompanying Notes to Financial Statements are an integral part of this statement.
Annual Report 2015
27
COLUMBIA AMT-FREE CALIFORNIA INTERMEDIATE MUNI BOND FUND
FINANCIAL HIGHLIGHTS (continued)
| | | Year Ended April 30, | | Year Ended March 31, | |
Class Z | | 2015 | | 2014 | | 2013 | | 2012(a) | | 2012 | | 2011 | |
Per share data | |
Net asset value, beginning of period | | $ | 10.40 | | | $ | 10.65 | | | $ | 10.45 | | | $ | 10.35 | | | $ | 9.63 | | | $ | 9.70 | | |
Income from investment operations: | |
Net investment income | | | 0.32 | | | | 0.34 | | | | 0.35 | | | | 0.03 | | | | 0.34 | | | | 0.34 | | |
Net realized and unrealized gain (loss) | | | 0.07 | | | | (0.25 | ) | | | 0.20 | | | | 0.10 | | | | 0.72 | | | | (0.07 | ) | |
Total from investment operations | | | 0.39 | | | | 0.09 | | | | 0.55 | | | | 0.13 | | | | 1.06 | | | | 0.27 | | |
Less distributions to shareholders: | |
Net investment income | | | (0.32 | ) | | | (0.34 | ) | | | (0.35 | ) | | | (0.03 | ) | | | (0.34 | ) | | | (0.34 | ) | |
Total distributions to shareholders | | | (0.32 | ) | | | (0.34 | ) | | | (0.35 | ) | | | (0.03 | ) | | | (0.34 | ) | | | (0.34 | ) | |
Net asset value, end of period | | $ | 10.47 | | | $ | 10.40 | | | $ | 10.65 | | | $ | 10.45 | | | $ | 10.35 | | | $ | 9.63 | | |
Total return | | | 3.76 | % | | | 0.98 | % | | | 5.29 | % | | | 1.24 | % | | | 11.16 | % | | | 2.74 | % | |
Ratios to average net assets(b) | |
Total gross expenses | | | 0.70 | % | | | 0.71 | % | | | 0.71 | % | | | 0.75 | %(c) | | | 0.74 | % | | | 0.69 | % | |
Total net expenses(d) | | | 0.49 | %(e) | | | 0.49 | %(e) | | | 0.48 | %(e) | | | 0.48 | %(c) | | | 0.50 | %(e) | | | 0.55 | %(e) | |
Net investment income | | | 3.02 | % | | | 3.35 | % | | | 3.27 | % | | | 3.35 | %(c) | | | 3.39 | % | | | 3.43 | % | |
Supplemental data | |
Net assets, end of period (in thousands) | | $ | 329,535 | | | $ | 260,101 | | | $ | 281,301 | | | $ | 254,981 | | | $ | 252,647 | | | $ | 217,024 | | |
Portfolio turnover | | | 6 | % | | | 12 | % | | | 8 | % | | | 0 | % | | | 9 | % | | | 26 | % | |
Notes to Financial Highlights
(a) For the period from April 1, 2012 to April 30, 2012. During the period, the Fund's fiscal year end was changed from March 31 to April 30.
(b) In addition to the fees and expenses that the Fund bears directly, the Fund indirectly bears a pro rata share of the fees and expenses of any other funds in which it invests. Such indirect expenses are not included in the Fund's reported expense ratios.
(c) Annualized.
(d) Total net expenses include the impact of certain fee waivers/expense reimbursements made by the Investment Manager and certain of its affiliates, if applicable.
(e) The benefits derived from expense reductions had an impact of less than 0.01%.
The accompanying Notes to Financial Statements are an integral part of this statement.
Annual Report 2015
28
COLUMBIA AMT-FREE CALIFORNIA INTERMEDIATE MUNI BOND FUND
NOTES TO FINANCIAL STATEMENTS
April 30, 2015
Note 1. Organization
Columbia AMT-Free California Intermediate Muni Bond Fund (formerly known as Columbia California Intermediate Municipal Bond Fund) (the Fund), a series of Columbia Funds Series Trust (the Trust), is a diversified fund. The Trust is registered under the Investment Company Act of 1940, as amended (the 1940 Act), as an open-end management investment company organized as a Delaware statutory trust. Effective July 7, 2014, Columbia California Intermediate Municipal Bond Fund was renamed Columbia AMT-Free California Intermediate Muni Bond Fund.
Fund Shares
The Trust may issue an unlimited number of shares (without par value). The Fund offers Class A, Class B, Class C, Class R4, Class R5 and Class Z shares. Although all share classes generally have identical voting, dividend and liquidation rights, each share class votes separately when required by the Trust's organizational documents or by law. Different share classes pay different distribution amounts to the extent the expenses of such share classes differ, and distributions in liquidation will be proportional to the net asset value of each share class. Each share class has its own expense structure and sales charges.
Class A shares are subject to a maximum front-end sales charge of 3.00% based on the initial investment amount. In addition, Class A shares purchased on or after February 19, 2015 are subject to a contingent deferred sales charge (CDSC) of 0.75% on certain investments of $500,000 or more if redeemed within 12 months after purchase. Redemptions of Class A shares purchased prior to February 19, 2015, without an initial sales charge in accounts aggregating $1 million to $50 million at the time of purchase, are subject to a CDSC of 1.00% if redeemed within 12 months after purchase, and 0.50% if redeemed more than 12, but less than 18, months after purchase.
Class B shares may be subject to a maximum CDSC of 3.00% based upon the holding period after purchase. Class B shares will generally convert to Class A shares eight years after purchase. The Fund no longer accepts investments by new or existing investors in the Fund's Class B shares, except in connection with the reinvestment of any dividend and/or capital gain distributions in Class B shares of the Fund and exchanges by existing Class B shareholders of certain other funds within the Columbia Family of Funds.
Class C shares are subject to a 1.00% CDSC on shares redeemed within one year after purchase.
Class R4 shares are not subject to sales charges and are generally available only to omnibus retirement plans and certain investors as described in the Fund's prospectus.
Class R5 shares are not subject to sales charges and are generally available only to investors purchasing through authorized investment professionals and omnibus retirement plans.
Class Z shares are not subject to sales charges and are available only to eligible investors, which are subject to different investment minimums as described in the Fund's prospectus.
Note 2. Summary of Significant Accounting Policies
Basis of Preparation
The Fund is an investment company that applies the accounting and reporting guidance in the Financial Accounting Standards Board (FASB) Accounting Standards Codification Topic 946, Financial Services — Investment Companies (ASC 946). The financial statements are prepared in accordance with U.S. generally accepted accounting principles (GAAP), which requires management to make certain estimates and assumptions that affect the reported amounts of assets and liabilities, the disclosure of contingent assets and liabilities at the date of the financial statements and the reported amounts of income and expenses during the reporting period. Actual results could differ from those estimates.
The following is a summary of significant accounting policies followed by the Fund in the preparation of its financial statements.
Security Valuation
Debt securities generally are valued by pricing services approved by the Board of Trustees (the Board) based upon market transactions for normal, institutional-size trading units of similar securities. The services may use various pricing techniques that take into account, as applicable, factors such as yield, quality, coupon rate, maturity, type of issue, trading characteristics and other data, as well as broker quotes. Debt securities for which quotations are readily available may also be valued based upon an over-the-counter or exchange bid quotation.
Short-term securities within 60 days to maturity are valued at amortized cost, which approximates market
Annual Report 2015
29
COLUMBIA AMT-FREE CALIFORNIA INTERMEDIATE MUNI BOND FUND
NOTES TO FINANCIAL STATEMENTS (continued)
April 30, 2015
value. Short-term securities maturing in more than 60 days from the valuation date are valued at the market price or approximate market value based on current interest rates.
Investments for which market quotations are not readily available, or that have quotations which management believes are not reliable, are valued at fair value as determined in good faith under procedures established by and under the general supervision of the Board. If a security or class of securities (such as foreign securities) is valued at fair value, such value is likely to be different from the quoted or published price for the security.
The determination of fair value often requires significant judgment. To determine fair value, management may use assumptions including but not limited to future cash flows and estimated risk premiums. Multiple inputs from various sources may be used to determine fair value.
Delayed Delivery Securities
The Fund may trade securities on other than normal settlement terms, including securities purchased or sold on a "when-issued" basis. This may increase risk to the Fund since the other party to the transaction may fail to deliver which could cause the Fund to subsequently invest at less advantageous prices. The Fund designates cash or liquid securities in an amount equal to the delayed delivery commitment.
Security Transactions
Security transactions are accounted for on the trade date. Cost is determined and gains (losses) are based upon the specific identification method for both financial statement and federal income tax purposes.
Income Recognition
Interest income is recorded on an accrual basis. Market premiums and discounts, including original issue discounts, are amortized and accreted, respectively, over the expected life of the security on all debt securities, unless otherwise noted.
The Fund may place a debt security on non-accrual status and reduce related interest income when it becomes probable that the interest will not be collected and the amount of uncollectible interest can be reasonably estimated. A defaulted debt security is removed from non-accrual status when the issuer resumes interest payments or when collectability of interest is reasonably assured.
Dividend income is recorded on the ex-dividend date.
Expenses
General expenses of the Trust are allocated to the Fund and other funds of the Trust based upon relative net assets or other expense allocation methodologies determined by the nature of the expense. Expenses directly attributable to the Fund are charged to the Fund. Expenses directly attributable to a specific class of shares are charged to that share class.
Determination of Class Net Asset Value
All income, expenses (other than class-specific expenses, which are charged to that share class, as shown in the Statement of Operations) and realized and unrealized gains (losses) are allocated to each class of the Fund on a daily basis, based on the relative net assets of each class, for purposes of determining the net asset value of each class.
Federal Income Tax Status
The Fund intends to qualify each year as a regulated investment company under Subchapter M of the Internal Revenue Code, as amended, and will distribute substantially all of its tax exempt and taxable income (including net short-term capital gains), if any, for its tax year, and as such will not be subject to federal income taxes. In addition, the Fund intends to distribute in each calendar year substantially all of its net investment income, capital gains and certain other amounts, if any, such that the Fund should not be subject to federal excise tax. Therefore, no federal income or excise tax provision is recorded.
Distributions to Shareholders
Distributions from net investment income, if any, are declared daily and paid monthly. Net realized capital gains, if any, are distributed at least annually. Income distributions and capital gain distributions are determined in accordance with federal income tax regulations, which may differ from GAAP.
Guarantees and Indemnifications
Under the Trust's organizational documents and, in some cases, by contract, its officers and trustees are indemnified against certain liabilities arising out of the performance of their duties to the Trust or its funds. In addition, certain of the Fund's contracts with its service providers contain general indemnification clauses. The Fund's maximum exposure under these arrangements is unknown since the amount of any future claims that may be made against the Fund cannot be determined, and
Annual Report 2015
30
COLUMBIA AMT-FREE CALIFORNIA INTERMEDIATE MUNI BOND FUND
NOTES TO FINANCIAL STATEMENTS (continued)
April 30, 2015
the Fund has no historical basis for predicting the likelihood of any such claims.
Note 3. Fees and Compensation Paid to Affiliates
Investment Management Fees
Under an Investment Management Services Agreement, Columbia Management Investment Advisers, LLC (the Investment Manager), a wholly-owned subsidiary of Ameriprise Financial, Inc. (Ameriprise Financial), determines which securities will be purchased, held or sold. The investment management fee is an annual fee that is equal to a percentage of the Fund's average daily net assets that declines from 0.40% to 0.27% as the Fund's net assets increase. The effective investment management fee rate for the year ended April 30, 2015 was 0.40% of the Fund's average daily net assets.
Administration Fees
Under an Administrative Services Agreement, the Investment Manager also serves as the Fund Administrator. The Fund pays the Fund Administrator an annual fee for administration and accounting services equal to a percentage of the Fund's average daily net assets that declines from 0.07% to 0.04% as the Fund's net assets increase. The effective administration fee rate for the year ended April 30, 2015 was 0.07% of the Fund's average daily net assets.
Other Expenses
Other expenses are for, among other things, miscellaneous expenses of the Fund or the Board, including payments to a company providing limited administrative services to the Fund and the Board. That company's expenses include boardroom and office expense, employee compensation, employee health and retirement benefits, and certain other expenses. For the year ended April 30, 2015, other expenses paid by the Fund to this company were $1,639.
Compensation of Board Members
Board members are compensated for their services to the Fund as disclosed in the Statement of Operations. Under a Deferred Compensation Plan (the Plan), the Board members who are not "interested persons" of the Fund, as defined under the 1940 Act, may elect to defer payment of up to 100% of their compensation. Deferred amounts are treated as though equivalent dollar amounts had been invested in shares of certain funds managed by the Investment Manager. The Fund's liability
for these amounts is adjusted for market value changes and remains in the Fund until distributed in accordance with the Plan.
Transfer Agent Fees
Under a Transfer and Dividend Disbursing Agent Agreement, Columbia Management Investment Services Corp. (the Transfer Agent), an affiliate of the Investment Manager and a wholly-owned subsidiary of Ameriprise Financial, is responsible for providing transfer agency services to the Fund. The Transfer Agent has contracted with Boston Financial Data Services (BFDS) to serve as sub-transfer agent.
Effective November 1, 2014, the Transfer Agent receives a monthly transfer agency fee based on the number or the average value of accounts, depending on the type of account. Prior to November 1, 2014, the Transfer Agent received a monthly account-based service fee based on the number of open accounts. In addition, the Transfer Agent also receives sub-transfer agency fees based on a percentage of the average aggregate value of the Fund's shares maintained in omnibus accounts (other than omnibus accounts for which American Enterprise Investment Services Inc. is the broker of record or accounts where the beneficial shareholder is a customer of Ameriprise Financial Services, Inc., for which the Transfer Agent receives a per account fee). The Transfer Agent pays the fees of BFDS for services as sub-transfer agent and is not entitled to reimbursement for such fees from the Fund (with the exception of out-of-pocket fees).
The Transfer Agent also receives compensation from the Fund for various shareholder services and reimbursements for certain out-of-pocket fees. Total transfer agent fees for Class R5 shares are subject to an annual limitation of not more than 0.05% of the average daily net assets attributable to Class R5 shares.
For the year ended April 30, 2015, the Fund's effective transfer agent fee rates as a percentage of average daily net assets of each class were as follows:
Class A | | | 0.20 | % | |
Class B | | | 0.20 | | |
Class C | | | 0.20 | | |
Class R4 | | | 0.20 | | |
Class R5 | | | 0.05 | | |
Class Z | | | 0.20 | | |
An annual minimum account balance fee of $20 may apply to certain accounts with a value below the applicable share class's initial minimum investment
Annual Report 2015
31
COLUMBIA AMT-FREE CALIFORNIA INTERMEDIATE MUNI BOND FUND
NOTES TO FINANCIAL STATEMENTS (continued)
April 30, 2015
requirements to reduce the impact of small accounts on transfer agent fees. These minimum account balance fees are remitted to the Fund and recorded as part of expense reductions in the Statement of Operations. For the year ended April 30, 2015, these minimum account balance fees reduced total expenses of the Fund by $40.
Distribution and Service Fees
The Fund has an agreement with Columbia Management Investment Distributors, Inc. (the Distributor), an affiliate of the Investment Manager and a wholly-owned subsidiary of Ameriprise Financial, for distribution and shareholder services. The Board has approved, and the Fund has adopted, distribution and shareholder service plans (the Plans) applicable to certain share classes, which set the distribution and service fees for the Fund. These fees are calculated daily and are intended to compensate the Distributor and/or eligible selling and/or servicing agents for selling shares of the Fund and providing services to investors.
Under the Plans, the Fund pays a monthly combined distribution and service fee to the Distributor at the maximum annual rate of 0.25% of the average daily net assets attributable to Class A shares of the Fund. Also under the Plans, the Fund pays a monthly service fee at the maximum annual rate of 0.25% of the average daily net assets attributable to Class B and Class C shares of the Fund and the payment of a monthly distribution fee at the maximum annual rate of 0.75% of the average daily net assets attributable to Class B and Class C shares of the Fund.
Sales Charges
Sales charges, including front-end charges and CDSCs, received by the Distributor for distributing Fund shares were $74,555 for Class A and $4 for Class C shares for the year ended April 30, 2015.
Expenses Waived/Reimbursed by the Investment Manager and its Affiliates
The Investment Manager and certain of its affiliates have contractually agreed to waive fees and/or reimburse expenses (excluding certain fees and expenses described below for the period disclosed below, unless sooner terminated at the sole discretion of the Board), so that the Fund's net operating expenses, after giving effect to fees waived/expenses reimbursed and any balance credits and/or overdraft charges from the Fund's
custodian, do not exceed the following annual rates as a percentage of the class' average daily net assets:
| | | Fee Rates Contractual
through
August 31, 2015 | |
Class A | | | 0.74 | % | |
Class B | | | 1.49 | | |
Class C | | | 1.49 | | |
Class R4 | | | 0.49 | | |
Class R5 | | | 0.40 | | |
Class Z | | | 0.49 | | |
Under the agreement governing these fee waivers and/or expense reimbursement arrangements, the following fees and expenses are excluded from the waiver/reimbursement commitment, and therefore will be paid by the Fund, if applicable: taxes (including foreign transaction taxes), expenses associated with investments in affiliated and non-affiliated pooled investment vehicles (including mutual funds and exchange-traded funds), transaction costs and brokerage commissions, costs related to any securities lending program, dividend expenses associated with securities sold short, inverse floater program fees and expenses, transaction charges and interest on borrowed money, interest, extraordinary expenses and any other expenses the exclusion of which is specifically approved by the Board. Any fees waived and/or expenses reimbursed under the expense reimbursement arrangements described above are not recoverable by the Investment Manager or its affiliates in future periods. This agreement may be modified or amended only with approval from all parties.
Note 4. Federal Tax Information
The timing and character of income and capital gain distributions are determined in accordance with income tax regulations, which may differ from GAAP because of temporary or permanent book to tax differences.
At April 30, 2015, these differences are primarily due to differing treatment for capital loss carryforwards, Trustees' deferred compensation and distributions. To the extent these differences are permanent, reclassifications are made among the components of the Fund's net assets in the Statement of Assets and Liabilities. Temporary differences do not require reclassifications.
The Fund did not have any permanent differences; therefore, no reclassifications were made to the Statement of Assets and Liabilities.
Annual Report 2015
32
COLUMBIA AMT-FREE CALIFORNIA INTERMEDIATE MUNI BOND FUND
NOTES TO FINANCIAL STATEMENTS (continued)
April 30, 2015
The tax character of distributions paid during the years indicated was as follows:
Year Ended April 30, | | 2015 | | 2014 | |
Ordinary income | | $ | 18,726 | | | $ | 18,539 | | |
Tax-exempt income | | | 9,981,962 | | | | 9,562,631 | | |
Total | | | 10,000,688 | | | | 9,581,170 | | |
Short-term capital gain distributions, if any, are considered ordinary income distributions for tax purposes.
At April 30, 2015, the components of distributable earnings on a tax basis were as follows:
Undistributed tax-exempt income | | $ | 941,936 | | |
Capital loss carryforwards | | | (2,380,049 | ) | |
Net unrealized appreciation | | | 22,567,489 | | |
At April 30, 2015, the cost of investments for federal income tax purposes was $364,352,478 and the aggregate gross unrealized appreciation and depreciation based on that cost was:
Unrealized appreciation | | $ | 23,594,703 | | |
Unrealized depreciation | | | (1,027,214 | ) | |
Net unrealized appreciation | | | 22,567,489 | | |
The following capital loss carryforwards, determined at April 30, 2015, may be available to reduce taxable income arising from future net realized gains on investments, if any, to the extent permitted by the Internal Revenue Code:
Year of Expiration | | Amount ($) | |
2017 | | | 10,109 | | |
No expiration — short-term | | | 2,323,351 | | |
No expiration — long-term | | | 46,589 | | |
Total | | | 2,380,049 | | |
Capital loss carryforwards with no expiration are required to be utilized prior to any capital losses which carry an expiration date. As a result of this ordering rule, capital loss carryforwards which carry an expiration date may be more likely to expire unused.
Management of the Fund has concluded that there are no significant uncertain tax positions in the Fund that would require recognition in the financial statements. However, management's conclusion may be subject to review and adjustment at a later date based on factors including, but not limited to, new tax laws, regulations, and administrative interpretations (including relevant court decisions). Generally, the Fund's federal tax returns for the prior three fiscal years remain subject to examination by the Internal Revenue Service.
Note 5. Portfolio Information
The cost of purchases and proceeds from sales of securities, excluding short-term investments and derivatives, if any, aggregated to $103,313,517 and $19,745,000, respectively, for the year ended April 30, 2015. The amount of purchase and sale activity impacts the portfolio turnover rate reported in the Financial Highlights.
Note 6. Shareholder Concentration
At April 30, 2015, two unaffiliated shareholders of record owned 81.3% of the outstanding shares of the Fund in one or more accounts. The Fund has no knowledge about whether any portion of those shares was owned beneficially. Subscription and redemption activity by concentrated accounts may have a significant effect on the operations of the Fund.
Note 7. Line of Credit
The Fund has entered into a revolving credit facility with a syndicate of banks led by JPMorgan Chase Bank, N.A. whereby the Fund may borrow for the temporary funding of shareholder redemptions or for other temporary or emergency purposes. Pursuant to a December 9, 2014 amendment, the credit facility agreement, which is a collective agreement between the Fund and certain other funds managed by the Investment Manager, severally and not jointly, permits collective borrowings up to $550 million. Interest is charged to each participating fund based on its borrowings at a rate equal to the higher of (i) the overnight federal funds rate plus 1.00% or (ii) the one-month LIBOR rate plus 1.00%. Each borrowing under the credit facility matures no later than 60 days after the date of borrowing. The Fund also pays a commitment fee equal to its pro rata share of the amount of the credit facility at a rate of 0.075% per annum. The commitment fee is included in other expenses in the Statement of Operations. Prior to the December 9, 2014 amendment, the credit facility agreement permitted borrowings up to $500 million under the same terms and interest rates as described above.
The Fund had no borrowings during the year ended April 30, 2015.
Note 8. Significant Risks
Credit Risk
Credit risk is the risk that the value of debt securities in the Fund's portfolio may decline because the issuer may default and fail to pay interest or repay principal when due. Rating agencies assign credit ratings to debt
Annual Report 2015
33
COLUMBIA AMT-FREE CALIFORNIA INTERMEDIATE MUNI BOND FUND
NOTES TO FINANCIAL STATEMENTS (continued)
April 30, 2015
securities to indicate their credit risk. Lower rated or unrated debt securities held by the Fund may present increased credit risk as compared to higher-rated debt securities.
Interest Rate Risk
Interest rate risk is the risk of losses attributable to changes in interest rates. In general, if prevailing interest rates rise, the values of debt securities tend to fall, and if interest rates fall, the values of debt securities tend to rise. Actions by governments and central banking authorities can result in increases in interest rates. Increasing interest rates may negatively affect the value of debt securities held by the Fund, resulting in a negative impact on the Fund's performance and net asset value per share. In general, the longer the maturity or duration of a debt security, the greater its sensitivity to changes in interest rates.
Liquidity Risk
Liquidity risk is the risk associated with a lack of marketability of investments which may make it difficult to sell the investment at a desirable time or price. Changing regulatory, market or other conditions or environments (for example, the interest rate or credit environments) may adversely affect the liquidity of the Fund's investments. The Fund may have to accept a lower selling price for the holding, sell other investments, or forego another, more appealing investment opportunity. Generally, the less liquid the market at the time the Fund sells a portfolio investment, the greater the risk of loss or decline of value to the Fund. A less liquid market can lead to an increase in Fund redemptions, which may negatively impact Fund performance and net asset value per share, including, for example, if the Fund is forced to sell securities in a down market.
Geographic Concentration Risk
Because state-specific tax-exempt funds invest primarily in the municipal securities issued by the state and political sub-divisions of the state, the Fund will be particularly affected by political and economic conditions and developments in the state in which it invests. The Fund may, therefore, have a greater risk than that of a municipal bond fund which is more geographically diversified. The value of the municipal securities owned by the Fund also may be adversely affected by future changes in federal or state income tax laws.
Note 9. Subsequent Events
Management has evaluated the events and transactions that have occurred through the date the financial statements were issued and noted no items requiring adjustment of the financial statements or additional disclosure.
Note 10. Information Regarding Pending and Settled Legal Proceedings
In December 2005, without admitting or denying the allegations, American Express Financial Corporation (AEFC, which is now known as Ameriprise Financial, Inc. (Ameriprise Financial)) entered into settlement agreements with the Securities and Exchange Commission (SEC) and Minnesota Department of Commerce (MDOC) related to market timing activities. As a result, AEFC was censured and ordered to cease and desist from committing or causing any violations of certain provisions of the Investment Advisers Act of 1940, the Investment Company Act of 1940, and various Minnesota laws. AEFC agreed to pay disgorgement of $10 million and civil money penalties of $7 million. AEFC also agreed to retain an independent distribution consultant to assist in developing a plan for distribution of all disgorgement and civil penalties ordered by the SEC in accordance with various undertakings detailed at www.sec.gov/litigation/admin/ia-2451.pdf. Ameriprise Financial and its affiliates have cooperated with the SEC and the MDOC in these legal proceedings, and have made regular reports to the Funds' Boards of Trustees.
Ameriprise Financial and certain of its affiliates have historically been involved in a number of legal, arbitration and regulatory proceedings, including routine litigation, class actions, and governmental actions, concerning matters arising in connection with the conduct of their business activities. Ameriprise Financial believes that the Funds are not currently the subject of, and that neither Ameriprise Financial nor any of its affiliates are the subject of, any pending legal, arbitration or regulatory proceedings that are likely to have a material adverse effect on the Funds or the ability of Ameriprise Financial or its affiliates to perform under their contracts with the Funds. Ameriprise Financial is required to make quarterly (10-Q), annual (10-K) and, as necessary, 8-K filings with the Securities and Exchange Commission on legal and regulatory matters that relate to Ameriprise Financial and its affiliates. Copies of these filings may be obtained by accessing the SEC website at www.sec.gov.
Annual Report 2015
34
COLUMBIA AMT-FREE CALIFORNIA INTERMEDIATE MUNI BOND FUND
NOTES TO FINANCIAL STATEMENTS (continued)
April 30, 2015
There can be no assurance that these matters, or the adverse publicity associated with them, will not result in increased fund redemptions, reduced sale of fund shares or other adverse consequences to the Funds. Further, although we believe proceedings are not likely to have a material adverse effect on the Funds or the ability of Ameriprise Financial or its affiliates to perform under their contracts with the Funds, these proceedings are subject to uncertainties and, as such, we are unable to estimate the possible loss or range of loss that may result. An adverse outcome in one or more of these proceedings could result in adverse judgments, settlements, fines, penalties or other relief that could have a material adverse effect on the consolidated financial condition or results of operations of Ameriprise Financial.
Annual Report 2015
35
COLUMBIA AMT-FREE CALIFORNIA INTERMEDIATE MUNI BOND FUND
REPORT OF INDEPENDENT REGISTERED PUBLIC ACCOUNTING FIRM
To the Trustees of Columbia Funds Series Trust and the Shareholders of
Columbia AMT-Free California Intermediate Muni Bond Fund (formerly known as Columbia California Intermediate Municipal Bond Fund)
In our opinion, the accompanying statement of assets and liabilities, including the portfolio of investments, and the related statements of operations and of changes in net assets and the financial highlights present fairly, in all material respects, the financial position of Columbia AMT-Free California Intermediate Muni Bond Fund (formerly known as Columbia California Intermediate Municipal Bond Fund) (the "Fund", a series of Columbia Funds Series Trust) at April 30, 2015, and the results of its operations, the changes in its net assets and the financial highlights for each of the periods indicated, in conformity with accounting principles generally accepted in the United States of America. These financial statements and financial highlights (hereafter referred to as "financial statements") are the responsibility of the Fund's management. Our responsibility is to express an opinion on these financial statements based on our audits. We conducted our audits of these financial statements in accordance with the standards of the Public Company Accounting Oversight Board (United States). Those standards require that we plan and perform the audit to obtain reasonable assurance about whether the financial statements are free of material misstatement. An audit includes examining, on a test basis, evidence supporting the amounts and disclosures in the financial statements, assessing the accounting principles used and significant estimates made by management, and evaluating the overall financial statement presentation. We believe that our audits, which included confirmation of securities at April 30, 2015 by correspondence with the custodian and brokers, and the application of alternative auditing procedures where such confirmations had not been received, provide a reasonable basis for our opinion.
PricewaterhouseCoopers LLP
Minneapolis, Minnesota
June 19, 2015
Annual Report 2015
36
COLUMBIA AMT-FREE CALIFORNIA INTERMEDIATE MUNI BOND FUND
FEDERAL INCOME TAX INFORMATION
(Unaudited)
The Fund hereby designates the following tax attributes for the fiscal year ended April 30, 2015. Shareholders will be notified in early 2016 of the amounts for use in preparing 2015 income tax returns.
Tax Designations:
| Exempt-Interest Dividends | | | 99.81 | % | |
Exempt-Interest Dividends. The percentage of net investment income distributed during the fiscal year that qualifies as exempt-interest dividends for federal income tax purposes.
Annual Report 2015
37
COLUMBIA AMT-FREE CALIFORNIA INTERMEDIATE MUNI BOND FUND
Shareholders elect the Board that oversees the Funds' operations. The Board appoints officers who are responsible for day-to-day business decisions based on policies set by the Board. The following table provides basic biographical information about the Funds' Board members, including their principal occupations during the past five years, although specific titles for individuals may have varied over the period. Under current Board policy, members may serve through the end of the calendar year in which he or she reaches either the mandatory retirement age established by the Board or the fifteenth anniversary of the first Board meeting they attended as a member of the Board.
Independent Trustees
Name,
Address,
Year of Birth | | Position Held
With Funds and
Length of Service | | Principal Occupation(s)
During Past Five Years
and Other Relevant
Professional Experience | | Number of
Funds in the
Fund Family
Overseen by
Board Member | | Other Present or Past
Directorships/
Trusteeships
(Within Past 5 Years) | |
Kathleen Blatz
901 S. Marquette Ave.
Minneapolis, MN 55402
1954 | | Board member since 1/06 for RiverSource Funds and since 6/11 for Nations Funds | | Attorney; specializing in arbitration and mediation; Chief Justice, Minnesota Supreme Court, 1998-2006; Associate Justice, Minnesota Supreme Court, 1996-1998; Fourth Judicial District Court Judge, Hennepin County, 1994-1996; Attorney in private practice and public service, 1984-1993; State Representative, Minnesota House of Representatives, 1979-1993, which included service on the Tax and Financial Institutions and Insurance Committees | | | 127 | | | Trustee, BlueCross BlueShield of Minnesota (Chair of the Business Development Committee) since 2009; Chair of the Robina Foundation since August 2013 | |
Edward J. Boudreau, Jr.
901 S. Marquette Ave.
Minneapolis, MN 55402
1944 | | Board member since 6/11 for RiverSource Funds and since 1/05 for Nations Funds | | Managing Director, E.J. Boudreau & Associates (consulting) since 2000; FINRA Industry Arbitrator, 2002-present; Chairman and Chief Executive Officer, John Hancock Funds (asset management), Chairman and Interested Trustee for open-end and closed-end funds offered by John Hancock, 1989-2000; John Hancock Life Insurance Company, including SVP and Treasurer and SVP Information Technology, 1968-1988 | | | 125 | | | Former Trustee, BofA Funds Series Trust (11 funds), 2005-2011; Trustee, Boston Museum of Science (Chair of Finance Committee), 1985-2013 | |
Pamela G. Carlton
901 S. Marquette Ave.
Minneapolis, MN 55402
1954 | | Board member since 7/07 for RiverSource Funds and since 6/11 for Nations Funds | | President, Springboard — Partners in Cross Cultural Leadership (consulting company) since 2003; Managing Director of US Equity Research, JP Morgan Chase, 1999-2003; Director of US Equity Research, Chase Asset Management, 1996-1999; Co-Director Latin America Research, 1993-1996, COO Global Research, 1992-1996, Co-Director of US Research, 1991-1992, Investment Banker, Morgan Stanley, 1982-1991 | | | 127 | | | None | |
Annual Report 2015
38
COLUMBIA AMT-FREE CALIFORNIA INTERMEDIATE MUNI BOND FUND
TRUSTEES AND OFFICERS (continued)
Independent Trustees (continued)
Name,
Address,
Year of Birth | | Position Held
With Funds and
Length of Service | | Principal Occupation(s)
During Past Five Years
and Other Relevant
Professional Experience | | Number of
Funds in the
Fund Family
Overseen by
Board Member | | Other Present or Past
Directorships/
Trusteeships
(Within Past 5 Years) | |
William P. Carmichael
901 S. Marquette Ave.
Minneapolis, MN 55402
1943 | | Chair of the Board since 1/14, Board member since 6/11 for RiverSource Funds and since 2003 for Nations Funds | | Retired; Co-founder, The Succession Fund (provides exit strategies to owners of privately held companies) 1998-2007; Adjunct Professor of Finances, Kelley School of Business, Indiana University, 1993-2007; Senior Vice President, Sara Lee Corporation, 1991-1993; Senior Vice President and Chief Financial Officer, Beatrice Foods Company, 1984-1990; Vice President, Esmark, Inc., 1973-1984; Associate, Price Waterhouse, 1968-1972 | | | 127 | | | Director, Cobra Electronics Corporation (electronic equipment manufacturer), 1994-August 2014; The Finish Line (athletic shoes and apparel) since July 2003; Director, International Textile Corp. since 2012; former Director, McMoRan Exploration Company (oil and gas exploration and development) 2010-2013; former Trustee, BofA Funds Series Trust (11 funds) 2009-2011; Director, Spectrum Brands, Inc. (consumer products), 2002-2009; Director, Simmons Company (bedding), 2004-2010 | |
Patricia M. Flynn
901 S. Marquette Ave.
Minneapolis, MN 55402
1950 | | Board member since 11/04 for RiverSource Funds and since 6/11 for Nations Funds | | Trustee Professor of Economics and Management, Bentley University since 1976 (also teaches and conducts research on corporate governance); Dean, McCallum Graduate School of Business, Bentley University, 1992-2002 | | | 127 | | | Trustee, MA Taxpayers Foundation since 1997; Board of Governors, Innovation Institute, MA Technology Collaborative since 2010 | |
William A. Hawkins
901 S. Marquette Ave.
Minneapolis, MN 55402
1942 | | Board member since 6/11 for RiverSource Funds and since 1/05 for Nations Funds | | Managing Director, Overton Partners (financial consulting), since August 2010; President and Chief Executive Officer, California General Bank, N.A., January 2008-August 2010; Operation Hope, COO, 2004-2007; IndyMac Bancorp, President, CBG, 1999-2003; American General Bank, President, 1997-1999; Griffin Financial Services, CEO, 1981-1997; The Griffin Funds, CEO, 1992-1998 | | | 125 | | | Trustee, BofA Funds Series Trust (11 funds) | |
R. Glenn Hilliard
901 S. Marquette Ave.
Minneapolis, MN 55402
1943 | | Board member since 6/11 for RiverSource Funds and since 1/05 for Nations Funds | | Chairman and Chief Executive Officer, Hilliard Group LLC (investing and consulting) since April 2003; Non-Executive Director & Chairman, CNO Financial Group, Inc. (insurance), September 2003-May 2011 | | | 125 | | | Chairman, BofA Funds Series Trust (11 funds); former Director, CNO Financial Group, Inc. (insurance) 2003-2011 | |
Annual Report 2015
39
COLUMBIA AMT-FREE CALIFORNIA INTERMEDIATE MUNI BOND FUND
TRUSTEES AND OFFICERS (continued)
Independent Trustees (continued)
Name,
Address,
Year of Birth | | Position Held
With Funds and
Length of Service | | Principal Occupation(s)
During Past Five Years
and Other Relevant
Professional Experience | | Number of
Funds in the
Fund Family
Overseen by
Board Member | | Other Present or Past
Directorships/
Trusteeships
(Within Past 5 Years) | |
Catherine James Paglia
901 S. Marquette Ave.
Minneapolis, MN 55402
1952 | | Board member since 11/04 for RiverSource Funds and since 6/11 for Nations Funds | | Director, Enterprise Asset Management, Inc. (private real estate and asset management company) since September 1998; Managing Director and Partner, Interlaken Capital, Inc., 1989-1997; Managing Director, Morgan Stanley, 1982-1989; Vice President, Investment Banking, 1980-1982, Associate, Investment Banking, 1976-1980, Dean Witter Reynolds, Inc. | | | 127 | | | Director, Valmont Industries, Inc. (irrigation systems manufacturer) since 2012; Trustee, Carleton College (on the Investment Committee); Trustee, Carnegie Endowment for International Peace (on the Investment Committee) | |
Leroy C. Richie
901 S. Marquette Ave.
Minneapolis, MN 55402
1941 | | Board member since 2000 for Seligman Funds, since 11/08 for RiverSource Funds and since 6/11 for Nations Funds | | Counsel, Lewis & Munday, P.C. (law firm) since 2004; Vice President and General Counsel, Automotive Legal Affairs, Chrysler Corporation, 1993-1997 | | | 127 | | | Lead Outside Director, Digital Ally, Inc. (digital imaging) since September 2005; Director, Infinity, Inc. (oil and gas exploration and production) since 1994; Director, OGE Energy Corp. (energy and energy services) 2007-2014 | |
Minor M. Shaw
901 S. Marquette Ave.
Minneapolis, MN 55402
1947 | | Board member since 6/11 for RiverSource Funds and since 2003 for Nations Funds | | President, Micco LLC (private investments) since 2011; President, Micco Corp. (family investment business) 1998-2011 | | | 125 | | | Director, Piedmont Natural Gas; Director, BlueCross BlueShield of South Carolina since April 2008; Chair of the Duke Endowment; Director, National Association of Corporate Directors, Carolinas Chapter, since 2013; Chair of Greenville-Spartanburg Airport Commission; former Trustee, BofA Funds Series Trust (11 funds), 2003-2011 | |
Alison Taunton-Rigby
901 S. Marquette Ave.
Minneapolis, MN 55402
1944 | | Board member since 11/02 for RiverSource Funds and since 6/11 for Nations Funds | | Managing Director, Forester Biotech (consulting) since 2001; Chief Executive Officer and Director, RiboNovix, Inc., (biotechnology) 2003-2010; President and Chief Executive Officer of CMT Inc., 2001-2003; Aquila Biopharmaceuticals Inc., 1996-2000; Cambridge Biotech Corporation, 1995-1996, Mitotix Inc., 1993-1994 | | | 127 | | | Director, Healthways, Inc. (health and well-being solutions) since 2005; Director, ICI Mutual Insurance Company, since 2011; Director, Abt Associates (government contractor) since 2001; Director, Boston Children's Hospital since 2002 | |
Annual Report 2015
40
COLUMBIA AMT-FREE CALIFORNIA INTERMEDIATE MUNI BOND FUND
TRUSTEES AND OFFICERS (continued)
Interested Trustee Not Affiliated with Investment Manager*
Name,
Address,
Year of Birth | | Position Held
With Funds and
Length of Service | | Principal Occupation
During Past Five Years | | Number of
Funds in the
Fund Family
Overseen by
Board Member | | Other Present or Past
Directorships/
Trusteeships
(Within Past 5 Years) | |
Anthony M. Santomero
901 S. Marquette Ave.
Minneapolis, MN 55402
1946 | | Board member since 6/11 for RiverSource Funds and since 1/08 for Nations Funds | | Richard K. Mellon Professor Emeritus of Finance, The Wharton School, University of Pennsylvania, since 2002; Senior Advisor, McKinsey & Company (consulting), 2006-2008; President, Federal Reserve Bank of Philadelphia, 2000-2006, Professor of Finance, The Wharton School, University of Pennsylvania, 1972-2002 | | | 125 | | | Director, Renaissance Reinsurance Ltd. since May 2008; Trustee, Penn Mutual Life Insurance Company since March 2008; Director, Citigroup Inc. since 2009; Director, Citibank, N.A. since 2009; former Trustee, BofA Funds Series Trust (11 funds), 2008-2011 | |
* Dr. Santomero is not an affiliated person of the Investment Manager or Ameriprise Financial. However, he is currently deemed by the Funds to be an "interested person" (as defined in the 1940 Act) of the Funds because he serves as a Director of Citigroup Inc. and Citibank, N.A., companies that may directly or through subsidiaries and affiliates engage from time-to-time in brokerage execution, principal transactions and lending relationships with the Funds or accounts advised/managed by the Investment Manager.
Interested Trustee Affiliated with Investment Manager*
Name,
Address,
Year of Birth | | Position Held
With Funds and
Length of Service | | Principal Occupation
During Past Five Years | | Number of
Funds in the
Fund Family
Overseen by
Board Member | | Other Present or Past
Directorships/
Trusteeships
(Within Past 5 Years) | |
William F. Truscott
53600 Ameriprise
Financial Center
Minneapolis, MN 55474
1960 | | Board member since 11/01 for RiverSource Funds and since 6/11 for Nations Funds; Senior Vice President since 2002 for RiverSource Funds and since 5/10 for Nations Funds | | Chairman of the Board and President, Columbia Management Investment Advisers, LLC since May 2010 and February 2012, respectively (previously President and Chief Investment Officer, 2001-April 2010); Chief Executive Officer, Global Asset Management, Ameriprise Financial, Inc. since September 2012 (previously Chief Executive Officer, U.S. Asset Management & President, Annuities, May 2010-September 2012 and President — U.S. Asset Management and Chief Investment Officer, 2005-April 2010); Director and Chief Executive Officer, Columbia Management Investment Distributors, Inc. since May 2010 and February 2012, respectively (previously Chairman of the Board and Chief Executive Officer, 2006-April 2010); Chairman of the Board and Chief Executive Officer, RiverSource Distributors, Inc. since 2006; Director, Threadneedle Asset Management Holdings, SARL since 2014; President and Chief Executive Officer, Ameriprise Certificate Company, 2006-August 2012 | | | 186 | | | Former Director, Ameriprise Certificate Company, 2006-January 2013 | |
* Interested person (as defined under the 1940 Act) by reason of being an officer, director, security holder and/or employee of the Investment Manager or Ameriprise Financial.
Annual Report 2015
41
COLUMBIA AMT-FREE CALIFORNIA INTERMEDIATE MUNI BOND FUND
TRUSTEES AND OFFICERS (continued)
The Statement of Additional Information has additional information about the Fund's Board members and is available, without charge, upon request by calling 800.345.6611; contacting your financial intermediary or visiting columbiathreadneedle.com/us.
The Board has appointed officers who are responsible for day-to-day business decisions based on policies it has established. The officers serve at the pleasure of the Board. In addition to Mr. Truscott, who is Senior Vice President, the Funds' other officers are:
Fund Officers
Name,
Address and
Year of Birth | | Position and Year
First Appointed to
Position for any Fund
in the Columbia
Funds Complex or a
Predecessor Thereof | | Principal Occupation(s) During Past Five Years | |
Christopher O. Petersen
5228 Ameriprise
Financial Center
Minneapolis, MN 55474
Born 1970 | | President and Principal Executive Officer (2015) | | Vice President and Lead Chief Counsel, Ameriprise Financial, Inc. since January 2015 (previously, Vice President and Chief Counsel January 2010-December 2014; and Vice President and Group Counsel or Counsel 2004-January 2010); officer of Columbia Funds and affiliated funds since 2007. | |
Michael G. Clarke
225 Franklin Street
Boston, MA 02110
Born 1969 | | Treasurer (2011) and Chief Financial Officer (2009) | | Vice President — Mutual Fund Administration, Columbia Management Investment Advisers, LLC, since May 2010; Managing Director of Fund Administration, Columbia Management Advisors, LLC, September 2004-April 2010; senior officer of Columbia Funds and affiliated funds since 2002. | |
Paul B. Goucher
100 Park Avenue
New York, NY 10017
Born 1968 | | Senior Vice President (2011), Chief Legal Officer (2015) and Assistant Secretary (2008) | | Vice President and Lead Chief Counsel, Ameriprise Financial, Inc. since November 2008 and January 2013, respectively (previously Chief Counsel, January 2010-January 2013 and Group Counsel, November 2008-January 2010). | |
Thomas P. McGuire
225 Franklin Street
Boston, MA 02110
Born 1972 | | Vice President and Chief Compliance Officer (2012) | | Vice President — Asset Management Compliance, Ameriprise Financial, Inc., since May 2010; Chief Compliance Officer, Ameriprise Certificate Company since September 2010; Compliance Executive, Bank of America, 2005-April 2010. | |
Colin Moore
225 Franklin Street
Boston, MA 02110
Born 1958 | | Senior Vice President (2010) | | Executive Vice President and Global Chief Investment Officer, Ameriprise Financial, Inc., since July 2013; Director and Global Chief Investment Officer, Columbia Management Investment Advisers, LLC since May 2010; Manager, Managing Director and Chief Investment Officer, Columbia Management Advisors, LLC, 2007-April 2010. | |
Michael E. DeFao
225 Franklin Street
Boston, MA 02110
Born 1968 | | Vice President (2011) and Assistant Secretary (2010) | | Vice President and Chief Counsel, Ameriprise Financial, Inc. since May 2010; Associate General Counsel, Bank of America, 2005-April 2010. | |
Joseph F. DiMaria
225 Franklin Street
Boston, MA 02110
Born 1968 | | Vice President (2011), Assistant Treasurer (2012) and Chief Accounting Officer (2008) | | Vice President — Mutual Fund Treasurer, Columbia Management Investment Advisers, LLC since May 2010; Director of Fund Administration, Columbia Management Advisors, LLC, 2006-April 2010. | |
Amy Johnson
5228 Ameriprise
Financial Center
Minneapolis, MN 55474
Born 1965 | | Vice President (2006) | | Managing Director and Chief Operating Officer, Columbia Management Investment Advisers, LLC since May 2010 (previously Chief Administrative Officer, 2009-April 2010, and Vice President — Asset Management and Trust Company Services, 2006-2009). | |
Lyn Kephart-Strong
5228 Ameriprise
Financial Center
Minneapolis, MN 55474
Born 1960 | | Vice President (2015) | | President, Columbia Management Investment Services Corp. since October 2014; Vice President & Resolution Officer, Ameriprise Trust Company since August 2009; President, RiverSource Service Corporation 2004-2010. | |
Ryan C. Larrenaga
225 Franklin Street
Boston, MA 02110
Born 1970 | | Vice President and Secretary (2015) | | Vice President and Group Counsel, Ameriprise Financial, Inc. since August 2011 (previously, Counsel from May 2010 to August 2011); Assistant General Counsel, Bank of America, 2005-April 2010; officer of Columbia Funds and affiliated funds since 2005. | |
Annual Report 2015
42
COLUMBIA AMT-FREE CALIFORNIA INTERMEDIATE MUNI BOND FUND
APPROVAL OF INVESTMENT MANAGEMENT SERVICES AGREEMENT
Columbia Management Investment Advisers, LLC (Columbia Management or the Investment Manager), a wholly-owned subsidiary of Ameriprise Financial, Inc. (Ameriprise Financial), serves as the investment manager to Columbia AMT-Free California Intermediate Muni Bond Fund (the Fund). Under an investment management services agreement (the IMS Agreement), Columbia Management provides investment advice and other services to the Fund and other funds distributed by Columbia Management Investment Distributors, Inc. (collectively, the Funds).
The Fund's Board of Trustees (the Board), including the independent Board members (the Independent Trustees), considered the renewal of the IMS Agreement for a two-month period (Short-Term Period) in order to align the IMS Agreement with the review cycle of other funds in the Columbia family of funds. Columbia Management prepared detailed reports for the Board and its Contracts Committee in January, March and April 2015, including reports based on analyses of data provided by an independent organization (Lipper) and a comprehensive response to each item of information requested by independent legal counsel to the Independent Trustees (Independent Legal Counsel) in a letter to the Investment Manager, to assist the Board in making this determination. In addition, throughout the year, the Board (or its committees) regularly meets with portfolio management teams and senior management personnel, and reviews information prepared by Columbia Management addressing the services Columbia Management provides and Fund performance. The Board also accords appropriate weight to the work, deliberations and conclusions of the Contracts Committee, the Investment Review Committee and the Compliance Committee in determining whether to continue the IMS Agreement.
The Board, at its April 13-15, 2015 in-person Board meeting (the April Meeting), considered the renewal of the IMS Agreement for the Short-Term Period. At the April Meeting, Independent Legal Counsel reviewed with the Independent Trustees various factors relevant to the Board's consideration of advisory agreements and the Board's legal responsibilities related to such consideration. Following an analysis and discussion of the factors identified below, the Board, including all of the Independent Trustees, approved the renewal of the IMS Agreement for the Short-Term Period.
Nature, Extent and Quality of Services Provided by Columbia Management
The Independent Trustees analyzed various reports and presentations they had received detailing the services performed by Columbia Management, as well as its expertise, resources and capabilities. The Independent Trustees specifically considered many developments during the past year concerning the services provided by Columbia Management. The Independent Trustees noted the information they received concerning Columbia Management's ability to retain its key portfolio management personnel. In evaluating the quality of services provided under the IMS Agreement and the Fund's Administrative Services Agreement, the Independent Trustees also took into account the organization and strength of the Fund's and its service providers' compliance programs. In addition, the Board also reviewed the financial condition of Columbia Management (and its affiliates) and each entity's ability to carry out its responsibilities under the IMS Agreement and the Fund's other services agreements with affiliates of Ameriprise Financial, observing the financial strength of Ameriprise Financial, with its solid balance sheet. The Board also discussed the acceptability of the terms of the IMS Agreement for the Short-Term Period.
Based on the foregoing, and based on other information received (both oral and written, including the information on investment performance referenced below) and other considerations, the Board concluded that the services being performed by Columbia Management and its affiliates were acceptable for the Short-Term Period.
Investment Performance
For purposes of evaluating the nature, extent and quality of services provided under the IMS Agreement, the Board carefully reviewed the investment performance of the Fund. In this regard, the Board considered detailed reports providing the results of analyses performed by an independent organization showing, for various periods, the performance of the Fund, the performance of a benchmark index, the percentage ranking of the Fund among its comparison group and the net assets of the Fund. The Board observed that for purposes of approving the IMS Agreement for the Short-Term Period, the Fund's performance was acceptable.
Annual Report 2015
43
COLUMBIA AMT-FREE CALIFORNIA INTERMEDIATE MUNI BOND FUND
APPROVAL OF INVESTMENT MANAGEMENT SERVICES AGREEMENT (continued)
Comparative Fees, Costs of Services Provided and the Profits Realized By Columbia Management and its Affiliates from their Relationships with the Fund
The Board reviewed comparative fees and the costs of services provided under the IMS Agreement. The Board members considered detailed comparative information set forth in an annual report on fees and expenses, including, among other things, data (based on analyses conducted by an independent organization) showing a comparison of the Fund's expenses with median expenses paid by funds in its comparative peer universe, as well as data showing the Fund's contribution to Columbia Management's profitability.
The Board accorded particular weight to the notion that the level of fees should reflect a rational pricing model applied consistently across the various product lines in the Fund family, while assuring that the overall fees for each Fund (with few defined exceptions) are generally in line with the "pricing philosophy" currently in effect (i.e., that the total expense ratio of the Fund is no higher than the median expense ratio of funds in the same comparison universe of the Fund).
The Board also considered the expected profitability of Columbia Management and its affiliates in connection with Columbia Management providing investment management services to the Fund. In this regard, the Board referred to a detailed profitability report, discussing the profitability to Columbia Management and Ameriprise Financial from managing, operating and distributing the Funds. For purposes of approving the IMS Agreement for the Short-Term Period, the Board concluded that the investment management service fees were fair and reasonable, observing that the profitability levels also seemed reasonable.
Economies of Scale to be Realized
The Board also considered the economies of scale that might be realized by Columbia Management as the Fund grows and took note of the extent to which Fund shareholders might also benefit from such growth. In this regard, the Independent Trustees took into account that IMS fees decline as Fund assets exceed various breakpoints.
Based on the foregoing, the Board, including all of the Independent Trustees, concluded that, for purposes of its consideration of the renewal of the IMS Agreement for the Short-Term Period, the investment management service fees were fair and reasonable in light of the extent and quality of services provided. In reaching this conclusion, no single factor was determinative. The Board noted its understanding that it would undertake the full consideration of renewal of the IMS Agreement for the full annual period at its June 2015 meetings. On April 15, 2015, the Board, including all of the Independent Trustees, approved the renewal of the IMS Agreement for the Short-Term Period.
Annual Report 2015
44
COLUMBIA AMT-FREE CALIFORNIA INTERMEDIATE MUNI BOND FUND
IMPORTANT INFORMATION ABOUT THIS REPORT
Each fund mails one shareholder report to each shareholder address. If you would like more than one report, please call shareholder services at 800.345.6611 and additional reports will be sent to you.
The policy of the Board is to vote the proxies of the companies in which each fund holds investments consistent with the procedures as stated in the Statement of Additional Information (SAI). You may obtain a copy of the SAI without charge by calling 800.345.6611; contacting your financial intermediary; visiting columbiathreadneedle.com/us; or searching the website of the Securities and Exchange Commission (SEC) at sec.gov. Information regarding how each fund voted proxies relating to portfolio securities is filed with the SEC by August 31st for the most recent 12-month period ending June 30th of that year, and is available without charge by visiting columbiathreadneedle.com/us, or searching the website of the SEC at sec.gov.
Each fund files a complete schedule of portfolio holdings with the SEC for the first and third quarters of each fiscal year on Form N-Q. Each fund's Form N-Q is available on the SEC's website at sec.gov and may be reviewed and copied at the SEC's Public Reference Room in Washington, D.C. Information on the operation of the Public Reference Room may be obtained by calling 800.SEC.0330. Each fund's complete schedule of portfolio holdings, as filed on Form N-Q, can also be obtained without charge, upon request, by calling 800.345.6611.
Annual Report 2015
45
Columbia AMT-Free California Intermediate Muni Bond Fund
P.O. Box 8081
Boston, MA 02266-8081

This information is for use with concurrent or prior delivery of a fund prospectus. Please read and consider the investment objectives, risks, charges and expenses for any fund carefully before investing. For a prospectus and summary prospectus, which contains this and other important information about the Fund, go to columbiathreadneedle.com/us. The Fund is distributed by Columbia Management Investment Distributors, Inc., member FINRA, and managed by Columbia Management Investment Advisers, LLC.
Columbia Threadneedle Investments (Columbia Threadneedle) is the global brand name of the Columbia and Threadneedle group of companies.
All rights reserved. Columbia Management Investment Distributors, Inc., 225 Franklin Street, Boston, MA 02110-2804
© 2015 Columbia Management Investment Advisers, LLC.
columbiathreadneedle.com/us
ANN122_04_E01_(06/15)

ANNUAL REPORT
April 30, 2015

COLUMBIA AMT-FREE GEORGIA INTERMEDIATE MUNI BOND FUND

 Dear Shareholder,
In a world that is changing faster than ever before, investors want asset managers who offer a global perspective while generating strong and sustainable returns. To that end, Columbia Management, in conjunction with its U.K.-based affiliate, Threadneedle Investments, has rebranded to Columbia Threadneedle Investments. The new global brand represents the combined capabilities, resources and reach of the global group, offering investors access to the best of both firms.
With a presence in 18 countries and more than 450 investment professionals*, our collective perspective and world view as Columbia Threadneedle Investments gives us deeper insight into what might affect the real-life financial outcomes clients are seeking. Putting our views into a global context enables us to build richer perspectives and create the right solutions, and provides us with enhanced capabilities to deliver consistent investment performance, which may ultimately lead to better investor outcomes.
As a result of the rebrand, you will begin to see our new logo and colors reflected in printed materials, such as this shareholder report, as well as on our new website — columbiathreadneedle.com/us. We encourage you to visit us online and view a new video on the "About Us" tab that speaks to the strength of the firm.
While we are introducing a new brand, in many ways, the investment company you know well has not changed. The following remain in effect:
n Fund and strategy names
n Established investment teams, philosophies and processes
n Account services, features, servicing phone numbers and mailing addresses
n Columbia Management Investment Distributors as distributor and Columbia Management Investment Advisers as investment adviser
We recognize that the money we manage represents the hard work and savings of people like you, and that everyone has different ambitions and different definitions of success. Investors have varying goals — funding their children's education, enjoying their retirement, putting money aside for unexpected events, and more. Whatever your ambitions, we believe our wide range of investment products and solutions can help give you confidence that you will reach your goals.
The world is constantly changing, but our priority remains the same: to help you secure your finances, meet your goals and achieve success. Thank you for your continued investment with us. Our service representatives are available at 800.345.6611 to help with any questions.
Sincerely,

Christopher O. Petersen
President, Columbia Funds
Investors should consider the investment objectives, risks, charges and expenses of a mutual fund carefully before investing. For a free prospectus and summary prospectus, which contains this and other important information about a fund, visit columbiathreadneedle.com/us. The prospectus should be read carefully before investing.
* Source: Ameriprise as of December 1, 2014
Columbia Funds are distributed by Columbia Management Investment Distributors, Inc., member FINRA, and managed by Columbia Management Investment Advisers, LLC.
© 2015 Columbia Management Investment Advisers, LLC. All rights reserved.
COLUMBIA AMT-FREE GEORGIA INTERMEDIATE MUNI BOND FUND
Performance Overview | | | 2 | | |
Manager Discussion of Fund Performance | | | 4 | | |
Understanding Your Fund's Expenses | | | 6 | | |
Portfolio of Investments | | | 7 | | |
Statement of Assets and Liabilities | | | 12 | | |
Statement of Operations | | | 14 | | |
Statement of Changes in Net Assets | | | 15 | | |
Financial Highlights | | | 17 | | |
Notes to Financial Statements | | | 22 | | |
Report of Independent Registered
Public Accounting Firm | | | 28 | | |
Federal Income Tax Information | | | 29 | | |
Trustees and Officers | | | 30 | | |
Approval of Investment Management
Services Agreement | | | 35 | | |
Important Information About This Report | | | 37 | | |
Fund Investment Manager
Columbia Management Investment
Advisers, LLC
225 Franklin Street
Boston, MA 02110
Fund Distributor
Columbia Management Investment
Distributors, Inc.
225 Franklin Street
Boston, MA 02110
Fund Transfer Agent
Columbia Management Investment
Services Corp.
P.O. Box 8081
Boston, MA 02266-8081
For more information about any of the funds, please visit columbiathreadneedle.com/us or call 800.345.6611. Customer Service Representatives are available to answer your questions Monday through Friday from 8 a.m. to 7 p.m. Eastern time.
The views expressed in this report reflect the current views of the respective parties. These views are not guarantees of future performance and involve certain risks, uncertainties and assumptions that are difficult to predict, so actual outcomes and results may differ significantly from the views expressed. These views are subject to change at any time based upon economic, market or other conditions and the respective parties disclaim any responsibility to update such views. These views may not be relied on as investment advice and, because investment decisions for a Columbia fund are based on numerous factors, may not be relied on as an indication of trading intent on behalf of any particular Columbia fund. References to specific securities should not be construed as a recommendation or investment advice.
COLUMBIA AMT-FREE GEORGIA INTERMEDIATE MUNI BOND FUND
Performance Summary
n Columbia AMT-Free Georgia Intermediate Muni Bond Fund (the Fund) Class A shares returned 2.98% excluding sales charges for the 12-month period that ended April 30, 2015. Class Z shares of the Fund returned 3.24% for the same time period.
n The Fund's benchmark, the Barclays 3-15 Year Blend Municipal Bond Index, returned 3.76% during the 12-month period.
n The Fund's duration positioning was the largest factor in its underperformance. Duration is a measure of interest rate sensitivity.
Average Annual Total Returns (%) (for period ended April 30, 2015)
| | | Inception | | 1 Year | | 5 Years | | 10 Years | |
Class A | | 05/04/92 | | | | | | | |
Excluding sales charges | | | | | 2.98 | | | | 3.44 | | | | 3.48 | | |
Including sales charges | | | | | -0.07 | | | | 2.81 | | | | 3.17 | | |
Class B | | 06/07/93 | | | | | | | |
Excluding sales charges | | | | | 2.21 | | | | 2.66 | | | | 2.71 | | |
Including sales charges | | | | | -0.79 | | | | 2.66 | | | | 2.71 | | |
Class C | | 06/17/92 | | | | | | | |
Excluding sales charges | | | | | 2.21 | | | | 2.66 | | | | 2.70 | | |
Including sales charges | | | | | 1.21 | | | | 2.66 | | | | 2.70 | | |
Class R4* | | 03/19/13 | | | 3.24 | | | | 3.67 | | | | 3.73 | | |
Class Z | | 03/01/92 | | | 3.24 | | | | 3.69 | | | | 3.73 | | |
Barclays 3-15 Year Blend Municipal Bond Index | | | | | 3.76 | | | | 4.35 | | | | 4.54 | | |
Returns for Class A are shown with and without the maximum initial sales charge of 3.00%. The maximum applicable sales charge was reduced from 3.25% to 3.00% on Class A share purchases made on or after February 19, 2015. Class A returns (including sales charges) for all periods reflect the current maximum applicable sales charge of 3.00%. Returns for Class B are shown with and without the applicable contingent deferred sales charge (CDSC) of 3.00% in the first year, declining to 1.00% in the fourth year and eliminated thereafter. Returns for Class C are shown with and without the 1.00% CDSC for the first year only. The Fund's other classes are not subject to sales charges and have limited eligibility. Please see the Fund's prospectus for details. Performance for different share classes will vary based on differences in sales charges and fees associated with each class. All results shown assume reinvestment of distributions during the period. Returns do not reflect the deduction of taxes that a shareholder may pay on Fund distributions or on the redemption of Fund shares. Performance results reflect the effect of any fee waivers or reimbursements of Fund expenses by Columbia Management Investment Advisers, LLC and/or any of its affiliates. Absent these fee waivers or expense reimbursement arrangements, performance results would have been lower.
The performance information shown represents past performance and is not a guarantee of future results. The investment return and principal value of your investment will fluctuate so that your shares, when redeemed, may be worth more or less than their original cost. Current performance may be lower or higher than the performance information shown. You may obtain performance information current to the most recent month-end by contacting your financial intermediary, visiting columbiathreadneedle.com/us or calling 800.345.6611.
*The returns shown for periods prior to the share class inception date (including returns for the Life of the Fund, if shown, which are since Fund inception) include the returns of the Fund's oldest share class. These returns are adjusted to reflect any higher class-related operating expenses of the newer share classes, as applicable. Please visit columbiathreadneedle.com/us/investment-products/mutual-funds/appended-performance for more information.
The Barclays 3-15 Year Blend Municipal Bond Index is an unmanaged index that tracks the performance of municipal bonds issued after December 31, 1990, with remaining maturities between 2 and 17 years and at least $7 million in principal amount outstanding.
Indices are not available for investment, are not professionally managed and do not reflect sales charges, fees, brokerage commissions, taxes or other expenses of investing. Securities in the Fund may not match those in an index.
Annual Report 2015
2
COLUMBIA AMT-FREE GEORGIA INTERMEDIATE MUNI BOND FUND
PERFORMANCE OVERVIEW (continued)
Performance of a Hypothetical $10,000 Investment (May 1, 2005 – April 30, 2015)
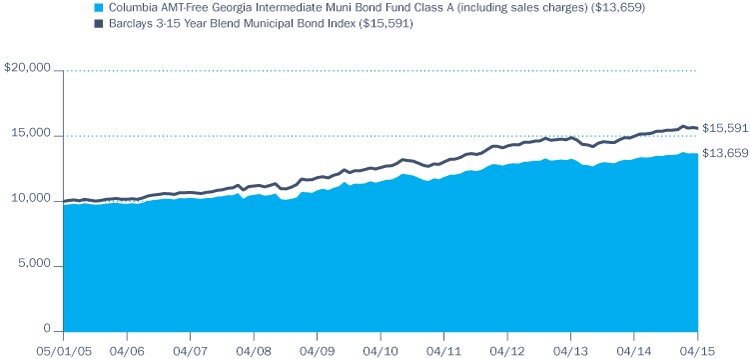
The chart above shows the change in value of a hypothetical $10,000 investment in Class A shares of Columbia AMT-Free Georgia Intermediate Muni Bond Fund during the stated time period, and does not reflect the deduction of taxes that a shareholder may pay on Fund distributions or on the redemption of Fund shares.
Annual Report 2015
3
COLUMBIA AMT-FREE GEORGIA INTERMEDIATE MUNI BOND FUND
MANAGER DISCUSSION OF FUND PERFORMANCE
Portfolio Management
Brian McGreevy
Quality Breakdown (%)
(at April 30, 2015) | |
AAA rating | | | 9.5 | | |
AA rating | | | 48.5 | | |
A rating | | | 34.3 | | |
BBB rating | | | 5.6 | | |
Not rated | | | 2.1 | | |
Total | | | 100.0 | | |
Percentages indicated are based upon total fixed income investments (excluding Money Market Funds).
Bond ratings apply to the underlying holdings of the Fund and not the Fund itself and are divided into categories ranging from highest to lowest credit quality, determined by using the middle rating of Moody's, S&P and Fitch, after dropping the highest and lowest available ratings. When ratings are available from only two rating agencies, the lower rating is used. When a rating is available from only one rating agency, that rating is used. When a bond is not rated by any rating agency, it is designated as "Not rated". Credit quality ratings assigned by a rating agency are subjective opinions, not statements of fact, and are subject to change, including daily. The ratings assigned by credit rating agencies are but one of the considerations that the Investment Manager and/or Fund's subadviser incorporates into its credit analysis process, along with such other issuer-specific factors as cash flows, capital structure and leverage ratios, ability to de-leverage (repay) through free cash flow, quality of management, market positioning and access to capital, as well as such security-specific factors as the terms of the security (e.g., interest rate, and time to maturity) and the amount and type of any collateral.
For the 12-month period that ended April 30, 2015, the Fund's Class A shares returned 2.98% excluding sales charges. Class Z shares of the Fund returned 3.24% for the same time period. The Fund's benchmark, the Barclays 3-15 Year Blend Municipal Bond Index, returned 3.76% during the 12-month period.
Market Overview
The U.S. municipal bond market generated positive performance during the past 12 months, with intermediate- and longer-term debt generating the best results. While short-term bonds were pressured by the possibility that the U.S. Federal Reserve may begin to increase interest rates before the end of 2015, longer term issues were aided by the environment of slow growth, low inflation and investors' continued search for yield. Lower rated investment-grade bonds — those rated A and BBB — delivered the best returns and soundly outperformed high-rated AAA debt. On a sector basis, hospital and transportation issues outperformed. State and local general obligation bonds, which tend to be higher quality, lagged the returns of revenue bonds during the period.
Beginning in the fourth quarter of 2014, the supply of new municipal issues began to increase. The number of current and advanced refundings jumped considerably, and that trend continued into 2015 as issuers took advantage of lower rates to refinance older, higher yielding bonds. This is positive for issuers' credit outlook, as it allows them to reduce their interest costs. For bond holders, however, the refundings often cause higher yielding bonds to be called away from their portfolios, with the proceeds needing to be reinvested in lower yielding securities. Supply expectations for 2015 had risen to $400 billion by the close of the period, with the largest increase in refunding volume. On the demand side, continued flows into municipal bond funds provided firm support for the market throughout the past year.
A Robust Economy, but an Underperforming Market
Georgia's economy performed well during the past 12 months, highlighted by stronger-than-expected growth in the labor market. While the state's unemployment rate remains above the national average, it is declining rapidly — a development that has led to higher average hourly earnings. Strength in the manufacturing sector and robust population growth also have provided support for the state's economy. Still, Georgia's municipal bond market underperformed during the period due to the higher credit quality of local and state general obligation bonds. Georgia's debt is AAA rated, and many of the large municipalities are rated AA2 or higher. At a time in which lower quality bonds outperformed, Georgia's higher credit quality was a headwind to relative performance.
Contributors and Detractors
The Fund underperformed its benchmark for the period. The Fund's shorter duration profile (its lower interest-rates sensitivity relative to the benchmark) hindered performance, as did its exposure to shorter maturity bonds. Short-term bonds lagged on a price basis, and their low yields were insufficient to overcome this shortfall. The Fund's heavier exposure
Annual Report 2015
4
COLUMBIA AMT-FREE GEORGIA INTERMEDIATE MUNI BOND FUND
MANAGER DISCUSSION OF FUND PERFORMANCE (continued)
to bonds with maturities between zero and three years detracted from performance, as this area of the yield curve produced the lowest returns. We sought to decrease the shorter exposure during the period, while adding bonds with longer maturities to maintain a neutral duration.
In terms of credit quality, we emphasized lower rated investment-grade credits, primarily those rated A and BBB. The Fund was underweight the three highest rating categories (AAA, AA1, and AA2), which helped performance since higher quality bonds generated the lowest returns during the period. In addition, the A and BBB rated bonds in the portfolio generated higher results than the corresponding index components.
Revenue bonds outperformed general obligation debt during the year. Within the Fund, the hospital, transportation and education sectors added to returns, while water and sewer bonds detracted from performance. The Fund's positions in pre-refunded bonds did well over the period. Pre-refunded bonds typically feature higher quality and shorter maturities than the market as a whole, both of which are traits that could have hurt their performance in the environment of the past year. However, several bonds the Fund owned were refinanced during the period, and the price appreciation from the refunding added to results.
Fund Positioning
We continue to emphasize A and BBB rated issues at this time for the additional income they offer. While yield spreads in these credit tiers have tightened considerably (meaning that investors are being paid less for the associated risks), we currently believe they still offer the most compelling relative value. We continue to favor hospitals and transportation issues at this time, but we have become more cautious with regard to smaller private schools in the higher education sector, as we do not feel the yields compensate investors for the risks in this area with lower enrollment pressuring some schools.
Investment risks
Fixed-income securities present issuer default risk. The Fund invests substantially in municipal securities and will be affected by tax, legislative, regulatory, demographic or political changes, as well as changes impacting a state's financial, economic or other conditions. A relatively small number of tax-exempt issuers may necessitate the Fund investing more heavily in a single issuer and, therefore, be more exposed to the risk of loss than a fund that invests more broadly. The value of the Fund's portfolio may be more volatile than a more geographically diversified fund. Prepayment and extension risk exists as a loan, bond or other investment may be called, prepaid or redeemed before maturity and that similar yielding investments may not be available for purchase. A rise in interest rates may result in a price decline of fixed-income instruments held by the Fund, negatively impacting its performance and NAV. Falling rates may result in the Fund investing in lower yielding debt instruments, lowering the Fund's income and yield. These risks may be heightened for longer maturity and duration securities. Non-investment-grade (high-yield or junk) securities present greater price volatility and more risk to principal and income than higher rated securities. Market risk may affect a single issuer, sector of the economy, industry or the market as a whole. Federal and state tax rules apply to capital gain distributions and any gains or losses on sales. Income may be subject to state or local taxes. Liquidity risk is associated with the difficulty of selling underlying investments at a desirable time or price. See the Fund's prospectus for information on these and other risks.
Annual Report 2015
5
COLUMBIA AMT-FREE GEORGIA INTERMEDIATE MUNI BOND FUND
UNDERSTANDING YOUR FUND'S EXPENSES
(Unaudited)
As an investor, you incur two types of costs. There are transaction costs, which generally include sales charges on purchases and may include redemption fees. There are also ongoing costs, which generally include management fees, distribution and/or service fees, and other fund expenses. The following information is intended to help you understand your ongoing costs (in dollars) of investing in the Fund and to help you compare these costs with the ongoing costs of investing in other mutual funds.
Analyzing Your Fund's Expenses
To illustrate these ongoing costs, we have provided examples and calculated the expenses paid by investors in each share class of the Fund during the period. The actual and hypothetical information in the table is based on an initial investment of $1,000 at the beginning of the period indicated and held for the entire period. Expense information is calculated two ways and each method provides you with different information. The amount listed in the "Actual" column is calculated using the Fund's actual operating expenses and total return for the period. You may use the Actual information, together with the amount invested, to estimate the expenses that you paid over the period. Simply divide your account value by $1,000 (for example, an $8,600 account value divided by $1,000 = 8.6), then multiply the results by the expenses paid during the period under the "Actual" column. The amount listed in the "Hypothetical" column assumes a 5% annual rate of return before expenses (which is not the Fund's actual return) and then applies the Fund's actual expense ratio for the period to the hypothetical return. You should not use the hypothetical account values and expenses to estimate either your actual account balance at the end of the period or the expenses you paid during the period. See "Compare With Other Funds" below for details on how to use the hypothetical data.
Compare With Other Funds
Since all mutual funds are required to include the same hypothetical calculations about expenses in shareholder reports, you can use this information to compare the ongoing cost of investing in the Fund with other funds. To do so, compare the hypothetical example with the 5% hypothetical examples that appear in the shareholder reports of other funds. As you compare hypothetical examples of other funds, it is important to note that hypothetical examples are meant to highlight the ongoing costs of investing in a fund only and do not reflect any transaction costs, such as sales charges, or redemption or exchange fees. Therefore, the hypothetical calculations are useful in comparing ongoing costs only, and will not help you determine the relative total costs of owning different funds. If transaction costs were included in these calculations, your costs would be higher.
November 1, 2014 – April 30, 2015
| | | Account Value at the Beginning
of the Period ($) | | Account Value at the End of the
Period ($) | | Expenses Paid During the
Period ($) | | Fund's Annualized
Expense Ratio (%) | |
| | | Actual | | Hypothetical | | Actual | | Hypothetical | | Actual | | Hypothetical | | Actual | |
Class A | | | 1,000.00 | | | | 1,000.00 | | | | 1,008.50 | | | | 1,020.78 | | | | 4.03 | | | | 4.06 | | | | 0.81 | | |
Class B | | | 1,000.00 | | | | 1,000.00 | | | | 1,004.80 | | | | 1,017.06 | | | | 7.75 | | | | 7.80 | | | | 1.56 | | |
Class C | | | 1,000.00 | | | | 1,000.00 | | | | 1,004.80 | | | | 1,017.06 | | | | 7.75 | | | | 7.80 | | | | 1.56 | | |
Class R4 | | | 1,000.00 | | | | 1,000.00 | | | | 1,009.80 | | | | 1,022.02 | | | | 2.79 | | | | 2.81 | | | | 0.56 | | |
Class Z | | | 1,000.00 | | | | 1,000.00 | | | | 1,009.80 | | | | 1,022.02 | | | | 2.79 | | | | 2.81 | | | | 0.56 | | |
Expenses paid during the period are equal to the annualized expense ratio for each class as indicated above, multiplied by the average account value over the period and then multiplied by the number of days in the Fund's most recent fiscal half year and divided by 365.
Expenses do not include fees and expenses incurred indirectly by the Fund from its investment in underlying funds, including affiliated and non-affiliated pooled investment vehicles, such as mutual funds and exchange-traded funds.
Had Columbia Management Investment Advisers, LLC and/or certain of its affiliates not waived/reimbursed certain fees and expenses, account value at the end of the period would have been reduced.
Annual Report 2015
6
COLUMBIA AMT-FREE GEORGIA INTERMEDIATE MUNI BOND FUND
PORTFOLIO OF INVESTMENTS
April 30, 2015
(Percentages represent value of investments compared to net assets)
Municipal Bonds 98.2%
Issue
Description | | Coupon
Rate | | Principal
Amount ($) | | Value ($) | |
AIRPORT 3.6% | |
City of Atlanta Department of Aviation
Refunding Revenue Bonds
General
Series 2010C
01/01/25 | | | 5.000 | % | | | 1,500,000 | | | | 1,720,950 | | |
Revenue Bonds
Series 2012B
01/01/27 | | | 5.000 | % | | | 1,000,000 | | | | 1,142,110 | | |
Total | | | | | | | 2,863,060 | | |
HIGHER EDUCATION 14.7% | |
Athens Housing Authority
Refunding Revenue Bonds
UGAREF East Campus Housing
Series 2011
12/01/25 | | | 5.000 | % | | | 1,000,000 | | | | 1,145,470 | | |
Bleckley County & Dodge County Joint Development Authority
Revenue Bonds
Middle Georgia College
Series 2008
07/01/21 | | | 5.000 | % | | | 1,260,000 | | | | 1,383,493 | | |
Bulloch County Development Authority
Refunding Revenue Bonds
Georgia Southern University Housing Foundation
Series 2012 (AGM)
08/01/27 | | | 5.000 | % | | | 500,000 | | | | 568,945 | | |
Revenue Bonds
Georgia Southern University Housing Foundation
Series 2008 (AGM)
07/01/20 | | | 5.250 | % | | | 1,000,000 | | | | 1,122,780 | | |
Carrollton Payroll Development Authority
Refunding Revenue Bonds
Anticipation Certificates – UWG Campus Center
Series 2012 (AGM)
08/01/25 | | | 5.000 | % | | | 1,225,000 | | | | 1,417,937 | | |
DeKalb Newton & Gwinnett Counties Joint Development Authority
Revenue Bonds
GGC Foundation LLC Project
Series 2009
07/01/24 | | | 5.500 | % | | | 2,500,000 | | | | 2,826,350 | | |
Fulton County Development Authority
Refunding Revenue Bonds
Spelman College
Series 2015
06/01/32 | | | 5.000 | % | | | 1,000,000 | | | | 1,131,060 | | |
Richmond County Development Authority
Refunding Revenue Bonds
ASU Jaguar Student Housing
Series 2012 (AGM)
02/01/27 | | | 5.000 | % | | | 750,000 | | | | 861,187 | | |
Municipal Bonds (continued)
Issue
Description | | Coupon
Rate | | Principal
Amount ($) | | Value ($) | |
Georgia Regents University Cancer Center
Series 2014 (AGM)
12/15/32 | | | 5.000 | % | | | 425,000 | | | | 484,904 | | |
South Regional Joint Development Authority
Revenue Bonds
VSU Auxiliary Services-Student
Series 2008A
08/01/23 | | | 5.000 | % | | | 625,000 | | | | 695,588 | | |
Total | | | | | | | 11,637,714 | | |
HOSPITAL 7.6% | |
Cobb County Kennestone Hospital Authority
Revenue Bonds
Certificates
Series 2005B (AMBAC)
04/01/16 | | | 4.000 | % | | | 1,110,000 | | | | 1,145,697 | | |
DeKalb Private Hospital Authority
Revenue Bonds
Children's Healthcare
Series 2009
11/15/17 | | | 5.000 | % | | | 320,000 | | | | 351,981 | | |
Fayette County Hospital Authority
Revenue Bonds
Fayette Community Hospital
Series 2009A
06/15/23 | | | 5.250 | % | | | 2,000,000 | | | | 2,274,860 | | |
Gwinnett County Hospital Authority
Revenue Bonds
Gwinnet Hospital System
Series 2007A (AGM)
07/01/23 | | | 5.000 | % | | | 2,000,000 | | | | 2,220,620 | | |
Total | | | | | | | 5,993,158 | | |
JOINT POWER AUTHORITY 3.6% | |
Municipal Electric Authority of Georgia
Revenue Bonds
Project One
Subordinated Series 2008A
01/01/21 | | | 5.250 | % | | | 1,395,000 | | | | 1,649,950 | | |
Subordinated Series 2008D
01/01/23 | | | 6.000 | % | | | 1,000,000 | | | | 1,154,600 | | |
Total | | | | | | | 2,804,550 | | |
LOCAL APPROPRIATION 5.9% | |
Atlanta Public Safety & Judicial Facilities Authority
Revenue Bonds
Public Safety Facility Project
Series 2006 (AGM)
12/01/17 | | | 5.000 | % | | | 1,310,000 | | | | 1,406,482 | | |
The accompanying Notes to Financial Statements are an integral part of this statement.
Annual Report 2015
7
COLUMBIA AMT-FREE GEORGIA INTERMEDIATE MUNI BOND FUND
PORTFOLIO OF INVESTMENTS (continued)
April 30, 2015
Municipal Bonds (continued)
Issue
Description | | Coupon
Rate | | Principal
Amount ($) | | Value ($) | |
Fulton County Facilities Corp.
Certificate of Participation
Fulton County Public Purpose Project
Series 2009
11/01/17 | | | 5.000 | % | | | 1,000,000 | | | | 1,095,300 | | |
Winder-Barrow Industrial Building Authority
Refunding Revenue Bonds
City of Winder Project
Series 2012 (AGM)
12/01/24 | | | 5.000 | % | | | 1,900,000 | | | | 2,188,914 | | |
Total | | | | | | | 4,690,696 | | |
LOCAL GENERAL OBLIGATION 17.4% | |
Atlanta Solid Waste Management Authority
Refunding Revenue Bonds
Series 2008 (AGM)
12/01/17 | | | 5.000 | % | | | 795,000 | | | | 879,524 | | |
Cherokee County Board of Education
Unlimited General Obligation Bonds
Series 2009A
08/01/22 | | | 5.000 | % | | | 2,000,000 | | | | 2,302,980 | | |
Series 2014A
08/01/30 | | | 5.000 | % | | | 1,000,000 | | | | 1,179,980 | | |
Series 2015
02/01/26 | | | 5.000 | % | | | 1,000,000 | | | | 1,218,600 | | |
City of Atlanta
Unlimited General Obligation Refunding Bonds
Series 2014A
12/01/26 | | | 5.000 | % | | | 500,000 | | | | 602,440 | | |
College Park Business & Industrial Development Authority
Refunding Revenue Bonds
Civic Center Project
Series 2005 (AMBAC)
09/01/19 | | | 5.250 | % | | | 1,000,000 | | | | 1,062,440 | | |
Forsyth County School District
Unlimited General Obligation Bonds
Series 2014
02/01/28 | | | 5.000 | % | | | 1,000,000 | | | | 1,199,160 | | |
Gwinnett County School District
Unlimited General Obligation Refunding Bonds
Series 2010
02/01/24 | | | 5.000 | % | | | 1,500,000 | | | | 1,864,035 | | |
Savannah-Chatham County School District
Unlimited General Obligation Refunding Bonds
Series 2004 (AGM)
08/01/19 | | | 5.250 | % | | | 2,000,000 | | | | 2,326,960 | | |
South Fulton Municipal Regional Water & Sewer Authority
Refunding Revenue Bonds
Series 2014
01/01/31 | | | 5.000 | % | | | 1,000,000 | | | | 1,124,010 | | |
Total | | | | | | | 13,760,129 | | |
Municipal Bonds (continued)
Issue
Description | | Coupon
Rate | | Principal
Amount ($) | | Value ($) | |
MULTI-FAMILY 1.3% | |
Cobb County Development Authority
Refunding Revenue Bonds
Kennesaw State University
Junior Subordinated Series 2014
07/15/29 | | | 5.000 | % | | | 980,000 | | | | 1,050,129 | | |
MUNICIPAL POWER 0.3% | |
Guam Power Authority
Refunding Revenue Bonds
Series 2012A (AGM)(a)
10/01/24 | | | 5.000 | % | | | 220,000 | | | | 260,630 | | |
PREPAID GAS 0.4% | |
Main Street Natural Gas, Inc.
Revenue Bonds
Series 2007A
09/15/19 | | | 5.250 | % | | | 295,000 | | | | 332,090 | | |
REFUNDED / ESCROWED 5.9% | |
Cobb County Development Authority
Prerefunded 07/15/17 Revenue Bonds
KSU Village Real Estate
Series 2007A (AMBAC)
07/15/27 | | | 5.250 | % | | | 2,250,000 | | | | 2,459,947 | | |
Gwinnett County School District
Prerefunded 02/01/18 Unlimited General Obligation Bonds
Series 2008
02/01/22 | | | 5.000 | % | | | 1,000,000 | | | | 1,108,460 | | |
State of Georgia
Prerefunded 12/01/17 Unlimited General Obligation Bonds
Series 2007G
12/01/20 | | | 5.000 | % | | | 1,000,000 | | | | 1,108,040 | | |
Total | | | | | | | 4,676,447 | | |
SALES TAX 1.2% | |
Metropolitan Atlanta Rapid Transit Authority
Refunding Revenue Bonds
3rd Indenture
Series 2014A
07/01/24 | | | 5.000 | % | | | 750,000 | | | | 903,113 | | |
SINGLE FAMILY 1.2% | |
Georgia Housing & Finance Authority
Revenue Bonds
Series 2014B-1
12/01/29 | | | 3.000 | % | | | 1,000,000 | | | | 976,820 | | |
SPECIAL NON PROPERTY TAX 5.8% | |
Cobb-Marietta Coliseum & Exhibit Hall Authority
Refunding Revenue Bonds
Series 2005 (NPFGC)
10/01/19 | | | 5.250 | % | | | 1,500,000 | | | | 1,704,840 | | |
The accompanying Notes to Financial Statements are an integral part of this statement.
Annual Report 2015
8
COLUMBIA AMT-FREE GEORGIA INTERMEDIATE MUNI BOND FUND
PORTFOLIO OF INVESTMENTS (continued)
April 30, 2015
Municipal Bonds (continued)
Issue
Description | | Coupon
Rate | | Principal
Amount ($) | | Value ($) | |
Metropolitan Atlanta Rapid Transit Authority
Refunding Revenue Bonds
Third Indenture
Series 2012A
07/01/30 | | | 5.000 | % | | | 1,500,000 | | | | 1,711,905 | | |
Territory of Guam
Revenue Bonds
Series 2011A(a)
01/01/31 | | | 5.000 | % | | | 300,000 | | | | 330,672 | | |
Virgin Islands Public Finance Authority
Refunding Revenue Bonds
Senior Lien
Series 2009B(a)
10/01/25 | | | 5.000 | % | | | 750,000 | | | | 827,318 | | |
Total | | | | | | | 4,574,735 | | |
SPECIAL PROPERTY TAX 4.4% | |
Atlanta & Fulton County Recreation Authority
Refunding Revenue Bonds
Park Improvement
Series 2014A
12/01/28 | | | 5.000 | % | | | 525,000 | | | | 613,526 | | |
12/01/33 | | | 5.000 | % | | | 1,000,000 | | | | 1,144,010 | | |
City of Atlanta
Refunding Tax Allocation Bonds
Atlanta Station Project
Series 2007 (AGM)
12/01/20 | | | 5.250 | % | | | 1,545,000 | | | | 1,687,696 | | |
Total | | | | | | | 3,445,232 | | |
STATE GENERAL OBLIGATION 2.9% | |
State of Georgia
Unlimited General Obligation Bonds
Series 2009D
05/01/23 | | | 5.000 | % | | | 2,000,000 | | | | 2,300,180 | | |
TRANSPORTATION 1.4% | |
Georgia State Road & Tollway Authority
Revenue Bonds
Federal Highway Grant
BAN Series 2009A
06/01/21 | | | 5.000 | % | | | 1,000,000 | | | | 1,140,270 | | |
TURNPIKE / BRIDGE / TOLL ROAD 0.8% | |
Georgia State Road & Tollway Authority
Revenue Bonds
I-75 S Express Lanes Project
Series 2014(b)(c)
06/01/24 | | | 0.000 | % | | | 1,000,000 | | | | 589,700 | | |
Municipal Bonds (continued)
Issue
Description | | Coupon
Rate | | Principal
Amount ($) | | Value ($) | |
WATER & SEWER 19.8% | |
Augusta Water & Sewerage
Refunding Revenue Bonds
Series 2007 (AGM)
10/01/21 | | | 5.000 | % | | | 1,000,000 | | | | 1,112,620 | | |
10/01/22 | | | 5.000 | % | | | 2,000,000 | | | | 2,223,800 | | |
City of Atlanta Water & Wastewater
Refunding Revenue Bonds
Series 2015
11/01/30 | | | 5.000 | % | | | 1,000,000 | | | | 1,168,900 | | |
Revenue Bonds
Series 2009B (AGM) | |
11/01/17 | | | 5.000 | % | | | 1,000,000 | | | | 1,103,930 | | |
City of Gainesville Water & Sewerage
Refunding Revenue Bonds
Series 2014
11/15/26 | | | 5.000 | % | | | 1,500,000 | | | | 1,820,310 | | |
County of DeKalb Water & Sewage
Refunding Revenue Bond
Series 2006B
10/01/21 | | | 5.250 | % | | | 2,000,000 | | | | 2,400,400 | | |
Jackson County Water & Sewer Authority
Revenue Bonds
Series 2006A (XLCA)
09/01/16 | | | 5.000 | % | | | 1,030,000 | | | | 1,076,360 | | |
Upper Oconee Basin Water Authority
Refunding Revenue Bonds
Series 2005 (NPFGC)
07/01/17 | | | 5.000 | % | | | 1,140,000 | | | | 1,241,984 | | |
07/01/22 | | | 5.000 | % | | | 1,000,000 | | | | 1,008,100 | | |
Villa Rica Public Facilities Authority
Refunding Revenue Bonds
Water & Sewer Project
Series 2015
03/01/31 | | | 5.000 | % | | | 750,000 | | | | 864,068 | | |
Walton County Water & Sewer Authority
Revenue Bonds
Hard Labor Creek Project
Series 2008 (AGM)
02/01/25 | | | 5.000 | % | | | 1,495,000 | | | | 1,643,244 | | |
Total | | | | | | | 15,663,716 | | |
Total Municipal Bonds
(Cost: $72,800,176) | | | | | | | 77,662,369 | | |
Total Investments
(Cost: $72,800,176) | | | | | | | 77,662,369 | | |
Other Assets & Liabilities, Net | | | | | | | 1,430,675 | | |
Net Assets | | | | | | | 79,093,044 | | |
The accompanying Notes to Financial Statements are an integral part of this statement.
Annual Report 2015
9
COLUMBIA AMT-FREE GEORGIA INTERMEDIATE MUNI BOND FUND
PORTFOLIO OF INVESTMENTS (continued)
April 30, 2015
Notes to Portfolio of Investments
(a) Municipal obligations include debt obligations issued by or on behalf of territories, possessions, or sovereign nations within the territorial boundaries of the United States. At April 30, 2015, the value of these securities amounted to $1,418,620 or 1.79% of net assets.
(b) Security exempt from registration pursuant to Rule 144A under the Securities Act of 1933. This security may be resold in transactions exempt from registration, normally to qualified institutional buyers. At April 30, 2015, the value of these securities amounted to $589,700 or 0.75% of net assets.
(c) Zero coupon bond.
Abbreviation Legend
AGM Assured Guaranty Municipal Corporation
AMBAC Ambac Assurance Corporation
BAN Bond Anticipation Note
NPFGC National Public Finance Guarantee Corporation
XLCA XL Capital Assurance
Fair Value Measurements
Generally accepted accounting principles (GAAP) require disclosure regarding the inputs and valuation techniques used to measure fair value and any changes in valuation inputs or techniques. In addition, investments shall be disclosed by major category.
The Fund categorizes its fair value measurements according to a three-level hierarchy that maximizes the use of observable inputs and minimizes the use of unobservable inputs by prioritizing that the most observable input be used when available. Observable inputs are those that market participants would use in pricing an investment based on market data obtained from sources independent of the reporting entity. Unobservable inputs are those that reflect the Fund's assumptions about the information market participants would use in pricing an investment. An investment's level within the fair value hierarchy is based on the lowest level of any input that is deemed significant to the asset or liability's fair value measurement. The input levels are not necessarily an indication of the risk or liquidity associated with investments at that level. For example, certain U.S. government securities are generally high quality and liquid, however, they are reflected as Level 2 because the inputs used to determine fair value may not always be quoted prices in an active market.
Fair value inputs are summarized in the three broad levels listed below:
> Level 1 — Valuations based on quoted prices for investments in active markets that the Fund has the ability to access at the measurement date (including NAV for open-end mutual funds). Valuation adjustments are not applied to Level 1 investments.
> Level 2 — Valuations based on other significant observable inputs (including quoted prices for similar securities, interest rates, prepayment speeds, credit risks, etc.).
> Level 3 — Valuations based on significant unobservable inputs (including the Fund's own assumptions and judgment in determining the fair value of investments).
Inputs that are used in determining fair value of an investment may include price information, credit data, volatility statistics, and other factors. These inputs can be either observable or unobservable. The availability of observable inputs can vary between investments, and is affected by various factors such as the type of investment, and the volume and level of activity for that investment or similar investments in the marketplace. The inputs will be considered by the Investment Manager, along with any other relevant factors in the calculation of an investment's fair value. The Fund uses prices and inputs that are current as of the measurement date, which may include periods of market dislocations. During these periods, the availability of prices and inputs may be reduced for many investments. This condition could cause an investment to be reclassified between the various levels within the hierarchy.
Investments falling into the Level 3 category are primarily supported by quoted prices from brokers and dealers participating in the market for those investments. However, these may be classified as Level 3 investments due to lack of market transparency and corroboration to support these quoted prices. Additionally, valuation models may be used as the pricing source for any remaining investments classified as Level 3. These models may rely on one or more significant unobservable inputs and/or significant assumptions by the Investment Manager. Inputs used in valuations may include, but are not limited to, financial statement analysis, capital account balances, discount rates and estimated cash flows, and comparable company data.
Under the direction of the Fund's Board of Trustees (the Board), the Investment Manager's Valuation Committee (the Committee) is responsible for overseeing the valuation procedures approved by the Board. The Committee consists of voting and non-voting members from various groups within the Investment Manager's organization, including operations and accounting, trading and investments, compliance, risk management and legal.
The accompanying Notes to Financial Statements are an integral part of this statement.
Annual Report 2015
10
COLUMBIA AMT-FREE GEORGIA INTERMEDIATE MUNI BOND FUND
PORTFOLIO OF INVESTMENTS (continued)
April 30, 2015
Fair Value Measurements (continued)
The Committee meets at least monthly to review and approve valuation matters, which may include a description of specific valuation determinations, data regarding pricing information received from approved pricing vendors and brokers and the results of Board-approved valuation control policies and procedures (the Policies). The Policies address, among other things, instances when market quotations are or are not readily available, including recommendations of third party pricing vendors and a determination of appropriate pricing methodologies; events that require specific valuation determinations and assessment of fair value techniques; securities with a potential for stale pricing, including those that are illiquid, restricted, or in default; and the effectiveness of third party pricing vendors, including periodic reviews of vendors. The Committee meets more frequently, as needed, to discuss additional valuation matters, which may include the need to review back-testing results, review time-sensitive information or approve related valuation actions. The Committee reports to the Board, with members of the Committee meeting with the Board at each of its regularly scheduled meetings to discuss valuation matters and actions during the period, similar to those described earlier.
For investments categorized as Level 3, the Committee monitors information similar to that described above, which may include: (i) data specific to the issuer or comparable issuers, (ii) general market or specific sector news and (iii) quoted prices and specific or similar security transactions. The Committee considers this data and any changes from prior periods in order to assess the reasonableness of observable and unobservable inputs, any assumptions or internal models used to value those securities and changes in fair value. This data is also used to corroborate, when available, information received from approved pricing vendors and brokers. Various factors impact the frequency of monitoring this information (which may occur as often as daily). However, the Committee may determine that changes to inputs, assumptions and models are not required as a result of the monitoring procedures performed.
The following table is a summary of the inputs used to value the Fund's investments at April 30, 2015:
Description | | Level 1
Quoted Prices in
Active Markets for
Identical Assets ($) | | Level 2
Other Significant
Observable
Inputs ($) | | Level 3
Significant
Unobservable
Inputs ($) | | Total ($) | |
Bonds | |
Municipal Bonds | | | — | | | | 77,662,369 | | | | — | | | | 77,662,369 | | |
Total Bonds | | | — | | | | 77,662,369 | | | | — | | | | 77,662,369 | | |
Total | | | — | | | | 77,662,369 | | | | — | | | | 77,662,369 | | |
See the Portfolio of Investments for all investment classifications not indicated in the table.
The Fund's assets assigned to the Level 2 input category are generally valued using the market approach, in which a security's value is determined through reference to prices and information from market transactions for similar or identical assets.
There were no transfers of financial assets between levels during the period.
The accompanying Notes to Financial Statements are an integral part of this statement.
Annual Report 2015
11
COLUMBIA AMT-FREE GEORGIA INTERMEDIATE MUNI BOND FUND
STATEMENT OF ASSETS AND LIABILITIES
April 30, 2015
Assets | |
Investments, at value | |
(identified cost $72,800,176) | | $ | 77,662,369 | | |
Cash | | | 576,696 | | |
Receivable for: | |
Capital shares sold | | | 218,132 | | |
Interest | | | 1,003,292 | | |
Expense reimbursement due from Investment Manager | | | 481 | | |
Prepaid expenses | | | 632 | | |
Total assets | | | 79,461,602 | | |
Liabilities | |
Payable for: | |
Capital shares purchased | | | 17,014 | | |
Dividend distributions to shareholders | | | 188,387 | | |
Investment management fees | | | 865 | | |
Distribution and/or service fees | | | 264 | | |
Transfer agent fees | | | 16,204 | | |
Administration fees | | | 151 | | |
Compensation of board members | | | 115,451 | | |
Accounting fees | | | 25,180 | | |
Other expenses | | | 5,042 | | |
Total liabilities | | | 368,558 | | |
Net assets applicable to outstanding capital stock | | $ | 79,093,044 | | |
Represented by | |
Paid-in capital | | $ | 73,891,176 | | |
Undistributed net investment income | | | 140,768 | | |
Accumulated net realized gain | | | 198,907 | | |
Unrealized appreciation (depreciation) on: | |
Investments | | | 4,862,193 | | |
Total — representing net assets applicable to outstanding capital stock | | $ | 79,093,044 | | |
The accompanying Notes to Financial Statements are an integral part of this statement.
Annual Report 2015
12
COLUMBIA AMT-FREE GEORGIA INTERMEDIATE MUNI BOND FUND
STATEMENT OF ASSETS AND LIABILITIES (continued)
April 30, 2015
Class A | |
Net assets | | $ | 20,060,406 | | |
Shares outstanding | | | 1,855,988 | | |
Net asset value per share | | $ | 10.81 | | |
Maximum offering price per share(a) | | $ | 11.14 | | |
Class B | |
Net assets | | $ | 163,284 | | |
Shares outstanding | | | 15,098 | | |
Net asset value per share | | $ | 10.81 | | |
Class C | |
Net assets | | $ | 4,612,417 | | |
Shares outstanding | | | 426,607 | | |
Net asset value per share | | $ | 10.81 | | |
Class R4 | |
Net assets | | $ | 220,320 | | |
Shares outstanding | | | 20,411 | | |
Net asset value per share | | $ | 10.79 | | |
Class Z | |
Net assets | | $ | 54,036,617 | | |
Shares outstanding | | | 4,999,578 | | |
Net asset value per share | | $ | 10.81 | | |
(a) The maximum offering price per share is calculated by dividing the net asset value per share by 1.0 minus the maximum sales charge of 3.00%.
The accompanying Notes to Financial Statements are an integral part of this statement.
Annual Report 2015
13
COLUMBIA AMT-FREE GEORGIA INTERMEDIATE MUNI BOND FUND
STATEMENT OF OPERATIONS
Year Ended April 30, 2015
Net investment income | |
Income: | |
Dividends | | $ | 49 | | |
Interest | | | 2,841,885 | | |
Total income | | | 2,841,934 | | |
Expenses: | |
Investment management fees | | | 312,006 | | |
Distribution and/or service fees | |
Class A | | | 44,187 | | |
Class B | | | 1,963 | | |
Class C | | | 40,880 | | |
Transfer agent fees | |
Class A | | | 36,225 | | |
Class B | | | 401 | | |
Class C | | | 8,383 | | |
Class R4 | | | 304 | | |
Class Z | | | 114,222 | | |
Administration fees | | | 54,601 | | |
Compensation of board members | | | 19,446 | | |
Custodian fees | | | 1,626 | | |
Printing and postage fees | | | 23,521 | | |
Registration fees | | | 18,028 | | |
Professional fees | | | 34,998 | | |
Other | | | 9,161 | | |
Total expenses | | | 719,952 | | |
Fees waived or expenses reimbursed by Investment Manager and its affiliates | | | (196,116 | ) | |
Total net expenses | | | 523,836 | | |
Net investment income | | | 2,318,098 | | |
Realized and unrealized gain (loss) — net | |
Net realized gain (loss) on: | |
Investments | | | 554,673 | | |
Net realized gain | | | 554,673 | | |
Net change in unrealized appreciation (depreciation) on: | |
Investments | | | (493,546 | ) | |
Net change in unrealized depreciation | | | (493,546 | ) | |
Net realized and unrealized gain | | | 61,127 | | |
Net increase in net assets resulting from operations | | $ | 2,379,225 | | |
The accompanying Notes to Financial Statements are an integral part of this statement.
Annual Report 2015
14
COLUMBIA AMT-FREE GEORGIA INTERMEDIATE MUNI BOND FUND
STATEMENT OF CHANGES IN NET ASSETS
| | | Year Ended
April 30,
2015 | | Year Ended
April 30,
2014 | |
Operations | |
Net investment income | | $ | 2,318,098 | | | $ | 2,570,596 | | |
Net realized gain (loss) | | | 554,673 | | | | (203,228 | ) | |
Net change in unrealized depreciation | | | (493,546 | ) | | | (2,737,552 | ) | |
Net increase (decrease) in net assets resulting from operations | | | 2,379,225 | | | | (370,184 | ) | |
Distributions to shareholders | |
Net investment income | |
Class A | | | (499,941 | ) | | | (494,521 | ) | |
Class B | | | (4,087 | ) | | | (4,493 | ) | |
Class C | | | (84,713 | ) | | | (83,246 | ) | |
Class R4 | | | (4,525 | ) | | | (142 | ) | |
Class Z | | | (1,724,830 | ) | | | (1,988,246 | ) | |
Net realized gains | |
Class A | | | (32,634 | ) | | | (113,251 | ) | |
Class B | | | (381 | ) | | | (1,381 | ) | |
Class C | | | (8,321 | ) | | | (25,243 | ) | |
Class R4 | | | (341 | ) | | | (16 | ) | |
Class Z | | | (110,861 | ) | | | (404,861 | ) | |
Total distributions to shareholders | | | (2,470,634 | ) | | | (3,115,400 | ) | |
Decrease in net assets from capital stock activity | | | (266,876 | ) | | | (16,253,048 | ) | |
Total decrease in net assets | | | (358,285 | ) | | | (19,738,632 | ) | |
Net assets at beginning of year | | | 79,451,329 | | | | 99,189,961 | | |
Net assets at end of year | | $ | 79,093,044 | | | $ | 79,451,329 | | |
Undistributed net investment income | | $ | 140,768 | | | $ | 140,766 | | |
The accompanying Notes to Financial Statements are an integral part of this statement.
Annual Report 2015
15
COLUMBIA AMT-FREE GEORGIA INTERMEDIATE MUNI BOND FUND
STATEMENT OF CHANGES IN NET ASSETS (continued)
| | | Year Ended April 30, 2015 | | Year Ended April 30, 2014 | |
| | | Shares | | Dollars ($) | | Shares | | Dollars ($) | |
Capital stock activity | |
Class A shares | |
Subscriptions(a) | | | 475,068 | | | | 5,176,385 | | | | 348,795 | | | | 3,717,506 | | |
Distributions reinvested | | | 30,975 | | | | 336,671 | | | | 37,421 | | | | 402,659 | | |
Redemptions | | | (196,429 | ) | | | (2,134,008 | ) | | | (758,732 | ) | | | (8,247,044 | ) | |
Net increase (decrease) | | | 309,614 | | | | 3,379,048 | | | | (372,516 | ) | | | (4,126,879 | ) | |
Class B shares | |
Subscriptions | | | 115 | | | | 1,250 | | | | 206 | | | | 2,213 | | |
Distributions reinvested | | | 262 | | | | 2,849 | | | | 297 | | | | 3,195 | | |
Redemptions(a) | | | (4,902 | ) | | | (53,170 | ) | | | (140 | ) | | | (1,507 | ) | |
Net increase (decrease) | | | (4,525 | ) | | | (49,071 | ) | | | 363 | | | | 3,901 | | |
Class C shares | |
Subscriptions | | | 169,429 | | | | 1,839,972 | | | | 61,401 | | | | 674,191 | | |
Distributions reinvested | | | 7,032 | | | | 76,451 | | | | 7,901 | | | | 84,936 | | |
Redemptions | | | (73,384 | ) | | | (796,797 | ) | | | (129,136 | ) | | | (1,384,926 | ) | |
Net increase (decrease) | | | 103,077 | | | | 1,119,626 | | | | (59,834 | ) | | | (625,799 | ) | |
Class R4 shares | |
Subscriptions | | | 16,598 | | | | 179,946 | | | | 3,189 | | | | 34,292 | | |
Distributions reinvested | | | 418 | | | | 4,533 | | | | 4 | | | | 42 | | |
Redemptions | | | (23 | ) | | | (247 | ) | | | — | | | | — | | |
Net increase | | | 16,993 | | | | 184,232 | | | | 3,193 | | | | 34,334 | | |
Class Z shares | |
Subscriptions | | | 736,716 | | | | 7,998,036 | | | | 447,121 | | | | 4,828,087 | | |
Distributions reinvested | | | 17,225 | | | | 187,236 | | | | 14,755 | | | | 158,690 | | |
Redemptions | | | (1,205,636 | ) | | | (13,085,983 | ) | | | (1,533,223 | ) | | | (16,525,382 | ) | |
Net decrease | | | (451,695 | ) | | | (4,900,711 | ) | | | (1,071,347 | ) | | | (11,538,605 | ) | |
Total net decrease | | | (26,536 | ) | | | (266,876 | ) | | | (1,500,141 | ) | | | (16,253,048 | ) | |
(a) Includes conversions of Class B shares to Class A shares, if any.
The accompanying Notes to Financial Statements are an integral part of this statement.
Annual Report 2015
16
COLUMBIA AMT-FREE GEORGIA INTERMEDIATE MUNI BOND FUND
The following tables are intended to help you understand the Fund's financial performance. Certain information reflects financial results for a single share of a class held for the periods shown. Per share net investment income (loss) amounts are calculated based on average shares outstanding during the period. Total return assumes reinvestment of all dividends and distributions, if any. Total return does not reflect payment of sales charges, if any. Total return and portfolio turnover are not annualized for periods of less than one year. The portfolio turnover rate is calculated without regard to purchase and sales transactions of short-term instruments and certain derivatives, if any. If such transactions were included, the Fund's portfolio turnover rate may be higher.
| | | Year Ended April 30, | | Year Ended March 31, | |
Class A | | 2015 | | 2014 | | 2013 | | 2012(a) | | 2012 | | 2011 | |
Per share data | |
Net asset value, beginning of period | | $ | 10.82 | | | $ | 11.21 | | | $ | 11.18 | | | $ | 11.09 | | | $ | 10.50 | | | $ | 10.58 | | |
Income from investment operations: | |
Net investment income | | | 0.31 | | | | 0.31 | | | | 0.31 | | | | 0.03 | | | | 0.33 | | | | 0.33 | | |
Net realized and unrealized gain (loss) | | | 0.01 | | | | (0.32 | ) | | | 0.04 | | | | 0.09 | | | | 0.59 | | | | (0.08 | ) | |
Total from investment operations | | | 0.32 | | | | (0.01 | ) | | | 0.35 | | | | 0.12 | | | | 0.92 | | | | 0.25 | | |
Less distributions to shareholders: | |
Net investment income | | | (0.31 | ) | | | (0.31 | ) | | | (0.31 | ) | | | (0.03 | ) | | | (0.33 | ) | | | (0.33 | ) | |
Net realized gains | | | (0.02 | ) | | | (0.07 | ) | | | (0.01 | ) | | | — | | | | — | | | | — | | |
Total distributions to shareholders | | | (0.33 | ) | | | (0.38 | ) | | | (0.32 | ) | | | (0.03 | ) | | | (0.33 | ) | | | (0.33 | ) | |
Net asset value, end of period | | $ | 10.81 | | | $ | 10.82 | | | $ | 11.21 | | | $ | 11.18 | | | $ | 11.09 | | | $ | 10.50 | | |
Total return | | | 2.98 | % | | | 0.02 | % | | | 3.16 | % | | | 1.05 | % | | | 8.85 | % | | | 2.35 | % | |
Ratios to average net assets(b) | |
Total gross expenses | | | 1.06 | % | | | 1.07 | % | | | 1.03 | % | | | 1.02 | %(c) | | | 1.04 | % | | | 0.99 | % | |
Total net expenses(d) | | | 0.81 | % | | | 0.81 | % | | | 0.81 | % | | | 0.80 | %(c) | | | 0.80 | %(e) | | | 0.80 | %(e) | |
Net investment income | | | 2.83 | % | | | 2.89 | % | | | 2.77 | % | | | 2.92 | %(c) | | | 2.99 | % | | | 3.09 | % | |
Supplemental data | |
Net assets, end of period (in thousands) | | $ | 20,060 | | | $ | 16,728 | | | $ | 21,517 | | | $ | 19,861 | | | $ | 19,563 | | | $ | 19,641 | | |
Portfolio turnover | | | 19 | % | | | 5 | % | | | 16 | % | | | 0 | % | | | 11 | % | | | 11 | % | |
Notes to Financial Highlights
(a) For the period from April 1, 2012 to April 30, 2012. During the period, the Fund's fiscal year end was changed from March 31 to April 30.
(b) In addition to the fees and expenses that the Fund bears directly, the Fund indirectly bears a pro rata share of the fees and expenses of any other funds in which it invests. Such indirect expenses are not included in the Fund's reported expense ratios.
(c) Annualized.
(d) Total net expenses include the impact of certain fee waivers/expense reimbursements made by the Investment Manager and certain of its affiliates, if applicable.
(e) The benefits derived from expense reductions had an impact of less than 0.01%.
The accompanying Notes to Financial Statements are an integral part of this statement.
Annual Report 2015
17
COLUMBIA AMT-FREE GEORGIA INTERMEDIATE MUNI BOND FUND
FINANCIAL HIGHLIGHTS (continued)
| | | Year Ended April 30, | | Year Ended March 31, | |
Class B | | 2015 | | 2014 | | 2013 | | 2012(a) | | 2012 | | 2011 | |
Per share data | |
Net asset value, beginning of period | | $ | 10.82 | | | $ | 11.22 | | | $ | 11.18 | | | $ | 11.10 | | | $ | 10.50 | | | $ | 10.58 | | |
Income from investment operations: | |
Net investment income | | | 0.23 | | | | 0.23 | | | | 0.23 | | | | 0.02 | | | | 0.24 | | | | 0.25 | | |
Net realized and unrealized gain (loss) | | | 0.01 | | | | (0.33 | ) | | | 0.05 | | | | 0.08 | | | | 0.60 | | | | (0.08 | ) | |
Total from investment operations | | | 0.24 | | | | (0.10 | ) | | | 0.28 | | | | 0.10 | | | | 0.84 | | | | 0.17 | | |
Less distributions to shareholders: | |
Net investment income | | | (0.23 | ) | | | (0.23 | ) | | | (0.23 | ) | | | (0.02 | ) | | | (0.24 | ) | | | (0.25 | ) | |
Net realized gains | | | (0.02 | ) | | | (0.07 | ) | | | (0.01 | ) | | | — | | | | — | | | | — | | |
Total distributions to shareholders | | | (0.25 | ) | | | (0.30 | ) | | | (0.24 | ) | | | (0.02 | ) | | | (0.24 | ) | | | (0.25 | ) | |
Net asset value, end of period | | $ | 10.81 | | | $ | 10.82 | | | $ | 11.22 | | | $ | 11.18 | | | $ | 11.10 | | | $ | 10.50 | | |
Total return | | | 2.21 | % | | | (0.82 | %) | | | 2.48 | % | | | 0.90 | % | | | 8.10 | % | | | 1.59 | % | |
Ratios to average net assets(b) | |
Total gross expenses | | | 1.81 | % | | | 1.83 | % | | | 1.78 | % | | | 1.77 | %(c) | | | 1.81 | % | | | 1.74 | % | |
Total net expenses(d) | | | 1.56 | % | | | 1.56 | % | | | 1.56 | % | | | 1.55 | %(c) | | | 1.55 | %(e) | | | 1.55 | %(e) | |
Net investment income | | | 2.09 | % | | | 2.15 | % | | | 2.04 | % | | | 2.17 | %(c) | | | 2.25 | % | | | 2.33 | % | |
Supplemental data | |
Net assets, end of period (in thousands) | | $ | 163 | | | $ | 212 | | | $ | 216 | | | $ | 373 | | | $ | 369 | | | $ | 528 | | |
Portfolio turnover | | | 19 | % | | | 5 | % | | | 16 | % | | | 0 | % | | | 11 | % | | | 11 | % | |
Notes to Financial Highlights
(a) For the period from April 1, 2012 to April 30, 2012. During the period, the Fund's fiscal year end was changed from March 31 to April 30.
(b) In addition to the fees and expenses that the Fund bears directly, the Fund indirectly bears a pro rata share of the fees and expenses of any other funds in which it invests. Such indirect expenses are not included in the Fund's reported expense ratios.
(c) Annualized.
(d) Total net expenses include the impact of certain fee waivers/expense reimbursements made by the Investment Manager and certain of its affiliates, if applicable.
(e) The benefits derived from expense reductions had an impact of less than 0.01%.
The accompanying Notes to Financial Statements are an integral part of this statement.
Annual Report 2015
18
COLUMBIA AMT-FREE GEORGIA INTERMEDIATE MUNI BOND FUND
FINANCIAL HIGHLIGHTS (continued)
| | | Year Ended April 30, | | Year Ended March 31, | |
Class C | | 2015 | | 2014 | | 2013 | | 2012(a) | | 2012 | | 2011 | |
Per share data | |
Net asset value, beginning of period | | $ | 10.82 | | | $ | 11.22 | | | $ | 11.18 | | | $ | 11.09 | | | $ | 10.50 | | | $ | 10.58 | | |
Income from investment operations: | |
Net investment income | | | 0.23 | | | | 0.23 | | | | 0.23 | | | | 0.02 | | | | 0.24 | | | | 0.25 | | |
Net realized and unrealized gain (loss) | | | 0.01 | | | | (0.33 | ) | | | 0.04 | | | | 0.09 | | | | 0.59 | | | | (0.08 | ) | |
Total from investment operations | | | 0.24 | | | | (0.10 | ) | | | 0.27 | | | | 0.11 | | | | 0.83 | | | | 0.17 | | |
Less distributions to shareholders: | |
Net investment income | | | (0.23 | ) | | | (0.23 | ) | | | (0.22 | ) | | | (0.02 | ) | | | (0.24 | ) | | | (0.25 | ) | |
Net realized gains | | | (0.02 | ) | | | (0.07 | ) | | | (0.01 | ) | | | — | | | | — | | | | — | | |
Total distributions to shareholders | | | (0.25 | ) | | | (0.30 | ) | | | (0.23 | ) | | | (0.02 | ) | | | (0.24 | ) | | | (0.25 | ) | |
Net asset value, end of period | | $ | 10.81 | | | $ | 10.82 | | | $ | 11.22 | | | $ | 11.18 | | | $ | 11.09 | | | $ | 10.50 | | |
Total return | | | 2.21 | % | | | (0.82 | %) | | | 2.48 | % | | | 0.99 | % | | | 8.00 | % | | | 1.59 | % | |
Ratios to average net assets(b) | |
Total gross expenses | | | 1.81 | % | | | 1.82 | % | | | 1.78 | % | | | 1.77 | %(c) | | | 1.78 | % | | | 1.74 | % | |
Total net expenses(d) | | | 1.56 | % | | | 1.56 | % | | | 1.56 | % | | | 1.55 | %(c) | | | 1.55 | %(e) | | | 1.55 | %(e) | |
Net investment income | | | 2.08 | % | | | 2.14 | % | | | 2.02 | % | | | 2.17 | %(c) | | | 2.23 | % | | | 2.34 | % | |
Supplemental data | |
Net assets, end of period (in thousands) | | $ | 4,612 | | | $ | 3,501 | | | $ | 4,301 | | | $ | 3,919 | | | $ | 4,066 | | | $ | 3,347 | | |
Portfolio turnover | | | 19 | % | | | 5 | % | | | 16 | % | | | 0 | % | | | 11 | % | | | 11 | % | |
Notes to Financial Highlights
(a) For the period from April 1, 2012 to April 30, 2012. During the period, the Fund's fiscal year end was changed from March 31 to April 30.
(b) In addition to the fees and expenses that the Fund bears directly, the Fund indirectly bears a pro rata share of the fees and expenses of any other funds in which it invests. Such indirect expenses are not included in the Fund's reported expense ratios.
(c) Annualized.
(d) Total net expenses include the impact of certain fee waivers/expense reimbursements made by the Investment Manager and certain of its affiliates, if applicable.
(e) The benefits derived from expense reductions had an impact of less than 0.01%.
The accompanying Notes to Financial Statements are an integral part of this statement.
Annual Report 2015
19
COLUMBIA AMT-FREE GEORGIA INTERMEDIATE MUNI BOND FUND
FINANCIAL HIGHLIGHTS (continued)
| | | Year Ended April 30, | |
Class R4 | | 2015 | | 2014 | | 2013(a) | |
Per share data | |
Net asset value, beginning of period | | $ | 10.80 | | | $ | 11.20 | | | $ | 11.12 | | |
Income from investment operations: | |
Net investment income | | | 0.33 | | | | 0.34 | | | | 0.04 | | |
Net realized and unrealized gain (loss) | | | 0.02 | | | | (0.33 | ) | | | 0.08 | | |
Total from investment operations | | | 0.35 | | | | 0.01 | | | | 0.12 | | |
Less distributions to shareholders: | |
Net investment income | | | (0.34 | ) | | | (0.34 | ) | | | (0.04 | ) | |
Net realized gains | | | (0.02 | ) | | | (0.07 | ) | | | — | | |
Total distributions to shareholders | | | (0.36 | ) | | | (0.41 | ) | | | (0.04 | ) | |
Net asset value, end of period | | $ | 10.79 | | | $ | 10.80 | | | $ | 11.20 | | |
Total return | | | 3.24 | % | | | 0.18 | % | | | 1.07 | % | |
Ratios to average net assets(b) | |
Total gross expenses | | | 0.81 | % | | | 0.88 | % | | | 0.72 | %(c) | |
Total net expenses(d) | | | 0.56 | % | | | 0.56 | % | | | 0.53 | %(c) | |
Net investment income | | | 3.09 | % | | | 3.21 | % | | | 3.12 | %(c) | |
Supplemental data | |
Net assets, end of period (in thousands) | | $ | 220 | | | $ | 37 | | | $ | 3 | | |
Portfolio turnover | | | 19 | % | | | 5 | % | | | 16 | % | |
Notes to Financial Highlights
(a) Based on operations from March 19, 2013 (commencement of operations) through the stated period end.
(b) In addition to the fees and expenses that the Fund bears directly, the Fund indirectly bears a pro rata share of the fees and expenses of any other funds in which it invests. Such indirect expenses are not included in the Fund's reported expense ratios.
(c) Annualized.
(d) Total net expenses include the impact of certain fee waivers/expense reimbursements made by the Investment Manager and certain of its affiliates, if applicable.
The accompanying Notes to Financial Statements are an integral part of this statement.
Annual Report 2015
20
COLUMBIA AMT-FREE GEORGIA INTERMEDIATE MUNI BOND FUND
FINANCIAL HIGHLIGHTS (continued)
| | | Year Ended April 30, | | Year Ended March 31, | |
Class Z | | 2015 | | 2014 | | 2013 | | 2012(a) | | 2012 | | 2011 | |
Per share data | |
Net asset value, beginning of period | | $ | 10.82 | | | $ | 11.22 | | | $ | 11.18 | | | $ | 11.09 | | | $ | 10.50 | | | $ | 10.58 | | |
Income from investment operations: | |
Net investment income | | | 0.34 | | | | 0.34 | | | | 0.34 | | | | 0.03 | | | | 0.35 | | | | 0.36 | | |
Net realized and unrealized gain (loss) | | | 0.01 | | | | (0.33 | ) | | | 0.05 | | | | 0.09 | | | | 0.59 | | | | (0.08 | ) | |
Total from investment operations | | | 0.35 | | | | 0.01 | | | | 0.39 | | | | 0.12 | | | | 0.94 | | | | 0.28 | | |
Less distributions to shareholders: | |
Net investment income | | | (0.34 | ) | | | (0.34 | ) | | | (0.34 | ) | | | (0.03 | ) | | | (0.35 | ) | | | (0.36 | ) | |
Net realized gains | | | (0.02 | ) | | | (0.07 | ) | | | (0.01 | ) | | | — | | | | — | | | | — | | |
Total distributions to shareholders | | | (0.36 | ) | | | (0.41 | ) | | | (0.35 | ) | | | (0.03 | ) | | | (0.35 | ) | | | (0.36 | ) | |
Net asset value, end of period | | $ | 10.81 | | | $ | 10.82 | | | $ | 11.22 | | | $ | 11.18 | | | $ | 11.09 | | | $ | 10.50 | | |
Total return | | | 3.24 | % | | | 0.18 | % | | | 3.51 | % | | | 1.07 | % | | | 9.08 | % | | | 2.61 | % | |
Ratios to average net assets(b) | |
Total gross expenses | | | 0.81 | % | | | 0.82 | % | | | 0.78 | % | | | 0.77 | %(c) | | | 0.79 | % | | | 0.74 | % | |
Total net expenses(d) | | | 0.56 | % | | | 0.56 | % | | | 0.56 | % | | | 0.55 | %(c) | | | 0.55 | %(e) | | | 0.55 | %(e) | |
Net investment income | | | 3.09 | % | | | 3.14 | % | | | 3.02 | % | | | 3.17 | %(c) | | | 3.24 | % | | | 3.34 | % | |
Supplemental data | |
Net assets, end of period (in thousands) | | $ | 54,037 | | | $ | 58,973 | | | $ | 73,154 | | | $ | 79,910 | | | $ | 79,371 | | | $ | 85,305 | | |
Portfolio turnover | | | 19 | % | | | 5 | % | | | 16 | % | | | 0 | % | | | 11 | % | | | 11 | % | |
Notes to Financial Highlights
(a) For the period from April 1, 2012 to April 30, 2012. During the period, the Fund's fiscal year end was changed from March 31 to April 30.
(b) In addition to the fees and expenses that the Fund bears directly, the Fund indirectly bears a pro rata share of the fees and expenses of any other funds in which it invests. Such indirect expenses are not included in the Fund's reported expense ratios.
(c) Annualized.
(d) Total net expenses include the impact of certain fee waivers/expense reimbursements made by the Investment Manager and certain of its affiliates, if applicable.
(e) The benefits derived from expense reductions had an impact of less than 0.01%.
The accompanying Notes to Financial Statements are an integral part of this statement.
Annual Report 2015
21
COLUMBIA AMT-FREE GEORGIA INTERMEDIATE MUNI BOND FUND
NOTES TO FINANCIAL STATEMENTS
April 30, 2015
Note 1. Organization
Columbia AMT-Free Georgia Intermediate Muni Bond Fund (formerly known as Columbia Georgia Intermediate Municipal Bond Fund) (the Fund), a series of Columbia Funds Series Trust (the Trust), is a diversified fund. The Trust is registered under the Investment Company Act of 1940, as amended (the 1940 Act), as an open-end management investment company organized as a Delaware statutory trust. Effective July 7, 2014, Columbia Georgia Intermediate Municipal Bond Fund was renamed Columbia AMT-Free Georgia Intermediate Muni Bond Fund.
Fund Shares
The Trust may issue an unlimited number of shares (without par value). The Fund offers Class A, Class B, Class C, Class R4 and Class Z shares. Although all share classes generally have identical voting, dividend and liquidation rights, each share class votes separately when required by the Trust's organizational documents or by law. Different share classes pay different distribution amounts to the extent the expenses of such share classes differ, and distributions in liquidation will be proportional to the net asset value of each share class. Each share class has its own expense structure and sales charges.
Class A shares are subject to a maximum front-end sales charge of 3.00% based on the initial investment amount. In addition, Class A shares purchased on or after February 19, 2015 are subject to a contingent deferred sales charge (CDSC) of 0.75% on certain investments of $500,000 or more if redeemed within 12 months after purchase. Redemptions of Class A shares purchased prior to February 19, 2015, without an initial sales charge in accounts aggregating $1 million to $50 million at the time of purchase, are subject to a CDSC of 1.00% if redeemed within 12 months after purchase, and 0.50% if redeemed more than 12, but less than 18, months after purchase.
Class B shares may be subject to a maximum CDSC of 3.00% based upon the holding period after purchase. Class B shares will generally convert to Class A shares eight years after purchase. The Fund no longer accepts investments by new or existing investors in the Fund's Class B shares, except in connection with the reinvestment of any dividend and/or capital gain distributions in Class B shares of the Fund and exchanges by existing Class B shareholders of certain other funds within the Columbia Family of Funds.
Class C shares are subject to a 1.00% CDSC on shares redeemed within one year after purchase.
Class R4 shares are not subject to sales charges and are generally available only to omnibus retirement plans and certain investors as described in the Fund's prospectus.
Class Z shares are not subject to sales charges and are available only to eligible investors, which are subject to different investment minimums as described in the Fund's prospectus.
Note 2. Summary of Significant Accounting Policies
Basis of Preparation
The Fund is an investment company that applies the accounting and reporting guidance in the Financial Accounting Standards Board (FASB) Accounting Standards Codification Topic 946, Financial Services — Investment Companies (ASC 946). The financial statements are prepared in accordance with U.S. generally accepted accounting principles (GAAP), which requires management to make certain estimates and assumptions that affect the reported amounts of assets and liabilities, the disclosure of contingent assets and liabilities at the date of the financial statements and the reported amounts of income and expenses during the reporting period. Actual results could differ from those estimates.
The following is a summary of significant accounting policies followed by the Fund in the preparation of its financial statements.
Security Valuation
Debt securities generally are valued by pricing services approved by the Board of Trustees (the Board) based upon market transactions for normal, institutional-size trading units of similar securities. The services may use various pricing techniques that take into account, as applicable, factors such as yield, quality, coupon rate, maturity, type of issue, trading characteristics and other data, as well as broker quotes. Debt securities for which quotations are readily available may also be valued based upon an over-the-counter or exchange bid quotation.
Investments for which market quotations are not readily available, or that have quotations which management believes are not reliable, are valued at fair value as determined in good faith under procedures established by and under the general supervision of the Board. If a
Annual Report 2015
22
COLUMBIA AMT-FREE GEORGIA INTERMEDIATE MUNI BOND FUND
NOTES TO FINANCIAL STATEMENTS (continued)
April 30, 2015
security or class of securities (such as foreign securities) is valued at fair value, such value is likely to be different from the quoted or published price for the security.
The determination of fair value often requires significant judgment. To determine fair value, management may use assumptions including but not limited to future cash flows and estimated risk premiums. Multiple inputs from various sources may be used to determine fair value.
Security Transactions
Security transactions are accounted for on the trade date. Cost is determined and gains (losses) are based upon the specific identification method for both financial statement and federal income tax purposes.
Income Recognition
Interest income is recorded on an accrual basis. Market premiums and discounts, including original issue discounts, are amortized and accreted, respectively, over the expected life of the security on all debt securities, unless otherwise noted.
The Fund may place a debt security on non-accrual status and reduce related interest income when it becomes probable that the interest will not be collected and the amount of uncollectible interest can be reasonably estimated. A defaulted debt security is removed from non-accrual status when the issuer resumes interest payments or when collectability of interest is reasonably assured.
Dividend income is recorded on the ex-dividend date.
Expenses
General expenses of the Trust are allocated to the Fund and other funds of the Trust based upon relative net assets or other expense allocation methodologies determined by the nature of the expense. Expenses directly attributable to the Fund are charged to the Fund. Expenses directly attributable to a specific class of shares are charged to that share class.
Determination of Class Net Asset Value
All income, expenses (other than class-specific expenses, which are charged to that share class, as shown in the Statement of Operations) and realized and unrealized gains (losses) are allocated to each class of the Fund on a daily basis, based on the relative net assets of each class, for purposes of determining the net asset value of each class.
Federal Income Tax Status
The Fund intends to qualify each year as a regulated investment company under Subchapter M of the Internal Revenue Code, as amended, and will distribute substantially all of its tax exempt and taxable income (including net short-term capital gains), if any, for its tax year, and as such will not be subject to federal income taxes. In addition, the Fund intends to distribute in each calendar year substantially all of its net investment income, capital gains and certain other amounts, if any, such that the Fund should not be subject to federal excise tax. Therefore, no federal income or excise tax provision is recorded.
Distributions to Shareholders
Distributions from net investment income, if any, are declared daily and paid monthly. Net realized capital gains, if any, are distributed at least annually. Income distributions and capital gain distributions are determined in accordance with federal income tax regulations, which may differ from GAAP.
Guarantees and Indemnifications
Under the Trust's organizational documents and, in some cases, by contract, its officers and trustees are indemnified against certain liabilities arising out of the performance of their duties to the Trust or its funds. In addition, certain of the Fund's contracts with its service providers contain general indemnification clauses. The Fund's maximum exposure under these arrangements is unknown since the amount of any future claims that may be made against the Fund cannot be determined, and the Fund has no historical basis for predicting the likelihood of any such claims.
Note 3. Fees and Compensation Paid to Affiliates
Investment Management Fees
Under an Investment Management Services Agreement, Columbia Management Investment Advisers, LLC (the Investment Manager), a wholly-owned subsidiary of Ameriprise Financial, Inc. (Ameriprise Financial), determines which securities will be purchased, held or sold. The investment management fee is an annual fee that is equal to a percentage of the Fund's average daily net assets that declines from 0.40% to 0.27% as the Fund's net assets increase. The effective investment management fee rate for the year ended April 30, 2015 was 0.40% of the Fund's average daily net assets.
Annual Report 2015
23
COLUMBIA AMT-FREE GEORGIA INTERMEDIATE MUNI BOND FUND
NOTES TO FINANCIAL STATEMENTS (continued)
April 30, 2015
Administration Fees
Under an Administrative Services Agreement, the Investment Manager also serves as the Fund Administrator. The Fund pays the Fund Administrator an annual fee for administration and accounting services equal to a percentage of the Fund's average daily net assets that declines from 0.07% to 0.04% as the Fund's net assets increase. The effective administration fee rate for the year ended April 30, 2015 was 0.07% of the Fund's average daily net assets.
Other Expenses
Other expenses are for, among other things, miscellaneous expenses of the Fund or the Board, including payments to a company providing limited administrative services to the Fund and the Board. That company's expenses include boardroom and office expense, employee compensation, employee health and retirement benefits, and certain other expenses. For the year ended April 30, 2015, other expenses paid by the Fund to this company were $1,263.
Compensation of Board Members
Board members are compensated for their services to the Fund as disclosed in the Statement of Operations. Under a Deferred Compensation Plan (the Plan), the Board members who are not "interested persons" of the Fund, as defined under the 1940 Act, may elect to defer payment of up to 100% of their compensation. Deferred amounts are treated as though equivalent dollar amounts had been invested in shares of certain funds managed by the Investment Manager. The Fund's liability for these amounts is adjusted for market value changes and remains in the Fund until distributed in accordance with the Plan.
Transfer Agent Fees
Under a Transfer and Dividend Disbursing Agent Agreement, Columbia Management Investment Services Corp. (the Transfer Agent), an affiliate of the Investment Manager and a wholly-owned subsidiary of Ameriprise Financial, is responsible for providing transfer agency services to the Fund. The Transfer Agent has contracted with Boston Financial Data Services (BFDS) to serve as sub-transfer agent.
Effective November 1, 2014, the Transfer Agent receives a monthly transfer agency fee based on the number or the average value of accounts, depending on the type of account. Prior to November 1, 2014, the Transfer Agent received a monthly account-based service fee based on
the number of open accounts. In addition, the Transfer Agent also receives sub-transfer agency fees based on a percentage of the average aggregate value of the Fund's shares maintained in omnibus accounts (other than omnibus accounts for which American Enterprise Investment Services Inc. is the broker of record or accounts where the beneficial shareholder is a customer of Ameriprise Financial Services, Inc., for which the Transfer Agent receives a per account fee). The Transfer Agent pays the fees of BFDS for services as sub-transfer agent and is not entitled to reimbursement for such fees from the Fund (with the exception of out-of-pocket fees).
The Transfer Agent also receives compensation from the Fund for various shareholder services and reimbursements for certain out-of-pocket fees.
For the year ended April 30, 2015, the Fund's effective transfer agent fee rates as a percentage of average daily net assets of each class were as follows:
Class A | | | 0.20 | % | |
Class B | | | 0.20 | | |
Class C | | | 0.21 | | |
Class R4 | | | 0.21 | | |
Class Z | | | 0.20 | | |
An annual minimum account balance fee of $20 may apply to certain accounts with a value below the applicable share class's initial minimum investment requirements to reduce the impact of small accounts on transfer agent fees. These minimum account balance fees are remitted to the Fund and recorded as part of expense reductions in the Statement of Operations. For the year ended April 30, 2015, no minimum account balance fees were charged by the Fund.
Distribution and Service Fees
The Fund has an agreement with Columbia Management Investment Distributors, Inc. (the Distributor), an affiliate of the Investment Manager and a wholly-owned subsidiary of Ameriprise Financial, for distribution and shareholder services. The Board has approved, and the Fund has adopted, distribution and shareholder service plans (the Plans) applicable to certain share classes, which set the distribution and service fees for the Fund. These fees are calculated daily and are intended to compensate the Distributor and/or eligible selling and/or servicing agents for selling shares of the Fund and providing services to investors.
Under the Plans, the Fund pays a monthly combined distribution and service fee to the Distributor at the
Annual Report 2015
24
COLUMBIA AMT-FREE GEORGIA INTERMEDIATE MUNI BOND FUND
NOTES TO FINANCIAL STATEMENTS (continued)
April 30, 2015
maximum annual rate of 0.25% of the average daily net assets attributable to Class A shares of the Fund. Also under the Plans, the Fund pays a monthly service fee at the maximum annual rate of 0.25% of the average daily net assets attributable to Class B and Class C shares of the Fund and the payment of a monthly distribution fee at the maximum annual rate of 0.75% of the average daily net assets attributable to Class B and Class C shares of the Fund.
Sales Charges
Sales charges, including front-end charges and CDSCs, received by the Distributor for distributing Fund shares were $7,306 for Class A and $95 for Class C shares for the year ended April 30, 2015.
Expenses Waived/Reimbursed by the Investment Manager and its Affiliates
The Investment Manager and certain of its affiliates have contractually agreed to waive fees and/or reimburse expenses (excluding certain fees and expenses described below) for the period disclosed below, unless sooner terminated at the sole discretion of the Board, so that the Fund's net operating expenses, after giving effect to fees waived/expenses reimbursed and any balance credits and/or overdraft charges from the Fund's custodian, do not exceed the following annual rates as a percentage of the class' average daily net assets:
| | | Fee Rates
Contractual
through
August 31, 2015 | |
Class A | | | 0.81 | % | |
Class B | | | 1.56 | | |
Class C | | | 1.56 | | |
Class R4 | | | 0.56 | | |
Class Z | | | 0.56 | | |
Under the agreement governing these fee waivers and/or expense reimbursement arrangements, the following fees and expenses are excluded from the waiver/reimbursement commitment, and therefore will be paid by the Fund, if applicable: taxes (including foreign transaction taxes), expenses associated with investments in affiliated and non-affiliated pooled investment vehicles (including mutual funds and exchange-traded funds), transaction costs and brokerage commissions, costs related to any securities lending program, dividend expenses associated with securities sold short, inverse floater program fees and expenses,
transaction charges and interest on borrowed money, interest, extraordinary expenses and any other expenses the exclusion of which is specifically approved by the Board. Any fees waived and/or expenses reimbursed under the expense reimbursement arrangements described above are not recoverable by the Investment Manager or its affiliates in future periods. This agreement may be modified or amended only with approval from all parties.
Note 4. Federal Tax Information
The timing and character of income and capital gain distributions are determined in accordance with income tax regulations, which may differ from GAAP because of temporary or permanent book to tax differences.
At April 30, 2015, these differences are primarily due to differing treatment for Trustees' deferred compensation and distributions. To the extent these differences are permanent, reclassifications are made among the components of the Fund's net assets in the Statement of Assets and Liabilities. Temporary differences do not require reclassifications. In the Statement of Assets and Liabilities the following reclassifications were made:
The Fund did not have any permanent differences; therefore, no reclassifications were made to the Statement of Assets and Liabilities.
The tax character of distributions paid during the years indicated was as follows:
Year Ended April 30, | | 2015 | | 2014 | |
Ordinary income | | $ | — | | | $ | 8,960 | | |
Long-term capital gains | | | 152,538 | | | | 510,808 | | |
Tax-exempt income | | | 2,318,096 | | | | 2,595,632 | | |
Total | | $ | 2,470,634 | | | $ | 3,115,400 | | |
Short-term capital gain distributions, if any, are considered ordinary income distributions for tax purposes.
At April 30, 2015, the components of distributable earnings on a tax basis were as follows:
Undistributed tax-exempt income | | $ | 443,964 | | |
Undistributed long-term capital gains | | | 198,907 | | |
Net unrealized appreciation | | | 4,862,193 | | |
At April 30, 2015, the cost of investments for federal income tax purposes was $72,800,176 and the
Annual Report 2015
25
COLUMBIA AMT-FREE GEORGIA INTERMEDIATE MUNI BOND FUND
NOTES TO FINANCIAL STATEMENTS (continued)
April 30, 2015
aggregate gross unrealized appreciation and depreciation based on that cost was:
Unrealized appreciation | | $ | 5,023,695 | | |
Unrealized depreciation | | | (161,502 | ) | |
Net unrealized appreciation | | $ | 4,862,193 | | |
For the year ended April 30, 2015, $203,228 of capital loss carryforward was utilized.
Management of the Fund has concluded that there are no significant uncertain tax positions in the Fund that would require recognition in the financial statements. However, management's conclusion may be subject to review and adjustment at a later date based on factors including, but not limited to, new tax laws, regulations, and administrative interpretations (including relevant court decisions). Generally, the Fund's federal tax returns for the prior three fiscal years remain subject to examination by the Internal Revenue Service.
Note 5. Portfolio Information
The cost of purchases and proceeds from sales of securities, excluding short-term investments and derivatives, if any, aggregated to $15,798,143 and $14,455,096, respectively, for the year ended April 30, 2015. The amount of purchase and sale activity impacts the portfolio turnover rate reported in the Financial Highlights.
Note 6. Shareholder Concentration
At April 30, 2015, one unaffiliated shareholder of record owned 68.8% of the outstanding shares of the Fund in one or more accounts. The Fund has no knowledge about whether any portion of those shares was owned beneficially. Subscription and redemption activity by concentrated accounts may have a significant effect on the operations of the Fund.
Note 7. Line of Credit
The Fund has entered into a revolving credit facility with a syndicate of banks led by JPMorgan Chase Bank, N.A. whereby the Fund may borrow for the temporary funding of shareholder redemptions or for other temporary or emergency purposes. Pursuant to a December 9, 2014 amendment, the credit facility agreement, which is a collective agreement between the Fund and certain other funds managed by the Investment Manager, severally and not jointly, permits collective borrowings up to $550 million. Interest is charged to each participating fund based on its borrowings at a rate equal to the higher of (i) the overnight federal funds rate plus 1.00% or (ii) the
one-month LIBOR rate plus 1.00%. Each borrowing under the credit facility matures no later than 60 days after the date of borrowing. The Fund also pays a commitment fee equal to its pro rata share of the amount of the credit facility at a rate of 0.075% per annum. The commitment fee is included in other expenses in the Statement of Operations. Prior to the December 9, 2014 amendment, the credit facility agreement permitted borrowings up to $500 million under the same terms and interest rates as described above.
The Fund had no borrowings during the year ended April 30, 2015.
Note 8. Significant Risks
Credit Risk
Credit risk is the risk that the value of debt securities in the Fund's portfolio may decline because the issuer may default and fail to pay interest or repay principal when due. Rating agencies assign credit ratings to debt securities to indicate their credit risk. Lower rated or unrated debt securities held by the Fund may present increased credit risk as compared to higher-rated debt securities.
Interest Rate Risk
Interest rate risk is the risk of losses attributable to changes in interest rates. In general, if prevailing interest rates rise, the values of debt securities tend to fall, and if interest rates fall, the values of debt securities tend to rise. Actions by governments and central banking authorities can result in increases in interest rates. Increasing interest rates may negatively affect the value of debt securities held by the Fund, resulting in a negative impact on the Fund's performance and net asset value per share. In general, the longer the maturity or duration of a debt security, the greater its sensitivity to changes in interest rates.
Liquidity Risk
Liquidity risk is the risk associated with a lack of marketability of investments which may make it difficult to sell the investment at a desirable time or price. Changing regulatory, market or other conditions or environments (for example, the interest rate or credit environments) may adversely affect the liquidity of the Fund's investments. The Fund may have to accept a lower selling price for the holding, sell other investments, or forego another, more appealing investment opportunity. Generally, the less liquid the market at the time the Fund sells a portfolio investment, the greater
Annual Report 2015
26
COLUMBIA AMT-FREE GEORGIA INTERMEDIATE MUNI BOND FUND
NOTES TO FINANCIAL STATEMENTS (continued)
April 30, 2015
the risk of loss or decline of value to the Fund. A less liquid market can lead to an increase in Fund redemptions, which may negatively impact Fund performance and net asset value per share, including, for example, if the Fund is forced to sell securities in a down market.
Geographic Concentration Risk
Because state-specific tax-exempt funds invest primarily in the municipal securities issued by the state and political sub-divisions of the state, the Fund will be particularly affected by political and economic conditions and developments in the state in which it invests. The Fund may, therefore, have a greater risk than that of a municipal bond fund which is more geographically diversified. The value of the municipal securities owned by the Fund also may be adversely affected by future changes in federal or state income tax laws.
Note 9. Subsequent Events
Management has evaluated the events and transactions that have occurred through the date the financial statements were issued and noted no items requiring adjustment of the financial statements or additional disclosure.
Note 10. Information Regarding Pending and Settled Legal Proceedings
In December 2005, without admitting or denying the allegations, American Express Financial Corporation (AEFC, which is now known as Ameriprise Financial, Inc. (Ameriprise Financial)) entered into settlement agreements with the Securities and Exchange Commission (SEC) and Minnesota Department of Commerce (MDOC) related to market timing activities. As a result, AEFC was censured and ordered to cease and desist from committing or causing any violations of certain provisions of the Investment Advisers Act of 1940, the Investment Company Act of 1940, and various Minnesota laws. AEFC agreed to pay disgorgement of $10 million and civil money penalties of $7 million. AEFC also agreed to retain an independent distribution consultant to assist in developing a plan for distribution of all disgorgement and civil penalties ordered by the SEC in accordance with various undertakings detailed at www.sec.gov/litigation/admin/ia-2451.pdf. Ameriprise Financial and its affiliates have cooperated with the SEC and the MDOC in these legal proceedings, and have made regular reports to the Funds' Boards of Trustees.
Ameriprise Financial and certain of its affiliates have historically been involved in a number of legal, arbitration and regulatory proceedings, including routine litigation, class actions, and governmental actions, concerning matters arising in connection with the conduct of their business activities. Ameriprise Financial believes that the Funds are not currently the subject of, and that neither Ameriprise Financial nor any of its affiliates are the subject of, any pending legal, arbitration or regulatory proceedings that are likely to have a material adverse effect on the Funds or the ability of Ameriprise Financial or its affiliates to perform under their contracts with the Funds. Ameriprise Financial is required to make quarterly (10-Q), annual (10-K) and, as necessary, 8-K filings with the Securities and Exchange Commission on legal and regulatory matters that relate to Ameriprise Financial and its affiliates. Copies of these filings may be obtained by accessing the SEC website at www.sec.gov.
There can be no assurance that these matters, or the adverse publicity associated with them, will not result in increased fund redemptions, reduced sale of fund shares or other adverse consequences to the Funds. Further, although we believe proceedings are not likely to have a material adverse effect on the Funds or the ability of Ameriprise Financial or its affiliates to perform under their contracts with the Funds, these proceedings are subject to uncertainties and, as such, we are unable to estimate the possible loss or range of loss that may result. An adverse outcome in one or more of these proceedings could result in adverse judgments, settlements, fines, penalties or other relief that could have a material adverse effect on the consolidated financial condition or results of operations of Ameriprise Financial.
Annual Report 2015
27
COLUMBIA AMT-FREE GEORGIA INTERMEDIATE MUNI BOND FUND
REPORT OF INDEPENDENT REGISTERED PUBLIC ACCOUNTING FIRM
To the Trustees of Columbia Funds Series Trust and the Shareholders of
Columbia AMT-Free Georgia Intermediate Muni Bond Fund (formerly known as Columbia Georgia Intermediate Municipal Bond Fund)
In our opinion, the accompanying statement of assets and liabilities, including the portfolio of investments, and the related statements of operations and of changes in net assets and the financial highlights present fairly, in all material respects, the financial position of Columbia AMT-Free Georgia Intermediate Muni Bond Fund (formerly known as Columbia Georgia Intermediate Municipal Bond Fund) (the "Fund", a series of Columbia Funds Series Trust) at April 30, 2015, and the results of its operations, the changes in its net assets and the financial highlights for each of the periods indicated, in conformity with accounting principles generally accepted in the United States of America. These financial statements and financial highlights (hereafter referred to as "financial statements") are the responsibility of the Fund's management. Our responsibility is to express an opinion on these financial statements based on our audits. We conducted our audits of these financial statements in accordance with the standards of the Public Company Accounting Oversight Board (United States). Those standards require that we plan and perform the audit to obtain reasonable assurance about whether the financial statements are free of material misstatement. An audit includes examining, on a test basis, evidence supporting the amounts and disclosures in the financial statements, assessing the accounting principles used and significant estimates made by management, and evaluating the overall financial statement presentation. We believe that our audits, which included confirmation of securities at April 30, 2015 by correspondence with the custodian, provide a reasonable basis for our opinion.
PricewaterhouseCoopers LLP
Minneapolis, Minnesota
June 19, 2015
Annual Report 2015
28
COLUMBIA AMT-FREE GEORGIA INTERMEDIATE MUNI BOND FUND
FEDERAL INCOME TAX INFORMATION
(Unaudited)
The Fund hereby designates the following tax attributes for the fiscal year ended April 30, 2015. Shareholders will be notified in early 2016 of the amounts for use in preparing 2015 income tax returns.
Tax Designations
Capital Gain Dividend | | $ | 369,017 | | |
| Exempt-Interest Dividends | | | 100.00 | % | |
Capital Gain Dividend. The Fund designates as a capital gain dividend the amount reflected above, or if subsequently determined to be different, the net capital gain of such fiscal period.
Exempt-Interest Dividends. The percentage of net investment income distributed during the fiscal year that qualifies as exempt-interest dividends for federal income tax purposes.
Annual Report 2015
29
COLUMBIA AMT-FREE GEORGIA INTERMEDIATE MUNI BOND FUND
Shareholders elect the Board that oversees the Funds' operations. The Board appoints officers who are responsible for day-to-day business decisions based on policies set by the Board. The following table provides basic biographical information about the Funds' Board members, including their principal occupations during the past five years, although specific titles for individuals may have varied over the period. Under current Board policy, members may serve through the end of the calendar year in which he or she reaches either the mandatory retirement age established by the Board or the fifteenth anniversary of the first Board meeting they attended as a member of the Board.
Independent Trustees
Name,
Address,
Year of Birth | | Position Held With
Funds and Length of
Service | | Principal Occupation(s)
During Past Five Years
and Other Relevant
Professional Experience | | Number of
Funds in the
Fund Family
Overseen by
Board Member | | Other Present or Past
Directorships/
Trusteeships
(Within Past 5 Years) | |
Kathleen Blatz
901 S. Marquette Ave.
Minneapolis, MN 55402
1954 | | Board member since 1/06 for RiverSource Funds and since 6/11 for Nations Funds | | Attorney; specializing in arbitration and mediation; Chief Justice, Minnesota Supreme Court, 1998-2006; Associate Justice, Minnesota Supreme Court, 1996-1998; Fourth Judicial District Court Judge, Hennepin County, 1994-1996; Attorney in private practice and public service, 1984-1993; State Representative, Minnesota House of Representatives, 1979- 1993, which included service on the Tax and Financial Institutions and Insurance Committees | | | 127 | | | Trustee, BlueCross BlueShield of Minnesota (Chair of the Business Development Committee) since 2009; Chair of the Robina Foundation since August 2013 | |
Edward J. Boudreau, Jr.
901 S. Marquette Ave.
Minneapolis, MN 55402
1944 | | Board member since 6/11 for RiverSource Funds and since 1/05 for Nations Funds | | Managing Director, E.J. Boudreau & Associates (consulting) since 2000; FINRA Industry Arbitrator, 2002-present; Chairman and Chief Executive Officer, John Hancock Funds (asset management), Chairman and Interested Trustee for open-end and closed-end funds offered by John Hancock, 1989-2000; John Hancock Life Insurance Company, including SVP and Treasurer and SVP Information Technology, 1968-1988 | | | 125 | | | Former Trustee, BofA Funds Series Trust (11 funds), 2005-2011; Trustee, Boston Museum of Science (Chair of Finance Committee), 1985-2013 | |
Pamela G. Carlton
901 S. Marquette Ave.
Minneapolis, MN 55402
1954 | | Board member since 7/07 for RiverSource Funds and since 6/11 for Nations Funds | | President, Springboard — Partners in Cross Cultural Leadership (consulting company) since 2003; Managing Director of US Equity Research, JP Morgan Chase, 1999-2003; Director of US Equity Research, Chase Asset Management, 1996- 1999; Co-Director Latin America Research, 1993-1996, COO Global Research, 1992-1996, Co-Director of US Research, 1991-1992, Investment Banker, Morgan Stanley, 1982-1991 | | | 127 | | | None | |
Annual Report 2015
30
COLUMBIA AMT-FREE GEORGIA INTERMEDIATE MUNI BOND FUND
TRUSTEES AND OFFICERS (continued)
Independent Trustees (continued)
Name,
Address,
Year of Birth | | Position Held With
Funds and Length of
Service | | Principal Occupation(s)
During Past Five Years
and Other Relevant
Professional Experience | | Number of
Funds in the
Fund Family
Overseen by
Board Member | | Other Present or Past
Directorships/
Trusteeships
(Within Past 5 Years) | |
William P. Carmichael
901 S. Marquette Ave.
Minneapolis, MN 55402
1943 | | Chair of the Board since 1/14, Board member since 6/11 for RiverSource Funds and since 2003 for Nations Funds | | Retired; Co-founder, The Succession Fund (provides exit strategies to owners of privately held companies) 1998-2007; Adjunct Professor of Finances, Kelley School of Business, Indiana University, 1993-2007; Senior Vice President, Sara Lee Corporation, 1991-1993; Senior Vice President and Chief Financial Officer, Beatrice Foods Company, 1984-1990; Vice President, Esmark, Inc., 1973-1984; Associate, Price Waterhouse, 1968-1972 | | | 127 | | | Director, Cobra Electronics Corporation (electronic equipment manufacturer), 1994-August 2014; The Finish Line (athletic shoes and apparel) since July 2003; Director, International Textile Corp. since 2012; former Director, McMoRan Exploration Company (oil and gas exploration and development) 2010-2013; former Trustee, BofA Funds Series Trust (11 funds) 2009-2011; Director, Spectrum Brands, Inc. (consumer products), 2002-2009; Director, Simmons Company (bedding), 2004-2010 | |
Patricia M. Flynn
901 S. Marquette Ave.
Minneapolis, MN 55402
1950 | | Board member since 11/04 for RiverSource Funds and since 6/11 for Nations Funds | | Trustee Professor of Economics and Management, Bentley University since 1976 (also teaches and conducts research on corporate governance); Dean, McCallum Graduate School of Business, Bentley University, 1992-2002 | | | 127 | | | Trustee, MA Taxpayers Foundation since 1997; Board of Governors, Innovation Institute, MA Technology Collaborative since 2010 | |
William A. Hawkins
901 S. Marquette Ave.
Minneapolis, MN 55402
1942 | | Board member since 6/11 for RiverSource Funds and since 1/05 for Nations Funds | | Managing Director, Overton Partners (financial consulting), since August 2010; President and Chief Executive Officer, California General Bank, N.A., January 2008-August 2010; Operation Hope, COO, 2004-2007; IndyMac Bancorp, President, CBG, 1999-2003; American General Bank, President, 1997-1999; Griffin Financial Services, CEO, 1981-1997; The Griffin Funds, CEO, 1992-1998 | | | 125 | | | Trustee, BofA Funds Series Trust (11 funds) | |
R. Glenn Hilliard
901 S. Marquette Ave.
Minneapolis, MN 55402
1943 | | Board member since 6/11 for RiverSource Funds and since 1/05 for Nations Funds | | Chairman and Chief Executive Officer, Hilliard Group LLC (investing and consulting) since April 2003; Non-Executive Director & Chairman, CNO Financial Group, Inc. (insurance), September 2003-May 2011 | | | 125 | | | Chairman, BofA Funds Series Trust (11 funds); former Director, CNO Financial Group, Inc. (insurance) 2003-2011 | |
Annual Report 2015
31
COLUMBIA AMT-FREE GEORGIA INTERMEDIATE MUNI BOND FUND
TRUSTEES AND OFFICERS (continued)
Independent Trustees (continued)
Name,
Address,
Year of Birth | | Position Held With
Funds and Length of
Service | | Principal Occupation(s)
During Past Five Years
and Other Relevant
Professional Experience | | Number of
Funds in the
Fund Family
Overseen by
Board Member | | Other Present or Past
Directorships/
Trusteeships
(Within Past 5 Years) | |
Catherine James Paglia
901 S. Marquette Ave.
Minneapolis, MN 55402
1952 | | Board member since 11/04 for RiverSource Funds and since 6/11 for Nations Funds | | Director, Enterprise Asset Management, Inc. (private real estate and asset management company) since September 1998; Managing Director and Partner, Interlaken Capital, Inc., 1989-1997; Managing Director, Morgan Stanley, 1982-1989; Vice President, Investment Banking, 1980-1982, Associate, Investment Banking, 1976-1980, Dean Witter Reynolds, Inc. | | | 127 | | | Director, Valmont Industries, Inc. (irrigation systems manufacturer) since 2012; Trustee, Carleton College (on the Investment Committee); Trustee, Carnegie Endowment for International Peace (on the Investment Committee) | |
Leroy C. Richie
901 S. Marquette Ave.
Minneapolis, MN 55402
1941 | | Board member since 2000 for Seligman Funds, since 11/08 for RiverSource Funds and since 6/11 for Nations Funds | | Counsel, Lewis & Munday, P.C. (law firm) since 2004; Vice President and General Counsel, Automotive Legal Affairs, Chrysler Corporation, 1993-1997 | | | 127 | | | Lead Outside Director, Digital Ally, Inc. (digital imaging) since September 2005; Director, Infinity, Inc. (oil and gas exploration and production) since 1994; Director, OGE Energy Corp. (energy and energy services) 2007-2014 | |
Minor M. Shaw
901 S. Marquette Ave.
Minneapolis, MN 55402
1947 | | Board member since 6/11 for RiverSource Funds and since 2003 for Nations Funds | | President, Micco LLC (private investments) since 2011; President, Micco Corp. (family investment business) 1998-2011 | | | 125 | | | Director, Piedmont Natural Gas; Director, BlueCross BlueShield of South Carolina since April 2008; Chair of the Duke Endowment; Director, National Association of Corporate Directors, Carolinas Chapter, since 2013; Chair of Greenville- Spartanburg Airport Commission; former Trustee, BofA Funds Series Trust (11 funds), 2003-2011 | |
Alison Taunton-Rigby
901 S. Marquette Ave.
Minneapolis, MN 55402
1944 | | Board member since 11/02 for RiverSource Funds and since 6/11 for Nations Funds | | Managing Director, Forester Biotech (consulting) since 2001; Chief Executive Officer and Director, RiboNovix, Inc., (biotechnology) 2003-2010; President and Chief Executive Officer of CMT Inc., 2001-2003; Aquila Biopharmaceuticals Inc., 1996-2000; Cambridge Biotech Corporation, 1995-1996, Mitotix Inc., 1993-1994 | | | 127 | | | Director, Healthways, Inc. (health and well- being solutions) since 2005; Director, ICI Mutual Insurance Company, since 2011; Director, Abt Associates (government contractor) since 2001; Director, Boston Children's Hospital since 2002 | |
Annual Report 2015
32
COLUMBIA AMT-FREE GEORGIA INTERMEDIATE MUNI BOND FUND
TRUSTEES AND OFFICERS (continued)
Interested Trustee Not Affiliated with Investment Manager*
Name,
Address,
Year of Birth | | Position Held With
Funds and Length of
Service | | Principal Occupation(s)
During Past Five Years | | Number of
Funds in the
Fund Family
Overseen by
Board Member | | Other Present or Past
Directorships/
Trusteeships
(Within Past 5 Years) | |
Anthony M. Santomero
901 S. Marquette Ave.
Minneapolis, MN 55402
1946 | | Board member since 6/11 for RiverSource Funds and since 1/08 for Nations Funds | | Richard K. Mellon Professor Emeritus of Finance, The Wharton School, University of Pennsylvania, since 2002; Senior Advisor, McKinsey & Company (consulting), 2006-2008; President, Federal Reserve Bank of Philadelphia, 2000-2006, Professor of Finance, The Wharton School, University of Pennsylvania, 1972-2002 | | | 125 | | | Director, Renaissance Reinsurance Ltd. since May 2008; Trustee, Penn Mutual Life Insurance Company since March 2008; Director, Citigroup Inc. since 2009; Director, Citibank, N.A. since 2009; former Trustee, BofA Funds Series Trust (11 funds), 2008-2011 | |
* Dr. Santomero is not an affiliated person of the Investment Manager or Ameriprise Financial. However, he is currently deemed by the Funds to be an "interested person" (as defined in the 1940 Act) of the Funds because he serves as a Director of Citigroup Inc. and Citibank, N.A., companies that may directly or through subsidiaries and affiliates engage from time-to-time in brokerage execution, principal transactions and lending relationships with the Funds or accounts advised/managed by the Investment Manager.
Interested Trustee Affiliated with Investment Manager*
Name, Address,
Year of Birth | | Position Held
With Funds and
Length of Service | | Principal Occupation(s) During Past Five Years | | Number
of Funds
in the Fund
Family
Overseen
by Board
Member | | Other Present or
Past Directorships/
Trusteeships
(Within Past 5 Years) | |
William F. Truscott
53600 Ameriprise Financial Center
Minneapolis, MN 55474
1960 | | Board member since 11/01 for RiverSource Funds and since 6/11 for Nations Funds; Senior Vice President since 2002 for RiverSource Funds and since 5/10 for Nations Funds | | Chairman of the Board and President, Columbia Management Investment Advisers, LLC since May 2010 and February 2012, respectively (previously President and Chief Investment Officer, 2001-April 2010); Chief Executive Officer, Global Asset Management, Ameriprise Financial, Inc. since September 2012 (previously Chief Executive Officer, U.S. Asset Management & President, Annuities, May 2010-September 2012 and President — U.S. Asset Management and Chief Investment Officer, 2005-April 2010); Director and Chief Executive Officer, Columbia Management Investment Distributors, Inc. since May 2010 and February 2012, respectively (previously Chairman of the Board and Chief Executive Officer, 2006-April 2010); Chairman of the Board and Chief Executive Officer, RiverSource Distributors, Inc. since 2006; Director, Threadneedle Asset Management Holdings, SARL since 2014; President and Chief Executive Officer, Ameriprise Certificate Company, 2006-August 2012 | | | 186 | | | Former Director, Ameriprise Certificate Company, 2006- January 2013 | |
* Interested person (as defined under the 1940 Act) by reason of being an officer, director, security holder and/or employee of the Investment Manager or Ameriprise Financial.
The Statement of Additional Information has additional information about the Fund's Board members and is available, without charge, upon request by calling 800.345.6611; contacting your financial intermediary or visiting columbiathreadneedle.com/us.
Annual Report 2015
33
COLUMBIA AMT-FREE GEORGIA INTERMEDIATE MUNI BOND FUND
TRUSTEES AND OFFICERS (continued)
The Board has appointed officers who are responsible for day-to-day business decisions based on policies it has established. The officers serve at the pleasure of the Board. In addition to Mr. Truscott, who is Senior Vice President, the Funds' other officers are:
Fund Officers
Name,
Address and
Year of Birth | | Position and Year
First Appointed to
Position for any Fund
in the Columbia
Funds Complex or a
Predecessor Thereof | | Principal Occupation(s) During Past Five Years | |
Christopher O. Petersen
5228 Ameriprise Financial Center
Minneapolis, MN 55474
Born 1970 | | President and Principal Executive Officer (2015) | | Vice President and Lead Chief Counsel, Ameriprise Financial, Inc. since January 2015 (previously, Vice President and Chief Counsel January 2010-December 2014; and Vice President and Group Counsel or Counsel 2004-January 2010); officer of Columbia Funds and affiliated funds since 2007. | |
Michael G. Clarke
225 Franklin Street
Boston, MA 02110
Born 1969 | | Treasurer (2011) and Chief Financial Officer (2009) | | Vice President — Mutual Fund Administration, Columbia Management Investment Advisers, LLC, since May 2010; Managing Director of Fund Administration, Columbia Management Advisors, LLC, September 2004-April 2010; senior officer of Columbia Funds and affiliated funds since 2002. | |
Paul B. Goucher
100 Park Avenue
New York, NY 10017
Born 1968 | | Senior Vice President (2011), Chief Legal Officer (2015) and Assistant Secretary (2008) | | Vice President and Lead Chief Counsel, Ameriprise Financial, Inc. since November 2008 and January 2013, respectively (previously Chief Counsel, January 2010-January 2013 and Group Counsel, November 2008-January 2010). | |
Thomas P. McGuire
225 Franklin Street
Boston, MA 02110
Born 1972 | | Vice President and Chief Compliance Officer (2012) | | Vice President — Asset Management Compliance, Ameriprise Financial, Inc., since May 2010; Chief Compliance Officer, Ameriprise Certificate Company since September 2010; Compliance Executive, Bank of America, 2005-April 2010. | |
Colin Moore
225 Franklin Street
Boston, MA 02110
Born 1958 | | Senior Vice President (2010) | | Executive Vice President and Global Chief Investment Officer, Ameriprise Financial, Inc., since July 2013; Director and Global Chief Investment Officer, Columbia Management Investment Advisers, LLC since May 2010; Manager, Managing Director and Chief Investment Officer, Columbia Management Advisors, LLC, 2007-April 2010. | |
Michael E. DeFao
225 Franklin Street
Boston, MA 02110
Born 1968 | | Vice President (2011) and Assistant Secretary (2010) | | Vice President and Chief Counsel, Ameriprise Financial, Inc. since May 2010; Associate General Counsel, Bank of America, 2005-April 2010. | |
Joseph F. DiMaria
225 Franklin Street
Boston, MA 02110
Born 1968 | | Vice President (2011), Assistant Treasurer (2012) and Chief Accounting Officer (2008) | | Vice President — Mutual Fund Treasurer, Columbia Management Investment Advisers, LLC since May 2010; Director of Fund Administration, Columbia Management Advisors, LLC, 2006-April 2010. | |
Amy Johnson
5228 Ameriprise Financial Center
Minneapolis, MN 55474
Born 1965 | | Vice President (2006) | | Managing Director and Chief Operating Officer, Columbia Management Investment Advisers, LLC since May 2010 (previously Chief Administrative Officer, 2009-April 2010, and Vice President — Asset Management and Trust Company Services, 2006-2009). | |
Lyn Kephart-Strong
5228 Ameriprise Financial Center
Minneapolis, MN 55474
Born 1960 | | Vice President (2015) | | President, Columbia Management Investment Services Corp. since October 2014; Vice President & Resolution Officer, Ameriprise Trust Company since August 2009; President, RiverSource Service Corporation 2004-2010. | |
Ryan C. Larrenaga
225 Franklin Street
Boston, MA 02110
Born 1970 | | Vice President and Secretary (2015) | | Vice President and Group Counsel, Ameriprise Financial, Inc. since August 2011 (previously, Counsel from May 2010 to August 2011); Assistant General Counsel, Bank of America, 2005-April 2010; officer of Columbia Funds and affiliated funds since 2005. | |
Annual Report 2015
34
COLUMBIA AMT-FREE GEORGIA INTERMEDIATE MUNI BOND FUND
APPROVAL OF INVESTMENT MANAGEMENT SERVICES AGREEMENT
Columbia Management Investment Advisers, LLC (Columbia Management or the Investment Manager), a wholly-owned subsidiary of Ameriprise Financial, Inc. (Ameriprise Financial), serves as the investment manager to Columbia AMT-Free Georgia Intermediate Muni Bond Fund (the Fund). Under an investment management services agreement (the IMS Agreement), Columbia Management provides investment advice and other services to the Fund and other funds distributed by Columbia Management Investment Distributors, Inc. (collectively, the Funds).
The Fund's Board of Trustees (the Board), including the independent Board members (the Independent Trustees), considered the renewal of the IMS Agreement for a two-month period (Short-Term Period) in order to align the IMS Agreement with the review cycle of other funds in the Columbia family of funds. Columbia Management prepared detailed reports for the Board and its Contracts Committee in January, March and April 2015, including reports based on analyses of data provided by an independent organization (Lipper) and a comprehensive response to each item of information requested by independent legal counsel to the Independent Trustees (Independent Legal Counsel) in a letter to the Investment Manager, to assist the Board in making this determination. In addition, throughout the year, the Board (or its committees) regularly meets with portfolio management teams and senior management personnel, and reviews information prepared by Columbia Management addressing the services Columbia Management provides and Fund performance. The Board also accords appropriate weight to the work, deliberations and conclusions of the Contracts Committee, the Investment Review Committee and the Compliance Committee in determining whether to continue the IMS Agreement.
The Board, at its April 13-15, 2015 in-person Board meeting (the April Meeting), considered the renewal of the IMS Agreement for the Short-Term Period. At the April Meeting, Independent Legal Counsel reviewed with the Independent Trustees various factors relevant to the Board's consideration of advisory agreements and the Board's legal responsibilities related to such consideration. Following an analysis and discussion of the factors identified below, the Board, including all of the Independent Trustees, approved the renewal of the IMS Agreement for the Short-Term Period.
Nature, Extent and Quality of Services Provided by Columbia Management
The Independent Trustees analyzed various reports and presentations they had received detailing the services performed by Columbia Management, as well as its expertise, resources and capabilities. The Independent Trustees specifically considered many developments during the past year concerning the services provided by Columbia Management. The Independent Trustees noted the information they received concerning Columbia Management's ability to retain its key portfolio management personnel. In evaluating the quality of services provided under the IMS Agreement and the Fund's Administrative Services Agreement, the Independent Trustees also took into account the organization and strength of the Fund's and its service providers' compliance programs. In addition, the Board also reviewed the financial condition of Columbia Management (and its affiliates) and each entity's ability to carry out its responsibilities under the IMS Agreement and the Fund's other services agreements with affiliates of Ameriprise Financial, observing the financial strength of Ameriprise Financial, with its solid balance sheet. The Board also discussed the acceptability of the terms of the IMS Agreement for the Short-Term Period.
Based on the foregoing, and based on other information received (both oral and written, including the information on investment performance referenced below) and other considerations, the Board concluded that the services being performed by Columbia Management and its affiliates were acceptable for the Short-Term Period.
Investment Performance
For purposes of evaluating the nature, extent and quality of services provided under the IMS Agreement, the Board carefully reviewed the investment performance of the Fund. In this regard, the Board considered detailed reports providing the results of analyses performed by an independent organization showing, for various periods, the performance of the Fund, the performance of a benchmark index, the percentage ranking of the Fund among its comparison group and the net assets of the Fund. The Board observed that for purposes of approving the IMS Agreement for the Short-Term Period, the Fund's performance was acceptable.
Annual Report 2015
35
COLUMBIA AMT-FREE GEORGIA INTERMEDIATE MUNI BOND FUND
APPROVAL OF INVESTMENT MANAGEMENT SERVICES AGREEMENT (continued)
Comparative Fees, Costs of Services Provided and the Profits Realized By Columbia Management and its Affiliates from their Relationships with the Fund
The Board reviewed comparative fees and the costs of services provided under the IMS Agreement. The Board members considered detailed comparative information set forth in an annual report on fees and expenses, including, among other things, data (based on analyses conducted by an independent organization) showing a comparison of the Fund's expenses with median expenses paid by funds in its comparative peer universe, as well as data showing the Fund's contribution to Columbia Management's profitability.
The Board accorded particular weight to the notion that the level of fees should reflect a rational pricing model applied consistently across the various product lines in the Fund family, while assuring that the overall fees for each Fund (with few defined exceptions) are generally in line with the "pricing philosophy" currently in effect (i.e., that the total expense ratio of the Fund is no higher than the median expense ratio of funds in the same comparison universe of the Fund).
The Board also considered the expected profitability of Columbia Management and its affiliates in connection with Columbia Management providing investment management services to the Fund. In this regard, the Board referred to a detailed profitability report, discussing the profitability to Columbia Management and Ameriprise Financial from managing, operating and distributing the Funds. For purposes of approving the IMS Agreement for the Short-Term Period, the Board concluded that the investment management service fees were fair and reasonable, observing that the profitability levels also seemed reasonable.
Economies of Scale to be Realized
The Board also considered the economies of scale that might be realized by Columbia Management as the Fund grows and took note of the extent to which Fund shareholders might also benefit from such growth. In this regard, the Independent Trustees took into account that IMS fees decline as Fund assets exceed various breakpoints.
Based on the foregoing, the Board, including all of the Independent Trustees, concluded that, for purposes of its consideration of the renewal of the IMS Agreement for the Short-Term Period, the investment management service fees were fair and reasonable in light of the extent and quality of services provided. In reaching this conclusion, no single factor was determinative. The Board noted its understanding that it would undertake the full consideration of renewal of the IMS Agreement for the full annual period at its June 2015 meetings. On April 15, 2015, the Board, including all of the Independent Trustees, approved the renewal of the IMS Agreement for the Short-Term Period.
Annual Report 2015
36
COLUMBIA AMT-FREE GEORGIA INTERMEDIATE MUNI BOND FUND
IMPORTANT INFORMATION ABOUT THIS REPORT
Each fund mails one shareholder report to each shareholder address. If you would like more than one report, please call shareholder services at 800.345.6611 and additional reports will be sent to you.
The policy of the Board is to vote the proxies of the companies in which each fund holds investments consistent with the procedures as stated in the Statement of Additional Information (SAI). You may obtain a copy of the SAI without charge by calling 800.345.6611; contacting your financial intermediary; visiting columbiathreadneedle.com/us; or searching the website of the Securities and Exchange Commission (SEC) at sec.gov. Information regarding how each fund voted proxies relating to portfolio securities is filed with the SEC by August 31st for the most recent 12-month period ending June 30th of that year, and is available without charge by visiting columbiathreadneedle.com/us, or searching the website of the SEC at sec.gov.
Each fund files a complete schedule of portfolio holdings with the SEC for the first and third quarters of each fiscal year on Form N-Q. Each fund's Form N-Q is available on the SEC's website at sec.gov and may be reviewed and copied at the SEC's Public Reference Room in Washington, D.C. Information on the operation of the Public Reference Room may be obtained by calling 800.SEC.0330. Each fund's complete schedule of portfolio holdings, as filed on Form N-Q, can also be obtained without charge, upon request, by calling 800.345.6611.
Annual Report 2015
37
Columbia AMT-Free Georgia Intermediate Muni Bond Fund
P.O. Box 8081
Boston, MA 02266-8081

This information is for use with concurrent or prior delivery of a fund prospectus. Please read and consider the investment objectives, risks, charges and expenses for any fund carefully before investing. For a prospectus and summary prospectus, which contains this and other important information about the Fund, go to columbiathreadneedle.com/us. The Fund is distributed by Columbia Management Investment Distributors, Inc., member FINRA, and managed by Columbia Management Investment Advisers, LLC.
Columbia Threadneedle Investments (Columbia Threadneedle) is the global brand name of the Columbia and Threadneedle group of companies.
All rights reserved. Columbia Management Investment Distributors, Inc., 225 Franklin Street, Boston, MA 02110-2804
© 2015 Columbia Management Investment Advisers, LLC.
columbiathreadneedle.com/us
ANN152_04_E01_(06/15)

ANNUAL REPORT
April 30, 2015

COLUMBIA AMT-FREE NORTH CAROLINA INTERMEDIATE MUNI BOND FUND

ABOUT COLUMBIA THREADNEEDLE INVESTMENTS
Columbia Threadneedle Investments is a leading global asset management group that provides a broad range of actively managed investment strategies and solutions for individual, institutional and corporate clients around the world.
With more than 2,000 people, including over 450 investment professionals based in North America, Europe and Asia, we manage $506 billion* of assets across developed and emerging market equities, fixed income, asset allocation solutions and alternatives. We are the 12th largest manager of long-term mutual fund assets in the U.S.** and the 5th largest manager of retail funds in the U.K.***
Our priority is the investment success of our clients. We aim to deliver the investment outcomes they expect through an investment approach that is team-based, performance-driven and risk-aware. Our culture is dynamic and interactive. By sharing our insights across asset classes and geographies, we generate richer perspectives on global, regional and local investment landscapes. The ability to exchange and debate investment ideas in a collaborative environment enriches our teams' investment processes. More importantly, it results in better informed investment decisions for our clients.
Columbia funds are distributed by Columbia Management Investment Distributors, Inc., member FINRA, and managed by Columbia Management Investment Advisers, LLC.
Columbia Threadneedle Investments (Columbia Threadneedle) is the global brand name of the Columbia and Threadneedle group of companies.
* In U.S. dollars as of March 31, 2015. Source: Ameriprise Q1 Earnings Release. Includes all assets managed by entities in the Columbia and Threadneedle groups of companies. Contact us for more current data.
** Source: ICI as of March 31, 2015 for Columbia Management Investment Advisers, LLC.
*** Source: Investment Association as of March 2015 for Threadneedle Asset Management Limited.
© 2015 Columbia Management Investment Advisers, LLC. All rights reserved.
Not part of the shareholder report
Get the market insight you need from our investment experts
Connect with Columbia Threadneedle Investments
Investor insight
Find economic and market commentary, investment videos, white papers, mutual fund commentary and more at columbiathreadneedle.com/us.
Columbia Threadneedle Investor Newsletter (e-newsletter)
Read our award-winning* shareholder newsletter. Our quarterly newsletter is available online and provides timely and relevant content about economic trends, fund news, service enhancements and changes. Sign up to receive the newsletter electronically at columbiathreadneedle.com/
us/newsletter.
Investment videos
Get analysis of current events and trends that may affect your investments. Visit our online video library to watch and discover what our thought leaders are saying about the financial markets and economy.
Social media
We offer you multiple ways to access our market commentary and investment insights.
n Perspectives blog at columbiathreadneedle.com/us
Read timely posts by our investment team, including our chief investment officer, chief economist and portfolio managers.
n twitter.com/CTinvest_US
Follow us on Twitter for quick, up-to-the-minute comments on market news and more.
n youtube.com/CTinvestUS
View our commentaries on the economy, markets and current investment opportunities.
n linkedin.com/company/columbia-threadneedle-investments-us
Connect with us on LinkedIn for updates from our thought leaders.
*Columbia Threadneedle Investor Newsletter was awarded top honors in the Mutual Fund Education Alliance STAR Awards competition for excellence in mutual fund marketing and communications in 2011, 2012 and 2013. Materials in the competition were evaluated on educational value, message comprehension, effective design and objectives.
Not part of the shareholder report
Stay informed
Become a subscriber to receive the latest investment publications and mutual fund commentaries
Subscribe to Columbia Threadneedle Investments
Email subscription center
Subscribe to the latest information from Columbia Threadneedle. Visit our email subscription center at columbiathreadneedle.com/us/subscribe to register for economic and market commentary, product and service updates, white papers and more.
n Columbia Threadneedle Investor Newsletter
Quarterly newsletter featuring the latest macro- and micro-economic trends, investment themes, products, service changes and other items of interest to our investors
n Investment Strategy Outlook
Quarterly publication featuring the Columbia Threadneedle Asset Allocation Team's perspective on global economic investment conditions and markets
n MarketTrack
Quarterly publication featuring more than 40 charts and graphs that highlight the current state of the economy and the markets; includes straightforward insight on current investment opportunities
n White papers
Frequent articles that delve deep into a variety of investment topics
n Mutual fund updates
Quarterly portfolio manager commentary and fund fact sheets available for Columbia funds. (Not all funds have a commentary.)
Register your information online at columbiathreadneedle.com/us/subscribe and select the publications you would like to receive. Update your subscriptions at any time by accessing the email subscription center.
 Dear Shareholder,
In a world that is changing faster than ever before, investors want asset managers who offer a global perspective while generating strong and sustainable returns. To that end, Columbia Management, in conjunction with its U.K.-based affiliate, Threadneedle Investments, has rebranded to Columbia Threadneedle Investments. The new global brand represents the combined capabilities, resources and reach of the global group, offering investors access to the best of both firms.
With a presence in 18 countries and more than 450 investment professionals*, our collective perspective and world view as Columbia Threadneedle Investments gives us deeper insight into what might affect the real-life financial outcomes clients are seeking. Putting our views into a global context enables us to build richer perspectives and create the right solutions, and provides us with enhanced capabilities to deliver consistent investment performance, which may ultimately lead to better investor outcomes.
As a result of the rebrand, you will begin to see our new logo and colors reflected in printed materials, such as this shareholder report, as well as on our new website — columbiathreadneedle.com/us. We encourage you to visit us online and view a new video on the "About Us" tab that speaks to the strength of the firm.
While we are introducing a new brand, in many ways, the investment company you know well has not changed. The following remain in effect:
n Fund and strategy names
n Established investment teams, philosophies and processes
n Account services, features, servicing phone numbers and mailing addresses
n Columbia Management Investment Distributors as distributor and Columbia Management Investment Advisers as investment adviser
We recognize that the money we manage represents the hard work and savings of people like you, and that everyone has different ambitions and different definitions of success. Investors have varying goals — funding their children's education, enjoying their retirement, putting money aside for unexpected events, and more. Whatever your ambitions, we believe our wide range of investment products and solutions can help give you confidence that you will reach your goals.
The world is constantly changing, but our priority remains the same: to help you secure your finances, meet your goals and achieve success. Thank you for your continued investment with us. Our service representatives are available at 800.345.6611 to help with any questions.
Sincerely,

Christopher O. Petersen
President, Columbia Funds
Investors should consider the investment objectives, risks, charges and expenses of a mutual fund carefully before investing. For a free prospectus and summary prospectus, which contains this and other important information about a fund, visit columbiathreadneedle.com/us. The prospectus should be read carefully before investing.
* Source: Ameriprise as of December 1, 2014
Columbia Funds are distributed by Columbia Management Investment Distributors, Inc., member FINRA, and managed by Columbia Management Investment Advisers, LLC.
© 2015 Columbia Management Investment Advisers, LLC. All rights reserved.
COLUMBIA AMT-FREE NORTH CAROLINA INTERMEDIATE MUNI BOND FUND
Fund Investment Manager
Columbia Management Investment
Advisers, LLC
225 Franklin Street
Boston, MA 02110
Fund Distributor
Columbia Management Investment
Distributors, Inc.
225 Franklin Street
Boston, MA 02110
Fund Transfer Agent
Columbia Management Investment
Services Corp.
P.O. Box 8081
Boston, MA 02266-8081
For more information about any of the funds, please visit columbiathreadneedle.com/us or call 800.345.6611. Customer Service Representatives are available to answer your questions Monday through Friday from 8 a.m. to 7 p.m. Eastern time.
The views expressed in this report reflect the current views of the respective parties. These views are not guarantees of future performance and involve certain risks, uncertainties and assumptions that are difficult to predict, so actual outcomes and results may differ significantly from the views expressed. These views are subject to change at any time based upon economic, market or other conditions and the respective parties disclaim any responsibility to update such views. These views may not be relied on as investment advice and, because investment decisions for a Columbia fund are based on numerous factors, may not be relied on as an indication of trading intent on behalf of any particular Columbia fund. References to specific securities should not be construed as a recommendation or investment advice.
Performance Overview | | | 3 | | |
Manager Discussion of Fund Performance | | | 5 | | |
Understanding Your Fund's Expenses | | | 7 | | |
Portfolio of Investments | | | 8 | | |
Statement of Assets and Liabilities | | | 14 | | |
Statement of Operations | | | 16 | | |
Statement of Changes in Net Assets | | | 17 | | |
Financial Highlights | | | 19 | | |
Notes to Financial Statements | | | 24 | | |
Report of Independent Registered
Public Accounting Firm | | | 30 | | |
Federal Income Tax Information | | | 31 | | |
Trustees and Officers | | | 32 | | |
Approval of Investment Management
Services Agreement | | | 37 | | |
Important Information About This Report | | | 39 | | |
COLUMBIA AMT-FREE NORTH CAROLINA INTERMEDIATE MUNI BOND FUND
Performance Summary
n Columbia AMT-Free North Carolina Intermediate Muni Bond Fund (the Fund) Class A shares returned 2.41% excluding sales charges for the 12-month period that ended April 30, 2015. Class Z shares of the Fund returned 2.67% for the same time period.
n The Fund underperformed its benchmark, the Barclays 3-15 Year Blend Municipal Bond Index, which returned 3.76% during the 12-month period.
n The Fund's yield curve positioning was the largest factor in its underperformance.
Average Annual Total Returns (%) (for period ended April 30, 2015)
| | | Inception | | 1 Year | | 5 Years | | 10 Years | |
Class A | | 12/14/92 | | | | | | | | | | | | | |
Excluding sales charges | | | | | | | 2.41 | | | | 3.46 | | | | 3.26 | | |
Including sales charges | | | | | | | -0.68 | | | | 2.82 | | | | 2.94 | | |
Class B | | 06/07/93 | | | | | | | | | | | | | |
Excluding sales charges | | | | | | | 1.65 | | | | 2.66 | | | | 2.48 | | |
Including sales charges | | | | | | | -1.34 | | | | 2.66 | | | | 2.48 | | |
Class C | | 12/16/92 | | | | | | | | | | | | | |
Excluding sales charges | | | | | | | 1.65 | | | | 2.69 | | | | 2.49 | | |
Including sales charges | | | | | | | 0.65 | | | | 2.69 | | | | 2.49 | | |
Class R4* | | 03/19/13 | | | 2.67 | | | | 3.70 | | | | 3.50 | | |
Class Z | | 12/11/92 | | | 2.67 | | | | 3.70 | | | | 3.50 | | |
Barclays 3-15 Year Blend Municipal Bond Index | | | | | | | 3.76 | | | | 4.35 | | | | 4.54 | | |
Returns for Class A are shown with and without the maximum initial sales charge of 3.00%. The maximum applicable sales charge was reduced from 3.25% to 3.00% on Class A share purchases made on or after February 19, 2015. Class A returns (including sales charges) for all periods reflect the current maximum applicable sales charge of 3.00%. Returns for Class B are shown with and without the applicable contingent deferred sales charge (CDSC) of 3.00% in the first year, declining to 1.00% in the fourth year and eliminated thereafter. Returns for Class C are shown with and without the 1.00% CDSC for the first year only. The Fund's other classes are not subject to sales charges and have limited eligibility. Please see the Fund's prospectus for details. Performance for different share classes will vary based on differences in sales charges and fees associated with each class. All results shown assume reinvestment of distributions during the period. Returns do not reflect the deduction of taxes that a shareholder may pay on Fund distributions or on the redemption of Fund shares. Performance results reflect the effect of any fee waivers or reimbursements of Fund expenses by Columbia Management Investment Advisers, LLC and/or any of its affiliates. Absent these fee waivers or expense reimbursement arrangements, performance results would have been lower.
The performance information shown represents past performance and is not a guarantee of future results. The investment return and principal value of your investment will fluctuate so that your shares, when redeemed, may be worth more or less than their original cost. Current performance may be lower or higher than the performance information shown. You may obtain performance information current to the most recent month-end by contacting your financial intermediary, visiting columbiathreadneedle.com/us or calling 800.345.6611.
*The returns shown for periods prior to the share class inception date (including returns for the Life of the Fund, if shown, which are since Fund inception) include the returns of the Fund's oldest share class. These returns are adjusted to reflect any higher class-related operating expenses of the newer share classes, as applicable. Please visit columbiathreadneedle.com/us/investment-products/mutual-funds/appended-performance for more information.
The Barclays 3-15 Year Blend Municipal Bond Index is an unmanaged index that tracks the performance of municipal bonds issued after December 31, 1990, with remaining maturities between 2 and 17 years and at least $7 million in principal amount outstanding.
Indices are not available for investment, are not professionally managed and do not reflect sales charges, fees, brokerage commissions, taxes or other expenses of investing. Securities in the Fund may not match those in an index.
Annual Report 2015
3
COLUMBIA AMT-FREE NORTH CAROLINA INTERMEDIATE MUNI BOND FUND
PERFORMANCE OVERVIEW (continued)
Performance of a Hypothetical $10,000 Investment (May 1, 2005 – April 30, 2015)

The chart above shows the change in value of a hypothetical $10,000 investment in Class A shares of Columbia AMT-Free North Carolina Intermediate Muni Bond Fund during the stated time period, and does not reflect the deduction of taxes that a shareholder may pay on Fund distributions or on the redemption of Fund shares.
Annual Report 2015
4
COLUMBIA AMT-FREE NORTH CAROLINA INTERMEDIATE MUNI BOND FUND
MANAGER DISCUSSION OF FUND PERFORMANCE
For the 12-month period that ended April 30, 2015, the Fund's Class A shares returned 2.41% excluding sales charges. Class Z shares of the Fund returned 2.67% for the same time period. The Fund underperformed its benchmark, the Barclays 3-15 Year Blend Municipal Bond Index, which returned 3.76% during the 12-month period. The Fund's yield curve positioning was the largest factor in its underperformance.
Market Overview
The U.S. municipal bond market generated positive performance during the past 12 months, with intermediate- and longer-term debt generating the best results. While short-term bonds were pressured by the possibility that the U.S. Federal Reserve may begin to increase interest rates before the end of 2015, longer term issues were aided by the environment of slow growth, low inflation and investors' continued search for yield. Lower rated investment-grade bonds — those rated A and BBB — delivered the best returns and soundly outperformed high-rated AAA debt. On a sector basis, hospital and transportation issues outperformed. State and local general obligation bonds, which tend to be higher quality, lagged the returns of revenue bonds during the period.
Beginning in the fourth quarter of 2014, the supply of new municipal issues began to increase. The number of current and advanced refundings jumped considerably, and that trend continued into 2015 as issuers took advantage of lower rates to refinance older, higher yielding bonds. This is positive for issuers' credit outlook, as it allows them to reduce their interest costs. For bond holders, however, the refundings often cause higher yielding bonds to be called away from their portfolios, with the proceeds needing to be reinvested in lower yielding securities. Supply expectations for 2015 had risen to $400 billion by the close of the period, with the largest increase in refunding volume. On the demand side, continued flows into municipal bond funds provided firm support for the market throughout the past year.
North Carolina's Economy Improved, but its Market Underperformed
North Carolina's well-diversified economy continued to exhibit signs of a recovery, led by increasing employment, rising property prices and strength in the manufacturing sector. Year-over-year growth in manufacturing reached the highest level in over 20 years due to rising domestic and international demand. The technology and research industries also remained an engine for growth, aiding the economy by boosting productivity and leading to higher average wages. Low business costs, favorable transportation infrastructure and a robust network of colleges are attracting new business to North Carolina and fueling expansion for existing firms. Together, these factors are underpinning a positive outlook for population growth, which is favorable for the state's long-term economic outlook. Still, North Carolina's municipal bond market underperformed during the period due to the higher credit quality of local and state general obligation bonds. North Carolina's debt is AAA rated, and many of the large municipalities are rated AA2 or higher. At a time in
Portfolio Management
Brian McGreevy
Quality Breakdown (%)
(at April 30, 2015) | |
AAA rating | | | 16.5 | | |
AA rating | | | 44.9 | | |
A rating | | | 28.0 | | |
BBB rating | | | 4.8 | | |
Not rated | | | 5.8 | | |
Total | | | 100.0 | | |
Percentages indicated are based upon total fixed income investments (excluding Money Market Funds).
Bond ratings apply to the underlying holdings of the Fund and not the Fund itself and are divided into categories ranging from highest to lowest credit quality, determined by using the middle rating of Moody's, S&P and Fitch, after dropping the highest and lowest available ratings. When ratings are available from only two rating agencies, the lower rating is used. When a rating is available from only one rating agency, that rating is used. When a bond is not rated by any rating agency, it is designated as "Not rated". Credit quality ratings assigned by a rating agency are subjective opinions, not statements of fact, and are subject to change, including daily. The ratings assigned by credit rating agencies are but one of the considerations that the Investment Manager and/or Fund's subadviser incorporates into its credit analysis process, along with such other issuer-specific factors as cash flows, capital structure and leverage ratios, ability to de-leverage (repay) through free cash flow, quality of management, market positioning and access to capital, as well as such security-specific factors as the terms of the security (e.g., interest rate, and time to maturity) and the amount and type of any collateral.
Annual Report 2015
5
COLUMBIA AMT-FREE NORTH CAROLINA INTERMEDIATE MUNI BOND FUND
MANAGER DISCUSSION OF FUND PERFORMANCE (continued)
Investment Risks
Fixed-income securities present issuer default risk. The Fund invests substantially in municipal securities and will be affected by tax, legislative, regulatory, demographic or political changes, as well as changes impacting a state's financial, economic or other conditions. A relatively small number of tax-exempt issuers may necessitate the Fund investing more heavily in a single issuer and, therefore, be more exposed to the risk of loss than a fund that invests more broadly. The value of the Fund's portfolio may be more volatile than a more geographically diversified fund. Prepayment and extension risk exists as a loan, bond or other investment may be called, prepaid or redeemed before maturity and that similar yielding investments may not be available for purchase. A rise in interest rates may result in a price decline of fixed-income instruments held by the Fund, negatively impacting its performance and NAV. Falling rates may result in the Fund investing in lower yielding debt instruments, lowering the Fund's income and yield. These risks may be heightened for longer maturity and duration securities. Non-investment-grade (high-yield or junk) securities present greater price volatility and more risk to principal and income than higher rated securities. Market risk may affect a single issuer, sector of the economy, industry or the market as a whole. Federal and state tax rules apply to capital gain distributions and any gains or losses on sales. Income may be subject to state or local taxes. Liquidity risk is associated with the difficulty of selling underlying investments at a desirable time or price. See the Fund's prospectus for information on these and other risks.
which lower quality bonds outperformed, North Carolina's higher credit quality was a headwind to relative performance.
Contributors and Detractors
The Fund underperformed its benchmark during the 12-month period. The Fund had a shorter duration (lower interest-rate sensitivity) than the benchmark, a negative for performance in an environment of falling yields. In addition, the Fund carried a higher weighting in shorter maturity bonds and cash than the benchmark, which detracted from results. The Fund had less exposure to the longer end of the yield curve (bonds with maturities of 12 to 17 years) than the benchmark, and more exposure to the eight- to 12-year range. Although the eight- to 12-year maturity tier outperformed the overall market, it lagged bonds with maturities of 15 years and longer.
We looked for opportunities to invest in longer maturity A and BBB rated bonds during the period. While our overweight in BBBs aided our results, it was not enough to offset the underperformance of higher quality bonds.
North Carolina's market has a large representation of pre-refunded bonds, which lagged during the year. We decreased the Fund's exposure to this market segment during the period.
Our positions in hospital issues made a strong contributor during the year, as did transportation and education bonds. Water and sewer issues were a drag on performance, however, as they have shorter average maturities than the benchmark.
Fund Positioning
Going forward, we currently intend to take a cautious stance on interest rates by maintaining a roughly neutral duration. Our overall quality positioning, along with the purchases we made during the period, continue to emphasize A and BBB rated issues for the additional income they offer. While yield spreads in these credit tiers have tightened considerably (meaning that investors are being paid less for the associated risks), we currently believe they still offer the most compelling relative value. Given the steep yield curve, we see value at this time in bonds maturing in the eight- to 12-year range.
Annual Report 2015
6
COLUMBIA AMT-FREE NORTH CAROLINA INTERMEDIATE MUNI BOND FUND
UNDERSTANDING YOUR FUND'S EXPENSES
(Unaudited)
As an investor, you incur two types of costs. There are transaction costs, which generally include sales charges on purchases and may include redemption fees. There are also ongoing costs, which generally include management fees, distribution and/or service fees, and other fund expenses. The following information is intended to help you understand your ongoing costs (in dollars) of investing in the Fund and to help you compare these costs with the ongoing costs of investing in other mutual funds.
Analyzing Your Fund's Expenses
To illustrate these ongoing costs, we have provided examples and calculated the expenses paid by investors in each share class of the Fund during the period. The actual and hypothetical information in the table is based on an initial investment of $1,000 at the beginning of the period indicated and held for the entire period. Expense information is calculated two ways and each method provides you with different information. The amount listed in the "Actual" column is calculated using the Fund's actual operating expenses and total return for the period. You may use the Actual information, together with the amount invested, to estimate the expenses that you paid over the period. Simply divide your account value by $1,000 (for example, an $8,600 account value divided by $1,000 = 8.6), then multiply the results by the expenses paid during the period under the "Actual" column. The amount listed in the "Hypothetical" column assumes a 5% annual rate of return before expenses (which is not the Fund's actual return) and then applies the Fund's actual expense ratio for the period to the hypothetical return. You should not use the hypothetical account values and expenses to estimate either your actual account balance at the end of the period or the expenses you paid during the period. See "Compare With Other Funds" below for details on how to use the hypothetical data.
Compare With Other Funds
Since all mutual funds are required to include the same hypothetical calculations about expenses in shareholder reports, you can use this information to compare the ongoing cost of investing in the Fund with other funds. To do so, compare the hypothetical example with the 5% hypothetical examples that appear in the shareholder reports of other funds. As you compare hypothetical examples of other funds, it is important to note that hypothetical examples are meant to highlight the ongoing costs of investing in a fund only and do not reflect any transaction costs, such as sales charges, or redemption or exchange fees. Therefore, the hypothetical calculations are useful in comparing ongoing costs only, and will not help you determine the relative total costs of owning different funds. If transaction costs were included in these calculations, your costs would be higher.
November 1, 2014 – April 30, 2015
| | | Account Value at the Beginning
of the Period ($) | | Account Value at the End of the
Period ($) | | Expenses Paid During the
Period ($) | | Fund's Annualized
Expense Ratio (%) | |
| | | Actual | | Hypothetical | | Actual | | Hypothetical | | Actual | | Hypothetical | | Actual | |
Class A | | | 1,000.00 | | | | 1,000.00 | | | | 1,003.50 | | | | 1,020.78 | | | | 4.02 | | | | 4.06 | | | | 0.81 | | |
Class B | | | 1,000.00 | | | | 1,000.00 | | | | 998.90 | | | | 1,017.06 | | | | 7.73 | | | | 7.80 | | | | 1.56 | | |
Class C | | | 1,000.00 | | | | 1,000.00 | | | | 999.80 | | | | 1,017.06 | | | | 7.74 | | | | 7.80 | | | | 1.56 | | |
Class R4 | | | 1,000.00 | | | | 1,000.00 | | | | 1,004.80 | | | | 1,022.02 | | | | 2.78 | | | | 2.81 | | | | 0.56 | | |
Class Z | | | 1,000.00 | | | | 1,000.00 | | | | 1,004.80 | | | | 1,022.02 | | | | 2.78 | | | | 2.81 | | | | 0.56 | | |
Expenses paid during the period are equal to the annualized expense ratio for each class as indicated above, multiplied by the average account value over the period and then multiplied by the number of days in the Fund's most recent fiscal half year and divided by 365.
Expenses do not include fees and expenses incurred indirectly by the Fund from its investment in underlying funds, including affiliated and non-affiliated pooled investment vehicles, such as mutual funds and exchange-traded funds.
Had Columbia Management Investment Advisers, LLC and/or certain of its affiliates not waived/reimbursed certain fees and expenses, account value at the end of the period would have been reduced.
Annual Report 2015
7
COLUMBIA AMT-FREE NORTH CAROLINA INTERMEDIATE MUNI BOND FUND
PORTFOLIO OF INVESTMENTS
April 30, 2015
Municipal Bonds 99.3%
Issue
Description | | Coupon
Rate | | Principal
Amount ($) | |
Value ($) | |
AIRPORT 2.8% | |
City of Charlotte Airport
Refunding Revenue Bonds
Charlotte Douglas International Airport
Series 2014
07/01/30 | | | 5.000 | % | | | 1,500,000 | | | | 1,738,875 | | |
Raleigh Durham Airport Authority
Refunding Revenue Bonds
Series 2010A
05/01/23 | | | 5.000 | % | | | 3,000,000 | | | | 3,485,940 | | |
Total | | | | | | | 5,224,815 | | |
HIGHER EDUCATION 7.2% | |
East Carolina University
Revenue Bonds
General
Series 2014A
10/01/31 | | | 5.000 | % | | | 1,900,000 | | | | 2,174,759 | | |
North Carolina Capital Facilities Finance Agency
Revenue Bonds
Meredith College
Series 2008
06/01/31 | | | 6.000 | % | | | 1,000,000 | | | | 1,072,190 | | |
Wake Forest University
Series 2009
01/01/26 | | | 5.000 | % | | | 1,000,000 | | | | 1,127,160 | | |
University of North Carolina System
Revenue Bonds
General Trust Indenture
Series 2009B
10/01/17 | | | 4.250 | % | | | 1,000,000 | | | | 1,078,600 | | |
Series 2008A
10/01/22 | | | 5.000 | % | | | 2,000,000 | | | | 2,233,760 | | |
University of North Carolina at Charlotte
Revenue Bonds
Series 2014
04/01/30 | | | 5.000 | % | | | 1,000,000 | | | | 1,152,090 | | |
University of North Carolina at Greensboro
Revenue Bonds
General
Series 2014
04/01/32 | | | 5.000 | % | | | 2,000,000 | | | | 2,289,060 | | |
University of North Carolina at Wilmington
Refunding Revenue Bonds
Series 2015(a)
06/01/29 | | | 5.000 | % | | | 2,000,000 | | | | 2,278,580 | | |
Total | | | | | | | 13,406,199 | | |
Municipal Bonds (continued)
Issue
Description | | Coupon
Rate | | Principal
Amount ($) | |
Value ($) | |
HOSPITAL 10.7% | |
Charlotte-Mecklenburg Hospital Authority (The)
Refunding Revenue Bonds
Carolinas Health Care System Group
Series 2007A (AGM)
01/15/20 | | | 5.000 | % | | | 1,550,000 | | | | 1,659,755 | | |
Series 2008A
01/15/24 | | | 5.250 | % | | | 2,000,000 | | | | 2,186,620 | | |
Series 2009A
01/15/21 | | | 5.000 | % | | | 1,000,000 | | | | 1,127,890 | | |
North Carolina Medical Care Commission
Refunding Revenue Bonds
Mission Health System, Inc.
Series 2015
10/01/36 | | | 5.000 | % | | | 2,515,000 | | | | 2,844,289 | | |
Novant Health Obligation Group
Series 2013
11/01/24 | | | 5.000 | % | | | 530,000 | | | | 615,537 | | |
Southeastern Regional Medical Center
Series 2012
06/01/26 | | | 5.000 | % | | | 1,000,000 | | | | 1,120,080 | | |
Vidant Health
Series 2012A
06/01/25 | | | 5.000 | % | | | 1,500,000 | | | | 1,714,980 | | |
06/01/36 | | | 5.000 | % | | | 1,445,000 | | | | 1,573,316 | | |
Series 2015
06/01/30 | | | 5.000 | % | | | 1,000,000 | | | | 1,137,450 | | |
Revenue Bonds
Duke University Health System
Series 2012A
06/01/32 | | | 5.000 | % | | | 1,000,000 | | | | 1,139,110 | | |
Moses Cone Health System
Series 2011
10/01/20 | | | 5.000 | % | | | 3,215,000 | | | | 3,700,819 | | |
Northern Hospital District of Surry County
Revenue Bonds
Series 2008
10/01/24 | | | 5.750 | % | | | 1,000,000 | | | | 1,080,370 | | |
Total | | | | | | | 19,900,216 | | |
JOINT POWER AUTHORITY 8.8% | |
North Carolina Eastern Municipal Power Agency
Refunding Revenue Bonds
Series 1993B (NPFGC)
01/01/22 | | | 6.000 | % | | | 1,000,000 | | | | 1,238,690 | | |
Series 1993B (NPFGC/IBC)
01/01/22 | | | 6.000 | % | | | 3,000,000 | | | | 3,711,870 | | |
Series 2005A (AMBAC)
01/01/20 | | | 5.250 | % | | | 2,000,000 | | | | 2,066,840 | | |
Series 2008A (AGM)
01/01/19 | | | 5.250 | % | | | 1,500,000 | | | | 1,665,390 | | |
Revenue Bonds
Series 2009B
01/01/26 | | | 5.000 | % | | | 2,250,000 | | | | 2,533,522 | | |
The accompanying Notes to Financial Statements are an integral part of this statement.
Annual Report 2015
8
COLUMBIA AMT-FREE NORTH CAROLINA INTERMEDIATE MUNI BOND FUND
PORTFOLIO OF INVESTMENTS (continued)
April 30, 2015
Municipal Bonds (continued)
Issue
Description | | Coupon
Rate | | Principal
Amount ($) | |
Value ($) | |
North Carolina Municipal Power Agency No. 1
Refunding Revenue Bonds
Series 2008A
01/01/17 | | | 5.250 | % | | | 1,185,000 | | | | 1,276,174 | | |
01/01/20 | | | 5.250 | % | | | 2,000,000 | | | | 2,194,940 | | |
Revenue Bonds
Series 2009A
01/01/25 | | | 5.000 | % | | | 1,500,000 | | | | 1,690,170 | | |
Total | | | | | | | 16,377,596 | | |
LOCAL APPROPRIATION 17.3% | |
City of Kannapolis
Revenue Bonds
Series 2014
04/01/31 | | | 5.000 | % | | | 1,365,000 | | | | 1,558,857 | | |
City of Raleigh
Revenue Bonds
Series 2014A
10/01/26 | | | 5.000 | % | | | 300,000 | | | | 361,542 | | |
City of Wilmington
Refunding Certificate of Participation
Series 2006A
06/01/17 | | | 5.000 | % | | | 1,005,000 | | | | 1,056,396 | | |
Refunding Revenue Bonds
Series 2014A
06/01/28 | | | 5.000 | % | | | 500,000 | | | | 589,415 | | |
City of Winston-Salem
Refunding Revenue Bonds
Series 2014C
06/01/29 | | | 5.000 | % | | | 750,000 | | | | 878,265 | | |
County of Brunswick
Revenue Bonds
Series 2015A
06/01/28 | | | 5.000 | % | | | 250,000 | | | | 294,403 | | |
06/01/29 | | | 5.000 | % | | | 250,000 | | | | 292,520 | | |
County of Buncombe
Revenue Bonds
Series 2012
06/01/28 | | | 5.000 | % | | | 500,000 | | | | 575,270 | | |
06/01/29 | | | 5.000 | % | | | 1,000,000 | | | | 1,144,640 | | |
Series 2014A
06/01/32 | | | 5.000 | % | | | 1,635,000 | | | | 1,891,924 | | |
County of Catawba
Revenue Bonds
Series 2011
10/01/22 | | | 5.000 | % | | | 400,000 | | | | 471,224 | | |
County of Chatham
Refunding Revenue Bonds
Series 2014
11/01/27 | | | 5.000 | % | | | 1,500,000 | | | | 1,783,065 | | |
Municipal Bonds (continued)
Issue
Description | | Coupon
Rate | | Principal
Amount ($) | |
Value ($) | |
County of Cumberland
Refunding Certificate of Participation
Improvement Projects
Series 2009-B1
12/01/21 | | | 5.000 | % | | | 2,775,000 | | | | 3,194,552 | | |
County of Harnett
Certificate of Participation
Series 2009
06/01/22 | | | 5.000 | % | | | 1,880,000 | | | | 2,126,994 | | |
County of Henderson
Certificate of Participation
Series 2006A (AMBAC)
06/01/16 | | | 5.000 | % | | | 1,060,000 | | | | 1,110,859 | | |
County of Johnston
Revenue Bonds
Series 2014
06/01/28 | | | 5.000 | % | | | 1,000,000 | | | | 1,167,460 | | |
County of Martin
Refunding Revenue Bonds
Water & Sewer District
Series 2014
06/01/30 | | | 4.000 | % | | | 730,000 | | | | 764,558 | | |
County of Moore
Revenue Bonds
Series 2010
06/01/24 | | | 5.000 | % | | | 1,635,000 | | | | 1,871,846 | | |
County of New Hanover
Refunding Certificate of Participation
Series 2005B (AMBAC)
09/01/18 | | | 5.000 | % | | | 1,755,000 | | | | 1,980,377 | | |
County of Randolph
Refunding Revenue Bonds
Series 2013C
10/01/26 | | | 5.000 | % | | | 1,500,000 | | | | 1,805,940 | | |
County of Sampson
Certificate of Participation
Series 2006 (AGM)
06/01/16 | | | 5.000 | % | | | 1,000,000 | | | | 1,049,520 | | |
County of Sampson(a)
Refunding Revenue Bonds
Series 2015
12/01/27 | | | 5.000 | % | | | 1,015,000 | | | | 1,204,419 | | |
County of Union
Refunding Revenue Bonds
Series 2012
12/01/24 | | | 5.000 | % | | | 1,715,000 | | | | 2,112,383 | | |
Jacksonville Public Facilities Corp.
Limited Obligation Revenue Bonds
Series 2012
04/01/26 | | | 5.000 | % | | | 1,075,000 | | | | 1,228,456 | | |
The accompanying Notes to Financial Statements are an integral part of this statement.
Annual Report 2015
9
COLUMBIA AMT-FREE NORTH CAROLINA INTERMEDIATE MUNI BOND FUND
PORTFOLIO OF INVESTMENTS (continued)
April 30, 2015
Municipal Bonds (continued)
Issue
Description | | Coupon
Rate | | Principal
Amount ($) | |
Value ($) | |
Orange County Public Facilities Co.
Revenue Bonds
Series 2012
10/01/24 | | | 5.000 | % | | | 1,325,000 | | | | 1,585,681 | | |
Total | | | | | | | 32,100,566 | | |
LOCAL GENERAL OBLIGATION 5.2% | |
County of Forsyth
Unlimited General Obligation Refunding Bonds
Series 2015
12/01/26 | | | 5.000 | % | | | 2,000,000 | | | | 2,527,040 | | |
County of New Hanover
Unlimited General Obligation Refunding Bonds
Series 2009
12/01/17 | | | 5.000 | % | | | 1,170,000 | | | | 1,296,302 | | |
County of Stanly
Unlimited General Obligation Refunding Bonds
Series 2010
02/01/18 | | | 4.000 | % | | | 1,500,000 | | | | 1,622,265 | | |
County of Wake
Unlimited General Obligation Refunding Bonds
Series 2010C
03/01/22 | | | 5.000 | % | | | 2,000,000 | | | | 2,431,020 | | |
Unrefunded Unlimited General Obligation Public Improvement Bonds
Series 2009
03/01/20 | | | 5.000 | % | | | 1,565,000 | | | | 1,790,892 | | |
Total | | | | | | | 9,667,519 | | |
MUNICIPAL POWER 2.2% | |
City of Fayetteville Public Works Commission
Revenue Bonds
Series 2014
03/01/27 | | | 4.000 | % | | | 2,000,000 | | | | 2,221,700 | | |
Greenville Utilities Commission
Revenue Bonds
Series 2008A (AGM)
11/01/18 | | | 5.000 | % | | | 1,040,000 | | | | 1,173,609 | | |
Guam Power Authority
Refunding Revenue Bonds
Series 2012A (AGM)(b)
10/01/24 | | | 5.000 | % | | | 520,000 | | | | 616,033 | | |
Total | | | | | | | 4,011,342 | | |
OTHER BOND ISSUE 0.6% | |
Durham County Industrial Facilities & Pollution Control
Financing Authority
Revenue Bonds
Research Triangle Institute
Series 2010
02/01/18 | | | 4.000 | % | | | 1,000,000 | | | | 1,074,950 | | |
Municipal Bonds (continued)
Issue
Description | | Coupon
Rate | | Principal
Amount ($) | |
Value ($) | |
PORTS 1.2% | |
North Carolina State Ports Authority
Revenue Bonds
Senior Lien
Series 2010B
02/01/25 | | | 5.000 | % | | | 2,000,000 | | | | 2,249,140 | | |
REFUNDED / ESCROWED 17.2% | |
Albemarle Hospital Authority
Prerefunded 10/01/17 Revenue Bonds
Series 2007
10/01/21 | | | 5.250 | % | | | 2,000,000 | | | | 2,205,940 | | |
10/01/27 | | | 5.250 | % | | | 1,000,000 | | | | 1,102,970 | | |
County of Cabarrus
Prerefunded 06/01/18 Certificates of Participation
Installment Financing Contract
Series 2008C
06/01/22 | | | 5.000 | % | | | 1,545,000 | | | | 1,734,587 | | |
County of Craven
Prerefunded 06/01/17 Certificate of Participation
Series 2007 (NPFGC)
06/01/18 | | | 5.000 | % | | | 2,825,000 | | | | 3,079,306 | | |
06/01/19 | | | 5.000 | % | | | 1,825,000 | | | | 1,989,286 | | |
County of Iredell
Prerefunded 02/01/16 Unlimited General Obligation Bonds
School
Series 2006
02/01/19 | | | 5.000 | % | | | 2,420,000 | | | | 2,506,660 | | |
County of Mecklenburg
Prerefunded 02/01/19 Certificate of Participation
Series 2009A
02/01/23 | | | 5.000 | % | | | 1,000,000 | | | | 1,140,720 | | |
County of Wake
Prerefunded 03/01/19 Unlimited General Obligation Public
Improvement Bonds
Series 2009
03/01/20 | | | 5.000 | % | | | 935,000 | | | | 1,068,827 | | |
Revenue Bonds
Series 1993 Escrowed to Maturity (NPFGC)
10/01/26 | | | 5.125 | % | | | 3,065,000 | | | | 3,619,183 | | |
North Carolina Eastern Municipal Power Agency
Prerefunded 01/01/22 Revenue Bonds
Series 1988A
01/01/26 | | | 6.000 | % | | | 1,000,000 | | | | 1,275,080 | | |
Revenue Bonds
Series 1986A Escrowed to Maturity
01/01/17 | | | 5.000 | % | | | 1,865,000 | | | | 1,938,425 | | |
North Carolina Infrastructure Finance Corp.
Prerefunded 05/01/17 Certificate of Participation
Capital Improvement
Series 2007A (AGM)
05/01/24 | | | 5.000 | % | | | 2,570,000 | | | | 2,789,067 | | |
The accompanying Notes to Financial Statements are an integral part of this statement.
Annual Report 2015
10
COLUMBIA AMT-FREE NORTH CAROLINA INTERMEDIATE MUNI BOND FUND
PORTFOLIO OF INVESTMENTS (continued)
April 30, 2015
Municipal Bonds (continued)
Issue
Description | | Coupon
Rate | | Principal
Amount ($) | |
Value ($) | |
North Carolina Medical Care Commission
Prerefunded 11/01/17 Revenue Bonds
Wilson Medical Center
Series 2007
11/01/19 | | | 5.000 | % | | | 3,385,000 | | | | 3,736,803 | | |
Puerto Rico Highways & Transportation Authority
Refunding Revenue Bonds
Series 2003AA Escrowed to Maturity (NPFGC)(b)
07/01/18 | | | 5.500 | % | | | 3,360,000 | | | | 3,824,856 | | |
Total | | | | | | | 32,011,710 | | |
RETIREMENT COMMUNITIES 2.6% | |
North Carolina Medical Care Commission
Refunding Revenue Bonds
1st Mortgage-Givens Estates
Series 2007
07/01/16 | | | 5.000 | % | | | 1,000,000 | | | | 1,037,320 | | |
1st Mortgage-United Church
Series 2015A
09/01/30 | | | 4.500 | % | | | 1,000,000 | | | | 967,640 | | |
1st Mortgage-United Methodist
Series 2013A
10/01/33 | | | 5.000 | % | | | 1,595,000 | | | | 1,640,410 | | |
Pennybyrn at Maryfield
Series 2015
10/01/25 | | | 5.000 | % | | | 1,000,000 | | | | 1,086,270 | | |
Total | | | | | | | 4,731,640 | | |
SPECIAL NON PROPERTY TAX 2.1% | |
Territory of Guam
Revenue Bonds
Series 2011A(b)
01/01/31 | | | 5.000 | % | | | 500,000 | | | | 551,120 | | |
Virgin Islands Public Finance Authority(b)
Refunding Revenue Bonds
Senior Lien
Series 2009B
10/01/25 | | | 5.000 | % | | | 1,500,000 | | | | 1,654,635 | | |
Revenue Bonds
Matching Fund Loan Notes-Senior Lien
Series 2010A
10/01/20 | | | 5.000 | % | | | 1,560,000 | | | | 1,763,018 | | |
Total | | | | | | | 3,968,773 | | |
STATE APPROPRIATED 1.3% | |
State of North Carolina
Refunding Revenue Bonds
Series 2014B
06/01/25 | | | 5.000 | % | | | 2,000,000 | | | | 2,476,000 | | |
Municipal Bonds (continued)
Issue
Description | | Coupon
Rate | | Principal
Amount ($) | |
Value ($) | |
WATER & SEWER 20.1% | |
Cape Fear Public Utility Authority
Revenue Bonds
Series 2008
08/01/20 | | | 5.000 | % | | | 1,000,000 | | | | 1,122,780 | | |
City of Charlotte Water & Sewer System
Revenue Bonds
Series 2008
07/01/23 | | | 5.000 | % | | | 3,000,000 | | | | 3,369,570 | | |
Series 2009B
07/01/25 | | | 5.000 | % | | | 5,835,000 | | | | 6,858,284 | | |
City of Concord Utilities Systems
Refunding Revenue Bonds
Series 2009B
12/01/19 | | | 5.000 | % | | | 1,500,000 | | | | 1,730,955 | | |
City of Gastonia Combined Utilities System
Refunding Revenue Bonds
Series 2009
05/01/17 | | | 4.000 | % | | | 1,205,000 | | | | 1,285,121 | | |
City of Greensboro Combined Water & Sewer System
Refunding Revenue Bonds
Series 2006
06/01/17 | | | 5.250 | % | | | 2,000,000 | | | | 2,188,920 | | |
06/01/22 | | | 5.250 | % | | | 1,200,000 | | | | 1,471,956 | | |
06/01/23 | | | 5.250 | % | | | 2,000,000 | | | | 2,488,440 | | |
City of High Point Combined Water & Sewer System
Revenue Bonds
Series 2008 (AGM)
11/01/24 | | | 5.000 | % | | | 1,000,000 | | | | 1,129,920 | | |
11/01/25 | | | 5.000 | % | | | 1,000,000 | | | | 1,128,450 | | |
City of Raleigh Combined Enterprise System
Revenue Bonds
Series 2006A
03/01/16 | | | 5.000 | % | | | 1,500,000 | | | | 1,559,250 | | |
Series 2011
03/01/27 | | | 5.000 | % | | | 800,000 | | | | 923,944 | | |
City of Raleigh Combined Enterprise System(a)
Refunding Revenue Bonds
Series 2015B
12/01/25 | | | 5.000 | % | | | 1,200,000 | | | | 1,449,468 | | |
City of Thomasville Combined Enterprise System
Refunding Revenue Bonds
Series 2012
05/01/24 | | | 4.000 | % | | | 500,000 | | | | 547,910 | | |
05/01/26 | | | 4.000 | % | | | 860,000 | | | | 924,285 | | |
City of Winston-Salem Water & Sewer System
Refunding Revenue Bonds
Series 2007A
06/01/19 | | | 5.000 | % | | | 3,000,000 | | | | 3,266,940 | | |
Revenue Bonds
Series 2009
06/01/23 | | | 5.000 | % | | | 1,000,000 | | | | 1,147,600 | | |
The accompanying Notes to Financial Statements are an integral part of this statement.
Annual Report 2015
11
COLUMBIA AMT-FREE NORTH CAROLINA INTERMEDIATE MUNI BOND FUND
PORTFOLIO OF INVESTMENTS (continued)
April 30, 2015
Municipal Bonds (continued)
Issue
Description | | Coupon
Rate | | Principal
Amount ($) | |
Value ($) | |
County of Brunswick
Revenue Bonds
Series 2008A
04/01/20 | | | 5.000 | % | | | 1,915,000 | | | | 2,128,599 | | |
04/01/22 | | | 5.000 | % | | | 1,390,000 | | | | 1,541,218 | | |
Town of Cary Combined Utility Systems
Refunding Revenue Bonds
Series 2015
12/01/29 | | | 4.000 | % | | | 1,000,000 | | | | 1,092,950 | | |
Total | | | | | | | 37,356,560 | | |
Total Municipal Bonds
(Cost: $173,325,869) | | | | | | | 184,557,026 | | |
Total Investments
(Cost: $173,325,869) | | | | | | | 184,557,026 | | |
Other Assets & Liabilities, Net | | | | | | | 1,264,676 | | |
Net Assets | | | | | | | 185,821,702 | | |
Notes to Portfolio of Investments
(a) Security, or a portion thereof, has been purchased on a when-issued or delayed delivery basis.
(b) Municipal obligations include debt obligations issued by or on behalf of territories, possessions, or sovereign nations within the territorial boundaries of the United States. At April 30, 2015, the value of these securities amounted to $8,409,662 or 4.53% of net assets.
Abbreviation Legend
AGM Assured Guaranty Municipal Corporation
AMBAC Ambac Assurance Corporation
IBC Insurance Bond Certificate
NPFGC National Public Finance Guarantee Corporation
Fair Value Measurements
Generally accepted accounting principles (GAAP) require disclosure regarding the inputs and valuation techniques used to measure fair value and any changes in valuation inputs or techniques. In addition, investments shall be disclosed by major category.
The Fund categorizes its fair value measurements according to a three-level hierarchy that maximizes the use of observable inputs and minimizes the use of unobservable inputs by prioritizing that the most observable input be used when available. Observable inputs are those that market participants would use in pricing an investment based on market data obtained from sources independent of the reporting entity. Unobservable inputs are those that reflect the Fund's assumptions about the information market participants would use in pricing an investment. An investment's level within the fair value hierarchy is based on the lowest level of any input that is deemed significant to the asset or liability's fair value measurement. The input levels are not necessarily an indication of the risk or liquidity associated with investments at that level. For example, certain U.S. government securities are generally high quality and liquid, however, they are reflected as Level 2 because the inputs used to determine fair value may not always be quoted prices in an active market.
Fair value inputs are summarized in the three broad levels listed below:
> Level 1 — Valuations based on quoted prices for investments in active markets that the Fund has the ability to access at the measurement date (including NAV for open-end mutual funds). Valuation adjustments are not applied to Level 1 investments.
The accompanying Notes to Financial Statements are an integral part of this statement.
Annual Report 2015
12
COLUMBIA AMT-FREE NORTH CAROLINA INTERMEDIATE MUNI BOND FUND
PORTFOLIO OF INVESTMENTS (continued)
April 30, 2015
Fair Value Measurements (continued)
> Level 2 — Valuations based on other significant observable inputs (including quoted prices for similar securities, interest rates, prepayment speeds, credit risks, etc.).
> Level 3 — Valuations based on significant unobservable inputs (including the Fund's own assumptions and judgment in determining the fair value of investments).
Inputs that are used in determining fair value of an investment may include price information, credit data, volatility statistics, and other factors. These inputs can be either observable or unobservable. The availability of observable inputs can vary between investments, and is affected by various factors such as the type of investment, and the volume and level of activity for that investment or similar investments in the marketplace. The inputs will be considered by the Investment Manager, along with any other relevant factors in the calculation of an investment's fair value. The Fund uses prices and inputs that are current as of the measurement date, which may include periods of market dislocations. During these periods, the availability of prices and inputs may be reduced for many investments. This condition could cause an investment to be reclassified between the various levels within the hierarchy.
Investments falling into the Level 3 category are primarily supported by quoted prices from brokers and dealers participating in the market for those investments. However, these may be classified as Level 3 investments due to lack of market transparency and corroboration to support these quoted prices. Additionally, valuation models may be used as the pricing source for any remaining investments classified as Level 3. These models may rely on one or more significant unobservable inputs and/or significant assumptions by the Investment Manager. Inputs used in valuations may include, but are not limited to, financial statement analysis, capital account balances, discount rates and estimated cash flows, and comparable company data.
Under the direction of the Fund's Board of Trustees (the Board), the Investment Manager's Valuation Committee (the Committee) is responsible for overseeing the valuation procedures approved by the Board. The Committee consists of voting and non-voting members from various groups within the Investment Manager's organization, including operations and accounting, trading and investments, compliance, risk management and legal.
The Committee meets at least monthly to review and approve valuation matters, which may include a description of specific valuation determinations, data regarding pricing information received from approved pricing vendors and brokers and the results of Board-approved valuation control policies and procedures (the Policies). The Policies address, among other things, instances when market quotations are or are not readily available, including recommendations of third party pricing vendors and a determination of appropriate pricing methodologies; events that require specific valuation determinations and assessment of fair value techniques; securities with a potential for stale pricing, including those that are illiquid, restricted, or in default; and the effectiveness of third party pricing vendors, including periodic reviews of vendors. The Committee meets more frequently, as needed, to discuss additional valuation matters, which may include the need to review back-testing results, review time-sensitive information or approve related valuation actions. The Committee reports to the Board, with members of the Committee meeting with the Board at each of its regularly scheduled meetings to discuss valuation matters and actions during the period, similar to those described earlier.
For investments categorized as Level 3, the Committee monitors information similar to that described above, which may include: (i) data specific to the issuer or comparable issuers, (ii) general market or specific sector news and (iii) quoted prices and specific or similar security transactions. The Committee considers this data and any changes from prior periods in order to assess the reasonableness of observable and unobservable inputs, any assumptions or internal models used to value those securities and changes in fair value. This data is also used to corroborate, when available, information received from approved pricing vendors and brokers. Various factors impact the frequency of monitoring this information (which may occur as often as daily). However, the Committee may determine that changes to inputs, assumptions and models are not required as a result of the monitoring procedures performed.
The following table is a summary of the inputs used to value the Fund's investments at April 30, 2015:
Description | | Level 1
Quoted Prices in Active
Markets for Identical
Assets ($) | | Level 2
Other Significant
Observable Inputs ($) | | Level 3
Significant
Unobservable Inputs ($) | | Total ($) | |
Bonds | |
Municipal Bonds | | | — | | | | 184,557,026 | | | | — | | | | 184,557,026 | | |
Total Bonds | | | — | | | | 184,557,026 | | | | — | | | | 184,557,026 | | |
Total | | | — | | | | 184,557,026 | | | | — | | | | 184,557,026 | | |
See the Portfolio of Investments for all investment classifications not indicated in the table.
The Fund's assets assigned to the Level 2 input category are generally valued using the market approach, in which a security's value is determined through reference to prices and information from market transactions for similar or identical assets.
There were no transfers of financial assets between levels during the period.
The accompanying Notes to Financial Statements are an integral part of this statement.
Annual Report 2015
13
COLUMBIA AMT-FREE NORTH CAROLINA INTERMEDIATE MUNI BOND FUND
STATEMENT OF ASSETS AND LIABILITIES
April 30, 2015
Assets | |
Investments, at value | |
(identified cost $173,325,869) | | $ | 184,557,026 | | |
Cash | | | 5,113,770 | | |
Receivable for: | |
Capital shares sold | | | 232,433 | | |
Interest | | | 2,324,214 | | |
Expense reimbursement due from Investment Manager | | | 741 | | |
Prepaid expenses | | | 691 | | |
Total assets | | | 192,228,875 | | |
Liabilities | |
Payable for: | |
Investments purchased | | | 540,655 | | |
Investments purchased on a delayed delivery basis | | | 4,400,941 | | |
Capital shares purchased | | | 846,828 | | |
Dividend distributions to shareholders | | | 435,642 | | |
Investment management fees | | | 2,046 | | |
Distribution and/or service fees | | | 371 | | |
Transfer agent fees | | | 31,240 | | |
Administration fees | | | 358 | | |
Compensation of board members | | | 117,941 | | |
Other expenses | | | 31,151 | | |
Total liabilities | | | 6,407,173 | | |
Net assets applicable to outstanding capital stock | | $ | 185,821,702 | | |
Represented by | |
Paid-in capital | | $ | 176,710,729 | | |
Undistributed net investment income | | | 737,032 | | |
Accumulated net realized loss | | | (2,857,216 | ) | |
Unrealized appreciation (depreciation) on: | |
Investments | | | 11,231,157 | | |
Total — representing net assets applicable to outstanding capital stock | | $ | 185,821,702 | | |
The accompanying Notes to Financial Statements are an integral part of this statement.
Annual Report 2015
14
COLUMBIA AMT-FREE NORTH CAROLINA INTERMEDIATE MUNI BOND FUND
STATEMENT OF ASSETS AND LIABILITIES (continued)
April 30, 2015
Class A | |
Net assets | | $ | 24,948,054 | | |
Shares outstanding | | | 2,358,235 | | |
Net asset value per share | | $ | 10.58 | | |
Maximum offering price per share(a) | | $ | 10.91 | | |
Class B | |
Net assets | | $ | 93,537 | | |
Shares outstanding | | | 8,840 | | |
Net asset value per share | | $ | 10.58 | | |
Class C | |
Net assets | | $ | 7,226,943 | | |
Shares outstanding | | | 683,343 | | |
Net asset value per share | | $ | 10.58 | | |
Class R4 | |
Net assets | | $ | 3,675,230 | | |
Shares outstanding | | | 347,803 | | |
Net asset value per share | | $ | 10.57 | | |
Class Z | |
Net assets | | $ | 149,877,938 | | |
Shares outstanding | | | 14,180,086 | | |
Net asset value per share | | $ | 10.57 | | |
(a) The maximum offering price per share is calculated by dividing the net asset value per share by 1.0 minus the maximum sales charge of 3.00%.
The accompanying Notes to Financial Statements are an integral part of this statement.
Annual Report 2015
15
COLUMBIA AMT-FREE NORTH CAROLINA INTERMEDIATE MUNI BOND FUND
STATEMENT OF OPERATIONS
Year Ended April 30, 2015
Net investment income | |
Income: | |
Dividends | | $ | 152 | | |
Interest | | | 6,192,006 | | |
Total income | | | 6,192,158 | | |
Expenses: | |
Investment management fees | | | 712,383 | | |
Distribution and/or service fees | |
Class A | | | 66,929 | | |
Class B | | | 944 | | |
Class C | | | 71,691 | | |
Transfer agent fees | |
Class A | | | 53,841 | | |
Class B | | | 190 | | |
Class C | | | 14,455 | | |
Class R4 | | | 5,763 | | |
Class Z | | | 285,289 | | |
Administration fees | | | 124,667 | | |
Compensation of board members | | | 20,716 | | |
Custodian fees | | | 2,168 | | |
Printing and postage fees | | | 25,836 | | |
Registration fees | | | 17,328 | | |
Professional fees | | | 32,885 | | |
Other | | | 10,126 | | |
Total expenses | | | 1,445,211 | | |
Fees waived or expenses reimbursed by Investment Manager and its affiliates | | | (308,313 | ) | |
Total net expenses | | | 1,136,898 | | |
Net investment income | | | 5,055,260 | | |
Realized and unrealized gain (loss) — net | |
Net realized gain (loss) on: | |
Investments | | | 251,729 | | |
Net realized gain | | | 251,729 | | |
Net change in unrealized appreciation (depreciation) on: | |
Investments | | | (883,590 | ) | |
Net change in unrealized depreciation | | | (883,590 | ) | |
Net realized and unrealized loss | | | (631,861 | ) | |
Net increase in net assets resulting from operations | | $ | 4,423,399 | | |
The accompanying Notes to Financial Statements are an integral part of this statement.
Annual Report 2015
16
COLUMBIA AMT-FREE NORTH CAROLINA INTERMEDIATE MUNI BOND FUND
STATEMENT OF CHANGES IN NET ASSETS
| | | Year Ended
April 30,
2015 | | Year Ended
April 30,
2014 | |
Operations | |
Net investment income | | $ | 5,055,260 | | | $ | 5,294,452 | | |
Net realized gain (loss) | | | 251,729 | | | | (432,106 | ) | |
Net change in unrealized depreciation | | | (883,590 | ) | | | (6,609,611 | ) | |
Net increase (decrease) in net assets resulting from operations | | | 4,423,399 | | | | (1,747,265 | ) | |
Distributions to shareholders | |
Net investment income | |
Class A | | | (714,735 | ) | | | (856,844 | ) | |
Class B | | | (1,815 | ) | | | (2,381 | ) | |
Class C | | | (137,325 | ) | | | (152,273 | ) | |
Class R4 | | | (82,530 | ) | | | (21,441 | ) | |
Class Z | | | (4,118,853 | ) | | | (4,261,513 | ) | |
Total distributions to shareholders | | | (5,055,258 | ) | | | (5,294,452 | ) | |
Increase (decrease) in net assets from capital stock activity | | | 24,382,599 | | | | (40,397,421 | ) | |
Total increase (decrease) in net assets | | | 23,750,740 | | | | (47,439,138 | ) | |
Net assets at beginning of year | | | 162,070,962 | | | | 209,510,100 | | |
Net assets at end of year | | $ | 185,821,702 | | | $ | 162,070,962 | | |
Undistributed net investment income | | $ | 737,032 | | | $ | 737,030 | | |
The accompanying Notes to Financial Statements are an integral part of this statement.
Annual Report 2015
17
COLUMBIA AMT-FREE NORTH CAROLINA INTERMEDIATE MUNI BOND FUND
STATEMENT OF CHANGES IN NET ASSETS (continued)
| | | Year Ended April 30, 2015 | | Year Ended April 30, 2014 | |
| | | Shares | | Dollars ($) | | Shares | | Dollars ($) | |
Capital stock activity | |
Class A shares | |
Subscriptions(a) | | | 306,247 | | | | 3,260,068 | | | | 487,517 | | | | 5,110,376 | | |
Distributions reinvested | | | 52,179 | | | | 556,388 | | | | 62,988 | | | | 661,759 | | |
Redemptions | | | (619,752 | ) | | | (6,604,486 | ) | | | (1,116,020 | ) | | | (11,686,687 | ) | |
Net decrease | | | (261,326 | ) | | | (2,788,030 | ) | | | (565,515 | ) | | | (5,914,552 | ) | |
Class B shares | |
Subscriptions | | | 32 | | | | 346 | | | | 37 | | | | 394 | | |
Distributions reinvested | | | 138 | | | | 1,468 | | | | 189 | | | | 1,985 | | |
Redemptions(a) | | | (941 | ) | | | (10,006 | ) | | | (3,351 | ) | | | (35,161 | ) | |
Net decrease | | | (771 | ) | | | (8,192 | ) | | | (3,125 | ) | | | (32,782 | ) | |
Class C shares | |
Subscriptions | | | 116,994 | | | | 1,245,308 | | | | 124,421 | | | | 1,309,987 | | |
Distributions reinvested | | | 11,000 | | | | 117,262 | | | | 12,008 | | | | 126,099 | | |
Redemptions | | | (105,964 | ) | | | (1,128,848 | ) | | | (268,833 | ) | | | (2,806,963 | ) | |
Net increase (decrease) | | | 22,030 | | | | 233,722 | | | | (132,404 | ) | | | (1,370,877 | ) | |
Class R4 shares | |
Subscriptions | | | 232,452 | | | | 2,475,600 | | | | 182,189 | | | | 1,914,667 | | |
Distributions reinvested | | | 7,699 | | | | 81,999 | | | | 2,033 | | | | 21,343 | | |
Redemptions | | | (56,213 | ) | | | (600,038 | ) | | | (20,588 | ) | | | (214,599 | ) | |
Net increase | | | 183,938 | | | | 1,957,561 | | | | 163,634 | | | | 1,721,411 | | |
Class Z shares | |
Subscriptions | | | 4,305,279 | | | | 45,808,782 | | | | 2,519,806 | | | | 26,520,764 | | |
Distributions reinvested | | | 54,896 | | | | 584,785 | | | | 53,774 | | | | 564,454 | | |
Redemptions | | | (2,010,575 | ) | | | (21,406,029 | ) | | | (5,911,569 | ) | | | (61,885,839 | ) | |
Net increase (decrease) | | | 2,349,600 | | | | 24,987,538 | | | | (3,337,989 | ) | | | (34,800,621 | ) | |
Total net increase (decrease) | | | 2,293,471 | | | | 24,382,599 | | | | (3,875,399 | ) | | | (40,397,421 | ) | |
(a) Includes conversions of Class B shares to Class A shares, if any.
The accompanying Notes to Financial Statements are an integral part of this statement.
Annual Report 2015
18
COLUMBIA AMT-FREE NORTH CAROLINA INTERMEDIATE MUNI BOND FUND
The following tables are intended to help you understand the Fund's financial performance. Certain information reflects financial results for a single share of a class held for the periods shown. Per share net investment income (loss) amounts are calculated based on average shares outstanding during the period. Total return assumes reinvestment of all dividends and distributions, if any. Total return does not reflect payment of sales charges, if any. Total return and portfolio turnover are not annualized for periods of less than one year. The portfolio turnover rate is calculated without regard to purchase and sales transactions of short-term instruments and certain derivatives, if any. If such transactions were included, the Fund's portfolio turnover rate may be higher.
| | | Year Ended April 30, | | Year Ended March 31, | |
Class A | | 2015 | | 2014 | | 2013 | | 2012(a) | | 2012 | | 2011 | |
Per share data | |
Net asset value, beginning of period | | $ | 10.61 | | | $ | 10.94 | | | $ | 10.84 | | | $ | 10.74 | | | $ | 10.13 | | | $ | 10.17 | | |
Income from investment operations: | |
Net investment income | | | 0.28 | | | | 0.30 | | | | 0.28 | | | | 0.02 | | | | 0.30 | | | | 0.31 | | |
Net realized and unrealized gain (loss) | | | (0.03 | ) | | | (0.33 | ) | | | 0.10 | | | | 0.10 | | | | 0.61 | | | | (0.04 | ) | |
Total from investment operations | | | 0.25 | | | | (0.03 | ) | | | 0.38 | | | | 0.12 | | | | 0.91 | | | | 0.27 | | |
Less distributions to shareholders: | |
Net investment income | | | (0.28 | ) | | | (0.30 | ) | | | (0.28 | ) | | | (0.02 | ) | | | (0.30 | ) | | | (0.31 | ) | |
Total distributions to shareholders | | | (0.28 | ) | | | (0.30 | ) | | | (0.28 | ) | | | (0.02 | ) | | | (0.30 | ) | | | (0.31 | ) | |
Net asset value, end of period | | $ | 10.58 | | | $ | 10.61 | | | $ | 10.94 | | | $ | 10.84 | | | $ | 10.74 | | | $ | 10.13 | | |
Total return | | | 2.41 | % | | | (0.22 | %) | | | 3.57 | % | | | 1.15 | % | | | 9.02 | % | | | 2.61 | % | |
Ratios to average net assets(b) | |
Total gross expenses | | | 0.98 | % | | | 0.99 | % | | | 0.97 | % | | | 0.96 | %(c) | | | 1.00 | % | | | 0.94 | % | |
Total net expenses(d) | | | 0.81 | % | | | 0.81 | % | | | 0.80 | % | | | 0.79 | %(c) | | | 0.79 | % | | | 0.80 | %(e) | |
Net investment income | | | 2.67 | % | | | 2.84 | % | | | 2.59 | % | | | 2.65 | %(c) | | | 2.80 | % | | | 2.97 | % | |
Supplemental data | |
Net assets, end of period (in thousands) | | $ | 24,948 | | | $ | 27,797 | | | $ | 34,852 | | | $ | 33,601 | | | $ | 33,061 | | | $ | 31,731 | | |
Portfolio turnover | | | 6 | % | | | 3 | % | | | 10 | % | | | 1 | % | | | 4 | % | | | 16 | % | |
Notes to Financial Highlights
(a) For the period from April 1, 2012 to April 30, 2012. During the period, the Fund's fiscal year end was changed from March 31 to April 30.
(b) In addition to the fees and expenses that the Fund bears directly, the Fund indirectly bears a pro rata share of the fees and expenses of any other funds in which it invests. Such indirect expenses are not included in the Fund's reported expense ratios.
(c) Annualized.
(d) Total net expenses include the impact of certain fee waivers/expense reimbursements made by the Investment Manager and certain of its affiliates, if applicable.
(e) The benefits derived from expense reductions had an impact of less than 0.01%.
The accompanying Notes to Financial Statements are an integral part of this statement.
Annual Report 2015
19
COLUMBIA AMT-FREE NORTH CAROLINA INTERMEDIATE MUNI BOND FUND
FINANCIAL HIGHLIGHTS (continued)
| | | Year Ended April 30, | | Year Ended March 31, | |
Class B | | 2015 | | 2014 | | 2013 | | 2012(a) | | 2012 | | 2011 | |
Per share data | |
Net asset value, beginning of period | | $ | 10.61 | | | $ | 10.94 | | | $ | 10.84 | | | $ | 10.74 | | | $ | 10.13 | | | $ | 10.17 | | |
Income from investment operations: | |
Net investment income | | | 0.20 | | | | 0.22 | | | | 0.20 | | | | 0.02 | | | | 0.22 | | | | 0.23 | | |
Net realized and unrealized gain (loss) | | | (0.03 | ) | | | (0.33 | ) | | | 0.10 | | | | 0.10 | | | | 0.59 | | | | (0.04 | ) | |
Total from investment operations | | | 0.17 | | | | (0.11 | ) | | | 0.30 | | | | 0.12 | | | | 0.81 | | | | 0.19 | | |
Less distributions to shareholders: | |
Net investment income | | | (0.20 | ) | | | (0.22 | ) | | | (0.20 | ) | | | (0.02 | ) | | | (0.20 | ) | | | (0.23 | ) | |
Total distributions to shareholders | | | (0.20 | ) | | | (0.22 | ) | | | (0.20 | ) | | | (0.02 | ) | | | (0.20 | ) | | | (0.23 | ) | |
Net asset value, end of period | | $ | 10.58 | | | $ | 10.61 | | | $ | 10.94 | | | $ | 10.84 | | | $ | 10.74 | | | $ | 10.13 | | |
Total return | | | 1.65 | % | | | (0.96 | %) | | | 2.80 | % | | | 1.09 | % | | | 8.07 | % | | | 1.85 | % | |
Ratios to average net assets(b) | |
Total gross expenses | | | 1.73 | % | | | 1.74 | % | | | 1.72 | % | | | 1.71 | %(c) | | | 1.82 | % | | | 1.69 | % | |
Total net expenses(d) | | | 1.56 | % | | | 1.56 | % | | | 1.55 | % | | | 1.54 | %(c) | | | 1.55 | % | | | 1.55 | %(e) | |
Net investment income | | | 1.92 | % | | | 2.09 | % | | | 1.85 | % | | | 1.90 | %(c) | | | 2.08 | % | | | 2.22 | % | |
Supplemental data | |
Net assets, end of period (in thousands) | | $ | 94 | | | $ | 102 | | | $ | 139 | | | $ | 185 | | | $ | 183 | | | $ | 554 | | |
Portfolio turnover | | | 6 | % | | | 3 | % | | | 10 | % | | | 1 | % | | | 4 | % | | | 16 | % | |
Notes to Financial Highlights
(a) For the period from April 1, 2012 to April 30, 2012. During the period, the Fund's fiscal year end was changed from March 31 to April 30.
(b) In addition to the fees and expenses that the Fund bears directly, the Fund indirectly bears a pro rata share of the fees and expenses of any other funds in which it invests. Such indirect expenses are not included in the Fund's reported expense ratios.
(c) Annualized.
(d) Total net expenses include the impact of certain fee waivers/expense reimbursements made by the Investment Manager and certain of its affiliates, if applicable.
(e) The benefits derived from expense reductions had an impact of less than 0.01%.
The accompanying Notes to Financial Statements are an integral part of this statement.
Annual Report 2015
20
COLUMBIA AMT-FREE NORTH CAROLINA INTERMEDIATE MUNI BOND FUND
FINANCIAL HIGHLIGHTS (continued)
| | | Year Ended April 30, | | Year Ended March 31, | |
Class C | | 2015 | | 2014 | | 2013 | | 2012(a) | | 2012 | | 2011 | |
Per share data | |
Net asset value, beginning of period | | $ | 10.61 | | | $ | 10.94 | | | $ | 10.83 | | | $ | 10.74 | | | $ | 10.13 | | | $ | 10.17 | | |
Income from investment operations: | |
Net investment income | | | 0.20 | | | | 0.22 | | | | 0.20 | | | | 0.02 | | | | 0.21 | | | | 0.23 | | |
Net realized and unrealized gain (loss) | | | (0.03 | ) | | | (0.33 | ) | | | 0.11 | | | | 0.09 | | | | 0.62 | | | | (0.04 | ) | |
Total from investment operations | | | 0.17 | | | | (0.11 | ) | | | 0.31 | | | | 0.11 | | | | 0.83 | | | | 0.19 | | |
Less distributions to shareholders: | |
Net investment income | | | (0.20 | ) | | | (0.22 | ) | | | (0.20 | ) | | | (0.02 | ) | | | (0.22 | ) | | | (0.23 | ) | |
Total distributions to shareholders | | | (0.20 | ) | | | (0.22 | ) | | | (0.20 | ) | | | (0.02 | ) | | | (0.22 | ) | | | (0.23 | ) | |
Net asset value, end of period | | $ | 10.58 | | | $ | 10.61 | | | $ | 10.94 | | | $ | 10.83 | | | $ | 10.74 | | | $ | 10.13 | | |
Total return | | | 1.65 | % | | | (0.96 | %) | | | 2.89 | % | | | 0.99 | % | | | 8.23 | % | | | 1.84 | % | |
Ratios to average net assets(b) | |
Total gross expenses | | | 1.73 | % | | | 1.74 | % | | | 1.72 | % | | | 1.71 | %(c) | | | 1.74 | % | | | 1.69 | % | |
Total net expenses(d) | | | 1.56 | % | | | 1.56 | % | | | 1.55 | % | | | 1.54 | %(c) | | | 1.54 | % | | | 1.55 | %(e) | |
Net investment income | | | 1.92 | % | | | 2.09 | % | | | 1.84 | % | | | 1.90 | %(c) | | | 2.03 | % | | | 2.22 | % | |
Supplemental data | |
Net assets, end of period (in thousands) | | $ | 7,227 | | | $ | 7,015 | | | $ | 8,683 | | | $ | 8,222 | | | $ | 8,112 | | | $ | 5,270 | | |
Portfolio turnover | | | 6 | % | | | 3 | % | | | 10 | % | | | 1 | % | | | 4 | % | | | 16 | % | |
Notes to Financial Highlights
(a) For the period from April 1, 2012 to April 30, 2012. During the period, the Fund's fiscal year end was changed from March 31 to April 30.
(b) In addition to the fees and expenses that the Fund bears directly, the Fund indirectly bears a pro rata share of the fees and expenses of any other funds in which it invests. Such indirect expenses are not included in the Fund's reported expense ratios.
(c) Annualized.
(d) Total net expenses include the impact of certain fee waivers/expense reimbursements made by the Investment Manager and certain of its affiliates, if applicable.
(e) The benefits derived from expense reductions had an impact of less than 0.01%.
The accompanying Notes to Financial Statements are an integral part of this statement.
Annual Report 2015
21
COLUMBIA AMT-FREE NORTH CAROLINA INTERMEDIATE MUNI BOND FUND
FINANCIAL HIGHLIGHTS (continued)
| | | Year Ended April 30, | |
Class R4 | | 2015 | | 2014 | | 2013(a) | |
Per share data | |
Net asset value, beginning of period | | $ | 10.60 | | | $ | 10.93 | | | $ | 10.85 | | |
Income from investment operations: | |
Net investment income | | | 0.31 | | | | 0.33 | | | | 0.04 | | |
Net realized and unrealized gain (loss) | | | (0.03 | ) | | | (0.33 | ) | | | 0.08 | | |
Total from investment operations | | | 0.28 | | | | — | | | | 0.12 | | |
Less distributions to shareholders: | |
Net investment income | | | (0.31 | ) | | | (0.33 | ) | | | (0.04 | ) | |
Total distributions to shareholders | | | (0.31 | ) | | | (0.33 | ) | | | (0.04 | ) | |
Net asset value, end of period | | $ | 10.57 | | | $ | 10.60 | | | $ | 10.93 | | |
Total return | | | 2.67 | % | | | 0.03 | % | | | 1.07 | % | |
Ratios to average net assets(b) | |
Total gross expenses | | | 0.74 | % | | | 0.76 | % | | | 0.60 | %(c) | |
Total net expenses(d) | | | 0.56 | % | | | 0.56 | % | | | 0.52 | %(c) | |
Net investment income | | | 2.92 | % | | | 3.17 | % | | | 2.98 | %(c) | |
Supplemental data | |
Net assets, end of period (in thousands) | | $ | 3,675 | | | $ | 1,737 | | | $ | 3 | | |
Portfolio turnover | | | 6 | % | | | 3 | % | | | 10 | % | |
Notes to Financial Highlights
(a) Based on operations from March 19, 2013 (commencement of operations) through the stated period end.
(b) In addition to the fees and expenses that the Fund bears directly, the Fund indirectly bears a pro rata share of the fees and expenses of any other funds in which it invests. Such indirect expenses are not included in the Fund's reported expense ratios.
(c) Annualized.
(d) Total net expenses include the impact of certain fee waivers/expense reimbursements made by the Investment Manager and certain of its affiliates, if applicable.
The accompanying Notes to Financial Statements are an integral part of this statement.
Annual Report 2015
22
COLUMBIA AMT-FREE NORTH CAROLINA INTERMEDIATE MUNI BOND FUND
FINANCIAL HIGHLIGHTS (continued)
| | | Year Ended April 30, | | Year Ended March 31, | |
Class Z | | 2015 | | 2014 | | 2013 | | 2012(a) | | 2012 | | 2011 | |
Per share data | |
Net asset value, beginning of period | | $ | 10.60 | | | $ | 10.93 | | | $ | 10.83 | | | $ | 10.73 | | | $ | 10.12 | | | $ | 10.17 | | |
Income from investment operations: | |
Net investment income | | | 0.31 | | | | 0.32 | | | | 0.31 | | | | 0.03 | | | | 0.32 | | | | 0.33 | | |
Net realized and unrealized gain (loss) | | | (0.03 | ) | | | (0.32 | ) | | | 0.10 | | | | 0.10 | | | | 0.61 | | | | (0.05 | ) | |
Total from investment operations | | | 0.28 | | | | — | | | | 0.41 | | | | 0.13 | | | | 0.93 | | | | 0.28 | | |
Less distributions to shareholders: | |
Net investment income | | | (0.31 | ) | | | (0.33 | ) | | | (0.31 | ) | | | (0.03 | ) | | | (0.32 | ) | | | (0.33 | ) | |
Total distributions to shareholders | | | (0.31 | ) | | | (0.33 | ) | | | (0.31 | ) | | | (0.03 | ) | | | (0.32 | ) | | | (0.33 | ) | |
Net asset value, end of period | | $ | 10.57 | | | $ | 10.60 | | | $ | 10.93 | | | $ | 10.83 | | | $ | 10.73 | | | $ | 10.12 | | |
Total return | | | 2.67 | % | | | 0.03 | % | | | 3.83 | % | | | 1.17 | % | | | 9.30 | % | | | 2.76 | % | |
Ratios to average net assets(b) | |
Total gross expenses | | | 0.73 | % | | | 0.74 | % | | | 0.72 | % | | | 0.71 | %(c) | | | 0.74 | % | | | 0.69 | % | |
Total net expenses(d) | | | 0.56 | % | | | 0.56 | % | | | 0.55 | % | | | 0.54 | %(c) | | | 0.54 | % | | | 0.55 | %(e) | |
Net investment income | | | 2.92 | % | | | 3.09 | % | | | 2.84 | % | | | 2.90 | %(c) | | | 3.05 | % | | | 3.22 | % | |
Supplemental data | |
Net assets, end of period (in thousands) | | $ | 149,878 | | | $ | 125,420 | | | $ | 165,833 | | | $ | 178,425 | | | $ | 178,204 | | | $ | 160,427 | | |
Portfolio turnover | | | 6 | % | | | 3 | % | | | 10 | % | | | 1 | % | | | 4 | % | | | 16 | % | |
Notes to Financial Highlights
(a) For the period from April 1, 2012 to April 30, 2012. During the period, the Fund's fiscal year end was changed from March 31 to April 30.
(b) In addition to the fees and expenses that the Fund bears directly, the Fund indirectly bears a pro rata share of the fees and expenses of any other funds in which it invests. Such indirect expenses are not included in the Fund's reported expense ratios.
(c) Annualized.
(d) Total net expenses include the impact of certain fee waivers/expense reimbursements made by the Investment Manager and certain of its affiliates, if applicable.
(e) The benefits derived from expense reductions had an impact of less than 0.01%.
The accompanying Notes to Financial Statements are an integral part of this statement.
Annual Report 2015
23
COLUMBIA AMT-FREE NORTH CAROLINA INTERMEDIATE MUNI BOND FUND
NOTES TO FINANCIAL STATEMENTS
April 30, 2015
Note 1. Organization
Columbia AMT-Free North Carolina Intermediate Muni Bond Fund (formerly known as Columbia North Carolina Intermediate Municipal Bond Fund) (the Fund), a series of Columbia Funds Series Trust (the Trust), is a diversified fund. The Trust is registered under the Investment Company Act of 1940, as amended (the 1940 Act), as an open-end management investment company organized as a Delaware statutory trust. Effective July 7, 2014, Columbia North Carolina Intermediate Municipal Bond Fund was renamed Columbia AMT-Free North Carolina Intermediate Muni Bond Fund.
Fund Shares
The Trust may issue an unlimited number of shares (without par value). The Fund offers Class A, Class B, Class C, Class R4 and Class Z shares. Although all share classes generally have identical voting, dividend and liquidation rights, each share class votes separately when required by the Trust's organizational documents or by law. Different share classes pay different distribution amounts to the extent the expenses of such share classes differ, and distributions in liquidation will be proportional to the net asset value of each share class. Each share class has its own expense structure and sales charges.
Class A shares are subject to a maximum front-end sales charge of 3.00% based on the initial investment amount. In addition, Class A shares purchased on or after February 19, 2015 are subject to a contingent deferred sales charge (CDSC) of 0.75% on certain investments of $500,000 or more if redeemed within 12 months after purchase. Redemptions of Class A shares purchased prior to February 19, 2015, without an initial sales charge in accounts aggregating $1 million to $50 million at the time of purchase, are subject to a CDSC of 1.00% if redeemed within 12 months after purchase, and 0.50% if redeemed more than 12, but less than 18, months after purchase.
Class B shares may be subject to a maximum CDSC of 3.00% based upon the holding period after purchase. Class B shares will generally convert to Class A shares eight years after purchase. The Fund no longer accepts investments by new or existing investors in the Fund's Class B shares, except in connection with the reinvestment of any dividend and/or capital gain distributions in Class B shares of the Fund and exchanges by existing Class B shareholders of certain other funds within the Columbia Family of Funds.
Class C shares are subject to a 1.00% CDSC on shares redeemed within one year after purchase.
Class R4 shares are not subject to sales charges and are generally available only to omnibus retirement plans and certain investors as described in the Fund's prospectus.
Class Z shares are not subject to sales charges and are available only to eligible investors, which are subject to different investment minimums as described in the Fund's prospectus.
Note 2. Summary of Significant Accounting Policies
Basis of Preparation
The Fund is an investment company that applies the accounting and reporting guidance in the Financial Accounting Standards Board (FASB) Accounting Standards Codification Topic 946, Financial Services — Investment Companies (ASC 946). The financial statements are prepared in accordance with U.S. generally accepted accounting principles (GAAP), which requires management to make certain estimates and assumptions that affect the reported amounts of assets and liabilities, the disclosure of contingent assets and liabilities at the date of the financial statements and the reported amounts of income and expenses during the reporting period. Actual results could differ from those estimates.
The following is a summary of significant accounting policies followed by the Fund in the preparation of its financial statements.
Security Valuation
Debt securities generally are valued by pricing services approved by the Board of Trustees (the Board) based upon market transactions for normal, institutional-size trading units of similar securities. The services may use various pricing techniques that take into account, as applicable, factors such as yield, quality, coupon rate, maturity, type of issue, trading characteristics and other data, as well as broker quotes. Debt securities for which quotations are readily available may also be valued based upon an over-the-counter or exchange bid quotation.
Investments for which market quotations are not readily available, or that have quotations which management believes are not reliable, are valued at fair value as determined in good faith under procedures established by and under the general supervision of the Board. If a
Annual Report 2015
24
COLUMBIA AMT-FREE NORTH CAROLINA INTERMEDIATE MUNI BOND FUND
NOTES TO FINANCIAL STATEMENTS (continued)
April 30, 2015
security or class of securities (such as foreign securities) is valued at fair value, such value is likely to be different from the quoted or published price for the security.
The determination of fair value often requires significant judgment. To determine fair value, management may use assumptions including but not limited to future cash flows and estimated risk premiums. Multiple inputs from various sources may be used to determine fair value.
Delayed Delivery Securities
The Fund may trade securities on other than normal settlement terms, including securities purchased or sold on a "when-issued" basis. This may increase risk to the Fund since the other party to the transaction may fail to deliver which could cause the Fund to subsequently invest at less advantageous prices. The Fund designates cash or liquid securities in an amount equal to the delayed delivery commitment.
Security Transactions
Security transactions are accounted for on the trade date. Cost is determined and gains (losses) are based upon the specific identification method for both financial statement and federal income tax purposes.
Income Recognition
Interest income is recorded on an accrual basis. Market premiums and discounts, including original issue discounts, are amortized and accreted, respectively, over the expected life of the security on all debt securities, unless otherwise noted.
The Fund may place a debt security on non-accrual status and reduce related interest income when it becomes probable that the interest will not be collected and the amount of uncollectible interest can be reasonably estimated. A defaulted debt security is removed from non-accrual status when the issuer resumes interest payments or when collectability of interest is reasonably assured.
Dividend income is recorded on the ex-dividend date.
Expenses
General expenses of the Trust are allocated to the Fund and other funds of the Trust based upon relative net assets or other expense allocation methodologies determined by the nature of the expense. Expenses directly attributable to the Fund are charged to the Fund. Expenses directly attributable to a specific class of shares are charged to that share class.
Determination of Class Net Asset Value
All income, expenses (other than class-specific expenses, which are charged to that share class, as shown in the Statement of Operations) and realized and unrealized gains (losses) are allocated to each class of the Fund on a daily basis, based on the relative net assets of each class, for purposes of determining the net asset value of each class.
Federal Income Tax Status
The Fund intends to qualify each year as a regulated investment company under Subchapter M of the Internal Revenue Code, as amended, and will distribute substantially all of its tax exempt and taxable income (including net short-term capital gains), if any, for its tax year, and as such will not be subject to federal income taxes. In addition, the Fund intends to distribute in each calendar year substantially all of its net investment income, capital gains and certain other amounts, if any, such that the Fund should not be subject to federal excise tax. Therefore, no federal income or excise tax provision is recorded.
Distributions to Shareholders
Distributions from net investment income, if any, are declared daily and paid monthly. Net realized capital gains, if any, are distributed at least annually. Income distributions and capital gain distributions are determined in accordance with federal income tax regulations, which may differ from GAAP.
Guarantees and Indemnifications
Under the Trust's organizational documents and, in some cases, by contract, its officers and trustees are indemnified against certain liabilities arising out of the performance of their duties to the Trust or its funds. In addition, certain of the Fund's contracts with its service providers contain general indemnification clauses. The Fund's maximum exposure under these arrangements is unknown since the amount of any future claims that may be made against the Fund cannot be determined, and the Fund has no historical basis for predicting the likelihood of any such claims.
Note 3. Fees and Compensation Paid to Affiliates
Investment Management Fees
Under an Investment Management Services Agreement, Columbia Management Investment Advisers, LLC (the Investment Manager), a wholly-owned subsidiary of
Annual Report 2015
25
COLUMBIA AMT-FREE NORTH CAROLINA INTERMEDIATE MUNI BOND FUND
NOTES TO FINANCIAL STATEMENTS (continued)
April 30, 2015
Ameriprise Financial, Inc. (Ameriprise Financial), determines which securities will be purchased, held or sold. The investment management fee is an annual fee that is equal to a percentage of the Fund's average daily net assets that declines from 0.40% to 0.27% as the Fund's net assets increase. The effective investment management fee rate for the year ended April 30, 2015 was 0.40% of the Fund's average daily net assets.
Administration Fees
Under an Administrative Services Agreement, the Investment Manager also serves as the Fund Administrator. The Fund pays the Fund Administrator an annual fee for administration and accounting services equal to a percentage of the Fund's average daily net assets that declines from 0.07% to 0.04% as the Fund's net assets increase. The effective administration fee rate for the year ended April 30, 2015 was 0.07% of the Fund's average daily net assets.
Other Expenses
Other expenses are for, among other things, miscellaneous expenses of the Fund or the Board, including payments to a company providing limited administrative services to the Fund and the Board. That company's expenses include boardroom and office expense, employee compensation, employee health and retirement benefits, and certain other expenses. For the year ended April 30, 2015, other expenses paid by the Fund to this company were $1,408.
Compensation of Board Members
Board members are compensated for their services to the Fund as disclosed in the Statement of Operations. Under a Deferred Compensation Plan (the Plan), the Board members who are not "interested persons" of the Fund, as defined under the 1940 Act, may elect to defer payment of up to 100% of their compensation. Deferred amounts are treated as though equivalent dollar amounts had been invested in shares of certain funds managed by the Investment Manager. The Fund's liability for these amounts is adjusted for market value changes and remains in the Fund until distributed in accordance with the Plan.
Transfer Agent Fees
Under a Transfer and Dividend Disbursing Agent Agreement, Columbia Management Investment Services Corp. (the Transfer Agent), an affiliate of the Investment Manager and a wholly-owned subsidiary of Ameriprise Financial, is responsible for providing transfer agency
services to the Fund. The Transfer Agent has contracted with Boston Financial Data Services (BFDS) to serve as sub-transfer agent.
Effective November 1, 2014, the Transfer Agent receives a monthly transfer agency fee based on the number or the average value of accounts, depending on the type of account. Prior to November 1, 2014, the Transfer Agent received a monthly account-based service fee based on the number of open accounts. In addition, the Transfer Agent also receives sub-transfer agency fees based on a percentage of the average aggregate value of the Fund's shares maintained in omnibus accounts (other than omnibus accounts for which American Enterprise Investment Services Inc. is the broker of record or accounts where the beneficial shareholder is a customer of Ameriprise Financial Services, Inc., for which the Transfer Agent receives a per account fee). The Transfer Agent pays the fees of BFDS for services as sub-transfer agent and is not entitled to reimbursement for such fees from the Fund (with the exception of out-of-pocket fees).
The Transfer Agent also receives compensation from the Fund for various shareholder services and reimbursements for certain out-of-pocket fees.
For the year ended April 30, 2015, the Fund's effective transfer agent fee rates as a percentage of average daily net assets of each class were as follows:
Class A | | | 0.20 | % | |
Class B | | | 0.20 | | |
Class C | | | 0.20 | | |
Class R4 | | | 0.20 | | |
Class Z | | | 0.20 | | |
An annual minimum account balance fee of $20 may apply to certain accounts with a value below the applicable share class's initial minimum investment requirements to reduce the impact of small accounts on transfer agent fees. These minimum account balance fees are remitted to the Fund and recorded as part of expense reductions in the Statement of Operations. For the year ended April 30, 2015, no minimum account balance fees were charged by the Fund.
Distribution and Service Fees
The Fund has an agreement with Columbia Management Investment Distributors, Inc. (the Distributor), an affiliate of the Investment Manager and a wholly-owned subsidiary of Ameriprise Financial, for distribution and shareholder services. The Board has approved, and the Fund has adopted, distribution and shareholder service
Annual Report 2015
26
COLUMBIA AMT-FREE NORTH CAROLINA INTERMEDIATE MUNI BOND FUND
NOTES TO FINANCIAL STATEMENTS (continued)
April 30, 2015
plans (the Plans) applicable to certain share classes, which set the distribution and service fees for the Fund. These fees are calculated daily and are intended to compensate the Distributor and/or eligible selling and/or servicing agents for selling shares of the Fund and providing services to investors.
Under the Plans, the Fund pays a monthly combined distribution and service fee to the Distributor at the maximum annual rate of 0.25% of the average daily net assets attributable to Class A shares of the Fund. Also under the Plans, the Fund pays a monthly service fee at the maximum annual rate of 0.25% of the average daily net assets attributable to Class B and Class C shares of the Fund and the payment of a monthly distribution fee at the maximum annual rate of 0.75% of the average daily net assets attributable to Class B and Class C shares of the Fund.
Sales Charges
Sales charges, including front-end charges and CDSCs, received by the Distributor for distributing Fund shares were $18,772 for Class A and $40 for Class C shares for the year ended April 30, 2015.
Expenses Waived/Reimbursed by the Investment Manager and its Affiliates
The Investment Manager and certain of its affiliates have contractually agreed to waive fees and/or reimburse expenses (excluding certain fees and expenses described below) for the period disclosed below, unless sooner terminated at the sole discretion of the Board, so that the Fund's net operating expenses, after giving effect to fees waived/expenses reimbursed and any balance credits and/or overdraft charges from the Fund's custodian, do not exceed the following annual rates as a percentage of the class' average daily net assets:
| | | Fee Rates Contractual
through
August 31, 2015 | |
Class A | | | 0.81 | % | |
Class B | | | 1.56 | | |
Class C | | | 1.56 | | |
Class R4 | | | 0.56 | | |
Class Z | | | 0.56 | | |
Under the agreement governing these fee waivers and/or expense reimbursement arrangements, the following fees and expenses are excluded from the waiver/reimbursement commitment, and therefore will be paid by the Fund, if applicable: taxes (including foreign transaction taxes), expenses associated with
investments in affiliated and non-affiliated pooled investment vehicles (including mutual funds and exchange-traded funds), transaction costs and brokerage commissions, costs related to any securities lending program, dividend expenses associated with securities sold short, inverse floater program fees and expenses, transaction charges and interest on borrowed money, interest, extraordinary expenses and any other expenses the exclusion of which is specifically approved by the Board. Any fees waived and/or expenses reimbursed under the expense reimbursement arrangements described above are not recoverable by the Investment Manager or its affiliates in future periods. This agreement may be modified or amended only with approval from all parties.
Note 4. Federal Tax Information
The timing and character of income and capital gain distributions are determined in accordance with income tax regulations, which may differ from GAAP because of temporary or permanent book to tax differences.
At April 30, 2015, these differences are primarily due to differing treatment for capital loss carryforwards, Trustees' deferred compensation, distributions, and tax straddles. To the extent these differences are permanent, reclassifications are made among the components of the Fund's net assets in the Statement of Assets and Liabilities. Temporary differences do not require reclassifications.
The Fund did not have any permanent differences; therefore, no reclassifications were made to the Statement of Assets and Liabilities.
The tax character of distributions paid during the years indicated was as follows:
Year Ended April 30, | | 2015 | | 2014 | |
Ordinary income | | $ | 11,271 | | | $ | 15,531 | | |
Tax-exempt income | | | 5,043,987 | | | | 5,278,921 | | |
Total | | $ | 5,055,258 | | | $ | 5,294,452 | | |
Short-term capital gain distributions, if any, are considered ordinary income distributions for tax purposes.
At April 30, 2015, the components of distributable earnings on a tax basis were as follows:
Undistributed tax-exempt income | | $ | 1,264,159 | | |
Capital loss carryforwards | | | (2,830,025 | ) | |
Net unrealized appreciation | | | 11,256,909 | | |
Annual Report 2015
27
COLUMBIA AMT-FREE NORTH CAROLINA INTERMEDIATE MUNI BOND FUND
NOTES TO FINANCIAL STATEMENTS (continued)
April 30, 2015
At April 30, 2015, the cost of investments for federal income tax purposes was $173,300,117 and the aggregate gross unrealized appreciation and depreciation based on that cost was:
Unrealized appreciation | | $ | 11,521,158 | | |
Unrealized depreciation | | | (264,249 | ) | |
Net unrealized appreciation | | $ | 11,256,909 | | |
The following capital loss carryforwards, determined at April 30, 2015, may be available to reduce taxable income arising from future net realized gains on investments, if any, to the extent permitted by the Internal Revenue Code:
Year of Expiration | | Amount ($) | |
2017 | | | 2,649,648 | | |
No expiration — short-term | | | 180,377 | | |
Total | | | 2,830,025 | | |
Capital loss carryforwards with no expiration are required to be utilized prior to any capital losses which carry an expiration date. As a result of this ordering rule, capital loss carryforwards which carry an expiration date may be more likely to expire unused.
For the year ended April 30, 2015, $251,729 of capital loss carryforward was utilized.
Management of the Fund has concluded that there are no significant uncertain tax positions in the Fund that would require recognition in the financial statements. However, management's conclusion may be subject to review and adjustment at a later date based on factors including, but not limited to, new tax laws, regulations, and administrative interpretations (including relevant court decisions). Generally, the Fund's federal tax returns for the prior three fiscal years remain subject to examination by the Internal Revenue Service.
Note 5. Portfolio Information
The cost of purchases and proceeds from sales of securities, excluding short-term investments and derivatives, if any, aggregated to $40,923,102 and $10,150,510, respectively, for the year ended April 30, 2015. The amount of purchase and sale activity impacts the portfolio turnover rate reported in the Financial Highlights.
Note 6. Shareholder Concentration
At April 30, 2015, two unaffiliated shareholders of record owned 82.5% of the outstanding shares of the Fund in one or more accounts. The Fund has no knowledge about whether any portion of those shares was owned
beneficially. Subscription and redemption activity by concentrated accounts may have a significant effect on the operations of the Fund.
Note 7. Line of Credit
The Fund has entered into a revolving credit facility with a syndicate of banks led by JPMorgan Chase Bank, N.A. whereby the Fund may borrow for the temporary funding of shareholder redemptions or for other temporary or emergency purposes. Pursuant to a December 9, 2014 amendment, the credit facility agreement, which is a collective agreement between the Fund and certain other funds managed by the Investment Manager, severally and not jointly, permits collective borrowings up to $550 million. Interest is charged to each participating fund based on its borrowings at a rate equal to the higher of (i) the overnight federal funds rate plus 1.00% or (ii) the one-month LIBOR rate plus 1.00%. Each borrowing under the credit facility matures no later than 60 days after the date of borrowing. The Fund also pays a commitment fee equal to its pro rata share of the amount of the credit facility at a rate of 0.075% per annum. The commitment fee is included in other expenses in the Statement of Operations. Prior to the December 9, 2014 amendment, the credit facility agreement permitted borrowings up to $500 million under the same terms and interest rates as described above.
The Fund had no borrowings during the year ended April 30, 2015.
Note 8. Significant Risks
Credit Risk
Credit risk is the risk that the value of debt securities in the Fund's portfolio may decline because the issuer may default and fail to pay interest or repay principal when due. Rating agencies assign credit ratings to debt securities to indicate their credit risk. Lower rated or unrated debt securities held by the Fund may present increased credit risk as compared to higher-rated debt securities.
Interest Rate Risk
Interest rate risk is the risk of losses attributable to changes in interest rates. In general, if prevailing interest rates rise, the values of debt securities tend to fall, and if interest rates fall, the values of debt securities tend to rise. Actions by governments and central banking authorities can result in increases in interest rates. Increasing interest rates may negatively affect the value of debt securities held by the Fund, resulting in a
Annual Report 2015
28
COLUMBIA AMT-FREE NORTH CAROLINA INTERMEDIATE MUNI BOND FUND
NOTES TO FINANCIAL STATEMENTS (continued)
April 30, 2015
negative impact on the Fund's performance and net asset value per share. In general, the longer the maturity or duration of a debt security, the greater its sensitivity to changes in interest rates.
Liquidity Risk
Liquidity risk is the risk associated with a lack of marketability of investments which may make it difficult to sell the investment at a desirable time or price. Changing regulatory, market or other conditions or environments (for example, the interest rate or credit environments) may adversely affect the liquidity of the Fund's investments. The Fund may have to accept a lower selling price for the holding, sell other investments, or forego another, more appealing investment opportunity. Generally, the less liquid the market at the time the Fund sells a portfolio investment, the greater the risk of loss or decline of value to the Fund. A less liquid market can lead to an increase in Fund redemptions, which may negatively impact Fund performance and net asset value per share, including, for example, if the Fund is forced to sell securities in a down market.
Geographic Concentration Risk
Because state-specific tax-exempt funds invest primarily in the municipal securities issued by the state and political sub-divisions of the state, the Fund will be particularly affected by political and economic conditions and developments in the state in which it invests. The Fund may, therefore, have a greater risk than that of a municipal bond fund which is more geographically diversified. The value of the municipal securities owned by the Fund also may be adversely affected by future changes in federal or state income tax laws.
Note 9. Subsequent Events
Management has evaluated the events and transactions that have occurred through the date the financial statements were issued and noted no items requiring adjustment of the financial statements or additional disclosure.
Note 10. Information Regarding Pending and Settled Legal Proceedings
In December 2005, without admitting or denying the allegations, American Express Financial Corporation (AEFC, which is now known as Ameriprise Financial, Inc. (Ameriprise Financial)) entered into settlement agreements with the Securities and Exchange Commission (SEC) and Minnesota Department of
Commerce (MDOC) related to market timing activities. As a result, AEFC was censured and ordered to cease and desist from committing or causing any violations of certain provisions of the Investment Advisers Act of 1940, the Investment Company Act of 1940, and various Minnesota laws. AEFC agreed to pay disgorgement of $10 million and civil money penalties of $7 million. AEFC also agreed to retain an independent distribution consultant to assist in developing a plan for distribution of all disgorgement and civil penalties ordered by the SEC in accordance with various undertakings detailed at www.sec.gov/litigation/admin/ia-2451.pdf. Ameriprise Financial and its affiliates have cooperated with the SEC and the MDOC in these legal proceedings, and have made regular reports to the Funds' Boards of Trustees.
Ameriprise Financial and certain of its affiliates have historically been involved in a number of legal, arbitration and regulatory proceedings, including routine litigation, class actions, and governmental actions, concerning matters arising in connection with the conduct of their business activities. Ameriprise Financial believes that the Funds are not currently the subject of, and that neither Ameriprise Financial nor any of its affiliates are the subject of, any pending legal, arbitration or regulatory proceedings that are likely to have a material adverse effect on the Funds or the ability of Ameriprise Financial or its affiliates to perform under their contracts with the Funds. Ameriprise Financial is required to make quarterly (10-Q), annual (10-K) and, as necessary, 8-K filings with the Securities and Exchange Commission on legal and regulatory matters that relate to Ameriprise Financial and its affiliates. Copies of these filings may be obtained by accessing the SEC website at www.sec.gov.
There can be no assurance that these matters, or the adverse publicity associated with them, will not result in increased fund redemptions, reduced sale of fund shares or other adverse consequences to the Funds. Further, although we believe proceedings are not likely to have a material adverse effect on the Funds or the ability of Ameriprise Financial or its affiliates to perform under their contracts with the Funds, these proceedings are subject to uncertainties and, as such, we are unable to estimate the possible loss or range of loss that may result. An adverse outcome in one or more of these proceedings could result in adverse judgments, settlements, fines, penalties or other relief that could have a material adverse effect on the consolidated financial condition or results of operations of Ameriprise Financial.
Annual Report 2015
29
COLUMBIA AMT-FREE NORTH CAROLINA INTERMEDIATE MUNI BOND FUND
REPORT OF INDEPENDENT REGISTERED PUBLIC ACCOUNTING FIRM
To the Trustees of Columbia Funds Series Trust and the Shareholders of
Columbia AMT-Free North Carolina Intermediate Muni Bond Fund (formerly known as Columbia North Carolina Intermediate Municipal Bond Fund)
In our opinion, the accompanying statement of assets and liabilities, including the portfolio of investments, and the related statements of operations and of changes in net assets and the financial highlights present fairly, in all material respects, the financial position of Columbia AMT-Free North Carolina Intermediate Muni Bond Fund (formerly known as Columbia North Carolina Intermediate Municipal Bond Fund) (the "Fund", a series of Columbia Funds Series Trust) at April 30, 2015, and the results of its operations, the changes in its net assets and the financial highlights for each of the periods indicated, in conformity with accounting principles generally accepted in the United States of America. These financial statements and financial highlights (hereafter referred to as "financial statements") are the responsibility of the Fund's management. Our responsibility is to express an opinion on these financial statements based on our audits. We conducted our audits of these financial statements in accordance with the standards of the Public Company Accounting Oversight Board (United States). Those standards require that we plan and perform the audit to obtain reasonable assurance about whether the financial statements are free of material misstatement. An audit includes examining, on a test basis, evidence supporting the amounts and disclosures in the financial statements, assessing the accounting principles used and significant estimates made by management, and evaluating the overall financial statement presentation. We believe that our audits, which included confirmation of securities at April 30, 2015 by correspondence with the custodian and brokers, provide a reasonable basis for our opinion.
PricewaterhouseCoopers LLP
Minneapolis, Minnesota
June 19, 2015
Annual Report 2015
30
COLUMBIA AMT-FREE NORTH CAROLINA INTERMEDIATE MUNI BOND FUND
FEDERAL INCOME TAX INFORMATION
(Unaudited)
The Fund hereby designates the following tax attributes for the fiscal year ended April 30, 2015. Shareholders will be notified in early 2016 of the amounts for use in preparing 2015 income tax returns.
Tax Designations
| Exempt-Interest Dividends | | | 99.78 | % | |
Exempt-Interest Dividends. The percentage of net investment income distributed during the fiscal year that qualifies as exempt-interest dividends for federal income tax purposes.
Annual Report 2015
31
COLUMBIA AMT-FREE NORTH CAROLINA INTERMEDIATE MUNI BOND FUND
Shareholders elect the Board that oversees the Funds' operations. The Board appoints officers who are responsible for day-to-day business decisions based on policies set by the Board. The following table provides basic biographical information about the Funds' Board members, including their principal occupations during the past five years, although specific titles for individuals may have varied over the period. Under current Board policy, members may serve through the end of the calendar year in which he or she reaches either the mandatory retirement age established by the Board or the fifteenth anniversary of the first Board meeting they attended as a member of the Board.
Independent Trustees
Name,
Address,
Year of Birth | | Position Held With
Funds and Length of
Service | | Principal Occupation(s)
During Past Five Years
and Other Relevant
Professional Experience | | Number of
Funds in the
Fund Family
Overseen by
Board Member | | Other Present or Past
Directorships/
Trusteeships
(Within Past 5 Years) | |
Kathleen Blatz
901 S. Marquette Ave.
Minneapolis, MN 55402
1954 | | Board member since 1/06 for RiverSource Funds and since 6/11 for Nations Funds | | Attorney; specializing in arbitration and mediation; Chief Justice, Minnesota Supreme Court, 1998-2006; Associate Justice, Minnesota Supreme Court, 1996-1998; Fourth Judicial District Court Judge, Hennepin County, 1994-1996; Attorney in private practice and public service, 1984-1993; State Representative, Minnesota House of Representatives, 1979-1993, which included service on the Tax and Financial Institutions and Insurance Committees | | | 127 | | | Trustee, BlueCross BlueShield of Minnesota (Chair of the Business Development Committee) since 2009; Chair of the Robina Foundation since August 2013 | |
Edward J. Boudreau, Jr.
901 S. Marquette Ave.
Minneapolis, MN 55402
1944 | | Board member since 6/11 for RiverSource Funds and since 1/05 for Nations Funds | | Managing Director, E.J. Boudreau & Associates (consulting) since 2000; FINRA Industry Arbitrator, 2002-present; Chairman and Chief Executive Officer, John Hancock Funds (asset management), Chairman and Interested Trustee for open-end and closed-end funds offered by John Hancock, 1989-2000; John Hancock Life Insurance Company, including SVP and Treasurer and SVP Information Technology, 1968-1988 | | | 125 | | | Former Trustee, BofA Funds Series Trust (11 funds), 2005-2011; Trustee, Boston Museum of Science (Chair of Finance Committee), 1985-2013 | |
Pamela G. Carlton
901 S. Marquette Ave.
Minneapolis, MN 55402
1954 | | Board member since 7/07 for RiverSource Funds and since 6/11 for Nations Funds | | President, Springboard — Partners in Cross Cultural Leadership (consulting company) since 2003; Managing Director of US Equity Research, JP Morgan Chase, 1999-2003; Director of US Equity Research, Chase Asset Management, 1996-1999; Co-Director Latin America Research, 1993-1996, COO Global Research, 1992-1996, Co-Director of US Research, 1991-1992, Investment Banker, Morgan Stanley, 1982-1991 | | | 127 | | | | None | | |
Annual Report 2015
32
COLUMBIA AMT-FREE NORTH CAROLINA INTERMEDIATE MUNI BOND FUND
TRUSTEES AND OFFICERS (continued)
Independent Trustees (continued)
Name,
Address,
Year of Birth | | Position Held With
Funds and Length of
Service | | Principal Occupation(s)
During Past Five Years
and Other Relevant
Professional Experience | | Number of
Funds in the
Fund Family
Overseen by
Board Member | | Other Present or Past
Directorships/
Trusteeships
(Within Past 5 Years) | |
William P. Carmichael
901 S. Marquette Ave.
Minneapolis, MN 55402
1943 | | Chair of the Board since 1/14, Board member since 6/11 for RiverSource Funds and since 2003 for Nations Funds | | Retired; Co-founder, The Succession Fund (provides exit strategies to owners of privately held companies) 1998-2007; Adjunct Professor of Finances, Kelley School of Business, Indiana University, 1993-2007; Senior Vice President, Sara Lee Corporation, 1991-1993; Senior Vice President and Chief Financial Officer, Beatrice Foods Company, 1984-1990; Vice President, Esmark, Inc., 1973-1984; Associate, Price Waterhouse, 1968-1972 | | | 127 | | | Director, Cobra Electronics Corporation (electronic equipment manufacturer), 1994-August 2014; The Finish Line (athletic shoes and apparel) since July 2003; Director, International Textile Corp. since 2012; former Director, McMoRan Exploration Company (oil and gas exploration and development) 2010-2013; former Trustee, BofA Funds Series Trust (11 funds) 2009-2011; Director, Spectrum Brands, Inc. (consumer products), 2002-2009; Director, Simmons Company (bedding), 2004-2010 | |
Patricia M. Flynn
901 S. Marquette Ave.
Minneapolis, MN 55402
1950 | | Board member since 11/04 for RiverSource Funds and since 6/11 for Nations Funds | | Trustee Professor of Economics and Management, Bentley University since 1976 (also teaches and conducts research on corporate governance); Dean, McCallum Graduate School of Business, Bentley University, 1992-2002 | | | 127 | | | Trustee, MA Taxpayers Foundation since 1997; Board of Governors, Innovation Institute, MA Technology Collaborative since 2010 | |
William A. Hawkins
901 S. Marquette Ave.
Minneapolis, MN 55402
1942 | | Board member since 6/11 for RiverSource Funds and since 1/05 for Nations Funds | | Managing Director, Overton Partners (financial consulting), since August 2010; President and Chief Executive Officer, California General Bank, N.A., January 2008-August 2010; Operation Hope, COO, 2004-2007; IndyMac Bancorp, President, CBG, 1999-2003; American General Bank, President, 1997-1999; Griffin Financial Services, CEO, 1981-1997; The Griffin Funds, CEO, 1992-1998 | | | 125 | | | Trustee, BofA Funds Series Trust (11 funds) | |
R. Glenn Hilliard
901 S. Marquette Ave.
Minneapolis, MN 55402
1943 | | Board member since 6/11 for RiverSource Funds and since 1/05 for Nations Funds | | Chairman and Chief Executive Officer, Hilliard Group LLC (investing and consulting) since April 2003; Non-Executive Director & Chairman, CNO Financial Group, Inc. (insurance), September 2003-May 2011 | | | 125 | | | Chairman, BofA Funds Series Trust (11 funds); former Director, CNO Financial Group, Inc. (insurance) 2003-2011 | |
Annual Report 2015
33
COLUMBIA AMT-FREE NORTH CAROLINA INTERMEDIATE MUNI BOND FUND
TRUSTEES AND OFFICERS (continued)
Independent Trustees (continued)
Name,
Address,
Year of Birth | | Position Held With
Funds and Length of
Service | | Principal Occupation(s)
During Past Five Years
and Other Relevant
Professional Experience | | Number of
Funds in the
Fund Family
Overseen by
Board Member | | Other Present or Past
Directorships/
Trusteeships
(Within Past 5 Years) | |
Catherine James Paglia
901 S. Marquette Ave.
Minneapolis, MN 55402
1952 | | Board member since 11/04 for RiverSource Funds and since 6/11 for Nations Funds | | Director, Enterprise Asset Management, Inc. (private real estate and asset management company) since September 1998; Managing Director and Partner, Interlaken Capital, Inc., 1989-1997; Managing Director, Morgan Stanley, 1982-1989; Vice President, Investment Banking, 1980-1982, Associate, Investment Banking, 1976-1980, Dean Witter Reynolds, Inc. | | | 127 | | | Director, Valmont Industries, Inc. (irrigation systems manufacturer) since 2012; Trustee, Carleton College (on the Investment Committee); Trustee, Carnegie Endowment for International Peace (on the Investment Committee) | |
Leroy C. Richie
901 S. Marquette Ave.
Minneapolis, MN 55402
1941 | | Board member since 2000 for Seligman Funds, since 11/08 for RiverSource Funds and since 6/11 for Nations Funds | | Counsel, Lewis & Munday, P.C. (law firm) since 2004; Vice President and General Counsel, Automotive Legal Affairs, Chrysler Corporation, 1993-1997 | | | 127 | | | Lead Outside Director, Digital Ally, Inc. (digital imaging) since September 2005; Director, Infinity, Inc. (oil and gas exploration and production) since 1994; Director, OGE Energy Corp. (energy and energy services) 2007-2014 | |
Minor M. Shaw
901 S. Marquette Ave.
Minneapolis, MN 55402
1947 | | Board member since 6/11 for RiverSource Funds and since 2003 for Nations Funds | | President, Micco LLC (private investments) since 2011; President, Micco Corp. (family investment business) 1998-2011 | | | 125 | | | Director, Piedmont Natural Gas; Director, BlueCross BlueShield of South Carolina since April 2008; Chair of the Duke Endowment; Director, National Association of Corporate Directors, Carolinas Chapter, since 2013; Chair of Greenville-Spartanburg Airport Commission; former Trustee, BofA Funds Series Trust (11 funds), 2003-2011 | |
Alison Taunton-Rigby
901 S. Marquette Ave.
Minneapolis, MN 55402
1944 | | Board member since 11/02 for RiverSource Funds and since 6/11 for Nations Funds | | Managing Director, Forester Biotech (consulting) since 2001; Chief Executive Officer and Director, RiboNovix, Inc., (biotechnology) 2003-2010; President and Chief Executive Officer of CMT Inc., 2001-2003; Aquila Biopharmaceuticals Inc., 1996-2000; Cambridge Biotech Corporation, 1995-1996, Mitotix Inc., 1993-1994 | | | 127 | | | Director, Healthways, Inc. (health and well-being solutions) since 2005; Director, ICI Mutual Insurance Company, since 2011; Director, Abt Associates (government contractor) since 2001; Director, Boston Children's Hospital since 2002 | |
Annual Report 2015
34
COLUMBIA AMT-FREE NORTH CAROLINA INTERMEDIATE MUNI BOND FUND
TRUSTEES AND OFFICERS (continued)
Interested Trustee Not Affiliated with Investment Manager*
Name,
Address,
Year of Birth | | Position Held With
Funds and Length of
Service | | Principal Occupation
During Past Five Years | | Number of
Funds in the
Fund Family
Overseen by
Board Member | | Other Present or Past
Directorships/
Trusteeships
(Within Past 5 Years) | |
Anthony M. Santomero
901 S. Marquette Ave.
Minneapolis, MN 55402
1946 | | Board member since 6/11 for RiverSource Funds and since 1/08 for Nations Funds | | Richard K. Mellon Professor Emeritus of Finance, The Wharton School, University of Pennsylvania, since 2002; Senior Advisor, McKinsey & Company (consulting), 2006-2008; President, Federal Reserve Bank of Philadelphia, 2000-2006, Professor of Finance, The Wharton School, University of Pennsylvania, 1972-2002 | | | 125 | | | Director, Renaissance Reinsurance Ltd. since May 2008; Trustee, Penn Mutual Life Insurance Company since March 2008; Director, Citigroup Inc. since 2009; Director, Citibank, N.A. since 2009; former Trustee, BofA Funds Series Trust (11 funds), 2008-2011 | |
* Dr. Santomero is not an affiliated person of the Investment Manager or Ameriprise Financial. However, he is currently deemed by the Funds to be an "interested person" (as defined in the 1940 Act) of the Funds because he serves as a Director of Citigroup Inc. and Citibank, N.A., companies that may directly or through subsidiaries and affiliates engage from time-to-time in brokerage execution, principal transactions and lending relationships with the Funds or accounts advised/managed by the Investment Manager.
Interested Trustee Affiliated with Investment Manager*
Name,
Address,
Year of Birth | | Position Held With
Funds and Length of
Service | | Principal Occupation
During Past Five Years | | Number of
Funds in the
Fund Family
Overseen by
Board Member | | Other Present or Past
Directorships/
Trusteeships
(Within Past 5 Years) | |
William F. Truscott
53600 Ameriprise
Financial Center
Minneapolis, MN 55474
1960 | | Board member since 11/01 for RiverSource Funds and since 6/11 for Nations Funds; Senior Vice President since 2002 for RiverSource Funds and since 5/10 for Nations Funds | | Chairman of the Board and President, Columbia Management Investment Advisers, LLC since May 2010 and February 2012, respectively (previously President and Chief Investment Officer, 2001-April 2010); Chief Executive Officer, Global Asset Management, Ameriprise Financial, Inc. since September 2012 (previously Chief Executive Officer, U.S. Asset Management & President, Annuities, May 2010-September 2012 and President — U.S. Asset Management and Chief Investment Officer, 2005-April 2010); Director and Chief Executive Officer, Columbia Management Investment Distributors, Inc. since May 2010 and February 2012, respectively (previously Chairman of the Board and Chief Executive Officer, 2006-April 2010); Chairman of the Board and Chief Executive Officer, RiverSource Distributors, Inc. since 2006; Director, Threadneedle Asset Management Holdings, SARL since 2014; President and Chief Executive Officer, Ameriprise Certificate Company, 2006-August 2012 | | | 186 | | | Former Director, Ameriprise Certificate Company, 2006-January 2013 | |
* Interested person (as defined under the 1940 Act) by reason of being an officer, director, security holder and/or employee of the Investment Manager or Ameriprise Financial.
Annual Report 2015
35
COLUMBIA AMT-FREE NORTH CAROLINA INTERMEDIATE MUNI BOND FUND
TRUSTEES AND OFFICERS (continued)
The Statement of Additional Information has additional information about the Fund's Board members and is available, without charge, upon request by calling 800.345.6611; contacting your financial intermediary or visiting columbiathreadneedle.com/us.
The Board has appointed officers who are responsible for day-to-day business decisions based on policies it has established. The officers serve at the pleasure of the Board. In addition to Mr. Truscott, who is Senior Vice President, the Funds' other officers are:
Fund Officers
Name,
Address and
Year of Birth | | Position and Year
First Appointed to
Position for any Fund
in the Columbia
Funds Complex or a
Predecessor Thereof | | Principal Occupation(s) During Past Five Years | |
Christopher O. Petersen
5228 Ameriprise Financial
Center
Minneapolis, MN 55474
Born 1970 | | President and Principal Executive Officer (2015) | | Vice President and Lead Chief Counsel, Ameriprise Financial, Inc. since January 2015 (previously, Vice President and Chief Counsel January 2010-December 2014; and Vice President and Group Counsel or Counsel 2004-January 2010); officer of Columbia Funds and affiliated funds since 2007. | |
Michael G. Clarke
225 Franklin Street
Boston, MA 02110
Born 1969 | | Treasurer (2011) and Chief Financial Officer (2009) | | Vice President — Mutual Fund Administration, Columbia Management Investment Advisers, LLC, since May 2010; Managing Director of Fund Administration, Columbia Management Advisors, LLC, September 2004-April 2010; senior officer of Columbia Funds and affiliated funds since 2002. | |
Paul B. Goucher
100 Park Avenue
New York, NY 10017
Born 1968 | | Senior Vice President (2011), Chief Legal Officer (2015) and Assistant Secretary (2008) | | Vice President and Lead Chief Counsel, Ameriprise Financial, Inc. since November 2008 and January 2013, respectively (previously Chief Counsel, January 2010-January 2013 and Group Counsel, November 2008-January 2010). | |
Thomas P. McGuire
225 Franklin Street
Boston, MA 02110
Born 1972 | | Vice President and Chief Compliance Officer (2012) | | Vice President — Asset Management Compliance, Ameriprise Financial, Inc., since May 2010; Chief Compliance Officer, Ameriprise Certificate Company since September 2010; Compliance Executive, Bank of America, 2005-April 2010. | |
Colin Moore
225 Franklin Street
Boston, MA 02110
Born 1958 | | Senior Vice President (2010) | | Executive Vice President and Global Chief Investment Officer, Ameriprise Financial, Inc., since July 2013; Director and Global Chief Investment Officer, Columbia Management Investment Advisers, LLC since May 2010; Manager, Managing Director and Chief Investment Officer, Columbia Management Advisors, LLC, 2007-April 2010. | |
Michael E. DeFao
225 Franklin Street
Boston, MA 02110
Born 1968 | | Vice President (2011) and Assistant Secretary (2010) | | Vice President and Chief Counsel, Ameriprise Financial, Inc. since May 2010; Associate General Counsel, Bank of America, 2005-April 2010. | |
Joseph F. DiMaria
225 Franklin Street
Boston, MA 02110
Born 1968 | | Vice President (2011), Assistant Treasurer (2012) and Chief Accounting Officer (2008) | | Vice President — Mutual Fund Treasurer, Columbia Management Investment Advisers, LLC since May 2010; Director of Fund Administration, Columbia Management Advisors, LLC, 2006-April 2010. | |
Amy Johnson
5228 Ameriprise Financial
Center
Minneapolis, MN 55474
Born 1965 | | Vice President (2006) | | Managing Director and Chief Operating Officer, Columbia Management Investment Advisers, LLC since May 2010 (previously Chief Administrative Officer, 2009-April 2010, and Vice President — Asset Management and Trust Company Services, 2006-2009). | |
Lyn Kephart-Strong
5228 Ameriprise Financial
Center
Minneapolis, MN 55474
Born 1960 | | Vice President (2015) | | President, Columbia Management Investment Services Corp. since October 2014; Vice President & Resolution Officer, Ameriprise Trust Company since August 2009; President, RiverSource Service Corporation 2004-2010. | |
Ryan C. Larrenaga
225 Franklin Street
Boston, MA 02110
Born 1970 | | Vice President and Secretary (2015) | | Vice President and Group Counsel, Ameriprise Financial, Inc. since August 2011 (previously, Counsel from May 2010 to August 2011); Assistant General Counsel, Bank of America, 2005-April 2010; officer of Columbia Funds and affiliated funds since 2005. | |
Annual Report 2015
36
COLUMBIA AMT-FREE NORTH CAROLINA INTERMEDIATE MUNI BOND FUND
APPROVAL OF INVESTMENT MANAGEMENT SERVICES AGREEMENT
Columbia Management Investment Advisers, LLC (Columbia Management or the Investment Manager), a wholly-owned subsidiary of Ameriprise Financial, Inc. (Ameriprise Financial), serves as the investment manager to Columbia AMT-Free North Carolina Intermediate Muni Bond Fund (the Fund). Under an investment management services agreement (the IMS Agreement), Columbia Management provides investment advice and other services to the Fund and other funds distributed by Columbia Management Investment Distributors, Inc. (collectively, the Funds).
The Fund's Board of Trustees (the Board), including the independent Board members (the Independent Trustees), considered the renewal of the IMS Agreement for a two-month period (Short-Term Period) in order to align the IMS Agreement with the review cycle of other funds in the Columbia family of funds. Columbia Management prepared detailed reports for the Board and its Contracts Committee in January, March and April 2015, including reports based on analyses of data provided by an independent organization (Lipper) and a comprehensive response to each item of information requested by independent legal counsel to the Independent Trustees (Independent Legal Counsel) in a letter to the Investment Manager, to assist the Board in making this determination. In addition, throughout the year, the Board (or its committees) regularly meets with portfolio management teams and senior management personnel, and reviews information prepared by Columbia Management addressing the services Columbia Management provides and Fund performance. The Board also accords appropriate weight to the work, deliberations and conclusions of the Contracts Committee, the Investment Review Committee and the Compliance Committee in determining whether to continue the IMS Agreement.
The Board, at its April 13-15, 2015 in-person Board meeting (the April Meeting), considered the renewal of the IMS Agreement for the Short-Term Period. At the April Meeting, Independent Legal Counsel reviewed with the Independent Trustees various factors relevant to the Board's consideration of advisory agreements and the Board's legal responsibilities related to such consideration. Following an analysis and discussion of the factors identified below, the Board, including all of the Independent Trustees, approved the renewal of the IMS Agreement for the Short-Term Period.
Nature, Extent and Quality of Services Provided by Columbia Management
The Independent Trustees analyzed various reports and presentations they had received detailing the services performed by Columbia Management, as well as its expertise, resources and capabilities. The Independent Trustees specifically considered many developments during the past year concerning the services provided by Columbia Management. The Independent Trustees noted the information they received concerning Columbia Management's ability to retain its key portfolio management personnel. In evaluating the quality of services provided under the IMS Agreement and the Fund's Administrative Services Agreement, the Independent Trustees also took into account the organization and strength of the Fund's and its service providers' compliance programs. In addition, the Board also reviewed the financial condition of Columbia Management (and its affiliates) and each entity's ability to carry out its responsibilities under the IMS Agreement and the Fund's other services agreements with affiliates of Ameriprise Financial, observing the financial strength of Ameriprise Financial, with its solid balance sheet. The Board also discussed the acceptability of the terms of the IMS Agreement for the Short-Term Period.
Based on the foregoing, and based on other information received (both oral and written, including the information on investment performance referenced below) and other considerations, the Board concluded that the services being performed by Columbia Management and its affiliates were acceptable for the Short-Term Period.
Investment Performance
For purposes of evaluating the nature, extent and quality of services provided under the IMS Agreement, the Board carefully reviewed the investment performance of the Fund. In this regard, the Board considered detailed reports providing the results of analyses performed by an independent organization showing, for various periods, the performance of the Fund, the performance of a benchmark index, the percentage ranking of the Fund among its comparison group and the net assets of the Fund. The Board observed that for purposes of approving the IMS Agreement for the Short-Term Period, the Fund's performance was acceptable.
Annual Report 2015
37
COLUMBIA AMT-FREE NORTH CAROLINA INTERMEDIATE MUNI BOND FUND
APPROVAL OF INVESTMENT MANAGEMENT SERVICES AGREEMENT (continued)
Comparative Fees, Costs of Services Provided and the Profits Realized By Columbia Management and its Affiliates from their Relationships with the Fund
The Board reviewed comparative fees and the costs of services provided under the IMS Agreement. The Board members considered detailed comparative information set forth in an annual report on fees and expenses, including, among other things, data (based on analyses conducted by an independent organization) showing a comparison of the Fund's expenses with median expenses paid by funds in its comparative peer universe, as well as data showing the Fund's contribution to Columbia Management's profitability.
The Board accorded particular weight to the notion that the level of fees should reflect a rational pricing model applied consistently across the various product lines in the Fund family, while assuring that the overall fees for each Fund (with few defined exceptions) are generally in line with the "pricing philosophy" currently in effect (i.e., that the total expense ratio of the Fund is no higher than the median expense ratio of funds in the same comparison universe of the Fund).
The Board also considered the expected profitability of Columbia Management and its affiliates in connection with Columbia Management providing investment management services to the Fund. In this regard, the Board referred to a detailed profitability report, discussing the profitability to Columbia Management and Ameriprise Financial from managing, operating and distributing the Funds. For purposes of approving the IMS Agreement for the Short-Term Period, the Board concluded that the investment management service fees were fair and reasonable, observing that the profitability levels also seemed reasonable.
Economies of Scale to be Realized
The Board also considered the economies of scale that might be realized by Columbia Management as the Fund grows and took note of the extent to which Fund shareholders might also benefit from such growth. In this regard, the Independent Trustees took into account that IMS fees decline as Fund assets exceed various breakpoints.
Based on the foregoing, the Board, including all of the Independent Trustees, concluded that, for purposes of its consideration of the renewal of the IMS Agreement for the Short-Term Period, the investment management service fees were fair and reasonable in light of the extent and quality of services provided. In reaching this conclusion, no single factor was determinative. The Board noted its understanding that it would undertake the full consideration of renewal of the IMS Agreement for the full annual period at its June 2015 meetings. On April 15, 2015, the Board, including all of the Independent Trustees, approved the renewal of the IMS Agreement for the Short-Term Period.
Annual Report 2015
38
COLUMBIA AMT-FREE NORTH CAROLINA INTERMEDIATE MUNI BOND FUND
IMPORTANT INFORMATION ABOUT THIS REPORT
Each fund mails one shareholder report to each shareholder address. If you would like more than one report, please call shareholder services at 800.345.6611 and additional reports will be sent to you.
The policy of the Board is to vote the proxies of the companies in which each fund holds investments consistent with the procedures as stated in the Statement of Additional Information (SAI). You may obtain a copy of the SAI without charge by calling 800.345.6611; contacting your financial intermediary; visiting columbiathreadneedle.com/us; or searching the website of the Securities and Exchange Commission (SEC) at sec.gov. Information regarding how each fund voted proxies relating to portfolio securities is filed with the SEC by August 31st for the most recent 12-month period ending June 30th of that year, and is available without charge by visiting columbiathreadneedle.com/us, or searching the website of the SEC at sec.gov.
Each fund files a complete schedule of portfolio holdings with the SEC for the first and third quarters of each fiscal year on Form N-Q. Each fund's Form N-Q is available on the SEC's website at sec.gov and may be reviewed and copied at the SEC's Public Reference Room in Washington, D.C. Information on the operation of the Public Reference Room may be obtained by calling 800.SEC.0330. Each fund's complete schedule of portfolio holdings, as filed on Form N-Q, can also be obtained without charge, upon request, by calling 800.345.6611.
Annual Report 2015
39
Columbia AMT-Free North Carolina Intermediate Muni Bond Fund
P.O. Box 8081
Boston, MA 02266-8081

This information is for use with concurrent or prior delivery of a fund prospectus. Please read and consider the investment objectives, risks, charges and expenses for any fund carefully before investing. For a prospectus and summary prospectus, which contains this and other important information about the Fund, go to columbiathreadneedle.com/us. The Fund is distributed by Columbia Management Investment Distributors, Inc., member FINRA, and managed by Columbia Management Investment Advisers, LLC.
Columbia Threadneedle Investments (Columbia Threadneedle) is the global brand name of the Columbia and Threadneedle group of companies.
All rights reserved. Columbia Management Investment Distributors, Inc., 225 Franklin Street, Boston, MA 02110-2804
© 2015 Columbia Management Investment Advisers, LLC.
columbiathreadneedle.com/us
ANN206_04_E01_(06/15)
Item 2. Code of Ethics.
(a) The registrant has adopted a code of ethics that applies to the registrant’s principal executive officer, principal financial officer, principal accounting officer or controller, or persons performing similar functions, regardless of whether these individuals are employed by the registrant or a third party.
(b) During the period covered by this report, there were not any amendments to a provision of the code of ethics adopted in 2(a) above.
(c) During the period covered by this report, there were no waivers, including any implicit waivers, from a provision of the code of ethics described in 2(a) above that relates to one or more of the items set forth in paragraph (b) of this item’s instructions.
Item 3. Audit Committee Financial Expert.
The registrant’s Board of Trustees has determined that Edward J. Boudreau, Pamela G. Carlton, William A. Hawkins and Alison Taunton-Rigby, each of whom are members of the registrant’s Board of Trustees and Audit Committee, each qualify as an audit committee financial expert. Mr. Boudreau, Ms. Carlton, Mr. Hawkins and Ms. Taunton-Rigby are each independent trustees, as defined in paragraph (a)(2) of this item’s instructions.
Item 4. Principal Accountant Fees and Services.
Fee information below is disclosed for the seven series of the registrant whose reports to stockholders are included in this annual filing.
(a) Audit Fees. Aggregate Audit Fees billed by the principal accountant for professional services rendered during the fiscal years ended April 30, 2015 and April 30, 2014 are approximately as follows:
2015 | | 2014 | |
$ | 154,000 | | $ | 154,000 | |
| | | | | |
Audit Fees include amounts related to the audit of the registrant’s annual financial statements or services that are normally provided by the accountant in connection with statutory and regulatory filings or engagements for those fiscal years.
(b) Audit-Related Fees. Aggregate Audit-Related Fees billed to the registrant by the principal accountant for professional services rendered during the fiscal years ended April 30, 2015 and April 30, 2014 are approximately as follows:
Audit-Related Fees include amounts for assurance and related services by the principal accountant that are reasonably related to the performance of the audit of the registrant’s financial statements and are not reported in Audit Fees above. In both fiscal years 2015 and 2014, Audit-Related Fees consist of agreed-upon procedures performed for semi-annual shareholder reports.
During the fiscal years ended April 30, 2015 and April 30, 2014, there were no Audit-Related Fees billed by the registrant’s principal accountant to the registrant’s investment adviser (not including any sub-adviser whose role is primarily portfolio management and is subcontracted with or overseen by another investment adviser) and any entity controlling, controlled by, or under common control with the adviser that provides ongoing services to the registrant for an engagement that related directly to the operations and financial reporting of the registrant.
(c) Tax Fees. Aggregate Tax Fees billed by the principal accountant to the registrant for professional services rendered during the fiscal years ended April 30, 2015 and April 30, 2014 are approximately as follows:
2015 | | 2014 | |
$ | 25,800 | | $ | 25,800 | |
| | | | | |
Tax Fees include amounts for the review of annual tax returns, the review of required shareholder distribution calculations and typically include amounts for professional services by the principal accountant for tax compliance, tax advice and tax planning.
During the fiscal years ended April 30, 2015 and April 30, 2014, there were no Tax Fees billed by the registrant’s principal accountant to the registrant’s investment adviser (not including any sub-adviser whose role is primarily portfolio management and is subcontracted with or overseen by another investment adviser) and any entity controlling, controlled by, or under common control with the adviser that provides ongoing services to the registrant for an engagement that related directly to the operations and financial reporting of the registrant.
(d) All Other Fees. Aggregate All Other Fees billed by the principal accountant to the registrant for professional services rendered during the fiscal years ended April 30, 2015 and April 30, 2014 are approximately as follows:
All Other Fees include amounts for products and services provided by the principal accountant, other than the services reported in paragraphs (a) through (c) above.
Aggregate All Other Fees billed by the registrant’s principal accountant to the registrant’s investment adviser (not including any sub-adviser whose role is primarily portfolio management and is subcontracted with or overseen by another investment adviser) and any entity controlling, controlled by, or under common control with the adviser that provides ongoing services to the registrant for an engagement that related directly to the operations and financial reporting of the registrant during the fiscal years ended April 30, 2015 and April 30, 2014 are approximately as follows:
2015 | | 2014 | |
$ | 225,000 | | $ | 325,000 | |
| | | | | |
In both fiscal years 2015 and 2014, All Other Fees primarily consist of fees billed for internal control examinations of the registrant’s transfer agent and investment adviser.
(e)(1) Audit Committee Pre-Approval Policies and Procedures
The registrant’s Audit Committee is required to pre-approve the engagement of the registrant’s independent auditors to provide audit and non-audit services to the registrant and non-audit services to its investment adviser (excluding any sub-adviser whose role is primarily portfolio management and is sub-contracted or overseen by another investment adviser (the “Adviser”) or any entity controlling, controlled by or under common control with the Adviser that provides ongoing services to the Fund (a “Control Affiliate”) if the engagement relates directly to the operations and financial reporting of the registrant.
The Audit Committee has adopted a Policy for Engagement of Independent Auditors for Audit and Non-Audit Services (the “Policy”). The Policy sets forth the understanding of the Audit Committee regarding the engagement of the registrant’s independent accountants to provide (i) audit and permissible audit-related, tax and other services to the registrant (“Fund Services”); (ii) non-audit services to the registrant’s Adviser and any Control Affiliates, that relates directly to the operations and financial reporting of a Fund (“Fund-related Adviser Services”); and (iii) certain other audit and non-audit services to the registrant’s Adviser and its Control Affiliates. A service will require specific pre-approval by the Audit Committee if it is to be provided by the Fund’s independent auditor; provided, however, that pre-approval of non-audit services to the Fund, the Adviser or Control Affiliates may be waived if certain de minimis requirements set forth in the SEC’s rules are met.
Under the Policy, the Audit Committee may delegate pre-approval authority to any pre-designated member or members who are independent board members. The member(s) to whom such authority is delegated must report, for informational purposes only, any pre-approval decisions to the Audit Committee at its next regular meeting. The Audit Committee’s responsibilities with respect to the pre-approval of services performed by the independent auditor may not be delegated to management.
On an annual basis, at a regularly scheduled Audit Committee meeting, the Fund’s Treasurer or other Fund officer shall submit to the Audit Committee a schedule of the types of Fund Services and Fund-related Adviser Services that are subject to specific pre-approval. This schedule will provide a description of each type of service that is subject to specific pre-approval, along with total projected fees for each service. The pre-approval will generally cover a one-year period. The Audit Committee will review and approve the types of services and the projected fees for the next one-year period and may add to, or subtract from, the list of pre-approved services from time to time, based on subsequent determinations. This specific approval acknowledges that the Audit Committee is in agreement with the specific types of services that the independent auditor will be permitted to perform and the projected fees for each service.
The Fund’s Treasurer or other Fund officer shall report to the Audit Committee at each of its regular meetings regarding all Fund Services or Fund-related Adviser Services provided since the last such report was rendered, including a description of the services, by category, with forecasted fees for the annual reporting period, proposed changes requiring specific pre-approval and a description of services provided by the independent auditor, by category, with actual fees during the current reporting period.
*****
(e)(2) 100% of the services performed for items (b) through (d) above during 2015 and 2014 were pre-approved by the registrant’s Audit Committee.
(f) Not applicable.
(g) The aggregate non-audit fees billed by the registrant’s accountant for services rendered to the registrant, and rendered to the registrant’s investment adviser (not including any sub-adviser whose role is primarily portfolio management and is subcontracted with or overseen by another investment adviser), and any entity controlling, controlled by, or under common control with the adviser that provides ongoing services to the registrant for the fiscal years ended April 30, 2015 and April 30, 2014 are approximately as follows:
2015 | | 2014 | |
$ | 253,600 | | $ | 353,600 | |
| | | | | |
(h) The registrant’s Audit Committee of the Board of Directors has considered whether the provision of non-audit services that were rendered to the registrant’s adviser (not including any sub-adviser whose role is primarily portfolio management and is subcontracted with or overseen by another investment adviser), and any entity
controlling, controlled by, or under common control with the investment adviser that provides ongoing services to the registrant that were not pre-approved pursuant to paragraph (c)(7)(ii) of Rule 2-01 of Regulation S-X, is compatible with maintaining the principal accountant’s independence.
Item 5. Audit Committee of Listed Registrants.
Not applicable.
Item 6. Investments
(a) The registrant’s “Schedule I — Investments in securities of unaffiliated issuers” (as set forth in 17 CFR 210.12-12) is included in Item 1 of this Form N-CSR.
(b) Not applicable.
Item 7. Disclosure of Proxy Voting Policies and Procedures for Closed-End Management Investment Companies.
Not applicable.
Item 8. Portfolio Managers of Closed-End Management Investment Companies.
Not applicable.
Item 9. Purchases of Equity Securities by Closed-End Management Investment Company and Affiliated Purchasers.
Not applicable.
Item 10. Submission of Matters to a Vote of Security Holders.
There were no material changes to the procedures by which shareholders may recommend nominees to the registrant’s board of directors.
Item 11. Controls and Procedures.
(a) The registrant’s principal executive officer and principal financial officers, based on their evaluation of the registrant’s disclosure controls and procedures as of a date within 90 days of the filing of this report, have concluded that such controls and procedures are adequately designed to ensure that material information required to be disclosed by the registrant in Form N-CSR is accumulated and communicated to the registrant’s management, including the principal executive officer and principal financial officer, or persons performing similar functions, as appropriate to allow timely decisions regarding required disclosure.
(b) There was no change in the registrant’s internal control over financial reporting that occurred during the registrant’s second fiscal quarter of the period covered by this report that has materially affected, or is reasonably likely to materially affect, the registrant’s internal control over financial reporting.
Item 12. Exhibits.
(a)(1) Code of ethics required to be disclosed under Item 2 of Form N-CSR attached hereto as Exhibit 99.CODE ETH.
(a)(2) Certifications pursuant to Rule 30a-2(a) under the Investment Company Act of 1940 (17 CFR 270.30a-2(a)) attached hereto as Exhibit 99.CERT.
(a)(3) Not applicable.
(b) Certification pursuant to Rule 30a-2(b) under the Investment Company Act of 1940 (17 CFR 270.30a-2(b)) attached hereto as Exhibit 99.906CERT.
SIGNATURES
Pursuant to the requirements of the Securities Exchange Act of 1934 and the Investment Company Act of 1940, the registrant has duly caused this report to be signed on its behalf by the undersigned, thereunto duly authorized.
(registrant) | | Columbia Funds Series Trust | |
| | |
| | |
By (Signature and Title) | /s/ Christopher O. Petersen | |
| Christopher O. Petersen, President and Principal Executive Officer | |
| | |
| | |
Date | | June 19, 2015 | |
| | | | |
Pursuant to the requirements of the Securities Exchange Act of 1934 and the Investment Company Act of 1940, this report has been signed below by the following persons on behalf of the registrant and in the capacities and on the dates indicated.
By (Signature and Title) | /s/ Christopher O. Petersen | |
| Christopher O. Petersen, President and Principal Executive Officer | |
| | |
| | |
Date | | June 19, 2015 | |
| | |
| | |
By (Signature and Title) | /s/ Michael G. Clarke | |
| Michael G. Clarke, Treasurer and Chief Financial Officer | |
| | |
| | |
Date | | June 19, 2015 | |