UNITED STATES
SECURITIES AND EXCHANGE COMMISSION
Washington, D.C. 20549
FORM N-CSR
CERTIFIED SHAREHOLDER REPORT OF REGISTERED
MANAGEMENT INVESTMENT COMPANIES
Investment Company Act file number 811-09645
Columbia Funds Series Trust
(Exact name of registrant as specified in charter)
50606 Ameriprise Financial Center
Minneapolis, MN 55474
(Address of principal executive offices) (Zip code)
Ryan Larrenaga
c/o Columbia Management Investment Advisers, LLC
225 Franklin Street
Boston, MA 02110
(Name and address of agent for service)
Registrant’s telephone number, including area code: (800) 345-6611
Date of fiscal year end: March 31
Date of reporting period: March 31, 2015
Form N-CSR is to be used by management investment companies to file reports with the Commission not later than 10 days after the transmission to stockholders of any report that is required to be transmitted to stockholders under Rule 30e-1 under the Investment Company Act of 1940 (17 CFR 270.30e-1). The Commission may use the information provided on Form N-CSR in its regulatory, disclosure review, inspection, and policymaking roles.
A registrant is required to disclose the information specified by Form N-CSR, and the Commission will make this information public. A registrant is not required to respond to the collection of information contained in Form N-CSR unless the Form displays a currently valid Office of Management and Budget (“OMB”) control number. Please direct comments concerning the accuracy of the information collection burden estimate and any suggestions for reducing the burden to Secretary, Securities and Exchange Commission, 450 Fifth Street, NW, Washington, DC 20549-0609. The OMB has reviewed this collection of information under the clearance requirements of 44 U.S.C. § 3507.
| Item 1. | Reports to Stockholders. |

ANNUAL REPORT
March 31, 2015

COLUMBIA SHORT TERM BOND FUND


ABOUT COLUMBIA THREADNEEDLE INVESTMENTS
Columbia Threadneedle Investments is a leading global asset management group that provides a broad range of actively managed investment strategies and solutions for individual, institutional and corporate clients around the world.
With more than 2,000 people, including over 450 investment professionals based in North America, Europe and Asia, we manage $506 billion* of assets across developed and emerging market equities, fixed income, asset allocation solutions and alternatives. We are the 11th largest manager of long-term mutual fund assets in the U.S.** and the 5th largest manager of retail funds in the U.K.***
Our priority is the investment success of our clients. We aim to deliver the investment outcomes they expect through an investment approach that is team-based, performance-driven and risk-aware. Our culture is dynamic and interactive. By sharing our insights across asset classes and geographies, we generate richer perspectives on global, regional and local investment landscapes. The ability to exchange and debate investment ideas in a collaborative environment enriches our teams’ investment processes. More importantly, it results in better informed investment decisions for our clients.
Columbia funds are distributed by Columbia Management Investment Distributors, Inc., member FINRA, and managed by Columbia Management Investment Advisers, LLC.
Columbia Threadneedle Investments (Columbia Threadneedle) is the global brand name of the Columbia and Threadneedle group of companies.
| * | | In U.S. dollars as of December 31, 2014. Source: Ameriprise Q4 Earnings Release. Includes all assets managed by entities in the Columbia and Threadneedle groups of companies. |
Contact us for more current data.
| ** | | Source: ICI as of December 31, 2014 for Columbia Management Investment Advisers, LLC. |
| *** | | Source: Investment Association as of December 2014 for Threadneedle Asset Management Limited. |
© 2015 Columbia Management Investment Advisers, LLC. All rights reserved.
Not part of the shareholder report
Get the market insight you need from our investment experts
Connect with Columbia Threadneedle Investments
Investor insight
Find economic and market commentary, investment videos, white papers,
mutual fund commentary and more at columbiathreadneedle.com/us.
| | | | |
 | | Columbia Threadneedle Investor Newsletter (e-newsletter) Read our award-winning* shareholder
newsletter. Our quarterly newsletter
is available online and provides timely
and relevant content about economic
trends, fund news, service enhancements and
changes. Sign up to receive the newsletter
electronically at columbiathreadneedle.com/
us/newsletter. | |  |
| | |
 | | Investment videos Get analysis of current events and trends that may affect your investments.
Visit our online video library to watch and discover what our thought leaders
are saying about the financial markets and economy. |
| | |
| | Social media We offer you multiple ways to access our market commentary and
investment insights. |
| | n | | Perspectives blog at columbiathreadneedle.com/us |
Read timely posts by our investment team, including our chief investment officer, chief economist and portfolio managers.
| | n | | twitter.com/CTinvest_US |
Follow us on Twitter for quick, up-to-the-minute comments on market news and more.
View our commentaries on the economy, markets and current investment opportunities.
| | n | | linkedin.com/company/columbia-threadneedle-investments-us |
Connect with us on LinkedIn for updates from our thought leaders.
| * | Columbia Threadneedle Investor Newsletter was awarded top honors in the Mutual Fund Education Alliance STAR Awards competition for excellence in mutual fund marketing and communications in 2011, 2012 and 2013. Materials in the competition were evaluated on educational value, message comprehension, effective design and objectives. |
Not part of the shareholder report
Stay informed
Become a subscriber to receive the latest investment publications and mutual fund commentaries
Subscribe to Columbia Threadneedle Investments
Email subscription center
Subscribe to the latest information from Columbia Threadneedle. Visit our email subscription center at columbiathreadneedle.com/us/subscribe to register for economic and market commentary, product and service updates, white papers and more.
| n | | Columbia Threadneedle Investor Newsletter |
Quarterly newsletter featuring the latest macro- and micro-economic trends, investment themes, products, service changes and other items of interest to our investors
| n | | Investment Strategy Outlook |
Quarterly publication featuring the Columbia Threadneedle Asset Allocation Team’s perspective on global economic investment conditions and markets
Quarterly publication featuring more than 40 charts and graphs that highlight the current state of the economy and the markets; includes straightforward insight on current investment opportunities
Frequent articles that delve deep into a variety of investment topics
Quarterly portfolio manager commentary and fund fact sheets available for Columbia funds. (Not all funds have a commentary.)
Register your information online at columbiathreadneedle.com/us/subscribe and select the publications you would like to receive. Update your subscriptions at any time by accessing the email subscription center.
CT-MK (03/15) 5383/1125800
PRESIDENT’S MESSAGE

Dear Shareholder,
In a world that is changing faster than ever before, investors want asset managers who offer a global perspective while generating strong and sustainable returns. To that end, Columbia Management, in conjunction with its U.K.-based affiliate, Threadneedle Investments, has rebranded to Columbia Threadneedle Investments. The new global brand represents the combined capabilities, resources and reach of the global group, offering investors access to the best of both firms.
With a presence in 18 countries and more than 450 investment professionals*, our collective perspective and world view as Columbia Threadneedle Investments gives us deeper insight into what might affect the real-life financial outcomes clients are seeking. Putting our views into a global context enables us to build richer perspectives and create the right solutions, and provides us with enhanced capabilities to deliver consistent investment performance, which may ultimately lead to better investor outcomes.
As a result of the rebrand, you will begin to see our new logo and colors reflected in printed materials, such as this shareholder report, as well as on our new website — columbiathreadneedle.com/us. We encourage you to visit us online and view a new video on the “About Us” tab that speaks to the strength of the firm.
While we are introducing a new brand, in many ways, the investment company you know well has not changed. The following remain in effect:
| n | | Fund and strategy names |
| n | | Established investment teams, philosophies and processes |
| n | | Account services, features, servicing phone numbers and mailing addresses |
| n | | Columbia Management Investment Distributors as distributor and Columbia Management Investment Advisers as investment adviser |
We recognize that the money we manage represents the hard work and savings of people like you, and that everyone has different ambitions and different definitions of success. Investors have varying goals — funding their children’s education, enjoying their retirement, putting money aside for unexpected events, and more. Whatever your ambitions, we believe our wide range of investment products and solutions can help give you confidence that you will reach your goals.
The world is constantly changing, but our priority remains the same: to help you secure your finances, meet your goals and achieve success. Thank you for your continued investment with us. Our service representatives are available at 800.345.6611 to help with any questions.
Sincerely,

Christopher O. Petersen
President, Columbia Funds
Investors should consider the investment objectives, risks, charges and expenses of a mutual fund carefully before investing. For a free prospectus and summary prospectus, which contains this and other important information about a fund, visit columbiathreadneedle.com/us. The prospectus should be read carefully before investing.
* Source: Ameriprise as of December 1, 2014
Columbia Funds are distributed by Columbia Management Investment Distributors, Inc., member FINRA, and managed by Columbia Management Investment Advisers, LLC.
© 2015 Columbia Management Investment Advisers, LLC. All rights reserved.
Annual Report 2015
| | |
| |
| | COLUMBIA SHORT TERM BOND FUND |
TABLE OF CONTENTS
Fund Investment Manager
Columbia Management Investment
Advisers, LLC
225 Franklin Street
Boston, MA 02110
Fund Distributor
Columbia Management Investment
Distributors, Inc.
225 Franklin Street
Boston, MA 02110
Fund Transfer Agent
Columbia Management Investment
Services Corp.
P.O. Box 8081
Boston, MA 02266-8081
For more information about any of the funds, please visit columbiathreadneedle.com/us or call 800.345.6611. Customer Service Representatives are available to answer your questions Monday through Friday from 8 a.m. to 7 p.m. Eastern time.
The views expressed in this report reflect the current views of the respective parties. These views are not guarantees of future performance and involve certain risks, uncertainties and assumptions that are difficult to predict, so actual outcomes and results may differ significantly from the views expressed. These views are subject to change at any time based upon economic, market or other conditions and the respective parties disclaim any responsibility to update such views. These views may not be relied on as investment advice and, because investment decisions for a Columbia fund are based on numerous factors, may not be relied on as an indication of trading intent on behalf of any particular Columbia fund. References to specific securities should not be construed as a recommendation or investment advice.
Annual Report 2015
| | |
| |
| COLUMBIA SHORT TERM BOND FUND | | |
PERFORMANCE OVERVIEW
Performance Summary
| n | | Columbia Short Term Bond Fund (the Fund) Class A shares returned 0.86% excluding sales charges for the 12-month period that ended March 31, 2015. |
| n | | The Fund modestly underperformed its benchmark, the Barclays 1-3 Year Government/Credit Index, which returned 1.12% during the same time period. |
| n | | Fees, which the Fund incurs but the index does not, generally accounted for the Fund’s slight shortfall relative to the benchmark. |
| | | | | | | | | | | | | | |
Average Annual Total Returns (%) (for period ended March 31, 2015) | |
| | | Inception | | 1 Year | | | 5 Years | | | 10 Years | |
Class A | | 10/02/92 | | | | | | | | | | | | |
Excluding sales charges | | | | | 0.86 | | | | 1.43 | | | | 2.83 | |
Including sales charges | | | | | -0.14 | | | | 1.23 | | | | 2.73 | |
Class B | | 06/07/93 | | | | | | | | | | | | |
Excluding sales charges | | | | | 0.45 | | | | 0.87 | | | | 2.16 | |
Including sales charges | | | | | -2.54 | | | | 0.87 | | | | 2.16 | |
Class C | | 10/02/92 | | | | | | | | | | | | |
Excluding sales charges | | | | | 0.25 | | | | 1.08 | | | | 2.47 | |
Including sales charges | | | | | -0.75 | | | | 1.08 | | | | 2.47 | |
Class I* | | 09/27/10 | | | 1.16 | | | | 1.78 | | | | 3.14 | |
Class K* | | 03/07/11 | | | 0.96 | | | | 1.52 | | | | 2.91 | |
Class R* | | 09/27/10 | | | 0.50 | | | | 1.17 | | | | 2.54 | |
Class R4* | | 11/08/12 | | | 1.11 | | | | 1.71 | | | | 3.10 | |
Class R5* | | 11/08/12 | | | 1.11 | | | | 1.74 | | | | 3.11 | |
Class W* | | 09/27/10 | | | 0.76 | | | | 1.43 | | | | 2.81 | |
Class Y* | | 07/15/09 | | | 1.16 | | | | 1.79 | | | | 3.14 | |
Class Z | | 09/30/92 | | | 1.01 | | | | 1.69 | | | | 3.09 | |
Barclays 1-3 Year Government/Credit Index | | | | | 1.12 | | | | 1.35 | | | | 2.94 | |
Returns for Class A are shown with and without the maximum initial sales charge of 1.00%. Returns for Class B are shown with and without the applicable contingent deferred sales charge (CDSC) of 3.00% in the first year, declining to 1.00% in the sixth year and eliminated thereafter. Returns for Class C are shown with and without the 1.00% CDSC for the first year only. The Fund’s other classes are not subject to sales charges and have limited eligibility. Please see the Fund’s prospectus for details. Performance for different share classes will vary based on differences in sales charges and fees associated with each class. All results shown assume reinvestment of distributions during the period. Returns do not reflect the deduction of taxes that a shareholder may pay on Fund distributions or on the redemption of Fund shares. Performance results reflect the effect of any fee waivers or reimbursements of Fund expenses by Columbia Management Investment Advisers, LLC and/or any of its affiliates. Absent these fee waivers or expense reimbursement arrangements, performance results would have been lower.
The performance information shown represents past performance and is not a guarantee of future results. The investment return and principal value of your investment will fluctuate so that your shares, when redeemed, may be worth more or less than their original cost. Current performance may be lower or higher than the performance information shown. You may obtain performance information current to the most recent month-end by contacting your financial intermediary, visiting columbiathreadneedle.com/us or calling 800.345.6611.
| * | The returns shown for periods prior to the share class inception date (including returns for the Life of the Fund, if shown, which are since Fund inception) include the returns of the Fund’s oldest share class. These returns are adjusted to reflect any higher class-related operating expenses of the newer share classes, as applicable. Please visit columbiathreadneedle.com/us/investment-products/mutual-funds/appended-performance for more information. |
The Barclays 1-3 Year Government/Credit Index consists of Treasury or government agency securities and investment grade corporate debt securities with maturities of one to three years.
Indices are not available for investment, are not professionally managed and do not reflect sales charges, fees, brokerage commissions, taxes or other expenses of investing. Securities in the Fund may not match those in an index.
| | |
| |
| | COLUMBIA SHORT TERM BOND FUND |
PERFORMANCE OVERVIEW (continued)
|
Performance of a Hypothetical $10,000 Investment (April 1, 2005 — March 31, 2015) |
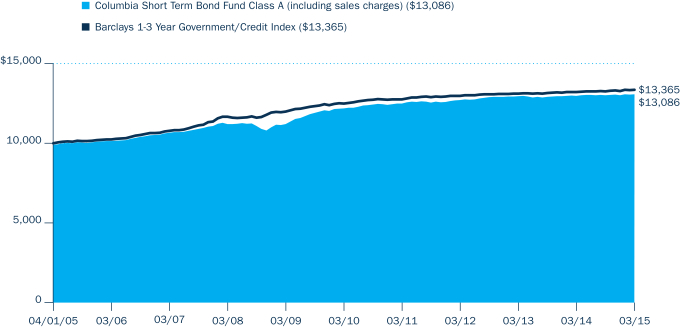
The chart above shows the change in value of a hypothetical $10,000 investment in Class A shares of Columbia Short Term Bond Fund during the stated time period, and does not reflect the deduction of taxes that a shareholder may pay on Fund distributions or on the redemption of Fund shares.
| | |
| |
| COLUMBIA SHORT TERM BOND FUND | | |
MANAGER DISCUSSION OF FUND PERFORMANCE
For the 12-month period that ended March 31, 2015, the Fund’s Class A shares returned 0.86% excluding sales charges. The Fund modestly underperformed its benchmark, the Barclays 1-3 Year Government/Credit Index, which returned 1.12% during the same time period. Fees, which the Fund incurs but the index does not, generally accounted for the Fund’s slight shortfall relative to the benchmark.
Interest Rates Stayed Put as Economy Improved
Economic data showed broad improvement over the 12-month period ended March 31, 2015. However, it wasn’t quite strong enough for the Federal Reserve (the Fed) to make its first short-term interest rate hike since 2006. Even though robust new job growth lowered the unemployment rate to a pre-recession level of 5.5%, inflationary pressures remained low enough to keep the Fed on the sidelines. Manufacturing activity remained relatively steady. The housing market continued its slow recovery, marked by subdued price increases and low inventories. Against this backdrop of generally favorable economic news, the yield spread between investment-grade bonds and similar duration Treasuries widened, led by volatility in the energy sector. (Duration is a measure of interest rate sensitivity.) The Treasury yield curve, which depicts the range of yields from short-term to long-term, flattened during the period. One- to three-year yields rose modestly while yields on securities with maturities of five years+ fell significantly. (Bond yields and prices move in opposite directions.) Two-year Treasury notes rose 14 basis points to 0.56%, while the five-year note fell 35 basis points to 1.37%. (A basis point is one hundredth of one percent.)
Contributors and Detractors
Fund overweights in structured securities also enhanced returns, as both sectors outperformed Treasuries. The conventional 15-year mortgage sector returned 61 basis points more than similar duration Treasuries. The Fund’s largest overweight was in commercial mortgage-backed securities (CMBS), which outperformed by 75 basis points. Within CMBS, the Fund continued to be invested in seasoned, AAA rated non-agency paper. The majority of these securities were issued prior to the financial crisis of 2007-2008, when credit standards were generally higher than in subsequent years, which helped them weather the peak of the crisis. As older vintages, these seasoned securities enjoy credit enhancement as the result of several favorable factors. The Fund continues to own agency CMBS, mostly through Ginnie Mae project loans, which offer both the explicit guaranty of the U.S. government as well as better call protection than traditional non-agency CMBS. In light of their improving fundamentals, both agency and non-agency AAA CMBS remain attractive relative to many other investment grade securities. The Fund’s overweight position in credits rated BBB aided results as lower rated credits outperformed during the period. Finally, the Fund’s modest exposure to asset-backed securities (ABS) was a plus for the Fund, as AAA rated ABS outperformed similar duration Treasuries by 42 basis points. Within the corporate sector, the Fund was overweight at the end of the period in energy, banking, insurance and communications.
An overweight within the energy sector detracted from results as energy was the only subsector that underperformed Treasuries for the period.
Portfolio Management
Leonard Aplet, CFA
Gregory Liechty
Ronald Stahl, CFA
| | | | |
Portfolio Breakdown (%) (at March 31, 2015) | |
Asset-Backed Securities — Non-Agency | | | 18.3 | |
Commercial Mortgage-Backed Securities — Agency | | | 12.1 | |
Commercial Mortgage-Backed Securities — Non-Agency | | | 9.1 | |
Corporate Bonds & Notes | | | 31.7 | |
Foreign Government Obligations | | | 0.9 | |
Inflation-Indexed Bonds | | | 2.0 | |
Money Market Funds | | | 0.5 | |
Municipal Bonds | | | 0.5 | |
Residential Mortgage-Backed Securities — Agency | | | 3.7 | |
Residential Mortgage-Backed Securities — Non-Agency | | | 2.0 | |
U.S. Government & Agency Obligations | | | 6.1 | |
U.S. Treasury Obligations | | | 13.1 | |
Total | | | 100.0 | |
Percentages indicated are based upon total investments. The Fund’s portfolio composition is subject to change.
| | | | |
Quality Breakdown (%)
(at March 31, 2015) | |
AAA rating | | | 61.6 | |
AA rating | | | 5.5 | |
A rating | | | 16.0 | |
BBB rating | | | 16.9 | |
BB rating | | | 0.0 | (a) |
B rating | | | 0.0 | (a) |
D rating | | | 0.0 | (a) |
Not rated | | | 0.0 | (a) |
Total | | | 100.0 | |
Percentages indicated are based upon total fixed income investments (excluding Money Market Funds).
Bond ratings apply to the underlying holdings of the Fund and not the Fund itself and are divided into categories ranging from highest to lowest credit quality, determined by using the middle rating of Moody’s, S&P and Fitch, after dropping the highest and lowest available ratings. When ratings are available from only two rating agencies, the lower rating is used. When a rating is available from only one rating agency, that rating is used. When a bond is
| | |
| |
| | COLUMBIA SHORT TERM BOND FUND |
MANAGER DISCUSSION OF FUND PERFORMANCE (continued)
not rated by any rating agency, it is designated as “Not rated”. Credit quality ratings assigned by a rating agency are subjective opinions, not statements of fact, and are subject to change, including daily. The ratings assigned by credit rating agencies are but one of the considerations that the Investment Manager and/or Fund’s subadviser incorporates into its credit analysis process, along with such other issuer-specific factors as cash flows, capital structure and leverage ratios, ability to de-leverage (repay) through free cash flow, quality of management, market positioning and access to capital, as well as such security-specific factors as the terms of the security (e.g., interest rate, and time to maturity) and the amount and type of any collateral.
Investment Risks
Market risk may affect a single issuer, sector of the economy, industry or the market as a whole. Mortgage- and asset-backed securities are affected by interest rates, financial health of issuers/originators, creditworthiness of entities providing credit enhancements and the value of underlying assets. Fixed-income securities present issuer default risk. A rise in interest rates may result in a price decline of fixed-income instruments held by the Fund, negatively impacting its performance and NAV. Falling rates may result in the Fund investing in lower yielding debt instruments, lowering the Fund’s income and yield. These risks may be heightened for longer maturity and duration securities. Prepayment and extension risk exists as a loan, bond or other investment may be called, prepaid or redeemed before maturity and that similar yielding investments may not be available for purchase. Investing in derivatives is a specialized activity that involves special risks, which may result in significant losses. See the Fund’s prospectus for more information on these and other risks.
Treasury Futures Helped Manage Duration and Yield Curve Exposure
During the period, we used Treasury futures contracts to hedge the Fund’s duration and to help manage the Fund’s yield curve exposure. These derivatives had no material impact on Fund performance.
Looking Ahead
We continue to target a duration at this time that is shorter than that of the benchmark because we expect interest rates to rise modestly in 2015. If rates rise, a shorter duration has the potential to mitigate a drop in bond prices. We expect yield-spread volatility as the market continues to assess the strength of the current economic expansion and uncertainty regarding the timing of changes in monetary policy. Inflation, the strength of the U.S. dollar, oil prices and the employment picture are on our radar screen, as well as the potential for slower global growth, which could be a drag on the U.S. economy.
In this current environment, the Fund remains underweight in U.S. government securities relative to its benchmark and overweight in ABS and CMBS, including Ginnie Mae government-backed project loans. Within CMBS, we prefer seasoned, AAA rated super senior holdings; within Ginnie Mae project loans, we favor short, current-pay securities. We believe these segments offer some of the most attractive opportunities in the investment-grade market. We continue to believe that the corporate sector has the potential to offer returns in excess of those generated by U.S. Treasuries, driven by its yield advantage. Corporate balance sheets and earnings remain solid.
| | |
| |
| COLUMBIA SHORT TERM BOND FUND | | |
UNDERSTANDING YOUR FUND’S EXPENSES
(Unaudited)
As an investor, you incur two types of costs. There are transaction costs, which generally include sales charges on purchases and may include redemption fees. There are also ongoing costs, which generally include management fees, distribution and/or service fees, and other fund expenses. The following information is intended to help you understand your ongoing costs (in dollars) of investing in the Fund and to help you compare these costs with the ongoing costs of investing in other mutual funds.
Analyzing Your Fund’s Expenses
To illustrate these ongoing costs, we have provided examples and calculated the expenses paid by investors in each share class of the Fund during the period. The actual and hypothetical information in the table is based on an initial investment of $1,000 at the beginning of the period indicated and held for the entire period. Expense information is calculated two ways and each method provides you with different information. The amount listed in the “Actual” column is calculated using the Fund’s actual operating expenses and total return for the period. You may use the Actual information, together with the amount invested, to estimate the expenses that you paid over the period. Simply divide your account value by $1,000 (for example, an $8,600 account value divided by $1,000 = 8.6), then multiply the results by the expenses paid during the period under the “Actual” column. The amount listed in the “Hypothetical” column assumes a 5% annual rate of return before expenses (which is not the Fund’s actual return) and then applies the Fund’s actual expense ratio for the period to the hypothetical return. You should not use the hypothetical account values and expenses to estimate either your actual account balance at the end of the period or the expenses you paid during the period. See “Compare With Other Funds” below for details on how to use the hypothetical data.
Compare With Other Funds
Since all mutual funds are required to include the same hypothetical calculations about expenses in shareholder reports, you can use this information to compare the ongoing cost of investing in the Fund with other funds. To do so, compare the hypothetical example with the 5% hypothetical examples that appear in the shareholder reports of other funds. As you compare hypothetical examples of other funds, it is important to note that hypothetical examples are meant to highlight the ongoing costs of investing in a fund only and do not reflect any transaction costs, such as sales charges, or redemption or exchange fees. Therefore, the hypothetical calculations are useful in comparing ongoing costs only, and will not help you determine the relative total costs of owning different funds. If transaction costs were included in these calculations, your costs would be higher.
October 1, 2014 – March 31, 2015
| | | | | | | | | | | | | | | | | | | | | | | | | | | | |
| | | Account Value at the
Beginning of the
Period ($) | | | Account Value at the
End of the
Period ($) | | | Expenses Paid During
the Period ($) | | | Fund’s Annualized
Expense Ratio (%) | |
| | | | Actual | | | | Hypothetical | | | | Actual | | | | Hypothetical | | | | Actual | | | | Hypothetical | | | | Actual | |
Class A | | | 1,000.00 | | | | 1,000.00 | | | | 1,005.00 | | | | 1,020.94 | | | | 4.00 | | | | 4.03 | | | | 0.80 | |
Class B | | | 1,000.00 | | | | 1,000.00 | | | | 1,003.50 | | | | 1,019.45 | | | | 5.49 | | | | 5.54 | | | | 1.10 | |
Class C | | | 1,000.00 | | | | 1,000.00 | | | | 1,002.00 | �� | | | 1,017.95 | | | | 6.99 | | | | 7.04 | | | | 1.40 | |
Class I | | | 1,000.00 | | | | 1,000.00 | | | | 1,007.00 | | | | 1,022.94 | | | | 2.00 | | | | 2.02 | | | | 0.40 | |
Class K | | | 1,000.00 | | | | 1,000.00 | | | | 1,005.50 | | | | 1,021.44 | | | | 3.50 | | | | 3.53 | | | | 0.70 | |
Class R | | | 1,000.00 | | | | 1,000.00 | | | | 1,003.70 | | | | 1,019.70 | | | | 5.25 | | | | 5.29 | | | | 1.05 | |
Class R4 | | | 1,000.00 | | | | 1,000.00 | | | | 1,007.30 | | | | 1,022.19 | | | | 2.75 | | | | 2.77 | | | | 0.55 | |
Class R5 | | | 1,000.00 | | | | 1,000.00 | | | | 1,006.80 | | | | 1,022.69 | | | | 2.25 | | | | 2.27 | | | | 0.45 | |
Class W | | | 1,000.00 | | | | 1,000.00 | | | | 1,005.00 | | | | 1,020.94 | | | | 4.00 | | | | 4.03 | | | | 0.80 | |
Class Y | | | 1,000.00 | | | | 1,000.00 | | | | 1,007.00 | | | | 1,022.94 | | | | 2.00 | | | | 2.02 | | | | 0.40 | |
Class Z | | | 1,000.00 | | | | 1,000.00 | | | | 1,006.30 | | | | 1,022.19 | | | | 2.75 | | | | 2.77 | | | | 0.55 | |
Expenses paid during the period are equal to the annualized expense ratio for each class as indicated above, multiplied by the average account value over the period and then multiplied by the number of days in the Fund’s most recent fiscal half year and divided by 365.
Expenses do not include fees and expenses incurred indirectly by the Fund from its investment in underlying funds, including affiliated and non-affiliated pooled investment vehicles, such as mutual funds and exchange-traded funds.
Had Columbia Management Investment Advisers, LLC and/or certain of its affiliates not waived/reimbursed certain fees and expenses, account value at the end of the period would have been reduced.
| | |
| |
| | COLUMBIA SHORT TERM BOND FUND |
PORTFOLIO OF INVESTMENTS
March 31, 2015
(Percentages represent value of investments compared to net assets)
| | | | | | | | | | | | |
| Corporate Bonds & Notes 31.7% | |
| Issuer | | Coupon
Rate | | | Principal
Amount ($) | | | Value ($) | |
AEROSPACE & DEFENSE 0.3% | | | | | |
L-3 Communications Corp. | |
05/28/17 | | | 1.500% | | | | 8,000,000 | | | | 7,949,872 | |
| | | |
| | | | | | | | | | | | |
AUTOMOTIVE 0.4% | | | | | |
Ford Motor Credit Co. LLC | |
01/16/18 | | | 2.375% | | | | 8,200,000 | | | | 8,341,893 | |
| | | |
| | | | | | | | | | | | |
BANKING 9.0% | | | | | |
BB&T Corp.(a) | |
12/01/16 | | | 0.692% | | | | 8,925,000 | | | | 8,924,866 | |
|
Bank of America Corp.(a) | |
03/22/16 | | | 1.085% | | | | 20,500,000 | | | | 20,559,389 | |
|
Bank of Montreal(a) | |
07/14/17 | | | 0.503% | | | | 7,000,000 | | | | 6,995,191 | |
|
Bank of New York Mellon Corp. (The)(a) | |
10/23/15 | | | 0.487% | | | | 5,800,000 | | | | 5,805,817 | |
|
Barclays Bank PLC(a) | |
02/17/17 | | | 0.837% | | | | 6,400,000 | | | | 6,411,565 | |
|
Canadian Imperial Bank of Commerce(a) | |
07/18/16 | | | 0.777% | | | | 6,725,000 | | | | 6,755,094 | |
| | | |
Capital One NA(a) | | | | | | | | | | | | |
02/05/18 | | | 0.935% | | | | 8,275,000 | | | | 8,291,012 | |
|
Citigroup, Inc. | |
06/15/16 | | | 3.953% | | | | 13,000,000 | | | | 13,440,544 | |
|
Goldman Sachs Group, Inc. (The)(a) | |
04/30/18 | | | 1.455% | | | | 11,750,000 | | | | 11,913,008 | |
|
HSBC USA, Inc | |
06/23/17 | | | 1.300% | | | | 6,000,000 | | | | 6,020,472 | |
|
ING Bank NV(a)(b) | |
03/16/18 | | | 0.821% | | | | 8,000,000 | | | | 8,008,000 | |
| | | |
JPMorgan Chase & Co. | | | | | | | | | | | | |
07/05/16 | | | 3.150% | | | | 12,000,000 | | | | 12,311,460 | |
| | | |
KeyCorp | | | | | | | | | | | | |
08/13/15 | | | 3.750% | | | | 6,000,000 | | | | 6,061,236 | |
| | | |
Lloyds Bank PLC | | | | | | | | | | | | |
03/28/17 | | | 4.200% | | | | 8,000,000 | | | | 8,454,896 | |
| | | |
Morgan Stanley | | | | | | | | | | | | |
04/29/16 | | | 3.800% | | | | 10,650,000 | | | | 10,957,913 | |
|
PNC Bank National Association(a) | |
01/28/16 | | | 0.566% | | | | 9,525,000 | | | | 9,535,944 | |
| | | |
Regions Financial Corp. | | | | | | | | | | | | |
05/15/18 | | | 2.000% | | | | 7,000,000 | | | | 6,993,518 | |
|
Royal Bank of Canada(a) | |
09/09/16 | | | 0.724% | | | | 7,000,000 | | | | 7,024,661 | |
|
Royal Bank of Scotland Group PLC | |
09/18/15 | | | 2.550% | | | | 7,600,000 | | | | 7,655,442 | |
|
Toronto-Dominion Bank (The) | |
04/30/18 | | | 1.400% | | | | 7,033,000 | | | | 7,035,342 | |
|
U.S. Bank(a) | |
04/29/20 | | | 3.778% | | | | 8,500,000 | | | | 8,515,351 | |
| | | | | | | | | | | | |
| Corporate Bonds & Notes (continued) | |
| Issuer | | Coupon
Rate | | | Principal
Amount ($) | | | Value ($) | |
Wells Fargo & Co.(a) | |
04/23/18 | | | 0.887% | | | | 14,000,000 | | | | 14,088,606 | |
|
Westpac Banking Corp.(a) | |
12/01/17 | | | 0.632% | | | | 8,000,000 | | | | 7,997,360 | |
| | | | | | | | | | | | | |
Total | | | | | | | | | | | 209,756,687 | |
| | | |
| | | | | | | | | | | | |
CABLE AND SATELLITE 1.1% | | | | | |
DIRECTV Holdings LLC/Financing Co., Inc. | |
02/15/16 | | | 3.125% | | | | 8,300,000 | | | | 8,457,476 | |
|
NBCUniversal Enterprise, Inc.(a)(b) | |
04/15/16 | | | 0.790% | | | | 8,995,000 | | | | 9,028,308 | |
|
Time Warner Cable, Inc. | |
02/01/20 | | | 5.000% | | | | 7,600,000 | | | | 8,473,833 | |
| | | | | | | | | | | | | |
Total | | | | | | | | | | | 25,959,617 | |
| | | |
| | | | | | | | | | | | |
CHEMICALS 0.5% | | | | | |
Eastman Chemical Co. | |
06/01/17 | | | 2.400% | | | | 4,550,000 | | | | 4,645,414 | |
|
LyondellBasell Industries NV | |
04/15/19 | | | 5.000% | | | | 7,000,000 | | | | 7,719,355 | |
| | | | | | | | | | | | | |
Total | | | | | | | | | | | 12,364,769 | |
| | | |
| | | | | | | | | | | | |
CONSTRUCTION MACHINERY 0.4% | | | | | |
Caterpillar Financial Services Corp. | |
05/29/15 | | | 1.100% | | | | 4,715,000 | | | | 4,722,365 | |
|
John Deere Capital Corp.(a) | |
01/16/18 | | | 0.544% | | | | 5,394,000 | | | | 5,407,350 | |
| | | | | | | | | | | | | |
Total | | | | | | | | | | | 10,129,715 | |
| | | |
| | | | | | | | | | | | |
DIVERSIFIED MANUFACTURING 0.3% | | | | | |
United Technologies Corp.(a) | |
06/01/15 | | | 0.762% | | | | 5,875,000 | | | | 5,880,164 | |
| | | |
| | | | | | | | | | | | |
ELECTRIC 1.7% | | | | | |
Dominion Resources, Inc. | | | | | | | | | | | | |
03/15/17 | | | 1.250% | | | | 7,885,000 | | | | 7,890,243 | |
|
Exelon Generation Co. LLC | |
10/01/19 | | | 5.200% | | | | 6,633,000 | | | | 7,437,046 | |
|
National Rural Utilities Cooperative Finance Corp. | |
03/01/16 | | | 3.050% | | | | 1,000,000 | | | | 1,022,610 | |
|
Nevada Power Co. | |
03/15/16 | | | 5.950% | | | | 7,275,000 | | | | 7,624,862 | |
|
Ohio Power Co. | |
06/01/16 | | | 6.000% | | | | 1,000,000 | | | | 1,057,042 | |
|
Progress Energy, Inc. | |
01/15/16 | | | 5.625% | | | | 7,579,000 | | | | 7,862,364 | |
|
TransAlta Corp. | |
06/03/17 | | | 1.900% | | | | 6,000,000 | | | | 5,963,592 | |
| | | | | | | | | | | | | |
Total | | | | | | | | | | | 38,857,759 | |
The accompanying Notes to Financial Statements are an integral part of this statement.
| | |
| |
| COLUMBIA SHORT TERM BOND FUND | | |
PORTFOLIO OF INVESTMENTS (continued)
March 31, 2015
| | | | | | | | | | | | |
| Corporate Bonds & Notes (continued) | |
| Issuer | | Coupon
Rate | | | Principal
Amount ($) | | | Value ($) | |
FINANCE COMPANIES 0.8% | | | | | |
General Electric Capital Corp.(a) | |
04/02/18 | | | 0.981% | | | | 18,500,000 | | | | 18,697,062 | |
| | | |
| | | | | | | | | | | | |
FOOD AND BEVERAGE 1.9% | | | | | |
Anheuser-Busch InBev Finance, Inc.(a) | |
01/27/17 | | | 0.446% | | | | 9,000,000 | | | | 8,982,027 | |
|
ConAgra Foods, Inc. | |
06/15/17 | | | 5.819% | | | | 3,681,000 | | | | 4,005,425 | |
03/15/18 | | | 2.100% | | | | 2,722,000 | | | | 2,733,310 | |
|
Diageo Capital PLC | |
05/11/17 | | | 1.500% | | | | 3,000,000 | | | | 3,028,068 | |
|
General Mills, Inc.(a) | |
01/29/16 | | | 0.553% | | | | 7,000,000 | | | | 6,999,559 | |
|
PepsiCo, Inc.(a) | |
02/26/16 | | | 0.471% | | | | 5,000,000 | | | | 5,005,655 | |
|
SABMiller Holdings, Inc.(b) | |
01/15/17 | | | 2.450% | | | | 7,332,000 | | | | 7,492,864 | |
|
Sysco Corp. | |
10/02/17 | | | 1.450% | | | | 6,095,000 | | | | 6,143,467 | |
| | | | | | | | | | | | | |
Total | | | | | | | | | | | 44,390,375 | |
| | | |
| | | | | | | | | | | | |
HEALTH CARE 1.1% | | | | | |
CareFusion Corp. | |
05/15/17 | | | 1.450% | | | | 6,000,000 | | | | 6,004,518 | |
|
McKesson Corp. | |
03/10/17 | | | 1.292% | | | | 6,000,000 | | | | 6,006,096 | |
|
Medco Health Solutions, Inc. | |
09/15/15 | | | 2.750% | | | | 6,350,000 | | | | 6,405,302 | |
| | | |
Medtronic, Inc.(b) | | | | | | | | | | | | |
03/15/20 | | | 2.500% | | | | 6,000,000 | | | | 6,132,840 | |
| | | | | | | | | | | | | |
Total | | | | | | | | | | | 24,548,756 | |
| | | |
| | | | | | | | | | | | |
HEALTHCARE INSURANCE 0.2% | | | | | |
UnitedHealth Group, Inc. | |
12/15/17 | | | 1.400% | | | | 5,510,000 | | | | 5,554,267 | |
| | | |
| | | | | | | | | | | | |
INDEPENDENT ENERGY 1.4% | | | | | |
Anadarko Petroleum Corp. | |
09/15/16 | | | 5.950% | | | | 6,000,000 | | | | 6,400,716 | |
|
Canadian Natural Resources Ltd. | |
05/15/17 | | | 5.700% | | | | 6,668,000 | | | | 7,215,976 | |
|
Devon Energy Corp. | |
12/15/18 | | | 2.250% | | | | 6,000,000 | | | | 6,057,414 | |
|
Southwestern Energy Co. | |
02/01/18 | | | 7.500% | | | | 5,000,000 | | | | 5,647,970 | |
|
Woodside Finance Ltd.(b) | |
03/01/19 | | | 8.750% | | | | 5,826,000 | | | | 7,156,536 | |
| | | | | | | | | | | | | |
Total | | | | | | | | | | | 32,478,612 | |
| | | |
| | | | | | | | | | | | |
INTEGRATED ENERGY 0.4% | | | | | |
BP Capital Markets PLC(a) | |
11/07/16 | | | 0.676% | | | | 9,500,000 | | | | 9,496,827 | |
| | | |
| | | | | | | | | | | | |
| | | | | | | | | | | | |
| Corporate Bonds & Notes (continued) | |
| Issuer | | Coupon
Rate | | | Principal
Amount ($) | | | Value ($) | |
LIFE INSURANCE 1.0% | | | | | |
American International Group, Inc. | |
01/16/18 | | | 5.850% | | | | 6,955,000 | | | | 7,769,695 | |
|
Metropolitan Life Global Funding I(a)(b) | |
04/10/17 | | | 0.632% | | | | 7,500,000 | | | | 7,516,725 | |
|
Prudential Covered Trust(b) | |
09/30/15 | | | 2.997% | | | | 6,874,000 | | | | 6,942,121 | |
| | | | | | | | | | | | | |
Total | | | | | | | | | | | 22,228,541 | |
| | | |
| | | | | | | | | | | | |
MEDIA AND ENTERTAINMENT 1.0% | | | | | |
21st Century Fox America, Inc. | |
10/17/16 | | | 8.000% | | | | 3,670,000 | | | | 4,055,703 | |
|
British Sky Broadcasting Group PLC(b) | |
02/15/18 | | | 6.100% | | | | 5,800,000 | | | | 6,461,774 | |
|
Scripps Networks Interactive, Inc. | |
11/15/19 | | | 2.750% | | | | 6,000,000 | | | | 6,050,742 | |
|
Thomson Reuters Corp. | |
05/23/16 | | | 0.875% | | | | 7,500,000 | | | | 7,497,120 | |
| | | | | | | | | | | | | |
Total | | | | | | | | | | | 24,065,339 | |
| | | |
| | | | | | | | | | | | |
METALS 0.6% | | | | | |
Rio Tinto Finance USA PLC | |
08/21/17 | | | 1.625% | | | | 6,000,000 | | | | 6,033,054 | |
|
Vale Overseas Ltd. | |
01/23/17 | | | 6.250% | | | | 6,900,000 | | | | 7,311,930 | |
| | | | | | | | | | | | | |
Total | | | | | | | | | | | 13,344,984 | |
| | | |
| | | | | | | | | | | | |
MIDSTREAM 2.1% | | | | | |
Enterprise Products Operating LLC | |
02/01/16 | | | 3.200% | | | | 6,138,000 | | | | 6,246,759 | |
|
Kinder Morgan Energy Partners LP | |
03/01/21 | | | 3.500% | | | | 7,265,000 | | | | 7,322,699 | |
|
NiSource Finance Corp. | |
01/15/19 | | | 6.800% | | | | 6,144,000 | | | | 7,229,829 | |
|
Plains All American Pipeline LP/Finance Corp. | |
08/15/16 | | | 5.875% | | | | 6,000,000 | | | | 6,365,598 | |
|
Southern Natural Gas Co. LLC(b) | |
04/01/17 | | | 5.900% | | | | 7,365,000 | | | | 7,918,053 | |
|
TransCanada PipeLines Ltd.(a) | |
06/30/16 | | | 0.953% | | | | 7,000,000 | | | | 7,021,469 | |
|
Williams Partners LP/Finance Corp. | |
02/01/17 | | | 7.250% | | | | 5,300,000 | | | | 5,822,532 | |
| | | | | | | | | | | | | |
Total | | | | | | | | | | | 47,926,939 | |
| | | |
| | | | | | | | | | | | |
OFFICE REIT 0.3% | |
Boston Properties LP | | | | | | | | | | | | |
11/15/18 | | | 3.700% | | | | 5,888,000 | | | | 6,271,197 | |
| | | |
| | | | | | | | | | | | |
OIL FIELD SERVICES 0.6% | |
Halliburton Co. | | | | | | | | | | | | |
08/01/16 | | | 1.000% | | | | 7,500,000 | | | | 7,516,372 | |
|
Noble Holding International Ltd. | |
03/16/18 | | | 4.000% | | | | 7,275,000 | | | | 7,315,282 | |
| | | | | | | | | | | | | |
Total | | | | | | | | | | | 14,831,654 | |
The accompanying Notes to Financial Statements are an integral part of this statement.
| | |
| |
| | COLUMBIA SHORT TERM BOND FUND |
PORTFOLIO OF INVESTMENTS (continued)
March 31, 2015
| | | | | | | | | | | | |
| Corporate Bonds & Notes (continued) | |
| Issuer | | Coupon
Rate | | | Principal
Amount ($) | | | Value ($) | |
PHARMACEUTICALS 1.0% | |
AbbVie, Inc. | | | | | | | | | | | | |
11/06/17 | | | 1.750% | | | | 6,500,000 | | | | 6,523,055 | |
|
Actavis Funding SCS | |
06/15/19 | | | 2.450% | | | | 2,684,000 | | | | 2,695,045 | |
|
Actavis Funding SCS(a) | |
03/12/18 | | | 1.348% | | | | 6,500,000 | | | | 6,541,028 | |
|
Amgen, Inc. | |
06/15/16 | | | 2.300% | | | | 8,375,000 | | | | 8,500,684 | |
| | | | | | | | | | | | | |
Total | | | | | | | | | | | 24,259,812 | |
| | | |
| | | | | | | | | | | | |
PROPERTY & CASUALTY 1.3% | |
Berkshire Hathaway Finance Corp.(a) | |
08/14/17 | | | 0.382% | | | | 6,835,000 | | | | 6,834,084 | |
|
CNA Financial Corp. | |
08/15/16 | | | 6.500% | | | | 5,500,000 | | | | 5,891,990 | |
|
Hartford Financial Services Group, Inc. (The) | |
01/15/19 | | | 6.000% | | | | 5,500,000 | | | | 6,252,158 | |
|
Liberty Mutual Group, Inc.(b) | |
06/01/21 | | | 5.000% | | | | 7,000,000 | | | | 7,755,349 | |
|
Transatlantic Holdings, Inc. | |
12/14/15 | | | 5.750% | | | | 3,090,000 | | | | 3,184,440 | |
| | | | | | | | | | | | | |
Total | | | | | | | | | | | 29,918,021 | |
| | | |
| | | | | | | | | | | | |
REFINING 0.3% | |
Marathon Petroleum Corp. | |
03/01/16 | | | 3.500% | | | | 6,000,000 | | | | 6,131,016 | |
| | | |
| | | | | | | | | | | | |
RESTAURANTS 0.3% | |
Yum! Brands, Inc. | |
04/15/16 | | | 6.250% | | | | 6,690,000 | | | | 7,044,831 | |
| | | |
| | | | | | | | | | | | |
RETAIL REIT 0.6% | |
Kimco Realty Corp. | |
02/01/18 | | | 4.300% | | | | 6,000,000 | | | | 6,452,706 | |
|
Simon Property Group LP | |
02/01/19 | | | 2.200% | | | | 7,800,000 | | | | 7,919,410 | |
| | | | | | | | | | | | | |
Total | | | | | | | | | | | 14,372,116 | |
| | | |
| | | | | | | | | | | | |
TECHNOLOGY 1.0% | |
Apple, Inc.(a) | |
05/03/16 | | | 0.303% | | | | 6,000,000 | | | | 6,002,556 | |
|
Cisco Systems, Inc.(a) | |
03/03/17 | | | 0.542% | | | | 6,000,000 | | | | 6,018,966 | |
|
Hewlett-Packard Co. | |
06/01/16 | | | 2.650% | | | | 6,100,000 | | | | 6,214,034 | |
|
Oracle Corp.(a) | |
07/07/17 | | | 0.471% | | | | 6,000,000 | | | | 6,006,708 | |
| | | | | | | | | | | | | |
Total | | | | | | | | | | | 24,242,264 | |
| | | |
| | | | | | | | | | | | |
TRANSPORTATION SERVICES 0.3% | |
ERAC U.S.A. Finance LLC(b) | |
10/15/17 | | | 6.375% | | | | 7,275,000 | | | | 8,148,364 | |
| | | | | | | | | | | | |
| Corporate Bonds & Notes (continued) | |
| Issuer | | Coupon
Rate | | | Principal
Amount ($) | | | Value ($) | |
WIRELINES 1.8% | |
AT&T, Inc. | |
11/27/18 | | | 2.375% | | | | 2,165,000 | | | | 2,192,868 | |
|
Deutsche Telekom International Finance BV(b) | |
04/11/16 | | | 3.125% | | | | 6,000,000 | | | | 6,129,666 | |
|
Orange SA | |
09/14/16 | | | 2.750% | | | | 6,000,000 | | | | 6,135,240 | |
|
Southwestern Bell Telephone LP | |
07/01/15 | | | 7.000% | | | | 9,200,000 | | | | 9,330,530 | |
|
Telefonica Emisiones SAU | |
04/27/18 | | | 3.192% | | | | 5,000,000 | | | | 5,214,710 | |
|
Verizon Communications, Inc. | |
03/15/21 | | | 3.450% | | | | 11,628,000 | | | | 12,161,097 | |
| | | | | | | | | | | | | |
Total | | | | | | | | | | | 41,164,111 | |
| | | | | | | | | | | | | |
Total Corporate Bonds & Notes | | | | | |
(Cost: $732,616,055) | | | | | | | | 738,355,564 | |
| | | |
| | | | | | | | | | | | |
| Residential Mortgage-Backed Securities — Agency 3.7% | |
| Issuer | | Coupon
Rate | | | Principal
Amount ($) | | | Value ($) | |
Federal Home Loan Mortgage Corp.(a)(c) | |
03/01/34 | | | 2.440% | | | | 378,421 | | | | 402,017 | |
04/01/35 | | | 2.058% | | | | 285,707 | | | | 302,093 | |
01/01/36 | | | 2.458% | | | | 878,697 | | | | 941,554 | |
07/01/36 | | | 2.235% | | | | 10,053 | | | | 10,651 | |
08/01/36 | | | 2.227% | | | | 183,120 | | | | 195,268 | |
12/01/36 | | | 6.091% | | | | 161,808 | | | | 174,375 | |
01/01/37 | | | 2.157% | | | | 452,329 | | | | 481,079 | |
09/01/37 | | | 2.423% | | | | 514,656 | | | | 550,990 | |
|
Federal Home Loan Mortgage Corp.(c) | |
03/01/17 - 10/01/21 | | | 6.000% | | | | 566,470 | | | | 613,344 | |
04/01/17 | | | 6.500% | | | | 1,020,579 | | | | 1,060,984 | |
05/01/17 - 02/01/24 | | | 5.500% | | | | 5,090,627 | | | | 5,557,770 | |
11/01/17 - 07/01/25 | | | 5.000% | | | | 7,050,563 | | | | 7,631,806 | |
03/01/19 - 10/01/24 | | | 4.500% | | | | 2,457,146 | | | | 2,640,089 | |
04/01/21 - 10/01/26 | | | 3.500% | | | | 8,584,210 | | | | 9,125,549 | |
05/01/24 - 07/01/26 | | | 4.000% | | | | 10,299,329 | | | | 10,967,952 | |
03/01/27 | | | 3.000% | | | | 211,513 | | | | 221,842 | |
CMO Series 2467 Class NB | | | | | |
07/15/17 | | | 5.000% | | | | 895,677 | | | | 927,543 | |
|
Federal National Mortgage Association(a)(c) | |
06/01/33 | | | 1.796% | | | | 672,422 | | | | 698,847 | |
07/01/33 | | | 1.787% | | | | 32,453 | | | | 32,743 | |
03/01/34 | | | 2.230% | | | | 370,639 | | | | 394,733 | |
04/01/34 | | | 2.061% | | | | 591,760 | | | | 628,418 | |
06/01/34 | | | 2.250% | | | | 497,735 | | | | 527,566 | |
07/01/34 | | | 2.005% | | | | 744,085 | | | | 790,213 | |
11/01/34 | | | 1.936% | | | | 229,134 | | | | 242,715 | |
01/01/35 | | | 1.945% | | | | 338,483 | | | | 359,055 | |
06/01/35 | | | 2.296% | | | | 490,823 | | | | 522,942 | |
07/01/35 | | | 2.412% | | | | 427,337 | | | | 457,216 | |
08/01/35 | | | 2.348% | | | | 547,039 | | | | 585,213 | |
10/01/35 | | | 2.405% | | | | 430,810 | | | | 451,909 | |
04/01/36 | | | 1.925% | | | | 167,475 | | | | 178,585 | |
The accompanying Notes to Financial Statements are an integral part of this statement.
| | |
| |
| COLUMBIA SHORT TERM BOND FUND | | |
PORTFOLIO OF INVESTMENTS (continued)
March 31, 2015
| | | | | | | | | | | | |
| Residential Mortgage-Backed Securities — Agency (continued) | |
| Issuer | | Coupon
Rate | | | Principal
Amount ($) | | | Value ($) | |
04/01/36 | | | 2.162% | | | | 1,384,262 | | | | 1,482,901 | |
04/01/36 | | | 2.455% | | | | 96,981 | | | | 103,739 | |
08/01/36 | | | 2.396% | | | | 133,140 | | | | 143,565 | |
06/01/37 | | | 1.189% | | | | 1,000,715 | | | | 1,045,309 | |
09/01/37 | | | 2.274% | | | | 215,324 | | | | 229,231 | |
09/01/37 | | | 2.283% | | | | 38,897 | | | | 39,843 | |
CMO Series 2003-W11 Class A1 | |
06/25/33 | | | 3.464% | | | | 24,483 | | | | 25,664 | |
|
Federal National Mortgage Association(c) | |
06/01/17 - 08/01/17 | | | 6.000% | | | | 2,194,297 | | | | 2,279,672 | |
11/01/17 - 01/01/24 | | | 5.500% | | | | 8,629,790 | | | | 9,468,000 | |
07/01/22 - 08/01/24 | | | 5.000% | | | | 2,566,463 | | | | 2,785,011 | |
03/01/24 - 02/01/27 | | | 4.000% | | | | 15,850,230 | | | | 16,841,867 | |
12/01/25 - 01/01/27 | | | 3.500% | | | | 2,381,591 | | | | 2,529,895 | |
|
Federal National Mortgage Association(c)(d)
CMO PO Series G-15 Class A | |
06/25/21 | | | 0.000% | | | | 5,846 | | | | 5,727 | |
|
Federal National Mortgage Association(c)(e) | |
10/01/24 | | | 5.500% | | | | 606,031 | | | | 674,169 | |
02/01/25 | | | 4.000% | | | | 180,572 | | | | 191,343 | |
|
Government National Mortgage Association(a)(c) | |
07/20/18 | | | 3.000% | | | | 54,561 | | | | 55,955 | |
04/20/22 - 03/20/30 | | | 1.625% | | | | 762,404 | | | | 789,319 | |
|
Government National Mortgage Association(c) | |
09/20/21 | | | 6.000% | | | | 107,316 | | | | 113,844 | |
| | | | | | | | | | | | | |
Total Residential Mortgage-Backed Securities — Agency | |
(Cost: $83,580,839) | | | | | | | | | | | 86,480,115 | |
| | | |
| | | | | | | | | | | | |
| Residential Mortgage-Backed Securities — Non-Agency 2.0% | |
BCAP LLC Trust
CMO Series 2010-RR2 Class 5A1(a)(b)(c) | |
12/26/36 | | | 5.000% | | | | 1,106,992 | | | | 1,110,316 | |
|
Credit Suisse Mortgage Capital Certificates
CMO Series 2009-9R Class 12A1(a)(b)(c) | |
08/26/35 | | | 5.387% | | | | 4,567,345 | | | | 4,640,775 | |
|
JPMorgan Resecuritization Trust(a)(b)(c)
CMO Series 2009-12 Class 9A1 | |
05/26/36 | | | 2.673% | | | | 5,631,801 | | | | 5,680,004 | |
CMO Series 2010-4 Class 3A2 | |
04/26/35 | | | 4.500% | | | | 4,895,306 | | | | 5,043,861 | |
|
Springleaf Mortgage Loan Trust(a)(b)(c)
CMO Series 2012-3A Class A | |
12/25/59 | | | 1.570% | | | | 6,620,660 | | | | 6,598,646 | |
CMO Series 2013-1A Class A | |
06/25/58 | | | 1.270% | | | | 6,136,552 | | | | 6,118,050 | |
CMO Series 2013-2A Class A | |
12/25/65 | | | 1.780% | | | | 5,270,175 | | | | 5,261,069 | |
CMO Series 2013-3A Class A | |
09/25/57 | | | 1.870% | | | | 10,087,879 | | | | 10,069,510 | |
|
Wells Fargo Mortgage Loan Trust
CMO Series 2010-RR4 Class 1A1(a)(b)(c) | |
12/27/46 | | | 2.620% | | | | 2,830,788 | | | | 2,817,558 | |
| | | | | | | | | | | | | |
Total Residential Mortgage-Backed Securities — Non-Agency | |
(Cost: $47,592,959) | | | | | | | | | | | 47,339,789 | |
| | | | | | | | | | | | |
| Commercial Mortgage-Backed Securities — Agency 12.1% | |
| Issuer | | Coupon
Rate | | | Principal
Amount ($) | | | Value ($) | |
Government National Mortgage Association(a)(c)
Series 2013-50 Class AH | |
06/16/39 | | | 2.100% | | | | 11,482,801 | | | | 11,506,249 | |
|
Government National Mortgage Association(c)
Series 2010-141 Class A | |
08/16/31 | | | 1.864% | | | | 658,814 | | | | 659,846 | |
Series 2011-120 Class AB | |
08/16/33 | | | 2.400% | | | | 7,186,590 | | | | 7,240,030 | |
Series 2011-144 Class AB | |
07/16/35 | | | 2.012% | | | | 522,368 | | | | 522,647 | |
Series 2011-149 Class A | | | | | | | | | | | | |
10/16/46 | | | 3.000% | | | | 1,471,184 | | | | 1,497,168 | |
Series 2011-16 Class A | | | | | | | | | | | | |
11/16/34 | | | 2.210% | | | | 1,406,998 | | | | 1,407,673 | |
Series 2011-161 Class A | | | | | | | | | | | | |
01/16/34 | | | 1.738% | | | | 9,818,678 | | | | 9,808,250 | |
Series 2011-20 Class A | | | | | | | | | | | | |
04/16/32 | | | 1.883% | | | | 4,501,164 | | | | 4,514,954 | |
Series 2011-31 Class A | | | | | | | | | | | | |
12/16/35 | | | 2.210% | | | | 1,718,306 | | | | 1,725,263 | |
Series 2011-78 Class A | | | | | | | | | | | | |
08/16/34 | | | 2.250% | | | | 2,545,508 | | | | 2,552,679 | |
Series 2012-1 Class AB | | | | | | | | | | | | |
09/16/33 | | | 1.999% | | | | 4,997,306 | | | | 5,013,742 | |
Series 2012-142 Class A | | | | | | | | | | | | |
05/16/37 | | | 1.105% | | | | 8,092,630 | | | | 7,986,066 | |
Series 2012-22 Class AB | | | | | | | | | | | | |
03/16/33 | | | 1.661% | | | | 2,978,995 | | | | 2,995,950 | |
Series 2012-4 Class A | | | | | | | | | | | | |
05/16/40 | | | 2.120% | | | | 11,347,806 | | | | 11,462,601 | |
Series 2012-55 Class A | | | | | | | | | | | | |
08/16/33 | | | 1.704% | | | | 9,255,905 | | | | 9,290,701 | |
Series 2012-58 Class A | | | | | | | | | | | | |
01/16/40 | | | 2.500% | | | | 14,651,601 | | | | 14,901,192 | |
Series 2012-79 Class A | | | | | | | | | | | | |
04/16/39 | | | 1.800% | | | | 12,190,936 | | | | 12,060,407 | |
Series 2012-9 Class A | | | | | | | | | | | | |
05/16/39 | | | 3.220% | | | | 1,728,899 | | | | 1,761,441 | |
Series 2013-118 Class AC | | | | | |
06/16/36 | | | 1.700% | | | | 5,113,656 | | | | 5,091,105 | |
Series 2013-12 Class A | | | | | | | | | | | | |
10/16/42 | | | 1.410% | | | | 13,777,352 | | | | 13,627,165 | |
Series 2013-126 Class AB | | | | | |
04/16/38 | | | 1.540% | | | | 7,741,458 | | | | 7,669,643 | |
Series 2013-17 Class AF | | | | | | | | | | | | |
11/16/43 | | | 1.210% | | | | 9,164,128 | | | | 8,999,706 | |
Series 2013-17 Class AH | | | | | | | | | | | | |
10/16/43 | | | 1.558% | | | | 11,433,189 | | | | 11,308,052 | |
Series 2013-194 Class AB | | | | | |
05/16/38 | | | 2.250% | | | | 10,087,650 | | | | 10,198,009 | |
Series 2013-2 Class AB | | | | | | | | | | | | |
12/16/42 | | | 1.600% | | | | 16,102,108 | | | | 15,985,947 | |
Series 2013-30 Class A | | | | | | | | | | | | |
05/16/42 | | | 1.500% | | | | 18,942,053 | | | | 18,659,589 | |
Series 2013-32 Class AB | | | | | | | | | | | | |
01/16/42 | | | 1.900% | | | | 6,232,585 | | | | 6,201,796 | |
Series 2013-33 Class A | | | | | | | | | | | | |
07/16/38 | | | 1.061% | | | | 27,396,417 | | | | 26,919,500 | |
Series 2013-35 Class A | | | | | | | | | | | | |
02/16/40 | | | 1.618% | | | | 7,810,436 | | | | 7,730,332 | |
The accompanying Notes to Financial Statements are an integral part of this statement.
| | |
| |
| | COLUMBIA SHORT TERM BOND FUND |
PORTFOLIO OF INVESTMENTS (continued)
March 31, 2015
| | | | | | | | | | | | |
| Commercial Mortgage-Backed Securities — Agency (continued) | |
| Issuer | | Coupon
Rate | | | Principal
Amount ($) | | | Value ($) | |
Series 2013-40 Class A | | | | | | | | | | | | |
10/16/41 | | | 1.511% | | | | 12,048,735 | | | | 11,938,923 | |
Series 2013-45 Class A | | | | | | | | | | | | |
10/16/40 | | | 1.450% | | | | 6,445,244 | | | | 6,364,176 | |
Series 2013-57 Class A | | | | | | | | | | | | |
06/16/37 | | | 1.350% | | | | 10,312,576 | | | | 10,187,938 | |
Series 2013-61 Class A | | | | | | | | | | | | |
01/16/43 | | | 1.450% | | | | 13,375,090 | | | | 13,172,137 | |
| | | | | | | | | | | | | |
Total Commercial Mortgage-Backed Securities — Agency | |
(Cost: $285,536,038) | | | | | | | | | | | 280,960,877 | |
| | | |
| | | | | | | | | | | | |
| Commercial Mortgage-Backed Securities — Non-Agency 9.1% | |
Bear Stearns Commercial Mortgage Securities Trust
Series 2006-T24 Class A4(c) | |
10/12/41 | | | 5.537% | | | | 5,717,432 | | | | 5,997,426 | |
|
Citigroup/Deutsche Bank Commercial Mortgage Trust
Series 2005-CD1 Class A4(a)(c) | |
07/15/44 | | | 5.225% | | | | 10,865,478 | | | | 10,917,371 | |
|
Colony Multifamily Mortgage Trust
Series 2014-1 Class A(b)(c) | |
04/20/50 | | | 2.543% | | | | 7,625,129 | | | | 7,650,411 | |
|
Commercial Mortgage Trust
Series 2006-C8 Class A4(c) | |
12/10/46 | | | 5.306% | | | | 1,416,181 | | | | 1,489,534 | |
|
Credit Suisse First Boston Mortgage Securities Corp.(a)(c) | |
Series 2005-C4 Class A5 | | | | | | | | | | | | |
08/15/38 | | | 5.104% | | | | 3,295,939 | | | | 3,303,638 | |
Series 2005-C6 Class A4 | | | | | | | | | | | | |
12/15/40 | | | 5.230% | | | | 3,467,087 | | | | 3,495,906 | |
|
GE Capital Commercial Mortgage Corp.
Series 2006-C1 Class A4(a)(c) | |
03/10/44 | | | 5.271% | | | | 8,434,428 | | | | 8,608,583 | |
|
GS Mortgage Securities Trust
Series 2006-GG8 Class A4(c) | |
11/10/39 | | | 5.560% | | | | 11,611,566 | | | | 12,185,363 | |
|
JPMorgan Chase Commercial Mortgage Securities Trust(a)(c)
Series 2005-LDP4 Class A4 | |
10/15/42 | | | 4.918% | | | | 10,229,156 | | | | 10,290,398 | |
Series 2005-LDP5 Class A4 | |
12/15/44 | | | 5.227% | | | | 12,186,265 | | | | 12,319,667 | |
Series 2006-CB14 Class ASB | |
12/12/44 | | | 5.506% | | | | 434,245 | | | | 435,072 | |
Series 2006-LDP6 Class A4 | |
04/15/43 | | | 5.475% | | | | 9,280,179 | | | | 9,484,723 | |
Series 2006-LDP7 Class ASB | |
04/15/45 | | | 5.841% | | | | 289,478 | | | | 292,377 | |
|
LB-UBS Commercial Mortgage Trust
Series 2006-C4 Class A4(a)(c) | |
06/15/38 | | | 5.822% | | | | 8,842,518 | | | | 9,212,498 | |
|
Merrill Lynch Mortgage Trust
Series 2005-CKI1 Class A6(a)(c) | |
11/12/37 | | | 5.282% | | | | 4,402,120 | | | | 4,438,776 | |
|
Morgan Stanley Capital I Trust(a)(c)
Series 2007-HQ11 Class A4 | |
02/12/44 | | | 5.447% | | | | 11,920,000 | | | | 12,615,151 | |
| | | | | | | | | | | | |
| Commercial Mortgage-Backed Securities — Non-Agency (continued) | |
| Issuer | | Coupon
Rate | | | Principal
Amount ($) | | | Value ($) | |
Series 2007-T27 Class A4 | |
06/11/42 | | | 5.654% | | | | 5,690,000 | | | | 6,168,950 | |
|
Morgan Stanley Capital I Trust(c) | |
Series 2007-IQ13 Class A4 | |
03/15/44 | | | 5.364% | | | | 8,450,000 | | | | 8,992,760 | |
|
Morgan Stanley Re-Remic Trust(a)(b)(c)
Series 2009-GG10 Class A4A | |
08/12/45 | | | 5.796% | | | | 11,930,239 | | | | 12,772,168 | |
Series 2010-GG10 Class A4A | |
08/15/45 | | | 5.796% | | | | 14,451,039 | | | | 15,465,343 | |
|
Wachovia Bank Commercial Mortgage Trust(a)(c)
Series 2005-C21 Class A4 | |
10/15/44 | | | 5.272% | | | | 9,135,642 | | | | 9,201,620 | |
Series 2005-C22 Class A4 | |
12/15/44 | | | 5.271% | | | | 15,782,788 | | | | 15,976,758 | |
Series 2006-C24 Class A1A | |
03/15/45 | | | 5.557% | | | | 17,822,894 | | | | 18,379,360 | |
Series 2006-C24 Class A3 | |
03/15/45 | | | 5.558% | | | | 11,644,372 | | | | 11,934,923 | |
| | | | | | | | | | | | | |
Total Commercial Mortgage-Backed Securities — Non-Agency | |
(Cost: $220,552,802) | | | | | | | | | | | 211,628,776 | |
| | | |
| | | | | | | | | | | | |
| Asset-Backed Securities — Non-Agency 18.3% | |
AMRESCO Residential Securities Corp. Mortgage Loan Trust
Series 1998-3 Class A7(a)(f) | |
07/25/28 | | | 0.654% | | | | 14,774 | | | | 13,111 | |
|
ARI Fleet Lease Trust
Series 2012-A Class A(a)(b) | |
03/15/20 | | | 0.725% | | | | 661,825 | | | | 662,009 | |
|
Aames Mortgage Investment Trust
Series 2005-3 Class A2(a)(b) | |
08/25/35 | | | 0.694% | | | | 3,660,082 | | | | 3,646,686 | |
|
Access Group, Inc.(a) | |
Series 2004A Class A2 | | | | | | | | | | | | |
04/25/29 | | | 0.516% | | | | 8,964,617 | | | | 8,813,975 | |
Series 2007A Class A2 | |
08/25/26 | | | 0.392% | | | | 1,341,271 | | | | 1,335,194 | |
|
Ally Master Owner Trust(a)
Series 2013-1 Class A1 | |
02/15/18 | | | 0.625% | | | | 7,475,000 | | | | 7,485,212 | |
Series 2014-1 Class A1 | |
01/15/19 | | | 0.645% | | | | 6,125,000 | | | | 6,144,436 | |
Series 2014-2 Class A | |
01/16/18 | | | 0.545% | | | | 3,000,000 | | | | 3,002,362 | |
|
AmeriCredit Automobile Receivables Trust
Series 2013-4 Class B | |
09/10/18 | | | 1.660% | | | | 2,660,000 | | | | 2,679,088 | |
Series 2015-1 Class A2A | |
04/09/18 | | | 0.770% | | | | 1,650,000 | | | | 1,649,007 | |
|
American Credit Acceptance Receivables Trust(b)
Series 2012-3 Class A | |
11/15/16 | | | 1.640% | | | | 70,616 | | | | 70,673 | |
Series 2013-1 Class A | | | | | | | | | | | | |
04/16/18 | | | 1.450% | | | | 1,370,635 | | | | 1,373,019 | |
The accompanying Notes to Financial Statements are an integral part of this statement.
| | |
| |
| COLUMBIA SHORT TERM BOND FUND | | |
PORTFOLIO OF INVESTMENTS (continued)
March 31, 2015
| | | | | | | | | | | | |
| Asset-Backed Securities — Non-Agency (continued) | |
| Issuer | | Coupon
Rate | | | Principal
Amount ($) | | | Value ($) | |
Series 2013-2 Class A | | | | | | | | | | | | |
02/15/17 | | | 1.320% | | | | 565,468 | | | | 565,716 | |
Series 2014-1 Class A | |
03/12/18 | | | 1.140% | | | | 1,321,882 | | | | 1,322,415 | |
Series 2014-3 Class A | |
08/10/18 | | | 0.990% | | | | 5,551,055 | | | | 5,547,729 | |
|
CCG Receivables Trust(b)
Series 2013-1 Class A2 | |
08/14/20 | | | 1.050% | | | | 2,669,144 | | | | 2,671,970 | |
Series 2014-1 Class A2 | |
11/15/21 | | | 1.060% | | | | 3,673,510 | | | | 3,671,856 | |
|
CIT Equipment Collateral
Series 2014-VT1 Class A2(b) | |
05/22/17 | | | 0.860% | | | | 10,600,000 | | | | 10,595,713 | |
|
CNH Wholesale Master Note Trust
Series 2013-2A Class A(a)(b) | |
08/15/19 | | | 0.775% | | | | 14,150,000 | | | | 14,171,382 | |
|
California Republic Auto Receivables Trust
Series 2014-3 Class A3 | |
11/15/18 | | | 1.090% | | | | 4,925,000 | | | | 4,931,728 | |
|
Capital Auto Receivables Asset Trust
Series 2014-3 Class A2 | |
12/20/17 | | | 1.180% | | | | 8,080,000 | | | | 8,079,130 | |
Series 2015-1 Class A1A | |
07/20/17 | | | 0.950% | | | | 3,815,000 | | | | 3,796,999 | |
|
CarFinance Capital Auto Trust(b) | |
Series 2013-2A Class A | | | | | | | | | | | | |
11/15/17 | | | 1.750% | | | | 1,877,324 | | | | 1,880,634 | |
Series 2014-1A Class A | |
12/17/18 | | | 1.460% | | | | 2,714,167 | | | | 2,710,771 | |
Series 2015-1A Class A | |
06/15/21 | | | 1.750% | | | | 7,051,077 | | | | 7,037,401 | |
|
Chesapeake Funding LLC(a)(b) | |
Series 2011-2A Class A | | | | | | | | | | | | |
04/07/24 | | | 1.425% | | | | 5,250,130 | | | | 5,290,462 | |
Series 2014-1A Class A | |
03/07/26 | | | 0.595% | | | | 12,000,000 | | | | 12,000,504 | |
|
Citigroup Mortgage Loan Trust, Inc.
Series 2003-HE4 Class A(a)(b) | |
12/25/33 | | | 0.584% | | | | 497,178 | | | | 496,908 | |
|
Cityscape Home Equity Loan Trust
Series 1997-C Class A3(a)(f)(g)(h) | |
07/25/28 | | | 7.380% | | | | 607,537 | | | | 1 | |
|
DT Auto Owner Trust(b) | |
Series 2014-1A Class A | | | | | | | | | | | | |
07/17/17 | | | 0.660% | | | | 1,243,091 | | | | 1,242,874 | |
Series 2014-3A Class A | |
04/16/18 | | | 0.980% | | | | 8,238,497 | | | | 8,232,314 | |
|
Diamond Resorts Owner Trust
Series 2013-2 Class A(b) | |
05/20/26 | | | 2.270% | | | | 5,068,674 | | | | 5,097,582 | |
|
Drive Auto Receivables Trust
Series 2015-AA Class A3(b) | |
07/16/18 | | | 1.430% | | | | 5,655,000 | | | | 5,655,189 | |
|
EFS Volunteer LLC
Series 2010-1 Class A1(a)(b) | |
10/26/26 | | | 1.106% | | | | 4,771,091 | | | | 4,791,769 | |
| | | | | | | | | | | | |
| Asset-Backed Securities — Non-Agency (continued) | |
| Issuer | | Coupon
Rate | | | Principal
Amount ($) | | | Value ($) | |
Encore Credit Receivables Trust
Series 2005-4 Class 2A4(a) | |
01/25/36 | | | 0.514% | | | | 3,151,417 | | | | 3,139,328 | |
|
Enterprise Fleet Financing LLC
Series 2015-1 Class A2(b) | |
09/20/20 | | | 1.300% | | | | 5,000,000 | | | | 5,006,570 | |
|
Exeter Automobile Receivables Trust(b)
Series 2012-2A Class A | |
06/15/17 | | | 1.300% | | | | 234,415 | | | | 234,459 | |
Series 2014-2A Class A | |
08/15/18 | | | 1.060% | | | | 4,396,068 | | | | 4,384,768 | |
Series 2014-3A Class A | |
01/15/19 | | | 1.320% | | | | 9,878,302 | | | | 9,863,805 | |
Series 2015-1A Class A | |
06/17/19 | | | 1.600% | | | | 8,150,000 | | | | 8,140,311 | |
|
First Alliance Mortgage Loan Trust
Series 1994-2 Class A2 (NPFGC)(f) | |
06/25/25 | | | 6.680% | | | | 20,644 | | | | 20,672 | |
|
First Investors Auto Owner Trust(b)
Series 2013-2A Class A2 | |
03/15/19 | | | 1.230% | | | | 1,875,171 | | | | 1,878,130 | |
Series 2013-3A Class A2 | |
09/15/17 | | | 0.890% | | | | 1,378,831 | | | | 1,379,123 | |
Series 2014-1A Class A2 | |
02/15/18 | | | 0.800% | | | | 2,415,618 | | | | 2,414,427 | |
Series 2014-3A Class A2 | |
11/15/18 | | | 1.060% | | | | 8,400,000 | | | | 8,391,964 | |
|
GE Dealer Floorplan Master Note Trust(a)
Series 2014-1 Class A | |
07/20/19 | | | 0.556% | | | | 8,045,000 | | | | 8,045,175 | |
Series 2015-1 Class A | |
01/20/20 | | | 0.676% | | | | 7,300,000 | | | | 7,300,009 | |
|
Hertz Fleet Lease Funding LP(a)(b) | |
Series 2013-3 Class A | |
12/10/27 | | | 0.725% | | | | 11,090,218 | | | | 11,100,434 | |
Series 2014-1 Class A | |
04/10/28 | | | 0.575% | | | | 13,000,000 | | | | 13,000,000 | |
|
Hilton Grand Vacations Trust(b)
Series 2013-A Class A | |
01/25/26 | | | 2.280% | | | | 9,349,676 | | | | 9,426,579 | |
Series 2014-AA Class A | |
11/25/26 | | | 1.770% | | | | 9,230,873 | | | | 9,158,203 | |
|
Hyundai Auto Lease Securitization Trust
Series 2015-A Class A3(b) | |
09/17/18 | | | 1.420% | | | | 7,405,000 | | | | 7,403,807 | |
|
IMC Home Equity Loan Trust
Series 1997-3 Class A7 | |
08/20/28 | | | 7.080% | | | | 56 | | | | 56 | |
|
KeyCorp Student Loan Trust
Series 1999-A Class A2(a) | |
12/27/29 | | | 0.599% | | | | 3,599,201 | | | | 3,567,207 | |
|
MVW Owner Trust
Series 2014-1A Class A(b) | |
09/20/31 | | | 2.250% | | | | 3,176,864 | | | | 3,172,920 | |
|
Macquarie Equipment Funding Trust
Series 2014-A Class A2(b) | |
11/21/16 | | | 0.800% | | | | 8,440,000 | | | | 8,451,090 | |
The accompanying Notes to Financial Statements are an integral part of this statement.
| | |
| |
| | COLUMBIA SHORT TERM BOND FUND |
PORTFOLIO OF INVESTMENTS (continued)
March 31, 2015
| | | | | | | | | | | | |
| Asset-Backed Securities — Non-Agency (continued) | |
| Issuer | | Coupon
Rate | | | Principal
Amount ($) | | | Value ($) | |
Marriott Vacation Club Owner Trust
Series 2009-2A Class A(b) | |
07/20/31 | | | 4.809% | | | | 1,009,256 | | | | 1,011,054 | |
|
Montana Higher Education Student Assistance Corp.
Series 2006-1 Class A(a) | |
03/20/24 | | | 0.370% | | | | 3,442,370 | | | | 3,425,678 | |
|
Nations Equipment Finance Funding I LLC
Series 2013-1A Class A(b) | |
11/20/16 | | | 1.697% | | | | 666,744 | | | | 667,344 | |
|
Navient Private Education Loan Trust Series 2015-AA Class A1(a)(b) | |
12/15/21 | | | 0.675% | | | | 2,933,968 | | | | 2,931,840 | |
|
Navient Student Loan Trust
Series 2014-AA Class A1(a)(b) | |
05/16/22 | | | 0.655% | | | | 5,457,124 | | | | 5,455,504 | |
|
Navitas Equipment Receivables LLC
Series 2013-1 Class A(b) | |
11/15/16 | | | 1.950% | | | | 2,865,277 | | | | 2,865,180 | |
|
New York City Tax Liens Trust
Series 2014-A Class A(b) | |
11/10/27 | | | 1.030% | | | | 745,642 | | | | 745,426 | |
|
PFS Tax Lien Trust
Series 2014-1 Class NOTE(b) | |
05/15/29 | | | 1.440% | | | | 2,983,293 | | | | 2,989,988 | |
|
Panhandle-Plains Higher Education Authority, Inc.
Series 2011-2 Class A1(a) | |
07/01/21 | | | 0.774% | | | | 1,105,505 | | | | 1,106,606 | |
|
Prestige Auto Receivables Trust(b) | |
Series 2013-1A Class A2 | | | | | | | | | | | | |
02/15/18 | | | 1.090% | | | | 1,451,495 | | | | 1,453,824 | |
Series 2014-1A Class A2 | | | | | | | | | | | | |
03/15/18 | | | 0.970% | | | | 3,332,700 | | | | 3,332,460 | |
Series 2015-1 Class A2 | | | | | | | | | | | | |
02/15/19 | | | 1.090% | | | | 4,350,000 | | | | 4,349,836 | |
|
Residential Funding Mortgage Securities II
Series 2003-HS3 Class A2B (NPFGC)(a)(f) | |
08/25/33 | | | 0.464% | | | | 3,311 | | | | 3,062 | |
|
SLM Private Credit Student Loan Trust(a) | |
Series 2003-A Class A2 | | | | | | | | | | | | |
09/15/20 | | | 0.711% | | | | 3,592,178 | | | | 3,575,882 | |
Series 2004-B Class A2 | | | | | | | | | | | | |
06/15/21 | | | 0.471% | | | | 7,004,157 | | | | 6,959,877 | |
|
SLM Private Education Loan Trust(a)(b) | |
Series 2011-A Class A1 | | | | | | | | | | | | |
10/15/24 | | | 1.175% | | | | 780,986 | | | | 783,982 | |
Series 2012-A Class A1 | | | | | | | | | | | | |
08/15/25 | | | 1.575% | | | | 1,952,131 | | | | 1,969,157 | |
Series 2012-B Class A1 | | | | | | | | | | | | |
12/15/21 | | | 1.275% | | | | 1,328,420 | | | | 1,331,140 | |
Series 2013-A Class A1 | | | | | | | | | | | | |
08/15/22 | | | 0.775% | | | | 4,097,632 | | | | 4,099,250 | |
Series 2013-B Class A1 | | | | | | | | | | | | |
07/15/22 | | | 0.825% | | | | 11,288,358 | | | | 11,299,013 | |
Series 2013-C Class A1 | | | | | | | | | | | | |
02/15/22 | | | 1.025% | | | | 2,034,101 | | | | 2,040,179 | |
Series 2014-A Class A1 | | | | | | | | | | | | |
07/15/22 | | | 0.775% | | | | 3,724,824 | | | | 3,725,069 | |
| | | | | | | | | | | | |
| Asset-Backed Securities — Non-Agency (continued) | |
| Issuer | | Coupon
Rate | | | Principal
Amount ($) | | | Value ($) | |
SLM Student Loan Trust
Series 2003-12 Class A5(a)(b) | |
09/15/22 | | | 0.551% | | | | 531,300 | | | | 531,226 | |
|
SMART ABS Trust
Series 2015-1US Class A2A | |
08/14/17 | | | 0.990% | | | | 5,250,000 | | | | 5,252,536 | |
|
SMART Trust(a) | |
Series 2013-1US Class A3B | |
09/14/16 | | | 0.625% | | | | 5,673,401 | | | | 5,672,627 | |
Series 2013-2US Class A3B | |
01/14/17 | | | 0.605% | | | | 4,990,547 | | | | 4,989,065 | |
Series 2014-1US Class A3B | |
02/14/18 | | | 0.575% | | | | 7,000,000 | | | | 6,989,720 | |
|
SMART Trust(a)(b) | |
Series 2012-1USA Class A3B | |
05/14/16 | | | 1.075% | | | | 82,930 | | | | 82,958 | |
Series 2012-2USA Class A3B | |
10/14/16 | | | 1.125% | | | | 1,069,112 | | | | 1,070,716 | |
|
SVO VOI Mortgage LLC
Series 2012-AA Class A(b) | |
09/20/29 | | | 2.000% | | | | 1,887,074 | | | | 1,880,809 | |
|
Santander Drive Auto Receivables Trust | |
Series 2014-4 Class A3 | | | | | | | | | | | | |
09/17/18 | | | 1.080% | | | | 9,635,000 | | | | 9,650,409 | |
Series 2014-5 Class A2A | | | | | | | | | | | | |
04/16/18 | | | 0.720% | | | | 4,405,000 | | | | 4,401,980 | |
Series 2015-1 Class A2A | | | | | | | | | | | | |
07/16/18 | | | 0.910% | | | | 4,085,000 | | | | 4,084,400 | |
|
Sierra Timeshare Receivables Funding Co. LLC(b) | |
Series 2011-1A Class A | | | | | | | | | | | | |
04/20/26 | | | 3.350% | | | | 1,330,295 | | | | 1,356,005 | |
Series 2011-2A Class A | | | | | | | | | | | | |
05/20/28 | | | 3.260% | | | | 1,158,487 | | | | 1,174,500 | |
Series 2011-3A Class A | | | | | | | | | | | | |
07/20/28 | | | 3.370% | | | | 1,860,330 | | | | 1,899,499 | |
Series 2012-1A Class A | | | | | | | | | | | | |
11/20/28 | | | 2.840% | | | | 3,092,574 | | | | 3,130,633 | |
Series 2012-3A Class A | | | | | | | | | | | | |
08/20/29 | | | 1.870% | | | | 1,176,081 | | | | 1,175,527 | |
Series 2013-1A Class A | | | | | | | | | | | | |
11/20/29 | | | 1.590% | | | | 1,922,289 | | | | 1,909,240 | |
|
South Texas Higher Education Authority, Inc.
Series 2012-1 Class A1(a) | |
10/01/20 | | | 0.774% | | | | 2,923,915 | | | | 2,925,874 | |
|
Specialty Underwriting & Residential Finance Trust
Series 2005-BC3 Class M1(a) | |
06/25/36 | | | 0.624% | | | | 599,600 | | | | 599,952 | |
|
TAL Advantage V LLC
Series 2014-2A Class A1(b) | |
05/20/39 | | | 1.700% | | | | 5,983,467 | | | | 5,945,168 | |
|
Westlake Automobile Receivables Trust(b) | |
Series 2013-1A Class A2 | | | | | | | | | | | | |
01/15/18 | | | 1.120% | | | | 2,511,788 | | | | 2,513,882 | |
Series 2014-1A Class A2 | |
05/15/17 | | | 0.700% | | | | 3,243,485 | | | | 3,240,297 | |
Series 2014-2A Class A2 | |
10/16/17 | | | 0.970% | | | | 4,840,000 | | | | 4,838,967 | |
The accompanying Notes to Financial Statements are an integral part of this statement.
| | |
| |
| COLUMBIA SHORT TERM BOND FUND | | |
PORTFOLIO OF INVESTMENTS (continued)
March 31, 2015
| | | | | | | | | | | | |
| Asset-Backed Securities — Non-Agency (continued) | |
| Issuer | | Coupon
Rate | | | Principal
Amount ($) | | | Value ($) | |
Series 2015-1A Class A2 | |
03/15/18 | | | 1.170% | | | | 13,400,000 | | | | 13,399,881 | |
| | | | | | | | | | | | | |
Total Asset-Backed Securities — Non-Agency | |
(Cost: $426,273,492) | | | | 426,982,078 | |
| | | |
| | | | | | | | | | | | |
| Inflation-Indexed Bonds 2.0% | |
UNITED STATES 2.0% | |
U.S. Treasury Inflation-Indexed Bond | |
04/15/17 | | | 0.125% | | | | 46,148,408 | | | | 46,970,403 | |
| | | | | | | | | | | | | |
Total Inflation-Indexed Bonds | |
(Cost: $46,971,693) | | | | 46,970,403 | |
| | | |
| | | | | | | | | | | | |
| U.S. Treasury Obligations 13.1% | |
U.S. Treasury | |
10/31/16 | | | 1.000% | | | | 60,755,000 | | | | 61,286,606 | |
08/31/17 | | | 0.625% | | | | 235,975,000 | | | | 235,550,953 | |
12/31/18 | | | 1.500% | | | | 9,000,000 | | | | 9,119,529 | |
| | | | | | | | | | | | | |
Total U.S. Treasury Obligations | |
(Cost: $303,534,258) | | | | 305,957,088 | |
| | | |
| | | | | | | | | | | | |
| U.S. Government & Agency Obligations 6.1% | |
Federal Farm Credit Banks(a) | |
12/06/16 | | | 0.273% | | | | 25,000,000 | | | | 25,037,975 | |
|
Federal Home Loan Banks | |
05/24/17 | | | 0.875% | | | | 24,500,000 | | | | 24,611,034 | |
|
Federal National Mortgage Association | |
08/28/17 | | | 0.875% | | | | 68,475,000 | | | | 68,560,525 | |
09/27/17 | | | 1.000% | | | | 23,000,000 | | | | 23,086,871 | |
|
Morocco Government AID Bond(a)(h) | |
05/01/23 | | | 0.344% | | | | 722,500 | | | | 692,878 | |
| | | | | | | | | | | | | |
Total U.S. Government & Agency Obligations | |
(Cost: $141,325,595) | | | | 141,989,283 | |
| | | | | | | | | | | | |
| Foreign Government Obligations(i) 0.9% | |
| Issuer | | Coupon
Rate | | | Principal
Amount ($) | | | Value ($) | |
CANADA 0.5% | |
Province of Ontario | | | | | | | | | | | | |
05/26/15 | | | 0.950% | | | | 6,000,000 | | | | 6,005,894 | |
| | | |
Province of Quebec | | | | | | | | | | | | |
03/01/16 | | | 5.000% | | | | 5,806,000 | | | | 6,045,439 | |
| | | | | | | | | | | | | |
Total | | | | | | | | | | | 12,051,333 | |
| | | |
| | | | | | | | | | | | |
MEXICO 0.4% | |
Petroleos Mexicanos | | | | | | | | | | | | |
03/01/18 | | | 5.750% | | | | 7,000,000 | | | | 7,689,500 | |
| | | | | | | | | | | | | |
Total Foreign Government Obligations | |
(Cost: $19,629,020) | | | | 19,740,833 | |
| | | |
| | | | | | | | | | | | |
| Municipal Bonds 0.5% | |
Issue
Description | | Coupon
Rate | | | Principal
Amount ($) | | | Value ($) | |
ILLINOIS 0.5% | | | | | | | | | | | | |
State of Illinois
Unlimited General Obligation Bonds Taxable
Series 2011 | |
03/01/17 | | | 5.365% | | | | 10,550,000 | | | | 11,336,292 | |
| | | | | | | | | | | | | |
Total Municipal Bonds | |
(Cost: $11,132,285) | | | | 11,336,292 | |
| | | |
| | | | | | | | | | | | |
| Money Market Funds 0.5% | |
| | | | | | Shares | | | Value ($) | |
| | |
Columbia Short-Term Cash Fund, 0.123%(j)(k) | | | | 12,368,385 | | | | 12,368,385 | |
| | | | | | | | | | | | | |
Total Money Market Funds | |
(Cost: $12,368,385) | | | | 12,368,385 | |
| | | | | | | | | | | | | |
Total Investments | | | | | |
(Cost: $2,331,113,421) | | | | 2,330,109,483 | |
| | | | | | | | | | | | | |
Other Assets & Liabilities, Net | | | | (285,071 | ) |
| | | | | | | | | | | | | |
Net Assets | | | | 2,329,824,412 | |
| | | | | | | | | | | | | |
Investments in Derivatives
Futures Contracts Outstanding at March 31, 2015
At March 31, 2015, securities totaling $747,057 were pledged as collateral to cover initial margin requirements on open futures contracts.
Long Futures Contracts Outstanding
| | | | | | | | | | | | | | | | | | | | | | | | |
| Contract Description | | Number of
Contracts | | | Trading
Currency | | | Notional Market
Value ($) | | | Expiration Date | | | Unrealized
Appreciation ($) | | | Unrealized
Depreciation ($) | |
US 2YR NOTE (CBT) | | | 1,200 | | | | USD | | | | 262,987,500 | | | | 06/2015 | | | | 841,229 | | | | — | |
The accompanying Notes to Financial Statements are an integral part of this statement.
| | |
| |
| | COLUMBIA SHORT TERM BOND FUND |
PORTFOLIO OF INVESTMENTS (continued)
March 31, 2015
Short Futures Contracts Outstanding
| | | | | | | | | | | | | | | | | | | | | | | | |
| Contract Description | | Number of
Contracts | | | Trading
Currency | | | Notional Market
Value ($) | | | Expiration Date | | | Unrealized
Appreciation ($) | | | Unrealized
Depreciation ($) | |
US 5YR NOTE (CBT) | | | (200 | ) | | | USD | | | | (24,042,188 | ) | | | 06/2015 | | | | — | | | | (217,608 | ) |
Notes to Portfolio of Investments
| (a) | Variable rate security. |
| (b) | Security exempt from registration pursuant to Rule 144A under the Securities Act of 1933. This security may be resold in transactions exempt from registration, normally to qualified institutional buyers. At March 31, 2015, the value of these securities amounted to $469,260,031 or 20.14% of net assets. |
| (c) | The maturity dates shown represent the original maturity of the underlying obligation. Actual maturity may vary based upon prepayment activity on these obligations. Unless otherwise noted, the coupon rates presented are fixed rates. |
| (d) | Principal Only (PO) security issued with a zero coupon. Income is recognized through the accretion of discount. |
| (e) | This security, or a portion of this security, has been pledged as collateral in connection with open futures contracts. These values are denoted within the Investments in Derivatives section of the Portfolio of Investments. |
| (f) | Identifies securities considered by the Investment Manager to be illiquid as to their marketability. The aggregate value of such securities at March 31, 2015 was $36,846, which represents less than 0.01% of net assets. Information concerning such security holdings at March 31, 2015 is as follows: |
| | | | | | | | |
| Security Description | | Acquisition Dates | | | Cost ($) | |
AMRESCO Residential Securities Corp. Mortgage Loan Trust Series 1998-3 Class A7 07/25/28 0.654% | | | 12/19/2003 | | | | 14,671 | |
| | |
Cityscape Home Equity Loan Trust Series 1997-C Class A3 07/25/28 7.380% | | | 11/25/2003 - 06/29/2009 | | | | 572,589 | |
| | |
First Alliance Mortgage Loan Trust Series 1994-2 Class A2 (NPFGC) 06/25/25 6.680% | | | 06/24/2004 | | | | 20,660 | |
| | |
Residential Funding Mortgage Securities II Series 2003-HS3 Class A2B (NPFGC) 08/25/33 0.464% | | | 09/15/2003 | | | | 3,311 | |
| (g) | Represents securities that have defaulted on payment of interest. The Fund has stopped accruing interest on these securities. At March 31, 2015, the value of these securities amounted to $1, which represents less than 0.01% of net assets. |
| (h) | Represents fair value as determined in good faith under procedures approved by the Board of Trustees. At March 31, 2015, the value of these securities amounted to $692,879, which represents 0.03% of net assets. |
| (i) | Principal and interest may not be guaranteed by the government. |
| (j) | The rate shown is the seven-day current annualized yield at March 31, 2015. |
| (k) | As defined in the Investment Company Act of 1940, an affiliated company is one in which the Fund owns 5% or more of the company’s outstanding voting securities, or a company which is under common ownership or control with the Fund. Holdings and transactions in these affiliated companies during the year ended March 31, 2015, are as follows: |
| | | | | | | | | | | | | | | | | | | | | | | | |
| Issuer | | Beginning
Cost ($) | | | Purchase
Cost ($) | | | Proceeds
From Sales ($) | | | Ending
Cost ($) | | | Dividends —
Affiliated
Issuers ($) | | | Value ($) | |
Columbia Short-Term Cash Fund | | | 22,720,143 | | | | 840,174,991 | | | | (850,526,749 | ) | | | 12,368,385 | | | | 45,810 | | | | 12,368,385 | |
Abbreviation Legend
| | |
| AID | | Agency for International Development |
| CMO | | Collateralized Mortgage Obligation |
| NPFGC | | National Public Finance Guarantee Corporation |
Currency Legend
The accompanying Notes to Financial Statements are an integral part of this statement.
| | |
| |
| COLUMBIA SHORT TERM BOND FUND | | |
PORTFOLIO OF INVESTMENTS (continued)
March 31, 2015
Fair Value Measurements
Generally accepted accounting principles (GAAP) require disclosure regarding the inputs and valuation techniques used to measure fair value and any changes in valuation inputs or techniques. In addition, investments shall be disclosed by major category.
The Fund categorizes its fair value measurements according to a three-level hierarchy that maximizes the use of observable inputs and minimizes the use of unobservable inputs by prioritizing that the most observable input be used when available. Observable inputs are those that market participants would use in pricing an investment based on market data obtained from sources independent of the reporting entity. Unobservable inputs are those that reflect the Fund’s assumptions about the information market participants would use in pricing an investment. An investment’s level within the fair value hierarchy is based on the lowest level of any input that is deemed significant to the asset or liability’s fair value measurement. The input levels are not necessarily an indication of the risk or liquidity associated with investments at that level. For example, certain U.S. government securities are generally high quality and liquid, however, they are reflected as Level 2 because the inputs used to determine fair value may not always be quoted prices in an active market.
Fair value inputs are summarized in the three broad levels listed below:
| n | | Level 1 — Valuations based on quoted prices for investments in active markets that the Fund has the ability to access at the measurement date (including NAV for open-end mutual funds). Valuation adjustments are not applied to Level 1 investments. |
| n | | Level 2 — Valuations based on other significant observable inputs (including quoted prices for similar securities, interest rates, prepayment speeds, credit risks, etc.). |
| n | | Level 3 — Valuations based on significant unobservable inputs (including the Fund’s own assumptions and judgment in determining the fair value of investments). |
Inputs that are used in determining fair value of an investment may include price information, credit data, volatility statistics, and other factors. These inputs can be either observable or unobservable. The availability of observable inputs can vary between investments, and is affected by various factors such as the type of investment, and the volume and level of activity for that investment or similar investments in the marketplace. The inputs will be considered by the Investment Manager, along with any other relevant factors in the calculation of an investment’s fair value. The Fund uses prices and inputs that are current as of the measurement date, which may include periods of market dislocations. During these periods, the availability of prices and inputs may be reduced for many investments. This condition could cause an investment to be reclassified between the various levels within the hierarchy.
Investments falling into the Level 3 category are primarily supported by quoted prices from brokers and dealers participating in the market for those investments. However, these may be classified as Level 3 investments due to lack of market transparency and corroboration to support these quoted prices. Additionally, valuation models may be used as the pricing source for any remaining investments classified as Level 3. These models may rely on one or more significant unobservable inputs and/or significant assumptions by the Investment Manager. Inputs used in valuations may include, but are not limited to, financial statement analysis, capital account balances, discount rates and estimated cash flows, and comparable company data.
Under the direction of the Fund’s Board of Trustees (the Board), the Investment Manager’s Valuation Committee (the Committee) is responsible for overseeing the valuation procedures approved by the Board. The Committee consists of voting and non-voting members from various groups within the Investment Manager’s organization, including operations and accounting, trading and investments, compliance, risk management and legal.
The Committee meets at least monthly to review and approve valuation matters, which may include a description of specific valuation determinations, data regarding pricing information received from approved pricing vendors and brokers and the results of Board-approved valuation control policies and procedures (the Policies). The Policies address, among other things, instances when market quotations are or are not readily available, including recommendations of third party pricing vendors and a determination of appropriate pricing methodologies; events that require specific valuation determinations and assessment of fair value techniques; securities with a potential for stale pricing, including those that are illiquid, restricted, or in default; and the effectiveness of third party pricing vendors, including periodic reviews of vendors. The Committee meets more frequently, as needed, to discuss additional valuation matters, which may include the need to review back-testing results, review time-sensitive information or approve related valuation actions. The Committee reports to the Board, with members of the Committee meeting with the Board at each of its regularly scheduled meetings to discuss valuation matters and actions during the period, similar to those described earlier.
For investments categorized as Level 3, the Committee monitors information similar to that described above, which may include: (i) data specific to the issuer or comparable issuers, (ii) general market or specific sector news and (iii) quoted prices and specific or similar security transactions. The Committee considers this data and any changes from prior periods in order to assess the reasonableness of observable and unobservable inputs, any assumptions or internal models used to value those securities and changes in fair value. This data is also used to corroborate, when available, information received from approved pricing vendors and brokers. Various factors impact the frequency of monitoring this information (which may occur as often as daily). However, the Committee may determine that changes to inputs, assumptions and models are not required as a result of the monitoring procedures performed.
The accompanying Notes to Financial Statements are an integral part of this statement.
| | |
| |
| | COLUMBIA SHORT TERM BOND FUND |
PORTFOLIO OF INVESTMENTS (continued)
March 31, 2015
Fair Value Measurements (continued)
The following table is a summary of the inputs used to value the Fund’s investments at March 31, 2015:
| | | | | | | | | | | | | | | | |
| Description | | Level 1 Quoted Prices in Active
Markets for Identical
Assets ($) | | | Level 2 Other Significant
Observable Inputs ($) | | | Level 3 Significant
Unobservable Inputs ($) | | | Total ($) | |
Bonds | | | | | | | | | | | | | | | | |
| | | | |
Corporate Bonds & Notes | | | — | | | | 738,355,564 | | | | — | | | | 738,355,564 | |
| | | | |
Residential Mortgage-Backed Securities — Agency | | | — | | | | 86,480,115 | | | | — | | | | 86,480,115 | |
| | | | |
Residential Mortgage-Backed Securities — Non-Agency | | | — | | | | 47,339,789 | | | | — | | | | 47,339,789 | |
| | | | |
Commercial Mortgage-Backed Securities — Agency | | | — | | | | 280,960,877 | | | | — | | | | 280,960,877 | |
| | | | |
Commercial Mortgage-Backed Securities — Non-Agency | | | — | | | | 211,628,776 | | | | — | | | | 211,628,776 | |
| | | | |
Asset-Backed Securities — Non-Agency | | | — | | | | 426,314,733 | | | | 667,345 | | | | 426,982,078 | |
| | | | |
Inflation-Indexed Bonds | | | — | | | | 46,970,403 | | | | — | | | | 46,970,403 | |
| | | | |
U.S. Treasury Obligations | | | 305,957,088 | | | | — | | | | — | | | | 305,957,088 | |
| | | | |
U.S. Government & Agency Obligations | | | — | | | | 141,296,405 | | | | 692,878 | | | | 141,989,283 | |
| | | | |
Foreign Government Obligations | | | — | | | | 19,740,833 | | | | — | | | | 19,740,833 | |
| | | | |
Municipal Bonds | | | — | | | | 11,336,292 | | | | — | | | | 11,336,292 | |
| | | | | | | | | | | | | | | | | |
Total Bonds | | | 305,957,088 | | | | 2,010,423,787 | | | | 1,360,223 | | | | 2,317,741,098 | |
| | | | | | | | | | | | | | | | | |
Mutual Funds | | | | | | | | | | | | | | | | |
| | | | |
Money Market Funds | | | 12,368,385 | | | | — | | | | — | | | | 12,368,385 | |
| | | | | | | | | | | | | | | | | |
Total Mutual Funds | | | 12,368,385 | | | | — | | | | — | | | | 12,368,385 | |
| | | | | | | | | | | | | | | | | |
Investments in Securities | | | 318,325,473 | | | | 2,010,423,787 | | | | 1,360,223 | | | | 2,330,109,483 | |
| | | | |
Derivatives | | | | | | | | | | | | | | | | |
| | | | |
Assets | | | | | | | | | | | | | | | | |
| | | | |
Futures Contracts | | | 841,229 | | | | — | | | | — | | | | 841,229 | |
| | | | |
Liabilities | | | | | | | | | | | | | | | | |
| | | | |
Futures Contracts | | | (217,608 | ) | | | — | | | | — | | | | (217,608 | ) |
| | | | | | | | | | | | | | | | | |
Total | | | 318,949,094 | | | | 2,010,423,787 | | | | 1,360,223 | | | | 2,330,733,104 | |
| | | | | | | | | | | | | | | | | |
See the Portfolio of Investments for all investment classifications not indicated in the table.
The Fund’s assets assigned to the Level 2 input category are generally valued using the market approach, in which a security’s value is determined through reference to prices and information from market transactions for similar or identical assets.
There were no transfers of financial assets between levels during the period.
Derivative instruments are valued at unrealized appreciation (depreciation).
The Fund does not hold any significant investments (greater than one percent of net assets) categorized as Level 3.
The Fund’s assets assigned to the Level 3 category are valued utilizing the valuation technique deemed the most appropriate in the circumstances.
Certain asset backed securities classified as Level 3 securities are valued using the market approach and utilize single market quotations from broker dealers which may have included, but not limited to, observable transactions for identical or similar assets in the market and the distressed nature of the security. The appropriateness of fair values for these securities is monitored on an ongoing basis which may include results of back testing, manual price reviews and other control procedures. Significant increases (decreases) to any of these inputs would result in a significantly lower (higher) valuation measurement.
Certain U.S. Government and Agency Obligations classified as Level 3 securities are valued using the market approach. To determine fair value for these securities, management considered various factors which may have included, but were not limited to, estimated cash flows of the securities, discount rates observed in the market for similar assets as well as observed yields on securities management deemed comparable. Significant increases (decreases) to any of these inputs would result in a significantly lower (higher) fair value measurement. Generally, a change in observable yields on comparable securities would result in a directionally similar change to discount rates.
The accompanying Notes to Financial Statements are an integral part of this statement.
| | |
| |
| COLUMBIA SHORT TERM BOND FUND | | |
STATEMENT OF ASSETS AND LIABILITIES
March 31, 2015
| | | | |
Assets | |
| |
Investments, at value | | | | |
| |
Unaffiliated issuers (identified cost $2,318,745,036) | | | $2,317,741,098 | |
| |
Affiliated issuers (identified cost $12,368,385) | | | 12,368,385 | |
| |
Total investments (identified cost $2,331,113,421) | | | 2,330,109,483 | |
| |
Receivable for: | | | | |
| |
Investments sold | | | 516,651 | |
| |
Capital shares sold | | | 2,321,993 | |
| |
Dividends | | | 3,762 | |
| |
Interest | | | 7,174,345 | |
| |
Variation margin | | | 168,744 | |
| |
Expense reimbursement due from Investment Manager | | | 4,675 | |
| |
Prepaid expenses | | | 3,478 | |
| |
Trustees’ deferred compensation plan | | | 1,598 | |
| |
Total assets | | | 2,340,304,729 | |
| |
| |
Liabilities | | | | |
| |
Disbursements in excess of cash | | | 495,307 | |
| |
Payable for: | | | | |
| |
Investments purchased | | | 1,012,752 | |
| |
Capital shares purchased | | | 6,532,743 | |
| |
Dividend distributions to shareholders | | | 1,689,480 | |
| |
Variation margin | | | 40,626 | |
| |
Investment management fees | | | 22,815 | |
| |
Distribution and/or service fees | | | 4,732 | |
| |
Transfer agent fees | | | 315,401 | |
| |
Administration fees | | | 4,046 | |
| |
Plan administration fees | | | 1,301 | |
| |
Compensation of board members | | | 244,532 | |
| |
Other expenses | | | 114,984 | |
| |
Trustees’ deferred compensation plan | | | 1,598 | |
| |
Total liabilities | | | 10,480,317 | |
| |
Net assets applicable to outstanding capital stock | | | $2,329,824,412 | |
| |
| |
Represented by | | | | |
| |
Paid-in capital | | | $2,355,827,888 | |
| |
Excess of distributions over net investment income | | | (871,302 | ) |
| |
Accumulated net realized loss | | | (24,751,857 | ) |
| |
Unrealized appreciation (depreciation) on: | | | | |
| |
Investments | | | (1,003,938 | ) |
| |
Futures contracts | | | 623,621 | |
| |
Total — representing net assets applicable to outstanding capital stock | | | $2,329,824,412 | |
| |
The accompanying Notes to Financial Statements are an integral part of this statement.
| | |
| |
| | COLUMBIA SHORT TERM BOND FUND |
STATEMENT OF ASSETS AND LIABILITIES (continued)
March 31, 2015
| | | | |
Class A | | | | |
| |
Net assets | | | $414,188,089 | |
| |
Shares outstanding | | | 41,504,461 | |
| |
Net asset value per share | | | $9.98 | |
| |
Maximum offering price per share(a) | | | $10.08 | |
| |
Class B | | | | |
| |
Net assets | | | $3,431,451 | |
| |
Shares outstanding | | | 344,081 | |
| |
Net asset value per share | | | $9.97 | |
| |
Class C | | | | |
| |
Net assets | | | $75,283,693 | |
| |
Shares outstanding | | | 7,550,806 | |
| |
Net asset value per share | | | $9.97 | |
| |
Class I | | | | |
| |
Net assets | | | $442,259,847 | |
| |
Shares outstanding | | | 44,391,963 | |
| |
Net asset value per share | | | $9.96 | |
| |
Class K | | | | |
| |
Net assets | | | $3,062,842 | |
| |
Shares outstanding | | | 307,528 | |
| |
Net asset value per share | | | $9.96 | |
| |
Class R | | | | |
| |
Net assets | | | $3,373,066 | |
| |
Shares outstanding | | | 337,912 | |
| |
Net asset value per share | | | $9.98 | |
| |
Class R4 | | | | |
| |
Net assets | | | $8,944,800 | |
| |
Shares outstanding | | | 897,494 | |
| |
Net asset value per share | | | $9.97 | |
| |
Class R5 | | | | |
| |
Net assets | | | $53,515,660 | |
| |
Shares outstanding | | | 5,372,705 | |
| |
Net asset value per share | | | $9.96 | |
| |
Class W | | | | |
| |
Net assets | | | $6,597,414 | |
| |
Shares outstanding | | | 660,974 | |
| |
Net asset value per share | | | $9.98 | |
| |
Class Y | | | | |
| |
Net assets | | | $22,996,391 | |
| |
Shares outstanding | | | 2,308,267 | |
| |
Net asset value per share | | | $9.96 | |
| |
Class Z | | | | |
| |
Net assets | | | $1,296,171,159 | |
| |
Shares outstanding | | | 130,103,918 | |
| |
Net asset value per share | | | $9.96 | |
| |
| (a) | The maximum offering price per share is calculated by dividing the net asset value per share by 1.0 minus the maximum sales charge of 1.00%. |
The accompanying Notes to Financial Statements are an integral part of this statement.
| | |
| |
| COLUMBIA SHORT TERM BOND FUND | | |
STATEMENT OF OPERATIONS
Year Ended March 31, 2015
| | | | |
Net investment income | | | | |
Income: | | | | |
Dividends — affiliated issuers | | | $45,810 | |
Interest | | | 38,580,449 | |
| |
Total income | | | 38,626,259 | |
| |
Expenses: | | | | |
Investment management fees | | | 8,903,586 | |
Distribution and/or service fees | | | | |
Class A | | | 1,134,280 | |
Class B | | | 46,824 | |
Class C | | | 818,659 | |
Class R | | | 19,186 | |
Class W | | | 16,977 | |
Transfer agent fees | | | | |
Class A | | | 905,525 | |
Class B | | | 9,330 | |
Class C | | | 163,384 | |
Class K | | | 1,587 | |
Class R | | | 7,650 | |
Class R4 | | | 16,617 | |
Class R5 | | | 26,308 | |
Class W | | | 13,559 | |
Class Z | | | 2,884,372 | |
Administration fees | | | 1,575,615 | |
Plan administration fees | | | | |
Class K | | | 7,934 | |
Compensation of board members | | | 59,832 | |
Custodian fees | | | 33,002 | |
Printing and postage fees | | | 116,317 | |
Registration fees | | | 147,704 | |
Professional fees | | | 56,845 | |
Other | | | 44,653 | |
| |
Total expenses | | | 17,009,746 | |
Fees waived or expenses reimbursed by Investment Manager and its affiliates | | | (1,925,395 | ) |
Fees waived by Distributor — Class B | | | (21,071 | ) |
Fees waived by Distributor — Class C | | | (205,842 | ) |
Expense reductions | | | (2,568 | ) |
| |
Total net expenses | | | 14,854,870 | |
| |
Net investment income | | | 23,771,389 | |
| |
| |
Realized and unrealized gain (loss) — net | | | | |
Net realized gain (loss) on: | | | | |
Investments | | | 6,499,188 | |
Futures contracts | | | 718,794 | |
| | | | | |
Net realized gain | | | 7,217,982 | |
Net change in unrealized appreciation (depreciation) on: | | | | |
Investments | | | (6,159,243 | ) |
Futures contracts | | | 410,293 | |
| |
Net change in unrealized depreciation | | | (5,748,950 | ) |
| |
Net realized and unrealized gain | | | 1,469,032 | |
| |
Net increase in net assets resulting from operations | | | $25,240,421 | |
| |
The accompanying Notes to Financial Statements are an integral part of this statement.
| | |
| |
| | COLUMBIA SHORT TERM BOND FUND |
STATEMENT OF CHANGES IN NET ASSETS
| | | | | | | | |
| | | Year Ended
March 31, 2015 | | | Year Ended
March 31, 2014 | |
Operations | | | | | | | | |
| | |
Net investment income | | | $23,771,389 | | | | $26,625,887 | |
| | |
Net realized gain | | | 7,217,982 | | | | 9,140,000 | |
| | |
Net change in unrealized depreciation | | | (5,748,950 | ) | | | (24,329,271 | ) |
| |
Net increase in net assets resulting from operations | | | 25,240,421 | | | | 11,436,616 | |
| |
| | |
Distributions to shareholders | | | | | | | | |
| | |
Net investment income | | | | | | | | |
| | |
Class A | | | (3,890,971 | ) | | | (3,556,162 | ) |
| | |
Class B | | | (26,262 | ) | | | (31,442 | ) |
| | |
Class C | | | (294,190 | ) | | | (366,990 | ) |
| | |
Class I | | | (5,344,689 | ) | | | (4,618,545 | ) |
| | |
Class K | | | (30,273 | ) | | | (25,939 | ) |
| | |
Class R | | | (23,419 | ) | | | (18,824 | ) |
| | |
Class R4 | | | (91,493 | ) | | | (56,145 | ) |
| | |
Class R5 | | | (631,573 | ) | | | (329,212 | ) |
| | |
Class W | | | (58,125 | ) | | | (59,742 | ) |
| | |
Class Y | | | (177,553 | ) | | | (74,726 | ) |
| | |
Class Z | | | (15,995,797 | ) | | | (14,959,204 | ) |
| |
Total distributions to shareholders | | | (26,564,345 | ) | | | (24,096,931 | ) |
| |
Decrease in net assets from capital stock activity | | | (316,973,074 | ) | | | (220,225,960 | ) |
| |
Total decrease in net assets | | | (318,296,998 | ) | | | (232,886,275 | ) |
| | |
Net assets at beginning of year | | | 2,648,121,410 | | | | 2,881,007,685 | |
| |
Net assets at end of year | | | $2,329,824,412 | | | | $2,648,121,410 | |
| |
Undistributed (excess of distributions over) net investment income | | | $(871,302 | ) | | | $1,637,411 | |
| |
The accompanying Notes to Financial Statements are an integral part of this statement.
| | |
| |
| COLUMBIA SHORT TERM BOND FUND | | |
STATEMENT OF CHANGES IN NET ASSETS (continued)
| | | | | | | | | | | | | | | | |
| | | Year Ended
March 31, 2015 | | | Year Ended
March 31, 2014 | |
| | | Shares | | | Dollars ($) | | | Shares | | | Dollars ($) | |
Capital stock activity | | | | | | | | | | | | | | | | |
| | | | |
Class A shares | | | | | | | | | | | | | | | | |
| | | | |
Subscriptions(a) | | | 7,515,675 | | | | 75,024,653 | | | | 11,513,706 | | | | 115,004,113 | |
| | | | |
Distributions reinvested | | | 341,548 | | | | 3,409,466 | | | | 309,883 | | | | 3,095,278 | |
| | | | |
Redemptions | | | (14,411,395 | ) | | | (143,782,764 | ) | | | (19,473,395 | ) | | | (194,575,092 | ) |
| |
Net decrease | | | (6,554,172 | ) | | | (65,348,645 | ) | | | (7,649,806 | ) | | | (76,475,701 | ) |
| |
Class B shares | | | | | | | | | | | | | | | | |
| | | | |
Subscriptions | | | 24,247 | | | | 241,825 | | | | 76,906 | | | | 767,553 | |
| | | | |
Distributions reinvested | | | 1,994 | | | | 19,896 | | | | 2,568 | | | | 25,634 | |
| | | | |
Redemptions(a) | | | (295,548 | ) | | | (2,948,376 | ) | | | (613,152 | ) | | | (6,118,096 | ) |
| |
Net decrease | | | (269,307 | ) | | | (2,686,655 | ) | | | (533,678 | ) | | | (5,324,909 | ) |
| |
Class C shares | | | | | | | | | | | | | | | | |
| | | | |
Subscriptions | | | 1,120,026 | | | | 11,168,112 | | | | 1,579,587 | | | | 15,767,320 | |
| | | | |
Distributions reinvested | | | 20,327 | | | | 202,800 | | | | 24,777 | | | | 247,264 | |
| | | | |
Redemptions | | | (2,415,723 | ) | | | (24,085,734 | ) | | | (3,969,049 | ) | | | (39,636,981 | ) |
| |
Net decrease | | | (1,275,370 | ) | | | (12,714,822 | ) | | | (2,364,685 | ) | | | (23,622,397 | ) |
| |
Class I shares | | | | | | | | | | | | | | | | |
| | | | |
Subscriptions | | | 19,931,634 | | | | 198,625,835 | | | | 33,454,781 | | | | 333,872,767 | |
| | | | |
Distributions reinvested | | | 536,420 | | | | 5,344,572 | | | | 463,148 | | | | 4,617,943 | |
| | | | |
Redemptions | | | (23,043,859 | ) | | | (229,702,844 | ) | | | (17,758,700 | ) | | | (176,891,767 | ) |
| |
Net increase (decrease) | | | (2,575,805 | ) | | | (25,732,437 | ) | | | 16,159,229 | | | | 161,598,943 | |
| |
Class K shares | | | | | | | | | | | | | | | | |
| | | | |
Subscriptions | | | 100,956 | | | | 1,006,037 | | | | 83,430 | | | | 832,511 | |
| | | | |
Distributions reinvested | | | 3,029 | | | | 30,172 | | | | 2,600 | | | | 25,920 | |
| | | | |
Redemptions | | | (119,583 | ) | | | (1,192,355 | ) | | | (101,725 | ) | | | (1,015,034 | ) |
| |
Net decrease | | | (15,598 | ) | | | (156,146 | ) | | | (15,695 | ) | | | (156,603 | ) |
| |
Class R shares | | | | | | | | | | | | | | | | |
| | | | |
Subscriptions | | | 108,679 | | | | 1,086,316 | | | | 82,229 | | | | 822,299 | |
| | | | |
Distributions reinvested | | | 897 | | | | 8,956 | | | | 674 | | | | 6,732 | |
| | | | |
Redemptions | | | (155,932 | ) | | | (1,555,672 | ) | | | (166,231 | ) | | | (1,662,353 | ) |
| |
Net decrease | | | (46,356 | ) | | | (460,400 | ) | | | (83,328 | ) | | | (833,322 | ) |
| |
Class R4 shares | | | | | | | | | | | | | | | | |
| | | | |
Subscriptions | | | 392,075 | | | | 3,908,655 | | | | 923,727 | | | | 9,232,017 | |
| | | | |
Distributions reinvested | | | 9,169 | | | | 91,388 | | | | 5,627 | | | | 56,118 | |
| | | | |
Redemptions | | | (211,404 | ) | | | (2,105,737 | ) | | | (241,105 | ) | | | (2,406,202 | ) |
| |
Net increase | | | 189,840 | | | | 1,894,306 | | | | 688,249 | | | | 6,881,933 | |
| |
Class R5 shares | | | | | | | | | | | | | | | | |
| | | | |
Subscriptions | | | 5,920,856 | | | | 58,928,968 | | | | 2,119,418 | | | | 21,128,087 | |
| | | | |
Distributions reinvested | | | 63,384 | | | | 631,447 | | | | 33,012 | | | | 329,187 | |
| | | | |
Redemptions | | | (4,696,434 | ) | | | (46,738,957 | ) | | | (590,653 | ) | | | (5,893,312 | ) |
| |
Net increase | | | 1,287,806 | | | | 12,821,458 | | | | 1,561,777 | | | | 15,563,962 | |
| |
The accompanying Notes to Financial Statements are an integral part of this statement.
| | |
| |
| | COLUMBIA SHORT TERM BOND FUND |
STATEMENT OF CHANGES IN NET ASSETS (continued)
| | | | | | | | | | | | | | | | |
| | | Year Ended
March 31, 2015 | | | Year Ended
March 31, 2014 | |
| | | Shares | | | Dollars ($) | | | Shares | | | Dollars ($) | |
Capital stock activity (continued) | | | | | | | | | | | | | | | | |
| | | | |
Class W shares | | | | | | | | | | | | | | | | |
| | | | |
Subscriptions | | | 120,318 | | | | 1,201,133 | | | | 377,058 | | | | 3,771,450 | |
| | | | |
Distributions reinvested | | | 5,814 | | | | 58,040 | | | | 5,972 | | | | 59,693 | |
| | | | |
Redemptions | | | (167,034 | ) | | | (1,667,233 | ) | | | (1,484,883 | ) | | | (14,848,679 | ) |
| |
Net decrease | | | (40,902 | ) | | | (408,060 | ) | | | (1,101,853 | ) | | | (11,017,536 | ) |
| |
Class Y shares | | | | | | | | | | | | | | | | |
| | | | |
Subscriptions | | | 2,012,949 | | | | 20,065,599 | | | | 26,519 | | | | 265,595 | |
| | | | |
Distributions reinvested | | | 12,743 | | | | 126,860 | | | | 2,582 | | | | 25,743 | |
| | | | |
Redemptions | | | (356,463 | ) | | | (3,552,000 | ) | | | (302,164 | ) | | | (3,014,188 | ) |
| |
Net increase (decrease) | | | 1,669,229 | | | | 16,640,459 | | | | (273,063 | ) | | | (2,722,850 | ) |
| |
Class Z shares | | | | | | | | | | | | | | | | |
| | | | |
Subscriptions | | | 39,942,509 | | | | 397,884,622 | | | | 47,045,647 | | | | 469,228,828 | |
| | | | |
Distributions reinvested | | | 331,887 | | | | 3,306,899 | | | | 328,338 | | | | 3,274,084 | |
| | | | |
Redemptions | | | (64,451,575 | ) | | | (642,013,653 | ) | | | (75,848,972 | ) | | | (756,620,392 | ) |
| |
Net decrease | | | (24,177,179 | ) | | | (240,822,132 | ) | | | (28,474,987 | ) | | | (284,117,480 | ) |
| |
Total net decrease | | | (31,807,814 | ) | | | (316,973,074 | ) | | | (22,087,840 | ) | | | (220,225,960 | ) |
| |
| (a) | Includes conversions of Class B shares to Class A shares, if any. |
The accompanying Notes to Financial Statements are an integral part of this statement.
| | |
| |
| COLUMBIA SHORT TERM BOND FUND | | |
FINANCIAL HIGHLIGHTS
The following tables are intended to help you understand the Fund’s financial performance. Certain information reflects financial results for a single share of a class held for the periods shown. Per share net investment income (loss) amounts are calculated based on average shares outstanding during the period. Total return assumes reinvestment of all dividends and distributions, if any. Total return does not reflect payment of sales charges, if any. Total return and portfolio turnover are not annualized for periods of less than one year. The portfolio turnover rate is calculated without regard to purchase and sales transactions of short-term instruments and certain derivatives, if any. If such transactions were included, the Fund’s portfolio turnover rate may be higher.
| | | | | | | | | | | | | | | | | | | | |
| | | Year Ended March 31, | |
Class A | | | 2015 | | | | 2014 | | | | 2013 | | | | 2012 | | | | 2011 | |
Per share data | | | | | | | | | | | | | | | | | | | | |
Net asset value, beginning of period | | | $9.98 | | | | $10.03 | | | | $9.95 | | | | $9.94 | | | | $9.95 | |
| | |
Income from investment operations: | | | | | | | | | | | | | | | | | | | | |
| | | | | |
Net investment income | | | 0.07 | | | | 0.08 | | | | 0.10 | | | | 0.15 | | | | 0.22 | |
| | | | | | | | | | | | | | | | | | | | | |
Net realized and unrealized gain (loss) | | | 0.02 | | | | (0.06 | ) | | | 0.08 | | | | 0.03 | | | | 0.03 | |
| | | | | | | | | | | | | | | | | | | | | |
Total from investment operations | | | 0.09 | | | | 0.02 | | | | 0.18 | | | | 0.18 | | | | 0.25 | |
| | | | | | | | | | | | | | | | | | | | | |
Less distributions to shareholders: | | | | | | | | | | | | | | | | | | | | |
| | | | | |
Net investment income | | | (0.09 | ) | | | (0.07 | ) | | | (0.10 | ) | | | (0.17 | ) | | | (0.26 | ) |
| | | | | | | | | | | �� | | | | | | | | | | |
Total distributions to shareholders | | | (0.09 | ) | | | (0.07 | ) | | | (0.10 | ) | | | (0.17 | ) | | | (0.26 | ) |
| | | | | | | | | | | | | | | | | | | | | |
Proceeds from regulatory settlements | | | — | | | | — | | | | — | | | | 0.00 | (a) | | | — | |
| | | | | | | | | | | | | | | | | | | | | |
Net asset value, end of period | | | $9.98 | | | | $9.98 | | | | $10.03 | | | | $9.95 | | | | $9.94 | |
| | | | | | | | | | | | | | | | | | | | | |
Total return | | | 0.86 | % | | | 0.19 | % | | | 1.79 | % | | | 1.78 | % | | | 2.57 | % |
| | | | | | | | | | | | | | | | | | | | | |
Ratios to average net assets(b) | | | | | | | | | | | | | | | | | | | | |
| | | | | |
Total gross expenses | | | 0.89 | % | | | 0.89 | % | | | 0.89 | % | | | 0.89 | % | | | 0.82 | % |
| | | | | | | | | | | | | | | | | | | | | |
Total net expenses(c) | | | 0.80 | %(d) | | | 0.80 | %(d) | | | 0.79 | %(d) | | | 0.74 | %(d) | | | 0.73 | %(d) |
| | | | | | | | | | | | | | | | | | | | | |
Net investment income | | | 0.75 | % | | | 0.77 | % | | | 1.00 | % | | | 1.53 | % | | | 2.21 | % |
| | | | | | | | | | | | | | | | | | | | | |
Supplemental data | | | | | | | | | | | | | | | | | | | | |
| | | | | |
Net assets, end of period (in thousands) | | | $414,188 | | | | $479,831 | | | | $558,651 | | | | $641,835 | | | | $263,223 | |
| | | | | | | | | | | | | | | | | | | | | |
Portfolio turnover | | | 60 | % | | | 81 | % | | | 102 | % | | | 76 | % | | | 83 | % |
| | | | | | | | | | | | | | | | | | | | | |
Notes to Financial Highlights
| (b) | In addition to the fees and expenses that the Fund bears directly, the Fund indirectly bears a pro rata share of the fees and expenses of any other funds in which it invests. Such indirect expenses are not included in the Fund’s reported expense ratios. |
| (c) | Total net expenses include the impact of certain fee waivers/expense reimbursements made by the Investment Manager and certain of its affiliates, if applicable. |
| (d) | The benefits derived from expense reductions had an impact of less than 0.01%. |
The accompanying Notes to Financial Statements are an integral part of this statement.
| | |
| |
| | COLUMBIA SHORT TERM BOND FUND |
FINANCIAL HIGHLIGHTS (continued)
| | | | | | | | | | | | | | | | | | | | |
| | | Year Ended March 31, | |
Class B | | | 2015 | | | | 2014 | | | | 2013 | | | | 2012 | | | | 2011 | |
Per share data | | | | | | | | | | | | | | | | | | | | |
Net asset value, beginning of period | | | $9.98 | | | | $10.02 | | | | $9.95 | | | | $9.93 | | | | $9.94 | |
| | | | | | | | | | | | | | | | | | | | | |
Income from investment operations: | | | | | | | | | | | | | | | | | | | | |
| | | | | |
Net investment income | | | 0.05 | | | | 0.05 | | | | 0.03 | | | | 0.07 | | | | 0.15 | |
| | | | | | | | | | | | | | | | | | | | | |
Net realized and unrealized gain (loss) | | | 0.00 | (a) | | | (0.05 | ) | | | 0.07 | | | | 0.04 | | | | 0.03 | |
| | | | | | | | | | | | | | | | | | | | | |
Total from investment operations | | | 0.05 | | | | — | | | | 0.10 | | | | 0.11 | | | | 0.18 | |
| | | | | | | | | | | | | | | | | | | | | |
Less distributions to shareholders: | | | | | | | | | | | | | | | | | | | | |
| | | | | |
Net investment income | | | (0.06 | ) | | | (0.04 | ) | | | (0.03 | ) | | | (0.09 | ) | | | (0.19 | ) |
| | | | | | | | | | | | | | | | | | | | | |
Total distributions to shareholders | | | (0.06 | ) | | | (0.04 | ) | | | (0.03 | ) | | | (0.09 | ) | | | (0.19 | ) |
| | | | | | | | | | | | | | | | | | | | | |
Proceeds from regulatory settlements | | | — | | | | — | | | | — | | | | 0.00 | (a) | | | — | |
| | | | | | | | | | | | | | | | | | | | | |
Net asset value, end of period | | | $9.97 | | | | $9.98 | | | | $10.02 | | | | $9.95 | | | | $9.93 | |
| | | | | | | | | | | | | | | | | | | | | |
Total return | | | 0.45 | % | | | (0.01 | %) | | | 0.98 | % | | | 1.12 | % | | | 1.80 | % |
| | | | | | | | | | | | | | | | | | | | | |
Ratios to average net assets(b) | | | | | | | | | | | | | | | | | | | | |
| | | | | |
Total gross expenses | | | 1.64 | % | | | 1.64 | % | | | 1.64 | % | | | 1.65 | % | | | 1.57 | % |
| | | | | | | | | | | | | | | | | | | | | |
Total net expenses(c) | | | 1.10 | %(d) | | | 1.10 | %(d) | | | 1.49 | %(d) | | | 1.49 | %(d) | | | 1.48 | %(d) |
| | | | | | | | | | | | | | | | | | | | | |
Net investment income | | | 0.46 | % | | | 0.47 | % | | | 0.32 | % | | | 0.75 | % | | | 1.47 | % |
| | | | | | | | | | | | | | | | | | | | | |
Supplemental data | | | | | | | | | | | | | | | | | | | | |
| | | | | |
Net assets, end of period (in thousands) | | | $3,431 | | | | $6,120 | | | | $11,495 | | | | $19,697 | | | | $6,100 | |
| | | | | | | | | | | | | | | | | | | | | |
Portfolio turnover | | | 60 | % | | | 81 | % | | | 102 | % | | | 76 | % | | | 83 | % |
| | | | | | | | | | | | | | | | | | | | | |
Notes to Financial Highlights
| (b) | In addition to the fees and expenses that the Fund bears directly, the Fund indirectly bears a pro rata share of the fees and expenses of any other funds in which it invests. Such indirect expenses are not included in the Fund’s reported expense ratios. |
| (c) | Total net expenses include the impact of certain fee waivers/expense reimbursements made by the Investment Manager and certain of its affiliates, if applicable. |
| (d) | The benefits derived from expense reductions had an impact of less than 0.01%. |
The accompanying Notes to Financial Statements are an integral part of this statement.
| | |
| |
| COLUMBIA SHORT TERM BOND FUND | | |
FINANCIAL HIGHLIGHTS (continued)
| | | | | | | | | | | | | | | | | | | | |
| | | Year Ended March 31, | |
Class C | | | 2015 | | | | 2014 | | | | 2013 | | | | 2012 | | | | 2011 | |
Per share data | | | | | | | | | | | | | | | | | | | | |
Net asset value, beginning of period | | | $9.98 | | | | $10.02 | | | | $9.94 | | | | $9.93 | | | | $9.94 | |
| | | | | | | | | | | | | | | | | | | | | |
Income from investment operations: | | | | | | | | | | | | | | | | | | | | |
| | | | | |
Net investment income | | | 0.02 | | | | 0.05 | | | | 0.07 | | | | 0.13 | | | | 0.19 | |
| | | | | | | | | | | | | | | | | | | | | |
Net realized and unrealized gain (loss) | | | 0.01 | | | | (0.05 | ) | | | 0.08 | | | | 0.02 | | | | 0.03 | |
| | | | | | | | | | | | | | | | | | | | | |
Total from investment operations | | | 0.03 | | | | — | | | | 0.15 | | | | 0.15 | | | | 0.22 | |
| | | | | | | | | | | | | | | | | | | | | |
Less distributions to shareholders: | | | | | | | | | | | | | | | | | | | | |
| | | | | |
Net investment income | | | (0.04 | ) | | | (0.04 | ) | | | (0.07 | ) | | | (0.14 | ) | | | (0.23 | ) |
| | | | | | | | | | | | | | | | | | | | | |
Total distributions to shareholders | | | (0.04 | ) | | | (0.04 | ) | | | (0.07 | ) | | | (0.14 | ) | | | (0.23 | ) |
| | | | | | | | | | | | | | | | | | | | | |
Proceeds from regulatory settlements | | | — | | | | — | | | | — | | | | 0.00 | (a) | | | — | |
| | | | | | | | | | | | | | | | | | | | | |
Net asset value, end of period | | | $9.97 | | | | $9.98 | | | | $10.02 | | | | $9.94 | | | | $9.93 | |
| | | | | | | | | | | | | | | | | | | | | |
Total return | | | 0.25 | % | | | (0.02 | %) | | | 1.47 | % | | | 1.48 | % | | | 2.25 | % |
| | | | | | | | | | | | | | | | | | | | | |
Ratios to average net assets(b) | | | | | | | | | | | | | | | | | | | | |
| | | | | |
Total gross expenses | | | 1.64 | % | | | 1.64 | % | | | 1.64 | % | | | 1.62 | % | | | 1.57 | % |
| | | | | | | | | | | | | | | | | | | | | |
Total net expenses(c) | | | 1.30 | %(d) | | | 1.11 | %(d) | | | 1.10 | %(d) | | | 1.04 | %(d) | | | 1.04 | %(d) |
| | | | | | | | | | | | | | | | | | | | | |
Net investment income | | | 0.25 | % | | | 0.46 | % | | | 0.69 | % | | | 1.30 | % | | | 1.90 | % |
| | | | | | | | | | | | | | | | | | | | | |
Supplemental data | | | | | | | | | | | | | | | | | | | | |
| | | | | |
Net assets, end of period (in thousands) | | | $75,284 | | | | $88,042 | | | | $112,124 | | | | $129,511 | | | | $113,863 | |
| | | | | | | | | | | | | | | | | | | | | |
Portfolio turnover | | | 60 | % | | | 81 | % | | | 102 | % | | | 76 | % | | | 83 | % |
| | | | | | | | | | | | | | | | | | | | | |
Notes to Financial Highlights
| (b) | In addition to the fees and expenses that the Fund bears directly, the Fund indirectly bears a pro rata share of the fees and expenses of any other funds in which it invests. Such indirect expenses are not included in the Fund’s reported expense ratios. |
| (c) | Total net expenses include the impact of certain fee waivers/expense reimbursements made by the Investment Manager and certain of its affiliates, if applicable. |
| (d) | The benefits derived from expense reductions had an impact of less than 0.01%. |
The accompanying Notes to Financial Statements are an integral part of this statement.
| | |
| |
| | COLUMBIA SHORT TERM BOND FUND |
FINANCIAL HIGHLIGHTS (continued)
| | | | | | | | | | | | | | | | | | | | |
| | | Year Ended March 31, | |
Class I | | | 2015 | | | | 2014 | | | | 2013 | | | | 2012 | | | | 2011(a) | |
Per share data | | | | | | | | | | | | | | | | | | | | |
Net asset value, beginning of period | | | $9.97 | | | | $10.01 | | | | $9.93 | | | | $9.93 | | | | $10.00 | |
| | | | | | | | | | | | | | | | | | | | | |
Income from investment operations: | | | | | | | | | | | | | | | | | | | | |
| | | | | |
Net investment income | | | 0.11 | | | | 0.12 | | | | 0.10 | | | | 0.18 | | | | 0.10 | |
| | | | | | | | | | | | | | | | | | | | | |
Net realized and unrealized gain (loss) | | | 0.01 | | | | (0.05 | ) | | | 0.11 | | | | 0.02 | | | | (0.03 | ) |
| | | | | | | | | | | | | | | | | | | | | |
Total from investment operations | | | 0.12 | | | | 0.07 | | | | 0.21 | | | | 0.20 | | | | 0.07 | |
| | | | | | | | | | | | | | | | | | | | | |
Less distributions to shareholders: | | | | | | | | | | | | | | | | | | | | |
| | | | | |
Net investment income | | | (0.13 | ) | | | (0.11 | ) | | | (0.13 | ) | | | (0.20 | ) | | | (0.14 | ) |
| | | | | | | | | | | | | | | | | | | | | |
Total distributions to shareholders | | | (0.13 | ) | | | (0.11 | ) | | | (0.13 | ) | | | (0.20 | ) | | | (0.14 | ) |
| | | | | | | | | | | | | | | | | | | | | |
Proceeds from regulatory settlements | | | — | | | | — | | | | — | | | | 0.00 | (b) | | | — | |
| | | | | | | | | | | | | | | | | | | | | |
Net asset value, end of period | | | $9.96 | | | | $9.97 | | | | $10.01 | | | | $9.93 | | | | $9.93 | |
| | | | | | | | | | | | | | | | | | | | | |
Total return | | | 1.16 | % | | | 0.69 | % | | | 2.15 | % | | | 1.99 | % | | | 0.73 | % |
| | | | | | | | | | | | | | | | | | | | | |
Ratios to average net assets(c) | | | | | | | | | | | | | | | | | | | | |
| | | | | |
Total gross expenses | | | 0.44 | % | | | 0.44 | % | | | 0.46 | % | | | 0.44 | % | | | 0.48 | %(d) |
| | | | | | | | | | | | | | | | | | | | | |
Total net expenses(e) | | | 0.40 | % | | | 0.41 | % | | | 0.42 | % | | | 0.44 | %(f) | | | 0.46 | %(d)(f) |
| | | | | | | | | | | | | | | | | | | | | |
Net investment income | | | 1.14 | % | | | 1.17 | % | | | 1.06 | % | | | 1.80 | % | | | 1.99 | %(d) |
| | | | | | | | | | | | | | | | | | | | | |
Supplemental data | | | | | | | | | | | | | | | | | | | | |
| | | | | |
Net assets, end of period (in thousands) | | | $442,260 | | | | $468,126 | | | | $308,394 | | | | $2,706 | | | | $10,679 | |
| | | | | | | | | | | | | | | | | | | | | |
Portfolio turnover | | | 60 | % | | | 81 | % | | | 102 | % | | | 76 | % | | | 83 | % |
| | | | | | | | | | | | | | | | | | | | | |
Notes to Financial Highlights
| (a) | Based on operations from September 27, 2010 (commencement of operations) through the stated period end. |
| (c) | In addition to the fees and expenses that the Fund bears directly, the Fund indirectly bears a pro rata share of the fees and expenses of any other funds in which it invests. Such indirect expenses are not included in the Fund’s reported expense ratios. |
| (e) | Total net expenses include the impact of certain fee waivers/expense reimbursements made by the Investment Manager and certain of its affiliates, if applicable. |
| (f) | The benefits derived from expense reductions had an impact of less than 0.01%. |
The accompanying Notes to Financial Statements are an integral part of this statement.
| | |
| |
| COLUMBIA SHORT TERM BOND FUND | | |
FINANCIAL HIGHLIGHTS (continued)
| | | | | | | | | | | | | | | | | | | | |
| | | Year Ended March 31, | |
Class K | | | 2015 | | | | 2014 | | | | 2013 | | | | 2012 | | | | 2011(a) | |
Per share data | | | | | | | | | | | | | | | | | | | | |
Net asset value, beginning of period | | | $9.96 | | | | $10.01 | | | | $9.93 | | | | $9.92 | | | | $9.93 | |
| | | | | | | | | | | | | | | | | | | | | |
Income from investment operations: | | | | | | | | | | | | | | | | | | | | |
| | | | | |
Net investment income (loss) | | | 0.08 | | | | 0.09 | | | | 0.11 | | | | 0.14 | | | | (0.03 | ) |
| | | | | | | | | | | | | | | | | | | | | |
Net realized and unrealized gain (loss) | | | 0.02 | | | | (0.06 | ) | | | 0.08 | | | | 0.04 | | | | 0.04 | |
| | | | | | | | | | | | | | | | | | | | | |
Total from investment operations | | | 0.10 | | | | 0.03 | | | | 0.19 | | | | 0.18 | | | | 0.01 | |
| | | | | | | | | | | | | | | | | | | | | |
Less distributions to shareholders: | | | | | | | | | | | | | | | | | | | | |
| | | | | |
Net investment income | | | (0.10 | ) | | | (0.08 | ) | | | (0.11 | ) | | | (0.17 | ) | | | (0.02 | ) |
| | | | | | | | | | | | | | | | | | | | | |
Total distributions to shareholders | | | (0.10 | ) | | | (0.08 | ) | | | (0.11 | ) | | | (0.17 | ) | | | (0.02 | ) |
| | | | | | | | | | | | | | | | | | | | | |
Proceeds from regulatory settlements | | | — | | | | — | | | | — | | | | 0.00 | (b) | | | — | |
| | | | | | | | | | | | | | | | | | | | | |
Net asset value, end of period | | | $9.96 | | | | $9.96 | | | | $10.01 | | | | $9.93 | | | | $9.92 | |
| | | | | | | | | | | | | | | | | | | | | |
Total return | | | 0.96 | % | | | 0.29 | % | | | 1.87 | % | | | 1.83 | % | | | 0.07 | % |
| | | | | | | | | | | | | | | | | | | | | |
Ratios to average net assets(c) | | | | | | | | | | | | | | | | | | | | |
| | | | | |
Total gross expenses | | | 0.74 | % | | | 0.74 | % | | | 0.72 | % | | | 0.75 | % | | | 0.68 | %(d) |
| | | | | | | | | | | | | | | | | | | | | |
Total net expenses(e) | | | 0.70 | % | | | 0.71 | % | | | 0.70 | % | | | 0.75 | %(f) | | | 0.66 | %(d)(f) |
| | | | | | | | | | | | | | | | | | | | | |
Net investment income (loss) | | | 0.84 | % | | | 0.87 | % | | | 1.10 | % | | | 1.46 | % | | | (4.05 | %)(d) |
| | | | | | | | | | | | | | | | | | | | | |
Supplemental data | | | | | | | | | | | | | | | | | | | | |
| | | | | |
Net assets, end of period (in thousands) | | | $3,063 | | | | $3,220 | | | | $3,391 | | | | $4,205 | | | | $3 | |
| | | | | | | | | | | | | | | | | | | | | |
Portfolio turnover | | | 60 | % | | | 81 | % | | | 102 | % | | | 76 | % | | | 83 | % |
| | | | | | | | | | | | | | | | | | | | | |
Notes to Financial Highlights
| (a) | Based on operations from March 7, 2011 (commencement of operations) through the stated period end. |
| (c) | In addition to the fees and expenses that the Fund bears directly, the Fund indirectly bears a pro rata share of the fees and expenses of any other funds in which it invests. Such indirect expenses are not included in the Fund’s reported expense ratios. |
| (e) | Total net expenses include the impact of certain fee waivers/expense reimbursements made by the Investment Manager and certain of its affiliates, if applicable. |
| (f) | The benefits derived from expense reductions had an impact of less than 0.01%. |
The accompanying Notes to Financial Statements are an integral part of this statement.
| | |
| |
| | COLUMBIA SHORT TERM BOND FUND |
FINANCIAL HIGHLIGHTS (continued)
| | | | | | | | | | | | | | | | | | | | |
| | | Year Ended March 31, | |
Class R | | | 2015 | | | | 2014 | | | | 2013 | | | | 2012 | | | | 2011(a) | |
Per share data | | | | | | | | | | | | | | | | | | | | |
Net asset value, beginning of period | | | $9.99 | | | | $10.03 | | | | $9.96 | | | | $9.94 | | | | $10.02 | |
| | | | | | | | | | | | | | | | | | | | | |
Income from investment operations: | | | | | | | | | | | | | | | | | | | | |
| | | | | |
Net investment income | | | 0.05 | | | | 0.05 | | | | 0.07 | | | | 0.12 | | | | 0.07 | |
| | | | | | | | | | | | | | | | | | | | | |
Net realized and unrealized gain (loss) | | | 0.00 | (b) | | | (0.05 | ) | | | 0.07 | | | | 0.04 | | | | (0.03 | ) |
| | | | | | | | | | | | | | | | | | | | | |
Total from investment operations | | | 0.05 | | | | — | | | | 0.14 | | | | 0.16 | | | | 0.04 | |
| | | | | | | | | | | | | | | | | | | | | |
Less distributions to shareholders: | | | | | | | | | | | | | | | | | | | | |
| | | | | |
Net investment income | | | (0.06 | ) | | | (0.04 | ) | | | (0.07 | ) | | | (0.14 | ) | | | (0.12 | ) |
| | | | | | | | | | | | | | | | | | | | | |
Total distributions to shareholders | | | (0.06 | ) | | | (0.04 | ) | | | (0.07 | ) | | | (0.14 | ) | | | (0.12 | ) |
| | | | | | | | | | | | | | | | | | | | | |
Proceeds from regulatory settlements | | | — | | | | — | | | | — | | | | 0.00 | (b) | | | — | |
| | | | | | | | | | | | | | | | | | | | | |
Net asset value, end of period | | | $9.98 | | | | $9.99 | | | | $10.03 | | | | $9.96 | | | | $9.94 | |
| | | | | | | | | | | | | | | | | | | | | |
Total return | | | 0.50 | % | | | 0.04 | % | | | 1.43 | % | | | 1.60 | % | | | 0.37 | % |
| | | | | | | | | | | | | | | | | | | | | |
Ratios to average net assets(c) | | | | | | | | | | | | | | | | | | | | |
| | | | | |
Total gross expenses | | | 1.14 | % | | | 1.14 | % | | | 1.14 | % | | | 1.15 | % | | | 1.19 | %(d) |
| | | | | | | | | | | | | | | | | | | | | |
Total net expenses(e) | | | 1.05 | %(f) | | | 1.05 | %(f) | | | 1.04 | %(f) | | | 0.99 | %(f) | | | 1.04 | %(d)(f) |
| | | | | | | | | | | | | | | | | | | | | |
Net investment income | | | 0.50 | % | | | 0.52 | % | | | 0.72 | % | | | 1.22 | % | | | 1.35 | %(d) |
| | | | | | | | | | | | | | | | | | | | | |
Supplemental data | | | | | | | | | | | | | | | | | | | | |
| | | | | |
Net assets, end of period (in thousands) | | | $3,373 | | | | $3,838 | | | | $4,691 | | | | $3,594 | | | | $2 | |
| | | | | | | | | | | | | | | | | | | | | |
Portfolio turnover | | | 60 | % | | | 81 | % | | | 102 | % | | | 76 | % | | | 83 | % |
| | | | | | | | | | | | | | | | | | | | | |
Notes to Financial Highlights
| (a) | Based on operations from September 27, 2010 (commencement of operations) through the stated period end. |
| (c) | In addition to the fees and expenses that the Fund bears directly, the Fund indirectly bears a pro rata share of the fees and expenses of any other funds in which it invests. Such indirect expenses are not included in the Fund’s reported expense ratios. |
| (e) | Total net expenses include the impact of certain fee waivers/expense reimbursements made by the Investment Manager and certain of its affiliates, if applicable. |
| (f) | The benefits derived from expense reductions had an impact of less than 0.01%. |
The accompanying Notes to Financial Statements are an integral part of this statement.
| | |
| |
| COLUMBIA SHORT TERM BOND FUND | | |
FINANCIAL HIGHLIGHTS (continued)
| | | | | | | | | | | | |
| | | Year Ended March 31, | |
Class R4 | | | 2015 | | | | 2014 | | | | 2013(a) | |
Per share data | | | | | | | | | | | | |
Net asset value, beginning of period | | | $9.97 | | | | $10.01 | | | | $10.01 | |
| | | | | | | | | | | | | |
Income from investment operations: | | | | | | | | | | | | |
| | | |
Net investment income | | | 0.10 | | �� | | 0.10 | | | | 0.06 | |
| | | | | | | | | | | | | |
Net realized and unrealized gain (loss) | | | 0.01 | | | | (0.05 | ) | | | (0.02 | )(b) |
| | | | | | | | | | | | | |
Total from investment operations | | | 0.11 | | | | 0.05 | | | | 0.04 | |
| | | | | | | | | | | | | |
Less distributions to shareholders: | | | | | | | | | | | | |
| | | |
Net investment income | | | (0.11 | ) | | | (0.09 | ) | | | (0.04 | ) |
| | | | | | | | | | | | | |
Total distributions to shareholders | | | (0.11 | ) | | | (0.09 | ) | | | (0.04 | ) |
| | | | | | | | | | | | | |
Net asset value, end of period | | | $9.97 | | | | $9.97 | | | | $10.01 | |
| | | | | | | | | | | | | |
Total return | | | 1.11 | % | | | 0.54 | % | | | 0.36 | % |
| | | | | | | | | | | | | |
Ratios to average net assets(c) | | | | | | | | | | | | |
| | | |
Total gross expenses | | | 0.64 | % | | | 0.64 | % | | | 0.73 | %(d) |
| | | | | | | | | | | | | |
Total net expenses(e) | | | 0.55 | %(f) | | | 0.55 | %(f) | | | 0.56 | %(d) |
| | | | | | | | | | | | | |
Net investment income | | | 0.98 | % | | | 1.03 | % | | | 1.97 | %(d) |
| | | | | | | | | | | | | |
Supplemental data | | | | | | | | | | | | |
| | | |
Net assets, end of period (in thousands) | | | $8,945 | | | | $7,056 | | | | $194 | |
| | | | | | | | | | | | | |
Portfolio turnover | | | 60 | % | | | 81 | % | | | 102 | % |
| | | | | | | | | | | | | |
Notes to Financial Highlights
| (a) | Based on operations from November 8, 2012 (commencement of operations) through the stated period end. |
| (b) | Calculation of the net gain (loss) per share (both realized and unrealized) does not correlate to the aggregate realized and unrealized gain (loss) presented in the Statement of Operations due to the timing of subscriptions and redemptions of Fund shares in relation to fluctuations in the market value of the portfolio. |
| (c) | In addition to the fees and expenses that the Fund bears directly, the Fund indirectly bears a pro rata share of the fees and expenses of any other funds in which it invests. Such indirect expenses are not included in the Fund’s reported expense ratios. |
| (e) | Total net expenses include the impact of certain fee waivers/expense reimbursements made by the Investment Manager and certain of its affiliates, if applicable. |
| (f) | The benefits derived from expense reductions had an impact of less than 0.01%. |
The accompanying Notes to Financial Statements are an integral part of this statement.
| | |
| |
| | COLUMBIA SHORT TERM BOND FUND |
FINANCIAL HIGHLIGHTS (continued)
| | | | | | | | | | | | |
| | | Year Ended March 31, | |
Class R5 | | | 2015 | | | | 2014 | | | | 2013(a) | |
Per share data | | | | | | | | | | | | |
Net asset value, beginning of period | | | $9.97 | | | | $10.01 | | | | $10.01 | |
| | | | | | | | | | | | | |
Income from investment operations: | | | | | | | | | | | | |
| | | |
Net investment income | | | 0.11 | | | | 0.11 | | | | 0.04 | |
| | | | | | | | | | | | | |
Net realized and unrealized gain (loss) | | | 0.00 | (b) | | | (0.05 | ) | | | 0.00 | (b) |
| | | | | | | | | | | | | |
Total from investment operations | | | 0.11 | | | | 0.06 | | | | 0.04 | |
| | | | | | | | | | | | | |
Less distributions to shareholders: | | | | | | | | | | | | |
| | | |
Net investment income | | | (0.12 | ) | | | (0.10 | ) | | | (0.04 | ) |
| | | | | | | | | | | | | |
Total distributions to shareholders | | | (0.12 | ) | | | (0.10 | ) | | | (0.04 | ) |
| | | | | | | | | | | | | |
Net asset value, end of period | | | $9.96 | | | | $9.97 | | | | $10.01 | |
| | | | | | | | | | | | | |
Total return | | | 1.11 | % | | | 0.64 | % | | | 0.40 | % |
| | | | | | | | | | | | | |
Ratios to average net assets(c) | | | | | | | | | | | | |
| | | |
Total gross expenses | | | 0.49 | % | | | 0.49 | % | | | 0.51 | %(d) |
| | | | | | | | | | | | | |
Total net expenses(e) | | | 0.45 | % | | | 0.46 | % | | | 0.46 | %(d) |
| | | | | | | | | | | | | |
Net investment income | | | 1.09 | % | | | 1.13 | % | | | 1.13 | %(d) |
| | | | | | | | | | | | | |
Supplemental data | | | | | | | | | | | | |
| | | |
Net assets, end of period (in thousands) | | | $53,516 | | | | $40,717 | | | | $25,258 | |
| | | | | | | | | | | | | |
Portfolio turnover | | | 60 | % | | | 81 | % | | | 102 | % |
| | | | | | | | | | | | | |
Notes to Financial Highlights
| (a) | Based on operations from November 8, 2012 (commencement of operations) through the stated period end. |
| (c) | In addition to the fees and expenses that the Fund bears directly, the Fund indirectly bears a pro rata share of the fees and expenses of any other funds in which it invests. Such indirect expenses are not included in the Fund’s reported expense ratios. |
| (e) | Total net expenses include the impact of certain fee waivers/expense reimbursements made by the Investment Manager and certain of its affiliates, if applicable. |
The accompanying Notes to Financial Statements are an integral part of this statement.
| | |
| |
| COLUMBIA SHORT TERM BOND FUND | | |
FINANCIAL HIGHLIGHTS (continued)
| | | | | | | | | | | | | | | | | | | | |
| | | Year Ended March 31, | |
Class W | | | 2015 | | | | 2014 | | | | 2013 | | | | 2012 | | | | 2011(a) | |
Per share data | | | | | | | | | | | | | | | | | | | | |
Net asset value, beginning of period | | | $9.99 | | | | $10.03 | | | | $9.96 | | | | $9.94 | | | | $10.02 | |
| | | | | | | | | | | | | | | | | | | | | |
Income from investment operations: | | | | | | | | | | | | | | | | | | | | |
| | | | | |
Net investment income | | | 0.07 | | | | 0.08 | | | | 0.08 | | | | 0.15 | | | | 0.08 | |
| | | | | | | | | | | | | | | | | | | | | |
Net realized and unrealized gain (loss) | | | 0.01 | | | | (0.05 | ) | | | 0.09 | | | | 0.04 | | | | (0.03 | ) |
| | | | | | | | | | | | | | | | | | | | | |
Total from investment operations | | | 0.08 | | | | 0.03 | | | | 0.17 | | | | 0.19 | | | | 0.05 | |
| | | | | | | | | | | | | | | | | | | | | |
Less distributions to shareholders: | | | | | | | | | | | | | | | | | | | | |
| | | | | |
Net investment income | | | (0.09 | ) | | | (0.07 | ) | | | (0.10 | ) | | | (0.17 | ) | | | (0.13 | ) |
| | | | | | | | | | | | | | | | | | | | | |
Total distributions to shareholders | | | (0.09 | ) | | | (0.07 | ) | | | (0.10 | ) | | | (0.17 | ) | | | (0.13 | ) |
| | | | | | | | | | | | | | | | | | | | | |
Proceeds from regulatory settlements | | | — | | | | — | | | | — | | | | 0.00 | (b) | | | — | |
| | | | | | | | | | | | | | | | | | | | | |
Net asset value, end of period | | | $9.98 | | | | $9.99 | | | | $10.03 | | | | $9.96 | | | | $9.94 | |
| | | | | | | | | | | | | | | | | | | | | |
Total return | | | 0.76 | % | | | 0.29 | % | | | 1.69 | % | | | 1.89 | % | | | 0.48 | % |
| | | | | | | | | | | | | | | | | | | | | |
Ratios to average net assets(c) | | | | | | | | | | | | | | | | | | | | |
| | | | | |
Total gross expenses | | | 0.89 | % | | | 0.89 | % | | | 0.90 | % | | | 0.90 | % | | | 0.90 | %(d) |
| | | | | | | | | | | | | | | | | | | | | |
Total net expenses(e) | | | 0.80 | %(f) | | | 0.81 | %(f) | | | 0.81 | %(f) | | | 0.74 | %(f) | | | 0.77 | %(d)(f) |
| | | | | | | | | | | | | | | | | | | | | |
Net investment income | | | 0.74 | % | | | 0.78 | % | | | 0.82 | % | | | 1.53 | % | | | 1.67 | %(d) |
| | | | | | | | | | | | | | | | | | | | | |
Supplemental data | | | | | | | | | | | | | | | | | | | | |
| | | | | |
Net assets, end of period (in thousands) | | | $6,597 | | | | $7,009 | | | | $18,092 | | | | $8 | | | | $2 | |
| | | | | | | | | | | | | | | | | | | | | |
Portfolio turnover | | | 60 | % | | | 81 | % | | | 102 | % | | | 76 | % | | | 83 | % |
| | | | | | | | | | | | | | | | | | | | | |
Notes to Financial Highlights
| (a) | Based on operations from September 27, 2010 (commencement of operations) through the stated period end. |
| (c) | In addition to the fees and expenses that the Fund bears directly, the Fund indirectly bears a pro rata share of the fees and expenses of any other funds in which it invests. Such indirect expenses are not included in the Fund’s reported expense ratios. |
| (e) | Total net expenses include the impact of certain fee waivers/expense reimbursements made by the Investment Manager and certain of its affiliates, if applicable. |
| (f) | The benefits derived from expense reductions had an impact of less than 0.01%. |
The accompanying Notes to Financial Statements are an integral part of this statement.
| | |
| |
| | COLUMBIA SHORT TERM BOND FUND |
FINANCIAL HIGHLIGHTS (continued)
| | | | | | | | | | | | | | | | | | | | |
| | | Year Ended March 31, | |
Class Y | | | 2015 | | | | 2014 | | | | 2013 | | | | 2012 | | | | 2011 | |
Per share data | | | | | | | | | | | | | | | | | | | | |
Net asset value, beginning of period | | | $9.97 | | | | $10.01 | | | | $9.93 | | | | $9.92 | | | | $9.93 | |
| | | | | | | | | | | | | | | | | | | | | |
Income from investment operations: | | | | | | | | | | | | | | | | | | | | |
| | | | | |
Net investment income | | | 0.11 | | | | 0.12 | | | | 0.14 | | | | 0.19 | | | | 0.25 | |
| | | | | | | | | | | | | | | | | | | | | |
Net realized and unrealized gain (loss) | | | 0.01 | | | | (0.05 | ) | | | 0.07 | | | | 0.02 | | | | 0.03 | |
| | | | | | | | | | | | | | | | | | | | | |
Total from investment operations | | | 0.12 | | | | 0.07 | | | | 0.21 | | | | 0.21 | | | | 0.28 | |
| | | | | | | | | | | | | | | | | | | | | |
Less distributions to shareholders: | | | | | | | | | | | | | | | | | | | | |
| | | | | |
Net investment income | | | (0.13 | ) | | | (0.11 | ) | | | (0.13 | ) | | | (0.20 | ) | | | (0.29 | ) |
| | | | | | | | | | | | | | | | | | | | | |
Total distributions to shareholders | | | (0.13 | ) | | | (0.11 | ) | | | (0.13 | ) | | | (0.20 | ) | | | (0.29 | ) |
| | | | | | | | | | | | | | | | | | | | | |
Proceeds from regulatory settlements | | | — | | | | — | | | | — | | | | 0.00 | (a) | | | — | |
| | | | | | | | | | | | | | | | | | | | | |
Net asset value, end of period | | | $9.96 | | | | $9.97 | | | | $10.01 | | | | $9.93 | | | | $9.92 | |
| | | | | | | | | | | | | | | | | | | | | |
Total return | | | 1.16 | % | | | 0.69 | % | | | 2.15 | % | | | 2.11 | % | | | 2.84 | % |
| | | | | | | | | | | | | | | | | | | | | |
Ratios to average net assets(b) | | | | | | | | | | | | | | | | | | | | |
| | | | | |
Total gross expenses | | | 0.44 | % | | | 0.44 | % | | | 0.45 | % | | | 0.44 | % | | | 0.47 | % |
| | | | | | | | | | | | | | | | | | | | | |
Total net expenses(c) | | | 0.40 | % | | | 0.41 | % | | | 0.43 | % | | | 0.44 | %(d) | | | 0.45 | %(d) |
| | | | | | | | | | | | | | | | | | | | | |
Net investment income | | | 1.06 | % | | | 1.17 | % | | | 1.37 | % | | | 1.93 | % | | | 2.51 | % |
| | | | | | | | | | | | | | | | | | | | | |
Supplemental data | | | | | | | | | | | | | | | | | | | | |
| | | | | |
Net assets, end of period (in thousands) | | | $22,996 | | | | $6,368 | | | | $9,129 | | | | $13,707 | | | | $16,173 | |
| | | | | | | | | | | | | | | | | | | | | |
Portfolio turnover | | | 60 | % | | | 81 | % | | | 102 | % | | | 76 | % | | | 83 | % |
| | | | | | | | | | | | | | | | | | | | | |
Notes to Financial Highlights
| (b) | In addition to the fees and expenses that the Fund bears directly, the Fund indirectly bears a pro rata share of the fees and expenses of any other funds in which it invests. Such indirect expenses are not included in the Fund’s reported expense ratios. |
| (c) | Total net expenses include the impact of certain fee waivers/expense reimbursements made by the Investment Manager and certain of its affiliates, if applicable. |
| (d) | The benefits derived from expense reductions had an impact of less than 0.01%. |
The accompanying Notes to Financial Statements are an integral part of this statement.
| | |
| |
| COLUMBIA SHORT TERM BOND FUND | | |
FINANCIAL HIGHLIGHTS (continued)
| | | | | | | | | | | | | | | | | | | | |
| | | Year Ended March 31, | |
Class Z | | | 2015 | | | | 2014 | | | | 2013 | | | | 2012 | | | | 2011 | |
Per share data | | | | | | | | | | | | | | | | | | | | |
Net asset value, beginning of period | | | $9.97 | | | | $10.01 | | | | $9.94 | | | | $9.92 | | | | $9.93 | |
| | | | | | | | | | | | | | | | | | | | | |
Income from investment operations: | | | | | | | | | | | | | | | | | | | | |
| | | | | |
Net investment income | | | 0.10 | | | | 0.10 | | | | 0.12 | | | | 0.18 | | | | 0.24 | |
| | | | | | | | | | | | | | | | | | | | | |
Net realized and unrealized gain (loss) | | | 0.00 | (a) | | | (0.05 | ) | | | 0.07 | | | | 0.03 | | | | 0.04 | |
| | | | | | | | | | | | | | | | | | | | | |
Total from investment operations | | | 0.10 | | | | 0.05 | | | | 0.19 | | | | 0.21 | | | | 0.28 | |
| | | | | | | | | | | | | | | | | | | | | |
Less distributions to shareholders: | | | | | | | | | | | | | | | | | | | | |
| | | | | |
Net investment income | | | (0.11 | ) | | | (0.09 | ) | | | (0.12 | ) | | | (0.19 | ) | | | (0.29 | ) |
| | | | | | | | | | | | | | | | | | | | | |
Total distributions to shareholders | | | (0.11 | ) | | | (0.09 | ) | | | (0.12 | ) | | | (0.19 | ) | | | (0.29 | ) |
| | | | | | | | | | | | | | | | | | | | | |
Proceeds from regulatory settlements | | | — | | | | — | | | | — | | | | 0.00 | (a) | | | — | |
| | | | | | | | | | | | | | | | | | | | | |
Net asset value, end of period | | | $9.96 | | | | $9.97 | | | | $10.01 | | | | $9.94 | | | | $9.92 | |
| | | | | | | | | | | | | | | | | | | | | |
Total return | | | 1.01 | % | | | 0.54 | % | | | 1.94 | % | | | 2.14 | % | | | 2.82 | % |
| | | | | | | | | | | | | | | | | | | | | |
Ratios to average net assets(b) | | | | | | | | | | | | | | | | | | | | |
| | | | | |
Total gross expenses | | | 0.64 | % | | | 0.64 | % | | | 0.64 | % | | | 0.62 | % | | | 0.57 | % |
| | | | | | | | | | | | | | | | | | | | | |
Total net expenses(c) | | | 0.55 | %(d) | | | 0.55 | %(d) | | | 0.53 | %(d) | | | 0.49 | %(d) | | | 0.48 | %(d) |
| | | | | | | | | | | | | | | | | | | | | |
Net investment income | | | 1.00 | % | | | 1.02 | % | | | 1.25 | % | | | 1.86 | % | | | 2.46 | % |
| | | | | | | | | | | | | | | | | | | | | |
Supplemental data | | | | | | | | | | | | | | | | | | | | |
| | | | | |
Net assets, end of period (in thousands) | | | $1,296,171 | | | | $1,537,794 | | | | $1,829,589 | | | | $2,099,898 | | | | $1,936,070 | |
| | | | | | | | | | | | | | | | | | | | | |
Portfolio turnover | | | 60 | % | | | 81 | % | | | 102 | % | | | 76 | % | | | 83 | % |
| | | | | | | | | | | | | | | | | | | | | |
Notes to Financial Highlights
| (b) | In addition to the fees and expenses that the Fund bears directly, the Fund indirectly bears a pro rata share of the fees and expenses of any other funds in which it invests. Such indirect expenses are not included in the Fund’s reported expense ratios. |
| (c) | Total net expenses include the impact of certain fee waivers/expense reimbursements made by the Investment Manager and certain of its affiliates, if applicable. |
| (d) | The benefits derived from expense reductions had an impact of less than 0.01%. |
The accompanying Notes to Financial Statements are an integral part of this statement.
| | |
| |
| | COLUMBIA SHORT TERM BOND FUND |
NOTES TO FINANCIAL STATEMENTS
March 31, 2015
Note 1. Organization
Columbia Short Term Bond Fund (the Fund), a series of Columbia Funds Series Trust (the Trust), is a diversified fund. The Trust is registered under the Investment Company Act of 1940, as amended (the 1940 Act), as an open-end management investment company organized as a Delaware statutory trust.
Fund Shares
The Trust may issue an unlimited number of shares (without par value). The Fund offers Class A, Class B, Class C, Class I, Class K, Class R, Class R4, Class R5, Class W, Class Y and Class Z shares. Although all share classes generally have identical voting, dividend and liquidation rights, each share class votes separately when required by the Trust’s organizational documents or by law. Different share classes pay different distribution amounts to the extent the expenses of such share classes differ, and distributions in liquidation will be proportional to the net asset value of each share class. Each share class has its own expense structure and sales charges.
Class A shares are subject to a maximum front-end sales charge of 1.00% based on the initial investment amount. Class A shares purchased without an initial sales charge in accounts aggregating $1 million to $50 million at the time of purchase are subject to a contingent deferred sales charge (CDSC) if the shares are sold within 18 months after purchase, charged as follows: 1.00% CDSC if redeemed within 12 months after purchase, and 0.50% CDSC if redeemed more than 12, but less than 18, months after purchase.
Class B shares may be subject to a maximum CDSC of 3.00% based upon the holding period after purchase. The Fund no longer accepts investments by new or existing investors in the Fund’s Class B shares, except in connection with the reinvestment of any dividend and/or capital gain distributions in Class B shares of the Fund and exchanges by existing Class B shareholders of certain other funds within the Columbia Family of Funds.
Class C shares are subject to a 1.00% CDSC on shares redeemed within one year after purchase.
Class I shares are not subject to sales charges and are available only to the Columbia Family of Funds.
Class K shares are not subject to sales charges, however this share class is closed to new investors.
Class R shares are not subject to sales charges and are generally available only to certain retirement plans and other investors as described in the Fund’s prospectus.
Class R4 shares are not subject to sales charges and are generally available only to omnibus retirement plans and certain investors as described in the Fund’s prospectus.
Class R5 shares are not subject to sales charges and are generally available only to investors purchasing through authorized investment professionals and omnibus retirement plans.
Class W shares are not subject to sales charges and are available only to investors purchasing through authorized investment programs managed by investment professionals, including discretionary managed account programs.
Class Y shares are not subject to sales charges and are generally available only to certain retirement plans as described in the Fund’s prospectus.
Class Z shares are not subject to sales charges and are available only to eligible investors, which are subject to different investment minimums as described in the Fund’s prospectus.
Note 2. Summary of Significant Accounting Policies
Basis of Preparation
The Fund is an investment company that applies the accounting and reporting guidance in the Financial Accounting Standards Board (FASB) Accounting Standards Codification Topic 946, Financial Services — Investment Companies (ASC 946). The financial statements are prepared in accordance with U.S. generally accepted accounting principles (GAAP), which requires management to make certain estimates and assumptions that affect the reported amounts of assets and liabilities, the disclosure of contingent assets and liabilities at the date of the financial statements and the reported amounts of income and expenses during the reporting period. Actual results could differ from those estimates.
The following is a summary of significant accounting policies followed by the Fund in the preparation of its financial statements.
Security Valuation
Debt securities generally are valued by pricing services approved by the Board of Trustees (the Board) based upon market transactions for normal, institutional-size trading units of similar securities. The services may use various pricing techniques that take into account, as
| | |
| |
| COLUMBIA SHORT TERM BOND FUND | | |
NOTES TO FINANCIAL STATEMENTS (continued)
March 31, 2015
applicable, factors such as yield, quality, coupon rate, maturity, type of issue, trading characteristics and other data, as well as broker quotes. Debt securities for which quotations are readily available may also be valued based upon an over-the-counter or exchange bid quotation.
Asset and mortgage-backed securities are generally valued by pricing services, which utilize pricing models that incorporate the securities’ cash flow and loan performance data. These models also take into account available market data, including trades, market quotations, and benchmark yield curves for identical or similar securities. Factors used to identify similar securities may include, but are not limited to, issuer, collateral type, vintage, prepayment speeds, collateral performance, credit ratings, credit enhancement and expected life. Asset-backed securities for which quotations are readily available may also be valued based upon an over-the-counter or exchange bid quotation.
Investments in open-end investment companies, including money market funds, are valued at their net asset value.
Futures and options on futures contracts are valued based upon the settlement price established each day by the board of trade or exchange on which they are traded.
Investments for which market quotations are not readily available, or that have quotations which management believes are not reliable, are valued at fair value as determined in good faith under procedures established by and under the general supervision of the Board. If a security or class of securities (such as foreign securities) is valued at fair value, such value is likely to be different from the quoted or published price for the security.
The determination of fair value often requires significant judgment. To determine fair value, management may use assumptions including but not limited to future cash flows and estimated risk premiums. Multiple inputs from various sources may be used to determine fair value.
Derivative Instruments
The Fund invests in certain derivative instruments, as detailed below, to meet its investment objectives. Derivatives are instruments whose values depend on, or are derived from, in whole or in part, the value of one or more other assets, such as securities, currencies, commodities or indices. Derivative instruments may be used to increase investment flexibility (including to maintain cash reserves while maintaining exposure to
certain other assets), for risk management (hedging) purposes, to facilitate trading, to reduce transaction costs and to pursue higher investment returns. The Fund may also use derivative instruments to mitigate certain investment risks, such as foreign currency exchange rate risk, interest rate risk and credit risk. Derivatives may involve various risks, including the potential inability of the counterparty to fulfill its obligation under the terms of the contract, the potential for an illiquid secondary market (making it difficult for the Fund to sell, including at favorable prices) and the potential for market movements which may expose the Fund to gains or losses in excess of the amount shown in the Statement of Assets and Liabilities. The notional amounts of derivative instruments, if applicable, are not recorded in the financial statements.
A derivative instrument may suffer a marked-to-market loss if the value of the contract decreases due to an unfavorable change in the market rates or values of the underlying instrument. Losses can also occur if the counterparty does not perform under the contract. The Fund’s risk of loss from counterparty credit risk on over-the-counter derivatives is generally limited to the aggregate unrealized gain netted against any collateral held by the Fund and the amount of any variation margin held by the counterparty. With exchange-traded or centrally cleared derivatives, there is reduced counterparty credit risk to the Fund since the exchange’s clearinghouse, as counterparty to such instruments, guarantees against a possible default. The clearinghouse stands between the buyer and the seller of the contract; therefore, the counterparty credit risk is failure of the clearinghouse. However, credit risk still exists in exchange-traded or centrally cleared derivatives with respect to initial and variation margin that is held in a broker’s customer account. While brokers are required to segregate customer margin from their own assets, in the event that a broker becomes insolvent or goes into bankruptcy and at that time there is a shortfall in the aggregate amount of margin held by the broker for all its clients, U.S. bankruptcy laws will typically allocate that shortfall on a pro-rata basis across all the broker’s customers (including the Fund), potentially resulting in losses to the Fund.
In order to better define its contractual rights and to secure rights that will help the Fund mitigate its counterparty risk, the Fund may enter into an International Swaps and Derivatives Association, Inc. Master Agreement (ISDA Master Agreement) or similar agreement with its derivative contract counterparties. An
| | |
| |
| | COLUMBIA SHORT TERM BOND FUND |
NOTES TO FINANCIAL STATEMENTS (continued)
March 31, 2015
ISDA Master Agreement is an agreement between the Fund and a counterparty that governs over-the-counter derivatives and forward foreign currency exchange contracts and typically contains, among other things, collateral posting terms and netting provisions in the event of a default and/or termination event. Under an ISDA Master Agreement, the Fund may, under certain circumstances, offset with the counterparty certain derivative instrument’s payables and/or receivables with collateral held and/or posted and create one single net payment. The provisions of the ISDA Master Agreement typically permit a single net payment in the event of default (close-out netting) including the bankruptcy or insolvency of the counterparty. Note, however, that bankruptcy or insolvency laws of a particular jurisdiction may impose restrictions on or prohibitions against the right of offset in bankruptcy, insolvency or other events.
Collateral (margin) requirements differ by type of derivative. Margin requirements are established by the exchange or clearinghouse for exchange-traded and centrally cleared derivatives. Brokers can ask for margin in excess of the minimum in certain circumstances. Collateral terms are contract specific for over-the-counter derivatives. For over-the-counter derivatives traded under an ISDA Master Agreement, the collateral requirements are typically calculated by netting the marked-to-market amount for each transaction under such agreement and comparing that amount to the value of any variation margin currently pledged by the Fund and/or the counterparty. Generally, the amount of collateral due from or to a party has to exceed a minimum transfer amount threshold (e.g., $500,000) before a transfer has to be made. To the extent amounts due to the Fund from its counterparties are not fully collateralized, contractually or otherwise, the Fund bears the risk of loss from counterparty nonperformance. The Fund attempts to mitigate counterparty risk by only entering into agreements with counterparties that it believes have the financial resources to honor their obligations and by monitoring the financial stability of those counterparties.
Certain ISDA Master Agreements allow counterparties to over-the-counter derivatives to terminate derivative contracts prior to maturity in the event the Fund’s net assets decline by a stated percentage over a specified time period or if the Fund fails to meet the terms of the ISDA Master Agreement, which would cause the Fund to accelerate payment of any net liability owed to the counterparty. The Fund also has termination rights if the counterparty fails to meet the terms of the ISDA Master Agreement. In addition to considering counterparty credit risk, the Fund would consider terminating the derivative
contracts based on whether termination would result in a net liability owed from the counterparty.
For financial reporting purposes, the Fund does not offset derivative assets and derivative liabilities that are subject to netting arrangements in the Statement of Assets and Liabilities.
Futures Contracts
Futures contracts are exchange traded and represent commitments for the future purchase or sale of an asset at a specified price on a specified date. The Fund bought and sold futures contracts to manage the duration and yield curve exposure of the Fund versus the benchmark and manage exposure to movements in interest rates. These instruments may be used for other purposes in future periods. Upon entering into futures contracts, the Fund bears risks that it may not achieve the anticipated benefits of the futures contracts and may realize a loss. Additional risks include counterparty credit risk, the possibility of an illiquid market, and that a change in the value of the contract or option may not correlate with changes in the value of the underlying asset.
Upon entering into a futures contract, the Fund pledges cash or securities with the broker in an amount sufficient to meet the initial margin requirement. The initial margin deposit must be maintained at an established level over the life of the contract. Cash deposited as initial margin is recorded in the Statement of Assets and Liabilities as margin deposits. Securities deposited as initial margin are designated in the Portfolio of Investments. Subsequent payments (variation margin) are made or received by the Fund each day. The variation margin payments are equal to the daily change in the contract value and are recorded as variation margin receivable or payable and are offset in unrealized gains or losses. The Fund recognizes a realized gain or loss when the contract is closed or expires. Futures contracts involve, to varying degrees, risk of loss in excess of the variation margin disclosed in the Statement of Assets and Liabilities.
Effects of Derivative Transactions in the Financial Statements
The following tables are intended to provide additional information about the effect of derivatives on the financial statements of the Fund, including: the fair value of derivatives by risk category and the location of those fair values in the Statement of Assets and Liabilities; and the impact of derivative transactions over the period in the Statement of Operations, including realized gains or losses and unrealized gains or losses. The derivative
| | |
| |
| COLUMBIA SHORT TERM BOND FUND | | |
NOTES TO FINANCIAL STATEMENTS (continued)
March 31, 2015
schedules following the Portfolio of Investments present additional information regarding derivative instruments outstanding at the end of the period, if any.
The following table is a summary of the fair value of derivative instruments (not considered to be hedging instruments for accounting disclosure purposes) at March 31, 2015:
| | | | | | |
| | | | | | | |
| | Asset Derivatives | |
Risk Exposure
Category | | Statement of Assets and Liabilities Location | | | Fair Value ($) | |
Interest rate risk | | Net assets — unrealized appreciation on futures contracts | | | 841,229 | * |
| |
| | Liability Derivatives | |
Risk Exposure
Category | | Statement of Assets and Liabilities Location | | | Fair Value ($) | |
Interest rate risk | | Net assets — unrealized depreciation on futures contracts | | | 217,608 | * |
| * | Includes cumulative appreciation (depreciation) as reported in the tables following the Portfolio of Investments. Only the current day’s variation margin is reported in receivables or payables in the Statement of Assets and Liabilities. |
The following table indicates the effect of derivative instruments (not considered to be hedging instruments for accounting disclosure purposes) in the Statement of Operations for the year ended March 31, 2015:
| | | | |
Amount of Realized Gain (Loss) on Derivatives Recognized in
Income | |
| Risk Exposure Category | | Futures Contracts ($) | |
Interest rate risk | | | 718,794 | |
Change in Unrealized Appreciation (Depreciation) on Derivatives
Recognized in Income | |
| Risk Exposure Category | | Futures Contracts ($) | |
Interest rate risk | | | 410,293 | |
The following table is a summary of the average outstanding volume by derivative instrument for the year ended March 31, 2015:
| | | | |
| | | | | |
| Derivative Instrument | | Average notional amounts($)* | |
Futures contracts — Long | | | 202,571,094 | |
Futures contracts — Short | | | 46,133,497 | |
| * | Based on the ending quarterly outstanding amounts for the year ended March 31, 2015. |
Treasury Inflation Protected Securities
The Fund may invest in treasury inflation protected securities (TIPS). The principal amount of TIPS is adjusted periodically and is increased for inflation or
decreased for deflation based on a monthly published index. These adjustments are recorded as interest income in the Statement of Operations. Coupon payments are based on the adjusted principal at the time the interest is paid.
Principal Only Securities
The Fund may invest in Principal Only Securities (POs). POs are stripped securities entitled to receive most, if not all, of the principal from the underlying obligation, but not the interest. The Fund may also invest in stripped mortgage-backed securities. POs are particularly sensitive to changes in interest rates and therefore are subject to fluctuations in price. POs are also subject to credit risk because the Fund may not receive all or part of its principal if the issuer or credit enhancer defaults on its obligation.
Security Transactions
Security transactions are accounted for on the trade date. Cost is determined and gains (losses) are based upon the specific identification method for both financial statement and federal income tax purposes.
Income Recognition
Interest income is recorded on an accrual basis. Market premiums and discounts, including original issue discounts, are amortized and accreted, respectively, over the expected life of the security on all debt securities, unless otherwise noted. The Fund classifies gains and losses realized on prepayments received on mortgage-backed securities as adjustments to interest income.
The Fund may place a debt security on non-accrual status and reduce related interest income when it becomes probable that the interest will not be collected and the amount of uncollectible interest can be reasonably estimated. A defaulted debt security is removed from non-accrual status when the issuer resumes interest payments or when collectability of interest is reasonably assured.
Dividend income is recorded on the ex-dividend date.
Expenses
General expenses of the Trust are allocated to the Fund and other funds of the Trust based upon relative net assets or other expense allocation methodologies determined by the nature of the expense. Expenses directly attributable to the Fund are charged to the Fund. Expenses directly attributable to a specific class of shares are charged to that share class.
| | |
| |
| | COLUMBIA SHORT TERM BOND FUND |
NOTES TO FINANCIAL STATEMENTS (continued)
March 31, 2015
Determination of Class Net Asset Value
All income, expenses (other than class-specific expenses, which are charged to that share class, as shown in the Statement of Operations) and realized and unrealized gains (losses) are allocated to each class of the Fund on a daily basis, based on the relative net assets of each class, for purposes of determining the net asset value of each class.
Federal Income Tax Status
The Fund intends to qualify each year as a regulated investment company under Subchapter M of the Internal Revenue Code, as amended, and will distribute substantially all of its taxable income (including net short-term capital gains), if any, for its tax year, and as such will not be subject to federal income taxes. In addition, the Fund intends to distribute in each calendar year substantially all of its net investment income, capital gains and certain other amounts, if any, such that the Fund should not be subject to federal excise tax. Therefore, no federal income or excise tax provision is recorded.
Distributions to Shareholders
Distributions from net investment income, if any, are declared daily and paid monthly. Net realized capital gains, if any, are distributed at least annually. Income distributions and capital gain distributions are determined in accordance with federal income tax regulations, which may differ from GAAP.
Guarantees and Indemnifications
Under the Trust’s organizational documents and, in some cases, by contract, its officers and trustees are indemnified against certain liabilities arising out of the performance of their duties to the Trust or its funds. In addition, certain of the Fund’s contracts with its service providers contain general indemnification clauses. The Fund’s maximum exposure under these arrangements is unknown since the amount of any future claims that may be made against the Fund cannot be determined, and the Fund has no historical basis for predicting the likelihood of any such claims.
Note 3. Fees and Compensation Paid to Affiliates
Investment Management Fees
Under an Investment Management Services Agreement, Columbia Management Investment Advisers, LLC (the Investment Manager), a wholly-owned subsidiary of
Ameriprise Financial, Inc. (Ameriprise Financial), determines which securities will be purchased, held or sold. The investment management fee is an annual fee that is equal to a percentage of the Fund’s average daily net assets that declines from 0.36% to 0.24% as the Fund’s net assets increase. The effective investment management fee rate for the year ended March 31, 2015 was 0.36% of the Fund’s average daily net assets.
Administration Fees
Under an Administrative Services Agreement, the Investment Manager also serves as the Fund Administrator. The Fund pays the Fund Administrator an annual fee for administration and accounting services equal to a percentage of the Fund’s average daily net assets that declines from 0.07% to 0.04% as the Fund’s net assets increase. The effective administration fee rate for the year ended March 31, 2015 was 0.06% of the Fund’s average daily net assets.
Other Expenses
Other expenses are for, among other things, miscellaneous expenses of the Fund or the Board, including payments to a company providing limited administrative services to the Fund and the Board. That company’s expenses include boardroom and office expense, employee compensation, employee health and retirement benefits, and certain other expenses. For the year ended March 31, 2015, other expenses paid by the Fund to this company were $5,055.
Compensation of Board Members
Board members are compensated for their services to the Fund as disclosed in the Statement of Operations. Under a Deferred Compensation Plan (the Plan), the Board members who are not “interested persons” of the Fund, as defined under the 1940 Act, may elect to defer payment of up to 100% of their compensation. Deferred amounts are treated as though equivalent dollar amounts had been invested in shares of certain funds managed by the Investment Manager. The Fund’s liability for these amounts is adjusted for market value changes and remains in the Fund until distributed in accordance with the Plan.
Transfer Agent Fees
Under a Transfer and Dividend Disbursing Agent Agreement, Columbia Management Investment Services Corp. (the Transfer Agent), an affiliate of the Investment Manager and a wholly-owned subsidiary of Ameriprise Financial, is responsible for providing transfer agency
| | |
| |
| COLUMBIA SHORT TERM BOND FUND | | |
NOTES TO FINANCIAL STATEMENTS (continued)
March 31, 2015
services to the Fund. The Transfer Agent has contracted with Boston Financial Data Services (BFDS) to serve as sub-transfer agent.
Effective November 1, 2014, the Transfer Agent receives a monthly transfer agency fee based on the number or the average value of accounts, depending on the type of account. Prior to November 1, 2014, the Transfer Agent received a monthly account-based service fee based on the number of open accounts. In addition, the Transfer Agent also receives sub-transfer agency fees based on a percentage of the average aggregate value of the Fund’s shares maintained in omnibus accounts (other than omnibus accounts for which American Enterprise Investment Services Inc. is the broker of record or accounts where the beneficial shareholder is a customer of Ameriprise Financial Services, Inc., for which the Transfer Agent receives a per account fee). The Transfer Agent pays the fees of BFDS for services as sub-transfer agent and is not entitled to reimbursement for such fees from the Fund (with the exception of out-of-pocket fees).
The Transfer Agent also receives compensation from the Fund for various shareholder services and reimbursements for certain out-of-pocket fees. Total transfer agent fees for Class K and Class R5 shares are subject to an annual limitation of not more than 0.05% of the average daily net assets attributable to each share class. Class I and Class Y shares do not pay transfer agency fees.
For the year ended March 31, 2015, the Fund’s effective transfer agent fee rates as a percentage of average daily net assets of each class were as follows:
| | | | |
| | | | | |
Class A | | | 0.20 | % |
Class B | | | 0.20 | |
Class C | | | 0.20 | |
Class K | | | 0.05 | |
Class R | | | 0.20 | |
Class R4 | | | 0.20 | |
Class R5 | | | 0.05 | |
Class W | | | 0.20 | |
Class Z | | | 0.20 | |
The Fund and certain other associated investment companies, have severally, but not jointly, guaranteed the performance and observance of all the terms and conditions of a lease entered into by Seligman Data Corp. (SDC), the former transfer agent, including the payment of rent by SDC (the Guaranty). SDC was the legacy Seligman funds’ former transfer agent.
The lease and the Guaranty expire in January 2019. At March 31, 2015, the Fund’s total potential future obligation over the life of the Guaranty is $42,212. The liability remaining at March 31, 2015 for non-recurring charges associated with the lease amounted to $23,505 and is recorded as a part of the payable for other expenses in the Statement of Assets and Liabilities.
An annual minimum account balance fee of $20 may apply to certain accounts with a value below the applicable share class’s initial minimum investment requirements to reduce the impact of small accounts on transfer agent fees. These minimum account balance fees are remitted to the Fund and recorded as part of expense reductions in the Statement of Operations. For the year ended March 31, 2015, these minimum account balance fees reduced total expenses of the Fund by $2,568.
Plan Administration Fees
Under a Plan Administration Services Agreement with the Transfer Agent, the Fund pays an annual fee at a rate of 0.25% of the Fund’s average daily net assets attributable to Class K shares for the provision of various administrative, recordkeeping, communication and educational services.
Distribution and Service Fees
The Fund has an agreement with Columbia Management Investment Distributors, Inc. (the Distributor), an affiliate of the Investment Manager and a wholly-owned subsidiary of Ameriprise Financial, for distribution and shareholder services. The Board has approved, and the Fund has adopted, distribution and shareholder service plans (the Plans) applicable to certain share classes, which set the distribution and service fees for the Fund. These fees are calculated daily and are intended to compensate the Distributor and/or eligible selling and/or servicing agents for selling shares of the Fund and providing services to investors.
Under the Plans, the Fund pays a monthly combined distribution and service fee to the Distributor at the maximum annual rate of 0.25% of the average daily net assets attributable to Class A shares of the Fund. Also under the Plans, the Fund pays a monthly service fee at the maximum annual rate of 0.25% of the average daily net assets attributable to Class B, Class C and Class W shares of the Fund and the payment of a monthly distribution fee at the maximum annual rates of 0.75%, 0.75%, 0.50% and 0.25% of the average daily net assets attributable to Class B, Class C, Class R and Class W shares of the Fund.
| | |
| |
| | COLUMBIA SHORT TERM BOND FUND |
NOTES TO FINANCIAL STATEMENTS (continued)
March 31, 2015
The Distributor has voluntarily agreed to waive a portion of the distribution fee for Class B shares so that it does not exceed 0.30% annually of the average daily net assets attributable to Class B shares. This arrangement may be modified or terminated by the Distributor at any time.
Effective August 1, 2014, the Distributor has voluntarily agreed to waive a portion of the distribution fee for Class C shares so that it does not exceed 0.60% annually of the average daily net assets attributable to Class C shares. This arrangement may be modified or terminated by the Distributor at any time. Prior to August 1, 2014, the Distributor voluntarily waived a portion of the distribution fee for Class C shares so that it did not exceed 0.31% annually of the average daily net assets attributable to Class C shares.
Although the Fund may pay a distribution fee up to 0.25% of the Fund’s average daily net assets attributable to Class W shares and a service fee of up to 0.25% of the Fund’s average daily net assets attributable to Class W shares, the aggregate fee shall not exceed 0.25% of the Fund’s average daily net assets attributable to Class W shares.
Sales Charges
Sales charges, including front-end charges and CDSCs, received by the Distributor for distributing Fund shares were $99,203 for Class A, $264 for Class B and $8,251 for Class C, shares for the year ended March 31, 2015.
Expenses Waived/Reimbursed by the Investment Manager and its Affiliates
The Investment Manager and certain of its affiliates have contractually agreed to waive fees and/or reimburse expenses (excluding certain fees and expenses described below) for the period disclosed below, unless sooner terminated at the sole discretion of the Board, so that the Fund’s net operating expenses, after giving effect to fees waived/expenses reimbursed and any balance credits and/or overdraft charges from the Fund’s custodian, do not exceed the following annual rates as a percentage of the class’ average daily net assets:
| | | | |
| | | Fee Rates Contractual through July 31, 2015 | |
Class A | | | 0.80 | % |
Class B | | | 1.55 | |
Class C | | | 1.55 | |
Class I | | | 0.40 | |
Class K | | | 0.70 | |
Class R | | | 1.05 | |
Class R4 | | | 0.55 | |
Class R5 | | | 0.45 | |
Class W | | | 0.80 | |
Class Y | | | 0.40 | |
Class Z | | | 0.55 | |
Under the agreement governing these fee waivers and/or expense reimbursement arrangements, the following fees and expenses are excluded from the waiver/reimbursement commitment, and therefore will be paid by the Fund, if applicable: taxes (including foreign transaction taxes), expenses associated with investments in affiliated and non-affiliated pooled investment vehicles (including mutual funds and exchange-traded funds), transaction costs and brokerage commissions, costs related to any securities lending program, dividend expenses associated with securities sold short, inverse floater program fees and expenses, transaction charges and interest on borrowed money, interest, extraordinary expenses and any other expenses the exclusion of which is specifically approved by the Board. This agreement may be modified or amended only with approval from all parties. Any fees waived and/or expenses reimbursed under the expense reimbursement arrangements described above are not recoverable by the Investment Manager or its affiliates in future periods. Class B and Class C distribution fees waived by the Distributor, as discussed above, are in addition to the waiver/reimbursement commitment under the agreement.
Note 4. Federal Tax Information
The timing and character of income and capital gain distributions are determined in accordance with income tax regulations, which may differ from GAAP because of temporary or permanent book to tax differences.
At March 31, 2015, these differences are primarily due to differing treatment for capital loss carryforwards, principal and/or interest from fixed income securities, deferral/reversal of wash sale losses, Trustees’ deferred compensation, distributions, derivative investments, and
| | |
| |
| COLUMBIA SHORT TERM BOND FUND | | |
NOTES TO FINANCIAL STATEMENTS (continued)
March 31, 2015
tax straddles. To the extent these differences are permanent, reclassifications are made among the components of the Fund’s net assets in the Statement of Assets and Liabilities. Temporary differences do not require reclassifications. In the Statement of Assets and Liabilities the following reclassifications were made:
| | | | |
Excess of distributions over net investment income | | | $284,243 | |
Accumulated net realized loss | | | 4,499,433 | |
Paid-in capital | | | (4,783,676 | ) |
Net investment income (loss) and net realized gains (losses), as disclosed in the Statement of Operations, and net assets were not affected by this reclassification.
The tax character of distributions paid during the years indicated was as follows:
| | | | | | | | |
| | | Year Ended
March 31, 2015 ($) | | | Year Ended
March 31,
2014 ($) | |
Ordinary income | | | 26,564,345 | | | | 24,096,931 | |
Short-term capital gain distributions, if any, are considered ordinary income distributions for tax purposes.
At March 31, 2015, the components of distributable earnings on a tax basis were as follows:
| | | | |
Undistributed ordinary income | | | $1,228,630 | |
Capital loss carryforwards | | | (23,134,245 | ) |
Net unrealized depreciation | | | (1,190,309 | ) |
At March 31, 2015, the cost of investments for federal income tax purposes was $2,331,299,792 and the aggregate gross unrealized appreciation and depreciation based on that cost was:
| | | | |
Unrealized appreciation | | | $13,909,451 | |
Unrealized depreciation | | | (15,099,760 | ) |
Net unrealized depreciation | | | ($1,190,309 | ) |
The following capital loss carryforwards, determined at March 31, 2015, may be available to reduce taxable income arising from future net realized gains on investments, if any, to the extent permitted by the Internal Revenue Code:
| | | | |
| Year of Expiration | | Amount ($) | |
2016 | | | 4,489,585 | |
2017 | | | 18,644,660 | |
Total | | | 23,134,245 | |
For the year ended March 31, 2015, $7,907,943 of capital loss carryforward was utilized and $4,783,676 expired unused.
Management of the Fund has concluded that there are no significant uncertain tax positions in the Fund that would require recognition in the financial statements. However, management’s conclusion may be subject to review and adjustment at a later date based on factors including, but not limited to, new tax laws, regulations, and administrative interpretations (including relevant court decisions). Generally, the Fund’s federal tax returns for the prior three fiscal years remain subject to examination by the Internal Revenue Service.
Note 5. Portfolio Information
The cost of purchases and proceeds from sales of securities, excluding short-term investments and derivatives, if any, aggregated to $1,482,452,688 and $1,773,567,197, respectively, for the year ended March 31, 2015, of which $681,656,426 and $800,477,920, respectively, were U.S. government securities. The amount of purchase and sale activity impacts the portfolio turnover rate reported in the Financial Highlights.
Note 6. Affiliated Money Market Fund
The Fund invests in Columbia Short-Term Cash Fund, an affiliated money market fund established for the exclusive use by the Fund and other affiliated funds. The income earned by the Fund from such investments is included as Dividends — affiliated issuers in the Statement of Operations. As an investing fund, the Fund indirectly bears its proportionate share of the expenses of Columbia Short-Term Cash Fund.
Note 7. Shareholder Concentration
At March 31, 2015, one unaffiliated shareholder of record owned 47.4% of the outstanding shares of the Fund in one or more accounts. The Fund has no knowledge about whether any portion of those shares was owned beneficially. Affiliated shareholders of record owned 34.6% of the outstanding shares of the Fund in one or more accounts. Subscription and redemption activity by concentrated accounts may have a significant effect on the operations of the Fund.
Note 8. Line of Credit
The Fund has entered into a revolving credit facility with a syndicate of banks led by JPMorgan Chase Bank, N.A. (JPMorgan) whereby the Fund may borrow for the
| | |
| |
| | COLUMBIA SHORT TERM BOND FUND |
NOTES TO FINANCIAL STATEMENTS (continued)
March 31, 2015
temporary funding of shareholder redemptions or for other temporary or emergency purposes. Pursuant to a December 9, 2014 amendment, the credit facility agreement, which is a collective agreement between the Fund and certain other funds managed by the Investment Manager, severally and not jointly, permits collective borrowings up to $550 million. Interest is charged to each participating fund based on its borrowings at a rate equal to the higher of (i) the overnight federal funds rate plus 1.00% or (ii) the one-month LIBOR rate plus 1.00%. Each borrowing under the credit facility matures no later than 60 days after the date of borrowing. The Fund also pays a commitment fee equal to its pro rata share of the amount of the credit facility at a rate of 0.075% per annum. The commitment fee is included in other expenses in the Statement of Operations. Prior to the December 9, 2014 amendment, the credit facility agreement permitted borrowings up to $500 million under the same terms and interest rates as described above.
The Fund had no borrowings during the year ended March 31, 2015.
Note 9. Significant Risks
Mortgage-Backed Securities Risk
The value of mortgage-backed securities may be affected by, among other things, changes in interest rates, factors concerning the interests in and structure of the issuer or the originator of the mortgages, the creditworthiness of the entities that provide any supporting letters of credit, surety bonds or other credit enhancements or the quality of underlying assets or the market’s assessment thereof. Mortgage-backed securities are subject to prepayment risk, which is the possibility that the underlying mortgage may be refinanced or prepaid prior to maturity during periods of declining or low interest rates, causing the Fund to have to reinvest the money received in securities that have lower yields. In addition, the impact of prepayments on the value of mortgage-backed securities may be difficult to predict and may result in greater volatility.
Credit Risk
Credit risk is the risk that the value of debt securities in the Fund’s portfolio may decline because the issuer may default and fail to pay interest or repay principal when due. Rating agencies assign credit ratings to debt securities to indicate their credit risk. Lower rated or unrated debt securities held by the Fund may present increased credit risk as compared to higher-rated debt securities.
Interest Rate Risk
Interest rate risk is the risk of losses attributable to changes in interest rates. In general, if prevailing interest rates rise, the values of debt securities tend to fall, and if interest rates fall, the values of debt securities tend to rise. Actions by governments and central banking authorities can result in increases in interest rates. Increasing interest rates may negatively affect the value of debt securities held by the Fund, resulting in a negative impact on the Fund’s performance and net asset value per share. In general, the longer the maturity or duration of a debt security, the greater its sensitivity to changes in interest rates.
Liquidity Risk
Liquidity risk is the risk associated with a lack of marketability of investments which may make it difficult to sell the investment at a desirable time or price. Changing regulatory, market or other conditions or environments (for example, the interest rate or credit environments) may adversely affect the liquidity of the Fund’s investments. The Fund may have to accept a lower selling price for the holding, sell other investments, or forego another, more appealing investment opportunity. Generally, the less liquid the market at the time the Fund sells a portfolio investment, the greater the risk of loss or decline of value to the Fund. A less liquid market can lead to an increase in Fund redemptions, which may negatively impact Fund performance and net asset value per share, including, for example, if the Fund is forced to sell securities in a down market.
Note 10. Subsequent Events
Management has evaluated the events and transactions that have occurred through the date the financial statements were issued and noted no items requiring adjustment of the financial statements or additional disclosure.
Note 11. Information Regarding Pending and Settled Legal Proceedings
In December 2005, without admitting or denying the allegations, American Express Financial Corporation (AEFC, which is now known as Ameriprise Financial, Inc. (Ameriprise Financial)) entered into settlement agreements with the Securities and Exchange Commission (SEC) and Minnesota Department of Commerce (MDOC) related to market timing activities. As a result, AEFC was censured and ordered to cease and
| | |
| |
| COLUMBIA SHORT TERM BOND FUND | | |
NOTES TO FINANCIAL STATEMENTS (continued)
March 31, 2015
desist from committing or causing any violations of certain provisions of the Investment Advisers Act of 1940, the Investment Company Act of 1940, and various Minnesota laws. AEFC agreed to pay disgorgement of $10 million and civil money penalties of $7 million. AEFC also agreed to retain an independent distribution consultant to assist in developing a plan for distribution of all disgorgement and civil penalties ordered by the SEC in accordance with various undertakings detailed at www.sec.gov/litigation/admin/ia-2451.pdf. Ameriprise Financial and its affiliates have cooperated with the SEC and the MDOC in these legal proceedings, and have made regular reports to the Funds’ Boards of Trustees.
Ameriprise Financial and certain of its affiliates have historically been involved in a number of legal, arbitration and regulatory proceedings, including routine litigation, class actions, and governmental actions, concerning matters arising in connection with the conduct of their business activities. Ameriprise Financial believes that the Funds are not currently the subject of, and that neither Ameriprise Financial nor any of its affiliates are the subject of, any pending legal, arbitration or regulatory proceedings that are likely to have a material adverse effect on the Funds or the ability of Ameriprise Financial or its affiliates to perform under their contracts with the Funds. Ameriprise Financial is required to make quarterly (10-Q), annual (10-K) and, as necessary, 8-K filings with the Securities and Exchange Commission on legal and regulatory matters that relate to Ameriprise Financial and its affiliates. Copies of these filings may be obtained by accessing the SEC website at www.sec.gov.
There can be no assurance that these matters, or the adverse publicity associated with them, will not result in increased fund redemptions, reduced sale of fund shares or other adverse consequences to the Funds. Further, although we believe proceedings are not likely to have a material adverse effect on the Funds or the ability of Ameriprise Financial or its affiliates to perform under their contracts with the Funds, these proceedings are subject to uncertainties and, as such, we are unable to estimate the possible loss or range of loss that may result. An adverse outcome in one or more of these proceedings could result in adverse judgments, settlements, fines, penalties or other relief that could have a material adverse effect on the consolidated financial condition or results of operations of Ameriprise Financial.
| | |
| |
| | COLUMBIA SHORT TERM BOND FUND |
REPORT OF INDEPENDENT REGISTERED PUBLIC ACCOUNTING FIRM
To the Trustees of Columbia Funds Series Trust and the Shareholders of
Columbia Short Term Bond Fund
In our opinion, the accompanying statement of assets and liabilities, including the portfolio of investments, and the related statements of operations and of changes in net assets and the financial highlights present fairly, in all material respects, the financial position of Columbia Short Term Bond Fund (the “Fund”, a series of Columbia Funds Series Trust) at March 31, 2015, and the results of its operations, the changes in its net assets and the financial highlights for each of the periods indicated, in conformity with accounting principles generally accepted in the United States of America. These financial statements and financial highlights (hereafter referred to as “financial statements”) are the responsibility of the Fund’s management. Our responsibility is to express an opinion on these financial statements based on our audits. We conducted our audits of these financial statements in accordance with the standards of the Public Company Accounting Oversight Board (United States). Those standards require that we plan and perform the audit to obtain reasonable assurance about whether the financial statements are free of material misstatement. An audit includes examining, on a test basis, evidence supporting the amounts and disclosures in the financial statements, assessing the accounting principles used and significant estimates made by management, and evaluating the overall financial statement presentation. We believe that our audits, which included confirmation of securities at March 31, 2015 by correspondence with the custodian, brokers and transfer agent, provide a reasonable basis for our opinion.
PricewaterhouseCoopers LLP
Minneapolis, Minnesota
May 22, 2015
| | |
| |
| COLUMBIA SHORT TERM BOND FUND | | |
TRUSTEES AND OFFICERS
Shareholders elect the Board that oversees the Funds’ operations. The Board appoints officers who are responsible for day-to-day business decisions based on policies set by the Board. The following table provides basic biographical information about the Funds’ Board members, including their principal occupations during the past five years, although specific titles for individuals may have varied over the period. Under current Board policy, members may serve through the end of the calendar year in which he or she reaches either the mandatory retirement age established by the Board or the fifteenth anniversary of the first Board meeting they attended as a member of the Board.
| | | | | | | | |
| Independent Trustees |
Name, Address, Year of Birth | | Position Held With Funds and Length of Service | | Principal Occupation(s) During Past Five Years and Other Relevant Professional Experience | | Number of
Funds in the Fund Family Overseen by Board Member | | Other Present or Past Directorships/ Trusteeships (Within Past 5 Years) |
Kathleen Blatz 901 S. Marquette Ave. Minneapolis, MN 55402 1954 | | Board member since 1/06 for RiverSource Funds and since 6/11 for Nations Funds | | Attorney; specializing in arbitration and mediation; Chief Justice, Minnesota Supreme Court, 1998-2006; Associate Justice, Minnesota Supreme Court, 1996-1998; Fourth Judicial District Court Judge, Hennepin Country, 1994-1996; Attorney in private practice and public service, 1984-1993; State Representative, Minnesota House of Representatives, 1979-1993, which included service on the Tax and Financial Institutions and Insurance Committees | | 127 | | Trustee, BlueCross BlueShield of Minnesota (Chair of the Business Development Committee) since 2009; Chair of the Robina Foundation since August 2013 |
Edward J. Boudreau, Jr. 901 S. Marquette Ave. Minneapolis, MN 55402 1944 | | Board member since 6/11 for RiverSource Funds and since 1/05 for Nations Funds | | Managing Director, E.J. Boudreau & Associates (consulting) since 2000; FINRA Industry Arbitrator, 2002-present; Chairman and Chief Executive Officer, John Hancock Funds (asset management), Chairman and Interested Trustee for open-end and closed-end funds offered by John Hancock, 1989-2000; John Hancock Life Insurance Company, including SVP and Treasurer and SVP Information Technology, 1968-1988 | | 125 | | Former Trustee, BofA Funds Series Trust (11 funds), 2005-2011; Trustee, Boston Museum of Science (Chair of Finance Committee), 1985-2013 |
Pamela G. Carlton 901 S. Marquette Ave. Minneapolis, MN 55402 1954 | | Board member since 7/07 for RiverSource Funds and since 6/11 for Nations Funds | | President, Springboard — Partners in Cross Cultural Leadership (consulting company) since 2003; Managing Director of US Equity Research, JP Morgan Chase, 1999-2003; Director of US Equity Research, Chase Asset Management, 1996- 1999; Co-Director Latin America Research, 1993-1996, COO Global Research, 1992-1996, Co-Director of US Research, 1991-1992, Investment Banker, Morgan Stanley, 1982-1991 | | 127 | | None |
William P. Carmichael 901 S. Marquette Ave. Minneapolis, MN 55402 1943 | | Chair of the Board since 1/14, Board member since 6/11 for RiverSource Funds and since 2003 for Nations Funds | | Retired; Co-founder, The Succession Fund (provides exit strategies to owners of privately held companies) 1998-2007; Adjunct Professor of Finances, Kelley School of Business, Indiana University, 1993-2007; Senior Vice President, Sara Lee Corporation, 1991-1993; Senior Vice President and Chief Financial Officer, Beatrice Foods Company, 1984-1990; Vice President, Esmark, Inc, 1973-1984.; Associate, Price Waterhouse, 1968-1972 | | 127 | | Director, Cobra Electronics Corporation (electronic equipment manufacturer), 1994-August 2014; The Finish Line (athletic shoes and apparel) since July 2003; Director, International Textile Corp. since 2012; former Director, McMoRan Exploration Company (oil and gas exploration and development) 2010-2013; former Trustee, BofA Funds Series Trust (11 funds) 2009-2011; Director, Spectrum Brands, Inc. (consumer products), 2002-2009; Director, Simmons Company (bedding), 2004-2010 |
| | |
| |
| | COLUMBIA SHORT TERM BOND FUND |
TRUSTEES AND OFFICERS (continued)
| | | | | | | | |
| Independent Trustees (continued) |
Name, Address, Year of Birth | | Position Held With Funds and Length of Service | | Principal Occupation(s) During Past Five Years and Other Relevant Professional Experience | | Number of
Funds in the Fund Family Overseen by Board Member | | Other Present or Past Directorships/ Trusteeships (Within Past 5 Years) |
Patricia M. Flynn 901 S. Marquette Ave. Minneapolis, MN 55402 1950 | | Board member since 11/04 for RiverSource Funds and since 6/11 for Nations Funds | | Trustee Professor of Economics and Management, Bentley University since 1976 (also teaches and conducts research on corporate governance); Dean, McCallum Graduate School of Business, Bentley University, 1992-2002 | | 127 | | Trustee, MA Taxpayers Foundation since 1997; Board of Governors, Innovation Institute, MA Technology Collaborative since 2010 |
William A. Hawkins 901 S. Marquette Ave. Minneapolis, MN 55402 1942 | | Board member since 6/11 for RiverSource Funds and since 1/05 for Nations Funds | | Managing Director, Overton Partners (financial consulting), since August 2010; President and Chief Executive Officer, California General Bank, N.A., January 2008-August 2010; Operation Hope, COO, 2004-2007; IndyMac Bancorp, President, CBG, 1999-2003; American General Bank, President, 1997-1999; Griffin Financial Services, CEO, 1981-1997; The Griffin Funds, CEO, 1992-1998 | | 125 | | Trustee, BofA Funds Series Trust (11 funds) |
R. Glenn Hilliard 901 S. Marquette Ave. Minneapolis, MN 55402 1943 | | Board member since 6/11 for RiverSource Funds and since 1/05 for Nations Funds | | Chairman and Chief Executive Officer, Hilliard Group LLC (investing and consulting) since April 2003; Non-Executive Director & Chairman, CNO Financial Group, Inc. (insurance), September 2003-May 2011 | | 125 | | Chairman, BofA Funds Series Trust (11 funds); former Director, CNO Financial Group, Inc. (insurance) 2003-2011 |
Catherine James Paglia 901 S. Marquette Ave. Minneapolis, MN 55402 1952 | | Board member since 11/04 for RiverSource Funds and since 6/11 for Nations Funds | | Director, Enterprise Asset Management, Inc. (private real estate and asset management company) since September 1998; Managing Director and Partner, Interlaken Capital, Inc., 1989-1997; Managing Director, Morgan Stanley, 1982-1989; Vice President, Investment Banking, 1980-1982, Associate, Investment Banking, 1976-1980, Dean Witter Reynolds, Inc. | | 127 | | Director, Valmont Industries, Inc. (irrigation systems manufacturer) since 2012; Trustee, Carleton College (on the Investment Committee); Trustee, Carnegie Endowment for International Peace (on the Investment Committee) |
Leroy C. Richie 901 S. Marquette Ave. Minneapolis, MN 55402 1941 | | Board member since 2000 for Seligman Funds, since 11/08 for RiverSource Funds and since 6/11 for Nations Funds | | Counsel, Lewis & Munday, P.C. (law firm) since 2004; Vice President and General Counsel, Automotive Legal Affairs, Chrysler Corporation, 1993-1997 | | 127 | | Lead Outside Director, Digital Ally, Inc. (digital imaging) since September 2005; Director, Infinity, Inc. (oil and gas exploration and production) since 1994; Director, OGE Energy Corp. (energy and energy services) 2007-2014 |
Minor M. Shaw 901 S. Marquette Ave. Minneapolis, MN 55402 1947 | | Board member since 6/11 for RiverSource Funds and since 2003 for Nations Funds | | President, Micco LLC (private investments) since 2011; President, Micco Corp. (family investment business) 1998-2011 | | 125 | | Director, Piedmont Natural Gas; Director, BlueCross BlueShield of South Carolina since April 2008; Chair of the Duke Endowment; Director, National Association of Corporate Directors, Carolinas Chapter, since 2013; Chair of Greenville-Spartanburg Airport Commission; former Trustee, BofA Funds Series Trust (11 funds), 2003-2011 |
Alison Taunton-Rigby 901 S. Marquette Ave. Minneapolis, MN 55402 1944 | | Board member since 11/02 for RiverSource Funds and since 6/11 for Nations Funds | | Managing Director, Forester Biotech (consulting) since 2001; Chief Executive Officer and Director, RiboNovix, Inc., (biotechnology) 2003-2010; President and Chief Executive Officer of CMT Inc., 2001-2003; Aquila Biopharmaceuticals Inc., 1996-2000; Cambridge Biotech Corporation, 1995-1996, Mitotix Inc., 1993-1994 | | 127 | | Director, Healthways, Inc. (health and well-being solutions) since 2005; Director, ICI Mutual Insurance Company, RRG since 2011; Director, Abt Associates (government contractor) since 2001; Director, Boston Children’s Hospital since 2002 |
| | |
| |
| COLUMBIA SHORT TERM BOND FUND | | |
TRUSTEES AND OFFICERS (continued)
| | | | | | | | |
| Interested Trustee Not Affiliated with Investment Manager* |
Name, Address, Year of Birth | | Position Held With Funds and Length of Service | | Principal Occupation During Past Five Years | | Number of
Funds in the Fund Family Overseen by Board Member | | Other Present or Past Directorships/ Trusteeships (Within Past 5 Years) |
Anthony M. Santomero 901 S. Marquette Ave. Minneapolis, MN 55402 1946 | | Board member since 6/11 for RiverSource Funds and since 1/08 for Nations Funds | | Richard K. Mellon Professor Emeritus of Finance, The Wharton School, University of Pennsylvania, since 2002; Senior Advisor, McKinsey & Company (consulting), 2006-2008; President, Federal Reserve Bank of Philadelphia, 2000-2006, Professor of Finance, The Wharton School, University of Pennsylvania, 1972-2002 | | 125 | | Director, Renaissance Reinsurance Ltd. since May 2008; Trustee, Penn Mutual Life Insurance Company since March 2008; Director, Citigroup Inc. since 2009; Director, Citibank, N.A. since 2009; former Trustee, BofA Funds Series Trust (11 funds), 2008-2011 |
| * | Dr. Santomero is not an affiliated person of the Investment Manager or Ameriprise Financial. However, he is currently deemed by the Funds to be an “interested person” (as defined in the 1940 Act) of the Funds because he serves as a Director of Citigroup Inc. and Citibank, N.A., companies that may directly or through subsidiaries and affiliates engage from time-to-time in brokerage execution, principal transactions and lending relationships with the Funds or accounts advised/managed by the Investment Manager. |
| | | | | | | | |
| Interested Trustee Affiliated with Investment Manager* |
Name, Address, Year of Birth | | Position Held With Funds and Length of Service | | Principal Occupation During Past Five Years | | Number of
Funds in the Fund Family Overseen by Board Member | | Other Present or Past Directorships/ Trusteeships (Within Past 5 Years) |
William F. Truscott 53600 Ameriprise Financial Center Minneapolis, MN 55474 1960 | | Board member since 11/01 for RiverSource Funds and since 6/11 for Nations Funds; Senior Vice President since 2002 for RiverSource Funds and since 5/10 for Nations Funds | | Chairman of the Board and President, Columbia Management Investment Advisers, LLC since May 2010 and February 2012, respectively (previously President and Chief Investment Officer, 2001-April 2010); Chief Executive Officer, Global Asset Management, Ameriprise Financial, Inc. since September 2012 (previously Chief Executive Officer, U.S. Asset Management & President, Annuities, May 2010-September 2012 and President — U.S. Asset Management and Chief Investment Officer, 2005-April 2010); Director and Chief Executive Officer, Columbia Management Investment Distributors, Inc. since May 2010 and February 2012, respectively (previously Chairman of the Board and Chief Executive Officer, 2006-April 2010); Chairman of the Board and Chief Executive Officer, RiverSource Distributors, Inc. since 2006; Director, Threadneedle Asset Management Holdings, SARL since 2014; President and Chief Executive Officer, Ameriprise Certificate Company, 2006-August 2012 | | 186 | | Former Director, Ameriprise Certificate Company, 2006-January 2013 |
| * | Interested person (as defined under the 1940 Act) by reason of being an officer, director, security holder and/or employee of the Investment Manager or Ameriprise Financial. |
The Statement of Additional Information has additional information about the Fund’s Board members and is available, without charge, upon request by calling 800.345.6611; contacting your financial intermediary or visiting columbiathreadneedle.com/us.
| | |
| |
| | COLUMBIA SHORT TERM BOND FUND |
TRUSTEES AND OFFICERS (continued)
The Board has appointed officers who are responsible for day-to-day business decisions based on policies it has established. The officers serve at the pleasure of the Board. In addition to Mr. Truscott, who is Senior Vice President, the Funds’ other officers are:
| | | | |
| Fund Officers |
Name, Address and Year of Birth | | Position and Year First Appointed to Position for any Fund in the Columbia Funds Complex or a Predecessor Thereof | | Principal Occupation(s) During Past Five Years |
Christopher O. Petersen 5228 Ameriprise Financial Center Minneapolis, MN 55474 Born 1970 | | President and Principal Executive Officer (2015) | | Vice President and Lead Chief Counsel, Ameriprise Financial, Inc. since January 2015 (previously, Vice President and Chief Counsel January 2010-December 2014; and Vice President and Group Counsel or Counsel 2004-January 2010); officer of Columbia Funds and affiliated funds since 2007. |
Michael G. Clarke 225 Franklin Street Boston, MA 02110 Born 1969 | | Treasurer (2011) and Chief Financial Officer (2009) | | Vice President — Mutual Fund Administration, Columbia Management Investment Advisers, LLC, since May 2010; Managing Director of Fund Administration, Columbia Management Advisors, LLC, September 2004-April 2010; senior officer of Columbia Funds and affiliated funds since 2002. |
Paul B. Goucher 100 Park Avenue New York, NY 10017 Born 1968 | | Senior Vice President (2011), Chief Legal Officer (2015) and Assistant Secretary (2008) | | Vice President and Lead Chief Counsel, Ameriprise Financial, Inc. since November 2008 and January 2013, respectively (previously Chief Counsel, January 2010-January 2013 and Group Counsel, November 2008-January 2010). |
Thomas P. McGuire 225 Franklin Street Boston, MA 02110 Born 1972 | | Vice President and Chief Compliance Officer (2012) | | Vice President — Asset Management Compliance, Ameriprise Financial, Inc., since May 2010; Chief Compliance Officer, Ameriprise Certificate Company since September 2010; Compliance Executive, Bank of America, 2005-April 2010. |
Colin Moore 225 Franklin Street Boston, MA 02110 Born 1958 | | Senior Vice President (2010) | | Executive Vice President and Global Chief Investment Officer, Ameriprise Financial, Inc., since July 2013; Director and Global Chief Investment Officer, Columbia Management Investment Advisers, LLC since May 2010; Manager, Managing Director and Chief Investment Officer, Columbia Management Advisors, LLC, 2007-April 2010. |
Michael E. DeFao 225 Franklin Street Boston, MA 02110 Born 1968 | | Vice President (2011) and Assistant Secretary (2010) | | Vice President and Chief Counsel, Ameriprise Financial, Inc. since May 2010; Associate General Counsel, Bank of America, 2005-April 2010. |
Joseph F. DiMaria 225 Franklin Street Boston, MA 02110 Born 1968 | | Vice President (2011), Assistant Treasurer (2012) and Chief Accounting Officer (2008) | | Vice President — Mutual Fund Treasurer, Columbia Management Investment Advisers, LLC since May 2010; Director of Fund Administration, Columbia Management Advisors, LLC, 2006-April 2010. |
Amy Johnson 5228 Ameriprise Financial Center Minneapolis, MN 55474 Born 1965 | | Vice President (2006) | | Managing Director and Chief Operating Officer, Columbia Management Investment Advisers, LLC since May 2010 (previously Chief Administrative Officer, 2009-April 2010, and Vice President — Asset Management and Trust Company Services, 2006-2009). |
Lyn Kephart-Strong 5228 Ameriprise Financial Center Minneapolis, MN 55474 Born 1960 | | Vice President (2015) | | President, Columbia Management Investment Services Corp. since October 2014; Vice President & Resolution Officer, Ameriprise Trust Company since August 2009; President, RiverSource Service Corporation 2004-2010. |
Ryan C. Larrenaga 225 Franklin Street Boston, MA 02110 Born 1970 | | Vice President and Secretary (2015) | | Vice President and Group Counsel, Ameriprise Financial, Inc. since August 2011 (previously, Counsel from May 2010 to August 2011); Assistant General Counsel, Bank of America, 2005-April 2010; officer of Columbia Funds and affiliated funds since 2005. |
| | |
| |
| COLUMBIA SHORT TERM BOND FUND | | |
IMPORTANT INFORMATION ABOUT THIS REPORT
Each fund mails one shareholder report to each shareholder address. If you would like more than one report, please call shareholder services at 800.345.6611 and additional reports will be sent to you.
The policy of the Board is to vote the proxies of the companies in which each fund holds investments consistent with the procedures as stated in the Statement of Additional Information (SAI). You may obtain a copy of the SAI without charge by calling 800.345.6611; contacting your financial intermediary; visiting columbiathreadneedle.com/us; or searching the website of the Securities and Exchange Commission (SEC) at sec.gov. Information regarding how each fund voted proxies relating to portfolio securities is filed with the SEC by August 31st for the most recent 12-month period ending June 30th of that year, and is available without charge by visiting columbiathreadneedle.com/us, or searching the website of the SEC at sec.gov.
Each fund files a complete schedule of portfolio holdings with the SEC for the first and third quarters of each fiscal year on Form N-Q. Each fund’s Form N-Q is available on the SEC’s website at sec.gov and may be reviewed and copied at the SEC’s Public Reference Room in Washington, D.C. Information on the operation of the Public Reference Room may be obtained by calling 800.SEC.0330. Each fund’s complete schedule of portfolio holdings, as filed on Form N-Q, can also be obtained without charge, upon request, by calling 800.345.6611.
Columbia Short Term Bond Fund
P.O. Box 8081
Boston, MA 02266-8081
This information is for use with concurrent or prior delivery of a fund prospectus. Please read and consider the investment objectives, risks, charges and expenses for any fund carefully before investing. For a prospectus and summary prospectus, which contains this and other important information about the Fund, go to columbiathreadneedle.com/us. The Fund is distributed by Columbia Management Investment Distributors, Inc., member FINRA, and managed by Columbia Management Investment Advisers, LLC.
Columbia Threadneedle Investments (Columbia Threadneedle) is the global brand name of the Columbia and Threadneedle group of companies. All rights reserved. Columbia Management Investment Distributors, Inc., 225 Franklin Street, Boston, MA 02110-2804
© 2015 Columbia Management Investment Advisers, LLC. All rights reserved.
columbiathreadneedle.com/us
ANN222_03_E01_(05/15)
| | (a) | The registrant has adopted a code of ethics that applies to the registrant’s principal executive officer, principal financial officer, principal accounting officer or controller, or persons performing similar functions, regardless of whether these individuals are employed by the registrant or a third party. |
| | (b) | During the period covered by this report, there were not any amendments to a provision of the code of ethics adopted in 2(a) above. |
| | (c) | During the period covered by this report, there were no waivers, including any implicit waivers, from a provision of the code of ethics described in 2(a) above that relates to one or more of the items set forth in paragraph (b) of this item’s instructions. |
| Item 3. | Audit Committee Financial Expert. |
The registrant’s Board of Trustees has determined that Edward J. Boudreau, Pamela G. Carlton, William A. Hawkins and Alison Taunton-Rigby, each of whom are members of the registrant’s Board of Trustees and Audit Committee, each qualify as an audit committee financial expert. Mr. Boudreau, Ms. Carlton, Mr. Hawkins and Ms. Taunton-Rigby are each independent trustees, as defined in paragraph (a)(2) of this item’s instructions.
| Item 4. | Principal Accountant Fees and Services. |
Fee information below is disclosed for the one series of the registrant whose report to stockholders is included in this annual filing.
(a) Audit Fees. Aggregate Audit Fees billed by the principal accountant for professional services rendered during the fiscal years ended March 31, 2015 and March 31, 2014 are approximately as follows:
| | | | |
| 2015 | | 2014 | |
$29,300 | | $ | 29,300 | |
Audit Fees include amounts related to the audit of the registrant’s annual financial statements or services that are normally provided by the accountant in connection with statutory and regulatory filings or engagements for those fiscal years.
(b) Audit-Related Fees. Aggregate Audit-Related Fees billed to the registrant by the principal accountant for professional services rendered during the fiscal years ended March 31, 2015 and March 31, 2014 are approximately as follows:
Audit-Related Fees include amounts for assurance and related services by the principal accountant that are reasonably related to the performance of the audit of the registrant’s financial statements and are not reported in Audit Fees above. In both fiscal years 2015 and 2014, Audit-Related Fees consist of agreed-upon procedures performed for semi-annual shareholder reports.
During the fiscal years ended March 31, 2015 and March 31, 2014, there were no Audit-Related Fees billed by the registrant’s principal accountant to the registrant’s investment adviser (not including any sub-adviser whose role is primarily portfolio management and is subcontracted with or overseen by another investment adviser) and any entity controlling, controlled by, or under common control with the adviser that provides ongoing services to the registrant for an engagement that related directly to the operations and financial reporting of the registrant.
(c) Tax Fees. Aggregate Tax Fees billed by the principal accountant to the registrant for professional services rendered during the fiscal years ended March 31, 2015 and March 31, 2014 are approximately as follows:
Tax Fees include amounts for the review of annual tax returns, the review of required shareholder distribution calculations and typically include amounts for professional services by the principal accountant for tax compliance, tax advice and tax planning.
During the fiscal years ended March 31, 2015 and March 31, 2014, there were no Tax Fees billed by the registrant’s principal accountant to the registrant’s investment adviser (not including any sub-adviser whose role is primarily portfolio management and is subcontracted with or overseen by another investment adviser) and any entity controlling, controlled by, or under common control with the adviser that provides ongoing services to the registrant for an engagement that related directly to the operations and financial reporting of the registrant.
(d) All Other Fees. Aggregate All Other Fees billed by the principal accountant to the registrant for professional services rendered during the fiscal years ended March 31, 2015 and March 31, 2014 are approximately as follows:
All Other Fees include amounts for products and services provided by the principal accountant, other than the services reported in paragraphs (a) through (c) above.
Aggregate All Other Fees billed by the registrant’s principal accountant to the registrant’s investment adviser (not including any sub-adviser whose role is primarily portfolio management and is subcontracted with or overseen by another investment adviser) and any entity controlling, controlled by, or under common control with the adviser that provides ongoing services to the registrant for an engagement that related directly to the operations and financial reporting of the registrant during the fiscal years ended March 31, 2015 and March 31, 2014 are approximately as follows:
| | | | |
| 2015 | | 2014 | |
$325,000 | | $ | 225,000 | |
In both fiscal years 2015 and 2014, All Other Fees primarily consist of fees billed for internal control examinations of the registrant’s transfer agent and investment advisor.
(e)(1) Audit Committee Pre-Approval Policies and Procedures
The registrant’s Audit Committee is required to pre-approve the engagement of the registrant’s independent auditors to provide audit and non-audit services to the registrant and non-audit services to its investment adviser (excluding any sub-adviser whose role is primarily portfolio management and is sub-contracted or overseen by another investment adviser (the “Adviser”) or any entity controlling, controlled by or under common control with the Adviser that provides ongoing services to the Fund (a “Control Affiliate”) if the engagement relates directly to the operations and financial reporting of the registrant.
The Audit Committee has adopted a Policy for Engagement of Independent Auditors for Audit and Non-Audit Services (the “Policy”). The Policy sets forth the understanding of the Audit Committee regarding the engagement of the registrant’s independent accountants to provide (i) audit and permissible audit-related, tax and other services to the registrant (“Fund Services”); (ii) non-audit services to the registrant’s Adviser and any Control Affiliates, that relates directly to the operations and financial reporting of a Fund (“Fund-related Adviser Services”); and (iii) certain other audit and non-audit services to the registrant’s Adviser and its Control Affiliates. A service will require specific pre-approval by the Audit Committee if it is to be provided by the Fund’s independent auditor; provided, however, that pre-approval of non-audit services to the Fund, the Adviser or Control Affiliates may be waived if certain de minimis requirements set forth in the SEC’s rules are met.
Under the Policy, the Audit Committee may delegate pre-approval authority to any pre-designated member or members who are independent board members. The member(s) to whom such authority is delegated must report, for informational purposes only, any pre-approval decisions to the Audit Committee at its next regular meeting. The Audit Committee’s responsibilities with respect to the pre-approval of services performed by the independent auditor may not be delegated to management.
On an annual basis, at a regularly scheduled Audit Committee meeting, the Fund’s Treasurer or other Fund officer shall submit to the Audit Committee a schedule of the types of Fund Services and Fund-related Adviser Services that are subject to specific pre-
approval. This schedule will provide a description of each type of service that is subject to specific pre-approval, along with total projected fees for each service. The pre-approval will generally cover a one-year period. The Audit Committee will review and approve the types of services and the projected fees for the next one-year period and may add to, or subtract from, the list of pre-approved services from time to time, based on subsequent determinations. This specific approval acknowledges that the Audit Committee is in agreement with the specific types of services that the independent auditor will be permitted to perform and the projected fees for each service.
The Fund’s Treasurer or other Fund officer shall report to the Audit Committee at each of its regular meetings regarding all Fund Services or Fund-related Adviser Services provided since the last such report was rendered, including a description of the services, by category, with forecasted fees for the annual reporting period, proposed changes requiring specific pre-approval and a description of services provided by the independent auditor, by category, with actual fees during the current reporting period.
*****
(e)(2) 100% of the services performed for items (b) through (d) above during 2015 and 2014 were pre-approved by the registrant’s Audit Committee.
(g) The aggregate non-audit fees billed by the registrant’s accountant for services rendered to the registrant, and rendered to the registrant’s investment adviser (not including any sub-adviser whose role is primarily portfolio management and is subcontracted with or overseen by another investment adviser), and any entity controlling, controlled by, or under common control with the adviser that provides ongoing services to the registrant for the fiscal years ended March 31, 2015 and March 31, 2014 are approximately as follows:
| | | | |
| 2015 | | 2014 | |
$328,600 | | $ | 228,600 | |
(h) The registrant’s Audit Committee of the Board of Directors has considered whether the provision of non-audit services that were rendered to the registrant’s adviser (not including any sub-adviser whose role is primarily portfolio management and is subcontracted with or overseen by another investment adviser), and any entity controlling, controlled by, or under common control with the investment adviser that provides ongoing services to the registrant that were not pre-approved pursuant to paragraph (c)(7)(ii) of Rule 2-01 of Regulation S-X, is compatible with maintaining the principal accountant’s independence.
| Item 5. | Audit Committee of Listed Registrants. |
Not applicable.
| | (a) | The registrant’s “Schedule I – Investments in securities of unaffiliated issuers” (as set forth in 17 CFR 210.12-12) is included in Item 1 of this Form N-CSR. |
| Item 7. | Disclosure of Proxy Voting Policies and Procedures for Closed-End Management Investment Companies. |
Not applicable.
| Item 8. | Portfolio Managers of Closed-End Management Investment Companies. |
Not applicable.
| Item 9. | Purchases of Equity Securities by Closed-End Management Investment Company and Affiliated Purchasers. |
Not applicable.
| Item 10. | Submission of Matters to a Vote of Security Holders. |
There were no material changes to the procedures by which shareholders may recommend nominees to the registrant’s board of directors.
| Item 11. | Controls and Procedures. |
| | (a) | The registrant’s principal executive officer and principal financial officers, based on their evaluation of the registrant’s disclosure controls and procedures as of a date within 90 days of the filing of this report, have concluded that such controls and procedures are adequately designed to ensure that material information required to be disclosed by the registrant in Form N-CSR is accumulated and communicated to the registrant’s management, including the principal executive officer and principal financial officer, or persons performing similar functions, as appropriate to allow timely decisions regarding required disclosure. |
| | (b) | There was no change in the registrant’s internal control over financial reporting that occurred during the registrant’s second fiscal quarter of the period covered by this report that has materially affected, or is reasonably likely to materially affect, the registrant’s internal control over financial reporting. |
(a)(1) Code of ethics required to be disclosed under Item 2 of Form N-CSR attached hereto as Exhibit 99.CODE ETH.
(a)(2) Certifications pursuant to Rule 30a-2(a) under the Investment Company Act of 1940 (17 CFR 270.30a-2(a)) attached hereto as Exhibit 99.CERT.
(a)(3) Not applicable.
(b) Certification pursuant to Rule 30a-2(b) under the Investment Company Act of 1940 (17 CFR 270.30a-2(b)) attached hereto as Exhibit 99.906CERT.
SIGNATURES
Pursuant to the requirements of the Securities Exchange Act of 1934 and the Investment Company Act of 1940, the registrant has duly caused this report to be signed on its behalf by the undersigned, thereunto duly authorized.
| | |
| (registrant) | | Columbia Funds Series Trust |
| | |
| |
| By (Signature and Title) | | /s/ Christopher O. Petersen |
| | Christopher O. Petersen, President and Principal Executive Officer |
Pursuant to the requirements of the Securities Exchange Act of 1934 and the Investment Company Act of 1940, this report has been signed below by the following persons on behalf of the registrant and in the capacities and on the dates indicated.
| | |
| By (Signature and Title) | | /s/ Christopher O. Petersen |
| | Christopher O. Petersen, President and Principal Executive Officer |
| | |
| |
| By (Signature and Title) | | /s/ Michael G. Clarke |
| | Michael G. Clarke, Treasurer and Chief Financial Officer |