UNITED STATES
SECURITIES AND EXCHANGE COMMISSION
Washington, D.C. 20549
FORM N-CSR
CERTIFIED SHAREHOLDER REPORT OF REGISTERED MANAGEMENT INVESTMENT COMPANIES
Investment Company Act file number: 811-09721
PIMCO Managed Accounts Trust
(Exact name of registrant as specified in charter)
1633 Broadway, New York, NY 10019
(Address of principal executive offices)
William G. Galipeau
Treasurer (Principal Financial & Accounting Officer)
650 Newport Center Drive
Newport Beach, CA 92660
(Name and address of agent for service)
Copies to:
David C. Sullivan
Ropes & Gray LLP
Prudential Tower
800 Boylston Street
Boston, MA 02199
Registrant’s telephone number, including area code: (844) 337-4626
Date of fiscal year end: December 31
Date of reporting period: June 30, 2016
Form N-CSR is to be used by management investment companies to file reports with the Commission not later than 10 days after the transmission to stockholders of any report that is required to be transmitted to stockholders under Rule 30e-1 under the Investment Company Act of 1940 (17 CFR 270.30e-1). The Commission may use the information provided on Form N-CSR in its regulatory, disclosure review, inspection, and policymaking roles.
A registrant is required to disclose the information specified by Form N-CSR, and the Commission will make this information public. A registrant is not required to respond to the collection of information contained in Form N-CSR unless the Form displays a currently valid Office of Management and Budget (“OMB”) control number. Please direct comments concerning the accuracy of the information collection burden estimate and any suggestions for reducing the burden to Secretary, Securities and Exchange Commission, 450 Fifth Street, NW, Washington, DC 20549-0609. The OMB has reviewed this collection of information under the clearance requirements of 44 U.S.C. § 3507.
| Item 1. | Reports to Shareholders. |
The following is a copy of the report transmitted to shareholders pursuant to Rule 30e-1 under the Investment Company Act of 1940, as amended (the “1940 Act”) (17 CFR 270.30e-1).

PIMCO Managed Accounts Trust
Semiannual Report
June 30, 2016
Fixed Income SHares: Series C (“FISH: Series C”)
Fixed Income SHares: Series LD (“FISH: Series LD”)
Fixed Income SHares: Series M (“FISH: Series M”)
Fixed Income SHares: Series R (“FISH: Series R”)
Fixed Income SHares: Series TE (“FISH: Series TE”)

Table of Contents
Letter from the Chairman of the Board & President
Dear Shareholder,
The financial markets generated mixed results during the reporting period. Investor sentiment fluctuated as investors reacted to incoming economic data, shifting monetary policy, volatile commodity prices and numerous geopolitical issues.
Outside of the reporting period, PIMCO announced on July 19, 2016 that the firm’s Managing Directors have appointed Emmanuel (Manny) Roman as PIMCO’s next Chief Executive Officer. PIMCO’s current CEO Douglas Hodge will assume a new role as Managing Director and Senior Advisor when Mr. Roman joins PIMCO on November 1st. The announcement of Mr. Roman as PIMCO’s CEO is the culmination of a process undertaken by the firm to hire a senior executive who would add leadership and strategic insights combined with a deep appreciation of PIMCO’s diversified global businesses, investment process and focus on superior investment performance and client service. Mr. Roman’s appointment has the full support of the firm’s leadership including Mr. Hodge, PIMCO’s President Jay Jacobs, the firm’s Executive Committee and its Managing Directors. Mr. Roman has nearly 30 years of experience in the investment industry, with expertise in fixed income and proven executive leadership, most recently as CEO of Man Group PLC, one of the world’s largest publicly traded alternative asset managers and leader in liquid, high-alpha investment strategies.
For the six-month reporting period ended June 30, 2016
Despite a number of headwinds, the U.S. economy was resilient and continued to expand during the reporting period. That being said, the pace was far from robust. Looking back, U.S. gross domestic product (“GDP”), which represents the value of goods and services produced in the country, the broadest measure of economic activity and the principal indicator of economic performance, expanded at a revised 0.9% annual pace during the fourth quarter of 2015. Economic activity then decelerated, as GDP grew at a 0.8% annual pace during the first quarter of 2016. Finally, the Commerce Department’s initial reading — released after the reporting period had ended — showed that second quarter 2016 GDP grew at an annual pace of 1.2%.
At its meeting in December 2015, the Federal Reserve (“Fed”) took its initial step toward normalizing monetary policy. In particular, the Fed raised interest rates from a range between 0% and 0.25% to a range between 0.25% and 0.50%. However, since that time the Fed has remained on hold. In its official statement following the Fed’s June 2016 meeting it said, “The Committee expects that economic conditions will evolve in a manner that will warrant only gradual increases in the federal funds rate; the federal funds rate is likely to remain, for some time, below levels that are expected to prevail in the longer run.”
Economic activity outside the U.S. was mixed during the reporting period. In the eurozone, underlying economies gradually improved from low levels due to better domestic demand, while low inflation remained a concern. Against this backdrop, the European Central Bank (“ECB”) introduced additional easing measures, including the purchase of corporate bonds in an attempt to stimulate growth and spur inflation. The Bank of Japan also continued to pursue highly accommodative monetary policy. While the Bank of England kept rates on hold, British voters’ decision in June 2016 to leave the European Union (“Brexit”) led to speculation that the country’s central bank would lower rates in the near future. Elsewhere, economic activity in China moderated, which impacted growth in many emerging market economies.
| | | | | | |
| 2 | | PIMCO MANAGED ACCOUNTS TRUST | | | | |
The municipal bond market generated solid results during the six months ended June 30, 2016. Despite negative headlines from the likes of Puerto Rico and Chicago, the overall municipal market, as measured by the Barclays Municipal Bond Index, posted positive returns during all six months of the reporting period. The municipal market was supported by overall solid fundamentals, attractive valuations and generally strong investor demand. All told, the Barclays Municipal Bond Index gained 4.33% during the reporting period. In comparison, the overall taxable fixed income market, as measured by the Barclays U.S. Aggregate Bond Index, returned 5.31%.
Outlook
PIMCO’s baseline view is for a version of today’s status quo to continue and evolve gradually for the next three to five years. More specifically, PIMCO foresees U.S. GDP growth at or slightly above trend of 1.5% to 2% per year, inflation fluctuating around the 2% Fed’s target, the Fed gradually lifting the federal funds rate to the “New Neutral” range of 2% to 3% nominal and fiscal policy providing modest positive support to aggregate demand.
Overseas, PIMCO’s baseline view for the eurozone is for lackluster, trend-like growth between 1% and 1.5% per year, with inflation remaining somewhat below 2%. In terms of monetary policy, PIMCO sees the ECB continuing to do the heavy lifting and eventually even pursuing an extension of the quantitative easing (“QE”) program. PIMCO’s baseline view sees modest positive support for European growth from fiscal policy, over the next three to five years. Finally, for China, PIMCO’s baseline view is that of a managed slowdown, with growth between 5% and 6% and inflation around 2%.
In the following pages of this PIMCO Managed Accounts Trust Semiannual Report, please find specific details regarding investment performance and a discussion of factors that most affected the performance of the series of PIMCO Managed Accounts Trust over the six months ended June 30, 2016.
Thank you for investing with us. We value your trust and will continue to work diligently to meet your investment needs. We also invite you to visit our website at www.pimco.com/FISH to learn more about our views.
Sincerely,
| | |
 | |  |
| |
 | |  |
| Hans W. Kertess | | Peter G. Strelow |
| Chairman of the Board of Trustees | | President |
| | | | | | |
| | SEMIANNUAL REPORT | | JUNE 30, 2016 | | 3 |
Important Information About the Portfolios
We believe that bond funds have an important role to play in a well-diversified investment portfolio. It is important to note, however, that in an environment where interest rates trend upward, rising rates would negatively impact the performance of most bond funds, and fixed-income securities held by a Portfolio are likely to decrease in value. A number of factors can cause interest rates to rise (e.g., central bank monetary policies, inflation rates, general economic conditions, etc.). Accordingly, changes in interest rates can be sudden, and there is no guarantee that Portfolio Management will anticipate such movement.
As of the date of this report, interest rates in the U.S. are at or near historically low levels. As such, bond funds may currently face an increased exposure to the risks associated with rising interest rates. This is especially true since the Federal Reserve Board has concluded its quantitative easing program, and, at its meeting on December 16, 2015, raised interest rates for the first time since 2006 from a target range of 0% to 0.25% to a target range of 0.25% to 0.50%. Further, while the U.S. bond market has steadily grown over the past three decades, dealer inventories of corporate bonds have remained relatively stagnant. As a result, there has been a significant reduction in the ability of dealers to “make markets” in corporate bonds. All of the factors mentioned above, individually or collectively, could lead to increased volatility and/or lower liquidity in the fixed income markets, which could result in increased losses to a Portfolio. Bond funds and individual bonds with a longer duration (a measure of the sensitivity of a security’s price to changes in interest rates) tend to be more sensitive to changes in interest rates, usually making them more volatile than securities or funds with shorter durations.
The use of derivatives may subject the Portfolios to greater volatility than investments in traditional securities. The Portfolios may use derivative instruments for hedging purposes or as part of an investment strategy. Use of these instruments may involve certain costs and risks such as liquidity risk, interest rate risk, market risk, call risk, credit risk, management risk and the risk that a Portfolio could not close out a position when it would be most advantageous to do so. Certain derivative transactions may have a leveraging effect on a Portfolio. For example, a small investment in a derivative instrument may have a significant impact on a Portfolio’s exposure to interest rates, currency exchange rates or other investments. As a result, a relatively small price movement in a derivative instrument may cause an immediate and substantial loss or gain, which translates into heightened volatility in a Portfolio’s net asset value. A Portfolio may engage in such transactions regardless of whether the Portfolio owns the asset, instrument or components of the index underlying a derivative instrument. A Portfolio may invest a significant portion of its assets in these types of instruments. If it does, a Portfolio’s investment exposure could far exceed the value of its portfolio securities and its investment performance could be primarily dependent upon securities it does not directly own. Changes in regulation relating to a mutual fund’s use of derivatives and related instruments could potentially limit or impact a Portfolio’s ability to invest in derivatives, limit a Portfolio’s ability to employ certain strategies that use derivatives and adversely affect the value or performance of derivatives and a Portfolio. For instance, in December 2015, the SEC proposed new regulations applicable to a mutual fund’s use of derivatives and related instruments. If adopted as proposed, these regulations could significantly limit or impact a Portfolio’s ability to invest in derivatives and other instruments, limit a Portfolio’s ability to employ certain strategies that use derivatives and adversely affect a Portfolio’s performance, efficiency in implementing its strategy, liquidity and ability to pursue its investment objectives.
| | | | | | |
| 4 | | PIMCO MANAGED ACCOUNTS TRUST | | | | |
A Portfolio’s investments in and exposure to foreign securities involve special risks. For example, the value of these investments may decline in response to unfavorable political and legal developments, unreliable or untimely information or economic and financial instability. Foreign securities may experience more rapid and extreme changes in value than investments in securities of U.S. issuers. The securities markets of certain foreign countries are relatively small, with a limited number of companies representing a small number of industries. Issuers of foreign securities are usually not subject to the same degree of regulation as U.S. issuers. Reporting, accounting, auditing and custody standards of foreign countries differ, in some cases significantly, from U.S. standards. Also, nationalization, expropriation or other confiscation, currency blockage, political changes or diplomatic developments could adversely affect a Portfolio’s investments in foreign securities. In the event of nationalization, expropriation or other confiscation, a Portfolio could lose its entire investment in foreign securities. Risks associated with investing in foreign securities may be increased when a Portfolio invests in emerging markets. For example, if a Portfolio invests in emerging market debt, it may face increased exposure to interest rate, liquidity, volatility, and redemption risk due to the specific economic, political, geographical, or legal background of the emerging market issuer.
The geographical classification of foreign (non-U.S.) securities in this report are classified by the country of incorporation of a holding. In certain instances, a security’s country of incorporation may be different from its country of economic exposure.
Investments in loans are generally subject to risks similar to those of investments in other types of debt obligations, including, among others, credit risk, interest rate risk, variable and floating rate securities risk, and, as applicable, risks associated with mortgage-related securities. In addition, in many cases loans are subject to the risks associated with below-investment grade securities. In the case of a loan participation or assignment, a Portfolio generally has no right to enforce compliance with the terms of the loan agreement with the borrower. As a result, a Portfolio may be subject to the credit risk of both the borrower and the lender that is selling the loan agreement. In the event of the insolvency of the lender selling a loan participation, a Portfolio may be treated as a general creditor of the lender and may not benefit from any set-off between the lender and the borrower.
The Portfolios may be subject to heightened or additional risks and potential liabilities and costs by investing in mezzanine and other subordinated loans or acting as an originator of loans, including those arising under bankruptcy, fraudulent conveyance, equitable subordination, lender liability, environmental and other laws and regulations, and risks and costs associated with debt servicing and taking foreclosure actions associated with the loans. To the extent that a Portfolio originates a loan, it may be responsible for all or a substantial portion of the expenses associated with initiating the loan, irrespective of whether the loan transaction is ultimately consummated or closed. This may include significant legal and due diligence expenses, which will be indirectly borne by a Portfolio and its shareholders.
Mortgage-related and other asset-backed securities often involve risks that are different from or more acute than risks associated with other types of debt instruments. Generally, rising interest rates tend to extend the duration of fixed rate mortgage-related securities, making them more sensitive to changes in interest rates. As a result, in a period of rising interest rates, if a Portfolio holds mortgage-related securities, it may experience additional volatility since individual mortgage holders are less likely to exercise prepayment options, thereby putting additional downward pressure on the value of these securities and potentially causing the Portfolio to lose money. This is known as
| | | | | | |
| | SEMIANNUAL REPORT | | JUNE 30, 2016 | | 5 |
Important Information About the Portfolios (Cont.)
extension risk. Mortgage-backed securities can be highly sensitive to rising interest rates, such that even small movements can cause an investing Portfolio to lose value. Mortgage-backed securities, and in particular those not backed by a government guarantee, are subject to credit risk. In addition, adjustable and fixed rate mortgage-related securities are subject to prepayment risk. When interest rates decline, borrowers may pay off their mortgages sooner than expected. This can reduce the returns of the Portfolios because the Portfolios may have to reinvest that money at the lower prevailing interest rates. A Portfolio’s investments in other asset-backed securities are subject to risks similar to those associated with mortgage-related securities, as well as additional risks associated with the nature of the assets and the servicing of those assets. Payment of principal and interest on asset-backed securities may be largely dependent upon the cash flows generated by the assets backing the securities, and asset-backed securities may not have the benefit of any security interest in the related assets.
The Portfolios may invest in trust certificates issued in tender option bond programs. In a tender option bond transaction (“TOB”), a tender option bond trust (“TOB Trust”) issues floating rate certificates (“TOB Floater”) and residual interest certificates (“TOB Residual”) and utilizes the proceeds of such issuance to purchase a fixed-rate municipal bond (“Fixed Rate Bond”) that either is owned or identified by a Portfolio. The TOB Floater is generally issued to third party investors (typically a money market fund) and the TOB Residual is generally issued to the Portfolio that sold or identified the Fixed Rate Bond. The TOB Trust divides the income stream provided by the Fixed Rate Bond to create two securities, the TOB Floater, which is a short-term security, and the TOB Residual, which is a longer-term security. The interest rates payable on the TOB Residual issued to a Portfolio bear an inverse relationship to the interest rate on the TOB Floater. The interest rate on the TOB Floater is reset by a remarketing process typically every 7 to 35 days. After income is paid on the TOB Floater at current rates, the residual income from the Fixed Rate Bond goes to the TOB Residual. Therefore, rising short-term rates result in lower income for the TOB Residual, and vice versa. In the case of a TOB Trust that utilizes the cash received (less transaction expenses) from the issuance of the TOB Floater and TOB Residual to purchase the Fixed Rate Bond from a Portfolio, the Portfolio may then invest the cash received in additional securities, generating leverage for the Portfolio. The TOB Residual may be more volatile and less liquid than other municipal bonds of comparable maturity. In most circumstances the TOB Residual holder bears substantially all of the underlying Fixed Rate Bond’s downside investment risk and also benefits from any appreciation in the value of the underlying Fixed Rate Bond. Investments in a TOB Residual typically will involve greater risk than investments in Fixed Rate Bonds.
In December 2013, regulators finalized rules implementing Section 619 (the “Volcker Rule”) and Section 941 (the “Risk Retention Rules”) of the Dodd-Frank Wall Street Reform and Consumer Protection Act. The implementation of the final rules is being phased in. Both the Volcker Rule and the Risk Retention Rules apply to tender option bond programs and, when effective, will operate to require that such programs be restructured. In particular, these rules will preclude banking entities from (i) sponsoring or acquiring interests in the trusts used to hold a municipal bond in the creation of TOB Trusts; and (ii) continuing to service or maintain relationships with existing programs involving TOB Trusts to the same extent and in the same capacity as existing programs. At this time, the full impact of these rules is not certain; however, in response to these rules, industry participants are continuing to explore various structuring alternatives for tender option bond programs. Because of the important role that tender option bond programs play in the municipal bond market, it is
| | | | | | |
| 6 | | PIMCO MANAGED ACCOUNTS TRUST | | | | |
possible that implementation of these rules and any resulting impact may adversely impact the municipal bond market and the Portfolios. For example, as a result of the implementation of these rules, the municipal bond market may experience reduced demand or liquidity and increased financing costs.
High-yield bonds (commonly referred to as “junk bonds”) typically have a lower credit rating than other bonds. Lower-rated bonds generally involve a greater risk to principal than higher-rated bonds. Further, markets for lower-rated bonds are typically less liquid than for higher-rated bonds, and public information is usually less abundant in such markets. Thus, high yield investments increase the chance that a Portfolio will lose money on its investment. The Portfolios may also invest in bonds and other instruments that are not rated, but which PIMCO considers to be equivalent to high-yield investments. The Portfolios may hold defaulted securities that may involve special considerations including bankruptcy proceedings, other regulatory and legal restrictions affecting the Portfolio’s ability to trade, and the availability of prices from independent pricing services or dealer quotations. Defaulted securities are often illiquid and may not be actively traded. Sale of securities in bankrupt companies at an acceptable price may be difficult and differences compared to the value of the securities used by the Portfolios could be material.
Variable and floating rate securities generally are less sensitive to interest rate changes but may decline in value if their interest rates do not rise as much, or as quickly, as interest rates in general. Conversely floating rate securities will not generally increase in value if interest rates decline. Inverse floating rate securities may decrease in value if interest rates increase. Inverse floating rate securities may also exhibit greater price volatility than a fixed rate obligation with similar credit quality. When a Portfolio holds variable or floating rate securities, a decrease (or, in the case of inverse floating rate securities, an increase) in market interest rates will adversely affect the income received from such securities and the NAV of the Portfolios’ shares.
The global economic crisis brought several small economies in Europe to the brink of bankruptcy and many other economies into recession and weakened the banking and financial sectors of many European countries. For example, the governments of Greece, Spain, Portugal, and the Republic of Ireland have all experienced large public budget deficits, the effects of which are still yet unknown and may slow the overall recovery of the European economies from the global economic crisis. In addition, due to large public deficits, some European countries may be dependent on assistance from other European governments and institutions or other central banks or supranational agencies such as the International Monetary Fund. Assistance may be dependent on a country’s implementation of reforms or reaching a certain level of performance. Failure to reach those objectives or an insufficient level of assistance could result in a deep economic downturn which could significantly affect the value of a Portfolio’s European investments. It is possible that one or more Economic and Monetary Union of the European Union (“EMU”) member countries could abandon the euro and return to a national currency and/or that the euro will cease to exist as a single currency in its current form. The exit of any country out of the euro may have an extremely destabilizing effect on other eurozone countries and their economies and a negative effect on the global economy as a whole. Such an exit by one country may also increase the possibility that additional countries may exit the euro should they face similar financial difficulties. In June 2016, the United Kingdom approved a referendum to leave the EU. Significant uncertainty remains in the market regarding the ramifications of that development, and the range and potential implications of possible political, regulatory, economic and market outcomes are difficult to predict.
| | | | | | |
| | SEMIANNUAL REPORT | | JUNE 30, 2016 | | 7 |
Important Information About the Portfolios (Cont.)
The Portfolios may invest in securities and instruments that are economically tied to Russia. Investments in Russia are subject to various risks such as political, economic, legal, market and currency risks. The risks include uncertain political and economic policies, short-term market volatility, poor accounting standards, corruption and crime, an inadequate regulatory system, and unpredictable taxation. Investments in Russia are particularly subject to the risk that economic
sanctions may be imposed by the United States and/or other countries. Such sanctions — which may impact companies in many sectors, including energy, financial services and defense, among
others — may negatively impact the Portfolios’ performance and/or ability to achieve their investment objectives. The Russian securities market is characterized by limited volume of trading, resulting in difficulty in obtaining accurate prices. The Russian securities market, as compared to U.S. markets, has significant price volatility, less liquidity, a smaller market capitalization and a smaller number of traded securities. There may be little publicly available information about issuers. Settlement, clearing and registration of securities transactions are subject to risks because of registration systems that may not be subject to effective government supervision. This may result in significant delays or problems in registering the transfer of securities. Russian securities laws may not recognize foreign nominee accounts held with a custodian bank, and therefore the custodian may be considered the ultimate owner of securities they hold for their clients. Ownership of securities issued by Russian companies is recorded by companies themselves and by registrars instead of through a central registration system. It is possible that the ownership rights of the Portfolios could be lost through fraud or negligence. While applicable Russian regulations impose liability on registrars for losses resulting from their errors, it may be difficult for the Portfolios to enforce any rights they may have against the registrar or issuer of the securities in the event of loss of share registration. Adverse currency exchange rates are a risk and there may be a lack of available currency hedging instruments. Investments in Russia may be subject to the risk of nationalization or expropriation of assets. Oil, natural gas, metals, and timber account for a significant portion of Russia’s exports, leaving the country vulnerable to swings in world prices.
A Portfolio that invests in the municipal bond market is subject to certain risks. The amount of public information available about the municipal bonds held by a Portfolio is generally less than that for corporate equities or bonds, and the investment performance of the Portfolio may therefore be more dependent on the analytical abilities of PIMCO than would be a stock fund or taxable bond fund. The secondary market for municipal bonds, also tends to be less well-developed or liquid than many other securities markets, which may adversely affect a Portfolio’s ability to sell its bonds at attractive prices. The ability of municipal issuers to make timely payments of interest and principal may be diminished during general economic downturns and as governmental cost burdens are reallocated among federal, state and local governments. In addition, laws enacted in the future by Congress or state legislatures or referenda could extend the time for payment of principal and/or interest, or impose other constraints on enforcement of such obligations, or on the ability of municipal issuers to levy taxes. Issuers of municipal securities might seek protection under the bankruptcy laws. In the event of bankruptcy of such an issuer, a Portfolio investing in the issuer’s securities could experience delays in collecting principal and interest and the Portfolio may not, in all circumstances, be able to collect all principal and interest to which it is entitled. To enforce its rights in the event of a default in the payment of interest or repayment of principal, or both, a Portfolio may, in some instances, take possession of, and manage, the assets securing the issuer’s obligations on such securities, which may increase the Portfolio’s operating expenses. Any income derived from the Portfolio’s ownership or
| | | | | | |
| 8 | | PIMCO MANAGED ACCOUNTS TRUST | | | | |
operation of such assets may not be tax-exempt. More generally, the Portfolios other than FISH:
Series TE do not expect to be eligible to pass through to shareholders the tax-exempt character of interest earned on municipal bonds.
A Portfolio that concentrates its investments in California municipal bonds may be affected significantly by economic, regulatory or political developments affecting the ability of California issuers to pay interest or repay principal. Certain issuers of California municipal bonds have experienced serious financial difficulties in the past and reoccurrence of these difficulties may impair the ability of certain California issuers to pay principal or interest on their obligations. Provisions of the California Constitution and State statutes that limit the taxing and spending authority of California governmental entities may impair the ability of California issuers to pay principal and/or interest on their obligations. While California’s economy is broad, it does have major concentrations in high technology, aerospace and defense-related manufacturing, trade, entertainment, real estate and financial services, and may be sensitive to economic problems affecting those industries. Future California political and economic developments, constitutional amendments, legislative measures, executive orders, administrative regulations, litigation and voter initiatives could have an adverse effect on the debt obligations of California issuers.
A Portfolio that concentrates its investments in New York municipal bonds may be affected significantly by economic, regulatory or political developments affecting the ability of New York issuers to pay interest or repay principal. While New York’s economy is broad, it does have concentrations in the financial services industry, and may be sensitive to economic problems affecting that industry. Certain issuers of New York municipal bonds have experienced serious financial difficulties in the past and a reoccurrence of these difficulties may impair the ability of certain New York issuers to pay principal or interest on their obligations. The financial health of New York City affects that of the State, and when New York City experiences financial difficulty it may have an adverse effect on New York municipal bonds held by a Portfolio. The growth rate of New York has at times been somewhat slower than the nation overall. The economic and financial condition of New York also may be affected by various financial, social, economic and political factors.
As the use of technology has become more prevalent in the course of business, the Portfolios have become potentially more susceptible to operational risks through breaches in cyber security. A breach in cyber security refers to both intentional and unintentional cyber events that may cause a Portfolio to lose proprietary information, suffer data corruption, or lose operational capacity. Cyber security breaches may involve unauthorized access to a Portfolio’s digital information systems (e.g., through “hacking” or malicious software coding), but may also result from outside attacks such as denial-of-service attacks (i.e., efforts to make network services unavailable to intended users). In addition, cyber security breaches of a Portfolio’s third party service providers (including but not limited to advisers, sub-advisers, administrators, transfer agents, custodians, distributors and other third parties) or issuers that a Portfolio invests in can also subject a Portfolio to many of the same risks associated with direct cyber security breaches. Cyber security failures or breaches may result in financial losses to a Portfolio and its shareholders. These failures or breaches may also result in disruptions to business operations, potentially resulting in financial losses; interference with a Portfolio’s ability to calculate its net asset value, process shareholder transactions or otherwise transact business with shareholders; impediments to trading; violations of applicable privacy and
| | | | | | |
| | SEMIANNUAL REPORT | | JUNE 30, 2016 | | 9 |
Important Information About the Portfolios (Cont.)
other laws; regulatory fines; penalties; reputational damage; reimbursement or other compensation costs; or additional compliance costs. In addition, substantial costs may be incurred in order to prevent any cyber incidents in the future. Like with operational risk in general, the Portfolios have established risk management systems designed to reduce the risks associated with cyber security. However, there is no guarantee that such efforts will succeed, especially since the Portfolios do not directly control the cyber security systems of issuers or third party service providers. The Portfolios and their shareholders could be negatively impacted as a result.
The Portfolios may be subject to various risks in addition to those described above. Some of these risks may include, but are not limited to, the following: credit risk, currency risk, focused-investment risk, interest rate risk, issuer-non-diversification risk, sovereign debt risk, issuer risk, leveraging risk, liquidity risk, management risk, market risk, municipal project-specific risk, municipal securities risk, and turnover risk. A description of certain of these risks is available in the Notes to Financial Statements of this Report.
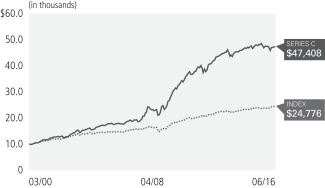
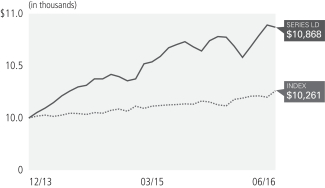
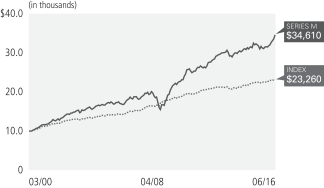
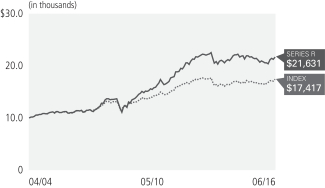
On each Portfolio Summary page in this Shareholder Report the Average Annual Total Return table and Cumulative Returns chart measure performance assuming that all dividend and capital gain distributions were reinvested. Returns do not reflect the deduction of taxes that a shareholder would pay on (i) Portfolio distributions or (ii) the redemption of Portfolio shares. Performance shown is net of fees and expenses. The figures in the line graph are calculated at net asset value and assume the investment of $10,000 at the end of the month that a Portfolio commenced operations. Each Portfolio measures its performance against a broad-based securities market index (“benchmark index”). Each benchmark index does not take into account fees, expenses or taxes.
The following table discloses the commencement of operations and diversification status of each Portfolio:
| | | | | | | | | | |
| Portfolio Name | | | | | Commencement
of Operations | | | Diversification
Status |
| Fixed Income SHares: Series C | | | | | | | 03/17/00 | | | Diversified |
| Fixed Income SHares: Series LD | | | | | | | 12/20/13 | | | Diversified |
| Fixed Income SHares: Series M | | | | | | | 03/17/00 | | | Diversified |
| Fixed Income SHares: Series R | | | | | | | 04/15/04 | | | Diversified |
| Fixed Income SHares: Series TE | | | | | | | 06/25/12 | | | Non-Diversified |
The Trustees are responsible generally for overseeing the management of the Trust. The Trustees authorize the Trust to enter into service agreements with PIMCO as the Investment Adviser and Administrator, PIMCO Investments LLC and other service providers in order to provide, and in some cases authorize service providers to procure through other parties, necessary or desirable services on behalf of the Trust and the Portfolios. Shareholders are not parties to or third-party beneficiaries of such service agreements. Neither a Portfolio’s prospectus nor summary prospectus, the Trust’s Statement of Additional Information (SAI), any contracts filed as exhibits to the Trust’s registration statement, nor any other communications, disclosure documents or regulatory filings (including this report) from or on behalf of the Trust or a Portfolio creates a contract between or among any shareholder of a Portfolio, on the one hand, and the Trust, a Portfolio, a service provider to the Trust or a Portfolio, and/or the Trustees or officers of the Trust, on the other hand. The Trustees (or the Trust and its officers, service providers or other delegates acting under authority of the Trustees) may
| | | | | | |
| 10 | | PIMCO MANAGED ACCOUNTS TRUST | | | | |
amend its most recent or use a new prospectus, summary prospectus or SAI with respect to a Portfolio or the Trust, and/or amend, file and/or issue any other communications, disclosure documents or regulatory filings, and may amend or enter into any contracts to which the Trust or a Portfolio is a party, and interpret the investment objective(s), policies, restrictions and contractual provisions applicable to any Portfolio, without shareholder input or approval, except in circumstances in which shareholder approval is specifically required by law (such as changes to fundamental investment policies) or where a shareholder approval requirement is specifically disclosed in the Trust’s then-current prospectus or SAI.
An investment in a Portfolio is not a deposit of a bank and is not guaranteed or insured by the Federal Deposit Insurance Corporation or any other government agency. It is possible to lose money on investments in the Portfolios.
PIMCO has adopted written proxy voting policies and procedures (“Proxy Policy”) as required by Rule 206(4)-6 under the Investment Advisers Act of 1940. The Proxy Policy has been adopted by the Portfolios as the policies and procedures that PIMCO will use when voting proxies on behalf of the Portfolios. A description of the policies and procedures that PIMCO uses to vote proxies relating to portfolio securities of each Portfolio, and information about how each Portfolio voted proxies relating to portfolio securities held during the most recent twelve-month period ended June 30, are available without charge, upon request, by calling the Portfolios at (800) 927-4648, on the Portfolios’ website at www.pimco.com/ FISH, and on the Securities and Exchange Commission’s (“SEC”) website at http://www.sec.gov.
Each Portfolio files a complete schedule of its portfolio holdings with the SEC for the first and third quarters of its fiscal year on Form N-Q. A copy of each Portfolio’s Form N-Q is available on the SEC’s website at http://www.sec.gov and may be reviewed and copied at the SEC’s Public Reference Room in Washington, D.C., and is available without charge, upon request by calling the Portfolios at (800) 927-4648, on the Portfolios’ website at www.pimco.com/FISH. Information on the operation of the Public Reference Room may be obtained by calling 1-800-SEC-0330.
| | | | | | |
| | SEMIANNUAL REPORT | | JUNE 30, 2016 | | 11 |
| | |
| Fixed Income SHares: Series C | | FXICX |
Cumulative Returns Through June 30, 2016
| | | | |
| Allocation Breakdown† | | | |
| |
| Corporate Bonds & Notes | | | 40.0% | |
| U.S. Treasury Obligations | | | 28.8% | |
| U.S. Government Agencies | | | 19.5% | |
| Non-Agency Mortgage-Backed Securities | | | 4.9% | |
| Short-Term Instruments | | | 0.2% | |
| Other | | | 6.6% | |
| † | | % of Investments, at value as of 06/30/2016. Financial derivative instruments, if any, are excluded. |
| | | | | | | | | | | | | | | | | | | | | | |
| Average Annual Total Return for the period ended June 30, 2016 | |
| | | | | 6 Month* | | | 1 Year | | | 5 Year | | | 10 Year | | | Commencement
of Operations
(03/17/00) | |
 | | Fixed Income SHares: Series C | | | (0.13)% | | | | (1.55)% | | | | 3.83% | | | | 10.39% | | | | 10.06% | |

| | Barclays U.S. Credit Intermediate Index | | | 4.88% | | | | 4.97% | | | | 3.96% | | | | 5.38% | | | | 5.74%** | |
* Cumulative Return
** Average Annual Return since 3/31/00
All Portfolio returns are net of fees and expenses.
Performance quoted represents past performance. Past performance is not a guarantee or a reliable indicator of future results. Current performance may be lower or higher than performance shown. Investment return and the principal value of an investment will fluctuate. Returns presented do not reflect the deduction of taxes that a shareholder would pay on portfolio distribution or the redemption of portfolio shares or the deduction of any fees charged to investors at the “wrap account” level. The Portfolio’s total annual operating expense ratio as stated in the Portfolio’s current prospectus, as supplemented to date, is 0.03%.
| | | | | | |
| 12 | | PIMCO MANAGED ACCOUNTS TRUST | | | | |
Investment Objective and Strategy Overview
| » | | The Portfolio seeks maximum total return, consistent with preservation of capital and prudent investment management. |
Portfolio Insights
Following are key factors impacting the Portfolio’s performance during the reporting period:
| » | | An underweight to investment grade corporate bonds, particularly industrials and utilities, detracted from performance, as the sectors outperformed like-duration Treasuries, as measured by the Barclays U.S. Credit Index. |
| » | | An underweight to the investment grade credit financial sector contributed to returns, as the sector underperformed like-duration Treasuries. |
| » | | Currency positioning, particularly a long U.S. dollar strategy versus the Japanese yen, detracted from performance, while an exposure to the Russian ruble was positive for performance. |
| » | | Exposure to local Mexican rates was positive for performance. |
| » | | U.S. interest rate exposure, as well as yield curve positioning, were negative for returns. Specifically, short positions in the intermediate part of the curve detracted from results, as the 10-year Treasury yield fell 75 basis points. |
| » | | An allocation to external emerging market sovereign debt was positive for performance, particularly Brazilian debt. |
| | | | | | |
| | SEMIANNUAL REPORT | | JUNE 30, 2016 | | 13 |
| | |
| Fixed Income SHares: Series LD | | FXIDX |
Cumulative Returns Through June 30, 2016
| | | | |
| Allocation Breakdown† | | | |
| |
| Corporate Bonds & Notes | | | 67.9% | |
| Non-Agency Mortgage-Backed Securities | | | 11.9% | |
| Asset-Backed Securities | | | 8.7% | |
| U.S. Treasury Obligations | | | 8.5% | |
| Short-Term Instruments | | | 0.4% | |
| Other | | | 2.6% | |
| † | | % of Investments, at value as of 06/30/2016. Financial derivative instruments, if any, are excluded. |
| | | | | | | | | | | | | | |
| Average Annual Total Return for the period ended June 30, 2016 | |
| | | | | 6 Month* | | | 1 Year | | | Commencement
of Operations
(12/20/13) | |
| | Fixed Income SHares: Series LD | | | 0.88% | | | | 1.54% | | | | 3.32% | |
| | BofA Merrill Lynch 1-3 Year U.S. Treasury Index | | | 1.43% | | | | 1.31% | | | | 1.02% | |
* Cumulative Return
All Portfolio returns are net of fees and expenses.
Performance quoted represents past performance. Past performance is not a guarantee or a reliable indicator of future results. Current performance may be lower or higher than performance shown. Investment return and the principal value of an investment will fluctuate. Returns presented do not reflect the deduction of taxes that a shareholder would pay on portfolio distribution or the redemption of portfolio shares or the deduction of any fees charged to investors at the “wrap account” level. The Portfolio’s total annual operating expense ratio as stated in the Portfolio’s current prospectus, as supplemented to date, is 0.24%.
| | | | | | |
| 14 | | PIMCO MANAGED ACCOUNTS TRUST | | | | |
Investment Objective and Strategy Overview
| » | | The Portfolio seeks maximum total return, consistent with preservation of capital and prudent investment management. |
Portfolio Insights
Following are key factors impacting the Portfolio’s performance during the reporting period:
| » | | An overweight to investment grade corporate bonds, particularly industrials and utilities, added to performance, as the sectors outperformed like-duration Treasuries, as measured by the Barclays U.S. Credit Index. |
| » | | Security selection of U.S. high yield corporate bonds and an allocation to external emerging market Brazilian sovereign debt were positive for performance. |
| » | | Currency positioning was negative for performance, specifically shorts to the euro and Japanese yen, as both currencies strengthened against the U.S. dollar. |
| » | | U.S. interest rate exposure, as well as yield curve positioning, were negative for returns. Specifically, short positions in the front and intermediate part of the curve detracted from results, as the 3-year and 10-year Treasury yield fell 60 and 75 basis points, respectively. |
| » | | Exposure to Australian rates added to performance, as their yields fell across the curve. |
| | | | | | |
| | SEMIANNUAL REPORT | | JUNE 30, 2016 | | 15 |
| | |
| Fixed Income SHares: Series M | | FXIMX |
Cumulative Returns Through June 30, 2016
| | | | |
| Allocation Breakdown† | | | |
| |
| U.S. Government Agencies | | | 24.9% | |
| Corporate Bonds & Notes | | | 22.8% | |
| U.S. Treasury Obligations | | | 21.5% | |
| Municipal Bonds & Notes | | | 15.0% | |
| Non-Agency Mortgage-Backed Securities | | | 8.1% | |
| Asset-Backed Securities | | | 7.0% | |
| Short-Term Instruments | | | 0.6% | |
| Sovereign Issues | | | 0.1% | |
| † | | % of Investments, at value as of 06/30/2016. Financial derivative instruments, if any, are excluded. |
| | | | | | | | | | | | | | | | | | | | | | |
| Average Annual Total Return for the period ended June 30, 2016 | |
| | | | | 6 Month* | | | 1 Year | | | 5 Year | | | 10 Year | | | Commencement
of Operations
(03/17/00) | |
| | Fixed Income SHares: Series M | | | 9.91% | | | | 11.61% | | | | 5.68% | | | | 7.49% | | | | 7.97% | |
| | Barclays U.S. MBS Fixed Rate Index | | | 3.11% | | | | 4.36% | | | | 3.02% | | | | 5.00% | | | | 5.33%** | |
* Cumulative Return
** Average Annual Return since 3/31/00
All Portfolio returns are net of fees and expenses.
Performance quoted represents past performance. Past performance is not a guarantee or a reliable indicator of future results. Current performance may be lower or higher than performance shown. Investment return and the principal value of an investment will fluctuate. Returns presented do not reflect the deduction of taxes that a shareholder would pay on portfolio distribution or the redemption of portfolio shares or the deduction of any fees charged to investors at the “wrap account” level. The Portfolio’s total annual operating expense ratio as stated in the Portfolio’s current prospectus, as supplemented to date, is 0.06%.
| | | | | | |
| 16 | | PIMCO MANAGED ACCOUNTS TRUST | | | | |
Investment Objective and Strategy Overview
| » | | The Portfolio seeks maximum total return, consistent with preservation of capital and prudent investment management. |
Portfolio Insights
Following are key factors impacting the Portfolio’s performance during the reporting period:
| » | | Curve positioning, particularly an overweight to the long end of the yield curve, was additive to performance, as the 30-year Treasury yield fell 68 basis points. |
| » | | Security selection of U.S. high yield corporate bonds, an allocation to external emerging market Brazilian sovereign debt and security selection of municipal bonds were positive for performance. |
| » | | An allocation to agency mortgage-backed securities contributed to performance. |
| » | | Exposure to German rates was positive for performance, as their yields fell. |
| » | | A short to U.K. rates was negative for performance, as their yields fell. |
| » | | A short to a basket of Asian currencies was negative for performance. |
| | | | | | |
| | SEMIANNUAL REPORT | | JUNE 30, 2016 | | 17 |
| | |
| Fixed Income SHares: Series R | | FXIRX |
Cumulative Returns Through June 30, 2016
| | | | |
| Allocation Breakdown† | | | |
| |
| U.S. Treasury Obligations | | | 59.2% | |
| Sovereign Issues | | | 13.2% | |
| U.S. Government Agencies | | | 10.3% | |
| Corporate Bonds & Notes | | | 9.1% | |
| Short-Term Instruments | | | 1.7% | |
| Other | | | 6.5% | |
| † | | % of Investments, at value as of 06/30/2016. Financial derivative instruments, if any, are excluded. |
| | | | | | | | | | | | | | | | | | | | | | |
| Average Annual Total Return for the period ended June 30, 2016 | |
| | | | | 6 Month* | | | 1 Year | | | 5 Year | | | 10 Year | | | Commencement
of Operations
(04/15/04) | |
| | Fixed Income SHares: Series R | | | 5.37% | | | | 1.45% | | | | 3.85% | | | | 6.99% | | | | 6.50% | |
| | Barclays U.S. TIPS Index | | | 6.24% | | | | 4.35% | | | | 2.63% | | | | 4.75% | | | | 4.66%** | |
* Cumulative Return
** Average Annual Return since 4/30/04
All Portfolio returns are net of fees and expenses.
Performance quoted represents past performance. Past performance is not a guarantee or a reliable indicator of future results. Current performance may be lower or higher than performance shown. Investment return and the principal value of an investment will fluctuate. Returns presented do not reflect the deduction of taxes that a shareholder would pay on portfolio distribution or the redemption of portfolio shares or the deduction of any fees charged to investors at the “wrap account” level. The Portfolio’s total annual operating expense ratio as stated in the Portfolio’s current prospectus, as supplemented to date, is 0.16%.
| | | | | | |
| 18 | | PIMCO MANAGED ACCOUNTS TRUST | | | | |
Investment Objective and Strategy Overview
| » | | The Portfolio seeks maximum real return, consistent with preservation of real capital and prudent investment management. |
Portfolio Insights
Following are key factors impacting the Portfolio’s performance during the reporting period:
| » | | An underweight to the intermediate part of the U.S. yield curve detracted from relative performance, as the 10-year Treasury yield fell 75 basis points. |
| » | | Short exposure to nominal interest rates in Germany detracted from performance, as rates fell. |
| » | | Selection of U.S. Treasury Inflation-Protected Securities added to performance, as breakevens fell in the intermediate and long parts of the maturity curve. |
| » | | Exposure to local emerging market duration, particularly Mexican inflation-linked bonds, contributed to performance. Similarly, exposure to inflation-linked bonds in New Zealand and Denmark benefited relative performance. |
| » | | An allocation to external emerging market sovereign debt was positive for performance, particularly Brazilian debt. |
| » | | Tactical exposure to a basket of local emerging market currencies, as well as long U.S. dollar strategies against the euro and Japanese yen, were overall neutral for performance. |
| | | | | | |
| | SEMIANNUAL REPORT | | JUNE 30, 2016 | | 19 |
| | |
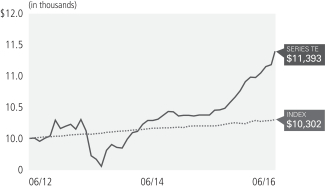
| Fixed Income SHares: Series TE | | FXIEX |
Cumulative Returns Through June 30, 2016
| | | | |
| Allocation Breakdown† | | | |
| |
| Municipal Bonds & Notes | | | 91.0% | |
| Short-Term Instruments | | | 9.0% | |
| † | | % of Investments, at value as of 06/30/2016. Financial derivative instruments, if any, are excluded. |
| | | | | | | | | | | | | | |
| Average Annual Total Return for the period ended June 30, 2016 | |
| | | | | 6 Month* | | | 1 Year | | | Commencement
of Operations
(06/25/12) | |
| | Fixed Income SHares: Series TE | | | 4.48% | | | | 9.05% | | | | 3.30% | |
| | Barclays 1-Year Municipal Bond Index | | | 0.66% | | | | 1.05% | | | | 0.74% | |
* Cumulative Return
All Portfolio returns are net of fees and expenses.
Performance quoted represents past performance. Past performance is not a guarantee or a reliable indicator of future results. Current performance may be lower or higher than performance shown. Investment return and the principal value of an investment will fluctuate. Returns presented do not reflect the deduction of taxes that a shareholder would pay on portfolio distribution or the redemption of portfolio shares or the deduction of any fees charged to investors at the “wrap account” level. The Portfolio’s total annual operating expense ratio as stated in the Portfolio’s current prospectus, as supplemented to date, is 0.00%.
| | | | | | |
| 20 | | PIMCO MANAGED ACCOUNTS TRUST | | | | |
Investment Objective and Strategy Overview
| » | | The Portfolio seeks high current income exempt from U.S. federal income tax consistent with prudent investment management. Total return/capital appreciation is a secondary objective. |
Portfolio Insights
Following are key factors impacting the Portfolio’s performance during the reporting period:
| » | | An overweight to revenue-backed bonds contributed to results, as they outperformed the broader municipal market. |
| » | | Within the revenue-backed sector, overweights to transportation, special tax and hospital municipal bonds were positive for returns, as they all outperformed the broader municipal market. |
| » | | An underweight to the front and long ends of the nominal Treasury yield curve were negative for performance as 3- and 30-year Treasury yields fell 60 and 68 basis points, respectively. |
| » | | An overweight to general obligation bonds detracted from performance, as they underperformed the broader municipal market. |
| | | | | | |
| | SEMIANNUAL REPORT | | JUNE 30, 2016 | | 21 |
Expense Examples
Example
As a shareholder of a Portfolio, you incur two types of costs: (1) transaction costs and (2) ongoing costs, including management fees, distribution and/or service (12b-1) fees (if applicable), and other Portfolio expenses. The Example is intended to help you understand your ongoing costs (in dollars) of investing in the Portfolio and to compare these costs with the ongoing costs of investing in other mutual funds.
The Example is based on an investment of $1,000 invested at the beginning of the period and held for the entire period indicated, which for all Portfolios is from January 1, 2016 to June 30, 2016 unless noted otherwise in the table and footnotes below.
Actual Expenses
The information in the table under the heading “Actual” provides information about actual account values and actual expenses. You may use the information in these rows, together with the amount you invested, to estimate the expenses that you paid over the period. Simply divide your account value by $1,000 (for example, an $8,600 account value divided by $1,000 = 8.60), then multiply the result by the number in the appropriate row for your Portfolio in the column titled “Expenses Paid During Period” to estimate the expenses you paid on your account during this period.
Hypothetical Example for Comparison Purposes
The information in the table under the heading “Hypothetical (5% return before expenses)” provides information about hypothetical account values and hypothetical expenses based on a Portfolio’s actual expense ratio and an assumed rate of return of 5% per year before expenses, which is not the Portfolio’s actual return. The hypothetical account values and expenses may not be used to estimate the actual ending account balance or expenses you paid for the period. You may use this information to compare the ongoing costs of investing in a Portfolio and other funds. To do so, compare this 5% hypothetical example with the 5% hypothetical examples that appear in the shareholder reports of the other funds.
Please note that the expenses shown in the table are meant to highlight your ongoing costs only and do not reflect any transactional costs. Therefore, the information under the heading “Hypothetical (5% return before expenses)” is useful in comparing ongoing costs only, and will not help you determine the relative total costs of owning different funds. In addition, if these transactional costs were included, your costs would have been higher.
Expense ratios may vary period to period because of various factors, such as an increase in expenses that are not covered by the management fees such as fees and expenses of the independent trustees and their counsel, extraordinary expenses and interest expense.
| | | | | | | | | | | | | | | | | | | | | | | | | | | | | | | | | | | | | | | | |
| | | | | | Actual | | | | | | Hypothetical
(5% return before expenses) | | | | | | | |
| | | | | | Beginning
Account Value
(01/01/16) | | | Ending
Account Value
(06/30/16) | | | Expenses Paid
During Period* | | | | | | Beginning
Account Value
(01/01/16) | | | Ending
Account Value
(06/30/16) | | | Expenses Paid
During Period* | | | | | | Net Annualized
Expense Ratio** | |
Series C | | | | | | $ | 1,000.00 | | | $ | 998.70 | | | $ | 0.30 | | | | | | | $ | 1,000.00 | | | $ | 1,024.22 | | | $ | 0.31 | | | | | | | | 0.06 | % |
Series LD | | | | | | | 1,000.00 | | | | 1,008.80 | | | | 2.51 | | | | | | | | 1,000.00 | | | | 1,022.02 | | | | 2.53 | | | | | | | | 0.51 | |
Series M | | | | | | | 1,000.00 | | | | 1,099.10 | | | | 0.93 | | | | | | | | 1,000.00 | | | | 1,023.64 | | | | 0.89 | | | | | | | | 0.18 | |
Series R | | | | | | | 1,000.00 | | | | 1,053.70 | | | | 2.12 | | | | | | | | 1,000.00 | | | | 1,022.46 | | | | 2.08 | | | | | | | | 0.42 | |
Series TE | | | | | | | 1,000.00 | | | | 1,044.80 | | | | 0.00 | | | | | | | | 1,000.00 | | | | 1,024.52 | | | | 0.00 | | | | | | | | 0.00 | |
* Expenses Paid During Period are equal to the net annualized expense ratio for the Portfolio, multiplied by the average account value over the period, multiplied by 179/366 (to reflect the one-half year period).
** Net Annualized Expense Ratio is reflective of any applicable expense limitations and/or expense reimbursements. Details regarding fee waivers can be found in Note 8 in the Notes to Financial Statements.
| | | | | | |
| 22 | | PIMCO MANAGED ACCOUNTS TRUST | | | | |
Benchmark Descriptions
| | |
| Index | | Description |
| |
| Barclays U.S. Credit Intermediate Index | | The Barclays U.S. Credit Intermediate Index is an unmanaged index of publicly issued U.S. corporate and specified foreign debentures and secured notes with intermediate maturities ranging from 1 to 10 years. To qualify, bonds must be SEC-registered. Securities must also meet specific liquidity and quality requirements. |
| |
| Barclays U.S. MBS Fixed-Rate Index | | Barclays U.S. MBS Fixed Rate Index is an unmanaged index of mortgage-backed pass-through securities of Ginnie Mae (GNMA), Fannie Mae (FNMA), and Freddie Mac (FHLMC). The MBS Index is formed by grouping the universe of over 600,000 individual fixed rate MBS pools into approximately 3,500 generic aggregates. |
| |
| Barclays U.S. TIPS Index | | Barclays U.S. TIPS Index is an unmanaged index comprised of all U.S. Treasury Inflation-Protected Securities rated investment grade (Baa3 or better), have at least one year to final maturity, and at least $250 million par amount outstanding. |
| |
| Barclays 1-Year Municipal Bond Index | | The Barclays 1-Year Municipal Bond Index is the 1 Year (1-2) component of the Municipal Bond Index. The Index is a rules- based, market-value-weighted index engineered for the long term tax-exempt bond market. To be included in the Index, bonds must be rated investment-grade (Baa3/BBB- or higher) by at least two of the following ratings agencies: Moody’s, S&P and Fitch. If only two of the three agencies rate the security, the lower rating is used to determine index eligibility. If only one of the three agencies rates a security, the rating must be investment-grade. They must have an outstanding par value of at least $7 million and be issued as part of a transaction of at least $75 million. The bonds must be fixed rate, have a dated-date after December 31, 1990, and must be at least one year from their maturity date. Remarketed issues, taxable municipal bonds, bonds with floating rates, and derivatives, are excluded from the benchmark. |
| |
| BofA Merrill Lynch 1-3 Year U.S. Treasury Index | | The BofA Merrill Lynch 1-3 Year U.S. Treasury Index is an unmanaged index comprised of U.S. Treasury securities, other than inflation-protection securities and STRIPS, with at least $1 billion in outstanding face value and a remaining term to final maturity of at least one year and less than three years. |
| | | | | | |
| | SEMIANNUAL REPORT | | JUNE 30, 2016 | | 23 |
Financial Highlights
| | | | | | | | | | | | | | | | | | | | | | | | | | | | |
Selected Per Share Data for
the Year or Period Ended: | |
Net Asset
Value
Beginning
of Year
or Period | | | Net
Investment
Income(a) | | | Net Realized/
Unrealized
Gain (Loss) | | | Total
from
Investment
Operations | | | Dividends
from Net
Investment
Income | | | Distributions
from Net
Realized
Capital Gains | | | Tax Basis
Return of
Capital | |
Series C | | | | | | | | | | | | | | | | | | | | | | | | | | | | |
01/01/2016 - 06/30/2016+ | | $ | 10.42 | | | $ | 0.21 | | | $ | (0.23 | ) | | $ | (0.02 | ) | | $ | (0.22 | ) | | $ | 0.00 | | | $ | 0.00 | |
11/01/2015 - 12/31/2015(e) | | | 11.20 | | | | 0.09 | | | | (0.11 | ) | | | (0.02 | ) | | | (0.76 | ) | | | 0.00 | | | | 0.00 | |
10/31/2015 | | | 12.29 | | | | 0.53 | | | | (0.48 | ) | | | 0.05 | | | | (0.56 | ) | | | (0.58 | ) | | | 0.00 | |
10/31/2014 | | | 13.11 | | | | 0.51 | | | | 0.05 | | | | 0.56 | | | | (0.55 | ) | | | (0.83 | ) | | | 0.00 | |
10/31/2013 | | | 13.75 | | | | 0.60 | | | | (0.24 | ) | | | 0.36 | | | | (0.90 | ) | | | (0.10 | ) | | | 0.00 | |
10/31/2012 | | | 12.71 | | | | 0.65 | | | | 1.06 | | | | 1.71 | | | | (0.67 | ) | | | 0.00 | | | | 0.00 | |
10/31/2011 | | | 14.05 | | | | 0.78 | | | | (0.46 | ) | | | 0.32 | | | | (1.25 | ) | | | (0.41 | ) | | | 0.00 | |
| | | | | | | |
Series LD | | | | | | | | | | | | | | | | | | | | | | | | | | | | |
01/01/2016 - 06/30/2016+ | | $ | 9.83 | | | $ | 0.18 | | | $ | (0.10 | ) | | $ | 0.08 | | | $ | (0.20 | ) | | $ | 0.00 | | | $ | 0.00 | |
11/01/2015 - 12/31/2015(e) | | | 10.02 | | | | 0.06 | | | | (0.03 | ) | | | 0.03 | | | | (0.10 | ) | | | (0.12 | ) | | | 0.00 | |
10/31/2015 | | | 10.20 | | | | 0.31 | | | | 0.00 | | | | 0.31 | | | | (0.38 | ) | | | (0.11 | ) | | | 0.00 | |
12/20/2013 - 10/31/2014 | | | 10.00 | | | | 0.19 | | | | 0.22 | | | | 0.41 | | | | (0.21 | ) | | | 0.00 | | | | 0.00 | |
| | | | | | | |
Series M | | | | | | | | | | | | | | | | | | | | | | | | | | | | |
01/01/2016 - 06/30/2016+ | | $ | 9.87 | | | $ | 0.30 | | | $ | 0.67 | | | $ | 0.97 | | | $ | (0.24 | ) | | $ | 0.00 | | | $ | 0.00 | |
11/01/2015 - 12/31/2015(e) | | | 10.06 | | | | 0.10 | | | | (0.11 | ) | | | (0.01 | ) | | | (0.18 | ) | | | 0.00 | | | | 0.00 | |
10/31/2015 | | | 10.78 | | | | 0.50 | | | | (0.45 | ) | | | 0.05 | | | | (0.50 | ) | | | (0.27 | ) | | | 0.00 | |
10/31/2014 | | | 10.86 | | | | 0.43 | | | | 0.07 | | | | 0.50 | | | | (0.40 | ) | | | (0.18 | ) | | | 0.00 | |
10/31/2013 | | | 11.22 | | | | 0.34 | | | | (0.23 | ) | | | 0.11 | | | | (0.47 | ) | | | 0.00 | | | | 0.00 | |
10/31/2012 | | | 10.51 | | | | 0.41 | | | | 0.84 | | | | 1.25 | | | | (0.54 | ) | | | 0.00 | | | | 0.00 | |
10/31/2011 | | | 10.94 | | | | 0.48 | | | | (0.29 | ) | | | 0.19 | | | | (0.49 | ) | | | (0.13 | ) | | | 0.00 | |
| | | | | | | |
Series R | | | | | | | | | | | | | | | | | | | | | | | | | | | | |
01/01/2016 - 06/30/2016+ | | $ | 8.94 | | | $ | 0.16 | | | $ | 0.32 | | | $ | 0.48 | | | $ | (0.14 | ) | | $ | 0.00 | | | $ | 0.00 | |
11/01/2015 - 12/31/2015(e) | | | 9.46 | | | | 0.01 | | | | (0.18 | ) | | | (0.17 | ) | | | (0.33 | ) | | | 0.00 | | | | (0.02 | ) |
10/31/2015 | | | 10.47 | | | | 0.19 | | | | (0.62 | ) | | | (0.43 | ) | | | (0.58 | ) | | | 0.00 | | | | 0.00 | |
10/31/2014 | | | 10.52 | | | | 0.37 | | | | 0.01 | | | | 0.38 | | | | (0.18 | ) | | | (0.25 | ) | | | 0.00 | |
10/31/2013 | | | 11.93 | | | | 0.19 | | | | (0.69 | ) | | | (0.50 | ) | | | (0.23 | ) | | | (0.68 | ) | | | 0.00 | |
10/31/2012 | | | 11.97 | | | | 0.31 | | | | 1.10 | | | | 1.41 | | | | (0.40 | ) | | | (1.05 | ) | | | 0.00 | |
10/31/2011 | | | 12.13 | | | | 0.40 | | | | 0.85 | | | | 1.25 | | | | (0.43 | ) | | | (0.98 | ) | | | 0.00 | |
Please see footnotes on page 26.
| | | | | | |
| 24 | | PIMCO MANAGED ACCOUNTS TRUST | | | | See Accompanying Notes |
| | | | | | | | | | | | | | | | | | | | | | | | | | | | | | |
Total
Distributions(b) | | | Net Asset
Value End
of Year
or Period | | | Total
Return(c) | | | Net Assets
End of Year or
Period (000s) | | | Ratio of
Expenses
to Average
Net Assets(d) | | | Ratio of
Expenses
to Average
Net Assets
Excluding
Interest
Expense(d) | | | Ratio of Net
Investment
Income to
Average
Net Assets | | | Portfolio
Turnover
Rate | |
| | | | | | | | | | | | | | | | | | | | | | | | | | | | | | |
| $ | (0.22 | ) | | $ | 10.18 | | | | (0.13 | )% | | $ | 1,474,029 | | | | 0.06 | %* | | | 0.00 | %* | | | 4.21 | %* | | | 64 | % |
| | (0.76 | )(f) | | | 10.42 | | | | (0.17 | ) | | | 1,429,703 | | | | 0.11 | * | | | 0.00 | * | | | 4.54 | * | | | 8 | |
| | (1.14 | ) | | | 11.20 | | | | 0.43 | | | | 1,604,425 | | | | 0.03 | | | | 0.00 | | | | 4.56 | | | | 95 | |
| | (1.38 | ) | | | 12.29 | | | | 4.72 | | | | 2,353,773 | | | | 0.01 | | | | 0.00 | | | | 4.11 | | | | 82 | |
| | (1.00 | ) | | | 13.11 | | | | 2.72 | | | | 3,261,050 | | | | 0.00 | † | | | 0.00 | † | | | 4.65 | | | | 149 | |
| | (0.67 | ) | | | 13.75 | | | | 13.79 | | | | 4,018,843 | | | | 0.00 | † | | | 0.00 | | | | 4.87 | | | | 83 | |
| | (1.66 | ) | | | 12.71 | | | | 2.75 | | | | 3,680,966 | | | | 0.00 | † | | | 0.00 | | | | 5.72 | | | | 178 | |
| | | | | | | |
| | | | | | | | | | | | | | | | | | | | | | | | | | | | | | |
| $ | (0.20 | ) | | $ | 9.71 | | | | 0.88 | % | | $ | 31,905 | | | | 0.51 | %* | | | 0.00 | %* | | | 3.75 | %* | | | 1,230 | % |
| | (0.22 | )(f) | | | 9.83 | | | | 0.29 | | | | 31,900 | | | | 0.32 | * | | | 0.00 | * | | | 3.48 | * | | | 44 | |
| | (0.49 | ) | | | 10.02 | | | | 3.11 | | | | 28,100 | | | | 0.24 | | | | 0.00 | | | | 3.10 | | | | 1,135 | |
| | (0.21 | ) | | | 10.20 | | | | 4.08 | | | | 9,070 | | | | 0.10 | * | | | 0.00 | * | | | 2.15 | * | | | 8,278 | |
| | | | | | | |
| | | | | | | | | | | | | | | | | | | | | | | | | | | | | | |
| $ | (0.24 | ) | | $ | 10.60 | | | | 9.91 | % | | $ | 1,529,283 | | | | 0.18 | %* | | | 0.00 | %* | | | 6.14 | %* | | | 259 | % |
| | (0.18 | )(f) | | | 9.87 | | | | (0.07 | ) | | | 1,487,909 | | | | 0.14 | * | | | 0.00 | * | | | 5.60 | * | | | 68 | |
| | (0.77 | ) | | | 10.06 | | | | 0.51 | | | | 1,622,393 | | | | 0.06 | | | | 0.00 | | | | 4.83 | | | | 473 | |
| | (0.58 | ) | | | 10.78 | | | | 4.78 | | | | 2,332,201 | | | | 0.04 | | | | 0.00 | | | | 4.01 | | | | 587 | |
| | (0.47 | ) | | | 10.86 | | | | 0.97 | | | | 2,996,930 | | | | 0.00 | † | | | 0.00 | † | | | 3.25 | | | | 448 | |
| | (0.54 | ) | | | 11.22 | | | | 12.23 | | | | 3,988,009 | | | | 0.00 | † | | | 0.00 | | | | 3.78 | | | | 516 | |
| | (0.62 | ) | | | 10.51 | | | | 1.95 | | | | 3,643,832 | | | | 0.00 | † | | | 0.00 | | | | 4.57 | | | | 514 | |
| | | | | | | |
| | | | | | | | | | | | | | | | | | | | | | | | | | | | | | |
| $ | (0.14 | ) | | $ | 9.28 | | | | 5.37 | % | | $ | 143,051 | | | | 0.42 | %* | | | 0.00 | %* | | | 3.57 | %* | | | 109 | % |
| | (0.35 | )(f) | | | 8.94 | | | | (1.76 | ) | | | 157,218 | | | | 0.28 | * | | | 0.00 | * | | | 0.87 | * | | | 16 | |
| | (0.58 | ) | | | 9.46 | | | | (4.22 | ) | | | 174,222 | | | | 0.16 | | | | 0.00 | | | | 1.89 | | | | 126 | |
| | (0.43 | ) | | | 10.47 | | | | 3.82 | | | | 215,671 | | | | 0.07 | | | | 0.00 | | | | 3.55 | | | | 88 | |
| | (0.91 | ) | | | 10.52 | | | | (4.78 | ) | | | 350,159 | | | | 0.04 | | | | 0.00 | † | | | 2.06 | | | | 69 | |
| | (1.45 | ) | | | 11.93 | | | | 13.26 | | | | 602,719 | | | | 0.02 | | | | 0.00 | | | | 2.67 | | | | 264 | |
| | (1.41 | ) | | | 11.97 | | | | 12.23 | | | | 492,949 | | | | 0.00 | † | | | 0.00 | | | | 3.62 | | | | 805 | |
Please see footnotes on page 26.
| | | | | | |
| | SEMIANNUAL REPORT | | JUNE 30, 2016 | | 25 |
Financial Highlights (Cont.)
| | | | | | | | | | | | | | | | | | | | | | | | | | | | |
Selected Per Share Data for
the Year or Period Ended: | |
Net Asset
Value
Beginning
of Year
or Period | | | Net
Investment
Income(a) | | | Net Realized/
Unrealized
Gain (Loss) | | | Total
from
Investment
Operations | | | Dividends
from Net
Investment
Income | | | Distributions
from Net
Realized
Capital Gains | | | Tax Basis
Return of
Capital | |
Series TE | | | | | | | | | | | | | | | | | | | | | | | | | | | | |
01/01/2016 - 06/30/2016+ | | $ | 10.02 | | | $ | 0.15 | | | $ | 0.29 | | | $ | 0.44 | | | $ | (0.15 | ) | | $ | 0.00 | | | $ | 0.00 | |
11/01/2015 - 12/31/2015(e) | | | 9.85 | | | | 0.06 | | | | 0.17 | | | | 0.23 | | | | (0.06 | ) | | | 0.00 | | | | 0.00 | |
10/31/2015 | | | 9.90 | | | | 0.28 | | | | (0.06 | ) | | | 0.22 | | | | (0.27 | ) | | | 0.00 | | | | 0.00 | |
10/31/2014 | | | 9.64 | | | | 0.26 | | | | 0.24 | | | | 0.50 | | | | (0.24 | ) | | | 0.00 | | | | 0.00 | |
10/31/2013 | | | 9.99 | | | | 0.22 | | | | (0.35 | ) | | | (0.13 | ) | | | (0.22 | ) | | | 0.00 | | | | 0.00 | |
06/25/2012 - 10/31/2012 | | | 10.00 | | | | 0.05 | | | | (0.01 | ) | | | 0.04 | | | | (0.05 | ) | | | 0.00 | | | | 0.00 | |
| (a) | Per share amounts based on average number of shares outstanding during the year or period. |
| (b) | The tax characterization of distributions is determined in accordance with federal income tax regulations. The actual tax characterization of distributions paid are determined at the end of the fiscal year. See Note 2(c) in the Notes to Financial Statements |
| (c) | The calculation assumes that all income dividends and capital gain distributions, if any, have been reinvested. Total return does not reflect broker commissions or “wrap fee” charges. Total investment return for a period of less than one year is not annualized. |
| (d) | The financial statements reflect the fact that no investment management fees or expenses are incurred by the Portfolios. The Portfolios are an integral part of “wrap-fee” programs sponsored by investment advisers and/or broker-dealers unaffiliated with the Portfolios and PIMCO. Participants in these programs pay a “wrap” fee to the sponsor of the program. |
| (e) | Fiscal year end changed from October 31st to December 31st. |
| (f) | Total distributions for the period ended December 31, 2015 may be lower than prior fiscal years due to fiscal year end changes resulting in a reduction of the amount of days in the period ended December 31, 2015. |
| | | | | | |
| 26 | | PIMCO MANAGED ACCOUNTS TRUST | | | | See Accompanying Notes |
| | | | | | | | | | | | | | | | | | | | | | | | | | | | | | |
Total
Distributions(b) | | | Net Asset
Value End
of Year
or Period | | | Total
Return(c) | | | Net Assets
End of Year or
Period (000s) | | | Ratio of
Expenses
to Average
Net Assets(d) | | | Ratio of
Expenses
to Average
Net Assets
Excluding
Interest
Expense(d) | | | Ratio of Net
Investment
Income to
Average
Net Assets | | | Portfolio
Turnover
Rate | |
| | | | | | | | | | | | | | | | | | | | | | | | | | | | | | |
| $ | (0.15 | ) | | $ | 10.31 | | | | 4.48 | % | | $ | 100,455 | | | | 0.00 | %* | | | 0.00 | %* | | | 3.13 | %* | | | 86 | % |
| | (0.06 | )(f) | | | 10.02 | | | | 2.33 | | | | 92,821 | | | | 0.00 | * | | | 0.00 | * | | | 3.43 | * | | | 5 | |
| | (0.27 | ) | | | 9.85 | | | | 2.25 | | | | 91,524 | | | | 0.00 | | | | 0.00 | | | | 2.91 | | | | 72 | |
| | (0.24 | ) | | | 9.90 | | | | 5.27 | | | | 95,841 | | | | 0.00 | | | | 0.00 | | | | 2.67 | | | | 8 | |
| | (0.22 | ) | | | 9.64 | | | | (1.40 | ) | | | 65,594 | | | | 0.00 | † | | | 0.00 | | | | 2.19 | | | | 18 | |
| | (0.05 | ) | | | 9.99 | | | | 0.43 | | | | 9,450 | | | | 0.00 | * | | | 0.00 | * | | | 1.71 | * | | | 30 | |
| | | | | | |
| | SEMIANNUAL REPORT | | JUNE 30, 2016 | | 27 |
Statements of Assets and Liabilities
| | | | | | | | |
| (Amounts in thousands†, except per share amounts) | | Series C | | | Series LD | |
Assets: | | | | | | | | |
Investments, at value | | | | | | | | |
Investments in securities* | | $ | 1,996,344 | | | $ | 56,492 | |
Financial Derivative Instruments | | | | | | | | |
Exchange-traded or centrally cleared | | | 8,065 | | | | 12 | |
Over the counter | | | 14,756 | | | | 414 | |
Cash | | | 0 | | | | 482 | |
Deposits with counterparty | | | 3,122 | | | | 269 | |
Foreign currency, at value | | | 5,209 | | | | 74 | |
Receivable for investments sold | | | 4,295 | | | | 14,254 | |
Receivable for investments sold on a delayed-delivery basis | | | 0 | | | | 0 | |
Receivable for TBA investments sold | | | 233,989 | | | | 0 | |
Receivable for Portfolio shares sold | | | 809 | | | | 0 | |
Interest and/or dividends receivable | | | 17,174 | | | | 350 | |
Other assets | | | 18 | | | | 0 | |
Total Assets | | | 2,283,781 | | | | 72,347 | |
| | |
Liabilities: | | | | | | | | |
Borrowings & Other Financing Transactions | | | | | | | | |
Payable for reverse repurchase agreements | | $ | 89,848 | | | $ | 21,688 | |
Payable for sale-buyback transactions | | | 15,001 | | | | 3,757 | |
Payable for short sales | | | 36,926 | | | | 0 | |
Financial Derivative Instruments | | | | | | | | |
Exchange-traded or centrally cleared | | | 549 | | | | 1 | |
Over the counter | | | 20,629 | | | | 339 | |
Payable for investments purchased | | | 44,598 | | | | 14,260 | |
Payable for TBA investments purchased | | | 584,412 | | | | 0 | |
Deposits from counterparty | | | 11,312 | | | | 270 | |
Payable for Portfolio shares redeemed | | | 665 | | | | 0 | |
Dividends payable | | | 5,812 | | | | 127 | |
Total Liabilities | | | 809,752 | | | | 40,442 | |
| | |
Net Assets | | $ | 1,474,029 | | | $ | 31,905 | |
| | |
Net Assets Consist of: | | | | | | | | |
Shares of beneficial interest of $0.001 par value (unlimited number authorized) | | $ | 145 | | | $ | 3 | |
Paid in capital in excess of par | | | 1,684,899 | | | | 32,929 | |
Undistributed (overdistributed) net investment income | | | 6,534 | | | | (229 | ) |
Accumulated undistributed net realized gain (loss) | | | (229,023 | ) | | | (871 | ) |
Net unrealized appreciation | | | 11,474 | | | | 73 | |
| | |
Net Assets | | $ | 1,474,029 | | | $ | 31,905 | |
| | |
Shares Issued and Outstanding | | | 144,790 | | | | 3,285 | |
| | |
Net Asset Value Per Share Outstanding | | $ | 10.18 | | | $ | 9.71 | |
| | |
Cost of investments in securities | | $ | 1,904,458 | | | $ | 56,121 | |
Cost of foreign currency held | | $ | 5,180 | | | $ | 73 | |
Proceeds received on short sales | | $ | 36,752 | | | $ | 0 | |
Cost or premiums of financial derivative instruments, net | | $ | 4,606 | | | $ | (15 | ) |
| | |
* Includes repurchase agreements of: | | $ | 3,578 | | | $ | 0 | |
| † | A zero balance may reflect actual amounts rounding to less than one thousand. |
| | | | | | |
| 28 | | PIMCO MANAGED ACCOUNTS TRUST | | | | See Accompanying Notes |
June 30, 2016 (Unaudited)
| | | | | | | | | | |
| Series M | | | Series R | | | Series TE | |
| | | | | | | | | | |
| | | | | | | | | | | |
| $ | 2,609,363 | | | $ | 260,755 | | | $ | 105,796 | |
| | | | | | | | | | | |
| | 1,595 | | | | 239 | | | | 0 | |
| | 8,281 | | | | 2,984 | | | | 0 | |
| | 1 | | | | 1 | | | | 534 | |
| | 5,139 | | | | 1,848 | | | | 0 | |
| | 5,270 | | | | 315 | | | | 0 | |
| | 33,413 | | | | 6,728 | | | | 1,800 | |
| | 0 | | | | 9,457 | | | | 0 | |
| | 517,376 | | | | 46,941 | | | | 0 | |
| | 869 | | | | 0 | | | | 0 | |
| | 17,038 | | | | 1,016 | | | | 928 | |
| | 17 | | | | 17 | | | | 1 | |
| | 3,198,362 | | | | 330,301 | | | | 109,059 | |
| | |
| | | | | | | | | | |
| | | | | | | | | | | |
| $ | 453,800 | | | $ | 0 | | | $ | 0 | |
| | 21,176 | | | | 103,984 | | | | 0 | |
| | 6,313 | | | | 0 | | | | 0 | |
| | | | | | | | | | | |
| | 1,870 | | | | 94 | | | | 0 | |
| | 3,555 | | | | 7,607 | | | | 0 | |
| | 17,255 | | | | 57 | | | | 8,344 | |
| | 1,146,532 | | | | 74,016 | | | | 0 | |
| | 12,038 | | | | 320 | | | | 0 | |
| | 721 | | | | 207 | | | | 0 | |
| | 5,819 | | | | 965 | | | | 260 | |
| | 1,669,079 | | | | 187,250 | | | | 8,604 | |
| | |
| $ | 1,529,283 | | | $ | 143,051 | | | $ | 100,455 | |
| | |
| | | | | | | | | | |
$ | 144 | | | $ | 15 | | | $ | 10 | |
| | 1,453,664 | | | | 181,475 | | | | 96,109 | |
| | 13,370 | | | | 490 | | | | (44 | ) |
| | 1,501 | | | | (39,982 | ) | | | (2,158 | ) |
| | 60,604 | | | | 1,053 | | | | 6,538 | |
| | |
| $ | 1,529,283 | | | $ | 143,051 | | | $ | 100,455 | |
| | |
| | 144,327 | | | | 15,412 | | | | 9,742 | |
| | |
| $ | 10.60 | | | $ | 9.28 | | | $ | 10.31 | |
| | |
| $ | 2,509,461 | | | $ | 256,026 | | | $ | 99,258 | |
| $ | 5,346 | | | $ | 318 | | | $ | 0 | |
| $ | 6,307 | | | $ | 0 | | | $ | 0 | |
| $ | 925 | | | $ | 40 | | | $ | 0 | |
| | |
| $ | 17,176 | | | $ | 831 | | | $ | 9,500 | |
| | | | | | |
| | SEMIANNUAL REPORT | | JUNE 30, 2016 | | 29 |
Statements of Operations
| | | | | | | | |
| Six Months Ended June 30, 2016 (Unaudited) | | | | | | |
| (Amounts in thousands†) | | Series C | | | Series LD | |
| | |
Investment Income: | | | | | | | | |
Interest | | $ | 30,976 | | | $ | 643 | |
Total Income | | | 30,976 | | | | 643 | |
| | |
Expenses: | | | | | | | | |
Interest expense | | | 431 | | | | 77 | |
Miscellaneous expense | | | 16 | | | | 1 | |
Total Expenses | | | 447 | | | | 78 | |
| | |
Net Investment Income | | | 30,529 | | | | 565 | |
| | |
Net Realized Gain (Loss): | | | | | | | | |
Investments in securities | | | (2,961 | ) | | | (535 | ) |
Exchange-traded or centrally cleared financial derivative instruments | | | (89,913 | ) | | | (183 | ) |
Over the counter financial derivative instruments | | | (7,621 | ) | | | 110 | |
Foreign currency | | | 1,110 | | | | 15 | |
| | |
Net Realized Gain (Loss) | | | (99,385 | ) | | | (593 | ) |
| | |
Net Change in Unrealized Appreciation (Depreciation): | | | | | | | | |
Investments in securities | | | 96,839 | | | | 864 | |
Exchange-traded or centrally cleared financial derivative instruments | | | (17,294 | ) | | | (462 | ) |
Over the counter financial derivative instruments | | | (9,250 | ) | | | (88 | ) |
Foreign currency assets and liabilities | | | (793 | ) | | | 1 | |
| | |
Net Change in Unrealized Appreciation | | | 69,502 | | | | 315 | |
| | |
Net Increase in Net Assets Resulting from Operations | | $ | 646 | | | $ | 287 | |
| † | A zero balance may reflect actual amounts rounding to less than one thousand. |
| | | | | | |
| 30 | | PIMCO MANAGED ACCOUNTS TRUST | | | | See Accompanying Notes |
| | | | | | | | | | |
| | | | | | | | |
| Series M | | | Series R | | | Series TE | |
| | |
| | | | | | | | | | |
| $ | 47,115 | | | $ | 2,922 | | | $ | 1,466 | |
| | 47,115 | | | | 2,922 | | | | 1,466 | |
| | |
| | | | | | | | | | |
| | 1,337 | | | | 309 | | | | 0 | |
| | 0 | | | | 2 | | | | 0 | |
| | 1,337 | | | | 311 | | | | 0 | |
| | |
| | 45,778 | | | | 2,611 | | | | 1,466 | |
| | |
| | | | | | | | | | |
| | 19,435 | | | | (758 | ) | | | 1,722 | |
| | (16,407 | ) | | | (5,827 | ) | | | (655 | ) |
| | (2,088 | ) | | | (1,335 | ) | | | 0 | |
| | 242 | | | | (99 | ) | | | 0 | |
| | |
| | 1,182 | | | | (8,019 | ) | | | 1,067 | |
| | |
| | | | | | | | | | |
| | 117,102 | | | | 15,625 | | | | 1,706 | |
| | (22,310 | ) | | | (1,475 | ) | | | 0 | |
| | 2,099 | | | | (788 | ) | | | 0 | |
| | (269 | ) | | | (146 | ) | | | 0 | |
| | |
| | 96,622 | | | | 13,216 | | | | 1,706 | |
| | |
| $ | 143,582 | | | $ | 7,808 | | | $ | 4,239 | |
| | | | | | |
| | SEMIANNUAL REPORT | | JUNE 30, 2016 | | 31 |
Statements of Changes in Net Assets
| | | | | | | | | | | | |
| | | Series C | |
| (Amounts in thousands†) | | Six Months Ended June 30, 2016 (Unaudited) | | | Period from
November 1, 2015 to
December 31, 2015(c) | | | Year Ended
October 31, 2015 | |
Increase (Decrease) in Net Assets from: | | | | | | | | | | | | |
| | | |
Operations: | | | | | | | | | | | | |
Net investment income | | $ | 30,529 | | | $ | 11,967 | | | $ | 84,837 | |
Net realized gain (loss) | | | (99,385 | ) | | | 1,520 | | | | (3,114 | ) |
Net change in unrealized appreciation (depreciation) | | | 69,502 | | | | (16,469 | ) | | | (72,477 | ) |
| | | |
Net Increase (Decrease) in Net Assets Resulting from Operations | | | 646 | | | | (2,982 | ) | | | 9,246 | |
| | | |
Distributions to Shareholders: | | | | | | | | | | | | |
From net investment income | | | (32,681 | ) | | | (102,527 | ) | | | (89,288 | ) |
From net realized capital gains | | | 0 | | | | 0 | | | | (98,083 | ) |
| | | |
Total Distributions(a) | | | (32,681 | ) | | | (102,527 | )(b) | | | (187,371 | ) |
| | | |
Portfolio Share Transactions: | | | | | | | | | | | | |
Receipts for shares sold | | | 256,202 | | | | 96,655 | | | | 369,973 | |
Cost of shares redeemed | | | (179,841 | ) | | | (165,868 | ) | | | (941,196 | ) |
Net increase (decrease) resulting from Portfolio share transactions | | | 76,361 | | | | (69,213 | ) | | | (571,223 | ) |
| | | |
Total Increase (Decrease) in Net Assets | | | 44,326 | | | | (174,722 | ) | | | (749,348 | ) |
| | | |
Net Assets: | | | | | | | | | | | | |
Beginning of year or period | | | 1,429,703 | | | | 1,604,425 | | | | 2,353,773 | |
End of year or period* | | $ | 1,474,029 | | | $ | 1,429,703 | | | $ | 1,604,425 | |
| | | |
* Including undistributed (overdistributed) net investment income of: | | $ | 6,534 | | | $ | 8,686 | | | $ | 86,726 | |
| | | |
Shares of Beneficial Interest: | | | | | | | | | | | | |
Shares Sold | | | 25,236 | | | | 9,067 | | | | 32,096 | |
Shares Redeemed | | | (17,718 | ) | | | (15,059 | ) | | | (80,339 | ) |
Net increase (decrease) in shares outstanding | | | 7,518 | | | | (5,992 | ) | | | (48,243 | ) |
| † | A zero balance may reflect actual amounts rounding to less than one thousand. |
| (a) | The tax characterization of distributions is determined in accordance with federal income tax regulations. The actual tax characterization of distributions paid are determined at the end of the fiscal year. See Note 2(c) in the Notes to Financial Statements for more information. |
| (b) | Total distributions for the period ended December 31, 2015 may be lower than prior fiscal years due to fiscal year end changes resulting in a reduction of the amount of days in the period ended December 31, 2015. |
| (c) | Fiscal year end changed from October 31st to December 31st. |
| | | | | | |
| 32 | | PIMCO MANAGED ACCOUNTS TRUST | | | | See Accompanying Notes |
| | | | | | | | | | | | | | | | | | | | | | |
| Series LD | | | Series M | |
Six Months Ended June 30, 2016 (Unaudited) | | | Period from
November 1, 2015 to
December 31, 2015(c) | | | Year Ended
October 31, 2015 | | | Six Months Ended June 30, 2016 (Unaudited) | | | Period from
November 1, 2015 to
December 31, 2015(c) | | | Year Ended
October 31, 2015 | |
| | | | | | | | | | | | | | | | | | | | | | |
| | | | | |
| | | | | | | | | | | | | | | | | | | | | | |
| $ | 565 | | | $ | 183 | | | $ | 543 | | | $ | 45,778 | | | $ | 15,042 | | | $ | 89,933 | |
| | (593 | ) | | | (232 | ) | | | 330 | | | | 1,182 | | | | (3,844 | ) | | | 14,153 | |
| | 315 | | | | 143 | | | | (431 | ) | | | 96,622 | | | | (12,537 | ) | | | (92,602 | ) |
| | | | | |
|
287 |
| | | 94 | | | | 442 | | | | 143,582 | | | | (1,339 | ) | | | 11,484 | |
| | | | | |
| | | | | | | | | | | | | | | | | | | | | | |
| | (649 | ) | | | (305 | ) | | | (585 | ) | | | (35,536 | ) | | | (28,101 | ) | | | (90,491 | ) |
| | 0 | | | | (367 | ) | | | (92 | ) | | | 0 | | | | 0 | | | | (52,801 | ) |
| | | | | |
| | (649 | ) | | | (672 | )(b) | | | (677 | ) | | | (35,536 | ) | | | (28,101 | )(b) | | | (143,292 | ) |
| | | | | |
| | | | | | | | | | | | | | | | | | | | | | |
| | 5,033 | | | | 5,902 | | | | 21,301 | | | | 141,116 | | | | 50,295 | | | | 311,899 | |
| | (4,666 | ) | | | (1,524 | ) | | | (2,036 | ) | | | (207,788 | ) | | | (155,339 | ) | | | (889,899 | ) |
|
367 |
| | | 4,378 | | | | 19,265 | | | | (66,672 | ) | | | (105,044 | ) | | | (578,000 | ) |
| | | | | |
| | 5 | | | | 3,800 | | | | 19,030 | | | | 41,374 | | | | (134,484 | ) | | | (709,808 | ) |
| | | | | |
| | | | | | | | | | | | | | | | | | | | | | |
| | 31,900 | | | | 28,100 | | | | 9,070 | | | | 1,487,909 | | | | 1,622,393 | | | | 2,332,201 | |
| $ | 31,905 | | | $ | 31,900 | | | $ | 28,100 | | | $ | 1,529,283 | | | $ | 1,487,909 | | | $ | 1,622,393 | |
| | | | | |
$ | (229 | ) | | $ | (145 | ) | | $ | (70 | ) | | $ | 13,370 | | | $ | 3,128 | | | $ | 13,680 | |
| | | | | |
| | | | | | | | | | | | | | | | | | | | | | |
| | 519 | | | | 592 | | | | 2,120 | | | | 14,144 | | | | 5,057 | | | | 30,075 | |
| | (480 | ) | | | (152 | ) | | | (203 | ) | | | (20,524 | ) | | | (15,569 | ) | | | (85,132 | ) |
| | 39 | | | | 440 | | | | 1,917 | | | | (6,380 | ) | | | (10,512 | ) | | | (55,057 | ) |
| | | | | | |
| | SEMIANNUAL REPORT | | JUNE 30, 2016 | | 33 |
Statements of Changes in Net Assets (Cont.)
| | | | | | | | | | | | |
| | | Series R | |
| (Amounts in thousands†) | | Six Months Ended June 30, 2016 (Unaudited) | | | Period from
November 1, 2015 to
December 31, 2015(c) | | | Year Ended
October 31, 2015 | |
Increase (Decrease) in Net Assets from: | | | | | | | | | | | | |
| | | |
Operations: | | | | | | | | | | | | |
Net investment income | | $ | 2,611 | | | $ | 247 | | | $ | 3,607 | |
Net realized gain (loss) | | | (8,019 | ) | | | (1,187 | ) | | | (8,856 | ) |
Net change in unrealized appreciation (depreciation) | | | 13,216 | | | | (2,127 | ) | | | (2,904 | ) |
| | | |
Net Increase (Decrease) in Net Assets Resulting from Operations | | | 7,808 | | | | (3,067 | ) | | | (8,153 | ) |
| | | |
Distributions to Shareholders: | | | | | | | | | | | | |
From net investment income | | | (2,160 | ) | | | (5,675 | ) | | | (11,210 | ) |
From net realized capital gains | | | 0 | | | | 0 | | | | 0 | |
Tax basis return of capital | | | | | | | (437 | ) | | | | |
| | | |
Total Distributions(a) | | | (2,160 | ) | | | (6,112 | )(b) | | | (11,210 | ) |
| | | |
Portfolio Share Transactions: | | | | | | | | | | | | |
Receipts for shares sold | | | 16,882 | | | | 6,895 | | | | 32,261 | |
Cost of shares redeemed | | | (36,697 | ) | | | (14,720 | ) | | | (54,347 | ) |
Net increase (decrease) resulting from Portfolio share transactions | | | (19,815 | ) | | | (7,825 | ) | | | (22,086 | ) |
| | | |
Total Increase (Decrease) in Net Assets | | | (14,167 | ) | | | (17,004 | ) | | | (41,449 | ) |
| | | |
Net Assets: | | | | | | | | | | | | |
Beginning of year or period | | | 157,218 | | | | 174,222 | | | | 215,671 | |
End of year or period* | | $ | 143,051 | | | $ | 157,218 | | | $ | 174,222 | |
| | | |
* Including undistributed (overdistributed) net investment income of: | | $ | 490 | | | $ | 39 | | | $ | 5,205 | |
| | | |
Shares of Beneficial Interest: | | | | | | | | | | | | |
Shares Sold | | | 1,880 | | | | 763 | | | | 3,291 | |
Shares Redeemed | | | (4,060 | ) | | | (1,589 | ) | | | (5,471 | ) |
Net increase (decrease) in shares outstanding | | | (2,180 | ) | | | (826 | ) | | | (2,180 | ) |
| † | A zero balance may reflect actual amounts rounding to less than one thousand. |
| (a) | The tax characterization of distributions is determined in accordance with federal income tax regulations. The actual tax characterization of distributions paid are determined at the end of the fiscal year. See Note 2(c) in the Notes to Financial Statements for more information. |
| (b) | Total distributions for the period ended December 31, 2015 may be lower than prior fiscal years due to fiscal year end changes resulting in a reduction of the amount of days in the period ended December 31, 2015. |
| (c) | Fiscal year end changed from October 31st to December 31st. |
| | | | | | |
| 34 | | PIMCO MANAGED ACCOUNTS TRUST | | | | See Accompanying Notes |
| | | | | | | | | | |
| Series TE | |
Six Months Ended June 30, 2016 (Unaudited) | | | Period from
November 1, 2015 to
December 31, 2015(c) | | | Year Ended
October 31, 2015 | |
| | | | | | | | | | |
| | |
| | | | | | | | | | |
| $ | 1,466 | | | $ | 547 | | | $ | 2,698 | |
| | 1,067 | | | | 35 | | | | (2,581 | ) |
| | 1,706 | | | | 1,549 | | | | 1,801 | |
| | |
|
4,239 |
| | | 2,131 | | | | 1,918 | |
| | |
| | | | | | | | | | |
| | (1,466 | ) | | | (547 | ) | | | (2,530 | ) |
| | 0 | | | | 0 | | | | 0 | |
| | | | | | | | | | | |
| | |
| | (1,466 | ) | | | (547 | )(b) | | | (2,530 | ) |
| | |
| | | | | | | | | | |
| | 13,324 | | | | 2,468 | | | | 22,146 | |
| | (8,463 | ) | | | (2,755 | ) | | | (25,851 | ) |
|
4,861 |
| | | (287 | ) | | | (3,705 | ) |
| | |
| | 7,634 | | | | 1,297 | | | | (4,317 | ) |
| | |
| | | | | | | | | | |
| | 92,821 | | | | 91,524 | | | | 95,841 | |
| $ | 100,455 | | | $ | 92,821 | | | $ | 91,524 | |
| | |
$ | (44 | ) | | $ | (44 | ) | | $ | (44 | ) |
| | |
| | | | | | | | | | |
| | 1,320 | | | | 248 | | | | 2,262 | |
| | (838 | ) | | | (277 | ) | | | (2,650 | ) |
| | 482 | | | | (29) | | | | (388 | ) |
| | | | | | |
| | SEMIANNUAL REPORT | | JUNE 30, 2016 | | 35 |
Statements of Cash Flows PIMCO Fixed Income SHares
| | | | | | | | | | | | |
Six Months Ended June 30, 2016 (Unaudited) | | | | | | | | | |
| (Amounts in thousands†) | | Series LD | | | Series M | | | Series R | |
Cash Flows Provided by (Used for) Operating Activities: | | | | | | | | | | | | |
Net increase in net assets resulting from operations | | $ | 287 | | | $ | 143,582 | | | $ | 7,808 | |
| | | |
Adjustments to Reconcile Net Increase in Net Assets from Operations to Net Cash Provided by (Used for) Operating Activities: | | | | | | | | | | | | |
Purchases of long-term securities | | | (593,553 | ) | | | (6,904,128 | ) | | | (268,187 | ) |
Proceeds from sales of long-term securities | | | 581,125 | | | | 7,111,633 | | | | 285,751 | |
(Purchases) Proceeds from sales of short-term portfolio investments, net | | | 3,071 | | | | 2,838 | | | | (11,112 | ) |
(Increase) decrease in deposits with counterparty | | | 160 | | | | (411 | ) | | | 1,640 | |
(Increase) in receivable for investments sold | | | (14,254 | ) | | | (234,933 | ) | | | (53,588 | ) |
(Increase) decrease in interest and/or dividends receivable | | | (24 | ) | | | 3,499 | | | | 69 | |
(Payments on) exchange-traded or centrally cleared financial derivative instruments | | | (747 | ) | | | (39,814 | ) | | | (7,464 | ) |
Proceeds from (Payments on) over the counter financial derivative instruments | | | 117 | | | | (2,581 | ) | | | (2,205 | ) |
Increase in payable for investments purchased | | | 13,861 | | | | 151,635 | | | | 74,012 | |
Increase in deposits from counterparty | | | 270 | | | | 5,847 | | | | 130 | |
Proceeds from short sales transactions, net | | | 0 | | | | 6,307 | | | | 0 | |
Proceeds from (Payments on) foreign currency transactions | | | 16 | | | | (27 | ) | | | (97 | ) |
Net Realized (Gain) Loss | | | | | | | | | | | | |
Investments in securities | | | 535 | | | | (19,435 | ) | | | 758 | |
Exchange-traded or centrally cleared financial derivative instruments | | | 183 | | | | 16,407 | | | | 5,827 | |
Over the counter financial derivative instruments | | | (110 | ) | | | 2,088 | | | | 1,335 | |
Foreign currency | | | (15 | ) | | | (242 | ) | | | 99 | |
Net Change in Unrealized (Appreciation) Depreciation | | | | | | | | | | | | |
Investments in securities | | | (864 | ) | | | (117,102 | ) | | | (15,625 | ) |
Exchange-traded or centrally cleared financial derivative instruments | | | 462 | | | | 22,310 | | | | 1,475 | |
Over the counter financial derivative instruments | | | 88 | | | | (2,099 | ) | | | 788 | |
Foreign currency assets and liabilities | | | (1 | ) | | | 269 | | | | 146 | |
Net amortization (accretion) on investments | | | 141 | | | | 2,346 | | | | (68 | ) |
Net Cash Provided by (Used for) Operating Activities | | | (9,252 | ) | | | 147,989 | | | | 21,492 | |
| | | |
Cash Flows Received from (Used for) Financing Activities: | | | | | | | | | | | | |
Proceeds from shares sold | | | 5,033 | | | | 140,704 | | | | 16,882 | |
Payments on shares redeemed | | | (4,666 | ) | | | (209,091 | ) | | | (36,499 | ) |
Cash dividend paid | | | (635 | ) | | | (36,579 | ) | | | (1,315 | ) |
Proceeds from reverse repurchase agreements | | | 101,826 | | | | 1,468,139 | | | | 25,560 | |
Payments on reverse repurchase agreements | | | (96,013 | ) | | | (1,436,174 | ) | | | (32,440 | ) |
Proceeds from sale-buyback transactions | | | 29,512 | | | | 829,595 | | | | 863,409 | |
Payments on sale-buyback transactions | | | (25,755 | ) | | | (905,180 | ) | | | (857,650 | ) |
Proceeds from deposits from counterparty | | | 0 | | | | 2,925 | | | | 0 | |
Payments on deposits from counterparty | | | 0 | | | | (2,925 | ) | | | 0 | |
Net Cash Received from (Used for) Financing Activities | | | 9,302 | | | | (148,586 | ) | | | (22,053 | ) |
| | | |
Net Increase (Decrease) in Cash and Foreign Currency | | | 50 | | | | (597 | ) | | | (561 | ) |
| | | |
Cash and Foreign Currency: | | | | | | | | | | | | |
Beginning of period | | | 506 | | | | 5,868 | | | | 877 | |
End of period | | $ | 556 | | | $ | 5,271 | | | $ | 316 | |
| | | |
Supplemental Disclosure of Cash Flow Information: | | | | | | | | | | | | |
Interest expense paid during the period | | $ | 81 | | | $ | 1,083 | | | $ | 320 | |
| † | A zero balance may reflect actual amounts rounding to less than one thousand. |
| | | | | | |
| 36 | | PIMCO MANAGED ACCOUNTS TRUST | | | | See Accompanying Notes |
Schedule of Investments PIMCO Fixed Income SHares: Series C
(Unaudited)
June 30, 2016
| | | | | | | | | | | | |
| | | | | PRINCIPAL
AMOUNT
(000S) | | | | | MARKET
VALUE
(000S) | |
| INVESTMENTS IN SECURITIES 135.4% | |
| |
| BANK LOAN OBLIGATIONS 0.5% | |
Energy Future Intermediate Holding Co. LLC | |
4.250% due 12/19/2016 | | $ | | | 6,700 | | | $ | | | 6,698 | |
| | | | | | | | | | | | |
Total Bank Loan Obligations (Cost $6,701) | | | 6,698 | |
| | | | | | | | | | | | |
| | | | | | | | | | | | |
| CORPORATE BONDS & NOTES 54.1% | |
| |
| BANKING & FINANCE 37.1% | |
Ally Financial, Inc. | |
6.250% due 12/01/2017 | | | | | 300 | | | | | | 315 | |
Bank of America Corp. | |
4.000% due 04/01/2024 | | | | | 500 | | | | | | 535 | |
4.100% due 07/24/2023 | | | | | 5,600 | | | | | | 6,011 | |
5.000% due 05/13/2021 | | | | | 300 | | | | | | 336 | |
5.625% due 07/01/2020 | | | | | 11,800 | | | | | | 13,289 | |
6.400% due 08/28/2017 | | | | | 14,750 | | | | | | 15,568 | |
6.875% due 04/25/2018 | | | | | 41,255 | �� | | | | | 45,060 | |
Barclays Bank PLC | |
7.625% due 11/21/2022 | | | | | 1,200 | | | | | | 1,294 | |
7.750% due 04/10/2023 | | | | | 7,300 | | | | | | 7,546 | |
10.000% due 05/21/2021 | | GBP | | | 300 | | | | | | 496 | |
14.000% due 06/15/2019 (c) | | | | | 100 | | | | | | 162 | |
Bear Stearns Cos. LLC | |
7.250% due 02/01/2018 | | $ | | | 17,440 | | | | | | 19,016 | |
Blackstone CQP Holdco LP | |
9.296% due 03/19/2019 | | | | | 11,873 | | | | | | 11,873 | |
BPCE S.A. | |
4.500% due 03/15/2025 | | | | | 10,000 | | | | | | 10,017 | |
12.500% due 09/30/2019 (c) | | EUR | | | 4,000 | | | | | | 5,874 | |
CIT Group, Inc. | |
3.875% due 02/19/2019 | | $ | | | 900 | | | | | | 907 | |
4.250% due 08/15/2017 | | | | | 1,000 | | | | | | 1,021 | |
Cooperatieve Rabobank UA | |
4.750% due 01/15/2020 | | | | | 18,400 | | | | | | 20,276 | |
8.375% due 07/26/2016 (c) | | | | | 25,653 | | | | | | 25,793 | |
8.400% due 06/29/2017 (c) | | | | | 4,240 | | | | | | 4,447 | |
Credit Agricole S.A. | |
8.125% due 09/19/2033 | | | | | 1,300 | | | | | | 1,398 | |
Credit Suisse AG | |
6.500% due 08/08/2023 | | | | | 1,100 | | | | | | 1,155 | |
Doric Nimrod Air Finance Alpha Ltd. Pass-Through Trust | |
5.125% due 11/30/2024 | | | | | 8,637 | | | | | | 8,865 | |
Ford Motor Credit Co. LLC | |
5.750% due 02/01/2021 | | | | | 15,000 | | | | | | 17,070 | |
5.875% due 08/02/2021 | | | | | 600 | | | | | | 689 | |
8.000% due 12/15/2016 | | | | | 7,900 | | | | | | 8,141 | |
8.125% due 01/15/2020 | | | | | 27,305 | | | | | | 32,594 | |
| | | | | | | | | | | | |
| | | | | PRINCIPAL
AMOUNT
(000S) | | | | | MARKET
VALUE
(000S) | |
General Motors Financial Co., Inc. | |
4.250% due 05/15/2023 | | $ | | | 21,570 | | | $ | | | 22,218 | |
Goldman Sachs Group, Inc. | |
4.000% due 03/03/2024 | | | | | 16,700 | | | | | | 17,947 | |
6.150% due 04/01/2018 | | | | | 15,200 | | | | | | 16,392 | |
HBOS PLC | |
6.750% due 05/21/2018 | | | | | 25,300 | | | | | | 27,200 | |
Heta Asset Resolution AG | |
2.750% due 12/31/2023 ^ | | CHF | | | 200 | | | | | | 181 | |
4.250% due 10/31/2016 ^ | | EUR | | | 600 | | | | | | 578 | |
4.375% due 01/24/2017 ^ | | | | | 600 | | | | | | 577 | |
HSBC Holdings PLC | |
6.375% due 09/17/2024 (c) | | $ | | | 1,200 | | | | | | 1,136 | |
International Lease Finance Corp. | |
6.750% due 09/01/2016 | | | | | 4,000 | | | | | | 4,022 | |
7.125% due 09/01/2018 | | | | | 3,000 | | | | | | 3,301 | |
JPMorgan Chase & Co. | |
3.625% due 05/13/2024 | | | | | 900 | | | | | | 957 | |
6.125% due 04/30/2024 (c) | | | | | 4,200 | | | | | | 4,357 | |
7.900% due 04/30/2018 (c) | | | | | 30,900 | | | | | | 31,557 | |
Lloyds Bank PLC | |
9.875% due 12/16/2021 | | | | | 177 | | | | | | 183 | |
11.875% due 12/16/2021 | | EUR | | | 1,748 | | | | | | 2,032 | |
12.000% due 12/16/2024 (c) | | $ | | | 26,600 | | | | | | 36,343 | |
13.000% due 12/19/2021 | | AUD | | | 200 | | | | | | 155 | |
Lloyds Banking Group PLC | |
7.500% due 06/27/2024 (c) | | $ | | | 3,604 | | | | | | 3,532 | |
MetLife Capital Trust | |
7.875% due 12/15/2067 | | | | | 600 | | | | | | 719 | |
Morgan Stanley | |
4.000% due 07/23/2025 | | | | | 1,900 | | | | | | 2,039 | |
5.500% due 07/28/2021 | | | | | 9,500 | | | | | | 10,861 | |
5.750% due 01/25/2021 | | | | | 100 | | | | | | 114 | |
5.950% due 12/28/2017 | | | | | 900 | | | | | | 957 | |
6.625% due 04/01/2018 | | | | | 3,700 | | | | | | 4,013 | |
Navient Corp. | |
5.500% due 01/15/2019 | | | | | 1,500 | | | | | | 1,512 | |
7.250% due 01/25/2022 | | | | | 17,700 | | | | | | 17,191 | |
8.000% due 03/25/2020 | | | | | 1,100 | | | | | | 1,127 | |
8.450% due 06/15/2018 | | | | | 14,855 | | | | | | 16,118 | |
Preferred Term Securities Ltd. | |
1.206% due 03/24/2034 | | | | | 269 | | | | | | 221 | |
Qatari Diar Finance Co. | |
5.000% due 07/21/2020 | | | | | 1,500 | | | | | | 1,657 | |
Royal Bank of Scotland Group PLC | |
7.648% due 09/30/2031 (c) | | | | | 5,000 | | | | | | 5,925 | |
Russian Agricultural Bank OJSC Via RSHB Capital S.A. | |
6.299% due 05/15/2017 | | | | | 5,880 | | | | | | 6,056 | |
Springleaf Finance Corp. | |
6.900% due 12/15/2017 | | | | | 14,000 | | | | | | 14,542 | |
| | | | | | |
| See Accompanying Notes | | SEMIANNUAL REPORT | | JUNE 30, 2016 | | 37 |
Schedule of Investments PIMCO Fixed Income SHares: Series C (Cont.)
| | | | | | | | | | | | |
| | | | | PRINCIPAL
AMOUNT
(000S) | | | | | MARKET
VALUE
(000S) | |
UBS AG | |
4.750% due 02/12/2026 | | EUR | | | 400 | | | $ | | | 466 | |
7.250% due 02/22/2022 | | $ | | | 200 | | | | | | 206 | |
Wells Fargo & Co. | |
3.450% due 02/13/2023 | | | | | 4,700 | | | | | | 4,869 | |
7.980% due 03/15/2018 (c) | | | | | 19,217 | | | | | | 20,130 | |
Weyerhaeuser Co. | |
7.375% due 10/01/2019 | | | | | 5,000 | | | | | | 5,751 | |
| | | | | | | | | | | | |
| | | | | | | | | | | 546,890 | |
| | | | | | | | | | | | |
| |
| INDUSTRIALS 11.6% | |
Alliance Data Systems Corp. | |
5.250% due 12/01/2017 | | | | | 12,750 | | | | | | 12,957 | |
Amgen, Inc. | |
5.700% due 02/01/2019 | | | | | 1,700 | | | | | | 1,885 | |
Brunswick Rail Finance Ltd. | |
6.500% due 11/01/2017 | | | | | 2,800 | | | | | | 1,372 | |
Charter Communications Operating LLC | |
4.908% due 07/23/2025 | | | | | 800 | | | | | | 873 | |
6.484% due 10/23/2045 | | | | | 1,300 | | | | | | 1,559 | |
CSC Holdings LLC | |
7.625% due 07/15/2018 | | | | | 5,150 | | | | | | 5,585 | |
7.875% due 02/15/2018 | | | | | 810 | | | | | | 873 | |
CVS Health Corp. | |
3.875% due 07/20/2025 | | | | | 6,372 | | | | | | 7,026 | |
5.125% due 07/20/2045 | | | | | 1,400 | | | | | | 1,743 | |
Delta Air Lines Pass-Through Trust | |
4.950% due 11/23/2020 | | | | | 267 | | | | | | 282 | |
6.200% due 01/02/2020 | | | | | 264 | | | | | | 282 | |
DISH DBS Corp. | |
5.000% due 03/15/2023 | | | | | 14,842 | | | | | | 13,543 | |
5.875% due 07/15/2022 | | | | | 300 | | | | | | 292 | |
Energy Transfer Partners LP | |
6.125% due 02/15/2017 | | | | | 2,100 | | | | | | 2,155 | |
9.700% due 03/15/2019 | | | | | 300 | | | | | | 340 | |
Georgia-Pacific LLC | |
5.400% due 11/01/2020 | | | | | 9,300 | | | | | | 10,544 | |
Glencore Finance Canada Ltd. | |
5.800% due 11/15/2016 | | | | | 7,400 | | | | | | 7,489 | |
Gold Fields Orogen Holding BVI Ltd. | |
4.875% due 10/07/2020 | | | | | 5,000 | | | | | | 4,950 | |
Kern River Funding Corp. | |
4.893% due 04/30/2018 | | | | | 457 | | | | | | 484 | |
Kinder Morgan Energy Partners LP | |
3.500% due 03/01/2021 | | | | | 300 | | | | | | 301 | |
3.950% due 09/01/2022 | | | | | 1,000 | | | | | | 1,019 | |
6.000% due 02/01/2017 | | | | | 5,800 | | | | | | 5,936 | |
Kinder Morgan, Inc. | |
3.050% due 12/01/2019 | | | | | 600 | | | | | | 607 | |
7.000% due 06/15/2017 | | | | | 1,789 | | | | | | 1,863 | |
| | | | | | | | | | | | |
| | | | | PRINCIPAL
AMOUNT
(000S) | | | | | MARKET
VALUE
(000S) | |
Latam Airlines Pass-Through Trust | |
4.200% due 08/15/2029 | | $ | | | 2,850 | | | $ | | | 2,620 | |
Medtronic, Inc. | |
3.500% due 03/15/2025 | | | | | 1,000 | | | | | | 1,092 | |
NBCUniversal Media LLC | |
4.375% due 04/01/2021 | | | | | 15,600 | | | | | | 17,494 | |
Northwest Airlines Pass-Through Trust | |
7.041% due 10/01/2023 | | | | | 1,112 | | | | | | 1,269 | |
7.150% due 04/01/2021 | | | | | 18,491 | | | | | | 19,635 | |
Numericable SFR S.A. | |
5.375% due 05/15/2022 | | EUR | | | 700 | | | | | | 791 | |
Ooredoo International Finance Ltd. | |
5.000% due 10/19/2025 | | $ | | | 11,800 | | | | | | 13,237 | |
Petrofac Ltd. | |
3.400% due 10/10/2018 | | | | | 1,200 | | | | | | 1,201 | |
Pfizer, Inc. | |
6.050% due 03/30/2017 | | | | | 1,700 | | | | | | 1,765 | |
Phosagro OAO Via Phosagro Bond Funding Ltd. | |
4.204% due 02/13/2018 | | | | | 4,300 | | | | | | 4,407 | |
Rockies Express Pipeline LLC | |
5.625% due 04/15/2020 | | | | | 100 | | | | | | 101 | |
Severstal OAO Via Steel Capital S.A. | |
6.700% due 10/25/2017 | | | | | 500 | | | | | | 527 | |
Sibur Securities Designated Activity Co. | |
3.914% due 01/31/2018 | | | | | 4,400 | | | | | | 4,466 | |
Tennessee Gas Pipeline Co. LLC | |
7.500% due 04/01/2017 | | | | | 1,950 | | | | | | 2,031 | |
TransCanada PipeLines Ltd. | |
3.800% due 10/01/2020 | | | | | 1,100 | | | | | | 1,170 | |
UAL Pass-Through Trust | |
9.750% due 07/15/2018 | | | | | 840 | | | | | | 870 | |
10.400% due 05/01/2018 | | | | | 681 | | | | | | 701 | |
USG Corp. | |
9.750% due 01/15/2018 | | | | | 2,407 | | | | | | 2,651 | |
Vale Overseas Ltd. | |
8.250% due 01/17/2034 (e) | | | | | 1,000 | | | | | | 1,051 | |
Virgin Media Secured Finance PLC | |
6.000% due 04/15/2021 | | GBP | | | 7,290 | | | | | | 10,032 | |
| | | | | | | | | | | | |
| | | | | | | | | | | 171,071 | |
| | | | | | | | | | | | |
| | | | | | | | | | | | |
| UTILITIES 5.4% | |
AK Transneft OJSC Via TransCapitalInvest Ltd. | |
8.700% due 08/07/2018 | | $ | | | 700 | | | | | | 790 | |
FirstEnergy Corp. | |
2.750% due 03/15/2018 | | | | | 2,000 | | | | | | 2,026 | |
Gazprom OAO Via Gaz Capital S.A. | |
6.510% due 03/07/2022 | | | | | 1,300 | | | | | | 1,427 | |
8.146% due 04/11/2018 | | | | | 600 | | | | | | 659 | |
Intergas Finance BV | |
6.375% due 05/14/2017 | | | | | 895 | | | | | | 922 | |
| | | | | | |
| 38 | | PIMCO MANAGED ACCOUNTS TRUST | | | | See Accompanying Notes |
(Unaudited)
June 30, 2016
| | | | | | | | | | | | |
| | | | | PRINCIPAL
AMOUNT
(000S) | | | | | MARKET
VALUE
(000S) | |
NRG Energy, Inc. | |
7.625% due 01/15/2018 | | $ | | | 2,016 | | | $ | | | 2,177 | |
Petrobras Global Finance BV | |
7.875% due 03/15/2019 | | | | | 17,000 | | | | | | 17,595 | |
Qwest Corp. | |
6.500% due 06/01/2017 | | | | | 1,250 | | | | | | 1,299 | |
Rosneft Finance S.A. | |
6.625% due 03/20/2017 | | | | | 5,150 | | | | | | 5,305 | |
7.500% due 07/18/2016 | | | | | 3,800 | | | | | | 3,810 | |
7.875% due 03/13/2018 | | | | | 3,700 | | | | | | 4,005 | |
Rosneft Oil Co. Via Rosneft International Finance Ltd. | |
3.149% due 03/06/2017 | | | | | 4,500 | | | | | | 4,523 | |
Sprint Communications, Inc. | |
7.000% due 08/15/2020 | | | | | 1,000 | | | | | | 899 | |
SSE PLC | |
5.625% due 10/01/2017 (c) | | EUR | | | 5,000 | | | | | | 5,786 | |
TECO Finance, Inc. | |
6.572% due 11/01/2017 | | $ | | | 983 | | | | | | 1,044 | |
Verizon Communications, Inc. | |
3.500% due 11/01/2021 | | | | | 600 | | | | | | 647 | |
4.500% due 09/15/2020 | | | | | 24,400 | | | | | | 27,118 | |
W3A Funding Corp. | |
8.090% due 01/02/2017 | | | | | 33 | | | | | | 33 | |
| | | | | | | | | | | | |
| | | | | | | | | | | 80,065 | |
| | | | | | | | | | | | |
Total Corporate Bonds & Notes (Cost $770,837) | | | 798,026 | |
| | | | | | | | | | | | |
| | | | | | | | | | | | |
| MUNICIPAL BONDS & NOTES 1.2% | |
| | | | | | | | | | | | |
| CALIFORNIA 0.8% | |
Los Angeles County, California Public Works Financing Authority Revenue Bonds, (BABs), Series 2010 | |
7.488% due 08/01/2033 | | | | | 5,950 | | | | | | 8,388 | |
Los Angeles Department of Water & Power, California Revenue Bonds, Series 2010 | |
5.516% due 07/01/2027 | | | | | 3,000 | | | | | | 3,850 | |
| | | | | | | | | | | | |
| | | | | | | | | | | 12,238 | |
| | | | | | | | | | | | |
| | | | | | | | | | | | |
| ILLINOIS 0.2% | |
Chicago, Illinois General Obligation Bonds, Series 2015 | |
7.375% due 01/01/2033 | | | | | 1,500 | | | | | | 1,584 | |
7.750% due 01/01/2042 | | | | | 850 | | | | | | 864 | |
| | | | | | | | | | | | |
| | | | | | | | | | | 2,448 | |
| | | | | | | | | | | | |
| | | | | | | | | | | | |
| NEW YORK 0.2% | |
New York City, New York Transitional Finance Authority Future Tax Secured Revenue Bonds, (BABs), Series 2010 | |
4.525% due 11/01/2022 | | | | | 800 | | | | | | 917 | |
| | | | | | | | | | | | |
| | | | | PRINCIPAL
AMOUNT
(000S) | | | | | MARKET
VALUE
(000S) | |
New York State Dormitory Authority Revenue Bonds, (BABs), Series 2010 | |
5.289% due 03/15/2033 | | $ | | | 1,600 | | | $ | | | 2,051 | |
| | | | | | | | | | | | |
| | | | | | | | | | | 2,968 | |
| | | | | | | | | | | | |
Total Municipal Bonds & Notes
(Cost $13,612) | | | 17,654 | |
| | | | | | | | | | | | |
| | | | | | | | | | | | |
| U.S. GOVERNMENT AGENCIES 26.5% | |
Fannie Mae | |
1.940% due 08/25/2018 | | | | | 1 | | | | | | 1 | |
4.095% due 04/01/2017 | | | | | 0 | | | | | | 1 | |
4.500% due 08/01/2039 - 11/01/2041 | | | | | 417 | | | | | | 458 | |
Fannie Mae, TBA | |
3.000% due 07/01/2031 - 08/01/2046 | | | | | 139,000 | | | | | | 144,930 | |
3.500% due 07/01/2031 - 08/01/2046 | | | | | 176,000 | | | | | | 185,593 | |
4.000% due 07/01/2046 - 08/01/2046 | | | | | 21,000 | | | | | | 22,493 | |
5.000% due 07/01/2046 | | | | | 33,000 | | | | | | 36,661 | |
Freddie Mac | |
1.875% due 12/01/2018 | | | | | 3 | | | | | | 3 | |
6.500% due 01/01/2038 - 10/01/2038 | | | | | 65 | | | | | | 75 | |
Ginnie Mae | |
2.000% due 01/20/2022 | | | | | 5 | | | | | | 5 | |
| | | | | | | | | | | | |
Total U.S. Government Agencies (Cost $388,832) | | | 390,220 | |
| | | | | | | | | | | | |
| | | | | | | | | | | | |
| U.S. TREASURY OBLIGATIONS 39.1% | |
U.S. Treasury Bonds | |
2.875% due 08/15/2045 (g)(i) | | | 51,200 | | | | | | 57,510 | |
3.000% due 05/15/2045 (e)(i) | | | 336,900 | | | | | | 387,665 | |
U.S. Treasury Inflation Protected Securities (b) | |
0.250% due 01/15/2025 (g) | | | | | 11,918 | | | | | | 12,113 | |
2.500% due 01/15/2029 (g) | | | | | 83,567 | | | | | | 106,055 | |
U.S. Treasury Notes | |
1.500% due 02/28/2019 (g)(i) | | | 12,030 | | | | | | 12,291 | |
| | | | | | | | | | | | |
Total U.S. Treasury Obligations
(Cost $516,717) | | | 575,634 | |
| | | | | | | | | | | | |
| | | | | | | | | | | | |
| NON-AGENCY MORTGAGE-BACKED SECURITIES 6.6% | |
Banc of America Commercial Mortgage Trust | |
5.723% due 06/10/2049 | | | | | 8,742 | | | | | | 8,967 | |
5.889% due 07/10/2044 | | | | | 603 | | | | | | 602 | |
Banc of America Funding Trust | |
3.017% due 01/20/2047 ^ | | | | | 97 | | | | | | 82 | |
BCAP LLC Trust | |
0.335% due 09/26/2035 | | | | | 11 | | | | | | 11 | |
| | | | | | |
| See Accompanying Notes | | SEMIANNUAL REPORT | | JUNE 30, 2016 | | 39 |
Schedule of Investments PIMCO Fixed Income SHares: Series C (Cont.)
| | | | | | | | | | | | |
| | | | | PRINCIPAL
AMOUNT
(000S) | | | | | MARKET
VALUE
(000S) | |
Bear Stearns Adjustable Rate Mortgage Trust | |
2.782% due 10/25/2033 | | $ | | | 57 | | | $ | | | 57 | |
2.924% due 03/25/2035 | | | | | 118 | | | | | | 119 | |
2.973% due 05/25/2034 | | | | | 42 | | | | | | 40 | |
Bear Stearns ALT-A Trust | |
2.835% due 02/25/2036 ^ | | | | | 856 | | | | | | 600 | |
Bear Stearns Commercial Mortgage Securities Trust | |
5.537% due 10/12/2041 | | | | | 465 | | | | | | 466 | |
Canadian Mortgage Pools | |
1.241% due 07/01/2020 | | CAD | | | 7,323 | | | | | | 5,642 | |
Citigroup Mortgage Loan Trust, Inc. | |
2.430% due 09/25/2035 | | $ | | | 240 | | | | | | 239 | |
2.760% due 09/25/2035 | | | | | 217 | | | | | | 216 | |
Commercial Mortgage Trust | |
6.007% due 12/10/2049 | | | | | 1,000 | | | | | | 1,032 | |
Cordusio RMBS SRL | |
0.008% due 06/30/2035 | | EUR | | | 94 | | | | | | 103 | |
Countrywide Alternative Loan Trust | |
0.653% due 05/25/2036 | | $ | | | 74 | | | | | | 55 | |
Countrywide Home Loan Mortgage Pass-Through Trust | |
1.093% due 03/25/2035 | | | | | 171 | | | | | | 125 | |
3.002% due 08/25/2034 ^ | | | | | 30 | | | | | | 25 | |
Credit Suisse First Boston Mortgage Securities Corp. | |
2.677% due 07/25/2033 | | | | | 8 | | | | | | 8 | |
Credit Suisse Mortgage Capital Certificates | |
5.342% due 12/16/2043 | | | | | 1,100 | | | | | | 1,103 | |
Downey Savings & Loan Association Mortgage Loan Trust | |
0.708% due 08/19/2045 | | | | | 1,312 | | | | | | 1,115 | |
2.667% due 07/19/2044 | | | | | 756 | | | | | | 746 | |
GreenPoint Mortgage Funding Trust | |
0.913% due 06/25/2045 | | | | | 2,345 | | | | | | 2,044 | |
Greenpoint Mortgage Pass-Through Certificates | |
3.135% due 10/25/2033 | | | | | 7 | | | | | | 7 | |
GSR Mortgage Loan Trust | |
2.220% due 03/25/2033 | | | | | 37 | | | | | | 36 | |
2.876% due 09/25/2035 | | | | | 359 | | | | | | 361 | |
2.978% due 09/25/2035 | | | | | 848 | | | | | | 869 | |
HarborView Mortgage Loan Trust | |
0.638% due 01/19/2038 | | | | | 202 | | | | | | 169 | |
0.788% due 06/20/2035 | | | | | 329 | | | | | | 300 | |
2.887% due 05/19/2033 | | | | | 80 | | | | | | 79 | |
HomeBanc Mortgage Trust | |
0.713% due 01/25/2036 | | | | | 1,879 | | | | | | 1,629 | |
2.728% due 04/25/2037 ^ | | | | | 175 | | | | | | 141 | |
JPMorgan Chase Commercial Mortgage Securities Trust | |
5.336% due 05/15/2047 | | | | | 1,573 | | | | | | 1,587 | |
5.794% due 02/12/2051 | | | | | 972 | | | | | | 1,010 | |
JPMorgan Mortgage Trust | |
2.467% due 11/25/2033 | | | | | 50 | | | | | | 47 | |
| | | | | | | | | | | | |
| | | | | PRINCIPAL
AMOUNT
(000S) | | | | | MARKET
VALUE
(000S) | |
2.827% due 07/25/2035 | | $ | | | 685 | | | $ | | | 685 | |
2.870% due 07/25/2035 | | | | | 437 | | | | | | 429 | |
2.954% due 02/25/2035 | | | | | 43 | | | | | | 41 | |
LB-UBS Commercial Mortgage Trust | |
5.387% due 02/15/2040 | | | | | 23,402 | | | | | | 23,816 | |
5.424% due 02/15/2040 | | | | | 12,086 | | | | | | 12,239 | |
Morgan Stanley Capital Trust | |
5.319% due 12/15/2043 | | | | | 5,058 | | | | | | 5,093 | |
5.328% due 11/12/2041 | | | | | 1,515 | | | | | | 1,517 | |
5.332% due 12/15/2043 | | | | | 282 | | | | | | 283 | |
5.692% due 04/15/2049 | | | | | 5,395 | | | | | | 5,498 | |
RBSSP Resecuritization Trust | |
0.733% due 05/26/2037 | | | | | 5 | | | | | | 5 | |
0.944% due 09/26/2034 | | | | | 2,567 | | | | | | 2,434 | |
0.944% due 03/26/2036 | | | | | 273 | | | | | | 272 | |
0.949% due 04/26/2037 | | | | | 2,045 | | | | | | 1,894 | |
Residential Accredit Loans, Inc. Trust | |
0.663% due 04/25/2046 | | | | | 1,117 | | | | | | 493 | |
Structured Adjustable Rate Mortgage Loan Trust | |
2.830% due 02/25/2034 | | | | | 77 | | | | | | 77 | |
Structured Asset Securities Corp. Mortgage Pass-Through Certificates | |
5.250% due 09/25/2034 | | | | | 300 | | | | | | 302 | |
Wachovia Bank Commercial Mortgage Trust | |
0.656% due 04/15/2047 | | | | | 3,600 | | | | | | 3,570 | |
5.889% due 06/15/2049 | | | | | 6,000 | | | | | | 6,185 | |
WaMu Mortgage Pass-Through Certificates Trust | |
0.763% due 01/25/2045 | | | | | 131 | | | | | | 124 | |
1.193% due 11/25/2034 | | | | | 1,425 | | | | | | 1,277 | |
1.437% due 02/25/2046 | | | | | 865 | | | | | | 787 | |
Wells Fargo Mortgage-Backed Securities Trust | |
2.844% due 03/25/2036 | | | | | 371 | | | | | | 356 | |
| | | | | | | | | | | | |
Total Non-Agency Mortgage-Backed Securities
(Cost $99,052) | | | 97,009 | |
| | | | | | | | | | | | |
| | | | | | | | | | | | |
| ASSET-BACKED SECURITIES 3.8% | |
Ameriquest Mortgage Securities Trust | |
0.843% due 03/25/2036 | | | | | 100 | | | | | | 89 | |
Bear Stearns Asset-Backed Securities Trust | |
0.653% due 12/25/2036 | | | | | 1,378 | | | | | | 1,311 | |
0.863% due 12/25/2035 | | | | | 934 | | | | | | 916 | |
1.453% due 10/25/2037 | | | | | 361 | | | | | | 335 | |
BNC Mortgage Loan Trust | |
0.553% due 05/25/2037 | | | | | 600 | | | | | | 588 | |
Conseco Financial Corp. | |
6.220% due 03/01/2030 | | | | | 131 | | | | | | 138 | |
6.530% due 02/01/2031 | | | | | 2,750 | | | | | | 2,761 | |
First Franklin Mortgage Loan Trust | |
0.943% due 09/25/2035 | | | | | 1,058 | | | | | | 1,041 | |
First NLC Trust | |
1.158% due 12/25/2035 | | | | | 909 | | | | | | 852 | |
| | | | | | |
| 40 | | PIMCO MANAGED ACCOUNTS TRUST | | | | See Accompanying Notes |
(Unaudited)
June 30, 2016
| | | | | | | | | | | | |
| | | | | PRINCIPAL
AMOUNT
(000S) | | | | | MARKET
VALUE
(000S) | |
Home Equity Asset Trust | |
1.653% due 10/25/2033 | | $ | | | 668 | | | $ | | | 618 | |
Mariner CLO LLC | |
2.221% due 07/23/2026 (a) | | | 29,300 | | | | | | 29,300 | |
Merrill Lynch Mortgage Investors Trust | |
0.573% due 02/25/2037 | | | | | 201 | | | | | | 91 | |
Morgan Stanley ABS Capital, Inc. Trust | |
1.098% due 09/25/2035 | | | | | 500 | | | | | | 453 | |
Morgan Stanley Mortgage Loan Trust | |
0.813% due 04/25/2037 | | | | | 149 | | | | | | 72 | |
Neuberger Berman CLO Ltd. | |
1.931% due 07/25/2023 (a) | | | 12,450 | | | | | | 12,450 | |
Nomura Home Equity Loan, Inc. Home Equity Loan Trust | |
1.338% due 09/25/2035 | | | | | 1,000 | | | | | | 891 | |
Residential Asset Mortgage Products Trust | |
2.103% due 11/25/2034 | | | | | 214 | | | | | | 204 | |
Structured Asset Investment Loan Trust | |
1.143% due 06/25/2035 | | | | | 904 | | | | | | 889 | |
Structured Asset Securities Corp. Mortgage Loan Trust | |
0.793% due 02/25/2036 | | | | | 1,000 | | | | | | 909 | |
0.903% due 11/25/2035 | | | | | 1,200 | | | | | | 1,103 | |
Wells Fargo Home Equity Asset-Backed Securities Trust | |
1.043% due 11/25/2035 | | | | | 1,500 | | | | | | 1,389 | |
1.503% due 10/25/2034 | | | | | 335 | | | | | | 315 | |
| | | | | | | | | | | | |
Total Asset-Backed Securities
(Cost $55,338) | | | | | | 56,715 | |
| | | | | | | | | | | | |
| | | | | | | | | | | | |
| SOVEREIGN ISSUES 3.4% | |
Banco Nacional de Desenvolvimento Economico e Social | |
3.375% due 09/26/2016 | | | | | 11,700 | | | | | | 11,723 | |
6.369% due 06/16/2018 | | | | | 3,300 | | | | | | 3,460 | |
Colombia Government International Bond | |
7.375% due 01/27/2017 | | | | | 2,000 | | | | | | 2,077 | |
| | | | | | | | | | | | |
| | | | | PRINCIPAL
AMOUNT
(000S) | | | | | MARKET
VALUE
(000S) | |
Indonesia Government International Bond | |
5.125% due 01/15/2045 | | $ | | | 7,500 | | | $ | | | 7,985 | |
Italy Buoni Poliennali Del Tesoro | |
2.500% due 12/01/2024 | | EUR | | | 1,700 | | | | | | 2,100 | |
Mexico Government International Bond | |
4.750% due 03/08/2044 | | $ | | | 4,600 | | | | | | 4,968 | |
Republic of Greece Government International Bond | |
3.800% due 08/08/2017 | | JPY | | | 955,000 | | | | | | 8,751 | |
4.500% due 07/03/2017 | | | | | 820,000 | | | | | | 7,514 | |
South Africa Government International Bond | |
6.875% due 05/27/2019 | | $ | | | 300 | | | | | | 335 | |
Spain Government International Bond | |
2.750% due 10/31/2024 | | EUR | | | 1,500 | | | | | | 1,897 | |
| | | | | | | | | | | | |
Total Sovereign Issues
(Cost $49,791) | | | | | | 50,810 | |
| | | | | | | | | | | | |
| | | | | | | | | | | | |
| SHORT-TERM INSTRUMENTS 0.2% | |
| | | | | | | | | | | | |
| REPURCHASE AGREEMENTS (d) 0.2% | |
| | | | | | | | | | | 3,578 | |
| | | | | | | | | | | | |
Total Short-Term Instruments
(Cost $3,578) | | | | | | 3,578 | |
| | | | | | | | | | | | |
| |
Total Investments in Securities
(Cost $1,904,458) | | | | | | 1,996,344 | |
| |
Total Investments 135.4%
(Cost $1,904,458) | | | $ | | | 1,996,344 | |
| | | | | | | | | | | | |
Financial Derivative
Instruments (f)(h) 0.1% (Cost or Premiums, net $4,606) | | | 1,643 | |
| | | | | | | | | | | | |
| Other Assets and Liabilities, net (35.5)% | | | (523,958 | ) |
| | | | | | | | | | | | |
| Net Assets 100.0% | | | | | | | | $ | | | 1,474,029 | |
| | | | | | | | | | | | |
NOTES TO SCHEDULE OF INVESTMENTS (AMOUNTS IN THOUSANDS*, EXCEPT NUMBER OF CONTRACTS):
| * | A zero balance may reflect actual amounts rounding to less than one thousand. |
| (b) | Principal amount of security is adjusted for inflation. |
| (c) | Perpetual maturity; date shown, if applicable, represents next contractual call date. |
| | | | | | |
| See Accompanying Notes | | SEMIANNUAL REPORT | | JUNE 30, 2016 | | 41 |
Schedule of Investments PIMCO Fixed Income SHares: Series C (Cont.)
BORROWINGS AND OTHER FINANCING TRANSACTIONS
(d) REPURCHASE AGREEMENTS:
| | | | | | | | | | | | | | | | | | | | | | | | | | | | |
| Counterparty | | Lending
Rate | | Settlement
Date | | | Maturity
Date | | | Principal
Amount | | | Collateralized By | | Collateral
(Received) | | | Repurchase
Agreements,
at Value | | | Repurchase
Agreement
Proceeds
to be
Received (1) | |
SSB | | 0.010% | | | 06/30/2016 | | | | 07/01/2016 | | | $ | 3,578 | | | U.S. Treasury Notes
0.750% due 12/31/2017 | | $ | (3,654 | ) | | $ | 3,578 | | | $ | 3,578 | |
| | | | | | | | | | | | | | | | | | | | | | | | | | | | |
Total Repurchase Agreements | | | | | | | | | $ | (3,654 | ) | | $ | 3,578 | | | $ | 3,578 | |
| | | | | | | | | | | | | | | | | | | | | | | | | | | | |
| (1) | Includes accrued interest. |
REVERSE REPURCHASE AGREEMENTS:
| | | | | | | | | | | | | | | | | | | | |
| Counterparty | | Borrowing
Rate (2) | | | Borrowing
Date | | | Maturity
Date | | | Amount
Borrowed (2) | | | Payable for
Reverse
Repurchase
Agreements | |
BOM | | | 0.590 | % | | | 04/27/2016 | | | | 07/27/2016 | | | $ | (49,097 | ) | | $ | (49,149 | ) |
BOS | | | 0.630 | | | | 06/17/2016 | | | | 07/08/2016 | | | | (5,555 | ) | | | (5,557 | ) |
| | | 1.030 | | | | 06/28/2016 | | | | 07/05/2016 | | | | (4,167 | ) | | | (4,167 | ) |
BPS | | | (1.250 | ) | | | 06/20/2016 | | | | 07/01/2016 | | | | (167 | ) | | | (167 | ) |
BSN | | | 0.570 | | | | 04/05/2016 | | | | 07/05/2016 | | | | (328 | ) | | | (329 | ) |
| | | 0.580 | | | | 04/12/2016 | | | | 07/12/2016 | | | | (3,982 | ) | | | (3,988 | ) |
GRE | | | 0.580 | | | | 05/19/2016 | | | | 07/19/2016 | | | | (1,933 | ) | | | (1,934 | ) |
| | | 0.590 | | | | 05/03/2016 | | | | 08/03/2016 | | | | (6,250 | ) | | | (6,255 | ) |
| | | 0.600 | | | | 06/07/2016 | | | | 07/07/2016 | | | | (4,500 | ) | | | (4,502 | ) |
| | | 0.620 | | | | 06/10/2016 | | | | 07/19/2016 | | | | (13,795 | ) | | | (13,800 | ) |
| | | | | | | | | | | | | | | | | | | | |
Total Reverse Repurchase Agreements | | | | | | | | | | | $ | (89,848 | ) |
| | | | | | | | | | | | | | | | | | | | |
SALE-BUYBACK TRANSACTIONS:
| | | | | | | | | | | | | | | | | | | | |
| Counterparty | | Borrowing
Rate (2) | | | Borrowing
Date | | | Maturity
Date | | | Amount
Borrowed (2) | | | Payable for
Sale-Buyback
Transactions (3) | |
GSC | | | 0.630 | % | | | 05/25/2016 | | | | 07/06/2016 | | | $ | (14,991 | ) | | $ | (15,001 | ) |
| | | | | | | | | | | | | | | | | | | | |
Total Sale-Buyback Transactions | | | | | | | | | | | $ | (15,001 | ) |
| | | | | | | | | | | | | | | | | | | | |
| (2) | The average amount of borrowings outstanding during the period ended June 30, 2016 was $(129,607) at a weighted average interest rate of 0.612%. |
| (3) | Payable for sale-buyback transactions includes $(1) of deferred price drop. |
SHORT SALES:
SHORT SALES ON U.S. GOVERNMENT AGENCIES
| | | | | | | | | | | | | | | | | | | | |
| Description | | Coupon | | | Maturity
Date | | | Principal
Amount | | | Proceeds | | | Payable for
Short Sales | |
Fannie Mae, TBA | | | 3.500 | % | | | 07/01/2046 | | | $ | 35,000 | | | $ | (36,752 | ) | | $ | (36,926 | ) |
| | | | | | | | | | | | | | | | | | | | |
Total Short Sales | | | | | | | | | | | | | | $ | (36,752 | ) | | $ | (36,926 | ) |
| | | | | | | | | | | | | | | | | | | | |
| | | | | | |
| 42 | | PIMCO MANAGED ACCOUNTS TRUST | | | | See Accompanying Notes |
(Unaudited)
June 30, 2016
BORROWINGS AND OTHER FINANCING TRANSACTIONS SUMMARY
The following is a summary by counterparty of the market value of Borrowings and Other Financing Transactions and collateral (received)/pledged as of June 30, 2016:
| (e) | Securities with an aggregate market value of $111,320 have been pledged as collateral under the terms of the following master agreements as of June 30, 2016. |
| | | | | | | | | | | | | | | | | | | | | | | | |
| Counterparty | | Repurchase
Agreement
Proceeds to be
Received | | | Payable for
Reverse
Repurchase
Agreements | | | Payable for
Sale-Buyback
Transactions | | | Total
Borrowings and
Other Financing
Transactions | | | Collateral
(Received)/
Pledged | | | Net Exposure (4) | |
Global/Master Repurchase Agreement | | | | | | | | | | | | | | | | | | | | | | | | |
BOM | | $ | 0 | | | $ | (49,149 | ) | | $ | 0 | | | $ | (49,149 | ) | | $ | 50,568 | | | $ | 1,419 | |
BOS | | | 0 | | | | (9,724 | ) | | | 0 | | | | (9,724 | ) | | | 9,781 | | | | 57 | |
BPS | | | 0 | | | | (167 | ) | | | 0 | | | | (167 | ) | | | 164 | | | | (3 | ) |
BSN | | | 0 | | | | (4,317 | ) | | | 0 | | | | (4,317 | ) | | | 4,488 | | | | 171 | |
GRE | | | 0 | | | | (26,491 | ) | | | 0 | | | | (26,491 | ) | | | 26,282 | | | | (209 | ) |
SGY | | | 0 | | | | 0 | | | | 0 | | | | 0 | | | | (489 | ) | | | (489 | ) |
SSB | | | 3,578 | | | | 0 | | | | 0 | | | | 3,578 | | | | (3,654 | ) | | | (76 | ) |
| | | | | | |
Master Securities Forward Transaction Agreement | | | | | | | | | | | | | | | | | | | | | | | | |
GSC | | | 0 | | | | 0 | | | | (15,001 | ) | | | (15,001 | ) | | | 14,899 | | | | (102 | ) |
SAL | | | 0 | | | | 0 | | | | 0 | | | | 0 | | | | (343 | ) | | | (343 | ) |
| | | | | | | | | | | | | | | | | | | | | | | | |
Total Borrowings and Other Financing Transactions | | $ | 3,578 | | | $ | (89,848 | ) | | $ | (15,001 | ) | | | | | | | | | | | | |
| | | | | | | | | | | | | | | | | | | | | | | | |
| (4) | Net Exposure represents the net receivable/(payable) that would be due from/to the counterparty in the event of default. Exposure from borrowings and other financing transactions can only be netted across transactions governed under the same master agreement with the same legal entity. See Note 7, Principal Risks, in the Notes to Financial Statements for more information regarding master netting arrangements. |
CERTAIN TRANSFERS ACCOUNTED FOR AS SECURED BORROWINGS
Remaining Contractual Maturity of the Agreements
| | | | | | | | | | | | | | | | | | | | |
| | | Overnight and
Continuous | | | Up to 30 days | | | 31-90 days | | | Greater Than 90 days | | | Total | |
Reverse Repurchase Agreements | | | | | | | | | | | | | | | | | | | | |
Corporate Bonds & Notes | | $ | (167 | ) | | $ | 0 | | | $ | 0 | | | $ | 0 | | | $ | (167) | |
U.S. Treasury Obligations | | | 0 | | | | (83,425 | ) | | | (6,256 | ) | | | 0 | | | | (89,681) | |
| | | | | | | | | | | | | | | | | | | | |
Total | | $ | (167 | ) | | $ | (83,425 | ) | | $ | (6,256 | ) | | $ | 0 | | | $ | (89,848) | |
| | | | | |
Sale-Buyback Transactions | | | | | | | | | | | | | | | | | | | | |
U.S. Treasury Obligations | | | 0 | | | | (15,001 | ) | | | 0 | | | | 0 | | | | (15,001) | |
| | | | | | | | | | | | | | | | | | | | |
Total | | $ | 0 | | | $ | (15,001 | ) | | $ | 0 | | | $ | 0 | | | $ | (15,001) | |
| | | | | | | | | | | | | | | | | | | | |
Total Borrowings | | $ | (167 | ) | | $ | (98,426 | ) | | $ | (6,256 | ) | | $ | 0 | | | $ | (104,849) | |
| | | | | | | | | | | | | | | | | | | | |
Gross amount of recognized liabilities for reverse repurchase agreements and sale-buyback financing transactions | | | $ | (104,849) | |
| | | | | | | | | | | | | | | | | | | | |
| | | | | | |
| See Accompanying Notes | | SEMIANNUAL REPORT | | JUNE 30, 2016 | | 43 |
Schedule of Investments PIMCO Fixed Income SHares: Series C (Cont.)
(f) FINANCIAL DERIVATIVE INSTRUMENTS: EXCHANGE-TRADED OR CENTRALLY CLEARED
PURCHASED OPTIONS:
OPTIONS ON EXCHANGE-TRADED FUTURES CONTRACTS
| | | | | | | | | | | | | | | | | | | | |
| Description | | Strike
Price | | | Expiration
Date | | | # of
Contracts | | | Cost | | | Market
Value | |
Put - CBOT U.S. Treasury 5-Year Note September Futures | | $ | 112.250 | | | | 08/26/2016 | | | | 4,495 | | | $ | 39 | | | $ | 4 | |
Put - CBOT U.S. Treasury 10-Year Note September Futures | | | 114.000 | | | | 08/26/2016 | | | | 952 | | | | 8 | | | | 1 | |
| | | | | | | | | | | | | | | | | | | | |
| | | | | | | | | | | | | | $ | 47 | | | $ | 5 | |
| | | | | | | | | | | | | | | | | | | | |
Total Purchased Options | | | | | | | | | | | | | | $ | 47 | | | $ | 5 | |
| | | | | | | | | | | | | | | | | | | | |
FUTURES CONTRACTS:
| | | | | | | | | | | | | | | | | | | | | | | | |
| Description | | Type | | | Expiration
Month | | | # of
Contracts | | | Unrealized
Appreciation/
(Depreciation) | | | Variation Margin | |
| | | | | | Asset | | | Liability | |
Euro-BTP Italy Government Bond September Futures | | | Long | | | | 09/2016 | | | | 46 | | | $ | 88 | | | $ | 48 | | | $ | 0 | |
Euro-Bund 10-Year Bond September Futures | | | Short | | | | 09/2016 | | | | 198 | | | | (819 | ) | | | 0 | | | | (57 | ) |
U.S. Treasury 5-Year Note September Futures | | | Long | | | | 09/2016 | | | | 4,495 | | | | 10,108 | | | | 351 | | | | 0 | |
United Kingdom Long Gilt September Futures | | | Short | | | | 09/2016 | | | | 306 | | | | (2,440 | ) | | | 0 | | | | (196 | ) |
| | | | | | | | | | | | | | | | | | | | | | | | |
Total Futures Contracts | | | | | | | | | | | | | | $ | 6,937 | | | $ | 399 | | | $ | (253 | ) |
| | | | | | | | | | | | | | | | | | | | | | | | |
SWAP AGREEMENTS:
CREDIT DEFAULT SWAPS ON CREDIT INDICES - SELL PROTECTION (1)
| | | | | | | | | | | | | | | | | | | | | | | | | | | | | | | | |
| Index/Tranches | | Fixed
Receive Rate | | | Maturity
Date | | | Notional
Amount (2) | | | Market
Value (3) | | | Unrealized
Appreciation/
(Depreciation) | | | Variation Margin | |
| | | | | | | Asset | | | Liability | |
CDX.HY-24 5-Year Index | | | 5.000 | % | | | 06/20/2020 | | | $ | | | | | 3,724 | | | $ | 227 | | | $ | (22) | | | $ | 13 | | | $ | 0 | |
CDX.HY-25 5-Year Index | | | 5.000 | | | | 12/20/2020 | | | | | | | | 1,188 | | | | 51 | | | | 31 | | | | 5 | | | | 0 | |
iTraxx Europe Senior 25 5-Year Index | | | 1.000 | | | | 06/20/2021 | | | | EUR | | | | 100,000 | | | | (626 | ) | | | 352 | | | | 321 | | | | 0 | |
| | | | | | | | | | | | | | | | | | | | | | | | | | | | | | | | |
| | | | | | | | | | | | | | | | | | $ | (348 | ) | | $ | 361 | | | $ | 339 | | | $ | 0 | |
| | | | | | | | | | | | | | | | | | | | | | | | | | | | | | | | |
| (1) | If the Portfolio is a seller of protection and a credit event occurs, as defined under the terms of that particular swap agreement, the Portfolio will either (i) pay to the buyer of protection an amount equal to the notional amount of the swap and take delivery of the referenced obligation or underlying securities comprising the referenced index or (ii) pay a net settlement amount in the form of cash or securities equal to the notional amount of the swap less the recovery value of the referenced obligation or underlying securities comprising the referenced index. |
| (2) | The maximum potential amount the Portfolio could be required to pay as a seller of credit protection or receive as a buyer of credit protection if a credit event occurs as defined under the terms of that particular swap agreement. |
| (3) | The prices and resulting values for credit default swap agreements on credit indices serve as an indicator of the current status of the payment/performance risk and represent the likelihood of an expected liability (or profit) for the credit derivative should the notional amount of the swap agreement be closed/sold as of the period end. Increasing market values, in absolute terms when compared to the notional amount of the swap, represent a deterioration of the referenced indices’ credit soundness and a greater likelihood or risk of default or other credit event occurring as defined under the terms of the agreement. |
| | | | | | |
| 44 | | PIMCO MANAGED ACCOUNTS TRUST | | | | See Accompanying Notes |
(Unaudited)
June 30, 2016
INTEREST RATE SWAPS
| | | | | | | | | | | | | | | | | | | | | | | | | | | | | | | | | | |
Pay/Receive
Floating Rate | | Floating Rate Index | | Fixed Rate | | | Maturity
Date | | | Notional
Amount | | | Market
Value | | | Unrealized
Appreciation/
(Depreciation) | | | Variation Margin | |
| | | | | | | | Asset | | | Liability | |
Receive | | 3-Month USD-LIBOR | | | 1.500% | | | | 12/16/2017 | | | | $ | | | | 426,800 | | | $ | (5,107 | ) | | $ | (3,073 | ) | | $ | 0 | | | $ | (86 | ) |
Pay | | 3-Month USD-LIBOR | | | 2.000 | | | | 12/16/2020 | | | | | | | | 283,900 | | | | 13,242 | | | | 7,637 | | | | 14 | | | | 0 | |
Receive | | 3-Month USD-LIBOR | | | 2.550 | | | | 03/23/2026 | | | | | | | | 820,100 | | | | (28,781 | ) | | | (25,296 | ) | | | 1,700 | | | | 0 | |
Receive | | 3-Month USD-LIBOR * | | | 1.750 | | | | 12/21/2026 | | | | | | | | 65,900 | | | | (1,729 | ) | | | (1,130 | ) | | | 159 | | | | 0 | |
Receive | | 3-Month USD-LIBOR | | | 2.500 | | | | 06/15/2046 | | | | | | | | 400,100 | | | | (60,704 | ) | | | (35,123 | ) | | | 4,389 | | | | 0 | |
Pay | | 6-Month EUR-EURIBOR | | | 4.000 | | | | 09/16/2019 | | | | EUR | | | | 4,000 | | | | 745 | | | | 142 | | | | 0 | | | | 0 | |
Receive | | 6-Month EUR-EURIBOR * | | | 0.750 | | | | 09/21/2026 | | | | | | | | 3,400 | | | | (137 | ) | | | (129 | ) | | | 0 | | | | (12 | ) |
Receive | | 6-Month JPY-LIBOR | | | 1.000 | | | | 09/18/2023 | | | | JPY | | | | 7,920,000 | | | | (6,463 | ) | | | (4,781 | ) | | | 21 | | | | 0 | |
Pay | | 28-Day MXN-TIIE | | | 5.500 | | | | 09/13/2017 | | | | MXN | | | | 1,008,000 | | | | 432 | | | | (1,904 | ) | | | 0 | | | | (55 | ) |
Pay | | 28-Day MXN-TIIE | | | 7.780 | | | | 04/09/2019 | | | | | | | | 91,800 | | | | 359 | | | | (314 | ) | | | 0 | | | | (3 | ) |
Pay | | 28-Day MXN-TIIE | | | 6.000 | | | | 06/07/2022 | | | | | | | | 1,039,800 | | | | 1,053 | | | | 1,004 | | | | 215 | | | | 0 | |
Pay | | 28-Day MXN-TIIE | | | 6.300 | | | | 04/26/2024 | | | | | | | | 1,300,000 | | | | 2,107 | | | | 579 | | | | 465 | | | | 0 | |
Pay | | 28-Day MXN-TIIE | | | 6.150 | | | | 06/07/2024 | | | | | | | | 887,000 | | | | 879 | | | | 1,554 | | | | 325 | | | | 0 | |
Pay | | 28-Day MXN-TIIE | | | 5.805 | | | | 12/30/2024 | | | | | | | | 82,900 | | | | (45 | ) | | | (45 | ) | | | 34 | | | | 0 | |
| | | | | | | | | | | | | | | | | | | | | | | | | | | | | | | | | | |
| | | | | | | | | | | | | | | | | | | | $ | (84,149 | ) | | $ | (60,879 | ) | | $ | 7,322 | | | $ | (156 | ) |
| | | | | | | | | | | | | | | | | | | | | | | | | | | | | | | | | | |
Total Swap Agreements | | | | | | | | | | | $ | (84,497 | ) | | $ | (60,518 | ) | | $ | 7,661 | | | $ | (156 | ) |
| | | | | | | | | | | | | | | | | | | | | | | | | | | | | | | | | | |
| * | This security has a forward starting effective date. See Note 2(a) in the Notes to Financial Statements for further information. |
FINANCIAL DERIVATIVE INSTRUMENTS: EXCHANGE-TRADED OR CENTRALLY CLEARED SUMMARY
The following is a summary of the market value and variation margin of Exchange-Traded or Centrally Cleared Financial Derivative Instruments as of June 30, 2016:
| (g) | Securities with an aggregate market value of $65,819 and cash of $3,117 have been pledged as collateral for exchange-traded and centrally cleared financial derivative instruments as of June 30, 2016. See Note 7, Principal Risks, in the Notes to Financial Statements for more information regarding master netting arrangements. |
| | | | | | | | | | | | | | | | | | | | | | | | | | | | | | | | | | | | |
| | | Financial Derivative Assets | | | | | | Financial Derivative Liabilities | |
| | | Market Value | | | Variation Margin
Asset | | | | | | | | | Market Value | | | Variation Margin
Liability (4) | | | | |
| | | Purchased
Options | | | Futures | | | Swap
Agreements | | | Total | | | | | | Written
Options | | | Futures | | | Swap
Agreements | | | Total | |
Total Exchange-Traded or Centrally Cleared | | $ | 5 | | | $ | 399 | | | $ | 7,661 | | | $ | 8,065 | | | | | | | $ | 0 | | | $ | (393) | | | $ | (156) | | | $ | (549) | |
| | | | | | | | | | | | | | | | | | | | | | | | | | | | | | | | | | | | |
| (4) | Unsettled variation margin liability of $(140) for closed futures is outstanding at period end. |
(h) FINANCIAL DERIVATIVE INSTRUMENTS: OVER THE COUNTER
FORWARD FOREIGN CURRENCY CONTRACTS:
| | | | | | | | | | | | | | | | | | | | | | | | | | | | |
| Counterparty | | Settlement
Month | | | Currency to
be Delivered | | | Currency to
be Received | | | Unrealized Appreciation/
(Depreciation) | |
| | | | | Asset | | | Liability | |
AZD | | | 07/2016 | | | $ | | | | | 25,691 | | | | AUD | | | | 34,746 | | | $ | 222 | | | $ | 0 | |
| | | 08/2016 | | | | AUD | | | | 34,746 | | | $ | | | | | 25,665 | | | | 0 | | | | (221 | ) |
| | | | | | | | | | | | | | | | | | | | | | | | | | | | |
BOA | | | 07/2016 | | | | GBP | | | | 5,722 | | | | | | | | 8,390 | | | | 773 | | | | 0 | |
| | | 07/2016 | | | $ | | | | | 64,275 | | | | EUR | | | | 58,326 | | | | 452 | | | | 0 | |
| | | 07/2016 | | | | | | | | 8,978 | | | | GBP | | | | 6,748 | | | | 5 | | | | 0 | |
| | | | | | |
| See Accompanying Notes | | SEMIANNUAL REPORT | | JUNE 30, 2016 | | 45 |
Schedule of Investments PIMCO Fixed Income SHares: Series C (Cont.)
| | | | | | | | | | | | | | | | | | | | | | | | | | | | |
| Counterparty | | Settlement
Month | | | Currency to
be Delivered | | | Currency to
be Received | | | Unrealized Appreciation/
(Depreciation) | |
| | | | | Asset | | | Liability | |
| | | 08/2016 | | | | EUR | | | | 58,326 | | | $ | | | | | 64,344 | | | $ | 0 | | | $ | (449 | ) |
| | | 08/2016 | | | | GBP | | | | 6,748 | | | | | | | | 8,981 | | | | 0 | | | | (5 | ) |
| | | 08/2016 | | | | TWD | | | | 784,098 | | | | | | | | 24,208 | | | | 0 | | | | (122 | ) |
| | | | | | | | | | | | | | | | | | | | | | | | | | | | |
BPS | | | 08/2016 | | | $ | | | | | 164,663 | | | | JPY | | | | 16,889,300 | | | | 0 | | | | (971 | ) |
| | | | | | | | | | | | | | | | | | | | | | | | | | | | |
CBK | | | 07/2016 | | | | GBP | | | | 478 | | | $ | | | | | 679 | | | | 43 | | | | 0 | |
| | | 08/2016 | | | | CAD | | | | 6,735 | | | | | | | | 5,198 | | | | 0 | | | | (15 | ) |
| | | 08/2016 | | | | MXN | | | | 75,960 | | | | | | | | 4,085 | | | | 0 | | | | (49 | ) |
| | | 08/2016 | | | | THB | | | | 910,205 | | | | | | | | 25,840 | | | | 0 | | | | (43 | ) |
| | | 08/2016 | | | $ | | | | | 1,906 | | | | MXN | | | | 35,098 | | | | 7 | | | | (3 | ) |
| | | 08/2016 | | | | | | | | 417 | | | | PLN | | | | 1,602 | | | | 0 | | | | (12 | ) |
| | | | | | | | | | | | | | | | | | | | | | | | | | | | |
GLM | | | 07/2016 | | | | CNH | | | | 165,670 | | | $ | | | | | 24,240 | | | | 0 | | | | (609 | ) |
| | | 07/2016 | | | | EUR | | | | 58,326 | | | | | | | | 65,071 | | | | 343 | | | | 0 | |
| | | 08/2016 | | | | KRW | | | | 3,199,711 | | | | | | | | 2,761 | | | | 0 | | | | (16 | ) |
| | | | | | | | | | | | | | | | | | | | | | | | | | | | |
HUS | | | 10/2016 | | | | CNH | | | | 73,281 | | | | | | | | 11,262 | | | | 316 | | | | 0 | |
| | | | | | | | | | | | | | | | | | | | | | | | | | | | |
JPM | | | 07/2016 | | | | GBP | | | | 1,761 | | | | | | | | 2,384 | | | | 47 | | | | (8 | ) |
| | | 07/2016 | | | | RUB | | | | 4,321,266 | | | | | | | | 67,069 | | | | 0 | | | | (328 | ) |
| | | 08/2016 | | | $ | | | | | 428 | | | | MXN | | | | 7,973 | | | | 6 | | | | 0 | |
| | | 09/2016 | | | | | | | | 66,025 | | | | RUB | | | | 4,321,266 | | | | 297 | | | | 0 | |
| | | 10/2016 | | | | CNH | | | | 370,001 | | | $ | | | | | 56,605 | | | | 1,341 | | | | 0 | |
| | | | | | | | | | | | | | | | | | | | | | | | | | | | |
SCX | | | 07/2016 | | | | AUD | | | | 34,746 | | | | | | | | 24,966 | | | | 0 | | | | (948 | ) |
| | | 07/2016 | | | $ | | | | | 180,769 | | | | JPY | | | | 18,420,322 | | | | 0 | | | | (2,389 | ) |
| | | 08/2016 | | | | JPY | | | | 18,420,322 | | | $ | | | | | 180,959 | | | | 2,428 | | | | 0 | |
| | | | | | | | | | | | | | | | | | | | | | | | | | | | |
SOG | | | 07/2016 | | | $ | | | | | 37,621 | | | | JPY | | | | 3,916,192 | | | | 303 | | | | 0 | |
| | | | | | | | | | | | | | | | | | | | | | | | | | | | |
UAG | | | 07/2016 | | | | EUR | | | | 326 | | | $ | | | | | 359 | | | | 0 | | | | (2 | ) |
| | | 07/2016 | | | | JPY | | | | 22,336,514 | | | | | | | | 203,095 | | | | 0 | | | | (13,208 | ) |
| | | 07/2016 | | | $ | | | | | 1,014 | | | | GBP | | | | 730 | | | | 0 | | | | (42 | ) |
| | | 07/2016 | | | | | | | | 64,016 | | | | RUB | | | | 4,321,266 | | | | 3,380 | | | | 0 | |
| | | 10/2016 | | | | CNH | | | | 16,878 | | | $ | | | | | 2,584 | | | | 64 | | | | 0 | |
| | | | | | | | | | | | | | | | | | | | | | | | | | | | |
Total Forward Foreign Currency Contracts | | | $ | 10,027 | | | $ | (19,440 | ) |
| | | | | | | | | | | | | | | | | | | | | | | | | | | | |
WRITTEN OPTIONS:
AS OF JUNE 30, 2016, THERE WERE NO OPEN WRITTEN OPTIONS. TRANSACTIONS IN WRITTEN CALL AND PUT OPTIONS FOR PERIOD ENDED JUNE 30, 2016:
| | | | | | | | | | | | | | | | | | | | | | | | | | | | | | | | | | | | | | | | | | | | | | | | |
| | | Balance at
Beginning of Period | | | Sales | | | Closing Buys | | | Expirations | | | Exercised | | | Balance at
End of Period | |
Notional Amount in $ | | | $ | | | | 820,100 | | | | $ | | | | 0 | | | | $ | | | | 0 | | | | $ | | | | 0 | | | | $ | | | | (820,100 | ) | | | $ | | | | 0 | |
Notional Amount in EUR | | | EUR | | | | 0 | | | | EUR | | | | 115,600 | | | | EUR | | | | (57,800 | ) | | | EUR | | | | (57,800 | ) | | | EUR | | | | 0 | | | | EUR | | | | 0 | |
Premiums | | | $ | | | | (3,486 | ) | | | $ | | | | (183 | ) | | | $ | | | | 120 | | | | $ | | | | 63 | | | | $ | | | | 3,486 | | | | $ | | | | 0 | |
SWAP AGREEMENTS:
CREDIT DEFAULT SWAPS ON CORPORATE, SOVEREIGN AND U.S. MUNICIPAL ISSUES - SELL PROTECTION (1)
| | | | | | | | | | | | | | | | | | | | | | | | | | | | | | | | | | | | |
Counterparty | | Reference Entity | | Fixed
Receive Rate | | Maturity
Date | | | Implied
Credit
Spread at
June 30,
2016 (2) | | | Notional
Amount (3) | | | Premiums
Paid/(Received) | | | Unrealized
Appreciation/
(Depreciation) | | | Swap Agreements,
at Value | |
| | | | | | | | | Asset | | | Liability | |
BOA | | China Government International Bond | | 1.000% | | | 09/20/2016 | | | | 0.296% | | | | $ | | | | 2,000 | | | $ | 10 | | | $ | (6 | ) | | $ | 4 | | | $ | 0 | |
| | | | | | | | | | | | | | | | | | | | | | | | | | | | | | | | | | | | |
BPS | | Teck Resources Ltd. | | 1.000 | | | 03/20/2019 | | | | 4.100 | | | | | | | | 800 | | | | (23 | ) | | | (41 | ) | | | 0 | | | | (64 | ) |
| | | | | | | | | | | | | | | | | | | | | | | | | | | | | | | | | | | | |
| | | | | | |
| 46 | | PIMCO MANAGED ACCOUNTS TRUST | | | | See Accompanying Notes |
(Unaudited)
June 30, 2016
| | | | | | | | | | | | | | | | | | | | | | | | | | | | | | | | | | | | |
Counterparty | | Reference Entity | | Fixed
Receive Rate | | Maturity
Date | | | Implied
Credit
Spread at
June 30,
2016 (2) | | | Notional
Amount (3) | | | Premiums
Paid/(Received) | | | Unrealized
Appreciation/
(Depreciation) | | | Swap Agreements,
at Value | |
| | | | | | | | | Asset | | | Liability | |
BRC | | Ally Financial, Inc. | | 5.000% | | | 03/20/2020 | | | | 2.367% | | | | $ | | | | 20,500 | | | $ | 3,478 | | | $ | (1,562 | ) | | $ | 1,916 | | | $ | 0 | |
| | China Government International Bond | | 1.000 | | | 09/20/2016 | | | | 0.296 | | | | | | | | 6,000 | | | | 31 | | | | (20 | ) | | | 11 | | | | 0 | |
| | | | | | | | | | | | | | | | | | | | | | | | | | | | | | | | | | | | |
DUB | | Ally Financial, Inc. | | 5.000 | | | 03/20/2020 | | | | 2.367 | | | | | | | | 10,000 | | | | 1,810 | | | | (875 | ) | | | 935 | | | | 0 | |
| | BP Capital Markets America, Inc. | | 1.000 | | | 12/20/2018 | | | | 0.435 | | | | EUR | | | | 4,000 | | | | 106 | | | | (42 | ) | | | 64 | | | | 0 | |
| | | | | | | | | | | | | | | | | | | | | | | | | | | | | | | | | | | | |
GST | | Brazil Government International Bond | | 1.000 | | | 03/20/2018 | | | | 1.216 | | | | $ | | | | 1,200 | | | | (14 | ) | | | 10 | | | | 0 | | | | (4 | ) |
| | California State General Obligation Bonds, Series 2003 | | 1.630 | | | 12/20/2018 | | | | 0.563 | | | | | | | | 3,300 | | | | 0 | | | | 88 | | | | 88 | | | | 0 | |
| | California State General Obligation Bonds, Series 2003 | | 1.650 | | | 12/20/2018 | | | | 0.563 | | | | | | | | 25,000 | | | | 0 | | | | 676 | | | | 676 | | | | 0 | |
| | China Government International Bond | | 1.000 | | | 06/20/2019 | | | | 0.733 | | | | | | | | 25,000 | | | | 370 | | | | (167 | ) | | | 203 | | | | 0 | |
| | | | | | | | | | | | | | | | | | | | | | | | | | | | | | | | | | | | |
JPM | | Brazil Government International Bond | | 1.000 | | | 12/20/2017 | | | | 1.129 | | | | | | | | 12,000 | | | | 0 | | | | (19 | ) | | | 0 | | | | (19 | ) |
| | China Government International Bond | | 1.000 | | | 06/20/2019 | | | | 0.733 | | | | | | | | 50,000 | | | | 740 | | | | (333 | ) | | | 407 | | | | 0 | |
| | | | | | | | | | | | | | | | | | | | | | | | | | | | | | | | | | | | |
MYC | | China Government International Bond | | 1.000 | | | 06/20/2019 | | | | 0.733 | | | | | | | | 25,000 | | | | 370 | | | | (167 | ) | | | 203 | | | | 0 | |
| | France Government International Bond | | 0.250 | | | 09/20/2016 | | | | 0.088 | | | | | | | | 22,300 | | | | (1,053 | ) | | | 1,063 | | | | 10 | | | | 0 | |
| | | | | | | | | | | | | | | | | | | | | | | | | | | | | | | | | | | | |
| | | | | | | | | | | | | | | | | | | | | | $ | 5,825 | | | $ | (1,395 | ) | | $ | 4,517 | | | $ | (87 | ) |
| | | | | | | | | | | | | | | | | | | | | | | | | | | | | | | | | | | | |
CREDIT DEFAULT SWAPS ON CREDIT INDICES - SELL PROTECTION (1)
| | | | | | | | | | | | | | | | | | | | | | | | | | | | | | |
Counterparty | | Index/Tranches | | Fixed
Receive Rate | | | Maturity
Date | | | Notional
Amount (3) | | | Premiums
Paid/(Received) | | | Unrealized
Appreciation | | | Swap Agreements,
at Value (4) | |
| | | | | | | | Asset | | | Liability | |
CBK | | MCDX-26 5-Year Index | | | 1.000% | | | | 06/20/2021 | | | $ | 49,300 | | | $ | 128 | | | $ | 16 | | | $ | 144 | | | $ | 0 | |
| | | | | | | | | | | | | | | | | | | | | | | | | | | | | | |
GST | | MCDX-26 5-Year Index | | | 1.000 | | | | 06/20/2021 | | | | 23,200 | | | | 55 | | | | 13 | | | | 68 | | | | 0 | |
| | | | | | | | | | | | | | | | | | | | | | | | | | | | | | |
MYC | | MCDX-24 10-Year Index | | | 1.000 | | | | 06/20/2025 | | | | 42,800 | | | | (1,449 | ) | | | 347 | | | | 0 | | | | (1,102 | ) |
| | | | | | | | | | | | | | | | | | | | | | | | | | | | | | |
| | | | | | | | | | | | | | | | $ | (1,266 | ) | | $ | 376 | | | $ | 212 | | | $ | (1,102 | ) |
| | | | | | | | | | | | | | | | | | | | | | | | | | | | | | |
Total Swap Agreements | | | | | | | | | | | $ | 4,559 | | | $ | (1,019 | ) | | $ | 4,729 | | | $ | (1,189 | ) |
| | | | | | | | | | | | | | | | | | | | | | | | | | | | | | |
| (1) | If the Portfolio is a seller of protection and a credit event occurs, as defined under the terms of that particular swap agreement, the Portfolio will either (i) pay to the buyer of protection an amount equal to the notional amount of the swap and take delivery of the referenced obligation or underlying securities comprising the referenced index or (ii) pay a net settlement amount in the form of cash or securities equal to the notional amount of the swap less the recovery value of the referenced obligation or underlying securities comprising the referenced index. |
| (2) | Implied credit spreads, represented in absolute terms, utilized in determining the market value of credit default swap agreements on corporate, sovereign or U.S. municipal issues as of period end serve as an indicator of the current status of the payment/performance risk and represent the likelihood or risk of default for the credit derivative. The implied credit spread of a particular referenced entity reflects the cost of buying/selling protection and may include upfront payments required to be made to enter into the agreement. Wider credit spreads represent a deterioration of the referenced entity’s credit soundness and a greater likelihood or risk of default or other credit event occurring as defined under the terms of the agreement. |
| (3) | The maximum potential amount the Portfolio could be required to pay as a seller of credit protection or receive as a buyer of credit protection if a credit event occurs as defined under the terms of that particular swap agreement. |
| | | | | | |
| See Accompanying Notes | | SEMIANNUAL REPORT | | JUNE 30, 2016 | | 47 |
Schedule of Investments PIMCO Fixed Income SHares: Series C (Cont.)
| (4) | The prices and resulting values for credit default swap agreements on credit indices serve as an indicator of the current status of the payment/performance risk and represent the likelihood of an expected liability (or profit) for the credit derivative should the notional amount of the swap agreement be closed/sold as of the period end. Increasing market values, in absolute terms when compared to the notional amount of the swap, represent a deterioration of the referenced indices’ credit soundness and a greater likelihood or risk of default or other credit event occurring as defined under the terms of the agreement. |
FINANCIAL DERIVATIVE INSTRUMENTS: OVER THE COUNTER SUMMARY
The following is a summary by counterparty of the market value of OTC financial derivative instruments and collateral (received)/pledged as of June 30, 2016:
| (i) | Securities with an aggregate market value of $13,272 have been pledged as collateral for financial derivative instruments as governed by International Swaps and Derivatives Association, Inc. master agreements as of June 30, 2016. |
| | | | | | | | | | | | | | | | | | | | | | | | | | | | | | | | | | | | | | | | | | | | | | | | |
| | | Financial Derivative Assets | | | | | | Financial Derivative Liabilities | | | | | | | | | | |
| Counterparty | | Forward
Foreign
Currency
Contracts | | | Purchased
Options | | | Swap
Agreements | | | Total
Over
the
Counter | | | | | | Forward
Foreign
Currency
Contracts | | | Written
Options | | | Swap
Agreements | | | Total
Over
the
Counter | | | Net
Market
Value
of OTC
Derivatives | | | Collateral
(Received)/
Pledged | | | Net
Exposure (5) | |
AZD | | $ | 222 | | | $ | 0 | | | $ | 0 | | | $ | 222 | | | | | | | $ | (221 | ) | | $ | 0 | | | $ | 0 | | | $ | (221 | ) | | $ | 1 | | | $ | 0 | | | $ | 1 | |
BOA | | | 1,230 | | | | 0 | | | | 4 | | | | 1,234 | | | | | | | | (576 | ) | | | 0 | | | | 0 | | | | (576 | ) | | | 658 | | | | (640 | ) | | | 18 | |
BPS | | | 0 | | | | 0 | | | | 0 | | | | 0 | | | | | | | | (971 | ) | | | 0 | | | | (64 | ) | | | (1,035 | ) | | | (1,035 | ) | | | 304 | | | | (731 | ) |
BRC | | | 0 | | | | 0 | | | | 1,927 | | | | 1,927 | | | | | | | | 0 | | | | 0 | | | | 0 | | | | 0 | | | | 1,927 | | | | (1,600 | ) | | | 327 | |
CBK | | | 50 | | | | 0 | | | | 144 | | | | 194 | | | | | | | | (122 | ) | | | 0 | | | | 0 | | | | (122 | ) | | | 72 | | | | (340 | ) | | | (268 | ) |
DUB | | | 0 | | �� | | 0 | | | | 999 | | | | 999 | | | | | | | | 0 | | | | 0 | | | | 0 | | | | 0 | | | | 999 | | | | (1,070 | ) | | | (71 | ) |
GLM | | | 343 | | | | 0 | | | | 0 | | | | 343 | | | | | | | | (625 | ) | | | 0 | | | | 0 | | | | (625 | ) | | | (282 | ) | | | 352 | | | | 70 | |
GST | | | 0 | | | | 0 | | | | 1,035 | | | | 1,035 | | | | | | | | 0 | | | | 0 | | | | (4 | ) | | | (4 | ) | | | 1,031 | | | | (1,090 | ) | | | (59 | ) |
HUS | | | 316 | | | | 0 | | | | 0 | | | | 316 | | | | | | | | 0 | | | | 0 | | | | 0 | | | | 0 | | | | 316 | | | | (270 | ) | | | 46 | |
JPM | | | 1,691 | | | | 0 | | | | 407 | | | | 2,098 | | | | | | | | (336 | ) | | | 0 | | | | (19 | ) | | | (355 | ) | | | 1,743 | | | | (1,742 | ) | | | 1 | |
MYC | | | 0 | | | | 0 | | | | 213 | | | | 213 | | | | | | | | 0 | | | | 0 | | | | (1,102 | ) | | | (1,102 | ) | | | (889 | ) | | | 186 | | | | (703) | |
SCX | | | 2,428 | | | | 0 | | | | 0 | | | | 2,428 | | | | | | | | (3,337 | ) | | | 0 | | | | 0 | | | | (3,337 | ) | | | (909 | ) | | | 610 | | | | (299) | |
SOG | | | 303 | | | | 0 | | | | 0 | | | | 303 | | | | | | | | 0 | | | | 0 | | | | 0 | | | | 0 | | | | 303 | | | | (730 | ) | | | (427 | ) |
UAG | | | 3,444 | | | | 0 | | | | 0 | | | | 3,444 | | | | | | | | (13,252 | ) | | | 0 | | | | 0 | | | | (13,252 | ) | | | (9,808 | ) | | | 11,094 | | | | 1,286 | |
| | | | | | | | | | | | | | | | | | | | | | | | | | | | | | | | | | | | | | | | | | | | | | | | |
Total Over the
Counter | | $ | 10,027 | | | $ | 0 | | | $ | 4,729 | | | $ | 14,756 | | | | | | | $ | (19,440 | ) | | $ | 0 | | | $ | (1,189 | ) | | $ | (20,629 | ) | | | | | | | | | | | | |
| | | | | | | | | | | | | | | | | | | | | | | | | | | | | | | | | | | | | | | | | | | | | | | | |
| (5) | Net Exposure represents the net receivable/(payable) that would be due from/to the counterparty in the event of default. Exposure from OTC financial derivative instruments can only be netted across transactions governed under the same master agreement with the same legal entity. See Note 7, Principal Risks, in the Notes to Financial Statements for more information regarding master netting arrangements. |
FAIR VALUE OF FINANCIAL DERIVATIVE INSTRUMENTS
The following is a summary of the fair valuation of the Portfolio’s derivative instruments categorized by risk exposure. See Note 7, Principal Risks, in the Notes to Financial Statements on risks of the Portfolio.
Fair Values of Financial Derivative Instruments on the Statements of Assets and Liabilities as of June 30, 2016:
| | | | | | | | | | | | | | | | | | | | | | | | |
| | | Derivatives not accounted for as hedging instruments | |
| | | Commodity
Contracts | | | Credit
Contracts | | | Equity
Contracts | | | Foreign
Exchange
Contracts | | | Interest
Rate Contracts | | | Total | |
Financial Derivative Instruments - Assets | | | | | | | | | | | | | | | | | | | | | | | | |
Exchange-traded or centrally cleared | | | | | | | | | | | | | | | | | | | | | | | | |
Purchased Options | | $ | 0 | | | $ | 0 | | | $ | 0 | | | $ | 0 | | | $ | 5 | | | $ | 5 | |
Futures | | | 0 | | | | 0 | | | | 0 | | | | 0 | | | | 399 | | | | 399 | |
Swap Agreements | | | 0 | | | | 339 | | | | 0 | | | | 0 | | | | 7,322 | | | | 7,661 | |
| | | | | | | | | | | | | | | | | | | | | | | | |
| | $ | 0 | | | $ | 339 | | | $ | 0 | | | $ | 0 | | | $ | 7,726 | | | $ | 8,065 | |
| | | | | | | | | | | | | | | | | | | | | | | | |
| | | | | | |
| 48 | | PIMCO MANAGED ACCOUNTS TRUST | | | | See Accompanying Notes |
(Unaudited)
June 30, 2016
| | | | | | | | | | | | | | | | | | | | | | | | |
| | | Derivatives not accounted for as hedging instruments | |
| | | Commodity
Contracts | | | Credit
Contracts | | | Equity
Contracts | | | Foreign
Exchange
Contracts | | | Interest
Rate Contracts | | | Total | |
Over the counter | | | | | | | | | | | | | | | | | | | | | | | | |
Forward Foreign Currency Contracts | | $ | 0 | | | $ | 0 | | | $ | 0 | | | $ | 10,027 | | | $ | 0 | | | $ | 10,027 | |
Swap Agreements | | | 0 | | | | 4,729 | | | | 0 | | | | 0 | | | | 0 | | | | 4,729 | |
| | | | | | | | | | | | | | | | | | | | | | | | |
| | $ | 0 | | | $ | 4,729 | | | $ | 0 | | | $ | 10,027 | | | $ | 0 | | | $ | 14,756 | |
| | | | | | | | | | | | | | | | | | | | | | | | |
| | $ | 0 | | | $ | 5,068 | | | $ | 0 | | | $ | 10,027 | | | $ | 7,726 | | | $ | 22,821 | |
| | | | | | | | | | | | | | | | | | | | | | | | |
| | | | | |
Financial Derivative Instruments - Liabilities | | | | | | | | | | | | | | | | | | | | | |
Exchange-traded or centrally cleared | | | | | | | | | | | | | | | | | | | | | | | | |
Futures | | $ | 0 | | | $ | 0 | | | $ | 0 | | | $ | 0 | | | $ | 393 | | | $ | 393 | |
Swap Agreements | | | 0 | | | | 0 | | | | 0 | | | | 0 | | | | 156 | | | | 156 | |
| | | | | | | | | | | | | | | | | | | | | | | | |
| | $ | 0 | | | $ | 0 | | | $ | 0 | | | $ | 0 | | | $ | 549 | | | $ | 549 | |
| | | | | | | | | | | | | | | | | | | | | | | | |
Over the counter | | | | | | | | | | | | | | | | | | | | | | | | |
Forward Foreign Currency Contracts | | $ | 0 | | | $ | 0 | | | $ | 0 | | | $ | 19,440 | | | $ | 0 | | | $ | 19,440 | |
Swap Agreements | | | 0 | | | | 1,189 | | | | 0 | | | | 0 | | | | 0 | | | | 1,189 | |
| | | | | | | | | | | | | | | | | | | | | | | | |
| | $ | 0 | | | $ | 1,189 | | | $ | 0 | | | $ | 19,440 | | | $ | 0 | | | $ | 20,629 | |
| | | | | | | | | | | | | | | | | | | | | | | | |
| | $ | 0 | | | $ | 1,189 | | | $ | 0 | | | $ | 19,440 | | | $ | 549 | | | $ | 21,178 | |
| | | | | | | | | | | | | | | | | | | | | | | | |
The effect of Financial Derivative Instruments on the Statements of Operations for the period ended June 30, 2016:
| | | | | | | | | | | | | | | | | | | | | | | | |
| | | Derivatives not accounted for as hedging instruments | |
| | | Commodity
Contracts | | | Credit
Contracts | | | Equity
Contracts | | | Foreign
Exchange
Contracts | | | Interest
Rate Contracts | | | Total | |
Net Realized Gain (Loss) on Financial Derivative Instruments | | | | | |
Exchange-traded or centrally cleared | | | | | | | | | | | | | | | | | | | | | | | | |
Purchased Options | | $ | 0 | | | $ | 0 | | | $ | 0 | | | $ | 0 | | | $ | (111 | ) | | $ | (111 | ) |
Futures | | | 0 | | | | 0 | | | | 0 | | | | 0 | | | | 12,972 | | | | 12,972 | |
Swap Agreements | | | 0 | | | | 38 | | | | 0 | | | | 0 | | | | (102,812 | ) | | | (102,774 | ) |
| | | | | | | | | | | | | | | | | | | | | | | | |
| | $ | 0 | | | $ | 38 | | | $ | 0 | | | $ | 0 | | | $ | (89,951 | ) | | $ | (89,913 | ) |
| | | | | | | | | | | | | | | | | | | | | | | | |
Over the counter | | | | | | | | | | | | | | | | | | | | | | | | |
Forward Foreign Currency Contracts | | $ | 0 | | | $ | 0 | | | $ | 0 | | | $ | (12,349 | ) | | $ | 0 | | | $ | (12,349 | ) |
Purchased Options | | | 0 | | | | 0 | | | | 0 | | | | 0 | | | | (8 | ) | | | (8 | ) |
Written Options | | | 0 | | | | 176 | | | | 0 | | | | 0 | | | | 0 | | | | 176 | |
Swap Agreements | | | 0 | | | | 4,560 | | | | 0 | | | | 0 | | | | 0 | | | | 4,560 | |
| | | | | | | | | | | | | | | | | | | | | | | | |
| | $ | 0 | | | $ | 4,736 | | | $ | 0 | | | $ | (12,349 | ) | | $ | (8 | ) | | $ | (7,621 | ) |
| | | | | | | | | | | | | | | | | | | | | | | | |
| | $ | 0 | | | $ | 4,774 | | | $ | 0 | | | $ | (12,349 | ) | | $ | (89,959 | ) | | $ | (97,534 | ) |
| | | | | | | | | | | | | | | | | | | | | | | | |
|
Net Change in Unrealized Appreciation (Depreciation) on Financial Derivative Instruments | |
Exchange-traded or centrally cleared | | | | | | | | | | | | | | | | | | | | | | | | |
Purchased Options | | $ | 0 | | | $ | 0 | | | $ | 0 | | | $ | 0 | | | $ | (57 | ) | | $ | (57 | ) |
Futures | | | 0 | | | | 0 | | | | 0 | | | | 0 | | | | 7,991 | | | | 7,991 | |
Swap Agreements | | | 0 | | | | 477 | | | | 0 | | | | 0 | | | | (25,705 | ) | | | (25,228 | ) |
| | | | | | | | | | | | | | | | | | | | | | | | |
| | $ | 0 | | | $ | 477 | | | $ | 0 | | | $ | 0 | | | $ | (17,771 | ) | | $ | (17,294 | ) |
| | | | | | | | | | | | | | | | | | | | | | | | |
Over the counter | | | | | | | | | | | | | | | | | | | | | | | | |
Forward Foreign Currency Contracts | | $ | 0 | | | $ | 0 | | | $ | 0 | | | $ | (6,084 | ) | | $ | 0 | | | $ | (6,084 | ) |
Purchased Options | | | 0 | | | | 0 | | | | 0 | | | | 0 | | | | 2 | | | | 2 | |
Written Options | | | 0 | | | | 0 | | | | 0 | | | | 0 | | | | (987 | ) | | | (987 | ) |
Swap Agreements | | | 0 | | | | (2,181 | ) | | | 0 | | | | 0 | | | | 0 | | | | (2,181 | ) |
| | | | | | | | | | | | | | | | | | | | | | | | |
| | $ | 0 | | | $ | (2,181 | ) | | $ | 0 | | | $ | (6,084 | ) | | $ | (985 | ) | | $ | (9,250 | ) |
| | | | | | | | | | | | | | | | | | | | | | | | |
| | $ | 0 | | | $ | (1,704 | ) | | $ | 0 | | | $ | (6,084 | ) | | $ | (18,756 | ) | | $ | (26,544 | ) |
| | | | | | | | | | | | | | | | | | | | | | | | |
| | | | | | |
| See Accompanying Notes | | SEMIANNUAL REPORT | | JUNE 30, 2016 | | 49 |
Schedule of Investments PIMCO Fixed Income SHares: Series C (Cont.)
(Unaudited)
June 30, 2016
FAIR VALUE MEASUREMENTS
The following is a summary of the fair valuations according to the inputs used as of June 30, 2016 in valuing the Portfolio’s assets and liabilities:
| | | | | | | | | | | | | | | | |
| Category and Subcategory | | Level 1 | | | Level 2 | | | Level 3 | | | Fair
Value at
06/30/2016 | |
Investments in Securities, at Value | | | | | | | | | | | | | | | | |
Bank Loan Obligations | | $ | 0 | | | $ | 6,698 | | | $ | 0 | | | $ | 6,698 | |
Corporate Bonds & Notes | | | | | | | | | | | | | | | | |
Banking & Finance | | | 0 | | | | 546,890 | | | | 0 | | | | 546,890 | |
Industrials | | | 0 | | | | 171,071 | | | | 0 | | | | 171,071 | |
Utilities | | | 0 | | | | 80,065 | | | | 0 | | | | 80,065 | |
Municipal Bonds & Notes | | | | | | | | | | | | | | | | |
California | | | 0 | | | | 12,238 | | | | 0 | | | | 12,238 | |
Illinois | | | 0 | | | | 2,448 | | | | 0 | | | | 2,448 | |
New York | | | 0 | | | | 2,968 | | | | 0 | | | | 2,968 | |
U.S. Government Agencies | | | 0 | | | | 390,220 | | | | 0 | | | | 390,220 | |
U.S. Treasury Obligations | | | 0 | | | | 575,634 | | | | 0 | | | | 575,634 | |
Non-Agency Mortgage-Backed Securities | | | 0 | | | | 97,009 | | | | 0 | | | | 97,009 | |
Asset-Backed Securities | | | 41,750 | | | | 14,965 | | | | 0 | | | | 56,715 | |
Sovereign Issues | | | 0 | | | | 50,810 | | | | 0 | | | | 50,810 | |
Short-Term Instruments | | | | | | | | | | | | | | | | |
Repurchase Agreements | | | 0 | | | | 3,578 | | | | 0 | | | | 3,578 | |
| | | | |
Total Investments | | $ | 41,750 | | | $ | 1,954,594 | | | $ | 0 | | | $ | 1,996,344 | |
| | | | |
Short Sales, at Value - Liabilities | | | | | | | | | | | | | | | | |
U.S. Government Agencies | | $ | 0 | | | $ | (36,926 | ) | | $ | 0 | | | $ | (36,926 | ) |
| | | | |
Financial Derivative Instruments - Assets | | | | | | | | | | | | | | | | |
Exchange-traded or centrally cleared | | | 399 | | | | 7,666 | | | | 0 | | | | 8,065 | |
Over the counter | | | 0 | | | | 14,756 | | | | 0 | | | | 14,756 | |
| | $ | 399 | | | $ | 22,422 | | | $ | 0 | | | $ | 22,821 | |
| | | | |
Financial Derivative Instruments - Liabilities | | | | | | | | | | | | | | | | |
Exchange-traded or centrally cleared | | | (253 | ) | | | (156 | ) | | | 0 | | | | (409 | ) |
Over the counter | | | 0 | | | | (20,629 | ) | | | 0 | | | | (20,629 | ) |
| | $ | (253 | ) | | $ | (20,785 | ) | | $ | 0 | | | $ | (21,038 | ) |
| | | | |
Totals | | $ | 41,896 | | | $ | 1,919,305 | | | $ | 0 | | | $ | 1,961,201 | |
There were no significant transfers between Levels 1, 2, or 3 during the period ended June 30, 2016.
| | | | | | |
| 50 | | PIMCO MANAGED ACCOUNTS TRUST | | | | See Accompanying Notes |
Schedule of Investments PIMCO Fixed Income SHares: Series LD
(Unaudited)
June 30, 2016
| | | | | | | | | | | | |
| | | | | PRINCIPAL
AMOUNT
(000S) | | | | | MARKET
VALUE
(000S) | |
| INVESTMENTS IN SECURITIES 177.1% | |
| | | | | | | | | | | | |
| BANK LOAN OBLIGATIONS 2.0% | |
Energy Future Intermediate Holding Co. LLC | |
4.250% due 12/19/2016 | | $ | | | 400 | | | $ | | | 400 | |
Las Vegas Sands LLC | |
3.250% due 12/19/2020 | | | | | 250 | | | | | | 250 | |
| | | | | | | | | | | | |
Total Bank Loan Obligations (Cost $650) | | | 650 | |
| | | | | | | | | | | | |
| | | | | | | | | | | | |
| CORPORATE BONDS & NOTES 120.2% | |
| | | | | | | | | | | | |
| BANKING & FINANCE 61.8% | |
Ally Financial, Inc. | |
2.750% due 01/30/2017 | | | | | 100 | | | | | | 101 | |
3.500% due 07/18/2016 | | | | | 400 | | | | | | 401 | |
3.600% due 05/21/2018 | | | | | 200 | | | | | | 201 | |
American Express Co. | |
7.000% due 03/19/2018 | | | | | 200 | | | | | | 219 | |
American Tower Corp. | |
2.800% due 06/01/2020 (c) | | | | | 400 | | | | | | 410 | |
Aviation Capital Group Corp. | |
6.750% due 04/06/2021 (c) | | | | | 250 | | | | | | 283 | |
Bank of America Corp. | |
5.650% due 05/01/2018 | | | | | 75 | | | | | | 80 | |
6.875% due 04/25/2018 (c) | | | | | 400 | | | | | | 437 | |
BBVA Banco Continental S.A. | |
2.250% due 07/29/2016 | | | | | 400 | | | | | | 399 | |
BGC Partners, Inc. | |
5.125% due 05/27/2021 | | | | | 300 | | | | | | 306 | |
BOC Aviation Ltd. | |
3.875% due 05/09/2019 | | | | | 294 | | | | | | 307 | |
Cantor Fitzgerald LP | |
6.500% due 06/17/2022 (c) | | | | | 200 | | | | | | 211 | |
7.875% due 10/15/2019 (c) | | | | | 300 | | | | | | 337 | |
CIT Group, Inc. | |
4.250% due 08/15/2017 | | | | | 95 | | | | | | 97 | |
5.000% due 05/15/2017 | | | | | 300 | | | | | | 305 | |
Commerzbank AG | |
0.393% due 09/20/2017 | | | | | 100 | | | | | | 98 | |
Commerzbank Finance & Covered Bond S.A. | |
0.393% due 03/20/2017 | | | | | 100 | | | | | | 99 | |
Cooperatieve Rabobank UA | |
8.375% due 07/26/2016 (b) | | | | | 300 | | | | | | 302 | |
Credit Agricole S.A. | |
1.628% due 06/10/2020 (c) | | | | | 400 | | | | | | 400 | |
Credit Suisse Group Funding Guernsey Ltd. | |
3.800% due 09/15/2022 (c) | | | | | 250 | | | | | | 251 | |
DBS Bank Ltd. | |
3.625% due 09/21/2022 | | | | | 600 | | | | | | 614 | |
Eksportfinans ASA | |
5.500% due 06/26/2017 | | | | | 13 | | | | | | 13 | |
| | | | | | | | | | | | |
| | | | | PRINCIPAL
AMOUNT
(000S) | | | | | MARKET
VALUE
(000S) | |
Ford Motor Credit Co. LLC | |
1.250% due 12/06/2017 (c) | | $ | | | 400 | | | $ | | | 398 | |
1.569% due 01/09/2018 (c) | | | | | 200 | | | | | | 200 | |
General Motors Financial Co., Inc. | |
3.000% due 09/25/2017 | | | | | 200 | | | | | | 203 | |
4.750% due 08/15/2017 | | | | | 600 | | | | | | 619 | |
Goldman Sachs Group, Inc. | |
2.274% due 11/29/2023 (c) | | | | | 900 | | | | | | 901 | |
Goodman Funding Pty. Ltd. | |
6.375% due 11/12/2020 (c) | | | | | 500 | | | | | | 580 | |
Hartford Financial Services Group, Inc. | |
5.500% due 03/30/2020 (c) | | | | | 350 | | | | | | 396 | |
HSBC Bank USA N.A. | |
6.000% due 08/09/2017 | | | | | 1,100 | | | | | | 1,151 | |
HSBC Holdings PLC | |
2.322% due 05/25/2021 | | | | | 250 | | | | | | 250 | |
International Lease Finance Corp. | |
7.125% due 09/01/2018 (c) | | | | | 300 | | | | | | 330 | |
Intesa Sanpaolo SpA | |
2.375% due 01/13/2017 (c) | | | | | 800 | | | | | | 803 | |
JPMorgan Chase & Co. | |
7.900% due 04/30/2018 (b) | | | | | 400 | | | | | | 409 | |
Kookmin Bank | |
1.509% due 01/27/2017 | | | | | 200 | | | | | | 200 | |
LeasePlan Corp. NV | |
2.500% due 05/16/2018 (c) | | | | | 380 | | | | | | 380 | |
2.875% due 01/22/2019 (c) | | | | | 200 | | | | | | 200 | |
Lloyds Bank PLC | |
1.750% due 05/14/2018 (c) | | | | | 400 | | | | | | 399 | |
Macquarie Bank Ltd. | |
1.600% due 10/27/2017 (c) | | | | | 300 | | | | | | 300 | |
Macquarie Group Ltd. | |
3.000% due 12/03/2018 | | | | | 100 | | | | | | 103 | |
Mitsubishi UFJ Trust & Banking Corp. | |
1.600% due 10/16/2017 (c) | | | | | 500 | | | | | | 502 | |
Mizuho Bank Ltd. | |
1.700% due 09/25/2017 (c) | | | | | 500 | | | | | | 502 | |
Morgan Stanley | |
5.500% due 01/26/2020 (c) | | | | | 200 | | | | | | 223 | |
Navient Corp. | |
4.875% due 06/17/2019 | | | | | 300 | | | | | | 290 | |
Royal Bank of Scotland PLC | |
9.500% due 03/16/2022 | | | | | 200 | | | | | | 208 | |
Santander Holdings USA, Inc. | |
2.115% due 11/24/2017 (c) | | | | | 300 | | | | | | 300 | |
Santander UK PLC | |
2.350% due 09/10/2019 | | | | | 100 | | | | | | 101 | |
Springleaf Finance Corp. | |
6.900% due 12/15/2017 | | | | | 400 | | | | | | 416 | |
Standard Chartered PLC | |
1.001% due 09/08/2017 (c) | | | | | 700 | | | | | | 695 | |
| | | | | | |
| See Accompanying Notes | | SEMIANNUAL REPORT | | JUNE 30, 2016 | | 51 |
Schedule of Investments PIMCO Fixed Income SHares: Series LD (Cont.)
| | | | | | | | | | | | |
| | | | | PRINCIPAL
AMOUNT
(000S) | | | | | MARKET
VALUE
(000S) | |
Suncorp-Metway Ltd. | |
2.100% due 05/03/2019 (c) | | $ | | | 500 | | | $ | | | 506 | |
Synchrony Financial | |
1.867% due 02/03/2020 | | | | | 400 | | | | | | 388 | |
1.875% due 08/15/2017 | | | | | 100 | | | | | | 100 | |
UBS Group Funding Jersey Ltd. | |
2.950% due 09/24/2020 (c) | | | | | 300 | | | | | | 305 | |
Ventas Realty LP | |
2.000% due 02/15/2018 | | | | | 500 | | | | | | 503 | |
VEREIT Operating Partnership LP | |
2.000% due 02/06/2017 | | | | | 300 | | | | | | 302 | |
WEA Finance LLC | |
2.700% due 09/17/2019 (c) | | | | | 500 | | | | | | 510 | |
Weyerhaeuser Co. | |
6.950% due 08/01/2017 | | | | | 150 | | | | | | 158 | |
| | | | | | | | | | | | |
| | | | | | | | | | | 19,702 | |
| | | | | | | | | | | | |
| | | | | | | | | | | | |
| INDUSTRIALS 44.0% | |
AbbVie, Inc. | |
2.500% due 05/14/2020 (c) | | | | | 400 | | | | | | 410 | |
Actavis Funding SCS | |
1.911% due 03/12/2020 (c) | | | | | 400 | | | | | | 401 | |
Anheuser-Busch InBev Finance, Inc. | |
2.650% due 02/01/2021 (c) | | | | | 200 | | | | | | 207 | |
AP Moeller - Maersk A/S | |
2.550% due 09/22/2019 (c) | | | | | 400 | | | | | | 408 | |
BMW U.S. Capital LLC | |
2.000% due 04/11/2021 | | | | | 200 | | | | | | 203 | |
Boston Scientific Corp. | |
3.375% due 05/15/2022 (c) | | | | | 300 | | | | | | 312 | |
Charter Communications Operating LLC | |
4.464% due 07/23/2022 | | | | | 300 | | | | | | 323 | |
ConocoPhillips Co. | |
1.526% due 05/15/2022 (c) | | | | | 200 | | | | | | 190 | |
Crown Castle Towers LLC | |
3.222% due 05/15/2042 (c) | | | | | 300 | | | | | | 312 | |
CVS Health Corp. | |
3.500% due 07/20/2022 (c) | | | | | 200 | | | | | | 216 | |
D.R. Horton, Inc. | |
3.750% due 03/01/2019 | | | | | 200 | | | | | | 203 | |
Daimler Finance North America LLC | |
2.700% due 08/03/2020 (c) | | | | | 500 | | | | | | 519 | |
Delphi Automotive PLC | |
3.150% due 11/19/2020 (c) | | | | | 300 | | | | | | 309 | |
Delta Air Lines Pass-Through Trust | |
7.750% due 06/17/2021 | | | | | 213 | | | | | | 241 | |
Denali International LLC/Denali Finance Corp. | |
5.625% due 10/15/2020 | | | | | 200 | | | | | | 210 | |
Diamond 1 Finance Corp. | |
4.420% due 06/15/2021 | | | | | 400 | | | | | | 412 | |
| | | | | | | | | | | | |
| | | | | PRINCIPAL
AMOUNT
(000S) | | | | | MARKET
VALUE
(000S) | |
eBay, Inc. | |
1.117% due 08/01/2019 (c) | | $ | | | 400 | | | $ | | | 393 | |
Enbridge, Inc. | |
1.136% due 06/02/2017 | | | | | 150 | | | | | | 147 | |
Energy Transfer Partners LP | |
6.125% due 02/15/2017 (c) | | | | | 200 | | | | | | 205 | |
9.000% due 04/15/2019 (c) | | | | | 200 | | | | | | 224 | |
Express Scripts Holding Co. | |
2.250% due 06/15/2019 | | | | | 100 | | | | | | 102 | |
Forest Laboratories LLC | |
4.375% due 02/01/2019 (c) | | | | | 100 | | | | | | 106 | |
Georgia-Pacific LLC | |
5.400% due 11/01/2020 (c) | | | | | 400 | | | | | | 453 | |
Hyundai Capital America | |
1.450% due 02/06/2017 (c) | | | | | 50 | | | | | | 50 | |
2.125% due 10/02/2017 | | | | | 100 | | | | | | 101 | |
Imperial Tobacco Finance PLC | |
2.050% due 07/20/2018 (c) | | | | | 400 | | | | | | 405 | |
2.950% due 07/21/2020 (c) | | | | | 400 | | | | | | 412 | |
Kia Motors Corp. | |
2.625% due 04/21/2021 | | | | | 300 | | | | | | 310 | |
Kinder Morgan Energy Partners LP | |
6.000% due 02/01/2017 | | | | | 30 | | | | | | 31 | |
Kinder Morgan, Inc. | |
7.250% due 06/01/2018 (c) | | | | | 200 | | | | | | 216 | |
Korea Water Resources Corp. | |
2.000% due 04/16/2018 (c) | | | | | 400 | | | | | | 403 | |
Latam Airlines Pass-Through Trust | |
4.200% due 08/15/2029 | | | | | 197 | | | | | | 181 | |
Mylan, Inc. | |
1.350% due 11/29/2016 (c) | | | | | 450 | | | | | | 450 | |
Nissan Motor Acceptance Corp. | |
2.000% due 03/08/2019 (c) | | | | | 500 | | | | | | 506 | |
ONEOK Partners LP | |
2.000% due 10/01/2017 | | | | | 200 | | | | | | 200 | |
Pioneer Natural Resources Co. | |
6.875% due 05/01/2018 | | | | | 100 | | | | | | 108 | |
QUALCOMM, Inc. | |
3.000% due 05/20/2022 (c) | | | | | 200 | | | | | | 211 | |
Reynolds American, Inc. | |
4.000% due 06/12/2022 | | | | | 200 | | | | | | 218 | |
SBA Tower Trust | |
2.933% due 12/15/2042 (c) | | | | | 250 | | | | | | 251 | |
Scripps Networks Interactive, Inc. | |
3.500% due 06/15/2022 (c) | | | | | 200 | | | | | | 208 | |
Sinopec Group Overseas Development Ltd. | |
2.750% due 05/17/2017 | | | | | 200 | | | | | | 202 | |
SK Telecom Co. Ltd. | |
2.125% due 05/01/2018 | | | | | 400 | | | | | | 404 | |
Southern Co. | |
2.950% due 07/01/2023 (c) | | | | | 300 | | | | | | 311 | |
| | | | | | |
| 52 | | PIMCO MANAGED ACCOUNTS TRUST | | | | See Accompanying Notes |
(Unaudited)
June 30, 2016
| | | | | | | | | | | | |
| | | | | PRINCIPAL
AMOUNT
(000S) | | | | | MARKET
VALUE
(000S) | |
Telefonica Emisiones S.A.U. | |
6.221% due 07/03/2017 (c) | | $ | | | 400 | | | $ | | | 418 | |
Time Warner Cable, Inc. | |
8.250% due 04/01/2019 | | | | | 300 | | | | | | 349 | |
UAL Pass-Through Trust | |
9.750% due 07/15/2018 | | | | | 129 | | | | | | 134 | |
Universal Health Services, Inc. | |
3.750% due 08/01/2019 | | | | | 100 | | | | | | 104 | |
USG Corp. | |
6.300% due 11/15/2016 | | | | | 95 | | | | | | 97 | |
7.875% due 03/30/2020 | | | | | 200 | | | | | | 209 | |
Volkswagen International Finance NV | |
1.066% due 11/18/2016 (c) | | | | | 400 | | | | | | 399 | |
Woodside Finance Ltd. | |
8.750% due 03/01/2019 | | | | | 400 | | | | | | 461 | |
Wynn Macau Ltd. | |
5.250% due 10/15/2021 | | | | | 200 | | | | | | 196 | |
| | | | | | | | | | | | |
| | | | | | | | | | | 14,051 | |
| | | | | | | | | | | | |
| | | | | | | | | | | | |
| UTILITIES 14.4% | |
AT&T, Inc. | |
1.561% due 06/30/2020 (c) | | | | | 300 | | | | | | 299 | |
E.ON International Finance BV | |
5.800% due 04/30/2018 | | | | | 350 | | | | | | 375 | |
Electricite de France S.A. | |
1.094% due 01/20/2017 | | | | | 30 | | | | | | 30 | |
Exelon Corp. | |
2.450% due 04/15/2021 (c) | | | | | 300 | | | | | | 305 | |
FirstEnergy Corp. | |
2.750% due 03/15/2018 | | | | | 200 | | | | | | 203 | |
Kinder Morgan Finance Co. LLC | |
6.000% due 01/15/2018 (c) | | | | | 400 | | | | | | 421 | |
Korea Western Power Co. Ltd. | |
3.125% due 05/10/2017 | | | | | 200 | | | | | | 203 | |
KT Corp. | |
2.625% due 04/22/2019 | | | | | 200 | | | | | | 206 | |
National Grid North America, Inc. | |
1.294% due 08/21/2017 (c) | | | | | 600 | | | | | | 598 | |
NextEra Energy Capital Holdings, Inc. | |
2.056% due 09/01/2017 (c) | | | | | 200 | | | | | | 201 | |
Orange S.A. | |
2.750% due 02/06/2019 (c) | | | | | 50 | | | | | | 51 | |
PSEG Power LLC | |
3.000% due 06/15/2021 | | | | | 400 | | | | | | 406 | |
Shell International Finance BV | |
1.080% due 05/11/2020 (c) | | | | | 400 | | | | | | 395 | |
Spire, Inc. | |
1.376% due 08/15/2017 (c) | | | | | 305 | | | | | | 304 | |
Sprint Communications, Inc. | |
6.000% due 12/01/2016 | | | | | 500 | | | | | | 504 | |
| | | | | | | | | | | | |
| | | | | PRINCIPAL
AMOUNT
(000S) | | | | | MARKET
VALUE
(000S) | |
Telstra Corp. Ltd. | |
3.125% due 04/07/2025 | | $ | | | 100 | | | $ | | | 105 | |
| | | | | | | | | | | | |
| | | | | | | | | | | 4,606 | |
| | | | | | | | | | | | |
Total Corporate Bonds & Notes
(Cost $37,996) | | | 38,359 | |
| | | | | | | | | | | | |
| | | | | | | | | | | | |
| U.S. GOVERNMENT AGENCIES 2.6% | |
Fannie Mae | |
1.103% due 09/25/2023 | | | | | 20 | | | | | | 20 | |
1.350% due 09/25/2022 | | | | | 48 | | | | | | 49 | |
3.000% due 03/01/2042 (c) | | | | | 246 | | | | | | 256 | |
Freddie Mac | |
4.442% due 01/15/2022 | | | | | 31 | | | | | | 33 | |
Ginnie Mae | |
1.116% due 08/20/2061 (c) | | | | | 456 | | | | | | 455 | |
| | | | | | | | | | | | |
Total U.S. Government Agencies
(Cost $800) | | | 813 | |
| | | | | | | | | | | | |
| | | | | | | | | | | | |
| U.S. TREASURY OBLIGATIONS 15.1% | |
U.S. Treasury Inflation Protected Securities (a) | |
0.125% due 04/15/2020 (c) | | | | | 4,699 | | | | | | 4,810 | |
| | | | | | | | | | | | |
Total U.S. Treasury Obligations
(Cost $4,794) | | | 4,810 | |
| | | | | | | | | | | | |
| | | | | | | | | | | | |
| NON-AGENCY MORTGAGE-BACKED SECURITIES 21.2% | |
American Home Mortgage Investment Trust | |
1.033% due 02/25/2045 | | | | | 17 | | | | | | 16 | |
BAMLL Commercial Mortgage Securities Trust | |
1.242% due 06/15/2028 | | | | | 100 | | | | | | 99 | |
BAMLL Re-REMIC Trust | |
5.383% due 11/15/2016 | | | | | 254 | | | | | | 254 | |
Banc of America Funding Trust | |
0.748% due 02/20/2035 | | | | | 28 | | | | | | 26 | |
2.746% due 09/20/2034 | | | | | 157 | | | | | | 155 | |
BCAP LLC Trust | |
0.606% due 03/26/2037 | | | | | 31 | | | | | | 31 | |
3.167% due 07/26/2036 | | | | | 7 | | | | | | 7 | |
Bear Stearns Adjustable Rate Mortgage Trust | |
2.522% due 04/25/2033 | | | | | 55 | | | | | | 55 | |
2.836% due 11/25/2034 | | | | | 101 | | | | | | 99 | |
2.972% due 01/25/2034 | | | | | 14 | | | | | | 14 | |
Citigroup Mortgage Loan Trust, Inc. | |
2.730% due 10/25/2035 | | | | | 17 | | | | | | 16 | |
Citigroup/Deutsche Bank Commercial Mortgage Trust | |
5.322% due 12/11/2049 | | | | | 381 | | | | | | 385 | |
Countrywide Commercial Mortgage Trust | |
6.275% due 11/12/2043 | | | | | 187 | | | | | | 191 | |
| | | | | | |
| See Accompanying Notes | | SEMIANNUAL REPORT | | JUNE 30, 2016 | | 53 |
Schedule of Investments PIMCO Fixed Income SHares: Series LD (Cont.)
| | | | | | | | | | | | |
| | | | | PRINCIPAL
AMOUNT
(000S) | | | | | MARKET
VALUE
(000S) | |
Credit Suisse Commercial Mortgage Trust | |
5.311% due 12/15/2039 | | $ | | | 175 | | | $ | | | 175 | |
Credit Suisse First Boston Mortgage Securities Corp. | |
2.539% due 06/25/2033 | | | | | 34 | | | | | | 33 | |
5.362% due 05/15/2036 | | | | | 500 | | | | | | 536 | |
6.500% due 04/25/2033 | | | | | 143 | | | | | | 147 | |
Credit Suisse Mortgage Capital Certificates | |
2.511% due 06/26/2037 | | | | | 3 | | | | | | 3 | |
2.795% due 09/27/2036 | | | | | 57 | | | | | | 57 | |
2.973% due 08/27/2037 | | | | | 16 | | | | | | 16 | |
5.396% due 05/26/2037 | | | | | 23 | | | | | | 23 | |
Eurosail PLC | |
0.874% due 06/13/2045 | | GBP | | | 143 | | | | | | 189 | |
First Republic Mortgage Loan Trust | |
0.792% due 11/15/2031 | | $ | | | 53 | | | | | | 51 | |
GSR Mortgage Loan Trust | |
2.876% due 09/25/2035 | | | | | 14 | | | | | | 14 | |
3.067% due 08/25/2033 | | | | | 305 | | | | | | 304 | |
Impac CMB Trust | |
1.453% due 07/25/2033 | | | | | 512 | | | | | | 488 | |
JPMorgan Chase Commercial Mortgage Securities Trust | |
5.397% due 05/15/2045 | | | | | 31 | | | | | | 31 | |
5.440% due 06/12/2047 | | | | | 256 | | | | | | 260 | |
JPMorgan Mortgage Trust | |
2.721% due 02/25/2034 | | | | | 81 | | | | | | 83 | |
2.749% due 09/25/2034 | | | | | 15 | | | | | | 16 | |
2.774% due 04/25/2035 | | | | | 452 | | | | | | 450 | |
2.954% due 02/25/2035 | | | | | 9 | | | | | | 8 | |
JPMorgan Resecuritization Trust | |
2.365% due 07/27/2037 | | | | | 13 | | | | | | 13 | |
MASTR Asset Securitization Trust | |
5.500% due 09/25/2033 | | | | | 22 | | | | | | 22 | |
MASTR Seasoned Securitization Trust | |
6.242% due 09/25/2017 | | | | | 20 | | | | | | 21 | |
Mellon Residential Funding Corp. Mortgage Pass-Through Trust | |
0.922% due 06/15/2030 | | | | | 33 | | | | | | 32 | |
2.610% due 10/20/2029 | | | | | 20 | | | | | | 20 | |
Merrill Lynch Mortgage Investors Trust | |
0.913% due 04/25/2029 | | | | | 14 | | | | | | 13 | |
1.093% due 10/25/2028 | | | | | 10 | | | | | | 10 | |
2.650% due 02/25/2035 | | | | | 289 | | | | | | 289 | |
Merrill Lynch/Countrywide Commercial Mortgage Trust | |
5.810% due 06/12/2050 | | | | | 359 | | | | | | 369 | |
Morgan Stanley Capital Trust | |
5.692% due 04/15/2049 | | | | | 135 | | | | | | 138 | |
Morgan Stanley Mortgage Loan Trust | |
2.836% due 11/25/2034 | | | | | 20 | | | | | | 20 | |
Prime Mortgage Trust | |
0.853% due 02/25/2034 | | | | | 16 | | | | | | 15 | |
| | | | | | | | | | | | |
| | | | | PRINCIPAL
AMOUNT
(000S) | | | | | MARKET
VALUE
(000S) | |
Residential Accredit Loans, Inc. Trust | |
0.893% due 06/25/2034 | | $ | | | 84 | | | $ | | | 82 | |
Sequoia Mortgage Trust | |
1.148% due 10/19/2026 | | | | | 137 | | | | | | 134 | |
1.208% due 10/20/2027 | | | | | 25 | | | | | | 23 | |
Structured Asset Mortgage Investments Trust | |
1.028% due 07/19/2034 | | | | | 73 | | | | | | 72 | |
1.108% due 09/19/2032 | | | | | 22 | | | | | | 22 | |
8.914% due 06/25/2029 | | | | | 11 | | | | | | 11 | |
Structured Asset Securities Corp. Mortgage Loan Trust | |
1.053% due 10/25/2027 | | | | | 19 | | | | | | 18 | |
Thornburg Mortgage Securities Trust | |
1.093% due 09/25/2043 | | | | | 14 | | | | | | 13 | |
2.537% due 04/25/2045 | | | | | 53 | | | | | | 53 | |
Wachovia Bank Commercial Mortgage Trust | |
0.656% due 04/15/2047 | | | | | 500 | | | | | | 496 | |
WaMu Mortgage Pass-Through Certificates Trust | |
0.723% due 12/25/2045 | | | | | 359 | | | | | | 332 | |
0.743% due 10/25/2045 | | | | | 58 | | | | | | 54 | |
0.853% due 06/25/2044 | | | | | 43 | | | | | | 40 | |
1.193% due 11/25/2034 | | | | | 115 | | | | | | 104 | |
1.837% due 06/25/2042 | | | | | 15 | | | | | | 14 | |
Wells Fargo Mortgage-Backed Securities Trust | |
2.785% due 10/25/2033 | | | | | 79 | | | | | | 80 | |
2.979% due 12/25/2034 | | | | | 6 | | | | | | 6 | |
| | | | | | | | | | | | |
Total Non-Agency Mortgage-Backed Securities
(Cost $6,774) | | | 6,748 | |
| | | | | | | | | | | | |
| | | | | | | | | | | | |
| ASSET-BACKED SECURITIES 15.3% | |
Aegis Asset-Backed Securities Trust | |
0.723% due 12/25/2035 | | | | | 13 | | | | | | 13 | |
Amortizing Residential Collateral Trust | |
1.453% due 10/25/2034 | | | | | 423 | | | | | | 407 | |
Argent Securities, Inc. Asset-Backed Pass-Through Certificates | |
1.493% due 04/25/2034 | | | | | 101 | | | | | | 93 | |
Babson CLO Ltd. | |
1.866% due 05/15/2023 | | | | | 300 | | | | | | 300 | |
Bear Stearns Asset-Backed Securities Trust | |
1.253% due 10/27/2032 | | | | | 48 | | | | | | 44 | |
Chase Funding Trust | |
1.193% due 10/25/2032 | | | | | 71 | | | | | | 66 | |
Colony American Finance Ltd. | |
2.544% due 06/15/2048 | | | | | 300 | | | | | | 301 | |
Colony Starwood Homes Trust | |
1.946% due 07/17/2033 | | | | | 200 | | | | | | 200 | �� |
Cordatus CLO PLC | |
0.152% due 01/30/2024 | | EUR | | | 227 | | | | | | 249 | |
Delta Funding Home Equity Loan Trust | |
1.262% due 09/15/2029 | | $ | | | 7 | | | | | | 6 | |
| | | | | | |
| 54 | | PIMCO MANAGED ACCOUNTS TRUST | | | | See Accompanying Notes |
(Unaudited)
June 30, 2016
| | | | | | | | | | | | |
| | | | | PRINCIPAL
AMOUNT
(000S) | | | | | MARKET
VALUE
(000S) | |
Denali Capital CLO Ltd. | |
0.865% due 01/22/2022 | | $ | | | 282 | | | $ | | | 278 | |
Exeter Automobile Receivables Trust | |
1.060% due 08/15/2018 | | | | | 8 | | | | | | 9 | |
Golden Knight CDO Ltd. | |
0.868% due 04/15/2019 | | | | | 6 | | | | | | 6 | |
GSAA Home Equity Trust | |
1.093% due 12/25/2034 | | | | | 48 | | | | | | 47 | |
Highbridge Loan Management Ltd. | |
1.436% due 09/20/2022 | | | | | 214 | | | | | | 214 | |
KVK CLO Ltd. | |
1.998% due 07/15/2023 | | | | | 277 | | | | | | 277 | |
National Collegiate Student Loan Trust | |
0.686% due 11/27/2028 | | | | | 47 | | | | | | 46 | |
OneMain Financial Issuance Trust | |
2.570% due 07/18/2025 | | | | | 300 | | | | | | 300 | |
Race Point CLO Ltd. | |
1.637% due 12/15/2022 | | | | | 33 | | | | | | 32 | |
Renaissance Home Equity Loan Trust | |
0.953% due 12/25/2033 | | | | | 8 | | | | | | 7 | |
Residential Mortgage Loan Trust | |
1.953% due 09/25/2029 | | | | | 7 | | | | | | 6 | |
SMB Private Education Loan Trust | |
1.442% due 06/15/2027 | | | | | 400 | | | | | | 393 | |
Symphony CLO LP | |
1.729% due 01/09/2023 | | | | | 239 | | | | | | 238 | |
Symphony CLO Ltd. | |
1.586% due 07/23/2023 | | | | | 250 | | | | | | 249 | |
| | | | | | | | | | | | |
| | | | | PRINCIPAL
AMOUNT
(000S) | | | | | MARKET
VALUE
(000S) | |
Venture CLO Ltd. | |
1.609% due 11/14/2022 | | $ | | | 500 | | | $ | | | 499 | |
Vericrest Opportunity Loan Trust | |
3.375% due 10/25/2058 | | | | | 286 | | | | | | 284 | |
VOLT LLC | |
3.250% due 02/25/2055 | | | | | 325 | | | | | | 323 | |
| | | | | | | | | | | | |
Total Asset-Backed Securities (Cost $4,882) | | | | | | 4,887 | |
| | | | | | | | | | | | |
| | | | | | | | | | | | |
| SHORT-TERM INSTRUMENTS 0.7% | |
| | | | | | | | | | | | |
| SHORT-TERM NOTES 0.7% | |
Kansas City Southern Co. | |
1.334% due 10/28/2016 (c) | | | | | 225 | | | | | | 225 | |
| | | | | | | | | | | | |
Total Short-Term Instruments
(Cost $225) | | | | | | 225 | |
| | | | | | | | | | | | |
| |
Total Investments in Securities
(Cost $56,121) | | | | | | 56,492 | |
| |
Total Investments 177.1%
(Cost $56,121) | | | $ | | | 56,492 | |
| | | | | | | | | | | | |
Financial Derivative
Instruments (d)(e) 0.2% (Cost or Premiums, net $(15)) | | | 86 | |
| | | | | | | | | | | | |
Other Assets and Liabilities,
net (77.3)% | | | (24,673) | |
| | | | | | | | | | | | |
| Net Assets 100.0% | | | | | | | | $ | | | 31,905 | |
| | | | | | | | | | | | |
NOTES TO SCHEDULE OF INVESTMENTS (AMOUNTS IN THOUSANDS*, EXCEPT NUMBER OF CONTRACTS):
| * | A zero balance may reflect actual amounts rounding to less than one thousand. |
| (a) | Principal amount of security is adjusted for inflation. |
| (b) | Perpetual maturity; date shown, if applicable, represents next contractual call date. |
BORROWINGS AND OTHER FINANCING TRANSACTIONS
REVERSE REPURCHASE AGREEMENTS:
| | | | | | | | | | | | | | | | | | | | |
| Counterparty | | Borrowing
Rate (2) | | | Borrowing
Date | | | Maturity
Date | | | Amount
Borrowed (2) | | | Payable for
Reverse
Repurchase
Agreements | |
BPS | | | (2.000 | )% | | | 06/13/2016 | | | | TBD | (1) | | $ | (262 | ) | | $ | (262 | ) |
| | | 0.850 | | | | 05/31/2016 | | | | 07/11/2016 | | | | (1,718 | ) | | | (1,719 | ) |
| | | 0.890 | | | | 06/09/2016 | | | | 07/18/2016 | | | | (1,913 | ) | | | (1,914 | ) |
| | | 0.890 | | | | 06/10/2016 | | | | 07/18/2016 | | | | (941 | ) | | | (942 | ) |
DEU | | | 0.850 | | | | 05/12/2016 | | | | 08/12/2016 | | | | (450 | ) | | | (451 | ) |
FOB | | | 0.800 | | | | 06/03/2016 | | | | 07/06/2016 | | | | (2,421 | ) | | | (2,423 | ) |
| | | 0.850 | | | | 06/09/2016 | | | | 07/12/2016 | | | | (478 | ) | | | (478 | ) |
GSC | | | 0.680 | | | | 06/09/2016 | | | | 07/13/2016 | | | | (248 | ) | | | (248 | ) |
| | | | | | |
| See Accompanying Notes | | SEMIANNUAL REPORT | | JUNE 30, 2016 | | 55 |
Schedule of Investments PIMCO Fixed Income SHares: Series LD (Cont.)
| | | | | | | | | | | | | | | | | | | | |
| Counterparty | | Borrowing
Rate (2) | | | Borrowing
Date | | | Maturity
Date | | | Amount
Borrowed (2) | | | Payable for
Reverse
Repurchase
Agreements | |
RDR | | | 0.890 | % | | | 05/23/2016 | | | | 07/01/2016 | | | $ | (202 | ) | | $ | (202 | ) |
| | | 0.890 | | | | 05/23/2016 | | | | 07/07/2016 | | | | (3,309 | ) | | | (3,312 | ) |
| | | 0.890 | | | | 05/24/2016 | | | | 07/08/2016 | | | | (3,077 | ) | | | (3,080 | ) |
| | | 0.900 | | | | 05/26/2016 | | | | 07/11/2016 | | | | (859 | ) | | | (860 | ) |
| | | 0.900 | | | | 05/27/2016 | | | | 07/11/2016 | | | | (1,655 | ) | | | (1,656 | ) |
| | | 0.900 | | | | 06/01/2016 | | | | 07/11/2016 | | | | (203 | ) | | | (203 | ) |
SOG | | | 0.860 | | | | 06/10/2016 | | | | 07/13/2016 | | | | (1,350 | ) | | | (1,351 | ) |
| | | 0.880 | | | | 06/10/2016 | | | | 07/13/2016 | | | | (498 | ) | | | (498 | ) |
| | | 0.950 | | | | 06/27/2016 | | | | 07/13/2016 | | | | (2,089 | ) | | | (2,089 | ) |
| | | | | | | | | | | | | | | | | | | | |
Total Reverse Repurchase Agreements | | | | | | | | | | | $ | (21,688 | ) |
| | | | | | | | | | | | | | | | | | | | |
| (1) | Open maturity reverse repurchase agreement. |
SALE-BUYBACK TRANSACTIONS:
| | | | | | | | | | | | | | | | | | | | |
| Counterparty | | Borrowing
Rate (2) | | | Borrowing
Date | | | Maturity
Date | | | Amount
Borrowed (2) | | | Payable for
Sale-Buyback
Transactions | |
TDM | | | 0.850 | % | | | 06/29/2016 | | | | 07/06/2016 | | | $ | (3,757 | ) | | $ | (3,757 | ) |
| | | | | | | | | | | | | | | | | | | | |
Total Sale-Buyback Transactions | | | | | | | | | | | $ | (3,757 | ) |
| | | | | | | | | | | | | | | | | | | | |
| (2) | The average amount of borrowings outstanding during the period ended June 30, 2016 was $(18,877) at a weighted average interest rate of 0.817%. |
BORROWINGS AND OTHER FINANCING TRANSACTIONS SUMMARY
The following is a summary by counterparty of the market value of Borrowings and Other Financing Transactions and collateral pledged as of June 30, 2016:
| (c) | Securities with an aggregate market value of $26,611 have been pledged as collateral under the terms of the following master agreements as of June 30, 2016. |
| | | | | | | | | | | | | | | | | | | | | | | | |
| Counterparty | | Repurchase
Agreement
Proceeds to be
Received | | | Payable for
Reverse
Repurchase
Agreements | | | Payable for
Sale-Buyback
Transactions | | | Total
Borrowings and
Other Financing
Transactions | | | Collateral
Pledged | | | Net Exposure (3) | |
Global/Master Repurchase Agreement | | | | | | | | | | | | | | | | | | | | | | | | |
BPS | | $ | 0 | | | $ | (4,837 | ) | | $ | 0 | | | $ | (4,837 | ) | | $ | 5,083 | | | $ | 246 | |
DEU | | | 0 | | | | (451 | ) | | | 0 | | | | (451 | ) | | | 455 | | | | 4 | |
FOB | | | 0 | | | | (2,901 | ) | | | 0 | | | | (2,901 | ) | | | 3,111 | | | | 210 | |
GSC | | | 0 | | | | (248 | ) | | | 0 | | | | (248 | ) | | | 256 | | | | 8 | |
RDR | | | 0 | | | | (9,313 | ) | | | 0 | | | | (9,313 | ) | | | 9,799 | | | | 486 | |
SOG | | | 0 | | | | (3,938 | ) | | | 0 | | | | (3,938 | ) | | | 4,142 | | | | 204 | |
| | | | | | |
Master Securities Forward Transaction Agreement | | | | | | | | | | | | | | | | | | | | | | | | |
TDM | | | 0 | | | | 0 | | | | (3,757 | ) | | | (3,757 | ) | | | 3,764 | | | | 7 | |
| | | | | | | | | | | | | | | | | | | | | | | | |
Total Borrowings and Other Financing Transactions | | $ | 0 | | | $ | (21,688 | ) | | $ | (3,757 | ) | | | | | | | | | | | | |
| | | | | | | | | | | | | | | | | | | | | | | | |
| (3) | Net Exposure represents the net receivable/(payable) that would be due from/to the counterparty in the event of default. Exposure from borrowings and other financing transactions can only be netted across transactions governed under the same master agreement with the same legal entity. See Note 7, Principal Risks, in the Notes to Financial Statements for more information regarding master netting arrangements. |
| | | | | | |
| 56 | | PIMCO MANAGED ACCOUNTS TRUST | | | | See Accompanying Notes |
(Unaudited)
June 30, 2016
CERTAIN TRANSFERS ACCOUNTED FOR AS SECURED BORROWINGS
Remaining Contractual Maturity of the Agreements
| | | | | | | | | | | | | | | | | | | | |
| | | Overnight and
Continuous | | | Up to 30 days | | | 31-90 days | | | Greater Than 90 days | | | Total | |
Reverse Repurchase Agreements | | | | | | | | | | | | | | | | | | | | |
Corporate Bonds & Notes | | $ | (202 | ) | | $ | (20,525) | | | $ | 0 | | | $ | (262 | ) | | $ | (20,989) | |
U.S. Government Agencies | | | 0 | | | | (248) | | | | (451 | ) | | | 0 | | | | (699) | |
| | | | | | | | | | | | | | | | | | | | |
Total | | $ | (202 | ) | | $ | (20,773) | | | $ | (451 | ) | | $ | (262 | ) | | $ | (21,688) | |
| | | | | |
Sale-Buyback Transactions | | | | | | | | | | | | | | | | | | | | |
U.S. Treasury Obligations | | | 0 | | | | (3,757) | | | | 0 | | | | 0 | | | | (3,757) | |
| | | | | | | | | | | | | | | | | | | | |
Total | | $ | 0 | | | $ | (3,757) | | | $ | 0 | | | $ | 0 | | | $ | (3,757) | |
| | | | | | | | | | | | | | | | | | | | |
Total Borrowings | | $ | (202 | ) | | $ | (24,530) | | | $ | (451 | ) | | $ | (262 | ) | | $ | (25,445) | |
| | | | | | | | | | | | | | | | | | | | |
Gross amount of recognized liabilities for reverse repurchase agreements and sale-buyback financing transactions | | | $ | (25,445) | |
| | | | | | | | | | | | | | | | | | | | |
(d) FINANCIAL DERIVATIVE INSTRUMENTS: EXCHANGE-TRADED OR CENTRALLY CLEARED
FUTURES CONTRACTS:
| | | | | | | | | | | | | | | | | | | | | | | | |
| Description | | Type | | | Expiration
Month | | | # of
Contracts | | | Unrealized
Appreciation/
(Depreciation) | | | Variation Margin | |
| | | | | | Asset | | | Liability | |
3-Month Euribor December Futures | | | Long | | | | 12/2017 | | | | 8 | | | $ | 2 | | | $ | 0 | | | $ | 0 | |
90-Day Eurodollar December Futures | | | Short | | | | 12/2019 | | | | 185 | | | | (138 | ) | | | 5 | | | | 0 | |
Euro-Schatz September Futures | | | Long | | | | 09/2016 | | | | 16 | | | | 2 | | | | 0 | | | | (1 | ) |
| | | | | | | | | | | | | | | | | | | | | | | | |
Total Futures Contracts | | | | | | | | | | | | | | $ | (134 | ) | | $ | 5 | | | $ | (1 | ) |
| | | | | | | | | | | | | | | | | | | | | | | | |
SWAP AGREEMENTS:
INTEREST RATE SWAPS
| | | | | | | | | | | | | | | | | | | | | | | | | | | | | | | | | | |
Pay/Receive
Floating Rate | | Floating Rate Index | | Fixed Rate | | | Maturity
Date | | | | | | Notional
Amount | | | Market
Value | | | Unrealized
Appreciation/
(Depreciation) | | | Variation Margin | |
| | | | | | | | | Asset | | | Liability | |
Pay | | 3-Month USD-LIBOR | | | 0.950% | | | | 04/13/2018 | | | | $ | | | | 3,000 | | | $ | (14 | ) | | $ | (11 | ) | | $ | 0 | | | $ | 0 | |
Pay | | 3-Month USD-LIBOR * | | | 0.000 | | | | 06/21/2020 | | | | | | | | 49,000 | | | | (5 | ) | | | (4 | ) | | | 1 | | | | 0 | |
Pay | | 3-Month USD-LIBOR | | | 2.000 | | | | 12/16/2020 | | | | | | | | 15,000 | | | | 700 | | | | 437 | | | | 1 | | | | 0 | |
Pay | | 3-Month USD-LIBOR * | | | 1.500 | | | | 12/14/2021 | | | | | | | | 15,000 | | | | (308 | ) | | | (662 | ) | | | 4 | | | | 0 | |
Pay | | 3-Month USD-LIBOR | | | 2.250 | | | | 06/15/2026 | | | | | | | | 400 | | | | (32 | ) | | | (15 | ) | | | 1 | | | | 0 | |
Pay | | 6-Month EUR-EURIBOR * | | | 0.000 | | | | 09/21/2018 | | | | EUR | | | | 1,500 | | | | 7 | | | | 2 | | | | 0 | | | | 0 | |
| | | | | | | | | | | | | | | | | | | | | | | | | | | | | | | | | | |
| | | | | | | | | | | | | | | | | | | | $ | 348 | | | $ | (253 | ) | | $ | 7 | | | $ | 0 | |
| | | | | | | | | | | | | | | | | | | | | | | | | | | | | | | | | | |
Total Swap Agreements | | | $ | 348 | | | $ | (253 | ) | | $ | 7 | | | $ | 0 | |
| | | | | | | | | | | | | | | | | | | | | | | | | | | | | | | | | | |
| * | This security has a forward starting effective date. See Note 2(a) in the Notes to Financial Statements for further information. |
| | | | | | |
| See Accompanying Notes | | SEMIANNUAL REPORT | | JUNE 30, 2016 | | 57 |
Schedule of Investments PIMCO Fixed Income SHares: Series LD (Cont.)
FINANCIAL DERIVATIVE INSTRUMENTS: EXCHANGE-TRADED OR CENTRALLY CLEARED SUMMARY
The following is a summary of the market value and variation margin of Exchange-Traded or Centrally Cleared Financial Derivative Instruments as of June 30, 2016:
Cash of $269 has been pledged as collateral for exchange-traded and centrally cleared financial derivative instruments as of June 30, 2016. See Note 7, Principal Risks, in the Notes to Financial Statements for more information regarding master netting arrangements.
| | | | | | | | | | | | | | | | | | | | | | | | | | | | | | | | | | | | |
| | | Financial Derivative Assets | | | | | | Financial Derivative Liabilities | |
| | | Market Value | | | Variation Margin
Asset | | | | | | | | | Market Value | | | Variation Margin
Liability | | | | |
| | | Purchased
Options | | | Futures | | | Swap
Agreements | | | Total | | | | | | Written
Options | | | Futures | | | Swap
Agreements | | | Total | |
Total Exchange-Traded or Centrally Cleared | | $ | 0 | | | $ | 5 | | | $ | 7 | | | $ | 12 | | | | | | | $ | 0 | | | $ | (1) | | | $ | 0 | | | $ | (1) | |
| | | | | | | | | | | | | | | | | | | | | | | | | | | | | | | | | | | | |
(e) FINANCIAL DERIVATIVE INSTRUMENTS: OVER THE COUNTER
FORWARD FOREIGN CURRENCY CONTRACTS:
| | | | | | | | | | | | | | | | | | | | | | | | | | | | |
Counterparty | | Settlement
Month | | | Currency to
be Delivered | | | Currency to
be Received | | | Unrealized Appreciation/
(Depreciation) | |
| | | | | Asset | | | Liability | |
BOA | | | 07/2016 | | | $ | | | | | 210 | | | | GBP | | | | 158 | | | $ | 0 | | | $ | 0 | |
| | | 08/2016 | | | | GBP | | | | 158 | | | $ | | | | | 210 | | | | 0 | | | | 0 | |
| | | 08/2016 | | | $ | | | | | 17 | | | | EUR | | | | 15 | | | | 0 | | | | 0 | |
| | | | | | | | | | | | | | | | | | | | | | | | | | | | |
BPS | | | 08/2016 | | | | EUR | | | | 634 | | | $ | | | | | 700 | | | | 0 | | | | (5 | ) |
| | | | | | | | | | | | | | | | | | | | | | | | | | | | |
DUB | | | 07/2016 | | | | BRL | | | | 1,000 | | | | | | | | 303 | | | | 0 | | | | (8 | ) |
| | | 07/2016 | | | $ | | | | | 312 | | | | BRL | | | | 1,000 | | | | 0 | | | | 0 | |
| | | 08/2016 | | | | EUR | | | | 752 | | | $ | | | | | 834 | | | | 0 | | | | (2 | ) |
| | | | | | | | | | | | | | | | | | | | | | | | | | | | |
GLM | | | 07/2016 | | | | BRL | | | | 3,500 | | | | | | | | 1,090 | | | | 1 | | | | 0 | |
| | | 07/2016 | | | | GBP | | | | 195 | | | | | | | | 282 | | | | 22 | | | | 0 | |
| | | 07/2016 | | | $ | | | | | 861 | | | | BRL | | | | 3,500 | | | | 228 | | | | 0 | |
| | | 07/2016 | | | | | | | | 52 | | | | GBP | | | | 37 | | | | 0 | | | | (3 | ) |
| | | 07/2016 | | | | | | | | 829 | | | | JPY | | | | 84,800 | | | | 0 | | | | (8 | ) |
| | | 08/2016 | | | | AUD | | | | 2,242 | | | $ | | | | | 1,643 | | | | 0 | | | | (26 | ) |
| | | 08/2016 | | | | EUR | | | | 2,343 | | | | | | | | 2,677 | | | | 73 | | | | 0 | |
| | | 08/2016 | | | | JPY | | | | 36,100 | | | | | | | | 351 | | | | 2 | | | | 0 | |
| | | 08/2016 | | | $ | | | | | 708 | | | | CAD | | | | 923 | | | | 6 | | | | 0 | |
| | | 08/2016 | | | | | | | | 370 | | | | EUR | | | | 325 | | | | 0 | | | | (9 | ) |
| | | | | | | | | | | | | | | | | | | | | | | | | | | | |
IND | | | 08/2016 | | | | JPY | | | | 31,600 | | | $ | | | | | 308 | | | | 1 | | | | 0 | |
| | | | | | | | | | | | | | | | | | | | | | | | | | | | |
JPM | | | 07/2016 | | | | BRL | | | | 2,500 | | | | | | | | 597 | | | | 0 | | | | (181 | ) |
| | | 07/2016 | | | $ | | | | | 779 | | | | BRL | | | | 2,500 | | | | 0 | | | | (1 | ) |
| | | 08/2016 | | | | CAD | | | | 1,883 | | | $ | | | | | 1,462 | | | | 8 | | | | (4 | ) |
| | | 08/2016 | | | | EUR | | | | 81 | | | | | | | | 92 | | | | 2 | | | | 0 | |
| | | 08/2016 | | | $ | | | | | 1,588 | | | | AUD | | | | 2,212 | | | | 60 | | | | 0 | |
| | | | | | | | | | | | | | | | | | | | | | | | | | | | |
TDM | | | 07/2016 | | | | JPY | | | | 116,400 | | | $ | | | | | 1,049 | | | | 0 | | | | (78 | ) |
| | | 08/2016 | | | | CAD | | | | 917 | | | | | | | | 721 | | | | 11 | | | | 0 | |
| | | | | | | | | | | | | | | | | | | | | | | | | | | | |
Total Forward Foreign Currency Contracts | | | | | | | | | | | $ | 414 | | | $ | (325 | ) |
| | | | | | | | | | | | | | | | | | | | | | | | | | | | |
| | | | | | |
| 58 | | PIMCO MANAGED ACCOUNTS TRUST | | | | See Accompanying Notes |
(Unaudited)
June 30, 2016
WRITTEN OPTIONS:
FOREIGN CURRENCY OPTIONS
| | | | | | | | | | | | | | | | | | | | | | |
| Counterparty | | Description | | Strike
Price | | | Expiration
Date | | | Notional
Amount | | | Premiums
(Received) | | | Market
Value | |
| BPS | | Put - OTC EUR versus USD | | $ | 1.087 | | | | 08/03/2016 | | | | EUR 2,000 | | | $ | (10 | ) | | $ | (10 | ) |
| | | | | | | | | | | | | | | | | | | | | | |
Total Written Options | | | | | | | $ | (10 | ) | | $ | (10 | ) |
| | | | | | | | | | | | | | | | | | | | | | |
TRANSACTIONS IN WRITTEN CALL AND PUT OPTIONS FOR THE PERIOD ENDED JUNE 30, 2016:
| | | | | | | | | | | | | | | | | | | | | | | | | | | | | | | | | | | | | | | | | | | | | | | | |
| | | Balance at
Beginning of Period | | | Sales | | | Closing Buys | | | Expirations | | | Exercised | | | Balance at
End of Period | |
# of Contracts | | | | | | | 166 | | | | | | | | 8 | | | | | | | | (174 | ) | | | | | | | 0 | | | | | | | | 0 | | | | | | | | 0 | |
Notional Amount in $ | | | $ | | | | 0 | | | | $ | | | | 31,900 | | | | $ | | | | (21,700 | ) | | | $ | | | | 0 | | | | $ | | | | (10,200 | ) | | | $ | | | | 0 | |
Notional Amount in AUD | | | AUD | | | | 0 | | | | AUD | | | | 1,050 | | | | AUD | | | | 0 | | | | AUD | | | | (1,050 | ) | | | AUD | | | | 0 | | | | AUD | | | | 0 | |
Notional Amount in EUR | | | EUR | | | | 0 | | | | EUR | | | | 2,000 | | | | EUR | | | | 0 | | | | EUR | | | | 0 | | | | EUR | | | | 0 | | | | EUR | | | | 2,000 | |
Premiums | | | $ | | | | (124 | ) | | | $ | | | | (73 | ) | | | $ | | | | 173 | | | | $ | | | | 4 | | | | $ | | | | 10 | | | | $ | | | | (10 | ) |
SWAP AGREEMENTS:
CREDIT DEFAULT SWAPS ON SOVEREIGN ISSUES - SELL PROTECTION (1)
| | | | | | | | | | | | | | | | | | | | | | | | | | | | | | | | | | | | | | |
| Counterparty | | Reference Entity | | Fixed
Receive Rate | | | Maturity
Date | | | Implied
Credit
Spread at
June 30,
2016 (2) | | | Notional
Amount (3) | | | Premiums
(Received) | | | Unrealized
Appreciation | | | Swap Agreements,
at Value | |
| | | | | | | | | Asset | | | Liability | |
BPS | | Mexico Government International Bond | | | 1.000% | | | | 09/20/2020 | | | | 1.333% | | | | $ | | | | 300 | | | $ | (5 | ) | | $ | 1 | | | $ | 0 | | | $ | (4 | ) |
| | | | | | | | | | | | | | | | | | | | | | | | | | | | | | | | | | | | | | |
Total Swap Agreements | | | | | | | | | | | | | | | | | | | | | | $ | (5 | ) | | $ | 1 | | | $ | 0 | | | $ | (4 | ) |
| | | | | | | | | | | | | | | | | | | | | | | | | | | | | | | | | | | | | | |
| (1) | If the Portfolio is a seller of protection and a credit event occurs, as defined under the terms of that particular swap agreement, the Portfolio will either (i) pay to the buyer of protection an amount equal to the notional amount of the swap and take delivery of the referenced obligation or underlying securities comprising the referenced index or (ii) pay a net settlement amount in the form of cash, securities , or other deliverable obligations equal to the notional amount of the swap less the recovery value of the referenced obligation or underlying securities comprising the referenced index. |
| (2) | Implied credit spreads, represented in absolute terms, utilized in determining the market value of credit default swap agreements on sovereign issues as of period end serve as an indicator of the current status of the payment/performance risk and represent the likelihood or risk of default for the credit derivative. The implied credit spread of a particular referenced entity reflects the cost of buying/selling protection and may include upfront payments required to be made to enter into the agreement. Wider credit spreads represent a deterioration of the referenced entity’s credit soundness and a greater likelihood or risk of default or other credit event occurring as defined under the terms of the agreement. |
| (3) | The maximum potential amount the Portfolio could be required to pay as a seller of credit protection or receive as a buyer of credit protection if a credit event occurs as defined under the terms of that particular swap agreement. |
| | | | | | |
| See Accompanying Notes | | SEMIANNUAL REPORT | | JUNE 30, 2016 | | 59 |
Schedule of Investments PIMCO Fixed Income SHares: Series LD (Cont.)
FINANCIAL DERIVATIVE INSTRUMENTS: OVER THE COUNTER SUMMARY
The following is a summary by counterparty of the market value of OTC financial derivative instruments and collateral (received) as of June 30, 2016:
| | | | | | | | | | | | | | | | | | | | | | | | | | | | | | | | | | | | | | | | | | | | | | | | |
| | | Financial Derivative Assets | | | | | | Financial Derivative Liabilities | | | | | | | | | | |
| Counterparty | | Forward
Foreign
Currency
Contracts | | | Purchased
Options | | | Swap
Agreements | | | Total
Over
the
Counter | | | | | | Forward
Foreign
Currency
Contracts | | | Written
Options | | | Swap
Agreements | | | Total
Over
the
Counter | | | Net Market
Value
of
OTC
Derivatives | | | Collateral
(Received) | | | Net
Exposure (4) | |
BPS | | $ | 0 | | | $ | 0 | | | $ | 0 | | | $ | 0 | | | | | | | $ | (5 | ) | | $ | (10 | ) | | $ | (4 | ) | | $ | (19 | ) | | $ | (19 | ) | | $ | 0 | | | $ | (19 | ) |
DUB | | | 0 | | | | 0 | | | | 0 | | | | 0 | | | | | | | | (10 | ) | | | 0 | | | | 0 | | | | (10 | ) | | | (10 | ) | | | 0 | | | | (10 | ) |
GLM | | | 332 | | | | 0 | | | | 0 | | | | 332 | | | | | | | | (46 | ) | | | 0 | | | | 0 | | | | (46 | ) | | | 286 | | | | (270 | ) | | | 16 | |
IND | | | 1 | | | | 0 | | | | 0 | | | | 1 | | | | | | | | 0 | | | | 0 | | | | 0 | | | | 0 | | | | 1 | | | | 0 | | | | 1 | |
JPM | | | 70 | | | | 0 | | | | 0 | | | | 70 | | | | | | | | (186 | ) | | | 0 | | | | 0 | | | | (186 | ) | | | (116 | ) | | | 0 | | | | (116 | ) |
TDM | | | 11 | | | | 0 | | | | 0 | | | | 11 | | | | | | | | (78 | ) | | | 0 | | | | 0 | | | | (78 | ) | | | (67 | ) | | | 0 | | | | (67 | ) |
| | | | | | | | | | | | | | | | | | | | | | | | | | | | | | | | | | | | | | | | | | | | | | | | |
Total Over the Counter | | $ | 414 | | | $ | 0 | | | $ | 0 | | | $ | 414 | | | | | | | $ | (325 | ) | | $ | (10 | ) | | $ | (4 | ) | | $ | (339 | ) | | | | | | | | | | | | |
| | | | | | | | | | | | | | | | | | | | | | | | | | | | | | | | | | | | | | | | | | | | | | | | |
| (4) | Net Exposure represents the net receivable/(payable) that would be due from/to the counterparty in the event of default. Exposure from OTC financial derivative instruments can only be netted across transactions governed under the same master agreement with the same legal entity. See Note 7, Principal Risks, in the Notes to Financial Statements for more information regarding master netting arrangements. |
FAIR VALUE OF FINANCIAL DERIVATIVE INSTRUMENTS
The following is a summary of the fair valuation of the Portfolio’s derivative instruments categorized by risk exposure. See Note 7, Principal Risks, in the Notes to Financial Statements on risks of the Portfolio.
Fair Values of Financial Derivative Instruments on the Statements of Assets and Liabilities as of June 30, 2016:
| | | | | | | | | | | | | | | | | | | | | | | | |
| | | Derivatives not accounted for as hedging instruments | |
| | | Commodity
Contracts | | | Credit
Contracts | | | Equity
Contracts | | | Foreign
Exchange
Contracts | | | Interest
Rate Contracts | | | Total | |
Financial Derivative Instruments - Assets | | | | | | | | | | | | | | | | | | | | | | | | |
Exchange-traded or centrally cleared | | | | | | | | | | | | | | | | | | | | | | | | |
Futures | | $ | 0 | | | $ | 0 | | | $ | 0 | | | $ | 0 | | | $ | 5 | | | $ | 5 | |
Swap Agreements | | | 0 | | | | 0 | | | | 0 | | | | 0 | | | | 7 | | | | 7 | |
| | | | | | | | | | | | | | | | | | | | | | | | |
| | $ | 0 | | | $ | 0 | | | $ | 0 | | | $ | 0 | | | $ | 12 | | | $ | 12 | |
| | | | | | | | | | | | | | | | | | | | | | | | |
Over the counter | | | | | | | | | | | | | | | | | | | | | | | | |
Forward Foreign Currency Contracts | | $ | 0 | | | $ | 0 | | | $ | 0 | | | $ | 414 | | | $ | 0 | | | $ | 414 | |
| | | | | | | | | | | | | | | | | | | | | | | | |
| | $ | 0 | | | $ | 0 | | | $ | 0 | | | $ | 414 | | | $ | 12 | | | $ | 426 | |
| | | | | | | | | | | | | | | | | | | | | | | | |
| | | | | |
Financial Derivative Instruments - Liabilities | | | | | | | | | | | | | | | | | | | | | |
Exchange-traded or centrally cleared | | | | | | | | | | | | | | | | | | | | | | | | |
Futures | | $ | 0 | | | $ | 0 | | | $ | 0 | | | $ | 0 | | | $ | 1 | | | $ | 1 | |
| | | | | | | | | | | | | | | | | | | | | | | | |
Over the counter | | | | | | | | | | | | | | | | | | | | | | | | |
Forward Foreign Currency Contracts | | $ | 0 | | | $ | 0 | | | $ | 0 | | | $ | 325 | | | $ | 0 | | | $ | 325 | |
Written Options | | | 0 | | | | 0 | | | | 0 | | | | 10 | | | | 0 | | | | 10 | |
Swap Agreements | | | 0 | | | | 4 | | | | 0 | | | | 0 | | | | 0 | | | | 4 | |
| | | | | | | | | | | | | | | | | | | | | | | | |
| | $ | 0 | | | $ | 4 | | | $ | 0 | | | $ | 335 | | | $ | 0 | | | $ | 339 | |
| | | | | | | | | | | | | | | | | | | | | | | | |
| | $ | 0 | | | $ | 4 | | | $ | 0 | | | $ | 335 | | | $ | 1 | | | $ | 340 | |
| | | | | | | | | | | | | | | | | | | | | | | | |
| | | | | | |
| 60 | | PIMCO MANAGED ACCOUNTS TRUST | | | | See Accompanying Notes |
(Unaudited)
June 30, 2016
The effect of Financial Derivative Instruments on the Statements of Operations for the period ended June 30, 2016:
| | | | | | | | | | | | | | | | | | | | | | | | |
| | | Derivatives not accounted for as hedging instruments | |
| | | Commodity
Contracts | | | Credit
Contracts | | | Equity
Contracts | | | Foreign
Exchange
Contracts | | | Interest
Rate Contracts | | | Total | |
Net Realized Gain (Loss) on Financial Derivative Instruments | | | | | |
Exchange-traded or centrally cleared | | | | | | | | | | | | | | | | | | | | | | | | |
Written Options | | $ | 0 | | | $ | 0 | | | $ | 0 | | | $ | 0 | | | $ | 7 | | | $ | 7 | |
Futures | | | 0 | | | | 0 | | | | 0 | | | | 0 | | | | (164 | ) | | | (164 | ) |
Swap Agreements | | | 0 | | | | 0 | | | | 0 | | | | 0 | | | | (26 | ) | | | (26 | ) |
| | | | | | | | | | | | | | | | | | | | | | | | |
| | $ | 0 | | | $ | 0 | | | $ | 0 | | | $ | 0 | | | $ | (183 | ) | | $ | (183 | ) |
| | | | | | | | | | | | | | | | | | | | | | | | |
Over the counter | | | | | | | | | | | | | | | | | | | | | | | | |
Forward Foreign Currency Contracts | | $ | 0 | | | $ | 0 | | | $ | 0 | | | $ | 94 | | | $ | 0 | | | $ | 94 | |
Purchased Options | | | 0 | | | | 0 | | | | 0 | | | | (4 | ) | | | (10 | ) | | | (14 | ) |
Written Options | | | 0 | | | | 0 | | | | 0 | | | | 4 | | | | 22 | | | | 26 | |
Swap Agreements | | | 0 | | | | 4 | | | | 0 | | | | 0 | | | | 0 | | | | 4 | |
| | | | | | | | | | | | | | | | | | | | | | | | |
| | $ | 0 | | | $ | 4 | | | $ | 0 | | | $ | 94 | | | $ | 12 | | | $ | 110 | |
| | | | | | | | | | | | | | | | | | | | | | | | |
| | $ | 0 | | | $ | 4 | | | $ | 0 | | | $ | 94 | | | $ | (171 | ) | | $ | (73 | ) |
| | | | | | | | | | | | | | | | | | | | | | | | |
| |
Net Change in Unrealized Appreciation (Depreciation) on Financial Derivative Instruments | | | | | |
Exchange-traded or centrally cleared | | | | | | | | | | | | | | | | | | | | | | | | |
Purchased Options | | $ | 0 | | | $ | 0 | | | $ | 0 | | | $ | 0 | | | $ | 7 | | | $ | 7 | |
Written Options | | | 0 | | | | 0 | | | | 0 | | | | 0 | | | | (46 | ) | | | (46 | ) |
Futures | | | 0 | | | | 0 | | | | 0 | | | | 0 | | | | (208 | ) | | | (208 | ) |
Swap Agreements | | | 0 | | | | 0 | | | | 0 | | | | 0 | | | | (215 | ) | | | (215 | ) |
| | | | | | | | | | | | | | | | | | | | | | | | |
| | $ | 0 | | | $ | 0 | | | $ | 0 | | | $ | 0 | | | $ | (462 | ) | | $ | (462 | ) |
| | | | | | | | | | | | | | | | | | | | | | | | |
Over the counter | | | | | | | | | | | | | | | | | | | | | | | | |
Forward Foreign Currency Contracts | | $ | 0 | | | $ | 0 | | | $ | 0 | | | $ | (93 | ) | | $ | 0 | | | $ | (93 | ) |
Written Options | | | 0 | | | | 0 | | | | 0 | | | | 1 | | | | 0 | | | | 1 | |
Swap Agreements | | | 0 | | | | 4 | | | | 0 | | | | 0 | | | | 0 | | | | 4 | |
| | | | | | | | | | | | | | | | | | | | | | | | |
| | $ | 0 | | | $ | 4 | | | $ | 0 | | | $ | (92 | ) | | $ | 0 | | | $ | (88 | ) |
| | | | | | | | | | | | | | | | | | | | | | | | |
| | $ | 0 | | | $ | 4 | | | $ | 0 | | | $ | (92 | ) | | $ | (462 | ) | | $ | (550 | ) |
| | | | | | | | | | | | | | | | | | | | | | | | |
FAIR VALUE MEASUREMENTS
The following is a summary of the fair valuations according to the inputs used as of June 30, 2016 in valuing the Portfolio’s assets and liabilities:
| | | | | | | | | | | | | | | | |
| Category and Subcategory | | Level 1 | | | Level 2 | | | Level 3 | | | Fair
Value at
06/30/2016 | |
Investments in Securities, at Value | | | | | | | | | | | | | | | | |
Bank Loan Obligations | | $ | 0 | | | $ | 650 | | | $ | 0 | | | $ | 650 | |
Corporate Bonds & Notes | | | | | | | | | | | | | | | | |
Banking & Finance | | | 0 | | | | 19,702 | | | | 0 | | | | 19,702 | |
Industrials | | | 0 | | | | 14,051 | | | | 0 | | | | 14,051 | |
Utilities | | | 0 | | | | 4,606 | | | | 0 | | | | 4,606 | |
U.S. Government Agencies | | | 0 | | | | 813 | | | | 0 | | | | 813 | |
U.S. Treasury Obligations | | | 0 | | | | 4,810 | | | | 0 | | | | 4,810 | |
Non-Agency Mortgage-Backed Securities | | | 0 | | | | 6,748 | | | | 0 | | | | 6,748 | |
Asset-Backed Securities | | | 0 | | | | 4,887 | | | | 0 | | | | 4,887 | |
Short-Term Instruments | | | | | | | | | | | | | | | | |
Short-Term Notes | | | 0 | | | | 225 | | | | 0 | | | | 225 | |
| | | | |
Total Investments | | $ | 0 | | | $ | 56,492 | | | $ | 0 | | | $ | 56,492 | |
| | | | | | |
| See Accompanying Notes | | SEMIANNUAL REPORT | | JUNE 30, 2016 | | 61 |
Schedule of Investments PIMCO Fixed Income SHares: Series LD (Cont.)
(Unaudited)
June 30, 2016
| | | | | | | | | | | | | | | | |
| Category and Subcategory | | Level 1 | | | Level 2 | | | Level 3 | | | Fair
Value at
06/30/2016 | |
Financial Derivative Instruments - Assets | | | | | | | | | | | | | | | | |
Exchange-traded or centrally cleared | | $ | 5 | | | $ | 7 | | | $ | 0 | | | $ | 12 | |
Over the counter | | | 0 | | | | 414 | | | | 0 | | | | 414 | |
| | $ | 5 | | | $ | 421 | | | $ | 0 | | | $ | 426 | |
| | | | |
Financial Derivative Instruments - Liabilities | | | | | | | | | | | | | | | | |
Exchange-traded or centrally cleared | | | (1 | ) | | | 0 | | | | 0 | | | | (1 | ) |
Over the counter | | | 0 | | | | (339 | ) | | | 0 | | | | (339 | ) |
| | $ | (1 | ) | | $ | (339 | ) | | $ | 0 | | | $ | (340 | ) |
| | | | |
Totals | | $ | 4 | | | $ | 56,574 | | | $ | 0 | | | $ | 56,578 | |
There were no significant transfers between Levels 1, 2, or 3 during the period ended June 30, 2016.
| | | | | | |
| 62 | | PIMCO MANAGED ACCOUNTS TRUST | | | | See Accompanying Notes |
Schedule of Investments PIMCO Fixed Income SHares: Series M
(Unaudited)
June 30, 2016
| | | | | | | | | | | | |
| | | | | PRINCIPAL
AMOUNT
(000S) | | | | | MARKET
VALUE
(000S) | |
| INVESTMENTS IN SECURITIES 170.6% | |
| | | | | | | | | | | | |
| CORPORATE BONDS & NOTES 38.9% | |
| | | | | | | | | | | | |
| BANKING & FINANCE 24.6% | |
AerCap Ireland Capital Ltd. | |
5.000% due 10/01/2021 | | $ | | | 17,800 | | | $ | | | 18,556 | |
Ally Financial, Inc. | |
2.750% due 01/30/2017 | | | | | 100 | | | | | | 101 | |
American International Group, Inc. | |
6.250% due 05/01/2036 | | | | | 6,000 | | | | | | 7,161 | |
Aviation Capital Group Corp. | |
6.750% due 04/06/2021 | | | | | 9,800 | | | | | | 11,086 | |
Banco Santander Mexico S.A. Institucion de Banca Multiple Grupo Financiero Santand | |
4.125% due 11/09/2022 | | | | | 46,000 | | | | | | 47,495 | |
Bank of America Corp. | |
5.700% due 01/24/2022 | | | | | 14,000 | | | | | | 16,233 | |
Barclays Bank PLC | |
7.625% due 11/21/2022 | | | | | 5,000 | | | | | | 5,391 | |
7.750% due 04/10/2023 | | | | | 2,600 | | | | | | 2,688 | |
10.000% due 05/21/2021 | | GBP | | | 17,200 | | | | | | 28,437 | |
10.179% due 06/12/2021 | | $ | | | 12,280 | | | | | | 15,478 | |
14.000% due 06/15/2019 (d) | | GBP | | | 3,500 | | | | | | 5,661 | |
Blackstone CQP Holdco LP | |
9.296% due 03/19/2019 | | $ | | | 71,771 | | | | | | 71,771 | |
BPCE S.A. | |
4.500% due 03/15/2025 | | | | | 5,300 | | | | | | 5,309 | |
4.625% due 07/11/2024 | | | | | 14,300 | | | | | | 14,362 | |
CIT Group, Inc. | |
4.250% due 08/15/2017 | | | | | 7,000 | | | | | | 7,147 | |
5.000% due 05/15/2017 | | | | | 100 | | | | | | 102 | |
Cooperatieve Rabobank UA | |
8.400% due 06/29/2017 (d) | | | | | 11,700 | | | | | | 12,271 | |
Corp. Financiera de Desarrollo S.A. | |
4.750% due 02/08/2022 | | | | | 7,000 | | | | | | 7,455 | |
Credit Suisse AG | |
6.500% due 08/08/2023 | | | | | 14,100 | | | | | | 14,808 | |
General Motors Financial Co., Inc. | |
4.250% due 05/15/2023 | | | | | 10,930 | | | | | | 11,259 | |
Hospitality Properties Trust | |
5.000% due 08/15/2022 | | | | | 8,500 | | | | | | 9,147 | |
HSBC Finance Corp. | |
6.676% due 01/15/2021 | | | | | 15,900 | | | | | | 17,800 | |
Intesa Sanpaolo SpA | |
6.500% due 02/24/2021 | | | | | 2,300 | | | | | | 2,620 | |
Itau Unibanco Holding S.A. | |
5.650% due 03/19/2022 | | | | | 7,900 | | | | | | 8,149 | |
KGH Intermediate Holdco LLC | |
8.500% due 08/08/2019 (e) | | | | | 16,926 | | | | | | 15,751 | |
Ohio National Financial Services, Inc. | |
6.375% due 04/30/2020 | | | | | 1,500 | | | | | | 1,696 | |
| | | | | | | | | | | | |
| | | | | PRINCIPAL
AMOUNT
(000S) | | | | | MARKET
VALUE
(000S) | |
OMX Timber Finance Investments LLC | |
5.420% due 01/29/2020 | | $ | | | 10,000 | | | $ | | | 11,122 | |
Qatari Diar Finance Co. | |
5.000% due 07/21/2020 | | | | | 2,000 | | | | | | 2,210 | |
Sberbank of Russia Via SB Capital S.A. | |
5.400% due 03/24/2017 | | | | | 4,950 | | | | | | 5,085 | |
| | | | | | | | | | | | |
| | | | | | | | | | | 376,351 | |
| | | | | | | | | | | | |
| | | | | | | | | | | | |
| INDUSTRIALS 7.7% | |
Clear Channel Worldwide Holdings, Inc. | |
6.500% due 11/15/2022 | | | | | 11,250 | | | | | | 11,184 | |
CNH Industrial Finance Europe S.A. | |
6.250% due 03/09/2018 | | EUR | | | 1,000 | | | | | | 1,198 | |
CVS Pass-Through Trust | |
7.507% due 01/10/2032 | | $ | | | 6,809 | | | | | | 8,587 | |
Domtar Corp. | |
6.750% due 02/15/2044 | | | | | 700 | | | | | | 769 | |
Florida Gas Transmission Co. LLC | |
7.900% due 05/15/2019 | | | | | 5,000 | | | | | | 5,648 | |
Georgia-Pacific LLC | |
8.000% due 01/15/2024 | | | | | 4,200 | | | | | | 5,621 | |
Gerdau Trade, Inc. | |
5.750% due 01/30/2021 | | | | | 2,000 | | | | | | 1,916 | |
HCA, Inc. | |
5.875% due 03/15/2022 | | | | | 5,000 | | | | | | 5,450 | |
6.500% due 02/15/2020 | | | | | 10,300 | | | | | | 11,446 | |
Kinder Morgan Energy Partners LP | |
5.300% due 09/15/2020 | | | | | 10,500 | | | | | | 11,246 | |
6.850% due 02/15/2020 | | | | | 5,000 | | | | | | 5,601 | |
Petroleum Co. of Trinidad & Tobago Ltd. | |
9.750% due 08/14/2019 | | | | | 6,865 | | | | | | 7,517 | |
Sabine Pass Liquefaction LLC | |
5.625% due 02/01/2021 | | | | | 3,800 | | | | | | 3,857 | |
Telenet Finance Luxembourg S.C.A. | |
6.750% due 08/15/2024 | | EUR | | | 6,000 | | | | | | 7,341 | |
Wind Acquisition Finance S.A. | |
4.000% due 07/15/2020 | | | | | 28,200 | | | | | | 30,982 | |
| | | | | | | | | | | | |
| | | | | | | | | | | 118,363 | |
| | | | | | | | | | | | |
| | | | | | | | | | | | |
| UTILITIES 6.6% | |
BG Energy Capital PLC | |
6.500% due 11/30/2072 | | GBP | | | 2,000 | | | | | | 2,793 | |
6.500% due 11/30/2072 | | $ | | | 4,000 | | | | | | 4,180 | |
Gazprom OAO Via Gaz Capital S.A. | |
5.999% due 01/23/2021 | | | | | 200 | | | | | | 216 | |
6.212% due 11/22/2016 | | | | | 4,750 | | | | | | 4,838 | |
8.146% due 04/11/2018 | | | | | 15,500 | | | | | | 17,030 | |
Odebrecht Drilling Norbe Ltd. | |
6.350% due 06/30/2022 | | | | | 150 | | | | | | 44 | |
| | | | | | |
| See Accompanying Notes | | SEMIANNUAL REPORT | | JUNE 30, 2016 | | 63 |
Schedule of Investments PIMCO Fixed Income SHares: Series M (Cont.)
| | | | | | | | | | | | |
| | | | | PRINCIPAL
AMOUNT
(000S) | | | | | MARKET
VALUE
(000S) | |
Petrobras Global Finance BV | |
5.375% due 01/27/2021 | | $ | | | 3,800 | | | $ | | | 3,515 | |
6.250% due 03/17/2024 | | | | | 47,600 | | | | | | 42,469 | |
Petroleos Mexicanos | |
5.500% due 02/24/2025 | | EUR | | | 13,000 | | | | | | 15,904 | |
6.625% due 06/15/2035 | | $ | | | 9,200 | | | | | | 9,531 | |
| | | | | | | | | | | | |
| | | | | | | | | | | 100,520 | |
| | | | | | | | | | | | |
Total Corporate Bonds & Notes
(Cost $614,535) | | | | | | 595,234 | |
| | | | | | | | | | | | |
| | | | | | | | | | | | |
| MUNICIPAL BONDS & NOTES 25.6% | |
| | | | | | | | | | | | |
| CALIFORNIA 13.1% | |
Alameda County, California Joint Powers Authority Revenue Bonds, (BABs), Series 2010 | |
7.046% due 12/01/2044 | | | | | 11,000 | | | | | | 16,275 | |
Bay Area Toll Authority, California Revenue Bonds, (BABs), Series 2010 | |
6.918% due 04/01/2040 | | | | | 1,300 | | | | | | 1,897 | |
7.043% due 04/01/2050 | | | | | 14,000 | | | | | | 22,260 | |
California Infrastructure & Economic Development Bank Revenue Bonds, (BABs), Series 2010 | |
6.486% due 05/15/2049 | | | | | 15,000 | | | | | | 21,360 | |
California State General Obligation Bonds, (BABs), Series 2010 | |
7.700% due 11/01/2030 | | | | | 12,000 | | | | | | 14,561 | |
7.950% due 03/01/2036 | | | | | 21,850 | | | | | | 26,563 | |
Irvine Ranch Water District, California Special Assessment Bonds, (BABs), Series 2010 | |
6.622% due 05/01/2040 | | | | | 7,200 | | | | | | 10,213 | |
Los Angeles County, California Metropolitan Transportation Authority Revenue Bonds, (BABs), Series 2010 | |
4.530% due 06/01/2022 | | | | | 1,850 | | | | | | 2,131 | |
Los Angeles County, California Public Works Financing Authority Revenue Bonds, (BABs), Series 2010 | |
7.488% due 08/01/2033 | | | | | 1,800 | | | | | | 2,538 | |
7.618% due 08/01/2040 | | | | | 12,300 | | | | | | 19,382 | |
Los Angeles Department of Water & Power, California Revenue Bonds, (BABs), Series 2010 | |
6.166% due 07/01/2040 | | | | | 5,295 | | | | | | 6,130 | |
Los Angeles Unified School District, California General Obligation Bonds, Series 2010 | |
5.981% due 05/01/2027 | | | | | 6,500 | | | | | | 8,605 | |
Napa Valley Unified School District, California General Obligation Bonds, (BABs), Series 2010 | |
6.507% due 08/01/2043 | | | | | 204 | | | | | | 300 | |
Newport Beach, California Certificates of Participation Bonds, (BABs), Series 2010 | |
7.168% due 07/01/2040 | | | | | 3,500 | | | | | | 4,814 | |
| | | | | | | | | | | | |
| | | | | PRINCIPAL
AMOUNT
(000S) | | | | | MARKET
VALUE
(000S) | |
Palomar Community College District, California General Obligation Bonds, (BABs), Series 2010 | |
7.194% due 08/01/2045 | | $ | | | 3,500 | | | $ | | | 4,223 | |
Pasadena Public Financing Authority, California Revenue Bonds, (BABs), Series 2010 | |
7.148% due 03/01/2043 | | | | | 6,500 | | | | | | 9,532 | |
Regents of the University of California Medical Center Pooled Revenue Bonds, (BABs), Series 2010 | |
6.398% due 05/15/2031 | | | | | 5,100 | | | | | | 6,715 | |
Riverside Community College District Foundation, California General Obligation Bonds, (BABs), Series 2010 | |
6.971% due 08/01/2035 | | | | | 1,550 | | | | | | 1,807 | |
7.021% due 08/01/2040 | | | | | 3,250 | | | | | | 3,806 | |
San Diego County, California Regional Airport Authority Revenue Bonds, (BABs), Series 2010 | |
6.628% due 07/01/2040 | | | | | 2,300 | | | | | | 2,584 | |
San Diego Redevelopment Agency, California Tax Allocation Bonds, Series 2010 | |
7.750% due 09/01/2040 | | | | | 2,400 | | | | | | 2,744 | |
San Francisco, California Public Utilities Commission Water Revenue Bonds, (BABs), Series 2010 | |
5.500% due 11/01/2025 | | | | | 6,400 | | | | | | 7,819 | |
University of California Revenue Bonds, (BABs), Series 2010 | |
6.296% due 05/15/2050 | | | | | 3,350 | | | | | | 4,144 | |
| | | | | | | | | | | | |
| | | | | | | | | | | 200,403 | |
| | | | | | | | | | | | |
| | | | | | | | | | | | |
| ILLINOIS 1.1% | |
Chicago Transit Authority, Illinois Revenue Bonds, (BABs), Series 2010 | |
6.200% due 12/01/2040 | | | | | 10,100 | | | | | | 12,396 | |
Chicago, Illinois Waterworks Revenue Bonds, Series 2010 | |
6.642% due 11/01/2029 | | | | | 900 | | | | | | 1,101 | |
Illinois State Toll Highway Authority Revenue Bonds, (BABs), Series 2009 | |
6.184% due 01/01/2034 | | | | | 2,200 | | | | | | 3,048 | |
| | | | | | | | | | | | |
| | | | | | | | | | | 16,545 | |
| | | | | | | | | | | | |
| | | | | | | | | | | | |
| MASSACHUSETTS 0.1% | |
University of Massachusetts Building Authority Revenue Bonds, (BABs), Series 2009 | |
6.423% due 05/01/2029 | | | | | 750 | | | | | | 841 | |
| | | | | | | | | | | | |
| | | | | | | | | | | | |
| MICHIGAN 0.1% | |
Michigan State University Revenue Bonds, (BABs), Series 2010 | |
6.173% due 02/15/2050 | | | | | 1,250 | | | | | | 1,592 | |
| | | | | | | | | | | | |
| | | | | | |
| 64 | | PIMCO MANAGED ACCOUNTS TRUST | | | | See Accompanying Notes |
(Unaudited)
June 30, 2016
| | | | | | | | | | | | |
| | | | | PRINCIPAL
AMOUNT
(000S) | | | | | MARKET
VALUE
(000S) | |
| NEW JERSEY 0.1% | |
New Jersey Economic Development Authority Revenue Bonds, (BABs), Series 2010 | |
6.425% due 12/15/2035 | | $ | | | 1,335 | | | $ | | | 1,465 | |
| | | | | | | | | | | | |
| | | | | | | | | | | | |
| NEW YORK 5.7% | |
Metropolitan Transportation Authority, New York Revenue Bonds, (BABs), Series 2009 | |
5.871% due 11/15/2039 | | | | | 3,500 | | | | | | 4,786 | |
Metropolitan Transportation Authority, New York Revenue Bonds, (BABs), Series 2010 | |
6.814% due 11/15/2040 | | | | | 12,000 | | | | | | 17,505 | |
New York City, New York Transitional Finance Authority Future Tax Secured Revenue Bonds, (BABs), Series 2010 | |
4.325% due 11/01/2021 | | | | | 6,730 | | | | | | 7,636 | |
4.525% due 11/01/2022 | | | | | 14,400 | | | | | | 16,511 | |
5.932% due 11/01/2036 | | | | | 13,900 | | | | | | 15,970 | |
New York City, New York Transitional Finance Authority Future Tax Secured Revenue Bonds, Series 2010 | |
5.267% due 05/01/2027 | | | | | 5,000 | | | | | | 6,200 | |
New York City, New York Water & Sewer System Revenue Bonds, (BABs), Series 2010 | |
6.124% due 06/15/2042 | | | | | 3,000 | | | | | | 3,412 | |
New York State Dormitory Authority Revenue Bonds, (BABs), Series 2010 | |
5.500% due 03/15/2030 | | | | | 400 | | | | | | 516 | |
New York State Dormitory Authority Revenue Bonds, Series 2010 | |
5.051% due 09/15/2027 | | | | | 4,000 | | | | | | 4,965 | |
Port Authority of New York & New Jersey Revenue Bonds, Series 2009 | |
5.859% due 12/01/2024 | | | | | 2,500 | | | | | | 3,220 | |
Triborough Bridge & Tunnel Authority, New York Revenue Bonds, (BABs), Series 2010 | |
5.550% due 11/15/2040 | | | | | 5,200 | | | | | | 6,944 | |
| | | | | | | | | | | | |
| | | | | | | | | | | 87,665 | |
| | | | | | | | | | | | |
| | | | | | | | | | | | |
| OHIO 1.2% | |
American Municipal Power, Inc., Ohio Revenue Bonds, (BABs), Series 2010 | |
8.084% due 02/15/2050 | | | | | 10,100 | | | | | | 16,345 | |
American Municipal Power, Inc., Ohio Revenue Bonds, Series 2010 | |
7.734% due 02/15/2033 | | | | | 900 | | | | | | 1,325 | |
| | | | | | | | | | | | |
| | | | | | | | | | | 17,670 | |
| | | | | | | | | | | | |
| | | | | | | | | | | | |
| PENNSYLVANIA 0.7% | |
Pennsylvania Economic Development Financing Authority Revenue Bonds, (BABs), Series 2010 | |
6.532% due 06/15/2039 | | | | | 600 | | | | | | 737 | |
| | | | | | | | | | | | |
| | | | | PRINCIPAL
AMOUNT
(000S) | | | | | MARKET
VALUE
(000S) | |
State Public School Building Authority, Pennsylvania Revenue Bonds, Series 2011 | |
5.426% due 09/15/2026 | | $ | | | 8,500 | | | $ | | | 10,045 | |
| | | | | | | | | | | | |
| | | | | | | | | | | 10,782 | |
| | | | | | | | | | | | |
| | | | | | | | | | | | |
| TENNESSEE 0.0% | |
Metropolitan Government of Nashville & Davidson County, Tennessee Water & Sewer Revenue Bonds, (BABs), Series 2010 | |
6.568% due 07/01/2037 | | | | | 100 | | | | | | 140 | |
| | | | | | | | | | | | |
| | | | | | | | | | | | |
| VIRGINIA 1.1% | |
Tobacco Settlement Financing Corp., Virginia Revenue Bonds, Series 2007 | |
6.706% due 06/01/2046 | | | | | 19,105 | | | | | | 16,144 | |
| | | | | | | | | | | | |
| | | | | | | | | | | | |
| WASHINGTON 0.6% | |
Washington State Convention Center Public Facilities District Revenue Bonds, (BABs), Series 2010 | |
6.790% due 07/01/2040 | | | | | 6,800 | | | | | | 9,356 | |
| | | | | | | | | | | | |
| | | | | | | | | | | | |
| WEST VIRGINIA 1.8% | |
Tobacco Settlement Finance Authority, West Virginia Revenue Bonds, Series 2007 | |
7.467% due 06/01/2047 | | | | | 29,470 | | | | | | 28,096 | |
| | | | | | | | | | | | |
Total Municipal Bonds & Notes
(Cost $322,663) | | | | | | 390,699 | |
| | | | | | | | | | | | |
| | | | | | | | | | | | |
| U.S. GOVERNMENT AGENCIES 42.5% | |
Fannie Mae | |
0.653% due 10/27/2037 | | | | | 2,078 | | | | | | 2,073 | |
0.903% due 08/25/2021 | | | | | 8 | | | | | | 8 | |
2.282% due 10/01/2032 | | | | | 20 | | | | | | 21 | |
2.345% due 09/01/2027 | | | | | 47 | | | | | | 49 | |
2.350% due 11/01/2032 | | | | | 13 | | | | | | 14 | |
2.375% due 05/01/2028 | | | | | 55 | | | | | | 58 | |
2.465% due 09/01/2032 | | | | | 9 | | | | | | 9 | |
2.472% due 12/01/2034 | | | | | 83 | | | | | | 87 | |
2.476% due 01/01/2033 | | | | | 54 | | | | | | 57 | |
2.480% due 06/01/2020 | | | | | 7 | | | | | | 7 | |
2.500% due 05/01/2017 | | | | | 4 | | | | | | 4 | |
2.656% due 05/01/2033 | | | | | 100 | | | | | | 106 | |
2.675% due 10/01/2034 | | | | | 132 | | | | | | 132 | |
2.758% due 01/01/2018 | | | | | 4 | | | | | | 4 | |
2.775% due 05/01/2018 | | | | | 9 | | | | | | 9 | |
3.000% due 01/01/2046 | | | | | 389 | | | | | | 404 | |
3.508% due 03/25/2041 | | | | | 17 | | | | | | 18 | |
3.842% due 05/25/2042 | | | | | 15 | | | | | | 16 | |
4.000% due 11/25/2019 | | | | | 171 | | | | | | 175 | |
6.000% due 08/01/2022 - 12/01/2023 | | | | | 101 | | | | | | 110 | |
| | | | | | |
| See Accompanying Notes | | SEMIANNUAL REPORT | | JUNE 30, 2016 | | 65 |
Schedule of Investments PIMCO Fixed Income SHares: Series M (Cont.)
| | | | | | | | | | | | |
| | | | | PRINCIPAL
AMOUNT
(000S) | | | | | MARKET
VALUE
(000S) | |
6.500% due 01/01/2025 - 12/01/2028 | | $ | | | 49 | | | $ | | | 56 | |
7.000% due 11/01/2038 | | | | | 83 | | | | | | 96 | |
7.010% due 08/01/2022 | | | | | 36 | | | | | | 36 | |
11.000% due 07/15/2020 | | | | | 11 | | | | | | 11 | |
Fannie Mae, TBA | |
3.000% due 07/01/2046 - 08/01/2046 | | | | | 185,600 | | | | | | 192,343 | |
3.500% due 08/01/2031 - 08/01/2046 | | | | | 53,000 | | | | | | 55,891 | |
4.000% due 07/01/2046 - 08/01/2046 | | | | | 235,000 | | | | | | 251,828 | |
4.500% due 08/01/2046 | | | | | 129,000 | | | | | | 140,743 | |
Freddie Mac | |
0.892% due 08/15/2029 - 12/15/2031 | | | | | 49 | | | | | | 49 | |
0.942% due 09/15/2030 | | | | | 5 | | | | | | 5 | |
0.992% due 03/15/2032 | | | | | 7 | | | | | | 7 | |
1.092% due 03/15/2020 - 02/15/2024 | | | | | 230 | | | | | | 236 | |
1.592% due 09/15/2022 | | | | | 27 | | | | | | 27 | |
1.792% due 08/15/2023 | | | | | 7 | | | | | | 7 | |
2.165% due 08/01/2032 | | | | | 69 | | | | | | 69 | |
2.375% due 08/01/2029 | | | | | 14 | | | | | | 15 | |
2.500% due 10/01/2032 | | | | | 68 | | | | | | 72 | |
2.588% due 02/01/2029 | | | | | 78 | | | | | | 82 | |
2.625% due 01/01/2032 | | | | | 85 | | | | | | 87 | |
2.643% due 07/01/2032 | | | | | 7 | | | | | | 8 | |
2.693% due 02/01/2033 | | | | | 54 | | | | | | 57 | |
2.723% due 01/01/2033 | | | | | 3 | | | | | | 3 | |
2.750% due 10/01/2032 | | | | | 57 | | | | | | 59 | |
2.834% due 04/01/2032 | | | | | 58 | | | | | | 59 | |
2.926% due 08/01/2032 | | | | | 11 | | | | | | 12 | |
4.500% due 05/15/2018 | | | | | 4 | | | | | | 4 | |
6.000% due 08/15/2016 - 12/15/2028 | | | | | 327 | | | | | | 374 | |
6.500% due 08/15/2016 - 12/15/2023 | | | | | 6 | | | | | | 6 | |
7.000% due 04/01/2029 - 06/01/2030 | | | | | 19 | | | | | | 21 | |
7.500% due 08/15/2030 | | | | | 51 | | | | | | 60 | |
Ginnie Mae | |
0.798% due 06/20/2032 | | | | | 14 | | | | | | 14 | |
1.750% due 04/20/2022 - 06/20/2032 | | | | | 166 | | | | | | 172 | |
1.875% due 08/20/2017 - 07/20/2029 | | | | | 63 | | | | | | 64 | |
2.000% due 03/20/2017 - 03/20/2032 | | | | | 378 | | | | | | 392 | |
2.250% due 06/20/2022 | | | | | 25 | | | | | | 25 | |
2.500% due 05/20/2018 - 09/20/2021 | | | | | 9 | | | | | | 10 | |
3.000% due 04/20/2019 - 08/20/2025 | | | | | 54 | | | | | | 55 | |
6.500% due 05/15/2023 - 12/15/2023 | | | | | 1 | | | | | | 2 | |
| | | | | | | | | | | | |
| | | | | PRINCIPAL
AMOUNT
(000S) | | | | | MARKET
VALUE
(000S) | |
NCUA Guaranteed Notes | |
0.915% due 10/07/2020 | | $ | | | 2,169 | | | $ | | | 2,174 | |
Vendee Mortgage Trust | |
6.500% due 09/15/2024 | | | | | 529 | | | | | | 596 | |
| | | | | | | | | | | | |
Total U.S. Government Agencies
(Cost $646,868) | | | | | | 649,188 | |
| | | | | | | | | | | | |
| | | | | | | | | | | | |
| U.S. TREASURY OBLIGATIONS 36.6% | |
U.S. Treasury Bonds | |
2.500% due 02/15/2045 (g)(i)(k) | | | 176,750 | | | | | | 184,231 | |
2.750% due 08/15/2042 (g)(i) | | | 68,400 | | | | | | 75,444 | |
2.875% due 08/15/2045 (g) | | | | | 84,400 | | | | | | 94,802 | |
3.000% due 05/15/2042 (g)(i) | | | 58,900 | | | | | | 68,108 | |
4.375% due 05/15/2040 (g)(i)(k) | | | 17,950 | | | | | | 25,564 | |
6.125% due 11/15/2027 (i) | | | | | 9,500 | | | | | | 14,030 | |
6.250% due 05/15/2030 (g) | | | | | 15,400 | | | | | | 24,217 | |
U.S. Treasury Notes | |
2.000% due 02/15/2025 (i)(k) | | | 17,700 | | | | | | 18,527 | |
2.000% due 08/15/2025 (g)(i)(k) | | | 53,000 | | | | | | 55,443 | |
| | | | | | | | | | | | |
Total U.S. Treasury Obligations
(Cost $512,299) | | | | | | 560,366 | |
| | | | | | | | | | | | |
| | | | | | | | | | | | |
| NON-AGENCY MORTGAGE-BACKED SECURITIES 13.9% | |
Adjustable Rate Mortgage Trust | |
2.763% due 01/25/2036 ^ | | | | | 117 | | | | | | 103 | |
2.811% due 11/25/2035 ^ | | | | | 474 | | | | | | 427 | |
2.892% due 02/25/2036 | | | | | 241 | | | | | | 205 | |
2.929% due 11/25/2035 ^ | | | | | 279 | | | | | | 237 | |
American Home Mortgage Assets Trust | |
0.643% due 09/25/2046 ^ | | | | | 1,032 | | | | | | 708 | |
0.663% due 10/25/2046 | | | | | 812 | | | | | | 541 | |
1.357% due 11/25/2046 | | | | | 726 | | | | | | 344 | |
American Home Mortgage Investment Trust | |
1.033% due 02/25/2045 | | | | | 116 | | | | | | 114 | |
Banc of America Alternative Loan Trust | |
6.000% due 07/25/2046 ^ | | | | | 262 | | | | | | 228 | |
15.943% due 09/25/2035 ^ | | | | | 235 | | | | | | 289 | |
Banc of America Funding Ltd. | |
0.699% due 10/03/2039 | | | | | 895 | | | | | | 878 | |
Banc of America Funding Trust | |
0.638% due 10/20/2036 | | | | | 255 | | | | | | 206 | |
0.663% due 04/25/2037 ^ | | | | | 209 | | | | | | 138 | |
0.748% due 05/20/2047 | | | | | 128 | | | | | | 106 | |
0.853% due 05/25/2037 ^ | | | | | 178 | | | | | | 129 | |
2.854% due 02/20/2036 | | | | | 776 | | | | | | 762 | |
2.963% due 09/20/2047 ^ | | | | | 369 | | | | | | 274 | |
3.114% due 04/20/2035 ^ | | | | | 275 | | | | | | 201 | |
4.321% due 09/20/2046 ^ | | | | | 206 | | | | | | 167 | |
5.500% due 03/25/2036 ^ | | | | | 41 | | | | | | 39 | |
Banc of America Mortgage Trust | |
2.872% due 02/25/2033 | | | | | 1 | | | | | | 1 | |
2.966% due 07/25/2035 ^ | | | | | 58 | | | | | | 54 | |
| | | | | | |
| 66 | | PIMCO MANAGED ACCOUNTS TRUST | | | | See Accompanying Notes |
(Unaudited)
June 30, 2016
| | | | | | | | | | | | |
| | | | | PRINCIPAL
AMOUNT
(000S) | | | | | MARKET
VALUE
(000S) | |
5.500% due 09/25/2035 ^ | | $ | | | 831 | | | $ | | | 789 | |
5.500% due 05/25/2037 ^ | | | | | 250 | | | | | | 184 | |
BCAP LLC Trust | |
0.603% due 05/25/2047 ^ | | | | | 144 | | | | | | 108 | |
0.606% due 03/26/2037 | | | | | 62 | | | | | | 62 | |
0.638% due 07/26/2036 | | | | | 325 | | | | | | 308 | |
0.673% due 05/25/2047 ^ | | | | | 926 | | | | | | 699 | |
0.694% due 07/26/2035 | | | | | 7 | | | | | | 7 | |
0.698% due 05/26/2047 | | | | | 227 | | | | | | 220 | |
0.946% due 05/26/2035 | | | | | 101 | | | | | | 95 | |
0.966% due 11/26/2035 | | | | | 144 | | | | | | 141 | |
1.103% due 09/25/2047 | | | | | 226 | | | | | | 193 | |
1.186% due 01/26/2036 | | | | | 48 | | | | | | 48 | |
1.250% due 11/26/2046 | | | | | 319 | | | | | | 307 | |
1.904% due 10/26/2035 | | | | | 161 | | | | | | 160 | |
2.454% due 07/26/2036 | | | | | 600 | | | | | | 600 | |
2.761% due 01/26/2034 | | | | | 83 | | | | | | 82 | |
2.765% due 02/26/2035 | | | | | 153 | | | | | | 150 | |
2.897% due 06/26/2035 | | | | | 298 | | | | | | 296 | |
2.988% due 03/26/2037 | | | | | 279 | | | | | | 223 | |
3.157% due 07/26/2036 | | | | | 469 | | | | | | 422 | |
3.231% due 07/26/2036 | | | | | 70 | | | | | | 57 | |
3.375% due 07/26/2036 | | | | | 264 | | | | | | 263 | |
4.000% due 02/26/2037 | | | | | 255 | | | | | | 254 | |
4.528% due 03/27/2037 | | | | | 453 | | | | | | 309 | |
9.015% due 10/26/2036 | | | | | 410 | | | | | | 383 | |
BCRR Trust | |
5.988% due 08/17/2045 | | | | | 3,860 | | | | | | 3,912 | |
Bear Stearns Adjustable Rate Mortgage Trust | |
2.460% due 08/25/2035 | | | | | 4,232 | | | | | | 4,227 | |
2.660% due 10/25/2035 | | | | | 1,260 | | | | | | 1,218 | |
2.727% due 12/25/2046 ^ | | | | | 1,943 | | | | | | 1,688 | |
2.729% due 08/25/2035 | | | | | 127 | | | | | | 112 | |
2.870% due 02/25/2036 ^ | | | | | 233 | | | | | | 196 | |
2.871% due 11/25/2034 | | | | | 148 | | | | | | 141 | |
2.897% due 03/25/2035 | | | | | 105 | | | | | | 103 | |
2.915% due 01/25/2035 | | | | | 33 | | | | | | 30 | |
2.917% due 02/25/2034 | | | | | 124 | | | | | | 123 | |
2.924% due 03/25/2035 | | | | | 1,784 | | | | | | 1,801 | |
2.930% due 10/25/2035 | | | | | 216 | | | | | | 213 | |
2.937% due 01/25/2034 | | | | | 126 | | | | | | 125 | |
2.946% due 06/25/2035 ^ | | | | | 63 | | | | | | 56 | |
3.076% due 05/25/2034 | | | | | 66 | | | | | | 65 | |
3.143% due 05/25/2047 ^ | | | | | 498 | | | | | | 449 | |
Bear Stearns ALT-A Trust | |
0.893% due 04/25/2036 | | | | | 257 | | | | | | 205 | |
2.699% due 02/25/2036 ^ | | | | | 63 | | | | | | 50 | |
2.835% due 02/25/2036 ^ | | | | | 611 | | | | | | 429 | |
2.860% due 08/25/2036 ^ | | | | | 398 | | | | | | 254 | |
2.913% due 05/25/2035 | | | | | 107 | | | | | | 103 | |
2.940% due 06/25/2034 | | | | | 4,455 | | | | | | 4,218 | |
3.037% due 05/25/2036 ^ | | | | | 851 | | | | | | 591 | |
3.877% due 11/25/2036 ^ | | | | | 190 | | | | | | 145 | |
4.725% due 07/25/2035 ^ | | | | | 936 | | | | | | 751 | |
| | | | | | | | | | | | |
| | | | | PRINCIPAL
AMOUNT
(000S) | | | | | MARKET
VALUE
(000S) | |
Bear Stearns Mortgage Funding Trust | |
0.643% due 01/25/2037 | | $ | | | 166 | | | $ | | | 137 | |
Bear Stearns Mortgage Securities, Inc. | |
6.300% due 03/25/2031 | | | | | 8 | | | | | | 8 | |
Bear Stearns Structured Products, Inc. Trust | |
2.878% due 01/26/2036 | | | | | 1,464 | | | | | | 1,149 | |
Chase Mortgage Finance Trust | |
2.756% due 03/25/2037 ^ | | | | | 169 | | | | | | 155 | |
4.786% due 03/25/2037 ^ | | | | | 93 | | | | | | 87 | |
5.393% due 09/25/2036 ^ | | | | | 3,043 | | | | | | 2,697 | |
6.000% due 05/25/2037 | | | | | 193 | | | | | | 160 | |
ChaseFlex Trust | |
0.753% due 07/25/2037 | | | | | 338 | | | | | | 250 | |
4.400% due 08/25/2037 ^ | | | | | 64 | | | | | | 54 | |
5.000% due 07/25/2037 ^ | | | | | 193 | | | | | | 171 | |
Citigroup Commercial Mortgage Trust | |
5.322% due 12/17/2049 | | | | | 6,577 | | | | | | 6,617 | |
5.858% due 07/17/2040 | | | | | 10,123 | | | | | | 10,146 | |
Citigroup Mortgage Loan Trust, Inc. | |
2.469% due 09/25/2037 | | | | | 200 | | | | | | 193 | |
2.590% due 10/25/2046 | | | | | 392 | | | | | | 313 | |
2.730% due 10/25/2035 | | | | | 333 | | | | | | 329 | |
2.740% due 11/25/2035 | | | | | 239 | | | | | | 228 | |
2.822% due 08/25/2035 | | | | | 2,571 | | | | | | 2,518 | |
2.861% due 08/25/2035 | | | | | 70 | | | | | | 69 | |
2.988% due 03/25/2037 ^ | | | | | 191 | | | | | | 156 | |
3.003% due 12/25/2035 ^ | | | | | 190 | | | | | | 147 | |
3.028% due 09/25/2037 ^ | | | | | 1,140 | | | | | | 1,041 | |
5.500% due 12/25/2035 | | | | | 281 | | | | | | 213 | |
6.250% due 11/25/2037 | | | | | 167 | | | | | | 142 | |
Citigroup/Deutsche Bank Commercial Mortgage Trust | |
5.617% due 10/15/2048 | | | | | 269 | | | | | | 269 | |
CitiMortgage Alternative Loan Trust | |
6.500% due 06/25/2037 ^ | | | | | 253 | | | | | | 225 | |
Community Program Loan Trust | |
4.500% due 04/01/2029 | | | | | 281 | | | | | | 280 | |
Countrywide Alternative Loan Resecuritization Trust | |
2.893% due 03/25/2047 | | | | | 246 | | | | | | 230 | |
6.000% due 08/25/2037 ^ | | | | | 213 | | | | | | 158 | |
Countrywide Alternative Loan Trust | |
0.593% due 08/25/2037 | | | | | 1,257 | | | | | | 907 | |
0.613% due 12/25/2046 ^ | | | | | 198 | | | | | | 169 | |
0.623% due 11/25/2036 | | | | | 1,515 | | | | | | 1,193 | |
0.623% due 01/25/2037 ^ | | | | | 290 | | | | | | 240 | |
0.628% due 02/20/2047 ^ | | | | | 2,109 | | | | | | 1,333 | |
0.633% due 11/25/2036 | | | | | 193 | | | | | | 156 | |
0.633% due 05/25/2047 | | | | | 1,814 | | | | | | 1,453 | |
0.643% due 07/25/2046 ^ | | | | | 199 | | | | | | 189 | |
0.643% due 09/25/2046 ^ | | | | | 773 | | | | | | 589 | |
0.643% due 10/25/2046 | | | | | 202 | | | | | | 194 | |
0.658% due 07/20/2046 ^ | | | | | 78 | | | | | | 38 | |
0.673% due 05/25/2035 | | | | | 3,086 | | | | | | 2,547 | |
0.703% due 06/25/2035 | | | | | 207 | | | | | | 183 | |
| | | | | | |
| See Accompanying Notes | | SEMIANNUAL REPORT | | JUNE 30, 2016 | | 67 |
Schedule of Investments PIMCO Fixed Income SHares: Series M (Cont.)
| | | | | | | | | | | | |
| | | | | PRINCIPAL
AMOUNT
(000S) | | | | | MARKET
VALUE
(000S) | |
0.713% due 07/25/2035 | | $ | | | 220 | | | $ | | | 170 | |
0.723% due 05/25/2036 ^ | | | | | 18 | | | | | | 30 | |
0.763% due 08/25/2035 ^ | | | | | 325 | | | | | | 226 | |
0.763% due 10/25/2035 | | | | | 191 | | | | | | 145 | |
0.953% due 05/25/2035 ^ | | | | | 5,376 | | | | | | 4,343 | |
0.973% due 12/25/2035 | | | | | 1,759 | | | | | | 1,526 | |
1.233% due 09/25/2034 | | | | | 54 | | | | | | 53 | |
1.437% due 02/25/2036 | | | | | 753 | | | | | | 661 | |
2.736% due 05/25/2036 | | | | | 100 | | | | | | 67 | |
2.745% due 08/25/2035 | | | | | 375 | | | | | | 282 | |
2.764% due 11/25/2035 ^ | | | | | 178 | | | | | | 121 | |
4.333% due 06/25/2047 | | | | | 314 | | | | | | 244 | |
5.500% due 11/25/2035 | | | | | 185 | | | | | | 134 | |
5.500% due 02/25/2036 ^ | | | | | 132 | | | | | | 109 | |
5.750% due 03/25/2037 ^ | | | | | 238 | | | | | | 196 | |
5.750% due 04/25/2047 ^ | | | | | 217 | | | | | | 176 | |
6.000% due 12/25/2034 | | | | | 136 | | | | | | 135 | |
6.000% due 03/25/2036 ^ | | | | | 351 | | | | | | 264 | |
6.000% due 08/25/2036 ^ | | | | | 533 | | | | | | 467 | |
6.000% due 02/25/2037 ^ | | | | | 760 | | | | | | 510 | |
6.000% due 04/25/2037 | | | | | 143 | | | | | | 115 | |
6.000% due 05/25/2037 ^ | | | | | 652 | | | | | | 480 | |
6.000% due 08/25/2037 ^ | | | | | 706 | | | | | | 577 | |
6.250% due 11/25/2036 ^ | | | | | 157 | | | | | | 135 | |
6.500% due 12/25/2036 ^ | | | | | 109 | | | | | | 77 | |
6.500% due 08/25/2037 ^ | | | | | 523 | | | | | | 318 | |
18.553% due 07/25/2035 | | | | | 81 | | | | | | 110 | |
Countrywide Home Loan Mortgage Pass-Through Trust | |
0.683% due 05/25/2035 | | | | | 133 | | | | | | 110 | |
0.753% due 04/25/2046 ^ | | | | | 73 | | | | | | 52 | |
0.793% due 03/25/2036 | | | | | 702 | | | | | | 364 | |
0.993% due 02/25/2035 | | | | | 29 | | | | | | 27 | |
1.073% due 03/25/2035 | | | | | 541 | | | | | | 449 | |
1.093% due 03/25/2035 | | | | | 839 | | | | | | 689 | |
1.193% due 02/25/2035 | | | | | 615 | | | | | | 502 | |
1.233% due 02/25/2035 | | | | | 521 | | | | | | 389 | |
2.385% due 04/25/2035 ^ | | | | | 286 | | | | | | 51 | |
2.592% due 02/20/2036 ^ | | | | | 78 | | | | | | 68 | |
2.674% due 11/25/2034 | | | | | 171 | | | | | | 162 | |
2.710% due 02/20/2036 | | | | | 593 | | | | | | 425 | |
2.766% due 05/20/2036 | | | | | 114 | | | | | | 95 | |
2.784% due 08/25/2034 ^ | | | | | 121 | | | | | | 107 | |
2.801% due 01/25/2036 ^ | | | | | 221 | | | | | | 191 | |
2.880% due 05/20/2036 ^ | | | | | 269 | | | | | | 214 | |
2.884% due 11/25/2037 | | | | | 442 | | | | | | 365 | |
2.964% due 10/20/2035 | | | | | 146 | | | | | | 125 | |
5.500% due 07/25/2037 ^ | | | | | 619 | | | | | | 484 | |
5.750% due 12/25/2035 ^ | | | | | 203 | | | | | | 178 | |
6.000% due 02/25/2037 ^ | | | | | 693 | | | | | | 604 | |
6.000% due 03/25/2037 ^ | | | | | 231 | | | | | | 199 | |
6.000% due 07/25/2037 | | | | | 368 | | | | | | 277 | |
6.500% due 11/25/2036 ^ | | | | | 1,569 | | | | | | 1,306 | |
Countrywide Home Loan Reperforming REMIC Trust | |
6.000% due 03/25/2035 ^ | | | | | 153 | | | | | | 151 | |
| | | | | | | | | | | | |
| | | | | PRINCIPAL
AMOUNT
(000S) | | | | | MARKET
VALUE
(000S) | |
Credit Suisse Commercial Mortgage Trust | |
0.686% due 05/27/2037 | | $ | | | 100 | | | $ | | | 89 | |
Credit Suisse First Boston Mortgage Securities Corp. | |
1.054% due 03/25/2032 | | | | | 7 | | | | | | 7 | |
1.603% due 09/25/2034 ^ | | | | | 155 | | | | | | 133 | |
Credit Suisse Mortgage Capital Certificates | |
0.776% due 12/27/2035 | | | | | 240 | | | | | | 221 | |
2.675% due 04/26/2038 | | | | | 1,900 | | | | | | 1,864 | |
2.795% due 09/27/2036 | | | | | 125 | | | | | | 125 | |
3.090% due 04/28/2037 | | | | | 541 | | | | | | 396 | |
3.097% due 08/28/2036 | | | | | 132 | | | | | | 130 | |
Deutsche ALT-A Securities, Inc. | |
0.613% due 01/25/2047 | | | | | 157 | | | | | | 127 | |
0.643% due 08/25/2047 | | | | | 665 | | | | | | 555 | |
0.753% due 04/25/2037 | | | | | 576 | | | | | | 294 | |
Deutsche Mortgage & Asset Receiving Corp. | |
0.662% due 11/27/2036 | | | | | 500 | | | | | | 418 | |
Downey Savings & Loan Association Mortgage Loan Trust | |
0.768% due 07/19/2045 ^ | | | | | 56 | | | | | | 9 | |
First Horizon Alternative Mortgage Securities Trust | |
2.576% due 04/25/2036 ^ | | | | | 317 | | | | | | 271 | |
2.728% due 01/25/2036 ^ | | | | | 580 | | | | | | 457 | |
First Horizon Mortgage Pass-Through Trust | |
2.614% due 11/25/2037 ^ | | | | | 130 | | | | | | 115 | |
6.250% due 11/25/2036 | | | | | 844 | | | | | | 806 | |
GMAC Mortgage Corp. Loan Trust | |
3.299% due 11/19/2035 | | | | | 243 | | | | | | 224 | |
GreenPoint Mortgage Funding Trust | |
0.653% due 12/25/2046 ^ | | | | | 353 | | | | | | 229 | |
GSC Capital Corp. Mortgage Trust | |
0.633% due 05/25/2036 ^ | | | | | 258 | | | | | | 200 | |
GSR Mortgage Loan Trust | |
2.876% due 09/25/2035 | | | | | 574 | | | | | | 578 | |
2.908% due 09/25/2034 | | | | | 171 | | | | | | 164 | |
2.980% due 04/25/2035 | | | | | 110 | | | | | | 106 | |
3.024% due 11/25/2035 | | | | | 236 | | | | | | 213 | |
3.032% due 04/25/2035 | | | | | 82 | | | | | | 82 | |
HarborView Mortgage Loan Trust | |
0.638% due 01/19/2038 | | | | | 67 | | | | | | 56 | |
0.668% due 05/19/2035 | | | | | 4,524 | | | | | | 3,763 | |
0.698% due 01/19/2036 | | | | | 204 | | | | | | 139 | |
0.698% due 01/19/2038 ^ | | | | | 117 | | | | | | 42 | |
0.698% due 09/19/2046 ^ | | | | | 8 | | | | | | 0 | |
1.128% due 01/19/2035 | | | | | 77 | | | | | | 61 | |
1.485% due 07/19/2045 | | | | | 80 | | | | | | 74 | |
2.773% due 12/19/2035 ^ | | | | | 241 | | | | | | 191 | |
3.024% due 12/19/2035 ^ | | | | | 165 | | | | | | 145 | |
HomeBanc Mortgage Trust | |
0.633% due 12/25/2036 | | | | | 186 | | | | | | 164 | |
Impac Secured Assets Trust | |
0.603% due 11/25/2036 | | | | | 1,755 | | | | | | 1,351 | |
0.623% due 01/25/2037 | | | | | 362 | | | | | | 315 | |
| | | | | | |
| 68 | | PIMCO MANAGED ACCOUNTS TRUST | | | | See Accompanying Notes |
(Unaudited)
June 30, 2016
| | | | | | | | | | | | |
| | | | | PRINCIPAL
AMOUNT
(000S) | | | | | MARKET
VALUE
(000S) | |
IndyMac Mortgage Loan Trust | |
0.633% due 07/25/2047 | | $ | | | 581 | | | $ | | | 392 | |
0.643% due 09/25/2046 | | | | | 206 | | | | | | 170 | |
0.733% due 03/25/2035 | | | | | 469 | | | | | | 404 | |
0.753% due 11/25/2035 ^ | | | | | 307 | | | | | | 179 | |
2.619% due 06/25/2037 ^ | | | | | 170 | | | | | | 129 | |
2.763% due 08/25/2035 | | | | | 1,594 | | | | | | 1,319 | |
2.803% due 09/25/2035 ^ | | | | | 161 | | | | | | 136 | |
2.926% due 06/25/2036 | | | | | 2,427 | | | | | | 2,259 | |
2.927% due 11/25/2035 ^ | | | | | 239 | | | | | | 198 | |
3.034% due 10/25/2035 | | | | | 1,364 | | | | | | 1,124 | |
3.071% due 06/25/2035 ^ | | | | | 143 | | | | | | 124 | |
4.113% due 08/25/2036 | | | | | 4,008 | | | | | | 3,796 | |
JPMorgan Alternative Loan Trust | |
0.950% due 06/27/2037 | | | | | 6,353 | | | | | | 4,826 | |
3.171% due 12/25/2036 | | | | | 73 | | | | | | 69 | |
JPMorgan Chase Commercial Mortgage Securities Trust | |
5.440% due 06/12/2047 | | | | | 1,196 | | | | | | 1,214 | |
JPMorgan Mortgage Trust | |
2.582% due 11/25/2035 | | | | | 146 | | | | | | 136 | |
2.747% due 11/25/2035 | | | | | 144 | | | | | | 136 | |
2.774% due 04/25/2035 | | | | | 65 | | | | | | 64 | |
2.776% due 01/25/2037 ^ | | | | | 43 | | | | | | 39 | |
2.827% due 07/25/2035 | | | | | 849 | | | | | | 849 | |
2.928% due 07/25/2035 | | | | | 661 | | | | | | 657 | |
2.944% due 04/25/2035 | | | | | 74 | | | | | | 74 | |
3.072% due 09/25/2034 | | | | | 402 | | | | | | 398 | |
4.614% due 06/25/2037 ^ | | | | | 324 | | | | | | 291 | |
6.000% due 01/25/2036 ^ | | | | | 204 | | | | | | 164 | |
JPMorgan Resecuritization Trust | |
2.601% due 05/27/2037 | | | | | 6,693 | | | | | | 6,491 | |
2.858% due 08/27/2037 | | | | | 72 | | | | | | 72 | |
Lavender Trust | |
6.250% due 10/26/2036 | | | | | 335 | | | | | | 260 | |
Lehman Mortgage Trust | |
5.403% due 01/25/2036 ^ | | | | | 312 | | | | | | 290 | |
5.570% due 12/25/2035 | | | | | 355 | | | | | | 256 | |
6.000% due 07/25/2036 ^ | | | | | 129 | | | | | | 95 | |
Lehman XS Trust | |
0.603% due 07/25/2047 ^ | | | | | 37 | | | | | | 36 | |
0.653% due 08/25/2046 ^ | | | | | 123 | | | | | | 94 | |
0.683% due 04/25/2046 ^ | | | | | 102 | | | | | | 79 | |
0.693% due 11/25/2046 ^ | | | | | 85 | | | | | | 22 | |
Luminent Mortgage Trust | |
0.616% due 12/25/2036 | | | | | 1,128 | | | | | | 901 | |
0.653% due 10/25/2046 | | | | | 360 | | | | | | 307 | |
MASTR Adjustable Rate Mortgages Trust | |
0.693% due 05/25/2037 | | | | | 182 | | | | | | 113 | |
MASTR Reperforming Loan Trust | |
7.000% due 05/25/2035 | | | | | 1,473 | | | | | | 1,467 | |
8.000% due 07/25/2035 | | | | | 1,284 | | | | | | 1,347 | |
| | | | | | | | | | | | |
| | | | | PRINCIPAL
AMOUNT
(000S) | | | | | MARKET
VALUE
(000S) | |
Mellon Residential Funding Corp. Mortgage Pass-Through Trust | |
2.610% due 10/20/2029 | | $ | | | 68 | | | $ | | | 68 | |
Merrill Lynch Alternative Note Asset Trust | |
0.633% due 04/25/2037 | | | | | 853 | | | | | | 797 | |
0.753% due 03/25/2037 | | | | | 1,163 | | | | | | 521 | |
6.000% due 05/25/2037 ^ | | | | | 266 | | | | | | 227 | |
Merrill Lynch Mortgage Investors Trust | |
0.913% due 04/25/2029 | | | | | 94 | | | | | | 88 | |
1.113% due 09/25/2029 | | | | | 88 | | | | | | 88 | |
1.113% due 11/25/2029 | | | | | 102 | | | | | | 98 | |
1.929% due 07/25/2029 | | | | | 97 | | | | | | 93 | |
2.228% due 10/25/2035 | | | | | 455 | | | | | | 442 | |
2.423% due 02/25/2036 | | | | | 76 | | | | | | 75 | |
2.790% due 11/25/2035 | | | | | 187 | | | | | | 182 | |
Morgan Stanley Dean Witter Capital, Inc. Trust | |
2.030% due 03/25/2033 | | | | | 122 | | | | | | 111 | |
Morgan Stanley Mortgage Loan Trust | |
0.733% due 11/25/2035 | | | | | 122 | | | | | | 118 | |
0.773% due 01/25/2035 | | | | | 75 | | | | | | 70 | |
2.527% due 06/25/2036 | | | | | 235 | | | | | | 229 | |
6.000% due 10/25/2037 ^ | | | | | 118 | | | | | | 96 | |
Morgan Stanley Re-REMIC Trust | |
0.852% due 02/26/2037 | | | | | 364 | | | | | | 249 | |
0.871% due 03/26/2037 | | | | | 198 | | | | | | 136 | |
5.500% due 08/26/2047 | | | | | 55 | | | | | | 55 | |
Morgan Stanley Resecuritization Trust | |
0.756% due 01/26/2051 | | | | | 467 | | | | | | 445 | |
NAAC Reperforming Loan REMIC Trust | |
7.500% due 03/25/2034 ^ | | | | | 677 | | | | | | 628 | |
Nomura Asset Acceptance Corp. Alternative Loan Trust | |
2.962% due 02/25/2036 ^ | | | | | 1,126 | | | | | | 928 | |
RBSSP Resecuritization Trust | |
0.696% due 02/26/2037 | | | | | 2,095 | | | | | | 1,972 | |
0.766% due 03/26/2037 | | | | | 4,390 | | | | | | 4,308 | |
2.365% due 10/26/2035 | | | | | 7,482 | | | | | | 7,552 | |
Residential Accredit Loans, Inc. Trust | |
0.623% due 12/25/2036 | | | | | 618 | | | | | | 479 | |
0.653% due 05/25/2047 | | | | | 226 | | | | | | 177 | |
0.663% due 06/25/2037 | | | | | 198 | | | | | | 145 | |
0.703% due 08/25/2037 | | | | | 624 | | | | | | 489 | |
0.753% due 01/25/2035 | | | | | 143 | | | | | | 137 | |
0.753% due 08/25/2035 | | | | | 253 | | | | | | 198 | |
0.853% due 10/25/2045 | | | | | 205 | | | | | | 146 | |
3.300% due 02/25/2035 ^ | | | | | 552 | | | | | | 445 | |
4.363% due 02/25/2036 ^ | | | | | 184 | | | | | | 147 | |
8.000% due 04/25/2036 ^ | | | | | 247 | | | | | | 241 | |
Residential Asset Securitization Trust | |
6.000% due 06/25/2036 | | | | | 262 | | | | | | 178 | |
6.000% due 11/25/2036 ^ | | | | | 168 | | | | | | 110 | |
6.000% due 03/25/2037 ^ | | | | | 162 | | | | | | 109 | |
6.250% due 11/25/2036 | | | | | 115 | | | | | | 77 | |
6.500% due 04/25/2037 ^ | | | | | 1,400 | | | | | | 833 | |
| | | | | | |
| See Accompanying Notes | | SEMIANNUAL REPORT | | JUNE 30, 2016 | | 69 |
Schedule of Investments PIMCO Fixed Income SHares: Series M (Cont.)
| | | | | | | | | | | | |
| | | | | PRINCIPAL
AMOUNT
(000S) | | | | | MARKET
VALUE
(000S) | |
Residential Funding Mortgage Securities, Inc. Trust | |
3.854% due 03/25/2035 ^ | | $ | | | 1,657 | | | $ | | | 1,353 | |
6.000% due 09/25/2036 ^ | | | | | 400 | | | | | | 364 | |
Structured Adjustable Rate Mortgage Loan Trust | |
0.773% due 10/25/2035 | | | | | 2,361 | | | | | | 1,947 | |
1.188% due 06/25/2034 | | | | | 712 | | | | | | 664 | |
1.855% due 05/25/2035 ^ | | | | | 780 | | | | | | 549 | |
2.752% due 02/25/2036 ^ | | | | | 483 | | | | | | 388 | |
2.859% due 09/25/2036 ^ | | | | | 5,898 | | | | | | 3,891 | |
2.872% due 10/25/2036 ^ | | | | | 258 | | | | | | 190 | |
2.874% due 10/25/2034 | | | | | 99 | | | | | | 100 | |
3.023% due 06/25/2036 ^ | | | | | 90 | | | | | | 78 | |
3.100% due 12/25/2035 ^ | | | | | 74 | | | | | | 73 | |
3.640% due 07/25/2037 ^ | | | | | 9 | | | | | | 8 | |
Structured Asset Mortgage Investments Trust | |
0.583% due 03/25/2037 | | | | | 284 | | | | | | 214 | |
0.633% due 09/25/2047 | | | | | 126 | | | | | | 104 | |
0.643% due 06/25/2036 | | | | | 13,918 | | | | | | 11,569 | |
0.643% due 07/25/2046 ^ | | | | | 888 | | | | | | 701 | |
0.643% due 09/25/2047 | | | | | 1,369 | | | | | | 1,083 | |
0.653% due 05/25/2036 | | | | | 1,347 | | | | | | 1,000 | |
0.663% due 09/25/2047 ^ | | | | | 2,415 | | | | | | 1,809 | |
0.673% due 05/25/2046 | | | | | 1,231 | | | | | | 661 | |
0.713% due 05/25/2046 ^ | | | | | 57 | | | | | | 21 | |
1.148% due 03/19/2034 | | | | | 601 | | | | | | 570 | |
1.148% due 02/19/2035 | | | | | 259 | | | | | | 248 | |
1.188% due 12/19/2033 | | | | | 630 | | | | | | 606 | |
1.765% due 02/25/2036 ^ | | | | | 958 | | | | | | 875 | |
Structured Asset Securities Corp. Mortgage Pass-Through Certificates | |
2.688% due 02/25/2032 | | | | | 2 | | | | | | 2 | |
2.694% due 01/25/2032 | | | | | 4 | | | | | | 4 | |
2.708% due 02/25/2034 | | | | | 138 | | | | | | 133 | |
2.993% due 08/25/2032 | | | | | 83 | | | | | | 82 | |
Structured Asset Securities Corp. Trust | |
0.803% due 02/25/2035 | | | | | 57 | | | | | | 54 | |
Suntrust Adjustable Rate Mortgage Loan Trust | |
6.020% due 02/25/2037 ^ | | | | | 672 | | | | | | 570 | |
Thornburg Mortgage Securities Trust | |
1.093% due 09/25/2043 | | | | | 494 | | | | | | 478 | |
1.193% due 09/25/2044 | | | | | 75 | | | | | | 68 | |
2.469% due 09/25/2037 | | | | | 168 | | | | | | 165 | |
Wachovia Mortgage Loan Trust LLC | |
2.767% due 10/20/2035 | | | | | 124 | | | | | | 117 | |
WaMu Mortgage Pass-Through Certificates Trust | |
0.723% due 12/25/2045 | | | | | 14 | | | | | | 13 | |
0.843% due 10/25/2044 | | | | | 1,775 | | | | | | 1,712 | |
0.863% due 11/25/2045 | | | | | 360 | | | | | | 317 | |
1.093% due 01/25/2045 | | | | | 408 | | | | | | 383 | |
1.187% due 06/25/2047 ^ | | | | | 192 | | | | | | 65 | |
1.193% due 11/25/2034 | | | | | 356 | | | | | | 319 | |
1.220% due 07/25/2047 | | | | | 1,057 | | | | | | 848 | |
1.433% due 11/25/2034 | | | | | 981 | | | | | | 860 | |
1.637% due 11/25/2042 | | | | | 40 | | | | | | 37 | |
| | | | | | | | | | | | |
| | | | | PRINCIPAL
AMOUNT
(000S) | | | | | MARKET
VALUE
(000S) | |
2.178% due 11/25/2046 | | $ | | | 377 | | | $ | | | 336 | |
2.352% due 08/25/2036 ^ | | | | | 205 | | | | | | 188 | |
2.490% due 08/25/2033 | | | | | 600 | | | | | | 607 | |
2.506% due 12/25/2036 ^ | | | | | 2,308 | | | | | | 2,010 | |
3.717% due 12/25/2036 ^ | | | | | 243 | | | | | | 213 | |
Washington Mutual Mortgage Pass-Through Certificates Trust | |
0.903% due 05/25/2035 ^ | | | | | 681 | | | | | | 506 | |
1.137% due 04/25/2047 | | | | | 634 | | | | | | 456 | |
1.207% due 04/25/2047 | | | | | 927 | | | | | | 656 | |
4.476% due 09/25/2036 ^ | | | | | 197 | | | | | | 112 | |
Wells Fargo Alternative Loan Trust | |
3.083% due 07/25/2037 ^ | | | | | 127 | | | | | | 108 | |
Wells Fargo Mortgage-Backed Securities Trust | |
0.953% due 07/25/2037 ^ | | | | | 210 | | | | | | 183 | |
2.737% due 10/25/2036 ^ | | | | | 132 | | | | | | 126 | |
2.751% due 10/25/2036 ^ | | | | | 1,209 | | | | | | 1,127 | |
2.777% due 06/25/2035 | | | | | 4,110 | | | | | | 4,070 | |
2.781% due 08/25/2034 | | | | | 239 | | | | | | 240 | |
2.851% due 01/25/2035 | | | | | 724 | | | | | | 723 | |
2.855% due 03/25/2036 | | | | | 1,411 | | | | | | 1,386 | |
2.865% due 03/25/2035 | | | | | 2,300 | | | | | | 2,300 | |
2.989% due 07/25/2036 ^ | | | | | 2,700 | | | | | | 2,592 | |
3.031% due 03/25/2036 ^ | | | | | 202 | | | | | | 199 | |
3.057% due 05/25/2035 | | | | | 56 | | | | | | 56 | |
6.000% due 06/25/2037 ^ | | | | | 253 | | | | | | 252 | |
| | | | | | | | | | | | |
Total Non-Agency Mortgage-Backed Securities
(Cost $211,190) | | | 212,621 | |
| | | | | | | | | | | | |
| | | | | | | | | | | | |
| ASSET-BACKED SECURITIES 11.9% | |
Aames Mortgage Investment Trust | |
1.233% due 10/25/2035 | | | | | 200 | | | | | | 165 | |
1.653% due 06/25/2035 | | | | | 700 | | | | | | 607 | |
Accredited Mortgage Loan Trust | |
0.583% due 02/25/2037 | | | | | 2,505 | | | | | | 2,411 | |
0.713% due 09/25/2036 | | | | | 1,100 | | | | | | 947 | |
0.930% due 09/25/2035 | | | | | 200 | | | | | | 170 | |
ACE Securities Corp. Home Equity Loan Trust | |
0.563% due 12/25/2036 | | | | | 380 | | | | | | 151 | |
0.593% due 07/25/2036 | | | | | 396 | | | | | | 280 | |
0.608% due 08/25/2036 | | | | | 918 | | | | | | 777 | |
0.613% due 05/25/2036 | | | | | 85 | | | | | | 79 | |
0.753% due 02/25/2036 | | | | | 194 | | | | | | 175 | |
0.923% due 10/25/2035 | | | | | 1,800 | | | | | | 1,571 | |
1.073% due 02/25/2036 ^ | | | | | 190 | | | | | | 159 | |
1.113% due 11/25/2035 | | | | | 200 | | | | | | 172 | |
1.353% due 12/25/2034 | | | | | 190 | | | | | | 172 | |
1.428% due 06/25/2034 | | | | | 193 | | | | | | 178 | |
1.428% due 07/25/2035 | | | | | 100 | | | | | | 85 | |
Aegis Asset-Backed Securities Trust | |
0.883% due 12/25/2035 | | | | | 200 | | | | | | 141 | |
0.933% due 06/25/2035 | | | | | 200 | | | | | | 146 | |
1.153% due 03/25/2035 | | | | | 300 | | | | | | 251 | |
1.453% due 03/25/2035 ^ | | | | | 169 | | | | | | 156 | |
| | | | | | |
| 70 | | PIMCO MANAGED ACCOUNTS TRUST | | | | See Accompanying Notes |
(Unaudited)
June 30, 2016
| | | | | | | | | | | | |
| | | | | PRINCIPAL
AMOUNT
(000S) | | | | | MARKET
VALUE
(000S) | |
Ameriquest Mortgage Securities Trust | |
0.843% due 03/25/2036 | | $ | | | 400 | | | $ | | | 355 | |
Ameriquest Mortgage Securities, Inc. Asset-Backed Pass-Through Certificates | |
0.903% due 07/25/2035 | | | | | 800 | | | | | | 735 | |
0.903% due 01/25/2036 | | | | | 300 | | | | | | 283 | |
0.923% due 11/25/2035 | | | | | 200 | | | | | | 168 | |
0.973% due 09/25/2035 | | | | | 10,000 | | | | | | 8,414 | |
1.053% due 08/25/2035 | | | | | 591 | | | | | | 587 | |
1.058% due 11/25/2034 | | | | | 23 | | | | | | 23 | |
1.563% due 03/25/2035 | | | | | 200 | | | | | | 159 | |
Amortizing Residential Collateral Trust | |
1.033% due 07/25/2032 | | | | | 73 | | | | | | 68 | |
1.453% due 10/25/2034 | | | | | 287 | | | | | | 277 | |
Argent Securities Trust | |
0.603% due 09/25/2036 | | | | | 997 | | | | | | 377 | |
0.643% due 03/25/2036 | | | | | 393 | | | | | | 199 | |
Argent Securities, Inc. Asset-Backed Pass-Through Certificates | |
0.683% due 01/25/2036 | | | | | 131 | | | | | | 97 | |
Asset-Backed Funding Certificates Trust | |
0.563% due 01/25/2037 | | | | | 591 | | | | | | 356 | |
0.613% due 01/25/2037 | | | | | 373 | | | | | | 226 | |
0.673% due 01/25/2037 | | | | | 224 | | | | | | 137 | |
1.073% due 04/25/2034 | | | | | 619 | | | | | | 612 | |
1.128% due 06/25/2035 | | | | | 396 | | | | | | 386 | |
1.453% due 06/25/2037 | | | | | 294 | | | | | | 217 | |
Asset-Backed Securities Corp. Home Equity Loan Trust | |
0.903% due 11/25/2035 | | | | | 300 | | | | | | 274 | |
1.353% due 06/25/2035 | | | | | 200 | | | | | | 172 | |
1.653% due 06/25/2034 | | | | | 200 | | | | | | 170 | |
3.442% due 08/15/2033 | | | | | 46 | | | | | | 42 | |
Basic Asset-Backed Securities Trust | |
0.763% due 04/25/2036 | | | | | 200 | | | | | | 182 | |
Bayview Financial Asset Trust | |
0.853% due 12/25/2039 | | | | | 339 | | | | | | 333 | |
Bear Stearns Asset-Backed Securities Trust | |
0.563% due 04/25/2031 | | | | | 151 | | | | | | 154 | |
0.603% due 06/25/2036 | | | | | 297 | | | | | | 285 | |
0.623% due 05/25/2036 ^ | | | | | 319 | | | | | | 309 | |
0.633% due 06/25/2047 | | | | | 110 | | | | | | 107 | |
0.643% due 05/25/2037 | | | | | 296 | | | | | | 284 | |
0.653% due 12/25/2036 | | | | | 469 | | | | | | 446 | |
0.723% due 06/25/2036 | | | | | 200 | | | | | | 175 | |
0.853% due 09/25/2046 | | | | | 299 | | | | | | 253 | |
0.883% due 12/25/2035 | | | | | 500 | | | | | | 462 | |
0.903% due 08/25/2036 | | | | | 400 | | | | | | 349 | |
0.953% due 12/25/2035 | | | | | 300 | | | | | | 277 | |
1.003% due 06/25/2036 | | | | | 300 | | | | | | 264 | |
1.153% due 11/25/2035 ^ | | | | | 239 | | | | | | 205 | |
1.413% due 04/25/2035 | | | | | 140 | | | | | | 131 | |
1.633% due 06/25/2043 | | | | | 1,772 | | | | | | 1,697 | |
1.703% due 08/25/2037 | | | | | 189 | | | | | | 174 | |
| | | | | | | | | | | | |
| | | | | PRINCIPAL
AMOUNT
(000S) | | | | | MARKET
VALUE
(000S) | |
2.115% due 10/25/2036 | | $ | | | 77 | | | $ | | | 54 | |
22.003% due 03/25/2036 ^ | | | | | 232 | | | | | | 295 | |
Carrington Mortgage Loan Trust | |
0.673% due 01/25/2037 | | | | | 1,200 | | | | | | 708 | |
0.713% due 02/25/2037 | | | | | 1,400 | | | | | | 1,000 | |
1.503% due 05/25/2035 | | | | | 300 | | | | | | 228 | |
Cendant Mortgage Corp. | |
6.000% due 07/25/2043 | | | | | 28 | | | | | | 28 | |
Citigroup Mortgage Loan Trust Asset-Backed Pass-Through Certificates | |
1.383% due 05/25/2035 | | | | | 200 | | | | | | 160 | |
Citigroup Mortgage Loan Trust, Inc. | |
0.593% due 12/25/2036 | | | | | 1,152 | | | | | | 1,051 | |
0.593% due 05/25/2037 | | | | | 41 | | | | | | 41 | |
0.623% due 05/25/2037 | | | | | 800 | | | | | | 740 | |
0.713% due 01/25/2037 | | | | | 300 | | | | | | 241 | |
0.846% due 11/25/2046 | | | | | 397 | | | | | | 341 | |
0.863% due 10/25/2035 | | | | | 1,700 | | | | | | 1,583 | |
0.889% due 11/25/2045 | | | | | 300 | | | | | | 276 | |
1.073% due 12/25/2035 | | | | | 752 | | | | | | 714 | |
1.143% due 09/25/2035 | | | | | 185 | | | | | | 185 | |
1.173% due 09/25/2035 ^ | | | | | 300 | | | | | | 286 | |
1.188% due 09/25/2035 ^ | | | | | 500 | | | | | | 415 | |
6.351% due 05/25/2036 ^ | | | | | 223 | | | | | | 139 | |
Conseco Financial Corp. | |
6.810% due 12/01/2028 | | | | | 956 | | | | | | 1,013 | |
6.870% due 04/01/2030 | | | | | 403 | | | | | | 435 | |
7.060% due 02/01/2031 | | | | | 861 | | | | | | 887 | |
7.550% due 01/15/2029 | | | | | 29 | | | | | | 30 | |
Countrywide Asset-Backed Certificates | |
0.593% due 02/25/2037 | | | | | 55 | | | | | | 53 | |
0.593% due 07/25/2037 ^ | | | | | 5,989 | | | | | | 4,986 | |
0.603% due 07/25/2036 | | | | | 540 | | | | | | 520 | |
0.603% due 01/25/2037 | | | | | 115 | | | | | | 109 | |
0.603% due 05/25/2037 | | | | | 854 | | | | | | 780 | |
0.613% due 01/25/2034 | | | | | 126 | | | | | | 116 | |
0.613% due 05/25/2036 | | | | | 928 | | | | | | 629 | |
0.613% due 03/25/2037 | | | | | 258 | | | | | | 236 | |
0.623% due 03/25/2037 | | | | | 427 | | | | | | 352 | |
0.623% due 05/25/2037 | | | | | 359 | | | | | | 331 | |
0.623% due 06/25/2047 | | | | | 448 | | | | | | 418 | |
0.633% due 06/25/2047 | | | | | 699 | | | | | | 629 | |
0.643% due 06/25/2047 | | | | | 371 | | | | | | 336 | |
0.673% due 09/25/2037 ^ | | | | | 317 | | | | | | 247 | |
0.673% due 09/25/2047 | | | | | 2,674 | | | | | | 2,118 | |
0.683% due 10/25/2047 | | | | | 633 | | | | | | 546 | |
0.693% due 12/25/2031 ^ | | | | | 671 | | | | | | 491 | |
0.703% due 01/25/2046 | | | | | 193 | | | | | | 121 | |
0.703% due 06/25/2047 | | | | | 243 | | | | | | 161 | |
0.753% due 07/25/2036 | | | | | 349 | | | | | | 311 | |
0.803% due 04/25/2036 | | | | | 100 | | | | | | 94 | |
0.853% due 06/25/2036 | | | | | 300 | | | | | | 221 | |
0.903% due 03/25/2036 | | | | | 100 | | | | | | 75 | |
0.903% due 03/25/2047 ^ | | | | | 161 | | | | | | 81 | |
0.943% due 02/25/2036 | | | | | 200 | | | | | | 166 | |
| | | | | | |
| See Accompanying Notes | | SEMIANNUAL REPORT | | JUNE 30, 2016 | | 71 |
Schedule of Investments PIMCO Fixed Income SHares: Series M (Cont.)
| | | | | | | | | | | | |
| | | | | PRINCIPAL
AMOUNT
(000S) | | | | | MARKET
VALUE
(000S) | |
0.973% due 12/25/2035 | | $ | | | 120 | | | $ | | | 118 | |
1.113% due 12/25/2035 | | | | | 300 | | | | | | 268 | |
1.223% due 11/25/2035 | | | | | 87 | | | | | | 83 | |
1.428% due 02/25/2034 | | | | | 97 | | | | | | 90 | |
1.503% due 08/25/2035 | | | | | 100 | | | | | | 90 | |
1.953% due 02/25/2035 | | | | | 300 | | | | | | 269 | |
5.329% due 04/25/2047 ^ | | | | | 38 | | | | | | 37 | |
Countrywide Asset-Backed Certificates Trust | |
0.603% due 03/25/2047 | | | | | 268 | | | | | | 231 | |
0.913% due 05/25/2036 | | | | | 600 | | | | | | 517 | |
0.983% due 02/25/2036 | | | | | 200 | | | | | | 174 | |
1.073% due 08/25/2035 | | | | | 200 | | | | | | 193 | |
1.173% due 07/25/2034 | | | | | 241 | | | | | | 227 | |
1.183% due 07/25/2035 | | | | | 400 | | | | | | 346 | |
1.253% due 08/25/2047 | | | | | 1,126 | | | | | | 960 | |
1.353% due 10/25/2034 | | | | | 122 | | | | | | 115 | |
1.796% due 04/25/2035 | | | | | 200 | | | | | | 173 | |
Credit-Based Asset Servicing and Securitization LLC | |
0.566% due 07/25/2037 | | | | | 18 | | | | | | 11 | |
0.673% due 07/25/2037 | | | | | 376 | | | | | | 230 | |
1.023% due 07/25/2036 | | | | | 300 | | | | | | 281 | |
1.398% due 04/25/2036 | | | | | 80 | | | | | | 68 | |
3.873% due 07/25/2035 ^ | | | | | 39 | | | | | | 39 | |
Delta Funding Home Equity Loan Trust | |
1.082% due 08/15/2030 | | | | | 72 | | | | | | 63 | |
EMC Mortgage Loan Trust | |
1.186% due 05/25/2040 | | | | | 14 | | | | | | 13 | |
First Franklin Mortgage Loan Trust | |
0.593% due 12/25/2036 | | | | | 375 | | | | | | 224 | |
0.603% due 07/25/2036 | | | | | 124 | | | | | | 118 | |
0.613% due 04/25/2036 | | | | | 349 | | | | | | 305 | |
0.693% due 04/25/2036 | | | | | 400 | | | | | | 256 | |
0.693% due 08/25/2036 | | | | | 395 | | | | | | 279 | |
0.813% due 10/25/2035 | | | | | 204 | | | | | | 192 | |
0.813% due 11/25/2035 | | | | | 200 | | | | | | 147 | |
0.943% due 09/25/2035 | | | | | 212 | | | | | | 208 | |
0.963% due 09/25/2035 | | | | | 174 | | | | | | 174 | |
1.128% due 06/25/2036 | | | | | 297 | | | | | | 287 | |
1.263% due 04/25/2035 | | | | | 780 | | | | | | 743 | |
1.323% due 09/25/2034 | | | | | 501 | | | | | | 473 | |
1.398% due 03/25/2035 | | | | | 100 | | | | | | 84 | |
1.653% due 01/25/2035 | | | | | 122 | | | | | | 102 | |
1.878% due 10/25/2034 | | | | | 948 | | | | | | 805 | |
First NLC Trust | |
0.523% due 08/25/2037 | | | | | 71 | | | | | | 38 | |
0.913% due 05/25/2035 | | | | | 1,155 | | | | | | 977 | |
First Plus Home Loan Owners Trust | |
7.320% due 11/10/2023 ^ | | | | | 6 | | | | | | 5 | |
Fremont Home Loan Trust | |
0.603% due 01/25/2037 | | | | | 316 | | | | | | 160 | |
0.613% due 08/25/2036 | | | | | 248 | | | | | | 99 | |
0.623% due 02/25/2036 | | | | | 77 | | | | | | 66 | |
0.623% due 02/25/2037 | | | | | 1,103 | | | | | | 585 | |
0.723% due 02/25/2036 | | | | | 300 | | | | | | 198 | |
| | | | | | | | | | | | |
| | | | | PRINCIPAL
AMOUNT
(000S) | | | | | MARKET
VALUE
(000S) | |
0.723% due 04/25/2036 | | $ | | | 3,000 | | | $ | | | 1,671 | |
0.943% due 07/25/2035 | | | | | 100 | | | | | | 89 | |
1.243% due 12/25/2029 | | | | | 14 | | | | | | 12 | |
GE-WMC Asset-Backed Pass-Through Certificates | |
0.703% due 12/25/2035 | | | | | 3,574 | | | | | | 3,330 | |
GSAA Home Equity Trust | |
0.573% due 04/25/2047 | | | | | 374 | | | | | | 311 | |
GSAMP Trust | |
0.543% due 01/25/2037 | | | | | 3,739 | | | | | | 2,239 | |
0.573% due 12/25/2036 | | | | | 1,191 | | | | | | 641 | |
0.603% due 06/25/2036 | | | | | 424 | | | | | | 400 | |
0.603% due 09/25/2036 | | | | | 408 | | | | | | 189 | |
0.603% due 12/25/2046 | | | | | 777 | | | | | | 440 | |
0.613% due 05/25/2046 | | | | | 54 | | | | | | 49 | |
0.653% due 11/25/2036 | | | | | 232 | | | | | | 132 | |
0.683% due 12/25/2046 | | | | | 233 | | | | | | 134 | |
0.693% due 12/25/2035 | | | | | 192 | | | | | | 180 | |
0.693% due 06/25/2036 | | | | | 362 | | | | | | 218 | |
0.723% due 04/25/2036 | | | | | 400 | | | | | | 239 | |
2.103% due 10/25/2034 | | | | | 101 | | | | | | 94 | |
Home Equity Asset Trust | |
1.548% due 05/25/2035 | | | | | 200 | | | | | | 176 | |
Home Equity Loan Trust | |
0.683% due 04/25/2037 | | | | | 800 | | | | | | 503 | |
0.793% due 04/25/2037 | | | | | 500 | | | | | | 283 | |
HSI Asset Securitization Corp. Trust | |
0.000% due 03/25/2036 (a)(b) | | | | | 1,440 | | | | | | 1,431 | |
0.563% due 12/25/2036 | | | | | 286 | | | | | | 116 | |
0.623% due 12/25/2036 | | | | | 1,302 | | | | | | 532 | |
0.673% due 12/25/2036 | | | | | 868 | | | | | | 360 | |
0.843% due 11/25/2035 | | | | | 300 | | | | | | 217 | |
IndyMac Home Equity Mortgage Loan Asset-Backed Trust | |
0.593% due 11/25/2036 | | | | | 599 | | | | | | 478 | |
0.613% due 11/25/2036 | | | | | 500 | | | | | | 333 | |
0.773% due 04/25/2037 | | | | | 455 | | | | | | 322 | |
IXIS Real Estate Capital Trust | |
1.083% due 02/25/2036 | | | | | 500 | | | | | | 446 | |
JPMorgan Mortgage Acquisition Corp. | |
0.633% due 02/25/2036 | | | | | 324 | | | | | | 313 | |
0.683% due 05/25/2035 | | | | | 406 | | | | | | 396 | |
JPMorgan Mortgage Acquisition Trust | |
0.613% due 01/25/2036 | | | | | 200 | | | | | | 186 | |
0.613% due 05/25/2036 | | | | | 403 | | | | | | 391 | |
0.613% due 01/25/2037 | | | | | 658 | | | | | | 643 | |
0.613% due 05/25/2037 | | | | | 200 | | | | | | 187 | |
0.623% due 04/25/2036 | | | | | 786 | | | | | | 747 | |
0.713% due 03/25/2037 | | | | | 300 | | | | | | 222 | |
0.713% due 05/25/2037 | | | | | 300 | | | | | | 242 | |
0.723% due 04/25/2036 | | | | | 300 | | | | | | 265 | |
0.723% due 05/25/2036 | | | | | 700 | | | | | | 595 | |
0.723% due 07/25/2036 | | | | | 200 | | | | | | 142 | |
0.733% due 01/25/2037 | | | | | 200 | | | | | | 148 | |
6.337% due 08/25/2036 ^ | | | | | 174 | | | | | | 118 | |
| | | | | | |
| 72 | | PIMCO MANAGED ACCOUNTS TRUST | | | | See Accompanying Notes |
(Unaudited)
June 30, 2016
| | | | | | | | | | | | |
| | | | | PRINCIPAL
AMOUNT
(000S) | | | | | MARKET
VALUE
(000S) | |
Lehman ABS Mortgage Loan Trust | |
0.543% due 06/25/2037 | | $ | | | 308 | | | $ | | | 185 | |
0.653% due 06/25/2037 | | | | | 248 | | | | | | 152 | |
Lehman XS Trust | |
0.603% due 04/25/2037 ^ | | | | | 913 | | | | | | 694 | |
0.623% due 02/25/2037 ^ | | | | | 2,016 | | | | | | 1,154 | |
Long Beach Mortgage Loan Trust | |
0.833% due 08/25/2045 | | | | | 218 | | | | | | 203 | |
0.883% due 11/25/2035 | | | | | 600 | | | | | | 514 | |
1.293% due 07/25/2031 | | | | | 297 | | | | | | 282 | |
1.503% due 06/25/2035 | | | | | 500 | | | | | | 385 | |
1.728% due 02/25/2035 | | | | | 200 | | | | | | 160 | |
1.878% due 03/25/2032 | | | | | 335 | | | | | | 324 | |
MASTR Asset-Backed Securities Trust | |
0.563% due 08/25/2036 | | | | | 221 | | | | | | 108 | |
0.603% due 08/25/2036 | | | | | 364 | | | | | | 181 | |
0.633% due 02/25/2036 | | | | | 495 | | | | | | 259 | |
0.693% due 06/25/2036 | | | | | 211 | | | | | | 114 | |
0.693% due 08/25/2036 | | | | | 218 | | | | | | 111 | |
0.753% due 01/25/2036 | | | | | 286 | | | | | | 277 | |
0.833% due 01/25/2036 | | | | | 300 | | | | | | 234 | |
1.196% due 10/25/2035 ^ | | | | | 381 | | | | | | 286 | |
1.203% due 12/25/2034 ^ | | | | | 100 | | | | | | 96 | |
Meritage Mortgage Loan Trust | |
1.203% due 11/25/2035 | | | | | 285 | | | | | | 280 | |
Merrill Lynch Mortgage Investors Trust | |
0.653% due 01/25/2037 | | | | | 31 | | | | | | 31 | |
0.693% due 08/25/2037 | | | | | 1,205 | | | | | | 748 | |
0.763% due 08/25/2036 | | | | | 300 | | | | | | 284 | |
0.903% due 02/25/2047 | | | | | 1,454 | | | | | | 965 | |
0.933% due 05/25/2036 | | | | | 413 | | | | | | 380 | |
MESA Trust | |
1.253% due 12/25/2031 | | | | | 833 | | | | | | 774 | |
Mid-State Capital Corp. Trust | |
6.005% due 08/15/2037 | | | | | 876 | | | | | | 939 | |
Morgan Stanley ABS Capital, Inc. Trust | |
0.523% due 10/25/2036 | | | | | 113 | | | | | | 61 | |
0.593% due 10/25/2036 | | | | | 168 | | | | | | 92 | |
0.593% due 11/25/2036 | | | | | 311 | | | | | | 190 | |
0.603% due 06/25/2036 | | | | | 556 | | | | | | 425 | |
0.603% due 09/25/2036 | | | | | 447 | | | | | | 212 | |
0.603% due 10/25/2036 | | | | | 269 | | | | | | 156 | |
0.603% due 11/25/2036 | | | | | 1,641 | | | | | | 965 | |
0.633% due 03/25/2037 | | | | | 495 | | | | | | 247 | |
0.653% due 02/25/2037 | | | | | 169 | | | | | | 98 | |
0.673% due 11/25/2036 | | | | | 389 | | | | | | 239 | |
0.703% due 03/25/2037 | | | | | 495 | | | | | | 251 | |
0.763% due 12/25/2035 | | | | | 479 | | | | | | 431 | |
1.353% due 05/25/2034 | | | | | 145 | | | | | | 134 | |
1.383% due 03/25/2035 | | | | | 300 | | | | | | 296 | |
1.443% due 06/25/2035 | | | | | 400 | | | | | | 368 | |
1.503% due 04/25/2035 | | | | | 200 | | | | | | 143 | |
1.703% due 07/25/2037 | | | | | 400 | | | | | | 268 | |
2.103% due 03/25/2034 | | | | | 1,157 | | | | | | 1,069 | |
| | | | | | | | | | | | |
| | | | | PRINCIPAL
AMOUNT
(000S) | | | | | MARKET
VALUE
(000S) | |
Morgan Stanley Capital, Inc. Trust | |
0.743% due 01/25/2036 | | $ | | | 1,803 | | | $ | | | 1,622 | |
Morgan Stanley Dean Witter Capital, Inc. Trust | |
1.803% due 02/25/2033 | | | | | 1,024 | | | | | | 981 | |
Morgan Stanley Home Equity Loan Trust | |
0.613% due 04/25/2036 | | | | | 157 | | | | | | 110 | |
0.623% due 04/25/2037 | | | | | 767 | | | | | | 463 | |
0.683% due 04/25/2037 | | | | | 256 | | | | | | 156 | |
Morgan Stanley Mortgage Loan Trust | |
0.683% due 02/25/2037 | | | | | 204 | | | | | | 108 | |
0.813% due 04/25/2037 | | | | | 348 | | | | | | 167 | |
5.750% due 11/25/2036 ^ | | | | | 316 | | | | | | 153 | |
5.965% due 09/25/2046 ^ | | | | | 485 | | | | | | 273 | |
New Century Home Equity Loan Trust | |
0.703% due 12/25/2035 | | | | | 186 | | | | | | 183 | |
0.903% due 06/25/2035 | | | | | 1,000 | | | | | | 958 | |
Nomura Home Equity Loan, Inc. Home Equity Loan Trust | |
0.863% due 02/25/2036 | | | | | 200 | | | | | | 186 | |
6.032% due 10/25/2036 ^ | | | | | 193 | | | | | | 95 | |
NovaStar Mortgage Funding Trust | |
0.603% due 06/25/2036 | | | | | 170 | | | | | | 113 | |
0.823% due 01/25/2036 | | | | | 45 | | | | | | 45 | |
0.923% due 01/25/2036 | | | | | 7,500 | | | | | | 6,085 | |
Option One Mortgage Loan Trust | |
0.593% due 01/25/2037 | | | | | 86 | | | | | | 51 | |
0.623% due 05/25/2037 | | | | | 221 | | | | | | 129 | |
0.673% due 01/25/2037 | | | | | 343 | | | | | | 205 | |
0.783% due 04/25/2037 | | | | | 161 | | | | | | 98 | |
0.813% due 01/25/2036 | | | | | 300 | | | | | | 198 | |
0.963% due 08/25/2035 | | | | | 400 | | | | | | 308 | |
Option One Mortgage Loan Trust Asset-Backed Certificates | |
0.893% due 11/25/2035 | | | | | 400 | | | | | | 381 | |
0.913% due 11/25/2035 | | | | | 1,100 | | | | | | 835 | |
Ownit Mortgage Loan Trust | |
1.053% due 10/25/2036 ^ | | | | | 300 | | | | | | 251 | |
Park Place Securities, Inc. | |
0.943% due 09/25/2035 | | | | | 200 | | | | | | 161 | |
Park Place Securities, Inc. Asset-Backed Pass-Through Certificates | |
0.943% due 08/25/2035 | | | | | 200 | | | | | | 162 | |
0.943% due 09/25/2035 | | | | | 500 | | | | | | 405 | |
0.983% due 07/25/2035 | | | | | 400 | | | | | | 364 | |
1.003% due 07/25/2035 | | | | | 950 | | | | | | 733 | |
1.293% due 01/25/2036 | | | | | 100 | | | | | | 98 | |
1.398% due 02/25/2035 | | | | | 55 | | | | | | 55 | |
1.398% due 06/25/2035 | | | | | 200 | | | | | | 176 | |
1.503% due 10/25/2034 | | | | | 500 | | | | | | 429 | |
1.578% due 03/25/2035 | | | | | 400 | | | | | | 342 | |
1.698% due 01/25/2036 | | | | | 300 | | | | | | 276 | |
2.253% due 12/25/2034 | | | | | 676 | | | | | | 572 | |
People’s Choice Home Loan Securities Trust | |
1.173% due 05/25/2035 ^ | | | | | 200 | | | | | | 193 | |
| | | | | | |
| See Accompanying Notes | | SEMIANNUAL REPORT | | JUNE 30, 2016 | | 73 |
Schedule of Investments PIMCO Fixed Income SHares: Series M (Cont.)
| | | | | | | | | | | | |
| | | | | PRINCIPAL
AMOUNT
(000S) | | | | | MARKET
VALUE
(000S) | |
People’s Financial Realty Mortgage Securities Trust | |
0.593% due 09/25/2036 | | $ | | | 457 | | | $ | | | 192 | |
Popular ABS Mortgage Pass-Through Trust | |
0.713% due 11/25/2046 | | | | | 200 | | | | | | 177 | |
0.843% due 02/25/2036 | | | | | 400 | | | | | | 338 | |
RAAC Trust | |
0.753% due 06/25/2044 | | | | | 101 | | | | | | 86 | |
0.796% due 11/25/2046 | | | | | 738 | | | | | | 630 | |
0.853% due 09/25/2045 | | | | | 4,100 | | | | | | 3,388 | |
0.853% due 06/25/2047 | | | | | 140 | | | | | | 133 | |
1.385% due 10/25/2045 | | | | | 250 | | | | | | 230 | |
1.953% due 09/25/2047 | | | | | 600 | | | | | | 492 | |
Renaissance Home Equity Loan Trust | |
5.812% due 11/25/2036 | | | | | 569 | | | | | | 325 | |
7.238% due 09/25/2037 ^ | | | | | 277 | | | | | | 162 | |
Residential Asset Mortgage Products Trust | |
0.613% due 12/25/2036 | | | | | 182 | | | | | | 176 | |
0.613% due 02/25/2037 | | | | | 459 | | | | | | 423 | |
0.666% due 10/25/2034 | | | | | 82 | | | | | | 77 | |
0.733% due 09/25/2036 | | | | | 300 | | | | | | 262 | |
0.753% due 05/25/2036 ^ | | | | | 1,753 | | | | | | 1,402 | |
0.773% due 01/25/2036 | | | | | 1,000 | | | | | | 784 | |
0.883% due 11/25/2035 | | | | | 250 | | | | | | 226 | |
0.893% due 10/25/2035 | | | | | 200 | | | | | | 191 | |
0.913% due 10/25/2035 | | | | | 100 | | | | | | 86 | |
0.933% due 09/25/2035 | | | | | 300 | | | | | | 274 | |
1.353% due 08/25/2034 | | | | | 227 | | | | | | 218 | |
5.636% due 07/25/2034 ^ | | | | | 1,640 | | | | | | 1,543 | |
5.740% due 01/25/2034 | | | | | 1,730 | | | | | | 1,822 | |
Residential Asset Securities Corp. Trust | |
0.583% due 11/25/2036 | | | | | 803 | | | | | | 661 | |
0.613% due 11/25/2036 ^ | | | | | 743 | | | | | | 664 | |
0.623% due 11/25/2036 | | | | | 989 | | | | | | 870 | |
0.693% due 09/25/2036 | | | | | 900 | | | | | | 809 | |
0.703% due 04/25/2037 | | | | | 368 | | | | | | 345 | |
0.723% due 05/25/2037 | | | | | 280 | | | | | | 258 | |
0.733% due 06/25/2036 | | | | | 1,000 | | | | | | 804 | |
0.776% due 12/25/2035 | | | | | 285 | | | | | | 200 | |
0.793% due 04/25/2037 | | | | | 1,600 | | | | | | 1,132 | |
0.833% due 02/25/2036 | | | | | 400 | | | | | | 360 | |
0.863% due 01/25/2036 | | | | | 200 | | | | | | 180 | |
0.873% due 10/25/2035 | | | | | 300 | | | | | | 279 | |
0.873% due 12/25/2035 | | | | | 400 | | | | | | 348 | |
0.893% due 11/25/2035 | | | | | 300 | | | | | | 261 | |
0.913% due 11/25/2035 | | | | | 300 | | | | | | 238 | |
1.098% due 03/25/2035 | | | | | 1,447 | | | | | | 1,335 | |
1.218% due 03/25/2034 | | | | | 97 | | | | | | 91 | |
1.293% due 12/25/2034 | | | | | 49 | | | | | | 47 | |
Salomon Mortgage Loan Trust | |
1.353% due 11/25/2033 | | | | | 299 | | | | | | 292 | |
Saxon Asset Securities Trust | |
1.623% due 07/25/2031 | | | | | 32 | | | | | | 32 | |
Securitized Asset-Backed Receivables LLC Trust | |
0.543% due 07/25/2036 | | | | | 285 | | | | | | 134 | |
| | | | | | | | | | | | |
| | | | | PRINCIPAL
AMOUNT
(000S) | | | | | MARKET
VALUE
(000S) | |
0.593% due 05/25/2036 | | $ | | | 616 | | | $ | | | 348 | |
0.613% due 07/25/2036 | | | | | 279 | | | | | | 134 | |
0.693% due 07/25/2036 | | | | | 239 | | | | | | 117 | |
0.703% due 05/25/2036 | | | | | 1,366 | | | | | | 791 | |
0.723% due 03/25/2036 | | | | | 289 | | | | | | 231 | |
1.013% due 08/25/2035 | | | | | 6 | | | | | | 6 | |
1.113% due 08/25/2035 | | | | | 400 | | | | | | 264 | |
1.128% due 01/25/2035 | | | | | 156 | | | | | | 142 | |
1.413% due 01/25/2036 ^ | | | | | 157 | | | | | | 127 | |
3.420% due 01/25/2036 ^ | | | | | 78 | | | | | | 58 | |
SG Mortgage Securities Trust | |
0.613% due 07/25/2036 | | | | | 34,177 | | | | | | 12,933 | |
0.903% due 10/25/2035 | | | | | 1,000 | | | | | | 832 | |
SLM Student Loan Trust | |
2.138% due 04/25/2023 | | | | | 8,747 | | | | | | 8,749 | |
Soundview Home Loan Trust | |
0.533% due 06/25/2037 | | | | | 72 | | | | | | 45 | |
0.563% due 02/25/2037 | | | | | 354 | | | | | | 140 | |
0.603% due 01/25/2037 | | | | | 1 | | | | | | 1 | |
0.613% due 11/25/2036 | | | | | 621 | | | | | | 531 | |
0.633% due 02/25/2037 | | | | | 496 | | | | | | 199 | |
0.633% due 07/25/2037 | | | | | 2,825 | | | | | | 1,765 | |
0.803% due 03/25/2036 | | | | | 400 | | | | | | 325 | |
1.278% due 06/25/2035 | | | | | 272 | | | | | | 247 | |
1.403% due 10/25/2037 | | | | | 503 | | | | | | 359 | |
South Carolina Student Loan Corp. | |
1.673% due 09/03/2024 | | | | | 600 | | | | | | 588 | |
Specialty Underwriting & Residential Finance Trust | |
0.596% due 09/25/2037 | | | | | 160 | | | | | | 92 | |
0.603% due 11/25/2037 | | | | | 1,094 | | | | | | 647 | |
0.716% due 04/25/2037 | | | | | 268 | | | | | | 147 | |
1.428% due 12/25/2035 | | | | | 537 | | | | | | 481 | |
Structured Asset Investment Loan Trust | |
0.603% due 09/25/2036 | | | | | 401 | | | | | | 330 | |
0.643% due 03/25/2036 | | | | | 773 | | | | | | 682 | |
0.753% due 01/25/2036 | | | | | 313 | | | | | | 251 | |
1.353% due 05/25/2035 | | | | | 600 | | | | | | 504 | |
1.578% due 07/25/2033 | | | | | 104 | | | | | | 100 | |
Structured Asset Securities Corp. Mortgage Loan Trust | |
0.593% due 09/25/2036 | | | | | 513 | | | | | | 503 | |
0.603% due 09/25/2036 | | | | | 204 | | | | | | 177 | |
0.613% due 03/25/2036 | | | | | 130 | | | | | | 126 | |
0.623% due 12/25/2036 | | | | | 293 | | | | | | 253 | |
0.663% due 02/25/2037 | | | | | 1,040 | | | | | | 873 | |
0.683% due 01/25/2037 | | | | | 3,172 | | | | | | 1,872 | |
0.703% due 09/25/2036 | | | | | 200 | | | | | | 166 | |
0.823% due 04/25/2036 | | | | | 600 | | | | | | 526 | |
1.353% due 08/25/2037 | | | | | 405 | | | | | | 387 | |
1.453% due 08/25/2037 | | | | | 1,140 | | | | | | 1,061 | |
Structured Asset Securities Corp. Trust | |
0.913% due 09/25/2035 | | | | | 700 | | | | | | 521 | |
Wells Fargo Home Equity Asset-Backed Securities Trust | |
0.783% due 05/25/2036 | | | | | 300 | | | | | | 244 | |
| | | | | | |
| 74 | | PIMCO MANAGED ACCOUNTS TRUST | | | | See Accompanying Notes |
(Unaudited)
June 30, 2016
| | | | | | | | | | | | |
| | | | | PRINCIPAL
AMOUNT
(000S) | | | | | MARKET
VALUE
(000S) | |
1.083% due 03/25/2035 | | $ | | | 1,000 | | | $ | | | 900 | |
1.083% due 11/25/2035 | | | | | 200 | | | | | | 182 | |
1.503% due 02/25/2035 | | | | | 200 | | | | | | 183 | |
| | | | | | | | | | | | |
Total Asset-Backed Securities (Cost $183,128) | | | 182,474 | |
| | | | |
| | | | |
| SOVEREIGN ISSUES 0.1% | |
Banco Nacional de Desenvolvimento Economico e Social | |
3.375% due 09/26/2016 | | | | | 1,400 | | | | | | 1,403 | |
| | | | | | | | | | | | |
Total Sovereign Issues (Cost $1,400) | | | 1,403 | |
| | | | | | | | | | | | |
| |
| SHORT-TERM INSTRUMENTS 1.1% | |
| | | | | | | | | | | | |
REPURCHASE AGREEMENTS (f) 1.1% | |
| | | | | | 17,176 | |
| | | | | | | | | | | | |
| | | | | | | | | | | | |
| | | | | PRINCIPAL
AMOUNT
(000S) | | | | | MARKET
VALUE
(000S) | |
| U.S. TREASURY BILLS 0.0% | |
0.238% due 07/21/2016 (b)(c)(k) | | $ | | | 202 | | | $ | | | 202 | |
| | | | | | | | | | | | |
Total Short-Term Instruments
(Cost $17,378) | | | 17,378 | |
| | | | | | | | | | | | |
| |
Total Investments in Securities
(Cost $2,509,461) | | | 2,609,363 | |
| |
Total Investments 170.6%
(Cost $2,509,461) | | | $ | | | 2,609,363 | |
| | | | | | | | | | | | |
Financial Derivative Instruments (h)(j) 0.3% (Cost or Premiums, net $925) | | | 4,451 | |
| |
Other Assets and Liabilities,
net (70.9)% | | | (1,084,531 | ) |
| | | | | | | | | | | | |
| Net Assets 100.0% | | | $ | | | 1,529,283 | |
| | | | | | | | | | | | |
NOTES TO SCHEDULE OF INVESTMENTS (AMOUNTS IN THOUSANDS*, EXCEPT NUMBER OF CONTRACTS):
| * | A zero balance may reflect actual amounts rounding to less than one thousand. |
| (a) | Principal only security. |
| (c) | Coupon represents a yield to maturity. |
| (d) | Perpetual maturity; date shown, if applicable, represents next contractual call date. |
(e) RESTRICTED SECURITIES:
| | | | | | | | | | | | | | | | | | | | | | | | |
| Issuer Description | | Coupon | | | Maturity
Date | | | Acquisition
Date | | | Cost | | | Market
Value | | | Market Value
as Percentage
of Net Assets | |
KGH Intermediate Holdco LLC | | | 8.500% | | | | 08/08/2019 | | | | 08/07/2014 | | | $ | 16,714 | | | $ | 15,751 | | | | 1.03% | |
| | | | | | | | | | | | | | | | | | | | | | | | |
BORROWINGS AND OTHER FINANCING TRANSACTIONS
(f) REPURCHASE AGREEMENTS:
| | | | | | | | | | | | | | | | | | | | | | | | | | | | |
| Counterparty | | Lending
Rate | | Settlement
Date | | | Maturity
Date | | | Principal
Amount | | | Collateralized By | | Collateral
(Received) | | | Repurchase
Agreements,
at Value | | | Repurchase
Agreement
Proceeds
to be
Received (1) | |
NOM | | 0.950% | | | 06/30/2016 | | | | 07/01/2016 | | | $ | 12,000 | | | U.S. Treasury Notes 1.625% due 05/31/2023 | | $ | (12,250 | ) | | $ | 12,000 | | | $ | 12,000 | |
SSB | | 0.010 | | | 06/30/2016 | | | | 07/01/2016 | | | | 5,176 | | | U.S. Treasury Notes 0.750% due 12/31/2017 | | | (5,283 | ) | | | 5,176 | | | | 5,176 | |
| | | | | | | | | | | | | | | | | | | | | | | | | | | | |
Total Repurchase Agreements | | | | | | | | | $ | (17,533 | ) | | $ | 17,176 | | | $ | 17,176 | |
| | | | | | | | | | | | | | | | | | | | | | | | | | | | |
| (1) | Includes accrued interest. |
| | | | | | |
| See Accompanying Notes | | SEMIANNUAL REPORT | | JUNE 30, 2016 | | 75 |
Schedule of Investments PIMCO Fixed Income SHares: Series M (Cont.)
REVERSE REPURCHASE AGREEMENTS:
| | | | | | | | | | | | | | | | | | | | | | | | |
| Counterparty | | Borrowing
Rate (2) | | | Borrowing
Date | | | Maturity
Date | | | Amount
Borrowed (2) | | | Payable for
Reverse
Repurchase
Agreements | |
BOM | | | 0.570 | % | | | 04/15/2016 | | | | 07/15/2016 | | | $ | | | | | (46,230 | ) | | $ | (46,287 | ) |
| | | 0.590 | | | | 04/27/2016 | | | | 07/27/2016 | | | | | | | | (114,211 | ) | | | (114,332 | ) |
BSN | | | 0.580 | | | | 04/18/2016 | | | | 07/18/2016 | | | | | | | | (46,079 | ) | | | (46,134 | ) |
| | | 0.590 | | | | 04/25/2016 | | | | 07/25/2016 | | | | | | | | (3,909 | ) | | | (3,913 | ) |
DEU | | | 0.610 | | | | 06/27/2016 | | | | 07/11/2016 | | | | | | | | (3,706 | ) | | | (3,706 | ) |
GRE | | | 0.580 | | | | 05/06/2016 | | | | 07/06/2016 | | | | | | | | (15,900 | ) | | | (15,914 | ) |
| | | 0.590 | | | | 05/03/2016 | | | | 08/03/2016 | | | | | | | | (60,288 | ) | | | (60,346 | ) |
| | | 0.630 | | | | 04/11/2016 | | | | 07/11/2016 | | | | | | | | (55,145 | ) | | | (55,223 | ) |
| | | 0.630 | | | | 04/13/2016 | | | | 07/13/2016 | | | | | | | | (15,456 | ) | | | (15,478 | ) |
| | | 0.630 | | | | 04/14/2016 | | | | 07/14/2016 | | | | | | | | (2,127 | ) | | | (2,130 | ) |
| | | 0.630 | | | | 05/24/2016 | | | | 07/25/2016 | | | | | | | | (12,805 | ) | | | (12,813 | ) |
| | | 0.630 | | | | 06/14/2016 | | | | 07/14/2016 | | | | | | | | (3,228 | ) | | | (3,229 | ) |
| | | 0.640 | | | | 06/21/2016 | | | | 07/05/2016 | | | | | | | | (8,241 | ) | | | (8,243 | ) |
RDR | | | 0.600 | | | | 04/27/2016 | | | | 07/19/2016 | | | | | | | | (65,980 | ) | | | (66,052 | ) |
| | | | | | | | | | | | | | | | | | | | | | | | |
Total Reverse Repurchase Agreements | | | | | | | | | | | | | | | $ | (453,800 | ) |
| | | | | | | | | | | | | | | | | | | | | | | | |
SALE-BUYBACK TRANSACTIONS:
| | | | | | | | | | | | | | | | | | | | | | | | |
| Counterparty | | Borrowing
Rate (2) | | | Borrowing
Date | | | Maturity
Date | | | Amount
Borrowed (2) | | | Payable for
Sale-Buyback
Transactions (3) | |
GSC | | | 0.580 | % | | | 06/09/2016 | | | | 07/11/2016 | | | $ | | | | | (10,378 | ) | | $ | (10,382 | ) |
| | | 0.630 | | | | 05/25/2016 | | | | 07/06/2016 | | | | | | | | (5,047 | ) | | | (5,049 | ) |
UBS | | | 0.850 | | | | 06/27/2016 | | | | 07/05/2016 | | | | | | | | (5,744 | ) | | | (5,745 | ) |
| | | | | | | | | | | | | | | | | | | | | | | | |
Total Sale-Buyback Transactions | | | | | | | | | | | | | | | $ | (21,176 | ) |
| | | | | | | | | | | | | | | | | | | | | | | | |
| (2) | The average amount of borrowings outstanding during the period ended June 30, 2016 was $(444,105) at a weighted average interest rate of 0.582%. |
| (3) | Payable for sale-buyback transactions includes $(3) of deferred price drop. |
SHORT SALES:
SHORT SALES ON U.S. GOVERNMENT AGENCIES
| | | | | | | | | | | | | | | | | | | | |
| Description | | Coupon | | | Maturity
Date | | | Principal
Amount | | | Proceeds | | | Payable for
Short Sales | |
Fannie Mae, TBA | | | 3.000 | % | | | 07/01/2046 | | | $ | 1,000 | | | $ | (1,037 | ) | | $ | (1,038 | ) |
Fannie Mae, TBA | | | 3.500 | | | | 07/01/2046 | | | | 5,000 | | | | (5,270 | ) | | | (5,275 | ) |
| | | | | | | | | | | | | | | | | | | | |
Total Short Sales | | | | | | | | | | | | | | $ | (6,307 | ) | | $ | (6,313 | ) |
| | | | | | | | | | | | | | | | | | | | |
| | | | | | |
| 76 | | PIMCO MANAGED ACCOUNTS TRUST | | | | See Accompanying Notes |
(Unaudited)
June 30, 2016
BORROWINGS AND OTHER FINANCING TRANSACTIONS SUMMARY
The following is a summary by counterparty of the market value of Borrowings and Other Financing Transactions and collateral (received)/pledged as of June 30, 2016:
| (g) | Securities with an aggregate market value of $504,662 have been pledged as collateral under the terms of the following master agreements as of June 30, 2016. |
| | | | | | | | | | | | | | | | | | | | | | | | |
| Counterparty | | Repurchase
Agreement
Proceeds to be
Received | | | Payable for
Reverse
Repurchase
Agreements | | | Payable for
Sale-Buyback
Transactions | | | Total
Borrowings and
Other Financing
Transactions | | | Collateral
(Received)/
Pledged | | | Net Exposure (4) | |
Global/Master Repurchase Agreement | | | | | | | | | | | | | | | | | | | | | | | | |
BOM | | $ | 0 | | | $ | (160,619 | ) | | $ | 0 | | | $ | (160,619 | ) | | $ | 163,993 | | | $ | 3,374 | |
BSN | | | 0 | | | | (50,047 | ) | | | 0 | | | | (50,047 | ) | | | 49,608 | | | | (439 | ) |
DEU | | | 0 | | | | (3,706 | ) | | | 0 | | | | (3,706 | ) | | | 3,750 | | | | 44 | |
GRE | | | 0 | | | | (173,376 | ) | | | 0 | | | | (173,376 | ) | | | 171,032 | | | | (2,344 | ) |
NOM | | | 12,000 | | | | 0 | | | | 0 | | | | 12,000 | | | | (12,250 | ) | | | (250 | ) |
RDR | | | 0 | | | | (66,052 | ) | | | 0 | | | | (66,052 | ) | | | 65,498 | | | | (554 | ) |
SGY | | | 0 | | | | 0 | | | | 0 | | | | 0 | | | | (293 | ) | | | (293 | ) |
SSB | | | 5,176 | | | | 0 | | | | 0 | | | | 5,176 | | | | (5,283 | ) | | | (107 | ) |
| | | | | | |
Master Securities Forward Transaction Agreement | | | | | | | | | | | | | | | | | | | | | | | | |
GSC | | | 0 | | | | 0 | | | | (15,431 | ) | | | (15,431 | ) | | | 15,270 | | | | (161 | ) |
MSC | | | 0 | | | | 0 | | | | 0 | | | | 0 | | | | (144 | ) | | | (144 | ) |
SAL | | | 0 | | | | 0 | | | | 0 | | | | 0 | | | | (117 | ) | | | (117 | ) |
UBS | | | 0 | | | | 0 | | | | (5,745 | ) | | | (5,745 | ) | | | 5,687 | | | | (58 | ) |
| | | | | | | | | | | | | | | | | | | | | | | | |
Total Borrowings and Other Financing Transactions | | $ | 17,176 | | | $ | (453,800 | ) | | $ | (21,176 | ) | | | | | | | | | | | | |
| | | | | | | | | | | | | | | | | | | | | | | | |
| (4) | Net Exposure represents the net receivable/(payable) that would be due from/to the counterparty in the event of default. Exposure from borrowings and other financing transactions can only be netted across transactions governed under the same master agreement with the same legal entity. See Note 7, Principal Risks, in the Notes to Financial Statements for more information regarding master netting arrangements. |
CERTAIN TRANSFERS ACCOUNTED FOR AS SECURED BORROWINGS
Remaining Contractual Maturity of the Agreements
| | | | | | | | | | | | | | | | | | | | |
| | | Overnight and
Continuous | | | Up to 30 days | | | 31-90 days | | | Greater Than 90 days | | | Total | |
Reverse Repurchase Agreements | | | | | | | | | | | | | | | | | | | | |
U.S. Treasury Obligations | | $ | 0 | | | $ | (393,454) | | | $ | (60,346 | ) | | $ | 0 | | | $ | (453,800) | |
| | | | | | | | | | | | | | | | | | | | |
Total | | $ | 0 | | | $ | (393,454) | | | $ | (60,346 | ) | | $ | 0 | | | $ | (453,800) | |
| | | | | |
Sale-Buyback Transactions | | | | | | | | | | | | | | | | | | | | |
U.S. Treasury Obligations | | | 0 | | | | (21,176) | | | | 0 | | | | 0 | | | | (21,176) | |
| | | | | | | | | | | | | | | | | | | | |
Total | | $ | 0 | | | $ | (21,176) | | | $ | 0 | | | $ | 0 | | | $ | (21,176) | |
| | | | | | | | | | | | | | | | | | | | |
Total Borrowings | | $ | 0 | | | $ | (414,630) | | | $ | (60,346 | ) | | $ | 0 | | | $ | (474,976) | |
| | | | | | | | | | | | | | | | | | | | |
Gross amount of recognized liabilities for reverse repurchase agreements and sale-buyback financing transactions | | | $ | (474,976) | |
| | | | | | | | | | | | | | | | | | | | |
| | | | | | |
| See Accompanying Notes | | SEMIANNUAL REPORT | | JUNE 30, 2016 | | 77 |
Schedule of Investments PIMCO Fixed Income SHares: Series M (Cont.)
(h) FINANCIAL DERIVATIVE INSTRUMENTS: EXCHANGE-TRADED OR CENTRALLY CLEARED
PURCHASED OPTIONS:
OPTIONS ON EXCHANGE-TRADED FUTURES CONTRACTS
| | | | | | | | | | | | | | | | | | | | |
| Description | | Strike
Price | | | Expiration
Date | | | # of
Contracts | | | Cost | | | Market
Value | |
Put - CBOT U.S. Treasury Ultra Long-Term Bond September Futures | | $ | 115.000 | | | | 08/26/2016 | | | | 934 | | | $ | 8 | | | $ | 1 | |
| | | | | | | | | | | | | | | | | | | | |
Total Purchased Options | | | | | | | | | | | | | | $ | 8 | | | $ | 1 | |
| | | | | | | | | | | | | | | | | | | | |
FUTURES CONTRACTS:
| | | | | | | | | | | | | | | | | | | | | | | | |
| Description | | Type | | | Expiration
Month | | | # of
Contracts | | | Unrealized
Appreciation/
(Depreciation) | | | Variation Margin | |
| | | | | | Asset | | | Liability | |
90-Day Eurodollar December Futures | | | Short | | | | 12/2016 | | | | 4,352 | | | $ | (8,042 | ) | | $ | 0 | | | $ | (163 | ) |
90-Day Eurodollar December Futures | | | Short | | | | 12/2017 | | | | 4,329 | | | | (13,633 | ) | | | 0 | | | | (216 | ) |
Euro-BTP Italy Government Bond September Futures | | | Long | | | | 09/2016 | | | | 55 | | | | 105 | | | | 57 | | | | 0 | |
Euro-Bund 10-Year Bond September Futures | | | Long | | | | 09/2016 | | | | 1,312 | | | | 5,291 | | | | 379 | | | | 0 | |
Put Options Strike @ EUR 150.000 on Euro-Bund 10-Year Bond September Futures | | | Long | | | | 08/2016 | | | | 1,000 | | | | (1 | ) | | | 0 | | | | 0 | |
United Kingdom 90-Day LIBOR Sterling Interest Rate June Futures | | | Short | | | | 06/2017 | | | | 1,763 | | | | (2,701 | ) | | | 0 | | | | (147 | ) |
United Kingdom 90-Day LIBOR Sterling Interest Rate June Futures | | | Short | | | | 06/2018 | | | | 1,058 | | | | (615 | ) | | | 35 | | | | (88 | ) |
United Kingdom 90-Day LIBOR Sterling Interest Rate March Futures | | | Short | | | | 03/2017 | | | | 4,584 | | | | (6,103 | ) | | | 0 | | | | (458 | ) |
| | | | | | | | | | | | | | | | | | | | | | | | |
Total Futures Contracts | | | | | | | | | | | | | | $ | (25,699 | ) | | $ | 471 | | | $ | (1,072 | ) |
| | | | | | | | | | | | | | | | | | | | | | | | |
SWAP AGREEMENTS:
CREDIT DEFAULT SWAPS ON CREDIT INDICES - BUY PROTECTION (1)
| | | | | | | | | | | | | | | | | | | | | | | | | | | | | | | | |
| Index/Tranches | | Fixed
(Pay) Rate | | | Maturity
Date | | | Notional
Amount (3) | | | Market
Value (4) | | | Unrealized
Appreciation | | | Variation Margin | |
| | | | | | | Asset | | | Liability | |
iTraxx Europe Main 25 5-Year Index | | | (1.000)% | | | | 06/20/2021 | | | | EUR | | | | 39,400 | | | $ | (342 | ) | | $ | 146 | | | $ | 0 | | | $ | (190 | ) |
| | | | | | | | | | | | | | | | | | | | | | | | | | | | | | | | |
CREDIT DEFAULT SWAPS ON CREDIT INDICES - SELL PROTECTION (2)
| | | | | | | | | | | | | | | | | | | | | | | | | | | | | | | | |
| Index/Tranches | | Fixed
Receive Rate | | | Maturity
Date | | | Notional
Amount (3) | | | Market
Value (4) | | | Unrealized
Appreciation/
(Depreciation) | | | Variation Margin | |
| | | | | | | Asset | | | Liability | |
CDX.IG-24 5-Year Index | | | 1.000 | % | | | 06/20/2020 | | | $ | | | | | 13,400 | | | $ | 125 | | | $ | (61 | ) | | $ | 20 | | | $ | 0 | |
CDX.IG-25 5-Year Index | | | 1.000 | | | | 12/20/2020 | | | | | | | | 190,100 | | | | 1,562 | | | | 1,894 | | | | 325 | | | | 0 | |
CDX.IG-26 5-Year Index | | | 1.000 | | | | 06/20/2021 | | | | | | | | 59,400 | | | | 668 | | | | 82 | | | | 114 | | | | 0 | |
iTraxx Europe Senior 25 5-Year Index | | | 1.000 | | | | 06/20/2021 | | | | EUR | | | | 25,000 | | | | (156 | ) | | | 88 | | | | 80 | | | | 0 | |
| | | | | | | | | | | | | | | | | | | | | | | | | | | | | | | | |
| | | | | | | | | | | | | | | | | | $ | 2,199 | | | $ | 2,003 | | | $ | 539 | | | $ | 0 | |
| | | | | | | | | | | | | | | | | | | | | | | | | | | | | | | | |
| (1) | If the Portfolio is a buyer of protection and a credit event occurs, as defined under the terms of that particular swap agreement, the Portfolio will either (i) receive from the seller of protection an amount equal to the notional amount of the swap and deliver the referenced obligation or underlying securities comprising the referenced index or (ii) receive a net settlement amount in the form of cash or securities equal to the notional amount of the swap less the recovery value of the referenced obligation or underlying securities comprising the referenced index. |
| | | | | | |
| 78 | | PIMCO MANAGED ACCOUNTS TRUST | | | | See Accompanying Notes |
(Unaudited)
June 30, 2016
| (2) | If the Portfolio is a seller of protection and a credit event occurs, as defined under the terms of that particular swap agreement, the Portfolio will either (i) pay to the buyer of protection an amount equal to the notional amount of the swap and take delivery of the referenced obligation or underlying securities comprising the referenced index or (ii) pay a net settlement amount in the form of cash, securities, or other deliverable obligations equal to the notional amount of the swap less the recovery value of the referenced obligation or underlying securities comprising the referenced index. |
| (3) | The maximum potential amount the Portfolio could be required to pay as a seller of credit protection or receive as a buyer of credit protection if a credit event occurs as defined under the terms of that particular swap agreement. |
| (4) | The prices and resulting values for credit default swap agreements on credit indices serve as an indicator of the current status of the payment/performance risk and represent the likelihood of an expected liability (or profit) for the credit derivative should the notional amount of the swap agreement be closed/sold as of the period end. Increasing market values, in absolute terms when compared to the notional amount of the swap, represent a deterioration of the referenced indices’ credit soundness and a greater likelihood or risk of default or other credit event occurring as defined under the terms of the agreement. |
INTEREST RATE SWAPS
| | | | | | | | | | | | | | | | | | | | | | | | | | | | | | | | | | |
Pay/Receive
Floating Rate | | Floating Rate Index | | Fixed Rate | | | Maturity
Date | | | Notional
Amount | | | Market
Value | | | Unrealized
Appreciation/
(Depreciation) | | | Variation Margin | |
| | | | | | | | Asset | | | Liability | |
Receive | | 3-Month USD-LIBOR | | | 1.500% | | | | 12/16/2017 | | | $ | | | | | 446,600 | | | $ | (5,344 | ) | | $ | (3,215 | ) | | $ | 0 | | | $ | (90 | ) |
Receive | | 3-Month USD-LIBOR | | | 2.000 | | | | 12/16/2020 | | | | | | | | 109,600 | | | | (5,112 | ) | | | (4,808 | ) | | | 0 | | | | (6 | ) |
Receive | | 3-Month USD-LIBOR | | | 2.500 | | | | 06/15/2046 | | | | | | | | 22,800 | | | | (3,459 | ) | | | (1,977 | ) | | | 250 | | | | 0 | |
Receive | | 6-Month EUR-EURIBOR * | | | 0.750 | | | | 09/21/2026 | | | | EUR | | | | 1,600 | | | | (64 | ) | | | (61 | ) | | | 0 | | | | (6 | ) |
Receive | | 6-Month GBP-LIBOR * | | | 1.000 | | | | 09/21/2018 | | | | GBP | | | | 220,600 | | | | (2,949 | ) | | | (2,592 | ) | | | 0 | | | | (266 | ) |
Receive | | 6-Month JPY-LIBOR | | | 1.000 | | | | 09/18/2023 | | | | JPY | | | | 7,290,000 | | | | (5,949 | ) | | | (4,401 | ) | | | 19 | | | | 0 | |
Pay | | 28-Day MXN-TIIE | | | 6.150 | | | | 06/07/2024 | | | | MXN | | | | 68,000 | | | | 67 | | | | 118 | | | | 25 | | | | 0 | |
| | | | | | | | | | | | | | | | | | | | | | | | | | | | | | | | | | |
| | | | | | | | | | | | | | | | | | | | $ | (22,810 | ) | | $ | (16,936 | ) | | $ | 294 | | | $ | (368 | ) |
| | | | | | | | | | | | | | | | | | | | | | | | | | | | | | | | | | |
Total Swap Agreements | | | | | | | | | | | $ | (20,953 | ) | | $ | (14,787 | ) | | $ | 833 | | | $ | (558 | ) |
| | | | | | | | | | | | | | | | | | | | | | | | | | | | | | | | | | |
| * | This security has a forward starting effective date. See Note 2(a) in the Notes to Financial Statements for further information. |
FINANCIAL DERIVATIVE INSTRUMENTS: EXCHANGE-TRADED OR CENTRALLY CLEARED SUMMARY
The following is a summary of the market value and variation margin of Exchange-Traded or Centrally Cleared Financial Derivative Instruments as of June 30, 2016:
| (i) | Securities with an aggregate market value of $56,306 and cash of $5,713 have been pledged as collateral for exchange-traded and centrally cleared financial derivative instruments as of June 30, 2016. See Note 7, Principal Risks, in the Notes to Financial Statements for more information regarding master netting arrangements. |
| | | | | | | | | | | | | | | | | | | | | | | | | | | | | | | | | | | | |
| | | Financial Derivative Assets | | | | | | Financial Derivative Liabilities | |
| | | Market Value | | | Variation Margin
Asset (5) | | | | | | | | | Market Value | | | Variation Margin
Liability (5) | | | Total | |
| | | Purchased
Options | | | Futures | | | Swap
Agreements | | | Total | | | | | | Written
Options | | | Futures | | | Swap
Agreements | | |
Total Exchange-Traded or Centrally Cleared | | $ | 1 | | | $ | 471 | | | $ | 1,123 | | | $ | 1,595 | | | | | | | $ | 0 | | | $ | (1,312) | | | $ | (558) | | | $ | (1,870) | |
| | | | | | | | | | | | | | | | | | | | | | | | | | | | | | | | | | | | |
| (5) | Unsettled variation margin liability of $(240) for closed futures and unsettled variation margin asset of $290 for closed swap agreements is outstanding at period end. |
| | | | | | |
| See Accompanying Notes | | SEMIANNUAL REPORT | | JUNE 30, 2016 | | 79 |
Schedule of Investments PIMCO Fixed Income SHares: Series M (Cont.)
(j) FINANCIAL DERIVATIVE INSTRUMENTS: OVER THE COUNTER
FORWARD FOREIGN CURRENCY CONTRACTS:
| | | | | | | | | | | | | | | | | | | | | | | | | | | | |
| Counterparty | | Settlement
Month | | | Currency to
be Delivered | | | Currency to
be Received | | | Unrealized Appreciation/
(Depreciation) | |
| | | | | Asset | | | Liability | |
BOA | | | 07/2016 | | | | GBP | | | | 35,045 | | | $ | | | | | 51,386 | | | $ | 4,732 | | | $ | 0 | |
| | | 07/2016 | | | $ | | | | | 38,194 | | | | EUR | | | | 34,659 | | | | 269 | | | | 0 | |
| | | 07/2016 | | | | | | | | 50,502 | | | | GBP | | | | 37,957 | | | | 28 | | | | 0 | |
| | | 08/2016 | | | | EUR | | | | 34,659 | | | $ | | | | | 38,235 | | | | 0 | | | | (267 | ) |
| | | 08/2016 | | | | GBP | | | | 37,957 | | | | | | | | 50,515 | | | | 0 | | | | (27 | ) |
| | | | | | | | | | | | | | | | | | | | | | | | | | | | |
BPS | | | 08/2016 | | | $ | | | | | 25,641 | | | | JPY | | | | 2,630,000 | | | | 0 | | | | (151 | ) |
| | | | | | | | | | | | | | | | | | | | | | | | | | | | |
CBK | | | 07/2016 | | | | | | | | 2,359 | | | | EUR | | | | 2,098 | | | | 0 | | | | (31 | ) |
| | | 08/2016 | | | | MXN | | | | 1,682 | | | $ | | | | | 90 | | | | 0 | | | | (1 | ) |
| | | 08/2016 | | | | SGD | | | | 34,630 | | | | | | | | 25,502 | | | | 0 | | | | (195 | ) |
| | | 08/2016 | | | $ | | | | | 1,069 | | | | CAD | | | | 1,385 | | | | 3 | | | | 0 | |
| | | | | | | | | | | | | | | | | | | | | | | | | | | | |
GLM | | | 07/2016 | | | | CNH | | | | 100,000 | | | $ | | | | | 14,632 | | | | 0 | | | | (368 | ) |
| | | 07/2016 | | | | EUR | | | | 38,622 | | | | | | | | 43,070 | | | | 213 | | | | (4 | ) |
| | | 07/2016 | | | $ | | | | | 2,244 | | | | EUR | | | | 2,006 | | | | 1 | | | | (19 | ) |
| | | 08/2016 | | | | KRW | | | | 25,119,481 | | | $ | | | | | 21,673 | | | | 0 | | | | (124 | ) |
| | | 08/2016 | | | $ | | | | | 25,169 | | | | AUD | | | | 34,338 | | | | 405 | | | | 0 | |
| | | | | | | | | | | | | | | | | | | | | | | | | | | | |
JPM | | | 07/2016 | | | | GBP | | | | 2,912 | | | $ | | | | | 3,850 | | | | 0 | | | | (27 | ) |
| | | 07/2016 | | | | ILS | | | | 1,840 | | | | | | | | 486 | | | | 10 | | | | 0 | |
| | | 07/2016 | | | $ | | | | | 961 | | | | EUR | | | | 853 | | | | 0 | | | | (15 | ) |
| | | 08/2016 | | | | | | | | 5,573 | | | | MXN | | | | 100,924 | | | | 0 | | | | (79 | ) |
| | | | | | | | | | | | | | | | | | | | | | | | | | | | |
MSB | | | 07/2016 | | | | JPY | | | | 2,732,600 | | | $ | | | | | 24,831 | | | | 0 | | | | (1,631 | ) |
| | | | | | | | | | | | | | | | | | | | | | | | | | | | |
SCX | | | 07/2016 | | | $ | | | | | 26,817 | | | | JPY | | | | 2,732,600 | | | | 0 | | | | (355 | ) |
| | | 08/2016 | | | | JPY | | | | 2,732,600 | | | $ | | | | | 26,845 | | | | 360 | | | | 0 | |
| | | | | | | | | | | | | | | | | | | | | | | | | | | | |
SOG | | | 07/2016 | | | $ | | | | | 478 | | | | ILS | | | | 1,840 | | | | 0 | | | | (1 | ) |
| | | 08/2016 | | | | ILS | | | | 1,840 | | | $ | | | | | 478 | | | | 1 | | | | 0 | |
| | | | | | | | | | | | | | | | | | | | | | | | | | | | |
UAG | | | 07/2016 | | | $ | | | | | 3,142 | | | | EUR | | | | 2,851 | | | | 22 | | | | 0 | |
| | | 08/2016 | | | | MYR | | | | 99,534 | | | $ | | | | | 24,465 | | | | 0 | | | | (165 | ) |
| | | | | | | | | | | | | | | | | | | | | | | | | | | | |
Total Forward Foreign Currency Contracts | | | $ | 6,044 | | | $ | (3,460 | ) |
| | | | | | | | | | | | | | | | | | | | | | | | | | | | |
PURCHASED OPTIONS:
FOREIGN CURRENCY OPTIONS
| | | | | | | | | | | | | | | | | | | | | | |
| Counterparty | | Description | | Strike
Price | | | Expiration
Date | | | Notional
Amount | | | Cost | | | Market
Value | |
| BPS | | Call - OTC USD versus CNH | | | CNH 6.615 | | | | 08/18/2016 | | | | $ 71,763 | | | $ | 1,521 | | | $ | 936 | |
| | | | | | | | | | | | | | | | | | | | | | |
OPTIONS ON SECURITIES
| | | | | | | | | | | | | | | | | | | | | | |
Counterparty | | Description | | Strike
Price | | | Expiration
Date | | | Notional
Amount | | | Cost | | | Market
Value | |
| FBF | | Put - OTC Fannie Mae
4.000% due 07/01/2046 | | $ | 80.000 | | | | 07/07/2016 | | | | $ 210,000 | | | $ | 8 | | | $ | 0 | |
| | | | | | | | | | | | | | | | | | | | | | |
| JPM | | Put - OTC Fannie Mae
3.000% due 07/01/2046 | | | 73.000 | | | | 07/07/2016 | | | | 65,000 | | | | 2 | | | | 0 | |
| | Put - OTC Fannie Mae
3.000% due 08/01/2046 | | | 71.000 | | | | 08/04/2016 | | | | 120,000 | | | | 5 | | | | 0 | |
| | | | | | |
| 80 | | PIMCO MANAGED ACCOUNTS TRUST | | | | See Accompanying Notes |
(Unaudited)
June 30, 2016
| | | | | | | | | | | | | | | | | | | | | | |
Counterparty | | Description | | Strike
Price | | | Expiration
Date | | | Notional
Amount | | | Cost | | | Market
Value | |
| | Put - OTC Fannie Mae 3.500% due 07/01/2046 | | $ | 73.000 | | | | 07/07/2016 | | | $ | 49,000 | | | $ | 2 | | | $ | 0 | |
| | Put - OTC Fannie Mae 4.500% due 07/01/2046 | | | 78.000 | | | | 07/07/2016 | | | | 120,000 | | | | 5 | | | | 0 | |
| | | | | | | | | | | | | | | | | | | | | | |
| | | | | | | | | | | | | | | | $ | 22 | | | $ | 0 | |
| | | | | | | | | | | | | | | | | | | | | | |
Total Purchased Options | | | | | | | $ | 1,543 | | | $ | 936 | |
| | | | | | | | | | | | | | | | | | | | | | |
WRITTEN OPTIONS:
FOREIGN CURRENCY OPTIONS
| | | | | | | | | | | | | | | | | | | | | | |
| Counterparty | | Description | | Strike Price | | | Expiration
Date | | | Notional
Amount | | | Premiums
(Received) | | | Market
Value | |
| BPS | | Call - OTC USD versus CNH | | | CNH 6.985 | | | | 08/18/2016 | | | | $ 71,763 | | | $ | (866 | ) | | $ | (95 | ) |
| | | | | | | | | | | | | | | | | | | | | | |
Total Written Options | | | | | | | $ | (866 | ) | | $ | (95 | ) |
| | | | | | | | | | | | | | | | | | | | | | |
TRANSACTIONS IN WRITTEN CALL AND PUT OPTIONS FOR THE PERIOD ENDED JUNE 30, 2016:
| | | | | | | | | | | | | | | | | | | | | | | | | | | | | | | | | | | | | | | | | | | | | | | | |
| | | Balance at
Beginning of Period | | | Sales | | | Closing Buys | | | Expirations | | | Exercised | | | Balance at
End of Period | |
Notional Amount in $ | | | $ | | | | 316,963 | | | | $ | | | | 167,600 | | | | $ | | | | (65,600 | ) | | | $ | | | | (119,400 | ) | | | $ | | | | (227,800 | ) | | | $ | | | | 71,763 | |
Notional Amount in EUR | | | EUR | | | | 0 | | | | EUR | | | | 327,400 | | | | EUR | | | | (92,100 | ) | | | EUR | | | | (195,900 | ) | | | EUR | | | | (39,400 | ) | | | EUR | | | | 0 | |
Premiums | | | $ | | | | (1,311 | ) | | | $ | | | | (1,102 | ) | | | $ | | | | 367 | | | | $ | | | | 715 | | | | $ | | | | 465 | | | | $ | | | | (866 | ) |
SWAP AGREEMENTS:
CREDIT DEFAULT SWAPS ON CORPORATE AND U.S. MUNICIPAL ISSUES - SELL PROTECTION (1)
| | | | | | | | | | | | | | | | | | | | | | | | | | | | | | | | | | | | | | |
| Counterparty | | Reference
Entity | | Fixed
Receive Rate | | | Maturity
Date | | | Implied
Credit
Spread at
June 30,
2016 (2) | | | Notional
Amount (3) | | | Premiums
Paid/(Received) | | | Unrealized
Appreciation/
(Depreciation) | | | Swap Agreements,
at Value | |
| | | | | | | | | Asset | | | Liability | |
| DUB | | BP Capital Markets America, Inc. | | | 1.000% | | | | 12/20/2018 | | | | 0.435% | | | | EUR | | | | 8,200 | | | $ | 217 | | | $ | (86 | ) | | $ | 131 | | | $ | 0 | |
| | | | | | | | | | | | | | | | | | | | | | | | | | | | | | | | | | | | | | |
| GST | | California State General Obligation Bonds, Series 2003 | | | 1.600 | | | | 12/20/2018 | | | | 0.563 | | | | $ | | | | 25,000 | | | | 0 | | | | 645 | | | | 645 | | | | 0 | |
| | California State General Obligation Bonds, Series 2003 | | | 1.750 | | | | 12/20/2018 | | | | 0.563 | | | | | | | | 11,000 | | | | 0 | | | | 325 | | | | 325 | | | | 0 | |
| | | | | | | | | | | | | | | | | | | | | | | | | | | | | | | | | | | | | | |
| | | | | | | | | | | | | | | | | | | | | | | | $ | 217 | | | $ | 884 | | | $ | 1,101 | | | $ | 0 | |
| | | | | | | | | | | | | | | | | | | | | | | | | | | | | | | | | | | | | | |
CREDIT DEFAULT SWAPS ON CREDIT INDICES - SELL PROTECTION (1)
| | | | | | | | | | | | | | | | | | | | | | | | | | | | | | | | | | | | |
| Counterparty | | Index/Tranches | | | Fixed
Receive Rate | | | Maturity
Date | | | Notional
Amount (3) | | | Premiums Paid | | | Unrealized
Appreciation | | | Swap Agreements,
at Value (4) | |
| | | | | | | | Asset | | | Liability | |
CBK | | | MCDX-26 5-Year Index | | | | 1.000% | | | | 06/20/2021 | | | $ | | | | | 6,100 | | | $ | 16 | | | $ | 2 | | | $ | 18 | | | $ | 0 | |
| | | | | | | | | | | | | | | | | | | | | | | | | | | | | | | | | | | | |
GST | | | MCDX-26 5-Year Index | | | | 1.000 | | | | 06/20/2021 | | | | | | | | 2,900 | | | | 7 | | | | 1 | | | | 8 | | | | 0 | |
| | | | | | | | | | | | | | | | | | | | | | | | | | | | | | | | | | | | |
| | | | | | | | | | | | | | | | | | | | | | $ | 23 | | | $ | 3 | | | $ | 26 | | | $ | 0 | |
| | | | | | | | | | | | | | | | | | | | | | | | | | | | | | | | | | | | |
| | | | | | |
| See Accompanying Notes | | SEMIANNUAL REPORT | | JUNE 30, 2016 | | 81 |
Schedule of Investments PIMCO Fixed Income SHares: Series M (Cont.)
| (1) | If the Portfolio is a seller of protection and a credit event occurs, as defined under the terms of that particular swap agreement, the Portfolio will either (i) pay to the buyer of protection an amount equal to the notional amount of the swap and take delivery of the referenced obligation or underlying securities comprising the referenced index or (ii) pay a net settlement amount in the form of cash or securities equal to the notional amount of the swap less the recovery value of the referenced obligation or underlying securities comprising the referenced index. |
| (2) | Implied credit spreads, represented in absolute terms, utilized in determining the market value of credit default swap agreements on corporate or U.S. municipal issues as of period end serve as an indicator of the current status of the payment/performance risk and represent the likelihood or risk of default for the credit derivative. The implied credit spread of a particular referenced entity reflects the cost of buying/selling protection and may include upfront payments required to be made to enter into the agreement. Wider credit spreads represent a deterioration of the referenced entity’s credit soundness and a greater likelihood or risk of default or other credit event occurring as defined under the terms of the agreement. |
| (3) | The maximum potential amount the Portfolio could be required to pay as a seller of credit protection or receive as a buyer of credit protection if a credit event occurs as defined under the terms of that particular swap agreement. |
| (4) | The prices and resulting values for credit default swap agreements on credit indices serve as an indicator of the current status of the payment/performance risk and represent the likelihood of an expected liability (or profit) for the credit derivative should the notional amount of the swap agreement be closed/sold as of the period end. Increasing market values, in absolute terms when compared to the notional amount of the swap, represent a deterioration of the referenced indices’ credit soundness and a greater likelihood or risk of default or other credit event occurring as defined under the terms of the agreement. |
INTEREST RATE SWAPS
| | | | | | | | | | | | | | | | | | | | | | | | | | | | | | | | | | | | |
| Counterparty | | Pay/
Receive
Floating
Rate | | Floating Rate Index | | Fixed
Rate | | | Maturity
Date | | | Notional
Amount | | | Premiums
Paid/(Received) | | | Unrealized
Appreciation | | | Swap Agreements,
at Value | |
| | | | | | | | | Asset | | | Liability | |
BOA | | Pay | | 28-Day MXN-TIIE | | | 8.300% | | | | 02/07/2019 | | | | MXN | | | | 40,400 | | | $ | 0 | | | $ | 174 | | | $ | 174 | | | $ | 0 | |
| | | | | | | | | | | | | | | | | | | | | | | | | | | | | | | | | | | | |
Total Swap Agreements | | | | | | | | | | | | | | | | | | $ | 240 | | | $ | 1,061 | | | $ | 1,301 | | | $ | 0 | |
| | | | | | | | | | | | | | | | | | | | | | | | | | | | | | | | | | | | |
FINANCIAL DERIVATIVE INSTRUMENTS: OVER THE COUNTER SUMMARY
The following is a summary by counterparty of the market value of OTC financial derivative instruments and collateral (received)/pledged as of June 30, 2016:
| (k) | Securities with an aggregate market value of $2,402 have been pledged as collateral for financial derivative instruments as governed by International Swaps and Derivatives Association, Inc. master agreements as of June 30, 2016. |
| | | | | | | | | | | | | | | | | | | | | | | | | | | | | | | | | | | | | | | | | | | | | | | | |
| | | Financial Derivative Assets | | | | | | Financial Derivative Liabilities | | | | | | | | | | |
| Counterparty | | Forward
Foreign
Currency
Contracts | | | Purchased
Options | | | Swap
Agreements | | | Total
Over
the
Counter | | | | | | Forward
Foreign
Currency
Contracts | | | Written
Options | | | Swap
Agreements | | | Total
Over
the
Counter | | | Net Market
Value of
OTC
Derivatives | | | Collateral
(Received)/
Pledged | | | Net
Exposure (5) | |
BOA | | $ | 5,029 | | | $ | 0 | | | $ | 174 | | | $ | 5,203 | | | | | | | $ | (294 | ) | | $ | 0 | | | $ | 0 | | | $ | (294 | ) | | $ | 4,909 | | | $ | (4,520 | ) | | $ | 389 | |
BPS | | | 0 | | | | 936 | | | | 0 | | | | 936 | | | | | | | | (151 | ) | | | (95 | ) | | | 0 | | | | (246 | ) | | | 690 | | | | (909 | ) | | | (219 | ) |
CBK | | | 3 | | | | 0 | | | | 18 | | | | 21 | | | | | | | | (227 | ) | | | 0 | | | | 0 | | | | (227 | ) | | | (206 | ) | | | 0 | | | | (206 | ) |
DUB | | | 0 | | | | 0 | | | | 131 | | | | 131 | | | | | | | | 0 | | | | 0 | | | | 0 | | | | 0 | | | | 131 | | | | (70 | ) | | | 61 | |
GLM | | | 619 | | | | 0 | | | | 0 | | | | 619 | | | | | | | | (515 | ) | | | 0 | | | | 0 | | | | (515 | ) | | | 104 | | | | (50 | ) | | | 54 | |
GST | | | 0 | | | | 0 | | | | 978 | | | | 978 | | | | | | | | 0 | | | | 0 | | | | 0 | | | | 0 | | | | 978 | | | | (1,240 | ) | | | (262 | ) |
JPM | | | 10 | | | | 0 | | | | 0 | | | | 10 | | | | | | | | (121 | ) | | | 0 | | | | 0 | | | | (121 | ) | | | (111 | ) | | | 186 | | | | 75 | |
MSB | | | 0 | | | | 0 | | | | 0 | | | | 0 | | | | | | | | (1,631 | ) | | | 0 | | | | 0 | | | | (1,631 | ) | | | (1,631 | ) | | | 1,931 | | | | 300 | |
SCX | | | 360 | | | | 0 | | | | 0 | | | | 360 | | | | | | | | (355 | ) | | | 0 | | | | 0 | | | | (355 | ) | | | 5 | | | | 0 | | | | 5 | |
SOG | | | 1 | | | | 0 | | | | 0 | | | | 1 | | | | | | | | (1 | ) | | | 0 | | | | 0 | | | | (1 | ) | | | 0 | | | | 0 | | | | 0 | |
UAG | | | 22 | | | | 0 | | | | 0 | | | | 22 | | | | | | | | (165 | ) | | | 0 | | | | 0 | | | | (165 | ) | | | (143 | ) | | | 285 | | | | 142 | |
| | | | | | | | | | | | | | | | | | | | | | | | | | | | | | | | | | | | | | | | | | | | | | | | |
Total Over the Counter | | $ | 6,044 | | | $ | 936 | | | $ | 1,301 | | | $ | 8,281 | | | | | | | $ | (3,460 | ) | | $ | (95 | ) | | $ | 0 | | | $ | (3,555 | ) | | | | | | | | | | | | |
| | | | | | | | | | | | | | | | | | | | | | | | | | | | | | | | | | | | | | | | | | | | | | | | |
| (5) | Net Exposure represents the net receivable/(payable) that would be due from/to the counterparty in the event of default. Exposure from OTC financial derivative instruments can only be netted across transactions governed under the same master agreement with the same legal entity. See Note 7, Principal Risks, in the Notes to Financial Statements for more information regarding master netting arrangements. |
| | | | | | |
| 82 | | PIMCO MANAGED ACCOUNTS TRUST | | | | See Accompanying Notes |
(Unaudited)
June 30, 2016
FAIR VALUE OF FINANCIAL DERIVATIVE INSTRUMENTS
The following is a summary of the fair valuation of the Portfolio’s derivative instruments categorized by risk exposure. See Note 7, Principal Risks, in the Notes to Financial Statements on risks of the Portfolio.
Fair Values of Financial Derivative Instruments on the Statements of Assets and Liabilities as of June 30, 2016:
| | | | | | | | | | | | | | | | | | | | | | | | |
| | | Derivatives not accounted for as hedging instruments | |
| | | Commodity
Contracts | | | Credit
Contracts | | | Equity
Contracts | | | Foreign
Exchange
Contracts | | | Interest
Rate Contracts | | | Total | |
Financial Derivative Instruments - Assets | | | | | | | | | | | | | | | | | | | | | | | | |
Exchange-traded or centrally cleared | | | | | | | | | | | | | | | | | | | | | | | | |
Purchased Options | | $ | 0 | | | $ | 0 | | | $ | 0 | | | $ | 0 | | | $ | 1 | | | $ | 1 | |
Futures | | | 0 | | | | 0 | | | | 0 | | | | 0 | | | | 471 | | | | 471 | |
Swap Agreements | | | 0 | | | | 539 | | | | 0 | | | | 0 | | | | 584 | | | | 1,123 | |
| | | | | | | | | | | | | | | | | | | | | | | | |
| | $ | 0 | | | $ | 539 | | | $ | 0 | | | $ | 0 | | | $ | 1,056 | | | $ | 1,595 | |
| | | | | | | | | | | | | | | | | | | | | | | | |
Over the counter | | | | | | | | | | | | | | | | | | | | | | | | |
Forward Foreign Currency Contracts | | $ | 0 | | | $ | 0 | | | $ | 0 | | | $ | 6,044 | | | $ | 0 | | | $ | 6,044 | |
Purchased Options | | | 0 | | | | 0 | | | | 0 | | | | 936 | | | | 0 | | | | 936 | |
Swap Agreements | | | 0 | | | | 1,127 | | | | 0 | | | | 0 | | | | 174 | | | | 1,301 | |
| | | | | | | | | | | | | | | | | | | | | | | | |
| | $ | 0 | | | $ | 1,127 | | | $ | 0 | | | $ | 6,980 | | | $ | 174 | | | $ | 8,281 | |
| | | | | | | | | | | | | | | | | | | | | | | | |
| | $ | 0 | | | $ | 1,666 | | | $ | 0 | | | $ | 6,980 | | | $ | 1,230 | | | $ | 9,876 | |
| | | | | | | | | | | | | | | | | | | | | | | | |
| | | | | |
Financial Derivative Instruments - Liabilities | | | | | | | | | | | | | | | | | | | | | |
Exchange-traded or centrally cleared | | | | | | | | | | | | | | | | | | | | | | | | |
Futures | | $ | 0 | | | $ | 0 | | | $ | 0 | | | $ | 0 | | | $ | 1,312 | | | $ | 1,312 | |
Swap Agreements | | | 0 | | | | 190 | | | | 0 | | | | 0 | | | | 368 | | | | 558 | |
| | | | | | | | | | | | | | | | | | | | | | | | |
| | $ | 0 | | | $ | 190 | | | $ | 0 | | | $ | 0 | | | $ | 1,680 | | | $ | 1,870 | |
| | | | | | | | | | | | | | | | | | | | | | | | |
Over the counter | | | | | | | | | | | | | | | | | | | | | | | | |
Forward Foreign Currency Contracts | | $ | 0 | | | $ | 0 | | | $ | 0 | | | $ | 3,460 | | | $ | 0 | | | $ | 3,460 | |
Written Options | | | 0 | | | | 0 | | | | 0 | | | | 95 | | | | 0 | | | | 95 | |
| | | | | | | | | | | | | | | | | | | | | | | | |
| | $ | 0 | | | $ | 0 | | | $ | 0 | | | $ | 3,555 | | | $ | 0 | | | $ | 3,555 | |
| | | | | | | | | | | | | | | | | | | | | | | | |
| | $ | 0 | | | $ | 190 | | | $ | 0 | | | $ | 3,555 | | | $ | 1,680 | | | $ | 5,425 | |
| | | | | | | | | | | | | | | | | | | | | | | | |
The effect of Financial Derivative Instruments on the Statements of Operations for the period ended June 30, 2016:
| | | | | | | | | | | | | | | | | | | | | | | | |
| | | Derivatives not accounted for as hedging instruments | |
| | | Commodity
Contracts | | | Credit
Contracts | | | Equity
Contracts | | | Foreign
Exchange
Contracts | | | Interest
Rate Contracts | | | Total | |
Net Realized Gain (Loss) on Financial Derivative Instruments | |
Exchange-traded or centrally cleared | | | | | | | | | | | | | | | | | | | | | | | | |
Purchased Options | | $ | 0 | | | $ | 0 | | | $ | 0 | | | $ | 0 | | | $ | (4 | ) | | $ | (4 | ) |
Futures | | | 0 | | | | 0 | | | | 0 | | | | 0 | | | | 26,635 | | | | 26,635 | |
Swap Agreements | | | 0 | | | | 1,256 | | | | 0 | | | | 0 | | | | (44,294 | ) | | | (43,038 | ) |
| | | | | | | | | | | | | | | | | | | | | | | | |
| | $ | 0 | | | $ | 1,256 | | | $ | 0 | | | $ | 0 | | | $ | (17,663 | ) | | $ | (16,407 | ) |
| | | | | | | | | | | | | | | | | | | | | | | | |
Over the counter | | | | | | | | | | | | | | | | | | | | | | | | |
Forward Foreign Currency Contracts | | $ | 0 | | | $ | 0 | | | $ | 0 | | | $ | (3,792 | ) | | $ | 0 | | | $ | (3,792 | ) |
Purchased Options | | | 0 | | | | 0 | | | | 0 | | | | 0 | | | | (88 | ) | | | (88 | ) |
Written Options | | | 0 | | | | 1,063 | | | | 0 | | | | 0 | | | | 0 | | | | 1,063 | |
Swap Agreements | | | 0 | | | | 674 | | | | 0 | | | | 0 | | | | 55 | | | | 729 | |
| | | | | | | | | | | | | | | | | | | | | | | | |
| | $ | 0 | | | $ | 1,737 | | | $ | 0 | | | $ | (3,792 | ) | | $ | (33 | ) | | $ | (2,088 | ) |
| | | | | | | | | | | | | | | | | | | | | | | | |
| | $ | 0 | | | $ | 2,993 | | | $ | 0 | | | $ | (3,792 | ) | | $ | (17,696 | ) | | $ | (18,495 | ) |
| | | | | | | | | | | | | | | | | | | | | | | | |
| | | | | | |
| See Accompanying Notes | | SEMIANNUAL REPORT | | JUNE 30, 2016 | | 83 |
Schedule of Investments PIMCO Fixed Income SHares: Series M (Cont.)
| | | | | | | | | | | | | | | | | | | | | | | | |
| | | Derivatives not accounted for as hedging instruments | |
| | | Commodity
Contracts | | | Credit
Contracts | | | Equity
Contracts | | | Foreign
Exchange
Contracts | | | Interest
Rate Contracts | | | Total | |
Net Change in Unrealized Appreciation (Depreciation) on Financial Derivative Instruments | |
Exchange-traded or centrally cleared | | | | | | | | | | | | | | | | | | | | | | | | |
Purchased Options | | $ | 0 | | | $ | 0 | | | $ | 0 | | | $ | 0 | | | $ | (8 | ) | | $ | (8 | ) |
Futures | | | 0 | | | | 0 | | | | 0 | | | | 0 | | | | (20,159 | ) | | | (20,159 | ) |
Swap Agreements | | | 0 | | | | 2,313 | | | | 0 | | | | 0 | | | | (4,456 | ) | | | (2,143 | ) |
| | | | | | | | | | | | | | | | | | | | | | | | |
| | $ | 0 | | | $ | 2,313 | | | $ | 0 | | | $ | 0 | | | $ | (24,623 | ) | | $ | (22,310 | ) |
| | | | | | | | | | | | | | | | | | | | | | | | |
Over the counter | | | | | | | | | | | | | | | | | | | | | | | | |
Forward Foreign Currency Contracts | | $ | 0 | | | $ | 0 | | | $ | 0 | | | $ | 3,264 | | | $ | 0 | | | $ | 3,264 | |
Purchased Options | | | 0 | | | | 0 | | | | 0 | | | | (1,294 | ) | | | (9 | ) | | | (1,303 | ) |
Written Options | | | 0 | | | | (245 | ) | | | 0 | | | | 800 | | | | 0 | | | | 555 | |
Swap Agreements | | | 0 | | | | (346 | ) | | | 0 | | | | 0 | | | | (71 | ) | | | (417 | ) |
| | | | | | | | | | | | | | | | | | | | | | | | |
| | $ | 0 | | | $ | (591 | ) | | $ | 0 | | | $ | 2,770 | | | $ | (80 | ) | | $ | 2,099 | |
| | | | | | | | | | | | | | | | | | | | | | | | |
| | $ | 0 | | | $ | 1,722 | | | $ | 0 | | | $ | 2,770 | | | $ | (24,703 | ) | | $ | (20,211 | ) |
| | | | | | | | | | | | | | | | | | | | | | | | |
FAIR VALUE MEASUREMENTS
The following is a summary of the fair valuations according to the inputs used as of June 30, 2016 in valuing the Portfolio’s assets and liabilities:
| | | | | | | | | | | | | | | | |
| Category and Subcategory | | Level 1 | | | Level 2 | | | Level 3 | | | Fair
Value at
06/30/2016 | |
Investments in Securities, at Value | | | | | | | | | |
Corporate Bonds & Notes | | | | | | | | | | | | | | | | |
Banking & Finance | | $ | 0 | | | $ | 349,479 | | | $ | 26,872 | | | $ | 376,351 | |
Industrials | | | 0 | | | | 118,363 | | | | 0 | | | | 118,363 | |
Utilities | | | 0 | | | | 100,520 | | | | 0 | | | | 100,520 | |
Municipal Bonds & Notes | | | | | | | | | | | | | | | | |
California | | | 0 | | | | 200,403 | | | | 0 | | | | 200,403 | |
Illinois | | | 0 | | | | 16,545 | | | | 0 | | | | 16,545 | |
Massachusetts | | | 0 | | | | 841 | | | | 0 | | | | 841 | |
Michigan | | | 0 | | | | 1,592 | | | | 0 | | | | 1,592 | |
New Jersey | | | 0 | | | | 1,465 | | | | 0 | | | | 1,465 | |
New York | | | 0 | | | | 87,665 | | | | 0 | | | | 87,665 | |
Ohio | | | 0 | | | | 17,670 | | | | 0 | | | | 17,670 | |
Pennsylvania | | | 0 | | | | 10,782 | | | | 0 | | | | 10,782 | |
Tennessee | | | 0 | | | | 140 | | | | 0 | | | | 140 | |
Virginia | | | 0 | | | | 16,144 | | | | 0 | | | | 16,144 | |
Washington | | | 0 | | | | 9,356 | | | | 0 | | | | 9,356 | |
West Virginia | | | 0 | | | | 28,096 | | | | 0 | | | | 28,096 | |
U.S. Government Agencies | | | 0 | | | | 649,188 | | | | 0 | | | | 649,188 | |
U.S. Treasury Obligations | | | 0 | | | | 560,366 | | | | 0 | | | | 560,366 | |
Non-Agency Mortgage-Backed Securities | | | 0 | | | | 212,621 | | | | 0 | | | | 212,621 | |
Asset-Backed Securities | | | 0 | | | | 182,469 | | | | 5 | | | | 182,474 | |
Sovereign Issues | | | 0 | | | | 1,403 | | | | 0 | | | | 1,403 | |
Short-Term Instruments | | | | | | | | | | | | | | | | |
Repurchase Agreements | | | 0 | | | | 17,176 | | | | 0 | | | | 17,176 | |
U.S. Treasury Bills | | | 0 | | | | 202 | | | | 0 | | | | 202 | |
| | | | |
Total Investments | | $ | 0 | | | $ | 2,582,486 | | | $ | 26,877 | | | $ | 2,609,363 | |
| | | | |
Short Sales, at Value - Liabilities | | | | | | | | | | | | | | | | |
| U.S. Government Agencies | | $ | 0 | | | $ | (6,313 | ) | | $ | 0 | | | $ | (6,313 | ) |
| | | | | | |
| 84 | | PIMCO MANAGED ACCOUNTS TRUST | | | | See Accompanying Notes |
(Unaudited)
June 30, 2016
| | | | | | | | | | | | | | | | |
| Category and Subcategory | | Level 1 | | | Level 2 | | | Level 3 | | | Fair
Value at
06/30/2016 | |
Financial Derivative Instruments - Assets | | | | | | | | | | | | | | | | |
Exchange-traded or centrally cleared | | | 471 | | | | 834 | | | | 0 | | | | 1,305 | |
Over the counter | | | 0 | | | | 8,281 | | | | 0 | | | | 8,281 | |
| | $ | 471 | | | $ | 9,115 | | | $ | 0 | | | $ | 9,586 | |
| | | | |
Financial Derivative Instruments - Liabilities | | | | | | | | | | | | | | | | |
Exchange-traded or centrally cleared | | | (1,072 | ) | | | (558 | ) | | | 0 | | | | (1,630 | ) |
Over the counter | | | 0 | | | | (3,555 | ) | | | 0 | | | | (3,555 | ) |
| | $ | (1,072 | ) | | $ | (4,113 | ) | | $ | 0 | | | $ | (5,185 | ) |
| | | | |
Totals | | $ | (601 | ) | | $ | 2,581,175 | | | $ | 26,877 | | | $ | 2,607,451 | |
There were no significant transfers between Level 1 and 2 during the period ended June 30, 2016.
The following is a reconciliation of the fair valuations using significant unobservable inputs (Level 3) for the Portfolio during the period ended June 30, 2016:
| | | | | | | | | | | | | | | | | | | | | | | | | | | | | | | | | | | | | | | | |
| Category and Subcategory | | Beginning
Balance
at
12/31/2015 | | | Net
Purchases | | | Net
Sales | | | Accrued
Discounts/
(Premiums) | | | Realized
Gain/
(Loss) | | | Net
Change
in
Unrealized
Appreciation/
(Depreciation) (1) | | | Transfers
into
Level 3 | | | Transfers
out
of
Level 3 | | | Ending
Balance
at
06/30/2016 | | | Net
Change
in
Unrealized
Appreciation/
(Depreciation)
on
Investments
Held
at
06/30/2016 (1) | |
Investments in Securities, at Value | | | | | | | | | | | | | | | | | | | | | | | | | |
Corporate Bonds &
Notes | | | | | | | | | | | | | | | | | | | | | | | | | | | | | | | | | | | | | | | | |
Banking &
Finance | | $ | 96,105 | | | $ | 3,223 | | | $ | (13,689 | ) | | $ | 9 | | | $ | 69 | | | $ | 1,804 | | | $ | 11,122 | | | $ | (71,771 | ) | | $ | 26,872 | | | $ | 1,532 | |
Non-Agency Mortgage-Backed
Securities | | | 2,064 | | | | 0 | | | | (1,202 | ) | | | 1 | | | | 11 | | | | 4 | | | | 0 | | | | (878 | ) | | | 0 | | | | 0 | |
Asset-Backed
Securities | | | 0 | | | | 0 | | | | 0 | | | | 0 | | | | 0 | | | | 5 | | | | 0 | | | | 0 | | | | 5 | | | | 4 | |
| | | | | | | | | | | | | | | | | | | | | | | | | | | | | | | | | | | | | | | | |
Totals | | $ | 98,169 | | | $ | 3,223 | | | $ | (14,891 | ) | | $ | 10 | | | $ | 80 | | | $ | 1,813 | | | $ | 11,122 | | | $ | (72,649 | ) | | $ | 26,877 | | | $ | 1,536 | |
| | | | | | | | | | | | | | | | | | | | | | | | | | | | | | | | | | | | | | | | |
The following is a summary of significant unobservable inputs used in the fair valuations of assets and liabilities categorized within Level 3 of the fair value hierarchy:
| | | | | | | | | | | | | | | | | | | | |
| Category and Subcategory | | Ending
Balance
at 06/30/2016 | | Valuation
Technique | | Unobservable
Inputs | | Input Value(s)
(% Unless
Noted
Otherwise) |
Investments in Securities, at Value | | | | | | | | | | | | | | | | | | | | |
Corporate Bonds & Notes | | | | | | | | | | | | | | | | | | | | |
Banking & Finance | | | $ | 11,122 | | | | | Third Party Vendor | | | | | Broker Quote | | | | | 111.22 | |
| | | | 15,750 | | | | | Reference Instrument | | | | | Spread Movement | | | | | 324.53 bps | |
Asset-Backed Securities | | | | 5 | | | | | Proxy Pricing | | | | | Base Price | | | | | 79.00 | |
| | | | | | | | | | | | | | | | | | | | |
Total | | | $ | 26,877 | | | | | | | | | | | | | | | | |
| | | | | | | | | | | | | | | | | | | | |
| (1) | Any difference between Net Change in Unrealized Appreciation/(Depreciation) and Net Change in Unrealized Appreciation/(Depreciation) on Investments Held at June 30, 2016 may be due to an investment no longer held or categorized as Level 3 at period end. |
| | | | | | |
| See Accompanying Notes | | SEMIANNUAL REPORT | | JUNE 30, 2016 | | 85 |
Schedule of Investments PIMCO Fixed Income SHares: Series R
| | | | | | | | | | | | |
| | | | | PRINCIPAL
AMOUNT
(000S) | | | | | MARKET
VALUE
(000S) | |
| INVESTMENTS IN SECURITIES 182.3% | |
| | | | | | | | | | | | |
| CORPORATE BONDS & NOTES 16.7% | |
| | | | | | | | | | | | |
| BANKING & FINANCE 12.9% | |
Ally Financial, Inc. | |
3.250% due 02/13/2018 | | $ | | | 700 | | | $ | | | 702 | |
5.500% due 02/15/2017 | | | | | 4,700 | | | | | | 4,778 | |
Banco Popular Espanol S.A. | |
11.500% due 10/10/2018 (d) | | EUR | | | 600 | | | | | | 662 | |
Bank of America Corp. | |
5.650% due 05/01/2018 | | $ | | | 500 | | | | | | 536 | |
Bank of America N.A. | |
1.750% due 06/05/2018 | | | | | 2,200 | | | | | | 2,215 | |
Barclays Bank PLC | |
7.625% due 11/21/2022 | | | | | 700 | | | | | | 755 | |
Barclays PLC | |
6.500% due 09/15/2019 (d) | | EUR | | | 200 | | | | | | 197 | |
Goldman Sachs Group, Inc. | |
1.853% due 09/15/2020 | | $ | | | 1,700 | | | | | | 1,698 | |
HSBC Holdings PLC | |
2.950% due 05/25/2021 | | | | | 1,300 | | | | | | 1,314 | |
3.600% due 05/25/2023 | | | | | 600 | | | | | | 614 | |
Lloyds Bank PLC | |
1.750% due 05/14/2018 | | | | | 850 | | | | | | 848 | |
National Bank of Greece S.A. | |
3.875% due 10/07/2016 | | EUR | | | 400 | | | | | | 443 | |
Realkredit Danmark A/S | |
1.000% due 01/01/2017 | | DKK | | | 2,600 | | | | | | 391 | |
UBS Group Funding Jersey Ltd. | |
2.950% due 09/24/2020 | | $ | | | 2,000 | | | | | | 2,036 | |
UniCredit SpA | |
6.750% due 09/10/2021 (d) | | EUR | | | 1,400 | | | | | | 1,250 | |
| | | | | | | | | | | | |
| | | | | | | | | | | 18,439 | |
| | | | | | | | | | | | |
| | | | | | | | | | | | |
| INDUSTRIALS 3.0% | |
Zimmer Biomet Holdings, Inc. | |
1.450% due 04/01/2017 | | $ | | | 1,600 | | | | | | 1,601 | |
2.000% due 04/01/2018 | | | | | 2,700 | | | | | | 2,724 | |
| | | | | | | | | | | | |
| | | | | | | | | | | 4,325 | |
| | | | | | | | | | | | |
| | | | | | | | | | | | |
| UTILITIES 0.8% | |
Petrobras Global Finance BV | |
2.768% due 01/15/2019 | | | | | 200 | | | | | | 181 | |
3.000% due 01/15/2019 | | | | | 94 | | | | | | 88 | |
4.375% due 05/20/2023 | | | | | 1,000 | | | | | | 815 | |
| | | | | | | | | | | | |
| | | | | | | | | | | 1,084 | |
| | | | | | | | | | | | |
Total Corporate Bonds & Notes (Cost $24,338) | | | 23,848 | |
| | | | | | | | | | | | |
| | | | | | | | | | | | |
| | | | | PRINCIPAL
AMOUNT
(000S) | | | | | MARKET
VALUE
(000S) | |
| U.S. GOVERNMENT AGENCIES 18.7% | |
Fannie Mae | |
0.898% due 02/25/2037 | | $ | | | 100 | | | $ | | | 100 | |
1.610% due 10/01/2044 | | | | | 7 | | | | | | 7 | |
Fannie Mae, TBA | |
3.000% due 08/01/2046 | | | | | 6,000 | | | | | | 6,216 | |
3.500% due 07/01/2046 - 08/01/2046 | | | | | 17,000 | | | | | | 17,914 | |
Freddie Mac | |
2.240% due 09/01/2036 | | | | | 110 | | | | | | 116 | |
2.339% due 07/01/2036 | | | | | 89 | | | | | | 94 | |
NCUA Guaranteed Notes | |
0.835% due 11/06/2017 | | | | | 2,122 | | | | | | 2,123 | |
2.650% due 10/29/2020 | | | | | 224 | | | | | | 224 | |
| | | | | | | | | | | | |
Total U.S. Government Agencies (Cost $26,699) | | | 26,794 | |
| | | | | | | | | | | | |
| | | | | | | | | | | | |
| U.S. TREASURY OBLIGATIONS 107.9% | |
U.S. Treasury Bonds | |
2.500% due 02/15/2046 (f) | | | | | 4,770 | | | | | | 4,972 | |
2.500% due 05/15/2046 (f) | | | | | 1,400 | | | | | | 1,461 | |
3.000% due 11/15/2044 (j) | | | | | 300 | | | | | | 345 | |
3.000% due 11/15/2045 (j) | | | | | 50 | | | | | | 57 | |
3.000% due 05/15/2045 (j) | | | | | 220 | | | | | | 253 | |
U.S. Treasury Inflation Protected Securities (c) | |
0.125% due 04/15/2018 (f)(h)(j) | | | 27,424 | | | | | | 27,844 | |
0.125% due 04/15/2019 (f) | | | | | 3,185 | | | | | | 3,254 | |
0.125% due 04/15/2020 | | | | | 5,312 | | | | | | 5,437 | |
0.125% due 01/15/2022 (f) | | | | | 7,821 | | | | | | 7,982 | |
0.125% due 01/15/2023 | | | | | 7,566 | | | | | | 7,675 | |
0.250% due 01/15/2025 | | | | | 1,212 | | | | | | 1,232 | |
0.625% due 07/15/2021 | | | | | 1,518 | | | | | | 1,599 | |
0.625% due 01/15/2024 | | | | | 4,306 | | | | | | 4,514 | |
0.750% due 02/15/2042 (j) | | | | | 2,583 | | | | | | 2,596 | |
0.750% due 02/15/2045 (j) | | | | | 1,087 | | | | | | 1,095 | |
1.000% due 02/15/2046 (j) | | | | | 2,433 | | | | | | 2,632 | |
1.250% due 07/15/2020 (j) | | | | | 1,503 | | | | | | 1,617 | |
1.375% due 02/15/2044 (f)(j) | | | 11,548 | | | | | | 13,383 | |
1.750% due 01/15/2028 (f) | | | | | 20,748 | | | | | | 24,293 | |
1.875% due 07/15/2019 (f) | | | | | 8,515 | | | | | | 9,219 | |
2.125% due 02/15/2040 (j) | | | | | 266 | | | | | | 348 | |
2.125% due 02/15/2041 | | | | | 1,529 | | | | | | 2,022 | |
2.375% due 01/15/2025 (f) | | | | | 7,539 | | | | | | 9,012 | |
2.375% due 01/15/2027 (j) | | | | | 178 | | | | | | 219 | |
2.500% due 01/15/2029 (f) | | | | | 10,697 | | | | | | 13,575 | |
2.625% due 07/15/2017 (h)(j) | | | 1,847 | | | | | | 1,923 | |
3.625% due 04/15/2028 (j) | | | | | 4,141 | | | | | | 5,739 | |
U.S. Treasury Notes | |
1.625% due 02/15/2026 | | | | | 40 | | | | | | 40 | |
| | | | | | | | | | | | |
Total U.S. Treasury Obligations (Cost $150,596) | | | | | | 154,338 | |
| | | | | | | | | | | | |
| | | | | | |
| 86 | | PIMCO MANAGED ACCOUNTS TRUST | | | | See Accompanying Notes |
(Unaudited)
June 30, 2016
| | | | | | | | | | | | |
| | | | | PRINCIPAL
AMOUNT
(000S) | | | | | MARKET
VALUE
(000S) | |
| NON-AGENCY MORTGAGE-BACKED SECURITIES 4.1% | |
Bear Stearns Adjustable Rate Mortgage Trust | |
2.380% due 08/25/2035 | | $ | | | 14 | | | $ | | | 14 | |
2.924% due 03/25/2035 | | | | | 10 | | | | | | 11 | |
3.090% due 03/25/2035 | | | | | 41 | | | | | | 41 | |
Citigroup Mortgage Loan Trust, Inc. | |
2.430% due 09/25/2035 | | | | | 16 | | | | | | 16 | |
2.760% due 09/25/2035 | | | | | 27 | | | | | | 27 | |
3.028% due 09/25/2037 ^ | | | | | 506 | | | | | | 463 | |
Countrywide Alternative Loan Trust | |
0.643% due 12/20/2046 ^ | | | | | 1,506 | | | | | | 1,099 | |
1.437% due 02/25/2036 | | | | | 386 | | | | | | 339 | |
Countrywide Home Loan Mortgage Pass-Through Trust | |
2.603% due 04/20/2035 | | | | | 375 | | | | | | 372 | |
Countrywide Home Loan Reperforming REMIC Trust | |
0.793% due 06/25/2035 | | | | | 11 | | | | | | 10 | |
Grifonas Finance PLC | |
0.152% due 08/28/2039 | | EUR | | | 208 | | | | | | 166 | |
GSR Mortgage Loan Trust | |
2.876% due 09/25/2035 | | $ | | | 57 | | | | | | 58 | |
IndyMac Mortgage Loan Trust | |
1.293% due 05/25/2034 | | | | | 1,863 | | | | | | 1,652 | |
Marche Mutui SRL | |
0.175% due 02/25/2055 | | EUR | | | 108 | | | | | | 118 | |
2.001% due 01/27/2064 | | | | | 180 | | | | | | 201 | |
Merrill Lynch Mortgage Investors Trust | |
2.228% due 10/25/2035 | | $ | | | 390 | | | | | | 379 | |
Morgan Stanley Capital Trust | |
5.809% due 12/12/2049 | | | | | 414 | | | | | | 430 | |
Residential Accredit Loans, Inc. Trust | |
0.633% due 06/25/2046 | | | | | 295 | | | | | | 120 | |
Swan Trust | |
3.140% due 04/25/2041 | | AUD | | | 359 | | | | | | 268 | |
| | | | | | | | | | | | |
Total Non-Agency Mortgage-Backed Securities (Cost $5,580) | | | 5,784 | |
| | | | | | | | | | | | |
| | | | | | | | | | | | |
| ASSET-BACKED SECURITIES 7.7% | |
Bear Stearns Asset-Backed Securities Trust | |
1.453% due 10/25/2037 | | $ | | | 217 | | | | | | 201 | |
2.553% due 03/25/2035 | | | | | 1,190 | | | | | | 1,125 | |
CIFC Funding Ltd. | |
1.587% due 01/19/2023 | | | | | 536 | | | | | | 536 | |
Citigroup Mortgage Loan Trust, Inc. | |
0.533% due 01/25/2037 | | | | | 300 | | | | | | 192 | |
0.743% due 10/25/2036 | | | | | 2,600 | | | | | | 2,324 | |
1.428% due 05/25/2035 | | | | | 416 | | | | | | 396 | |
Fraser Sullivan CLO Ltd. | |
1.709% due 04/20/2023 | | | | | 648 | | | | | | 645 | |
GSAMP Trust | |
0.593% due 06/25/2036 | | | | | 475 | | | | | | 407 | |
| | | | | | | | | | | | |
| | | | | PRINCIPAL
AMOUNT
(000S) | | | | | MARKET
VALUE
(000S) | |
Highlander Euro CDO BV | |
0.069% due 05/01/2023 | | EUR | | | 1,469 | | | $ | | | 1,602 | |
Massachusetts Educational Financing Authority | |
1.588% due 04/25/2038 | | $ | | | 102 | | | | | | 101 | |
Nomura Home Equity Loan, Inc. Home Equity Loan Trust | |
0.743% due 03/25/2036 | | | | | 400 | | | | | | 301 | |
NovaStar Mortgage Funding Trust | |
0.893% due 01/25/2036 | | | | | 1,100 | | | | | | 907 | |
Park Place Securities, Inc. Asset-Backed Pass-Through Certificates | |
1.533% due 03/25/2035 | | | | | 300 | | | | | | 277 | |
RAAC Trust | |
0.793% due 08/25/2036 | | | | | 100 | | | | | | 88 | |
Residential Asset Securities Corp. Trust | |
0.873% due 12/25/2035 | | | | | 400 | | | | | | 348 | |
Saxon Asset Securities Trust | |
1.173% due 05/25/2035 | | | | | 42 | | | | | | 30 | |
4.034% due 06/25/2033 | | | | | 273 | | | | | | 277 | |
Soundview Home Loan Trust | |
0.713% due 12/25/2035 | | | | | 517 | | | | | | 511 | |
Structured Asset Securities Corp. Mortgage Loan Trust | |
0.583% due 02/25/2037 | | | | | 771 | | | | | | 696 | |
1.453% due 08/25/2037 | | | | | 85 | | | | | | 80 | |
Wood Street CLO BV | |
0.117% due 03/29/2021 | | EUR | | | 8 | | | | | | 9 | |
| | | | | | | | | | | | |
Total Asset-Backed Securities (Cost $10,964) | | | 11,053 | |
| | | | | | | | | | | | |
| | | | | | | | | | | | |
| SOVEREIGN ISSUES 24.1% | |
Athens Urban Transportation Organisation | |
4.851% due 09/19/2016 | | | | | 1,300 | | | | | | 1,434 | |
Brazil Letras do Tesouro Nacional | |
0.000% due 10/01/2016 (a) | | BRL | | | 58,100 | | | | | | 17,479 | |
Denmark Government International Bond | |
0.100% due 11/15/2023 (c) | | DKK | | | 39,445 | | | | | | 6,280 | |
France Government International Bond | |
0.250% due 07/25/2018 (c) | | EUR | | | 104 | | | | | | 119 | |
1.850% due 07/25/2027 (c) | | | | | 641 | | | | | | 924 | |
Japan Government International Bond | |
0.100% due 03/10/2026 (c) | | JPY | | | 109,503 | | | | | | 1,138 | |
0.300% due 09/20/2016 | | | | | 50,000 | | | | | | 485 | |
Mexico Government International Bond | |
4.000% due 11/15/2040 (c) | | MXN | | | 7,353 | | | | | | 441 | |
4.000% due 11/08/2046 (c) | | | | | 39,607 | | | | | | 2,402 | |
4.460% due 06/29/2017 | | | | | 1,200 | | | | | | 66 | |
4.500% due 11/22/2035 (c) | | | | | 4,516 | | | | | | 288 | |
New Zealand Government International Bond | |
2.000% due 09/20/2025 (c) | | NZD | | | 516 | | | | | | 385 | |
| | | | | | |
| See Accompanying Notes | | SEMIANNUAL REPORT | | JUNE 30, 2016 | | 87 |
Schedule of Investments PIMCO Fixed Income SHares: Series R (Cont.)
| | | | | | | | | | | | |
| | | | | PRINCIPAL
AMOUNT
(000S) | | | | | MARKET
VALUE
(000S) | |
2.500% due 09/20/2035 | | NZD | | | 403 | | | $ | | | 323 | |
3.000% due 09/20/2030 | | | | | 1,228 | | | | | | 1,027 | |
United Kingdom Gilt | |
0.125% due 03/22/2046 (c) | | GBP | | | 375 | | | | | | 757 | |
0.125% due 03/22/2058 (c) | | | | | 61 | | | | | | 152 | |
0.125% due 03/22/2068 (c) | | | | | 115 | | | | | | 341 | |
0.375% due 03/22/2062 (c) | | | | | 166 | | | | | | 481 | |
| | | | | | | | | | | | |
Total Sovereign Issues (Cost $33,524) | | | 34,522 | |
| | | | | | | | | | | | |
| | | | | | | | | | | | |
| SHORT-TERM INSTRUMENTS 3.1% | |
| | | | | | | | | | | | |
| REPURCHASE AGREEMENTS (e) 0.6% | |
| | | | | | | | | | | 831 | |
| | | | | | | | | | | | |
| | | | | | | | | | | | |
| | | | | PRINCIPAL
AMOUNT
(000S) | | | | | MARKET
VALUE
(000S) | |
| JAPAN TREASURY BILLS 2.5% | |
(0.240)% due 09/26/2016 (b) | | JPY | | | 370,000 | | | $ | | | 3,585 | |
| | | | | | | | | | | | |
Total Short-Term Instruments
(Cost $4,325) | | | | | | 4,416 | |
| | | | | | | | | | | | |
| |
Total Investments in Securities
(Cost $256,026) | | | | | | 260,755 | |
| |
Total Investments 182.3%
(Cost $256,026) | | | $ | | | 260,755 | |
| | | | | | | | | | | | |
Financial Derivative
Instruments (g)(i) (3.1)%
(Cost or Premiums, net $40) | | | (4,478 | ) |
| | | | | | | | | | | | |
| Other Assets and Liabilities, net (79.2)% | | | | | | (113,226 | ) |
| | | | | | | | | | | | |
| Net Assets 100.0% | | | $ | | | 143,051 | |
| | | | | | | | | | | | |
NOTES TO SCHEDULE OF INVESTMENTS (AMOUNTS IN THOUSANDS*, EXCEPT NUMBER OF CONTRACTS):
| * | A zero balance may reflect actual amounts rounding to less than one thousand. |
| (b) | Coupon represents a yield to maturity. |
| (c) | Principal amount of security is adjusted for inflation. |
| (d) | Perpetual maturity; date shown, if applicable, represents next contractual call date. |
BORROWINGS AND OTHER FINANCING TRANSACTIONS
(e) REPURCHASE AGREEMENTS:
| | | | | | | | | | | | | | | | | | | | | | | | | | | | |
| Counterparty | | Lending
Rate | | Settlement
Date | | | Maturity
Date | | | Principal
Amount | | | Collateralized By | | Collateral
(Received) | | | Repurchase
Agreements,
at Value | | | Repurchase
Agreement
Proceeds
to be
Received (1) | |
BCY | | 0.750% | | | 06/30/2016 | | | | 07/01/2016 | | | $ | 200 | | | U.S. Treasury Notes 1.250% due 06/30/2023 | | $ | (205 | ) | | $ | 200 | | | $ | 200 | |
SSB | | 0.010 | | | 06/30/2016 | | | | 07/01/2016 | | | | 631 | | | U.S. Treasury Notes 2.375% due 12/31/2020 | | | (647 | ) | | | 631 | | | | 631 | |
| | | | | | | | | | | | | | | | | | | | | | | | | | | | |
Total Repurchase Agreements | | | | | $ | (852 | ) | | $ | 831 | | | $ | 831 | |
| | | | | | | | | | | | | | | | | | | | | | | | | | | | |
| (1) | Includes accrued interest. |
SALE-BUYBACK TRANSACTIONS:
| | | | | | | | | | | | | | | | | | | | | | | | |
| Counterparty | | Borrowing
Rate (2) | | | Borrowing
Date | | | Maturity
Date | | | Amount
Borrowed (2) | | | Payable for
Sale-Buyback
Transactions (3) | |
BCY | | | 0.600 | % | | | 06/28/2016 | | | | 07/05/2016 | | | $ | | | | | (4,292 | ) | | $ | (4,292 | ) |
| | | 0.950 | | | | 06/30/2016 | | | | 07/01/2016 | | | | | | | | (1,476 | ) | | | (1,476 | ) |
BPG | | | 0.650 | | | | 06/03/2016 | | | | 08/03/2016 | | | | | | | | (2,926 | ) | | | (2,928 | ) |
| | | | | | |
| 88 | | PIMCO MANAGED ACCOUNTS TRUST | | | | See Accompanying Notes |
(Unaudited)
June 30, 2016
| | | | | | | | | | | | | | | | | | | | | | | | |
| Counterparty | | Borrowing
Rate (2) | | | Borrowing
Date | | | Maturity
Date | | | Amount
Borrowed (2) | | | Payable for
Sale-Buyback
Transactions (3) | |
MSC | | | 0.640 | % | | | 06/07/2016 | | | | 07/07/2016 | | | $ | | | | | (1,990 | ) | | $ | (1,991 | ) |
| | | 0.700 | | | | 06/28/2016 | | | | 07/05/2016 | | | | | | | | (717 | ) | | | (717 | ) |
| | | 1.200 | | | | 06/30/2016 | | | | 07/01/2016 | | | | | | | | (1,725 | ) | | | (1,725 | ) |
TDM | | | 0.580 | | | | 05/19/2016 | | | | 07/14/2016 | | | | | | | | (314 | ) | | | (313 | ) |
| | | 0.590 | | | | 04/18/2016 | | | | 07/14/2016 | | | | | | | | (15,517 | ) | | | (15,536 | ) |
| | | 0.620 | | | | 04/11/2016 | | | | 07/11/2016 | | | | | | | | (41,925 | ) | | | (41,983 | ) |
| | | 0.620 | | | | 04/12/2016 | | | | 07/12/2016 | | | | | | | | (13,411 | ) | | | (13,430 | ) |
| | | 0.620 | | | | 04/13/2016 | | | | 07/13/2016 | | | | | | | | (12,653 | ) | | | (12,670 | ) |
| | | 0.630 | | | | 06/15/2016 | | | | 07/14/2016 | | | | | | | | (107 | ) | | | (107 | ) |
| | | 0.650 | | | | 06/02/2016 | | | | 07/05/2016 | | | | | | | | (6,812 | ) | | | (6,816 | ) |
| | | | | | | | | | | | | | | | | | | | | | | | |
Total Sale-Buyback Transactions | | | | | | | | | | | | | | | $ | (103,984 | ) |
| | | | | | | | | | | | | | | | | | | | | | | | |
| (2) | The average amount of borrowings outstanding during the period ended June 30, 2016 was $(99,679) at a weighted average interest rate of 0.589%. Average borrowings includes reverse repurchase agreements, of which there were none open at period end. |
| (3) | Payable for sale-buyback transactions includes $(19) of deferred price drop. |
BORROWINGS AND OTHER FINANCING TRANSACTIONS SUMMARY
The following is a summary by counterparty of the market value of Borrowings and Other Financing Transactions and collateral (received)/pledged as of June 30, 2016:
| (f) | Securities with an aggregate market value of $105,258 have been pledged as collateral under the terms of the following master agreements as of June 30, 2016. |
| | | | | | | | | | | | | | | | | | | | | | | | |
| Counterparty | | Repurchase
Agreement
Proceeds
to be
Received | | | Payable for
Reverse
Repurchase
Agreements | | | Payable for
Sale-Buyback
Transactions | | | Total
Borrowings and
Other Financing
Transactions | | | Collateral
(Received)/
Pledged | | | Net Exposure (4) | |
Global/Master Repurchase Agreement | | | | | | | | | | | | | | | | | | | | | |
BCY | | $ | 200 | | | $ | 0 | | | $ | 0 | | | $ | 200 | | | $ | (205 | ) | | $ | (5 | ) |
SSB | | | 631 | | | | 0 | | | | 0 | | | | 631 | | | | (647 | ) | | | (16 | ) |
| | | | | | |
Master Securities Forward Transaction Agreement | | | | | | | | | | | | | | | | | | | | | | | | |
BCY | | | 0 | | | | 0 | | | | (5,768 | ) | | | (5,768 | ) | | | 5,703 | | | | (65 | ) |
BPG | | | 0 | | | | 0 | | | | (2,928 | ) | | | (2,928 | ) | | | 2,942 | | | | 14 | |
MSC | | | 0 | | | | 0 | | | | (4,433 | ) | | | (4,433 | ) | | | 4,452 | | | | 19 | |
TDM | | | 0 | | | | 0 | | | | (90,855 | ) | | | (90,855 | ) | | | 92,162 | | | | 1,307 | |
| | | | | | | | | | | | | | | | | | | | | | | | |
Total Borrowings and Other Financing Transactions | | $ | 831 | | | $ | 0 | | | $ | (103,984 | ) | | | | | | | | | | | | |
| | | | | | | | | | | | | | | | | | | | | | | | |
| (4) | Net Exposure represents the net receivable/(payable) that would be due from/to the counterparty in the event of default. Exposure from borrowings and other financing transactions can only be netted across transactions governed under the same master agreement with the same legal entity. See Note 7, Principal Risks, in the Notes to Financial Statements for more information regarding master netting arrangements. |
| | | | | | |
| See Accompanying Notes | | SEMIANNUAL REPORT | | JUNE 30, 2016 | | 89 |
Schedule of Investments PIMCO Fixed Income SHares: Series R (Cont.)
CERTAIN TRANSFERS ACCOUNTED FOR AS SECURED BORROWINGS
Remaining Contractual Maturity of the Agreements
| | | | | | | | | | | | | | | | | | | | |
| | | Overnight and
Continuous | | | Up to 30 days | | | 31-90 days | | | Greater Than 90 days | | | Total | |
Sale-Buyback Transactions | | | | | | | | | | | | | | | | | | | | |
U.S. Treasury Obligations | | $ | (3,201 | ) | | $ | (97,855 | ) | | $ | (2,928 | ) | | $ | 0 | | | $ | (103,984 | ) |
| | | | | | | | | | | | | | | | | | | | |
Total Borrowings | | $ | (3,201 | ) | | $ | (97,855 | ) | | $ | (2,928 | ) | | $ | 0 | | | $ | (103,984 | ) |
| | | | | | | | | | | | | | | | | | | | |
Gross amount of recognized liabilities for sale-buyback financing transactions | | | $ | (103,984 | ) |
| | | | | | | | | | | | | | | | | | | | |
(g) FINANCIAL DERIVATIVE INSTRUMENTS: EXCHANGE-TRADED OR CENTRALLY CLEARED
PURCHASED OPTIONS:
OPTIONS ON EXCHANGE-TRADED FUTURES CONTRACTS
| | | | | | | | | | | | | | | | | | | | |
| Description | | Strike
Price | | | Expiration
Date | | | # of
Contracts | | | Cost | | | Market
Value | |
Put - CBOT U.S. Treasury 5-Year Note September Futures | | $ | 112.250 | | | | 08/26/2016 | | | | 191 | | | $ | 1 | | | $ | 0 | |
Put - CBOT U.S. Treasury 10-Year Note September Futures | | | 115.000 | | | | 08/26/2016 | | | | 206 | | | | 2 | | | | 0 | |
Put - CBOT U.S. Treasury 10-Year Note September Futures | | | 117.000 | | | | 08/26/2016 | | | | 21 | | | | 0 | | | | 0 | |
Call - CBOT U.S. Treasury 30-Year Note Futures | | | 208.000 | | | | 08/26/2016 | | | | 63 | | | | 1 | | | | 0 | |
| | | | | | | | | | | | | | | | | | | | |
| | | | | | | | | | | | | | $ | 4 | | | $ | 0 | |
| | | | | | | | | | | | | | | | | | | | |
Total Purchased Options | | | | | | | | | | | | | | $ | 4 | | | $ | 0 | |
| | | | | | | | | | | | | | | | | | | | |
FUTURES CONTRACTS:
| | | | | | | | | | | | | | | | | | | | | | | | |
| Description | | Type | | | Expiration
Month | | | # of
Contracts | | | Unrealized
Appreciation/
(Depreciation) | | | Variation Margin | |
| | | | | | Asset | | | Liability | |
90-Day Eurodollar December Futures | | | Long | | | | 12/2016 | | | | 123 | | | $ | 53 | | | $ | 5 | | | $ | 0 | |
90-Day Eurodollar December Futures | | | Short | | | | 12/2017 | | | | 123 | | | | (79 | ) | | | 0 | | | | (6 | ) |
Call Options Strike @ EUR 168.000 on Euro-Bund 10-Year Bond August Futures | | | Short | | | | 07/2016 | | | | 18 | | | | 1 | | | | 1 | | | | 0 | |
Call Options Strike @ EUR 170.000 on Euro-Bund 10-Year Bond September Futures | | | Short | | | | 08/2016 | | | | 10 | | | | 2 | | | | 1 | | | | 0 | |
Call Options Strike @ EUR 183.000 on Euro-Bund 10-Year Bond September Futures | | | Long | | | | 08/2016 | | | | 83 | | | | 0 | | | | 0 | | | | 0 | |
Euro-BTP Italy Government Bond September Futures | | | Short | | | | 09/2016 | | | | 1 | | | | 3 | | | | 3 | | | | 0 | |
Euro-Bund 10-Year Bond September Futures | | | Short | | | | 09/2016 | | | | 49 | | | | (201 | ) | | | 1 | | | | (14 | ) |
Euro-OAT France Government 10-Year Bond September Futures | | | Short | | | | 09/2016 | | | | 6 | | | | (19 | ) | | | 0 | | | | (4 | ) |
Japan Government 10-Year Bond September Futures | | | Short | | | | 09/2016 | | | | 1 | | | | (9 | ) | | | 1 | | | | (1 | ) |
Put Options Strike @ GBP 98.000 on United Kingdom 90-Day LIBOR Sterling December Futures | | | Short | | | | 12/2016 | | | | 401 | | | | 8 | | | | 0 | | | | 0 | |
Put Options Strike @ GBP 98.000 on United Kingdom 90-Day LIBOR Sterling June Futures | | | Short | | | | 06/2017 | | | | 99 | | | | 2 | | | | 0 | | | | 0 | |
Put Options Strike @ GBP 98.500 on United Kingdom 90-Day LIBOR Sterling December Futures | | | Long | | | | 12/2016 | | | | 401 | | | | (42 | ) | | | 0 | | | | 0 | |
Put Options Strike @ GBP 98.500 on United Kingdom 90-Day LIBOR Sterling June Futures | | | Long | | | | 06/2017 | | | | 99 | | | | (6 | ) | | | 0 | | | | (1 | ) |
U.S. Treasury 5-Year Note September Futures | | | Long | | | | 09/2016 | | | | 157 | | | | 348 | | | | 12 | | | | 0 | |
U.S. Treasury 10-Year Note September Futures | | | Long | | | | 09/2016 | | | | 200 | | | | 719 | | | | 0 | | | | (16 | ) |
U.S. Treasury 30-Year Bond September Futures | | | Short | | | | 09/2016 | | | | 63 | | | | (581 | ) | | | 41 | | | | 0 | |
| | | | | | | | | | | | | | | | | | | | | | | | |
Total Futures Contracts | | | | | | | | | | | | | | $ | 199 | | | $ | 65 | | | $ | (42 | ) |
| | | | | | | | | | | | | | | | | | | | | | | | |
| | | | | | |
| 90 | | PIMCO MANAGED ACCOUNTS TRUST | | | | See Accompanying Notes |
(Unaudited)
June 30, 2016
SWAP AGREEMENTS:
CREDIT DEFAULT SWAPS ON CREDIT INDICES - BUY PROTECTION (1)
| | | | | | | | | | | | | | | | | | | | | | | | | | | | | | | | |
Index/Tranches | | Fixed
(Pay) Rate | | | Maturity
Date | | | Notional
Amount (2) | | | Market
Value (3) | | | Unrealized
(Depreciation) | | | Variation Margin | |
| | | | | | | Asset | | | Liability | |
CDX.HY-26 5-Year Index | | | (5.000)% | | | | 06/20/2021 | | | $ | | | | | 6,100 | | | $ | (205) | | | $ | (97) | | | $ | 0 | | | $ | (28 | ) |
| | | | | | | | | | | | | | | | | | | | | | | | | | | | | | | | |
| (1) | If the Portfolio is a buyer of protection and a credit event occurs, as defined under the terms of that particular swap agreement, the Portfolio will either (i) receive from the seller of protection an amount equal to the notional amount of the swap and deliver the referenced obligation or underlying securities comprising the referenced index or (ii) receive a net settlement amount in the form of cash or securities equal to the notional amount of the swap less the recovery value of the referenced obligation or underlying securities comprising the referenced index. |
| (2) | The maximum potential amount the Portfolio could be required to pay as a seller of credit protection or receive as a buyer of credit protection if a credit event occurs as defined under the terms of that particular swap agreement. |
| (3) | The prices and resulting values for credit default swap agreements on credit indices serve as an indicator of the current status of the payment/performance risk and represent the likelihood of an expected liability (or profit) for the credit derivative should the notional amount of the swap agreement be closed/sold as of the period end. Increasing market values, in absolute terms when compared to the notional amount of the swap, represent a deterioration of the referenced indices’ credit soundness and a greater likelihood or risk of default or other credit event occurring as defined under the terms of the agreement. |
INTEREST RATE SWAPS
| | | | | | | | | | | | | | | | | | | | | | | | | | | | | | | | | | |
Pay/Receive
Floating Rate | | Floating Rate Index | | Fixed Rate | | | Maturity
Date | | | Notional
Amount | | | Market
Value | | | Unrealized
Appreciation/
(Depreciation) | | | Variation Margin | |
| | | | | | | | Asset | | | Liability | |
Pay | | 3-Month CAD-Bank Bill * | | | 0.900% | | | | 04/17/2018 | | | | CAD | | | | 7,900 | | | $ | 3 | | | $ | 1 | | | $ | 0 | | | $ | 0 | |
Receive | | 3-Month USD-LIBOR | | | 1.500 | | | | 12/16/2017 | | | | $ | | | | 8,100 | | | | (97 | ) | | | (43 | ) | | | 0 | | | | (2 | ) |
Receive | | 3-Month USD-LIBOR * | | | 0.996 | | | | 04/05/2018 | | | | | | | | 6,100 | | | | (14 | ) | | | (14 | ) | | | 0 | | | | (1 | ) |
Pay | | 3-Month USD-LIBOR | | | 1.250 | | | | 06/15/2018 | | | | | | | | 9,700 | | | | 99 | | | | 105 | | | | 3 | | | | 0 | |
Receive | | 3-Month USD-LIBOR | | | 2.000 | | | | 12/16/2020 | | | | | | | | 16,000 | | | | (746 | ) | | | (355 | ) | | | 0 | | | | (1 | ) |
Pay | | 3-Month USD-LIBOR | | | 2.250 | | | | 12/16/2022 | | | | | | | | 7,200 | | | | 511 | | | | 461 | | | | 0 | | | | (5 | ) |
Receive | | 3-Month USD-LIBOR * | | | 2.800 | | | | 10/28/2025 | | | | | | | | 16,400 | | | | (813 | ) | | | (722 | ) | | | 33 | | | | 0 | |
Receive | | 3-Month USD-LIBOR * | | | 2.500 | | | | 02/22/2026 | | | | | | | | 15,800 | | | | (526 | ) | | | (475 | ) | | | 33 | | | | 0 | |
Receive | | 3-Month USD-LIBOR * | | | 2.400 | | | | 03/16/2026 | | | | | | | | 8,600 | | | | (243 | ) | | | (243 | ) | | | 18 | | | | 0 | |
Receive | | 3-Month USD-LIBOR * | | | 2.300 | | | | 04/21/2026 | | | | | | | | 5,000 | | | | (114 | ) | | | (94 | ) | | | 10 | | | | 0 | |
Receive | | 3-Month USD-LIBOR * | | | 2.300 | | | | 04/27/2026 | | | | | | | | 5,900 | | | | (135 | ) | | | (112 | ) | | | 12 | | | | 0 | |
Receive | | 3-Month USD-LIBOR | | | 2.250 | | | | 06/15/2026 | | | | | | | | 1,200 | | | | (101 | ) | | | (38 | ) | | | 2 | | | | 0 | |
Receive | | 3-Month USD-LIBOR * | | | 1.750 | | | | 12/21/2026 | | | | | | | | 17,170 | | | | (479 | ) | | | (265 | ) | | | 38 | | | | 0 | |
Receive | | 6-Month GBP-LIBOR * | | | 1.500 | | | | 09/21/2026 | | | | GBP | | | | 1,710 | | | | (106 | ) | | | (118 | ) | | | 0 | | | | (3 | ) |
Receive | | 6-Month GBP-LIBOR * | | | 1.750 | | | | 03/15/2047 | | | | | | | | 1,610 | | | | (294 | ) | | | (290 | ) | | | 0 | | | | (11 | ) |
Receive | | 6-Month JPY-LIBOR | | | 1.500 | | | | 12/21/2045 | | | | JPY | | | | 110,000 | | | | (428 | ) | | | (165 | ) | | | 25 | | | | 0 | |
Pay | | 28-Day MXN-TIIE | | | 4.310 | | | | 09/06/2016 | | | | MXN | | | | 70,000 | | | | 0 | | | | 12 | | | | 0 | | | | (1 | ) |
| | | | | | | | | | | | | | | | | | | | | | | | | | | | | | | | | | |
| | | | | | | | | | | | | | | | | | | | $ | (3,483 | ) | | $ | (2,355 | ) | | $ | 174 | | | $ | (24 | ) |
| | | | | | | | | | | | | | | | | | | | | | | | | | | | | | | | | | |
Total Swap Agreements | | | | | | | | | | | $ | (3,688 | ) | | $ | (2,452 | ) | | $ | 174 | | | $ | (52 | ) |
| | | | | | | | | | | | | | | | | | | | | | | | | | | | | | | | | | |
| * | This security has a forward starting effective date. See Note 2(a) in the Notes to Financial Statements for further information. |
| | | | | | |
| See Accompanying Notes | | SEMIANNUAL REPORT | | JUNE 30, 2016 | | 91 |
Schedule of Investments PIMCO Fixed Income SHares: Series R (Cont.)
FINANCIAL DERIVATIVE INSTRUMENTS: EXCHANGE-TRADED OR CENTRALLY CLEARED SUMMARY
The following is a summary of the market value and variation margin of Exchange-Traded or Centrally Cleared Financial Derivative Instruments as of June 30, 2016:
| (h) | Securities with an aggregate market value of $1,093 and cash of $1,849 have been pledged as collateral for exchange-traded and centrally cleared financial derivative instruments as of June 30, 2016. See Note 7, Principal Risks, in the Notes to Financial Statements for more information regarding master netting arrangements. |
| | | | | | | | | | | | | | | | | | | | | | | | | | | | | | | | | | | | |
| | | Financial Derivative Assets | | | | | | Financial Derivative Liabilities | |
| | | Market Value | | | Variation Margin
Asset | | | | | | | | | Market Value | | | Variation Margin
Liability | | | | |
| | | Purchased
Options | | | Futures | | | Swap
Agreements | | | Total | | | | | | Written
Options | | | Futures | | | Swap
Agreements | | | Total | |
Total Exchange-Traded or Centrally Cleared | | $ | 0 | | | $ | 65 | | | $ | 174 | | | $ | 239 | | | | | | | $ | 0 | | | $ | (42) | | | $ | (52) | | | $ | (94) | |
| | | | | | | | | | | | | | | | | | | | | | | | | | | | | | | | | | | | |
(i) FINANCIAL DERIVATIVE INSTRUMENTS: OVER THE COUNTER
FORWARD FOREIGN CURRENCY CONTRACTS:
| | | | | | | | | | | | | | | | | | | | | | | | | | | | |
Counterparty | | Settlement
Month | | | Currency to
be Delivered | | | Currency to
be Received | | | Unrealized Appreciation/
(Depreciation) | |
| | | | | Asset | | | Liability | |
BOA | | | 07/2016 | | | | GBP | | | | 1,698 | | | $ | | | | | 2,490 | | | $ | 229 | | | $ | 0 | |
| | | 07/2016 | | | $ | | | | | 8,188 | | | | EUR | | | | 7,430 | | | | 58 | | | | 0 | |
| | | 07/2016 | | | | | | | | 3,422 | | | | GBP | | | | 2,572 | | | | 2 | | | | 0 | |
| | | 08/2016 | | | | EUR | | | | 7,430 | | | $ | | | | | 8,197 | | | | 0 | | | | (57 | ) |
| | | 08/2016 | | | | GBP | | | | 2,572 | | | | | | | | 3,423 | | | | 0 | | | | (2 | ) |
| | | 08/2016 | | | | PLN | | | | 446 | | | | | | | | 115 | | | | 2 | | | | 0 | |
| | | 01/2017 | | | | CNH | | | | 103 | | | | | | | | 15 | | | | 0 | | | | 0 | |
| | | | | | | | | | | | | | | | | | | | | | | | | | | | |
BPS | | | 07/2016 | | | | BRL | | | | 266 | | | | | | | | 78 | | | | 0 | | | | (5 | ) |
| | | 07/2016 | | | | EUR | | | | 458 | | | | | | | | 514 | | | | 6 | | | | 0 | |
| | | 07/2016 | | | | GBP | | | | 1,199 | | | | | | | | 1,760 | | | | 164 | | | | 0 | |
| | | 07/2016 | | | $ | | | | | 83 | | | | BRL | | | | 266 | | | | 0 | | | | 0 | |
| | | 08/2016 | | | | | | | | 77 | | | | | | | | 266 | | | | 5 | | | | 0 | |
| | | 10/2016 | | | | BRL | | | | 12,700 | | | $ | | | | | 3,433 | | | | 0 | | | | (413 | ) |
| | | | | | | | | | | | | | | | | | | | | | | | | | | | |
BRC | | | 07/2016 | | | $ | | | | | 2,912 | | | | EUR | | | | 2,633 | | | | 10 | | | | 0 | |
| | | 08/2016 | | | | EUR | | | | 2,633 | | | $ | | | | | 2,915 | | | | 0 | | | | (10 | ) |
| | | | | | | | | | | | | | | | | | | | | | | | | | | | |
CBK | | | 07/2016 | | | | | | | | 113 | | | | | | | | 128 | | | | 3 | | | | 0 | |
| | | 07/2016 | | | | JPY | | | | 9,100 | | | | | | | | 85 | | | | 0 | | | | (3 | ) |
| | | 07/2016 | | | $ | | | | | 107 | | | | EUR | | | | 94 | | | | 0 | | | | (2 | ) |
| | | 08/2016 | | | | AUD | | | | 943 | | | $ | | | | | 690 | | | | 0 | | | | (13 | ) |
| | | 08/2016 | | | $ | | | | | 144 | | | | MXN | | | | 2,753 | | | | 6 | | | | 0 | |
| | | | | | | | | | | | | | | | | | | | | | | | | | | | |
DUB | | | 01/2017 | | | | CNH | | | | 6,368 | | | $ | | | | | 920 | | | | 0 | | | | (27 | ) |
| | | | | | | | | | | | | | | | | | | | | | | | | | | | |
GLM | | | 07/2016 | | | | EUR | | | | 6,490 | | | | | | | | 7,240 | | | | 38 | | | | 0 | |
| | | 07/2016 | | | $ | | | | | 231 | | | | GBP | | | | 159 | | | | 0 | | | | (20 | ) |
| | | 08/2016 | | | | NZD | | | | 2,026 | | | $ | | | | | 1,376 | | | | 0 | | | | (68 | ) |
| | | 10/2016 | | | | BRL | | | | 30,300 | | | | | | | | 7,556 | | | | 0 | | | | (1,620 | ) |
| | | | | | | | | | | | | | | | | | | | | | | | | | | | |
HUS | | | 01/2017 | | | | DKK | | | | 2,626 | | | | | | | | 402 | | | | 7 | | | | 0 | |
| | | | | | | | | | | | | | | | | | | | | | | | | | | | |
JPM | | | 07/2016 | | | | BRL | | | | 266 | | | | | | | | 83 | | | | 0 | | | | 0 | |
| | | 07/2016 | | | | EUR | | | | 463 | | | | | | | | 522 | | | | 8 | | | | 0 | |
| | | 07/2016 | | | | GBP | | | | 792 | | | | | | | | 1,121 | | | | 66 | | | | 0 | |
| | | 07/2016 | | | | JPY | | | | 428,500 | | | | | | | | 4,059 | | | | 0 | | | | (90 | ) |
| | | 07/2016 | | | $ | | | | | 73 | | | | BRL | | | | 266 | | | | 10 | | | | 0 | |
| | | 07/2016 | | | | | | | | 1,019 | | | | GBP | | | | 719 | | | | 2 | | | | (64 | ) |
| | | | | | |
| 92 | | PIMCO MANAGED ACCOUNTS TRUST | | | | See Accompanying Notes |
(Unaudited)
June 30, 2016
| | | | | | | | | | | | | | | | | | | | | | | | | | | | |
Counterparty | | Settlement
Month | | | Currency to
be Delivered | | | Currency to
be Received | | | Unrealized Appreciation/
(Depreciation) | |
| | | | | Asset | | | Liability | |
| | | 08/2016 | | | | DKK | | | | 41,645 | | | $ | | | | | 6,391 | | | $ | 169 | | | $ | 0 | |
| | | 08/2016 | | | | MXN | | | | 29,825 | | | | | | | | 1,647 | | | | 23 | | | | 0 | |
| | | 10/2016 | | | | BRL | | | | 15,100 | | | | | | | | 3,566 | | | | 0 | | | | (1,008 | ) |
| | | 10/2016 | | | | CNH | | | | 8,171 | | | | | | | | 1,250 | | | | 30 | | | | 0 | |
| | | | | | | | | | | | | | | | | | | | | | | | | | | | |
MSB | | | 07/2016 | | | | JPY | | | | 122,300 | | | | | | | | 1,110 | | | | 0 | | | | (75 | ) |
| | | | | | | | | | | | | | | | | | | | | | | | | | | | |
SCX | | | 07/2016 | | | $ | | | | | 5,495 | | | | JPY | | | | 559,900 | | | | 0 | | | | (73 | ) |
| | | 08/2016 | | | | JPY | | | | 559,900 | | | $ | | | | | 5,500 | | | | 74 | | | | 0 | |
| | | 09/2016 | | | | CNH | | | | 6,591 | | | | | | | | 1,000 | | | | 14 | | | | 0 | |
| | | 01/2017 | | | | | | | | 6,307 | | | | | | | | 917 | | | | 0 | | | | (21 | ) |
| | | | | | | | | | | | | | | | | | | | | | | | | | | | |
UAG | | | 07/2016 | | | | EUR | | | | 2,633 | | | | | | | | 2,902 | | | | 0 | | | | (20 | ) |
| | | 07/2016 | | | $ | | | | | 171 | | | | GBP | | | | 123 | | | | 0 | | | | (7 | ) |
| | | 08/2016 | | | | CNH | | | | 4,784 | | | $ | | | | | 731 | | | | 14 | | | | 0 | |
| | | 08/2016 | | | | HUF | | | | 4,622 | | | | | | | | 17 | | | | 1 | | | | 0 | |
| | | | | | | | | | | | | | | | | | | | | | | | |
Total Forward Foreign Currency Contracts | | | | | | | | | | | $ | 941 | | | $ | (3,598 | ) |
| | | | | | | | | | | | | | | | | | | | | | | | |
PURCHASED OPTIONS:
FOREIGN CURRENCY OPTIONS
| | | | | | | | | | | | | | | | | | | | | | | | | | | | | | |
| Counterparty | | Description | | Strike
Price | | | Expiration
Date | | | Notional
Amount | | | Cost | | | Market
Value | |
| DUB | | Call - OTC USD versus JPY | | | JPY | | | | 111.500 | | | | 07/07/2016 | | | | $ | | | | 700 | | | $ | 4 | | | $ | 0 | |
| | | | | | | | | | | | | | | | | | | | | | | | | | | | | | |
| FBF | | Call - OTC USD versus JPY | | | | | | | 111.500 | | | | 07/07/2016 | | | | | | | | 960 | | | | 11 | | | | 0 | |
| | | | | | | | | | | | | | | | | | | | | | | | | | | | | | |
| | | | | | | | | | | | | | | | | | | | | | | | $ | 15 | | | $ | 0 | |
| | | | | | | | | | | | | | | | | | | | | | | | | | | | | | |
INTEREST RATE SWAPTIONS
| | | | | | | | | | | | | | | | | | | | | | | | | | | | |
| Counterparty | | Description | | Floating Rate Index | | Pay/
Receive
Floating
Rate | | Exercise
Rate | | Expiration
Date | | | Notional
Amount | | | Cost | | | Market
Value | |
CBK | | Put - OTC 1-Year Interest Rate Swap | | 3-Month USD-LIBOR | | Receive | | 1.500% | | | 07/05/2016 | | | | $ | | | | 66,300 | | | $ | 23 | | | $ | 0 | |
| | Put - OTC 1-Year Interest Rate Swap | | 3-Month USD-LIBOR | | Receive | | 1.250 | | | 12/27/2016 | | | | | | | | 31,300 | | | | 27 | | | | 3 | |
| | Call - OTC 5-Year Interest Rate Swap | | 3-Month USD-LIBOR | | Pay | | 1.000 | | | 12/21/2016 | | | | | | | | 2,900 | | | | 24 | | | | 24 | |
| | Put - OTC 10-Year Interest Rate Swap | | 3-Month USD-LIBOR | | Receive | | 1.780 | | | 07/21/2016 | | | | | | | | 1,500 | | | | 3 | | | | 0 | |
| | | | | | | | | | | | | | | | | | | | | | | | | | | | |
DUB | | Put - OTC 1-Year Interest Rate Swap | | 3-Month USD-LIBOR | | Receive | | 1.250 | | | 07/05/2016 | | | | | | | | 120,900 | | | | 39 | | | | 0 | |
| | Call - OTC 30-Year Interest Rate Swap | | 3-Month USD-LIBOR | | Pay | | 2.150 | | | 06/15/2018 | | | | | | | | 2,000 | | | | 200 | | | | 246 | |
| | Put - OTC 30-Year Interest Rate Swap | | 3-Month USD-LIBOR | | Receive | | 2.150 | | | 06/15/2018 | | | | | | | | 2,000 | | | | 200 | | | | 163 | |
| | Put - OTC 30-Year Interest Rate Swap | | 3-Month USD-LIBOR | | Receive | | 2.860 | | | 10/23/2018 | | | | | | | | 3,000 | | | | 205 | | | | 108 | |
| | | | | | | | | | | | | | | | | | | | | | | | | | | | |
FBF | | Put - OTC 5-Year Interest Rate Swap | | 3-Month USD-LIBOR | | Receive | | 3.400 | | | 12/05/2016 | | | | | | | | 7,600 | | | | 56 | | | | 1 | |
| | | | | | | | | | | | | | | | | | | | | | | | | | | | |
GLM | | Put - OTC 1-Year Interest Rate Swap | | 3-Month USD-LIBOR | | Receive | | 1.150 | | | 07/05/2016 | | | | | | | | 46,300 | | | | 14 | | | | 0 | |
| | | | | | |
| See Accompanying Notes | | SEMIANNUAL REPORT | | JUNE 30, 2016 | | 93 |
Schedule of Investments PIMCO Fixed Income SHares: Series R (Cont.)
| | | | | | | | | | | | | | | | | | | | | | | | | | | | | | | | |
| Counterparty | | Description | | Floating Rate Index | | Pay/
Receive
Floating
Rate | | | Exercise
Rate | | | Expiration
Date | | | Notional
Amount | | | Cost | | | Market
Value | |
| | Put - OTC 1-Year Interest Rate Swap | | 3-Month USD-LIBOR | | | Receive | | | | 1.250% | | | | 07/05/2016 | | | | $ | | | | 48,300 | | | $ | 18 | | | $ | 0 | |
| | Put - OTC 1-Year Interest Rate Swap | | 3-Month USD-LIBOR | | | Receive | | | | 1.250 | | | | 12/27/2016 | | | | | | | | 59,700 | | | | 53 | | | | 5 | |
| | Call - OTC 2-Year Interest Rate Swap | | 3-Month USD-LIBOR | | | Pay | | | | 1.100 | | | | 09/28/2016 | | | | | | | | 12,500 | | | | 43 | | | | 39 | |
| | | | | | | | | | | | | | | | | | | | | | | | | | | | | | | | |
JPM | | Put - OTC 1-Year Interest Rate Swap | | 3-Month USD-LIBOR | | | Receive | | | | 1.000 | | | | 08/08/2016 | | | | | | | | 57,700 | | | | 20 | | | | 0 | |
| | Put - OTC 10-Year Interest Rate Swap | | 3-Month JPY-LIBOR | | | Receive | | | | 0.300 | | | | 11/14/2016 | | | | JPY | | | | 430,000 | | | | 17 | | | | 10 | |
| | | | | | | | | | | | | | | | | | | | | | | | | | | | | | | | |
MYC | | Call - OTC 5-Year Interest Rate Swap | | 3-Month USD-LIBOR | | | Pay | | | | 1.000 | | | | 12/13/2016 | | | | $ | | | | 3,900 | | | | 33 | | | | 30 | |
| | Put - OTC 30-Year Interest Rate Swap | | 3-Month USD-LIBOR | | | Receive | | | | 2.605 | | | | 10/17/2018 | | | | | | | | 2,100 | | | | 193 | | | | 107 | |
| | Put - OTC 30-Year Interest Rate Swap | | 3-Month USD-LIBOR | | | Receive | | | | 2.608 | | | | 11/15/2018 | | | | | | | | 600 | | | | 60 | | | | 32 | |
| | Put - OTC 30-Year Interest Rate Swap | | 3-Month USD-LIBOR | | | Receive | | | | 2.590 | | | | 12/10/2018 | | | | | | | | 600 | | | | 63 | | | | 33 | |
| | Put - OTC 30-Year Interest Rate Swap | | 3-Month USD-LIBOR | | | Receive | | | | 2.600 | | | | 03/29/2019 | | | | | | | | 2,700 | | | | 255 | | | | 164 | |
| | | | | | | | | | | | | | | | | | | | | | | | | | | | | | | | |
RYL | | Put - OTC 1-Year Interest Rate Swap | | 3-Month USD-LIBOR | | | Receive | | | | 1.250 | | | | 07/05/2016 | | | | | | | | 57,800 | | | | 19 | | | | 0 | |
| | | | | | | | | | | | | | | | | | | | | | | | | | | | | | | | |
| | | | | | | | | | | | | | | | | | | | | | | | | | $ | 1,565 | | | $ | 965 | |
| | | | | | | | | | | | | | | | | | | | | | | | | | | | | | | | |
OPTIONS ON SECURITIES
| | | | | | | | | | | | | | | | | | | | | | |
| Counterparty | | Description | | Strike
Price | | | Expiration
Date | | | Notional
Amount | | | Cost | | | Market
Value | |
| JPM | | Put - OTC Fannie Mae 3.500% due 07/01/2046 | | $ | 75.000 | | | | 07/07/2016 | | | | $ 10,000 | | | $ | 0 | | | $ | 0 | |
| | | | | | | | | | | | | | | | | | | | | | |
Total Purchased Options | | | | | | | $ | 1,580 | | | $ | 965 | |
| | | | | | | | | | | | | | | | | | | | | | |
WRITTEN OPTIONS:
CREDIT DEFAULT SWAPTIONS ON CREDIT INDICES
| | | | | | | | | | | | | | | | | | | | | | | | | | | | |
| Counterparty | | Description | | Buy/Sell
Protection | | Exercise
Rate | | | Expiration
Date | | | Notional
Amount | | | Premiums
(Received) | | | Market
Value | |
| BPS | | Put - OTC iTraxx Europe 25 5-Year Index | | Sell | | | 1.250% | | | | 09/21/2016 | | | | EUR | | | | 1,600 | | | $ | (6 | ) | | $ | (2 | ) |
| | | | | | | | | | | | | | | | | | | | | | | | | | | | |
| JPM | | Call - OTC CDX.IG-26 5-Year Index | | Buy | | | 0.750 | | | | 07/20/2016 | | | | $ | | | | 7,800 | | | | (7 | ) | | | (6 | ) |
| | Put - OTC CDX.IG-26 5-Year Index | | Sell | | | 1.000 | | | | 07/20/2016 | | | | | | | | 7,800 | | | | (9 | ) | | | (1 | ) |
| | Put - OTC CDX.IG-26 5-Year Index | | Sell | | | 1.200 | | | | 09/21/2016 | | | | | | | | 1,600 | | | | (2 | ) | | | (1 | ) |
| | | | | | | | | | | | | | | | | | | | | | | | | | | | |
| | | | | | | | | | | | | | | | | | | | | | $ | (24 | ) | | $ | (10 | ) |
| | | | | | | | | | | | | | | | | | | | | | | | | | | | |
| | | | | | |
| 94 | | PIMCO MANAGED ACCOUNTS TRUST | | | | See Accompanying Notes |
(Unaudited)
June 30, 2016
FOREIGN CURRENCY OPTIONS
| | | | | | | | | | | | | | | | | | | | | | | | | | | | | | |
| Counterparty | | Description | | Strike
Price | | | Expiration
Date | | | Notional
Amount | | | Premiums
(Received) | | | Market
Value | |
| BPS | | Call - OTC EUR versus USD | | | $ | | | | 1.140 | | | | 07/01/2016 | | | | EUR | | | | 1,520 | | | $ | (5 | ) | | $ | 0 | |
| | Put - OTC USD versus JPY | | | JPY | | | | 101.200 | | | | 09/15/2016 | | | | $ | | | | 2,010 | | | | (21 | ) | | | (32 | ) |
| | | | | | | | | | | | | | | | | | | | | | | | | | | | | | |
| DUB | | Put - OTC USD versus JPY | | | | | | | 104.800 | | | | 07/07/2016 | | | | | | | | 700 | | | | (5 | ) | | | (11 | ) |
| | | | | | | | | | | | | | | | | | | | | | | | | | | | | | |
| FBF | | Put - OTC USD versus JPY | | | | | | | 104.800 | | | | 07/07/2016 | | | | | | | | 960 | | | | (4 | ) | | | (16 | ) |
| | | | | | | | | | | | | | | | | | | | | | | | | | | | | | |
| JPM | | Call - OTC EUR versus USD | | | $ | | | | 1.165 | | | | 09/15/2016 | | | | EUR | | | | 1,690 | | | | (15 | ) | | | (6 | ) |
| | Call - OTC USD versus MXN | | | MXN | | | | 19.000 | | | | 08/11/2016 | | | | $ | | | | 1,370 | | | | (16 | ) | | | (12 | ) |
| | | | | | | | | | | | | | | | | | | | | | | | | | | | | | |
| MSB | | Put - OTC EUR versus USD | | | $ | | | | 1.085 | | | | 08/03/2016 | | | | EUR | | | | 1,590 | | | | (7 | ) | | | (7 | ) |
| | | | | | | | | | | | | | | | | | | | | | | | | | | | | | |
| | | | | | | | | | | | | | | | | | | | | | | | $ | (73 | ) | | $ | (84 | ) |
| | | | | | | | | | | | | | | | | | | | | | | | | | | | | | |
INFLATION-CAPPED OPTIONS
| | | | | | | | | | | | | | | | | | | | | | | | | | | | |
| Counterparty | | Description | | Initial
Index | | | Floating Rate | | Expiration
Date (1) | | | Notional
Amount | | | Premiums
(Received) | | | Market
Value | |
| CBK | | Floor - OTC CPURNSA Index | | | 216.687 | | | Maximum of [(1 + 0.000%)10 - (Final Index/Initial Index)] or 0 | | | 04/07/2020 | | | | $ | | | | 32,200 | | | $ | (287 | ) | | $ | (3 | ) |
| | Floor - OTC CPURNSA Index | | | 217.965 | | | Maximum of [(1 + 0.000%)10 - (Final Index/Initial Index)] or 0 | | | 09/29/2020 | | | | | | | | 1,500 | | | | (19 | ) | | | 0 | |
| | | | | | | | | | | | | | | | | | | | | | | | | | | | |
| DUB | | Floor - OTC YOY CPURNSA Index | | | 233.546 | | | Maximum of [(1 + 0.000%) - (Final Index/Initial Index)] or 0 | | | 01/22/2018 | | | | | | | | 1,800 | | | | (17 | ) | | | (4 | ) |
| | | | | | | | | | | | | | | | | | | | | | | | | | | | |
| GLM | | Cap - OTC CPALEMU Index | | | 100.152 | | | Maximum of [(Final Index/Initial Index - 1) - 3.000%] or 0 | | | 06/22/2035 | | | | EUR | | | | 1,200 | | | | (55 | ) | | | (9 | ) |
| | | | | | | | | | | | | | | | | | | | | | | | | | | | |
| JPM | | Cap - OTC CPURNSA Index | | | 233.916 | | | Maximum of [(Final Index/Initial Index - 1) - 4.000%] or 0 | | | 04/22/2024 | | | | $ | | | | 6,500 | | | | (47 | ) | | | (2 | ) |
| | Cap - OTC CPURNSA Index | | | 234.781 | | | Maximum of [(Final Index/Initial Index - 1) - 4.000%] or 0 | | | 05/16/2024 | | | | | | | | 500 | | | | (4 | ) | | | 0 | |
| | Floor - OTC YOY CPURNSA Index | | | 234.812 | | | Maximum of [0.000% - (Final Index/Initial Index - 1)] or 0 | | | 03/24/2020 | | | | | | | | 4,800 | | | | (54 | ) | | | (46 | ) |
| | Floor - OTC YOY CPURNSA Index | | | 238.654 | | | Maximum of [0.000% - (Final Index/Initial Index - 1)] or 0 | | | 10/02/2020 | | | | | | | | 2,100 | | | | (39 | ) | | | (25 | ) |
| | | | | | | | | | | | | | | | | | | | | | | | | | | | |
| | | | | | | | | | | | | | | | | | | | | | $ | (522 | ) | | $ | (89 | ) |
| | | | | | | | | | | | | | | | | | | | | | | | | | | | |
| (1) | YOY options may have a series of expirations. |
INTEREST RATE SWAPTIONS
| | | | | | | | | | | | | | | | | | | | | | | | | | | | |
| Counterparty | | Description | | Floating Rate Index | | Pay/
Receive
Floating
Rate | | Exercise
Rate | | Expiration
Date | | | Notional
Amount | | | Premiums
(Received) | | | Market
Value | |
| BRC | | Put - OTC 5-Year Interest Rate Swap * | | 6-Month GBP-LIBOR | | Pay | | 2.185% | | | 08/12/2016 | | | | GBP | | | | 1,800 | | | $ | (10 | ) | | $ | 0 | |
| | | | | | | | | | | | | | | | | | | | | | | | | | | | |
| CBK | | Put - OTC 5-Year Interest Rate Swap | | 3-Month USD-LIBOR | | Pay | | 1.400 | | | 07/21/2016 | | | | $ | | | | 1,500 | | | | (2 | ) | | | 0 | |
| | Call - OTC 5-Year Interest Rate Swap * | | 3-Month USD-LIBOR | | Receive | | 1.850 | | | 07/25/2016 | | | | | | | | 3,000 | | | | (5 | ) | | | (14 | ) |
| | Put - OTC 5-Year Interest Rate Swap * | | 3-Month USD-LIBOR | | Pay | | 2.250 | | | 07/25/2016 | | | | | | | | 3,000 | | | | (5 | ) | | | 0 | |
| | Call - OTC 5-Year Interest Rate Swap | | 3-Month USD-LIBOR | | Receive | | 0.770 | | | 12/21/2016 | | | | | | | | 5,800 | | | | (24 | ) | | | (24 | ) |
| | Put - OTC 30-Year Interest Rate Swap | | 3-Month USD-LIBOR | | Pay | | 2.230 | | | 07/21/2016 | | | | | | | | 300 | | | | (1 | ) | | | 0 | |
| | | | | | | | | | | | | | | | | | | | | | | | | | | | |
| | | | | | |
| See Accompanying Notes | | SEMIANNUAL REPORT | | JUNE 30, 2016 | | 95 |
Schedule of Investments PIMCO Fixed Income SHares: Series R (Cont.)
| | | | | | | | | | | | | | | | | | | | | | | | | | | | | | | | |
| Counterparty | | Description | | Floating Rate Index | | Pay/
Receive
Floating
Rate | | | Exercise
Rate | | | Expiration
Date | | | Notional
Amount | | | Premiums
(Received) | | | Market
Value | |
| DUB | | Put - OTC 5-Year Interest Rate Swap | | 3-Month USD-LIBOR | | | Pay | | | | 2.500% | | | | 10/23/2018 | | | | $ | | | | 15,000 | | | $ | (211 | ) | | $ | (98 | ) |
| | | | | | | | | | | | | | | | | | | | | | | | | | | | | | | | |
| FBF | | Call - OTC 5-Year Interest Rate Swap * | | 3-Month USD-LIBOR | | | Receive | | | | 2.400 | | | | 12/05/2016 | | | | | | | | 7,600 | | | | (60 | ) | | | (208 | ) |
| | | | | | | | | | | | | | | | | | | | | | | | | | | | | | | | |
| GLM | | Call - OTC 2-Year Interest Rate Swap * | | 3-Month USD-LIBOR | | | Receive | | | | 0.890 | | | | 09/28/2016 | | | | | | | | 25,000 | | | | (44 | ) | | | (38 | ) |
| | Call - OTC 5-Year Interest Rate Swap * | | 3-Month USD-LIBOR | | | Receive | | | | 1.850 | | | | 07/18/2016 | | | | | | | | 7,800 | | | | (25 | ) | | | (32 | ) |
| | | | | | | | | | | | | | | | | | | | | | | | | | | | | | | | |
| MYC | | Call - OTC 5-Year Interest Rate Swap * | | 3-Month USD-LIBOR | | | Receive | | | | 2.000 | | | | 07/25/2016 | | | | | | | | 4,400 | | | | (13 | ) | | | (41 | ) |
| | Put - OTC 5-Year Interest Rate Swap * | | 3-Month USD-LIBOR | | | Pay | | | | 2.500 | | | | 07/25/2016 | | | | | | | | 1,700 | | | | (7 | ) | | | 0 | |
| | Call - OTC 5-Year Interest Rate Swap | | 3-Month USD-LIBOR | | | Receive | | | | 0.765 | | | | 12/13/2016 | | | | | | | | 7,800 | | | | (33 | ) | | | (30 | ) |
| | Put - OTC 5-Year Interest Rate Swap | | 3-Month USD-LIBOR | | | Pay | | | | 2.250 | | | | 10/17/2018 | | | | | | | | 9,800 | | | | (195 | ) | | | (88 | ) |
| | Put - OTC 5-Year Interest Rate Swap | | 3-Month USD-LIBOR | | | Pay | | | | 2.250 | | | | 11/15/2018 | | | | | | | | 2,800 | | | | (60 | ) | | | (27 | ) |
| | Put - OTC 5-Year Interest Rate Swap | | 3-Month USD-LIBOR | | | Pay | | | | 2.250 | | | | 12/10/2018 | | | | | | | | 2,800 | | | | (63 | ) | | | (28 | ) |
| | Put - OTC 5-Year Interest Rate Swap | | 3-Month USD-LIBOR | | | Pay | | | | 2.300 | | | | 03/29/2019 | | | | | | | | 12,800 | | | | (257 | ) | | | (144 | ) |
| | | | | | | | | | | | | | | | | | | | | | | | | | | | | | | | |
| | | | | | | | | | | | | | | | | | | | | | $ | (1,015 | ) | | $ | (772 | ) |
| | | | | | | | | | | | | | | | | | | | | | | | | | | | | | | | |
Total Written Options | | | | | | | | | | | | | | | | | | | | | | $ | (1,634 | ) | | $ | (955 | ) |
| | | | | | | | | | | | | | | | | | | | | | | | | | | | | | | | |
| * | The underlying security has a forward starting effective date. See Note 2(a) in the Notes to Financial Statements for further information. |
TRANSACTIONS IN WRITTEN CALL AND PUT OPTIONS FOR THE PERIOD ENDED JUNE 30, 2016:
| | | | | | | | | | | | | | | | | | | | | | | | | | | | | | | | | | | | | | | | | | | | | | | | |
| | | Balance at
Beginning of Period | | | Sales | | | Closing Buys | | | Expirations | | | Exercised | | | Balance at
End of Period | |
# of Contracts | | | | | | | 0 | | | | | | | | 96 | | | | | | | | (21 | ) | | | | | | | (27 | ) | | | | | | | (48 | ) | | | | | | | 0 | |
Notional Amount in $ | | | $ | | | | 127,400 | | | | $ | | | | 210,340 | | | | $ | | | | (53,600) | | | | $ | | | | (36,900) | | | | $ | | | | (64,500) | | | | $ | | | | 182,740 | |
Notional Amount in AUD | | | AUD | | | | 0 | | | | AUD | | | | 780 | | | | AUD | | | | (780 | ) | | | AUD | | | | 0 | | | | AUD | | | | 0 | | | | AUD | | | | 0 | |
Notional Amount in EUR | | | EUR | | | | 1,400 | | | | EUR | | | | 15,890 | | | | EUR | | | | (3,700 | ) | | | EUR | | | | (5,990 | ) | | | EUR | | | | 0 | | | | EUR | | | | 7,600 | |
Notional Amount in GBP | | | GBP | | | | 0 | | | | GBP | | | | 1,800 | | | | GBP | | | | 0 | | | | GBP | | | | 0 | | | | GBP | | | | 0 | | | | GBP | | | | 1,800 | |
| | | | | | | | | | | | | | | | | | | | | | | | | | | | | | | | | | | | | | | | | | | | | | | | |
Premiums | | | $ | | | | (1,225 | ) | | | $ | | | | (1,378 | ) | | | $ | | | | 570 | | | | $ | | | | 157 | | | | $ | | | | 242 | | | | $ | | | | (1,634 | ) |
| | | | | | | | | | | | | | | | | | | | | | | | | | | | | | | | | | | | | | | | | | | | | | | | |
SWAP AGREEMENTS:
CREDIT DEFAULT SWAPS ON CREDIT INDICES - SELL PROTECTION (2)
| | | | | | | | | | | | | | | | | | | | | | | | | | | | | | | | |
| Counterparty | | Index/Tranches | | Fixed
Receive Rate | | Maturity
Date | | | Notional
Amount(3) | | | Premiums
(Received) | | | Unrealized
Appreciation | | | Swap Agreements,
at Value (4) | |
| | | | | | | | Asset | | | Liability | |
DUB | | CMBX.NA.AAA.7 Index | | 0.500% | | | 01/17/2047 | | | $ | | | | | 220 | | | $ | (7 | ) | | $ | 1 | | | $ | 0 | | | $ | (6 | ) |
| | CMBX.NA.AAA.8 Index | | 0.500 | | | 10/17/2057 | | | | | | | | 500 | | | | (22 | ) | | | 4 | | | | 0 | | | | (18 | ) |
| | | | | | | | | | | | | | | | | | | | | | | | | | | | | | | | |
MYC | | CMBX.NA.AAA.7 Index | | 0.500 | | | 01/17/2047 | | | | | | | | 180 | | | | (6 | ) | | | 1 | | | | 0 | | | | (5 | ) |
| | | | | | | | | | | | | | | | | | | | | | | | | | | | | | | | |
| | | | | | | | | | | | | | | | | | $ | (35 | ) | | $ | 6 | | | $ | 0 | | | $ | (29 | ) |
| | | | | | | | | | | | | | | | | | | | | | | | | | | | | | | | |
| (2) | If the Portfolio is a seller of protection and a credit event occurs, as defined under the terms of that particular swap agreement, the Portfolio will either (i) pay to the buyer of protection an amount equal to the notional amount of the swap and take delivery |
| | | | | | |
| 96 | | PIMCO MANAGED ACCOUNTS TRUST | | | | See Accompanying Notes |
(Unaudited)
June 30, 2016
| | of the referenced obligation or underlying securities comprising the referenced index or (ii) pay a net settlement amount in the form of cash or securities equal to the notional amount of the swap less the recovery value of the referenced obligation or underlying securities comprising the referenced index. |
| (3) | The maximum potential amount the Portfolio could be required to pay as a seller of credit protection or receive as a buyer of credit protection if a credit event occurs as defined under the terms of that particular swap agreement. |
| (4) | The prices and resulting values for credit default swap agreements on credit indices serve as an indicator of the current status of the payment/performance risk and represent the likelihood of an expected liability (or profit) for the credit derivative should the notional amount of the swap agreement be closed/sold as of the period end. Increasing market values, in absolute terms when compared to the notional amount of the swap, represent a deterioration of the referenced indices’ credit soundness and a greater likelihood or risk of default or other credit event occurring as defined under the terms of the agreement. |
INTEREST RATE SWAPS
| | | | | | | | | | | | | | | | | | | | | | | | | | | | | | | | | | | | |
Counterparty | | Pay/
Receive
Floating
Rate | | Floating Rate Index | | Fixed
Rate | | | Maturity
Date | | | Notional
Amount | | | Premiums
Paid/
(Received) | | | Unrealized
Appreciation/
(Depreciation) | | | Swap Agreements,
at Value | |
| | | | | | | | | Asset | | | Liability | |
BOA | | Pay | | 1-Month GBP-UKRPI | | | 3.350% | | | | 08/15/2030 | | | | GBP | | | | 1,100 | | | $ | (13 | ) | | $ | 116 | | | $ | 103 | | | $ | 0 | |
| | Receive | | 3-Month
USD-CPURNSA Index | | | 1.010 | | | | 10/16/2017 | | | | $ | | | | 500 | | | | 0 | | | | 3 | | | | 3 | | | | 0 | |
| | Receive | | 3-Month
USD-CPURNSA Index * | | | 1.580 | | | | 05/23/2018 | | | | | | | | 2,800 | | | | 0 | | | | (2 | ) | | | 0 | | | | (2 | ) |
| | Receive | | 3-Month
USD-CPURNSA Index * | | | 1.565 | | | | 06/07/2018 | | | | | | | | 500 | | | | 0 | | | | 0 | | | | 0 | | | | 0 | |
| | Receive | | 3-Month
USD-CPURNSA Index | | | 1.560 | | | | 12/17/2020 | | | | | | | | 1,700 | | | | 0 | | | | (5 | ) | | | 0 | | | | (5 | ) |
| | Receive | | 3-Month
USD-CPURNSA Index | | | 1.493 | | | | 06/30/2021 | | | | | | | | 1,900 | | | | 0 | | | | 9 | | | | 9 | | | | 0 | |
| | Receive | | 3-Month
USD-CPURNSA Index | | | 1.730 | | | | 08/26/2025 | | | | | | | | 1,500 | | | | 0 | | | | (25 | ) | | | 0 | | | | (25 | ) |
| | | | | | | | | | | | | | | | | | | | | | | | | | | | | | | | | | | | |
BPS | | Pay | | 1-Month GBP-UKRPI | | | 3.400 | | | | 06/15/2030 | | | | GBP | | | | 900 | | | | 4 | | | | 97 | | | | 101 | | | | 0 | |
| | Receive | | 3-Month
EUR-EXT-CPI Index | | | 0.550 | | | | 10/15/2017 | | | | EUR | | | | 100 | | | | 0 | | | | (1 | ) | | | 0 | | | | (1 | ) |
| | Receive | | 3-Month
EUR-EXT-CPI Index | | | 1.090 | | | | 06/15/2026 | | | | | | | | 100 | | | | 0 | | | | (1 | ) | | | 0 | | | | (1 | ) |
| | Receive | | 3-Month
USD-CPURNSA Index | | | 1.560 | | | | 11/05/2016 | | | | $ | | | | 4,800 | | | | 0 | | | | (80 | ) | | | 0 | | | | (80 | ) |
| | | | | | | | | | | | | | | | | | | | | | | | | | | | | | | | | | | | |
CBK | | Pay | | 1-Month GBP-UKRPI | | | 3.190 | | | | 04/15/2030 | | | | GBP | | | | 1,700 | | | | 0 | | | | 112 | | | | 112 | | | | 0 | |
| | Pay | | 1-Month GBP-UKRPI | | | 3.350 | | | | 05/15/2030 | | | | | | | | 600 | | | | 0 | | | | 63 | | | | 63 | | | | 0 | |
| | Pay | | 1-Month GBP-UKRPI | | | 3.325 | | | | 08/15/2030 | | | | | | | | 900 | | | | (3 | ) | | | 81 | | | | 78 | | | | 0 | |
| | Pay | | 1-Month GBP-UKRPI | | | 3.275 | | | | 09/15/2030 | | | | | | | | 800 | | | | 0 | | | | 59 | | | | 59 | | | | 0 | |
| | Pay | | 1-Month GBP-UKRPI | | | 3.140 | | | | 04/15/2031 | | | | | | | | 40 | | | | 0 | | | | 1 | | | | 1 | | | | 0 | |
| | Receive | | 3-Month
EUR-EXT-CPI Index | | | 0.305 | | | | 09/15/2016 | | | | EUR | | | | 1,100 | | | | 0 | | | | (4 | ) | | | 0 | | | | (4 | ) |
| | Pay | | 3-Month
EUR-EXT-CPI Index | | | 0.830 | | | | 05/15/2018 | | | | | | | | 3,300 | | | | 0 | | | | (3 | ) | | | 0 | | | | (3 | ) |
| | Receive | | 3-Month
EUR-EXT-CPI Index | | | 0.655 | | | | 08/15/2018 | | | | | | | | 100 | | | | 0 | | | | (1 | ) | | | 0 | | | | (1 | ) |
| | Receive | | 3-Month
EUR-EXT-CPI Index | | | 0.640 | | | | 09/15/2018 | | | | | | | | 100 | | | | 0 | | | | (1 | ) | | | 0 | | | | (1 | ) |
| | Receive | | 3-Month
EUR-EXT-CPI Index | | | 0.650 | | | | 10/15/2018 | | | | | | | | 200 | | | | 0 | | | | (2 | ) | | | 0 | | | | (2 | ) |
| | Receive | | 3-Month
EUR-EXT-CPI Index | | | 0.875 | | | | 05/15/2021 | | | | | | | | 2,500 | | | | 0 | | | | (14 | ) | | | 0 | | | | (14 | ) |
| | Pay | | 3-Month
EUR-EXT-CPI Index | | | 1.178 | | | | 05/15/2026 | | | | | | | | 600 | | | | 0 | | | | 10 | | | | 10 | | | | 0 | |
| | Receive | | 3-Month
EUR-EXT-CPI Index | | | 1.090 | | | | 06/15/2026 | | | | | | | | 200 | | | | 0 | | | | (2 | ) | | | 0 | | | | (2 | ) |
| | Receive | | 3-Month
USD-CPURNSA Index | | | 2.250 | | | | 07/15/2017 | | | | $ | | | | 15,000 | | | | 4 | | | | (842 | ) | | | 0 | | | | (838 | ) |
| | | | | | | | | | | | | | | | | | | | | | | | | | | | | | | | | | | | |
| | | | | | |
| See Accompanying Notes | | SEMIANNUAL REPORT | | JUNE 30, 2016 | | 97 |
Schedule of Investments PIMCO Fixed Income SHares: Series R (Cont.)
| | | | | | | | | | | | | | | | | | | | | | | | | | | | | | | | | | | | |
Counterparty | | Pay/
Receive
Floating
Rate | | Floating Rate Index | | Fixed
Rate | | | Maturity
Date | | | Notional
Amount | | | Premiums
Paid/
(Received) | | | Unrealized
Appreciation/
(Depreciation) | | | Swap Agreements,
at Value | |
| | | | | | | | | Asset | | | Liability | |
DUB | | Pay | | 1-Month GBP-UKRPI | | | 3.325% | | | | 08/15/2030 | | | | GBP | | | | 1,800 | | | $ | 4 | | | $ | 153 | | | $ | 157 | | | $ | 0 | |
| | Pay | | 1-Month GBP-UKRPI | | | 3.100 | | | | 06/15/2031 | | | | | | | | 400 | | | | 0 | | | | (3 | ) | | | 0 | | | | (3 | ) |
| | Receive | | 3-Month
EUR-EXT-CPI Index | | | 0.580 | | | | 10/15/2017 | | | | EUR | | | | 300 | | | | 0 | | | | (2 | ) | | | 0 | | | | (2 | ) |
| | Receive | | 3-Month
EUR-EXT-CPI Index | | | 0.570 | | | | 10/15/2017 | | | | | | | | 100 | | | | 0 | | | | (1 | ) | | | 0 | | | | (1 | ) |
| | Receive | | 3-Month
EUR-EXT-CPI Index | | | 0.605 | | | | 09/15/2018 | | | | | | | | 200 | | | | 0 | | | | (1 | ) | | | 0 | | | | (1 | ) |
| | Receive | | 3-Month
EUR-EXT-CPI Index | | | 0.650 | | | | 10/15/2018 | | | | | | | | 500 | | | | 0 | | | | (4 | ) | | | 0 | | | | (4 | ) |
| | Receive | | 3-Month
EUR-EXT-CPI Index | | | 1.090 | | | | 06/15/2026 | | | | | | | | 100 | | | | 0 | | | | (1 | ) | | | 0 | | | | (1 | ) |
| | Receive | | 3-Month
USD-CPURNSA Index | | | 2.360 | | | | 01/28/2017 | | | | $ | | | | 8,200 | | | | 0 | | | | (416 | ) | | | 0 | | | | (416 | ) |
| | Receive | | 3-Month
USD-CPURNSA Index | | | 1.725 | | | | 03/04/2019 | | | | | | | | 1,175 | | | | 0 | | | | (17 | ) | | | 0 | | | | (17 | ) |
| | Receive | | 3-Month
USD-CPURNSA Index | | | 1.510 | | | | 12/23/2019 | | | | | | | | 14,000 | | | | 0 | | | | (212 | ) | | | 0 | | | | (212 | ) |
| | Receive | | 3-Month
USD-CPURNSA Index | | | 2.500 | | | | 07/15/2022 | | | | | | | | 5,000 | | | | 103 | | | | (753 | ) | | | 0 | | | | (650 | ) |
| | | | | | | | | | | | | | | | | | | | | | | | | | | | | | | | | | | | |
FBF | | Pay | | 1-Month GBP-UKRPI | | | 3.335 | | | | 04/15/2035 | | | | GBP | | | | 300 | | | | 0 | | | | 34 | | | | 34 | | | | 0 | |
| | Receive | | 3-Month
EUR-EXT-CPI Index | | | 0.615 | | | | 09/15/2018 | | | | EUR | | | | 200 | | | | 0 | | | | (2 | ) | | | 0 | | | | (2 | ) |
| | | | | | | | | | | | | | | | | | | | | | | | | | | | | | | | | | | | |
GLM | | Pay | | 1-Month GBP-UKRPI | | | 3.400 | | | | 06/15/2030 | | | | GBP | | | | 500 | | | | 2 | | | | 54 | | | | 56 | | | | 0 | |
| | Pay | | 1-Month GBP-UKRPI | | | 3.325 | | | | 08/15/2030 | | | | | | | | 1,250 | | | | (4 | ) | | | 113 | | | | 109 | | | | 0 | |
| | Pay | | 1-Month GBP-UKRPI | | | 3.358 | | | | 04/15/2035 | | | | | | | | 400 | | | | 0 | | | | 49 | | | | 49 | | | | 0 | |
| | Receive | | 1-Month GBP-UKRPI | | | 3.145 | | | | 05/15/2046 | | | | | | | | 850 | | | | 15 | | | | (26 | ) | | | 0 | | | | (11 | ) |
| | Receive | | 1-Month GBP-UKRPI | | | 3.120 | | | | 06/15/2046 | | | | | | | | 400 | | | | 0 | | | | 7 | | | | 7 | | | | 0 | |
| | Receive | | 3-Month
EUR-EXT-CPI Index | | | 0.650 | | | | 09/15/2018 | | | | EUR | | | | 500 | | | | (1 | ) | | | (3 | ) | | | 0 | | | | (4 | ) |
| | Receive | | 3-Month
EUR-EXT-CPI Index | | | 1.090 | | | | 06/15/2026 | | | | | | | | 200 | | | | 0 | | | | (2 | ) | | | 0 | | | | (2 | ) |
| | Receive | | 3-Month
USD-CPURNSA Index | | | 2.033 | | | | 04/15/2018 | | | | $ | | | | 5,300 | | | | 0 | | | | (233 | ) | | | 0 | | | | (233 | ) |
| | | | | | | | | | | | | | | | | | | | | | | | | | | | | | | | | | | | |
JPM | | Pay | | 1-Month GBP-UKRPI | | | 3.400 | | | | 06/15/2030 | | | | GBP | | | | 100 | | | | 0 | | | | 11 | | | | 11 | | | | 0 | |
| | Receive | | 3-Month
EUR-EXT-CPI Index | | | 0.320 | | | | 09/15/2016 | | | | EUR | | | | 5,500 | | | | 0 | | | | (23 | ) | | | 0 | | | | (23 | ) |
| | Receive | | 3-Month
EUR-EXT-CPI Index | | | 0.580 | | | | 10/15/2017 | | | | | | | | 300 | | | | 0 | | | | (2 | ) | | | 0 | | | | (2 | ) |
| | | | | | | | | | | | | | | | | | | | | | | | | | | | | | | | | | | | |
MYC | | Pay | | 1-Month GBP-UKRPI | | | 3.320 | | | | 05/15/2030 | | | | GBP | | | | 1,200 | | | | 0 | | | | 116 | | | | 116 | | | | 0 | |
| | Receive | | 3-Month
USD-CPURNSA Index | | | 1.548 | | | | 12/21/2020 | | | | $ | | | | 4,000 | | | | 0 | | | | (10 | ) | | | 0 | | | | (10 | ) |
| | | | | | | | | | | | | | | | | | | | | | | | | | | | | | | | | | | | |
RYL | | Receive | | 3-Month
USD-CPURNSA Index | | | 1.930 | | | | 10/31/2016 | | | | | | | | 7,800 | | | | 0 | | | | (210 | ) | | | 0 | | | | (210 | ) |
| | Receive | | 3-Month
USD-CPURNSA Index | | | 2.250 | | | | 07/15/2017 | | | | | | | | 4,100 | | | | 14 | | | | (243 | ) | | | 0 | | | | (229 | ) |
| | | | | | | | | | | | | | | | | | | | | | | | | | | | | | | | | | | | |
UAG | | Receive | | 3-Month
EUR-EXT-CPI Index | | | 0.525 | | | | 10/15/2017 | | | | EUR | | | | 800 | | | | 0 | | | | (5 | ) | | | 0 | | | | (5 | ) |
| | Receive | | 3-Month
EUR-EXT-CPI Index | | | 0.610 | | | | 09/15/2018 | | | | | | | | 1,000 | | | | 0 | | | | (8 | ) | | | 0 | | | | (8 | ) |
| | | | | | | | | | | | | | | | | | | | | | | | | | | | | | | | | | | | |
| | | | | | | | | | | | | | | | | | | | | | $ | 125 | | | $ | (2,072 | ) | | $ | 1,078 | | | $ | (3,025 | ) |
| | | | | | | | | | | | | | | | | | | | | | | | | | | | | | | | | | | | |
Total Swap Agreements | | | $ | 90 | | | $ | (2,066 | ) | | $ | 1,078 | | | $ | (3,054 | ) |
| | | | | | | | | | | | | | | | | | | | | | | | | | | | | | | | | | | | |
| * | This security has a forward starting effective date. See Note 2(a) in the Notes to Financial Statements for further information. |
| | | | | | |
| 98 | | PIMCO MANAGED ACCOUNTS TRUST | | | | See Accompanying Notes |
(Unaudited)
June 30, 2016
FINANCIAL DERIVATIVE INSTRUMENTS: OVER THE COUNTER SUMMARY
The following is a summary by counterparty of the market value of OTC financial derivative instruments and collateral (received)/pledged as of June 30, 2016:
| (j) | Securities with an aggregate market value of $4,612 have been pledged as collateral for financial derivative instruments as governed by International Swaps and Derivatives Association, Inc. master agreements as of June 30, 2016. |
| | | | | | | | | | | | | | | | | | | | | | | | | | | | | | | | | | | | | | | | | | | | | | | | |
| | | Financial Derivative Assets | | | | | | Financial Derivative Liabilities | | | | | | | | | | |
| Counterparty | | Forward
Foreign
Currency
Contracts | | | Purchased
Options | | | Swap
Agreements | | | Total
Over
the
Counter | | | | | | Forward
Foreign
Currency
Contracts | | | Written
Options | | | Swap
Agreements | | | Total
Over
the
Counter | | | Net Market
Value
of OTC
Derivatives | | | Collateral
(Received)/
Pledged | | | Net
Exposure (5) | |
BOA | | $ | 291 | | | $ | 0 | | | $ | 115 | | | $ | 406 | | | | | | | $ | (59 | ) | | $ | 0 | | | $ | (32 | ) | | $ | (91 | ) | | $ | 315 | | | $ | (260 | ) | | $ | 55 | |
BPS | | | 175 | | | | 0 | | | | 101 | | | | 276 | | | | | | | | (418 | ) | | | (34 | ) | | | (82 | ) | | | (534 | ) | | | (258 | ) | | | 263 | | | | 5 | |
BRC | | | 10 | | | | 0 | | | | 0 | | | | 10 | | | | | | | | (10 | ) | | | 0 | | | | 0 | | | | (10 | ) | | | 0 | | | | 0 | | | | 0 | |
CBK | | | 9 | | | | 27 | | | | 323 | | | | 359 | | | | | | | | (18 | ) | | | (41 | ) | | | (865 | ) | | | (924 | ) | | | (565 | ) | | | 393 | | | | (172) | |
DUB | | | 0 | | | | 517 | | | | 157 | | | | 674 | | | | | | | | (27 | ) | | | (113 | ) | | | (1,331 | ) | | | (1,471 | ) | | | (797 | ) | | | 793 | | | | (4 | ) |
FBF | | | 0 | | | | 1 | | | | 34 | | | | 35 | | | | | | | | 0 | | | | (224 | ) | | | (2 | ) | | | (226 | ) | | | (191 | ) | | | 272 | | | | 81 | |
GLM | | | 38 | | | | 44 | | | | 221 | | | | 303 | | | | | | | | (1,708 | ) | | | (79 | ) | | | (250 | ) | | | (2,037 | ) | | | (1,734 | ) | | | 1,665 | | | | (69 | ) |
HUS | | | 7 | | | | 0 | | | | 0 | | | | 7 | | | | | | | | 0 | | | | 0 | | | | 0 | | | | 0 | | | | 7 | | | | 0 | | | | 7 | |
JPM | | | 308 | | | | 10 | | | | 11 | | | | 329 | | | | | | | | (1,162 | ) | | | (99 | ) | | | (25 | ) | | | (1,286 | ) | | | (957 | ) | | | 533 | | | | (424 | ) |
MSB | | | 0 | | | | 0 | | | | 0 | | | | 0 | | | | | | | | (75 | ) | | | (7 | ) | | | 0 | | | | (82 | ) | | | (82 | ) | | | 0 | | | | (82 | ) |
MYC | | | 0 | | | | 366 | | | | 116 | | | | 482 | | | | | | | | 0 | | | | (358 | ) | | | (15 | ) | | | (373 | ) | | | 109 | | | | 0 | | | | 109 | |
RYL | | | 0 | | | | 0 | | | | 0 | | | | 0 | | | | | | | | 0 | | | | 0 | | | | (439 | ) | | | (439 | ) | | | (439 | ) | | | 634 | | | | 195 | |
SCX | | | 88 | | | | 0 | | | | 0 | | | | 88 | | | | | | | | (94 | ) | | | 0 | | | | 0 | | | | (94 | ) | | | (6 | ) | | | 0 | | | | (6 | ) |
UAG | | | 15 | | | | 0 | | | | 0 | | | | 15 | | | | | | | | (27 | ) | | | 0 | | | | (13 | ) | | | (40 | ) | | | (25 | ) | | | 0 | | | | (25 | ) |
| | | | | | | | | | | | | | | | | | | | | | | | | | | | | | | | | | | | | | | | | | | | | | | | |
Total Over
the Counter | | $ | 941 | | | $ | 965 | | | $ | 1,078 | | | $ | 2,984 | | | | | | | $ | (3,598) | | | $ | (955) | | | $ | (3,054) | | | $ | (7,607) | | | | | | | | | | | | | |
| | | | | | | | | | | | | | | | | | | | | | | | | | | | | | | | | | | | | | | | | | | | | | | | |
| (5) | Net Exposure represents the net receivable/(payable) that would be due from/to the counterparty in the event of default. Exposure from OTC financial derivative instruments can only be netted across transactions governed under the same master agreement with the same legal entity. See Note 7, Principal Risks, in the Notes to Financial Statements for more information regarding master netting arrangements. |
FAIR VALUE OF FINANCIAL DERIVATIVE INSTRUMENTS
The following is a summary of the fair valuation of the Portfolio’s derivative instruments categorized by risk exposure. See Note 7, Principal Risks, in the Notes to Financial Statements on risks of the Portfolio.
Fair Values of Financial Derivative Instruments on the Statements of Assets and Liabilities as of June 30, 2016:
| | | | | | | | | | | | | | | | | | | | | | | | |
| | | Derivatives not accounted for as hedging instruments | |
| | | Commodity
Contracts | | | Credit
Contracts | | | Equity
Contracts | | | Foreign
Exchange
Contracts | | | Interest
Rate Contracts | | | Total | |
Financial Derivative Instruments - Assets | | | | | | | | | | | | | | | | | | | | | | | | |
Exchange-traded or centrally cleared | | | | | | | | | | | | | | | | | | | | | | | | |
Futures | | $ | 0 | | | $ | 0 | | | $ | 0 | | | $ | 0 | | | $ | 65 | | | $ | 65 | |
Swap Agreements | | | 0 | | | | 0 | | | | 0 | | | | 0 | | | | 174 | | | | 174 | |
| | | | | | | | | | | | | | | | | | | | | | | | |
| | $ | 0 | | | $ | 0 | | | $ | 0 | | | $ | 0 | | | $ | 239 | | | $ | 239 | |
| | | | | | | | | | | | | | | | | | | | | | | | |
Over the counter | | | | | | | | | | | | | | | | | | | | | | | | |
Forward Foreign Currency Contracts | | $ | 0 | | | $ | 0 | | | $ | 0 | | | $ | 941 | | | $ | 0 | | | $ | 941 | |
Purchased Options | | | 0 | | | | 0 | | | | 0 | | | | 0 | | | | 965 | | | | 965 | |
Swap Agreements | | | 0 | | | | 0 | | | | 0 | | | | 0 | | | | 1,078 | | | | 1,078 | |
| | | | | | | | | | | | | | | | | | | | | | | | |
| | $ | 0 | | | $ | 0 | | | $ | 0 | | | $ | 941 | | | $ | 2,043 | | | $ | 2,984 | |
| | | | | | | | | | | | | | | | | | | | | | | | |
| | $ | 0 | | | $ | 0 | | | $ | 0 | | | $ | 941 | | | $ | 2,282 | | | $ | 3,223 | |
| | | | | | | | | | | | | | | | | | | | | | | | |
| | | | | | |
| See Accompanying Notes | | SEMIANNUAL REPORT | | JUNE 30, 2016 | | 99 |
Schedule of Investments PIMCO Fixed Income SHares: Series R (Cont.)
| | | | | | | | | | | | | | | | | | | | | | | | |
| | | Derivatives not accounted for as hedging instruments | |
| | | Commodity
Contracts | | | Credit
Contracts | | | Equity
Contracts | | | Foreign
Exchange
Contracts | | | Interest
Rate Contracts | | | Total | |
Financial Derivative Instruments - Liabilities | | | | | | | | | | | | | | | | | | | | | | | | |
Exchange-traded or centrally cleared | | | | | | | | | | | | | | | | | | | | | | | | |
Futures | | $ | 0 | | | $ | 0 | | | $ | 0 | | | $ | 0 | | | $ | 42 | | | $ | 42 | |
Swap Agreements | | | 0 | | | | 28 | | | | 0 | | | | 0 | | | | 24 | | | | 52 | |
| | | | | | | | | | | | | | | | | | | | | | | | |
| | $ | 0 | | | $ | 28 | | | $ | 0 | | | $ | 0 | | | $ | 66 | | | $ | 94 | |
| | | | | | | | | | | | | | | | | | | | | | | | |
Over the counter | | | | | | | | | | | | | | | | | | | | | | | | |
Forward Foreign Currency Contracts | | $ | 0 | | | $ | 0 | | | $ | 0 | | | $ | 3,598 | | | $ | 0 | | | $ | 3,598 | |
Written Options | | | 0 | | | | 10 | | | | 0 | | | | 84 | | | | 861 | | | | 955 | |
Swap Agreements | | | 0 | | | | 29 | | | | 0 | | | | 0 | | | | 3,025 | | | | 3,054 | |
| | | | | | | | | | | | | | | | | | | | | | | | |
| | $ | 0 | | | $ | 39 | | | $ | 0 | | | $ | 3,682 | | | $ | 3,886 | | | $ | 7,607 | |
| | | | | | | | | | | | | | | | | | | | | | | | |
| | $ | 0 | | | $ | 67 | | | $ | 0 | | | $ | 3,682 | | | $ | 3,952 | | | $ | 7,701 | |
| | | | | | | | | | | | | | | | | | | | | | | | |
The effect of Financial Derivative Instruments on the Statements of Operations for the period ended June 30, 2016:
| | | | | | | | | | | | | | | | | | | | | | | | |
| | | Derivatives not accounted for as hedging instruments | |
| | | Commodity
Contracts | | | Credit
Contracts | | | Equity
Contracts | | | Foreign
Exchange
Contracts | | | Interest
Rate Contracts | | | Total | |
Net Realized Gain (Loss) on Financial Derivative Instruments | |
Exchange-traded or centrally cleared | | | | | | | | | | | | | | | | | | | | | | | | |
Purchased Options | | $ | 0 | | | $ | 0 | | | $ | 0 | | | $ | 0 | | | $ | (15 | ) | | $ | (15 | ) |
Written Options | | | 0 | | | | 0 | | | | 0 | | | | 0 | | | | 10 | | | | 10 | |
Futures | | | 0 | | | | 0 | | | | 0 | | | | 0 | | | | (12 | ) | | | (12 | ) |
Swap Agreements | | | 0 | | | | (172 | ) | | | 0 | | | | 0 | | | | (5,638 | ) | | | (5,810 | ) |
| | | | | | | | | | | | | | | | | | | | | | | | |
| | $ | 0 | | | $ | (172 | ) | | $ | 0 | | | $ | 0 | | | $ | (5,655 | ) | | $ | (5,827 | ) |
| | | | | | | | | | | | | | | | | | | | | | | | |
Over the counter | | | | | | | | | | | | | | | | | | | | | | | | |
Forward Foreign Currency Contracts | | $ | 0 | | | $ | 0 | | | $ | 0 | | | $ | (775 | ) | | $ | 0 | | | $ | (775 | ) |
Purchased Options | | | 0 | | | | 0 | | | | 0 | | | | (5 | ) | | | (481 | ) | | | (486 | ) |
Written Options | | | 0 | | | | 20 | | | | 0 | | | | 30 | | | | 491 | | | | 541 | |
Swap Agreements | | | 0 | | | | (334 | ) | | | 0 | | | | 0 | | | | (281 | ) | | | (615 | ) |
| | | | | | | | | | | | | | | | | | | | | | | | |
| | $ | 0 | | | $ | (314 | ) | | $ | 0 | | | $ | (750 | ) | | $ | (271 | ) | | $ | (1,335 | ) |
| | | | | | | | | | | | | | | | | | | | | | | | |
| | $ | 0 | | | $ | (486 | ) | | $ | 0 | | | $ | (750 | ) | | $ | (5,926 | ) | | $ | (7,162 | ) |
| | | | | | | | | | | | | | | | | | | | | | | | |
| |
Net Change in Unrealized Appreciation (Depreciation) on Financial Derivative Instruments | | | | | |
Exchange-traded or centrally cleared | | | | | | | | | | | | | | | | | | | | | | | | |
Purchased Options | | $ | 0 | | | $ | 0 | | | $ | 0 | | | $ | 0 | | | $ | (6 | ) | | $ | (6 | ) |
Futures | | | 0 | | | | 0 | | | | 0 | | | | 0 | | | | 223 | | | | 223 | |
Swap Agreements | | | 0 | | | | (88 | ) | | | 0 | | | | 0 | | | | (1,604 | ) | | | (1,692 | ) |
| | | | | | | | | | | | | | | | | | | | | | | | |
| | $ | 0 | | | $ | (88 | ) | | $ | 0 | | | $ | 0 | | | $ | (1,387 | ) | | $ | (1,475 | ) |
| | | | | | | | | | | | | | | | | | | | | | | | |
Over the counter | | | | | | | | | | | | | | | | | | | | | | | | |
Forward Foreign Currency Contracts | | $ | 0 | | | $ | 0 | | | $ | 0 | | | $ | (2,324 | ) | | $ | 0 | | | $ | (2,324 | ) |
Purchased Options | | | 0 | | | | 0 | | | | 0 | | | | (11 | ) | | | (383 | ) | | | (394 | ) |
Written Options | | | 0 | | | | 10 | | | | 0 | | | | (16 | ) | | | (33 | ) | | | (39 | ) |
Swap Agreements | | | 0 | | | | 571 | | | | 0 | | | | 0 | | | | 1,398 | | | | 1,969 | |
| | | | | | | | | | | | | | | | | | | | | | | | |
| | $ | 0 | | | $ | 581 | | | $ | 0 | | | $ | (2,351 | ) | | $ | 982 | | | $ | (788 | ) |
| | | | | | | | | | | | | | | | | | | | | | | | |
| | $ | 0 | | | $ | 493 | | | $ | 0 | | | $ | (2,351 | ) | | $ | (405 | ) | | $ | (2,263 | ) |
| | | | | | | | | | | | | | | | | | | | | | | | |
| | | | | | |
| 100 | | PIMCO MANAGED ACCOUNTS TRUST | | | | See Accompanying Notes |
(Unaudited)
June 30, 2016
FAIR VALUE MEASUREMENTS
The following is a summary of the fair valuations according to the inputs used as of June 30, 2016 in valuing the Portfolio’s assets and liabilities:
| | | | | | | | | | | | | | | | |
| Category and Subcategory | | Level 1 | | | Level 2 | | | Level 3 | | | Fair
Value at
06/30/2016 | |
Investments in Securities, at Value | | | | | | | | | | | | | | | | |
Corporate Bonds & Notes | | | | | | | | | | | | | | | | |
Banking & Finance | | $ | 0 | | | $ | 18,439 | | | $ | 0 | | | $ | 18,439 | |
Industrials | | | 0 | | | | 4,325 | | | | 0 | | | | 4,325 | |
Utilities | | | 0 | | | | 1,084 | | | | 0 | | | | 1,084 | |
U.S. Government Agencies | | | 0 | | | | 26,794 | | | | 0 | | | | 26,794 | |
U.S. Treasury Obligations | | | 0 | | | | 154,338 | | | | 0 | | | | 154,338 | |
Non-Agency Mortgage-Backed Securities | | | 0 | | | | 5,784 | | | | 0 | | | | 5,784 | |
Asset-Backed Securities | | | 0 | | | | 11,053 | | | | 0 | | | | 11,053 | |
Sovereign Issues | | | 0 | | | | 34,456 | | | | 66 | | | | 34,522 | |
Short-Term Instruments | | | | | | | | | | | | | | | | |
Repurchase Agreements | | | 0 | | | | 831 | | | | 0 | | | | 831 | |
Japan Treasury Bills | | | 0 | | | | 3,585 | | | | 0 | | | | 3,585 | |
| | | | |
Total Investments | | $ | 0 | | | $ | 260,689 | | | $ | 66 | | | $ | 260,755 | |
| | | | |
Financial Derivative Instruments - Assets | | | | | | | | | | | | | | | | |
Exchange-traded or centrally cleared | | | 65 | | | | 174 | | | | 0 | | | | 239 | |
Over the counter | | | 0 | | | | 2,984 | | | | 0 | | | | 2,984 | |
| | $ | 65 | | | $ | 3,158 | | | $ | 0 | | | $ | 3,223 | |
| | | | |
Financial Derivative Instruments - Liabilities | | | | | | | | | | | | | | | | |
Exchange-traded or centrally cleared | | | (42) | | | | (52 | ) | | | 0 | | | | (94 | ) |
Over the counter | | | 0 | | | | (7,607 | ) | | | 0 | | | | (7,607 | ) |
| | $ | (42 | ) | | $ | (7,659 | ) | | $ | 0 | | | $ | (7,701 | ) |
| | | | |
Totals | | $ | 23 | | | $ | 256,188 | | | $ | 66 | | | $ | 256,277 | |
There were no significant transfers between Levels 1, 2, or 3 during the period ended June 30, 2016.
| | | | | | |
| See Accompanying Notes | | SEMIANNUAL REPORT | | JUNE 30, 2016 | | 101 |
Schedule of Investments PIMCO Fixed Income SHares: Series TE
| | | | | | | | | | | | |
| | | | | PRINCIPAL
AMOUNT
(000S) | | | | | MARKET
VALUE
(000S) | |
| INVESTMENTS IN SECURITIES 105.3% | |
| | | | | | | | | | | | |
| MUNICIPAL BONDS & NOTES 95.8% | |
| | | | | | | | | | | | |
| ARIZONA 2.4% | |
Phoenix Civic Improvement Corp., Arizona Revenue Bonds, Series 2010 | |
5.000% due 07/01/2028 | | $ | | | 1,000 | | | $ | | | 1,148 | |
Salt River Project Agricultural Improvement & Power District, Arizona Revenue Bonds, Series 2012 | |
5.000% due 12/01/2030 | | | | | 1,000 | | | | | | 1,214 | |
| | | | | | | | | | | | |
| | | | | | | | | | | 2,362 | |
| | | | | | | | | | | | |
| | | | | | | | | | | | |
| CALIFORNIA 8.9% | |
Alameda Community Facilities District, California Special Tax Bonds, Series 2016 | |
5.000% due 09/01/2042 | | | | | 1,105 | | | | | | 1,286 | |
Alameda Corridor Transportation Authority, California Revenue Bonds, (AGM Insured), Series 2016 | |
5.000% due 10/01/2036 | | | | | 1,500 | | | | | | 1,854 | |
Bay Area Toll Authority, California Revenue Bonds, Series 2013 | |
5.000% due 04/01/2038 | | | | | 2,000 | | | | | | 2,392 | |
California County Tobacco Securitization Agency Revenue Bonds, Series 2002 | |
5.750% due 06/01/2029 | | | | | 1,710 | | | | | | 1,711 | |
California Health Facilities Financing Authority Revenue Bonds, Series 2013 | |
5.000% due 07/01/2043 | | | | | 1,000 | | | | | | 1,167 | |
Kaweah Delta Health Care District, California Revenue Bonds, Series 2015 | |
4.000% due 06/01/2045 | | | | | 500 | | | | | | 546 | |
| | | | | | | | | | | | |
| | | | | | | | | | | 8,956 | |
| | | | | | | | | | | | |
| | | | | | | | | | | | |
| COLORADO 2.5% | |
Colorado Health Facilities Authority Revenue Bonds, Series 2013 | |
5.000% due 12/01/2033 | | | | | 2,125 | | | | | | 2,537 | |
| | | | | | | | | | | | |
| | | | | | | | | | | | |
| CONNECTICUT 1.2% | |
Connecticut State Health & Educational Facility Authority Revenue Bonds, Series 2014 | |
5.000% due 07/01/2026 | | | | | 1,000 | | | | | | 1,219 | |
| | | | | | | | | | | | |
| | | | | | | | | | | | |
| FLORIDA 2.2% | |
Broward County, Florida Airport System Revenue Bonds, Series 2012 | |
5.000% due 10/01/2037 | | | | | 1,300 | | | | | | 1,527 | |
| | | | | | | | | | | | |
| | | | | PRINCIPAL
AMOUNT
(000S) | | | | | MARKET
VALUE
(000S) | |
Miami-Dade County, Florida Water & Sewer System Revenue Bonds, Series 2013 | |
5.000% due 10/01/2028 | | $ | | | 555 | | | $ | | | 686 | |
| | | | | | | | | | | | |
| | | | | | | | | | | 2,213 | |
| | | | | | | | | | | | |
| | | | | | | | | | | | |
| ILLINOIS 12.9% | |
Chicago, Illinois General Obligation Bonds, Series 2015 | |
5.250% due 01/01/2028 | | | | | 2,000 | | | | | | 2,063 | |
Chicago, Illinois Waterworks Revenue Bonds, Series 1999 | |
5.000% due 11/01/2030 | | | | | 1,000 | | | | | | 1,212 | |
Illinois State General Obligation Bonds, Series 2012 | |
5.000% due 03/01/2037 | | | | | 500 | | | | | | 538 | |
Illinois State General Obligation Bonds, Series 2013 | |
5.500% due 07/01/2038 | | | | | 3,500 | | | | | | 3,940 | |
Illinois State General Obligation Bonds, Series 2014 | |
5.000% due 04/01/2029 | | | | | 605 | | | | | | 671 | |
Illinois State General Obligation Bonds, Series 2016 | |
5.000% due 01/01/2027 | | | | | 2,000 | | | | | | 2,264 | |
Illinois State General Obligation Notes, Series 2016 | |
5.000% due 01/01/2026 | | | | | 2,000 | | | | | | 2,300 | |
| | | | | | | | | | | | |
| | | | | | | | | | | 12,988 | |
| | | | | | | | | | | | |
| | | | | | | | | | | | |
| KANSAS 2.4% | |
Kansas Development Finance Authority Revenue Bonds, Series 2012 | |
5.000% due 11/15/2034 | | | | | 2,000 | | | | | | 2,364 | |
| | | | | | | | | | | | |
| | | | | | | | | | | | |
| MAINE 1.7% | |
Maine Health & Higher Educational Facilities Authority Revenue Bonds, Series 2016 | |
5.000% due 07/01/2046 (a) | | | | | 1,500 | | | | | | 1,741 | |
| | | | | | | | | | | | |
| | | | | | | | | | | | |
| MASSACHUSETTS 2.4% | |
Massachusetts State College Building Authority Revenue Bonds, Series 2014 | |
5.000% due 05/01/2028 | | | | | 2,000 | | | | | | 2,458 | |
| | | | | | | | | | | | |
| | | | | | | | | | | | |
| MICHIGAN 2.2% | |
Michigan Finance Authority Revenue Notes, Series 2014 | |
4.000% due 10/01/2024 | | | | | 2,000 | | | | | | 2,228 | |
| | | | | | | | | | | | |
| |
| NEBRASKA 1.1% | |
Central Plains Energy Project, Nebraska Revenue Bonds, Series 2012 | |
5.000% due 09/01/2032 | | | | | 1,000 | | | | | | 1,145 | |
| | | | | | | | | | | | |
| | | | | | |
| 102 | | PIMCO MANAGED ACCOUNTS TRUST | | | | See Accompanying Notes |
(Unaudited)
June 30, 2016
| | | | | | | | | | | | |
| | | | | PRINCIPAL
AMOUNT
(000S) | | | | | MARKET
VALUE
(000S) | |
| NEW JERSEY 7.6% | |
New Jersey Educational Facilities Authority Revenue Bonds, Series 2016 | |
5.000% due 07/01/2033 (a) | | $ | | | 1,000 | | | $ | | | 1,186 | |
5.000% due 07/01/2041 (a) | | | | | 1,000 | | | | | | 1,187 | |
New Jersey Health Care Facilities Financing Authority Revenue Bonds, Series 2013 | |
5.250% due 07/01/2035 | | | | | 1,000 | | | | | | 1,180 | |
New Jersey Transportation Trust Fund Authority Revenue Bonds, Series 2010 | |
5.250% due 12/15/2023 | | | | | 1,985 | | | | | | 2,304 | |
New Jersey Transportation Trust Fund Authority Revenue Bonds, Series 2011 | |
5.250% due 06/15/2024 | | | | | 1,105 | | | | | | 1,239 | |
New Jersey Transportation Trust Fund Authority Revenue Bonds, Series 2015 | |
5.250% due 06/15/2029 | | | | | 500 | | | | | | 579 | |
| | | | | | | | | | | | |
| | | | | | | | | | | 7,675 | |
| | | | |
| |
| NEW YORK 11.1% | |
Metropolitan Transportation Authority, New York Revenue Bonds, Series 2012 | |
5.000% due 11/15/2028 | | | | | 1,340 | | | | | | 1,639 | |
New York Convention Center Development Corp. Revenue Bonds, Series 2015 | |
5.000% due 11/15/2029 | | | | | 2,500 | | | | | | 3,159 | |
New York State Urban Development Corp. Revenue Bonds, Series 2016 | |
5.000% due 03/15/2027 | | | | | 2,000 | | | | | | 2,598 | |
Tompkins County, New York Development Corp. Revenue Notes, Series 2013 | |
5.000% due 07/01/2020 | | | | | 1,130 | | | | | | 1,241 | |
Triborough Bridge & Tunnel Authority, New York Revenue Bonds, Series 2013 | |
5.000% due 11/15/2027 | | | | | 2,000 | | | | | | 2,461 | |
| | | | | | | | | | | | |
| | | | | | | | | | | 11,098 | |
| | | | |
| |
| NORTH CAROLINA 4.8% | |
North Carolina Turnpike Authority Revenue Bonds, Series 2011 | |
5.000% due 07/01/2024 | | | | | 1,000 | | | | | | 1,184 | |
Raleigh, North Carolina Combined Enterprise System Revenue Bonds, Series 2013 | |
5.000% due 03/01/2024 | | | | | 1,250 | | | | | | 1,568 | |
University of North Carolina at Greensboro Revenue Notes, Series 2014 | |
5.000% due 04/01/2024 | | | | | 1,660 | | | | | | 2,090 | |
| | | | | | | | | | | | |
| | | | | | | | | | | 4,842 | |
| | | | |
| | | | | | | | | | | | |
| | | | | PRINCIPAL
AMOUNT
(000S) | | | | | MARKET
VALUE
(000S) | |
| OHIO 6.7% | |
Ohio Air Quality Development Authority Revenue Bonds, Series 2006 | |
3.750% due 12/01/2023 | | $ | | | 4,000 | | | $ | | | 4,095 | |
Ohio State Water Development Authority Revenue Bonds, Series 2005 | |
4.000% due 01/01/2034 | | | | | 2,500 | | | | | | 2,597 | |
| | | | | | | | | | | | |
| | | | | | | | | | | 6,692 | |
| | | | |
| |
| PENNSYLVANIA 3.5% | |
Delaware River Port Authority, Pennsylvania Revenue Bonds, Series 2012 | |
5.000% due 01/01/2023 | | | | | 1,000 | | | | | | 1,178 | |
Pennsylvania Turnpike Commission Revenue Bonds, Series 2009 | |
5.000% due 12/01/2020 | | | | | 1,000 | | | | | | 1,138 | |
Pennsylvania Turnpike Commission Revenue Bonds, Series 2016 | |
5.000% due 12/01/2046 | | | | | 1,000 | | | | | | 1,177 | |
| | | | | | | | | | | | |
| | | | | | | | | | | 3,493 | |
| | | | |
| |
| RHODE ISLAND 1.1% | |
Tobacco Settlement Financing Corp., Rhode Island Revenue Bonds, Series 2015 | |
5.000% due 06/01/2050 | | | | | 1,000 | | | | | | 1,064 | |
| | | | | | | | | | | | |
| | | | | | | | | | | | |
| TENNESSEE 0.3% | |
Tennessee Energy Acquisition Corp. Revenue Bonds, Series 2006 | |
5.250% due 09/01/2024 | | | | | 200 | | | | | | 249 | |
| | | | | | | | | | | | |
| | | | | | | | | | | | |
| TEXAS 13.2% | |
Harris County, Texas General Obligation Bonds, Series 1997 | |
5.125% due 08/15/2024 | | | | | 1,580 | | | | | | 1,982 | |
Harris County, Texas Revenue Bonds, Series 2016 | |
5.000% due 08/15/2041 (a) | | | | | 2,000 | | | | | | 2,492 | |
New Hope Cultural Education Facilities Corp., Texas Revenue Bonds, Series 2016 | |
4.000% due 07/01/2036 | | | | | 1,000 | | | | | | 1,082 | |
Texas Municipal Gas Acquisition & Supply Corp. Revenue Bonds, Series 2006 | |
5.250% due 12/15/2023 | | | | | 1,000 | | | | | | 1,216 | |
Texas Municipal Gas Acquisition & Supply Corp. Revenue Bonds, Series 2008 | |
6.250% due 12/15/2026 | | | | | 5,000 | | | | | | 6,479 | |
| | | | | | | | | | | | |
| | | | | | | | | | | 13,251 | |
| | | | | | | | | | | | |
| | | | | | | | | | | | |
| VIRGINIA 4.8% | |
Fairfax County, Virginia Industrial Development Authority Revenue Bonds, Series 2016 | |
5.000% due 05/15/2031 | | | | | 750 | | | | | | 953 | |
| | | | | | |
| See Accompanying Notes | | SEMIANNUAL REPORT | | JUNE 30, 2016 | | 103 |
Schedule of Investments PIMCO Fixed Income SHares: Series TE (Cont.)
| | | | | | | | | | | | |
| | | | | PRINCIPAL
AMOUNT
(000S) | | | | | MARKET
VALUE
(000S) | |
Loudoun County, Virginia General Obligation Bonds, Series 2013 | |
5.000% due 12/01/2027 | | $ | | | 2,315 | | | $ | | | 2,872 | |
Louisa Industrial Development Authority, Virginia Revenue Bonds, Series 2008 | |
2.150% due 11/01/2035 | | | | | 1,000 | | | | | | 1,036 | |
| | | | | | | | | | | | |
| | | | | | | | | | | 4,861 | |
| | | | | | | | | | | | |
| | | | | | | | | | | | |
| WASHINGTON 1.6% | |
Energy Northwest, Washington Revenue Bonds, Series 2015 | |
5.000% due 07/01/2031 | | | | | 1,300 | | | | | | 1,640 | |
| | | | | | | | | | | | |
| | | | | | | | | | | | |
| WISCONSIN 1.2% | |
WPPI Energy, Wisconsin Revenue Bonds, Series 2013 | |
5.000% due 07/01/2025 | | | | | 1,000 | | | | | | 1,220 | |
| | | | | | | | | | | | |
Total Municipal Bonds & Notes
(Cost $89,758) | | | 96,296 | |
| | | | |
| | | | | | | | | | | | |
| | | | | | | | | | MARKET
VALUE
(000S) | |
| SHORT-TERM INSTRUMENTS 9.5% | |
| | | | | | | | | | | | |
| REPURCHASE AGREEMENTS (b) 9.5% | | | | |
| | | | | | | | $ | | | 9,500 | |
| | | | | | | | | | | | |
Total Short-Term Instruments
(Cost $9,500) | | | 9,500 | |
| | | | | | | | | | | | |
| |
Total Investments in Securities
(Cost $99,258) | | | 105,796 | |
| |
Total Investments 105.3%
(Cost $99,258) | | | $ | | | 105,796 | |
| |
Other Assets and Liabilities,
net (5.3)% | | | (5,341 | ) |
| | | | | | | | | | | | |
| Net Assets 100.0% | | | $ | | | 100,455 | |
| | | | | | | | | | | | |
NOTES TO SCHEDULE OF INVESTMENTS (AMOUNTS IN THOUSANDS*):
| * | A zero balance may reflect actual amounts rounding to less than one thousand. |
BORROWINGS AND OTHER FINANCING TRANSACTIONS
(b) REPURCHASE AGREEMENTS:
| | | | | | | | | | | | | | | | | | | | | | | | | | | | |
| Counterparty | | Lending
Rate | | Settlement
Date | | | Maturity
Date | | | Principal
Amount | | | Collateralized By | | Collateral
(Received) | | | Repurchase
Agreements,
at Value | | | Repurchase
Agreement
Proceeds
to be
Received (1) | |
BPG | | 0.750% | | | 06/30/2016 | | | | 07/01/2016 | | | $ | 9,500 | | | U.S. Treasury Inflation Protected Securities 0.125% due 04/15/2020 | | $ | (9,715 | ) | | $ | 9,500 | | | $ | 9,500 | |
| | | | | | | | | | | | | | | | | | | | | | | | | | | | |
Total Repurchase Agreements | | | | | $ | (9,715 | ) | | $ | 9,500 | | | $ | 9,500 | |
| | | | | | | | | | | | | | | | | | | | | | | | | | | | |
| (1) | Includes accrued interest. |
BORROWINGS AND OTHER FINANCING TRANSACTIONS SUMMARY
The following is a summary by counterparty of the market value of Borrowings and Other Financing Transactions and collateral (received) as of June 30, 2016:
| | | | | | | | | | | | | | | | | | | | | | | | |
| Counterparty | | Repurchase
Agreement
Proceeds
to be
Received | | | Payable for
Reverse
Repurchase
Agreements | | | Payable for
Sale-Buyback
Transactions | | | Total
Borrowings and
Other Financing
Transactions | | | Collateral
(Received) | | | Net
Exposure (2) | |
Global/Master Repurchase Agreement | | | | | | | | | | | | | | | | | | | | | | | | |
BPG | | $ | 9,500 | | | $ | 0 | | | $ | 0 | | | $ | 9,500 | | | $ | (9,715 | ) | | $ | (215 | ) |
| | | | | | | | | | | | | | | | | | | | | | | | |
Total Borrowings and Other Financing Transactions | | $ | 9,500 | | | $ | 0 | | | $ | 0 | | | | | | | | | | | | | |
| | | | | | | | | | | | | | | | | | | | | | | | |
| | | | | | |
| 104 | | PIMCO MANAGED ACCOUNTS TRUST | | | | See Accompanying Notes |
(Unaudited)
June 30, 2016
| (2) | Net Exposure represents the net receivable/(payable) that would be due from/to the counterparty in the event of default. Exposure from borrowings and other financing transactions can only be netted across transactions governed under the same master agreement with the same legal entity. See Note 7, Principal Risks, in the Notes to Financial Statements for more information regarding master netting arrangements. |
The following is a summary of the fair valuation of the Portfolio’s derivative instruments categorized by risk exposure. See Note 7, Principal Risks, in the Notes to Financial Statements on risks of the Portfolio.
The effect of Financial Derivative Instruments on the Statements of Operations for the period ended June 30, 2016:
| | | | | | | | | | | | | | | | | | | | | | | | |
| | | Derivatives not accounted for as hedging instruments | |
| | | Commodity
Contracts | | | Credit
Contracts | | | Equity
Contracts | | | Foreign
Exchange
Contracts | | | Interest
Rate Contracts | | | Total | |
Net Realized (Loss) on Financial Derivative Instruments | | | | | | | | | | | | | | | | | | | | | |
Exchange-traded or centrally cleared | | | | | | | | | | | | | | | | | | | | | | | | |
Futures | | $ | 0 | | | $ | 0 | | | $ | 0 | | | $ | 0 | | | $ | (655 | ) | | $ | (655 | ) |
| | | | | | | | | | | | | | | | | | | | | | | | |
FAIR VALUE MEASUREMENTS
The following is a summary of the fair valuations according to the inputs used as of June 30, 2016 in valuing the Portfolio’s assets and liabilities:
| | | | | | | | | | | | | | | | |
| Category and Subcategory | | Level 1 | | | Level 2 | | | Level 3 | | | Fair
Value at
06/30/2016 | |
Investments in Securities, at Value | | | | | | | | | | | | | | | | |
Municipal Bonds & Notes | | | | | | | | | | | | | | | | |
Arizona | | $ | 0 | | | $ | 2,362 | | | $ | 0 | | | $ | 2,362 | |
California | | | 0 | | | | 8,956 | | | | 0 | | | | 8,956 | |
Colorado | | | 0 | | | | 2,537 | | | | 0 | | | | 2,537 | |
Connecticut | | | 0 | | | | 1,219 | | | | 0 | | | | 1,219 | |
Florida | | | 0 | | | | 2,213 | | | | 0 | | | | 2,213 | |
Illinois | | | 0 | | | | 12,988 | | | | 0 | | | | 12,988 | |
Kansas | | | 0 | | | | 2,364 | | | | 0 | | | | 2,364 | |
Maine | | | 0 | | | | 1,741 | | | | 0 | | | | 1,741 | |
Massachusetts | | | 0 | | | | 2,458 | | | | 0 | | | | 2,458 | |
Michigan | | | 0 | | | | 2,228 | | | | 0 | | | | 2,228 | |
Nebraska | | | 0 | | | | 1,145 | | | | 0 | | | | 1,145 | |
New Jersey | | | 0 | | | | 7,675 | | | | 0 | | | | 7,675 | |
New York | | | 0 | | | | 11,098 | | | | 0 | | | | 11,098 | |
North Carolina | | | 0 | | | | 4,842 | | | | 0 | | | | 4,842 | |
Ohio | | | 0 | | | | 6,692 | | | | 0 | | | | 6,692 | |
Pennsylvania | | | 0 | | | | 3,493 | | | | 0 | | | | 3,493 | |
Rhode Island | | | 0 | | | | 1,064 | | | | 0 | | | | 1,064 | |
Tennessee | | | 0 | | | | 249 | | | | 0 | | | | 249 | |
Texas | | | 0 | | | | 13,251 | | | | 0 | | | | 13,251 | |
Virginia | | | 0 | | | | 4,861 | | | | 0 | | | | 4,861 | |
Washington | | | 0 | | | | 1,640 | | | | 0 | | | | 1,640 | |
Wisconsin | | | 0 | | | | 1,220 | | | | 0 | | | | 1,220 | |
Short-Term Instruments | | | | | | | | | | | | | | | | |
Repurchase Agreements | | | 0 | | | | 9,500 | | | | 0 | | | | 9,500 | |
| | | | |
Total Investments | | $ | 0 | | | $ | 105,796 | | | $ | 0 | | | $ | 105,796 | |
There were no significant transfers between Levels 1, 2, or 3 during the period ended June 30, 2016.
| | | | | | |
| See Accompanying Notes | | SEMIANNUAL REPORT | | JUNE 30, 2016 | | 105 |
Notes to Financial Statements
1. ORGANIZATION
PIMCO Managed Accounts Trust (the “Trust”), was organized as a Massachusetts business trust on November 3, 1999. The Trust is comprised of Fixed Income SHares (“FISH”): Series C, Series LD, Series M, Series R and Series TE (each a “Portfolio” or “Series” and collectively the “Portfolios” or “Series”). Each Portfolio has authorized an unlimited number of shares of beneficial interest with $0.001 par value. Pacific Investment Management Company LLC (“PIMCO” or the “Adviser”) serves as the Portfolios’ investment adviser and administrator.
2. SIGNIFICANT ACCOUNTING POLICIES
The following is a summary of significant accounting policies consistently followed by each Portfolio in the preparation of its financial statements in conformity with accounting principles generally accepted in the United States of America (“U.S. GAAP”). Each Portfolio is treated as an investment company under the reporting requirements of U.S. GAAP. The preparation of financial statements in accordance with U.S. GAAP requires management to make estimates and assumptions that affect the reported amounts of assets and liabilities and disclosure of contingent assets and liabilities at the date of the financial statements and the reported amounts of increases and decreases in net assets from operations during the reporting period. Actual results could differ from those estimates.
(a) Securities Transactions and Investment Income Securities transactions are recorded as of the trade date for financial reporting purposes. Securities purchased or sold on a when-issued or delayed-delivery basis may be settled 15 days or more after the trade date. Realized gains (losses) from securities sold are recorded on the identified cost basis. Dividend income is recorded on the ex- dividend date, except certain dividends from foreign securities where the ex-dividend date may have passed, which are recorded as soon as a Portfolio is informed of the ex-dividend date. Interest income, adjusted for the accretion of discounts and amortization of premiums, is recorded on the accrual basis from settlement date, with the exception of securities with a forward starting effective date, where interest income is recorded on the accrual basis from effective date. For convertible securities, premiums attributable to the conversion feature are not amortized. Estimated tax liabilities on certain foreign securities are recorded on an accrual basis and are reflected as components of interest income or net change in unrealized appreciation (depreciation) on investments on the Statements of Operations, as appropriate. Tax liabilities realized as a result of such security sales are reflected as a component of net realized gain (loss) on investments on the Statements of Operations. Paydown gains (losses) on mortgage-related and other asset-backed securities are recorded as components of interest income on the Statements of Operations.
Debt obligations may be placed on non-accrual status and related interest income may be reduced by ceasing current accruals and writing off interest receivable when the collection of all or a portion of interest has become doubtful based on consistently applied procedures. A debt obligation is removed from non-accrual status when the issuer resumes interest payments or when collectability of interest is probable.
(b) Cash and Foreign Currency The functional and reporting currency for the Portfolios is the U.S. dollar. The market values of foreign securities, currency holdings and other assets and liabilities are translated into U.S. dollars based on the current exchange rates each business day. Purchases and sales of securities and income and expense items denominated in foreign currencies, if any, are
| | | | | | |
| 106 | | PIMCO MANAGED ACCOUNTS TRUST | | | | |
(Unaudited)
June 30, 2016
translated into U.S. dollars at the exchange rate in effect on the transaction date. The Portfolios do not separately report the effects of changes in foreign exchange rates from changes in market prices on securities held. Such changes are included in net realized and net changes in unrealized appreciation (depreciation) from investments on the Statements of Operations. The Portfolios may invest in foreign currency-denominated securities and may engage in foreign currency transactions either on a spot (cash) basis at the rate prevailing in the currency exchange market at the time or through a forward foreign currency contract, please see Note 7, Principal Risks. Realized foreign exchange gains (losses) arising from sales of spot foreign currencies, currency gains (losses ) realized between the trade and settlement dates on securities transactions and the difference between the recorded amounts of dividends, interest, and foreign withholding taxes and the U.S. dollar equivalent of the amounts actually received or paid are included in net realized gain (loss) on foreign currency transactions on the Statements of Operations. Net unrealized foreign exchange gains (losses) arising from changes in foreign exchange rates on foreign denominated assets and liabilities other than investments in securities held at the end of the reporting period are included in net change in unrealized appreciation (depreciation) on foreign currency assets and liabilities on the Statements of Operations.
(c) Dividends and Distributions to Shareholders Each Portfolio distributes substantially all of its net investment income to shareholders in the form of dividends. Dividends are declared daily and paid monthly, generally on the last business day of the month. Net realized capital gains earned by each Portfolio, if any, will be distributed no less frequently than once each year. A Portfolio may engage in investment strategies, including the use of derivatives, to, among other things, generate current, distributable income even if such strategies could potentially result in declines in the Portfolio’s net asset value. A Portfolio’s income and gain-generating strategies, including certain derivatives strategies, may generate current income and gains taxable as ordinary income sufficient to support monthly distributions even in situations when the Portfolio has experienced a decline in net assets due to, for example, adverse changes in the broad U.S. or non-U.S. equity markets or the Portfolio’s debt investments, or arising from its use of derivatives. Consequently, common shareholders may receive distributions and owe tax at a time when their investment in a Portfolio has declined in value, which tax may be at ordinary income rates, and which may be economically similar to a taxable return of capital. The tax treatment of certain derivatives may be open to different interpretations. Any recharacterization of payments made or received by a Portfolio pursuant to derivatives potentially could affect the amount, timing or character of Portfolio distributions. In addition, the tax treatment of such investment strategies may be changed by regulation or otherwise.
Income distributions and capital gain distributions are determined in accordance with income tax regulations which may differ from U.S. GAAP. Differences between tax regulations and U.S. GAAP may cause timing differences between income and capital gain recognition. Further, the character of investment income and capital gains may be different for certain transactions under the two methods of accounting. As a result, income distributions and capital gain distributions declared during a fiscal period may differ significantly from the net investment income (loss) and realized gains (losses) reported on the Portfolio’s annual financial statements presented under U.S. GAAP.
If a Portfolio estimates that a portion of one of its dividend distributions may be comprised of amounts from sources other than net investment income, the Portfolio will notify shareholders of record of the estimated composition of such distribution through a Section 19 Notice. To determine the sources of a
| | | | | | |
| | SEMIANNUAL REPORT | | JUNE 30, 2016 | | 107 |
Notes to Financial Statements (Cont.)
Portfolio’s distributions during the reporting period, the Portfolio references its internal accounting records at the time the distribution is paid and generally bases its projections of the final tax character of those distributions on the tax characteristics of the distribution reflected in its internal accounting records at the time of such payment. If, based on such records, a particular distribution does not include capital gains or paid-in surplus or other capital sources, a Section 19 Notice generally would not be issued. It is important to note that differences exist between a Portfolio’s daily internal accounting records, the Portfolio’s financial statements presented in accordance with U.S. GAAP, and recordkeeping practices under income tax regulations. Examples of such differences may include, among others, the treatment of paydowns on mortgage-backed securities purchased at a discount and periodic payments under interest rate swap contracts. Notwithstanding a Portfolio’s estimates and projections, it is possible that a Portfolio may not issue a Section 19 Notice in situations where the Portfolio’s financial statements prepared later and in accordance with U.S. GAAP or the final tax character of those distributions might later report that the sources of those distributions included capital gains and/or a return of capital. Additionally, given differences in tax and U.S. GAAP treatment of certain distributions, a Portfolio may not issue a Section 19 Notice in situations where the Portfolio’s financial statements prepared later and in accordance with U.S. GAAP might report that the sources of these distributions included capital gains and/or a return of capital. Please visit www.pimco.com for the most recent Section 19 Notice, if applicable, for additional information regarding the composition of distributions. Final determination of a distribution’s tax character will be reported on Form 1099 DIV sent to shareholders each January.
Distributions classified as a tax basis return of capital, if any, are reflected on the Statements of Changes in Net Assets and have been recorded to paid in capital. In addition, other amounts have been reclassified between undistributed (overdistributed) net investment income (loss), accumulated undistributed (overdistributed) net realized gains (losses) and/or paid in capital to more appropriately conform financial accounting to tax characterizations of distributions.
(d) Statement of Cash Flows U.S. GAAP requires entities providing financial statements that report both financial position and results of operations to also provide a statement of cash flows for each period for which results of operations are provided, but exempts investment companies meeting certain conditions. One of the conditions is that substantially all of the enterprise’s investments were carried at fair value during the period and classified as Level 1 or Level 2 in the fair value hierarchy in accordance with the requirements of U.S. GAAP. Another condition is that the enterprise had little or no debt, based on the average debt outstanding during the period, in relation to average total assets. Portfolios with certain degrees of borrowing activity, typically through the use of reverse repurchase agreements or sale-buyback transactions, have been determined to be at a level requiring a Statement of Cash Flows. Statements of Cash Flows, as applicable, have been prepared using the indirect method which requires net change in net assets resulting from operations to be adjusted to reconcile to net cash flows from operating activities.
(e) New Accounting Pronouncements In June 2014, the Financial Accounting Standards Board (“FASB”) issued an Accounting Standards Update (“ASU”), ASU 2014-11, that expanded secured borrowing accounting for certain repurchase agreements. The ASU also sets forth additional disclosure requirements for certain transactions accounted for as sales in order to provide financial statement users with information to compare to similar transactions accounted for as secured borrowings. The ASU became effective prospectively for annual periods beginning after December 15,
| | | | | | |
| 108 | | PIMCO MANAGED ACCOUNTS TRUST | | | | |
(Unaudited)
June 30, 2016
2014, and interim periods beginning after March 15, 2015. The Portfolios have adopted the ASU. The financial statements have been modified to provide enhanced disclosures surrounding secured borrowing transactions, if any. See the Notes to Schedule of Investments for additional details.
In August 2014, the FASB issued ASU 2014-15 requiring management to evaluate whether there are conditions or events, considered in the aggregate, that raise substantial doubt about the entity’s ability to continue as a going concern. The ASU is effective prospectively for annual periods ending after December 15, 2016, and interim periods thereafter. At this time, management is evaluating the implications of these changes on the financial statements.
In May 2015, the FASB issued ASU 2015-07 which removes the requirement to categorize within the fair value hierarchy all investments for which fair value is measured using the net asset value per share practical expedient. The ASU also removes the requirement to make certain disclosures for all investments that are eligible to be measured at fair value using the net asset value per share practical expedient. The ASU is effective for annual periods beginning after December 15, 2015 and interim periods within those annual periods. The ASU did not have an impact on the Portfolios’ financial statements.
3. INVESTMENT VALUATION AND FAIR VALUE MEASUREMENTS
(a) Investment Valuation Policies The price of a Portfolio’s shares is based on the Portfolio’s Net Asset Value (“NAV”). The NAV of a Portfolio’s shares is determined by dividing the total value of portfolio investments and other assets attributable to that Portfolio, less any liabilities, by the total number of shares outstanding of that Portfolio.
On each day that the New York Stock Exchange (“NYSE”) is open, Portfolio shares are ordinarily valued as of the close of regular trading (“NYSE Close”). Information that becomes known to the Portfolios or their agents after the time as of which NAV has been calculated on a particular day will not generally be used to retroactively adjust the price of a security or the NAV determined earlier that day. Each Portfolio reserves the right to change the time as of which its respective NAV is calculated if the Portfolio closes earlier, or as permitted by the U.S. Securities and Exchange Commission (the “SEC”).
For purposes of calculating NAV, portfolio securities and other assets for which market quotes are readily available are valued at market value. Market value is generally determined on the basis of official closing prices or the last reported sales prices, or if no sales are reported, based on quotes obtained from established market makers or prices (including evaluated prices) supplied by the Portfolios’ approved pricing services, quotation reporting systems and other third-party sources (together, “Pricing Services”). The Portfolios will normally use pricing data for domestic equity securities received shortly after the NYSE Close and do not normally take into account trading, clearances or settlements that take place after the NYSE Close. A foreign (non-U.S.) equity security traded on a foreign exchange or on more than one exchange is typically valued using pricing information from the exchange considered by PIMCO to be the primary exchange. A foreign (non-U.S.) equity security will be valued as of the close of trading on the foreign exchange, or the NYSE Close, if the NYSE Close occurs before the end of trading on the foreign exchange. Domestic and foreign (non-U.S.) fixed income securities, non-exchange traded derivatives, and equity options are normally valued on the basis of quotes obtained from brokers and dealers or Pricing Services using data reflecting the earlier closing of the principal markets for those securities. Prices obtained from
| | | | | | |
| | SEMIANNUAL REPORT | | JUNE 30, 2016 | | 109 |
Notes to Financial Statements (Cont.)
Pricing Services may be based on, among other things, information provided by market makers or estimates of market values obtained from yield data relating to investments or securities with similar characteristics. Certain fixed income securities purchased on a delayed-delivery basis are marked to market daily until settlement at the forward settlement date. Exchange-traded options, except equity options, futures and options on futures are valued at the settlement price determined by the relevant exchange. Swap agreements are valued on the basis of bid quotes obtained from brokers and dealers or market-based prices supplied by Pricing Services or other pricing sources. With respect to any portion of a Portfolio’s assets that are invested in one or more open-end management investment companies (other than exchange-traded funds (“ETFs”)), a Portfolio’s NAV will be calculated based upon the NAVs of such investments.
If a foreign (non-U.S.) equity security’s value has materially changed after the close of the security’s primary exchange or principal market but before the NYSE Close, the security may be valued at fair value based on procedures established and approved by the Board of Trustees (the “Board”). Foreign (non-U.S.) equity securities that do not trade when the NYSE is open are also valued at fair value. With respect to foreign (non-U.S.) equity securities, a Portfolio may determine the fair value of investments based on information provided by Pricing Services and other third-party vendors, which may recommend fair value or adjustments with reference to other securities, indices or assets. In considering whether fair valuation is required and in determining fair values, a Portfolio may, among other things, consider significant events (which may be considered to include changes in the value of U.S. securities or securities indices) that occur after the close of the relevant market and before the NYSE Close. A Portfolio may utilize modeling tools provided by third-party vendors to determine fair values of non-U.S. securities. Foreign (non-U.S.) exchanges may permit trading in foreign (non-U.S.) equity securities on days when a Portfolio is not open for business, which may result in a Portfolio’s portfolio investments being affected when shareholders are unable to buy or sell shares.
Senior secured floating rate loans for which an active secondary market exists to a reliable degree will be valued at the mean of the last available bid/ask prices in the market for such loans, as provided by a Pricing Service. Senior secured floating rate loans for which an active secondary market does not exist to a reliable degree will be valued at fair value, which is intended to approximate market value. In valuing a senior secured floating rate loan at fair value, the factors considered may include, but are not limited to, the following: (a) the creditworthiness of the borrower and any intermediate participants, (b) the terms of the loan, (c) recent prices in the market for similar loans, if any, and (d) recent prices in the market for instruments of similar quality, rate, period until next interest rate reset and maturity.
Investments valued in currencies other than the U.S. dollar are converted to the U.S. dollar using exchange rates obtained from Pricing Services. As a result, the value of such investments and, in turn, the NAV of a Portfolio’s shares may be affected by changes in the value of currencies in relation to the U.S. dollar. The value of investments traded in markets outside the United States or denominated in currencies other than the U.S. dollar may be affected significantly on a day that the Trust is not open for business. As a result, to the extent that a Portfolio holds foreign (non-U.S.) investments, the value of those investments may change at times when shareholders are unable to buy or sell shares and the value of such investments will be reflected in the Portfolio’s next calculated NAV.
| | | | | | |
| 110 | | PIMCO MANAGED ACCOUNTS TRUST | | | | |
(Unaudited)
June 30, 2016
Investments for which market quotes or market-based valuations are not readily available are valued at fair value as determined in good faith by the Board or persons acting at their direction. The Board has adopted methods for valuing securities and other assets in circumstances where market quotes are not readily available, and has delegated to PIMCO the responsibility for applying the fair valuation methods. In the event that market quotes or market-based valuations are not readily available, and the security or asset cannot be valued pursuant to a Board approved valuation method, the value of the security or asset will be determined in good faith by the Valuation Oversight Committee of the Board (“Valuation Oversight Committee”), generally based on recommendations provided by the Adviser. Market quotes are considered not readily available in circumstances where there is an absence of current or reliable market-based data (e.g., trade information, bid/ask information, indicative market quotations (“Broker Quotes”), Pricing Services’ prices), including where events occur after the close of the relevant market, but prior to the NYSE Close, that materially affect the values of a Portfolio’s securities or assets. In addition, market quotes are considered not readily available when, due to extraordinary circumstances, the exchanges or markets on which the securities trade do not open for trading for the entire day and no other market prices are available. The Board has delegated to the Adviser the responsibility for monitoring significant events that may materially affect the values of a Portfolio’s securities or assets and for determining whether the value of the applicable securities or assets should be reevaluated in light of such significant events.
When a Portfolio uses fair valuation to determine the value of a portfolio security or other asset for purposes of calculating its NAV, such investments will not be priced on the basis of quotes from the primary market in which they are traded, but rather may be priced by another method that the Board or persons acting at their direction believe reflects fair value. Fair valuation may require subjective determinations about the value of a security. While the Trust’s policy is intended to result in a calculation of a Portfolio’s NAV that fairly reflects security values as of the time of pricing, the Trust cannot ensure that fair values determined by the Board or persons acting at their direction would accurately reflect the price that a Portfolio could obtain for a security if it were to dispose of that security as of the time of pricing (for instance, in a forced or distressed sale). The prices used by a Portfolio may differ from the value that would be realized if the securities were sold.
(b) Fair Value Hierarchy U.S. GAAP describes fair value as the price that a Portfolio would receive to sell an asset or pay to transfer a liability in an orderly transaction between market participants at the measurement date. It establishes a fair value hierarchy that prioritizes inputs to valuation methods and requires disclosure of the fair value hierarchy, separately for each major category of assets and liabilities, that segregates fair value measurements into levels (Level 1, 2, or 3). The inputs or methodology used for valuing securities are not necessarily an indication of the risks associated with investing in those securities. Levels 1, 2, and 3 of the fair value hierarchy are defined as follows:
| n | | Level 1 — Inputs using (unadjusted) quoted prices in active markets or exchanges for identical assets and liabilities. |
| n | | Level 2 — Significant other observable inputs, which may include, but are not limited to, quoted prices for similar assets or liabilities in markets that are active, quoted prices for identical or similar assets or liabilities in markets that are not active, inputs other than quoted prices that are observable for the assets or liabilities (such as interest rates, yield curves, volatilities, prepayment speeds, loss severities, credit risks and default rates) or other market corroborated inputs. |
| | | | | | |
| | SEMIANNUAL REPORT | | JUNE 30, 2016 | | 111 |
Notes to Financial Statements (Cont.)
| n | | Level 3 — Significant unobservable inputs based on the best information available in the circumstances, to the extent observable inputs are not available, which may include assumptions made by the Board or persons acting at their direction that are used in determining the fair value of investments. |
In accordance with the requirements of U.S. GAAP, the amounts of transfers between Levels 1 and 2 and transfers into and out of Level 3, if material, are disclosed in the Notes to Schedule of Investments for each respective Portfolio.
For fair valuations using significant unobservable inputs, U.S. GAAP requires a reconciliation of the beginning to ending balances for reported fair values that presents changes attributable to realized gain (loss), unrealized appreciation (depreciation), purchases and sales, accrued discounts (premiums), and transfers into and out of the Level 3 category during the period. The end of period timing recognition is used for the transfers between Levels of a Portfolio’s assets and liabilities. Additionally, U.S. GAAP requires quantitative information regarding the significant unobservable inputs used in the determination of fair value of assets or liabilities categorized as Level 3 in the fair value hierarchy. In accordance with the requirements of U.S. GAAP, a fair value hierarchy, and if material, a Level 3 reconciliation and details of significant unobservable inputs, have been included in the Notes to Schedules of Investments for each respective Portfolio.
(c) Valuation Techniques and the Fair Value Hierarchy
Level 1 and Level 2 trading assets and trading liabilities, at fair value The valuation methods (or “techniques”) and significant inputs used in determining the fair values of portfolio securities or other assets and liabilities categorized as Level 1 and Level 2 of the fair value hierarchy are as follows:
Fixed income securities including corporate, convertible and municipal bonds and notes, U.S. government agencies, U.S. treasury obligations, sovereign issues, bank loans, convertible preferred securities and non-U.S. bonds are normally valued on the basis of quotes obtained from brokers and dealers or Pricing Services that use broker-dealer quotations, reported trades or valuation estimates from their internal pricing models. The Pricing Services’ internal models use inputs that are observable such as issuer details, interest rates, yield curves, prepayment speeds, credit risks/spreads, default rates and quoted prices for similar assets. Securities that use similar valuation techniques and inputs as described above are categorized as Level 2 of the fair value hierarchy.
Fixed income securities purchased on a delayed-delivery basis or as a repurchase commitment in a sale-buyback transaction are marked to market daily until settlement at the forward settlement date and are categorized as Level 2 of the fair value hierarchy.
Mortgage-related and asset-backed securities are usually issued as separate tranches, or classes, of securities within each deal. These securities are also normally valued by Pricing Services that use broker-dealer quotations, reported trades or valuation estimates from their internal pricing models. The pricing models for these securities usually consider tranche-level attributes, current market data, estimated cash flows and market-based yield spreads for each tranche, and incorporate deal collateral performance, as available. Mortgage-related and asset-backed securities that use similar valuation techniques and inputs as described above are categorized as Level 2 of the fair value hierarchy.
| | | | | | |
| 112 | | PIMCO MANAGED ACCOUNTS TRUST | | | | |
(Unaudited)
June 30, 2016
Common stocks, ETFs, exchange-traded notes and financial derivative instruments, such as futures contracts, rights and warrants, or options on futures that are traded on a national securities exchange, are stated at the last reported sale or settlement price on the day of valuation. To the extent these securities are actively traded and valuation adjustments are not applied, they are categorized as Level 1 of the fair value hierarchy.
Investments valued (denominated) in currencies other than the U.S. dollar are converted to the U.S. dollar using exchange rates (currency spot and forward rates) obtained from Pricing Services. As a result, the NAV of a Portfolio’s shares may be affected by changes in the value of currencies in relation to the U.S. dollar. The value of securities traded in markets outside the United States or denominated in currencies other than the U.S. dollar may be affected significantly on a day that the Trust is not open for business. Valuation adjustments may be applied to certain securities that are solely traded on a foreign exchange to account for the market movement between the close of the foreign market and the NYSE Close. These securities are valued using Pricing Services that consider the correlation of the trading patterns of the foreign security to the intraday trading in the U.S. markets for investments. Securities using these valuation adjustments are categorized as Level 2 of the fair value hierarchy. Preferred securities and other equities traded on inactive markets or valued by reference to similar instruments are also categorized as Level 2 of the fair value hierarchy.
Valuation adjustments may be applied to certain securities that are solely traded on a foreign exchange to account for the market movement between the close of the foreign market and the NYSE Close. These securities are valued using Pricing Services that consider the correlation of the trading patterns of the foreign security to the intraday trading in the U.S. markets for investments. Securities using these valuation adjustments are categorized as Level 2 of the fair value hierarchy. Preferred securities and other equities traded on inactive markets or valued by reference to similar instruments are also categorized as Level 2 of the fair value hierarchy.
Short-term debt instruments (such as commercial paper) having a remaining maturity of 60 days or less may be valued at amortized cost, so long as the amortized cost of such short-term debt instrument is approximately the same as the fair value of the instrument as determined without the use of amortized cost valuation. Prior to July 31, 2015, short-term debt investments having a maturity of 60 days or less and repurchase agreements were generally valued at amortized cost which approximates fair value. Short-term debt instruments having a remaining maturity of 60 days or less are categorized as Level 2 of the fair value hierarchy.
Equity exchange-traded options and over the counter financial derivative instruments, such as foreign currency contracts, options contracts, or swap agreements, derive their value from underlying asset prices, indices, reference rates, and other inputs or a combination of these factors. Other than swap agreements, which are valued using a broker-dealer bid quotation or on market-based prices provided by Pricing Services or other pricing sources, these contracts are normally valued on the basis of quotes obtained from a quotation reporting system, established market makers or Pricing Services (normally determined as of the NYSE Close). Depending on the product and the terms of the transaction, financial derivative instruments can be valued by Pricing Services using a series of techniques, including simulation pricing models. The pricing models use inputs that are observed from actively quoted markets such as quoted prices, issuer details, indices, bid/ask spreads, interest
| | | | | | |
| | SEMIANNUAL REPORT | | JUNE 30, 2016 | | 113 |
Notes to Financial Statements (Cont.)
rates, implied volatilities, yield curves, dividends and exchange rates. Financial derivative instruments that use similar valuation techniques and inputs as described above are categorized as Level 2 of the fair value hierarchy.
Centrally cleared swaps listed or traded on a multilateral or trade facility platform, such as a registered exchange, are valued at the daily settlement price determined by the respective exchange (if available). For centrally cleared credit default swaps, the clearing facility requires its members to provide actionable price levels across complete term structures. These levels along with external third-party prices are used to produce daily settlement prices. These securities are categorized as Level 2 of the fair value hierarchy. Centrally cleared interest rate swaps are valued using a pricing model that references the underlying rates including the overnight index swap rate and London Interbank Offered Rate (“LIBOR”) forward rate to produce the daily settlement price. These securities are categorized as Level 2 of the fair value hierarchy.
Level 3 trading assets and trading liabilities, at fair value When a fair valuation method is applied by PIMCO that uses significant unobservable inputs, investments will be priced by a method that the Board or persons acting at their direction believe reflects fair value and are categorized as Level 3 of the fair value hierarchy. The valuation techniques and significant inputs used in determining the fair values of portfolio assets and liabilities categorized as Level 3 of the fair value hierarchy are as follows:
Proxy pricing procedures set the base price of a fixed income security and subsequently adjust the price proportionally to market value changes of a pre-determined security deemed to be comparable in duration, generally a U.S. Treasury or sovereign note based on country of issuance. The base price may be a broker-dealer quote, transaction price, or an internal value as derived by analysis of market data. The base price of the security may be reset on a periodic basis based on the availability of market data and procedures approved by the Valuation Oversight Committee. Significant changes in the unobservable inputs of the proxy pricing process (the base price) would result in direct and proportional changes in the fair value of the security. These securities are categorized as Level 3 of the fair value hierarchy.
If third-party evaluated vendor pricing is not available or not deemed to be indicative of fair value, the Adviser may elect to obtain Broker Quotes directly from the broker-dealer or passed through from a third-party vendor. In the event that fair value is based upon a single sourced Broker Quote, these securities are categorized as Level 3 of the fair value hierarchy. Broker Quotes are typically received from established market participants. Although independently received, the Adviser does not have the transparency to view the underlying inputs which support the market quotation. Significant changes in the Broker Quote would have direct and proportional changes in the fair value of the security.
Reference instrument valuation estimates fair value by utilizing the correlation of the security to one or more broad-based securities market indices, and/or other financial instruments for which pricing information is readily available. Unobservable inputs may include those used in algorithm formulas based on percentage change in the reference instruments and/or weights of each reference instrument. Significant changes in the unobservable inputs would result in direct and proportional changes in the fair value of the security. These securities are categorized as Level 3 of the fair value hierarchy.
| | | | | | |
| 114 | | PIMCO MANAGED ACCOUNTS TRUST | | | | |
(Unaudited)
June 30, 2016
The validity of the fair value is reviewed by the Adviser on a periodic basis and may be amended in accordance with the Trust’s valuation procedures.
4. SECURITIES AND OTHER INVESTMENTS
(a) Investments in Securities
Delayed-Delivery Transactions Certain Portfolios may purchase or sell securities on a delayed-delivery basis. These transactions involve a commitment by a Portfolio to purchase or sell securities for a predetermined price or yield, with payment and delivery taking place beyond the customary settlement period. When delayed-delivery transactions are outstanding, a Portfolio will designate or receive as collateral liquid assets in an amount sufficient to meet the purchase price or respective obligations. When purchasing a security on a delayed-delivery basis, a Portfolio assumes the rights and risks of ownership of the security, including the risk of price and yield fluctuations, and takes such fluctuations into account when determining its NAV. A Portfolio may dispose of or renegotiate a delayed-delivery transaction after it is entered into, which may result in a realized gain or loss. When a Portfolio has sold a security on a delayed-delivery basis, a Portfolio does not participate in future gains (losses) with respect to the security.
Inflation-Indexed Bonds Certain Portfolios may invest in inflation-indexed bonds. Inflation-indexed bonds are fixed income securities whose principal value is periodically adjusted to the rate of inflation. In general, the value of an inflation-indexed security tends to decrease when real interest rates increase and can increase when real interest rates decrease. Thus generally, during periods of rising inflation, the value of inflation-indexed securities will tend to increase and during periods of deflation, their value will tend to decrease. The interest rate on these bonds is generally fixed at issuance at a rate lower than typical bonds. Over the life of an inflation-indexed bond, however, interest will be paid based on a principal value which is adjusted for inflation. Any increase or decrease in the principal amount of an inflation-indexed bond will be included as interest income on the Statements of Operations, even though investors do not receive their principal until maturity. Repayment of the original bond principal upon maturity (as adjusted for inflation) is guaranteed in the case of U.S. Treasury inflation-indexed bonds. For bonds that do not provide a similar guarantee, the adjusted principal value of the bond repaid at maturity may be less than the original principal.
Loan Participations, Assignments and Originations Certain Portfolios may invest in direct debt instruments which are interests in amounts owed to lenders or lending syndicates by corporate, governmental, or other borrowers. A Portfolio’s investments in loans may be in the form of direct investments, participations in loans or assignments of all or a portion of loans from third parties or exposure to investments in or originations of loans through investments in a mutual fund or other pooled investment vehicle. A loan is often administered by a bank or other financial institution (the “agent”) that acts as agent for all holders. The agent administers the terms of the loan, as specified in the loan agreement. A Portfolio may invest in multiple series or tranches of a loan, which may have varying terms and carry different associated risks. A Portfolio generally has no right to enforce compliance with the terms of the loan agreement with the borrower. As a result, a Portfolio may be subject to the credit risk of both the borrower and the agent that is selling the loan agreement. In the event of the insolvency of the agent selling a participation, a Portfolio may be treated as a general creditor of the agent and may not benefit from any set-off between the agent and the borrower. When a Portfolio purchases assignments from agents it acquires direct rights against the
| | | | | | |
| | SEMIANNUAL REPORT | | JUNE 30, 2016 | | 115 |
Notes to Financial Statements (Cont.)
borrowers of the loans. These loans may include participations in bridge loans, which are loans taken out by borrowers for a short period (typically less than one year) pending arrangement of more permanent financing through, for example, the issuance of bonds, frequently high yield bonds issued for the purpose of acquisitions.
Investments in loans are generally subject to risks similar to those of investments in other types of debt obligations, including, among others, credit risk, interest rate risk, variable and floating rate securities risk, and risks associated with mortgage-related securities. In addition, in many cases loans are subject to the risks associated with below-investment grade securities. The Portfolios may be subject to heightened or additional risks and potential liabilities and costs by investing in mezzanine and other subordinated loans or acting as an originator of loans, including those arising under bankruptcy, fraudulent conveyance, equitable subordination, lender liability, environmental and other laws and regulations, and risks and costs associated with debt servicing and taking foreclosure actions associated with the loans. To the extent that a Portfolio originates a loan, it may be responsible for all or a substantial portion of the expenses associated with initiating the loan. This may include significant legal and due diligence expenses, which will be indirectly borne by a Portfolio and its shareholders. A Portfolio may pay fees and expenses associated with originating a loan, including significant legal and due diligence expenses, irrespective of whether the loan transaction is ultimately consummated or closed.
Additionally, because loans are not ordinarily registered with the SEC or any state securities commission or listed on any securities exchange, there is usually less publicly available information about such instruments. In addition, loans may not be considered “securities” for purposes of the anti-fraud provisions under the federal securities laws and, as a result, as a purchaser of these instruments, a Portfolio may not be entitled to the anti-fraud protections of the federal securities laws. In the course of investing in such instruments, a Portfolio may come into possession of material nonpublic information and, because of prohibitions on trading in securities of issuers while in possession of such information, the Portfolio may be unable to enter into a transaction in a publicly-traded security of that issuer when it would otherwise be advantageous for the Portfolio to do so. Alternatively, a Portfolio may choose not to receive material nonpublic information about an issuer of such loans, with the result that the Portfolio may have less information about such issuers than other investors who transact in such assets
The types of loans and related investments in which the Portfolios may invest include, among others, senior loans, subordinated loans (including second lien loans, B-Notes and mezzanine loans), whole loans, commercial real estate and other commercial loans and structured loans. The Portfolios may originate loans or acquire direct interests in loans through primary loan distributions and/or in private transactions. In the case of subordinated loans, there may be significant indebtedness ranking ahead of the borrower’s obligation to the holder of such a loan, including in the event of the borrower’s insolvency. Mezzanine loans are typically secured by a pledge of an equity interest in the mortgage borrower that owns the real estate rather than an interest in a mortgage.
Investments in loans may include unfunded loan commitments, which are contractual obligations for future funding. Unfunded loan commitments may include revolving credit facilities, which may obligate a Portfolio to supply additional cash to the borrower on demand. Unfunded loan commitments represent a future obligation in full, even though a percentage of the committed amount may not be
| | | | | | |
| 116 | | PIMCO MANAGED ACCOUNTS TRUST | | | | |
(Unaudited)
June 30, 2016
utilized by the borrower. When investing in a loan participation, a Portfolio has the right to receive payments of principal, interest and any fees to which it is entitled only from the agent selling the loan agreement and only upon receipt of payments by the agent from the borrower. Because investing in unfunded loan commitments creates a future obligation for the Portfolio to provide funding to a borrower upon demand in exchange for a fee, the Portfolio will segregate or earmark liquid assets with the Portfolio’s custodian in amounts sufficient to satisfy any such future obligations. A Portfolio may receive a commitment fee based on the undrawn portion of the underlying line of credit portion of a loan. In certain circumstances, a Portfolio may receive a penalty fee upon the prepayment of a loan by a borrower. Fees earned or paid are recorded as a component of interest income or interest expense, respectively, on the Statements of Operations. As of June 30, 2016, the Portfolios had no unfunded loan commitments outstanding.
Mortgage-Related and Other Asset-Backed Securities Certain Portfolios may invest in mortgage- related and other asset-backed securities that directly or indirectly represent a participation in, or are secured by and payable from, loans on real property. Mortgage-related securities are created from pools of residential or commercial mortgage loans, including mortgage loans made by savings and loan institutions, mortgage bankers, commercial banks and others. These securities typically provide a monthly payment which consists of both interest and principal. Interest may be determined by fixed or adjustable rates. In times of declining interest rates, there is a greater likelihood that a Portfolio’s higher yielding securities will be pre-paid with the Portfolio being unable to reinvest the proceeds in an investment with as great a yield. The rate of prepayments on underlying mortgages will affect the price and volatility of a mortgage-related security, and may have the effect of shortening or extending the effective duration of the security relative to what was anticipated at the time of purchase. Interest-only and principal-only securities are especially sensitive to interest rate changes, which can affect not only their prices but can also change the income flows and repayment assumptions about those investments. The timely payment of principal and interest of certain mortgage-related securities is guaranteed with the full faith and credit of the U.S. Government. Pools created and guaranteed by non-governmental issuers, including government-sponsored corporations, may be supported by various forms of insurance or guarantees, but there can be no assurance that private insurers or guarantors can meet their obligations under the insurance policies or guarantee arrangements. Many of the risks of investing in mortgage-related securities secured by commercial mortgage loans (“CMBS”) reflect the effects of local and other economic conditions on real estate markets, the ability of tenants to make lease payments, and the ability of a property to attract and retain tenants. These securities may be less liquid and may exhibit greater price volatility than other types of mortgage-related or other asset-backed securities. Other asset-backed securities are created from many types of assets, including without limitation, auto loans, credit card receivables, home equity loans, and student loans.
Collateralized Debt Obligations (“CDOs”) include Collateralized Bond Obligations (“CBOs”), Collateralized Loan Obligations (“CLOs”) and other similarly structured securities. CBOs and CLOs are types of asset-backed securities. A CBO is a trust which is typically backed by a diversified pool of high risk, below investment grade fixed income securities. A CLO is a trust typically collateralized by a pool of loans, which may include, among others, domestic and foreign senior secured loans, senior unsecured loans, and subordinate corporate loans, including loans that may be rated below investment grade or equivalent unrated loans. For both CBOs and CLOs, the cash flows from
| | | | | | |
| | SEMIANNUAL REPORT | | JUNE 30, 2016 | | 117 |
Notes to Financial Statements (Cont.)
the trust are split into two or more portions, called tranches, varying in risk and yield. The riskiest portion is the “equity” tranche which bears the bulk of defaults from the bonds or loans in the trust and serves to protect the other, more senior tranches from default in all but the most severe circumstances. Since it is partially protected from defaults, a senior tranche from a CBO trust or CLO trust typically has higher ratings and lower yields than the underlying securities, and can be rated investment grade. Despite the protection from the equity tranche, CBO or CLO tranches can experience substantial losses due to actual defaults, increased sensitivity to defaults due to collateral default and disappearance of protecting tranches, market anticipation of defaults and aversion to CBO or CLO securities as a class. The risks of an investment in a CDO depend largely on the type of the collateral securities and the class of the CDO in which a Portfolio invests. CDOs carry additional risks including, but not limited to, (i) the possibility that distributions from collateral securities will not be adequate to make interest or other payments, (ii) the collateral may decline in value or default, (iii) a Portfolio may invest in CDOs that are subordinate to other classes, and (iv) the complex structure of the security may not be fully understood at the time of investment and may produce disputes with the issuer or unexpected investment results.
Collateralized Mortgage Obligations (“CMOs”) are debt obligations of a legal entity that are collateralized by whole mortgage loans or private mortgage bonds and divided into classes. CMOs are structured into multiple classes, often referred to as “tranches,” with each class bearing a different stated maturity and entitled to a different schedule for payments of principal and interest, including prepayments. CMOs may be less liquid and may exhibit greater price volatility than other types of mortgage-related or asset-backed securities.
As CMOs have evolved, some classes of CMO bonds have become more common. For example, a Portfolio may invest in parallel-pay and planned amortization class (“PAC”) CMOs and multi-class pass-through certificates. Parallel-pay CMOs and multi-class pass-through certificates are structured to provide payments of principal on each payment date to more than one class. These simultaneous payments are taken into account in calculating the stated maturity date or final distribution date of each class, which, as with other CMO and multi-class pass-through structures, must be retired by its stated maturity date or final distribution date but may be retired earlier. PACs generally require payments of a specified amount of principal on each payment date. PACs are parallel-pay CMOs with the required principal amount on such securities having the highest priority after interest has been paid to all classes. Any CMO or multi-class pass-through structure that includes PAC securities must also have support tranches — known as support bonds, companion bonds or non-PAC bonds — which lend or absorb principal cash flows to allow the PAC securities to maintain their stated maturities and final distribution dates within a range of actual prepayment experience. These support tranches are subject to a higher level of maturity risk compared to other mortgage-related securities, and usually provide a higher yield to compensate investors. If principal cash flows are received in amounts outside a pre-determined range such that the support bonds cannot lend or absorb sufficient cash flows to the PAC securities as intended, the PAC securities are subject to heightened maturity risk. A Portfolio may invest in various tranches of CMO bonds, including support bonds.
Stripped Mortgage-Backed Securities (“SMBS”) are derivative multi-class mortgage securities. SMBS are usually structured with two classes that receive different proportions of the interest and principal distributions on a pool of mortgage assets. An SMBS will have one class that will receive all of the interest (the interest-only or “IO” class), while the other class will receive the entire principal
| | | | | | |
| 118 | | PIMCO MANAGED ACCOUNTS TRUST | | | | |
(Unaudited)
June 30, 2016
(the principal-only or “PO” class). IOs and POs can be extremely volatile in response to changes in interest rates. As interest rates rise and fall, the value of IOs tends to move in the same direction as interest rates. POs perform best when prepayments on the underlying mortgages rise since this increases the rate at which the principal is returned and the yield to maturity on the PO. When payments on mortgages underlying a PO are slower than anticipated, the life of the PO is lengthened and the yield to maturity is reduced. The yield to maturity on an IO class is extremely sensitive to the rate of principal payments (including prepayments) on the related underlying mortgage assets, and a rapid rate of principal payments may have a material adverse effect on a Portfolio’s yield to maturity from these securities. If the underlying mortgage assets experience greater than anticipated prepayments of principal, a Portfolio may fail to recoup some or all of its initial investment in these securities even if the security is in one of the highest rating categories. Payments received for IOs are included in interest income on the Statements of Operations. Because no principal will be received at the maturity of an IO, adjustments are made to the cost of the security on a monthly basis until maturity. These adjustments are included in interest income on the Statements of Operations. Payments received for POs are treated as reductions to the cost and par value of the securities.
Restricted Securities Certain Portfolios may invest in securities that are subject to legal or contractual restrictions on resale. These securities may generally be sold privately, but are required to be registered or exempted from such registration before being sold to the public. Private placement securities are generally considered to be restricted except for those securities traded between qualified institutional investors under the provisions of Rule 144A of the Securities Act of 1933. Disposal of restricted securities may involve time-consuming negotiations and expenses, and prompt sale at an acceptable price may be difficult to achieve. Restricted securities held by the Portfolios at June 30, 2016 are disclosed in the Notes to Schedules of Investments.
U.S. Government Agencies or Government-Sponsored Enterprises Certain Portfolios may invest in securities of U.S. Government agencies or government-sponsored enterprises. U.S. Government securities are obligations of and, in certain cases, guaranteed by, the U.S. Government, its agencies or instrumentalities. Some U.S. Government securities, such as Treasury bills, notes and bonds, and securities guaranteed by the Government National Mortgage Association (“GNMA” or “Ginnie Mae”), are supported by the full faith and credit of the U.S. Government; others, such as those of the Federal Home Loan Banks, are supported by the right of the issuer to borrow from the U.S. Department of the Treasury (the “U.S. Treasury”); and others, such as those of the Federal National Mortgage Association (“FNMA” or “Fannie Mae”), are supported by the discretionary authority of the U.S. Government to purchase the agency’s obligations. U.S. Government securities may include zero coupon securities. Zero coupon securities do not distribute interest on a current basis and tend to be subject to a greater risk than interest-paying securities.
Government-related guarantors (i.e., not backed by the full faith and credit of the U.S. Government) include FNMA and the Federal Home Loan Mortgage Corporation (“FHLMC” or “Freddie Mac”). FNMA is a government-sponsored corporation. FNMA purchases conventional (i.e., not insured or guaranteed by any government agency) residential mortgages from a list of approved seller/servicers which include state and federally chartered savings and loan associations, mutual savings banks, commercial banks and credit unions and mortgage bankers. Pass-through securities issued by FNMA are guaranteed as to timely payment of principal and interest by FNMA, but are not backed by the full faith and credit of the U.S. Government. FHLMC issues Participation Certificates (“PCs”), which
| | | | | | |
| | SEMIANNUAL REPORT | | JUNE 30, 2016 | | 119 |
Notes to Financial Statements (Cont.)
are pass-through securities, each representing an undivided interest in a pool of residential mortgages. FHLMC guarantees the timely payment of interest and ultimate collection of principal, but PCs are not backed by the full faith and credit of the U.S. Government.
Certain Portfolios may engage in strategies where they seek to extend the expiration or maturity of a position, such as a To Be Announced (“TBA”) security on an underlying asset, by closing out the position before expiration and opening a new position with respect to the same underlying asset with a later expiration date. TBA securities purchased or sold are reflected on the Statements of Assets and Liabilities as an asset or liability, respectively.
When-Issued Transactions Certain Portfolios may purchase or sell securities on a when-issued basis. These transactions are made conditionally because a security, although authorized, has not yet been issued in the market. Transactions to purchase or sell securities on a when-issued basis involve a commitment by a Portfolio to purchase or sell these securities for a predetermined price or yield, with payment and delivery taking place beyond the customary settlement period. When purchasing a security on a delayed delivery basis, a Portfolio assumes the rights and risks of ownership of the security, including the risk of price and yield fluctuations. A Portfolio may sell when-issued securities before they are delivered, which may result in a realized gain (loss).
5. BORROWINGS AND OTHER FINANCING TRANSACTIONS
The following disclosures contain information on a Portfolio’s ability to lend or borrow cash or securities to the extent permitted under the Act, which may be viewed as borrowing or financing transactions by a Portfolio. The location of these instruments in the Portfolio’s financial statements is described below. For a detailed description of credit and counterparty risks that can be associated with borrowings and other financing transactions, please see Note 7, Principal Risks.
(a) Repurchase Agreements Certain Portfolios may engage in repurchase agreements. Under the terms of a typical repurchase agreement, a Portfolio takes purchases an underlying debt obligation (collateral) subject to an obligation of the seller to repurchase, and a Portfolio to resell, the obligation at an agreed-upon price and time. The underlying securities for all repurchase agreements are held by a Portfolio’s custodian or designated subcustodians under tri-party repurchase agreements. The market value of the collateral must be equal to or exceed the total amount of the repurchase obligations, including interest. Repurchase agreements, if any, including accrued interest, are included on the Statements of Assets and Liabilities. Interest earned is recorded as a component of interest income on the Statements of Operations. In periods of increased demand for collateral, a Portfolio may pay a fee for the receipt of collateral, which may result in interest expense to the Portfolio.
(b) Reverse Repurchase Agreements Certain Portfolios may enter into reverse repurchase agreements. In a reverse repurchase agreement, a Portfolio delivers a security in exchange for cash to a financial institution, the counterparty, with a simultaneous agreement to repurchase the same or substantially the same security at an agreed-upon price and date. In an open maturity reverse repurchase agreement, there is no pre-determined repurchase date and the agreement can be terminated by the Portfolio or counterparty at any time. A Portfolio is entitled to receive principal and interest payments, if any, made on the security delivered to the counterparty during the term of the agreement. Cash received in exchange for securities delivered plus accrued interest payments to be made by a Portfolio to counterparties are reflected as a liability on the Statements of Assets and
| | | | | | |
| 120 | | PIMCO MANAGED ACCOUNTS TRUST | | | | |
(Unaudited)
June 30, 2016
Liabilities. Interest payments made by a Portfolio to counterparties are recorded as a component of interest expense on the Statements of Operations. In periods of increased demand for the security, a Portfolio may receive a fee for use of the security by the counterparty, which may result in interest income to the Portfolio. In the event the buyer of securities under a reverse repurchase agreement files for bankruptcy or becomes insolvent, a Portfolio’s use of the proceeds of the agreement may be restricted pending a determination by the other party, or its trustee or receiver, whether to enforce the Portfolio’s obligation to repurchase the securities. Reverse repurchase agreements involve leverage risk and also the risk that the market value of the securities to be repurchased may decline below the repurchase price (see Note 7, Principal Risks). A Portfolio will segregate assets determined to be liquid by PIMCO or will otherwise cover its obligations under reverse repurchase agreements.
(c) Sale-Buybacks Certain Portfolios may enter into financing transactions referred to as ‘sale- buybacks’. A sale-buyback transaction consists of a sale of a security by a Portfolio to a financial institution, the counterparty, with a simultaneous agreement to repurchase the same or substantially the same security at an agreed-upon price and date. A Portfolio is not entitled to receive principal and interest payments, if any, made on the security sold to the counterparty during the term of the agreement. The agreed-upon proceeds for securities to be repurchased by a Portfolio are reflected as a liability on the Statements of Assets and Liabilities. A Portfolio will recognize net income represented by the price differential between the price received for the transferred security and the agreed-upon repurchase price. This is commonly referred to as the ‘price drop’. A price drop consists of (i) the foregone interest and inflationary income adjustments, if any, a Portfolio would have otherwise received had the security not been sold and (ii) the negotiated financing terms between a Portfolio and counterparty. Foregone interest and inflationary income adjustments, if any, are recorded as components of interest income on the Statements of Operations. Interest payments based upon negotiated financing terms made by a Portfolio to counterparties are recorded as a component of interest expense on the Statements of Operations. In periods of increased demand for the security, a Portfolio may receive a fee for use of the security by the counterparty, which may result in interest income to the Portfolio. A Portfolio will segregate assets determined to be liquid by PIMCO or will otherwise cover its obligations under sale-buyback transactions. Sale-buybacks involve leverage risk and also the risk that the market value of the securities to be repurchased may decline below the repurchase price (see Note 7, Principal Risks).
(d) Short Sales Certain Portfolios may enter into short sales transactions. A short sale is a transaction in which a Portfolio sells securities it may not own in anticipation of a decline in the fair value of the securities. Securities sold in short sale transactions and the interest payable on such securities, if any, are reflected as a liability on the Statement of Assets and Liabilities. A Portfolio is obligated to deliver securities at the trade price at the time the short position is covered. Possible losses from short sales may be unlimited, whereas losses from purchases cannot exceed the total amount invested.
6. FINANCIAL DERIVATIVE INSTRUMENTS
The following disclosures contain information on how and why the Portfolios may use financial derivative instruments, the credit-risk-related contingent features in certain financial derivative instruments, and how financial derivative instruments affect the Portfolios’ financial position, results of operations and cash flows. The location and fair value amounts of these instruments on the Statements of Assets and Liabilities and of the realized appreciation (depreciation) and changes in
| | | | | | |
| | SEMIANNUAL REPORT | | JUNE 30, 2016 | | 121 |
Notes to Financial Statements (Cont.)
unrealized appreciation (depreciation) related to such instruments on the Statements of Operations, each categorized by type of financial derivative contract and related risk exposure, are included in a table in the Notes to Schedules of Investments. The financial derivative instruments outstanding as of period end and the amounts of realized and changes in unrealized appreciation (depreciation) on financial derivative instruments during the period, as disclosed in the Notes to Schedules of Investments, serve as indicators of the volume of financial derivative activity for the Portfolios.
(a) Forward Foreign Currency Contracts Certain Portfolios may enter into forward foreign currency contracts in connection with settling planned purchases or sales of securities, to hedge the currency exposure associated with some or all of a Portfolio’s securities or as a part of an investment strategy. A forward foreign currency contract is an agreement between two parties to buy and sell a currency at a set price on a future date. The market value of a forward foreign currency contract fluctuates with changes in foreign currency exchange rates. Forward foreign currency contracts are marked to market daily, and the change in value is recorded by a Portfolio as an unrealized gain (loss). Realized gains (losses) are equal to the difference between the value of the contract at the time it was opened and the value at the time it was closed and are recorded upon delivery or receipt of the currency. The contractual obligations of a buyer or seller of a forward foreign currency contract may generally be satisfied by taking or making physical delivery of the underlying currency, establishing an opposite position in the contract and recognizing the profit (loss) on both positions simultaneously on the delivery date or, in some instances, paying a cash settlement before the designated date of delivery. These contracts may involve market risk in excess of the unrealized gain (loss) reflected on the Statements of Assets and Liabilities. Although forwards may be intended to minimize the risk of loss due to a decline in the value of the hedged currencies, at the same time, they tend to limit any potential gain which might result should the value of such currencies increase. In addition, a Portfolio could be exposed to risk if the counterparties are unable to meet the terms of the contracts or if the value of the currency changes unfavorably to the U.S. dollar. To mitigate such risk, cash or securities may be exchanged as collateral pursuant to the terms of the underlying contracts.
(b) Futures Contracts Certain Portfolios may enter into futures contracts. A Portfolio may use futures contracts to manage its exposure to the securities markets or to movements in interest rates and currency values or for other investment purposes. Generally, a futures contract provides for the future sale by one party and purchase by another party of a specified quantity of the security or other financial instrument at a specified price and time. The primary risks associated with the use of futures contracts are the imperfect correlation between the change in market value of the securities held by a Portfolio and the prices of futures contracts and the possibility of an illiquid market. Futures contracts are valued based upon their quoted daily settlement prices. Upon entering into a futures contract, a Portfolio is required to deposit with its futures broker an amount of cash, U.S. Government and Agency Obligations, or select sovereign debt, in accordance with the initial margin requirements of the broker or exchange. Futures contracts are marked to market daily and based on changes in the price of the contracts, a Portfolio pays or receives cash or other eligible assets equal to the daily change in the value of the contract (“variation margin”). Gains (losses) are recognized but not considered realized until the contracts expire or close. Futures contracts involve, to varying degrees, risk of loss in excess of the variation margin included within exchange traded or centrally cleared financial derivative instruments on the Statements of Assets and Liabilities.
| | | | | | |
| 122 | | PIMCO MANAGED ACCOUNTS TRUST | | | | |
(Unaudited)
June 30, 2016
(c) Options Contracts Certain Portfolios may write call and put options on securities and financial derivative instruments they own or in which they may invest. An option on an instrument (or an index) is a contract that gives the holder of the option, in return for a premium, the right to buy from (in the case of a call) or sell to (in the case of a put) the writer of the option the instrument underlying the option (or the cash value of the index) at a specified exercise price at any time during the term of the option. Writing put options tends to increase a Portfolio’s exposure to the underlying instrument. Writing call options tends to decrease a Portfolio’s exposure to the underlying instrument. When a Portfolio writes a call or put, an amount equal to the premium received is recorded as a liability and subsequently marked to market to reflect the current value of the option written. These liabilities are included on the Statements of Assets and Liabilities. Premiums received from writing options which expire are treated as realized gains. Premiums received from writing options which are exercised or closed are added to the proceeds or offset against amounts paid on the underlying futures, swap, security or currency transaction to determine the realized gain (loss). Certain options may be written with premiums to be determined on a future date. The premiums for these options are based upon implied volatility parameters at specified terms. A Portfolio as a writer of an option has no control over whether the underlying instrument may be sold (“call”) or purchased (“put”) and as a result bears the market risk of an unfavorable change in the price of the instrument underlying the written option. There is the risk a Portfolio may not be able to enter into a closing transaction because of an illiquid market.
Certain Portfolios may also purchase put and call options. Purchasing call options tends to increase a Portfolio’s exposure to the underlying instrument. Purchasing put options tends to decrease a Portfolio’s exposure to the underlying instrument. A Portfolio pays a premium which is included as an asset on the Statements of Assets and Liabilities and subsequently marked to market to reflect the current value of the option. Premiums paid for purchasing options which expire are treated as realized losses. Certain options may be purchased with premiums to be determined on a future date. The premiums for these options are based upon implied volatility parameters at specified terms. The risk associated with purchasing put and call options is limited to the premium paid. Premiums paid for purchasing options which are exercised or closed are added to the amounts paid or offset against the proceeds on the underlying investment transaction to determine the realized gain (loss) when the underlying transaction is executed.
Credit Default Swaptions Certain Portfolios may write or purchase credit default swaption agreements to hedge exposure to the credit risk of an investment without making a commitment to the underlying instrument. A credit default swaption is an option to sell or buy credit protection to a specific reference by entering into a pre-defined swap agreement by some specified date in the future.
Foreign Currency Options Certain Portfolios may write or purchase foreign currency options. Purchasing foreign currency options gives a Portfolio the right, but not the obligation to buy or sell the specific amount of currency at a rate of exchange that may be exercised by a certain date. These options may be used as a short or long hedge against possible variations in foreign exchange rates or to gain exposure to foreign currencies.
Inflation-Capped Options Certain Portfolios may write or purchase inflation-capped options to enhance returns or for hedging opportunities. The purpose of purchasing inflation-capped options is to protect a Portfolio from inflation erosion above a certain rate on a given notional exposure. A floor can be used to give downside protection to investments in inflation-linked products.
| | | | | | |
| | SEMIANNUAL REPORT | | JUNE 30, 2016 | | 123 |
Notes to Financial Statements (Cont.)
Interest Rate Swaptions Certain Portfolios may write or purchase interest rate swaption agreements which are options to enter into a pre-defined swap agreement by some specified date in the future. The writer of the swaption becomes the counterparty to the swap if the buyer exercises. The interest rate swaption agreement will specify whether the buyer of the swaption will be a fixed-rate receiver or a fixed-rate payer upon exercise.
Options on Exchange-Traded Futures Contracts Certain Portfolios may write or purchase options on exchange-traded futures contracts (“Futures Option”) to hedge an existing position or future investment, for speculative purposes or to manage exposure to market movements. A Futures Option is an option contract in which the underlying instrument is a single futures contract.
Options on Securities Certain Portfolios may write or purchase options on securities. An option uses a specified security as the underlying instrument for the option contract. A Portfolio may write or purchase options to enhance returns or to hedge an existing position or future investment.
(d) Swap Agreements Certain Portfolios may invest in swap agreements. Swap agreements are bilaterally negotiated agreements between a Portfolio and a counterparty to exchange or swap investment cash flows, assets, foreign currencies or market-linked returns at specified, future intervals. Swap agreements may be privately negotiated in the over the counter market (“OTC swaps”) or may be cleared through a third party, known as a central counterparty or derivatives clearing organization (“Centrally Cleared Swaps”). A Portfolio may enter into asset, credit default, cross-currency, interest rate, total return, variance and other forms of swap agreements to manage its exposure to credit, currency, interest rate, commodity, equity and inflation risk. In connection with these agreements, securities or cash may be identified as collateral or margin in accordance with the terms of the respective swap agreements to provide assets of value and recourse in the event of default or bankruptcy/insolvency.
Centrally Cleared Swaps are marked to market daily based upon valuations as determined from the underlying contract or in accordance with the requirements of the central counterparty or derivatives clearing organization. Changes in market value, if any, are reflected as a component of net change in unrealized appreciation (depreciation) on the Statements of Operations. Daily changes in valuation of centrally cleared swaps, if any, are included as variation margin on the Statements of Assets and Liabilities. OTC swap payments received or paid at the beginning of the measurement period are included on the Statements of Assets and Liabilities and represent premiums paid or received upon entering into the swap agreement to compensate for differences between the stated terms of the swap agreement and prevailing market conditions (credit spreads, currency exchange rates, interest rates, and other relevant factors). Upfront premiums received (paid) are initially recorded as liabilities (assets) and subsequently marked to market to reflect the current value of the swap. These upfront premiums are recorded as realized gains (losses) on the Statements of Operations upon termination or maturity of the swap. A liquidation payment received or made at the termination of the swap is recorded as realized gain (loss) on the Statements of Operations. Net periodic payments received or paid by a Portfolio are included as part of realized gains (losses) on the Statements of Operations.
For purposes of applying a Portfolio’s investment policies and restrictions, swap agreements are generally valued by the Portfolio at market value. In the case of a credit default swap, however, in applying certain of a Portfolio’s investment policies and restrictions, the Portfolio will value the credit
| | | | | | |
| 124 | | PIMCO MANAGED ACCOUNTS TRUST | | | | |
(Unaudited)
June 30, 2016
default swap at its notional value or its full exposure value (i.e., the sum of the notional amount for the contract plus the market value), but may value the credit default swap at market value for purposes of applying certain of the Portfolio’s other investment policies and restrictions. For example, a Portfolio may value credit default swaps at full exposure value for purposes of the Portfolio’s credit quality guidelines (if any) because such value reflects the Portfolio’s actual economic exposure during the term of the credit default swap agreement. In this context, both the notional amount and the market value may be positive or negative depending on whether a Portfolio is selling or buying protection through the credit default swap. The manner in which certain securities or other instruments are valued by a Portfolio for purposes of applying investment policies and restrictions may differ from the manner in which those investments are valued by other types of investors.
Entering into swap agreements involves, to varying degrees, elements of interest, credit, market and documentation risk in excess of the amounts recognized on the Statements of Assets and Liabilities. Such risks involve the possibility that there will be no liquid market for these agreements, that the counterparty to the agreements may default on its obligation to perform or disagree as to the meaning of contractual terms in the agreements and that there may be unfavorable changes in interest rates or the asset upon which the swap is based.
A Portfolio’s maximum risk of loss from counterparty credit risk is the discounted net value of the cash flows to be received from the counterparty over the contract’s remaining life, to the extent that amount is positive. The risk may be mitigated by having a master netting arrangement between a Portfolio and the counterparty and by the posting of collateral to a Portfolio to cover a Portfolio’s exposure to the counterparty.
Credit Default Swap Agreements A Portfolio may use credit default swaps on corporate, loan, sovereign, U.S. municipal or U.S. Treasury issues to provide a measure of protection against defaults of the issuers (i.e., to reduce risk where a Portfolio owns or has exposure to the referenced obligation) or to take an active long or short position with respect to the likelihood of a particular issuer’s default. Credit default swap agreements involve one party making a stream of payments (referred to as the buyer of protection) to another party (the seller of protection) in exchange for the right to receive a specified return in the event that the referenced entity, obligation or index, as specified in the agreement, undergoes a certain credit event. As a seller of protection on credit default swap agreements, a Portfolio will generally receive from the buyer of protection a fixed rate of income throughout the term of the swap provided that there is no credit event. As the seller, a Portfolio would effectively add leverage to its portfolio because, in addition to its total net assets, a Portfolio would be subject to investment exposure on the notional amount of the swap.
If a Portfolio is a seller of protection and a credit event occurs, as defined under the terms of that particular swap agreement, a Portfolio will either (i) pay to the buyer of protection an amount equal to the notional amount of the swap and take delivery of the referenced obligation, other deliverable obligations or underlying securities comprising the referenced index or (ii) pay a net settlement amount in the form of cash or securities equal to the notional amount of the swap less the recovery value of the referenced obligation or underlying securities comprising the referenced index. If a Portfolio is a buyer of protection and a credit event occurs, as defined under the terms of that particular swap agreement, a Portfolio will either (i) receive from the seller of protection an amount equal to the notional amount of the swap and deliver the referenced obligation, other deliverable
| | | | | | |
| | SEMIANNUAL REPORT | | JUNE 30, 2016 | | 125 |
Notes to Financial Statements (Cont.)
obligations or underlying securities comprising the referenced index or (ii) receive a net settlement amount in the form of cash or securities equal to the notional amount of the swap less the recovery value of the referenced obligation or underlying securities comprising the referenced index. Recovery values are estimated by market makers considering either industry standard recovery rates or entity specific factors and considerations until a credit event occurs. If a credit event has occurred, the recovery value is determined by a facilitated auction whereby a minimum number of allowable broker bids, together with a specified valuation method, are used to calculate the settlement value.
Credit default swap agreements on corporate or sovereign issues involve one party making a stream of payments to another party in exchange for the right to receive a specified return in the event of a default or other credit event. If a credit event occurs and cash settlement is not elected, a variety of other deliverable obligations may be delivered in lieu of the specific referenced obligation. The ability to deliver other obligations may result in a cheapest-to-deliver option (the buyer of protection’s right to choose the deliverable obligation with the lowest value following a credit event).
Credit default swap agreements on credit indices involve one party making a stream of payments to another party in exchange for the right to receive a specified return in the event of a write-down, principal shortfall, interest shortfall or default of all or part of the referenced entities comprising the credit index. A credit index is a basket of credit instruments or exposures designed to be representative of some part of the credit market as a whole. These indices are made up of reference credits that are judged by a poll of dealers to be the most liquid entities in the credit default swap market based on the sector of the index. Components of the indices may include, but are not limited to, investment grade securities, high yield securities, asset-backed securities, emerging markets, and/or various credit ratings within each sector. Credit indices are traded using credit default swaps with standardized terms including a fixed spread and standard maturity dates. An index credit default swap references all the names in the index, and if there is a default, the credit event is settled based on that name’s weight in the index. The composition of the indices changes periodically, usually every six months, and for most indices, each name has an equal weight in the index. Credit default swaps on credit indices may be used to hedge a portfolio of credit default swaps or bonds, which is less expensive than it would be to buy many credit default swaps to achieve a similar effect or to take an active long or short position with respect to the likelihood of a particular referenced obligation’s default. Credit default swaps on indices are instruments often used to attempt to protect investors owning bonds against default, but may also be used for speculative purposes.
Implied credit spreads, represented in absolute terms, utilized in determining the market value of credit default swap agreements on corporate, sovereign or U.S. municipal issues as of period end are disclosed in the Notes to Schedules of Investments. They serve as an indicator of the current status of payment/performance risk and represent the likelihood or risk of default for the reference entity. The implied credit spread of a particular referenced entity reflects the cost of buying/selling protection and may include upfront payments required to be made to enter into the agreement. Wider credit spreads represent a deterioration of the referenced entity’s credit soundness and a greater likelihood or risk of default or other credit event occurring as defined under the terms of the agreement. For credit default swap agreements on asset-backed securities and credit indices, the quoted market prices and resulting values serve as the indicator of the current status of the payment/performance risk. Increasing market values, in absolute terms when compared to the notional amount of the
| | | | | | |
| 126 | | PIMCO MANAGED ACCOUNTS TRUST | | | | |
(Unaudited)
June 30, 2016
swap, represent a deterioration of the referenced entity’s credit soundness and a greater likelihood or risk of default or other credit event occurring as defined under the terms of the agreement.
The maximum potential amount of future payments (undiscounted) that a Portfolio as a seller of protection could be required to make under a credit default swap agreement equals the notional amount of the agreement. Notional amounts of each individual credit default swap agreement outstanding as of period end for which a Portfolio is the seller of protection are disclosed in the Notes to Schedules of Investments. These potential amounts would be partially offset by any recovery values of the respective referenced obligations, upfront payments received upon entering into the agreement, or net amounts received from the settlement of buy protection credit default swap agreements entered into by a Portfolio for the same referenced entity or entities.
Interest Rate Swap Agreements Certain Portfolios are subject to interest rate risk exposure in the normal course of pursuing their investment objectives. If a Portfolio holds fixed rate bonds, the value of these bonds may decrease if interest rates rise. To help hedge against this risk and to maintain its ability to generate income at prevailing market rates, a Portfolio may enter into interest rate swap agreements. Interest rate swap agreements involve the exchange by a Portfolio with another party for their respective commitment to pay or receive interest on the notional amount of principal. Certain forms of interest rate swap agreements may include: (i) interest rate caps, under which, in return for a premium, one party agrees to make payments to the other to the extent that interest rates exceed a specified rate, or “cap”, (ii) interest rate floors, under which, in return for a premium, one party agrees to make payments to the other to the extent that interest rates fall below a specified rate, or “floor”, (iii) interest rate collars, under which a party sells a cap and purchases a floor or vice versa in an attempt to protect itself against interest rate movements exceeding given minimum or maximum levels, (iv) callable interest rate swaps, under which the buyer pays an upfront fee in consideration for the right to early terminate the swap transaction in whole, at zero cost and at a predetermined date and time prior to the maturity date, (v) spreadlocks, which allow the interest rate swap users to lock in the forward differential (or spread) between the interest rate swap rate and a specified benchmark, or (vi) basis swaps, under which two parties can exchange variable interest rates based on different segments of money markets.
Asset Segregation Certain of the transactions described above can be viewed as constituting a form of borrowing or financing transaction by a Portfolio. In such event, a Portfolio will cover its commitment under such transactions by segregating or “earmarking” assets in accordance with procedures adopted by the Board, in which case such transactions will not be considered “senior securities” by the Portfolio. With respect to forwards, futures contracts, options and swaps that are contractually permitted or required to cash settle (i.e., where physical delivery of the underlying reference asset is not required), a Portfolio is permitted to segregate or earmark liquid assets equal to the Portfolio’s daily marked to market net obligation under the derivative instrument, if any, rather than the derivative’s full notional value. By segregating or earmarking liquid assets equal to only its net marked to market obligation under derivatives that are required to cash settle, a Portfolio will have the ability to employ leverage to a greater extent than if a Portfolio were to segregate or earmark liquid assets equal to the full notional value of the derivative.
| | | | | | |
| | SEMIANNUAL REPORT | | JUNE 30, 2016 | | 127 |
Notes to Financial Statements (Cont.)
7. PRINCIPAL RISKS
In the normal course of business the Portfolios trade financial instruments and enter into financial transactions where risk of potential loss exists due to such things as changes in the market (market risk) or failure or inability of the other party to a transaction to perform (credit and counterparty risk). See below for a detailed description of select principal risks. For a more comprehensive list of potential risks the Portfolios may be subject to, please see the Important Information About the Portfolios.
Market Risks A Portfolio’s investments in financial derivatives and other financial instruments expose the Portfolio to various risks such as, but not limited to, interest rate, foreign currency, equity and commodity risks.
Interest rate risk is the risk that fixed income securities will decline in value because of changes in interest rates. As nominal interest rates rise, the value of certain fixed income securities held by a Portfolio is likely to decrease. A nominal interest rate can be described as the sum of a real interest rate and an expected inflation rate. Interest rate changes can be sudden and unpredictable, and a Portfolio may lose money if these changes are not anticipated by Portfolio management. A Portfolio may not be able to hedge against changes in interest rates or may choose not to do so for cost or other reasons. In addition, any hedges may not work as intended.
Fixed income securities with longer durations tend to be more sensitive to changes in interest rates, usually making them more volatile than securities with shorter durations. Duration is a measure used to determine the sensitivity of a security’s price to changes in interest rates that incorporates a security’s yield, coupon, final maturity and call features, among other characteristics. Duration is useful primarily as a measure of the sensitivity of a fixed income security’s market price to interest rate (i.e. yield) movements. All other things remaining equal, for each one percentage point increase in interest rates, the value of a portfolio of fixed income investments would generally be expected to decline by one percent for every year of the portfolio’s average duration above zero. For example, the value of a portfolio of fixed income securities with an average duration of three years would generally be expected to decline by approximately 3% if interest rates rose by one percentage point. Convexity is an additional measure used to understand a security’s interest rate sensitivity. Convexity measures the rate of change of duration in response to changes in interest rates and may be positive or negative Securities with negative convexity may experience greater losses during periods of rising interest rates, and accordingly Portfolios holding such securities may be subject to a greater risk of losses in periods of rising interest rates. A wide variety of factors can cause interest rates to rise (e.g., central bank monetary policies, inflation rates, general economic conditions). At present, the U.S. is experiencing historically low interest rates. This, combined with recent economic recovery, the Federal Reserve Board’s conclusion of its quantitative easing program, and recent increases in the interest rates for the first time since 2006, could potentially increase the probability of an upward interest rate environment in the near future. During periods of very low or negative interest rates, a Portfolio may be unable to maintain positive returns. Changing interest rates, including rates that fall below zero, may have unpredictable effects on markets, may result in heightened market volatility and may detract from Portfolio performance to the extent a Portfolio is exposed to such interest rates. Rising interest rates may result in a decline in value of a Portfolio’s fixed-income investments and in periods of volatility. Further, while U.S. bond markets have steadily grown over the past three decades, dealer “market making” ability has remained relatively stagnant. As a result, dealer
| | | | | | |
| 128 | | PIMCO MANAGED ACCOUNTS TRUST | | | | |
(Unaudited)
June 30, 2016
inventories of certain types of bonds and similar instruments, which provide a core indication of the ability of financial intermediaries to “make markets,” are at or near historic lows in relation to market size. Because market makers provide stability to a market through their intermediary services, the significant reduction in dealer inventories could potentially lead to decreased liquidity and increased volatility in the fixed income markets. Such issues may be exacerbated during periods of economic uncertainty. All of these factors, collectively and/or individually, could cause a Portfolio to lose value. If a Portfolio lost enough value, the Portfolio could face increased redemptions by shareholders, which could further impair its performance and could require a Portfolio to liquidate its portfolio securities at disadvantageous times and prices.
Foreign (non-U.S.) securities in this report are classified by the country of incorporation of a holding. In certain instances, a security’s country of incorporation may be different from its country of economic exposure. If a Portfolio invests directly in foreign (non-U.S.) currencies or in securities that trade in, and receive revenues in, foreign (non-U.S.) currencies, or in financial derivatives that provide exposure to foreign (non-U.S.) currencies, it will be subject to the risk that those currencies will decline in value relative to the base currency of the Portfolio, or, in the case of hedging positions, that the Portfolio’s base currency will decline in value relative to the currency being hedged. Currency rates in foreign (non-U.S.) countries may fluctuate significantly over short periods of time for a number of reasons, including changes in interest rates, intervention (or the failure to intervene) by U.S. or foreign governments, central banks or supranational entities such as the International Monetary Fund, or by the imposition of currency controls or other political developments in the United States or abroad. As a result, a Portfolio’s investments in foreign (non-U.S) currency-denominated securities may reduce the Portfolio’s returns.
The market value of a Portfolio’s investments may decline due to general market conditions which are not specifically related to a particular company or issuer, such as real or perceived adverse economic conditions, changes in the general outlook for corporate earnings, changes in interest or currency rates or adverse investor sentiment generally. They may also decline due to factors which affect a particular industry or industries, such as labor shortages or increased production costs and competitive conditions within an industry. Equity securities and equity related investments generally have greater market price volatility than fixed income securities, although under certain market conditions fixed income securities may have comparable or greater price volatility. Credit ratings downgrades may also negatively affect securities held by a Portfolio. Even when markets perform well, there is no assurance that the investments held by a Portfolio will increase in value along with the broader market. In addition, market risk includes the risk that geopolitical events will disrupt the economy on a national or global level.
Credit and Counterparty Risks A Portfolio will be exposed to credit risk to parties with whom it trades and will also bear the risk of settlement default. A Portfolio seeks to minimize concentrations of credit risk by undertaking transactions with a large number of counterparties on recognized and reputable exchanges, where applicable. Over the counter (“OTC”) derivative transactions are subject to the risk that a counterparty to the transaction will not fulfill its contractual obligations to the other party, as many of the protections afforded to centrally cleared derivative transactions might not be available for OTC derivative transactions. A Portfolio could lose money if the issuer or guarantor of a fixed income security, or the counterparty to a financial derivatives contract, repurchase agreement or a loan of portfolio securities, is unable or unwilling to make timely principal and/or interest
| | | | | | |
| | SEMIANNUAL REPORT | | JUNE 30, 2016 | | 129 |
Notes to Financial Statements (Cont.)
payments, or to otherwise honor its obligations. Securities are subject to varying degrees of credit risk, which are often reflected in credit ratings.
Similar to credit risk, a Portfolio may be exposed to counterparty risk, or the risk that an institution or other entity with which a Portfolio has unsettled or open transactions will default. PIMCO, as investment adviser, seeks to minimize counterparty risks to a Portfolio in a number of ways. Prior to entering into transactions with a new counterparty, the PIMCO Counterparty Risk Committee conducts an extensive credit review of such counterparty and must approve the use of such counterparty. Furthermore, pursuant to the terms of the underlying contract, to the extent that unpaid amounts owed to a Portfolio exceed a predetermined threshold, such counterparty is required to advance collateral to a Portfolio in the form of cash or securities equal in value to the unpaid amount owed to the Portfolio. A Portfolio may invest such collateral in securities or other instruments and will typically pay interest to the counterparty on the collateral received. If the unpaid amount owed to a Portfolio subsequently decreases, the Portfolio would be required to return to the counterparty all or a portion of the collateral previously advanced. PIMCO’s attempts to minimize counterparty risk may, however, be unsuccessful.
All transactions in listed securities are settled/paid for upon delivery using approved counterparties. The risk of default is considered minimal, as delivery of securities sold is only made once a Portfolio has received payment. Payment is made on a purchase once the securities have been delivered by the counterparty. The trade will fail if either party fails to meet its obligation.
Master Netting Arrangements The Portfolios may be subject to various netting arrangements with select counterparties (“Master Agreements”). Master Agreements govern the terms of certain transactions, and are intended to reduce the counterparty risk associated with relevant transactions by specifying credit protection mechanisms and providing standardization that is intended to improve legal certainty. Each type of Master Agreement governs certain types of transactions. Different types of transactions may be traded out of different legal entities or affiliates of a particular organization, resulting in the need for multiple agreements with a single counterparty. As the Master Agreements are specific to unique operations of different asset types, they allow a Portfolio to close out and net its total exposure to a counterparty in the event of a default with respect to all the transactions governed under a single Master Agreement with a counterparty. For financial reporting purposes the Statements of Assets and Liabilities generally present derivative assets and liabilities on a gross basis, which reflects the full risks and exposures prior to netting.
Master Agreements can also help limit counterparty risk by specifying collateral posting arrangements at pre-arranged exposure levels. Under the Master Agreements, collateral is routinely transferred if the total net exposure to certain transactions (net of existing collateral already in place) governed under the relevant Master Agreement with a counterparty in a given account exceeds a specified threshold, which typically ranges from zero to $250,000 depending on the counterparty and the type of Master Agreement. United States Treasury Bills and U.S. dollar cash are generally the preferred forms of collateral, although other forms of AAA rated paper or sovereign securities may be used. Securities and cash pledged as collateral are reflected as assets on the Statements of Assets and Liabilities as either a component of Investments at value (securities) or Deposits with counterparty (cash). Cash collateral received is typically not held in a segregated account and as such is reflected as a liability on the Statements of Assets and Liabilities as Deposits from counterparty.
| | | | | | |
| 130 | | PIMCO MANAGED ACCOUNTS TRUST | | | | |
(Unaudited)
June 30, 2016
The market value of any securities received as collateral is not reflected as a component of NAV. A Portfolio’s overall exposure to counterparty risk can change substantially within a short period, as it is affected by each transaction subject to the relevant Master Agreement.
Master Repurchase Agreements and Global Master Repurchase Agreements (individually and collectively “Master Repo Agreements”) govern repurchase, reverse repurchase, and sale-buyback transactions between a Portfolio and select counterparties. Master Repo Agreements maintain provisions for, among other things, transaction initiation, income payments, events of default, and maintenance of collateral. The market value of transactions under the Master Repo Agreement, collateral pledged or received, and the net exposure by counterparty as of period end are disclosed in the Notes to Schedules of Investments.
Master Securities Forward Transaction Agreements (“Master Forward Agreements”) govern the considerations and factors surrounding the settlement of certain forward settling transactions, such as TBA securities, delayed-delivery or sale-buyback transactions by and between a Portfolio and select counterparties. The Master Forward Agreements maintain provisions for, among other things, transaction initiation and confirmation, payment and transfer, events of default, termination, and maintenance of collateral. The market value of forward settling transactions, collateral pledged or received, and the net exposure by counterparty as of period end is disclosed in the Notes to Schedules of Investments.
Customer Account Agreements and related addenda govern cleared derivatives transactions such as futures, options on futures, and cleared OTC derivatives. Cleared derivatives transactions require posting of initial margin as determined by each relevant clearing agency which is segregated at a broker account registered with the Commodity Futures Trading Commission (“CFTC”), or the applicable regulator. In the United States, counterparty risk may be reduced as creditors of a futures broker do not have a claim to Portfolio assets in the segregated account. Portability of exposure further reduces risk to the Portfolios. Variation margin, or changes in market value, are exchanged daily, but may not be netted between futures and cleared OTC derivatives. The market value or accumulated unrealized appreciation (depreciation), initial margin posted, and any unsettled variation margin as of period end is disclosed in the Notes to Schedules of Investments.
International Swaps and Derivatives Association, Inc. Master Agreements and Credit Support Annexes (“ISDA Master Agreements”) govern OTC financial derivative transactions entered into by a Portfolio and select counterparties. ISDA Master Agreements maintain provisions for general obligations, representations, agreements, collateral and posting events of default or termination. Events of termination include conditions that may entitle counterparties to elect to terminate early and cause settlement of all outstanding transactions under the applicable ISDA Master Agreement. Any election to terminate early could be material to the financial statements. In limited circumstances, the ISDA Master Agreement may contain additional provisions that add counterparty protection beyond coverage of existing daily exposure if the counterparty has a decline in credit quality below a predefined level. These amounts, if any, may be segregated with a third-party custodian. The market value of OTC financial derivative instruments, collateral received or pledged, and net exposure by counterparty as of period end are disclosed in the Notes to Schedules of Investments.
| | | | | | |
| | SEMIANNUAL REPORT | | JUNE 30, 2016 | | 131 |
Notes to Financial Statements (Cont.)
8. FEES AND EXPENSES
(a) Investment Advisory Fee The Trust entered into an Investment Advisory Contract with the Adviser (the “Advisory Contract”) pursuant to which the Adviser serves as the investment adviser to each Portfolio. The Adviser does not receive investment advisory or other fees from the Portfolios or the Trust (although PIMCO may receive compensation under the Advisory Contract with respect to future series of the Trust). The financial statements reflect the fact that no investment management fees or expenses are incurred by the Portfolios.
Each Portfolio is an integral part of one or more “wrap-fee” programs, including those sponsored by investment advisers and/or broker-dealers unaffiliated with the Portfolios or PIMCO. Participants in these programs pay a “wrap” fee to the sponsor of the program. PIMCO may receive fees or other benefits from or through its relationships with the sponsors of such wrap-fee programs for which the Portfolios are an investment option.
(b) Supervisory and Administration Fee Pursuant to the Supervision and Administration Agreement with PIMCO (the “Administration Agreement”), PIMCO also serves as administrator to the Portfolios (in this capacity, PIMCO is referred to as the “Administrator”). Under the Administration Agreement, the Administrator, at its expense, is required to procure most supervisory and administrative services required by the Portfolios including, but not limited to, expenses of most third-party service providers (e.g., audit, custodial, legal, transfer agency, printing) and other expenses, such as those associated with insurance, proxy solicitations and mailings for shareholder meetings, tax services, valuation services and other services required for the Portfolios’ daily operations. Under the Administration Agreement, the Administrator has agreed to provide or procure these services, and to bear the expenses associated with these services at no charge to the Portfolios. In addition, PIMCO has entered into an expense limitation agreement with the Trust pursuant to which it has agreed to pay or reimburse certain other expenses of the Portfolios, as discussed in more detail below. The Administrator does not receive any administration or other fees from the Portfolios or the Trust for serving as administrator to the Portfolios (although the Administrator may receive compensation under the Administration Agreement with respect to future series of the Trust).
(c) Distribution Fee The Trust has entered into a distribution contract with PIMCO Investments LLC (the “Distributor”), a wholly-owned subsidiary of PIMCO, pursuant to which the Distributor serves as the distributor and principal underwriter of the Portfolios’ shares (the “Distribution Contract”). The Distributor does not receive any distribution or other fees from the Portfolios or the Trust for serving as the distributor and principal underwriter of the Portfolios’ shares (although the Distributor may receive compensation under the Distribution Contract with respect to future series of the Trust).
(d) Expense Limitation Agreement The Adviser has contractually agreed pursuant to an expense limitation agreement (the “Expense Limitation Agreement”) to bear the expenses of or make payments to each Portfolio to the extent that, for any calendar month, “Specified Expenses”, as defined in the Expense Limitation Agreement of such Portfolio would exceed 0.00%. “Specified Expenses” of a Portfolio means all expenses incurred by the Portfolio, including organizational and offering expenses, but excluding any brokerage fees and commissions and other portfolio transaction expenses, costs, including interest expenses, of borrowing money or engaging in other types of leverage financing, including, without limitation, through reverse repurchase agreements, tender
| | | | | | |
| 132 | | PIMCO MANAGED ACCOUNTS TRUST | | | | |
(Unaudited)
June 30, 2016
option bonds, bank borrowings and credit facilities, fees and expenses of any underlying Portfolios or other pooled vehicles in which the Portfolio invests, taxes, governmental fees, dividends and interest on short positions, and extraordinary expenses, including extraordinary legal expenses. This Expense Limitation Agreement shall continue in effect, unless sooner terminated by the Trust’s Board of Trustees, for so long as the Adviser serves as the investment adviser to the applicable Portfolio pursuant to the Advisory Contract.
9. RELATED PARTY TRANSACTIONS
The Adviser, Administrator, and Distributor are related parties. Fees payable to these parties are disclosed in Note 8, Fees and Expenses, and the accrued related party fee amounts are disclosed on the Statements of Assets and Liabilities.
Certain Portfolios are permitted to purchase or sell securities from or to certain related affiliated funds under specified conditions outlined in procedures adopted by the Board. The procedures have been designed to ensure that any purchase or sale of securities by a Portfolio from or to another fund or portfolio that are, or could be, considered an affiliate by virtue of having a common investment adviser (or affiliated investment advisers), common Trustees and/or common officers complies with Rule 17a-7 of the Act. Further, as defined under the procedures, each transaction is effected at the current market price. During the period ended June 30, 2016, the Portfolios below engaged in purchases and sales of securities pursuant to Rule 17a-7 of the Act (amounts in thousands†):
| | | | | | | | | | | | |
| Portfolio Name | | | | | Purchases | | | Sales | |
| Fixed Income SHares - Series C | | | | | | $ | 1,230 | | | $ | 0 | |
| Fixed Income SHares - Series LD | | | | | | | 3,067 | | | | 2,378 | |
| Fixed Income SHares - Series M | | | | | | | 0 | | | | 25,471 | |
| Fixed Income SHares - Series R | | | | | | | 19,049 | | | | 4,097 | |
| † | A zero balance may reflect actual amounts rounding to less than one thousand. |
10. GUARANTEES AND INDEMNIFICATIONS
Under the Trust’s organizational documents, each Trustee and officer is indemnified, to the extent permitted by the Act, against certain liabilities that may arise out of performance of their duties to the Portfolios. Additionally, in the normal course of business, the Portfolios enter into contracts that contain a variety of indemnification clauses. The Portfolios’ maximum exposure under these arrangements is unknown as this would involve future claims that may be made against the Portfolios that have not yet occurred. However, the Portfolios have not had prior claims or losses pursuant to these contracts.
11. PURCHASES AND SALES OF SECURITIES
The length of time a Portfolio has held a particular security is not generally a consideration in investment decisions. A change in the securities held by a Portfolio is known as “portfolio turnover.” Each Portfolio may engage in frequent and active trading of portfolio securities to achieve its investment objective, particularly during periods of volatile market movements. High portfolio turnover involves correspondingly greater transaction costs to a Portfolio, including brokerage commissions or dealer mark-ups and other transaction costs on the sale of securities and reinvestments in other
| | | | | | |
| | SEMIANNUAL REPORT | | JUNE 30, 2016 | | 133 |
Notes to Financial Statements (Cont.)
securities. Such sales may also result in realization of taxable capital gains, including short-term capital gains (which are generally taxed at ordinary income tax rates). The transaction costs and tax effects associated with portfolio turnover may adversely affect a Portfolio’s performance. The portfolio turnover rates are reported in the Financial Highlights.
Purchases and sales of securities (excluding short-term investments) for the period ended June 30, 2016, were as follows (amounts in thousands†):
| | | | | | | | | | | | | | | | | | | | | | | | |
| | | | | | U.S. Government/Agency | | | | | | All Other | |
| Portfolio Name | | | | | Purchases | | | Sales | | | | | | Purchases | | | Sales | |
| Fixed Income SHares - Series C | | | | | | $ | 1,283,986 | | | $ | 966,685 | | | | | | | $ | 46,360 | | | $ | 133,926 | |
| Fixed Income SHares - Series LD | | | | | | | 572,369 | | | | 567,382 | | | | | | | | 20,865 | | | | 11,345 | |
| Fixed Income SHares - Series M | | | | | | | 6,873,796 | | | | 6,927,805 | | | | | | | | 28,384 | | | | 47,410 | |
| Fixed Income SHares - Series R | | | | | | | 242,524 | | | | 240,017 | | | | | | | | 26,151 | | | | 37,167 | |
| Fixed Income SHares - Series TE | | | | | | | 0 | | | | 0 | | | | | | | | 77,971 | | | | 75,000 | |
| † | A zero balance may reflect actual amounts rounding to less than one thousand. |
12. SHARES OF BENEFICIAL INTEREST
The Trust may issue an unlimited number of shares of beneficial interest with a $0.001 par value.
13. REGULATORY AND LITIGATION MATTERS
The Portfolios are not named as defendants in any material litigation or arbitration proceedings and are not aware of any material litigation or claim pending or threatened against them.
PIMCO has received a Wells Notice from the staff of the U.S. Securities and Exchange Commission (“SEC”) that relates to the PIMCO Total Return Active Exchange-Traded Fund (“BOND”), a series of PIMCO ETF Trust. The notice indicates the staff’s preliminary determination to recommend that the SEC commence a civil action against PIMCO stemming from a non-public investigation relating to BOND. A Wells Notice is neither a formal allegation of wrongdoing nor a finding that any law was violated.
This matter principally pertains to the valuation of smaller sized positions in non-agency mortgage- backed securities purchased by BOND between its inception on February 29, 2012 and June 30, 2012, BOND’s performance disclosures for that period, and PIMCO’s compliance policies and procedures related to these matters.
The Wells process provides PIMCO with the opportunity to demonstrate to the SEC staff why it believes its conduct was appropriate, in keeping with industry standards, and that no action should be taken. PIMCO believes that this matter is unlikely to have a material adverse effect on any Portfolio or on PIMCO’s ability to provide investment management services to any Portfolio.
The foregoing speaks only as of the date of this report.
14. FEDERAL INCOME TAX MATTERS
Each Portfolio intends to qualify as a regulated investment company under Subchapter M of the Internal Revenue Code (the “Code”) and distribute all of its taxable income and net realized gains, if applicable, to shareholders. Accordingly, no provision for Federal income taxes has been made.
| | | | | | |
| 134 | | PIMCO MANAGED ACCOUNTS TRUST | | | | |
(Unaudited)
June 30, 2016
The Portfolios may be subject to local withholding taxes, including those imposed on realized capital gains. Any applicable foreign capital gains tax is accrued daily based upon net unrealized gains, and may be payable following the sale of any applicable investments.
In accordance with U.S. GAAP, the Adviser has reviewed the Portfolios’ tax positions for all open tax years. As of June 30, 2016, the Portfolios have recorded no liability for net unrecognized tax benefits relating to uncertain income tax positions they have taken or expect to take in future tax returns.
Each Portfolio files U.S. tax returns. While the statute of limitations remains open to examine the Portfolios’ U.S. tax returns filed for the fiscal years from 2013-2015, no examinations are in progress or anticipated at this time. No Portfolio is aware of any tax positions for which it is reasonably possible that the total amounts of unrecognized tax benefits will significantly change in the next twelve months.
Under the Regulated Investment Company Modernization Act of 2010, a fund is permitted to carry forward any new capital losses for an unlimited period. Additionally, such capital losses that are carried forward will retain their character as either short-term or long-term capital losses rather than being considered all short-term under previous law.
As of December 31, 2015, the Portfolios had the following post-effective capital losses with no expiration (amounts in thousands):
| | | | | | | | | | | | |
| | | | | | Short-Term | | | Long-Term | |
| Series C | | | | | | $ | 96,930 | | | $ | 35,564 | |
| Series LD | | | | | | | — | | | | 182 | |
| Series M | | | | | | | 2,626 | | | | 2,067 | |
| Series R | | | | | | | 832 | | | | 30,133 | |
| Series TE | | | | | | | 1,061 | | | | 2,164 | |
As of June 30, 2016, the aggregate cost and the net unrealized appreciation (depreciation) of investments for federal income tax purposes are as follows (amounts in thousands):
| | | | | | | | | | | | | | | | | | | | |
| Portfolio Name | | | | | Federal
Tax Cost | | | Aggregate
Gross
Unrealized
Appreciation | | | Aggregate
Gross
Unrealized
(Depreciation) | | | Net
Unrealized
Appreciation
(Depreciation) (1) | |
| Fixed Income SHares - Series C | | | | | | $ | 1,904,458 | | | $ | 106,777 | | | $ | (14,891 | ) | | $ | 91,886 | |
| Fixed Income SHares - Series LD | | | | | | | 56,121 | | | | 583 | | | | (212 | ) | | | 371 | |
| Fixed Income SHares - Series M | | | | | | | 2,509,470 | | | | 145,159 | | | | (45,266 | ) | | | 99,893 | |
| Fixed Income SHares - Series R | | | | | | | 256,581 | | | | 7,239 | | | | (3,065 | ) | | | 4,174 | |
| Fixed Income SHares - Series TE | | | | | | | 99,258 | | | | 6,538 | | | | 0 | | | | 6,538 | |
| (1) | Primary differences, if any, between book and tax net unrealized appreciation (depreciation) are attributable to wash sale loss deferrals. |
| | | | | | |
| | SEMIANNUAL REPORT | | JUNE 30, 2016 | | 135 |
Notes to Financial Statements (Cont.)
(Unaudited)
June 30, 2016
15. SUBSEQUENT EVENTS
In preparing these financial statements, the Portfolios’ management has evaluated events and transactions for potential recognition or disclosure through the date the financial statements were issued.
There were no subsequent events identified that require recognition or disclosure.
| | | | | | |
| 136 | | PIMCO MANAGED ACCOUNTS TRUST | | | | |
Glossary: (abbreviations that may be used in the preceding statements)
(Unaudited)
| | | | | | |
|
| Counterparty Abbreviations: |
| AZD | | Australia and New Zealand Banking Group | | HUS | | HSBC Bank USA N.A. |
| BCY | | Barclays Capital, Inc. | | IND | | Crédit Agricole Corporate and Investment Bank S.A. |
| BOA | | Bank of America N.A. | | JPM | | JPMorgan Chase Bank N.A. |
| BOM | | Bank of Montreal | | MSB | | Morgan Stanley Bank N.A. |
| BOS | | Banc of America Securities LLC | | MSC | | Morgan Stanley & Co., Inc. |
| BPG | | BNP Paribas Securities Corp. | | MYC | | Morgan Stanley Capital Services, Inc. |
| BPS | | BNP Paribas S.A. | | NOM | | Nomura Securities International Inc. |
| BRC | | Barclays Bank PLC | | RDR | | RBC Capital Markets |
| BSN | | Bank of Nova Scotia | | RYL | | Royal Bank of Scotland Group PLC |
| CBK | | Citibank N.A. | | SAL | | Citigroup Global Markets, Inc. |
| DEU | | Deutsche Bank Securities, Inc. | | SCX | | Standard Chartered Bank |
| DUB | | Deutsche Bank AG | | SGY | | Societe Generale, New York |
| FBF | | Credit Suisse International | | SOG | | Societe Generale |
| FOB | | Credit Suisse Securities (USA) LLC | | SSB | | State Street Bank and Trust Co. |
| GLM | | Goldman Sachs Bank USA | | TDM | | TD Securities (USA) LLC |
| GRE | | RBS Securities, Inc. | | UAG | | UBS AG Stamford |
| GSC | | Goldman Sachs & Co. | | UBS | | UBS Securities LLC |
| GST | | Goldman Sachs International | | | | |
|
| Currency Abbreviations: |
| AUD | | Australian Dollar | | KRW | | South Korean Won |
| BRL | | Brazilian Real | | MXN | | Mexican Peso |
| CAD | | Canadian Dollar | | MYR | | Malaysian Ringgit |
| CHF | | Swiss Franc | | NZD | | New Zealand Dollar |
| CNH | | Chinese Renminbi (Offshore) | | PLN | | Polish Zloty |
| DKK | | Danish Krone | | RUB | | Russian Ruble |
| EUR | | Euro | | SGD | | Singapore Dollar |
| GBP | | British Pound | | THB | | Thai Baht |
| HUF | | Hungarian Forint | | TWD | | Taiwanese Dollar |
| ILS | | Israeli Shekel | | USD (or $) | | United States Dollar |
| JPY | | Japanese Yen | | | | |
|
| Exchange Abbreviations: |
| CBOT | | Chicago Board of Trade | | OTC | | Over the Counter |
|
| Index/Spread Abbreviations: |
| CDX.HY | | Credit Derivatives Index - High Yield | | CPURNSA | | Consumer Price All Urban Non-Seasonally Adjusted Index |
| CDX.IG | | Credit Derivatives Index - Investment Grade | | EXT-CPI | | Excluding Tobacco-Non-revised Consumer Price Index |
| CMBX | | Commercial Mortgage-Backed Index | | MCDX | | Municipal Bond Credit Derivative Index |
| CPALEMU | | Euro Area All Items Non-Seasonally Adjusted Index | | UKRPI | | United Kingdom Retail Price Index |
|
| Municipal Bond or Agency Abbreviations: |
| AGM | | Assured Guaranty Municipal | | | | |
|
| Other Abbreviations: |
| ABS | | Asset-Backed Security | | LIBOR | | London Interbank Offered Rate |
| ALT | | Alternate Loan Trust | | NCUA | | National Credit Union Administration |
| BABs | | Build America Bonds | | REMIC | | Real Estate Mortgage Investment Conduit |
| CDO | | Collateralized Debt Obligation | | RMBS | | Residential Mortgage-Backed Security |
| CLO | | Collateralized Loan Obligation | | TIIE | | Tasa de Interés Interbancaria de Equilibrio “Equilibrium Interbank Interest Rate” |
| EURIBOR | | Euro Interbank Offered Rate | | YOY | | Year-Over-Year |
| | | | | | |
| | SEMIANNUAL REPORT | | JUNE 30, 2016 | | 137 |
Approval of Investment Advisory Contract and Other Agreements
At an in-person meeting held on June 7, 2016 (the “Approval Meeting”), the Board of Trustees of PMAT (the “Board”), including the Trustees who are not interested persons (as that term is defined in the 1940 Act) of PMAT or PIMCO (the “Independent Trustees”), formally considered and unanimously approved the continuation of the Investment Advisory Contract between PMAT, on behalf of each of its series (as referenced in this exhibit, each, a “Portfolio” and, collectively, the “Portfolios”), and PIMCO (the “Investment Advisory Contract”), the Supervision and Administration Agreement between PMAT, on behalf of each Portfolio, and PIMCO (the “Administration Agreement”) and the Distribution Contract between PMAT, on behalf of each Portfolio, and PI (the “Distribution Contract” and, collectively, the “Agreements”), each for an additional one-year period commencing on September 5, 2016. Prior to the Approval Meeting, the Contracts Review Committee (the “Committee”) of the Board held an in-person meeting on June 7, 2016 (the “Committee Meeting”) and formally considered and recommended to the Board the continuation of the Agreements. Prior to the Approval Meeting, the Chair of the Committee, on May 4, 2016, participated in a conference call with members of management and PIMCO personnel and counsel to the Independent Trustees (“Independent Counsel”) to discuss the process for the Board’s review of the Agreements and to consider certain information relating to the Portfolios, including, among other information, information relating to PIMCO’s and PI’s profitability with respect to the Agreements and Portfolio performance. On April 29, 2016, PIMCO provided materials to the Committee for its consideration of the Agreements in response to a request from Independent Counsel (the “Manager Request Letter”), as well as other materials and information PIMCO and PI believed was useful in evaluating the continuation of the Agreements.
On May 23, 2016, the Committee held a meeting via conference call (collectively with the May 4, 2016 conference call, Committee Meeting and the Approval Meeting, the “Contract Renewal Meetings”), at which the members of the Committee, all of whom are Independent Trustees, considered materials and information provided by PIMCO and PI bearing on the continuation of the Agreements. The Committee also received and reviewed a memorandum from counsel to the Portfolios regarding the Trustees’ responsibilities in evaluating the Agreements, which they discussed with Independent Counsel.
At the Committee Meeting and Approval Meeting, PIMCO presented certain additional supplemental information to the Independent Trustees regarding the Portfolios. Following the presentation at the Committee Meeting, the Independent Trustees met separately in executive session with Independent Counsel to review and discuss all relevant information, including, but not limited to, information provided in response to the Manager Request Letter and information presented and discussed at the prior Contract Renewal Meetings.
In connection with their deliberations regarding the proposed continuation of the Agreements for each Portfolio, the Trustees, including the Independent Trustees, considered such information and factors as they believed, in light of the legal advice furnished to them and their own business judgment, to be relevant. The Trustees also considered the nature, quality and extent of the various investment management, administrative and other services performed by PIMCO under the Investment Advisory Contract and Administration Agreement and the distribution services provided to each Portfolio by PI under the Distribution Contract.
| | | | | | |
| 138 | | PIMCO MANAGED ACCOUNTS TRUST | | | | |
(Unaudited)
It was noted that, in connection with their Contract Renewal Meetings, the Trustees relied upon materials provided by PIMCO and PI, which included, among other items: (i) information regarding the investment performance for each Portfolio, certain representative indexes and composites comprised of separate accounts and commingled funds managed by PIMCO that invest in the Portfolios; (ii) the estimated profitability to PIMCO with respect to the Portfolios for the one-year period ended December 31, 2015; (iii) information regarding the overall organization of PIMCO, including information regarding senior management, portfolio managers and other personnel providing investment management, administrative, compliance and other services to the Portfolios; and (iv) PI’s Compliance Manual, organizational structure and personnel information.
The Trustees’ conclusions as to the continuation of the Agreements were based on a comprehensive consideration of all information provided to the Trustees and were not the result of any single factor. Some of the factors that figured particularly in the Trustees’ deliberations are described below, although individual Trustees may have evaluated the information presented differently from one another, attributing different weights to various factors. The Trustees also took into account that the Portfolios’ current arrangements were closely reviewed in 2014 in connection with the proposed transition from AGIFM to PIMCO as the Portfolios’ investment adviser and administrator and from Allianz Global Investors Distributors LLC to PI as the Portfolios’ principal underwriter, and that the Investment Advisory Contract had been approved by the shareholders of each Portfolio at special shareholder meetings in 2014.
As part of their review, the Trustees examined PIMCO’s abilities to provide high-quality investment management and other services to the Portfolios. Among other information, the Trustees considered the investment philosophy and research and decision-making processes of PIMCO; the experience of key advisory personnel of PIMCO responsible for portfolio management of the Portfolios; the ability of PIMCO to attract and retain capable personnel; and the capabilities of the senior management and staff of PIMCO. In addition, the Trustees reviewed the quality of PIMCO’s services with respect to regulatory compliance and compliance with the investment policies of the Portfolios; the nature and quality of the supervisory and administrative services PIMCO is responsible for providing to the Portfolios under the Administration Agreement; the nature and quality of the distribution services that PI is responsible for providing under the Distribution Contract; and conditions that might affect PIMCO’s and PI’s ability to provide high-quality services to the Portfolios in the future under the Agreements, including PIMCO’s and PI’s financial condition and operational stability. Based on the foregoing, the Trustees concluded that PIMCO’s investment process, research capabilities and philosophy were well suited to the Portfolios given their investment objectives and policies, and that PIMCO and PI would be able to continue to meet any reasonably foreseeable obligations under the Agreements.
The Trustees also considered the performance of the Portfolios as compared to the performance of certain indexes and composites comprised of separate accounts and commingled funds managed by PIMCO that invest in the Portfolios. The Trustees noted that because the Portfolios are intended to form only a portion of an overall investment strategy and were developed exclusively for use within separately managed accounts, comparisons to the performance of traditional stand-alone funds or accounts managed by PIMCO would produce limited information. In the course of their deliberations, the Trustees took into account information provided by PIMCO and PI at the Contract Renewal
| | | | | | |
| | SEMIANNUAL REPORT | | JUNE 30, 2016 | | 139 |
Approval of Investment Advisory Contract and Other Agreements (Cont.)
(Unaudited)
Meetings, as well as information provided during investment review meetings conducted with PIMCO personnel during the course of the year regarding each Portfolio’s performance.
The Trustees also gave substantial consideration to the fact that, with respect to the Portfolios, no fees are payable to PIMCO or PI from the Portfolios under the Agreements, and that PIMCO has entered into an Expense Limitation Agreement with PMAT, on behalf of each Portfolio, pursuant to which, PIMCO waives all fees and/or pays or reimburses all expenses of the Portfolios, except extraordinary expenses, including extraordinary legal expenses, and expenses incurred as a result of portfolio investments, such as any brokerage fees and commissions and other portfolio transaction expenses, costs, including interest expenses, of borrowing money or engaging in other types of leverage financing, fees and expenses of any underlying funds or other pooled vehicles in which the Portfolios invest, taxes, governmental fees and dividends and interest on short positions.
The Trustees also considered the amounts paid by the sponsors of the “wrap” programs to PIMCO and/or its affiliates with respect to wrap account assets invested in PMAT, as well as the fees “imputed” to PIMCO, for purposes of arriving at an estimate of profitability arising from PIMCO’s and its affiliates’ relationships with the Portfolios. Among other information, the Trustees took into account explanations from PIMCO regarding how certain corporate and shared expenses were allocated among the Portfolios and other funds and accounts managed by PIMCO for purposes of developing profitability estimates.
Based on the profitability analysis provided by PIMCO, the Trustees determined that, taking into account the various assumptions made, that such profitability did not appear to be excessive. Because the Portfolios do not pay fees directly, the Trustees did not place emphasis on the extent to which economies of scale would be realized due to potential growth of assets in the Portfolios or whether fee and expense levels reflect economies of scale for the Portfolios’ shareholders.
The Trustees considered the fact that PIMCO and its affiliates may benefit from their relationships with the sponsors of wrap programs for which the Portfolios are an investment option. They noted such benefits include the receipt by PIMCO and its affiliates of fees paid by the sponsor of the wrap program based on assets under management of the wrap program. Additionally, the Trustees considered so-called “fall-out benefits” to PIMCO, such as reputational value derived from serving as investment adviser to the Portfolios and research, statistical and quotation services PIMCO may receive from broker-dealers executing the Portfolios’ portfolio transactions on an agency basis.
After reviewing these and other factors described herein, including that no fees are payable under the Agreements, the Trustees concluded with respect to each Portfolio, within the context of their overall conclusions regarding the Agreements and based on the information provided and related representations made by management, that they were satisfied with PIMCO’s responses and efforts relating to the investment performance of the Portfolios. Based on their evaluation of factors that they deemed to be material, including those factors described above, the Trustees, including the Independent Trustees, unanimously concluded that the continuation of the Agreements were in the interests of each Portfolio and its shareholders, and should be approved.
| | | | | | |
| 140 | | PIMCO MANAGED ACCOUNTS TRUST | | | | |
General Information
Investment Adviser and Administrator
Pacific Investment Management Company LLC
650 Newport Center Drive
Newport Beach, CA 92660
Distributor
PIMCO Investments LLC
1633 Broadway
New York, NY 10019
Custodian
State Street Bank and Trust Company
801 Pennsylvania Avenue
Kansas City, MO 64105
Transfer Agent
Boston Financial Data Service
330 W. 9th Street
Kansas City, MO 64105
Legal Counsel
Ropes & Gray LLP
Prudential Tower
800 Boylston Street
Boston, MA 02199
Independent Registered Public Accounting Firm
PricewaterhouseCoopers LLP
1100 Walnut Street, Suite 1300
Kansas City, MO 64106
This report is submitted for the general information of the shareholders of FISH: Series C, FISH: Series LD, FISH: Series M, FISH: Series R and FISH: Series TE, each a series of PIMCO Managed Accounts Trust.

FISH4001SAR_063016
The information required by this Item 2 is only required in an annual report on this Form N-CSR.
| Item 3. | Audit Committee Financial Expert. |
The information required by this Item 3 is only required in an annual report on this Form N-CSR.
| Item 4. | Principal Accountant Fees and Services. |
The information required by this Item 4 is only required in an annual report on this Form N-CSR.
| Item 5. | Audit Committee of Listed Registrants. |
The information required by this Item 5 is only required in an annual report on this Form N-CSR.
| Item 6. | Schedule of Investments. |
The Schedule of Investments is included as part of the reports to shareholders under Item 1.
| Item 7. | Disclosure of Proxy Voting Policies and Procedures for Closed-End Management Investment Companies. |
Not applicable.
| Item 8. | Portfolio Managers of Closed-End Management Investment Companies. |
Not applicable.
| Item 9. | Purchases of Equity Securities by Closed-End Management Investment Company and Affiliated Purchasers. |
Not applicable.
| Item 10. | Submission of Matters to a Vote of Security Holders. |
There have been no material changes to the procedures by which shareholders may recommend nominees to the Trust’s Board of Trustees since the Trust last provided disclosure in response to this item.
| Item 11. | Controls and Procedures. |
| | (a) | The principal executive officer and principal financial & accounting officer have concluded that the Registrant’s disclosure controls and procedures (as defined in Rule 30a-3(c) under the 1940 Act) provide reasonable assurances that material information relating to the Registrant is made known to them by the appropriate persons, based on their evaluation of these controls and procedures as of a date within 90 days of the filing of this report. |
| | (b) | There were no changes in the Registrant’s internal control over financial reporting (as defined in Rule 30a-3(d) under the 1940 Act) that occurred during the second fiscal quarter of the period covered by this report that have materially affected, or are reasonably likely to materially affect, the Registrant’s internal control over financial reporting. |
| | (a)(1) | Exhibit 99.CODE—Code of Ethics is not applicable for semiannual reports. |
| | (a)(2) | Exhibit 99.CERT—Certifications pursuant to Section 302 of the Sarbanes-Oxley Act of 2002. |
| | (b) | Exhibit 99.906CERT—Certifications pursuant to Section 906 of the Sarbanes-Oxley Act of 2002. |
Signatures
Pursuant to the requirements of the Securities Exchange Act of 1934 and the Investment Company Act of 1940, the registrant has duly caused this report to be signed on its behalf by the undersigned, thereunto duly authorized.
| | | | |
| | PIMCO Managed Accounts Trust |
| | |
| | By: | | /s/ PETER G. STRELOW |
| | | | Peter G. Strelow |
| | | | President (Principal Executive Officer) |
| | |
| | Date: | | August 26, 2016 |
|
| Pursuant to the requirements of the Securities Exchange Act of 1934 and the Investment Company Act of 1940, this report has been signed below by the following persons on behalf of the registrant and in the capacities and on the dates indicated. |
| | |
| | By: | | /s/ PETER G. STRELOW |
| | | | Peter G. Strelow |
| | | | President (Principal Executive Officer) |
| | |
| | Date: | | August 26, 2016 |
| | |
| | By: | | /s/ WILLIAM G. GALIPEAU |
| | | | William G. Galipeau |
| | | | Treasurer (Principal Financial & Accounting Officer) |
| | |
| | Date: | | August 26, 2016 |