UNITED STATES
SECURITIES AND EXCHANGE COMMISSION
Washington, D.C. 20549
FORM N-CSR
CERTIFIED SHAREHOLDER REPORT OF REGISTERED
MANAGEMENT INVESTMENT COMPANIES
Investment Company Act file number 811-09721
AllianzGI Managed Accounts Trust
(Exact name of registrant as specified in charter)
1633 Broadway, New York, New York 10019
(Address of principal executive offices) (Zip code)
Lawrence G. Altadonna — 1633 Broadway, New York, New York 10019
(Name and address of agent for service)
Registrant’s telephone number, including area code: 212-739-3371
Date of fiscal year end: October 31, 2014
Date of reporting period: April 30, 2014
ITEM1. REPORT TO SHAREHOLDERS
AllianzGI Managed Accounts Trust
Fixed Income SHares: Series C, LD, M, R, TE
Semi-Annual Report
April 30, 2014

Table of Contents
Letter from Chairman of the Board &
President

Hans W. Kertess
Chairman

Julian Sluyters
President & CEO
Dear Shareholder:
After three years of generally moderate growth, the US economy contracted toward the end of the six-month fiscal reporting period ended April 30, 2014. Against this backdrop, US equities rallied sharply, while the US bond market was volatile and ultimately posted a modest gain.
Six-Months in Review
For the six-month fiscal reporting period ended April 30, 2014:
| n | | Fixed Income SHares: Series C returned 2.07% prior to the deduction of fees. |
| n | | Fixed Income SHares: Series LD returned 2.03% since its inception on December 23, 2013, prior to the deduction of fees. |
| n | | Fixed Income SHares: Series M returned 2.04% prior to the deduction of fees. |
| n | | Fixed Income SHares: Series R returned 1.72% prior to the deduction of fees. |
| n | | Fixed Income SHares: Series TE returned 3.25% prior to the deduction of fees. |
After several years of positive growth, severe winter weather in parts of the
country appeared to be a headwind for the US economy as the reporting period progressed. Gross domestic product (“GDP”), the value of goods and services produced in the country, the broadest measure of economic activity and the principal indicator of economic performance, expanded at an annual pace of 2.6% during the fourth quarter of 2013. According to the US Commerce Department’s second estimate, GDP contracted at an annual pace of 1.0% during the first quarter of 2014.
The Federal Reserve (the “Fed”) maintained an accommodative monetary policy during the reporting period. However, at its meeting in December 2013, the central bank announced that it would begin tapering its monthly asset purchase program beginning in January 2014. At its meetings in January, March and April 2014, the Fed announced that it would further taper its asset purchases. However, the Fed repeated that it would not raise interest rates in the near future, saying in April that it “likely will be appropriate to maintain the current target range for the federal
| | | | |
| 2 | | Semi-Annual Report | | | April 30, 2014 |
funds rate for a considerable time after the asset purchase program ends, especially if projected inflation continues to run below the Committee’s 2 percent longer-run goal, and provided that longer-term inflation expectations remain well anchored.”
Outlook
The US economy has been resilient and, based on recent data, appears to have overcome the headwinds associated with higher taxes, rising interest rates and
Receive this report electronically and eliminate paper mailings.
To enroll, visit:
us.allianzgi.com/edelivery.
severe winter weather. We continue to expect US economic growth will be above-trend in 2014 due, in part, to the fact that fiscal policy will be less of a drag than it was last year. While we are prepared for the Fed to start raising benchmark interest rates in 2015, we think policymakers will remain behind the curve on monetary normalization. Several factors support this view, including: the modest pace of the labor recovery, the lack of inflation pressure, the need to support the deleveraging process, the risk of a bond market crash if rates were to normalize too quickly, and constrained fiscal policy and political pressure.
Together with Allianz Global Investors Fund Management LLC, the Portfolios’ investment manager and Pacific Investment Management Company LLC, the Portfolios’ sub-adviser, we thank you for investing with us.
We remain dedicated to serving your investment needs.
Sincerely,
| | |
 | |  |
| Hans W. Kertess | | Julian Sluyters |
| Chairman of the Board of Trustees | | President & Chief Executive Officer |
| | | | | | |
| April 30, 2014 | | | Semi-Annual Report | | | 3 | |
Important Information
AllianzGI Managed Accounts Trust
Fixed Income SHares: Series C, LD, M, R, TE
April 30, 2014 (unaudited)
In an economic environment where interest rates may trend upward, rising rates will negatively impact the performance of most bond funds by likely causing fixed income securities held by a fund to decrease in value. Bond funds and individual bonds with a longer duration (a measure of the expected life of a security) tend to be more sensitive to changes in interest rates, usually making them more volatile than securities with shorter durations.
Fixed Income SHares: Series C, LD, M, R and TE (the “Portfolios”) may be subject to various risks as described in their prospectuses. The risks associated with one or more Portfolios may include, but are not limited to, the following: derivatives risk, foreign (non-U.S.) investment risk, high yield risk, credit risk and issuer non-diversification risk. The Portfolios may use derivative instruments for hedging purposes or as part of an investment strategy. Use of these instruments may involve certain costs and risks, such as liquidity risk, leverage risk, market risk, credit risk, management risk and the risk that a Portfolio could not close out a position when it would be most advantageous to do so. Portfolios investing in derivatives could lose more than the principal amount invested in these instruments. Investing in non-U.S. securities may entail risk due to non-U.S. economic, political and other developments. This risk may be enhanced when a Portfolio invests in emerging markets. High-yield bonds typically have a lower credit rating than other bonds. Lower rated bonds generally involve a greater risk to principal than higher rated bonds. Concentrating investments in individual sectors may add additional risk and volatility compared to a diversified Portfolio. The credit quality of a particular security or group of securities does not ensure the stability or safety of the overall Portfolio.
Proxy Voting
Allianz Global Investors Fund Management LLC (the “Investment Manager”or “AGIFM”) serves as the Portfolios’ Investment Manager and Pacific Investment Management Company LLC (“PIMCO” or the “Sub-Adviser”) serves as the sub-adviser. The Portfolios’ Investment Manager and Sub-Adviser have adopted written proxy voting policies and procedures (the “Proxy Policy”) as required by Rule 206(4)-6 under the Investment Advisers Act of 1940, as amended. The Proxy Policy has been adopted by the Portfolios as the policies and procedures that the Sub-Adviser will use when voting proxies on behalf of the Portfolios. Copies of the written Proxy Policy and the factors that the Sub-Adviser may consider in determining how to vote proxies for each Portfolio, and information about how each Portfolio voted proxies relating to portfolio securities held during the most recent twelve-month period ended June 30, are available without charge, upon request, by calling the Portfolios’ shareholder servicing agent at (800) 628-1237, on the Allianz Global Investors Distributors’ website at us.allianzgi.com and on the Securities and Exchange Commission’s (the “SEC”) website at http://www.sec.gov.
Past performance is no guarantee of future results.
Total return is calculated by subtracting the value of an investment in each Portfolio at the beginning of each specified period from its value at the end of the period and dividing the remainder by the value of the investment at the beginning of the period and expressing the result as a percentage. The calculation assumes that all income dividends and capital gain distributions, if any, have been reinvested. Total return does not reflect broker commissions or “wrap fee” charges. Total return for a period of more than one year represents the average
| | | | |
| 4 | | Semi-Annual Report | | | April 30, 2014 |
annual total return during the period. Total return for a period of less than one year is not annualized.
An investment in the Portfolios involves risk, including the loss of principal. Total return, distribution yield, net asset value and duration will fluctuate with changes in market conditions. The following data is provided for informational purposes only and is not intended for trading purposes. Net asset value is equal to total assets less total liabilities divided by the number of shares outstanding. The credit quality of a particular security or group of securities does not ensure the stability or safety
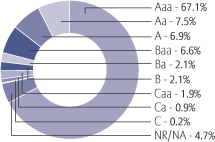
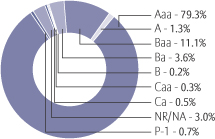
of an overall portfolio. The quality ratings of individual issues/issuers are provided to indicate the credit-worthiness of such issues/issues and generally range from AAA, Aaa, or AAA (highest) to D, C, or D (lowest) for S&P, Moody’s, and Fitch, respectively.
This report, including the financial information herein, is transmitted to the shareholders of AllianzGI Managed Accounts Trust for their information. It is not a prospectus, circular or representation intended for use in the purchase of shares of the Portfolios or any other securities mentioned in this report.
| | | | | | |
| April 30, 2014 | | | Semi-Annual Report | | | 5 | |
Portfolio Insights
AllianzGI Managed Accounts Trust
Fixed Income SHares: Series C
April 30, 2014 (unaudited)
| | | | |
| Symbol: | | Primary Investments: | | Inception Date: |
| FXICX | | Intermediate maturity fixed income securities. | | 3/17/00 |
| | |
| | | | Net Assets: |
| | | | $3.0 billion |
| | |
| | | | Portfolio Manager: |
| | | | Curtis Mewbourne |
Portfolio Commentary, Performance Statistics & Drivers
For the six-months ended April 30, 2014, Series C returned 2.07%, prior to the deduction of fees, modestly outperforming the unmanaged Barclays US Credit Intermediate Index (the “benchmark index”), which returned 2.04% during the reporting period.
An underweighting to US duration contributed to Series C’s performance, as the 10-year US Treasury yield rose during the reporting period. An exposure to high yield corporate bonds was additive given narrowing spreads amid overall robust investor demand and continued low defaults. An allocation to taxable municipal bonds, specifically Build America Bonds, contributed positively to returns as these securities outperformed the broader municipal market. Non-US interest rate exposure, particularly in Spain and Italy, were rewarded as the yields of Spanish and Italian issuers declined during the reporting period. Finally, exposures to certain non-taxable municipal securities, particularly general obligation and revenue bonds, added to results as they outperformed the benchmark index.
US yield curve positioning detracted from returns. Specifically an overweight to the 3-5 year portion of the curve, where rates rose the most, coupled with an underweighting to long end of the curve where 30-year Treasury rates declined, both detracted from performance. An overall underweighting to investment grade corporate bonds negatively impacted performance, as this sector outperformed like-duration Treasuries during the reporting period. An allocation to emerging market external debt, specifically Russian quasi-sovereign external debt, detracted from returns, as geopolitical tensions involving Ukraine negatively impacted Russian debt. An exposure to nominal emerging market local debt, particularly Brazil, detracted from performance as yields rose in the country during the reporting period.
| | | | |
| 6 | | Semi-Annual Report | | | April 30, 2014 |
Portfolio Insights
AllianzGI Managed Accounts Trust
Fixed Income SHares: Series LD
April 30, 2014 (unaudited)
| | | | |
| Symbol: | | Primary Investments: | | Inception Date: |
| FXIDX | | Short-duration fixed income securities. | | 12/23/13 |
| | |
| | | | Net Assets: |
| | | | $8.3 million |
| | |
| | | | Portfolio Managers: |
| | | | Jerome Schneider |
| | | | Andrew Wittkop |
Portfolio Commentary, Performance Statistics & Drivers
For the period from its inception on December 23, 2013 through April 30, 2014, the reporting period, Series LD returned 2.03%, prior to the deduction of fees, outperforming the unmanaged BofA Merrill Lynch 1-3 Year Treasury Index (the “benchmark index”), which returned 0.27% over the same period.
US yield curve positioning contributed to performance. In particular, an underweight to the 2-3 year portion of the curve was beneficial, as yields rose in that part of the curve. Exposures to high yield and investment grade corporate bonds were beneficial for results, as both sectors outperformed the benchmark index. An allocation to non-agency mortgage-backed securities was additive for performance, as the sector was supported by limited supply and a recovery in the housing market.
A modest exposure to asset-backed securities and a small allocation to Mexican local rates did not meaningfully impact the Portfolio’s performance.
| | | | | | |
| April 30, 2014 | | | Semi-Annual Report | | | 7 | |
Portfolio Insights
AllianzGI Managed Accounts Trust
Fixed Income SHares: Series M
April 30, 2014 (unaudited)
| | | | |
| Symbol: | | Primary Investments: | | Inception Date: |
| FXIMX | | Intermediate maturity mortgage-backed securities. | | 3/17/00 |
| | |
| | | | Net Assets: |
| | | | $2.9 billion |
| | |
| | | | Portfolio Manager: |
| | | | Curtis Mewbourne |
Portfolio Commentary, Performance Statistics & Drivers
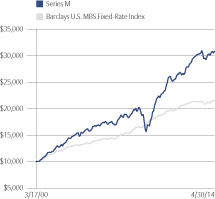
For the six-months ended April 30, 2014, Series M returned 2.04%, prior to the deduction of fees, outperforming the unmanaged Barclays US MBS Fixed-Rate Index (the “benchmark index”), which returned 1.41% during the reporting period.
Series M’s non-US interest rate exposure, particularly in Canada, contributed to performance, as the yields of non-US issuers declined during the reporting period. An allocation to commercial mortgage-backed securities (“CMBS”) positively impacted returns as the sector outperformed like-duration Treasuries and the benchmark index during the period. Exposure to non-agency mortgage-backed securities (“MBS”) was also beneficial, as these securities generally outperformed the benchmark index. Allocations to both investment grade and high yield corporate bonds was additive for results given their outperformance versus the benchmark index. An allocation to taxable municipal bonds, specifically Build America Bonds, was positive for returns as these securities outperformed the broader municipal market. An exposure to nominal emerging market external debt, particularly Venezuela, contributed to performance as yields declined in the country during the reporting period.
An overweighting to US duration detracted from performance as the 10-year US Treasury yield rose during the period. US yield curve positioning also detracted from returns. Specifically an overweight to the 3-5 year portion of the curve, where rates rose the most, coupled with an underweighting to long end of the curve where 30 year Treasury rates declined, both detracted from performance. An overall underweighting to the agency MBS sector detracted from returns, as the sector outperformed like-duration Treasuries during the reporting period. An exposure to nominal emerging market local debt, particularly Brazil, detracted from performance as yields rose in the country during the reporting period.
| | | | |
| 8 | | Semi-Annual Report | | | April 30, 2014 |
Portfolio Insights
AllianzGI Managed Accounts Trust
Fixed Income SHares: Series R
April 30, 2014 (unaudited)
| | | | |
| Symbol: | | Primary Investments: | | Inception Date: |
| FXIRX | | Inflation-indexed fixed income securities. | | 4/15/04 |
| | | | |
| | |
| | | | Net Assets: |
| | | | $247.1 million |
| | |
| | | | Portfolio Manager: |
| | | | Mihir Worah |
Portfolio Commentary, Performance Statistics & Drivers
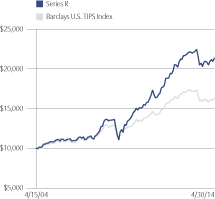
For the six-months ended April 30, 2014, Series R returned 1.72%, prior to the deduction of fees, outperforming the unmanaged Barclays US TIPS Index (the “benchmark index”), which returned 0.70% during the reporting period.
An overweighting to the short end of the US real duration curve was positive for performance as short-term breakeven inflation levels widened during the reporting period. Exposure to real rates in Italy contributed to performance as yields on Italian inflation-linked bonds fell during the period. Exposure to non-agency mortgage-backed securities (“MBS”) was also beneficial, as these securities generally produced positive returns. Series R’s allocation to financial investment grade corporate bonds contributed to performance as the sector posted strong returns relative to like-duration Treasuries. Overall, currency strategies benefited the portfolio, specifically exposures to the Mexican peso and Brazilian real.
Exposure to US nominal rates was negative for performance. In particular, exposure to the short to intermediate portion of the yield curve detracted as rates rose over the reporting period. In addition, an underweighting to the long end of the curve detracted from results as 30-year Treasuries declined over the reporting period. Short exposure to nominal European interest rates hurt performance as rates fell. An exposure to nominal emerging market local debt, particularly Brazil, detracted from performance as yields rose in the country during the reporting period.
| | | | | | |
| April 30, 2014 | | | Semi-Annual Report | | | 9 | |
Portfolio Insights
AllianzGI Managed Accounts Trust
Fixed Income SHares: Series TE
April 30, 2014 (unaudited)
| | | | |
| Symbol: | | Primary Investments: | | Inception Date: |
| FXIEX | | High yield municipal securities | | 6/26/12 |
| | |
| | | | Net Assets: |
| | | | $88.9 million |
| | |
| | | | Portfolio Managers: |
| | | | Joseph Deane |
| | | | Julie Callahan |
Portfolio Commentary, Performance Statistics & Drivers
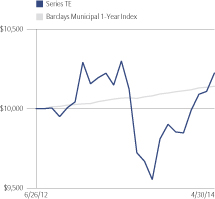
For the six-months ended April 30, 2014, Series TE returned 3.25%, prior to the deduction of fees, outperforming the unmanaged Barclays Municipal 1-Year Index (the “benchmark index”), which returned 0.43% during the reporting period.
A focus on revenue bonds, such as transportation, industrial and hospital revenue bonds, drove Series TE’s outperformance verses the benchmark index as these segments outperformed the general municipal market.
An underweighting to the long end of the curve detracted from results as 30-year Treasuries declined over the reporting period. Underweightings to general obligation and special tax-exempt municipal bonds detracted from performance as they both outperformed the benchmark index. Underweights to pre-refunded securities and the lease revenue sector detracted from performance as they both outperformed the general municipal market.
| | | | |
| 10 | | Semi-Annual Report | | | April 30, 2014 |
Performance & Statistics
Fixed Income SHares: Series C
April 30, 2014 (unaudited)
| | | | | | | | | | | | | | | | | | | | |
| Total Returns (Period ended 4/30/14) | | Six Months | | | 1 Year | | | 5 Years | | | 10 Years | | | Since Inception
(3/17/00) | |
Series C | | | 2.07% | | | | 0.04% | | | | 13.39% | | | | 11.48% | | | | 11.52% | |
Barclays U.S. Credit Intermediate Index | | | 2.04% | | | | 0.77% | | | | 7.23% | | | | 5.10% | | | | 6.11% | |
Change in Value of $10,000 Investments in
Series C and the Barclays U.S. Credit
Intermediate Index
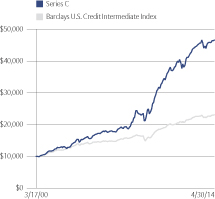
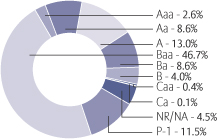
Moody’s Ratings
(as a % of total investments,
before options written and securities sold short)
Past performance is no guarantee of future results. Returns presented do not reflect the deduction of taxes that a shareholder would pay on fund distribution or the redemption of fund shares or the deduction of any fees charged to investors at the “wrap account” level.
| | | | | | | | |
| Shareholder Expense Example | | Actual | | | Hypothetical
(5% return before expenses) | |
Beginning Account Value (11/1/13) | | | $1,000.00 | | | | $1,000.00 | |
Ending Account Value (4/30/14) | | | $1,020.70 | | | | $1,024.71 | |
Expenses Paid During Period | | | $0.08 | | | | $0.08 | |
Expenses are equal to the annualized expense ratio of 0.0163%, multiplied by the average account value over the period, multiplied by 181/365 (to reflect the one-half year period).
| | | | | | |
| April 30, 2014 | | | Semi-Annual Report | | | 11 | |
Performance & Statistics
Fixed Income SHares: Series LD
April 30, 2014 (unaudited)
| | | | |
| Total Returns (Period ended 4/30/14) | | Since Inception (12/23/13) | |
Series LD | | | 2.03% | |
BofA Merrill Lynch 1-3 Year Treasury Index | | | 0.27% | |
Change in Value of $10,000 Investments in
Series LD and the BofA Merrill Lynch 1-3 Year Treasury Index
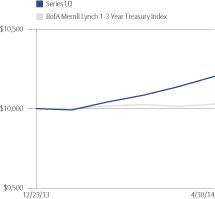
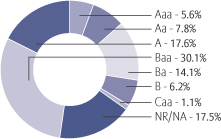
Moody’s Ratings
(as a % of total investments,
before securities sold short)
Past performance is no guarantee of future results. Returns presented do not reflect the deduction of taxes that a shareholder would pay on fund distribution or the redemption of fund shares or the deduction of any fees charged to investors at the “wrap account” level.
| | | | | | | | |
| Shareholder Expense Example | | Actual | | | Hypothetical
(5 % return before expenses) | |
Beginning Account Value (12/23/13)* | | | $1,000.00 | | | | $1,000.00 | |
Ending Account Value (4/30/14) | | | $1,020.30 | | | | $1,024.75 | |
Expenses Paid During Period | | | $0.03 | | | | $0.04 | |
* Series LD commenced operations on December 23, 2013. The Actual expense example is based on the period since inception; the Hypothetical expense example is based on the period beginning November 1, 2013.
Expenses are equal to the annualized expense ratio of 0.0084%, multiplied by the average account value over the period, multiplied by 129/365 for the Actual expense example and 181/365 for the Hypothetical expense example.
| | | | |
| 12 | | Semi-Annual Report | | | April 30, 2014 |
Performance & Statistics
Fixed Income SHares: Series M
April 30, 2014 (unaudited)
| | | | | | | | | | | | | | | | | | | | |
| Total Returns (Period ended 4/30/14) | | Six Months | | | 1 Year | | | 5 Years | | | 10 Years | | | Since Inception
(3/17/00) | |
Series M | | | 2.04% | | | | -0.50% | | | | 10.99% | | | | 6.89% | | | | 8.29% | |
Barclays U.S. MBS Fixed-Rate Index | | | 1.41% | | | | 0.57% | | | | 3.72% | | | | 4.89% | | | | 5.58% | |
Change in Value of $10,000 Investments in
Series M and the Barclays U.S. MBS Fixed-Rate Index
Moody’s Ratings
(as a % of total investments, before options written)
Past performance is no guarantee of future results. Returns presented do not reflect the deduction of taxes that a shareholder would pay on fund distribution or the redemption of fund shares or the deduction of any fees charged to investors at the “wrap account” level.
| | | | | | | | |
| Shareholder Expense Example | | Actual | | | Hypothetical
(5 % return before expenses) | |
Beginning Account Value (11/1/13) | | | $1,000.00 | | | | $1,000.00 | |
Ending Account Value (4/30/14) | | | $1,020.40 | | | | $1,024.71 | |
Expenses Paid During Period | | | $0.09 | | | | $0.09 | |
Expenses are equal to the annualized expense ratio of 0.0179%, multiplied by the average account value over the period, multiplied by 181/365 (to reflect the one-half year period).
| | | | | | |
| April 30, 2014 | | | Semi-Annual Report | | | 13 | |
Performance & Statistics
Fixed Income SHares: Series R
April 30, 2014 (unaudited)
| | | | | | | | | | | | | | | | | | | | |
| Total Returns (Period ended 4/30/14) | | Six Months | | | 1 Year | | | 5 Years | | | 10 Years | | | Since Inception
(4/15/04) | |
Series R | | | 1.72% | | | | -5.00% | | | | 10.69% | | | | 7.90% | | | | 7.83% | |
Barclays U.S. TIPS Index | | | 0.70% | | | | -5.97% | | | | 5.58% | | | | 5.19% | | | | 5.00% | |
Change in Value of $10,000 Investments
in Series R and the Barclays U.S. TIPS Index
Moody’s Ratings
(as a % of total investments, before options written )
Past performance is no guarantee of future results. Returns presented do not reflect the deduction of taxes that a shareholder would pay on fund distribution or the redemption of fund shares or the deduction of any fees charged to investors at the “wrap account” level.
| | | | | | | | |
| Shareholder Expense Example | | Actual | | | Hypothetical
(5 % return before expenses) | |
Beginning Account Value (11/1/13) | | | $1,000.00 | | | | $1,000.00 | |
Ending Account Value (4/30/14) | | | $1,017.20 | | | | $1,024.46 | |
Expenses Paid During Period | | | $0.33 | | | | $0.34 | |
Expenses are equal to the annualized expense ratio of 0.0668%, multiplied by the average account value over the period, multiplied by 181/365 (to reflect the one-half year period).
| | | | |
| 14 | | Semi-Annual Report | | | April 30, 2014 |
Performance & Statistics
Fixed Income SHares: Series TE
April 30, 2014 (unaudited)
| | | | | | | | | | | | |
| Total Returns (Period ended 4/30/14) | | Six Months | | | 1 Year | | | Since Inception
(6/26/12) | |
Series TE | | | 3.25% | | | | -0.74% | | | | 1.21% | |
Barclays Municipal 1-Year Index | | | 0.43% | | | | 0.76% | | | | 0.77% | |
Change in Value of $10,000 Investments in Series TE and the Barclays Municipal 1-Year Index
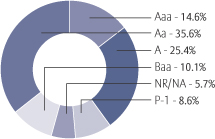
Moody’s Ratings
(as a % of total investments)
Past performance is no guarantee of future results. Returns presented do not reflect the deduction of taxes that a shareholder would pay on fund distribution or the redemption of fund shares or the deduction of any fees charged to investors at the “wrap account” level.
| | | | | | | | |
| Shareholder Expense Example | | Actual | | | Hypothetical
(5 % return before expenses) | |
Beginning Account Value (11/1/13) | | | $1,000.00 | | | | $1,000.00 | |
Ending Account Value (4/30/14) | | | $1,032.50 | | | | $1,024.79 | |
Expenses Paid During Period | | | $0.00 | | | | $0.00 | |
Expenses are equal to the annualized expense ratio of 0.0%, multiplied by the average account value over the period, multiplied by 181/365 (to reflect the one-half year period).
| | | | | | |
| April 30, 2014 | | | Semi-Annual Report | | | 15 | |
Benchmark Descriptions
AllianzGI Managed Accounts Trust
April 30, 2014 (unaudited)
Unless otherwise noted, index returns reflect the reinvestment of income dividends and capital gains, if any, but do not reflect fees, brokerage commissions or other expenses of investing. It is not possible to invest directly in an index.
| n | | Barclays Municipal 1-Year Index |
The Barclays Municipal 1-Year Index is the 1 Year (1-2) component of the Municipal Bond Index. The Barclays Municipal Bond Index is a rules-based, market-value-weighted index engineered for the long term tax-exempt bond market. To be included in the Index, bonds must be rated investment-grade (Baa3/BBB- or higher) by at least two of the following ratings agencies: Moody’s, S&P and Fitch. If only two of the three agencies rate the security, the lower rating is used to determine index eligibility. If only one of the three agencies rates a security, the rating must be investment-grade. They must have an outstanding par value of at least $7 million and be issued as part of a transaction of at least $75 million. The bonds must be fixed rate, be dated after December 31, 1990, and must be at least one year from their maturity date. Remarketed issues, taxable municipal bonds, bonds with floating rates, and derivatives, are excluded from the benchmark.
| n | | Barclays U.S. Credit Intermediate Index |
The Barclays U.S. Credit Intermediate Index is an unmanaged index of publicly issued U.S. corporate and specified foreign debentures and secured notes with intermediate maturities ranging from 1 to 10 years. Securities must also meet specific liquidity and quality requirements.
| n | | Barclays U.S. MBS Fixed-Rate Index |
The Barclays U.S. MBS Fixed Rate Index is an unmanaged index of mortgage-backed pass-through securities of Ginnie Mae (GNMA), Fannie Mae (FNMA), and Freddie Mac (FHLMC). The MBS Index is formed by grouping the universe of over 600,000 individual fixed rate MBS pools into approximately 3,500 generic aggregates.
| n | | Barclays U.S. TIPS Index |
The Barclays U.S. TIPS Index is an unmanaged market index comprised of all U.S. Treasury Inflation Protected Securities rated investment grade (Baa3 or better), having at least one year to final maturity, and at least $250 million par amount outstanding. Performance data for this index prior to October 1997 represents returns of the Barclays Inflation Notes Index.
| n | | BofA Merrill Lynch 1-3 Year Treasury Index |
The BofA Merrill Lynch 1-3 Year Treasury Index is an unmanaged index that tracks the performance of the direct sovereign debt of the U.S. Government having a maturity of at least one year and less than three years.
| | | | |
| 16 | | Semi-Annual Report | | | April 30, 2014 |
Schedule of Investments
Fixed Income SHares: Series C
April 30, 2014 (unaudited)
| | | | | | | | | | |
Principal
Amount
(000s) | | | | | | | Value | |
| | Corporate Bonds & Notes – 52.5% | | | | | | |
| | | | Airlines – 1.4% | | | | | | |
| | $355 | | | Delta Air Lines 2010-1 Class A Pass-Through Trust, 6.20%, 1/2/20 | | | | | $397,167 | |
| | 387 | | | Delta Air Lines 2010-2 Class A Pass-Through Trust, 4.95%, 11/23/20 | | | | | 421,009 | |
| | | | Northwest Airlines, Inc., | | | | | | |
| | 1,193 | | | 7.041%, 10/1/23 | | | | | 1,395,894 | |
| | 31,801 | | | 7.15%, 4/1/21 (MBIA) | | | | | 34,981,029 | |
| | | | United Air Lines Pass-Through Trust, | | | | | | |
| | 1,563 | | | 9.75%, 7/15/18 | | | | | 1,796,915 | |
| | 39 | | | 10.125%, 3/22/15 (e) | | | | | 23,587 | |
| | 1,873 | | | 10.40%, 5/1/18 | | | | | 2,133,316 | |
| | 1,500 | | | United Airlines, Inc., 6.75%, 9/15/15 (a)(d) | | | | | 1,528,125 | |
| | | | | | | | | | 42,677,042 | |
| | | | Auto Manufacturers – 0.3% | | | | | | |
| | 9,100 | | | Volkswagen International Finance NV, 4.00%, 8/12/20 (a)(d) | | | | | 9,827,481 | |
| | | | Banking – 16.7% | | | | | | |
| | | | Ally Financial, Inc., | | | | | | |
| | 21,075 | | | 3.635%, 6/20/14 (j) | | | | | 21,218,310 | |
| | 800 | | | 4.625%, 6/26/15 | | | | | 832,160 | |
| | 14,486 | | | 7.50%, 9/15/20 | | | | | 17,220,232 | |
| | 2,659 | | | 8.00%, 3/15/20 | | | | | 3,227,361 | |
| | 100 | | | 8.30%, 2/12/15 | | | | | 105,625 | |
| | 25,200 | | | Banco do Brasil S.A., 4.50%, 1/22/15 (a)(d) | | | | | 25,924,500 | |
| | | | Banco Santander Brasil S.A., | | | | | | |
| | 4,250 | | | 4.25%, 1/14/16 (a)(d) | | | | | 4,414,688 | |
| | 3,500 | | | 4.50%, 4/6/15 (a)(d) | | | | | 3,609,375 | |
| | 1,000 | | | 4.50%, 4/6/15 | | | | | 1,031,250 | |
| | 11,375 | | | 4.625%, 2/13/17 (a)(d) | | | | | 12,043,281 | |
| | | | Bank of America Corp., | | | | | | |
| | 500 | | | 5.00%, 1/15/15 | | | | | 515,103 | |
| | 3,800 | | | 5.65%, 5/1/18 | | | | | 4,313,756 | |
| | 4,300 | | | 5.75%, 12/1/17 | | | | | 4,869,311 | |
| | 2,715 | | | 6.00%, 9/1/17 | | | | | 3,083,070 | |
| | 22,700 | | | 6.40%, 8/28/17 | | | | | 26,021,305 | |
| | 66,155 | | | 6.875%, 4/25/18 | | | | | 77,997,539 | |
| | €1,000 | | | BPE Financiaciones S.A., 2.875%, 5/19/16 | | | | | 1,415,304 | |
| | $1,000 | | | CIT Group, Inc., 4.25%, 8/15/17 | | | | | 1,050,000 | |
| | | | Citigroup, Inc., | | | | | | |
| | 5,827 | | | 4.75%, 5/19/15 | | | | | 6,075,988 | |
| | 311 | | | 5.50%, 10/15/14 | | | | | 317,960 | |
| | 11,718 | | | 6.00%, 8/15/17 | | | | | 13,285,927 | |
| | 13,500 | | | 6.125%, 11/21/17 | | | | | 15,441,759 | |
| | €10,000 | | | Goldman Sachs Group, Inc., | | | | | | |
| | | | | 0.636%, 5/23/16 (j) | | | | | 13,829,348 | |
| | $15,200 | | | 6.15%, 4/1/18 | | | | | 17,429,369 | |
| | 5,000 | | | HBOS Capital Funding L.P., 6.071%, 6/30/14 (a)(d)(g) | | | | | 5,006,250 | |
| | 25,300 | | | HBOS PLC, 6.75%, 5/21/18 (a)(d) | | | | | 28,862,999 | |
| | | | | | |
| April 30, 2014 | | | Semi-Annual Report | | | 17 | |
Schedule of Investments
Fixed Income SHares: Series C
April 30, 2014 (unaudited) (continued)
| | | | | | | | | | |
Principal
Amount
(000s) | | | | | | | Value | |
| | | | Banking (continued) | | | | | | |
| | | | ICICI Bank Ltd., | | | | | | |
| | $5,900 | | | 4.75%, 11/25/16 (a)(d) | | | | | $6,240,448 | |
| | 2,500 | | | 5.00%, 1/15/16 | | | | | 2,632,308 | |
| | 700 | | | 5.50%, 3/25/15 | | | | | 722,915 | |
| | | | JPMorgan Chase & Co., | | | | | | |
| | 25,000 | | | 0.779%, 4/25/18 (j) | | | | | 25,005,150 | |
| | 14,800 | | | 6.00%, 1/15/18 | | | | | 16,977,998 | |
| | | | Korea Development Bank, | | | | | | |
| | 7,500 | | | 3.875%, 5/4/17 | | | | | 7,985,693 | |
| | 3,950 | | | 4.00%, 9/9/16 | | | | | 4,206,414 | |
| | 900 | | | Korea Exchange Bank, 4.875%, 1/14/16 | | | | | 955,915 | |
| | €2,825 | | | LBG Capital No. 1 PLC, 7.375%, 3/12/20 | | | | | 4,261,609 | |
| | £2,331 | | | LBG Capital No. 2 PLC, | | | | | | |
| | | | | 9.00%, 12/15/19 | | | | | 4,138,345 | |
| | €2,180 | | | 15.00%, 12/21/19 | | | | | 4,625,865 | |
| | | | Lloyds Bank PLC (g), | | | | | | |
| | $3,604 | | | 7.50%, 6/27/24 | | | | | 3,775,190 | |
| | 29,300 | | | 12.00%, 12/16/24 (a)(b)(d)(i) | | | | | | |
| | | | | (acquisition cost-$29,319,500; purchased 12/15/09-6/18/10) | | | | | 41,752,500 | |
| | €10,000 | | | Morgan Stanley, | | | | | | |
| | | | | 0.702%, 1/16/17 (j) | | | | | 13,816,140 | |
| | $2,800 | | | 5.375%, 10/15/15 | | | | | 2,983,618 | |
| | 5,000 | | | 5.55%, 4/27/17 | | | | | 5,584,685 | |
| | 900 | | | 5.95%, 12/28/17 | | | | | 1,026,853 | |
| | 3,700 | | | 6.625%, 4/1/18 | | | | | 4,320,172 | |
| | 500 | | | QNB Finance Ltd., 3.125%, 11/16/15 | | | | | 516,500 | |
| | 1,700 | | | RBS Capital Trust I, 2.099%, 6/30/14 (g) | | | | | 1,666,000 | |
| | 5,000 | | | Royal Bank of Scotland Group PLC, 7.648%, 9/30/31 (g) | | | | | 5,525,000 | |
| | 1,500 | | | RSHB Capital S.A. for OJSC Russian Agricultural Bank, 9.00%, 6/11/14 (a)(d) | | | | | 1,509,000 | |
| | | | State Bank of India, | | | | | | |
| | 1,300 | | | 4.50%, 10/23/14 | | | | | 1,320,526 | |
| | 1,000 | | | 4.50%, 7/27/15 (a)(d) | | | | | 1,034,432 | |
| | 582 | | | UBS AG, 5.875%, 12/20/17 | | | | | 666,208 | |
| | 2,050 | | | Wachovia Corp., 5.75%, 2/1/18 | | | | | 2,355,233 | |
| | 19,217 | | | Wells Fargo & Co., 7.98%, 3/15/18 (g) | | | | | 21,907,380 | |
| | | | | | | | | | 496,653,867 | |
| | | | Biotechnology – 0.1% | | | | | | |
| | 1,700 | | | Amgen, Inc., 5.70%, 2/1/19 | | | | | 1,978,052 | |
| | | | Computers – 0.1% | | | | | | |
| | 1,800 | | | International Business Machines Corp., 8.375%, 11/1/19 | | | | | 2,357,701 | |
| | | | Diversified Financial Services – 8.8% | | | | | | |
| | 11,000 | | | American Express Co., 7.25%, 5/20/14 | | | | | 11,032,329 | |
| | €700 | | | Banque PSA Finance S.A., 3.875%, 1/14/15 | | | | | 987,454 | |
| | | | Bear Stearns Cos. LLC, | | | | | | |
| | $1,500 | | | 5.30%, 10/30/15 | | | | | 1,600,921 | |
| | 17,265 | | | 7.25%, 2/1/18 | | | | | 20,549,097 | |
| | | | Ford Motor Credit Co. LLC, | | | | | | |
| | 500 | | | 3.984%, 6/15/16 | | | | | 530,553 | |
| | 49,300 | | | 5.625%, 9/15/15 | | | | | 52,485,815 | |
| | | | |
| 18 | | Semi-Annual Report | | | April 30, 2014 |
Schedule of Investments
Fixed Income SHares: Series C
April 30, 2014 (unaudited) (continued)
| | | | | | | | | | |
Principal
Amount
(000s) | | | | | | | Value | |
| | | | Diversified Financial Services (continued) | | | | | | |
| | $20,750 | | | 8.00%, 6/1/14 | | | | | $20,863,461 | |
| | 7,900 | | | 8.00%, 12/15/16 | | | | | 9,226,679 | |
| | 22,700 | | | 8.125%, 1/15/20 | | | | | 28,898,303 | |
| | 3,400 | | | 8.70%, 10/1/14 | | | | | 3,515,243 | |
| | €8,700 | | | GMAC International Finance BV, 7.50%, 4/21/15 | | | | | 12,741,462 | |
| | $2,000 | | | HSBC Finance Corp., 0.666%, 6/1/16 (j) | | | | | 2,000,298 | |
| | | | International Lease Finance Corp. (a)(d), | | | | | | |
| | 4,000 | | | 6.75%, 9/1/16 | | | | | 4,470,000 | |
| | 3,000 | | | 7.125%, 9/1/18 | | | | | 3,491,250 | |
| | 442 | | | Preferred Term Securities XIII Ltd., 0.783%, 3/24/34 (a)(b)(d)(f)(i)(j) | | | | | | |
| | | | | (acquisition cost-$441,589; purchased 3/9/04) | | | | | 357,499 | |
| | | | SLM Corp., | | | | | | |
| | 400 | | | 5.375%, 5/15/14 | | | | | 400,585 | |
| | 1,400 | | | 5.50%, 1/15/19 | | | | | 1,487,224 | |
| | 36,000 | | | 6.25%, 1/25/16 | | | | | 38,970,000 | |
| | 17,700 | | | 7.25%, 1/25/22 | | | | | 19,558,500 | |
| | 1,100 | | | 8.00%, 3/25/20 | | | | | 1,274,625 | |
| | 24,455 | | | 8.45%, 6/15/18 | | | | | 28,918,037 | |
| | | | | | | | | | 263,359,335 | |
| | | | Electric Utilities – 2.7% | | | | | | |
| | 2,000 | | | Consumers Energy Co., 5.15%, 2/15/17 | | | | | 2,213,502 | |
| | 5,000 | | | DTE Energy Co., 6.35%, 6/1/16 | | | | | 5,548,380 | |
| | 14,200 | | | Electricite de France, 6.50%, 1/26/19 (a)(d) | | | | | 16,919,101 | |
| | 27,500 | | | Entergy Corp., 3.625%, 9/15/15 | | | | | 28,458,292 | |
| | | | Korea Hydro & Nuclear Power Co., Ltd., | | | | | | |
| | 300 | | | 3.125%, 9/16/15 (a)(d) | | | | | 308,705 | |
| | 4,550 | | | 6.25%, 6/17/14 | | | | | 4,583,365 | |
| | 1,000 | | | Majapahit Holding BV, 7.25%, 6/28/17 | | | | | 1,133,750 | |
| | | | Nevada Power Co., | | | | | | |
| | 100 | | | 5.875%, 1/15/15 | | | | | 103,700 | |
| | 1,600 | | | 5.95%, 3/15/16 | | | | | 1,755,368 | |
| | 3,000 | | | 6.50%, 5/15/18 | | | | | 3,534,057 | |
| | 900 | | | Nisource Finance Corp., 6.40%, 3/15/18 | | | | | 1,037,755 | |
| | 6,100 | | | NRG Energy, Inc., 7.625%, 1/15/18 | | | | | 6,938,750 | |
| | 2,900 | | | Public Service Co. of Oklahoma, 6.15%, 8/1/16 | | | | | 3,194,423 | |
| | 1,900 | | | Sierra Pacific Power Co., 6.00%, 5/15/16 | | | | | 2,099,169 | |
| | | | Teco Finance, Inc., | | | | | | |
| | 983 | | | 6.572%, 11/1/17 | | | | | 1,136,296 | |
| | 2,000 | | | 6.75%, 5/1/15 | | | | | 2,120,698 | |
| | 41 | | | W3A Funding Corp., 8.09%, 1/2/17 | | | | | 40,635 | |
| | | | | | | | | | 81,125,946 | |
| | | | Food & Beverage – 0.2% | | | | | | |
| | 3,500 | | | Anheuser-Busch Cos. LLC, 6.50%, 2/1/43 | | | | | 4,639,765 | |
| | 1,100 | | | Tate & Lyle International Finance PLC, 6.625%, 6/15/16 (a)(d) | | | | | 1,224,414 | |
| | | | | | | | | | 5,864,179 | |
| | | | Healthcare-Products – 0.1% | | | | | | |
| | 1,700 | | | Hospira, Inc., 6.05%, 3/30/17 | | | | | 1,879,061 | |
| | | | | | |
| April 30, 2014 | | | Semi-Annual Report | | | 19 | |
Schedule of Investments
Fixed Income SHares: Series C
April 30, 2014 (unaudited) (continued)
| | | | | | | | | | |
Principal
Amount
(000s) | | | | | | | Value | |
| | | | Healthcare-Services – 0.1% | | | | | | |
| | $3,200 | | | HCA, Inc., 7.25%, 9/15/20 | | | | | $3,460,000 | |
| | | | Holding Companies-Diversified – 0.0% | | | | | | |
| | | | Hutchison Whampoa International Ltd., | | | | | | |
| | 100 | | | 5.75%, 9/11/19 | | | | | 114,664 | |
| | 1,000 | | | 7.625%, 4/9/19 | | | | | 1,223,876 | |
| | | | | | | | | | 1,338,540 | |
| | | | Insurance – 2.6% | | | | | | |
| | | | American International Group, Inc., | | | | | | |
| | 3,000 | | | 4.875%, 6/1/22 | | | | | 3,341,787 | |
| | 4,600 | | | 5.05%, 10/1/15 | | | | | 4,879,399 | |
| | 2,000 | | | 5.45%, 5/18/17 | | | | | 2,238,764 | |
| | 900 | | | 5.60%, 10/18/16 | | | | | 996,919 | |
| | 30,600 | | | 5.85%, 1/16/18 | | | | | 34,954,961 | |
| | £1,456 | | | 6.765%, 11/15/17 | | | | | 2,823,098 | |
| | $21,450 | | | 8.25%, 8/15/18 | | | | | 26,845,126 | |
| | | | | | | | | | 76,080,054 | |
| | | | Investment Companies – 0.1% | | | | | | |
| | 3,000 | | | Temasek Financial I Ltd., 2.375%, 1/23/23 (a)(d) | | | | | 2,791,530 | |
| | | | Iron/Steel – 0.6% | | | | | | |
| | 100 | | | CSN Islands XI Corp., 6.875%, 9/21/19 (a)(d) | | | | | 105,750 | |
| | 3,750 | | | Gerdau Holdings, Inc., 7.00%, 1/20/20 | | | | | 4,242,188 | |
| | 800 | | | Gerdau Trade, Inc., 5.75%, 1/30/21 (a)(d) | | | | | 846,000 | |
| | 8,944 | | | GTL Trade Finance, Inc., 5.893%, 4/29/24 (a)(b)(d)(i) | | | | | | |
| | | | | (acquisition cost-$8,423,473; purchased 4/18/11-11/22/11) | | | | | 9,234,680 | |
| | | | Vale Overseas Ltd., | | | | | | |
| | 2,590 | | | 4.375%, 1/11/22 | | | | | 2,636,876 | |
| | 1,000 | | | 8.25%, 1/17/34 | | | | | 1,247,817 | |
| | | | | | | | | | 18,313,311 | |
| | | | Machinery-Construction & Mining – 0.2% | | | | | | |
| | 5,700 | | | Caterpillar Financial Services Corp., 7.15%, 2/15/19 | | | | | 7,022,548 | |
| | | | Media – 2.1% | | | | | | |
| | | | Comcast Corp., | | | | | | |
| | 10,600 | | | 5.875%, 2/15/18 | | | | | 12,170,856 | |
| | 1,700 | | | 5.90%, 3/15/16 | | | | | 1,862,177 | |
| | 700 | | | 6.30%, 11/15/17 | | | | | 816,117 | |
| | | | CSC Holdings LLC, | | | | | | |
| | 7,850 | | | 7.625%, 7/15/18 | | | | | 9,106,000 | |
| | 810 | | | 7.875%, 2/15/18 | | | | | 941,625 | |
| | 7,500 | | | 8.625%, 2/15/19 | | | | | 8,981,250 | |
| | | | DISH DBS Corp., | | | | | | |
| | 14,842 | | | 5.00%, 3/15/23 | | | | | 15,175,945 | |
| | 300 | | | 5.875%, 7/15/22 | | | | | 324,375 | |
| | 4,200 | | | 7.125%, 2/1/16 | | | | | 4,599,000 | |
| | 6,940 | | | Time Warner Cable, Inc., 5.85%, 5/1/17 | | | | | 7,867,448 | |
| | | | | | | | | | 61,844,793 | |
| | | | Mining – 0.8% | | | | | | |
| | 12,800 | | | Anglo American Capital PLC, 4.125%, 9/27/22 (a)(d) | | | | | 12,542,016 | |
| | | | |
| 20 | | Semi-Annual Report | | | April 30, 2014 |
Schedule of Investments
Fixed Income SHares: Series C
April 30, 2014 (unaudited) (continued)
| | | | | | | | | | |
Principal
Amount
(000s) | | | | | | | Value | |
| | | | Mining (continued) | | | | | | |
| | $5,000 | | | Gold Fields Orogen Holding BVI Ltd., 4.875%, 10/7/20 (a)(d) | | | | | $4,525,000 | |
| | 7,400 | | | Xstrata Finance Canada Ltd., 5.80%, 11/15/16 (a)(d) | | | | | 8,149,598 | |
| | | | | | | | | | 25,216,614 | |
| | | | Miscellaneous Manufacturing – 2.0% | | | | | | |
| | 36,750 | | | General Electric Co., 5.25%, 12/6/17 | | | | | 41,600,633 | |
| | 15,000 | | | Tyco Electronics Group S.A., 6.55%, 10/1/17 | | | | | 17,389,005 | |
| | | | | | | | | | 58,989,638 | |
| | | | Oil & Gas – 4.9% | | | | | | |
| | 300 | | | Anadarko Petroleum Corp., 5.95%, 9/15/16 | | | | | 334,567 | |
| | 1,100 | | | BP Capital Markets PLC, 3.625%, 5/8/14 | | | | | 1,100,308 | |
| | 2,400 | | | Canadian Natural Resources Ltd., 6.00%, 8/15/16 | | | | | 2,670,727 | |
| | 10,400 | | | Canadian Oil Sands Ltd., 7.75%, 5/15/19 (a)(d) | | | | | 12,747,082 | |
| | 1,330 | | | Ecopetrol S.A., 7.625%, 7/23/19 | | | | | 1,605,975 | |
| | 2,000 | | | Encana Corp., 5.90%, 12/1/17 | | | | | 2,293,020 | |
| | | | Gaz Capital S.A. for Gazprom, | | | | | | |
| | 6,500 | | | 6.212%, 11/22/16 | | | | | 6,768,125 | |
| | 1,300 | | | 6.51%, 3/7/22 | | | | | 1,293,500 | |
| | 14,000 | | | 8.146%, 4/11/18 (a)(d) | | | | | 15,505,000 | |
| | 23,650 | | | 9.25%, 4/23/19 | | | | | 27,256,625 | |
| | 1,800 | | | Halliburton Co., 6.15%, 9/15/19 | | | | | 2,142,700 | |
| | 1,000 | | | Novatek Finance Ltd., 5.326%, 2/3/16 (a)(d) | | | | | 1,000,000 | |
| | 500 | | | Pemex Project Funding Master Trust, 5.75%, 12/15/15 | | | | | 530,625 | |
| | | | Petrobras International Finance Co.-Pifco, | | | | | | |
| | 300 | | | 5.875%, 3/1/18 | | | | | 325,608 | |
| | 17,500 | | | 7.875%, 3/15/19 | | | | | 20,375,863 | |
| | 12,300 | | | Petroleos de Venezuela S.A., 5.50%, 4/12/37 | | | | | 6,900,300 | |
| | | | Petroleos Mexicanos, | | | | | | |
| | 18,700 | | | 5.50%, 1/21/21 | | | | | 20,570,000 | |
| | 7,500 | | | 8.00%, 5/3/19 | | | | | 9,196,875 | |
| | 2,328 | | | Ras Laffan Liquefied Natural Gas Co., Ltd. II, 5.298%, 9/30/20 | | | | | 2,526,097 | |
| | | | Ras Laffan Liquefied Natural Gas Co., Ltd. III, | | | | | | |
| | 1,400 | | | 5.50%, 9/30/14 | | | | | 1,429,120 | |
| | 1,120 | | | 5.832%, 9/30/16 (b) | | | | | 1,192,800 | |
| | 3,000 | | | 6.75%, 9/30/19 | | | | | 3,570,000 | |
| | 1,800 | | | Reliance Holdings USA, Inc., 4.50%, 10/19/20 (b) | | | | | 1,833,394 | |
| | 3,900 | | | Tullow Oil PLC, 6.00%, 11/1/20 (a)(d) | | | | | 3,997,500 | |
| | | | | | | | | | 147,165,811 | |
| | | | Paper & Forest Products – 0.4% | | | | | | |
| | 9,300 | | | Georgia-Pacific LLC, 5.40%, 11/1/20 (a)(d) | | | | | 10,601,926 | |
| | | | Pharmaceuticals – 0.1% | | | | | | |
| | 3,400 | | | GlaxoSmithKline Capital, Inc., 5.65%, 5/15/18 | | | | | 3,916,528 | |
| | | | Pipelines – 2.7% | | | | | | |
| | 7,200 | | | AK Transneft OJSC Via TransCapitalInvest Ltd., 8.70%, 8/7/18 | | | | | 8,316,000 | |
| | 2,900 | | | DCP Midstream LLC, 5.375%, 10/15/15 (a)(b)(d)(i) | | | | | | |
| | | | | (acquisition cost-$2,875,669; purchased 10/6/05) | | | | | 3,049,721 | |
| | | | El Paso LLC, | | | | | | |
| | 1,789 | | | 7.00%, 6/15/17 | | | | | 2,025,751 | |
| | 13,900 | | | 7.25%, 6/1/18 | | | | | 15,912,150 | |
| | | | | | |
| April 30, 2014 | | | Semi-Annual Report | | | 21 | |
Schedule of Investments
Fixed Income SHares: Series C
April 30, 2014 (unaudited) (continued)
| | | | | | | | | | |
Principal
Amount
(000s) | | | | | | | Value | |
| | | | Pipelines (continued) | | | | | | |
| | $4,800 | | | Enbridge Energy Partners L.P., 5.875%, 12/15/16 | | | | | $5,346,235 | |
| | 2,100 | | | Energy Transfer Partners L.P., 6.125%, 2/15/17 | | | | | 2,346,853 | |
| | 699 | | | Kern River Funding Corp., 4.893%, 4/30/18 (a)(b)(d)(i) | | | | | | |
| | | | | (acquisition cost-$699,125; purchased 4/28/03) | | | | | 751,743 | |
| | 5,800 | | | Kinder Morgan Energy Partners L.P., 6.00%, 2/1/17 | | | | | 6,487,921 | |
| | 9,200 | | | Kinder Morgan Finance Co. LLC, 5.70%, 1/5/16 | | | | | 9,822,187 | |
| | 11,900 | | | Midcontinent Express Pipeline LLC, 5.45%, 9/15/14 (a)(b)(d)(i) | | | | | | |
| | | | | (acquisition cost-$11,879,413; purchased 9/9/09) | | | | | 12,029,627 | |
| | 3,400 | | | NGPL PipeCo LLC, 7.119%, 12/15/17 (a)(d) | | | | | 3,383,000 | |
| | 1,700 | | | Northwest Pipeline LLC, 7.00%, 6/15/16 | | | | | 1,907,211 | |
| | 100 | | | Rockies Express Pipeline LLC, 5.625%, 4/15/20 (a)(d) | | | | | 100,750 | |
| | 4,400 | | | Southern Natural Gas Co. LLC, 5.90%, 4/1/17 (a)(b)(d)(i) | | | | | | |
| | | | | (acquisition cost-$4,392,696; purchased 3/14/07) | | | | | 4,969,879 | |
| | 1,950 | | | Tennessee Gas Pipeline Co. LLC, 7.50%, 4/1/17 | | | | | 2,287,888 | |
| | 1,100 | | | TransCanada PipeLines Ltd., 3.80%, 10/1/20 | | | | | 1,167,462 | |
| | | | | | | | | | 79,904,378 | |
| | | | Real Estate – 0.1% | | | | | | |
| | 1,500 | | | Qatari Diar Finance Co., 5.00%, 7/21/20 | | | | | 1,680,000 | |
| | | | Real Estate Investment Trust – 0.2% | | | | | | |
| | 5,000 | | | Weyerhaeuser Co., 7.375%, 10/1/19 | | | | | 6,095,350 | |
| | | | Software – 0.1% | | | | | | |
| | 1,800 | | | Oracle Corp., 5.00%, 7/8/19 | | | | | 2,048,130 | |
| | | | Telecommunications – 4.7% | | | | | | |
| | | | America Movil S.A.B. de C.V., | | | | | | |
| | 42,800 | | | 5.00%, 3/30/20 | | | | | 47,773,660 | |
| | 5,530 | | | 6.125%, 3/30/40 | | | | | 6,377,699 | |
| | | | AT&T, Inc., | | | | | | |
| | 5,000 | | | 5.50%, 2/1/18 | | | | | 5,673,860 | |
| | 1,100 | | | 5.80%, 2/15/19 | | | | | 1,277,597 | |
| | 1,000 | | | Axiata SPV1 Labuan Ltd., 5.375%, 4/28/20 | | | | | 1,097,739 | |
| | 3,400 | | | Deutsche Telekom International Finance BV, 6.75%, 8/20/18 | | | | | 4,039,469 | |
| | | | Qtel International Finance Ltd., | | | | | | |
| | 3,000 | | | 3.375%, 10/14/16 (a)(d) | | | | | 3,146,250 | |
| | 4,500 | | | 5.00%, 10/19/25 | | | | | 4,707,900 | |
| | 7,300 | | | 5.00%, 10/19/25 (a)(d) | | | | | 7,637,260 | |
| | 1,250 | | | Qwest Corp., 6.50%, 6/1/17 | | | | | 1,414,440 | |
| | | | Verizon Communications, Inc., | | | | | | |
| | 32,900 | | | 3.65%, 9/14/18 | | | | | 35,155,920 | |
| | 19,700 | | | 4.50%, 9/15/20 | | | | | 21,495,714 | |
| | 715 | | | 8.75%, 11/1/18 | | | | | 914,173 | |
| | | | | | | | | | 140,711,681 | |
| | | | Tobacco – 0.3% | | | | | | |
| | 1,105 | | | Altria Group, Inc., 9.25%, 8/6/19 | | | | | 1,466,807 | |
| | 1,400 | | | Philip Morris International, Inc., 5.65%, 5/16/18 | | | | | 1,608,704 | |
| | 6,030 | | | Reynolds American, Inc., 7.75%, 6/1/18 | | | | | 7,266,771 | |
| | | | | | | | | | 10,342,282 | |
| | | | |
| 22 | | Semi-Annual Report | | | April 30, 2014 |
Schedule of Investments
Fixed Income SHares: Series C
April 30, 2014 (unaudited) (continued)
| | | | | | | | | | |
Principal
Amount
(000s) | | | | | | | Value | |
| | | | Transportation – 0.1% | | | | | | |
| | $1,800 | | | Canadian National Railway Co., 5.55%, 3/1/19 | | | | | $2,082,528 | |
| | Total Corporate Bonds & Notes (cost-$1,441,605,416) | | | | | 1,565,328,306 | |
| | Sovereign Debt Obligations – 18.4% | | | | | | |
| | | | Australia – 0.2% | | | | | | |
| | AUD 5,400 | | | Queensland Treasury Corp., 6.00%, 9/14/17, Ser. 17 | | | | | 5,469,284 | |
| | | | Brazil – 1.1% | | | | | | |
| | BRL 74,460 | | | Brazil Notas do Tesouro Nacional, 10.00%, 1/1/21, Ser. F | | | | | 29,977,649 | |
| | $3,300 | | | Brazilian Development Bank, 6.369%, 6/16/18 | | | | | 3,671,250 | |
| | | | | | | | | | 33,648,899 | |
| | | | Canada – 0.4% | | | | | | |
| | CAD 2,400 | | | Province of Ontario Canada, 6.50%, 3/8/29 | | | | | 2,912,224 | |
| | $7,800 | | | Province of Quebec Canada, 3.50%, 7/29/20 | | | | | 8,271,120 | |
| | | | | | | | | | 11,183,344 | |
| | | | Colombia – 0.1% | | | | | | |
| | 2,000 | | | Colombia Government International Bond, 7.375%, 1/27/17 | | | | | 2,307,500 | |
| | | | Indonesia – 0.1% | | | | | | |
| | 3,100 | | | Indonesia Government International Bond, 6.875%, 1/17/18 | | | | | 3,541,750 | |
| | | | Italy – 8.0% | | | | | | |
| | €155,300 | | | Italy Buoni Poliennali Del Tesoro, 4.75%, 6/1/17 | | | | | 238,274,440 | |
| | | | Korea (Republic of) – 0.4% | | | | | | |
| | | | Export-Import Bank of Korea, | | | | | | |
| | $10,900 | | | 4.00%, 1/29/21 | | | | | 11,496,623 | |
| | 250 | | | 5.125%, 6/29/20 | | | | | 280,517 | |
| | | | | | | | | | 11,777,140 | |
| | | | Qatar – 0.3% | | | | | | |
| | | | Qatar Government International Bond (a)(d), | | | | | | |
| | 3,500 | | | 4.00%, 1/20/15 | | | | | 3,589,950 | |
| | 6,400 | | | 5.25%, 1/20/20 | | | | | 7,304,320 | |
| | | | | | | | | | 10,894,270 | |
| | | | Russia – 0.1% | | | | | | |
| | 1,370 | | | Russian Federation Bond, 7.50%, 3/31/30 | | | | | 1,530,290 | |
| | | | South Africa – 0.0% | | | | | | |
| | 300 | | | South Africa Government International Bond, 6.875%, 5/27/19 | | | | | 348,750 | |
| | | | Spain – 7.7% | | | | | | |
| | €161,500 | | | Spain Government Bond, 2.10%, 4/30/17 | | | | | 230,825,674 | |
| | Total Sovereign Debt Obligations (cost-$542,643,357) | | | | | 549,801,341 | |
| | Municipal Bonds – 9.9% | | | | | | |
| | | | Arizona – 0.1% | | | | | | |
| | $2,000 | | | Univ. of Arizona Rev., 6.423%, 8/1/35, Ser. A | | | | | 2,217,920 | |
| | | | California – 5.0% | | | | | | |
| | 600 | | | Bay Area Toll Auth. Rev., 6.263%, 4/1/49, Ser. F-2 | | | | | 791,082 | |
| | 15,000 | | | Infrastructure & Economic Dev. Bank Rev., 6.486%, 5/15/49 | | | | | 18,460,350 | |
| | | | Los Angeles Cnty. Public Works Financing Auth. Rev., | | | | | | |
| | 6,900 | | | 7.488%, 8/1/33 | | | | | 8,598,573 | |
| | 12,300 | | | 7.618%, 8/1/40 | | | | | 16,042,521 | |
| | 14,000 | | | Los Angeles Community College Dist., GO, 6.75%, 8/1/49 | | | | | 19,549,040 | |
| | | | | | |
| April 30, 2014 | | | Semi-Annual Report | | | 23 | |
Schedule of Investments
Fixed Income SHares: Series C
April 30, 2014 (unaudited) (continued)
| | | | | | | | | | |
Principal
Amount
(000s) | | | | | | | Value | |
| | | | California (continued) | | | | | | |
| | $3,000 | | | Los Angeles Department of Water & Power Rev., 5.516%, 7/1/27, Ser. C | | | | | $3,510,240 | |
| | 300 | | | Palomar Community College Dist., GO, 7.194%, 8/1/45, Ser. B-1 | | | | | 337,266 | |
| | 1,000 | | | San Diego Cnty. Water Auth. Rev., 6.138%, 5/1/49 | | | | | 1,288,730 | |
| | | | State, GO, | | | | | | |
| | 800 | | | 4.85%, 10/1/14 | | | | | 814,968 | |
| | 400 | | | 6.20%, 10/1/19 | | | | | 480,548 | |
| | 1,500 | | | 6.65%, 3/1/22 | | | | | 1,820,805 | |
| | 3,150 | | | 7.55%, 4/1/39 | | | | | 4,465,251 | |
| | 18,100 | | | 7.60%, 11/1/40 | | | | | 26,041,194 | |
| | 12,000 | | | 7.70%, 11/1/30 | | | | | 14,523,120 | |
| | 27,250 | | | 7.95%, 3/1/36 | | | | | 32,804,912 | |
| | | | | | | | | | 149,528,600 | |
| | | | Illinois – 0.4% | | | | | | |
| | 10,100 | | | Chicago Transit Auth. Rev., 6.20%, 12/1/40, Ser. B | | | | | 11,399,264 | |
| | | | Massachusetts – 0.7% | | | | | | |
| | 17,000 | | | School Building Auth. Rev., 5.468%, 6/15/27 | | | | | 19,468,230 | |
| | | | New York – 2.2% | | | | | | |
| | 5,500 | | | Metropolitan Transportation Auth. Rev., 5.871%, 11/15/39 | | | | | 6,479,055 | |
| | 3,000 | | | New York City, GO, 4.769%, 10/1/23, Ser. A-2 | | | | | 3,307,320 | |
| | 3,640 | | | New York City Municipal Water & Sewer System Finance Auth. Rev., 5.79%, 6/15/41 | | | | | 3,904,337 | |
| | | | New York City Transitional Finance Auth. Rev., | | | | | | |
| | 400 | | | 4.325%, 11/1/21 | | | | | 433,916 | |
| | 800 | | | 4.525%, 11/1/22 | | | | | 874,080 | |
| | 3,000 | | | 5.267%, 5/1/27, Ser. G-3 | | | | | 3,466,560 | |
| | 700 | | | 5.572%, 11/1/38 | | | | | 829,556 | |
| | 200 | | | 5.932%, 11/1/36 | | | | | 217,720 | |
| | 9,200 | | | Port Auth. of New York & New Jersey Rev., 4.458%, 10/1/62, Ser. 174 | | | | | 8,870,272 | |
| | | | State Dormitory Auth. Rev., | | | | | | |
| | 4,500 | | | 5.00%, 3/15/27, Ser. A | | | | | 5,129,010 | |
| | 1,600 | | | 5.289%, 3/15/33, Ser. H | | | | | 1,827,568 | |
| | 2,700 | | | 5.389%, 3/15/40, Ser. H | | | | | 3,157,272 | |
| | 19,850 | | | 5.50%, 3/15/30 | | | | | 23,066,891 | |
| | 4,000 | | | State Urban Dev. Corp. Rev., 5.77%, 3/15/39 | | | | | 4,731,880 | |
| | | | | | | | | | 66,295,437 | |
| | | | Ohio – 0.3% | | | | | | |
| | | | American Municipal Power, Inc. Rev., | | | | | | |
| | 3,600 | | | 5.939%, 2/15/47 | | | | | 4,077,612 | |
| | 4,200 | | | Comb Hydroelectric Projects, 7.834%, 2/15/41, Ser. B | | | | | 5,812,758 | |
| | | | | | | | | | 9,890,370 | |
| | | | Texas – 1.2% | | | | | | |
| | | | Conroe Independent School Dist., GO, Ser. A, | | | | | | |
| | 3,115 | | | 5.00%, 2/15/27 (GTD-PSF) | | | | | 3,663,458 | |
| | 4,520 | | | 5.00%, 2/15/29 (GTD-PSF) | | | | | 5,220,329 | |
| | 4,400 | | | Dallas Cnty. Hospital Dist., GO, 5.621%, 8/15/44, Ser. C | | | | | 5,190,636 | |
| | 18,960 | | | Municipal Gas Acquisition & Supply Corp III Rev., 5.00%, 12/15/25 | | | | | 20,486,659 | |
| | | | | | | | | | 34,561,082 | |
| | Total Municipal Bonds (cost-$259,897,753) | | | | | 293,360,903 | |
| | | | |
| 24 | | Semi-Annual Report | | | April 30, 2014 |
Schedule of Investments
Fixed Income SHares: Series C
April 30, 2014 (unaudited) (continued)
| | | | | | | | | | |
Principal
Amount
(000s) | | | | | | | Value | |
| | Mortgage-Backed Securities – 3.2% | | | | | | |
| | $4,324 | | | Banc of America Commercial Mortgage Trust, 5.889%, 7/10/44, CMO (j) | | | | | $4,691,322 | |
| | 133 | | | Banc of America Funding Trust, 2.807%, 1/20/47, CMO (j) | | | | | 104,275 | |
| | 823 | | | BCAP LLC Trust, 0.324%, 9/26/35, CMO (a)(d)(j) | | | | | 812,317 | |
| | | | Bear Stearns Adjustable Rate Mortgage Trust, CMO (j), | | | | | | |
| | 79 | | | 2.517%, 10/25/33 | | | | | 80,358 | |
| | 190 | | | 2.533%, 3/25/35 | | | | | 193,531 | |
| | 61 | | | 2.68%, 5/25/34 | | | | | 56,853 | |
| | 1,086 | | | Bear Stearns ALT-A Trust, 2.46%, 2/25/36, CMO (j) | | | | | 745,678 | |
| | | | Bear Stearns Commercial Mortgage Securities Trust, CMO, | | | | | | |
| | 1,600 | | | 5.54%, 9/11/41 | | | | | 1,733,294 | |
| | 7,500 | | | 5.694%, 6/11/50 (j) | | | | | 8,387,246 | |
| | | | Citigroup Mortgage Loan Trust, Inc., CMO (j), | | | | | | |
| | 403 | | | 2.20%, 9/25/35 | | | | | 403,491 | |
| | 356 | | | 2.29%, 9/25/35 | | | | | 354,099 | |
| | | | Citigroup/Deutsche Bank Commercial Mortgage Trust, CMO, | | | | | | |
| | 8,000 | | | 5.302%, 1/15/46 (j) | | | | | 8,503,104 | |
| | 4,400 | | | 5.322%, 12/11/49 | | | | | 4,815,496 | |
| | €173 | | | Cordusio RMBS SRL, 0.453%, 6/30/35, CMO (j) | | | | | 235,572 | |
| | | | Countrywide Alternative Loan Trust, CMO (j), | | | | | | |
| | $1,729 | | | 0.344%, 11/25/46 | | | | | 1,351,088 | |
| | 523 | | | 0.354%, 5/25/36 | | | | | 423,383 | |
| | | | Countrywide Home Loan Mortgage Pass-Through Trust, CMO (j), | | | | | | |
| | 249 | | | 0.474%, 3/25/35 | | | | | 188,546 | |
| | 51 | | | 2.854%, 8/25/34 | | | | | 45,362 | |
| | 2,600 | | | Credit Suisse Commercial Mortgage Trust, 5.311%, 12/15/39, CMO | | | | | 2,818,969 | |
| | 15 | | | Credit Suisse First Boston Mortgage Securities Corp., 2.312%, 7/25/33, CMO (j) | | | | | 14,706 | |
| | 5,784 | | | Credit Suisse Mortgage Capital Certificates Mortgage-Backed Trust,
5.678%, 6/15/39, CMO (j) | | | | | 6,304,441 | |
| | | | Downey Savings & Loan Assoc. Mortgage Loan Trust, CMO (j), | | | | | | |
| | 1,796 | | | 0.416%, 8/19/45 | | | | | 1,576,330 | |
| | 1,057 | | | 2.63%, 7/19/44 | | | | | 1,070,213 | |
| | 2,991 | | | Greenpoint Mortgage Funding Trust, 0.384%, 6/25/45, CMO (j) | | | | | 2,581,747 | |
| | 10 | | | Greenpoint Mortgage Pass-Through Certificates, 2.795%, 10/25/33, CMO (j) | | | | | 10,363 | |
| | | | GSR Mortgage Loan Trust, CMO (j), | | | | | | |
| | 62 | | | 1.86%, 3/25/33 | | | | | 61,701 | |
| | 1,402 | | | 2.65%, 9/25/35 | | | | | 1,426,639 | |
| | 601 | | | 2.651%, 9/25/35 | | | | | 609,361 | |
| | | | Harborview Mortgage Loan Trust, CMO (j), | | | | | | |
| | 250 | | | 0.346%, 1/19/38 | | | | | 211,310 | |
| | 425 | | | 0.497%, 6/20/35 | | | | | 404,028 | |
| | 146 | | | 2.492%, 5/19/33 | | | | | 148,119 | |
| | | | HomeBanc Mortgage Trust, CMO (j), | | | | | | |
| | 2,511 | | | 0.414%, 1/25/36 | | | | | 2,128,552 | |
| | 295 | | | 5.48%, 4/25/37 | | | | | 240,459 | |
| | | | JPMorgan Chase Commercial Mortgage Securities Trust, CMO, | | | | | | |
| | 1,000 | | | 5.336%, 5/15/47 | | | | | 1,091,437 | |
| | 6,600 | | | 5.42%, 1/15/49 | | | | | 7,241,629 | |
| | 2,200 | | | 5.44%, 6/12/47 | | | | | 2,407,907 | |
| | | | | | |
| April 30, 2014 | | | Semi-Annual Report | | | 25 | |
Schedule of Investments
Fixed Income SHares: Series C
April 30, 2014 (unaudited) (continued)
| | | | | | | | | | |
Principal
Amount
(000s) | | | | | | | Value | |
| | | | JPMorgan Mortgage Trust, CMO (j), | | | | | | |
| | $81 | | | 1.99%, 11/25/33 | | | | | $81,592 | |
| | 1,085 | | | 2.663%, 7/25/35 | | | | | 1,104,783 | |
| | 71 | | | 3.319%, 2/25/35 | | | | | 70,622 | |
| | 813 | | | 5.219%, 7/25/35 | | | | | 836,248 | |
| | | | Merrill Lynch/Countrywide Commercial Mortgage Trust, CMO, | | | | | | |
| | 1,200 | | | 5.172%, 12/12/49 | | | | | 1,298,271 | |
| | 1,600 | | | 5.894%, 8/12/49 (j) | | | | | 1,787,141 | |
| | | | Morgan Stanley Re-Remic Trust, CMO (a)(d)(j), | | | | | | |
| | 2,976 | | | 5.819%, 8/12/45 | | | | | 3,299,227 | |
| | 1,313 | | | 5.819%, 8/15/45 | | | | | 1,455,542 | |
| | 181 | | | Ocwen Residential MBS Corp., 7.00%, 10/25/40, CMO (a)(d)(f)(j) | | | | | 359 | |
| | | | RBSSP Resecuritization Trust, CMO (a)(d)(j), | | | | | | |
| | 655 | | | 0.434%, 5/26/37 | | | | | 643,226 | |
| | 5,091 | | | 0.654%, 9/26/34 | | | | | 4,724,715 | |
| | 4,150 | | | 0.654%, 3/26/36 | | | | | 4,041,097 | |
| | 4,267 | | | 0.654%, 4/26/37 | | | | | 3,981,543 | |
| | 1,332 | | | Residential Accredit Loans, Inc., 0.364%, 4/25/46, CMO (j) | | | | | 659,013 | |
| | 117 | | | Structured Adjustable Rate Mortgage Loan Trust, 2.445%, 2/25/34, CMO (j) | | | | | 119,541 | |
| | 657 | | | Structured Asset Securities Corp. Mortgage Pass-Through Certificates,
5.25%, 9/25/34, CMO | | | | | 700,027 | |
| | | | Wachovia Bank Commercial Mortgage Trust, CMO, | | | | | | |
| | 95 | | | 0.235%, 6/15/20 (a)(d)(j) | | | | | 93,903 | |
| | 700 | | | 5.416%, 1/15/45 (j) | | | | | 750,508 | |
| | 1,300 | | | 5.678%, 5/15/46 | | | | | 1,442,743 | |
| | | | WaMu Mortgage Pass-Through Certificates, CMO (j), | | | | | | |
| | 178 | | | 0.464%, 1/25/45 | | | | | 176,348 | |
| | 1,895 | | | 0.558%, 11/25/34 | | | | | 1,797,831 | |
| | 1,039 | | | 1.135%, 2/25/46 | | | | | 971,867 | |
| | 591 | | | Wells Fargo Mortgage-Backed Securities Trust, 2.615%, 3/25/36, CMO (j) | | | | | 541,139 | |
| | Total Mortgage-Backed Securities (cost-$77,771,589) | | | | | 94,050,212 | |
| | U.S. Government Agency Securities – 1.3% | | | | | | |
| | | | Fannie Mae, | | | | | | |
| | 2 | | | 2.018%, 8/25/18, CMO (j) | | | | | 1,672 | |
| | 800 | | | 2.112%, 5/1/35, MBS (j) | | | | | 843,754 | |
| | 2,460 | | | 2.25%, 11/1/35, MBS (j) | | | | | 2,634,322 | |
| | 3 | | | 3.075%, 2/1/18, MBS (j) | | | | | 2,796 | |
| | 2 | | | 4.095%, 4/1/17, MBS (j) | | | | | 1,933 | |
| | 3,631 | | | 4.50%, 3/1/29-11/1/41, MBS | | | | | 3,901,311 | |
| | | | Freddie Mac, MBS, | | | | | | |
| | — | * | | 1.95%, 6/1/30 (j) | | | | | 388 | |
| | 6 | | | 2.25%, 12/1/18 (j) | | | | | 5,902 | |
| | 252 | | | 6.50%, 1/1/38-10/1/38 | | | | | 284,977 | |
| | 9 | | | Ginnie Mae, 1.625%, 1/20/22, MBS (j) | | | | | 9,304 | |
| | | | Small Business Administration Participation Certificates, ABS, | | | | | | |
| | 2,019 | | | 4.77%, 4/1/24 | | | | | 2,150,759 | |
| | 16,341 | | | 5.32%, 1/1/27 | | | | | 17,888,006 | |
| | 10,786 | | | 5.70%, 8/1/26 | | | | | 11,978,909 | |
| | Total U.S. Government Agency Securities (cost-$36,538,317) | | | | | 39,704,033 | |
| | | | |
| 26 | | Semi-Annual Report | | | April 30, 2014 |
Schedule of Investments
Fixed Income SHares: Series C
April 30, 2014 (unaudited) (continued)
| | | | | | | | | | |
Principal
Amount
(000s) | | | | | | | Value | |
| | U.S. Treasury Obligations – 0.7% | | | | | | |
| | | | U.S. Treasury Notes, | | | | | | |
| | $8,900 | | | 0.25%, 2/28/15 | | | | | $8,911,997 | |
| | 12,030 | | | 1.50%, 2/28/19 | | | | | 11,952,467 | |
| | Total U.S. Treasury Obligations (cost-$20,955,328) | | | | | 20,864,464 | |
| | Asset-Backed Securities – 0.6% | | | | | | |
| | 100 | | | Ameriquest Mortgage Securities Trust, 0.544%, 3/25/36 (j) | | | | | 83,346 | |
| | | | Bear Stearns Asset-Backed Securities I Trust (j), | | | | | | |
| | 1,776 | | | 0.354%, 12/25/36 | | | | | 1,661,067 | |
| | 1,000 | | | 0.564%, 12/25/35 | | | | | 953,047 | |
| | 490 | | | 1.154%, 10/25/37 | | | | | 457,426 | |
| | 1,234 | | | BNC Mortgage Loan Trust, 0.254%, 5/25/37 (j) | | | | | 1,178,461 | |
| | | | Conseco Financial Corp., | | | | | | |
| | 207 | | | 6.22%, 3/1/30 | | | | | 221,412 | |
| | 3,439 | | | 6.53%, 2/1/31 (j) | | | | | 3,468,422 | |
| | 1,500 | | | First Franklin Mortgage Loan Trust, 0.644%, 9/25/35 (j) | | | | | 1,365,888 | |
| | 1,284 | | | First NLC Trust, 0.859%, 12/25/35 (j) | | | | | 1,213,470 | |
| | 873 | | | Home Equity Asset Trust, 1.354%, 10/25/33 (j) | | | | | 810,488 | |
| | 3 | | | Keystone Owner Trust, 9.00%, 1/25/29 (a)(b)(d)(f)(i) | | | | | | |
| | | | | (acquisition cost-$1,680; purchased 11/21/00) | | | | | 1,355 | |
| | 228 | | | Merrill Lynch Mortgage Investors Trust, 0.274%, 2/25/37 (j) | | | | | 103,521 | |
| | 500 | | | Morgan Stanley ABS Capital I, Inc. Trust, 0.584%, 9/25/35 (j) | | | | | 428,982 | |
| | 173 | | | Morgan Stanley Mortgage Loan Trust, 0.514%, 4/25/37 (j) | | | | | 97,430 | |
| | 1,000 | | | Nomura Home Equity Loan, Inc. Home Equity Loan Trust, 0.744%, 9/25/35 (j) | | | | | 795,289 | |
| | 163 | | | Popular ABS Mortgage Pass-Through Trust, 0.244%, 6/25/47 (j) | | | | | 156,055 | |
| | 214 | | | Residential Asset Mortgage Products, Inc., 1.804%, 11/25/34 (j) | | | | | 202,565 | |
| | 1,000 | | | Structured Asset Investment Loan Trust, 0.844%, 6/25/35 (j) | | | | | 930,481 | |
| | | | Structured Asset Securities Corp. Mortgage Loan Trust (j), | | | | | | |
| | 1,000 | | | 0.494%, 2/25/36 | | | | | 829,118 | |
| | 1,200 | | | 0.604%, 11/25/35 | | | | | 1,027,391 | |
| | | | Wells Fargo Home Equity Asset-Backed Securities Trust (j), | | | | | | |
| | 1,500 | | | 0.744%, 11/25/35 | | | | | 1,289,644 | |
| | 500 | | | 0.854%, 10/25/34 | | | | | 439,783 | |
| | Total Asset-Backed Securities (cost-$16,443,820) | | | | | 17,714,641 | |
| | Senior Loans – 0.1% | | | | | | |
| | | | Technology Hardware, Storage & Peripherals – 0.1% | | | | | | |
| | 3,689 | | | Dell International LLC, 4.50%, 4/29/20, Term B (a)(c) (cost-$3,649,935) | | | | | 3,679,964 | |
| | Short-Term Investments – 12.6% | | | | | | |
| | | | U.S. Government Agency Securities (k) – 9.6% | | | | | | |
| | 72,862 | | | Fannie Mae Discount Notes, 0.061%, 9/22/14 | | | | | 72,850,342 | |
| | | | Federal Home Loan Bank Discount Notes, | | | | | | |
| | 41,595 | | | 0.058%, 7/30/14 | | | | | 41,591,880 | |
| | 69,500 | | | 0.061%, 7/9/14 | | | | | 69,495,969 | |
| | 66,147 | | | 0.079%, 10/29/14 | | | | | 66,134,586 | |
| | | | Freddie Mac Discount Notes, | | | | | | |
| | 18,300 | | | 0.101%, 10/24/14 | | | | | 18,296,413 | |
| | 19,000 | | | 0.112%, 11/19/14 | | | | | 18,994,661 | |
| | Total U.S. Government Agency Securities (cost-$287,327,806) | | | | | 287,363,851 | |
| | | | | | |
| April 30, 2014 | | | Semi-Annual Report | | | 27 | |
Schedule of Investments
Fixed Income SHares: Series C
April 30, 2014 (unaudited) (continued)
| | | | | | | | | | |
Principal
Amount
(000s) | | | | | | | Value | |
| | | | U.S. Treasury Obligations (h) – 1.8% | | | | | | |
| | $48,982 | | | U.S. Treasury Bills, 0.041%-0.078%, 5/8/14-10/30/14 (k) | | | | | $48,975,330 | |
| | 3,830 | | | U.S. Treasury Notes, 0.125%, 7/31/14 | | | | | 3,830,973 | |
| | Total U.S. Treasury Obligations (cost-$52,803,712) | | | | | 52,806,303 | |
| | | | Certificate of Deposit – 1.2% | | | | | | |
| | 35,400 | | | Intesa Sanpaolo Spa, 1.608%, 4/11/16 (j) (cost-$35,400,000) | | | | | 35,572,256 | |
| | | | Repurchase Agreements – 0.0% | | | | | | |
| | 1,437 | | | State Street Bank and Trust Co., | | | | | | |
| | | | dated 4/30/14, 0.00%, due 5/1/14, | | | | | | |
| | | | proceeds $1,437,000; collateralized by | | | | | | |
| | | | Fannie Mae, 2.20%, due 10/17/22, | | | | | | |
| | | | | valued at $1,469,651 including accrued interest (cost-$1,437,000) | | | | | 1,437,000 | |
| | Total Short-Term Investments (cost-$376,968,518) | | | | | 377,179,410 | |
| Total Investments, before options written and securities sold short
(cost-$2,776,474,033) – 99.3% | | | | | 2,961,683,274 | |
| | | |
Notional
Amount
(000s) | | | | | | | | |
| | Options Written (l) – (0.0)% | | | | | | |
| | | | Put Options – (0.0)% | | | | | | |
| | | | U.S. Dollar versus Japanese Yen, (OTC), | | | | | | |
| | $237,800 | | | strike price $99.00, expires 5/30/14 | | | | | (151,241 | ) |
| | $110,000 | | | strike price $99.00, expires 6/12/14 | | | | | (144,980 | ) |
| | Total Options Written (premiums received-$2,457,212) | | | | | (296,221 | ) |
| | | |
Principal
Amount
(000s) | | | | | | | | |
| | Securities Sold Short – (1.6)% | | | | |
| | | | U.S. Government Agency Securities – (1.6)% | | | | | | |
| | $45,200 | | | Fannie Mae, 4.50%, MBS, TBA, 30 Year (proceeds received-$48,108,281) | | | | | (48,517,548 | ) |
| Total Investments, net of options written and securities sold short
(cost-$2,725,908,540) – 97.7% | | | | | 2,912,869,505 | |
| | Other assets less other liabilities – 2.3% | | | | | 69,535,679 | |
| | Net Assets – 100.0% | | | | | $2,982,405,184 | |
Notes to Schedule of Investments:
| * | | Principal amount less than $500. | |
| (a) | | Private Placement–Restricted as to resale and may not have a readily available market. Securities with an aggregate value of $319,265,878, representing 10.7% of net assets. | |
| (c) | | These securities generally pay interest at rates which are periodically pre-determined by reference to a base lending rate plus a premium. These base lending rates are generally either the lending rate offered by one or more major European banks, such as the “LIBOR” or the prime rate offered by one or more major United States banks, or the certificate of deposit rate. These securities are generally considered to be restricted as the Portfolio is ordinarily contractually obligated to receive approval from the Agent bank and/or borrower prior to disposition. Remaining maturities of senior loans may be less than the stated maturities shown as a result of contractual or optional payments by the borrower. Such prepayments cannot be predicted with certainty. The interest rate disclosed reflects the rate in effect on April 30, 2014. | |
| | | | |
| 28 | | Semi-Annual Report | | | April 30, 2014 |
Schedule of Investments
Fixed Income SHares: Series C
April 30, 2014 (unaudited) (continued)
| (d) | | 144A–Exempt from registration under Rule 144A of the Securities Act of 1933. These securities may be resold in transactions exempt from registration, typically only to qualified institutional buyers. Unless otherwise indicated, these securities are not considered to be illiquid. | |
| (f) | | Fair-Valued–Securities with an aggregate value of $359,213, representing less than 0.05% of net assets. See Note 1(a) and Note 1(b) in the Notes to Financial Statements. | |
| (g) | | Perpetual maturity. The date shown, if any, is the next call date. For Corporate Bonds & Notes the interest rate is fixed until the first call date and variable thereafter. | |
| (h) | | All or partial amount segregated for the benefit of the counterparty as collateral for derivatives. | |
| (i) | | Restricted. The aggregate acquisition cost of such securities is $58,033,145. The aggregate value is $72,147,004, representing 2.4% of net assets. | |
| (j) | | Variable or Floating Rate Security–Securities with an interest rate that changes periodically. The interest rate disclosed reflects the rate in effect on April 30, 2014. | |
| (k) | | Rates reflect the effective yields at purchase date. | |
| (l) | | Non-income producing. | |
| (m) | | Futures contracts outstanding at April 30, 2014: | |
| | | | | | | | | | | | | | | | | | |
| Type | | Contracts | | | Market
Value
(000s) | | | Expiration
Date | | | Unrealized
Appreciation
(Depreciation) | |
| Long: | | 5-Year U.S. Treasury Note Futures | | | 1,826 | | | | $218,121 | | | | 6/30/14 | | | | $(857,526 | ) |
| | Financial Futures Euro-90 day | | | 5,258 | | | | 1,307,336 | | | | 6/15/15 | | | | 285,653 | |
| Short: | | 90-Day EURIBOR Futures | | | (690 | ) | | | (329 | ) | | | 12/15/14 | | | | 230,505 | |
| | | | | | | | | | | | | | | | | | |
| | | | | | | | | | | | | | | | | $(341,368 | ) |
| | | | | | | | | | | | | | | | | | |
| (n) | | Transactions in options written for the six months ended April 30, 2014: | |
| | | | | | | | | | | | | | | | |
| | | Contracts | | | Notional
Amount
(000s) | | | Notional
Amount
(000s) | | | Premiums | |
| Options outstanding, October 31, 2013 | | | 268 | | | | $1,408,800 | | | | €912,000 | | | | $5,860,876 | |
| Options written | | | 563 | | | | 2,169,200 | | | | – | | | | 7,241,788 | |
| Options terminated in closing transactions | | | – | | | | (2,185,300 | ) | | | – | | | | (2,696,845 | ) |
| Options expired | | | (831 | ) | | | (1,044,900 | ) | | | (456,000 | ) | | | (7,079,938 | ) |
| Options exercised | | | – | | | | – | | | | (456,000 | ) | | | (868,669 | ) |
| | | | | | | | | | | | | | | | |
| Options outstanding, April 30, 2014 | | | – | | | | $347,800 | | | | €– | | | | $2,457,212 | |
| | | | | | | | | | | | | | | | |
| (o) | | Credit default swap agreements outstanding at April 30, 2014: | |
OTC sell protection swap agreements:
| | | | | | | | | | | | | | | | | | | | | | | | | | | | |
Swap Counterparty/
Referenced Debt Issuer | | Notional
Amount
(000s)(1) | | | Credit
Spread | | | Termination
Date | | | Payments
Received | | | Value(2) | | | Upfront
Premiums
Paid (Received) | | | Unrealized
Appreciation
(Depreciation) | |
| Bank of America: | | | | | | | | | | | | | | | | | | | | | | | | | | | | |
China Government International Bond | | | $2,000 | | | | 0.36 | % | | | 9/20/16 | | | | 1.00 | % | | | $33,101 | | | | $10,371 | | | | $22,730 | |
| Barclays Bank: | | | | | | | | | | | | | | | | | | | | | | | | | | | | |
Ally Financial, Inc. | | | 20,500 | | | | 1.60 | % | | | 3/20/20 | | | | 5.00 | % | | | 3,858,575 | | | | 3,478,114 | | | | 380,461 | |
China Government International Bond | | | 28,800 | | | | 0.21 | % | | | 9/20/15 | | | | 1.00 | % | | | 352,414 | | | | 271,505 | | | | 80,909 | |
China Government International Bond | | | 6,000 | | | | 0.36 | % | | | 9/20/16 | | | | 1.00 | % | | | 99,307 | | | | 31,114 | | | | 68,193 | |
Dow Jones CDX.EM-15 5-Year Index | | | 5,700 | | | | 2.93 | % | | | 6/20/16 | | | | 5.00 | % | | | 277,733 | | | | 769,500 | | | | (491,767 | ) |
| BNP Paribas: | | | | | | | | | | | | | | | | | | | | | | | | | | | | |
China Government International Bond | | | 17,500 | | | | 0.21 | % | | | 9/20/15 | | | | 1.00 | % | | | 214,141 | | | | 161,043 | | | | 53,098 | |
General Electric | | | 900 | | | | 0.26 | % | | | 9/20/15 | | | | 1.00 | % | | | 10,326 | | | | (45,701 | ) | | | 56,027 | |
Teck Resources Ltd. | | | 800 | | | | 1.49 | % | | | 3/20/19 | | | | 1.00 | % | | | (17,203 | ) | | | (23,419 | ) | | | 6,216 | |
| | | | | | |
| April 30, 2014 | | | Semi-Annual Report | | | 29 | |
Schedule of Investments
Fixed Income SHares: Series C
April 30, 2014 (unaudited) (continued)
| | | | | | | | | | | | | | | | | | | | | | | | | | | | |
Swap Counterparty/
Referenced Debt Issuer | | Notional
Amount
(000s)(1) | | | Credit
Spread | | | Termination
Date | | | Payments
Received | | | Value(2) | | | Upfront
Premiums
Paid (Received) | | | Unrealized
Appreciation (Depreciation) | |
| Citigroup: | | | | | | | | | | | | | | | | | | | | | | | | | | | | |
China Government International Bond | | | $ 6,300 | | | | 0.21 | % | | | 9/20/15 | | | | 1.00 | % | | | $ 77,091 | | | | $ 58,011 | | | | $ 19,080 | |
China Government International Bond | | | 4,000 | | | | 0.36 | % | | | 9/20/16 | | | | 1.00 | % | | | 66,205 | | | | 20,743 | | | | 45,462 | |
United Kingdom Gilt | | | 16,200 | | | | 0.04 | % | | | 6/20/15 | | | | 1.00 | % | | | 198,039 | | | | 132,275 | | | | 65,764 | |
United Kingdom Gilt | | | 33,500 | | | | 0.07 | % | | | 6/20/16 | | | | 1.00 | % | | | 709,457 | | | | 415,748 | | | | 293,709 | |
| Credit Suisse First Boston: | | | | | | | | | | | | | | | | | | | | | | | | | | | | |
China Government International Bond | | | 4,700 | | | | 0.14 | % | | | 3/20/15 | | | | 1.00 | % | | | 41,676 | | | | 51,098 | | | | (9,422 | ) |
China Government International Bond | | | 4,000 | | | | 0.36 | % | | | 9/20/16 | | | | 1.00 | % | | | 66,205 | | | | 19,751 | | | | 46,454 | |
United Kingdom Gilt | | | 13,000 | | | | 0.05 | % | | | 9/20/15 | | | | 1.00 | % | | | 188,268 | | | | 133,971 | | | | 54,297 | |
| Deutsche Bank: | | | | | | | | | | | | | | | | | | | | | | | | | | | | |
Ally Financial, Inc. | | | 10,000 | | | | 1.60 | % | | | 3/20/20 | | | | 5.00 | % | | | 1,882,232 | | | | 1,809,445 | | | | 72,787 | |
BP Capital Markets | | | €4,000 | | | | 0.54 | % | | | 12/20/18 | | | | 1.00 | % | | | 122,333 | | | | 106,215 | | | | 16,118 | |
France Government International Bond | | | $3,800 | | | | 0.09 | % | | | 9/20/15 | | | | 0.25 | % | | | 9,597 | | | | (138,576 | ) | | | 148,173 | |
France Government International Bond | | | 31,100 | | | | 0.12 | % | | | 3/20/16 | | | | 0.25 | % | | | 83,353 | | | | (1,104,012 | ) | | | 1,187,365 | |
| Goldman Sachs: | | | | | | | | | | | | | | | | | | | | | | | | | | | | |
Brazilian Government International Bond | | | 1,200 | | | | 1.12 | % | | | 3/20/18 | | | | 1.00 | % | | | (3,885 | ) | | | (14,522 | ) | | | 10,637 | |
California State Municipal Bond | | | 3,300 | | | | 0.52 | % | | | 12/20/18 | | | | 1.63 | % | | | 169,626 | | | | – | | | | 169,626 | |
California State Municipal Bond | | | 25,000 | | | | 0.52 | % | | | 12/20/18 | | | | 1.65 | % | | | 1,307,880 | | | | – | | | | 1,307,880 | |
El Paso Corp. | | | 350 | | | | 0.33 | % | | | 9/20/14 | | | | 5.00 | % | | | 8,519 | | | | (27,125 | ) | | | 35,644 | |
France Government International Bond | | | 25,900 | | | | 0.12 | % | | | 3/20/16 | | | | 0.25 | % | | | 69,416 | | | | (866,475 | ) | | | 935,891 | |
| HSBC Bank: | | | | | | | | | | | | | | | | | | | | | | | | | | | | |
China Government International Bond | | | 6,200 | | | | 0.21 | % | | | 9/20/15 | | | | 1.00 | % | | | 75,866 | | | | 57,090 | | | | 18,776 | |
China Government International Bond | | | 3,000 | | | | 0.21 | % | | | 9/20/15 | | | | 1.00 | % | | | 36,710 | | | | (41,619 | ) | | | 78,329 | |
| JPMorgan Chase: | | | | | | | | | | | | | | | | | | | | | | | | | | | | |
Brazilian Government International Bond | | | 12,000 | | | | 1.06 | % | | | 12/20/17 | | | | 1.00 | % | | | (10,159 | ) | | | – | | | | (10,159 | ) |
China Government International Bond | | | 22,000 | | | | 0.14 | % | | | 3/20/15 | | | | 1.00 | % | | | 195,079 | | | | 254,939 | | | | (59,860 | ) |
France Government International Bond | | | 4,900 | | | | 0.09 | % | | | 9/20/15 | | | | 0.25 | % | | | 12,375 | | | | (171,695 | ) | | | 184,070 | |
Newmont Mining Corp. | | | 1,600 | | | | 1.37 | % | | | 12/20/18 | | | | 1.00 | % | | | (24,281 | ) | | | (110,946 | ) | | | 86,665 | |
| Morgan Stanley: | | | | | | | | | | | | | | | | | | | | | | | | | | | | |
China Government International Bond | | | 17,200 | | | | 0.21 | % | | | 9/20/15 | | | | 1.00 | % | | | 210,470 | | | | 137,396 | | | | 73,074 | |
France Government International Bond | | | 22,300 | | | | 0.17 | % | | | 9/20/16 | | | | 0.25 | % | | | 49,996 | | | | (1,052,989 | ) | | | 1,102,985 | |
| Royal Bank of Scotland: | | | | | | | | | | | | | | | | | | | | | | | | | | | | |
China Government International Bond | | | 41,500 | | | | 0.21 | % | | | 9/20/15 | | | | 1.00 | % | | | 507,820 | | | | 379,144 | | | | 128,676 | |
| | | | | | | | | | | | | | | | | | | | | | | | | | | | |
| | | | | | | | | | | | | | | | | | | $10,878,282 | | | | $4,700,394 | | | | $6,177,888 | |
| | | | | | | | | | | | | | | | | | | | | | | | | | | | |
| (1) | | This represents the maximum potential amount the Portfolio could be required to make available as a seller of credit protection or receive as a buyer of credit protection if a credit event occurs as defined under the terms of that particular swap agreement. | |
| | | | |
| 30 | | Semi-Annual Report | | | April 30, 2014 |
Schedule of Investments
Fixed Income SHares: Series C
April 30, 2014 (unaudited) (continued)
| (2) | | The quoted market prices and resulting values for credit default swap agreements serve as an indicator of the status at April 30, 2014 of the payment/performance risk and represent the likelihood of an expected liability (or profit) for the credit derivative should the notional amount of the swap agreement have been closed/sold as of the period end. Increasing market values, in absolute terms when compared to the notional amount of the swap, represent a deterioration of the referenced entity’s credit soundness and a greater likelihood or risk of default or other credit event occurring as defined under the terms of the agreement. | |
| (p) | | Interest rate swap agreements outstanding at April 30, 2014: | |
OTC swap agreements:
| | | | | | | | | | | | | | | | | | | | | | | | |
| | | Notional
Amount
(000s) | | | | | | Rate Type | | Value | | | Upfront
Premiums
Paid
(Received) | | | Unrealized
Appreciation
(Depreciation) | |
Swap
Counterparty | | | Termination
Date | | | Payments
Made | | Payments
Received | | | |
| Bank of America | | | MXN 258,000 | | | | 9/13/17 | | | 28-Day Mexico
Interbank TIIE Banxico | | 5.50% | | | $407,737 | | | | $46,749 | | | | $360,988 | |
| Barclays Bank | | | 750,000 | | | | 9/13/17 | | | 28-Day Mexico
Interbank TIIE Banxico | | 5.50% | | | 1,185,281 | | | | 143,088 | | | | 1,042,193 | |
| Barclays Bank | | | 91,800 | | | | 4/9/19 | | | 28-Day Mexico
Interbank TIIE Banxico | | 7.78% | | | 742,536 | | | | 3,208 | | | | 739,328 | |
| Deutsche Bank | | | BRL 100 | | | | 1/2/15 | | | BRL-CDI-Compounded | | 7.62% | | | (1,398 | ) | | | (246 | ) | | | (1,152 | ) |
| Deutsche Bank | | | AUD 188,640 | | | | 12/15/15 | | | 6-Month Australian
Bank Bill | | 5.00% | | | 7,391,966 | | | | (2,459,889 | ) | | | 9,851,855 | |
| HSBC Bank | | | MXN 2,250,000 | | | | 9/6/16 | | | 28-Day Mexico
Interbank TIIE Banxico | | 5.60% | | | 4,636,820 | | | | 666,135 | | | | 3,970,685 | |
| Morgan Stanley | | | 1,500,000 | | | | 9/6/16 | | | 28-Day Mexico
Interbank TIIE Banxico | | 5.60% | | | 3,091,214 | | | | 373,129 | | | | 2,718,085 | |
| | | | | | | | | | | | | | | | | | | | | | | | |
| | | | | | | | | | | | | | | $17,454,156 | | | | $(1,227,826 | ) | | | $18,681,982 | |
| | | | | | | | | | | | | | | | | | | | | | | | |
Centrally cleared swap agreements:
| | | | | | | | | | | | | | | | | | | | |
| | | Notional
Amount
(000s) | | | | | | Rate Type | | Value | | | Unrealized
Appreciation
(Depreciation) | |
Broker
(Exchange) | | | Termination
Date | | | Payments
Made | | Payments
Received | | |
| Barclays Bank (CME) | | | €445,000 | | | | 3/14/15 | | | 0.40% | | 3-Month USD-LIBOR | | | $(654,949 | ) | | | $192,364 | |
| Credit Suisse First Boston (CME) | | | 4,000 | | | | 9/16/19 | | | 6-Month EUR-EURIBOR | | 4.00% | | | 1,012,671 | | | | 410,073 | |
| Credit Suisse First Boston (CME) | | | ¥7,920,000 | | | | 9/18/23 | | | 1.00% | | 6-Month JPY-LIBOR | | | (1,957,836 | ) | | | (276,206 | ) |
| Deutsche Bank (CME) | | | €5,300 | | | | 3/14/15 | | | 0.40% | | 3-Month USD-LIBOR | | | (7,800 | ) | | | 1,802 | |
| Goldman Sachs (CME) | | | 5,700 | | | | 3/14/15 | | | 0.40% | | 3-Month USD-LIBOR | | | (8,389 | ) | | | 3,365 | |
| Goldman Sachs (CME) | | | $25,700 | | | | 12/18/23 | | | 3.00% | | 3-Month USD-LIBOR | | | (919,425 | ) | | | (475,329 | ) |
| Goldman Sachs (CME) | | | 211,700 | | | | 12/18/43 | | | 3.50% | | 3-Month USD-LIBOR | | | (4,785,001 | ) | | | (18,414,341 | ) |
| Morgan Stanley (CME) | | | 57,600 | | | | 6/19/43 | | | 2.75% | | 3-Month USD-LIBOR | | | 7,231,986 | | | | 3,247,955 | |
| | | | | | | | | | | | | | | | | | | | |
| | | | | | | | | | | | | | | $(88,743 | ) | | | $(15,310,317 | ) |
| | | | | | | | | | | | | | | | | | | | |
| (q) | | Forward foreign currency contracts outstanding at April 30, 2014: | |
| | | | | | | | | | | | | | |
| | | Counterparty | | U.S.$ Value on
Origination Date | | | U.S.$ Value
April 30, 2014 | | | Unrealized
Appreciation
(Depreciation) | |
| Purchased: | | | | | | | | | | | | | | |
| 134,293,000 Australian Dollar settling 5/2/14 | | Bank of America | | | $123,923,566 | | | | $124,758,228 | | | | $834,662 | |
| 50,434,000 Australian Dollar settling 5/2/14 | | Morgan Stanley | | | 46,793,917 | | | | 46,853,198 | | | | 59,281 | |
| 22,256,817 Brazilian Real settling 5/5/14 | | Credit Suisse
First Boston | | | 9,953,854 | | | | 9,981,755 | | | | 27,901 | |
| 95,652,269 Brazilian Real settling 5/5/14 | | UBS | | | 43,009,113 | | | | 42,898,203 | | | | (110,910 | ) |
| 16,632,000 British Pound settling 6/12/14 | | Barclays Bank | | | 27,438,625 | | | | 28,072,473 | | | | 633,848 | |
| 1,503,000 Euro settling 6/3/14 | | BNP Paribas | | | 2,084,405 | | | | 2,085,045 | | | | 640 | |
| | | | | | |
| April 30, 2014 | | | Semi-Annual Report | | | 31 | |
Schedule of Investments
Fixed Income SHares: Series C
April 30, 2014 (unaudited) (continued)
| | | | | | | | | | | | | | |
| | | Counterparty | | U.S.$ Value on
Origination Date | | | U.S.$ Value
April 30, 2014 | | | Unrealized
Appreciation
(Depreciation) | |
| 455,911,000 Euro settling 5/2/14 | | UBS | | | $629,841,046 | | | | $632,507,814 | | | | $2,666,768 | |
| 2,351,100,000 Japanese Yen settling 5/13/14 | | BNP Paribas | | | 23,084,241 | | | | 22,998,553 | | | | (85,688 | ) |
| 70,231,550 Japanese Yen settling 5/13/14 | | Citigroup | | | 688,707 | | | | 687,008 | | | | (1,699 | ) |
| 47,240,110 Mexican Peso settling 5/14/14 | | BNP Paribas | | | 3,524,330 | | | | 3,608,236 | | | | 83,906 | |
| 13,877,000 Mexican Peso settling 5/14/14 | | Citigroup | | | 1,046,279 | | | | 1,059,936 | | | | 13,657 | |
| 61,117,110 Mexican Peso settling 8/25/14 | | Goldman Sachs | | | 4,639,750 | | | | 4,629,722 | | | | (10,028 | ) |
| 1,040,000 Norwegian Krone settling 5/13/14 | | Citigroup | | | 169,093 | | | | 174,902 | | | | 5,809 | |
| Sold: | | | | | | | | | | | | | | |
| 184,727,000 Australian Dollar settling 5/2/14 | | Bank of America | | | 170,051,363 | | | | 171,611,425 | | | | (1,560,062 | ) |
| 50,434,000 Australian Dollar settling 6/3/14 | | Morgan Stanley | | | 46,689,886 | | | | 46,750,642 | | | | (60,756 | ) |
| 22,256,817 Brazilian Real settling 5/5/14 | | Credit Suisse
First Boston | | | 9,358,682 | | | | 9,981,755 | | | | (623,073 | ) |
| 95,652,269 Brazilian Real settling 5/5/14 | | UBS | | | 40,659,393 | | | | 42,898,203 | | | | (2,238,810 | ) |
| 95,652,269 Brazilian Real settling 6/3/14 | | UBS | | | 42,656,203 | | | | 42,508,524 | | | | 147,679 | |
| 17,643,000 British Pound settling 6/12/14 | | Goldman Sachs | | | 29,561,111 | | | | 29,778,899 | | | | (217,788 | ) |
| 344,458,004 Euro settling 5/2/14 | | Bank of America | | | 475,085,383 | | | | 477,883,577 | | | | (2,798,194 | ) |
| 111,452,996 Euro settling 5/2/14 | | Royal Bank of
Scotland | | | 153,540,880 | | | | 154,624,238 | | | | (1,083,358 | ) |
| 455,911,000 Euro settling 6/3/14 | | UBS | | | 629,779,498 | | | | 632,465,164 | | | | (2,685,666 | ) |
| 2,400,400,000 Japanese Yen settling 5/13/14 | | Barclays Bank | | | 23,693,052 | | | | 23,480,808 | | | | 212,244 | |
| 61,117,110 Mexican Peso settling 5/14/14 | | Goldman Sachs | | | 4,677,032 | | | | 4,668,172 | | | | 8,860 | |
| | | | | | | | | | | | | | |
| | | | | | | | | | | | | $(6,780,777 | ) |
| | | | | | | | | | | | | | |
| (r) | | At April 30, 2014, the Portfolio held $28,482,000 in cash and U.S. Treasury Obligations valued at $959,966 as collateral and pledged cash collateral of $9,000 for derivative contracts. Cash collateral held may be invested in accordance with the Portfolio’s investment strategy. Securities held as collateral will not be pledged and are not reflected in the Schedule of Investments. | |
| (s) | | The weighted average daily balance of reverse repurchase agreements during the six months ended April 30, 2014 was $255,247,280, at a weighted average interest rate of 0.08%. There were no open reverse repurchase agreements at April 30, 2014. | |
| (t) | | The weighted average borrowing for sale-buybacks during the six months ended April 30, 2014 was $331,113,506 at a weighted average interest rate of 0.11%. There were no open sale-buybacks at April 30, 2014. | |
| (u) | | Fair Value Measurements-See Note 1(b) in the Notes to Financial Statements. | |
| | | | | | | | | | | | | | | | |
| | | Level 1 –
Quoted
Prices | | | Level 2 –
Other Significant
Observable
Inputs | | | Level 3 –
Significant
Unobservable
Inputs | | | Value at
4/30/14 | |
Investments in Securities – Assets | | | | | | | | | | | | | | | | |
Corporate Bonds & Notes: | | | | | | | | | | | | | | | | |
Airlines | | | $– | | | | $1,528,125 | | | | $41,148,917 | | | | $42,677,042 | |
Diversified Financial Services | | | – | | | | 263,001,836 | | | | 357,499 | | | | 263,359,335 | |
All Other | | | – | | | | 1,259,291,929 | | | | – | | | | 1,259,291,929 | |
Sovereign Debt Obligations | | | – | | | | 549,801,341 | | | | – | | | | 549,801,341 | |
Municipal Bonds | | | – | | | | 293,360,903 | | | | – | | | | 293,360,903 | |
Mortgage-Backed Securities | | | – | | | | 94,049,853 | | | | 359 | | | | 94,050,212 | |
U.S. Government Agency Securities | | | – | | | | 39,704,033 | | | | – | | | | 39,704,033 | |
U.S. Treasury Obligations | | | – | | | | 20,864,464 | | | | – | | | | 20,864,464 | |
Asset-Backed Securities | | | – | | | | 17,713,286 | | | | 1,355 | | | | 17,714,641 | |
Senior Loans | | | – | | | | 3,679,964 | | | | – | | | | 3,679,964 | |
Short-Term Investments | | | – | | | | 377,179,410 | | | | – | | | | 377,179,410 | |
| | | | – | | | | 2,920,175,144 | | | | 41,508,130 | | | | 2,961,683,274 | |
| | | | |
| 32 | | Semi-Annual Report | | | April 30, 2014 |
Schedule of Investments
Fixed Income SHares: Series C
April 30, 2014 (unaudited) (continued)
| | | | | | | | | | | | | | | | |
| | | Level 1 –
Quoted
Prices | | | Level 2 –
Other Significant
Observable
Inputs | | | Level 3 –
Significant
Unobservable
Inputs | | | Value at
4/30/14 | |
Investment in Securities – Liabilities | | | | | | | | | | | | | | | | |
Options Written, at value: | | | | | | | | | | | | | | | | |
Foreign Exchange Contracts | | | $– | | | | $(296,221) | | | | $– | | | | $(296,221) | |
Securities Sold Short, at value | | | – | | | | (48,517,548) | | | | – | | | | (48,517,548) | |
| | | | – | | | | (48,813,769) | | | | – | | | | (48,813,769) | |
Other Financial Instruments* – Assets | | | | | | | | | | | | | | | | |
Credit Contracts | | | – | | | | 6,749,096 | | | | – | | | | 6,749,096 | |
Foreign Exchange Contracts | | | – | | | | 4,695,255 | | | | – | | | | 4,695,255 | |
Interest Rate Contracts | | | 516,158 | | | | 22,538,693 | | | | – | | | | 23,054,851 | |
| | | | 516,158 | | | | 33,983,044 | | | | – | | | | 34,499,202 | |
Other Financial Instruments* – Liabilities | | | | | | | | | | | | | | | | |
Credit Contracts | | | – | | | | (571,208) | | | | – | | | | (571,208) | |
Foreign Exchange Contracts | | | – | | | | (11,476,032) | | | | – | | | | (11,476,032) | |
Interest Rate Contracts | | | (857,526) | | | | (19,167,028) | | | | – | | | | (20,024,554) | |
| | | | (857,526) | | | | (31,214,268) | | | | – | | | | (32,071,794) | |
Totals | | $ | (341,368) | | | $ | 2,874,130,151 | | | | $41,508,130 | | | $ | 2,915,296,913 | |
At April 30, 2014, there were no transfers between Levels 1 and 2.
A roll forward of fair value measurements using significant unobservable inputs (Level 3) for the six months ended April 30, 2014, was as follows:
| | | | | | | | | | | | | | | | | | | | | | | | | | | | | | | | | | | | |
| | | Beginning
Balance
10/31/13 | | | Purchases | | | Sales | | | Accrued
Discount
(Premiums) | | | Net
Realized
Gain
(Loss) | | | Net Change
in Unrealized
Appreciation/
Depreciation | | | Transfers
into
Level 3** | | | Transfers
out of
Level 3 | | | Ending
Balance
4/30/14 | |
Investments in Securities – Assets | |
Corporate Bonds & Notes: | | | | | | | | | | | | | | | | | | | | | | | | | | | | | | | | | | | | |
Airlines | | | $1,428,026 | | | | $4,746,891 | | | | $(51,596 | ) | | | $(6,001 | ) | | | $(1,465 | ) | | | $52,033 | | | | $34,981,029 | | | | $– | | | | $41,148,917 | |
Diversified Financial Services | | | 349,195 | | | | – | | | | (8,600 | ) | | | – | | | | – | | | | 16,904 | | | | – | | | | – | | | | 357,499 | |
Mortgage-Backed Securities | | | 427 | | | | – | | | | (33,144 | ) | | | 178 | | | | 7,073 | | | | 25,825 | | | | – | | | | – | | | | 359 | |
Asset-Backed Securities | | | 1,361 | | | | – | | | | – | | | | (38 | ) | | | – | | | | 32 | | | | – | | | | – | | | | 1,355 | |
Totals | | | $1,779,009 | | | | $4,746,891 | | | | $(93,340 | ) | | | $(5,861 | ) | | | $5,608 | | | | $94,794 | | | | $34,981,029 | | | | $– | | | | $41,508,130 | |
The following table presents additional information about valuation techniques and inputs used for investments that are measured at fair value and categorized within Level 3 at April 30, 2014.
| | | | | | | | | | |
| | | Ending Balance
at 4/30/14 | | | Valuation
Technique Used | | Unobservable
Inputs | | Input Values |
Investments in Securities – Assets |
Corporate Bonds & Notes | | | $41,148,917 | | | Third-Party Pricing Vendor | | Single Broker Quote | | $60.50 – $117.00 |
| | | 357,499 | | | Benchmark Pricing | | Security Price Reset | | $80.96 |
Mortgage-Backed Securities | | | 359 | | | Benchmark Pricing | | Security Price Reset | | $0.20 |
Asset-Backed Securities | | | 1,355 | | | Benchmark Pricing | | Security Price Reset | | $48.77 |
| * | | Other financial instruments are derivatives, such as futures contracts, swap agreements and forward foreign currency contracts, which are valued at the unrealized appreciation (depreciation) of the instrument. | |
| ** | | Transferred out of Level 2 into Level 3 because an evaluated price with observable inputs from a third-party pricing vendor was not available. | |
The net change in unrealized appreciation/depreciation of Level 3 investments held at April 30, 2014, was $903,659. Net realized gain (loss) and net change in unrealized appreciation/depreciation are reflected on the Statement of Operations.
| | | | | | |
| April 30, 2014 | | | Semi-Annual Report | | | 33 | |
Schedule of Investments
Fixed Income SHares: Series C
April 30, 2014 (unaudited) (continued)
| (v) | | The following is a summary of the derivative instruments categorized by risk exposure: | |
The effect of derivatives on the Statement of Assets and Liabilities at April 30, 2014:
| | | | | | | | | | | | | | | | |
| Location | | Interest Rate
Contracts | | | Credit
Contracts | | | Foreign
Exchange
Contracts | | | Total | |
| Asset derivatives: | | | | | | | | | | | | | | | | |
| Unrealized appreciation of OTC swaps | | | $18,683,134 | | | | $6,749,096 | | | | $– | | | | $25,432,230 | |
| Receivable for variation margin on centrally cleared swaps** | | | 1,954 | | | | – | | | | – | | | | 1,954 | |
| Receivable for variation margin on futures contracts* | | | 893,963 | | | | – | | | | – | | | | 893,963 | |
Unrealized appreciation of forward foreign currency contracts | | | – | | | | – | | | | 4,695,255 | | | | 4,695,255 | |
Total asset derivatives | | | $19,579,051 | | | | $6,749,096 | | | | $4,695,255 | | | | $31,023,402 | |
| Liability derivatives: | | | | | | | | | | | | | | | | |
| Unrealized depreciation of OTC swaps | | | $(1,152 | ) | | | $(571,208 | ) | | | $– | | | | $(572,360 | ) |
| Payable for variation margin on centrally cleared swaps** | | | (1,797,320 | ) | | | – | | | | – | | | | (1,797,320 | ) |
| Options written, at value | | | – | | | | – | | | | (296,221 | ) | | | (296,221 | ) |
| Payable for variation margin on futures contracts* | | | (32,913 | ) | | | – | | | | – | | | | (32,913 | ) |
Unrealized depreciation of forward foreign currency contracts | | | – | | | | – | | | | (11,476,032 | ) | | | (11,476,032 | ) |
Total liability derivatives | | | $(1,831,385 | ) | | | $(571,208 | ) | | | $(11,772,253 | ) | | | $(14,174,846 | ) |
| * | | Included in net unrealized depreciation of $341,368 on futures contracts as reported in note (m) of the Notes to Schedule of Investments. | |
| ** | | Included in net unrealized depreciation of $15,310,317 on centrally cleared swaps as reported in note (p) of the Notes to Schedule of Investments. | |
The effect of derivatives on the Statement of Operations for the six months ended April 30, 2014:
| | | | | | | | | | | | | | | | |
| Location | | Interest
Rate
Contracts | | | Credit
Contracts | | | Foreign
Exchange
Contracts | | | Total | |
| Net realized gain (loss) on: | | | | | | | | | | | | | | | | |
| Futures contracts | | | $8,991,905 | | | | $– | | | | $– | | | | $8,991,905 | |
| Options written | | | 7,788,991 | | | | – | | | | 755,792 | | | | 8,544,783 | |
| Swaps | | | (30,645,767 | ) | | | 1,055,569 | | | | – | | | | (29,590,198 | ) |
Foreign currency transactions (forward foreign currency contracts) | | | – | | | | – | | | | (4,690,183 | ) | | | (4,690,183 | ) |
Total net realized gain (loss) | | | $(13,864,871 | ) | | | $1,055,569 | | | | $(3,934,391 | ) | | | $(16,743,693 | ) |
| Net change in unrealized appreciation/depreciation of: | | | | | | | | | | | | | | | | |
| Futures contracts | | | $(11,549,067 | ) | | | $– | | | | $– | | | | $(11,549,067 | ) |
| Options written | | | (2,009,185 | ) | | | – | | | | 2,160,991 | | | | 151,806 | |
| Swaps | | | 15,338,030 | | | | 2,026,296 | | | | – | | | | 17,364,326 | |
Foreign currency transactions (forward foreign currency contracts) | | | – | | | | – | | | | 1,883,319 | | | | 1,883,319 | |
Total net change in unrealized appreciation/depreciation | | | $1,779,778 | | | | $2,026,296 | | | | $4,044,310 | | | | $7,850,384 | |
The average volume (measured at each fiscal quarter-end) of derivative activity during the six months ended April 30, 2014:
| | | | | | | | | | | | | | | | | | | | | | | | | | | | | | | | |
Options
Written(1) | | Options
Written(2) | | | Futures
Contracts(1) | | | Forward Foreign
Currency Contracts(3) | | | Credit Default
Swap Agreements(2) | | | Interest Rate
Swap
Agreements(2) | |
| | | | | | | | Long | | | | Short | | | | Purchased | | | | Sold | | | | Buy | | | | Sell | | | | | |
| 366 | | $ | 1,550,300 | | | | 7,698 | | | | (690 | ) | | $ | 666,094,826 | | | $ | 1,187,239,711 | | | $ | 12,200 | | | $ | 407,750 | | | | $787,900 | |
| | | €608,000 | | | | | | | | | | | | | | | | | | | | | | | | €4,000 | | | | AUD 188,640 | |
| | | | | | | | | | | | | | | | | | | | | | | | | | | | | | | BRL 325,167 | |
| | | | | | | | | | | | | | | | | | | | | | | | | | | | | | | €156,000 | |
| | | | | | | | | | | | | | | | | | | | | | | | | | | | | | | ¥5,280,000 | |
| | | | | | | | | | | | | | | | | | | | | | | | | | | | | | | MXN 4,849,800 | |
| (2) | | Notional Amount (in thousands) | |
| (3) | | U.S. $ Value on origination date | |
| | | | |
| 34 | | Semi-Annual Report | | | April 30, 2014 |
Schedule of Investments
Fixed Income SHares: Series C
April 30, 2014 (unaudited) (continued)
| (w) | | The following tables present by counterparty the Portfolio’s derivative assets and liabilities net of related collateral held by the Fund at April 30, 2014 which has not been offset in the Statement of Assets and Liabilities, but would be available for offset to the extent of a default by the counterparty to the transaction. | |
Financial Assets and Derivative Assets, and Collateral Received at April 30, 2014:
| | | | | | | | | | | | | | | | |
| Gross Amounts Not Offset in the Statement of Assets and Liabilities | |
| Counterparty | | Gross Asset Derivatives
Presented in Statement of
Assets and Liabilities | | | Financial
Instrument/
Derivative
Offset | | | Cash Collateral
Paid (Received) | | | Net Amount | |
Foreign Currency Exchange Contracts | | | | | | | | | | | | | | | | |
Bank of America | | | $834,662 | | | | $(834,662 | ) | | | $– | | | | $– | |
Barclays Bank | | | 846,092 | | | | (491,767 | ) | | | – | | | | 354,325 | |
BNP Paribas | | | 84,546 | | | | (84,546 | ) | | | – | | | | – | |
Citigroup | | | 19,466 | | | | (1,699 | ) | | | – | | | | 17,767 | |
Credit Suisse First Boston | | | 27,901 | | | | (27,901 | ) | | | – | | | | – | |
Goldman Sachs | | | 8,860 | | | | (8,860 | ) | | | – | | | | – | |
Morgan Stanley | | | 59,281 | | | | (59,281 | ) | | | – | | | | – | |
UBS | | | 2,814,447 | | | | (2,814,447 | ) | | | – | | | | – | |
Swaps | | | | | | | | | | | | | | | | |
Bank of America | | | 383,718 | | | | (383,718 | ) | | | – | | | | – | |
Barclays Bank | | | 2,311,084 | | | | – | | | | (2,311,084 | )†,## | | | – | |
BNP Paribas | | | 115,341 | | | | (1,142 | ) | | | (114,199 | )†,#,## | | | – | |
Citigroup | | | 424,015 | | | | (959,966 | ) | | | 626,777 | ## | | | 90,826 | |
Credit Suisse First Boston | | | 100,751 | | | | (100,751 | ) | | | – | | | | – | |
Deutsche Bank | | | 11,276,298 | | | | (1,152 | ) | | | (11,197,063 | )#,## | | | 78,083 | |
Goldman Sachs | | | 2,459,678 | | | | (218,956 | ) | | | (2,240,722 | )†,#,## | | | – | |
HSBC Bank | | | 4,067,790 | | | | – | | | | (4,067,790 | )†,#,## | | | – | |
JPMorgan Chase | | | 270,735 | | | | (70,019 | ) | | | (27,702 | )#,## | | | 173,014 | |
Morgan Stanley | | | 3,894,144 | | | | (1,475 | ) | | | (3,892,669 | )†,#,## | | | – | |
Royal Bank of Scotland | | | 128,676 | | | | (128,676 | ) | | | – | | | | – | |
Totals | | | $30,127,485 | | | | $(6,189,018 | ) | | | $(23,224,452 | ) | | | $714,015 | |
| | | | | | | | | | | | |
| Gross Amounts Not Offset in the Statement of Assets and Liabilities | |
| Counterparty | | Gross Financial Assets
Presented in Statement
of Assets and Liabilities | | | Financial
Instrument/
Derivative
Offset | | | Net Amount | |
Repurchase Agreement | | | | | | | | | | | | |
State Street Bank & Trust Co. | | | $1,437,000 | | | | $(1,437,000 | )† | | | $– | |
Financial Liabilities and Derivative Liabilities, and Collateral Pledged at April 30, 2014:
| | | | | | | | | | | | | | | | |
| Gross Amounts Not Offset in the Statement of Assets and Liabilities | |
| Counterparty | | Gross Liability Derivatives
Presented in Statement
of Assets and Liabilities | | | Financial
Instrument/
Derivative
Offset | | | Cash
Collateral
Received (Pledged) | | | Net Amount | |
Foreign Currency Exchange Contracts | | | | | | | | | | | | | | | | |
Bank of America | | | $4,358,256 | | | | $(2,257,294 | ) | | | $– | | | | $2,100,962 | |
BNP Paribas | | | 85,688 | | | | (85,688 | ) | | | – | | | | – | |
Citigroup | | | 1,699 | | | | (1,699 | ) | | | – | | | | – | |
Credit Suisse First Boston | | | 623,073 | | | | (409,629 | ) | | | – | | | | 213,444 | |
Goldman Sachs | | | 227,816 | | | | (227,816 | ) | | | – | | | | – | |
Morgan Stanley | | | 60,756 | | | | (60,756 | ) | | | – | | | | – | |
Royal Bank of Scotland | | | 1,083,358 | | | | (128,676 | ) | | | – | | | | 954,682 | |
UBS | | | 5,035,386 | | | | (4,862,288 | ) | | | 630,000 | | | | 803,098 | |
| | | | | | |
| April 30, 2014 | | | Semi-Annual Report | | | 35 | |
Schedule of Investments
Fixed Income SHares: Series C
April 30, 2014 (unaudited) (continued)
| | | | | | | | | | | | | | | | |
| Gross Amounts Not Offset in the Statement of Assets and Liabilities | |
| Counterparty | | Gross Liability Derivatives
Presented in Statement
of Assets and Liabilities | | | Financial
Instrument/
Derivative
Offset | | | Cash
Collateral
Received (Pledged) | | | Net Amount | |
Swaps | | | | | | | – | | | | | | | | | |
Barclays Bank | | | $491,767 | | | | $(491,767 | ) | | | $– | | | | $– | |
Credit Suisse First Boston | | | 9,422 | | | | – | | | | (9,422 | )## | | | – | |
Deutsche Bank | | | 1,152 | | | | (1,152 | ) | | | – | | | | – | |
JPMorgan Chase | | | 70,019 | | | | (70,019 | ) | | | – | | | | – | |
Totals | | | $12,048,392 | | | | $(8,596,784 | ) | | | $620,578 | | | | $4,072,186 | |
| † | | The actual collateral received is greater than the amount shown here due to over collateralization. | |
| # | | The amount includes upfront premiums received. | |
| ## | | The amount includes upfront premiums paid. | |
Glossary:
| | | | |
| ABS | | - | | Asset-Backed Securities |
| AUD | | - | | Australian Dollar |
| BRL | | - | | Brazilian Real |
| £ | | - | | British Pound |
| CAD | | - | | Canadian Dollar |
| CDI | | - | | Inter-Bank Deposit Certificate |
| CDX.EM | | - | | Credit Derivatives Index Emerging Markets |
| CME | | - | | Chicago Mercantile Exchange |
| CMO | | - | | Collateralized Mortgage Obligation |
| EUR/€ | | - | | Euro |
| EURIBOR | | - | | Euro Inter-Bank Offered Rate |
| GO | | - | | General Obligation Bond |
| GTD | | - | | Guaranteed |
| JPY/¥ | | - | | Japanese Yen |
| LIBOR | | - | | London Inter-Bank Offered Rate |
| MBIA | | - | | insured by MBIA Insurance Corp. |
| MBS | | - | | Mortgage-Backed Securities |
| MXN | | - | | Mexican Peso |
| OTC | | - | | Over-the-Counter |
| PSF | | - | | Public School Fund |
| RMBS | | - | | Residential Mortage-Backed Security |
| TBA | | - | | To Be Announced |
| TIIE | | - | | Inter-Bank Equilibrium Interest Rate |
| | | | | | |
| 36 | | Semi-Annual Report | | | April 30, 2014 | | | See accompanying Notes to Financial Statements |
Schedule of Investments
Fixed Income SHares: Series LD
April 30, 2014 (unaudited)
| | | | | | | | | | |
Principal
Amount
(000s) | | | | | | | Value | |
| | Corporate Bonds & Notes – 78.3% | | | | |
| | | | Airlines – 2.2% | | | | | | |
| | $100 | | | American Airlines, Inc., 7.50%, 3/15/16 (a)(c)(d) | | | | | $104,188 | |
| | 75 | | | United Airlines, Inc., 6.75%, 9/15/15 (a)(c) | | | | | 76,406 | |
| | | | | | | | | | 180,594 | |
| | | | Auto Manufacturers – 1.1% | | | | | | |
| | | | Hyundai Capital America (a)(c), | | | | | | |
| | 50 | | | 1.45%, 2/6/17 | | | | | 50,106 | |
| | 40 | | | 1.625%, 10/2/15 | | | | | 40,456 | |
| | | | | | | | | | 90,562 | |
| | | | Banking – 22.1% | | | | | | |
| | 100 | | | Ally Financial, Inc., 2.75%, 1/30/17 | | | | | 101,500 | |
| | 200 | | | Banco Bradesco S.A., 4.50%, 1/12/17 (a)(c) | | | | | 211,250 | |
| | 150 | | | Banco Santander Chile, 3.75%, 9/22/15 | | | | | 155,605 | |
| | 75 | | | Bank of America Corp., 6.50%, 8/1/16 | | | | | 83,719 | |
| | 95 | | | CIT Group, Inc., 4.25%, 8/15/17 | | | | | 99,750 | |
| | | | DBS Bank Ltd. (a)(b)(c)(f), | | | | | | |
| | 100 | | | 0.849%, 7/15/21 (g) | | | | | | |
| | | | | (acquisition cost – $97,250; purchased 3/6/14) | | | | | 96,930 | |
| | 50 | | | 5.00%, 11/15/19 (converts to FRN on 11/15/14)
(acquisition cost-$51,150; purchased 2/21/14) | | | | | 50,878 | |
| | | | Eksportfinans ASA, | | | | | | |
| | 50 | | | 2.375%, 5/25/16 | | | | | 50,025 | |
| | 100 | | | 5.50%, 5/25/16 | | | | | 106,250 | |
| | 100 | | | Hypothekenbank Frankfurt AG, 0.102%, 9/20/17 (g) | | | | | 97,227 | |
| | | | Hypothekenbank Frankfurt International S.A., | | | | | | |
| | 100 | | | 0.097%, 3/20/17 | | | | | 93,974 | |
| | 100 | | | 5.125%, 1/21/16 | | | | | 105,183 | |
| | 200 | | | Kookmin Bank, 1.114%, 1/27/17 (a)(c)(g) | | | | | 201,302 | |
| | 100 | | | Korea Development Bank, 3.25%, 3/9/16 | | | | | 104,350 | |
| | 75 | | | Macquarie Bank Ltd., 2.00%, 8/15/16 (a)(b)(c)(f)
(acquisition cost-$76,283; purchased 2/4/14) | | | | | 76,279 | |
| | 100 | | | Royal Bank of Scotland PLC, 5.00%, 5/17/15 | | | | | 103,036 | |
| | 100 | | | Woori Bank Co., Ltd., 4.75%, 1/20/16 | | | | | 106,036 | |
| | | | | | | | | | 1,843,294 | |
| | | | Biotechnology – 1.2% | | | | | | |
| | 95 | | | Amgen, Inc., 2.125%, 5/15/17 | | | | | 97,409 | |
| | | | Building Materials – 2.6% | | | | | | |
| | 100 | | | Masco Corp., 6.125%, 10/3/16 | | | | | 110,750 | |
| | 95 | | | USG Corp., 6.30%, 11/15/16 | | | | | 103,075 | |
| | | | | | | | | | 213,825 | |
| | | | Diversified Financial Services – 13.4% | | | | | | |
| | 95 | | | American Express Credit Corp., 2.80%, 9/19/16 | | | | | 99,274 | |
| | 75 | | | Bear Stearns Cos. LLC, 0.624%, 11/21/16 (g) | | | | | 74,783 | |
| | 78 | | | General Electric Capital Corp., 0.555%, 12/20/16 (g) | | | | | 77,730 | |
| | 75 | | | General Motors Financial Co., Inc., 2.75%, 5/15/16 | | | | | 76,312 | |
| | 145 | | | HSBC Finance Corp., 5.50%, 1/19/16 (e) | | | | | 156,238 | |
| | | | International Lease Finance Corp., | | | | | | |
| | 50 | | | 5.75%, 5/15/16 | | | | | 53,938 | |
| | 50 | | | 8.625%, 9/15/15 | | | | | 55,000 | |
| | | | | | |
| April 30, 2014 | | | Semi-Annual Report | | | 37 | |
Schedule of Investments
Fixed Income SHares: Series LD
April 30, 2014 (unaudited) (continued)
| | | | | | | | | | |
Principal
Amount
(000s) | | | | | | | Value | |
| | $ 180 | | | LeasePlan Corp. NV, 2.50%, 5/16/18 (a)(b)(c)(f) | | | | | | |
| | | | | (acquisition cost-$178,366; purchased 1/29/14) | | | | | $ 179,833 | |
| | 100 | | | Macquarie Group Ltd., 3.00%, 12/3/18 (a)(b)(c)(f) | | | | | | |
| | | | | (acquisition cost-$100,550; purchased 2/11/14) | | | | | 101,604 | |
| | 150 | | | SLM Corp., 6.25%, 1/25/16 | | | | | 162,375 | |
| | 75 | | | Vesey Street Investment Trust I, 4.404%, 9/1/16 | | | | | 80,326 | |
| | | | | | | | | | 1,117,413 | |
| | | | Electric Utilities – 4.1% | | | | | | |
| | 30 | | | Electricite de France, 0.694%, 1/20/17 (a)(c)(g) | | | | | 30,111 | |
| | 100 | | | FirstEnergy Corp., 2.75%, 3/15/18 | | | | | 100,733 | |
| | 200 | | | Korea Western Power Co., Ltd., 3.125%, 5/10/17 (e) | | | | | 207,916 | |
| | | | | | | | | | 338,760 | |
| | | | Electronics – 1.2% | | | | | | |
| | 95 | | | Thermo Fisher Scientific, Inc., 3.20%, 3/1/16 | | | | | 99,099 | |
| | | | Healthcare-Services – 2.0% | | | | | | |
| | | | HCA, Inc., | | | | | | |
| | 80 | | | 6.50%, 2/15/16 | | | | | 87,000 | |
| | 75 | | | 7.19%, 11/15/15 | | | | | 81,375 | |
| | | | | | | | | | 168,375 | |
| | | | Insurance – 0.3% | | | | | | |
| | 22 | | | American International Group, Inc., 2.375%, 8/24/15 | | | | | 22,434 | |
| | | | Iron/Steel – 1.2% | | | | | | |
| | 100 | | | Glencore Funding LLC, 1.70%, 5/27/16 (a)(b)(c)(f) | | | | | | |
| | | | | (acquisition cost-$100,283; purchased 2/4/14) | | | | | 100,604 | |
| | | | Lodging – 3.9% | | | | | | |
| | 115 | | | MGM Resorts International, 6.625%, 7/15/15 | | | | | 122,187 | |
| | 200 | | | Wynn Macau Ltd., 5.25%, 10/15/21 (a)(c) | | | | | 203,500 | |
| | | | | | | | | | 325,687 | |
| | | | Media – 2.0% | | | | | | |
| | 25 | | | Comcast Corp., 5.90%, 3/15/16 | | | | | 27,385 | |
| | | | DISH DBS Corp., | | | | | | |
| | 50 | | | 7.125%, 2/1/16 | | | | | 54,750 | |
| | 80 | | | 7.75%, 5/31/15 | | | | | 85,600 | |
| | | | | | | | | | 167,735 | |
| | | | Oil & Gas – 10.5% | | | | | | |
| | 90 | | | Anadarko Petroleum Corp., 5.95%, 9/15/16 | | | | | 100,370 | |
| | 100 | | | Devon Energy Corp., 1.875%, 5/15/17 | | | | | 101,689 | |
| | 200 | | | Korea National Oil Corp., 4.00%, 10/27/16 (e) | | | | | 212,606 | |
| | 100 | | | Petrobras Global Finance BV, 1.855%, 5/20/16 (g) | | | | | 99,625 | |
| | 50 | | | Plains Exploration & Production Co., 6.125%, 6/15/19 | | | | | 55,375 | |
| | 200 | | | Sinopec Group Overseas Development 2012 Ltd., 2.75%, 5/17/17 (a)(c)(e) | | | | | 205,700 | |
| | 90 | | | Transocean, Inc., 5.05%, 12/15/16 | | | | | 97,982 | |
| | | | | | | | | | 873,347 | |
| | | | Pharmaceuticals – 2.4% | | | | | | |
| | 95 | | | Express Scripts Holding Co., 3.125%, 5/15/16 | | | | | 99,612 | |
| | 100 | | | McKesson Corp., 0.635%, 9/10/15 (g) | | | | | 100,156 | |
| | | | | | | | | | 199,768 | |
| | | | |
| 38 | | Semi-Annual Report | | | April 30, 2014 |
Schedule of Investments
Fixed Income SHares: Series LD
April 30, 2014 (unaudited) (continued)
| | | | | | | | | | |
Principal
Amount
(000s) | | | | | | | Value | |
| | | | Pipelines – 0.4% | | | | | | |
| | $ 30 | | | Kinder Morgan Energy Partners L.P., 6.00%, 2/1/17 | | | | | $ 33,558 | |
| | | | Telecommunications – 6.5% | | | | | | |
| | 50 | | | Orange S.A., 2.75%, 2/6/19 | | | | | 50,987 | |
| | 200 | | | SK Telecom Co., Ltd., 2.125%, 5/1/18 (a)(c) | | | | | 198,917 | |
| | 100 | | | Sprint Communications, Inc., 6.00%, 12/1/16 | | | | | 109,750 | |
| | 75 | | | Telecom Italia Capital S.A., 6.175%, 6/18/14 | | | | | 75,553 | |
| | 100 | | | Verizon Communications, Inc., 2.50%, 9/15/16 (e) | | | | | 103,564 | |
| | | | | | | | | | 538,771 | |
| | | | Transportation – 1.2% | | | | | | |
| | 100 | | | Kansas City Southern de Mexico S.A. De C.V., 0.935%, 10/28/16 (g) | | | | | 100,359 | |
| | Total Corporate Bonds & Notes (cost-$6,483,672) | | | | | 6,511,594 | |
| | Mortgage-Backed Securities – 7.5% | | | | | | |
| | 30 | | | Banc of America Merrill Lynch Commercial Mortgage, Inc., 4.933%, 7/10/45 | | | | | 31,241 | |
| | | | BCAP LLC Trust, CMO (a)(c)(g), | | | | | | |
| | 100 | | | 0.312%, 3/26/37 | | | | | 97,238 | |
| | 58 | | | 2.709%, 7/26/36 | | | | | 58,685 | |
| | 11 | | | Citigroup Mortgage Loan Trust, Inc., 6.00%, 2/25/37, CMO (a)(c) | | | | | 11,417 | |
| | 30 | | | Credit Suisse Commercial Mortgage Trust, 5.311%, 12/15/39, CMO | | | | | 32,527 | |
| | 149 | | | Credit Suisse Mortgage Capital Certificates, 2.659%, 9/27/36, CMO (a)(c)(g) | | | | | 150,791 | |
| | 31 | | | JPMorgan Resecuritization Trust, 2.255%, 7/27/37, CMO (a)(c)(g) | | | | | 30,761 | |
| | 131 | | | Residential Accredit Loans, Inc., 0.594%, 6/25/34, CMO (g) | | | | | 128,815 | |
| | 25 | | | Wachovia Bank Commercial Mortgage Trust, 5.558%, 3/15/45 (g) | | | | | 26,739 | |
| | 59 | | | WaMu Mortgage Pass-Through Certificates, 0.588%, 6/25/44, CMO (g) | | | | | 55,416 | |
| | Total Mortgage-Backed Securities (cost-$613,427) | | | | | 623,630 | |
| | Asset-Backed Securities (g) – 7.1% | | | | | | |
| | 30 | | | Aegis Asset-Backed Securities Trust, 0.424%, 12/25/35 | | | | | 28,865 | |
| | 77 | | | Argent Securities, Inc. Asset-Backed Pass-Through Certificates, 0.414%, 10/25/35 | | | | | 76,565 | |
| | 131 | | | Golden Knight CDO Ltd., 0.479%, 4/15/19 (a)(c) | | | | | 129,596 | |
| | 19 | | | Kingsland I Ltd., 0.483%, 6/13/19, CDO (a)(c) | | | | | 18,740 | |
| | 50 | | | Race Point CLO Ltd., 1.533%, 12/15/22 (a)(c) | | | | | 50,053 | |
| | 246 | | | Saturn CLO Ltd., 0.462%, 5/13/22 (a)(c) | | | | | 241,116 | |
| | 49 | | | Structured Asset Securities Corp. Mortgage Pass-Through Certificates, 0.734%, 1/25/33 | | | | | 45,378 | |
| | Total Asset-Backed Securities (cost-$586,818) | | | | | 590,313 | |
| | Sovereign Debt Obligations – 1.8% | | | | | | |
| | | | Republic of Korea – 1.2% | | | | | | |
| | 100 | | | Export-Import Bank of Korea, 4.125%, 9/9/15 | | | | | 104,563 | |
| | | | Spain – 0.6% | | | | | | |
| | 50 | | | Junta Comunidades de Castilla-La Mancha, 4.707%, 11/15/14 (a)(b)(c)(f) | | | | | | |
| | | | | (acquisition cost-$51,179; purchased 2/25/14) | | | | | 50,017 | |
| | Total Sovereign Debt Obligations (cost-$155,577) | | | | | 154,580 | |
| | Short-Term Investments – 13.1% | | | | | | |
| | | | Sovereign Debt Obligation – 8.3% | | | | | | |
| | | | Slovenia – 8.3% | | | | | | |
| | €500 | | | Slovenia Ministry of Finance Treasury Bills, zero coupon, 9/11/14 (cost-$679,909) | | | | | 692,085 | |
| | | | | | |
| April 30, 2014 | | | Semi-Annual Report | | | 39 | |
Schedule of Investments
Fixed Income SHares: Series LD
April 30, 2014 (unaudited) (continued)
| | | | | | | | | | |
Principal
Amount
(000s) | | | | | | | Value | |
| | | | Certificate of Deposit – 2.4% | | | | | | |
| | $ 200 | | | Intesa Sanpaolo SpA, 1.65%, 4/7/15 (cost-$200,000) | | | | | $ 200,345 | |
| | | | Mexico Treasury Bill – 2.4% | | | | | | |
| | MXN 2,600 | | | Mexico Cetes, zero coupon, 7/10/14 (cost-$196,332) | | | | | 197,415 | |
| | Total Short-Term Investments (cost-$1,076,241) | | | | | 1,089,845 | |
| | Total Investments, before securities sold short (cost-$8,915,735) – 107.8% | | | | | 8,969,962 | |
| | Securities Sold Short – (1.2)% | | | | | | |
| | | | U.S. Treasury Obligations – (1.2)% | | | | | | |
| | $100 | | | U.S. Treasury Notes, 1.625%, 3/31/19 (proceeds received-$99,526) | | | | | (99,816 | ) |
| | Total Investments, net of securities sold short (cost-$8,816,209) – 106.6% | | | | | 8,870,146 | |
| | Other liabilities in excess of other assets – (6.6)% | | | | | (549,656 | ) |
| | Net Assets – 100.0% | | | | | $8,320,490 | |
Notes to Schedule of Investments:
| (a) | | Private Placement–Restricted as to resale and may not have a readily available market. Securities with an aggregate value of $2,766,478, representing 33.2% of net assets. | |
| (c) | | 144A–Exempt from registration under Rule 144A of the Securities Act of 1933. These securities may be resold in transactions exempt from registration, typically only to qualified institutional buyers. Unless otherwise indicated, these securities are not considered to be illiquid. | |
| (e) | | All or partial amount transferred for the benefit of the counterparty as collateral for reverse repurchase agreements. | |
| (f) | | Restricted. The aggregate acquisition cost of such securities is $655,061. The aggregate value is $656,145, representing 7.9% of net assets. | |
| (g) | | Variable or Floating Rate Security–Securities with an interest rate that changes periodically. The interest rate disclosed reflects the rate in effect on April 30, 2014. | |
| (h) | | Futures contracts outstanding at April 30, 2014: | |
| | | | | | | | | | | | | | | | | | |
| | | Type | | Contracts | | | Market
Value
(000s) | | | Expiration
Date | | | Unrealized
Appreciation | |
| Long: | | 5-Year Euro-Bobl Futures | | | 1 | | | | $174 | | | | 6/6/14 | | | | $110 | |
| | | | | | | | | | | | | | | | | | |
At April 30, 2014, the Portfolio pledged cash collateral of $7,000 for futures contracts.
| (i) | | Transactions in options written during the period ended April 30, 2014: | |
| | | | | | | | |
| | | Notional
Amount
(000s) | | | Premiums | |
| Options written | | | 400 | | | | $3,529 | |
| Options terminated in closing transactions | | | (400 | ) | | | (3,529 | ) |
| | | | | | | | |
| Options outstanding, April 30, 2014 | | | – | | | | $– | |
| | | | | | | | |
| | | | |
| 40 | | Semi-Annual Report | | | April 30, 2014 |
Schedule of Investments
Fixed Income SHares: Series LD
April 30, 2014 (unaudited) (continued)
| (j) | | Credit default swap agreements outstanding at April 30, 2014: | |
OTC sell protection swap agreements:
| | | | | | | | | | | | | | | | | | | | | | | | | | | | |
Swap Counterparty/
Referenced Debt Issuer | | Notional
Amount
(000s)(1) | | | Credit
Spread | | | Termination
Date | | | Payments
Received | | | Value(2) | | | Upfront
Premiums
Received | | | Unrealized
Appreciation | |
| Credit Suisse First Boston: | | | | | | | | | | | | | | | | | | | | | | | | | | | | |
CMBX.NA AAA.1 | | | $95 | | | | | † | | | 10/12/52 | | | | 0.10 | % | | | $(322 | ) | | | $(476 | ) | | | $154 | |
| Goldman Sachs: | | | | | | | | | | | | | | | | | | | | | | | | | | | | |
CMBX.NA AAA.1 | | | 95 | | | | | † | | | 10/12/52 | | | | 0.10 | % | | | (321 | ) | | | (432 | ) | | | 111 | |
Standard Chartered PLC | | | 30 | | | | 0.94 | % | | | 3/20/19 | | | | 1.00 | % | | | 118 | | | | (30 | ) | | | 148 | |
| | | | | | | | | | | | | | | | | | | | | | | | | | | | |
| | | | | | | | | | | | | | | | | | | $(525 | ) | | | $(938 | ) | | | $413 | |
| | | | | | | | | | | | | | | | | | | | | | | | | | | | |
| † | | Credit Spread not quoted for asset-backed securities. | |
| (1) | | This represents the maximum potential amount the Portfolio could be required to make available as a seller of credit protection or receive as a buyer of credit protection if a credit event occurs as defined under the terms of that particular swap agreement. | |
| (2) | | The quoted market prices and resulting values for credit default swap agreements serve as an indicator of the status at April 30, 2014 of the payment/performance risk and represent the likelihood of an expected liability (or profit) for the credit derivative should the notional amount of the swap agreement have been closed/sold as of the period end. Increasing market values, in absolute terms when compared to the notional amount of the swap, represent a deterioration of the referenced entity’s credit soundness and a greater likelihood or risk of default or other credit event occurring as defined under the terms of the agreement. | |
| (k) | | Forward foreign currency contracts outstanding at April 30, 2014: | |
| | | | | | | | | | | | | | |
| | | Counterparty | | U.S.$ Value on
Origination Date | | | U.S.$ Value
April 30, 2014 | | | Unrealized
Appreciation
(Depreciation) | |
| Purchased: | | | | | | | | | | | | | | |
| 103,000 Euro settling 5/2/14 | | Bank of America | | | $142,512 | | | | $142,897 | | | | $385 | |
| 794,000 Mexican Peso settling 5/14/14 | | Barclays Bank | | | 59,340 | | | | 60,646 | | | | 1,306 | |
| Sold: | | | | | | | | | | | | | | |
| 70,000 Euro settling 5/2/14 | | Bank of America | | | 96,530 | | | | 97,114 | | | | (584 | ) |
| 103,000 Euro settling 6/3/14 | | Bank of America | | | 142,500 | | | | 142,887 | | | | (387 | ) |
| 500,000 Euro settling 9/11/14 | | Barclays Bank | | | 682,904 | | | | 693,525 | | | | (10,621 | ) |
| 33,000 Euro settling 5/2/14 | | BNP Paribas | | | 45,429 | | | | 45,783 | | | | (354 | ) |
| 4,200,000 Japanese Yen settling 5/13/14 | | Barclays Bank | | | 41,227 | | | | 41,085 | | | | 142 | |
| 10,100,000 Japanese Yen settling 5/13/14 | | BNP Paribas | | | 99,595 | | | | 98,799 | | | | 796 | |
| 15,300,000 Japanese Yen settling 5/13/14 | | Deutsche Bank | | | 149,221 | | | | 149,665 | | | | (444 | ) |
| 786,780 Mexican Peso settling 5/14/14 | | Barclays Bank | | | 60,000 | | | | 60,095 | | | | (95 | ) |
| 2,600,000 Mexican Peso settling 7/10/14 | | BNP Paribas | | | 195,854 | | | | 197,675 | | | | (1,821 | ) |
| | | | | | | | | | | | | | |
| | | | | | | | | | | | | $(11,677 | ) |
| | | | | | | | | | | | | | |
| (l) | | Open reverse repurchase agreements at April 30, 2014: | |
| | | | | | | | | | | | | | | | | | | | |
| Counterparty | | Rate | | | Trade Date | | | Due Date | | | Principal &
Interest | | | Principal | |
| BNP Paribas | | | 0.33 | % | | | 4/30/14 | | | | 5/14/14 | | | | $297,003 | | | | $297,000 | |
| UBS | | | 0.34 | | | | 4/28/14 | | | | 5/12/14 | | | | 406,012 | | | | 406,000 | |
| | | 0.35 | | | | 4/22/14 | | | | 5/6/14 | | | | 151,013 | | | | 151,000 | |
| | | | | | | | | | | | | | | | | | | | |
| | | | | | | | | | | | | | | | | | | $854,000 | |
| | | | | | | | | | | | | | | | | | | | |
| (m) | | The weighted average daily balance of reverse repurchase agreements during the period ended April 30, 2014 was $532,947, at a weighted average interest rate of 0.35%. Total value of underlying collateral (refer to the Schedule of Investments for positions transferred for the benefit of the counterparty as collateral) for open reverse repurchase agreements at April 30, 2014 was $1,093,939. | |
| (n) | | The weighted average borrowing for sale-buybacks during the period ended April 30, 2014 was $338,757 at a weighted average interest rate of (0.11)%. There were no open sale-buybacks at April 30, 2014. | |
| | | | | | |
| April 30, 2014 | | | Semi-Annual Report | | | 41 | |
Schedule of Investments
Fixed Income SHares: Series LD
April 30, 2014 (unaudited) (continued)
| (o) | | Fair Value Measurements-See Note 1(b) in the Notes to Financial Statements. | |
| | | | | | | | | | | | | | | | |
| | | Level 1 –
Quoted
Prices | | | Level 2 –
Other Significant
Observable
Inputs | | | Level 3 –
Significant
Unobservable
Inputs | | | Value at
4/30/14 | |
Investments in Securities – Assets | | | | | | | | | | | | | | | | |
Corporate Bonds & Notes | | | $– | | | | $6,511,594 | | | | $– | | | | $6,511,594 | |
Mortgage-Backed Securities | | | – | | | | 623,630 | | | | – | | | | 623,630 | |
Asset-Backed Securities | | | – | | | | 590,313 | | | | – | | | | 590,313 | |
Sovereign Debt Obligations | | | – | | | | 154,580 | | | | – | | | | 154,580 | |
Short-Term Investments | | | – | | | | 1,089,845 | | | | – | | | | 1,089,845 | |
| | | | – | | | | 8,969,962 | | | | – | | | | 8,969,962 | |
Investment in Securities – Liabilities | | | | | | | | | | | | | | | | |
Securities Sold Short, at value | | | – | | | | (99,816 | ) | | | – | | | | (99,816 | ) |
Other Financial Instruments* – Assets | | | | | | | | | | | | | | | | |
Credit Contracts | | | – | | | | 413 | | | | – | | | | 413 | |
Foreign Exchange Contracts | | | – | | | | 2,629 | | | | – | | | | 2,629 | |
Interest Rate Contracts | | | 110 | | | | – | | | | – | | | | 110 | |
| | | | 110 | | | | 3,042 | | | | – | | | | 3,152 | |
Other Financial Instruments* – Liabilities | | | | | | | | | | | | | | | | |
Foreign Exchange Contracts | | | – | | | | (14,306 | ) | | | – | | | | (14,306 | ) |
Totals | | $ | 110 | | | $ | 8,858,882 | | | $ | – | | | $ | 8,858,992 | |
At April 30, 2014, there were no transfers between Levels 1 and 2.
| * | | Other financial instruments are derivatives, such as futures contracts, swap agreements and forward foreign currency contracts, which are valued at the unrealized appreciation (depreciation) of the instrument. | |
| (p) | | The following is a summary of the derivative instruments categorized by risk exposure: | |
The effect of derivatives on the Statement of Assets and Liabilities at April 30, 2014:
| | | | | | | | | | | | | | | | |
| Location | | Interest
Rate
Contracts | | | Credit
Contracts | | | Foreign
Exchange
Contracts | | | Total | |
| Asset derivatives: | | | | | | | | | | | | | | | | |
| Unrealized appreciation of OTC swaps | | | $– | | | | $413 | | | | $– | | | | $413 | |
| Receivable for variation margin on futures contracts* | | | 319 | | | | – | | | | – | | | | 319 | |
Unrealized appreciation of forward foreign currency contracts | | | – | | | | – | | | | 2,629 | | | | 2,629 | |
Total asset derivatives | | | $319 | | | | $413 | | | | $2,629 | | | | $3,361 | |
| Liability derivatives: | | | | | | | | | | | | | | | | |
Unrealized depreciation of forward foreign currency contracts | | | $– | | | | $– | | | | $(14,306 | ) | | | $(14,306 | ) |
| * | | Included in net unrealized appreciation of $110 on futures contracts as reported in note (h) of the Notes to Schedule of Investments. | |
The effect of derivatives on the Statement of Operations for the period ended April 30, 2014:
| | | | | | | | | | | | | | | | |
| Location | | Interest
Rate
Contracts | | | Credit
Contracts | | | Foreign
Exchange
Contracts | | | Total | |
| Net realized gain (loss) on: | | | | | |
| Futures contracts | | | $824 | | | | $– | | | | $– | | | | $824 | |
| Options written | | | 239 | | | | – | | | | – | | | | 239 | |
| Swaps | | | – | | | | 86 | | | | – | | | | 86 | |
Foreign currency transactions (forward foreign currency contracts) | | | – | | | | – | | | | (7,501 | ) | | | (7,501 | ) |
Total net realized gain (loss) | | | $1,063 | | | | $86 | | | | $(7,501 | ) | | | $(6,352 | ) |
| Net change in unrealized appreciation/depreciation of: | | | | | | | | | | | | | | | | |
| Futures contracts | | | $110 | | | | $– | | | | $– | | | | $110 | |
| Swaps | | | – | | | | 413 | | | | – | | | | 413 | |
Foreign currency transactions (forward foreign currency contracts) | | | – | | | | – | | | | (11,677 | ) | | | (11,677 | ) |
Total net change in unrealized appreciation/depreciation | | | $110 | | | | $413 | | | | $(11,677 | ) | | | $(11,154 | ) |
| | | | |
| 42 | | Semi-Annual Report | | | April 30, 2014 |
Schedule of Investments
Fixed Income SHares: Series LD
April 30, 2014 (unaudited) (continued)
The average volume (measured at each fiscal quarter-end) of derivative activity during the period ended April 30, 2014:
| | | | | | | | | | |
Futures
Contracts(1) | | Forward Foreign
Currency Contracts(2) | | | Credit Default
Swap Agreements(3) | |
| Long | | Purchased | | Sold | | | Sell | |
| 1 | | $451,967 | | $ | 1,128,231 | | | $ | 125 | |
| (2) | | U.S. $ Value on origination date | |
| (3) | | Notional Amount (in thousands) | |
| (q) | | The following tables present by counterparty the Portfolio’s derivative assets and liabilities net of related collateral held by the Fund at April 30, 2014 which has not been offset in the Statement of Assets and Liabilities, but would be available for offset to the extent of a default by the counterparty to the transaction. | |
Financial Assets and Derivative Assets, and Collateral Received at April 30, 2014:
| | | | | | | | | | | | | | | | |
| Gross Amounts Not Offset in the Statement of Assets and Liabilities | |
| Counterparty | | Gross Asset Derivatives
Presented in Statement of
Assets and Liabilities | | | Financial
Instrument/
Derivative
Offset | | | Cash
Collateral
Received | | | Net Amount | |
Foreign Currency Exchange Contracts | | | | | | | | | | | | | | | | |
Bank of America | | | $385 | | | | $(385 | ) | | | $– | | | | $– | |
Barclays Bank | | | 1,448 | | | | (1,448 | ) | | | – | | | | – | |
BNP Paribas | | | 796 | | | | (796 | ) | | | – | | | | – | |
Swaps | | | | | | | | | | | | | | | | |
Credit Suisse First Boston | | | 154 | | | | – | | | | (154 | )†,# | | | – | |
Goldman Sachs | | | 259 | | | | – | | | | (259 | )†,# | | | – | |
Totals | | | $3,042 | | | | $(2,629 | ) | | | $(413 | ) | | | $– | |
Financial Liabilities and Derivative Liabilities, and Collateral Pledged at April 30, 2014:
| | | | | | | | | | | | | | | | |
| Gross Amounts Not Offset in the Statement of Assets and Liabilities | |
| Counterparty | | Gross Liability Derivatives
Presented in Statement of
Assets and Liabilities | | | Financial
Instrument/
Derivative
Offset | | | Cash
Collateral
Pledged | | | Net Amount | |
Foreign Currency Exchange Contracts | | | | | | | | | | | | | | | | |
Bank of America | | | $971 | | | | $(385 | ) | | | $– | | | | $586 | |
Barclays Bank | | | 10,716 | | | | (1,448 | ) | | | – | | | | 9,268 | |
BNP Paribas | | | 2,175 | | | | (796 | ) | | | – | | | | 1,379 | |
Deutsche Bank | | | 444 | | | | – | | | | – | | | | 444 | |
Totals | | | $14,306 | | | | $(2,629 | ) | | | $– | | | | $11,677 | |
| | | | |
| Counterparty | | Gross Liability Derivatives
Presented in Statement of
Assets and Liabilities | | | Financial
Instrument/
Derivative
Offset | | | Cash
Collateral
Pledged | | | Net Amount | |
Reverse Repurchase Agreements | | | | | | | | | | | | | | | | |
BNP Paribas | | | $297,003 | ††† | | | $(297,003 | )†† | | | $– | | | | $– | |
UBS | | | 557,025 | ††† | | | (557,025 | )†† | | | – | | | | – | |
Totals | | | $854,028 | | | | $(854,028 | ) | | | $– | | | | $– | |
| † | | The actual collateral received is greater than the amount shown here due to over collateralization. | |
| †† | | The actual collateral pledged is greater than the amount shown here due to over collateralization. | |
| ††† | | The amount includes interest payable for Reverse Repurchase Agreements. | |
| # | | The amount includes upfront premiums received. | |
| | | | | | |
| April 30, 2014 | | | Semi-Annual Report | | | 43 | |
Schedule of Investments
Fixed Income SHares: Series LD
April 30, 2014 (unaudited) (continued)
Glossary:
| | | | |
| CDO | | - | | Collateralized Debt Obligation |
| CLO | | - | | Collateralized Loan Obligation |
| CMBX | | - | | Commercial Mortgage-Backed Index |
| CMO | | - | | Collateralized Mortgage Obligation |
| € | | - | | Euro |
| FRN | | - | | Floating Rate Note |
| MXN | | - | | Mexican Peso |
| OTC | | - | | Over-the-Counter |
| | | | | | |
| 44 | | Semi-Annual Report | | | April 30, 2014 | | | See accompanying Notes to Financial Statements |
Schedule of Investments
Fixed Income SHares: Series M
April 30, 2014 (unaudited)
| | | | | | | | | | |
Principal
Amount
(000s) | | | | | | | Value | |
| | U.S. Treasury Obligations – 74.1% | | | | | | |
| | | | U.S. Treasury Notes, | | | | | | |
| | $974 | | | 0.25%, 1/31/15 (g) | | | | | $975,313 | |
| | 112,600 | | | 1.00%, 5/31/18 (g) | | | | | 110,963,810 | |
| | 60,000 | | | 1.125%, 5/31/19 (g) | | | | | 58,265,640 | |
| | 168,500 | | | 1.375%, 6/30/18 (g) | | | | | 168,315,661 | |
| | 129,800 | | | 1.375%, 2/28/19 (g) | | | | | 128,207,873 | |
| | 1,336,100 | | | 1.50%, 8/31/18 (g)(h) | | | | | 1,337,613,801 | |
| | 275,000 | | | 1.50%, 1/31/19 (e) | | | | | 273,517,475 | |
| | 68,480 | | | 1.50%, 2/28/19 | | | | | 68,038,646 | |
| | 5,300 | | | 2.00%, 2/15/22 | | | | | 5,156,529 | |
| | Total U.S. Treasury Obligations (cost-$2,163,165,208) | | | | | 2,151,054,748 | |
| | U.S. Government Agency Securities – 43.1% | | | | | | |
| | | | Fannie Mae, | | | | | | |
| | 6,100 | | | 0.354%, 10/27/37, CMO (j) | | | | | 6,085,814 | |
| | 22 | | | 0.604%, 8/25/21, CMO (j) | | | | | 22,133 | |
| | 1,052 | | | 1.712%, 1/1/34, MBS (j) | | | | | 1,098,438 | |
| | 496 | | | 1.863%, 1/1/20, MBS (j) | | | | | 517,960 | |
| | 289 | | | 1.913%, 1/1/22, MBS (j) | | | | | 298,162 | |
| | 338 | | | 2.025%, 1/1/33, MBS (j) | | | | | 355,132 | |
| | 295 | | | 2.04%, 5/1/28-5/1/34, MBS (j) | | | | | 313,918 | |
| | 15 | | | 2.10%, 11/1/32, MBS (j) | | | | | 14,629 | |
| | 29 | | | 2.123%, 10/1/32, MBS (j) | | | | | 29,093 | |
| | 105 | | | 2.217%, 12/1/34, MBS (j) | | | | | 110,830 | |
| | 57 | | | 2.22%, 9/1/27, MBS (j) | | | | | 59,898 | |
| | 284 | | | 2.24%, 9/1/32, MBS (j) | | | | | 302,950 | |
| | 164 | | | 2.251%, 5/1/33, MBS (j) | | | | | 174,528 | |
| | 83 | | | 2.269%, 1/1/33, MBS (j) | | | | | 88,321 | |
| | 214 | | | 2.297%, 9/1/35, MBS (j) | | | | | 223,844 | |
| | 17 | | | 2.307%, 9/1/32, MBS (j) | | | | | 17,497 | |
| | 262 | | | 2.33%, 2/1/33, MBS (j) | | | | | 260,954 | |
| | 1,038 | | | 2.345%, 11/1/35, MBS (j) | | | | | 1,113,068 | |
| | 12 | | | 2.50%, 5/1/17, MBS (j) | | | | | 12,170 | |
| | 19 | | | 2.532%, 6/1/20, MBS (j) | | | | | 19,757 | |
| | 212 | | | 2.54%, 12/1/32, MBS (j) | | | | | 212,304 | |
| | 144 | | | 2.55%, 10/1/34, MBS (j) | | | | | 151,067 | |
| | 310 | | | 2.692%, 4/1/35, MBS (j) | | | | | 327,565 | |
| | 46 | | | 2.758%, 1/1/18-5/1/18, MBS (j) | | | | | 48,583 | |
| | 21 | | | 3.133%, 3/25/41, CMO (j) | | | | | 21,082 | |
| | 269,000 | | | 3.50%, MBS, TBA, 30 Year (e) | | | | | 272,348,473 | |
| | 19 | | | 3.513%, 5/25/42, CMO (j) | | | | | 20,387 | |
| | 419,000 | | | 4.00%, MBS, TBA, 30 Year (e) | | | | | 439,098,885 | |
| | 430 | | | 4.00%, 11/25/19, CMO | | | | | 452,139 | |
| | 10,818 | | | 4.00%, 9/1/23-10/1/31, MBS | | | | | 11,512,669 | |
| | 280,000 | | | 4.50%, MBS, TBA, 30 Year (e) | | | | | 300,156,573 | |
| | 56,743 | | | 4.50%, 11/1/23-5/1/42, MBS | | | | | 61,058,609 | |
| | 6,644 | | | 4.50%, 11/25/26-10/25/34, CMO | | | | | 7,188,171 | |
| | | | | | |
| April 30, 2014 | | | Semi-Annual Report | | | 45 | |
Schedule of Investments
Fixed Income SHares: Series M
April 30, 2014 (unaudited) (continued)
| | | | | | | | | | |
Principal
Amount
(000s) | | | | | | | Value | |
| | $ 11,600 | | | 4.875%, 12/15/16 | | | | $ | 12,857,858 | |
| | 40,000 | | | 5.00%, MBS, TBA, 30 Year (e) | | | | | 43,767,040 | |
| | 93 | | | 5.00%, 9/25/14, CMO | | | | | 93,459 | |
| | 32,675 | | | 5.00%, 9/1/17-4/1/42, MBS | | | | | 35,881,286 | |
| | 361 | | | 5.50%, 2/25/24, CMO | | | | | 391,037 | |
| | 209 | | | 6.00%, 8/1/22-12/1/23, MBS | | | | | 226,687 | |
| | 14 | | | 6.50%, 1/1/25-12/1/28, MBS | | | | | 15,485 | |
| | 64 | | | 6.50%, 7/18/27, CMO | | | | | 70,248 | |
| | 130 | | | 7.00%, 11/1/38, MBS | | | | | 147,417 | |
| | 48 | | | 7.01%, 8/1/22, MBS | | | | | 49,400 | |
| | 2 | | | 7.925%, 2/1/25, MBS (j) | | | | | 2,130 | |
| | 40 | | | 11.00%, 7/15/20, MBS | | | | | 41,057 | |
| | | | Freddie Mac, | | | | | | |
| | 74 | | | 0.605%, 8/15/29-12/15/31, CMO (j) | | | | | 74,501 | |
| | 8 | | | 0.655%, 9/15/30, CMO (j) | | | | | 7,990 | |
| | 11 | | | 0.705%, 3/15/32, CMO (j) | | | | | 11,522 | |
| | 241 | | | 0.805%, 3/15/20-2/15/24, CMO (j) | | | | | 249,027 | |
| | 3 | | | 0.855%, 10/15/19, CMO (j) | | | | | 2,992 | |
| | 44 | | | 1.305%, 9/15/22, CMO (j) | | | | | 45,088 | |
| | 12 | | | 1.505%, 8/15/23, CMO (j) | | | | | 12,882 | |
| | 97 | | | 1.955%, 8/1/32, MBS (j) | | | | | 98,475 | |
| | 3,726 | | | 2.041%, 6/1/35, MBS (j) | | | | | 3,967,177 | |
| | 23 | | | 2.25%, 8/1/29, MBS (j) | | | | | 24,418 | |
| | 1,073 | | | 2.267%, 10/1/35, MBS (j) | | | | | 1,150,099 | |
| | 75 | | | 2.315%, 2/1/33, MBS (j) | | | | | 79,924 | |
| | 108 | | | 2.334%, 4/1/32, MBS (j) | | | | | 109,118 | |
| | 140 | | | 2.347%, 2/1/29, MBS (j) | | | | | 150,209 | |
| | 9 | | | 2.348%, 1/1/33, MBS (j) | | | | | 9,684 | |
| | 255 | | | 2.35%, 3/1/32, MBS (j) | | | | | 257,098 | |
| | 338 | | | 2.354%, 5/1/34, MBS (j) | | | | | 361,178 | |
| | 216 | | | 2.375%, 1/1/32-10/1/32, MBS (j) | | | | | 225,794 | |
| | 10 | | | 2.464%, 7/1/29, MBS (j) | | | | | 10,662 | |
| | 63 | | | 2.625%, 10/1/32, MBS (j) | | | | | 63,788 | |
| | 12 | | | 2.643%, 7/1/32, MBS (j) | | | | | 12,544 | |
| | 13 | | | 2.663%, 8/1/32, MBS (j) | | | | | 14,276 | |
| | 7,300 | | | 3.75%, 3/27/19 | | | | | 7,999,048 | |
| | 14 | | | 4.50%, 5/15/18, CMO | | | | | 14,741 | |
| | 6,756 | | | 5.50%, 3/15/34-5/15/36, CMO | | | | | 7,431,684 | |
| | 616 | | | 6.00%, 8/15/16-12/15/28, CMO | | | | | 671,518 | |
| | 280 | | | 6.50%, 8/15/16-7/15/31, CMO | | | | | 312,924 | |
| | 20 | | | 7.00%, 4/1/29-6/1/30, MBS | | | | | 23,536 | |
| | 80 | | | 7.50%, 8/15/30, CMO | | | | | 93,259 | |
| | | | Ginnie Mae, | | | | | | |
| | 19 | | | 0.507%, 6/20/32, CMO (j) | | | | | 19,585 | |
| | 1,963 | | | 1.625%, 3/20/17-6/20/32, MBS (j) | | | | | 2,040,746 | |
| | 155 | | | 2.00%, 5/20/18-9/20/27, MBS (j) | | | | | 162,847 | |
| | 34 | | | 2.125%, 6/20/22, MBS (j) | | | | | 35,777 | |
| | 24 | | | 2.50%, 1/20/18-9/20/21, MBS (j) | | | | | 25,287 | |
| | | | |
| 46 | | Semi-Annual Report | | | April 30, 2014 |
Schedule of Investments
Fixed Income SHares: Series M
April 30, 2014 (unaudited) (continued)
| | | | | | | | | | |
Principal
Amount
(000s) | | | | | | | Value | |
| | $ 74 | | | 3.00%, 4/20/19-8/20/25, MBS (j) | | | | | $ 76,582 | |
| | 3 | | | 4.50%, 8/20/18, MBS (j) | | | | | 2,851 | |
| | 2 | | | 6.50%, 5/15/23-12/15/23, MBS | | | | | 1,960 | |
| | 11,905 | | | SLM Student Loan Trust, 1.739%, 4/25/23, ABS (j) | | | | | 12,323,108 | |
| | 15,127 | | | Small Business Administration Participation Certificates, 5.23%, 3/1/27, ABS | | | | | 16,453,815 | |
| | 808 | | | Vendee Mortgage Trust, 6.50%, 9/15/24, CMO | | | | | 913,011 | |
| | Total U.S. Government Agency Securities (cost-$1,237,567,864) | | | | | 1,252,799,432 | |
| | Corporate Bonds & Notes – 26.6% | | | | | | |
| | | | Banking – 9.6% | | | | | | |
| | 563 | | | Achmea Hypotheekbank NV, 3.20%, 11/3/14 (a)(d) | | | | | 571,296 | |
| | 600 | | | American Express Bank FSB, 6.00%, 9/13/17 | | | | | 689,543 | |
| | 5,000 | | | Banco Santander Chile, 3.875%, 9/20/22 (a)(d) | | | | | 4,937,690 | |
| | 10,000 | | | Banco Santander Mexico S.A. Institucion de Banca Multiple Grupo Financiero Santand, 4.125%, 11/9/22 (a)(d) | | | | | 9,975,000 | |
| | | | Bank of America Corp., | | | | | | |
| | 8,295 | | | 0.566%, 8/15/16 (j) | | | | | 8,221,374 | |
| | 200 | | | 5.00%, 1/15/15 | | | | | 206,041 | |
| | 300 | | | 5.00%, 5/13/21 | | | | | 330,977 | |
| | 400 | | | 5.45%, 7/15/14 | | | | | 403,955 | |
| | 18,600 | | | 5.625%, 7/1/20 | | | | | 21,281,134 | |
| | 20,000 | | | 5.70%, 1/24/22 | | | | | 22,926,280 | |
| | 21,700 | | | 5.75%, 12/1/17 | | | | | 24,573,037 | |
| | 15,680 | | | Bank of Nova Scotia, 1.65%, 10/29/15 (a)(d) | | | | | 15,966,991 | |
| | | | Citigroup, Inc., | | | | | | |
| | 4,700 | | | 1.936%, 5/15/18 (j) | | | | | 4,877,110 | |
| | 1,550 | | | 4.587%, 12/15/15 | | | | | 1,642,495 | |
| | 17,900 | | | 6.125%, 5/15/18 | | | | | 20,631,916 | |
| | 12,700 | | | 6.375%, 8/12/14 | | | | | 12,902,654 | |
| | | | Cooperatieve Centrale Raiffeisen-Boerenleenbank BA (a)(d), | | | | | | |
| | 1,600 | | | 3.20%, 3/11/15 | | | | | 1,638,858 | |
| | 36,900 | | | 4.75%, 1/15/20 | | | | | 40,770,293 | |
| | 6,100 | | | HSBC Holdings PLC, 6.50%, 5/2/36 | | | | | 7,335,555 | |
| | 6,700 | | | ICICI Bank Ltd., 4.75%, 11/25/16 (a)(d) | | | | | 7,086,610 | |
| | | | JPMorgan Chase & Co., | | | | | | |
| | 35,000 | | | 0.854%, 2/26/16 (j) | | | | | 35,199,605 | |
| | 500 | | | 3.15%, 7/5/16 | | | | | 523,098 | |
| | 4,700 | | | JPMorgan Chase Bank N.A., 0.563%, 6/13/16 (j) | | | | | 4,680,166 | |
| | 6,400 | | | Morgan Stanley, 6.00%, 4/28/15 | | | | | 6,735,450 | |
| | 3,500 | | | Regions Financial Corp., 7.75%, 11/10/14 | | | | | 3,631,715 | |
| | 9,663 | | | UBS AG, 4.875%, 8/4/20 | | | | | 10,781,637 | |
| | 3,000 | | | Wachovia Bank N.A., 6.60%, 1/15/38 | | | | | 4,010,844 | |
| | 7,600 | | | Wachovia Corp., 0.503%, 6/15/17 (j) | | | | | 7,580,559 | |
| | | | | | | | | | 280,111,883 | |
| | | | Capital Markets – 1.9% | | | | | | |
| | 55,000 | | | Blackstone CQP Holdco LP, 2.324%, 3/18/19 (a)(b)(d)(i) | | | | | | |
| | | | | (acquisition cost-$55,000,000; purchased 3/18/14) | | | | | 55,222,740 | |
| | | | Commercial Services – 0.2% | | | | | | |
| | 4,700 | | | Stanford University, 4.75%, 5/1/19 | | | | | 5,284,882 | |
| | | | | | |
| April 30, 2014 | | | Semi-Annual Report | | | 47 | |
Schedule of Investments
Fixed Income SHares: Series M
April 30, 2014 (unaudited) (continued)
| | | | | | | | | | |
Principal
Amount
(000s) | | | | | | | Value | |
| | | | Diversified Financial Services – 6.6% | | | | | | |
| | | | Bear Stearns Cos. LLC, | | | | | | |
| | $ 30,600 | | | 6.40%, 10/2/17 | | | | | $ 35,421,152 | |
| | 19,000 | | | 7.25%, 2/1/18 | | | | | 22,614,123 | |
| | 7,000 | | | Corp. Financiera de Desarrollo S.A., 4.75%, 2/8/22 (a)(d) | | | | | 7,157,500 | |
| | | | Ford Motor Credit Co. LLC, | | | | | | |
| | 14,000 | | | 8.00%, 6/1/14 | | | | | 14,076,552 | |
| | 17,700 | | | 8.70%, 10/1/14 | | | | | 18,299,942 | |
| | 5,000 | | | General Electric Capital Corp., 6.15%, 8/7/37 | | | | | 6,169,410 | |
| | | | HSBC Finance Corp., | | | | | | |
| | 8,000 | | | 0.666%, 6/1/16 (j) | | | | | 8,001,192 | |
| | 19,600 | | | 6.676%, 1/15/21 | | | | | 23,210,457 | |
| | 32,250 | | | International Lease Finance Corp., 6.50%, 9/1/14 (a)(d) | | | | | 32,975,625 | |
| | 10,000 | | | OMX Timber Finance Investments I LLC, 5.42%, 1/29/20 (a)(b)(d)(i) | | | | | | |
| | | | | (acquisition cost-$10,780,800; purchased 10/6/10) | | | | | 11,064,000 | |
| | | | SLM Corp., | | | | | | |
| | 3,400 | | | 5.05%, 11/14/14 | | | | | 3,468,000 | |
| | 10,600 | | | 5.375%, 5/15/14 | | | | | 10,615,497 | |
| | | | | | | | | | 193,073,450 | |
| | | | Electric Utilities – 0.1% | | | | | | |
| | 2,600 | | | Electricite de France, 6.50%, 1/26/19 (a)(d) | | | | | 3,097,864 | |
| | | | Healthcare-Services – 0.6% | | | | | | |
| | 5,000 | | | HCA, Inc., 5.875%, 3/15/22 | | | | | 5,375,000 | |
| | 9,298 | | | Roche Holdings, Inc., 6.00%, 3/1/19 (a)(d) | | | | | 10,962,305 | |
| | | | | | | | | | 16,337,305 | |
| | | | Insurance – 1.4% | | | | | | |
| | | | American International Group, Inc., | | | | | | |
| | 10,000 | | | 6.25%, 5/1/36 | | | | | 12,623,190 | |
| | £455 | | | 6.765%, 11/15/17 | | | | | 882,218 | |
| | $7,200 | | | 8.25%, 8/15/18 | | | | | 9,010,951 | |
| | 1,500 | | | Ohio National Financial Services, Inc., 6.375%, 4/30/20 (a)(d) | | | | | 1,740,833 | |
| | 16,400 | | | Stone Street Trust, 5.902%, 12/15/15 (a)(d) | | | | | 17,592,132 | |
| | | | | | | | | | 41,849,324 | |
| | | | Investment Companies – 0.4% | | | | | | |
| | 10,000 | | | Temasek Financial I Ltd., 4.30%, 10/25/19 | | | | | 11,004,240 | |
| | | | Media – 0.4% | | | | | | |
| | 11,250 | | | Clear Channel Worldwide Holdings, Inc., 6.50%, 11/15/22 | | | | | 12,077,500 | |
| | | | Oil & Gas – 1.4% | | | | | | |
| | | | Gaz Capital S.A. for Gazprom, | | | | | | |
| | 4,750 | | | 6.212%, 11/22/16 | | | | | 4,945,938 | |
| | 2,000 | | | 8.125%, 7/31/14 | | | | | 2,022,500 | |
| | 180 | | | Odebrecht Drilling Norbe VIII/IX Ltd., 6.35%, 6/30/21 (a)(d) | | | | | 190,125 | |
| | 15,000 | | | Petrobras International Finance Co., 5.375%, 1/27/21 | | | | | 15,432,090 | |
| | 4,400 | | | Petrohawk Energy Corp., 7.25%, 8/15/18 | | | | | 4,655,574 | |
| | 1,100 | | | Rosneft Finance S.A., 6.25%, 2/2/15 | | | | | 1,119,250 | |
| | 12,300 | | | Southwestern Energy Co., 4.10%, 3/15/22 | | | | | 12,838,924 | |
| | | | | | | | | | 41,204,401 | |
| | | | |
| 48 | | Semi-Annual Report | | | April 30, 2014 |
Schedule of Investments
Fixed Income SHares: Series M
April 30, 2014 (unaudited) (continued)
| | | | | | | | | | |
Principal
Amount
(000s) | | | | | | | Value | |
| | | | Pharmaceuticals – 0.7% | | | | | | |
| | $ 8,000 | | | Novartis Securities Investment Ltd., 5.125%, 2/10/19 | | | | | $ 9,134,696 | |
| | 8,700 | | | Pfizer, Inc., 6.20%, 3/15/19 | | | | | 10,274,222 | |
| | | | | | | | | | 19,408,918 | |
| | | | Real Estate – 0.1% | | | | | | |
| | 2,000 | | | Qatari Diar Finance Co., 5.00%, 7/21/20 | | | | | 2,240,000 | |
| | | | Real Estate Investment Trust – 0.3% | | | | | | |
| | 8,500 | | | Hospitality Properties Trust, 5.00%, 8/15/22 | | | | | 8,947,746 | |
| | | | Retail – 0.7% | | | | | | |
| | 13,653 | | | CVS Pass-Through Trust, 7.507%, 1/10/32 (a)(d) | | | | | 16,928,975 | |
| | 2,349 | | | Macy’s Retail Holdings, Inc., 7.875%, 7/15/15 | | | | | 2,544,963 | |
| | | | | | | | | | 19,473,938 | |
| | | | Telecommunications – 2.1% | | | | | | |
| | 32,100 | | | AT&T, Inc., 5.50%, 2/1/18 | | | | | 36,426,181 | |
| | | | Verizon Communications, Inc., | | | | | | |
| | 5,400 | | | 4.50%, 9/15/20 | | | | | 5,892,226 | |
| | 16,200 | | | 5.15%, 9/15/23 | | | | | 17,884,071 | |
| | | | | | | | | | 60,202,478 | |
| | | | Tobacco – 0.1% | | | | | | |
| | | | Altria Group, Inc., | | | | | | |
| | 1,171 | | | 9.25%, 8/6/19 | | | | | 1,554,417 | |
| | 332 | | | 9.70%, 11/10/18 | | | | | 438,623 | |
| | | | | | | | | | 1,993,040 | |
| | Total Corporate Bonds & Notes (cost-$728,186,333) | | | | | 771,529,709 | |
| | Municipal Bonds – 15.9% | | | | | | |
| | | | California – 5.5% | | | | | | |
| | 11,000 | | | Alameda Cnty. Joint Powers Auth. Rev., 7.046%, 12/1/44, Ser. A | | | | | 13,497,660 | |
| | | | Bay Area Toll Auth. Rev., | | | | | | |
| | 11,000 | | | 6.907%, 10/1/50, Ser. S-3 | | | | | 15,144,030 | |
| | 1,300 | | | 6.918%, 4/1/40, Ser. S-1 | | | | | 1,714,908 | |
| | 14,000 | | | 7.043%, 4/1/50, Ser. S-1 | | | | | 19,405,400 | |
| | 11,200 | | | Irvine Ranch Water Dist., Special Assessment, 6.622%, 5/1/40, Ser. B | | | | | 14,183,232 | |
| | | | Los Angeles Cnty. Metropolitan Transportation Auth. Rev., | | | | | | |
| | 1,850 | | | 4.53%, 6/1/22 | | | | | 2,033,168 | |
| | 600 | | | 5.735%, 6/1/39 | | | | | 705,360 | |
| | | | Los Angeles Department of Water & Power Rev., | | | | | | |
| | 6,400 | | | 6.166%, 7/1/40 | | | | | 7,016,640 | |
| | 12,500 | | | 6.603%, 7/1/50 | | | | | 17,057,750 | |
| | 6,500 | | | Los Angeles Unified School Dist., GO, 5.981%, 5/1/27, Ser. J-05 | | | | | 7,928,505 | |
| | 2,000 | | | Napa Valley Unified School Dist., GO, 6.507%, 8/1/43, Ser. B | | | | | 2,476,940 | |
| | 3,500 | | | Newport Beach, CP, 7.168%, 7/1/40, Ser. B | | | | | 4,130,140 | |
| | 4,200 | | | Palomar Community College Dist., GO, 7.194%, 8/1/45, Ser. B-1 | | | | | 4,721,724 | |
| | 6,500 | | | Pasadena Public Financing Auth. Rev., 7.148%, 3/1/43, Ser. D | | | | | 8,173,295 | |
| | | | Riverside Community College Dist., GO, Ser. D-1, | | | | | | |
| | 1,550 | | | 6.971%, 8/1/35 | | | | | 1,735,179 | |
| | 3,250 | | | 7.021%, 8/1/40 | | | | | 3,646,792 | |
| | 1,000 | | | San Diego Redev. Agcy., Tax Allocation, 7.75%, 9/1/40, Ser. A | | | | | 1,060,110 | |
| | 6,400 | | | San Francisco Public Utilities Commission Water Rev., 5.50%, 11/1/25, Ser. B | | | | | 7,420,800 | |
| | | | | | |
| April 30, 2014 | | | Semi-Annual Report | | | 49 | |
Schedule of Investments
Fixed Income SHares: Series M
April 30, 2014 (unaudited) (continued)
| | | | | | | | | | |
Principal
Amount
(000s) | | | | | | | Value | |
| | | | California (continued) | | | | | | |
| | | | State, GO, | | | | | | |
| | $ 1,200 | | | 7.35%, 11/1/39 | | | | | $ 1,642,440 | |
| | 600 | | | 7.50%, 4/1/34 | | | | | 829,230 | |
| | 10,000 | | | 7.625%, 3/1/40 | | | | | 14,217,400 | |
| | 985 | | | Tobacco Securitization Auth. of Northern California Rev., 5.40%, 6/1/27, Ser. A-2 | | | | | 905,954 | |
| | 1,050 | | | Tobacco Securitization Auth. of Southern California Rev., 5.00%, 6/1/37, Ser. A-1 | | | | | 833,480 | |
| | | | Univ. of California Rev., | | | | | | |
| | 2,750 | | | 6.296%, 5/15/50 | | | | | 3,236,860 | |
| | 5,100 | | | 6.398%, 5/15/31, Ser. H | | | | | 6,059,718 | |
| | | | | | | | | | 159,776,715 | |
| | | | Illinois – 0.1% | | | | | | |
| | 2,200 | | | State Toll Highway Auth. Rev., 6.184%, 1/1/34, Ser. A | | | | | 2,722,280 | |
| | | | Massachusetts – 0.0% | | | | | | |
| | 750 | | | Univ. of Massachusetts Building Auth. Rev., 6.423%, 5/1/29 | | | | | 841,710 | |
| | | | Michigan – 0.0% | | | | | | |
| | 1,250 | | | State Univ. Rev., 6.173%, 2/15/50, Ser. A | | | | | 1,417,712 | |
| | | | New Jersey – 0.7% | | | | | | |
| | 1,335 | | | Economic Dev. Auth. Rev., 6.425%, 12/15/35, Ser. CC-1 | | | | | 1,464,482 | |
| | | | Tobacco Settlement Financing Corp. Rev., Ser. 1-A, | | | | | | |
| | 200 | | | 5.00%, 6/1/29 | | | | | 171,608 | |
| | 21,960 | | | 5.00%, 6/1/41 | | | | | 17,391,441 | |
| | | | | | | | | | 19,027,531 | |
| | | | New York – 4.1% | | | | | | |
| | | | Metropolitan Transportation Auth. Rev., | | | | | | |
| | 2,000 | | | 5.00%, 11/15/27, Ser. D | | | | | 2,229,300 | |
| | 3,500 | | | 5.871%, 11/15/39 | | | | | 4,123,035 | |
| | 12,000 | | | 6.814%, 11/15/40 | | | | | 15,707,760 | |
| | 8,650 | | | New York City, GO, 6.246%, 6/1/35, Ser. H-1 | | | | | 9,658,244 | |
| | | | New York City Transitional Finance Auth. Rev., | | | | | | |
| | 7,330 | | | 4.325%, 11/1/21 | | | | | 7,951,511 | |
| | 16,700 | | | 4.525%, 11/1/22 | | | | | 18,246,420 | |
| | 5,000 | | | 5.267%, 5/1/27, Ser. G-3 | | | | | 5,777,600 | |
| | 12,400 | | | 5.572%, 11/1/38 | | | | | 14,694,992 | |
| | 14,700 | | | 5.932%, 11/1/36 | | | | | 16,002,420 | |
| | | | New York City Water & Sewer System Rev., | | | | | | |
| | 3,000 | | | 6.124%, 6/15/42 | | | | | 3,277,710 | |
| | 5,800 | | | Second Generation Resolutions, 6.282%, 6/15/42 | | | | | 6,441,016 | |
| | 2,500 | | | Port Auth. of New York & New Jersey Rev., 5.859%, 12/1/24, Ser. 158 | | | | | 3,002,625 | |
| | | | State Dormitory Auth. Rev., | | | | | | |
| | 4,000 | | | 5.051%, 9/15/27 | | | | | 4,457,680 | |
| | 400 | | | 5.50%, 3/15/30 | | | | | 464,824 | |
| | 5,200 | | | Triborough Bridge & Tunnel Auth. Rev., 5.55%, 11/15/40, Ser. A-2 | | | | | 5,829,408 | |
| | | | | | | | | | 117,864,545 | |
| | | | Ohio – 1.5% | | | | | | |
| | 10,500 | | | American Municipal Power, Inc. Rev., Comb Hydroelectric Projects,
8.084%, 2/15/50, Ser. B | | | | | 15,501,255 | |
| | | | |
| 50 | | Semi-Annual Report | | | April 30, 2014 |
Schedule of Investments
Fixed Income SHares: Series M
April 30, 2014 (unaudited) (continued)
| | | | | | | | | | |
Principal
Amount
(000s) | | | | | | | Value | |
| | | | Ohio (continued) | | | | | | |
| | | | Buckeye Tobacco Settlement Financing Auth. Rev., Ser. A-2, | | | | | | |
| | $ 21,800 | | | 5.875%, 6/1/47 | | | | | $ 17,689,610 | |
| | 11,825 | | | 6.00%, 6/1/42 | | | | | 9,699,693 | |
| | 500 | | | 6.50%, 6/1/47 | | | | | 440,780 | |
| | 600 | | | Higher Educational Fac. Commission Rev., Cleveland Clinic Health, 5.00%, 1/1/38 | | | | | 647,118 | |
| | | | | | | | | | 43,978,456 | |
| | | | Pennsylvania – 0.3% | | | | | | |
| | 600 | | | Economic Dev. Financing Auth. Rev., 6.532%, 6/15/39, Ser. B | | | | | 671,730 | |
| | 8,500 | | | State Public School Building Auth. Rev., 5.426%, 9/15/26, Ser. B | | | | | 9,462,540 | |
| | | | | | | | | | 10,134,270 | |
| | | | Tennessee – 0.0% | | | | | | |
| | 100 | | | Metropolitan Gov’t of Nashville & Davidson Cnty. Water & Sewer Rev.,
6.568%, 7/1/37, Ser. B | | | | | 124,307 | |
| | | | Texas – 2.5% | | | | | | |
| | 4,600 | | | City Public Service Board of San Antonio Rev., 6.308%, 2/1/37 | | | | | 5,102,596 | |
| | 19,000 | | | Municipal Gas Acquisition & Supply Corp III Rev., 5.00%, 12/15/25 | | | | | 20,529,880 | |
| | 8,600 | | | State, GO, 4.631%, 4/1/33, Ser. A | | | | | 9,428,954 | |
| | 33,600 | | | State Transportation Commission Rev., 5.178%, 4/1/30, Ser. B | | | | | 39,066,048 | |
| | | | | | | | | | 74,127,478 | |
| | | | Washington – 0.3% | | | | | | |
| | 6,800 | | | State Convention Center Public Facs. Dist. Rev., 6.79%, 7/1/40 | | | | | 7,789,400 | |
| | | | West Virginia – 0.9% | | | | | | |
| | 29,815 | | | Tobacco Settlement Finance Auth. Rev., 7.467%, 6/1/47, Ser. A | | | | | 25,335,892 | |
| Total Municipal Bonds (cost-$407,084,416)
| | | | | 463,140,296 | |
| | Mortgage-Backed Securities – 12.3% | | | | | | |
| | | | Adjustable Rate Mortgage Trust, CMO (j), | | | | | | |
| | 416 | | | 2.728%, 11/25/35 | | | | | 357,637 | |
| | 209 | | | 4.901%, 1/25/36 | | | | | 193,600 | |
| | 824 | | | 4.983%, 11/25/35 | | | | | 762,209 | |
| | 1,096 | | | American General Mortgage Loan Trust, 5.15%, 3/25/58, CMO (a)(d)(j) | | | | | 1,107,553 | |
| | | | American Home Mortgage Assets Trust, CMO (j), | | | | | | |
| | 1,252 | | | 0.344%, 9/25/46 | | | | | 911,203 | |
| | 1,025 | | | 0.364%, 10/25/46 | | | | | 665,827 | |
| | 835 | | | 1.054%, 11/25/46 | | | | | 451,853 | |
| | 392 | | | Banc of America Alternative Loan Trust, 16.601%, 9/25/35, CMO (b)(j) | | | | | 485,878 | |
| | | | Banc of America Funding Trust, CMO (j), | | | | | | |
| | 340 | | | 0.347%, 10/20/36 | | | | | 243,349 | |
| | 290 | | | 0.364%, 4/25/37 | | | | | 196,927 | |
| | 251 | | | 0.554%, 5/25/37 | | | | | 176,481 | |
| | 1,315 | | | 2.683%, 2/20/36 | | | | | 1,318,154 | |
| | 483 | | | 2.756%, 9/20/47 | | | | | 368,120 | |
| | 344 | | | 5.436%, 9/20/46 | | | | | 287,568 | |
| | | | Banc of America Mortgage Trust, CMO, | | | | | | |
| | 3 | | | 2.689%, 2/25/33 (j) | | | | | 2,475 | |
| | 1,389 | | | 5.50%, 9/25/35 | | | | | 1,343,231 | |
| | | | BCAP LLC Trust, CMO (j), | | | | | | |
| | 200 | | | 0.312%, 3/26/37 (a)(d) | | | | | 194,477 | |
| | | | | | |
| April 30, 2014 | | | Semi-Annual Report | | | 51 | |
Schedule of Investments
Fixed Income SHares: Series M
April 30, 2014 (unaudited) (continued)
| | | | | | | | | | |
Principal
Amount
(000s) | | | | | | | Value | |
| | $ 536 | | | 0.352%, 7/26/36 (a)(d) | | | | | $ 512,917 | |
| | 1,218 | | | 0.374%, 5/25/47 | | | | | 914,961 | |
| | 251 | | | 0.404%, 7/26/35 (a)(b)(d)(i) | | | | | | |
| | | | | (acquisition cost-$247,871; purchased 3/31/14) | | | | | 247,026 | |
| | 188 | | | 0.654%, 5/26/35 (a)(d) | | | | | 173,723 | |
| | 357 | | | 0.672%, 11/26/35 (a)(d) | | | | | 351,291 | |
| | 271 | | | 0.894%, 1/26/36 (a)(d) | | | | | 268,077 | |
| | 437 | | | 0.973%, 11/26/46 (a)(d) | | | | | 422,235 | |
| | 394 | | | 1.581%, 10/26/35 (a)(b)(d)(i) | | | | | | |
| | | | | (acquisition cost-$395,942; purchased 3/31/14) | | | | | 396,792 | |
| | 984 | | | 2.229%, 7/26/36 (a)(d) | | | | | 988,149 | |
| | 146 | | | 2.391%, 1/26/34 (a)(d) | | | | | 145,595 | |
| | 303 | | | 2.61%, 2/26/35 (a)(d) | | | | | 302,602 | |
| | 601 | | | 2.618%, 6/26/35 (a)(b)(d)(i) | | | | | | |
| | | | | (acquisition cost-$615,250; purchased 3/31/14) | | | | | 614,411 | |
| | 621 | | | 2.653%, 7/26/36 (a)(d) | | | | | 518,079 | |
| | 342 | | | 2.932%, 3/26/37 (a)(b)(d)(i) | | | | | | |
| | | | | (acquisition cost-$266,987; purchased 4/10/14) | | | | | 268,550 | |
| | 433 | | | 4.00%, 2/26/37 (a)(d)(f) | | | | | 416,793 | |
| | 87 | | | 5.142%, 7/26/36 (a)(d) | | | | | 68,306 | |
| | 446 | | | 13.815%, 10/26/36 (a)(b)(d)(i) | | | | | | |
| | | | | (acquisition cost-$419,325; purchased 3/27/14) | | | | | 429,141 | |
| | 4,114 | | | BCRR Trust, 5.819%, 8/17/45, CMO (a)(d)(j) | | | | | 4,491,284 | |
| | | | Bear Stearns Adjustable Rate Mortgage Trust, CMO (j), | | | | | | |
| | 2,028 | | | 2.43%, 10/25/35 | | | | | 1,997,856 | |
| | 314 | | | 2.43%, 2/25/36 | | | | | 225,523 | |
| | 2,470 | | | 2.484%, 12/25/46 | | | | | 2,055,739 | |
| | 2,873 | | | 2.533%, 3/25/35 | | | | | 2,918,880 | |
| | 353 | | | 2.654%, 10/25/35 | | | | | 349,332 | |
| | 177 | | | 2.686%, 2/25/34 | | | | | 177,023 | |
| | 45 | | | 2.687%, 1/25/35 | | | | | 45,832 | |
| | 177 | | | 2.781%, 1/25/34 | | | | | 178,342 | |
| | 661 | | | 2.976%, 5/25/47 | | | | | 558,535 | |
| | 208 | | | 5.165%, 8/25/35 | | | | | 183,825 | |
| | | | Bear Stearns ALT-A Trust, CMO (j), | | | | | | |
| | 776 | | | 2.46%, 2/25/36 | | | | | 532,627 | |
| | 438 | | | 2.486%, 8/25/36 | | | | | 188,985 | |
| | 4,866 | | | 2.532%, 6/25/34 | | | | | 3,669,523 | |
| | 153 | | | 2.674%, 5/25/35 | | | | | 149,611 | |
| | 258 | | | 4.413%, 11/25/36 | | | | | 200,835 | |
| | 1,286 | | | 4.855%, 7/25/35 | | | | | 1,072,420 | |
| | 1,226 | | | 5.178%, 5/25/36 | | | | | 974,450 | |
| | 14 | | | Bear Stearns Mortgage Securities, Inc., 6.374%, 3/25/31, CMO (j) | | | | | 14,833 | |
| | 1,906 | | | Bear Stearns Structured Products, Inc. Trust, 1.885%, 1/26/36, CMO (j) | | | | | 1,538,801 | |
| | | | Chase Mortgage Finance Trust, CMO, | | | | | | |
| | 1,442 | | | 5.639%, 9/25/36 (j) | | | | | 1,320,853 | |
| | 258 | | | 6.00%, 5/25/37 | | | | | 237,681 | |
| | | | |
| 52 | | Semi-Annual Report | | | April 30, 2014 |
Schedule of Investments
Fixed Income SHares: Series M
April 30, 2014 (unaudited) (continued)
| | | | | | | | | | |
Principal
Amount
(000s) | | | | | | | Value | |
| | | | ChaseFlex Trust, CMO, | | | | | | |
| | $ 78 | | | 4.894%, 8/25/37 | | | | | $ 62,485 | |
| | 268 | | | 5.00%, 7/25/37 | | | | | 233,357 | |
| | | | Citigroup Commercial Mortgage Trust, CMO (a)(d)(j), | | | | | | |
| | 9,862 | | | 5.322%, 12/17/49 | | | | | 10,870,523 | |
| | 14,397 | | | 5.858%, 7/17/40 | | | | | 15,522,685 | |
| | | | Citigroup Mortgage Loan Trust, Inc., CMO (j), | | | | | | |
| | 300 | | | 0.318%, 10/25/46 (a)(b)(d)(i) | | | | | | |
| | | | | (acquisition cost-$281,813; purchased 11/21/13) | | | | | 281,242 | |
| | 523 | | | 2.299%, 10/25/46 | | | | | 415,243 | |
| | 557 | | | 2.51%, 10/25/35 | | | | | 552,652 | |
| | 248 | | | 2.582%, 12/25/35 | | | | | 172,919 | |
| | 107 | | | 2.605%, 8/25/35 | | | | | 106,450 | |
| | 245 | | | 2.757%, 3/25/37 | | | | | 192,343 | |
| | 1,462 | | | 2.895%, 9/25/37 | | | | | 1,226,503 | |
| | 185 | | | 6.579%, 11/25/37 (a)(d) | | | | | 157,292 | |
| | 200 | | | 8.075%, 9/25/37 (a)(b)(d)(i) | | | | | | |
| | | | | (acquisition cost-$188,500; purchased 4/29/14) | | | | | 189,167 | |
| | 15,034 | | | Commercial Mortgage Trust, 3.156%, 7/10/46, CMO (a)(d) | | | | | 15,401,849 | |
| | 469 | | | Community Program Loan Trust, 4.50%, 4/1/29, CMO | | | | | 474,739 | |
| | | | Countrywide Alternative Loan Trust, CMO, | | | | | | |
| | 1,759 | | | 0.294%, 8/25/37 (j) | | | | | 1,325,358 | |
| | 333 | | | 0.314%, 12/25/46 (j) | | | | | 310,571 | |
| | 2,579 | | | 0.324%, 11/25/36 (j) | | | | | 2,221,744 | |
| | 523 | | | 0.324%, 1/25/37 (j) | | | | | 435,207 | |
| | 2,752 | | | 0.334%, 5/25/47 (j) | | | | | 2,309,292 | |
| | 3,021 | | | 0.337%, 2/20/47 (j) | | | | | 2,269,033 | |
| | 473 | | | 0.344%, 7/25/46 (j) | | | | | 385,860 | |
| | 1,135 | | | 0.344%, 9/25/46 (j) | | | | | 911,962 | |
| | 549 | | | 0.344%, 10/25/46 (j) | | | | | 525,405 | |
| | 103 | | | 0.367%, 7/20/46 (j) | | | | | 63,022 | |
| | 4,322 | | | 0.374%, 5/25/35 (j) | | | | | 3,662,055 | |
| | 2,140 | | | 0.414%, 12/25/35 (j) | | | | | 1,895,946 | |
| | 102 | | | 0.424%, 5/25/36 (j) | | | | | 57,693 | |
| | 454 | | | 0.464%, 8/25/35 (j) | | | | | 348,787 | |
| | 289 | | | 0.464%, 10/25/35 (j) | | | | | 232,848 | |
| | 952 | | | 1.129%, 2/25/36 (j) | | | | | 843,420 | |
| | 353 | | | 2.557%, 3/25/47 (j) | | | | | 322,243 | |
| | 580 | | | 2.625%, 8/25/35 (j) | | | | | 492,401 | |
| | 443 | | | 4.749%, 6/25/47 (j) | | | | | 369,897 | |
| | 240 | | | 5.345%, 11/25/35 (j) | | | | | 196,646 | |
| | 232 | | | 5.50%, 11/25/35 | | | | | 192,645 | |
| | 195 | | | 5.50%, 2/25/36 | | | | | 172,131 | |
| | 282 | | | 5.75%, 4/25/47 | | | | | 228,815 | |
| | 203 | | | 6.00%, 12/25/34 | | | | | 201,762 | |
| | 482 | | | 6.00%, 3/25/36 | | | | | 401,052 | |
| | 187 | | | 6.00%, 8/25/36 (j) | | | | | 168,017 | |
| | 986 | | | 6.00%, 2/25/37 | | | | | 780,436 | |
| | | | | | |
| April 30, 2014 | | | Semi-Annual Report | | | 53 | |
Schedule of Investments
Fixed Income SHares: Series M
April 30, 2014 (unaudited) (continued)
| | | | | | | | | | |
Principal
Amount
(000s) | | | | | | | Value | |
| | $ 198 | | | 6.00%, 4/25/37 | | | | | $ 168,587 | |
| | 870 | | | 6.00%, 5/25/37 | | | | | 707,533 | |
| | 286 | | | 6.00%, 8/25/37 | | | | | 229,501 | |
| | 919 | | | 6.00%, 8/25/37 (j) | | | | | 766,804 | |
| | 210 | | | 6.25%, 11/25/36 | | | | | 192,511 | |
| | 134 | | | 6.50%, 12/25/36 | �� | | | | 107,540 | |
| | 624 | | | 6.50%, 8/25/37 | | | | | 453,658 | |
| | 128 | | | 19.376%, 7/25/35 (b)(j) | | | | | 172,194 | |
| | | | Countrywide Home Loan Mortgage Pass-Through Trust, CMO, | | | | | | |
| | 180 | | | 0.384%, 5/25/35 (j) | | | | | 154,714 | |
| | 175 | | | 0.454%, 4/25/46 (j) | | | | | 83,725 | |
| | 1,359 | | | 0.474%, 3/25/35 (j) | | | | | 1,210,300 | |
| | 889 | | | 0.494%, 3/25/36 (j) | | | | | 493,345 | |
| | 848 | | | 0.524%, 2/25/35 (j) | | | | | 732,274 | |
| | 719 | | | 0.544%, 2/25/35 (j) | | | | | 541,789 | |
| | 42 | | | 0.694%, 2/25/35 (j) | | | | | 39,857 | |
| | 876 | | | 0.774%, 3/25/35 (j) | | | | | 776,823 | |
| | 121 | | | 2.417%, 2/20/36 (j) | | | | | 113,959 | |
| | 318 | | | 2.556%, 4/25/35 (j) | | | | | 89,651 | |
| | 360 | | | 2.576%, 5/20/36 (j) | | | | | 289,999 | |
| | 250 | | | 5.05%, 10/20/35 (j) | | | | | 210,225 | |
| | 371 | | | 5.123%, 1/25/36 (j) | | | | | 340,064 | |
| | 977 | | | 5.50%, 7/25/37 | | | | | 876,009 | |
| | 1,094 | | | 6.00%, 2/25/37 | | | | | 1,025,790 | |
| | 660 | | | 6.00%, 7/25/37 | | | | | 565,271 | |
| | 2,440 | | | 6.50%, 11/25/36 | | | | | 2,245,176 | |
| | | | Credit Suisse First Boston Mortgage Securities Corp., CMO (j), | | | | | | |
| | 11 | | | 0.804%, 3/25/32 (a)(d) | | | | | 10,051 | |
| | 223 | | | 1.304%, 9/25/34 | | | | | 186,263 | |
| | | | Credit Suisse Mortgage Capital Certificates, CMO (j), | | | | | | |
| | 100 | | | 0.394%, 5/27/37 (a)(b)(d)(i) | | | | | | |
| | | | | (acquisition cost-$81,750; purchased 4/1/14) | | | | | 83,259 | |
| | 1,900 | | | 2.346%, 4/26/38 (a)(d) | | | | | 1,858,629 | |
| | 327 | | | 2.659%, 9/27/36 (a)(d) | | | | | 331,740 | |
| | 190 | | | 2.69%, 8/28/36 (a)(d) | | | | | 183,838 | |
| | 589 | | | 4.853%, 4/28/37 (a)(d) | | | | | 376,739 | |
| | 27,960 | | | 5.971%, 9/15/39 | | | | | 30,630,488 | |
| | | | Deutsche ALT-A Securities Mortgage Loan Trust, CMO (j), | | | | | | |
| | 224 | | | 0.314%, 1/25/47 | | | | | 161,401 | |
| | 963 | | | 0.344%, 8/25/47 | | | | | 805,005 | |
| | 774 | | | Deutsche ALT-A Securities, Inc., 0.454%, 4/25/37, CMO (j) | | | | | 438,492 | |
| | 166 | | | Downey Savings & Loan Assoc. Mortgage Loan Trust, 0.476%, 7/19/45, CMO (j) | | | | | 30,180 | |
| | 401 | | | First Horizon Alternative Mortgage Securities Trust, 2.21%, 4/25/36, CMO (j) | | | | | 335,643 | |
| | 1,137 | | | First Horizon Mortgage Pass-Through Trust, 6.25%, 11/25/36, CMO | | | | | 1,166,745 | |
| | 325 | | | GMAC Mortgage Loan Trust, 2.965%, 11/19/35, CMO (j) | | | | | 292,243 | |
| | 3,606 | | | Granite Master Issuer PLC, 0.337%, 12/20/54, CMO (j) | | | | | 3,575,519 | |
| | | | Greenpoint Mortgage Funding Trust, CMO (j), | | | | | | |
| | – | * | | 0.234%, 10/25/46 | | | | | 1 | |
| | 395 | | | 0.354%, 12/25/46 | | | | | 207,166 | |
| | | | |
| 54 | | Semi-Annual Report | | | April 30, 2014 |
Schedule of Investments
Fixed Income SHares: Series M
April 30, 2014 (unaudited) (continued)
| | | | | | | | | | |
Principal
Amount
(000s) | | | | | | | Value | |
| | $ 356 | | | GSC Capital Corp. Mortgage Trust, 0.334%, 5/25/36, CMO (j) | | | | | $ 255,907 | |
| | | | GSR Mortgage Loan Trust, CMO (j), | | | | | | |
| | 962 | | | 2.651%, 9/25/35 | | | | | 974,977 | |
| | 218 | | | 2.661%, 9/25/34 | | | | | 205,716 | |
| | 144 | | | 2.666%, 4/25/35 | | | | | 139,462 | |
| | | | Harborview Mortgage Loan Trust, CMO (j), | | | | | | |
| | 83 | | | 0.346%, 1/19/38 | | | | | 70,437 | |
| | 240 | | | 0.406%, 1/19/36 | | | | | 165,821 | |
| | 213 | | | 0.406%, 1/19/38 | | | | | 65,559 | |
| | 78 | | | 0.406%, 9/19/46 | | | | | 9,831 | |
| | 281 | | | 2.717%, 12/19/35 | | | | | 252,642 | |
| | 257 | | | HomeBanc Mortgage Trust, 0.334%, 12/25/36, CMO (j) | | | | | 223,658 | |
| | | | Impac Secured Assets Trust, CMO (j), | | | | | | |
| | 2,320 | | | 0.304%, 11/25/36 | | | | | 1,560,450 | |
| | 606 | | | 0.324%, 1/25/37 | | | | | 496,180 | |
| | 659 | | | IndyMac IMSC Mortgage Loan Trust, 0.334%, 7/25/47, CMO (j) | | | | | 481,169 | |
| | 377 | | | IndyMac INDB Mortgage Loan Trust, 0.454%, 11/25/35, CMO (j) | | | | | 229,100 | |
| | | | IndyMac Index Mortgage Loan Trust, CMO (j), | | | | | | |
| | 131 | | | 0.344%, 9/25/46 | | | | | 112,538 | |
| | 617 | | | 0.434%, 3/25/35 | | | | | 572,944 | |
| | 205 | | | 2.163%, 6/25/37 | | | | | 156,818 | |
| | 195 | | | 2.644%, 6/25/35 | | | | | 164,078 | |
| | 3,436 | | | 4.532%, 6/25/36 | | | | | 3,325,504 | |
| | 1,006 | | | 4.608%, 9/25/35 | | | | | 243,428 | |
| | 2,178 | | | 4.631%, 8/25/35 | | | | | 1,830,706 | |
| | 364 | | | 4.668%, 11/25/35 | | | | | 302,385 | |
| | 1,940 | | | 4.80%, 10/25/35 | | | | | 1,680,051 | |
| | | | JPMorgan Alternative Loan Trust, CMO (j), | | | | | | |
| | 8,900 | | | 0.654%, 6/27/37 (a)(d) | | | | | 7,518,995 | |
| | 121 | | | 3.251%, 12/25/36 | | | | | 108,394 | |
| | | | JPMorgan Chase Commercial Mortgage Securities Trust, CMO, | | | | | | |
| | 21,447 | | | 2.749%, 11/15/43 (a)(d) | | | | | 22,046,861 | |
| | 20,000 | | | 3.341%, 7/15/46 (a)(d) | | | | | 20,881,500 | |
| | 22,900 | | | 4.106%, 7/15/46 (a)(d) | | | | | 24,748,625 | |
| | 600 | | | 5.336%, 5/15/47 | | | | | 654,862 | |
| | | | JPMorgan Mortgage Trust, CMO (j), | | | | | | |
| | 58 | | | 2.566%, 1/25/37 | | | | | 50,785 | |
| | 1,344 | | | 2.663%, 7/25/35 | | | | | 1,368,971 | |
| | 854 | | | 2.834%, 9/25/34 | | | | | 863,095 | |
| | 118 | | | 3.115%, 4/25/35 | | | | | 120,442 | |
| | 219 | | | 5.081%, 11/25/35 | | | | | 211,860 | |
| | 451 | | | 5.113%, 6/25/37 | | | | | 410,719 | |
| | 332 | | | Lavendar Trust, 6.25%, 10/26/36, CMO (a)(d) | | | | | 243,484 | |
| | | | Lehman Mortgage Trust, CMO, | | | | | | |
| | 147 | | | 5.50%, 11/25/35 | | | | | 140,441 | |
| | 482 | | | 5.572%, 1/25/36 (j) | | | | | 445,424 | |
| | 589 | | | 5.764%, 12/25/35 (j) | | | | | 530,630 | |
| | | | | | |
| April 30, 2014 | | | Semi-Annual Report | | | 55 | |
Schedule of Investments
Fixed Income SHares: Series M
April 30, 2014 (unaudited) (continued)
| | | | | | | | | | |
Principal
Amount
(000s) | | | | | | | Value | |
| | | | Lehman XS Trust, CMO (j), | | | | | | |
| | $ 165 | | | 0.354%, 8/25/46 | | | | | $ 125,896 | |
| | 18 | | | 0.384%, 8/25/46 | | | | | 679 | |
| | 173 | | | 0.394%, 11/25/46 | | | | | 26,461 | |
| | | | Luminent Mortgage Trust, CMO (j), | | | | | | |
| | 1,413 | | | 0.324%, 12/25/36 | | | | | 1,097,081 | |
| | 478 | | | 0.354%, 10/25/46 | | | | | 421,949 | |
| | 234 | | | MASTR Adjustable Rate Mortgages Trust, 0.394%, 5/25/37, CMO (j) | | | | | 157,161 | |
| | | | MASTR Reperforming Loan Trust, CMO (a)(d), | | | | | | |
| | 1,829 | | | 7.00%, 5/25/35 | | | | | 1,736,468 | |
| | 1,670 | | | 8.00%, 7/25/35 | | | | | 1,730,516 | |
| | 96 | | | Mellon Residential Funding Corp., 2.609%, 10/20/29, CMO (j) | | | | | 97,838 | |
| | 854 | | | Merrill Lynch Alternative Note Asset Trust, 0.454%, 3/25/37, CMO (j) | | | | | 372,224 | |
| | | | Merrill Lynch Mortgage Investors Trust, CMO (j), | | | | | | |
| | 184 | | | 1.349%, 7/25/29 | | | | | 175,864 | |
| | 721 | | | 1.596%, 10/25/35 | | | | | 708,672 | |
| | 2,000 | | | Merrill Lynch/Countrywide Commercial Mortgage Trust, 5.894%, 8/12/49, CMO (j) | | | | | 2,233,926 | |
| | | | Morgan Stanley Capital I Trust, CMO, | | | | | | |
| | 37,225 | | | 5.332%, 12/15/43 | | | | | 40,329,063 | |
| | 1,100 | | | 5.692%, 4/15/49 (j) | | | | | 1,216,826 | |
| | 216 | | | Morgan Stanley Dean Witter Capital I, Inc. Trust, 1.686%, 3/25/33, CMO (j) | | | | | 207,027 | |
| | | | Morgan Stanley Mortgage Loan Trust, CMO, | | | | | | |
| | 289 | | | 2.118%, 6/25/36 (j) | | | | | 281,110 | |
| | 147 | | | 6.00%, 10/25/37 | | | | | 120,613 | |
| | | | Morgan Stanley Re-Remic Trust, CMO (a)(d), | | | | | | |
| | 418 | | | 0.451%, 2/26/37 (b)(i)(j) | | | | | | |
| | | | | (acquisition cost-$265,750; purchased 4/16/14) | | | | | 269,224 | |
| | 575 | | | 0.461%, 1/26/51 (b)(i)(j) | | | | | | |
| | | | | (acquisition cost-$540,643; purchased 4/30/14) | | | | | 547,571 | |
| | 152 | | | 5.50%, 8/26/47 | | | | | 159,111 | |
| | 3,158 | | | NCUA Guaranteed Notes Trust, 0.606%, 10/7/20, CMO (j) | | | | | 3,178,759 | |
| | 888 | | | Nomura Asset Acceptance Corp., 7.50%, 3/25/34, CMO (a)(d) | | | | | 960,944 | |
| | 1,197 | | | Nomura Asset Acceptance Corp. Alternative Loan Trust, 5.203%, 2/25/36, CMO (j) | | | | | 1,005,950 | |
| | 4 | | | Opteum Mortgage Acceptance Corp. Pass-Through Certificates,
0.414%, 7/25/35, CMO (j) | | | | | 4,223 | |
| | | | Residential Accredit Loans, Inc., CMO (j), | | | | | | |
| | 753 | | | 0.324%, 12/25/36 | | | | | 571,924 | |
| | 302 | | | 0.354%, 5/25/47 | | | | | 248,612 | |
| | 236 | | | 0.364%, 6/25/37 | | | | | 175,770 | |
| | 792 | | | 0.404%, 8/25/37 | | | | | 579,881 | |
| | 336 | | | 0.454%, 8/25/35 | | | | | 266,252 | |
| | 261 | | | 0.554%, 10/25/45 | | | | | 191,036 | |
| | 771 | | | 3.252%, 2/25/35 | | | | | 624,095 | |
| | 228 | | | 3.55%, 2/25/36 | | | | | 164,256 | |
| | 335 | | | 8.00%, 4/25/36 | | | | | 303,540 | |
| | | | Residential Asset Securitization Trust, CMO, | | | | | | |
| | 200 | | | 6.00%, 11/25/36 | | | | | 152,142 | |
| | 196 | | | 6.00%, 3/25/37 | | | | | 156,414 | |
| | 137 | | | 6.25%, 11/25/36 | | | | | 105,867 | |
| | | | |
| 56 | | Semi-Annual Report | | | April 30, 2014 |
Schedule of Investments
Fixed Income SHares: Series M
April 30, 2014 (unaudited) (continued)
| | | | | | | | | | |
Principal
Amount
(000s) | | | | | | | Value | |
| | | | Residential Funding Mortgage Securities I, CMO, | | | | | | |
| | $ 2,121 | | | 3.378%, 3/25/35 (j) | | | | | $ 1,755,423 | |
| | 613 | | | 6.00%, 9/25/36 | | | | | 566,174 | |
| | | | Structured Adjustable Rate Mortgage Loan Trust, CMO (j), | | | | | | |
| | 941 | | | 0.889%, 6/25/34 | | | | | 884,617 | |
| | 997 | | | 1.526%, 5/25/35 | | | | | 717,520 | |
| | 253 | | | 2.376%, 12/25/35 | | | | | 240,138 | |
| | 339 | | | 2.477%, 10/25/36 | | | | | 257,002 | |
| | 131 | | | 2.481%, 10/25/34 | | | | | 130,641 | |
| | 11 | | | 2.496%, 1/25/36 | | | | | 10,555 | |
| | 6,331 | | | 2.693%, 9/25/36 | | | | | 4,017,974 | |
| | 13 | | | 4.512%, 7/25/37 | | | | | 10,035 | |
| | | | Structured Asset Mortgage Investments II Trust, CMO (j), | | | | | | |
| | 339 | | | 0.284%, 3/25/37 | | | | | 260,982 | |
| | 526 | | | 0.344%, 6/25/36 | | | | | 425,815 | |
| | 1,052 | | | 0.344%, 7/25/46 | | | | | 857,384 | |
| | 1,648 | | | 0.354%, 5/25/36 | | | | | 1,236,985 | |
| | 2,400 | | | 0.364%, 9/25/47 | | | | | 1,580,633 | |
| | 1,358 | | | 0.374%, 5/25/46 | | | | | 794,943 | |
| | 149 | | | 0.414%, 5/25/46 | | | | | 30,383 | |
| | 882 | | | 0.856%, 3/19/34 | | | | | 817,170 | |
| | 1,170 | | | 1.614%, 2/25/36 | | | | | 997,187 | |
| | 867 | | | Structured Asset Mortgage Investments Trust, 0.896%, 12/19/33, CMO (j) | | | | | 834,790 | |
| | 112 | | | Structured Asset Securities Corp. Mortgage Loan Trust, 0.504%, 2/25/35, CMO (j) | | | | | 105,648 | |
| | | | Structured Asset Securities Corp. Mortgage Pass-Through Certificates, CMO (j), | | | | | | |
| | 3 | | | 1.829%, 5/25/32 | | | | | 3,051 | |
| | 5 | | | 2.227%, 1/25/32 | | | | | 5,080 | |
| | 202 | | | 2.382%, 2/25/34 | | | | | 199,286 | |
| | 2 | | | 2.516%, 2/25/32 | | | | | 2,264 | |
| | 760 | | | Suntrust Adjustable Rate Mortgage Loan Trust, 6.004%, 2/25/37, CMO (j) | | | | | 652,737 | |
| | 225 | | | Wachovia Mortgage Loan Trust LLC, 5.413%, 10/20/35, CMO (j) | | | | | 222,701 | |
| | | | WaMu Mortgage Pass-Through Certificates, CMO (j), | | | | | | |
| | 18 | | | 0.424%, 12/25/45 | | | | | 17,193 | |
| | 572 | | | 0.474%, 1/25/45 | | | | | 527,450 | |
| | 474 | | | 0.558%, 11/25/34 | | | | | 449,458 | |
| | 448 | | | 0.564%, 11/25/45 | | | | | 392,824 | |
| | 2,473 | | | 0.578%, 10/25/44 | | | | | 2,371,728 | |
| | 1,305 | | | 0.678%, 11/25/34 | | | | | 1,201,410 | |
| | 355 | | | 0.879%, 6/25/47 | | | | | 130,103 | |
| | 53 | | | 1.331%, 11/25/42 | | | | | 51,833 | |
| | 439 | | | 2.284%, 11/25/46 | | | | | 428,116 | |
| | 919 | | | 2.41%, 8/25/33 | | | | | 934,686 | |
| | 315 | | | 2.414%, 8/25/36 | | | | | 276,543 | |
| | 365 | | | 4.157%, 12/25/36 | | | | | 333,000 | |
| | | | Washington Mutual Mortgage Pass-Through Certificates, | | | | | | |
| | 726 | | | 0.829%, 4/25/47, CMO (j) | | | | | 586,193 | |
| | 1,061 | | | 0.899%, 4/25/47, CMO (j) | | | | | 859,251 | |
| | 228 | | | 4.925%, 9/25/36, CMO | | | | | 137,690 | |
| | | | | | |
| April 30, 2014 | | | Semi-Annual Report | | | 57 | |
Schedule of Investments
Fixed Income SHares: Series M
April 30, 2014 (unaudited) (continued)
| | | | | | | | | | |
Principal
Amount
(000s) | | | | | | | Value | |
| | $ 962 | | | Washington Mutual Mortgage Pass-Through Certificates Trust, 0.604%, 5/25/35, CMO (j) | | | | | $ 789,297 | |
| | 174 | | | Wells Fargo Alternative Loan Trust, 2.673%, 7/25/37, CMO (j) | | | | | 146,880 | |
| | | | Wells Fargo Mortgage-Backed Securities Trust, CMO, | | | | | | |
| | 385 | | | 0.654%, 7/25/37 (j) | | | | | 325,744 | �� |
| | 2,311 | | | 2.614%, 3/25/36 (j) | | | | | 2,320,933 | |
| | 421 | | | 2.615%, 8/25/34 (j) | | | | | 431,347 | |
| | 1,176 | | | 2.615%, 1/25/35 (j) | | | | | 1,196,547 | |
| | 6,893 | | | 2.615%, 6/25/35 (j) | | | | | 6,942,174 | |
| | 3,441 | | | 2.616%, 3/25/35 (j) | | | | | 3,444,014 | |
| | 312 | | | 2.628%, 3/25/36 (j) | | | | | 296,946 | |
| | 484 | | | 6.00%, 6/25/37 | | | | | 469,394 | |
| | Total Mortgage-Backed Securities (cost-$343,522,483) | | | | | 356,879,644 | |
| | Sovereign Debt Obligations – 4.1% | | | | | | |
| | | | Brazil – 0.1% | | | | | | |
| | 1,400 | | | Brazilian Development Bank, 3.375%, 9/26/16 (a)(d) | | | | | 1,429,750 | |
| | | | Canada – 1.6% | | | | | | |
| | CAD 53,300 | | | Province of Ontario Canada, 2.85%, 6/2/23 | | | | | 47,668,534 | |
| | | | China – 0.3% | | | | | | |
| | | | Export-Import Bank of China, | | | | | | |
| | $4,050 | | | 4.875%, 7/21/15 (a)(d) | | | | | 4,236,535 | |
| | 3,350 | | | 4.875%, 7/21/15 | | | | | 3,504,130 | |
| | | | | | | | | | 7,740,665 | |
| | | | Korea (Republic of) – 0.8% | | | | | | |
| | 21,900 | | | Export-Import Bank of Korea, 5.125%, 6/29/20 | | | | | 24,573,311 | |
| | | | Qatar – 1.0% | | | | | | |
| | | | Qatar Government International Bond, | | | | | | |
| | 3,900 | | | 4.00%, 1/20/15 (a)(d) | | | | | 4,000,230 | |
| | 10,200 | | | 5.25%, 1/20/20 (a)(d) | | | | | 11,641,260 | |
| | 2,300 | | | 6.40%, 1/20/40 (a)(d) | | | | | 2,762,760 | |
| | 9,500 | | | 6.55%, 4/9/19 | | | | | 11,483,125 | |
| | | | | | | | | | 29,887,375 | |
| | | | Venezuela – 0.3% | | | | | | |
| | 10,000 | | | Venezuela Government International Bond, 9.25%, 5/7/28 | | | | | 8,000,000 | |
| | Total Sovereign Debt Obligations (cost-$119,513,867) | | | | | 119,299,635 | |
| | Asset-Backed Securities – 4.1% | | | | | | |
| | | | Aames Mortgage Investment Trust (j), | | | | | | |
| | 200 | | | 0.934%, 10/25/35 | | | | | 155,636 | |
| | 700 | | | 1.354%, 6/25/35 | | | | | 534,934 | |
| | | | ABFC Trust (j), | | | | | | |
| | 319 | | | 0.264%, 1/25/37 | | | | | 194,122 | |
| | 266 | | | 0.374%, 1/25/37 | | | | | 164,046 | |
| | 359 | | | 1.154%, 6/25/37 | | | | | 246,392 | |
| | 199 | | | Access Group, Inc., 1.539%, 10/27/25 (j) | | | | | 200,949 | |
| | | | Accredited Mortgage Loan Trust (j), | | | | | | |
| | 700 | | | 0.414%, 9/25/36 | | | | | 527,698 | |
| | 200 | | | 0.63%, 9/25/35 | | | | | 147,597 | |
| | | | |
| 58 | | Semi-Annual Report | | | April 30, 2014 |
Schedule of Investments
Fixed Income SHares: Series M
April 30, 2014 (unaudited) (continued)
| | | | | | | | | | |
Principal
Amount
(000s) | | | | | | | Value | |
| | | | ACE Securities Corp. Home Equity Loan Trust (j), | | | | | | |
| | $ 422 | | | 0.262%, 12/25/36 | | | | | $ 182,022 | |
| | 607 | | | 0.294%, 7/25/36 | | | | | 438,017 | |
| | 181 | | | 0.314%, 5/25/36 | | | | | 152,938 | |
| | 200 | | | 0.454%, 2/25/36 | | | | | 155,146 | |
| | 200 | | | 0.594%, 11/25/35 | | | | | 159,412 | |
| | 1,300 | | | 0.624%, 10/25/35 | | | | | 1,097,271 | |
| | 100 | | | 0.804%, 7/25/35 | | | | | 84,206 | |
| | | | Aegis Asset-Backed Securities Trust (j), | | | | | | |
| | 200 | | | 0.584%, 12/25/35 | | | | | 132,549 | |
| | 200 | | | 0.634%, 6/25/35 | | | | | 131,345 | |
| | 300 | | | 1.204%, 3/25/35 | | | | | 228,105 | |
| | 200 | | | 1.654%, 3/25/35 | | | | | 175,922 | |
| | 400 | | | Ameriquest Mortgage Securities Trust, 0.544%, 3/25/36 (j) | | | | | 333,385 | |
| | | | Ameriquest Mortgage Securities, Inc. Asset-Backed Pass-Through Certificates (j), | | | | | | |
| | 400 | | | 0.604%, 7/25/35 | | | | | 352,127 | |
| | 300 | | | 0.604%, 1/25/36 | | | | | 263,250 | |
| | 200 | | | 0.622%, 11/25/35 | | | | | 156,733 | |
| | 1,000 | | | 0.754%, 8/25/35 | | | | | 974,706 | |
| | | | Amortizing Residential Collateral Trust (j), | | | | | | |
| | 44 | | | 0.694%, 6/25/32 | | | | | 40,959 | |
| | 73 | | | 0.734%, 7/25/32 | | | | | 67,329 | |
| | 433 | | | Argent Securities Trust, 0.344%, 3/25/36 (j) | | | | | 219,011 | |
| | 148 | | | Argent Securities, Inc. Asset-Backed Pass-Through Certificates, 0.384%, 1/25/36 (j) | | | | | 98,798 | |
| | | | Asset-Backed Funding Certificates (j), | | | | | | |
| | 997 | | | 0.774%, 4/25/34 | | | | | 973,411 | |
| | 425 | | | 0.829%, 6/25/35 | | | | | 380,709 | |
| | | | Asset-Backed Securities Corp. Home Equity Loan Trust (j), | | | | | | |
| | 300 | | | 0.604%, 11/25/35 | | | | | 242,516 | |
| | 200 | | | 0.954%, 6/25/34 | | | | | 171,460 | |
| | 200 | | | 1.054%, 6/25/35 | | | | | 164,211 | |
| | 65 | | | 3.155%, 8/15/33 | | | | | 58,369 | |
| | 555 | | | Bayview Financial Asset Trust, 0.554%, 12/25/39 (a)(d)(f)(j) | | | | | 467,983 | |
| | | | Bear Stearns Asset-Backed Securities I Trust (j), | | | | | | |
| | 249 | | | 0.264%, 11/25/36 | | | | | 205,398 | |
| | 450 | | | 0.324%, 5/25/36 | | | | | 377,773 | |
| | 192 | | | 0.334%, 6/25/47 | | | | | 184,912 | |
| | 390 | | | 0.342%, 5/25/37 | | | | | 339,590 | |
| | 604 | | | 0.354%, 12/25/36 | | | | | 564,763 | |
| | 184 | | | 0.854%, 11/25/35 | | | | | 140,818 | |
| | 189 | | | 1.114%, 4/25/35 | | | | | 175,959 | |
| | 234 | | | 1.404%, 8/25/37 | | | | | 206,143 | |
| | 282 | | | 22.986%, 3/25/36, CMO (b) | | | | | 312,939 | |
| | | | Bear Stearns Asset-Backed Securities Trust (j), | | | | | | |
| | 460 | | | 0.304%, 6/25/36 | | | | | 434,970 | |
| | 377 | | | 0.554%, 9/25/46 | | | | | 304,922 | |
| | 400 | | | 0.604%, 8/25/36 | | | | | 324,828 | |
| | 300 | | | 0.704%, 6/25/36 | | | | | 247,517 | |
| | 2,270 | | | 0.744%, 6/25/43 | | | | | 2,243,173 | |
| | | | | | |
| April 30, 2014 | | | Semi-Annual Report | | | 59 | |
Schedule of Investments
Fixed Income SHares: Series M
April 30, 2014 (unaudited) (continued)
| | | | | | | | | | |
Principal
Amount
(000s) | | | | | | | Value | |
| | | | Carrington Mortgage Loan Trust (j), | | | | | | |
| | $ 1,200 | | | 0.374%, 1/25/37 | | | | | $ 723,376 | |
| | 700 | | | 0.414%, 2/25/37 | | | | | 471,857 | |
| | 300 | | | 0.854%, 5/25/35 | | | | | 205,606 | |
| | 38 | | | Cendant Mortgage Corp., 5.965%, 7/25/43 (a)(d)(j) | | | | | 38,288 | |
| | | | Citigroup Mortgage Loan Trust, Inc. (j), | | | | | | |
| | 253 | | | 0.292%, 12/25/36 | | | | | 223,465 | |
| | 149 | | | 0.294%, 5/25/37 | | | | | 142,761 | |
| | 194 | | | 0.554%, 11/25/46 (a)(d) | | | | | 152,776 | |
| | 1,700 | | | 0.564%, 10/25/35 | | | | | 1,444,981 | |
| | 628 | | | 0.614%, 9/25/35 | | | | | 624,610 | |
| | 300 | | | 0.634%, 9/25/35 | | | | | 264,801 | |
| | 500 | | | 0.642%, 9/25/35 | | | | | 359,872 | |
| | 200 | | | 0.772%, 5/25/35 | | | | | 154,041 | |
| | | | Conseco Financial Corp., | | | | | | |
| | 2,531 | | | 6.18%, 4/1/30 | | | | | 2,612,948 | |
| | 1,684 | | | 6.81%, 12/1/28 (j) | | | | | 1,792,581 | |
| | 617 | | | 6.87%, 4/1/30 (j) | | | | | 658,165 | |
| | 1,000 | | | 7.06%, 2/1/31 (j) | | | | | 1,030,461 | |
| | 67 | | | 7.40%, 6/15/27 | | | | | 67,753 | |
| | 152 | | | 7.55%, 1/15/29 (j) | | | | | 160,158 | |
| | | | Countrywide Asset-Backed Certificates (j), | | | | | | |
| | 293 | | | 0.254%, 8/25/37 | | | | | 290,474 | |
| | 225 | | | 0.274%, 6/25/47 | | | | | 220,889 | |
| | 8,200 | | | 0.294%, 7/25/37 | | | | | 6,145,957 | |
| | 1,160 | | | 0.304%, 5/25/37 | | | | | 977,171 | |
| | 269 | | | 0.314%, 1/25/34 | | | | | 238,691 | |
| | 1,528 | | | 0.314%, 5/25/36 | | | | | 1,402,343 | |
| | 566 | | | 0.314%, 3/25/37 | | | | | 496,665 | |
| | 622 | | | 0.324%, 5/25/37 | | | | | 527,367 | |
| | 387 | | | 0.324%, 6/25/47 | | | | | 331,343 | |
| | 800 | | | 0.334%, 6/25/47 | | | | | 681,673 | |
| | 400 | | | 0.374%, 9/25/37 | | | | | 265,016 | |
| | 3,200 | | | 0.374%, 9/25/47 | | | | | 2,377,181 | |
| | 200 | | | 0.402%, 1/25/46 | | | | | 106,488 | |
| | 243 | | | 0.402%, 6/25/47 | | | | | 129,096 | |
| | 100 | | | 0.502%, 4/25/36 | | | | | 85,525 | |
| | 327 | | | 0.539%, 11/25/35 | | | | | 309,387 | |
| | 100 | | | 0.604%, 4/25/36 | | | | | 69,863 | |
| | 214 | | | 0.604%, 3/25/47 (a)(d) | | | | | 143,727 | |
| | 400 | | | 0.614%, 5/25/36 | | | | | 327,377 | |
| | 3 | | | 0.624%, 11/25/33 (a)(d) | | | | | 2,510 | |
| | 833 | | | 0.634%, 12/25/31 | | | | | 610,087 | |
| | 200 | | | 0.642%, 2/25/36 | | | | | 152,125 | |
| | 83 | | | 0.654%, 8/25/47 | | | | | 81,190 | |
| | 700 | | | 0.674%, 12/25/35 | | | | | 673,786 | |
| | 412 | | | 0.754%, 10/25/34 | | | | | 395,299 | |
| | 200 | | | 0.774%, 8/25/35 | | | | | 185,284 | |
| | | | |
| 60 | | Semi-Annual Report | | | April 30, 2014 |
Schedule of Investments
Fixed Income SHares: Series M
April 30, 2014 (unaudited) (continued)
| | | | | | | | | | |
Principal
Amount
(000s) | | | | | | | Value | |
| | $ 800 | | | 0.952%, 8/25/47 | | | | | $ 667,998 | |
| | 200 | | | 1.054%, 4/25/35 | | | | | 154,184 | |
| | | | Credit-Based Asset Servicing and Securitization LLC, | | | | | | |
| | 21 | | | 0.274%, 7/25/37 (a)(d)(j) | | | | | 13,405 | |
| | 452 | | | 0.374%, 7/25/37 (a)(d)(j) | | | | | 291,696 | |
| | 300 | | | 0.724%, 7/25/36 (a)(b)(d)(i)(j) | | | | | | |
| | | | | (acquisition cost-$261,563; purchased 2/18/14) | | | | | 265,745 | |
| | 80 | | | 1.099%, 4/25/36 (j) | | | | | 67,617 | |
| | 96 | | | 4.357%, 7/25/35 | | | | | 97,598 | |
| | 92 | | | Delta Funding Home Equity Loan Trust, 0.795%, 8/15/30 (j) | | | | | 74,399 | |
| | 279 | | | Denver Arena Trust, 6.94%, 11/15/19 (a)(b)(d)(i) | | | | | | |
| | | | | (acquisition cost-$284,861; purchased 12/19/05) | | | | | 285,780 | |
| | 22 | | | EMC Mortgage Loan Trust, 0.894%, 5/25/40 (a)(d)(j) | | | | | 20,332 | |
| | | | First Franklin Mortgage Loan Trust (j), | | | | | | |
| | 457 | | | 0.294%, 12/25/36 | | | | | 270,875 | |
| | 458 | | | 0.314%, 4/25/36 | | | | | 363,501 | |
| | 200 | | | 0.514%, 11/25/35 | | | | | 121,934 | |
| | 667 | | | 0.594%, 4/25/35 | | | | | 666,805 | |
| | 453 | | | 0.604%, 6/25/36 | | | | | 412,994 | |
| | 300 | | | 0.644%, 9/25/35 | | | | | 273,178 | |
| | 615 | | | 0.664%, 9/25/35 | | | | | 604,927 | |
| | 1,000 | | | 0.964%, 4/25/35 (a)(d) | | | | | 933,285 | |
| | 501 | | | 1.024%, 9/25/34 | | | | | 435,998 | |
| | 273 | | | 1.579%, 10/25/34 | | | | | 204,323 | |
| | | | First NLC Trust (j), | | | | | | |
| | 81 | | | 0.224%, 8/25/37 (a)(d) | | | | | 42,433 | |
| | 1,393 | | | 0.614%, 5/25/35 | | | | | 1,174,511 | |
| | 6 | | | First Plus Home Loan Owner Trust, 7.32%, 11/10/23 (f) | | | | | 363 | |
| | | | Fremont Home Loan Trust (j), | | | | | | |
| | 362 | | | 0.304%, 1/25/37 | | | | | 185,575 | |
| | 1,300 | | | 0.324%, 2/25/37 | | | | | 687,969 | |
| | 300 | | | 0.424%, 2/25/36 | | | | | 176,121 | |
| | 100 | | | 0.644%, 7/25/35 | | | | | 87,695 | |
| | 19 | | | 0.944%, 12/25/29 | | | | | 17,236 | |
| | | | GSAMP Trust (j), | | | | | | |
| | 279 | | | 0.244%, 1/25/37 | | | | | 166,468 | |
| | 1,366 | | | 0.274%, 12/25/36 | | | | | 731,705 | |
| | 642 | | | 0.304%, 6/25/36 | | | | | 566,931 | |
| | 894 | | | 0.304%, 12/25/46 | | | | | 502,978 | |
| | 76 | | | 0.314%, 5/25/46 | | | | | 64,910 | |
| | 268 | | | 0.384%, 12/25/46 | | | | | 152,363 | |
| | 277 | | | 0.394%, 12/25/35 | | | | | 251,328 | |
| | 429 | | | 0.394%, 6/25/36 | | | | | 248,076 | |
| | 166 | | | 1.804%, 10/25/34 | | | | | 143,232 | |
| | 200 | | | Home Equity Asset Trust, 1.247%, 5/25/35 (j) | | | | | 162,086 | |
| | | | Home Equity Loan Trust (j), | | | | | | |
| | 800 | | | 0.384%, 4/25/37 | | | | | 479,674 | |
| | 500 | | | 0.494%, 4/25/37 | | | | | 306,120 | |
| | | | | | |
| April 30, 2014 | | | Semi-Annual Report | | | 61 | |
Schedule of Investments
Fixed Income SHares: Series M
April 30, 2014 (unaudited) (continued)
| | | | | | | | | | |
Principal
Amount
(000s) | | | | | | | Value | |
| | | | HSI Asset Securitization Corp. Trust (j), | | | | | | |
| | $ 657 | | | 0.324%, 12/25/36 | | | | | $ 303,749 | |
| | 985 | | | 0.374%, 12/25/36 | | | | | 459,999 | |
| | 300 | | | 0.544%, 11/25/35 | | | | | 194,499 | |
| | 500 | | | IXIS Real Estate Capital Trust, 0.574%, 2/25/36 (j) | | | | | 409,127 | |
| | | | JP Morgan Mortgage Acquisition Trust (j), | | | | | | |
| | 200 | | | 0.314%, 1/25/36 | | | | | 174,442 | |
| | 1,126 | | | 0.314%, 1/25/37 | | | | | 1,097,110 | |
| | 200 | | | 0.314%, 5/25/37 | | | | | 170,255 | |
| | 300 | | | 0.414%, 5/25/37 | | | | | 226,841 | |
| | | | JPMorgan Mortgage Acquisition Corp., | | | | | | |
| | 534 | | | 0.332%, 2/25/36 (j) | | | | | 510,213 | |
| | 581 | | | 0.382%, 5/25/35 | | | | | 566,438 | |
| | | | JPMorgan Mortgage Acquisition Trust (j), | | | | | | |
| | 613 | | | 0.314%, 5/25/36 | | | | | 592,505 | |
| | 1,146 | | | 0.324%, 4/25/36 | | | | | 1,097,668 | |
| | 300 | | | 0.424%, 4/25/36 | | | | | 239,936 | |
| | 700 | | | 0.424%, 5/25/36 | | | | | 575,832 | |
| | | | Lehman ABS Mortgage Loan Trust (a)(d)(j), | | | | | | |
| | 366 | | | 0.244%, 6/25/37 | | | | | 216,207 | |
| | 295 | | | 0.352%, 6/25/37 (b)(i) | | | | | | |
| | | | | (acquisition cost-$179,252; purchased 4/29/14) | | | | | 176,927 | |
| | 1,526 | | | Lehman XS Trust, 0.304%, 4/25/37 (j) | | | | | 1,108,411 | |
| | | | Long Beach Mortgage Loan Trust (j), | | | | | | |
| | 600 | | | 0.584%, 11/25/35 | | | | | 510,884 | |
| | 648 | | | 1.579%, 3/25/32 | | | | | 600,054 | |
| | 396 | | | MASTR Asset Securitization Trust, 0.654%, 10/25/35 (j) | | | | | 263,927 | |
| | | | MASTR Asset-Backed Securities Trust (j), | | | | | | |
| | 258 | | | 0.264%, 8/25/36 | | | | | 131,544 | |
| | 425 | | | 0.304%, 8/25/36 | | | | | 218,320 | |
| | 247 | | | 0.394%, 6/25/36 | | | | | 134,711 | |
| | 255 | | | 0.394%, 8/25/36 | | | | | 133,272 | |
| | 300 | | | 0.454%, 1/25/36 | | | | | 270,111 | |
| | 300 | | | 0.534%, 1/25/36 | | | | | 212,046 | |
| | 156 | | | 0.904%, 12/25/34 | | | | | 141,366 | |
| | 110 | | | Meritage Mortgage Loan Trust, 0.904%, 11/25/35 (j) | | | | | 104,823 | |
| | | | Merrill Lynch Mortgage Investors Trust (j), | | | | | | |
| | 205 | | | 0.352%, 1/25/37 | | | | | 194,769 | |
| | 1,433 | | | 0.394%, 8/25/37 | | | | | 822,415 | |
| | 300 | | | 0.464%, 8/25/36 | | | | | 258,318 | |
| | 1,698 | | | 0.604%, 2/25/47 | | | | | 1,113,718 | |
| | 500 | | | 0.634%, 5/25/36 | | | | | 444,010 | |
| | 1,127 | | | MESA Trust, 0.954%, 12/25/31 (a)(d)(j) | | | | | 1,023,917 | |
| | 1,076 | | | Mid-State Capital Corp. Trust, 6.005%, 8/15/37 | | | | | 1,135,695 | |
| | | | Morgan Stanley ABS Capital I, Inc. Trust (j), | | | | | | |
| | 129 | | | 0.224%, 10/25/36 | | | | | 75,124 | |
| | 191 | | | 0.294%, 10/25/36 | | | | | 112,676 | |
| | 363 | | | 0.294%, 11/25/36 | | | | | 225,698 | |
| | | | |
| 62 | | Semi-Annual Report | | | April 30, 2014 |
Schedule of Investments
Fixed Income SHares: Series M
April 30, 2014 (unaudited) (continued)
| | | | | | | | | | |
Principal
Amount
(000s) | | | | | | | Value | |
| | $ 862 | | | 0.304%, 6/25/36 | | | | | $ 664,274 | |
| | 491 | | | 0.304%, 9/25/36 | | | | | 270,477 | |
| | 1,897 | | | 0.304%, 11/25/36 | | | | | 1,173,836 | |
| | 558 | | | 0.334%, 3/25/37 | | | | | 304,731 | |
| | 191 | | | 0.354%, 2/25/37 | | | | | 107,683 | |
| | 453 | | | 0.374%, 11/25/36 | | | | | 284,679 | |
| | 558 | | | 0.404%, 3/25/37 | | | | | 307,519 | |
| | 568 | | | 0.464%, 12/25/35 | | | | | 469,742 | |
| | 194 | | | 1.054%, 5/25/34 | | | | | 177,243 | |
| | 300 | | | 1.084%, 3/25/35 | | | | | 283,698 | |
| | 200 | | | 1.202%, 4/25/35 | | | | | 154,801 | |
| | 400 | | | 1.404%, 7/25/37 | | | | | 252,583 | |
| | 2,000 | | | Morgan Stanley Capital I, Inc., 0.444%, 1/25/36 (j) | | | | | 1,656,620 | |
| | 400 | | | Morgan Stanley Capital, Inc., 1.144%, 6/25/35 (j) | | | | | 329,532 | |
| | | | Morgan Stanley Home Equity Loan Trust (j), | | | | | | |
| | 223 | | | 0.314%, 4/25/36 | | | | | 160,274 | |
| | 870 | | | 0.324%, 4/25/37 | | | | | 516,273 | |
| | 290 | | | 0.384%, 4/25/37 | | | | | 173,424 | |
| | | | Morgan Stanley Mortgage Loan Trust, | | | | | | |
| | 238 | | | 0.384%, 2/25/37 (j) | | | | | 137,557 | |
| | 403 | | | 0.514%, 4/25/37 (j) | | | | | 227,337 | |
| | 345 | | | 5.75%, 11/25/36 (j) | | | | | 189,862 | |
| | 616 | | | 5.965%, 9/25/46 | | | | | 432,799 | |
| | | | New Century Home Equity Loan Trust (j), | | | | | | |
| | 565 | | | 0.434%, 10/25/35 | | | | | 554,770 | |
| | 1,000 | | | 0.604%, 6/25/35 | | | | | 917,596 | |
| | 200 | | | Nomura Home Equity Loan, Inc. Home Equity Loan Trust, 0.564%, 2/25/36 (j) | | | | | 168,440 | |
| | 219 | | | NovaStar Mortgage Funding Trust, 0.304%, 6/25/36 (j) | | | | | 124,311 | |
| | 400 | | | Option One Mortgage Loan Asset-Backed Certificates Trust, 0.594%, 11/25/35 (j) | | | | | 361,503 | |
| | | | Option One Mortgage Loan Trust (j), | | | | | | |
| | 98 | | | 0.294%, 1/25/37 | | | | | 56,723 | |
| | 254 | | | 0.324%, 5/25/37 | | | | | 149,793 | |
| | 394 | | | 0.374%, 1/25/37 | | | | | 228,347 | |
| | 188 | | | 0.482%, 4/25/37 | | | | | 112,384 | |
| | 400 | | | 0.614%, 11/25/35 | | | | | 292,498 | |
| | 200 | | | 0.662%, 8/25/35 | | | | | 151,306 | |
| | 299 | | | Ownit Mortgage Loan Trust, 0.754%, 10/25/36 (j) | | | | | 204,370 | |
| | | | Park Place Securities, Inc. Asset-Backed Pass-Through Certificates (j), | | | | | | |
| | 200 | | | 0.644%, 8/25/35 | | | | | 153,444 | |
| | 400 | | | 0.684%, 7/25/35 | | | | | 325,068 | |
| | 400 | | | 0.902%, 3/25/35 | | | | | 314,452 | |
| | 300 | | | 0.984%, 1/25/36 | | | | | 263,644 | |
| | 141 | | | 1.099%, 2/25/35 | | | | | 140,813 | |
| | 500 | | | 1.204%, 10/25/34 | | | | | 408,187 | |
| | 406 | | | 1.952%, 12/25/34 | | | | | 330,014 | |
| | 497 | | | People’s Financial Realty Mortgage Securities Trust, 0.294%, 9/25/36 (j) | | | | | 197,778 | |
| | 400 | | | Popular ABS Mortgage Pass-Through Trust, 0.544%, 2/25/36 (j) | | | | | 309,254 | |
| | | | RAAC (j), | | | | | | |
| | 865 | | | 0.504%, 11/25/46 (a)(d) | | | | | 748,517 | |
| | | | | | |
| April 30, 2014 | | | Semi-Annual Report | | | 63 | |
Schedule of Investments
Fixed Income SHares: Series M
April 30, 2014 (unaudited) (continued)
| | | | | | | | | | |
Principal
Amount
(000s) | | | | | | | Value | |
| | $ 200 | | | 0.554%, 6/25/47 | | | | | $ 184,391 | |
| | 600 | | | 1.654%, 9/25/47 | | | | | 485,867 | |
| | | | Residential Asset Mortgage Products, Inc., | | | | | | |
| | 295 | | | 0.314%, 12/25/36 (j) | | | | | 274,646 | |
| | 266 | | | 0.314%, 2/25/37 (j) | | | | | 238,208 | |
| | 300 | | | 0.434%, 9/25/36 (j) | | | | | 222,866 | |
| | 1,000 | | | 0.474%, 1/25/36 (j) | | | | | 696,276 | |
| | 250 | | | 0.584%, 11/25/35 (j) | | | | | 207,918 | |
| | 200 | | | 0.592%, 10/25/35 (j) | | | | | 179,347 | |
| | 100 | | | 0.612%, 10/25/35 (j) | | | | | 79,030 | |
| | 300 | | | 0.634%, 9/25/35 (j) | | | | | 254,609 | |
| | 342 | | | 1.054%, 8/25/34 (j) | | | | | 320,759 | |
| | 2,401 | | | 5.634%, 1/25/34 | | | | | 2,570,235 | |
| | 1,861 | | | 5.656%, 7/25/34 | | | | | 1,523,453 | |
| | | | Residential Asset Securities Corp. (j), | | | | | | |
| | 400 | | | 0.314%, 11/25/36 | | | | | 334,500 | |
| | 1,000 | | | 0.324%, 11/25/36 | | | | | 808,893 | |
| | 300 | | | 0.424%, 5/25/37 | | | | | 266,636 | |
| | 1,000 | | | 0.434%, 6/25/36 | | | | | 771,906 | |
| | 1,600 | | | 0.494%, 4/25/37 | | | | | 1,077,997 | |
| | 400 | | | 0.534%, 2/25/36 | | | | | 342,238 | |
| | 200 | | | 0.564%, 1/25/36 | | | | | 170,884 | |
| | 400 | | | 0.572%, 12/25/35 | | | | | 317,177 | |
| | 300 | | | 0.574%, 10/25/35 | | | | | 247,121 | |
| | 300 | | | 0.592%, 11/25/35 | | | | | 244,279 | |
| | 300 | | | 0.612%, 11/25/35 | | | | | 215,264 | |
| | 2,222 | | | 0.799%, 3/25/35 | | | | | 2,021,456 | |
| | 67 | | | 7.14%, 4/25/32 | | | | | 2,711 | |
| | 108 | | | SACO I, Inc., 0.914%, 11/25/35 (j) | | | | | 107,370 | |
| | 465 | | | Salomon Mortgage Loan Trust, 1.054%, 11/25/33 (j) | | | | | 438,811 | |
| | | | Securitized Asset-Backed Receivables LLC Trust (j), | | | | | | |
| | 320 | | | 0.244%, 7/25/36 | | | | | 148,797 | |
| | 700 | | | 0.294%, 5/25/36 | | | | | 392,399 | |
| | 313 | | | 0.314%, 7/25/36 | | | | | 147,370 | |
| | 268 | | | 0.392%, 7/25/36 | | | | | 128,133 | |
| | 1,552 | | | 0.404%, 5/25/36 | | | | | 885,605 | |
| | 374 | | | 0.424%, 3/25/36 | | | | | 279,933 | |
| | 247 | | | 0.829%, 1/25/35 | | | | | 223,790 | |
| | 189 | | | 1.114%, 1/25/36 | | | | | 148,184 | |
| | | | Soundview Home Loan Trust (j), | | | | | | |
| | 84 | | | 0.234%, 6/25/37 | | | | | 49,089 | |
| | 395 | | | 0.264%, 2/25/37 | | | | | 185,908 | |
| | 930 | | | 0.314%, 11/25/36 | | | | | 733,155 | |
| | 554 | | | 0.334%, 2/25/37 | | | | | 263,422 | |
| | 300 | | | 0.979%, 6/25/35 | | | | | 265,287 | |
| | 630 | | | 1.104%, 10/25/37 | | | | | 424,215 | |
| | | | South Carolina Student Loan Corp. (j), | | | | | | |
| | 466 | | | 0.786%, 3/1/18 | | | | | 466,589 | |
| | | | |
| 64 | | Semi-Annual Report | | | April 30, 2014 |
Schedule of Investments
Fixed Income SHares: Series M
April 30, 2014 (unaudited) (continued)
| | | | | | | | | | |
Principal
Amount
(000s) | | | | | | | Value | |
| | $ 3,600 | | | 0.986%, 3/2/20 | | | | | $ 3,624,912 | |
| | 600 | | | 1.236%, 9/3/24 | | | | | 609,246 | |
| | | | Specialty Underwriting & Residential Finance Trust (j), | | | | | | |
| | 185 | | | 0.304%, 9/25/37 | | | | | 104,810 | |
| | 300 | | | 0.424%, 4/25/37 | | | | | 159,309 | |
| | 600 | | | 0.804%, 12/25/35 | | | | | 555,406 | |
| | | | Structured Asset Investment Loan Trust (j), | | | | | | |
| | 515 | | | 0.304%, 9/25/36 | | | | | 394,490 | |
| | 1,060 | | | 0.344%, 3/25/36 | | | | | 858,104 | |
| | 313 | | | 0.452%, 1/25/36 | | | | | 220,301 | |
| | | | Structured Asset Securities Corp. Mortgage Loan Trust (j), | | | | | | |
| | 859 | | | 0.294%, 9/25/36 | | | | | 824,290 | |
| | 279 | | | 0.304%, 9/25/36 | | | | | 229,310 | |
| | 291 | | | 0.314%, 3/25/36 | | | | | 278,736 | |
| | 400 | | | 0.324%, 12/25/36 | | | | | 314,473 | |
| | 600 | | | 0.524%, 4/25/36 (a)(b)(d)(i) | | | | | | |
| | | | | (acquisition cost-$488,375; purchased 2/10/14-3/5/14) | | | | | 505,009 | |
| | 1,546 | | | 1.154%, 8/25/37 | | | | | 1,447,791 | |
| | 200 | | | Wells Fargo Home Equity Asset-Backed Securities Trust, 0.784%, 11/25/35 (j) | | | | | 167,901 | |
| | 1,000 | | | Wells Fargo Home Equity Trust, 0.784%, 8/25/35 (j) | | | | | 860,277 | |
| | Total Asset-Backed Securities (cost-$117,652,158) | | | | | 118,403,133 | |
| | Senior Loans – 0.7% | | | | | | |
| | | | Technology Hardware, Storage & Peripherals – 0.7% | | | | | | |
| | 21,000 | | | Dell International LLC, 4.50%, 4/29/20, Term B (a)(c) (cost-$20,789,251) | | | | | 20,950,660 | |
| | Short-Term Investments – 0.1% | | | | | | |
| | | | Repurchase Agreements – 0.1% | | | | | | |
| | 1,604 | | | State Street Bank and Trust Co., | | | | | | |
| | | | dated 4/30/14, 0.00%, due 5/1/14, | | | | | | |
| | | | proceeds $1,604,000; collateralized by | | | | | | |
| | | | Fannie Mae, 2.20%, due 10/17/22, | | | | | | |
| | | | | valued at $1,639,226 including accrued interest (cost-$1,604,000) | | | | | 1,604,000 | |
| | | | U.S. Treasury Obligations (g) – 0.0% | | | | | | |
| | 602 | | | U.S. Treasury Bills, 0.046%-0.052%, 10/16/14-10/30/14 (k) | | | | | 601,885 | |
| | 562 | | | U.S. Treasury Notes, 0.75%, 6/15/14 | | | | | 562,494 | |
| | Total U.S. Treasury Obligations (cost-$1,164,267) | | | | | 1,164,379 | |
| | Total Short-Term Investments (cost-$2,768,267) | | | | | 2,768,379 | |
| | | |
| Contracts | | | | | | | | |
| | Options Purchased (l) – 0.0% | | | | | | |
| | | | Call Options – 0.0% | | | | | | |
| | | | U.S. Treasury Ultra Bond Futures, (CBOT), | | | | | | |
| | 1,250 | | | strike price $172.00, expires 5/23/14 | | | | | 18,878 | |
| | 500 | | | strike price $186.00, expires 5/23/14 | | | | | 7,623 | |
| | 770 | | | strike price $191.00, expires 5/23/14 | | | | | 11,763 | |
| | | | | | | | | | 38,264 | |
| | | | | | |
| April 30, 2014 | | | Semi-Annual Report | | | 65 | |
Schedule of Investments
Fixed Income SHares: Series M
April 30, 2014 (unaudited) (continued)
| | | | | | | | | | |
Notional Amount (000s) | | | | | | | Value | |
| | | | Put Options – 0.0% | | | | | | |
| | | | Fannie Mae, zero coupon, (OTC), | | | | | | |
| | $90,000 | | | strike price $89.00, expires 5/5/14 | | | | | $ 1 | |
| | $280,000 | | | strike price $95.00, expires 5/5/14 | | | | | 2 | |
| | $296,000 | | | strike price $93.00, expires 6/5/14 | | | | | 3 | |
| | | | | | | | | | 6 | |
| | Total Options Purchased (cost-$58,148) | | | | | 38,270 | |
| | Total Investments, before options written (cost-$5,140,307,995) – 181.0% | | | | | 5,256,863,906 | |
| | Options Written (l) – (0.0)% | | | | | | |
| | | | Call Options – (0.0)% | | | | | | |
| | $247,500 | | | 10-Year Interest Rate Swap (OTC), Receive 3-Month USD-LIBOR Floating Rate Index, strike rate 2.60%, expires 6/16/14 | | | | | (408,820 | ) |
| | | | Put Options – (0.0)% | | | | | | |
| | $440,400 | | | 10-Year Interest Rate Swap (OTC), Pay 3-Month USD-LIBOR Floating Rate Index, strike rate 3.15%, expires 6/16/14 | | | | | (424,590 | ) |
| | $252,000 | | | CDX.IG-21 5-Year Index (OTC), strike price $0.75, expires 6/18/14 | | | | | (81,474 | ) |
| | | | U.S. Dollar versus Japanese Yen, (OTC), | | | | | | |
| | $121,700 | | | strike price $97.00, expires 5/30/14 | | | | | (13,387 | ) |
| | $105,000 | | | strike price $99.00, expires 6/12/14 | | | | | (138,390 | ) |
| | | | | | | | | | (657,841 | ) |
| | Total Options Written (premiums received-$5,302,335) | | | | | (1,066,661 | ) |
| | Total Investments, net of options written (cost-$5,135,005,660) – 181.0% | | | | | 5,255,797,245 | |
| | Other liabilities in excess of other assets – (81.0)% | | | | | (2,351,269,291 | ) |
| | Net Assets – 100.0% | | | | | $2,904,527,954 | |
Notes to Schedule of Investments:
| * | | Principal amount less than $500. | |
| (a) | | Private Placement–Restricted as to resale and may not have a readily available market. Securities with an aggregate value of $426,255,883, representing 14.7% of net assets. | |
| (c) | | These securities generally pay interest at rates which are periodically pre-determined by reference to a base lending rate plus a premium. These base lending rates are generally either the lending rate offered by one or more major European banks, such as the “LIBOR” or the prime rate offered by one or more major United States banks, or the certificate of deposit rate. These securities are generally considered to be restricted as the Portfolio is ordinarily contractually obligated to receive approval from the Agent bank and/or borrower prior to disposition. Remaining maturities of senior loans may be less than the stated maturities shown as a result of contractual or optional payments by the borrower. Such prepayments cannot be predicted with certainty. The interest rate disclosed reflects the rate in effect on April 30, 2014. | |
| (d) | | 144A–Exempt from registration under Rule 144A of the Securities Act of 1933. These securities may be resold in transactions exempt from registration, typically only to qualified institutional buyers. Unless otherwise indicated, these securities are not considered to be illiquid. | |
| (e) | | When-issued or delayed-delivery. To be settled/delivered after April 30, 2014. | |
| (f) | | Fair-Valued–Securities with an aggregate value of $885,139, representing less than 0.05% of net assets. See Note 1(a) and Note 1(b) in the Notes to Financial Statements. | |
| (g) | | All or partial amount segregated for the benefit of the counterparty as collateral for derivatives and/or when-issued or delayed-delivery securities. | |
| (h) | | All or partial amount transferred for the benefit of the counterparty as collateral for reverse repurchase agreements. | |
| (i) | | Restricted. The aggregate acquisition cost of such securities is $70,298,682. The aggregate value is $70,846,584, representing 2.4% of net assets. | |
| (j) | | Variable or Floating Rate Security–Securities with an interest rate that changes periodically. The interest rate disclosed reflects the rate in effect on April 30, 2014. | |
| | | | |
| 66 | | Semi-Annual Report | | | April 30, 2014 |
Schedule of Investments
Fixed Income SHares: Series M
April 30, 2014 (unaudited) (continued)
| (k) | | Rates reflect the effective yields at purchase date. | |
| (l) | | Non-income producing. | |
| (m) | | Futures contracts outstanding at April 30, 2014: | |
| | | | | | | | | | | | | | | | | | |
| | | Type | | Contracts | | | Market
Value
(000s) | | | Expiration
Date | | | Unrealized
Appreciation
(Depreciation) | |
| Long: | | 10-Year U.S. Treasury Note Futures | | | 1,463 | | | | $182,029 | | | | 6/19/14 | | | | $1,253,196 | |
| | 90-Day EURIBOR Futures | | | 2,611 | | | | 902,060 | | | | 12/14/15 | | | | 3,273,505 | |
| | Financial Futures Euro-90 day | | | 3,000 | | | | 745,913 | | | | 6/15/15 | | | | 3,032,977 | |
| | Financial Futures Euro-90 day | | | 6,747 | | | | 1,673,762 | | | | 9/14/15 | | | | (330,657 | ) |
| Short: | | U.S. Treasury Ultra Bond Futures | | | (2,648 | ) | | | (390,001 | ) | | | 6/19/14 | | | | (17,307,834 | ) |
| | | | | | | | | | | | | | | | | | |
| | | | | | | | | | | | | | | | | $(10,078,813 | ) |
| | | | | | | | | | | | | | | | | | |
At April 30, 2014, the Portfolio pledged cash collateral of $8,524,000 for futures contracts.
| (n) | | Transactions in options written for the six months ended April 30, 2014: | |
| | | | | | | | | | | | |
| | | Contracts | | | Notional
Amount
(000s) | | | Premiums | |
| Options outstanding, October 31, 2013 | | | 536 | | | | $12,874,000 | | | | $26,745,555 | |
| Options written | | | – | | | | 1,439,100 | | | | 6,600,728 | |
| Options terminated in closing transactions | | | – | | | | (12,415,100 | ) | | | (25,765,463 | ) |
| Options expired | | | (536 | ) | | | (731,400 | ) | | | (2,278,485 | ) |
| | | | | | | | | | | | |
| Options outstanding, April 30, 2014 | | | – | | | | $1,166,600 | | | | $5,302,335 | |
| | | | | | | | | | | | |
| (o) | | Credit default swap agreements outstanding at April 30, 2014: | |
OTC buy protection swap agreements:
| | | | | | | | | | | | | | | | | | | | | | | | | | | | |
Swap Counterparty/
Referenced Debt Issuer | | Notional
Amount
(000s)(1) | | | Credit
Spread | | | Termination
Date | | | Payments
Made | | | Value(2) | | | Upfront
Premiums
Paid
(Received) | | | Unrealized
Depreciation | |
| Bank of America: | | | | | | | | | | | | | | | | | | | | | | | | | | | | |
Macy’s | | | $5,000 | | | | 0.12 | % | | | 9/20/15 | | | | (7.06 | )% | | | $(528,396 | ) | | | $– | | | | $(528,396 | ) |
| Deutsche Bank: | | | | | | | | | | | | | | | | | | | | | | | | | | | | |
Altria Group, Inc. | | | 4,500 | | | | 0.45 | % | | | 3/20/19 | | | | (1.46 | )% | | | (222,147 | ) | | | – | | | | (222,147 | ) |
| Morgan Stanley: | | | | | | | | | | | | | | | | | | | | | | | | | | | | |
Altria Group, Inc. | | | 1,500 | | | | 0.42 | % | | | 12/20/18 | | | | (1.55 | )% | | | (79,712 | ) | | | – | | | | (79,712 | ) |
| | | | | | | | | | | | | | | | | | | | | | | | | | | | |
| | | | | | | | | | | | | | | | | | | $(830,255 | ) | | | $– | | | | $(830,255 | ) |
| | | | | | | | | | | | | | | | | | | | | | | | | | | | |
OTC sell protection swap agreements:
| | | | | | | | | | | | | | | | | | | | | | | | | | | | |
Swap Counterparty/
Referenced Debt Issuer | | Notional
Amount
(000s)(1) | | | Credit
Spread | | | Termination
Date | | | Payments
Received | | | Value(2) | | | Upfront
Premiums
Paid
(Received) | | | Unrealized
Appreciation | |
| Deutsche Bank: | | | | | | | | | | | | | | | | | | | | | | | | | | | | |
BP Capital Markets | | | €8,200 | | | | 0.54 | % | | | 12/20/18 | | | | 1.00 | % | | | $250,783 | | | | $217,741 | | | | $33,042 | |
| Goldman Sachs: | | | | | | | | | | | | | | | | | | | | | | | | | | | | |
Bank of America Corp. | | | $30,000 | | | | 0.50 | % | | | 3/20/18 | | | | 1.00 | % | | | 610,649 | | | | (316,073 | ) | | | 926,722 | |
California State Municipal Bond | | | 25,000 | | | | 0.52 | % | | | 12/20/18 | | | | 1.60 | % | | | 1,250,800 | | | | – | | | | 1,250,800 | |
California State Municipal Bond | | | 11,000 | | | | 0.52 | % | | | 12/20/18 | | | | 1.75 | % | | | 625,705 | | | | – | | | | 625,705 | |
Connecticut State Municipal Bond | | | 9,000 | | | | 0.97 | % | | | 3/20/21 | | | | 1.60 | % | | | 361,397 | | | | – | | | | 361,397 | |
| | | | | | | | | | | | | | | | | | | | | | | | | | | | |
| | | | | | | | | | | | | | | | | | | $3,099,334 | | | | $(98,332 | ) | | | $3,197,666 | |
| | | | | | | | | | | | | | | | | | | | | | | | | | | | |
| | | | | | |
| April 30, 2014 | | | Semi-Annual Report | | | 67 | |
Schedule of Investments
Fixed Income SHares: Series M
April 30, 2014 (unaudited) (continued)
| (1) | | This represents the maximum potential amount the Portfolio could be required to make available as a seller of credit protection or receive as a buyer of credit protection if a credit event occurs as defined under the terms of that particular swap agreement. | |
| (2) | | The quoted market prices and resulting values for credit default swap agreements serve as an indicator of the status at April 30, 2014 of the payment/performance risk and represent the likelihood of an expected liability (or profit) for the credit derivative should the notional amount of the swap agreement have been closed/sold as of the period end. Increasing market values, in absolute terms when compared to the notional amount of the swap, represent a deterioration of the referenced entity’s credit soundness and a greater likelihood or risk of default or other credit event occurring as defined under the terms of the agreement. | |
| (p) | | Interest rate swap agreements outstanding at April 30, 2014: | |
OTC swap agreements:
| | | | | | | | | | | | | | | | | | | | | | | | | | | | |
| | | Notional
Amount
(000s) | | | Termination
Date | | Rate Type | | | Value | | | Upfront
Premiums
Received | | | Unrealized
Appreciation
(Depreciation) | |
Swap
Counterparty | | | | Payments
Made | | Payments
Received | | | | |
| Bank of America | | | MXN | | | | 40,400 | | | 2/7/19 | | 28-Day Mexico
Interbank TIIE Banxico | | | 8.30 | % | | | $397,396 | | | | $– | | | | $397,396 | |
| Barclays Bank | | | | | | | 189,600 | | | 1/28/15 | | 28-Day Mexico
Interbank TIIE Banxico | | | 7.34 | % | | | 388,519 | | | | (35 | ) | | | 388,554 | |
| Barclays Bank | | | BRL | | | | 34,400 | | | 1/2/17 | | BRL-CDI-Compounded | | | 8.18 | % | | | (1,253,242 | ) | | | (45,824 | ) | | | (1,207,418 | ) |
| Deutsche Bank | | | | | | | 61,000 | | | 1/2/17 | | BRL-CDI-Compounded | | | 8.29 | % | | | (2,148,008 | ) | | | (71,953 | ) | | | (2,076,055 | ) |
| HSBC Bank | | | MXN | | | | 99,400 | | | 1/28/15 | | 28-Day Mexico
Interbank TIIE Banxico | | | 7.33 | % | | | 204,317 | | | | (6,855 | ) | | | 211,172 | |
| Morgan Stanley | | | BRL | | | | 13,600 | | | 1/2/17 | | BRL-CDI-Compounded | | | 8.22 | % | | | (487,991 | ) | | | (20,529 | ) | | | (467,462 | ) |
| UBS | | | | | | | 143,900 | | | 1/2/17 | | BRL-CDI-Compounded | | | 8.90 | % | | | (3,960,357 | ) | | | – | | | | (3,960,357 | ) |
| | | | | | | | | | | | | | | | | | | | | | | | | | | | |
| | | | | | | | | | | | | | | | | | $ | (6,859,366 | ) | | $ | (145,196 | ) | | $ | (6,714,170 | ) |
| | | | | | | | | | | | | | | | | | | | | | | | | | | | |
Centrally cleared swap agreements:
| | | | | | | | | | | | | | | | | | | | |
| | | Notional
Amount
(000s) | | | Termination
Date | | | Rate Type | | Value | | | Unrealized
Depreciation | |
Broker
(Exchange) | | | | Payments
Made | | Payments
Received | | |
| Barclays Bank (CME) | | | $74,900 | | | | 12/18/43 | | | 3.50% | | 3-Month USD-LIBOR | | | $(1,692,946) | | | �� | $(4,945,853) | |
| Credit Suisse First Boston (CME) | | | ¥7,290,000 | | | | 9/18/23 | | | 1.00% | | 6-Month JPY-LIBOR | | | (1,802,099 | ) | | | (254,235 | ) |
| Credit Suisse First Boston (CME) | | | $309,700 | | | | 12/18/23 | | | 3.00% | | 3-Month USD-LIBOR | | | (11,079,606 | ) | | | (17,251,754 | ) |
| Deutsche Bank (CME) | | | 200,000 | | | | 12/18/43 | | | 3.50% | | 3-Month USD-LIBOR | | | (4,520,549 | ) | | | (11,360,549 | ) |
| | | | | | | | | | | | | | | | | | | | |
| | | | | | | | | | | | | | | $(19,095,200 | ) | | | $(33,812,391 | ) |
| | | | | | | | | | | | | | | | | | | | |
| (q) | | Forward foreign currency contracts outstanding at April 30, 2014: | |
| | | | | | | | | | | | | | |
| | | Counterparty | | U.S.$ Value on
Origination Date | | | U.S.$ Value
April 30, 2014 | | | Unrealized
Appreciation
(Depreciation) | |
| Purchased: | | | | | | | | | | | | | | |
| 42,661,000 Australian Dollar settling 5/2/14 | | Bank of America | | | $39,271,797 | | | | $39,632,079 | | | | $360,282 | |
| 42,661,000 Australian Dollar settling 6/3/14 | | Morgan Stanley | | | 39,493,937 | | | | 39,545,329 | | | | 51,392 | |
| 4,944,774 Brazilian Real settling 5/5/14 | | UBS | | | 2,068,683 | | | | 2,217,636 | | | | 148,953 | |
| 4,944,774 Brazilian Real settling 6/3/14 | | UBS | | | 2,205,125 | | | | 2,197,491 | | | | (7,634 | ) |
| 9,543,000 Euro settling 5/2/14 | | Bank of America | | | 13,208,114 | | | | 13,239,475 | | | | 31,361 | |
| 98,314,000 Euro settling 6/3/14 | | Bank of America | | | 136,017,419 | | | | 136,386,663 | | | | 369,244 | |
| 6,397,000 Euro settling 5/2/14 | | Citigroup | | | 8,803,513 | | | | 8,874,874 | | | | 71,361 | |
| 82,374,000 Euro settling 5/2/14 | | Royal Bank
of Scotland | | | 113,480,812 | | | | 114,281,513 | | | | 800,701 | |
| 72,715,301 Mexican Peso settling 5/14/14 | | BNP Paribas | | | 5,424,895 | | | | 5,554,050 | | | | 129,155 | |
| 72,715,301 Mexican Peso settling 8/25/14 | | Goldman Sachs | | | 5,520,235 | | | | 5,508,304 | | | | (11,931 | ) |
| | | | |
| 68 | | Semi-Annual Report | | | April 30, 2014 |
Schedule of Investments
Fixed Income SHares: Series M
April 30, 2014 (unaudited) (continued)
| | | | | | | | | | | | | | |
| | | Counterparty | | U.S.$ Value on
Origination Date | | | U.S.$ Value
April 30, 2014 | | | Unrealized
Appreciation
(Depreciation) | |
| Sold: | | | | | | | | | | | | | | |
| 42,661,000 Australian Dollar settling 5/2/14 | | Morgan Stanley | | | $39,581,934 | | | | $39,632,079 | | | | $(50,145 | ) |
| 4,944,774 Brazilian Real settling 5/5/14 | | UBS | | | 2,223,370 | | | | 2,217,636 | | | | 5,734 | |
| 51,823,000 Canadian Dollar settling 6/19/14 | | Citigroup | | | 46,686,125 | | | | 47,227,224 | | | | (541,099 | ) |
| 98,314,000 Euro settling 5/2/14 | | Bank of America | | | 136,028,136 | | | | 136,395,861 | | | | (367,725 | ) |
| 70,500,000 Japanese Yen settling 5/13/14 | | Citigroup | | | 691,339 | | | | 689,634 | | | | 1,705 | |
| 72,715,301 Mexican Peso settling 5/14/14 | | Goldman Sachs | | | 5,564,591 | | | | 5,554,050 | | | | 10,541 | |
| | | | | | | | | | | | | | |
| | | | | | | | | | | | | $1,001,895 | |
| | | | | | | | | | | | | | |
| (r) | | At April 30, 2014, the Portfolio held $16,130,000 in cash as collateral for derivative contracts. Cash collateral held may be invested in accordance with the Portfolio’s investment strategy. | |
| (s) | | Open reverse repurchase agreements at April 30, 2014: | |
| | | | | | | | | | | | | | | | | | | | |
| Counterparty | | Rate | | | Trade Date | | | Due Date | | | Principal &
Interest | | | Principal | |
| Bank of America | | | 0.09 | % | | | 4/16/14 | | | | 5/1/14 | | | | $259,400,227 | | | | $259,390,500 | |
| Barclays Bank | | | 0.06 | | | | 4/30/14 | | | | 5/15/14 | | | | 129,322,500 | | | | 129,322,500 | |
| Deutsche Bank | | | 0.07 | | | | 4/23/14 | | | | 5/23/14 | | | | 284,068,419 | | | | 284,064,000 | |
| | | 0.08 | | | | 4/15/14 | | | | 5/15/14 | | | | 212,967,072 | | | | 212,959,500 | |
| Royal Bank of Scotland | | | 0.07 | | | | 4/30/14 | | | | 6/2/14 | | | | 126,315,000 | | | | 126,315,000 | |
| | | 0.08 | | | | 4/22/14 | | | | 5/6/14 | | | | 221,204,424 | | | | 221,200,000 | |
| | | 0.08 | | | | 4/23/14 | | | | 5/7/14 | | | | 150,002,667 | | | | 150,000,000 | |
| | | 0.08 | | | | 4/23/14 | | | | 5/7/14 | | | | 50,000,889 | | | | 50,000,000 | |
| | | | | | | | | | | | | | | | | | | | |
| | | | | | | | | | | | | | | | | | | $1,433,251,500 | |
| | | | | | | | | | | | | | | | | | | | |
| (t) | | The weighted average daily balance of reverse repurchase agreements during the six months ended April 30, 2014 was $951,156,052, at a weighted average interest rate of 0.07%. Total value of underlying collateral (refer to the Schedule of Investments for positions transferred for the benefit of the counterparty as collateral) for open reverse repurchase agreements at April 30, 2014 was $1,432,827,556. | |
| | | At April 30, 2014, the Portfolio held U.S. Treasury Obligations valued at $803,910 as collateral for open reverse repurchase agreements. Securities held as collateral will not be pledged and are not reflected in the Schedule of Investments. | |
| (u) | | The weighted average borrowing for sale-buybacks during the six months ended April 30, 2014 was $198,829,019 at a weighted average interest rate of 0.05%. | |
| (v) | | Fair Value Measurements-See Note 1(b) in the Notes to Financial Statements. | |
| | | | | | | | | | | | | | | | |
| | | Level 1 –
Quoted
Prices | | | Level 2 –
Other Significant
Observable
Inputs | | | Level 3 –
Significant
Unobservable
Inputs | | | Value at
4/30/14 | |
Investments in Securities – Assets | |
U.S. Treasury Obligations | | $ | – | | | | $2,151,054,748 | | | | $– | | | | $2,151,054,748 | |
U.S. Government Agency Securities | | | – | | | | 1,252,799,432 | | | | – | | | | 1,252,799,432 | |
Corporate Bonds & Notes: | | | | | | | | | | | | | | | | |
Diversified Financial Services | | | – | | | | 182,009,450 | | | | 11,064,000 | | | | 193,073,450 | |
All Other | | | – | | | | 578,456,259 | | | | – | | | | 578,456,259 | |
Municipal Bonds | | | – | | | | 463,140,296 | | | | – | | | | 463,140,296 | |
Mortgage-Backed Securities | | | – | | | | 356,462,851 | | | | 416,793 | | | | 356,879,644 | |
Sovereign Debt Obligations | | | – | | | | 119,299,635 | | | | – | | | | 119,299,635 | |
Asset-Backed Securities | | | – | | | | 117,934,787 | | | | 468,346 | | | | 118,403,133 | |
Senior Loans | | | – | | | | 20,950,660 | | | | – | | | | 20,950,660 | |
Short-Term Investments | | | – | | | | 2,768,379 | | | | – | | | | 2,768,379 | |
Options Purchased: | | | | | | | | | | | | | | | | |
Interest Rate Contracts | | | – | | | | 38,270 | | | | – | | | | 38,270 | |
| | | | – | | | | 5,244,914,767 | | | | 11,949,139 | | | | 5,256,863,906 | |
| | | | | | |
| April 30, 2014 | | | Semi-Annual Report | | | 69 | |
Schedule of Investments
Fixed Income SHares: Series M
April 30, 2014 (unaudited) (continued)
| | | | | | | | | | | | | | | | |
| | | Level 1 –
Quoted
Prices | | | Level 2 –
Other Significant
Observable
Inputs | | | Level 3 –
Significant
Unobservable
Inputs | | | Value at
4/30/14 | |
Investment in Securities – Liabilities | | | | | | | | | | | | | | | | |
Options Written, at value: | | | | | | | | | | | | | | | | |
Credit Contracts | | $ | – | | | | $(81,474 | ) | | | $– | | | | $(81,474 | ) |
Foreign Exchange Contracts | | | – | | | | (151,777 | ) | | | – | | | | (151,777 | ) |
Interest Rate Contracts | | | – | | | | (833,410 | ) | | | – | | | | (833,410 | ) |
| | | | – | | | | (1,066,661 | ) | | | – | | | | (1,066,661 | ) |
Other Financial Instruments* – Assets | | | | | | | | | | | | | | | | |
Credit Contracts | | | – | | | | 3,197,666 | | | | – | | | | 3,197,666 | |
Foreign Exchange Contracts | | | – | | | | 1,980,429 | | | | – | | | | 1,980,429 | |
Interest Rate Contracts | | | 7,559,678 | | | | 997,122 | | | | – | | | | 8,556,800 | |
| | | | 7,559,678 | | | | 6,175,217 | | | | – | | | | 13,734,895 | |
Other Financial Instruments* – Liabilities | | | | | | | | | | | | | | | | |
Credit Contracts | | | – | | | | (830,255 | ) | | | – | | | | (830,255 | ) |
Foreign Exchange Contracts | | | – | | | | (978,534 | ) | | | – | | | | (978,534 | ) |
Interest Rate Contracts | | | (17,638,491 | ) | | | (41,523,683 | ) | | | – | | | | (59,162,174 | ) |
| | | | (17,638,491 | ) | | | (43,332,472 | ) | | | – | | | | (60,970,963 | ) |
Totals | | $ | (10,078,813 | ) | | $ | 5,206,690,851 | | | $ | 11,949,139 | | | $ | 5,208,561,177 | |
At April 30, 2014, there were no transfers between Levels 1 and 2.
A roll forward of fair value measurements using significant unobservable inputs (Level 3) for the six months ended April 30, 2014, was as follows:
| | | | | | | | | | | | | | | | | | | | | | | | | | | | | | | | | | | | |
| | | Beginning
Balance
10/31/13 | | | Purchases | | | Sales | | | Accrued
Discount
(Premiums) | | | Net
Realized
Gain
(Loss) | | | Net Change
in Unrealized
Appreciation/
Depreciation | | | Transfers
into
Level 3 | | | Transfers
out of
Level 3** | | | Ending
Balance
4/30/14 | |
Investments in Securities – Assets | |
Corporate Bonds & Notes: | | | | | | | | | | | | | | | | | | | | | | | | | | | | | | | | | | | | |
Diversified Financial Services | | | $11,000,000 | | | | $ – | | | | $ – | | | | $(40,650 | ) | | | $ – | | | | $104,650 | | | | $ – | | | | $ – | | | | $11,064,000 | |
Mortgage-Backed Securities | | | 3,429,153 | | | | 436,807 | | | | (269,662 | ) | | | (16 | ) | | | 45 | | | | (775 | ) | | | – | | | | (3,178,759 | ) | | | 416,793 | |
Asset-Backed Securities | | | 510,119 | | | | – | | | | (46,575 | ) | | | – | | | | – | | | | 4,802 | | | | – | | | | – | | | | 468,346 | |
Totals | | | $14,939,272 | | | | $436,807 | | | | $(316,237 | ) | | | $(40,666 | ) | | | $ 45 | | | | $108,677 | | | | $ – | | | | $(3,178,759 | ) | | | $11,949,139 | |
The following table presents additional information about valuation techniques and inputs used for investments that are measured at fair value and categorized within Level 3 at April 30, 2014.
| | | | | | | | | | |
| | | Ending Balance
at 4/30/14 | | | Valuation
Technique Used | | Unobservable
Inputs | | Input Values |
Investments in Securities – Assets | | | | | | | |
Corporate Bonds & Notes | | | $11,064,000 | | | Third-Party Pricing Vendor | | Single Broker Quote | | $110.64 |
Mortgage-Backed Securities | | | 416,793 | | | Benchmark Pricing | | Security Price Reset | | $96.25 |
Asset-Backed Securities | | | 468,346 | | | Benchmark Pricing | | Security Price Reset | | $5.95–$84.34 |
| * | | Other financial instruments are derivatives, such as futures contracts, swap agreements and forward foreign currency contracts, which are valued at the unrealized appreciation (depreciation) of the instrument. | |
| ** | | Transferred out of Level 3 into Level 2 because an evaluated price with observable inputs from an independent third-party vendor became available. | |
The net change in unrealized appreciation/depreciation of Level 3 investments held at April 30, 2014, was $96,557. Net realized gain (loss) and net change in unrealized appreciation/depreciation are reflected on the Statement of Operations.
| | | | |
| 70 | | Semi-Annual Report | | | April 30, 2014 |
Schedule of Investments
Fixed Income SHares: Series M
April 30, 2014 (unaudited) (continued)
| (w) | | The following is a summary of the derivative instruments categorized by risk exposure: | |
The effect of derivatives on the Statement of Assets and Liabilities at April 30, 2014:
| | | | | | | | | | | | | | | | |
| Location | | Interest Rate
Contracts | | | Credit
Contracts | | | Foreign
Exchange
Contracts | | | Total | |
Asset derivatives: | | | | | | | | | | | | | | | | |
Investments, at value (options purchased) | | | $38,270 | | | | $– | | | | $– | | | | $38,270 | |
Unrealized appreciation of OTC swaps | | | 997,122 | | | | 3,197,666 | | | | – | | | | 4,194,788 | |
Receivable for variation margin on futures contracts* | | | 1,893,107 | | | | – | | | | – | | | | 1,893,107 | |
Unrealized appreciation of forward foreign currency contracts | | | – | | | | – | | | | 1,980,429 | | | | 1,980,429 | |
Total asset derivatives | | | $2,928,499 | | | | $3,197,666 | | | | $1,980,429 | | | | $8,106,594 | |
Liability derivatives: | | | | | | | | | | | | | | | | |
Unrealized depreciation of OTC swaps | | | $(7,711,292 | ) | | | $(830,255 | ) | | | $– | | | | $(8,541,547 | ) |
Payable for variation margin on centrally cleared swaps** | | | (2,799,063 | ) | | | – | | | | – | | | | (2,799,063 | ) |
Options written, at value | | | (833,410 | ) | | | (81,474 | ) | | | (151,777 | ) | | | (1,066,661 | ) |
Payable for variation margin on futures contracts* | | | (2,317,000 | ) | | | – | | | | – | | | | (2,317,000 | ) |
Unrealized depreciation of forward foreign currency contracts | | | – | | | | – | | | | (978,534 | ) | | | (978,534 | ) |
Total liability derivatives | | | $(13,660,765 | ) | | | $(911,729 | ) | | | $(1,130,311 | ) | | | $(15,702,805 | ) |
| * | | Included in net unrealized depreciation of $10,078,813 on futures contracts as reported in note (m) of the Notes to Schedule of Investments. | |
| ** | | Included in net unrealized depreciation of $33,812,391 on centrally cleared swaps as reported in note (p) of the Notes to Schedule of Investments. | |
The effect of derivatives on the Statement of Operations for the six months ended April 30, 2014:
| | | | | | | | | | | | | | | | |
| Location | | Interest Rate
Contracts | | | Credit
Contracts | | | Foreign
Exchange
Contracts | | | Total | |
Net realized gain (loss) on: | | | | | | | | | | | | | | | | |
Investments (options purchased) | | | $(41,724 | ) | | | $– | | | | $– | | | | $(41,724 | ) |
Futures contracts | | | 54,940 | | | | – | | | | – | | | | 54,940 | |
Options written | | | 19,698,297 | | | | 1,074,780 | | | | 877,393 | | | | 21,650,470 | |
Swaps | | | (13,442,676 | ) | | | 1,274,821 | | | | – | | | | (12,167,855 | ) |
Foreign currency transactions (forward foreign currency contracts) | | | – | | | | – | | | | 5,311,720 | | | | 5,311,720 | |
Total net realized gain | | | $6,268,837 | | | | $2,349,601 | | | | $6,189,113 | | | | $14,807,551 | |
Net change in unrealized appreciation/depreciation of: | | | | | | | | | | | | | | | | |
Investments (options purchased) | | | $(19,877 | ) | | | $– | | | | $– | | | | $(19,877 | ) |
Futures contracts | | | (14,922,000 | ) | | | – | | | | – | | | | (14,922,000 | ) |
Options written | | | (8,375,882 | ) | | | 384,726 | | | | 1,020,383 | | | | (6,970,773 | ) |
Swaps | | | (12,825,196 | ) | | | 292,767 | | | | – | | | | (12,532,429 | ) |
Foreign currency transactions (forward foreign currency contracts) | | | – | | | | – | | | | (874,629 | ) | | | (874,629 | ) |
Total net change in unrealized appreciation/depreciation | | | $(36,142,955 | ) | | | $677,493 | | | | $145,754 | | | | $(35,319,708 | ) |
The average volume (measured at each fiscal quarter-end) of derivative activity during the six months ended April 30, 2014:
| | | | | | | | | | | | | | | | | | | | | | | | | | | | | | | | | | | | | | | | |
Options
Purchased(1) | | Options
Purchased(2) | | | Options
Written(1) | | | Options
Written(2) | | | Futures
Contracts(1) | | | Forward Foreign
Currency Contracts(3) | | | Credit Default
Swap Agreements(2) | | | Interest Rate
Swap
Agreements(2) | |
| | | | | | | | | | | | Long | | | Short | | | Purchased | | | Sold | | | Buy | | | Sell | | | | |
840 | | | $222,000 | | | | 179 | | | | $8,892,467 | | | | 13,082 | | | | (1,156 | ) | | | $322,431,623 | | | | $211,209,572 | | | | $12,533 | | | | $103,333 | | | | $755,733 | |
| | | | | | | | | | | | | | | | | | | | | | | | | | | | | | | | | | | € 8,200 | | | | BRL 277,733 | |
| | | | | | | | | | | | | | | | | | | | | | | | | | | | | | | | | | | | | | | ¥ 4,860,000 | |
| | | | | | | | | | | | | | | | | | | | | | | | | | | | | | | | | | | | | | | MXN 329,400 | |
| (2) | | Notional Amount (in thousands) | |
| (3) | | U.S. $ Value on origination date | |
| | | | | | |
| April 30, 2014 | | | Semi-Annual Report | | | 71 | |
Schedule of Investments
Fixed Income SHares: Series M
April 30, 2014 (unaudited) (continued)
| (x) | | The following tables present by counterparty the Portfolio’s derivative assets and liabilities net of related collateral held by the Fund at April 30, 2014 which has not been offset in the Statement of Assets and Liabilities, but would be available for offset to the extent of a default by the counterparty to the transaction. | |
Financial Assets and Derivative Assets, and Collateral Received at April 30, 2014:
| | | | | | | | | | | | | | | | |
| Gross Amounts Not Offset in the Statement of Assets and Liabilities | |
| Counterparty | | Gross Asset Derivatives
Presented in Statement
of Assets and Liabilities | | | Financial
Instrument/
Derivative
Offset | | | Cash
Collateral
Received | | | Net Amount | |
Foreign Currency Exchange Contracts | | | | | | | | | | | | | | | | |
Bank of America | | | $760,887 | | | | $(498,725 | ) | | | $(190,000 | ) | | | $72,162 | |
BNP Paribas | | | 129,155 | | | | – | | | | – | | | | 129,155 | |
Citigroup | | | 73,066 | | | | (73,066 | ) | | | – | | | | – | |
Goldman Sachs | | | 10,541 | | | | (10,541 | ) | | | – | | | | – | |
Morgan Stanley | | | 51,392 | | | | (51,392 | ) | | | – | | | | – | |
Royal Bank of Scotland | | | 800,701 | | | | – | | | | (790,000 | ) | | | 10,701 | |
UBS | | | 154,687 | | | | (154,687 | ) | | | – | | | | – | |
Swaps | | | | | | | | | | | | | | | | |
Bank of America | | | 397,396 | | | | (397,396 | ) | | | – | | | | – | |
Barclays Bank | | | 388,554 | | | | (388,554 | ) | | | – | | | | – | |
Deutsche Bank | | | 33,042 | | | | (33,042 | ) | | | – | | | | – | |
Goldman Sachs | | | 3,164,624 | | | | (1,390 | ) | | | (3,163,234 | )†,# | | | – | |
HSBC Bank | | | 211,172 | | | | – | | | | (211,172 | )†,# | | | – | |
Totals | | | $6,175,217 | | | | $(1,608,793 | ) | | | $(4,354,406 | ) | | | $212,018 | |
| | | | | | | | | | | | |
| Gross Amounts Not Offset in the Statement of Assets and Liabilities | |
| Counterparty | | Gross Financial Assets
Presented in Statement
of Assets and Liabilities | | | Financial
Instrument/
Derivative
Offset | | | Net Amount | |
Repurchase Agreement | | | | | | | | | | | | |
State Street Bank & Trust Co. | | | $1,604,000 | | | | $(1,604,000 | )† | | | $– | |
Financial Liabilities and Derivative Liabilities, and Collateral Pledged at April 30, 2014:
| | | | | | | | | | | | | | | | |
| Gross Amounts Not Offset in the Statement of Assets and Liabilities | |
| Counterparty | | Gross Liability Derivatives
Presented in Statement
of Assets and Liabilities | | | Financial
Instrument/
Derivative
Offset | | | Cash
Collateral
Received
(Pledged) | | | Net Amount | |
Foreign Currency Exchange Contracts | | | | | | | | | | | | | | | | |
Bank of America | | | $367,725 | | | | $(367,725 | ) | | | $– | | | | $– | |
Citigroup | | | 541,099 | | | | (541,099 | )†† | | | – | | | | – | |
Goldman Sachs | | | 11,931 | | | | (11,931 | ) | | | – | | | | – | |
Morgan Stanley | | | 50,145 | | | | (50,145 | ) | | | – | | | | – | |
UBS | | | 7,634 | | | | (7,634 | ) | | | – | | | | – | |
Swaps | | | | | | | – | | | | | | | | | |
Bank of America | | | 528,396 | | | | (528,396 | ) | | | – | | | | – | |
Barclays Bank | | | 1,207,418 | | | | (1,110,763 | ) | | | – | | | | 96,655 | |
Deutsche Bank | | | 2,298,202 | | | | (2,080,461 | )†† | | | (217,741 | )## | | | – | |
Morgan Stanley | | | 547,174 | | | | (617,490 | ) | | | 1,000,529 | # | | | 930,213 | |
UBS | | | 3,960,357 | | | | (3,960,357 | )†† | | | – | | | | – | |
Totals | | | $9,520,081 | | | | $(9,276,001 | ) | | | $782,788 | | | | $1,026,868 | |
| | | | |
| 72 | | Semi-Annual Report | | | April 30, 2014 |
Schedule of Investments
Fixed Income SHares: Series M
April 30, 2014 (unaudited) (continued)
| | | | | | | | | | | | | | | | |
| Counterparty | | Gross Financial Liability
Presented in Statement of
Assets and Liabilities | | | Financial
Instrument/
Derivative
Offset | | | Cash
Collateral
Pledged | | | Net Amount | |
Reverse Repurchase Agreements | | | | | | | | | | | | | | | | |
Bank of America | | | $259,400,227 | ††† | | | $(259,335,495 | ) | | | – | | | | $64,732 | |
Barclays Bank | | | 129,322,500 | ††† | | | (129,146,157 | ) | | | – | | | | 176,343 | |
Deutsche Bank | | | 497,035,491 | ††† | | | (496,525,927 | ) | | | – | | | | 509,564 | |
Royal Bank of Scotland | | | 547,522,980 | ††† | | | (547,522,980 | )†† | | | – | | | | – | |
Totals | | | $1,433,281,198 | | | | $(1,432,530,559 | ) | | | – | | | | $750,639 | |
| † | | The actual collateral received is greater than the amount shown here due to over collateralization. | |
| †† | | The actual collateral pledged is greater than the amount shown here due to over collateralization. | |
| ††† | | The amount includes interest payable for Reverse Repurchase Agreements. | |
| # | | The amount includes upfront premiums received. | |
| ## | | The amount includes upfront premiums paid. | |
Glossary:
| | | | |
| ABS | | - | | Asset-Backed Securities |
| BRL | | - | | Brazilian Real |
| £ | | - | | British Pound |
| CAD | | - | | Canadian Dollar |
| CBOT | | - | | Chicago Board of Trade |
| CDI | | - | | Inter-Bank Deposit Certificate |
| CDX.IG | | - | | Credit Derivatives Index Investment Grade |
| CME | | - | | Chicago Mercantile Exchange |
| CMO | | - | | Collateralized Mortgage Obligation |
| CP | | - | | Certificates of Participation |
| EURIBOR | | - | | Euro Inter-Bank Offered Rate |
| € | | - | | Euro |
| GO | | - | | General Obligation Bond |
| JPY/¥ | | - | | Japanese Yen |
| LIBOR | | - | | London Inter-Bank Offered Rate |
| MBS | | - | | Mortgage-Backed Securities |
| MXN | | - | | Mexican Peso |
| OTC | | - | | Over-the-Counter |
| TBA | | - | | To Be Announced |
| TIIE | | - | | Inter-Bank Equilibrium Interest Rate |
| | | | | | | | |
| See accompanying Notes to Financial Statements | | | April 30, 2014 | | | Semi-Annual Report | | | 73 | |
Schedule of Investments
Fixed Income SHares: Series R
April 30, 2014 (unaudited)
| | | | | | | | | | |
Principal
Amount
(000s) | | | | | | | Value | |
| | U.S. Treasury Obligations – 105.4% | | | | | | |
| | | | U.S. Treasury Inflation Indexed Bonds (e), | | | | | | |
| | $23,801 | | | 0.125%, 4/15/19 | | | | | $24,304,419 | |
| | 933 | | | 0.125%, 1/15/22 | | | | | 923,480 | |
| | 3,834 | | | 1.375%, 2/15/44 (d) | | | | | 4,046,219 | |
| | 43,814 | | | 1.75%, 1/15/28 | | | | | 49,408,271 | |
| | 591 | | | 2.00%, 1/15/26 | | | | | 683,558 | |
| | 1,048 | | | 2.375%, 1/15/27 | | | | | 1,263,498 | |
| | 31,162 | | | 2.50%, 1/15/29 | | | | | 38,514,176 | |
| | | | U.S. Treasury Inflation Indexed Notes (e), | | | | | | |
| | 319 | | | 0.125%, 4/15/16 (f) | | | | | 328,357 | |
| | 3,936 | | | 0.125%, 4/15/17 (d)(f) | | | | | 4,061,494 | |
| | 18,735 | | | 0.125%, 4/15/18 (d) | | | | | 19,254,368 | |
| | 6,840 | | | 0.125%, 7/15/22 | | | | | 6,764,750 | |
| | 4,678 | | | 0.125%, 1/15/23 | | | | | 4,575,634 | |
| | 1,210 | | | 0.375%, 7/15/23 | | | | | 1,211,056 | |
| | 11,403 | | | 0.50%, 4/15/15 (d) | | | | | 11,621,576 | |
| | 3,125 | | | 0.625%, 7/15/21 | | | | | 3,244,571 | |
| | 1,556 | | | 1.125%, 1/15/21 | | | | | 1,664,491 | |
| | 38,717 | | | 1.25%, 7/15/20 (d)(f)(g) | | | | | 42,034,887 | |
| | 326 | | | 1.375%, 1/15/20 (f)(g) | | | | | 354,196 | |
| | 7,377 | | | 1.625%, 1/15/15 (d) | | | | | 7,558,395 | |
| | 3,143 | | | 1.875%, 7/15/15 (d)(f) | | | | | 3,291,087 | |
| | 8,364 | | | 1.875%, 7/15/19 (d) | | | | | 9,369,739 | |
| | 22,228 | | | 2.625%, 7/15/17 (d) | | | | | 24,936,992 | |
| | | | U.S. Treasury Notes (f), | | | | | | |
| | 600 | | | 0.25%, 1/15/15 | | | | | 600,762 | |
| | 512 | | | 0.25%, 1/31/15 | | | | | 512,690 | |
| | Total U.S. Treasury Obligations (cost-$264,096,079) | | | | | 260,528,666 | |
| | Sovereign Debt Obligations – 24.3% | | | | | | |
| | | | Australia – 3.7% | | | | | | |
| | AUD 5,100 | | | Australia Government Bond, 5.50%, 4/21/23 | | | | | 5,328,514 | |
| | | | New South Wales Treasury Corp. (e), | | | | | | |
| | 300 | | | 2.50%, 11/20/35, Ser. CI-B2 | | | | | 338,173 | |
| | 2,900 | | | 2.75%, 11/20/25, Ser. CI-B1 | | | | | 3,495,994 | |
| | | | | | | | | | 9,162,681 | |
| | | | Denmark – 3.0% | | | | | | |
| | DKK 40,387 | | | Denmark I/L Government Bond, 0.10%, 11/15/23, Ser. B (e) | | | | | 7,433,731 | |
| | | | Germany – 3.4% | | | | | | |
| | €5,691 | | | Bundesrepublik Deutschland Bundesobligation Inflation Linked Bond, | | | | | | |
| | | | | 0.75%, 4/15/18 (e) | | | | | 8,334,911 | |
| | | | Ireland – 0.4% | | | | | | |
| | $900 | | | VEB Finance PLC for Vnesheconombank, 5.45%, 11/22/17 (a)(c) | | | | | 885,375 | |
| | | | Italy – 3.9% | | | | | | |
| | | | Italy Buoni Poliennali Del Tesoro, | | | | | | |
| | €3,008 | | | 1.70%, 9/15/18 (e) | | | | | 4,376,388 | |
| | 106 | | | 2.10%, 9/15/16 (e) | | | | | 154,405 | |
| | | | |
| 74 | | Semi-Annual Report | | | April 30, 2014 |
Schedule of Investments
Fixed Income SHares: Series R
April 30, 2014 (unaudited) (continued)
| | | | | | | | | | |
Principal
Amount
(000s) | | | | | | | Value | |
| | | | Italy (continued) | | | | | | |
| | €1,504 | | | 2.10%, 9/15/21 (e) | | | | | $2,195,290 | |
| | 300 | | | 2.55%, 10/22/16 (e) | | | | | 434,180 | |
| | 210 | | | 3.10%, 9/15/26 (e) | | | | | 324,987 | |
| | 1,100 | | | 4.75%, 9/15/16 | | | | | 1,661,492 | |
| | 400 | | | 5.25%, 8/1/17 | | | | | 625,261 | |
| | | | | | | | | | 9,772,003 | |
| | | | Mexico – 1.9% | | | | | | |
| | | | Mexican Bonos de Proteccion al Ahorro (e)(h), | | | | | | |
| | MXN 59,800 | | | 3.56%, 1/30/20 | | | | | 4,557,628 | |
| | 1,200 | | | 3.57%, 6/29/17 | | | | | 91,560 | |
| | | | | | | | | | 4,649,188 | |
| | | | New Zealand – 0.4% | | | | | | |
| | NZD 1,200 | | | New Zealand Government Bond, 3.00%, 9/20/30 (e) | | | | | 1,062,283 | |
| | | | Spain – 7.6% | | | | | | |
| | | | Spain Government Bond, | | | | | | |
| | €9,100 | | | 2.75%, 4/30/19 | | | | | 13,268,495 | |
| | 3,300 | | | 5.40%, 1/31/23 (a)(c) | | | | | 5,492,576 | |
| | | | | | | 18,761,071 | |
| | Total Sovereign Debt Obligations (cost-$58,210,330) | | | | | 60,061,243 | |
| | Corporate Bonds & Notes – 13.6% | | | | | | |
| | | | Airlines – 2.1% | | | | | | |
| | $5,000 | | | United Airlines, Inc., 6.75%, 9/15/15 (a)(c) | | | | | 5,093,750 | |
| | | | Banking – 3.2% | | | | | | |
| | 700 | | | Ally Financial, Inc., 2.436%, 12/1/14 (h) | | | | | 704,136 | |
| | €400 | | | Bank of America Corp., 0.752%, 7/22/14 (h) | | | | | 555,368 | |
| | $4,400 | | | BNP Paribas, 0.683%, 5/7/17 (d)(h) | | | | | 4,400,000 | |
| | 300 | | | CIT Group, Inc., 4.75%, 2/15/15 (a)(c) | | | | | 308,438 | |
| | £770 | | | LBG Capital No. 2 PLC, 15.00%, 12/21/19 | | | | | 1,891,598 | |
| | | | | | | 7,859,540 | |
| | | | Chemicals – 0.5% | | | | | | |
| | $1,000 | | | RPM International, Inc., 6.50%, 2/15/18 | | | | | 1,148,398 | |
| | | | Diversified Financial Services – 0.9% | | | | | | |
| | 1,800 | | | Credit Agricole Home Loan SFH, 0.987%, 7/21/14 (a)(c)(h) | | | | | 1,802,437 | |
| | 500 | | | International Lease Finance Corp., 6.50%, 9/1/14 (a)(c) | | | | | 511,250 | |
| | | | | | | 2,313,687 | |
| | | | Insurance – 4.2% | | | | | | |
| | 3,000 | | | Marsh & McLennan Cos., Inc., 9.25%, 4/15/19 | | | | | 3,916,890 | |
| | 6,100 | | | Stone Street Trust, 5.902%, 12/15/15 (a)(c) | | | | | 6,543,415 | |
| | | | | | | 10,460,305 | |
| | | | Media – 2.1% | | | | | | |
| | 5,000 | | | DISH DBS Corp., 6.625%, 10/1/14 | | | | | 5,125,000 | |
| | | | Oil & Gas – 0.6% | | | | | | |
| | 1,440 | | | Odebrecht Drilling Norbe VIII/IX Ltd., 6.35%, 6/30/21 (a)(c) | | | | | 1,521,000 | |
| | Total Corporate Bonds & Notes (cost-$31,696,030) | | | | | 33,521,680 | |
| | | | | | |
| April 30, 2014 | | | Semi-Annual Report | | | 75 | |
Schedule of Investments
Fixed Income SHares: Series R
April 30, 2014 (unaudited) (continued)
| | | | | | | | | | |
Principal
Amount
(000s) | | | | | | | Value | |
| | Mortgage-Backed Securities – 8.8% | | | | | | |
| | | | Bear Stearns Adjustable Rate Mortgage Trust, CMO (h), | | | | | | |
| | $22 | | | 2.21%, 8/25/35 | | | | | $22,423 | |
| | 17 | | | 2.533%, 3/25/35 | | | | | 17,060 | |
| | 67 | | | 2.56%, 3/25/35 | | | | | 68,595 | |
| | | | Citigroup Mortgage Loan Trust, Inc., CMO (h), | | | | | | |
| | 27 | | | 2.20%, 9/25/35 | | | | | 26,899 | |
| | 44 | | | 2.29%, 9/25/35 | | | | | 44,262 | |
| | 650 | | | 2.895%, 9/25/37 | | | | | 545,112 | |
| | 4,864 | | | Commercial Mortgage Trust, 3.156%, 7/10/46, CMO (a)(c) | | | | | 4,982,951 | |
| | | | Countrywide Alternative Loan Trust, CMO (h), | | | | | | |
| | 2,145 | | | 0.352%, 12/20/46 | | | | | 1,631,179 | |
| | 488 | | | 1.129%, 2/25/36 | | | | | 432,523 | |
| | | | Countrywide Home Loan Mortgage Pass-Through Trust, CMO (h), | | | | | | |
| | 18 | | | 0.494%, 6/25/35 (a)(c) | | | | | 16,469 | |
| | 671 | | | 2.518%, 4/20/35 | | | | | 685,239 | |
| | £598 | | | Granite Mortgages PLC, 0.843%, 3/20/44, CMO (h) | | | | | 1,004,497 | |
| | $96 | | | GSR Mortgage Loan Trust, 2.651%, 9/25/35, CMO (h) | | | | | 97,498 | |
| | 618 | | | Merrill Lynch Mortgage Investors Trust, 1.596%, 10/25/35, CMO (h) | | | | | 607,434 | |
| | | | NCUA Guaranteed Notes Trust, CMO, | | | | | | |
| | 3,505 | | | 0.526%, 11/6/17 (h) | | | | | 3,513,539 | |
| | 6,780 | | | 2.65%, 10/29/20 | | | | | 6,968,512 | |
| | 346 | | | Residential Accredit Loans, Inc., 0.334%, 6/25/46, CMO (h) | | | | | 154,322 | |
| | AUD 609 | | | Swan Trust, 3.935%, 4/25/41, CMO (h) | | | | | 570,213 | |
| | $296 | | | Wachovia Bank Commercial Mortgage Trust, 5.088%, 8/15/41, CMO (h) | | | | | 297,069 | |
| | Total Mortgage-Backed Securities (cost-$20,901,322) | | | | | 21,685,796 | |
| | Asset-Backed Securities – 1.0% | | | | | | |
| | 76 | | | Ares VIR CLO Ltd., 0.462%, 3/12/18 (a)(c)(h) | | | | | 76,249 | |
| | 294 | | | Bear Stearns Asset-Backed Securities I Trust, 1.154%, 10/25/37 (h) | | | | | 274,455 | |
| | 352 | | | Citigroup Mortgage Loan Trust, Inc., 0.234%, 1/25/37 (h) | | | | | 216,127 | |
| | 216 | | | JPMorgan Mortgage Acquisition Corp., 0.644%, 7/25/35 (h) | | | | | 214,298 | |
| | €245 | | | Magi Funding PLC, 0.591%, 4/11/21 (a)(c)(h) | | | | | 335,857 | |
| | $160 | | | Massachusetts Educational Financing Auth., 1.189%, 4/25/38 (h) | | | | | 161,305 | |
| | 115 | | | Park Place Securities, Inc. Asset-Backed Pass-Through Certificates, 0.574%, 6/25/35 (h) | | | | | 114,854 | |
| | 400 | | | Residential Asset Securities Corp., 0.572%, 12/25/35 (h) | | | | | 317,177 | |
| | 365 | | | Saxon Asset Securities Trust, 4.034%, 6/25/33 | | | | | 370,920 | |
| | 116 | | | Structured Asset Securities Corp. Mortgage Loan Trust, 1.154%, 8/25/37 (h) | | | | | 108,584 | |
| | €120 | | | Wood Street CLO II BV, 0.666%, 3/29/21 (a)(c)(h) | | | | | 164,539 | |
| | Total Asset-Backed Securities (cost-$2,340,158) | | | | | 2,354,365 | |
| | U.S. Government Agency Securities (h) – 0.2% | | | | | | |
| | | | Fannie Mae, | | | | | | |
| | $197 | | | 0.599%, 2/25/37, CMO | | | | | 197,432 | |
| | 9 | | | 1.326%, 10/1/44, MBS | | | | | 9,325 | |
| | | | Freddie Mac, MBS, | | | | | | |
| | 125 | | | 2.09%, 7/1/36 | | | | | 133,305 | |
| | 130 | | | 2.137%, 9/1/36 | | | | | 137,823 | |
| | Total U.S. Government Agency Securities (cost-$462,971) | | | | | 477,885 | |
| | | | |
| 76 | | Semi-Annual Report | | | April 30, 2014 |
Schedule of Investments
Fixed Income SHares: Series R
April 30, 2014 (unaudited) (continued)
| | | | | | | | | | |
Principal
Amount
(000s) | | | | | | | Value | |
| | Senior Loans – 0.1% | | | | | | |
| | | | Electric Utilities – 0.1% | | | | | | |
| | $208 | | | AES Corp., 3.75%, 6/1/18, Term B (a)(b) (cost-$207,592) | | | | | $208,677 | |
| | Short-Term Investments – 3.1% | | | | | | |
| | | | Sovereign Debt Obligations – 1.9% | | | | | | |
| | | | Greece – 1.9% | | | | | | |
| | | | Hellenic Treasury Bill, | | | | | | |
| | €1,700 | | | 2.535%, 7/18/14 | | | | | 2,351,419 | |
| | 1,700 | | | 2.585%, 7/18/14 | | | | | 2,351,418 | |
| | Total Sovereign Debt Obligations (cost-$4,669,703) | | | | | 4,702,837 | |
| | | | U.S. Treasury Obligations (f) – 1.2% | | | | | | |
| | $2,667 | | | U.S. Treasury Bills, 0.046%-0.076%, 5/8/14-10/30/14 (i) | | | | | 2,666,770 | |
| | 206 | | | U.S. Treasury Notes, 0.25%, 12/15/14 | | | | | 206,245 | |
| | Total U.S. Treasury Obligations (cost-$2,872,829) | | | | | 2,873,015 | |
| | | | Repurchase Agreements – 0.0% | | | | | | |
| | 116 | | | State Street Bank and Trust Co., | | | | | | |
| | | | dated 4/30/14, 0.00%, due 5/1/14, | | | | | | |
| | | | proceeds $116,000; collateralized by | | | | | | |
| | | | Fannie Mae, 2.26%, due 10/17/22, | | | | | | |
| | | | | valued at $118,348 including accrued interest (cost-$116,000) | | | | | 116,000 | |
| | Total Short-Term Investments (cost-$7,658,532) | | | | | 7,691,852 | |
| | | |
Notional
Amount
(000s) | | | | | | | | |
| | Options Purchased (j) – 0.0% | | | | | | |
| | | | Put Options – 0.0% | | | | | | |
| | €7,800 | | | 5-Year Interest Rate Swap (OTC), Receive 6-Month EUR-EURIBOR Floating Rate Index, strike rate 1.00%, expires 10/29/14 | | | | | 100,711 | |
| | $44 | | | U.S. Treasury 10-Year Note Futures, (CBOT), strike price $112.00, expires 5/23/14 | | | | | 682 | |
| | | | U.S. Treasury 5-Year Note Futures, (CBOT), | | | | | | |
| | $392 | | | strike price $113.00, expires 5/23/14 | | | | | 3,037 | |
| | $230 | | | strike price $114.50, expires 5/23/14 | | | | | 1,778 | |
| | Total Options Purchased (cost-$122,436) | | | | | 106,208 | |
| | Total Investments, before options written (cost-$385,695,450) – 156.5% | | | | | 386,636,372 | |
| | Options Written (j) – (0.1)% | | | | | | |
| | | | Call Options – (0.0)% | | | | | | |
| | $6,500 | | | Inflation Cap CPURNSA Index (OTC), Exercise Index=Maximum of ((Index Final/Index Initial-1)-4.00%) or 0, strike price $4.00, expires 4/22/24 | | | | | (46,070 | ) |
| | €2,700 | | | iTraxx EU21 5Y Index (OTC), strike price $0.65, expires 6/18/14 | | | | | (2,861 | ) |
| | | | U.S. Dollar versus Brazilian Real, (OTC), | | | | | | |
| | $6,470 | | | strike price $2.505, expires 6/10/14 | | | | | (3,442 | ) |
| | $2,779 | | | strike price $2.523, expires 6/11/14 | | | | | (1,287 | ) |
| | $3,477 | | | strike price $2.506, expires 6/20/14 | | | | | (3,310 | ) |
| | $3,875 | | | strike price $2.468, expires 6/25/14 | | | | | (6,909 | ) |
| | | | | | |
| April 30, 2014 | | | Semi-Annual Report | | | 77 | |
Schedule of Investments
Fixed Income SHares: Series R
April 30, 2014 (unaudited) (continued)
| | | | | | | | | | |
Contracts/
Notional
Amount
(000s) | | | | | | | Value | |
| | | | Call Options (continued) | | | | | | |
| | | | U.S. Dollar versus Indian Rupee, (OTC), | | | | | | |
| | $3,091 | | | strike price $64.20, expires 6/11/14 | | | | | $(7,811 | ) |
| | $2,859 | | | strike price $64.70, expires 6/12/14 | | | | | (5,804 | ) |
| | $2,612 | | | strike price $64.90, expires 6/19/14 | | | | | (6,266 | ) |
| | $2,116 | | | strike price $64.00, expires 6/26/14 | | | | | (9,339 | ) |
| | 90 | | | U.S. Treasury 5-Year Note Futures, (CBOT), strike price $120.00, expires 5/23/14 | | | | | (13,553 | ) |
| | | | | | | | | | (106,652 | ) |
| | | | Put Options – (0.1)% | | | | | | |
| | €15,600 | | | 5-Year Interest Rate Swap (OTC), Pay 6-Month EUR-EURIBOR Floating Rate Index, strike rate 1.25%, expires 10/29/14 | | | | | (97,801 | ) |
| | | | Inflation Floor CPURNSA Index (OTC), Exercise Index=Maximum of ((1+0.00%)^10-(Index Final/Index Initial)) or $0, | | | | | | |
| | $1,800 | | | strike index 0.001, expires 1/22/18 | | | | | (7,545 | ) |
| | $32,200 | | | strike index 216.687, expires 4/7/20 | | | | | (25,721 | ) |
| | $1,500 | | | strike index 217.965, expires 9/29/20 | | | | | (1,148 | ) |
| | $1,500 | | | Inflation Floor CPURNSA Index (OTC), Exercise Index=Maximum of (0.00%-(Index Final/Index Initial-1)) or $0, strike index 215.949, expires 3/10/20 | | | | | (809 | ) |
| | €11,300 | | | iTraxx EU20 5Y Index (OTC), strike price $0.90, expires 6/18/14 | | | | | (3,635 | ) |
| | | | iTraxx EU21 5Y Index (OTC), | | | | | | |
| | €2,700 | | | strike price $0.90, expires 6/18/14 | | | | | (2,178 | ) |
| | €700 | | | strike price $1.00, expires 6/18/14 | | | | | (285 | ) |
| | €4,100 | | | strike price $0.95, expires 9/17/14 | | | | | (11,400 | ) |
| | €4,900 | | | strike price $1.10, expires 9/17/14 | | | | | (7,966 | ) |
| | $3,477 | | | U.S. Dollar versus Brazilian Real, (OTC), strike price $2.20, expires 6/20/14 | | | | | (22,406 | ) |
| | $2,501 | | | U.S. Dollar versus Japanese Yen, (OTC), strike price $100.00, expires 6/5/14 | | | | | (4,992 | ) |
| | | | | | | | | | (185,886 | ) |
| | Total Options Written (premiums received-$955,930) | | | | | (292,538 | ) |
| | Total Investments, net of options written (cost-$384,739,520) – 156.4% | | | | | 386,343,834 | |
| | Other liabilities in excess of other assets – (56.4)% | | | | | (139,264,355 | ) |
| | Net Assets – 100.0% | | | | | $247,079,479 | |
Notes to Schedule of Investments:
| (a) | | Private Placement–Restricted as to resale and may not have a readily available market. Securities with an aggregate value of $27,942,983, representing 11.3% of net assets. | |
| (b) | | These securities generally pay interest at rates which are periodically pre-determined by reference to a base lending rate plus a premium. These base lending rates are generally either the lending rate offered by one or more major European banks, such as the “LIBOR” or the prime rate offered by one or more major United States banks, or the certificate of deposit rate. These securities are generally considered to be restricted as the Portfolio is ordinarily contractually obligated to receive approval from the Agent bank and/or borrower prior to disposition. Remaining maturities of senior loans may be less than the stated maturities shown as a result of contractual or optional payments by the borrower. Such prepayments cannot be predicted with certainty. The interest rate disclosed reflects the rate in effect on April 30, 2014. | |
| (c) | | 144A–Exempt from registration under Rule 144A of the Securities Act of 1933. These securities may be resold in transactions exempt from registration, typically only to qualified institutional buyers. Unless otherwise indicated, these securities are not considered to be illiquid. | |
| (d) | | When-issued or delayed-delivery. To be settled/delivered after April 30, 2014. | |
| (e) | | Inflationary Bonds–Principal amount of security is adjusted for inflation/deflation. | |
| | | | |
| 78 | | Semi-Annual Report | | | April 30, 2014 |
Schedule of Investments
Fixed Income SHares: Series R
April 30, 2014 (unaudited) (continued)
| (f) | | All or partial amount segregated for the benefit of the counterparty as collateral for derivatives and/or when-issued or delayed-delivery securities. | |
| (g) | | All or partial amount segregated for the benefit of the counterparty as collateral for options written. | |
| (h) | | Variable or Floating Rate Security–Securities with an interest rate that changes periodically. The interest rate disclosed reflects the rate in effect on April 30, 2014. | |
| (i) | | Rates reflect the effective yields at purchase date. | |
| (j) | | Non-income producing. | |
| (k) | | Futures contracts outstanding at April 30, 2014: | |
| | | | | | | | | | | | | | | | | | |
| Type | | Contracts | | | Market
Value
(000s) | | | Expiration
Date | | | Unrealized
Appreciation
(Depreciation) | |
| Long: | | 10-Year U.S. Treasury Note Futures | | | 44 | | | | $5,475 | | | | 6/19/14 | | | | $21,263 | |
| | 5-Year U.S. Treasury Note Futures | | | 622 | | | | 74,300 | | | | 6/30/14 | | | | (258,244 | ) |
| | Financial Futures Euro-90 day | | | 19 | | | | 4,713 | | | | 9/14/15 | | | | 4,885 | |
| | Financial Futures Euro-90 day | | | 151 | | | | 37,246 | | | | 3/14/16 | | | | (94,416 | ) |
| Short: | | 10-Year Euro-Bund | | | (18 | ) | | | (11 | ) | | | 5/23/14 | | | | 367 | |
| | | | | | | | | | | | | | | | | | |
| | | | | | | | | | | | | | | | | $(326,145 | ) |
| | | | | | | | | | | | | | | | | | |
| (l) | | Transactions in options written for the six months ended April 30, 2014: | |
| | | | | | | | | | | | | | | | |
| | | Contracts | | | Notional
Amount
(000s) | | | Notional
Amount
(000s) | | | Premiums | |
| Options outstanding, October 31, 2013 | | | 93 | | | | $262,500 | | | | €56,000 | | | | $1,638,067 | |
| Options written | | | 90 | | | | 92,157 | | | | 42,000 | | | | 725,888 | |
| Options terminated in closing transactions | | | – | | | | (52,400 | ) | | | – | | | | (105,418 | ) |
| Options expired | | | (93 | ) | | | – | | | | (28,000 | ) | | | (1,245,042 | ) |
| Options exercised | | | – | | | | (225,500 | ) | | | (28,000 | ) | | | (57,565 | ) |
| | | | | | | | | | | | | | | | |
| Options outstanding, April 30, 2014 | | | 90 | | | | $76,757 | | | | €42,000 | | | | $955,930 | |
| | | | | | | | | | | | | | | | |
| (m) | | Credit default swap agreements outstanding at April 30, 2014: | |
OTC buy protection swap agreements:
| | | | | | | | | | | | | | | | | | | | | | | | | | | | |
Swap Counterparty/
Referenced Debt Issuer | | Notional
Amount
(000s)(1) | | | Credit
Spread | | | Termination
Date | | | Payments
Made | | | Value(2) | | | Upfront
Premiums
Paid
(Received) | | | Unrealized
Depreciation | |
| Bank of America: | | | | | | | | | | | | | | | | | | | | | | | | | | | | |
Marsh & McLennan Cos., Inc. | | | $3,000 | | | | 0.34 | % | | | 6/20/19 | | | | (0.90 | )% | | | $(87,815 | ) | | | $– | | | | $(87,815 | ) |
| Goldman Sachs: | | | | | | | | | | | | | | | | | | | | | | | | | | | | |
RPM International, Inc. | | | 1,000 | | | | 0.44 | % | | | 3/20/18 | | | | (1.50 | )% | | | (42,542 | ) | | | – | | | | (42,542 | ) |
| | | | | | | | | | | | | | | | | | | | | | | | | | | | |
| | | | | | | | | | | | | | | | | | | $(130,357 | ) | | | $– | | | | $(130,357 | ) |
| | | | | | | | | | | | | | | | | | | | | | | | | | | | |
| | | | | | |
| April 30, 2014 | | | Semi-Annual Report | | | 79 | |
Schedule of Investments
Fixed Income SHares: Series R
April 30, 2014 (unaudited) (continued)
OTC sell protection swap agreements:
| | | | | | | | | | | | | | | | | | | | | | | | | | | | |
Swap Counterparty/
Referenced Debt Issuer | | Notional
Amount
(000s)(1) | | | Credit
Spread | | | Termination
Date | | | Payments
Received | | | Value(2) | | | Upfront
Premiums
Paid
(Received) | | | Unrealized
Appreciation | |
| Bank of America: | | | | | | | | | | | | | | | | | | | | | | | | | | | | |
Brazilian Government International Bond | | | $100 | | | | 1.39 | % | | | 3/20/19 | | | | 1.00 | % | | | $(1,692 | ) | | | $(5,135 | ) | | | $3,443 | |
| BNP Paribas: | | | | | | | | | | | | | | | | | | | | | | | | | | | | |
Italy Government International Bond | | | 6,800 | | | | 1.11 | % | | | 3/20/19 | | | | 1.00 | % | | | (25,775 | ) | | | (117,653 | ) | | | 91,878 | |
| Citigroup: | | | | | | | | | | | | | | | | | | | | | | | | | | | | |
Russian Federation Government International Bond | | | 400 | | | | 2.56 | % | | | 3/20/19 | | | | 1.00 | % | | | (27,413 | ) | | | (33,435 | ) | | | 6,022 | |
| Deutsche Bank: | | | | | | | | | | | | | | | | | | | | | | | | | | | | |
Brazilian Government International Bond | | | 2,400 | | | | 1.39 | % | | | 3/20/19 | | | | 1.00 | % | | | (40,632 | ) | | | (121,067 | ) | | | 80,435 | |
| HSBC Bank: | | | | | | | | | | | | | | | | | | | | | | | | | | | | |
Petrobras International Finance Co. - Pifco | | | 2,000 | | | | 1.05 | % | | | 9/20/15 | | | | 1.00 | % | | | 1,001 | | | | (63,728 | ) | | | 64,729 | |
Spain Government International Bond | | | 1,600 | | | | 0.87 | % | | | 3/20/19 | | | | 1.00 | % | | | 11,574 | | | | (12,075 | ) | | | 23,649 | |
| JPMorgan Chase: | | | | | | | | | | | | | | | | | | | | | | | | | | | | |
Brazilian Government International Bond | | | 900 | | | | 1.39 | % | | | 3/20/19 | | | | 1.00 | % | | | (15,237 | ) | | | (45,809 | ) | | | 30,572 | |
HSBC Bank | | | 4,500 | | | | 0.59 | % | | | 6/20/19 | | | | 1.00 | % | | | 97,123 | | | | 55,872 | | | | 41,251 | |
| Morgan Stanley: | | | | | | | | | | | | | | | | | | | | | | | | | | | | |
Brazilian Government International Bond | | | 2,500 | | | | 1.39 | % | | | 3/20/19 | | | | 1.00 | % | | | (42,324 | ) | | | (127,248 | ) | | | 84,924 | |
Spain Government International Bond | | | 3,000 | | | | 0.87 | % | | | 3/20/19 | | | | 1.00 | % | | | 21,701 | | | | (18,418 | ) | | | 40,119 | |
| | | | | | | | | | | | | | | | | | | | | | | | | | | | |
| | | | | | | | | | | | | | | | | | | $(21,674 | ) | | | $(488,696 | ) | | | $467,022 | |
| | | | | | | | | | | | | | | | | | | | | | | | | | | | |
Centrally cleared sell protection swap agreements:
| | | | | | | | | | | | | | | | | | | | | | | | |
Broker (Exchange)/
Referenced Debt Issuer | | Notional
Amount
(000s)(1) | | | Credit
Spread | | | Termination
Date | | | Payments
Received | | | Value(2) | | | Unrealized
Appreciation | |
| Barclays Bank (ICE): | | | | | | | | | | | | | | | | | | | | | | | | |
Dow Jones CDX.IT-21 5-Year Index | | | $10,100 | | | | 1.01 | % | | | 6/20/19 | | | | 1.00 | % | | | $222,860 | | | | $17,717 | |
| Credit Suisse First Boston (ICE): | | | | | | | | | | | | | | | | | | | | | | | | |
Dow Jones CDX.IG-22 5-Year Index | | | 10,100 | | | | 1.02 | % | | | 6/20/19 | | | | 1.00 | % | | | 189,240 | | | | 20,088 | |
Dow Jones CDX.IT-21 10-Year Index | | | 1,300 | | | | 0.99 | % | | | 6/20/24 | | | | 1.00 | % | | | (22,821 | ) | | | 7,565 | |
Dow Jones CDX.IT-21 5-Year Index | | | 9,050 | | | | 1.01 | % | | | 6/20/19 | | | | 1.00 | % | | | 199,691 | | | | 21,712 | |
| | | | | | | | | | | | | | | | | | | | | | | | |
| | | | | | | | | | | | | | | | | | | $588,970 | | | | $67,082 | |
| | | | | | | | | | | | | | | | | | | | | | | | |
| (1) | | This represents the maximum potential amount the Portfolio could be required to make available as a seller of credit protection or receive as a buyer of credit protection if a credit event occurs as defined under the terms of that particular swap agreement. | |
| (2) | | The quoted market prices and resulting values for credit default swap agreements serve as an indicator of the status at April 30, 2014 of the payment/performance risk and represent the likelihood of an expected liability (or profit) for the credit derivative should the notional amount of the swap agreement have been closed/sold as of the period end. Increasing market values, in absolute terms when compared to the notional amount of the swap, represent a deterioration of the referenced entity’s credit soundness and a greater likelihood or risk of default or other credit event occurring as defined under the terms of the agreement. | |
| | | | |
| 80 | | Semi-Annual Report | | | April 30, 2014 |
Schedule of Investments
Fixed Income SHares: Series R
April 30, 2014 (unaudited) (continued)
| (n) | | Interest rate swap agreements outstanding at April 30, 2014: | |
OTC swap agreements:
| | | | | | | | | | | | | | | | | | | | | | | | |
Swap
Counterparty | | Notional
Amount
(000s) | | | Termination
Date | | | Rate Type | | Value | | | Upfront
Premiums
Paid
(Received) | | | Unrealized
Appreciation
(Depreciation) | |
| | | | Payments
Made | | Payments
Received | | | |
| Bank of America | | | €1,500 | | | | 7/25/21 | | | 1-Month EUR-
FRCPXTOB Index | | 1.95% | | | $82,098 | | | | $3,676 | | | | $78,422 | |
| BNP Paribas | | | 5,600 | | | | 7/25/21 | | | 6-Month EUR-LIBOR | | 1.95% | | | 306,499 | | | | 70,570 | | | | 235,929 | |
| BNP Paribas | | | $8,300 | | | | 7/15/22 | | | 2.50% | | 3-Month USD-
CPURNSA Index | | | (247,422 | ) | | | 87,610 | | | | (335,032 | ) |
| BNP Paribas | | | €2,800 | | | | 10/8/23 | | | 1-Month EUR-
FRCPXTOB Index | | 2.11% | | | 177,233 | | | | 26,797 | | | | 150,436 | |
| Citigroup | | | $15,000 | | | | 7/15/17 | | | 2.25% | | 3-Month USD-
CPURNSA Index | | | (347,291 | ) | | | 3,600 | | | | (350,891 | ) |
| Citigroup | | | €900 | | | | 4/1/21 | | | 1-Month EUR-
FRCPXTOB Index | | 2.15% | | | 78,303 | | | | 14,046 | | | | 64,257 | |
| Citigroup | | | 1,300 | | | | 7/25/21 | | | 1-Month EUR-
FRCPXTOB Index | | 1.95% | | | 71,152 | | | | 1,825 | | | | 69,327 | |
| Deutsche Bank | | | $11,800 | | | | 11/5/16 | | | 1.86% | | 3-Month USD-
CPURNSA Index | | | 12,034 | | | | – | | | | 12,034 | |
| Deutsche Bank | | | 8,200 | | | | 1/28/17 | | | 2.36% | | 3-Month USD-
CPURNSA Index | | | (187,432 | ) | | | – | | | | (187,432 | ) |
| Deutsche Bank | | | AUD 8,400 | | | | 6/18/19 | | | 3-Month AUD-LIBOR | | 4.00% | | | 135,328 | | | | 19,522 | | | | 115,806 | |
| Deutsche Bank | | | €1,000 | | | | 4/1/21 | | | 1-Month EUR-
FRCPXTOB Index | | 2.15% | | | 87,005 | | | | 22,022 | | | | 64,983 | |
| Deutsche Bank | | | $5,000 | | | | 7/15/22 | | | 2.50% | | 3-Month USD-
CPURNSA Index | | | (149,049 | ) | | | 102,720 | | | | (251,769 | ) |
| Deutsche Bank | | | €5,600 | | | | 7/25/23 | | | 1-Month EUR-
FRCPXTOB Index | | 1.95% | | | 241,954 | | | | 47,448 | | | | 194,506 | |
| Goldman Sachs | | | $3,900 | | | | 4/15/16 | | | 1.73% | | 3-Month USD-
CPURNSA Index | | | (1,167 | ) | | | – | | | | (1,167 | ) |
| Goldman Sachs | | | 23,000 | | | | 4/15/16 | | | 1.73% | | 3-Month USD-
CPURNSA Index | | | (6,880 | ) | | | (48,721 | ) | | | 41,841 | |
| Goldman Sachs | | | BRL 44,100 | | | | 1/2/17 | | | BRL-CDI-Compounded | | 8.30% | | | (1,513,958 | ) | | | 21,518 | | | | (1,535,476 | ) |
| Goldman Sachs | | | 100 | | | | 1/2/17 | | | BRL-CDI-Compounded | | 10.91% | | | (633 | ) | | | (27 | ) | | | (606 | ) |
| Goldman Sachs | | | $5,300 | | | | 4/15/18 | | | 2.03% | | 3-Month USD-
CPURNSA Index | | | (31,107 | ) | | | – | | | | (31,107 | ) |
| Goldman Sachs | | | €5,200 | | | | 4/1/21 | | | 1-Month EUR-
FRCPXTOB Index | | 2.15% | | | 452,421 | | | | 67,598 | | | | 384,823 | |
| JPMorgan Chase | | | BRL 18,900 | | | | 1/2/15 | | | BRL-CDI-Compounded | | 7.90% | | | (215,654 | ) | | | (67,479 | ) | | | (148,175 | ) |
| Morgan Stanley | | | 1,700 | | | | 1/2/17 | | | BRL-CDI-Compounded | | 8.22% | | | (60,999 | ) | | | (90 | ) | | | (60,909 | ) |
| Royal Bank of Scotland | | | $7,800 | | | | 10/31/16 | | | 1.93% | | 3-Month USD-
CPURNSA Index | | | (9,064 | ) | | | – | | | | (9,064 | ) |
| Royal Bank of Scotland | | | 27,000 | | | | 7/15/17 | | | 2.25% | | 3-Month USD-
CPURNSA Index | | | (625,124 | ) | | | (50,400 | ) | | | (574,724 | ) |
| Royal Bank of Scotland | | | 9,700 | | | | 7/15/17 | | | 2.25% | | 3-Month USD-
CPURNSA Index | | | (224,582 | ) | | | 27,917 | | | | (252,499 | ) |
| UBS | | | BRL 39,800 | | | | 1/2/17 | | | BRL-CDI-Compounded | | 8.15% | | | (1,466,902 | ) | | | (39,489 | ) | | | (1,427,413 | ) |
| | | | | | | | | | | | | | | | | | | | | | | | |
| | | | | | | | | | | | | | | $(3,443,237 | ) | | | $310,663 | | | | $(3,753,900 | ) |
| | | | | | | | | | | | | | | | | | | | | | | | |
| | | | | | |
| April 30, 2014 | | | Semi-Annual Report | | | 81 | |
Schedule of Investments
Fixed Income SHares: Series R
April 30, 2014 (unaudited) (continued)
Centrally cleared swap agreements:
| | | | | | | | | | | | | | | | | | | | |
| | | Notional
Amount
(000s) | | | Termination
Date | | | Rate Type | | | | | Unrealized
Appreciation
(Depreciation) | |
Broker
(Exchange) | | | | Payments
Made | | Payments
Received | | Value | | |
| Barclays Bank (CME) | | | ¥310,000 | | | | 9/18/23 | | | 1.00% | | 6-Month JPY-LIBOR | | | $(76,632 | ) | | | $(32,222 | ) |
| Barclays Bank (CME) | | | $2,900 | | | | 6/19/43 | | | 2.75% | | 3-Month USD-LIBOR | | | 364,110 | | | | 190,345 | |
| Barclays Bank (CME) | | | 1,100 | | | | 12/18/43 | | | 3.50% | | 3-Month USD-LIBOR | | | (24,863 | ) | | | (63,891 | ) |
| Barclays Bank (CME) | | | €500 | | | | 9/17/44 | | | 2.75% | | 3-Month USD-LIBOR | | | (52,528 | ) | | | (3,917 | ) |
| Citigroup (CME) | | | $29,400 | | | | 12/18/43 | | | 3.50% | | 3-Month USD-LIBOR | | | (664,521 | ) | | | (1,927,361 | ) |
| Citigroup (CME) | | | €800 | | | | 9/17/44 | | | 2.75% | | 3-Month USD-LIBOR | | | (84,045 | ) | | | (18,406 | ) |
| Credit Suisse First Boston (CME) | | | ¥810,000 | | | | 9/18/23 | | | 1.00% | | 6-Month JPY-LIBOR | | | (200,233 | ) | | | (152,486 | ) |
| Credit Suisse First Boston (CME) | | | €3,400 | | | | 1/29/24 | | | 2.00% | | 3-Month USD-LIBOR | | | (158,456 | ) | | | (130,854 | ) |
| Credit Suisse First Boston (CME) | | | $4,100 | | | | 12/18/43 | | | 3.50% | | 3-Month USD-LIBOR | | | (92,671 | ) | | | (241,838 | ) |
| Credit Suisse First Boston (CME) | | | €3,100 | | | | 9/17/44 | | | 2.75% | | 3-Month USD-LIBOR | | | (325,674 | ) | | | (187,248 | ) |
| Deutsche Bank (CME) | | | 24,600 | | | | 1/17/16 | | | 0.55% | | 3-Month USD-LIBOR | | | (90,144 | ) | | | (60,180 | ) |
| Morgan Stanley (CME) | | | ¥620,000 | | | | 9/18/23 | | | 1.00% | | 6-Month JPY-LIBOR | | | (153,265 | ) | | | (116,261 | ) |
| Morgan Stanley (CME) | | | $1,800 | | | | 6/19/43 | | | 2.75% | | 3-Month USD-LIBOR | | | 226,000 | | | | 118,145 | |
| Morgan Stanley (CME) | | | €2,100 | | | | 9/17/44 | | | 2.75% | | 3-Month USD-LIBOR | | | (220,618 | ) | | | (104,781 | ) |
| | | | | | | | | | | | | | | | | | | | |
| | | | | | | | | | | | | | | $(1,553,540 | ) | | | $(2,730,955 | ) |
| | | | | | | | | | | | | | | | | | | | |
| (o) | | Forward foreign currency contracts outstanding at April 30, 2014: | |
| | | | | | | | | | | | | | |
| | | Counterparty | | U.S.$ Value on
Origination Date | | | U.S.$ Value
April 30, 2014 | | | Unrealized
Appreciation
(Depreciation) | |
| Purchased: | | | | | | | | | | | | | | |
| 12,090,000 Australian Dollar settling 5/2/14 | | Morgan Stanley | | | $11,217,402 | | | | $11,231,613 | | | | $14,211 | |
| 2,574,454 Brazilian Real settling 5/5/14 | | Credit Suisse
First Boston | | | 1,082,522 | | | | 1,154,593 | | | | 72,071 | |
| 8,725,274 Brazilian Real settling 5/5/14 | | UBS | | | 3,724,607 | | | | 3,913,117 | | | | 188,510 | |
| 8,725,274 Brazilian Real settling 6/3/14 | | UBS | | | 3,891,042 | | | | 3,877,571 | | | | (13,471 | ) |
| 32,133,000 Euro settling 5/2/14 | | Bank of America | | | 44,459,508 | | | | 44,579,696 | | | | 120,188 | |
| 1,880,406 Euro settling 7/30/14 | | Bank of America | | | 2,598,063 | | | | 2,608,306 | | | | 10,243 | |
| 748,801 Euro settling 7/30/14 | | Goldman Sachs | | | 1,035,435 | | | | 1,038,661 | | | | 3,226 | |
| 20,838,600 Indian Rupee settling 7/23/14 | | Deutsche Bank | | | 340,000 | | | | 339,726 | | | | (274 | ) |
| 23,309,200 Indian Rupee settling 7/23/14 | | Goldman Sachs | | | 380,000 | | | | 380,004 | | | | 4 | |
| 24,205,600 Indian Rupee settling 7/23/14 | | HSBC Bank | | | 395,001 | | | | 394,618 | | | | (383 | ) |
| 20,180,860 Indian Rupee settling 7/23/14 | | JPMorgan Chase | | | 329,000 | | | | 329,003 | | | | 3 | |
| 21,158,850 Indian Rupee settling 7/23/14 | | UBS | | | 345,000 | | | | 344,947 | | | | (53 | ) |
| 12,908,000 Mexican Peso settling 6/25/14 | | BNP Paribas | | | 965,257 | | | | 982,571 | | | | 17,314 | |
| 36,327,000 Mexican Peso settling 5/14/14 | | Citigroup | | | 2,747,155 | | | | 2,774,684 | | | | 27,529 | |
| 56,983,856 Mexican Peso settling 5/14/14 | | Goldman Sachs | | | 4,360,731 | | | | 4,352,470 | | | | (8,261 | ) |
| 2,638,800 Polish Zloty settling 7/30/14 | | BNP Paribas | | | 869,686 | | | | 866,818 | | | | (2,868 | ) |
| 4,630,189 Polish Zloty settling 7/30/14 | | HSBC Bank | | | 1,527,712 | | | | 1,520,968 | | | | (6,744 | ) |
| Sold: | | | | | | | | | | | | | | |
| 12,090,000 Australian Dollar settling 5/2/14 | | Bank of America | | | 11,129,510 | | | | 11,231,613 | | | | (102,103 | ) |
| 12,090,000 Australian Dollar settling 6/3/14 | | Morgan Stanley | | | 11,192,463 | | | | 11,207,028 | | | | (14,565 | ) |
| 2,574,454 Brazilian Real settling 5/5/14 | | Credit Suisse
First Boston | | | 1,151,366 | | | | 1,154,593 | | | | (3,227 | ) |
| 8,725,274 Brazilian Real settling 5/5/14 | | UBS | | | 3,923,234 | | | | 3,913,117 | | | | 10,117 | |
| 1,160,000 British Pound settling 6/12/14 | | Deutsche Bank | | | 1,929,793 | | | | 1,957,917 | | | | (28,124 | ) |
| 649,000 British Pound settling 6/12/14 | | Goldman Sachs | | | 1,087,410 | | | | 1,095,421 | | | | (8,011 | ) |
| 681,000 Canadian Dollar settling 6/19/14 | | Citigroup | | | 613,496 | | | | 620,607 | | | | (7,111 | ) |
| 39,735,000 Danish Krone settling 5/13/14 | | Citigroup | | | 7,298,334 | | | | 7,386,053 | | | | (87,719 | ) |
| 32,133,000 Euro settling 6/3/14 | | Bank of America | | | 44,456,006 | | | | 44,576,690 | | | | (120,684 | ) |
| 12,683,000 Euro settling 5/2/14 | | Barclays Bank | | | 17,415,684 | | | | 17,595,751 | | | | (180,067 | ) |
| 623,871 Euro settling 7/30/14 | | BNP Paribas | | | 869,686 | | | | 865,371 | | | | 4,315 | |
| 4,921,000 Euro settling 5/2/14 | | Credit Suisse
First Boston | | | 6,786,369 | | | | 6,827,146 | | | | (40,777 | ) |
| | | | |
| 82 | | Semi-Annual Report | | | April 30, 2014 |
Schedule of Investments
Fixed Income SHares: Series R
April 30, 2014 (unaudited) (continued)
| | | | | | | | | | | | | | |
| | | Counterparty | | U.S.$ Value on
Origination Date | | | U.S.$ Value
April 30, 2014 | | | Unrealized
Appreciation
(Depreciation) | |
| 1,097,461 Euro settling 7/30/14 | | HSBC Bank | | | $1,527,712 | | | | $1,522,286 | | | | $5,426 | |
| 14,529,000 Euro settling 5/2/14 | | Royal Bank of
Scotland | | | 20,015,571 | | | | 20,156,798 | | | | (141,227 | ) |
| 583,978,770 Hungarian Forint settling 7/30/14 | | Bank of America | | | 2,598,064 | | | | 2,629,521 | | | | (31,457 | ) |
| 232,940,000 Hungarian Forint settling 7/30/14 | | Goldman Sachs | | | 1,035,435 | | | | 1,048,875 | | | | (13,440 | ) |
| 42,754,000 Japanese Yen settling 5/13/14 | | Citigroup | | | 419,255 | | | | 418,221 | | | | 1,034 | |
| 93,310,857 Mexican Peso settling 5/14/14 | | BNP Paribas | | | 6,986,093 | | | | 7,127,154 | | | | (141,061 | ) |
| 56,983,856 Mexican Peso settling 8/25/14 | | Goldman Sachs | | | 4,325,971 | | | | 4,316,621 | | | | 9,350 | |
| 1,191,000 New Zealand Dollar settling 6/3/14 | | BNP Paribas | | | 1,016,128 | | | | 1,024,284 | | | | (8,156 | ) |
| 1,191,000 New Zealand Dollar settling 5/2/14 | | HSBC Bank | | | 1,029,275 | | | | 1,026,999 | | | | 2,276 | |
| | | | | | | | | | | | | | |
| | | | | | | | | | | | | $(473,966 | ) |
| | | | | | | | | | | | | | |
| (p) | | At April 30, 2014, the Portfolio held $325,000 in cash as collateral and pledged cash collateral of $2,417,000 for derivative contracts. Cash collateral held may be invested in accordance with the Portfolio’s investment strategy. | |
| (q) | | The weighted average daily balance of reverse repurchase agreements during the six months ended April 30, 2014 was $18,766,909, at a weighted average interest rate of (0.11)%. There were no open reverse repurchase agreements at April 30, 2014. | |
| (r) | | The weighted average borrowing for sale-buybacks during the six months ended April 30, 2014 was $149,125,203 at a weighted average interest rate of 0.12%. | |
| (s) | | Fair Value Measurements-See Note 1(b) in the Notes to Financial Statements. | |
| | | | | | | | | | | | | | | | |
| | | Level 1 –
Quoted
Prices | | | Level 2 –
Other Significant
Observable
Inputs | | | Level 3 –
Significant
Unobservable
Inputs | | | Value at
4/30/14 | |
Investments in Securities – Assets | | | | | | | | | | | | | | | | |
U.S. Treasury Obligations | | $ | – | | | $ | 260,528,666 | | | | $– | | | $ | 260,528,666 | |
Sovereign Debt Obligations | | | – | | | | 60,061,243 | | | | – | | | | 60,061,243 | |
Corporate Bonds & Notes | | | – | | | | 33,521,680 | | | | – | | | | 33,521,680 | |
Mortgage-Backed Securities | | | – | | | | 21,685,796 | | | | – | | | | 21,685,796 | |
Asset-Backed Securities | | | – | | | | 2,354,365 | | | | – | | | | 2,354,365 | |
U.S. Government Agency Securities | | | – | | | | 477,885 | | | | – | | | | 477,885 | |
Senior Loans | | | – | | | | 208,677 | | | | – | | | | 208,677 | |
Short-Term Investments | | | – | | | | 7,691,852 | | | | – | | | | 7,691,852 | |
Options Purchased: | | | | | | | | | | | | | | | | |
Interest Rate Contracts | | | – | | | | 106,208 | | | | – | | | | 106,208 | |
| | | | – | | | | 386,636,372 | | | | – | | | | 386,636,372 | |
Investment in Securities – Liabilities | | | | | | | | | | | | | | | | |
Options Written, at value: | | | | | | | | | | | | | | | | |
Credit Contracts | | | – | | | | (28,325 | ) | | | – | | | | (28,325 | ) |
Foreign Exchange Contracts | | | – | | | | (71,566 | ) | | | – | | | | (71,566 | ) |
Interest Rate Contracts | | | – | | | | (111,354 | ) | | | (81,293 | ) | | | (192,647 | ) |
| | | | – | | | | (211,245 | ) | | | (81,293 | ) | | | (292,538 | ) |
Other Financial Instruments* – Assets | | | | | | | | | | | | | | | | |
Credit Contracts | | | – | | | | 534,104 | | | | – | | | | 534,104 | |
Foreign Exchange Contracts | | | – | | | | 485,817 | | | | – | | | | 485,817 | |
Interest Rate Contracts | | | 26,515 | | | | 1,720,854 | | | | – | | | | 1,747,369 | |
| | | | 26,515 | | | | 2,740,775 | | | | – | | | | 2,767,290 | |
Other Financial Instruments* – Liabilities | | | | | | | | | | | | | | | | |
Credit Contracts | | | – | | | | (130,357 | ) | | | – | | | | (130,357 | ) |
Foreign Exchange Contracts | | | – | | | | (959,783 | ) | | | – | | | | (959,783 | ) |
Interest Rate Contracts | | | (352,660 | ) | | | (8,205,709 | ) | | | – | | | | (8,558,369 | ) |
| | | | (352,660 | ) | | | (9,295,849 | ) | | | – | | | | (9,648,509 | ) |
Totals | | $ | (326,145 | ) | | $ | 379,870,053 | | | $ | (81,293 | ) | | $ | 379,462,615 | |
| | | | | | |
| April 30, 2014 | | | Semi-Annual Report | | | 83 | |
Schedule of Investments
Fixed Income SHares: Series R
April 30, 2014 (unaudited) (continued)
At April 30, 2014, there were no transfers between Levels 1 and 2.
A roll forward of fair value measurements using significant unobservable inputs (Level 3) for the six months ended April 30, 2014, was as follows:
| | | | | | | | | | | | | | | | | | | | | | | | | | | | | | | | | | | | |
| | | Beginning
Balance
10/31/13 | | | Purchases | | | Sales | | | Accrued
Discount
(Premiums) | | | Net
Realized
Gain
(Loss) | | | Net Change
in Unrealized
Appreciation/
Depreciation | | | Transfers
into
Level 3 | | | Transfers
out of
Level 3** | | | Ending
Balance
4/30/14 | |
Investments in Securities – Assets | |
Mortgage-Backed Securities | | | $3,916,300 | | | | $ – | | | | $(404,842 | ) | | | $ – | | | | $ – | | | | $2,081 | | | | $ – | | | | $(3,513,539 | ) | | | $ – | |
Investments in Securities – Liabilities | | | | | | | | | | | | | |
Options Written: | | | | | | | | | | | | | | | | | | | | | | | | | | | | | |
Interest Rate Contracts | | | (48,704 | ) | | | – | | | | (47,288 | ) | | | – | | | | – | | | | 14,699 | | | | – | | | | – | | | | (81,293 | ) |
Totals | | | $3,867,596 | | | | $ – | | | | $(452,130 | ) | | | $ – | | | | $ – | | | | $16,780 | | | | $ – | | | | $(3,513,539 | ) | | | $(81,293 | ) |
The following table presents additional information about valuation techniques and inputs used for investments that are measured at fair value and categorized within Level 3 at April 30, 2014.
| | | | | | | | | | |
| | | Ending Balance
at 4/30/14 | | | Valuation
Technique Used | | Unobservable
Inputs | | Input Values |
Investments in Securities – Liabilities |
Options Written: | | | | | | | | | | |
Interest Rate Contracts | | | $(81,293 | ) | | Third-Party Pricing Vendor | | Single Broker Quote | | $(0.05) – $(0.71) |
| * | | Other financial instruments are derivatives, such as futures contracts, swap agreements and forward foreign currency contracts, which are valued at the unrealized appreciation (depreciation) of the instrument. | |
| ** | | Transferred out of Level 3 into Level 2 because an evaluated price with observable inputs from an independent third-party vendor became available. | |
The net change in unrealized appreciation/depreciation of Level 3 investments held at April 30, 2014, was $14,699. Net change in unrealized appreciation/depreciation is reflected on the Statement of Operations.
| (t) | | The following is a summary of the derivative instruments categorized by risk exposure: | |
The effect of derivatives on the Statement of Assets and Liabilities at April 30, 2014:
| | | | | | | | | | | | | | | | |
| Location | | Interest
Rate
Contracts | | | Credit
Contracts | | | Foreign
Exchange
Contracts | | | Total | |
| Asset derivatives: | | | | | | | | | | | | | | | | |
| Investments, at value (options purchased) | | | $106,208 | | | | $– | | | | $– | | | | $106,208 | |
| Unrealized appreciation of OTC swaps | | | 1,412,364 | | | | 467,022 | | | | – | | | | 1,879,386 | |
| Receivable for variation margin on centrally cleared swaps** | | | – | | | | 99,219 | | | | – | | | | 99,219 | |
| Receivable for variation margin on futures contracts* | | | 229,450 | | | | – | | | | – | | | | 229,450 | |
Unrealized appreciation of forward foreign currency contracts | | | – | | | | – | �� | | | 485,817 | | | | 485,817 | |
Total asset derivatives | | | $1,748,022 | | | | $566,241 | | | | $485,817 | | | | $2,800,080 | |
| Liability derivatives: | | | | | | | | | | | | | | | | |
| Unrealized depreciation of OTC swaps | | | $(5,166,264 | ) | | | $(130,357 | ) | | | $– | | | | $(5,296,621 | ) |
| Payable for variation margin on centrally cleared swaps** | | | (258,870 | ) | | | – | | | | – | | | | (258,870 | ) |
| Options written, at value | | | (192,647 | ) | | | (28,325 | ) | | | (71,566 | ) | | | (292,538 | ) |
| Payable for variation margin on futures contracts* | | | (1,248 | ) | | | – | | | | – | | | | (1,248 | ) |
Unrealized depreciation of forward foreign currency contracts | | | – | | | | – | | | | (959,783 | ) | | | (959,783 | ) |
Total liability derivatives | | | $(5,619,029 | ) | | | $(158,682 | ) | | | $(1,031,349 | ) | | | $(6,809,060 | ) |
| * | | Included in net unrealized depreciation of $326,145 on futures contracts as reported in note (k) of the Notes to Schedule of Investments. | |
| ** | | Included in net unrealized depreciation of $2,663,873 on centrally cleared swaps as reported in note (m) and (n) of the Notes to Schedule of Investments. | |
| | | | |
| 84 | | Semi-Annual Report | | | April 30, 2014 |
Schedule of Investments
Fixed Income SHares: Series R
April 30, 2014 (unaudited) (continued)
| The | | effect of derivatives on the Statement of Operations for the six months ended April 30, 2014: | |
| | | | | | | | | | | | | | | | |
| Location | | Interest
Rate
Contracts | | | Credit
Contracts | | | Foreign
Exchange
Contracts | | | Total | |
| Net realized gain (loss) on: | | | | | | | | | | | | | | | | |
| Investments (options purchased) | | | $(355,950 | ) | | | $– | | | | $– | | | | $(355,950 | ) |
| Futures contracts | | | 1,091,217 | | | | – | | | | – | | | | 1,091,217 | |
| Options written | | | 1,277,349 | | | | – | | | | – | | | | 1,277,349 | |
| Swaps | | | 2,082,704 | | | | (24,669 | ) | | | – | | | | 2,058,035 | |
Foreign currency transactions (forward foreign currency contracts) | | | – | | | | – | | | | (238,743 | ) | | | (238,743 | ) |
Total net realized gain (loss) | | | $4,095,320 | | | | $(24,669 | ) | | | $(238,743 | ) | | | $3,831,908 | |
| Net change in unrealized appreciation/depreciation of: | | | | | | | | | | | | | | | | |
| Investments (options purchased) | | | $174,253 | | | | $– | | | | $– | | | | $174,253 | |
| Futures contracts | | | (1,564,031 | ) | | | – | | | | – | | | | (1,564,031 | ) |
| Options written | | | (628,042 | ) | | | 49,594 | | | | 250,906 | | | | (327,542 | ) |
| Swaps | | | (4,442,807 | ) | | | 463,156 | | | | – | | | | (3,979,651 | ) |
Foreign currency transactions (forward foreign currency contracts) | | | – | | | | – | | | | (376,017 | ) | | | (376,017 | ) |
Total net change in unrealized appreciation/depreciation | | | $(6,460,627 | ) | | | $512,750 | | | | $(125,111 | ) | | | $(6,072,988 | ) |
The average volume (measured at each fiscal quarter-end) of derivative activity during the six months ended April 30, 2014:
| | | | | | | | | | | | | | | | | | | | | | | | | | | | | | | | | | | | |
Options
Purchased(3) | | Options
Written(1) | | | Options
Written(3) | | | Futures
Contracts(1) | | | Forward Foreign
Currency Contracts(2) | | | Credit Default
Swap Agreements(3) | | | Interest Rate
Swap
Agreements(3) | |
| | | | | | | | | Long | | | Short | | | Purchased | | | Sold | | | Buy | | | Sell | | | | |
$4,899 | | | 122 | | | | $180,452 | | | | 1,289 | | | | (43 | ) | | | $53,295,825 | | | | $96,464,944 | | | | $4,000 | | | | $21,550 | | | | $172,967 | |
€2,600 | | | | | | | € 32,667 | | | | | | | | | | | | | | | | | | | | | | | | | | | | AUD 2,800 | |
| | | | | | | | | | | | | | | | | | | | | | | | | | | | | | | | | | | BRL 104,600 | |
| | | | | | | | | | | | | | | | | | | | | | | | | | | | | | | | | | | €51,367 | |
| | | | | | | | | | | | | | | | | | | | | | | | | | | | | | | | | | | ¥1,740,000 | |
| (2) | | U.S. $ Value on origination date | |
| (3) | | Notional Amount (in thousands) | |
| | | | | | |
| April 30, 2014 | | | Semi-Annual Report | | | 85 | |
Schedule of Investments
Fixed Income SHares: Series R
April 30, 2014 (unaudited) (continued)
| (4) | | The following tables present by counterparty the Portfolio’s derivative assets and liabilities net of related collateral held by the Fund at April 30, 2014 which has not been offset in the Statement of Assets and Liabilities, but would be available for offset to the extent of a default by the counterparty to the transaction. | |
Financial Assets and Derivative Assets, and Collateral Received at April 30, 2014:
| | | | | | | | | | | | | | | | |
| Gross Amounts Not Offset in the Statement of Assets and Liabilities | |
| Counterparty | | Gross Asset Derivatives
Presented in Statement
of Assets and Liabilities | | | Financial
Instrument/
Derivative
Offset | | | Cash
Collateral
Paid
(Received) | | | Net Amount | |
Foreign Currency Exchange Contracts | | | | | | | | | | | | | | | | |
Bank of America | | | $130,431 | | | | $(130,431 | ) | | | $– | | | | $– | |
BNP Paribas | | | 21,629 | | | | (21,629 | ) | | | – | | | | – | |
Citigroup | | | 28,563 | | | | (28,563 | ) | | | – | | | | – | |
Credit Suisse First Boston | | | 72,071 | | | | (44,004 | ) | | | – | | | | 28,067 | |
Goldman Sachs | | | 12,580 | | | | (12,580 | ) | | | – | | | | – | |
HSBC Bank | | | 7,702 | | | | (7,127 | ) | | | – | | | | 575 | |
JPMorgan Chase | | | 3 | | | | (3 | ) | | | – | | | | – | |
Morgan Stanley | | | 14,211 | | | | (14,211 | ) | | | – | | | | – | |
UBS | | | 198,627 | | | | (198,627 | ) | | | – | | | | – | |
Swaps | | | | | | | | | | | | | | | | |
Bank of America | | | 81,865 | | | | (81,865 | ) | | | – | | | | – | |
BNP Paribas | | | 478,243 | | | | (465,488 | ) | | | (12,755 | )#,## | | | – | |
Citigroup | | | 139,606 | | | | (139,606 | ) | | | – | | | | – | |
Deutsche Bank | | | 467,764 | | | | (467,599 | ) | | | 70,645 | #,## | | | 70,810 | |
Goldman Sachs | | | 426,664 | | | | (426,664 | ) | | | – | | | | – | |
HSBC Bank | | | 88,378 | | | | – | | | | (75,803 | )# | | | 12,575 | |
JPMorgan Chase | | | 71,823 | | | | (71,823 | ) | | | – | | | | – | |
Morgan Stanley | | | 125,043 | | | | (61,263 | ) | | | (63,780 | )# | | | – | |
Totals | | | $2,365,203 | | | | $(2,171,483 | ) | | | $(81,693 | ) | | | $112,027 | |
| | | | | | | | | | | | |
| Gross Amounts Not Offset in the Statement of Assets and Liabilities | |
| Counterparty | | Gross Financial Assets
Presented in Statement
of Assets and Liabilities | | | Financial
Instrument/
Derivative
Offset | | | Net Amount | |
Repurchase Agreement | | | | | | | | | | | | |
State Street Bank & Trust Co. | | | $116,000 | | | | $(116,000 | )† | | | $– | |
| | | | |
| 86 | | Semi-Annual Report | | | April 30, 2014 |
Schedule of Investments
Fixed Income SHares: Series R
April 30, 2014 (unaudited) (continued)
Financial Liabilities and Derivative Liabilities, and Collateral Pledged at March 31, 2014:
| | | | | | | | | | | | | | | | |
| Gross Amounts Not Offset in the Statement of Assets and Liabilities | |
| Counterparty | | Gross Liability Derivatives
Presented in Statement
of Assets and Liabilities | | | Financial
Instrument/
Derivative
Offset | | | Cash
Collateral
Received
(Pledged) | | | Net Amount | |
Foreign Currency Exchange Contracts | | | | | | | | | | | | | | | | |
Bank of America | | | $254,244 | | | | $(254,244 | )†† | | | $– | | | | $– | |
Barclays Bank | | | 180,067 | | | | – | | | | | | | | 180,067 | |
BNP Paribas | | | 152,085 | | | | (152,085 | ) | | | – | | | | – | |
Citigroup | | | 94,830 | | | | (94,830 | ) | | | – | | | | – | |
Credit Suisse First Boston | | | 44,004 | | | | (44,004 | ) | | | – | | | | – | |
Deutsche Bank | | | 28,398 | | | | (28,398 | ) | | | – | | | | – | |
Goldman Sachs | | | 29,712 | | | | (29,712 | ) | | | – | | | | – | |
HSBC Bank | | | 7,127 | | | | (7,127 | ) | | | – | | | | – | |
Morgan Stanley | | | 14,565 | | | | (14,565 | ) | | | – | | | | – | |
Royal Bank of Scotland | | | 141,227 | | | | (141,227 | ) | | | – | | | | – | |
UBS | | | 13,524 | | | | (13,524 | ) | | | – | | | | – | |
Swaps | | | | | | | | | | | | | | | | |
Bank of America | | | 87,815 | | | | (89,274 | )†† | | | 1,459 | #,## | | | – | |
BNP Paribas | | | 335,032 | | | | (335,032 | ) | | | – | | | | – | |
Citigroup | | | 350,891 | | | | (343,703 | ) | | | 13,964 | #,## | | | 21,152 | |
Deutsche Bank | | | 439,201 | | | | (439,201 | ) | | | – | | | | – | |
Goldman Sachs | | | 1,610,898 | | | | (1,552,217 | ) | | | (40,368 | )#,## | | | 18,313 | |
JPMorgan Chase | | | 148,175 | | | | (205,591 | )†† | | | 57,416 | #,## | | | – | |
Morgan Stanley | | | 60,909 | | | | (60,909 | ) | | | – | | | | – | |
Royal Bank of Scotland | | | 836,287 | | | | (857,972 | ) | | | 92,483 | #,## | | | 70,798 | |
UBS | | | 1,427,413 | | | | (1,466,902 | )†† | | | 39,489 | # | | | – | |
Totals | | | $6,256,404 | | | | $(6,130,517 | ) | | | $164,443 | | | | $290,330 | |
| † | | The actual collateral received is greater than the amount shown here due to over collateralization. | |
| †† | | The actual collateral pledged is greater than the amount shown here due to over collateralization. | |
| # | | The amount includes upfront premiums received. | |
| ## | | The amount includes upfront premiums paid. | |
| | | | | | |
| April 30, 2014 | | | Semi-Annual Report | | | 87 | |
Schedule of Investments
Fixed Income SHares: Series R
April 30, 2014 (unaudited) (continued)
Glossary:
| | | | |
| AUD | | - | | Australian Dollar |
| BRL | | - | | Brazilian Real |
| £ | | - | | British Pound |
| CBOT | | - | | Chicago Board of Trade |
| CDI | | - | | Inter-Bank Deposit Certificate |
| CDX.IG | | - | | Credit Derivatives Index Investment Grade |
| CDX.IT | | - | | Credit Derivatives Index iTraxx |
| CLO | | - | | Collateralized Loan Obligation |
| CME | | - | | Chicago Mercantile Exchange |
| CMO | | - | | Collateralized Mortgage Obligation |
| CPURNSA | | - | | Consumer Price All Urban Non-Seasonally Adjusted Index |
| DKK | | - | | Danish Krone |
| EUR/€ | | - | | Euro |
| EURIBOR | | - | | Euro Inter-Bank Offered Rate |
| FRCPXTOB | | - | | France CPI ex-Tobacco Index |
| ICE | | - | | Intercontinental Exchange |
| JPY/¥ | | - | | Japanese Yen |
| LIBOR | | - | | London Inter-Bank Offered Rate |
| MBS | | - | | Mortgage-Backed Securities |
| MXN | | - | | Mexican Peso |
| NZD | | - | | New Zealand Dollar |
| OTC | | - | | Over-the-Counter |
| | | | | | |
| 88 | | Semi-Annual Report | | | April 30, 2014 | | | See accompanying Notes to Financial Statements |
Schedule of Investments
Fixed Income SHares: Series TE
April 30, 2014 (unaudited)
| | | | | | | | | | |
Principal
Amount
(000s) | | | | | | | Value | |
| | MUNICIPAL BONDS – 85.5% | | | | | | |
| | | | Arizona – 4.0% | | | | | | |
| | $1,000 | | | Phoenix Civic Improvement Corp. Rev., 5.00%, 7/1/28, Ser. A | | | | | $1,076,060 | |
| | 1,000 | | | Salt River Project Agricultural Improvement & Power Dist. Rev., 5.00%, 12/1/30, Ser. A | | | | | 1,144,730 | |
| | 175 | | | State Univ. Rev., 5.00%, 7/1/25, Ser. A | | | | | 201,789 | |
| | 1,000 | | | Water Infrastructure Finance Auth. Rev., 4.25%, 10/1/19, Ser. A | | | | | 1,149,550 | |
| | | | | | | | | | 3,572,129 | |
| | | | Arkansas – 0.3% | | | | | | |
| | 260 | | | Univ. of Arkansas Rev., 5.00%, 5/1/26, Ser. A | | | | | 297,690 | |
| | | | California – 9.4% | | | | | | |
| | 2,000 | | | Bay Area Toll Auth. Rev., 5.00%, 4/1/38, Ser. S-4 | | | | | 2,168,800 | |
| | 1,000 | | | Bay Area Water Supply & Conservation Agcy. Rev., 5.00%, 10/1/26, Ser. A | | | | | 1,168,880 | |
| | 500 | | | Contra Costa Transportation Auth. Rev., 5.00%, 3/1/25, Ser. B | | | | | 583,535 | |
| | 400 | | | East Bay Municipal Utility Dist. Rev., 5.00%, 6/1/22, Ser. B | | | | | 487,704 | |
| | 1,000 | | | Health Facs. Financing Auth. Rev.,
St. Joseph Health System, 5.00%, 7/1/43, Ser. D (b) | | | | | 1,181,200 | |
| | 500 | | | Sutter Health, 5.25%, 8/15/22, Ser. A | | | | | 565,630 | |
| | 100 | | | Irvine, Special Assessment, 4.00%, 9/2/21 | | | | | 108,170 | |
| | 730 | | | Los Angeles, GO, 5.00%, 9/1/22, Ser. B | | | | | 880,117 | |
| | 250 | | | Los Angeles Cnty. Public Works Financing Auth. Rev., 5.00%, 8/1/42 | | | | | 264,685 | |
| | 500 | | | Los Angeles Department of Airports Rev., 5.00%, 5/15/29, Ser. B | | | | | 565,155 | |
| | 200 | | | San Francisco Bay Area Rapid Transit Dist. Rev., 5.00%, 7/1/24 | | | | | 228,724 | |
| | 100 | | | Statewide Communities Dev. Auth. Rev., Sutter Health, 5.00%, 8/15/23, Ser. A | | | | | 116,311 | |
| | | | | | | | | | 8,318,911 | |
| | | | Colorado – 3.5% | | | | | | |
| | 500 | | | Denver City & Cnty. School Dist. No. 1, GO, 5.00%, 12/1/26, Ser. B | | | | | 580,825 | |
| | 2,125 | | | Health Facs. Auth. Rev., Childrens Hospital, 5.00%, 12/1/33, Ser. A | | | | | 2,273,367 | |
| | 250 | | | State Board of Governors Rev., 5.00%, 3/1/18, Ser. A | | | | | 286,393 | |
| | | | | | | | | | 3,140,585 | |
| | | | Connecticut – 1.2% | | | | | | |
| | 1,000 | | | Health & Educational Facs. Auth. Rev., Hartford Healthcare, 5.00%, 7/1/26, Ser. E | | | | | 1,114,450 | |
| | | | Florida – 4.9% | | | | | | |
| | 1,300 | | | Broward Cnty. Airport System Rev., 5.00%, 10/1/37, Ser. Q-1 | | | | | 1,360,775 | |
| | 555 | | | Miami-Dade Cnty. Water & Sewer System Rev., 5.00%, 10/1/28, Ser. B | | | | | 628,821 | |
| | 1,800 | | | Municipal Power Agcy. Rev., St. Lucie Project, 5.00%, 10/1/26, Ser. A | | | | | 2,041,344 | |
| | 250 | | | State, GO, 5.00%, 7/1/25, Ser. B | | | | | 293,427 | |
| | | | | | | | | | 4,324,367 | |
| | | | Georgia – 1.2% | | | | | | |
| | 1,000 | | | Atlanta Department of Aviation Rev., 5.00%, 1/1/42, Ser. B | | | | | 1,059,920 | |
| | | | Kansas – 2.5% | | | | | | |
| | 2,000 | | | Dev. Finance Auth. Rev., Adventist Health, 5.00%, 11/15/34, Ser. A | | | | | 2,183,480 | |
| | | | Massachusetts – 5.0% | | | | | | |
| | 1,150 | | | Bay Transportation Auth. Rev., 5.50%, 7/1/18, Ser. C | | | | | 1,357,023 | |
| | | | School Building Auth. Rev., | | | | | | |
| | 100 | | | 5.00%, 8/15/27, Ser. B | | | | | 115,990 | |
| | 165 | | | 5.00%, 8/15/30, Ser. A | | | | | 188,115 | |
| | 450 | | | 5.00%, 8/15/30, Ser. B | | | | | 513,040 | |
| | | | | | |
| April 30, 2014 | | | Semi-Annual Report | | | 89 | |
Schedule of Investments
Fixed Income SHares: Series TE
April 30, 2014 (unaudited) (continued)
| | | | | | | | | | |
Principal
Amount
(000s) | | | | | | | Value | |
| | | | Massachusetts (continued) | | | | | | |
| | $2,000 | | | State College Building Auth. Rev., 5.00%, 5/1/28, Ser. A | | | | | $2,316,520 | |
| | | | | | | | | | 4,490,688 | |
| | | | Minnesota – 1.3% | | | | | | |
| | 1,000 | | | Anoka-Hennepin Independent School Dist. No. 11, GO, 5.00%, 2/1/19, Ser. A | | | | | 1,156,030 | |
| | | | Missouri – 1.0% | | | | | | |
| | 750 | | | Metropolitan St. Louis Sewer Dist. Rev., 5.00%, 5/1/23, Ser. B | | | | | 896,408 | |
| | | | Nebraska – 0.3% | | | | | | |
| | 200 | | | Omaha Public Power Dist. Rev., 5.00%, 2/1/25, Ser. A | | | | | 233,444 | |
| | | | New Jersey – 4.6% | | | | | | |
| | 1,000 | | | Economic Dev. Auth. Rev., 5.00%, 3/1/24 | | | | | 1,156,490 | |
| | 1,000 | | | Health Care Facs. Financing Auth. Rev., Robert Wood Johnson Univ. Hospital, 5.25%, 7/1/35 | | | | | 1,082,230 | |
| | | | State Turnpike Auth. Rev., | | | | | | |
| | 175 | | | 5.00%, 1/1/21, Ser. B | | | | | 205,651 | |
| | 1,300 | | | 5.00%, 1/1/31, Ser. A | | | | | 1,434,342 | |
| | 210 | | | Transportation Trust Fund Auth. Rev., 5.50%, 6/15/41, Ser. A | | | | | 230,820 | |
| | | | | | | | | | 4,109,533 | |
| | | | New York – 10.9% | | | | | | |
| | | | Metropolitan Transportation Auth. Rev., | | | | | | |
| | 165 | | | 5.00%, 11/15/27, Ser. D | | | | | 183,917 | |
| | 1,340 | | | 5.00%, 11/15/28, Ser. A | | | | | 1,534,903 | |
| | 125 | | | New York City, GO, 5.00%, 8/1/23, Ser. I | | | | | 146,407 | |
| | | | New York City Trust for Cultural Res. Rev., Wildlife Conservation Society, Ser. A, | | | | | | |
| | 200 | | | 5.00%, 8/1/24 | | | | | 235,592 | |
| | 365 | | | 5.00%, 8/1/25 | | | | | 424,466 | |
| | | | State Dormitory Auth. Rev., Ser. A, | | | | | | |
| | 1,725 | | | 5.00%, 12/15/26 | | | | | 2,000,655 | |
| | 170 | | | 5.00%, 3/15/27 | | | | | 193,763 | |
| | 1,130 | | | Tompkins Cnty. Dev. Corp. Rev., Tompkins Cortland Community College, 5.00%, 7/1/20 | | | | | 1,209,507 | |
| | | | Triborough Bridge & Tunnel Auth. Rev., | | | | | | |
| | 300 | | | 5.00%, 11/15/25, Ser. A | | | | | 350,502 | |
| | 2,000 | | | 5.00%, 11/15/27, Ser. B | | | | | 2,320,340 | |
| | 1,000 | | | 5.00%, 11/15/29, Ser. A | | | | | 1,120,170 | |
| | | | | | | | | | 9,720,222 | |
| | | | North Carolina – 4.6% | | | | | | |
| | 1,000 | | | Cary Combined Utility Systems Rev., 5.00%, 12/1/24 | | | | | 1,202,060 | |
| | 100 | | | Charlotte-Mecklenburg Hospital Auth. Rev., 5.00%, 1/15/28, Ser. A | | | | | 111,897 | |
| | 1,250 | | | Raleigh Combined Enterprise System Rev., 5.00%, 3/1/24, Ser. A | | | | | 1,503,675 | |
| | 100 | | | State Rev., 5.00%, 5/1/26, Ser. C | | | | | 115,731 | |
| | 1,000 | | | Turnpike Auth. Rev., 5.00%, 7/1/24 | | | | | 1,162,840 | |
| | | | | | | | | | 4,096,203 | |
| | | | Ohio – 6.7% | | | | | | |
| | 4,000 | | | Air Quality Dev. Auth. Rev., 3.75%, 12/1/23 (b) | | | | | 4,081,840 | |
| | 900 | | | Cleveland Department of Public Utilities Division of Water Rev., 5.00%, 1/1/24, Ser. X | | | | | 1,056,546 | |
| | 450 | | | Higher Educational Fac. Commission Rev., Western Univ., 5.00%, 12/1/21, Ser. A | | | | | 532,273 | |
| | 250 | | | State Rev., 5.00%, 12/15/24, Ser. 1 | | | | | 288,868 | |
| | | | | | | | | | 5,959,527 | |
| | | | |
| 90 | | Semi-Annual Report | | | April 30, 2014 |
Schedule of Investments
Fixed Income SHares: Series TE
April 30, 2014 (unaudited) (continued)
| | | | | | | | | | |
Principal
Amount
(000s) | | | | | | | Value | |
| | | | Oklahoma – 0.4% | | | | | | |
| | $300 | | | Water Res. Board Rev., 5.00%, 4/1/22, Ser. B | | | | | $353,115 | |
| | | | Pennsylvania – 2.7% | | | | | | |
| | 100 | | | Monroeville Finance Auth. Rev., 5.00%, 2/15/22 | | | | | 117,336 | |
| | 1,000 | | | River Port Auth. Rev., 5.00%, 1/1/23 | | | | | 1,105,630 | |
| | 1,000 | | | Turnpike Commission Rev., 5.00%, 12/1/20, Ser. B | | | | | 1,155,720 | |
| | | | | | | | | | 2,378,686 | |
| | | | Tennessee – 0.4% | | | | | | |
| | 100 | | | Metropolitan Gov’t of Nashville & Davidson Cnty., GO, 5.00%, 7/1/23 | | | | | 119,642 | |
| | 200 | | | Tennessee Energy Acquisition Corp. Rev., 5.25%, 9/1/24, Ser. A | | | | | 224,560 | |
| | | | | | | | | | 344,202 | |
| | | | Texas – 9.4% | | | | | | |
| | 300 | | | Dallas, GO, 5.00%, 2/15/23 | | | | | 358,554 | |
| | 500 | | | Dallas/Fort Worth International Airport Rev., 5.00%, 11/1/27, Ser. B | | | | | 565,250 | |
| | | | Harris Cnty., GO, | | | | | | |
| | 250 | | | 5.00%, 8/15/26 | | | | | 291,177 | |
| | 1,580 | | | 5.125%, 8/15/24 | | | | | 1,926,968 | |
| | 200 | | | La Joya Independent School Dist., GO, 5.00%, 2/15/27 (GTD-PSF) | | | | | 232,140 | |
| | 750 | | | Lower River Auth. Rev., 5.00%, 5/15/33, Ser. A | | | | | 805,320 | |
| | 175 | | | North Texas Tollway Auth. Rev., 5.00%, 1/1/28, Ser. B | | | | | 192,488 | |
| | 250 | | | San Antonio Public Facs. Corp. Rev., 5.00%, 9/15/25 | | | | | 288,523 | |
| | | | Texas Municipal Gas Acquisition & Supply Corp. I Rev., | | | | | | |
| | 1,000 | | | 5.25%, 12/15/23, Ser. A | | | | | 1,132,150 | |
| | 2,000 | | | 6.25%, 12/15/26, Ser. D | | | | | 2,420,040 | |
| | 100 | | | Texas Municipal Gas Acquisition & Supply Corp. III Rev., 5.00%, 12/15/26 | | | | | 107,220 | |
| | | | | | | | | | 8,319,830 | |
| | | | Utah – 1.3% | | | | | | |
| | 1,000 | | | Intermountain Power Agcy. Rev., 5.00%, 7/1/23, Ser. A | | | | | 1,120,730 | |
| | | | Virginia – 6.7% | | | | | | |
| | 560 | | | College Building Auth. Rev., 5.00%, 2/1/25 | | | | | 654,500 | |
| | 2,315 | | | Loudoun Cnty., GO, 5.00%, 12/1/27, Ser. A | | | | | 2,718,041 | |
| | 1,000 | | | Public Building Auth. Rev., 5.00%, 8/1/25, Ser. A | | | | | 1,179,740 | |
| | 1,000 | | | Public School Auth. Rev., 5.00%, 8/1/21, Ser. A | | | | | 1,203,460 | |
| | 175 | | | Virginia Resource Auth. Rev., 5.00%, 11/1/26, Ser. A | | | | | 206,224 | |
| | | | | | | | | | 5,961,965 | |
| | | | Washington – 1.9% | | | | | | |
| | 1,250 | | | Central Puget Sound Regional Transit Auth. Rev., 5.00%, 2/1/24, Ser. P-1 | | | | | 1,467,637 | |
| | 200 | | | State, GO, 5.00%, 1/1/28, Ser. C | | | | | 222,614 | |
| | | | | | | | | | 1,690,251 | |
| | | | Wisconsin – 1.3% | | | | | | |
| | 1,000 | | | WPPI Energy Rev., 5.00%, 7/1/25, Ser. A | | | | | 1,166,010 | |
| | Total Municipal Bonds (cost-$75,541,429) | | | | | 76,008,376 | |
| | | | U.S. Treasury Obligations – 0.7% | | | | | | |
| | 600 | | | U.S. Treasury Notes, 0.094%, 4/30/16 (b) (cost-$600,000) | | | | | 600,000 | |
| | Short-Term Investments – 13.7% | | | | |
| | | | U.S. Government Agency Securities (c) – 7.8% | | | | | | |
| | | | Federal Home Loan Bank Discount Notes, | | | | | | |
| | 400 | | | 0.079%, 10/8/14 | | | | | 399,929 | |
| | | | | | |
| April 30, 2014 | | | Semi-Annual Report | | | 91 | |
Schedule of Investments
Fixed Income SHares: Series TE
April 30, 2014 (unaudited) (continued)
| | | | | | | | | | |
Principal
Amount
(000s) | | | | | | | Value | |
| | | | U.S. Government Agency Securities (c) (continued) | | | | | | |
| | $300 | | | 0.086%, 7/16/14 | | | | | $299,981 | |
| | 3,200 | | | 0.091%, 7/18/14 | | | | | 3,199,792 | |
| | 3,100 | | | 0.101%, 7/30/14 | | | | | 3,099,767 | |
| | Total U.S. Government Agency Securities (cost-$6,998,409) | | | | | 6,999,469 | |
| | | | Repurchase Agreements – 5.2% | | | | | | |
| | 4,600 | | | Goldman Sachs, | | | | | | |
| | | | dated 4/30/14, 0.05%, due 5/1/14, | | | | | | |
| | | | proceeds $4,600,006; collateralized by | | | | | | |
| | | | Freddie Mac, 3.50%, due 9/1/42, | | | | | | |
| | | | | valued at $4,739,126 including accrued interest (cost-$4,600,000) | | | | | 4,600,000 | |
| | | | U.S. Treasury Obligations – 0.7% | | | | | | |
| | 607 | | | U.S. Treasury Bills, 0.048%, 10/16/14 (a)(c) (cost-$606,866) | | | | | 606,890 | |
| | Total Short-Term Investments (cost-$12,205,275) | | | | | 12,206,359 | |
| | Total Investments (cost-$88,346,704) – 99.9% | | | | | 88,814,735 | |
| | Other assets less liabilities – 0.1% | | | | | 70,942 | |
| | Net Assets – 100.0% | | | | | $88,885,677 | |
Industry classification of portfolio holdings as a percentage of net assets was as follows:
| | | | | | | | |
Revenue Bonds: | | | | | | | | |
Electric Power & Light Revenue | | | 12.0 | % | | | | |
Highway Revenue Tolls | | | 10.0 | | | | | |
Health, Hospital & Nursing Home Revenue | | | 9.7 | | | | | |
Water Revenue | | | 8.6 | | | | | |
Miscellaneous Revenue | | | 7.7 | | | | | |
Port, Airport & Marina Revenue | | | 6.6 | | | | | |
College & University Revenue | | | 5.4 | | | | | |
Sales Tax Revenue | | | 5.1 | | | | | |
Natural Gas Revenue | | | 4.4 | | | | | |
Income Tax Revenue | | | 2.4 | | | | | |
Miscellaneous Taxes | | | 1.7 | | | | | |
Sewer Revenue | | | 1.0 | | | | | |
Lease (Appropriation) | | | 0.3 | | | | | |
Lease (Abatement) | | | 0.3 | | | | | |
Transit Revenue | | | 0.2 | | | | | |
| | | | | | | | |
Total Revenue Bonds | | | | | | | 75.4 | % |
General Obligation | | | | | | | 10.0 | |
U.S. Government Agency Securities | | | | | | | 7.8 | |
Repurchase Agreements | | | | | | | 5.2 | |
U.S. Treasury Obligations | | | | | | | 1.4 | |
Special Assessment | | | | | | | 0.1 | |
Other assets less liabilities | | | | | | | 0.1 | |
| | | | | | | | |
Net Assets | | | | | | | 100.0 | % |
| | | | | | | | |
Notes to Schedule of Investments:
| (a) | | All or partial amount segregated for the benefit of the counterparty as collateral for derivatives. | |
| (b) | | Variable or Floating Rate Security–Securities with an interest rate that changes periodically. The interest rate disclosed reflects the rate in effect on April 30, 2014. | |
| | | | |
| 92 | | Semi-Annual Report | | | April 30, 2014 |
Schedule of Investments
Fixed Income SHares: Series TE
April 30, 2014 (unaudited) (continued)
| (c) | | Rates reflect the effective yields at purchase date. | |
| (d) | | Futures contracts outstanding at April 30, 2014: | |
| | | | | | | | | | | | | | | | | | |
| | | Type | | Contracts | | | Market
Value
(000s) | | | Expiration
Date | | | Unrealized
Depreciation | |
| Short: | | 30-Year U.S. Treasury Bond Futures | | | (140 | ) | | | $(18,869 | ) | | | 6/19/14 | | | | $(21,997 | ) |
| | | | | | | | | | | | | | | | | | |
| (e) | | Interest rate swap agreements outstanding at April 30, 2014: | |
Centrally cleared swap agreements:
| | | | | | | | | | | | | | | | | | | | | | | | |
Broker
(Exchange) | | Notional
Amount
(000s) | | | Termination
Date | | | Rate Type | | | Value | | | Unrealized
Depreciation | |
| | | | Payments
Made | | | Payments
Received | | | |
| Morgan Stanley (CME) | | | $8,000 | | | | 12/18/43 | | | | 3.50 | % | | | 3-Month USD-LIBOR | | | | $(180,822 | ) | | | $(573,142 | ) |
| | | | | | | | | | | | | | | | | | | | | | | | |
| (f) | | Fair Value Measurements-See Note 1(b) in the Notes to Financial Statements. | |
| | | | | | | | | | | | | | | | |
| | | Level 1 –
Quoted
Prices | | | Level 2 –
Other Significant
Observable
Inputs | | | Level 3 –
Significant
Unobservable
Inputs | | | Value at
4/30/14 | |
Investments in Securities – Assets | |
Municipal Bonds | | $ | – | | | | $76,008,376 | | | | $– | | | | $76,008,376 | |
U.S. Treasury Obligations | | | – | | | | 600,000 | | | | – | | | | 600,000 | |
Short-Term Investments | | | – | | | | 12,206,359 | | | | – | | | | 12,206,359 | |
| | | | – | | | | 88,814,735 | | | | – | | | | 88,814,735 | |
Other Financial Instruments* – Liabilities | | | | | | | | | | | | | | | | |
Interest Rate Contracts | | | (21,997 | ) | | | (573,142 | ) | | | – | | | | (595,139 | ) |
Totals | | $ | (21,997 | ) | | $ | 88,241,593 | | | | $– | | | $ | 88,219,596 | |
At April 30, 2014, there were no transfers between Levels 1 and 2.
| * | | Other financial instruments are derivatives, such as futures contracts and swap agreements, which are valued at the unrealized appreciation (depreciation) of the instrument. | |
| (g) | | The following is a summary of the derivative instruments categorized by risk exposure: | |
The effect of derivatives on the Statement of Assets and Liabilities at April 30, 2014:
| | | | |
| Location | | Interest
Rate
Contracts | |
| Liability derivatives: | | | | |
| Payable for variation margin on centrally cleared swaps** | | | $(48,560 | ) |
| Payable for variation margin on futures contracts* | | | (21,997 | ) |
| | | | |
| Total liability derivatives | | | $(70,557 | ) |
| | | | |
| * | | Included in net unrealized depreciation of $21,997 on futures contracts as reported in note (d) of the Notes to Schedule of Investments. | |
| ** | | Included in net unrealized depreciation of $573,142 on centrally cleared swaps as reported in note (e) of the Notes to Schedule of Investments. | |
| | | | | | |
| April 30, 2014 | | | Semi-Annual Report | | | 93 | |
Schedule of Investments
Fixed Income SHares: Series TE
April 30, 2014 (unaudited) (continued)
The effect of derivatives on the Statement of Operations for the six months ended April 30, 2014:
| | | | |
| Location | | Interest
Rate
Contracts | |
| Net realized loss on: | | | | |
| Swaps | | | $(121 | ) |
| | | | |
| Net change in unrealized appreciation/depreciation of: | | | | |
| Futures contracts | | | $(21,997 | ) |
| Swaps | | | (573,142 | ) |
| | | | |
| Total net change in unrealized appreciation/depreciation | | | $(595,139 | ) |
| | | | |
The average volume (measured at each fiscal quarter-end) of derivative activity during the six months ended April 30, 2014:
| | | | |
| Futures Contracts(1) | | Interest
Rate
Swap
Agreements(2) | |
| Short | | | | |
| (47) | | | $5,333 | |
| (2) | | Notional Amount (in thousands) | |
| (h) | | The following tables present by counterparty the Portfolio’s derivative assets and liabilities net of related collateral held by the Fund at April 30, 2014 which has not been offset in the Statement of Assets and Liabilities, but would be available for offset to the extent of a default by the counterparty to the transaction. | |
Financial Assets and Derivative Assets, and Collateral Received at April 30, 2014:
| | | | | | | | | | | | |
| Gross Amounts Not Offset in the Statement of Assets and Liabilities | |
| Counterparty | | Gross Financial Assets
Presented in Statement of
Assets and Liabilities | | | Financial
Instrument/
Derivative
Offset | | | Net Amount | |
Repurchase Agreement | | | | | | | | | | | | |
Goldman Sachs | | | $4,600,000 | | | | $(4,600,000 | )† | | | $– | |
| † | | The actual collateral received is greater than the amount shown here due to over collateralization. | |
Glossary:
| | | | |
| CME | | - | | Chicago Mercantile Exchange |
| GO | | - | | General Obligation Bond |
| GTD | | - | | Guaranteed |
| LIBOR | | - | | London Inter-Bank Offered Rate |
| PSF | | - | | Public School Fund |
| | | | | | |
| 94 | | Semi-Annual Report | | | April 30, 2014 | | | See accompanying Notes to Financial Statements |
[THIS PAGE INTENTIONALLY LEFT BLANK]
| | | | | | |
| April 30, 2014 | | | Semi-Annual Report | | | 95 | |
Statements of Assets and Liabilities
AllianzGI Managed Accounts Trust
April 30, 2014 (unaudited)
| | | | | | | | | | | | | | | | | | | | | | | | | | | | | | |
| | | | | Series C | | | | | Series LD | | | | | Series M | | | | | Series R | | | | | Series TE | |
| Assets: | | | | | | | | | | | | | | | | | | | | | | | | | | | | | | |
| Investments, at value (cost-$2,776,474,033, $8,915,735, $5,140,307,995, $385,695,450 and $88,346,704, respectively) | | | | | $2,961,683,274 | | | | | | $8,969,962 | | | | | | $5,256,863,906 | | | | | | $386,636,372 | | | | | | $88,814,735 | |
| Cash | | | | | 1,101,663 | | | | | | – | | | | | | 192,689 | | | | | | 21,437 | | | | | | 528,095 | |
| Foreign currency, at value (cost-$3,103,095, $2,120, $2,910,135, $1,130,666 and $0, respectively) | | | | | 3,160,123 | | | | | | 2,092 | | | | | | 2,938,711 | | | | | | 1,134,038 | | | | | | – | |
| Receivable for investments sold | | | | | 75,494,622 | | | | | | 5,428,209 | | | | | | 657,209,928 | | | | | | 30,152,474 | | | | | | – | |
| Interest receivable | | | | | 31,069,897 | | | | | | 70,457 | | | | | | 27,506,591 | | | | | | 1,493,060 | | | | | | 996,252 | |
| Unrealized appreciation of OTC swaps | | | | | 25,432,230 | | | | | | 413 | | | | | | 4,194,788 | | | | | | 1,879,386 | | | | | | – | |
| Swap premiums paid | | | | | 9,529,782 | | | | | | – | | | | | | 217,741 | | | | | | 572,741 | | | | | | – | |
| Unrealized appreciation of forward foreign currency contracts | | | | | 4,695,255 | | | | | | 2,629 | | | | | | 1,980,429 | | | | | | 485,817 | | | | | | – | |
| Receivable for shares of beneficial interest sold | | | | | 2,332,790 | | | | | | 114,746 | | | | | | 2,992,481 | | | | | | 93,295 | | | | | | 122,924 | |
| Receivable for variation margin on futures contracts | | | | | 893,963 | | | | | | 319 | | | | | | 1,893,107 | | | | | | 229,450 | | | | | | – | |
| Deposits with brokers for derivatives collateral | | | | | 9,000 | | | | | | 7,000 | | | | | | 8,524,000 | | | | | | 2,417,000 | | | | | | – | |
| Receivable for variation margin on centrally cleared swaps | | | | | 1,954 | | | | | | – | | | | | | – | | | | | | 99,219 | | | | | | – | |
| Receivable for principal paydowns | | | | | 124 | | | | | | 22,157 | | | | | | 45,361 | | | | | | 513 | | | | | | – | |
| Receivable from broker | | | | | – | | | | | | – | | | | | | 183,585 | | | | | | – | | | | | | – | |
| Receivable for terminated swaps | | | | | – | | | | | | – | | | | | | – | | | | | | 169,728 | | | | | | – | |
| Unsettled reverse repurchase agreements | | | | | – | | | | | | – | | | | | | 255,637,500 | | | | | | – | | | | | | – | |
| Prepaid expenses | | | | | 17,041 | | | | | | – | | | | | | 17,041 | | | | | | – | | | | | | – | |
Total Assets | | | | | 3,115,421,718 | | | | | | 14,617,984 | | | | | | 6,220,397,858 | | | | | | 425,384,530 | | | | | | 90,462,006 | |
| | | | | | | | | | |
| Liabilities: | | | | | | | | | | | | | | | | | | | | | | | | | | | | | | |
| Payable for investments purchased | | | | | 21,895,661 | | | | | | 5,025,282 | | | | | | 1,703,904,425 | | | | | | 16,995,551 | | | | | | 1,219,067 | |
| Payable for reverse repurchase agreements | | | | | – | | | | | | 854,000 | | | | | | 1,433,251,500 | | | | | | – | | | | | | – | |
| Payable for shares of beneficial interest redeemed | | | | | 4,041,546 | | | | | | – | | | | | | 3,926,918 | | | | | | 556,956 | | | | | | 119,440 | |
| Payable to custodian for cash overdraft | | | | | – | | | | | | 291,038 | | | | | | – | | | | | | – | | | | | | – | |
| Payable to brokers for cash collateral received | | | | | 28,482,000 | | | | | | – | | | | | | 16,130,000 | | | | | | 325,000 | | | | | | – | |
| Payable for variation margin on centrally cleared swaps | | | | | 1,797,320 | | | | | | – | | | | | | 2,799,063 | | | | | | 258,870 | | | | | | 48,560 | |
| Payable to broker | | | | | 221,016 | | | | | | – | | | | | | – | | | | | | – | | | | | | – | |
| | | | | | |
| 96 | | Semi-Annual Report | | | April 30, 2014 | | | See accompanying Notes to Financial Statements |
Statements of Assets and Liabilities
AllianzGI Managed Accounts Trust
April 30, 2014 (unaudited) (continued)
| | | | | | | | | | | | | | | | | | | | | | | | | | | | | | |
| | | | | Series C | | | | | Series LD | | | | | Series M | | | | | Series R | | | | | Series TE | |
| Payable for terminated swaps | | | | | $– | | | | | | $– | | | | | | $– | | | | | | $67,023 | | | | | | $– | |
| Payable for variation margin on futures contracts | | | | | 32,913 | | | | | | – | | | | | | 2,317,000 | | | | | | 1,248 | | | | | | 21,997 | |
| Payable for sale-buyback financing transactions | | | | | – | | | | | | – | | | | | | 134,821,284 | | | | | | 152,074,958 | | | | | | – | |
| Securities sold short, at value (proceeds received-$48,108,281, $99,526, $0, $0 and $0, respectively) | | | | | 48,517,548 | | | | | | 99,816 | | | | | | – | | | | | | – | | | | | | – | |
| Unrealized depreciation of forward foreign currency contracts | | | | | 11,476,032 | | | | | | 14,306 | | | | | | 978,534 | | | | | | 959,783 | | | | | | – | |
| Dividends payable | | | | | 9,626,466 | | | | | | 11,948 | | | | | | 7,641,870 | | | | | | 725,726 | | | | | | 167,265 | |
| Swap premiums received | | | | | 6,057,214 | | | | | | 938 | | | | | | 461,269 | | | | | | 750,774 | | | | | | – | |
| Unrealized depreciation of OTC swaps | | | | | 572,360 | | | | | | – | | | | | | 8,541,547 | | | | | | 5,296,621 | | | | | | – | |
| Options written, at value (premiums received-$2,457,212, $0, $5,302,335, $955,930 and $0, respectively) | | | | | 296,221 | | | | | | – | | | | | | 1,066,661 | | | | | | 292,538 | | | | | | – | |
| Interest payable for cash collateral received | | | | | 237 | | | | | | 138 | | | | | | 135 | | | | | | 3 | | | | | | – | |
| Interest payable for reverse repurchase agreements | | | | | – | | | | | | 28 | | | | | | 29,698 | | | | | | – | | | | | | – | |
Total Liabilities | | | | | 133,016,534 | | | | | | 6,297,494 | | | | | | 3,315,869,904 | | | | | | 178,305,051 | | | | | | 1,576,329 | |
| Net Assets | | | | | $2,982,405,184 | | | | | | $8,320,490 | | | | | | $2,904,527,954 | | | | | | $247,079,479 | | | | | | $88,885,677 | |
| | | | | | | | | | |
| Net Assets Consist of: | | | | | | | | | | | | | | | | | | | | | | | | | | | | | | |
| Shares of beneficial interest of $0.001 par value (unlimited number authorized) | | | | | $243,524 | | | | | | $820 | | | | | | $271,029 | | | | | | $23,871 | | | | | | $9,046 | |
| Paid-in-capital in excess of par | | | | | 2,854,038,167 | | | | | | 8,219,812 | | | | | | 2,790,631,383 | | | | | | 269,585,065 | | | | | | 89,039,972 | |
| Undistributed net investment income | | | | | 5,322,386 | | | | | | 693 | | | | | | 6,150,554 | | | | | | 1,084,474 | | | | | | 64,280 | |
| Accumulated net realized gain (loss) | | | | | (66,780,118) | | | | | | 56,325 | | | | | | 33,900,730 | | | | | | (18,351,162) | | | | | | (100,513) | |
| Net unrealized appreciation (depreciation) | | | | | 189,581,225 | | | | | | 42,840 | | | | | | 73,574,258 | | | | | | (5,262,769) | | | | | | (127,108) | |
| Net Assets | | | | | $2,982,405,184 | | | | | | $8,320,490 | | | | | | $2,904,527,954 | | | | | | $247,079,479 | | | | | | $88,885,677 | |
| Shares Outstanding | | | | | 243,524,020 | | | | | | 819,740 | | | | | | 271,029,437 | | | | | | 23,870,823 | | | | | | 9,045,721 | |
| Net Asset Value, Offering Price and Redemption Price Per Share | | | | | $12.25 | | | | | | $10.15 | | | | | | $10.72 | | | | | | $10.35 | | | | | | $9.83 | |
| | | | | | | | |
| See accompanying Notes to Financial Statements | | | April 30, 2014 | | | Semi-Annual Report | | | 97 | |
Statements of Operations
AllianzGI Managed Accounts Trust
Period or Six Months ended April 30, 2014 (unaudited)
| | | | | | | | | | | | | | | | | | | | | | | | | | | | | | |
| | | | | Series C | | | | | Series LD* | | | | | Series M | | | | | Series R | | | | | Series TE | |
| Investment Income: | | | | | | | | | | | | | | | | | | | | | | | | | | | | | | |
| Interest** | | | | | $64,978,839 | | | | | | $34,460 | | | | | | $55,085,196 | | | | | | $3,849,703 | | | | | | $1,009,515 | |
| Miscellaneous | | | | | 3,967 | | | | | | – | | | | | | 58,065 | | | | | | – | | | | | | – | |
Total Investment Income | | | | | 64,982,806 | | | | | | 34,460 | | | | | | 55,143,261 | | | | | | 3,849,703 | | | | | | 1,009,515 | |
| | | | | | | | | | |
| Expenses: | | | | | | | | | | | | | | | | | | | | | | | | | | | | | | |
| Interest | | | | | 253,245 | | | | | | 176 | | | | | | 264,882 | | | | | | 94,625 | | | | | | – | |
| Miscellaneous | | | | | – | | | | | | – | | | | | | 36 | | | | | | – | | | | | | – | |
Total Expenses | | | | | 253,245 | | | | | | 176 | | | | | | 264,918 | | | | | | 94,625 | | | | | | – | |
| | | | | | | | | | |
| Net Investment Income | | | | | 64,729,561 | | | | | | 34,284 | | | | | | 54,878,343 | | | | | | 3,755,078 | | | | | | 1,009,515 | |
| | | | | | | | | | |
| Realized and Change in Unrealized Gain (Loss): | | | | | | | | | | | | | | | | | | | | | | | | | | | | | | |
Net realized gain (loss) on: | | | | | | | | | | | | | | | | | | | | | | | | | | | | | | |
Investments | | | | | (43,607,341) | | | | | | 56,593 | | | | | | 25,993,247 | | | | | | (1,091,808) | | | | | | (4,150) | |
Futures contracts | | | | | 8,991,905 | | | | | | 824 | | | | | | 54,940 | | | | | | 1,091,217 | | | | | | – | |
Options written | | | | | 8,544,783 | | | | | | 239 | | | | | | 21,650,470 | | | | | | 1,277,349 | | | | | | – | |
Swaps | | | | | (29,590,198) | | | | | | 86 | | | | | | (12,167,855) | | | | | | 2,058,035 | | | | | | (121) | |
Foreign currency transactions | | | | | (5,798,730) | | | | | | (1,417) | | | | | | 5,334,168 | | | | | | (292,344) | | | | | | – | |
Net change in unrealized appreciation/depreciation of: | | | | | | | | | | | | | | | | | | | | | | | | | | | | | | |
Investments | | | | | 51,293,055 | | | | | | 54,227 | | | | | | (513,351) | | | | | | 2,125,624 | | | | | | 2,159,978 | |
Securities sold short | | | | | (350,203) | | | | | | (290) | | | | | | – | | | | | | – | | | | | | – | |
Futures contracts | | | | | (11,549,067) | | | | | | 110 | | | | | | (14,922,000) | | | | | | (1,564,031) | | | | | | (21,997) | |
Options written | | | | | 151,806 | | | | | | – | | | | | | (6,970,773) | | | | | | (327,542) | | | | | | – | |
Swaps | | | | | 17,364,326 | | | | | | 413 | | | | | | (12,532,429) | | | | | | (3,979,651) | | | | | | (573,142) | |
Foreign currency transactions | | | | | 1,968,151 | | | | | | (11,620) | | | | | | (829,143) | | | | | | (353,915) | | | | | | – | |
| Net realized and change in unrealized gain (loss) | | | | | (2,581,513) | | | | | | 99,165 | | | | | | 5,097,274 | | | | | | (1,057,066) | | | | | | 1,560,568 | |
| Net Increase in Net Assets Resulting from Investment Operations | | | | | $62,148,048 | | | | | | $133,449 | | | | | | $59,975,617 | | | | | | $2,698,012 | | | | | | $2,570,083 | |
| **Including foreign withholding taxes of: | | | | | (4,134) | | | | | | – | | | | | | – | | | | | | – | | | | | | – | |
* For the period December 23, 2013 (commencement of operations) through April 30, 2014.
| | | | | | |
| 98 | | Semi-Annual Report | | | April 30, 2014 | | | See accompanying Notes to Financial Statements |
Statements of Changes in Net Assets
AllianzGI Managed Accounts Trust
| | | | | | | | | | | | |
| | | | | Series C | |
| | | | | Six Months ended
April 30, 2014
(unaudited) | | | | | Year ended
October 31, 2013 | |
| Investment Operations: | | | | | | | | | | | | |
| Net investment income | | | | | $64,729,561 | | | | | | $171,734,858 | |
| Net realized gain (loss) | | | | | (61,459,581) | | | | | | 247,851,712 | |
| Net change in unrealized appreciation/depreciation | | | | | 58,878,068 | | | | | | (318,536,731) | |
| Net increase in net assets resulting from investment operations | | | | | 62,148,048 | | | | | | 101,049,839 | |
| | | | |
| Dividends and Distributions to Shareholders from: | | | | | | | | | | | | |
| Net investment income | | | | | (69,975,738) | | | | | | (252,691,443) | |
| Net realized gains | | | | | (205,507,950) | | | | | | (28,713,093) | |
| Total dividends and distributions to shareholders | | | | | (275,483,688) | | | | | | (281,404,536) | |
| | | | |
| Share Transactions: | | | | | | | | | | | | |
| Net proceeds from the sale of shares | | | | | 567,339,495 | | | | | | 1,005,089,507 | |
| Cost of shares redeemed | | | | | (632,649,114) | | | | | | (1,582,526,880) | |
| Net decrease in net assets from share transactions | | | | | (65,309,619) | | | | | | (577,437,373) | |
| Total decrease in net assets | | | | | (278,645,259) | | | | | | (757,792,070) | |
| | | | |
| Net Assets: | | | | | | | | | | | | |
| Beginning of period | | | | | 3,261,050,443 | | | | | | 4,018,842,513 | |
| End of period* | | | | | $2,982,405,184 | | | | | | $3,261,050,443 | |
| *Including undistributed net investment income of: | | | | | $5,322,386 | | | | | | $10,568,563 | |
| | | | |
| Shares Issued and Redeemed: | | | | | | | | | | | | |
| Issued | | | | | 45,555,685 | | | | | | 75,594,711 | |
| Redeemed | | | | | (50,725,230) | | | | | | (119,237,180) | |
| Net Decrease | | | | | (5,169,545) | | | | | | (43,642,469) | |
| | | | | | | | |
| See accompanying Notes to Financial Statements | | | April 30, 2014 | | | Semi-Annual Report | | | 99 | |
Statements of Changes in Net Assets
AllianzGI Managed Accounts Trust
| | | | | | |
| | | | | Series LD | |
| | | | | Period from
December 23, 2013**
through
April 30, 2014
(unaudited) | |
| Investment Operations: | | | | | | |
| Net investment income | | | | | $34,284 | |
| Net realized gain | | | | | 56,325 | |
| Net change in unrealized appreciation/depreciation | | | | | 42,840 | |
| Net increase in net assets resulting from investment operations | | | | | 133,449 | |
| | |
| Dividends to Shareholders from: | | | | | | |
| Net investment income | | | | | (33,591) | |
| | |
| Share Transactions: | | | | | | |
| Net proceeds from the sale of shares | | | | | 5,222,252 | |
| Cost of shares redeemed | | | | | (1,620) | |
| Net increase in net assets from share transactions | | | | | 5,220,632 | |
| Total increase in net assets | | | | | 5,320,490 | |
| | |
| Net Assets: | | | | | | |
| Beginning of period | | | | | 3,000,000 | |
| End of period* | | | | | $8,320,490 | |
| *Including undistributed net investment income of: | | | | | $693 | |
| | |
| Shares Issued and Redeemed: | | | | | | |
| Issued | | | | | 819,900 | |
| Redeemed | | | | | (160) | |
| Net Increase | | | | | 819,740 | |
** Commencement of operations.
| | | | | | |
| 100 | | Semi-Annual Report | | | April 30, 2014 | | | See accompanying Notes to Financial Statements |
Statements of Changes in Net Assets
AllianzGI Managed Accounts Trust
| | | | | | | | | | | | |
| | | | | Series M | |
| | | | | Six Months ended
April 30, 2014
(unaudited) | | | | | Year ended
October 31, 2013 | |
| Investment Operations: | | | | | | | | | | | | |
| Net investment income | | | | | $54,878,343 | | | | | | $116,509,038 | |
| Net realized gain | | | | | 40,864,970 | | | | | | 129,621,830 | |
| Net change in unrealized appreciation/depreciation | | | | | (35,767,696) | | | | | | (209,794,999) | |
| Net increase in net assets resulting from investment operations | | | | | 59,975,617 | | | | | | 36,335,869 | |
| | | | |
| Dividends and Distributions to Shareholders from: | | | | | | | | | | | | |
| Net investment income | | | | | (47,475,585) | | | | | | (153,919,510) | |
| Net realized gains | | | | | (50,577,866) | | | | | | – | |
| Total dividends and distributions to shareholders | | | | | (98,053,451) | | | | | | (153,919,510) | |
| | | | |
| Share Transactions: | | | | | | | | | | | | |
| Net proceeds from the sale of shares | | | | | 530,194,656 | | | | | | 954,104,263 | |
| Cost of shares redeemed | | | | | (584,519,004) | | | | | | (1,827,599,582) | |
| Net decrease in net assets from share transactions | | | | | (54,324,348) | | | | | | (873,495,319) | |
| Total decrease in net assets | | | | | (92,402,182) | | | | | | (991,078,960) | |
| | | | |
| Net Assets: | | | | | | | | | | | | |
| Beginning of period | | | | | 2,996,930,136 | | | | | | 3,988,009,096 | |
| End of period* | | | | | $2,904,527,954 | | | | | | $2,996,930,136 | |
| *Including undistributed (dividends in excess of) net investment income of: | | | | | $6,150,554 | | | | | | $(1,252,204) | |
| | | | |
| Shares Issued and Redeemed: | | | | | | | | | | | | |
| Issued | | | | | 49,520,669 | | | | | | 86,881,849 | |
| Redeemed | | | | | (54,483,358) | | | | | | (166,386,495) | |
| Net Decrease | | | | | (4,962,689) | | | | | | (79,504,646) | |
| | | | | | | | |
| See accompanying Notes to Financial Statements | | | April 30, 2014 | | | Semi-Annual Report | | | 101 | |
Statements of Changes in Net Assets
AllianzGI Managed Accounts Trust
| | | | | | | | | | | | |
| | | | | Series R | |
| | | | | Six Months ended
April 30, 2014
(unaudited) | | | | | Year ended
October 31, 2013 | |
| Investment Operations: | | | | | | | | | | | | |
| Net investment income | | | | | $3,755,078 | | | | | | $10,725,951 | |
| Net realized gain | | | | | 3,042,449 | | | | | | 2,648,849 | |
| Net change in unrealized appreciation/depreciation | | | | | (4,099,515) | | | | | | (42,388,608) | |
| Net increase (decrease) in net assets resulting from investment operations | | | | | 2,698,012 | | | | | | (29,013,808) | |
| | | | |
| Dividends and Distributions to Shareholders from: | | | | | | | | | | | | |
| Net investment income | | | | | (1,516,700) | | | | | | (10,834,508) | |
| Net realized gains | | | | | (7,339,502) | | | | | | (34,897,070) | |
| Total dividends and distributions to shareholders | | | | | (8,856,202) | | | | | | (45,731,578) | |
| | | | |
| Share Transactions: | | | | | | | | | | | | |
| Net proceeds from the sale of shares | | | | | 26,175,081 | | | | | | 183,493,231 | |
| Cost of shares redeemed | | | | | (123,096,417) | | | | | | (361,307,822) | |
| Net decrease in nets assets from share transactions | | | | | (96,921,336) | | | | | | (177,814,591) | |
| Total decrease in net assets | | | | | (103,079,526) | | | | | | (252,559,977) | |
| | | | |
| Net Assets: | | | | | | | | | | | | |
| Beginning of period | | | | | 350,159,005 | | | | | | 602,718,982 | |
| End of period* | | | | | $247,079,479 | | | | | | $350,159,005 | |
| *Including undistributed (dividends in excess of) net investment income of: | | | | | $1,084,474 | | | | | | $(1,153,904) | |
| | | | |
| Shares Issued and Redeemed: | | | | | | | | | | | | |
| Issued | | | | | 2,577,210 | | | | | | 16,264,728 | |
| Redeemed | | | | | (11,988,918) | | | | | | (33,504,463) | |
| Net Decrease | | | | | (9,411,708) | | | | | | (17,239,735) | |
| | | | | | |
| 102 | | Semi-Annual Report | | | April 30, 2014 | | | See accompanying Notes to Financial Statements |
Statements of Changes in Net Assets
AllianzGI Managed Accounts Trust
| | | | | | | | | | | | |
| | | | | Series TE | |
| | | | | Six Months ended
April 30, 2014
(unaudited) | | | | | Year ended
October 31, 2013 | |
| Investment Operations: | | | | | | | | | | | | |
| Net investment income | | | | | $1,009,515 | | | | | | $902,893 | |
| Net realized loss | | | | | (4,271) | | | | | | (90,885) | |
| Net change in unrealized appreciation/depreciation | | | | | 1,564,839 | | | | | | (1,734,314) | |
| Net increase (decrease) in net assets resulting from investment operations | | | | | 2,570,083 | | | | | | (922,306) | |
| | | | |
| Dividends to Shareholders from: | | | | | | | | | | | | |
| Net investment income | | | | | (945,243) | | | | | | (902,893) | |
| | | | |
| Share Transactions: | | | | | | | | | | | | |
| Net proceeds from the sale of shares | | | | | 33,436,605 | | | | | | 70,208,582 | |
| Cost of shares redeemed | | | | | (11,769,835) | | | | | | (12,239,806) | |
| Net increase in net assets from share transactions | | | | | 21,666,770 | | | | | | 57,968,776 | |
| Total increase in net assets | | | | | 23,291,610 | | | | | | 56,143,577 | |
| | | | |
| Net Assets: | | | | | | | | | | | | |
| Beginning of period | | | | | 65,594,067 | | | | | | 9,450,490 | |
| End of period* | | | | | $88,885,677 | | | | | | $65,594,067 | |
| *Including undistributed net investment income of: | | | | | $64,280 | | | | | | $8 | |
| | | | |
| Shares Issued and Redeemed: | | | | | | | | | | | | |
| Issued | | | | | 3,461,577 | | | | | | 7,125,971 | |
| Redeemed | | | | | (1,220,416) | | | | | | (1,267,512) | |
| Net Increase | | | | | 2,241,161 | | | | | | 5,858,459 | |
| | | | | | | | |
| See accompanying Notes to Financial Statements | | | April 30, 2014 | | | Semi-Annual Report | | | 103 | |
Statements of Cash Flows†
AllianzGI Managed Accounts Trust
Period or Six Months ended April 30, 2014 (unaudited)
| | | | | | | | | | | | | | | | | | | | | | | | |
| | | | | Series C | | | | | Series LD(1) | | | | | Series M | | | | | Series R | |
| Increase (decrease) in Cash and Foreign Currency from: | | | | | | | | | | | | | | | | | | | | | | | | |
| | | | | | | | |
| Cash Flows provided by (used for) Operating Activities: | | | | | | | | | | | | | | | | | | | | | | | | |
Net increase in net assets resulting from investment operations | | | | | $62,148,048 | | | | | | $133,449 | | | | | | $59,975,617 | | | | | | $2,698,012 | |
| | | | | | | | |
| Adjustments to Reconcile Net Increase in Net Assets Resulting from Investment Operations to Net Cash provided by (used for) Operating Activities: | | | | | | | | | | | | | | | | | | | | | | | | |
Purchases of long-term investments | | | | | (4,445,145,689) | | | | | | (437,924,466) | | | | | | (18,394,597,091) | | | | | | (1,664,678,223) | |
Proceeds from sales of long-term investments | | | | | 5,889,895,396 | | | | | | 430,045,350 | | | | | | 17,092,528,232 | | | | | | 1,766,368,179 | |
(Purchases) sales of short-term portfolio investments, net | | | | | (319,630,377) | | | | | | (1,004,421) | | | | | | (30,039,574) | | | | | | 26,274,921 | |
Net change in unrealized appreciation/depreciation | | | | | (58,878,068) | | | | | | (42,840) | | | | | | 35,767,696 | | | | | | 4,099,515 | |
Net realized (gain) loss | | | | | 61,459,581 | | | | | | (56,325) | | | | | | (40,864,970) | | | | | | (3,042,449) | |
Net amortization/accretion on investments | | | | | 7,627,883 | | | | | | 24,633 | | | | | | 4,772,543 | | | | | | 992,483 | |
Proceeds for securities sold short | | | | | 19,256,250 | | | | | | 99,526 | | | | | | – | | | | | | – | |
Increase in receivable for investments sold | | | | | (4,717,924) | | | | | | (5,428,209) | | | | | | (422,206,764) | | | | | | (16,794,974) | |
(Increase) decrease in interest and dividends receivable | | | | | 9,383,324 | | | | | | (70,457) | | | | | | (5,448,035) | | | | | | 582,152 | |
(Increase) decrease in receivable for principal paydown | | | | | (2) | | | | | | (22,157) | | | | | | 122,149 | | | | | | 1,080 | |
Proceeds from futures contracts transactions | | | | | (3,574,574) | | | | | | 615 | | | | | | (12,931,552) | | | | | | (676,072) | |
(Increase) decrease in deposits with brokers for derivatives collateral | | | | | 17,282,000 | | | | | | (7,000) | | | | | | 33,897,000 | | | | | | (351,000) | |
Increase in receivable from broker | | | | | – | | | | | | – | | | | | | (4,269) | | | | | | – | |
Increase (decrease) in payable for investments purchased | | | | | (20,193,026) | | | | | | 5,025,282 | | | | | | 529,692,696 | | | | | | 7,217,621 | |
Increase (decrease) in payable to brokers for cash collateral received | | | | | 6,940,000 | | | | | | – | | | | | | 2,046,000 | | | | | | (1,119,000) | |
Net cash provided by (used for) swap transactions | | | | | (30,405,206) | | | | | | 1,024 | | | | | | (20,205,341) | | | | | | (856,612) | |
Net cash provided by (used for) foreign currency transactions | | | | | (5,713,764) | | | | | | (1,359) | | | | | | 5,373,584 | | | | | | (270,083) | |
Increase (decrease) in interest payable for reverse repurchase agreements | | | | | (3,718) | | | | | | 28 | | | | | | 29,698 | | | | | | (1,296) | |
Increase (decrease) in interest payable on cash collateral received | | | | | (117) | | | | | | 138 | | | | | | (96) | | | | | | (26) | |
| Net cash provided by (used for) operating activities* | | | | | 1,185,730,017 | | | | | | (9,227,189) | | | | | | (1,162,092,477) | | | | | | 120,444,228 | |
| | | | | | |
| 104 | | Semi-Annual Report | | | April 30, 2014 | | | See accompanying Notes to Financial Statements |
Statements of Cash Flows†
AllianzGI Managed Accounts Trust
Period or Six Months ended April 30, 2014 (unaudited) (continued)
| | | | | | | | | | | | | | | | | | | | | | | | |
| | | | | Series C | | | | | Series LD(1) | | | | | Series M | | | | | Series R | |
| | | | | | | | |
| Cash Flows provided by (used for) Financing Activities: | | | | | | | | | | | | | | | | | | | | | | | | |
Payments for reverse repurchase agreements | | | | | $(2,017,778,777) | | | | | | $(2,438,000) | | | | | | $(7,555,378,575) | | | | | | $(123,376,876) | |
Proceeds on reverse repurchase agreements | | | | | 1,709,133,777 | | | | | | 3,292,000 | | | | | | 8,988,630,075 | | | | | | 28,478,375 | |
Increase in unsettled reverse repurchase agreements | | | | | – | | | | | | – | | | | | | (255,637,500) | | | | | | – | |
Cash Dividends Paid | | | | | (279,594,708) | | | | | | (21,643) | | | | | | (99,526,585) | | | | | | (8,645,199) | |
Proceeds from shares of beneficial interest sold | | | | | 570,495,763 | | | | | | 5,107,506 | | | | | | 532,185,839 | | | | | | 26,629,586 | |
Payment on shares of beneficial interest redeemed | | | | | (631,918,512) | | | | | | (1,620) | | | | | | (583,703,139) | | | | | | (122,695,727) | |
Increase (decrease) in payable to custodian for cash overdraft | | | | | – | | | | | | 291,038 | | | | | | (39,298) | | | | | | – | |
Proceeds on sale-buyback financing transactions | | | | | (3,588,765,161) | | | | | | – | | | | | | (4,361,972,276) | | | | | | (1,423,413,353) | |
Payments for sale-buyback financing transactions | | | | | 3,055,701,984 | | | | | | – | | | | | | 4,498,931,120 | | | | | | 1,503,336,649 | |
| Net cash provided by (used for) financing activities | | | | | (1,182,725,634) | | | | | | 6,229,281 | | | | | | 1,163,489,661 | | | | | | (119,686,545) | |
| Net increase (decrease) in cash and foreign currency | | | | | 3,004,383 | | | | | | (2,997,908) | | | | | | 1,397,184 | | | | | | 757,683 | |
| Cash and foreign currency, at beginning of period | | | | | 1,257,403 | | | | | | 3,000,000 | | | | | | 1,734,216 | | | | | | 397,792 | |
| Cash and foreign currency, at end of period | | | | | $4,261,786 | | | | | | $2,092 | | | | | | $3,131,400 | | | | | | $1,155,475 | |
*Cash paid for interest primarily related to participation in reverse repurchase agreement transactions was $257,080, $10, $235,280, and $95,947, respectively.
(1) For the period December 23, 2013 (commencement of operations) through April 30, 2014.
† Statement of Cash Flows is not required for Series TE.
| | | | | | | | |
| See accompanying Notes to Financial Statements | | | April 30, 2014 | | | Semi-Annual Report | | | 105 | |
Financial Highlights
Fixed Income SHares: Series C
For a share outstanding throughout each period:
| | | | | | | | | | | | | | | | | | | | | | | | | | | | | | | | | | | | |
| | | | | Six Months
ended
April 30,
2014
(unaudited) | | | | | Year ended October 31, | |
| | | | | | | | 2013 | | | | | 2012 | | | | | 2011 | | | | | 2010 | | | | | 2009 | |
| Net asset value, beginning of period | | | | | $13.11 | | | | | | $13.75 | | | | | | $12.71 | | | | | | $14.05 | | | | | | $13.83 | | | | | | $11.50 | |
| Investment Operations: | | | | | | | | | | | | | | | | | | | | | | | | | | | | | | | | | | | | |
| Net investment income | | | | | 0.26 | | | | | | 0.60 | | | | | | 0.65 | | | | | | 0.78 | | | | | | 0.75 | | | | | | 0.83 | |
| Net realized and change in unrealized gain (loss) | | | | | (0.01 | ) | | | | | (0.24 | ) | | | | | 1.06 | | | | | | (0.46 | ) | | | | | 1.93 | | | | | | 3.86 | |
| Total from investment operations | | | | | 0.25 | | | | | | 0.36 | | | | | | 1.71 | | | | | | 0.32 | | | | | | 2.68 | | | | | | 4.69 | |
| Dividends and Distributions to Shareholders from: | | | | | | | | | | | | | | | | | | | | | | | | | | | | | | | | | | | | |
| Net investment income | | | | | (0.28 | ) | | | | | (0.90 | ) | | | | | (0.67 | ) | | | | | (1.25 | ) | | | | | (1.67 | ) | | | | | (1.36 | ) |
| Net realized gains | | | | | (0.83 | ) | | | | | (0.10 | ) | | | | | – | | | | | | (0.41 | ) | | | | | (0.79 | ) | | | | | (1.00 | ) |
| Total dividends and distributions to shareholders | | | | | (1.11 | ) | | | | | (1.00 | ) | | | | | (0.67 | ) | | | | | (1.66 | ) | | | | | (2.46 | ) | | | | | (2.36 | ) |
| Net asset value, end of period | | | | | $12.25 | | | | | | $13.11 | | | | | | $13.75 | | | | | | $12.71 | | | | | | $14.05 | | | | | | $13.83 | |
| Total Investment Return (1) | | | | | 2.07 | % | | | | | 2.72 | % | | | | | 13.79 | % | | | | | 2.75 | % | | | | | 22.40 | % | | | | | 45.84 | % |
| RATIOS/SUPPLEMENTAL DATA: | | | | | | | | | | | | | | | | | | | | | | | | | | | | | | | | | | | | |
| Net assets, end of period (000s) | | | | | $2,982,405 | | | | | | $3,261,050 | | | | | | $4,018,843 | | | | | | $3,680,966 | | | | | | $3,345,203 | | | | | | $2,893,227 | |
| Ratio of operating expenses to average net assets, including interest expense (2) | | | | | 0.02 | %(4) | | | | | 0.00 | %(3) | | | | | 0.00 | %(3) | | | | | 0.00 | %(3) | | | | | 0.00 | %(3) | | | | | 0.01 | % |
| Ratio of operating expenses to average net assets, excluding interest expense (2) | | | | | 0.00 | %(4) | | | | | 0.00 | %(3) | | | | | 0.00 | % | | | | | 0.00 | % | | | | | 0.00 | % | | | | | 0.00 | % |
| Ratio of net investment income to average net assets (2) | | | | | 4.16 | %(4) | | | | | 4.65 | % | | | | | 4.87 | % | | | | | 5.72 | % | | | | | 5.70 | % | | | | | 6.71 | % |
| Portfolio turnover rate | | | | | 41 | % | | | | | 149 | % | | | | | 83 | % | | | | | 178 | % | | | | | 164 | % | | | | | 683 | % |
| (1) | | The calculation assumes that all income dividends and capital gain distributions, if any, have been reinvested. Total return does not reflect broker commissions or “wrap fee” charges. Total investment return for a period of less than one year is not annualized. | |
| (2) | | Reflects the fact that no fees or expenses are incurred. The Portfolios are an integral part of “wrap-fee” programs sponsored by investment advisers and/or broker-dealers unaffiliated with Series C, the Investment Manager or the Sub-Adviser. Participants in these programs pay a “wrap” fee to the sponsor of the program. | |
| | | | | | |
| 106 | | Semi-Annual Report | | | April 30, 2014 | | | See accompanying Notes to Financial Statements |
Financial Highlights
Fixed Income SHares: Series LD
For a share outstanding throughout each period:
| | | | | | |
| | | | | Period from December 23, 2013*
through
April 30, 2014
(unaudited) | |
| Net asset value, beginning of period | | | | | $10.00 | |
| Investment Operations: | | | | | | |
| Net investment income | | | | | 0.05 | |
| Net realized and change in unrealized gain | | | | | 0.15 | |
| Total from investment operations | | | | | 0.20 | |
| Dividends to Shareholders from Net Investment Income | | | | | (0.05 | ) |
| Net asset value, end of period | | | | | $10.15 | |
| Total Investment Return (1) | | | | | 2.03 | % |
| RATIOS/SUPPLEMENTAL DATA: | | | | | | |
| Net assets, end of period (000s) | | | | | $8,320 | |
| Ratio of operating expenses to average net assets, including interest expense (2)(3) | | | | | 0.01 | % |
| Ratio of operating expenses to average net asset excluding interest expense (2)(3) | | | | | 0.00 | % |
| Ratio of net investment income to average net assets (2)(3) | | | | | 1.64 | % |
| Portfolio turnover rate | | | | | 8,531 | % |
| * | | Commencement of operations. | |
| (1) | | The calculation assumes that all income dividends and capital gain distributions, if any, have been reinvested. Total return does not reflect broker commissions or “wrap fee” charges. Total investment return for a period of less than one year is not annualized. | |
| (2) | | Reflects the fact that no fees or expenses are incurred. The Portfolios are an integral part of “wrap-fee” programs sponsored by investment advisers and/or broker-dealers unaffiliated with Series LD, the Investment Manager or the Sub-Adviser. Participants in these programs pay a “wrap” fee to the sponsor of the program. | |
| | | | | | | | |
| See accompanying Notes to Financial Statements | | | April 30, 2014 | | | Semi-Annual Report | | | 107 | |
Financial Highlights
Fixed Income SHares: Series M
For a share outstanding throughout each period:
| | | | | | | | | | | | | | | | | | | | | | | | | | | | | | | | | | | | |
| | | | | Six Months
ended
April 30, 2014
(unaudited) | | | | | Year ended October 31, | |
| | | | | | | | 2013 | | | | | 2012 | | | | | 2011 | | | | | 2010 | | | | | 2009 | |
| Net asset value, beginning of period | | | | | $10.86 | | | | | | $11.22 | | | | | | $10.51 | | | | | | $10.94 | | | | | | $9.90 | | | | | | $8.36 | |
| Investment Operations: | | | | | | | | | | | | | | | | | | | | | | | | | | | | | | | | | | | | |
| Net investment income | | | | | 0.20 | | | | | | 0.34 | | | | | | 0.41 | | | | | | 0.48 | | | | | | 0.47 | | | | | | 1.19 | |
| Net realized and change in unrealized gain (loss) | | | | | 0.01 | | | | | | (0.23 | ) | | | | | 0.84 | | | | | | (0.29 | ) | | | | | 1.25 | | | | | | 1.62 | |
| Total from investment operations | | | | | 0.21 | | | | | | 0.11 | | | | | | 1.25 | | | | | | 0.19 | | | | | | 1.72 | | | | | | 2.81 | |
| Dividends and Distributions to Shareholders from: | | | | | | | | | | | | | | | | | | | | | | | | | | | | | | | | | | | | |
| Net investment income | | | | | (0.17 | ) | | | | | (0.47 | ) | | | | | (0.54 | ) | | | | | (0.49 | ) | | | | | (0.68 | ) | | | | | (1.27 | ) |
| Net realized gains | | | | | (0.18 | ) | | | | | – | | | | | | – | | | | | | (0.13 | ) | | | | | – | | | | | | – | |
| Total dividends and distributions to shareholders | | | | | (0.35 | ) | | | | | (0.47 | ) | | | | | (0.54 | ) | | | | | (0.62 | ) | | | | | (0.68 | ) | | | | | (1.27 | ) |
| Net asset value, end of period | | | | | $10.72 | | | | | | $10.86 | | | | | | $11.22 | | | | | | $10.51 | | | | | | $10.94 | | | | | | $9.90 | |
| Total Investment Return (1) | | | | | 2.04 | % | | | | | 0.97 | % | | | | | 12.23 | % | | | | | 1.95 | % | | | | | 18.22 | % | | | | | 36.99 | % |
| RATIOS/SUPPLEMENTAL DATA: | | | | | | | | | | | | | | | | | | | | | | | | | | | | | | | | | | | | |
| Net assets, end of period (000s) | | | | | $2,904,528 | | | | | | $2,996,930 | | | | | | $3,988,009 | | | | | | $3,643,832 | | | | | | $3,351,404 | | | | | | $2,779,932 | |
| Ratio of operating expenses to average net assets, including interest expense (2) | | | | | 0.02 | %(4) | | | | | 0.00 | %(3) | | | | | 0.00 | %(3) | | | | | 0.00 | %(3) | | | | | 0.01 | % | | | | | 1.78 | % |
| Ratio of operating expenses to average net assets, excluding interest expense (2) | | | | | 0.00 | %(3)(4) | | | | | 0.00 | %(3) | | | | | 0.00 | % | | | | | 0.00 | % | | | | | 0.00 | % | | | | | 0.00 | % |
| Ratio of net investment income to average net assets (2) | | | | | 3.71 | %(4) | | | | | 3.25 | % | | | | | 3.78 | % | | | | | 4.57 | % | | | | | 4.67 | % | | | | | 13.01 | % |
| Portfolio turnover rate | | | | | 273 | % | | | | | 448 | % | | | | | 516 | % | | | | | 514 | % | | | | | 482 | % | | | | | 916 | % |
| (1) | | The calculation assumes that all income dividends and capital gain distributions, if any, have been reinvested. Total return does not reflect broker commissions or “wrap fee” charges. Total investment return for a period of less than one year is not annualized. | |
| (2) | | Reflects the fact that no fees or expenses are incurred. The Portfolios are an integral part of “wrap-fee” programs sponsored by investment advisers and/or broker-dealers unaffiliated with Series M, the Investment Manager or the Sub-Adviser. Participants in these programs pay a “wrap” fee to the sponsor of the program. | |
| | | | | | |
| 108 | | Semi-Annual Report | | | April 30, 2014 | | | See accompanying Notes to Financial Statements |
Financial Highlights
Fixed Income SHares: Series R
For a share outstanding throughout each period:
| | | | | | | | | | | | | | | | | | | | | | | | | | | | | | | | | | | | |
| | | | | Six Months
ended
April 30,
2014
(unaudited) | | | | | Year ended October 31, | |
| | | | | | | | 2013 | | | | | 2012 | | | | | 2011 | | | | | 2010 | | | | | 2009 | |
| Net asset value, beginning of period | | | | | $10.52 | | | | | | $11.93 | | | | | | $11.97 | | | | | | $12.13 | | | | | | $10.83 | | | | | | $9.27 | |
| Investment Operations: | | | | | | | | | | | | | | | | | | | | | | | | | | | | | | | | | | | | |
| Net investment income | | | | | 0.14 | | | | | | 0.19 | | | | | | 0.31 | | | | | | 0.40 | | | | | | 0.33 | | | | | | 0.25 | |
| Net realized and change in unrealized gain (loss) | | | | | (0.00 | )(1) | | | | | (0.69 | ) | | | | | 1.10 | | | | | | 0.85 | | | | | | 1.54 | | | | | | 2.00 | |
| Total from investment operations | | | | | 0.14 | | | | | | (0.50 | ) | | | | | 1.41 | | | | | | 1.25 | | | | | | 1.87 | | | | | | 2.25 | |
| Dividends and Distributions to Shareholders from: | | | | | | | | | | | | | | | | | | | | | | | | | | | | | | | | | | | | |
| Net investment income | | | | | (0.06 | ) | | | | | (0.23 | ) | | | | | (0.40 | ) | | | | | (0.43 | ) | | | | | (0.52 | ) | | | | | (0.29 | ) |
| Net realized gains | | | | | (0.25 | ) | | | | | (0.68 | ) | | | | | (1.05 | ) | | | | | (0.98 | ) | | | | | (0.05 | ) | | | | | (0.40 | ) |
| Total dividends and distributions to shareholders | | | | | (0.31 | ) | | | | | (0.91 | ) | | | | | (1.45 | ) | | | | | (1.41 | ) | | | | | (0.57 | ) | | | | | (0.69 | ) |
| Net asset value, end of period | | | | | $10.35 | | | | | | $10.52 | | | | | | $11.93 | | | | | | $11.97 | | | | | | $12.13 | | | | | | $10.83 | |
| Total Investment Return (2) | | | | | 1.72 | % | | | | | (4.78 | )% | | | | | 13.26 | % | | | | | 12.23 | % | | | | | 17.94 | % | | | | | 25.50 | % |
| RATIOS/SUPPLEMENTAL DATA: | | | | | | | | | | | | | | | | | | | | | | | | | | | | | | | | | | | | |
| Net assets, end of period (000s) | | | | | $247,079 | | | | | | $350,159 | | | | | | $602,719 | | | | | | $492,949 | | | | | | $403,376 | | | | | | $287,966 | |
| Ratio of operating expenses to average net assets, including interest expense (3) | | | | | 0.07 | %(5) | | | | | 0.04 | % | | | | | 0.02 | % | | | | | 0.00 | %(4) | | | | | 0.00 | %(4) | | | | | 0.00 | %(4) |
| Ratio of operating expenses to average net assets, excluding interest expense (3) | | | | | 0.00 | %(5) | | | | | 0.00 | %(4) | | | | | 0.00 | % | | | | | 0.00 | % | | | | | 0.00 | % | | | | | 0.00 | % |
Ratio of net investment income
to average net assets (3) | | | | | 2.65 | %(5) | | | | | 2.06 | % | | | | | 2.67 | % | | | | | 3.62 | % | | | | | 2.90 | % | | | | | 2.77 | % |
| Portfolio turnover rate | | | | | 36 | % | | | | | 69 | % | | | | | 264 | % | | | | | 805 | % | | | | | 495 | % | | | | | 1,216 | % |
| (1) | | Less than $(0.005) per common share. | |
| (2) | | The calculation assumes that all income dividends and capital gain distributions, if any, have been reinvested. Total return does not reflect broker commissions or “wrap fee” charges. Total investment return for a period of less than one year is not annualized. | |
| (3) | | Reflects the fact that no fees or expenses are incurred. The Portfolios are an integral part of “wrap-fee” programs sponsored by investment advisers and/or broker-dealers unaffiliated with Series R, the Investment Manager or the Sub-Adviser. Participants in these programs pay a “wrap” fee to the sponsor of the program. | |
| | | | | | | | |
| See accompanying Notes to Financial Statements | | | April 30, 2014 | | | Semi-Annual Report | | | 109 | |
Financial Highlights
Fixed Income SHares: Series TE
For a share outstanding throughout each period:
| | | | | | | | | | | | | | | | | | |
| | | | | Six Months
ended
April 30, 2014
(unaudited) | | | | | Year ended
October 31, 2013 | | | | | For the Period
June 26, 2012*
through
October 31, 2012 | |
| Net asset value, beginning of period | | | | | $9.64 | | | | | | $9.99 | | | | | | $10.00 | |
| Investment Operations: | | | | | | | | | | | | | | | | | | |
| Net investment income | | | | | 0.13 | | | | | | 0.22 | | | | | | 0.05 | |
| Net realized and change in unrealized gain (loss) | | | | | 0.18 | | | | | | (0.35 | ) | | | | | (0.01 | ) |
| Total from investment operations | | | | | 0.31 | | | | | | (0.13 | ) | | | | | 0.04 | |
| Dividends to Shareholders from Net Investment Income | | | | | (0.12 | ) | | | | | (0.22 | ) | | | | | (0.05 | ) |
| Net asset value, end of period | | | | | $9.83 | | | | | | $9.64 | | | | | | $9.99 | |
| Total Investment Return (1) | | | | | 3.25 | % | | | | | (1.40 | )% | | | | | 0.43 | % |
| RATIOS/SUPPLEMENTAL DATA: | | | | | | | | | | | | | | | | | | |
| Net assets, end of period (000s) | | | | | $88,886 | | | | | | $65,594 | | | | | | $9,450 | |
Ratio of operating expenses to average
net assets (3) | | | | | 0.00 | %(2) | | | | | 0.00 | %(4) | | | | | 0.00 | %(2) |
Ratio of net investment income to average
net assets (3) | | | | | 2.65 | %(2) | | | | | 2.19 | % | | | | | 1.71 | %(2) |
| Portfolio turnover rate | | | | | 0 | %(5) | | | | | 18 | % | | | | | 30 | % |
| * | | Commencement of operations. | |
| (1) | | The calculation assumes that all income dividends and capital gain distributions, if any, have been reinvested. Total return does not reflect broker commissions or “wrap fee” charges. Total investment return for a period of less than one year is not annualized. | |
| (3) | | Reflects the fact that no fees or expenses are incurred. The Portfolios are an integral part of “wrap-fee” programs sponsored by investment advisers and/or broker-dealers unaffiliated with Series TE, the Investment Manager or the Sub-Adviser. Participants in these programs pay a “wrap” fee to the sponsor of the program. | |
| | | | | | |
| 110 | | Semi-Annual Report | | | April 30, 2014 | | | See accompanying Notes to Financial Statements |
Notes to Financial Statements
AllianzGI Managed Accounts Trust
April 30, 2014 (unaudited)
1. Organization and Significant Accounting Policies
AllianzGI Managed Accounts Trust (the “Trust”) was organized as a Massachusetts business trust on November 3, 1999. The Trust is comprised of Fixed Income SHares: Series C, Series LD, Series M, Series R and Series TE (each a “Portfolio” and collectively the “Portfolios”). Allianz Global Investors Fund Management LLC (“AGIFM” or the “Investment Manager”) and Pacific Investment Management Company LLC (“PIMCO” or the “Sub-Adviser”) serve as the Portfolios’ investment adviser/administrator and Sub-Adviser, respectively, and are indirect, wholly-owned subsidiaries of Allianz Asset Management of America L.P. (“AAM”). AAM is an indirect, wholly-owned subsidiary of Allianz SE, a publicly traded European insurance and financial services company. Each Portfolio has authorized an unlimited amount of shares of beneficial interest with $0.001 par value.
Fixed Income SHares: Series LD sold and issued 300,000 shares of beneficial interest in the amount of $3,000,000 to the Investment Manager on December 23, 2013.
The preparation of the Portfolios’ financial statements in accordance with accounting principles generally accepted in the United States of America requires the Portfolios’ management to make estimates and assumptions that affect the reported amounts and disclosures in each Portfolio’s financial statements. Actual results could differ from those estimates.
In the normal course of business, the Portfolios enter into contracts that contain a variety of representations that provide general indemnifications. The Portfolios’ maximum exposure under these arrangements is unknown as this would involve future claims that may be made against the Portfolios that have not yet occurred.
The following is a summary of significant accounting policies consistently followed by the Portfolios:
(a) Valuation of Investments
Portfolio securities and other financial instruments for which market quotations are readily available are stated at market value. Market value is generally determined on the basis of last reported sales prices, or if no sales are reported, on the basis of quotes obtained from a quotation reporting system, established market makers, or independent pricing services. The Portfolios’ investments are valued daily using prices supplied by an independent pricing service or dealer quotations, or by using the last sale price on the exchange that is the primary market for such securities, or the mean between the last quoted bid and ask price. Independent pricing services use information provided by market makers or estimates of market values obtained from yield data relating to investments or securities with similar characteristics. Centrally cleared swaps and exchange traded futures are valued at the price determined by the relevant exchange. Securities purchased on a when-issued or delayed-delivery basis are marked to market daily until settlement at the forward settlement date.
The Board of Trustees (the “Board”) has adopted procedures for valuing portfolio securities and other financial instruments in circumstances where market quotes are not readily available, and has delegated the responsibility for applying the valuation methods to the Investment Manager and Sub-Adviser. The Trust’s Valuation Committee was established by the Board to oversee the implementation of the Portfolios’ valuation methods and to make fair value determinations on behalf of the Board, as instructed. The Sub-Adviser monitors the continued appropriateness of methods applied and
| | | | | | |
| April 30, 2014 | | | Semi-Annual Report | | | 111 | |
Notes to Financial Statements
AllianzGI Managed Accounts Trust
April 30, 2014 (unaudited)
1. Organization and Significant Accounting Policies (continued)
determines if adjustments should be made in light of market changes, events affecting the issuer, or other factors. If the Sub-Adviser determines that a valuation method may no longer be appropriate, another valuation method may be selected, or the Valuation Committee will be convened to consider the matter and take any appropriate action in accordance with procedures set forth by the Board. The Board shall review the appropriateness of the valuation methods and these methods may be amended or supplemented from time to time by the Valuation Committee.
Benchmark pricing procedures are used as the basis for setting the base price of a fixed-income security and for subsequently adjusting the price proportionally to market value changes of a pre-determined security deemed to be comparable in duration, generally a U.S. Treasury or sovereign note based on country of issuance. The base price may be a broker-dealer quote, transaction price, or an internal value as derived by analysis of market data. The base price of the security may be reset on a periodic basis based on the availability of market data and procedures approved by the Valuation Committee. The validity of the fair value is reviewed by the Sub-Adviser on a periodic basis and may be amended as the availability of market data indicates a material change.
Short-term securities maturing in 60 days or less are valued at amortized cost, if their original term to maturity was 60 days or less, or by amortizing premium or discount based on their value on the 61st day prior to maturity, if the original term to maturity exceeded 60 days.
Investments initially valued in currencies other than the U.S. dollar are converted to the U.S.
dollar using exchange rates obtained from pricing services. As a result, the net asset value (“NAV”) of each Portfolio’s shares may be affected by changes in the value of currencies in relation to the U.S. dollar. The value of securities traded in markets outside the United States or denominated in currencies other than the U.S. dollar may be affected significantly on a day that the New York Stock Exchange (“NYSE”) is closed.
The prices used by the Portfolios to value investments may differ from the value that would be realized if the investments were sold, and these differences could be material to the Portfolios’ financial statements. Each Portfolio’s NAV is normally determined as of the close of regular trading (normally, 4:00 p.m. Eastern time) on the NYSE on each day the NYSE is open for business.
(b) Fair Value Measurements
Fair value is defined as the price that would be received to sell an asset or paid to transfer a liability (i.e. the “exit price”) in an orderly transaction between market participants. The three levels of the fair value hierarchy are described below:
| n | | Level 1 – quoted prices in active markets for identical investments that the Portfolios have the ability to access |
| n | | Level 2 – valuations based on other significant observable inputs, which may include, but are not limited to, quoted prices for similar assets or liabilities, interest rates, yield curves, volatilities, prepayment speeds, loss severities, credit risks and default rates or other market corroborated inputs |
| n | | Level 3 – valuations based on significant unobservable inputs (including the Sub-Adviser’s or Valuation Committee’s own assumptions and securities whose price was determined by using a single broker’s quote) |
| | | | |
| 112 | | Semi-Annual Report | | | April 30, 2014 |
Notes to Financial Statements
AllianzGI Managed Accounts Trust
April 30, 2014 (unaudited)
1. Organization and Significant Accounting Policies (continued)
The valuation techniques used by the Portfolios to measure fair value during the six months ended April 30, 2014 were intended to maximize the use of observable inputs and to minimize the use of unobservable inputs.
The Portfolios’ policy is to recognize transfers between levels at the end of the reporting period. An investment asset’s or liability’s level within the fair value hierarchy is based on the lowest level input, individually or in aggregate, that is significant to the fair value measurement. The objective of fair value measurement remains the same even when there is a significant decrease in the volume and level of activity for an asset or liability and regardless of the valuation techniques used. Investments categorized as Level 1 or 2 as of period end may have been transferred between Levels 1 and 2 since the prior period due to changes in the valuation method utilized in valuing the investments.
The inputs or methodology used for valuing securities are not necessarily an indication of the risk associated with investing in those securities. The following are certain inputs and techniques that the Portfolios generally use to evaluate how to classify each major category of assets and liabilities for Level 2 and Level 3, in accordance with Generally Accepted Accounting Principles (“GAAP”).
U.S. Treasury Obligations – U.S. Treasury obligations are valued by independent pricing services based on pricing models that evaluate the mean between the most recently quoted bid and ask price. The models also take into consideration data received from active market makers and broker-dealers, yield curves, and the spread over comparable U.S. Treasury issues. The spreads change daily in response to
market conditions and are generally obtained from the new issue market and broker-dealer sources. To the extent that these inputs are observable, the values of U.S. Treasury obligations are categorized as Level 2. To the extent that these inputs are unobservable, the values are categorized as Level 3.
Government Sponsored Enterprise and Mortgage-Backed Securities – Government sponsored enterprise and mortgage-backed securities are valued by independent pricing services using pricing models based on inputs that include issuer type, coupon, cash flows, mortgage prepayment projection tables and Adjustable Rate Mortgage evaluations that incorporate index data, periodic life caps and the next coupon reset date. To the extent that these inputs are observable, the values of government sponsored enterprise and mortgage-backed securities are categorized as Level 2. To the extent that these inputs are unobservable, the values are categorized as Level 3.
Sovereign Debt Obligations – Sovereign debt obligations are valued by independent pricing services based on discounted cash flow models that incorporate option adjusted spreads along with benchmark curves and credit spreads. In addition, international bond markets are monitored regularly for information pertaining to the issuer and/or the specific issue. To the extent that these inputs are observable, the values of sovereign debt obligations are categorized as Level 2. To the extent that these inputs are unobservable, the values are categorized as Level 3.
Municipal Bonds – Municipal bonds are valued by independent pricing services based on pricing models that take into account, among other factors, information received from market makers and broker-dealers, current trades, bid-
| | | | | | |
| April 30, 2014 | | | Semi-Annual Report | | | 113 | |
Notes to Financial Statements
AllianzGI Managed Accounts Trust
April 30, 2014 (unaudited)
1. Organization and Significant Accounting Policies (continued)
want lists, offerings, market movements, the callability of the bond, state of issuance, benchmark yield curves, and bond insurance. To the extent that these inputs are observable, the values of municipal bonds are categorized as Level 2. To the extent that these inputs are unobservable, the values are categorized as Level 3.
Corporate Bonds & Notes – Corporate bonds & notes are generally comprised of two main categories: investment grade bonds and high yield bonds. Investment grade bonds are valued by independent pricing services using various inputs and techniques, which include broker-dealer quotations, live trading levels, recently executed transactions in securities of the issuer or comparable issuers, and option adjusted spread models that include base curve and spread curve inputs. Adjustments to individual bonds can be applied to recognize trading differences compared to other bonds issued by the same issuer. High yield bonds are valued by independent pricing services based primarily on broker-dealer quotations from relevant market makers and recently executed transactions in securities of the issuer or comparable issuers. The broker-dealer quotations received are supported by credit analysis of the issuer that takes into consideration credit quality assessments, daily trading activity, and the activity of the underlying equities, listed bonds and sector-specific trends. To the extent that these inputs are observable, the values of corporate bonds & notes are categorized as Level 2. To the extent that these inputs are unobservable, the values are categorized as Level 3.
Asset-Backed Securities and Collateralized Mortgage Obligations – Asset-backed securities and collateralized mortgage obligations are
valued by independent pricing services using pricing models based on a security’s average life volatility. The models also take into account tranche characteristics such as coupon, average life, collateral types, ratings, the issuer and tranche type, underlying collateral and performance of the collateral, and discount margin for certain floating rate issues. To the extent that these inputs are observable, the values of asset-backed securities and collateralized mortgage obligations are categorized as Level 2. To the extent that these inputs are unobservable, the values are categorized as Level 3.
Option Contracts – Option contracts traded over-the-counter (“OTC”) and FLexible EXchange (“FLEX”) options are valued by independent pricing services based on pricing models that incorporate various inputs such as interest rates, credit spreads, currency exchange rates and volatility measurements for in-the-money, at-the-money, and out-of-the-money contracts based on a given strike price. To the extent that these inputs are observable, the values of OTC and FLEX option contracts are categorized as Level 2. To the extent that these inputs are unobservable, the values are categorized as Level 3.
Forward Foreign Currency Contracts – Forward foreign currency contracts are valued by independent pricing services using various inputs and techniques, which include broker-dealer quotations, actual trading information and foreign currency exchange rates gathered from leading market makers and foreign currency exchange trading centers throughout the world. To the extent that these inputs are observable, the values of forward foreign currency contracts are categorized as Level 2. To the extent that these inputs are unobservable, the values are categorized as Level 3.
| | | | |
| 114 | | Semi-Annual Report | | | April 30, 2014 |
Notes to Financial Statements
AllianzGI Managed Accounts Trust
April 30, 2014 (unaudited)
1. Organization and Significant Accounting Policies (continued)
Credit Default Swaps – OTC credit default swaps are valued by independent pricing services using pricing models that take into account, among other factors, information received from market makers and broker-dealers, default probabilities from index specific credit spread curves, recovery rates, and cash flows. Centrally cleared credit default swaps are valued at the price determined by the relevant exchange. To the extent that these inputs are observable, the values of credit default swaps are categorized as Level 2. To the extent that these inputs are unobservable, the values are categorized as Level 3.
Interest Rate Swaps – OTC interest rate swaps are valued by independent pricing services using pricing models that are based on real-time intraday snapshots of relevant interest rate curves that are built using the most actively traded securities for a given maturity. The pricing models also incorporate cash and money market rates. In addition, market data pertaining to interest rate swaps is monitored regularly to ensure that interest rates are properly depicting the current market rate. Centrally cleared interest rate swaps are valued at the price determined by the relevant exchange. To the extent that these inputs are observable, the values of interest rate swaps are categorized as Level 2. To the extent that these inputs are unobservable, the values are categorized as Level 3.
Senior Loans – Senior Loans are valued by independent pricing services based on the average of quoted prices received from multiple dealers or valued relative to other benchmark securities when broker-dealer quotes are unavailable. These quoted prices are based on interest rates, yield curves, option adjusted spreads and credit spreads. To the extent that
these inputs are observable, the values of Senior Loans are categorized as Level 2. To the extent that these inputs are unobservable, the values are categorized as Level 3.
(c) Investment Transactions and Investment Income
Investment transactions are accounted for on the trade date. Securities purchased and sold on a when-issued or delayed-delivery basis may be settled a month or more after the trade date. Realized gains and losses on investments are determined on an identified cost basis. Interest income adjusted for the accretion of discount and amortization of premiums is recorded on an accrual basis. Discounts or premiums on debt securities purchased are accreted or amortized, respectively, to interest income. Dividend income is recorded on the ex-dividend date. Facility fees and other fees (such as origination fees) received at the settlement date are amortized as income over the expected term of the senior loan. Facility fees and other fees (such as origination fees) received after the settlement date relating to senior loans, consent fees relating to corporate actions and commitment fees received relating to unfunded purchase commitments are recorded as miscellaneous income upon receipt. Paydown gains and losses are netted and recorded as interest income on the Statements of Operations.
(d) Federal Income Taxes
The Portfolios intend to distribute all of their taxable income and to comply with the other requirements of Subchapter M of the U.S. Internal Revenue Code of 1986, as amended, applicable to regulated investment companies. Accordingly, no provision for U.S. federal income taxes is required.
| | | | | | |
| April 30, 2014 | | | Semi-Annual Report | | | 115 | |
Notes to Financial Statements
AllianzGI Managed Accounts Trust
April 30, 2014 (unaudited)
1. Organization and Significant Accounting Policies (continued)
Accounting for uncertainty in income taxes establishes for all entities, including pass-through entities such as the Portfolios, a minimum threshold for financial statement recognition of the benefit of positions taken in filing tax returns (including whether an entity is taxable in a particular jurisdiction), and requires certain expanded tax disclosures. In accordance with provisions set forth under U.S. GAAP, the Investment Manager has reviewed the Portfolios’ tax positions for all open tax years. As of April 30, 2014, the Portfolios have recorded no liability for net unrecognized tax benefits relating to uncertain income tax positions they have taken. The Portfolios’ federal income tax returns for the prior three years, as applicable, remain subject to examination by the Internal Revenue Service.
(e) Dividends and Distributions
The Portfolios declare dividends from net investment income to common shareholders monthly. Distributions of net realized capital gains, if any, are paid at least annually. The Portfolios record dividends and distributions on the ex-dividend date. The amount of dividends from net investment income and distributions from net realized capital gains is determined in accordance with federal income tax regulations, which may differ from GAAP. These “book-tax” differences are considered either temporary or permanent in nature. To the extent these differences are permanent in nature, such amounts are reclassified within the capital accounts based on their federal income tax treatment; temporary differences do not require reclassification. To the extent dividends and/or distributions exceed current and accumulated earnings and profits for federal income tax purposes, they are reported as dividends and/or distributions to shareholders from return of capital.
(f) Foreign Currency Translation
The Portfolios’ accounting records are maintained in U.S. dollars as follows: (1) the foreign currency market value of investments and other assets and liabilities denominated in foreign currencies are translated at the prevailing exchange rate at the end of the period; and (2) purchases and sales, income and expenses are translated at the prevailing exchange rate on the respective dates of such transactions. The resulting net foreign currency gain (loss) is included in the Portfolios’ Statements of Operations.
The Portfolios do not generally isolate that portion of the results of operations arising as a result of changes in foreign currency exchange rates from the fluctuations arising from changes in the market prices of securities. Accordingly, such foreign currency gain (loss) is included in net realized and unrealized gain (loss) on investments. However, the Portfolios do isolate the effect of fluctuations in foreign currency exchange rates when determining the gain (loss) upon the sale or maturity of foreign currency denominated debt obligations pursuant to U.S. federal income tax regulations; such amount is categorized as foreign currency gain (loss) for both financial reporting and income tax reporting purposes.
(g) Senior Loans
The Portfolios may purchase assignments of, and participations in, Senior Loans originated, negotiated and structured by a U.S. or foreign commercial bank, insurance company, finance company or other financial institution (the “Agent”) for a lending syndicate of financial institutions (the “Lender”). When purchasing an assignment, the Portfolios succeed to all the rights and obligations under the loan agreement with the same rights and obligations as the assigning Lender. Assignments may, however, be arranged through private
| | | | |
| 116 | | Semi-Annual Report | | | April 30, 2014 |
Notes to Financial Statements
AllianzGI Managed Accounts Trust
April 30, 2014 (unaudited)
1. Organization and Significant Accounting Policies (continued)
negotiations between potential assignees and potential assignors, and the rights and obligations acquired by the purchaser of an assignment may differ from, and be more limited than, those held by the assigning Lender.
(h) Repurchase Agreements
The Portfolios are parties to Master Repurchase Agreements (“Master Repo Agreements”) with select counterparties. The Master Repo Agreements maintain provisions for initiation, income payments, events of default, and maintenance of collateral.
The Portfolios enter into transactions, under the terms of the Master Repo Agreements, with their custodian bank or securities brokerage firms whereby they purchase securities under agreements to resell such securities at an agreed upon price and date (“repurchase agreements”). The Portfolios, through their custodian, take possession of securities collateralizing the repurchase agreement. Such agreements are carried at the contract amount in the financial statements, which is considered to represent fair value. Collateral pledged (the securities received), which consists primarily of U.S. government obligations and asset-backed securities, is held by the custodian bank for the benefit of the Portfolios until maturity of the repurchase agreement. Provisions of the repurchase agreements and the procedures adopted by the Portfolios require that the market value of the collateral, including accrued interest thereon, be sufficient in the event of default by the counterparty. If the counterparty defaults under the Master Repo Agreements, and the value of the collateral declines or if the counterparty enters an insolvency proceeding, realization of the collateral by the Portfolios may be delayed or limited.
(i) Reverse Repurchase Agreements
In a reverse repurchase agreement, the Portfolios sell securities to a bank or broker-dealer and agree to repurchase the securities at a mutually agreed upon date and price. Generally, the effect of such a transaction is that the Portfolios can recover and reinvest all or most of the cash invested in portfolio securities involved during the term of the reverse repurchase agreement and still be entitled to the returns associated with those portfolio securities. Such transactions are advantageous if the interest cost to the Portfolios of the reverse repurchase transaction is less than the returns the Portfolios obtain on investments purchased with the cash. To the extent the Portfolios do not cover their positions in reverse repurchase agreements (by segregating liquid assets at least equal in amount to the forward purchase commitment), the Portfolios’ uncovered obligations under the agreements will be subject to the Portfolios’ limitations on borrowings. Reverse repurchase agreements involve leverage risk and also the risk that the market value of the securities that the Portfolios are obligated to repurchase under the agreements may decline below the repurchase price. In the event the buyer of securities under a reverse repurchase agreement files for bankruptcy or becomes insolvent, the Portfolios’ use of the proceeds of the agreement may be restricted pending determination by the other party, or its trustee or receiver, whether to enforce the Portfolios’ obligation to repurchase the securities.
(j) When-Issued/Delayed-Delivery Transactions
When-issued or delayed-delivery transactions involve a commitment to purchase or sell securities for a predetermined price or yield, with payment and delivery taking place beyond the customary settlement period. When delayed-delivery purchases are outstanding, the
| | | | | | |
| April 30, 2014 | | | Semi-Annual Report | | | 117 | |
Notes to Financial Statements
AllianzGI Managed Accounts Trust
April 30, 2014 (unaudited)
1. Organization and Significant Accounting Policies (continued)
Portfolios will set aside and maintain until the settlement date in a designated account, liquid assets in an amount sufficient to meet the purchase price. When purchasing a security on a delayed-delivery basis, the Portfolios assume the rights and risks of ownership of the security, including the risk of price and yield fluctuations; consequently, such fluctuations are taken into account when determining the NAV. The Portfolios may dispose of or renegotiate a delayed-delivery transaction after it is entered into, and may sell when-issued securities before they are delivered, which may result in a realized gain or loss. When a security is sold on a delayed-delivery basis, the Portfolios do not participate in future gains and losses with respect to the security.
(k) Inflation-Indexed Bonds
Inflation-indexed bonds are fixed income securities whose principal value is periodically adjusted to the rate of inflation. The interest rate on these bonds is generally fixed at issuance at a rate lower than typical bonds. Over the life of an inflation-indexed bond, however, interest will be paid based on a principal value, which is adjusted for inflation. Any increase in the principal amount of an inflation-indexed bond will be considered interest income in the Statements of Operations, even though investors do not receive principal until maturity.
(l) Sale-Buybacks
A Portfolio may enter into financing transactions referred to as ‘sale-buybacks’. A sale-buyback transaction consists of a sale of a security by a Portfolio to a financial institution, the counterparty, with a simultaneous agreement to repurchase the same or substantially the same security at an agreed-upon price and date. A Portfolio is not entitled to receive principal and interest payments, if
any, made on the security sold to the counterparty during the term of the agreement. The agreed-upon proceeds for securities to be repurchased by a Portfolio are reflected as a liability on the Statements of Assets and Liabilities. A Portfolio will recognize net income represented by the price differential between the price received for the transferred security and the agreed-upon repurchase price. This is commonly referred to as the ‘price drop’. A price drop consists of (i) the foregone interest and inflationary income adjustments, if any, a Portfolio would have otherwise received had the security not been sold and (ii) the negotiated financing terms between a Portfolio and the counterparty. Foregone interest and inflationary income adjustments, if any, are recorded as components of interest income on the Statements of Operations. Interest payments based upon negotiated financing terms made by a Portfolio to counterparties are recorded as a component of interest expense on the Statements of Operations. In periods of increased demand for the security, a Portfolio may receive a fee for use of the security by the counterparty, which may result in interest income to the Portfolio. A Portfolio will segregate assets determined to be liquid by the Investment Manager or otherwise cover its obligations under sale-buyback transactions.
(m) Securities Traded on To-Be-Announced Basis
The Portfolios may from time to time purchase securities on a to-be-announced (“TBA”) basis. In a TBA transaction, the Portfolio commits to purchasing or selling securities for which all specific information is not yet known at the time of the trade, particularly the face amount and maturity date of the underlying security transactions. Securities purchased on a TBA basis are not settled until they are delivered to the Portfolio, normally 15 to 45 days later. Beginning on the date the Portfolio enters into a
| | | | |
| 118 | | Semi-Annual Report | | | April 30, 2014 |
Notes to Financial Statements
AllianzGI Managed Accounts Trust
April 30, 2014 (unaudited)
1. Organization and Significant Accounting Policies (continued)
TBA transaction, cash, U.S. government securities or other liquid securities are segregated in an amount equal in value to the purchase price of the TBA security. These transactions are subject to market fluctuations, and their current value is determined in the same manner as for other securities.
(n) Mortgage-Related and Other Asset-Backed Securities
Investments in mortgage-related or other asset-backed securities include mortgage pass-through securities, collateralized mortgage obligations (“CMOs”), commercial mortgage-backed securities, mortgage dollar rolls, CMO residuals, stripped mortgage-backed securities (“SMBSs”) and other securities that directly or indirectly represent a participation in, or are secured by and payable from, mortgage loans on real property. The value of some mortgage-related or asset-backed securities may be particularly sensitive to changes in prevailing interest rates. Early repayment of principal on some mortgage-related securities may expose the Portfolios to a lower rate of return upon reinvestment of principal. The value of these securities may fluctuate in response to the market’s perception of the creditworthiness of the issuers. The decline in liquidity and prices of these types of securities may make it more difficult to determine fair market value. Additionally, although mortgages and mortgage-related securities are generally supported by some form of government or private guarantee and/or insurance, there is no assurance that private guarantors or insurers will meet their obligations.
SMBSs are usually structured with two classes that receive different proportions of the interest and principal distributions on a pool of mortgage assets. SMBSs will have one class that
will receive all of the interest (the interest-only or “IO” class), while the other class will receive the entire principal (the principal-only or “PO” class). Payments received for IOs are included in interest income on the Statements of Operations. Because no principal will be received at the maturity of an IO, adjustments are made to the cost of the security on a monthly basis until maturity. These adjustments are included in interest income on the Statements of Operations. Payments received for POs are treated as reductions to the cost and par value of the securities.
(o) U.S. Government Agencies or Government-Sponsored Enterprises
Securities issued by U.S. Government agencies or government-sponsored enterprises may not be guaranteed by the U.S. Treasury. The Government National Mortgage Association (“GNMA” or “Ginnie Mae”), a wholly-owned U.S. Government corporation, is authorized to guarantee, with the full faith and credit of the U.S. Government, the timely payment of principal and interest on securities issued by institutions approved by GNMA and backed by pools of mortgages insured by the Federal Housing Administration or guaranteed by the Department of Veterans Affairs. Government-related guarantors not backed by the full faith and credit of the U.S. Government include the Federal National Mortgage Association (“FNMA” or “Fannie Mae”) and the Federal Home Loan Mortgage Corporation (“FHLMC” or “Freddie Mac”). Pass-through securities issued by FNMA are guaranteed as to timely payment of principal and interest by FNMA, but are not backed by the full faith and credit of the U.S. Government. FHLMC guarantees the timely payment of interest and ultimate collection of principal, but its participation certificates are not backed by the full faith and credit of the U.S. Government.
| | | | | | |
| April 30, 2014 | | | Semi-Annual Report | | | 119 | |
Notes to Financial Statements
AllianzGI Managed Accounts Trust
April 30, 2014 (unaudited)
1. Organization and Significant Accounting Policies (continued)
(p) Short Sales
Short sale transactions involve the Portfolios selling securities they do not own in anticipation of a decline in the market price of the securities. The Portfolios are obligated to deliver securities at the market price at the time the short position is closed. Possible losses from short sales may be unlimited, whereas losses from purchases cannot exceed the total amount invested.
(q) Restricted Securities
The Portfolios are permitted to invest in securities that are subject to legal or contractual restrictions on resale. These securities generally may be resold in transactions exempt from registration or to the public if the securities are registered. Disposal of these securities may involve time-consuming negotiations and expenses, and prompt sale at an acceptable price may be difficult.
(r) Interest Expense
Interest expense primarily relates to the Portfolios’ participation in reverse repurchase agreement transactions. Interest expense is recorded as it is incurred.
2. Principal Risks
In the normal course of business, the Portfolios trade financial instruments and enter into financial transactions where risk of potential loss exists due to, among other things, changes in the market (market risk) or failure of the other party to a transaction to perform (counterparty risk). The Portfolios are also exposed to other risks such as, but not limited to, interest rate, foreign currency, credit and leverage risks.
Interest rate risk is the risk that fixed income securities will decline in value because of changes in interest rates. As nominal interest
rates rise, the values of certain fixed income securities held by the Portfolios are likely to decrease. A nominal interest rate can be described as the sum of a real interest rate and an expected inflation rate. Fixed income securities with longer durations tend to be more sensitive to changes in interest rates, usually making them more volatile than securities with shorter durations. Duration is used primarily as a measure of the sensitivity of a fixed income security’s market price to interest rate (i.e. yield) movements. Interest rate changes can be sudden and unpredictable, and the Portfolios may lose money as a result of movements in interest rates. The Portfolios may not be able to hedge against changes in interest rates or may choose not to do so for cost or other reasons. In addition, any hedges may not work as intended.
Variable and floating rate securities generally are less sensitive to interest rate changes but may decline in value if their interest rates do not rise as much, or as quickly, as interest rates in general. Conversely, floating rate securities will not generally increase in value if interest rates decline. Inverse floating rate securities may decrease in value if interest rates increase. Inverse floating rate securities may also exhibit greater price volatility than a fixed rate obligation with similar credit quality. When a Portfolio holds variable or floating rate securities, a decrease (or, in the case of inverse floating rate securities, an increase) in market interest rates will adversely affect the income received from such securities and the NAV of the Portfolio’s shares.
Mortgage-related and other asset-backed securities often involve risks that are different from or more acute than risks associated with other types of debt instruments. Generally, rising interest rates tend to extend the duration of fixed rate mortgage-related securities,
| | | | |
| 120 | | Semi-Annual Report | | | April 30, 2014 |
Notes to Financial Statements
AllianzGI Managed Accounts Trust
April 30, 2014 (unaudited)
2. Principal Risks (continued)
making them more sensitive to changes in interest rates. As a result, in a period of rising interest rates, if a Portfolio holds mortgage-related securities, it may exhibit additional volatility since individual mortgage holders are less likely to exercise prepayment options, thereby putting additional downward pressure on the value of these securities and potentially causing the Portfolio to lose money. This is known as extension risk. Mortgage-backed securities can be highly sensitive to rising interest rates, such that even small movements can cause an investing Portfolio to lose value. Mortgage-backed securities, and in particular those not backed by a government guarantee, are subject to credit risk. In addition, adjustable and fixed rate mortgage-related securities are subject to prepayment risk. When interest rates decline, borrowers may pay off their mortgages sooner than expected. This can reduce the returns of the Portfolios because the Portfolios may have to reinvest that money at the lower prevailing interest rates. The Portfolios’ investments in other asset-backed securities are subject to risks similar to those associated with mortgage-related securities, as well as additional risks associated with the nature of the assets and the servicing of those assets. Payment of principal and interest on asset-backed securities may be largely dependent upon the cash flows generated by the assets backing the securities, and asset-backed securities may not have the benefit of any security interest in the related assets.
The Portfolios are exposed to credit risk, which is the risk of losing money if the issuer or guarantor of a fixed income security is unable or unwilling, or is perceived (whether by market participants, rating agencies, pricing services or otherwise) as unable or unwilling, to make timely principal and/or interest payments, or to otherwise honor its obligations. Securities are
subject to varying degrees of credit risk, which are often reflected in credit ratings.
To the extent the Portfolios directly invest in foreign currencies or in securities that trade in, and receive revenues in, foreign currencies, or in derivatives that provide exposure to foreign currencies, they will be subject to the risk that those currencies will decline in value relative to the U.S. dollar, or, in the case of hedging positions, that the U.S. dollar will decline in value relative to the currency being hedged. Currency rates in foreign countries may fluctuate significantly over short periods of time for a number of reasons, including economic growth, inflation, changes in interest rates, intervention (or the failure to intervene) by U.S. or foreign governments, central banks or supranational entities such as the International Monetary Fund, or the imposition of currency controls or other political developments in the United States or abroad. As a result, the Portfolios’ investments in foreign currency-denominated securities may reduce the returns of the Portfolios.
The Portfolios are subject to elements of risk not typically associated with investments in the U.S., due to concentrated investments in foreign issuers located in a specific country or region. Such concentrations will subject the Portfolios to additional risks resulting from future political or economic conditions in such country or region and the possible imposition of adverse governmental laws or currency exchange restrictions affecting such country or region, which could cause the securities and their markets to be less liquid and prices more volatile than those of comparable U.S. companies.
The market values of securities may decline due to general market conditions (market risk) which are not specifically related to a particular
| | | | | | |
| April 30, 2014 | | | Semi-Annual Report | | | 121 | |
Notes to Financial Statements
AllianzGI Managed Accounts Trust
April 30, 2014 (unaudited)
2. Principal Risks (continued)
company, such as real or perceived adverse economic conditions, changes in the general outlook for corporate earnings, changes in interest or currency rates, adverse changes to credit markets or adverse investor sentiment. They may also decline due to factors that affect a particular industry or industries, such as labor shortages or increased production costs and competitive conditions within an industry. Equity securities and equity-related investments generally have greater market price volatility than fixed income securities, although under certain market conditions fixed income securities may have comparable or greater price volatility. Credit ratings downgrades may also negatively affect securities held by the Portfolios. Even when markets perform well, there is no assurance that the investments held by the Portfolios will increase in value along with the broader market. In addition, market risk includes the risk that geopolitical events will disrupt the economy on a national or global level.
The Portfolios are exposed to counterparty risk, or the risk that an institution or other entity with which the Portfolios have unsettled or open transactions will default. The potential loss to the Portfolios could exceed the value of the financial assets recorded in the Portfolios’ financial statements. Financial assets, which potentially expose the Portfolios to counterparty risk, consist principally of cash due from counterparties and investments. The Sub-Adviser seeks to minimize the Portfolios’ counterparty risk by performing reviews of each counterparty and by minimizing concentration of counterparty risk by undertaking transactions with multiple customers and counterparties on recognized and reputable exchanges. Delivery of securities sold is only made once the Portfolios have received payment. Payment is made on a purchase once the securities have
been delivered by the counterparty. The trade will fail if either party fails to meet its obligation.
The Portfolios are exposed to risks associated with leverage. Leverage may cause the value of the Portfolios’ shares to be more volatile than if the Portfolios did not use leverage. This is because leverage tends to exaggerate the effect of any increase or decrease in the value of the Portfolios’ portfolio securities. The Portfolios may engage in transactions or purchase instruments that give rise to forms of leverage. Obligations to settle reverse repurchase agreements may be detrimental to the Portfolios’ performance. In addition, to the extent the Portfolios employ leverage, dividend and interest costs may not be recovered by any appreciation of the securities purchased with the leverage proceeds and could exceed the Portfolios’ investment returns, resulting in greater losses.
The Portfolios hold defaulted securities that may involve special considerations including bankruptcy proceedings, other regulatory and legal restrictions affecting the Portfolios’ ability to trade, and the availability of prices from independent pricing services or dealer quotations. Defaulted securities are often illiquid and may not be actively traded. Sale of securities in bankrupt companies at an acceptable price may be difficult and differences compared to the value of the securities used by the Portfolios could be material. A Portfolio may incur additional expenses to the extent it is required to seek recovery upon a portfolio security’s default in the payment of principal or interest. In any bankruptcy proceeding relating to a defaulted investment, a Portfolio may lose its entire investment or may be required to accept cash or securities with a value substantially less than its original investment.
| | | | |
| 122 | | Semi-Annual Report | | | April 30, 2014 |
Notes to Financial Statements
AllianzGI Managed Accounts Trust
April 30, 2014 (unaudited)
2. Principal Risks (continued)
The Portfolios are party to International Swaps and Derivatives Association, Inc. Master Agreements (“ISDA Master Agreements”) with select counterparties that govern transactions, over-the-counter derivatives and foreign exchange contracts entered into by the Portfolios and those counterparties. The ISDA Master Agreements contain provisions for general obligations, representations, agreements, collateral and events of default or termination. Events of termination include conditions that may entitle counterparties to elect to terminate early and cause settlement of all outstanding transactions under the applicable ISDA Master Agreement. Any election to terminate early could be material to the financial statements of the Portfolios.
The considerations and factors surrounding the settlement of certain purchases and sales made on a delayed-delivery basis are governed by Master Securities Forward Transaction Agreements (“Master Forward Agreements”) between the Portfolios and select counterparties. The Master Forward Agreements maintain provisions for, among other things, initiation and confirmation, payment and transfer, events of default, termination, and maintenance of collateral.
The counterparty risk associated with certain contracts may be reduced by master netting arrangements to the extent that if an event of default occurs, all amounts with the counterparty are terminated and settled on a net basis. The Portfolios’ overall exposure to counterparty risk with respect to transactions subject to master netting arrangements can change substantially within a short period, as it is affected by each transaction subject to the arrangement.
Certain Portfolios had security transactions outstanding with Lehman Brothers entities as counterparty at the time the relevant Lehman
Brothers entities filed for bankruptcy protection or were placed in administration. Series M’s security transactions associated with Lehman Brothers, Inc. (“SLH”) and Series R’s security transactions associated with Lehman Brothers International (Europe) (“LBI”) as counterparties were written down to their estimated recoverable values. Adjustments to anticipated losses for security and derivative transactions associated with Lehman Brothers have been incorporated as net realized gain (loss) on the Statements of Operations of the applicable Portfolios. The remaining balances due from (Series M) and due to (Series C) SLH are included in receivable from/payable to broker on the Statements of Assets and Liabilities of the applicable Portfolios. The estimated recoverable value of the receivables is determined by independent broker quotes.
3. Financial Derivative Instruments
Disclosure about derivatives and hedging activities requires qualitative disclosure regarding objectives and strategies for using derivatives, quantitative disclosure about fair value amounts of gains and losses on derivatives, and disclosure about credit-risk-related contingent features in derivative agreements. The disclosure requirements distinguish between derivatives, which are accounted for as “hedges,” and those that do not qualify for such accounting. Although the Portfolios at times use derivatives for hedging purposes, the Portfolios reflect derivatives at fair value and recognize changes in fair value through the Portfolios’ Statements of Operations, and such derivatives do not qualify for hedge accounting treatment.
(a) Futures Contracts
The Portfolios use futures contracts to manage their exposure to the securities markets or the movements in interest rates and currency values. A futures contract is an agreement
| | | | | | |
| April 30, 2014 | | | Semi-Annual Report | | | 123 | |
Notes to Financial Statements
AllianzGI Managed Accounts Trust
April 30, 2014 (unaudited)
3. Financial Derivative Instruments (continued)
between two parties to buy and sell a financial instrument at a set price on a future date. Upon entering into such a contract, the Portfolios are required to pledge to the broker an amount of cash or securities equal to the minimum “initial margin” requirements of the exchange. Pursuant to the contracts, the Portfolios agree to receive from or pay to the broker an amount of cash or securities equal to the daily fluctuation in the value of the contracts. Such receipts or payments are known as “variation margin” and are recorded by the Portfolios as unrealized appreciation or depreciation. When the contracts are closed, the Portfolios record a realized gain or loss equal to the difference between the value of the contracts at the time they were opened and the value at the time they were closed. Any unrealized appreciation or depreciation recorded is simultaneously reversed. The use of futures transactions involves various risks, including the risk of an imperfect correlation in the movements in the price of futures contracts, interest rates and underlying hedging assets, and possible inability or unwillingness of counterparties to meet the terms of their contracts.
(b) Option Transactions
The Portfolios purchase put and call options on securities and indices for hedging purposes, risk management purposes or otherwise as part of their investment strategies. The risks associated with purchasing an option include the risk that the Portfolios pay a premium whether or not the option is exercised. Additionally, the Portfolios bear the risk of loss of premiums and changes in market value should the counterparty not perform under the contract. Put and call options purchased are accounted for in the same manner as portfolio securities. The cost of securities acquired through the exercise of call options is increased by the
premiums paid. The proceeds from securities sold through the exercise of put options are decreased by the premiums paid.
The Portfolios may write (sell) put and call options on securities and indices to earn premiums, for hedging purposes, risk management purposes or otherwise as part of their investment strategies. When an option is written, the premium received is recorded as an asset with an equal liability that is subsequently marked to market to reflect the market value of the option written. These liabilities, if any, are reflected as options written in the Portfolios’ Statements of Assets and Liabilities. Premiums received from writing options which expire unexercised are recorded on the expiration date as a realized gain. The difference between the premium received and the amount paid on effecting a closing purchase transaction, including brokerage commissions, is also treated as a realized gain, or if the premium is less than the amount paid for the closing purchase transaction, as a realized loss. If a call option written is exercised, the premium is added to the proceeds from the sale of the underlying security in determining whether there has been a realized gain or loss. If a put option written is exercised, the premium reduces the cost basis of the security. In writing an option, the Portfolios bear the market risk of an unfavorable change in the price of the security underlying the written option. Exercise of a written option could result in the Portfolios purchasing a security at a price different from its current market value.
(c) Swap Agreements
Swap agreements are bilaterally negotiated agreements between the Portfolios and a counterparty to exchange or swap investment cash flows, assets, foreign currencies or market or event-linked returns at specified, future intervals. Swap agreements may be privately
| | | | |
| 124 | | Semi-Annual Report | | | April 30, 2014 |
Notes to Financial Statements
AllianzGI Managed Accounts Trust
April 30, 2014 (unaudited)
3. Financial Derivative Instruments (continued)
negotiated in the over-the-counter market (“OTC swaps”) or may be executed in a multilateral or other trade facility platform, such as a registered commodities exchange (“centrally cleared swaps”). The Portfolios may enter into credit default, cross-currency, interest rate, total return, variance and other forms of swap agreements in order to, among other things, to manage their exposure to credit, currency and interest rate risk. In connection with these agreements, securities or cash may be identified as collateral or margin in accordance with the terms of the respective swap agreements to provide assets of value and recourse in the event of default or bankruptcy/insolvency.
OTC swap payments received or made at the beginning of the measurement period, if any, are reflected as such on the Portfolios’ Statements of Assets and Liabilities and represent payments made or received upon entering into the swap agreement to compensate for differences between the stated terms of the swap agreement and prevailing market conditions (credit spreads, currency exchange rates, interest rates, and other relevant factors). These upfront payments are recorded as realized gains or losses on the Portfolios’ Statements of Operations upon termination or maturity of the swap. A liquidation payment received or made at the termination of the swap is recorded as realized gain or loss on the Portfolios’ Statements of Operations. Net periodic payments received or paid by the Portfolios are included as part of realized gains or losses on the Portfolios’ Statements of Operations. Changes in market value, if any, are reflected as a component of net changes in unrealized appreciation/depreciation on the Portfolios’ Statements of Operations. Daily changes in valuation of
centrally cleared swaps, if any, are recorded as a receivable or payable, as applicable, for variation margin on centrally cleared swaps on the Portfolios’ Statements of Assets and Liabilities.
Entering into these agreements involves, to varying degrees, elements of credit, legal, market and documentation risk in excess of the amounts recognized on the Portfolios’ Statements of Assets and Liabilities. Such risks include the possibility that there will be no liquid market for these agreements, that the counterparties to the agreements may default on their obligation to perform or disagree as to the meaning of contractual terms in the agreements and that there may be unfavorable changes in interest rates.
Credit Default Swap Agreements – Credit default swap agreements involve one party (referred to as the buyer of protection) making a stream of payments to another party (the seller of protection) in exchange for the right to receive a specified return in the event of a default or other credit event for the referenced entity, obligation or index. As the sellers of protection on credit default swap agreements, the Portfolios will generally receive from the buyer of protection a fixed rate of income throughout the term of the swap provided that there is no credit event. As the sellers, the Portfolios would effectively add leverage to their investment portfolios because, in addition to their total net assets, the Portfolios would be subject to investment exposure on the notional amount of the swap.
If the Portfolios are sellers of protection and a credit event occurs, as defined under the terms of that particular swap agreement, a Portfolio will either (i) pay to the buyer of protection an amount equal to the notional amount of the swap and take delivery of the referenced obligation, other deliverable obligations or
| | | | | | |
| April 30, 2014 | | | Semi-Annual Report | | | 125 | |
Notes to Financial Statements
AllianzGI Managed Accounts Trust
April 30, 2014 (unaudited)
3. Financial Derivative Instruments (continued)
underlying securities comprising the referenced index or (ii) pay a net settlement amount in the form of cash or securities equal to the notional amount of the swap less the recovery value of the referenced obligation or underlying securities comprising the referenced index. If the Portfolios are buyers of protection and a credit event occurs, as defined under the terms of that particular swap agreement, a Portfolio will either (i) receive from the seller of protection an amount equal to the notional amount of the swap and deliver the referenced obligation, other deliverable obligations or underlying securities comprising the referenced index or (ii) receive a net settlement amount in the form of cash or securities equal to the notional amount of the swap less the recovery value of the referenced obligation or underlying securities comprising the referenced index. Recovery values are assumed by market makers considering either industry standard recovery rates or entity specific factors and considerations until a credit event occurs. If a credit event has occurred, the recovery value is determined by a facilitated auction whereby a minimum number of allowable broker bids, together with a specified valuation method, are used to calculate the settlement value.
Credit default swap agreements on corporate or sovereign issues involve one party making a stream of payments to another party in exchange for the right to receive a specified return in the event of a default or other credit event. If a credit event occurs and cash settlement is not elected, a variety of other deliverable obligations may be delivered in lieu of the specific referenced obligation. The ability to deliver other obligations may result in a cheapest-to-deliver option (the buyer of protection’s right to choose the deliverable obligation with the lowest value following a
credit event). The Portfolios use credit default swaps on corporate or sovereign issues to provide a measure of protection against defaults of the issuers (i.e., to reduce risk where the Portfolios own or have exposure to the referenced obligation) or to take an active long or short position with respect to the likelihood of a particular issuer’s default.
Credit default swap agreements on asset-backed securities involve one party making a stream of payments to another party in exchange for the right to receive a specified return in the event of a default or other credit events. Unlike credit default swaps on corporate or sovereign issues, deliverable obligations in most instances would be limited to the specific referenced obligation as performance for asset-backed securities can vary across deals. Prepayments, principal paydowns, and other writedown or loss events on the underlying mortgage loans will reduce the outstanding principal balance of the referenced obligation. These reductions may be temporary or permanent as defined under the terms of the swap agreement and the notional amount of the swap agreement will be adjusted by corresponding amounts. The Portfolios use credit default swaps on asset-backed securities to provide a measure of protection against defaults of the referenced obligation or to take an active long or short position with respect to the likelihood of a particular referenced obligation’s default.
Credit default swap agreements on credit indices involve one party making a stream of payments to another party in exchange for the right to receive a specified return in the event of a write-down, principal shortfall, interest shortfall or default of all or part of the referenced entities comprising the credit index. A credit index is a basket of credit instruments or exposures designed to be representative of
| | | | |
| 126 | | Semi-Annual Report | | | April 30, 2014 |
Notes to Financial Statements
AllianzGI Managed Accounts Trust
April 30, 2014 (unaudited)
3. Financial Derivative Instruments (continued)
some part of the credit market as a whole. These indices are made up of reference credits that are judged by a poll of dealers to be the most liquid entities in the credit default swap market based on the sector of the index. Components of the indices may include, but are not limited to, investment grade securities, high yield securities, asset backed securities, emerging markets, and/or various credit ratings within each sector. Credit indices are traded using credit default swaps with standardized terms including a fixed spread and standard maturity dates. An index credit default swap references all the names in the index, and if there is a default, the credit event is settled based on that name’s weight in the index, or in the case of a tranched index credit default swap, the credit event is settled based on the name’s weight in the index that falls within the tranche for which the Portfolios bear exposure. The composition of the indices changes periodically, usually every six months, and for most indices, each name has an equal weight in the index. The Portfolios use credit default swaps on credit indices to hedge a portfolio of credit default swaps or bonds, which is less expensive than it would be to buy many credit default swaps to achieve a similar effect. Credit-default swaps on indices are benchmarks for protecting investors owning bonds against default, and traders use them to speculate on changes in credit quality.
Implied credit spreads, represented in absolute terms, utilized in determining the market value of credit default swap agreements on corporate or sovereign issues as of period end are disclosed in the Notes to Schedules of Investments, serve as an indicator of the current status of the payment/performance risk, and represent the likelihood or risk of default for the credit derivative. The implied credit spread of a
particular referenced entity reflects the cost of buying/selling protection and may include upfront payments required to be made to enter into the agreement. For credit default swap agreements on asset-backed securities and credit indices, the quoted market prices and resulting values serve as the indicator of the current status of the payment/performance risk. Wider credit spreads and increasing market values, in absolute terms when compared to the notional amount of the swap, represent a deterioration of the referenced entity’s credit soundness and a greater likelihood or risk of default or other credit event occurring as defined under the terms of the agreement.
The maximum potential amount of future payments (undiscounted) that the Portfolios as sellers of protection could be required to make under a credit default swap agreement would be an amount equal to the notional amount of the agreement. Notional amounts of all credit default swap agreements outstanding as of April 30, 2014 for which the Portfolios are sellers of protection are disclosed in the Notes to Schedules of Investments. These potential amounts would be partially offset by any recovery values of the respective referenced obligations, upfront payments received upon entering into the agreement, or net amounts received from the settlement of buy protection credit default swap agreements entered into by the Portfolios for the same referenced entity or entities.
Interest Rate Swap Agreements – Interest rate swap agreements involve the exchange by the Portfolios with a counterparty of their respective commitments to pay or receive interest, e.g., an exchange of floating rate payments for fixed rate payments, with respect to the notional amount of principal. Certain forms of interest rate swap agreements may include: (i) interest rate caps, under which, in return for a premium, one party agrees to make payments to the
| | | | | | |
| April 30, 2014 | | | Semi-Annual Report | | | 127 | |
Notes to Financial Statements
AllianzGI Managed Accounts Trust
April 30, 2014 (unaudited)
3. Financial Derivative Instruments (continued)
other to the extent that interest rates exceed a specified rate, or “cap,” (ii) interest rate floors, under which, in return for a premium, one party agrees to make payments to the other to the extent that interest rates fall below a specified rate, or “floor,” (iii) interest rate collars, under which a party sells a cap and purchases a floor or vice versa in an attempt to protect itself against interest rate movements exceeding given minimum or maximum levels, (iv) callable interest rate swaps, under which the counterparty may terminate the swap transaction in whole at zero cost by a predetermined date and time prior to the maturity date, (v) spreadlocks, which allow the interest rate swap users to lock in the forward differential (or spread) between the interest rate swap rate and a specified benchmark, or (vi) basis swaps, under which two parties can exchange variable interest rates based on different money markets.
(d) Forward Foreign Currency Contracts
A forward foreign currency contract is an agreement between two parties to buy and sell a currency at a set exchange rate on a future date. The Portfolios enter into forward foreign currency contracts for the purpose of hedging against foreign currency risk arising from the investment or anticipated investment in securities denominated in foreign currencies. The Portfolios also enter into these contracts for purposes of increasing exposure to a foreign currency or shifting exposure to foreign currency fluctuations from one country to another. The market value of a forward foreign currency contract fluctuates with changes in foreign currency exchange rates. All commitments are marked to market daily at the applicable exchange rates and any resulting unrealized appreciation or depreciation is recorded. Realized gains or losses are recorded
at the time the forward contract matures or by delivery of the currency. Risks may arise upon entering into these contracts from the potential inability of counterparties to meet the terms of their contracts and from unanticipated movements in the value of a foreign currency relative to the U.S. dollar. In addition, these contracts may involve market risk in excess of the unrealized appreciation (depreciation) reflected in the Portfolios’ Statements of Assets and Liabilities.
4. Investment Manager/Sub-Adviser/Administrator/Distributor
(a) Investment Manager/Sub-Adviser
The Investment Manager serves as manager of the Portfolios pursuant to an Investment Advisory Agreement with the Trust. Pursuant to a Portfolio Management Agreement between the Investment Manager and PIMCO, the Investment Manager employs PIMCO to serve as the Sub-Adviser and provide investment advisory services to the Portfolios. Neither the Investment Manager nor PIMCO receive investment management or other fees from the Portfolios or the Trust. The financial statements reflect the fact that no investment management fees or expenses are incurred by the Portfolios. It should be understood, however, that the Portfolios are an integral part of “wrap-fee” programs sponsored by investment advisers unaffiliated with the Portfolios, the Investment Manager or the Sub-Adviser. Typically, participants in these programs pay a “wrap fee” to their investment adviser. Although the Portfolios do not compensate the Investment Manager or Sub-Adviser directly for their services under the Investment Advisory Agreement or Portfolio Management Agreement, respectively, the Investment Manager and Sub-Adviser may benefit from their relationship with the sponsors of wrap fee programs for which the Trust is an investment option.
| | | | |
| 128 | | Semi-Annual Report | | | April 30, 2014 |
Notes to Financial Statements
AllianzGI Managed Accounts Trust
April 30, 2014 (unaudited)
4. Investment Manager/Sub-Adviser/ Administrator/Distributor (continued)
Please see Note 7 for a discussion of recently approved changes to the Portfolios’ investment management and sub-advisory arrangements.
(b) Administrator
The Investment Manager also serves as administrator to the Portfolios pursuant to an administration agreement (“Administration Agreement”) with the Trust. The administrator’s responsibilities include providing or procuring certain administrative services to the Portfolios as well as arranging at its own expense for the provision of legal, audit, custody, transfer agency and other services required for the ordinary operation of the Portfolios, and is responsible for printing, trustees’ fees, and other costs of the Portfolios. Under the Administration Agreement, the Investment Manager has agreed to provide
or procure these services, and to bear these expenses at no charge to the Portfolios.
Please see Note 7 for a discussion of recently approved changes to the Portfolios’ administration arrangements.
(c) Distributor
Allianz Global Investors Distributors LLC (the “Distributor”), an affiliate of the Investment Manager, serves as the distributor of the Portfolios’ shares. Pursuant to a distribution agreement with the Trust, the Investment Manager, on behalf of the Portfolios, pays the Distributor.
Please see Note 7 for a discussion of recently approved changes to the Portfolios’ distribution arrangements.
5. Investments in Securities
For the six months ended April 30, 2014, purchases and sales of investments, other than short-term securities were:
| | | | | | | | | | | | | | | | |
| | | U.S. Government Obligations | | | All Other | |
| | | Purchases | | | Sales | | | Purchases | | | Sales | |
Series C | | $ | 809,490,989 | | | $ | 2,290,950,019 | | | $ | 579,952,716 | | | $ | 558,720,957 | |
Series LD | | | 419,472,853 | | | | 419,513,046 | | | | 18,451,613 | | | | 10,524,996 | |
Series M | | | 13,414,233,777 | | | | 12,210,392,679 | | | | 481,362,185 | | | | 385,536,989 | |
Series R | | | 99,833,929 | | | | 222,507,959 | | | | 59,446,274 | | | | 35,656,532 | |
Series TE | | | 5,203,762 | | | | – | | | | 13,036,675 | | | | 110,658 | |
6. Income Tax Information
At April 30, 2014, the aggregate cost basis and the net unrealized appreciation (depreciation) of investments (before options written and securities sold short) for federal income tax purposes were:
| | | | | | | | | | | | | | | | |
| | | Federal Tax
Cost Basis | | | Unrealized
Appreciation | | | Unrealized
Depreciation | | | Net Unrealized
Appreciation
(Depreciation) | |
Series C | | $ | 2,776,502,457 | | | $ | 199,441,482 | | | $ | 14,260,665 | | | $ | 185,180,817 | |
| | | | |
Series LD | | | 8,915,735 | | | | 60,054 | | | | 5,827 | | | | 54,227 | |
| | | | |
Series M | | | 5,143,901,610 | | | | 139,191,401 | | | | 26,229,105 | | | | 112,962,296 | |
| | | | |
Series R | | | 397,556,857 | | | | 6,654,385 | | | | 17,574,870 | | | | (10,920,485 | ) |
| | | | |
Series TE | | | 88,346,704 | | | | 1,405,187 | | | | 937,156 | | | | 468,031 | |
| | | | | | |
| April 30, 2014 | | | Semi-Annual Report | | | 129 | |
Notes to Financial Statements
AllianzGI Managed Accounts Trust
April 30, 2014 (unaudited)
7. Subsequent Events
Differences, if any, between book and tax cost basis were attributable to wash sale loss deferrals and sale-buyback adjustments.
In preparing these financial statements, the Portfolios’ management has evaluated events and transactions for potential recognition or disclosure through the date the financial statements were issued.
At a special meeting of shareholders held on June 9, 2014, shareholders of each Portfolio approved an Investment Advisory Contract (the “Contract”) between the Trust, on behalf of the Portfolios, and PIMCO. Pursuant to the Contract, PIMCO will replace AGIFM as the investment adviser to the Portfolios. Under the Contract, PIMCO will continue to provide the day-to-day portfolio management services it currently provides to each Portfolio as its sub-adviser and the same investment professionals that are currently responsible for managing each Portfolio will continue to do so following the transition. In addition, PIMCO will enter into a new Supervision and Administration Agreement (the “PIMCO Administration Agreement”) with the Trust and begin providing supervisory and administrative services to the Portfolios, in replacement of AGIFM, which serves as the Trust’s current administrator. Accordingly, PIMCO personnel will replace AGIFM personnel as Trust officers and in other roles to provide and oversee the administrative, accounting/financial reporting, compliance, legal, transfer agency, shareholder servicing and other services required for the daily operations of the Portfolios. In addition, the Trust, on behalf of the Portfolios, will enter into a new Distribution Contract with PIMCO Investments LLC (“PIMCO Investments”), a U.S. registered broker-dealer affiliate of PIMCO, under which PIMCO Investments will provide the distribution services for the Portfolios that are currently provided by the Distributor.
PIMCO will receive no compensation under the Contract or the PIMCO Administration Agreement with respect to the Portfolios and PIMCO Investments will receive no compensation under its Distribution Contract with respect to the Portfolios and the fee and expense levels and arrangements of the Portfolios will not change as a result of the transition. Each Portfolio is, and will continue to be, an integral part of one or more “wrap-fee” programs, including those sponsored by investment advisers and broker-dealers unaffiliated with the Portfolios, and unaffiliated with AGIFM or PIMCO. Participants in these programs pay a “wrap” fee to the sponsor of the program. PIMCO and/or its affiliates receive fees or other benefits from or through their relationships with the sponsors of such wrap-fee programs for which the Portfolios are an investment option, which arrangements are not expected to change as a result of the Contract.
The Contract and the PIMCO Administration Agreement will become effective at a date and time mutually agreeable to the Trust, PIMCO and AGIFM, and the new Distribution Contract will become effective at a date and time mutually agreeable to the Trust, PIMCO Investments and the Distributor (collectively, the “Transition Date”), each in order to effect an efficient transition for the Portfolios and their shareholders. The Transition Date will be announced at a later date. Following the Transition Date, PIMCO will assume sole management responsibility for the Portfolios and AGIFM will continue to serve as adviser/administrator for numerous non-PIMCO sub-advised open- and closed-end funds. In addition, it is expected that, on the Transition Date, the Trust will change its name to PIMCO Managed Accounts Trust, although the names of the individual Portfolios will not change.
| | | | |
| 130 | | Semi-Annual Report | | | April 30, 2014 |
Special Shareholder Meeting Results/Corporate Changes (unaudited)
AllianzGI Managed Accounts Trust
Special Shareholder Meeting Results:
The Trust held a special meeting of shareholders on June 9, 2014. Shareholders voted as indicated below:
| | | | | | | | |
| Proposal 1: | | Approval of a new Investment Advisory Contract between the Trust, on behalf of each Portfolio, and
PIMCO |
| | | | | For | | Against | | Abstain |
| | Fixed Income SHares: Series C | | 233,270,735 | | 33,245 | | 13,440 |
| | Fixed Income SHares: Series LD | | 609,405 | | 0 | | 0 |
| | Fixed Income SHares: Series M | | 259,492,006 | | 28,645 | | 0 |
| | Fixed Income SHares: Series R | | 22,605,603 | | 0 | | 23,948 |
| | Fixed Income SHares: Series TE | | 8,163,877 | | 0 | | 0 |
| | | | |
| Proposal 2: | | Election of Trustees | | | | | | |
| | | | | | | Affirmative | | Withheld Authority |
| | Re-election of Hans W. Kertess | | | | 554,569,689 | | 173,580 |
| | Election of Craig A. Dawson1, 2 | | | | 554,653,581 | | 89,688 |
| | Election of Deborah A. DeCotis | | | | 554,573,596 | | 169,673 |
| | Re-election of Bradford K. Gallagher | | | | 554,579,171 | | 164,098 |
| | Re-election of James A. Jacobson | | | | 554,579,171 | | 164,098 |
| | Re-election of John C. Maney3 | | | | 554,569,689 | | 173,580 |
| | Re-election of William B. Ogden, IV | | | | 554,569,689 | | 173,580 |
| | Re-election of Alan Rappaport | | | | 554,569,689 | | 173,580 |
| 1 | | Mr. Dawson is an “interested person” of the Trust (as that term is defined in the 1940 Act) because of his affiliations with PIMCO and its affiliates. | |
| 2 | | The election of Mr. Dawson as a Trustee of the Trust is expected to be effective upon the effectiveness of the new Investment Advisory Contract between the Trust and PIMCO. | |
| 3 | | Mr. Maney is an “interested person” of the Trust (as that term is defined in the 1940 Act) because of his affiliations with Allianz Asset Management of America L.P. and its affiliates. | |
Corporate Changes:
On March 14, 2014, Julian Sluyters became President and Chief Executive Officer of the Trust.
| | | | | | |
| April 30, 2014 | | | Semi-Annual Report | | | 131 | |
Matters Relating to the Trustees’ Consideration of the Investment Advisory Agreement (unaudited)
AllianzGI Managed Accounts Trust
At a meeting of the Board of Trustees of the Trust (the “Board” or the “Trustees”) on December 10, 2013, the Board received a preliminary presentation from PIMCO regarding the proposed transition of the Portfolios’ investment advisory, administrative and distribution services from AGIFM to PIMCO and agreed that PIMCO and PIMCO Investments LLC (“PIMCO Investments”) should prepare materials regarding the proposed advisory contract between PIMCO and the Trust (the “Proposed Advisory Agreement”), the proposed supervisions and administration agreement between PIMCO and the Trust (the “PIMCO Administration Agreement”), the proposed distribution contract between PIMCO Investments and the Trust (the “Distribution Contract”) and related arrangements for formal consideration at the Board’s next regularly scheduled meeting. On February 4, 2014, the Board held a special in-person meeting with members of PIMCO’s senior management and with other PIMCO personnel proposed to serve as officers of the Trust to discuss the proposed transition. On February 25, 2014, the non-interested Trustees (the “Independent Trustees”) met separately via conference call with their counsel to discuss materials provided by PIMCO and PIMCO Investments regarding the proposed agreements and related arrangements, and representatives from PIMCO and PIMCO Investments attended a portion of that meeting to respond to questions from the Independent Trustees and to field requests for supplemental information regarding the proposed arrangements. The Board then held an in-person meeting with management on March 10-11, 2014 to consider approval of the Proposed Advisory Agreement and related arrangements (the meetings of the Board discussed herein collectively referred to as the “Meetings”). Following careful consideration of the matters as described in more detail herein, the Board, including all of the Independent Trustees, approved the Proposed Advisory
Agreement with respect to each Portfolio for an initial one-year term, subject to approval of the Proposed Advisory Agreement by each Portfolio’s shareholders. The information, material factors and conclusions that formed the basis for the Board’s approvals are described below. As noted, the Independent Trustees were assisted in their evaluation of the Proposed Advisory Agreement by independent legal counsel, from whom they received separate legal advice and with whom they met separately from Trust management during the Meetings.
In connection with their deliberations regarding the approval of the Proposed Advisory Agreement the Trustees, including the Independent Trustees, considered such information and factors as they believed, in light of the legal advice furnished to them and their own business judgment, to be relevant. As described below, the Trustees considered the nature, quality and extent of the various investment management, administrative and other services to be provided to each Portfolio by PIMCO under the Proposed Advisory Agreement and PIMCO Administration Agreement and the distribution and underwriting services to be provided to each Portfolio by PIMCO Investments under the Distribution Contract.
In connection with the Meetings, the Trustees received and relied upon materials provided by PIMCO and PIMCO Investments (or AGIFM, as applicable) which included, among other items, (i) information regarding the investment performance and management fees of mutual funds and other accounts managed by PIMCO with strategies that have similarities (but are not substantially similar) to those of the Portfolios, (ii) the estimated profitability to AGIFM as investment adviser and administrator to the Portfolios for the one-year period ended December 31, 2012, (iii) estimates of what the profitability to PIMCO would have been as
| | | | |
| 132 | | Semi-Annual Report | | | April 30, 2014 |
Matters Relating to the Trustees’ Consideration of the Investment Advisory Agreement (unaudited) (continued)
AllianzGI Managed Accounts Trust
investment adviser and administrator to the Portfolios for the one-year period ended December 31, 2013 and what the profitability to PIMCO as investment adviser and administrator to the Portfolios is estimated to be for the calendar years ending December 31, 2014, 2015 and 2016, (iv) information provided by PIMCO on each Portfolio’s risk-adjusted returns over various time periods, (v) descriptions of various functions and services to be performed or procured by PIMCO and PIMCO Investments for the Portfolios under the Proposed Advisory Agreement, the PIMCO Administration Agreement and the Distribution Contract, such as portfolio management, compliance monitoring, portfolio trading, distribution, underwriting, custody, transfer agency, dividend disbursement, recordkeeping, tax, legal, audit, valuation and other administrative and shareholder services and (vi) information regarding the overall organization of PIMCO, including information regarding senior management, portfolio managers and other personnel who will provide investment management, administrative, distribution and other services to the Portfolios under the Proposed Advisory Agreement, the PIMCO Administration Agreement and the Distribution Contract.
The Trustees’ conclusions as to the approval of the Proposed Advisory Agreement with respect to each Portfolio were based on a comprehensive consideration of all information provided to the Trustees and were not the result of any single factor. Some of the factors that figured particularly in the Trustees’ deliberations are described below, although individual Trustees may have evaluated the information presented differently from one another, attributing different weights to various factors.
As part of their review, the Trustees examined PIMCO’s ability to provide high-quality investment management and other services to
the Portfolios. Among other information, the Trustees considered the investment philosophy and research and decision-making processes of PIMCO; the experience of key advisory personnel of PIMCO responsible for portfolio management of the Portfolios; the ability of PIMCO to attract and retain capable personnel; and the capability of the senior management and staff of PIMCO. In addition, the Trustees reviewed the quality of PIMCO’s services with respect to regulatory compliance and compliance with the investment policies of the Portfolios and conditions that might affect PIMCO’s ability to provide high quality services to the Portfolios in the future under the Proposed Advisory Agreement, including PIMCO’s financial condition and operational stability. The Trustees took into account their familiarity and experience with PIMCO as the sub-adviser and portfolio manager to the Portfolios since their inceptions, and noted that the same investment professionals who are currently responsible for managing each Portfolio will continue to do so following the proposed transition. They further noted that each Portfolio will continue to have the same investment objective(s) and policies following the proposed transition.
The Trustees also considered the nature of certain supervisory, administrative and distribution services that PIMCO and PIMCO Investments would be responsible for providing to the Portfolios under the Proposed Advisory Agreement, the PIMCO Administration Agreement and the Distribution Contract. The Trustees considered PIMCO’s representation that it could offer the Portfolios an integrated set of high-quality investment advisory, administrative and distribution services under a single platform, which PIMCO believes will allow for greater efficiencies and enhanced coordination among various investment advisory, administrative and distribution functions. The Trustees also took into account that the fund administration group at PIMCO, then comprised of approximately 140
| | | | | | |
| April 30, 2014 | | | Semi-Annual Report | | | 133 | |
Matters Relating to the Trustees’ Consideration of the Investment Advisory Agreement (unaudited) (continued)
AllianzGI Managed Accounts Trust
professionals worldwide, provided administrative services for approximately $860 billion in assets under management globally (as of October 31, 2013), including over 150 PIMCO open-end funds and ETFs which, like the Trust, are U.S. registered investment companies. The Trustees also considered PIMCO’s representation that the PIMCO fund administration group is well integrated with all critical functions related to the PIMCO funds business, including portfolio management, compliance, legal, accounting and tax, account management, distribution, shareholder communications/services and technology, and noted PIMCO’s and PIMCO Investments’ belief that the Portfolios and shareholders will benefit by having all such services provided “under one roof” by the highly experienced team at PIMCO and PIMCO Investments. Moreover, the Trustees noted that the proposed PIMCO-only management, administration and distribution structure for the Portfolios aligns with the “two pillar” approach adopted by Allianz SE with respect to other PIMCO and Allianz Global Investors products globally. Based on the foregoing, the Trustees concluded that PIMCO’s investment process, research capabilities and philosophy were well suited to each Portfolio given its investment objective and policies, and that PIMCO and PIMCO Investments would be able to provide high-quality supervisory, administrative and distribution services to the Portfolios and meet any reasonably foreseeable obligations under the Proposed Advisory Agreement, the PIMCO Administration Agreement and the Distribution Contract.
The Trustees also considered the performance of the Portfolios as compared to the performance of other mutual funds and accounts managed by PIMCO, including composites of such mutual funds and accounts. The Trustees noted that the Portfolios do not have investment objectives or strategies that align closely with any particular account or fund managed by PIMCO, but that management had
provided information for various mutual funds and other accounts managed by PIMCO with strategies that have similarities (but are not substantially similar) to those of the Portfolios. The Trustees noted that meaningful performance information was not yet available for Fixed Income SHares: Series LD, as it had only recently commenced operations.
The Trustees also gave substantial consideration to the fact that, with respect to the Portfolios, no fees will be payable to PIMCO or PIMCO Investments under the Proposed Advisory Agreement, the PIMCO Administration Agreement or the Distribution Contract, and that, if the Proposed Advisory Agreement is approved, PIMCO will enter into an Expense Limitation Agreement with the Trust, on behalf of each Portfolio, pursuant to which, so long as PIMCO serves as the investment adviser to the Portfolio, PIMCO will waive all fees and/or pay or reimburse all expenses of the Portfolio, except extraordinary expenses, including extraordinary legal expenses, and expenses incurred as a result of portfolio investments, such as any brokerage fees and commissions and other portfolio transaction expenses, costs, including interest expenses, of borrowing money or engaging in other types of leverage financing, fees and expenses of any underlying funds or other pooled vehicles in which the Portfolio invests, taxes, governmental fees and dividends and interest on short positions.
The Trustees also considered the amounts that would be paid by the sponsors of the “wrap” programs to PIMCO and/or its affiliates with respect to the Trust, as well as the fees that would be “imputed” to PIMCO, for purposes of arriving at an estimate of profitability arising from PIMCO’s and its affiliates’ relationships with the Portfolios. In this regard, the Trustees considered profitability analyses provided by PIMCO, which included the estimated profitability to AGIFM as investment adviser and administrator to the Portfolios for the one-year
| | | | |
| 134 | | Semi-Annual Report | | | April 30, 2014 |
Matters Relating to the Trustees’ Consideration of the Investment Advisory Agreement (unaudited) (continued)
AllianzGI Managed Accounts Trust
period ended December 31, 2012 (such estimate having been prepared by AGIFM); pro forma estimated profitability to PIMCO for the one-year period ended December 31, 2013 assuming PIMCO had served as investment adviser and administrator to the Portfolios; and pro forma estimated profitability to PIMCO as investment adviser and administrator to the Portfolios for the calendar years ending December 31, 2014, 2015 and 2016. Based on the profitability analyses provided by PIMCO, the Trustees determined, taking into account the various assumptions made, that such profitability did not appear to be excessive.
Because the Portfolios would pay no fees to PIMCO directly under the Proposed Advisory Agreement, the PIMCO Administration Agreement or the Distribution Contract and PIMCO would bear substantially all of the Portfolio’s operating expenses, the Trustees did not place emphasis on the extent to which economies of scale would be realized due to potential growth of assets in the Portfolios or whether fee and expense levels reflect economies of scale for Shareholders.
The Trustees considered the fact that PIMCO and its affiliates may benefit from their relationships with the sponsors of wrap programs for which the Portfolios are an investment option. They noted such benefits
include the receipt by PIMCO and its affiliates of fees paid by the sponsor of the wrap program based on assets under management of the wrap program. The Trustees also took into account other so-called “fallout benefits” to PIMCO, such as reputational value derived from serving as investment adviser and the fact that PIMCO receives services from brokers who execute portfolio transactions for the Portfolios.
After reviewing these and other factors described herein, the Trustees concluded, with respect to each Portfolio, within the context of their overall conclusions regarding the Proposed Advisory Agreement and based upon the information provided and related representations made by PIMCO, that they were satisfied with PIMCO’s responses and efforts relating to the investment management and performance of the Portfolio. They also concluded that they were satisfied with PIMCO’s information and responses as to its resources and capabilities to serve as investment adviser of each Portfolio under the Proposed Advisory Agreement following the transition. Based on their evaluation of factors that they deemed to be material, including those factors described above, the Trustees, including the Independent Trustees, unanimously concluded that the approval of the Proposed Advisory Agreement was in the interests of each Portfolio and its shareholders, and determined to recommend the same for approval by shareholders.
| | | | | | |
| April 30, 2014 | | | Semi-Annual Report | | | 135 | |
Trustees
Hans W. Kertess
Chairman of the Board of Trustees
Deborah A. DeCotis
Bradford K. Gallagher
James A. Jacobson
John C. Maney
William B. Ogden, IV
Alan Rappaport
Fund Officers
Julian Sluyters
President & Chief Executive Officer
Lawrence G. Altadonna
Treasurer, Principal Financial & Accounting Officer
Thomas J. Fuccillo
Vice President, Secretary & Chief Legal Officer
Scott Whisten
Assistant Treasurer
Richard J. Cochran
Assistant Treasurer
Orhan Dzemaili
Assistant Treasurer
Thomas L. Harter
Chief Compliance Officer
Lagan Srivastava
Assistant Secretary
Investment Manager
Allianz Global Investors Fund Management LLC
1633 Broadway
New York, NY 10019
Sub-Adviser
Pacific Investment Management Company LLC
650 Newport Center Drive
Newport Beach, CA 92660
Distributor
Allianz Global Investors Distributors LLC
1633 Broadway
New York, NY 10019
Custodian & Accounting Agent
State Street Bank & Trust Co
801 Pennsylvania Avenue
Kansas City, MO 64105-1307
Transfer Agent, Dividend Paying Agent and Registrar
Boston Financial Data Services-Midwest
330 West 9th Street
Kansas City, MO 64105
Independent Registered Public Accounting Firm
PricewaterhouseCoopers LLP
1100 Walnut, Suite 1300
Kansas City, MO 64106
Legal Counsel
Ropes & Gray LLP
Prudential Tower
800 Boylston Street
Boston, MA 02199
This report, including the financial information herein, is transmitted to the shareholders of AllianzGI Managed Accounts Trust for their information. It is not a prospectus, circular or representation intended for use in the purchase of shares of the Portfolios or any securities mentioned in this report.
The financial information included herein is taken from the records of the Portfolios without examination by an independent registered public accounting firm, who did not express an opinion herein.
The Portfolios file their complete schedules of portfolio holdings with the Securities and Exchange Commission (“SEC”) for the first and third quarters of their fiscal year on Form N-Q. The Portfolios’ Form N-Q is available on the SEC’s website at www.sec.gov and may be reviewed and copied at the SEC’s Public Reference Room in Washington, D.C. Information on the operation of the Public Reference Room may be obtained by calling (800) SEC-0330.
us.allianzgi.com
Receive this report electronically and eliminate paper mailings.
To enroll, go to us.allianzgi.com/edelivery.
| | |
| | AZ080SA_043014 |
| |
| ©2014 Allianz Global Investors Distributors U.S. LLC | | |
AGI-2014-05-05-9670
ITEM 2. CODE OF ETHICS
Not required for this filing.
ITEM 3. AUDIT COMMITTEE FINANCIAL EXPERT
Not required in this filing.
ITEM 4. PRINCIPAL ACCOUNTANT FEES AND SERVICES
Not required in this filing.
ITEM 5. AUDIT COMMITTEE OF LISTED REGISTRANT
Not applicable to this registrant.
ITEM 6. INVESTMENTS
(a) The registrant’s Schedule of Investments is included as part of the report to shareholders filed under Item 1 of this form.
(b) Not applicable.
ITEM 7. DISCLOSURE OF PROXY VOTING POLICIES AND PROCEDURES FOR CLOSED-END MANAGEMENT INVESTMENT COMPANIES
Not applicable to this registrant.
ITEM 8. PORTFOLIO MANAGERS OF CLOSED-END MANAGEMENT INVESTMENT COMPANIES
Not applicable to this registrant.
ITEM 9. PURCHASES OF EQUITY SECURITIES BY CLOSED-END MANAGEMENT INVESTMENT COMPANY AND AFFILIATED COMPANIES.
Not applicable to this registrant.
ITEM 10. SUBMISSION OF MATTERS TO A VOTE OF SECURITY HOLDERS
There have been no material changes to the procedures by which shareholders may recommend nominees to the Fund’s Board of Trustees since the Fund last provided disclosure in response to this item.
ITEM 11. CONTROLS AND PROCEDURES
(a) The registrant’s President and Chief Executive Officer and Treasurer, Principal Financial & Accounting Officer have concluded that the registrant’s disclosure controls and procedures (as defined in Rule 30a-3(c) under the Act (17 CFR 270.30a-3(c))), are effective based on their evaluation of these controls and procedures as of a date within 90 days of the filing date of this document.
(b) There were no significant changes in internal control over financial reporting (as defined in Rule 30a-3(d) under the Act (17 CFR 270.30a-3(d))) that occurred during the second fiscal quarter of the period covered by this report that has materially affected, or is reasonably likely to materially affect, the registrant’s internal control over financial reporting.
ITEM 12. EXHIBITS
(a) (1) Not required in this filing.
(a) (2) Exhibit 99.302 Cert. — Certification pursuant to Section 302 of the Sarbanes-Oxley Act of 2002
(a) (3) Not Applicable
(b) Exhibit 99.906 Cert. — Certification pursuant to Section 906 of the Sarbanes-Oxley Act of 2002
Signatures
Pursuant to the requirements of the Securities Exchange Act of 1934 and the Investment Company Act of 1940, the registrant has duly caused this report to be signed on its behalf by the undersigned, thereunto duly authorized.
AllianzGI Managed Accounts Trust
| | |
| By: | | /s/ Julian Sluyters |
| | Julian Sluyters President & Chief Executive Officer Date: July 1, 2014 |
| | |
| By: | | /s/ Lawrence G. Altadonna |
| | Lawrence G. Altadonna Treasurer, Principal Financial & Accounting Officer Date: July 1, 2014 |
Pursuant to the requirements of the Securities Exchange Act of 1934 and the Investment Company Act of 1940, this report has been signed below by the following persons on behalf of the registrant and in the capacities and on the dates indicated.
| | |
| By: | | /s/ Julian Sluyters |
| | Julian Sluyters |
| | President & Chief Executive Officer Date: July 1, 2014 |
| | |
| By: | | /s/ Lawrence G. Altadonna |
| | Lawrence G. Altadonna |
| | Treasurer, Principal Financial & Accounting Officer Date: July 1, 2014 |