UNITED STATES
SECURITIES AND EXCHANGE COMMISSION
Washington, D.C. 20549
FORM N-CSR
CERTIFIED SHAREHOLDER REPORT OF REGISTERED MANAGEMENT
INVESTMENT COMPANIES
| | |
| Investment Company Act file number: | | 811-09999 |
| |
| Exact name of registrant as specified in charter: | | Prudential Investment Portfolios 2 |
(This Form N-CSR relates solely to the Registrant’s: Prudential Commodity Strategies Fund, Prudential Core Conservative Bond Fund, Prudential Jennison Small-Cap Core Equity Fund, Prudential QMA Mid-Cap Core Equity Fund, Prudential QMA US Broad Market Index Fund and Prudential TIPS Fund.)
| | |
| Address of principal executive offices: | | 655 Broad Street, 17th Floor Newark, New Jersey 07102 |
| |
| Name and address of agent for service: | | Deborah A. Docs 655 Broad Street, 17th Floor Newark, New Jersey 07102 |
| |
| Registrant’s telephone number, including area code: | | 973-367-7521 |
| |
| Date of fiscal period end: | | 7/31/2017 |
| |
| Date of reporting period: | | 7/31/2017 |
Item 1 – Reports to Stockholders

Prudential Jennison Small-Cap Core Equity Fund
Prudential Core Conservative Bond Fund
Prudential TIPS Fund
Prudential Commodity Strategies Fund
Prudential QMA US Broad Market Index Fund
Prudential QMA Mid-Cap Core Equity Fund
ANNUAL REPORT
JULY 31, 2017

To enroll in e-delivery, go to pgiminvestments.com/edelivery
This report is not authorized for distribution to prospective investors unless preceded or accompanied by a current prospectus.
The views expressed in this report and information about the Funds’ portfolio holdings are for the period covered by this report and are subject to change thereafter.
Mutual funds are distributed by Prudential Investment Management Services LLC, a Prudential Financial company and member SIPC. QMA is the primary business name of Quantitative Management Associates LLC, a wholly owned subsidiary of PGIM, Inc. (PGIM), a Prudential Financial company. © 2017 Prudential Financial, Inc. and its related entities. The Prudential logo and the Rock symbol are service marks of Prudential Financial, Inc. and its related entities, registered in many jurisdictions worldwide.
| | |
| 2 | | Visit our website at pgiminvestments.com |
Prudential Day One Underlying Funds
TABLE OF CONTENTS
| | | | |
| Prudential Day One Underlying Funds | | | 3 | |
This Page Intentionally Left Blank
Prudential Jennison Small-Cap Core Equity Fund
Your Fund’s Performance
Performance data quoted represent past performance. Past performance does not guarantee future results. The investment return and principal value of an investment will fluctuate, so that an investor’s shares, when redeemed, may be worth more or less than their original cost. Current performance may be lower or higher than the past performance data quoted.
| | |
| | | Total Returns as of 7/31/17 |
| | | Since Inception* (%) |
| Class Q | | 12.89 (11/15/16) |
| Russell 2000 Index | | 8.73 |
*Not annualized
Source: PGIM Investments LLC and Lipper Inc.
The returns in the tables do not reflect the deduction of taxes that a shareholder would pay on Fund distributions or following the redemption of Fund shares. The Since Inception returns for the index are measured from the closest month-end to the Fund’s inception date.
Growth of a $10,000 Investment
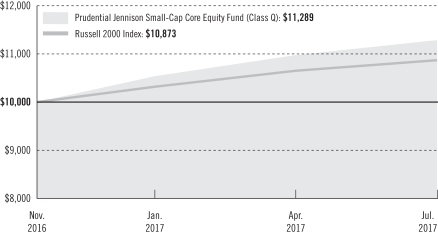
The graph compares a $10,000 investment in the Fund’s Class Q shares with a similar investment in the Russell 2000 Index by portraying the initial account values at the commencement of operations of Class Q shares (November 15, 2016) and the account values at the end of the current fiscal year (July 31, 2017), as measured on a quarterly basis. For purposes of the graph, and unless otherwise indicated, it has been assumed that (a) all recurring fees (including management fees) were deducted; and (b) all dividends
| | | | |
| Prudential Day One Underlying Funds | | | 5 | |
Prudential Jennison Small-Cap Core Equity Fund
Your Fund’s Performance (continued)
and distributions were reinvested. The line graph provides information for Class Q shares only. Without waiver of fees and/or expense reimbursements, the returns would have been lower.
Past performance does not predict future performance. Total returns and the ending account values in the graph include changes in share price and reinvestment of dividends and capital gains distributions in a hypothetical investment for the periods shown. The Fund’s total returns do not reflect the deduction of income taxes on an individual’s investment. Taxes may reduce your actual investment returns on income or gains paid by the Fund or any gains you may realize if you sell your shares.
Benchmark Definition
Russell 2000 Index—The Russell 2000 Index is an unmanaged index of the 2,000 smallest US companies included in the Russell 3000 Index. It gives an indication of how stock prices of smaller companies have performed.
Investors cannot invest directly in an index. The returns for the Index would be lower if they included the effects of sales charges, operating expenses of a mutual fund, or taxes.
Presentation of Fund Holdings
| | | | |
Five Largest Holdings expressed as a
percentage of net assets as of 7/31/17 (%) | |
| East West Bancorp, Inc., Banks | | | 2.1 | |
| Summit Materials, Inc., Construction Materials | | | 1.8 | |
| Paycom Software, Inc., Software | | | 1.8 | |
| MACOM Technology Solutions Holdings, Inc., Semiconductors & Semiconductor Equipment | | | 1.7 | |
| Univar, Inc., Trading Companies & Distributors | | | 1.7 | |
Holdings reflect only long-term investments and are subject to change.
| | | | |
Five Largest Industries expressed as a
percentage of net assets as of 7/31/17 (%) | |
| Banks | | | 13.2 | |
| Software | | | 8.1 | |
| Equity Real Estate Investment Trusts (REITs) | | | 7.2 | |
| Hotels, Restaurants & Leisure | | | 6.2 | |
| Machinery | | | 4.5 | |
Industry weightings reflect only long-term investments and are subject to change.
| | |
| 6 | | Visit our website at pgiminvestments.com |
Prudential Core Conservative Bond Fund
Your Fund’s Performance
Performance data quoted represent past performance. Past performance does not guarantee future results. The investment return and principal value of an investment will fluctuate, so that an investor’s shares, when redeemed, may be worth more or less than their original cost. Current performance may be lower or higher than the past performance data quoted.
| | |
| | | Total Returns as of 7/31/17 |
| | | Since Inception* (%) |
| Class Q | | 1.72 (11/15/16) |
| Bloomberg Barclays US Aggregate Bond Index | | 2.86 |
*Not annualized
Source: PGIM Investments LLC and Lipper Inc.
The returns in the tables do not reflect the deduction of taxes that a shareholder would pay on Fund distributions or following the redemption of Fund shares. The Since Inception returns for the index are measured from the closest month-end to the Fund’s inception date.
Growth of a $10,000 Investment
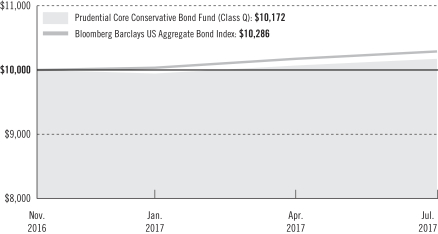
The graph compares a $10,000 investment in the Fund’s Class Q shares with a similar investment in the Bloomberg Barclays US Aggregate Bond Index by portraying the initial account values at the commencement of operations of Class Q shares (November 15, 2016) and the account values at the end of the current fiscal year (July 31, 2017), as measured on a quarterly basis. For purposes of the graph, and unless otherwise indicated, it has been assumed that (a) all recurring fees (including management fees) were
| | | | |
| Prudential Day One Underlying Funds | | | 7 | |
Prudential Core Conservative Bond Fund
Your Fund’s Performance (continued)
deducted; and (b) all dividends and distributions were reinvested. The line graph provides information for Class Q shares only. Without waiver of fees and/or expense reimbursements, the returns would have been lower.
Past performance does not predict future performance. Total returns and the ending account values in the graph include changes in share price and reinvestment of dividends and capital gains distributions in a hypothetical investment for the periods shown. The Fund’s total returns do not reflect the deduction of income taxes on an individual’s investment. Taxes may reduce your actual investment returns on income or gains paid by the Fund or any gains you may realize if you sell your shares.
Benchmark Definition
Bloomberg Barclays US Aggregate Bond Index—The Bloomberg Barclays US Aggregate Bond Index is unmanaged and represents securities that are SEC-registered, taxable, and dollar denominated. It covers the US investment-grade fixed rate bond market, with index components for government and corporate securities, mortgage pass-through securities, and asset-backed securities.
Investors cannot invest directly in an index. The returns for the Index would be lower if they included the effects of sales charges, operating expenses of a mutual fund, or taxes.
Presentation of Fund Holdings
| | | | |
Five Largest Holdings expressed as a
percentage of net assets as of 7/31/17 (%) | |
| US Treasury Notes, 1.500%, 01/31/2019 | | | 3.8 | |
| US Treasury Notes, 1.250%, 11/30/2018 | | | 2.6 | |
| US Treasury Bonds, 3.000%, 05/15/2045 | | | 2.6 | |
| US Treasury Notes, 1.625%, 06/30/2020 | | | 2.5 | |
| US Treasury Notes, 1.250%, 12/31/2018 | | | 2.5 | |
Holdings reflect only long-term investments and are subject to change.
| | | | |
Fund Composition expressed as a
percentage of net assets as of 7/31/17 (%) | |
| US Treasury Obligations | | | 37.9 | |
Corporate Bonds | | | 29.0 | |
| US Government Agency Obligations | | | 27.9 | |
| Commercial Mortgage-Backed Securities | | | 2.6 | |
Municipal Bonds | | | 1.2 | |
Fund Composition reflects only long-term investments and are subject to change.
| | |
| 8 | | Visit our website at pgiminvestments.com |
Prudential TIPS Fund
Your Fund’s Performance
Performance data quoted represent past performance. Past performance does not guarantee future results. The investment return and principal value of an investment will fluctuate, so that an investor’s shares, when redeemed, may be worth more or less than their original cost. Current performance may be lower or higher than the past performance data quoted.
| | |
| | | Total Returns as of 7/31/17 |
| | | Since Inception* (%) |
| Class Q | | 0.38 (11/15/16) |
| Bloomberg Barclays US TIPS Index | | 1.20 |
*Not annualized
Source: PGIM Investments LLC and Lipper Inc.
The returns in the tables do not reflect the deduction of taxes that a shareholder would pay on Fund distributions or following the redemption of Fund shares. The Since Inception returns for the index are measured from the closest month-end to the Fund’s inception date.
Growth of a $10,000 Investment
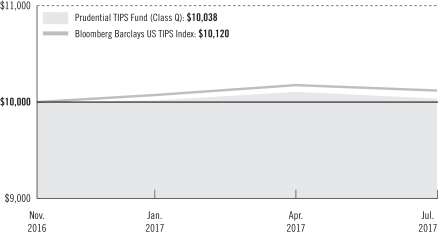
The graph compares a $10,000 investment in the Fund’s Class Q shares with a similar investment in the Bloomberg Barclays US TIPS Index by portraying the initial account values at the commencement of operations of Class Q shares (November 15, 2016) and the account values at the end of the current fiscal year (July 31, 2017), as measured on a quarterly basis. For purposes of the graph, and unless otherwise indicated, it has been assumed that (a) all recurring fees (including management fees) were deducted; and (b) all
| | | | |
| Prudential Day One Underlying Funds | | | 9 | |
Prudential TIPS Fund
Your Fund’s Performance (continued)
dividends and distributions were reinvested. The line graph provides information for Class Q shares only. Without waiver of fees and/or expense reimbursements, the returns would have been lower.
Past performance does not predict future performance. Total returns and the ending account values in the graph include changes in share price and reinvestment of dividends and capital gains distributions in a hypothetical investment for the periods shown. The Fund’s total returns do not reflect the deduction of income taxes on an individual’s investment. Taxes may reduce your actual investment returns on income or gains paid by the Fund or any gains you may realize if you sell your shares.
Benchmark Definition
Bloomberg Barclays US TIPS Index—The Bloomberg Barclays US Treasury Inflation-Protected Securities Index (TIPS Index) is an unmanaged index that consists of inflation-protected securities issued by the US Treasury.
Investors cannot invest directly in an index. The returns for the Index would be lower if they included the effects of sales charges, operating expenses of a mutual fund, or taxes.
Presentation of Fund Holdings
| | | | |
Five Largest Holdings expressed as a
percentage of net assets as of 7/31/17 (%) | |
| US Treasury Inflation Indexed Bonds, TIPS, 0.125%, 01/15/2022 | | | 14.1 | |
| US Treasury Inflation Indexed Bonds, TIPS, 2.375%, 01/15/2025 | | | 13.9 | |
| US Treasury Inflation Indexed Bonds, TIPS, 0.125%, 04/15/2020 | | | 5.5 | |
| US Treasury Inflation Indexed Bonds, TIPS, 0.125%, 01/15/2023 | | | 5.4 | |
| US Treasury Inflation Indexed Bonds, TIPS, 0.625%, 01/15/2024 | | | 5.4 | |
Holdings reflect only long-term investments and are subject to change.
| | | | |
Fund Composition expressed as a
percentage of net assets as of 7/31/17 (%) | |
| US Treasury Obligations | | | 99.5 | |
Fund Composition reflects only long-term investments and is subject to change.
| | |
| 10 | | Visit our website at pgiminvestments.com |
Prudential Commodity Strategies Fund
Your Fund’s Performance
Performance data quoted represent past performance. Past performance does not guarantee future results. The investment return and principal value of an investment will fluctuate, so that an investor’s shares, when redeemed, may be worth more or less than their original cost. Current performance may be lower or higher than the past performance data quoted.
| | |
| | | Total Returns as of 7/31/17 |
| | | Since Inception* (%) |
| Class Q | | 1.50 (11/15/16) |
| Bloomberg Commodity Index | | –1.37 |
*Not annualized
Source: PGIM Investments LLC and Lipper Inc.
The returns in the tables do not reflect the deduction of taxes that a shareholder would pay on Fund distributions or following the redemption of Fund shares. The Since Inception returns for the index are measured from the closest month-end to the Fund’s inception date.
Growth of a $10,000 Investment
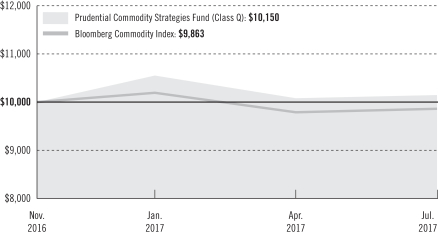
The graph compares a $10,000 investment in the Fund’s Class Q shares with a similar investment in the Bloomberg Commodity Index by portraying the initial account values at the commencement of operations of Class Q shares (November 15, 2016) and the account values at the end of the current fiscal year (July 31, 2017), as measured on a quarterly basis. For purposes of the graph, and unless otherwise indicated, it has been assumed that (a) all recurring fees (including management fees) were deducted; and (b) all dividends
| | | | |
| Prudential Day One Underlying Funds | | | 11 | |
Prudential Commodity Strategies Fund
Your Fund’s Performance (continued)
and distributions were reinvested. The line graph provides information for Class Q shares only. Without waiver of fees and/or expense reimbursements, the returns would have been lower.
Past performance does not predict future performance. Total returns and the ending account values in the graph include changes in share price and reinvestment of dividends and capital gains distributions in a hypothetical investment for the periods shown. The Fund’s total returns do not reflect the deduction of income taxes on an individual’s investment. Taxes may reduce your actual investment returns on income or gains paid by the Fund or any gains you may realize if you sell your shares.
Benchmark Definition
Bloomberg Commodity Index—The Bloomberg Commodity Index is a diversified benchmark for the commodity futures market. It is composed of futures contracts on 19 physical commodities traded on US exchanges, with the exception of aluminum, nickel, and zinc, which trade on the London Metal Exchange (LME).
Investors cannot invest directly in an index. The returns for the Index would be lower if they included the effects of sales charges, operating expenses of a mutual fund, or taxes.
Presentation of Fund Holdings
| | | | |
Five Largest Holdings expressed as a
percentage of net assets as of 7/31/17 (%) | |
| US Treasury Bills, 0.957%, 08/31/2017 | | | 49.2 | |
| Dreyfus Treasury Securities Cash Management | | | 19.6 | |
| US Treasury Bills, 0.977%, 09/07/2017 | | | 8.0 | |
| US Treasury Bills, 1.023%, 10/12/2017 | | | 7.2 | |
| US Treasury Bills, 1.138%, 10/26/2017 | | | 6.5 | |
Holdings reflect only long-term investments and are subject to change.
| | | | |
Top Five Commodities Futures Exposure as a
percentage of net assets as of 7/31/17 (%) | |
| Brent Crude | | | 9.6 | |
| Copper | | | 8.4 | |
| Corn | | | 8.2 | |
| Natural Gas | | | 7.4 | |
| Gold 100oz | | | 7.4 | |
Commodity Futures contracts reflect net exposure and are subject to change.
| | |
| 12 | | Visit our website at pgiminvestments.com |
Prudential QMA US Broad Market Index Fund
Your Fund’s Performance
Performance data quoted represent past performance. Past performance does not guarantee future results. The investment return and principal value of an investment will fluctuate, so that an investor’s shares, when redeemed, may be worth more or less than their original cost. Current performance may be lower or higher than the past performance data quoted.
| | |
| | | Total Returns as of 7/31/17 |
| | | Since Inception* (%) |
| Class Q | | 13.84 (11/17/16) |
| S&P Composite 1500 Index | | 13.25 |
*Not annualized
Source: PGIM Investments LLC and Lipper Inc.
The returns in the tables do not reflect the deduction of taxes that a shareholder would pay on Fund distributions or following the redemption of Fund shares. The Since Inception returns for the index are measured from the closest month-end to the Fund’s inception date.
Growth of a $10,000 Investment
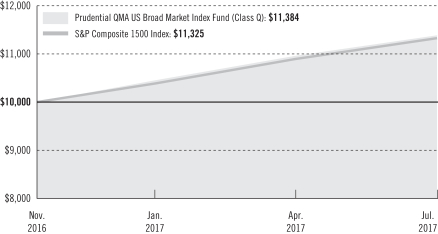
The graph compares a $10,000 investment in the Fund’s Class Q shares with a similar investment in the S&P Composite 1500 Index by portraying the initial account values at the commencement of operations of Class Q shares (November 17, 2016) and the account values at the end of the current fiscal year (July 31, 2017), as measured on a quarterly basis. For purposes of the graph, and unless otherwise indicated, it has been assumed that (a) all recurring fees (including management fees) were deducted; and (b) all dividends
| | | | |
| Prudential Day One Underlying Funds | | | 13 | |
Prudential QMA US Broad Market Index Fund
Your Fund’s Performance (continued)
and distributions were reinvested. The line graph provides information for Class Q shares only. Without waiver of fees and/or expense reimbursements, the returns would have been lower.
Past performance does not predict future performance. Total returns and the ending account values in the graph include changes in share price and reinvestment of dividends and capital gains distributions in a hypothetical investment for the periods shown. The Fund’s total returns do not reflect the deduction of income taxes on an individual’s investment. Taxes may reduce your actual investment returns on income or gains paid by the Fund or any gains you may realize if you sell your shares.
Benchmark Definition
S&P Composite 1500 Index—The S&P Composite 1500® Index combines three leading indices, the S&P 500®, the S&P MidCap 400®, and the S&P SmallCap 600® to cover approximately 90% of the US market capitalization.
Investors cannot invest directly in an index. The returns for the Index would be lower if they included the effects of sales charges, operating expenses of a mutual fund, or taxes.
Presentation of Fund Holdings
| | | | |
Five Largest Holdings expressed as a
percentage of net assets as of 7/31/17 (%) | |
| Apple, Inc., Technology Hardware, Storage & Peripherals | | | 3.0 | |
| SPDR S&P 500 ETF Trust, Exchange-Traded Funds | | | 2.9 | |
| Microsoft Corp., Software | | | 2.2 | |
| Facebook, Inc., Internet Software & Services | | | 1.6 | |
| Amazon.com, Inc., Internet & Direct Marketing Retail | | | 1.5 | |
Holdings reflect only long-term investments and are subject to change.
| | | | |
Five Largest Industries expressed as a
percentage of net assets as of 7/31/17 (%) | |
| Banks | | | 6.0 | |
| Software | | | 4.4 | |
| Oil, Gas & Consumable Fuels | | | 4.4 | |
| Pharmaceuticals | | | 4.2 | |
| Internet Software & Services | | | 4.0 | |
Industry weightings reflect only long-term investments and are subject to change.
| | |
| 14 | | Visit our website at pgiminvestments.com |
Prudential QMA Mid-Cap Core Equity Fund
Your Fund’s Performance
Performance data quoted represent past performance. Past performance does not guarantee future results. The investment return and principal value of an investment will fluctuate, so that an investor’s shares, when redeemed, may be worth more or less than their original cost. Current performance may be lower or higher than the past performance data quoted.
| | |
| | | Total Returns as of 7/31/17 |
| | | Since Inception* (%) |
| Class Q | | 11.72 (11/17/16) |
| S&P Mid-Cap 400 Index | | 9.26 |
*Not annualized
Source: PGIM Investments LLC and Lipper Inc.
The returns in the tables do not reflect the deduction of taxes that a shareholder would pay on Fund distributions or following the redemption of Fund shares. The Since Inception returns for the index are measured from the closest month-end to the Fund’s inception date.
Growth of a $10,000 Investment
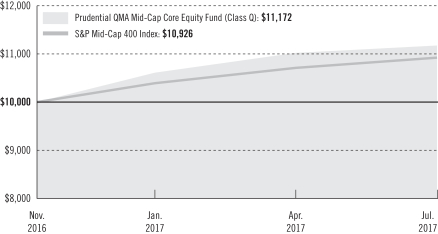
The graph compares a $10,000 investment in the Fund’s Class Q shares with a similar investment in the S&P Mid-Cap 400 Index by portraying the initial account values at the commencement of operations of Class Q shares (November 17, 2016) and the account values at the end of the current fiscal year (July 31, 2017), as measured on a quarterly basis. For purposes of the graph, and unless otherwise indicated, it has been assumed that (a) all recurring fees (including management fees) were deducted; and (b) all dividends
| | | | |
| Prudential Day One Underlying Funds | | | 15 | |
Prudential QMA Mid-Cap Core Equity Fund
Your Fund’s Performance (continued)
and distributions were reinvested. The line graph provides information for Class Q shares only. Without waiver of fees and/or expense reimbursements, the returns would have been lower.
Past performance does not predict future performance. Total returns and the ending account values in the graph include changes in share price and reinvestment of dividends and capital gains distributions in a hypothetical investment for the periods shown. The Fund’s total returns do not reflect the deduction of income taxes on an individual’s investment. Taxes may reduce your actual investment returns on income or gains paid by the Fund or any gains you may realize if you sell your shares.
Benchmark Definition
S&P Mid-Cap 400 Index—The S&P 400 Index is designed to measure the performance of 400 mid-sized companies in the US.
Investors cannot invest directly in an index. The returns for the Index would be lower if they included the effects of sales charges, operating expenses of a mutual fund, or taxes.
Presentation of Fund Holdings
| | | | |
Five Largest Holdings expressed as a
percentage of net assets as of 7/31/17 (%) | |
| Chemours Co. (The), Chemicals | | | 1.2 | |
| iShares Core S&P Mid-Cap ETF, Exchange-Traded Funds | | | 1.2 | |
| Cadence Design Systems, Inc., Software | | | 1.1 | |
| MSCI, Inc., Capital Markets | | | 1.1 | |
| Atmos Energy Corp., Gas Utilities | | | 1.0 | |
Holdings reflect only long-term investments and are subject to change.
| | | | |
Five Largest Industries expressed as a
percentage of net assets as of 7/31/17 (%) | |
| Equity Real Estate Investment Trusts (REITs) | | | 8.5 | |
| Banks | | | 7.2 | |
| Electronic Equipment, Instruments & Components | | | 5.8 | |
| Machinery | | | 5.7 | |
| Software | | | 4.6 | |
Industry weightings reflect only long-term investments and are subject to change.
| | |
| 16 | | Visit our website at pgiminvestments.com |
Prudential Jennison Small-Cap Core Equity Fund
Strategy and Performance Overview
How did the Fund perform?
The Prudential Jennison Small-Cap Core Equity Fund’s Class Q shares rose 12.89% since inception on November 15, 2016 through July 31, 2017. In the same period, the Russell 2000® Index (the Index) advanced 8.73%.
What was the market environment?
| • | | Equity markets posted strong gains in the period. Growth stocks meaningfully outperformed value stocks and large caps topped mid and small caps. |
| • | | Despite the Trump administration’s unorthodox approach and the Republican-controlled legislature’s lack of accomplishment, equity market gains so far this year have been supported by earnings growth and margin expansion across many industries. |
| • | | In the Index, utilities and information technology gained the most ground, while energy declined sharply. |
| • | | Solid economic fundamentals in the US included moderate GDP expansion, robust employment, and accelerating corporate profit growth. Inflation remained benign. The Federal Reserve raised the federal funds target rate to 1.00%-1.25%. |
What worked?
| • | | Information Technology contributed strongly to performance: |
| | • | | Paycom Software’s earnings and operating margins were impressive. Jennison continues to believe the company is executing extremely well, and its mix of growth and profitability is one of the best among its peers. It also has a defensible competitive position as well as the ability to gain clients from legacy vendors. |
| | • | | Results for semiconductor company MACOM Technology Solutions were driven by strength, most notably in its Datacenter Optical segment. Jennison believes the company is a unique mix of near and long term growth drivers and expanding margins. |
| • | | The consumer discretionary, materials, and industrials sectors also added value in aggregate; however, other key contributors were not concentrated in any one sector: |
| | • | | Vail Resorts enjoyed a good quarter despite a slow start to the ski season. This demonstrates to Jennison how nicely the business model has developed, with significant revenue locked in via season passes and increasing geographic diversity moderating some of the weather risk. Jennison continues to see numerous growth opportunities for the company, while eyeing its steadily increasing market cap for suitability in its portfolios. |
| | • | | Intersect ENT’s long-term upside remains compelling in Jennison’s view. Jennison expects accelerating sales growth to continue into 2019 and Jennison is encouraged by sales force productivity and early success of the PROPEL Contour launch. |
| | | | |
| Prudential Day One Underlying Funds | | | 17 | |
Prudential Jennison Small-Cap Core Equity Fund
Strategy and Performance Overview (continued)
| | • | | NN, Inc. is a global diversified industrial manufacturer of high-precision metal and plastic components and assemblies. The company posted organic growth in its three business segments—Precision Bearing Components, Autocam Precision Components, and Precision Engineered Products. Jennison believes there is the potential for additional upside as positive industrial data points turn into revenues in what should be a more robust macro environment. |
What didn’t work?
| • | | Overweight positions in energy and health care hurt relative results. Individual detractors were diversified across sectors. |
| | • | | Shares of Forum Energy Technologies likely fell as a result of slower cost absorption and less-robust pricing than investors anticipated. In our view, the company continues to be well situated for what Jennison still expects to be a broader recovery, particularly after the company absorbs costs at its facilities and pricing picks up at the same time. |
| | • | | Zoe’s Kitchen’s quarterly results were disappointing, and management signaled expectations for margin pressures to persist in the coming quarters, as core initiatives were not expected to drive sales until the latter half of this year. In addition, the fast casual industry remains difficult overall due to macro headwinds. Jennison likes the steps that management is taking to build future growth, including expanding its menu and delivery options, increasing infrastructure and technology investments, while building a national footprint. |
| | • | | Aggressive price actions by United drove weaker than expected guidance which sent shares of Spirit Airlines and broader airline equities down sharply. While fare wars will drive earnings down, Jennison is hopeful that this could be short lived. Jennison continues to like Spirit’s business model and position as a low cost provider in key leisure markets. |
| | • | | Radius Health suffered from complications surrounding the approval and commercialization of its program to treat severe osteoporosis. Jennison’s original investment decision was predicated on the strategic value of its treatments and oncology program However, Jennison eliminated the position as the launch and payer environment would take time before the drug was truly successful. |
| | • | | Shares of CyberArk Software declined on decelerating license revenue growth and sales execution issues. Jennison believes that the end markets are healthy and that CyberArk Software can fix its execution missteps. |
| | |
| 18 | | Visit our website at pgiminvestments.com |
The percentage points shown in the tables identify each security’s positive or negative contribution to the Fund’s return, which is the sum of all contributions by individual holdings.
| | | | | | |
| Top Contributors (%) | | Top Detractors (%) |
| Paycom Software Inc. | | 0.93 | | Forum Energy Technologies, Inc. | | –0.41 |
| Vail Resorts, Inc. | | 0.80 | | Zoe’s Kitchen, Inc. | | –0.37 |
| MACOM Technology Solutions Holdings, Inc. | | 0.68 | | Spirit Airlines, Inc. | | –0.27 |
| Intersect ENT, Inc. | | 0.59 | | Radius Health, Inc. | | –0.26 |
| NN, Inc. | | 0.56 | | CyberArk Software Ltd. | | –0.19 |
Current outlook
| • | | There are a number of outcomes from President Trump’s policy changes being discussed that could be positive for the overall US economy and equity markets. |
| • | | These include reduced regulations and a more business-friendly environment; a likelihood of lower corporate and personal tax rates; rising confidence of consumers and small business owners; and increased capital spending and/or stimulative fiscal policy. |
| • | | On the other hand, Jennison sees certain economic headwinds that indicate it might not be smooth sailing. |
| • | | These include historically low labor productivity, rising commodity prices and rising interest rates; calls for protectionism and increased tariffs or border taxes; and a rising US dollar. |
| • | | Jennison is more positive on the financial sector, which could benefit from the combination of rising rates, reduced regulation and possibly lower taxes. Jennison is also constructive on Technology and selected parts of Industrials which have been depressed and could benefit from increased spending in infrastructure and/or defense and improvement in Energy markets. |
| • | | In contrast, Jennison has concerns about the uncertainty impacting health care. At the same time, Jennison is cautious on cyclical stocks which have rebounded strongly but where the magnitude and duration of the recovery is very uncertain. Jennison favors more services-oriented businesses in the consumer discretionary sector over retail. |
| • | | As always, Jennison remains biased towards long term secular growth stories with attractive valuations, good balance sheets, and strong free cash flow. With inflation rising for the first time in many years, Jennison’s particular focus is on companies that can demonstrate pricing power and the ability to hold margins against cost pressures. |
| | | | |
| Prudential Day One Underlying Funds | | | 19 | |
Prudential Core Conservative Bond Fund
Strategy and Performance Overview
How did the Fund perform?
The Prudential Core Conservative Bond Fund’s Class Q shares returned 1.72% for the period since its inception on November 15, 2016 through July 31, 2017, underperforming the 2.86% gain of the Bloomberg Barclays US Aggregate Bond Index (the Index).
What were market conditions?
| • | | During the reporting period, the market experienced several significant events, including the surprise victory of Donald Trump in the US Presidential election, the impact of ongoing bond-buying programs by the European Central Bank and the Bank of England, two Federal Reserve (Fed) rate hikes, and the wait for details about the Fed’s long-expected balance sheet runoff. As the period ended, speculation increased about who would head the Fed after Janet Yellen’s term expires in early 2018. Would it be a dove intent on boosting the Trump growth agenda? Or, would it be a more rules-based chairperson intent on reaching the Fed’s “dots”? (“Dots” refer to projections made by the members of the Fed’s Open Market Committee about where they think interest rates should be at a particular point in the future.) |
| • | | US economic growth, which had weakened earlier in the period, rebounded to a 2.6% pace during the second quarter of 2017 against a backdrop of continued above-trend growth in the rest of the G3. (The G3, or Group of Three, refers to the US, Japan and the European Union.) US inflation, however, was generally weaker than expected, continuing to undershoot G3 central bank targets. |
| • | | Overall, the underlying momentum in the US economy has remained solid since early 2016. Real final private sector demand has been notably robust, growing at an annualized rate of between 2.6% and 3.3% in each of the last five calendar quarters and averaging 2.8% in first half of 2017. (Real final demand is the total demand for final goods and services, adjusted for inflation, in an economy.) Consumer spending has been particularly strong, but investment spending, too, has picked up as headwinds from the collapse in energy prices and the strengthening US dollar have faded. |
| • | | US companies continued to hire at a strong pace, with monthly job gains averaging 184,000 in the year to date through July 31, 2017, which is little changed from 2016’s average of 187,000 jobs and well above the estimated 75,000 to 100,000 jobs needed to keep the unemployment rate unchanged. Indeed, the unemployment rate gradually ticked lower during the reporting period, inching down to 4.3% in July. Importantly, job gains were widespread across industries. Even the retail sector, which shed jobs every month from February through May, saw stable employment in the last two months of the period. |
| • | | Lean business inventories, solid core durable goods orders, and ongoing strong job gains suggest real US GDP growth is on track to maintain its second-quarter momentum into the third quarter. |
| | |
| 20 | | Visit our website at pgiminvestments.com |
| • | | The US fixed income markets, as represented by the Index, performed well during the reporting period, posting a return of 2.86%. |
| • | | US corporate bonds also performed well. Within the Index, metals & mining, energy, and paper & packaging were amongst the strongest-performing sectors, while airlines, tobacco, and retailers & restaurants were amongst the largest underperforming sectors. |
| • | | Agency mortgage-backed securities outperformed US Treasuries during the fourth quarter of 2016 as interest rates rose sharply after the US Presidential election. The underperformance continued in the first quarter of 2017 due to increased concern about a more aggressive pace of Fed rate hikes and statements about potential adjustments to the Fed’s balance sheet. Toward the end of the period, mortgage-backed securities spreads (yield differentials versus comparable-maturity Treasuries) tightened, net supply increased, and outright buyers seemed willing to wait for better entry points to add mortgage-backed securities exposure. The 30-year mortgage rate ended the period at approximately 4%. |
| • | | Structured products performed very well but closed the period with notable spread tightening in asset-backed securities (ABS), non-agency mortgage-backed securities, and commercial mortgage-backed securities (CMBS). |
What worked?
| • | | The Fund’s overweight positions in investment-grade corporate bonds and municipal securities added to relative performance. |
| • | | Security selection among US Treasuries and emerging markets debt also contributed positively. |
| • | | Within corporate bonds, positioning in the foreign non-corporate, automotive, and consumer non-cyclical sectors was positive. |
| • | | In individual security selection, the Fund benefited from overweights in Morgan Stanley (banking), General Motors (automotive), and Anheuser-Busch InBev (consumer non-cyclical). |
| • | | The Fund’s duration positioning added to performance for the reporting period. Duration measures the sensitivity of the price (the value of principal) of a bond to a change in interest rates. |
What didn’t work?
| • | | The Fund underperformed due to expenses related to its start-up costs. |
| • | | The Fund’s underweights in emerging markets debt and mortgage-backed securities detracted from relative returns. |
| | | | |
| Prudential Day One Underlying Funds | | | 21 | |
Prudential Core Conservative Bond Fund
Strategy and Performance Overview (continued)
| • | | Security selection in investment-grade corporate bonds limited results. |
| • | | The Fund’s positioning in the telecommunication services, midstream energy, and banking sectors detracted from performance. |
| • | | In individual security selection, the Fund’s overweight positions in Verizon Communications (telecommunication services), Goldman Sachs (banking) and Oracle (technology) hurt relative returns. |
Current outlook
| • | | PGIM Fixed Income, a PGIM business, maintains a positive view of fundamentals in the credit sectors of the fixed income market and the Fund is overweight in spread sectors, including investment-grade corporate bonds, and also in municipal securities and CMBS. |
| • | | Within investment-grade corporate bonds, the Fund continues to have a longer duration emphasis, with a modest overweight in financials. Within industrials, PGIM Fixed Income is focusing on names where an “event” has passed, as companies that issue higher-quality corporate bonds continue to add debt and consolidation remains a concern. Furthermore, PGIM Fixed Income is focusing on US-centric issuers rather than multinationals or exporters that are vulnerable to potential protectionist trade policies. The main near-term risks in the corporate bond market are the policies of the US Administration, the impact of the tightening Fed, and political instability outside the US. |
| • | | With regards to municipal securities, PGIM Fixed Income believes market technicals (supply and demand conditions) should remain favorable through much of the third quarter of 2017 but expects the environment to become less supportive by the end of the quarter. Tax-reform discussions in Washington, D.C. will be closely monitored, though they are not expected to negatively impact the market during 2017. Volatility is likely to continue in Puerto Rico, as the judge overseeing the commonwealth’s bankruptcy case has encouraged all parties to resolve disputes through negotiation. Looking ahead, PGIM Fixed Income expects taxable municipal bonds to perform in line with corporate bonds, with the potential for outperformance should corporate mergers and acquisitions activity pick up. |
| • | | Among US Treasuries, the Fund is positioned for higher two-year yields given the potential for additional Fed policy tightening amid the recent firmness in economic data and the possibility of further increases in asset prices. Overall, PGIM Fixed Income remains positive on the intermediate portion of the Treasury yield curve, which appears cheap based on potential Fed policy scenarios. |
| • | | Structured products are noteworthy for favorable supply technicals and a benign fundamental backdrop, but PGIM Fixed Income believes they remain vulnerable to spread volatility in other riskier asset classes. Nevertheless, PGIM Fixed Income remains very positive on assets at the top of the capital structure. |
| | |
| 22 | | Visit our website at pgiminvestments.com |
| • | | In CMBS, PGIM Fixed Income continues to find value in high-quality securities of new issue conduit deals. (Conduit deals are collateralized by a pool of approximately 50 to 100 fixed-rate commercial mortgage loans that are fairly well diversified by loan size, geographic location, and property type.) |
| • | | The Fund maintains an underweight in non-US government-related sectors, as well as in US agency securities and US agency mortgage-backed securities, as PGIM Fixed Income finds more compelling value in the sectors previously mentioned. |
| | | | |
| Prudential Day One Underlying Funds | | | 23 | |
Prudential TIPS Fund
Strategy and Performance Overview
How did the Fund Perform?
The Prudential TIPS Fund’s Class Q shares returned 0.38% from its inception on November 15, 2016 through July 31, 2017. During the same period, the Bloomberg Barclays US TIPS Index (the Index) returned 1.20%.
What were market conditions?
| • | | Developed market rates encountered a steady headwind in late 2016 amid expectations for expanded fiscal policies in the US, signs of policy restraint or tightening from major central banks, and firming inflation prospects as oil prices rose. |
| • | | TIPS performed well in the fourth quarter of 2016, due to Donald Trump’s election win and expectations of more stimulus and pro-growth initiatives, which typically result in higher inflation. The increase in oil prices throughout the quarter also contributed to strong TIPS performance. |
| • | | While the market reaction to the global reflation trade, which reflects a pick-up in economic activity and corporate earnings, garnered many headlines in the first quarter of 2017, the US 10-year Treasury yield retraced its increase since the start of the year and ended the first quarter about six basis points lower at 2.39%. The earlier increase in rates occurred globally amid signs of accelerating growth and inflation. Indeed, the increase in inflation in both Europe and the US appeared to approach targets set by the respective central banks. TIPS breakevens widened to start the year as they outperformed nominal Treasuries on the global reflation trade. (A TIPS breakeven rate is when the expected inflation rate equals comparable US Treasury yield minus TIPS real yield.) Then later in the quarter, TIPS underperformed nominal Treasuries as confidence waned that the new President would be able to easily push through his pro-growth agenda. TIP breakevens finished the first quarter little changed. |
| • | | The US Treasuries market continued to offer a robust set of long and short opportunities across the curve. The front of the curve rose in the second quarter as the Federal Reserve (Fed) implemented another rate hike in June and set the stage to start tapering its balance sheet by the end of the year. While PGIM Fixed Income’s base case is that the Fed raises rates one more time in 2017, the market-implied probability for another hike this year only stood at about 50% as the quarter ended, which PGIM Fixed Income believes is underpriced and supports the Fund’s short positioning at the front of the Treasuries curve. TIPS breakevens tightened in the second quarter as inflation decelerated and commodity prices decreased. |
What worked?
| • | | Security selection added to performance for the reporting period. |
| | |
| 24 | | Visit our website at pgiminvestments.com |
| • | | The duration of the Fund was closely matched to the Index for the reporting period. Duration positioning added to performance during the period. The Fund ended the period with a neutral duration position to the Index. |
What didn’t work?
| • | | The Fund’s underperformance was driven mainly by transaction costs related to the launch of the Fund in November 2016. |
| • | | The Fund maintained a yield curve flattening position which hurt performance over the reporting period. |
Current outlook
The weak inflation environment poses a quandary for the Fed as it contemplates the next steps in its tightening cycle. At the Fed’s next meeting on September 20, PGIM Fixed Income anticipates the Fed will likely formally announce plans to begin reducing its balance sheet gradually by tapering its reinvestments of maturing securities, with actual tapering likely to begin in October. PGIM Fixed Income still anticipates an additional rate hike in December, followed by two additional rate hikes next year, as a base case. Policy developments out of Congress remain a risk for the timing of Fed tightening, however. The lack of progress on healthcare reform has likely delayed tax reform, and the legislative calendar in September is packed, including the need for Congress to address the debt ceiling and extend government spending authorization beyond the current September 30 deadline.
| | | | |
| Prudential Day One Underlying Funds | | | 25 | |
Prudential Commodity Strategies Fund
Strategy and Performance Overview
How did the Fund perform?
The Prudential Commodity Strategies Fund Class Q shares returned 1.50% for the period since the Fund’s inception on November 15, 2016 through July 31, 2017. The Fund outperformed the Bloomberg Commodity Index (the Index), which fell –1.37%.
What were market conditions?
For the period, the industrial metals, precious metals and livestock sectors rallied, while the energy and agriculture (grains and soft commodities) sectors fell.
What worked?
| | • | | The Fund’s positions in natural gas and sugar contributed to the relative outperformance for the period. |
| | • | | Underweights in sugar and soybean oil in addition to an overweight in wheat contributed to portfolio performance. |
What didn’t work?
| • | | The performance of natural gas and grains markets were hindered by negative roll yield associated with contango—a situation where the future spot price (the current market price) is below the current price. The precious metals and softs sectors moved lower. |
Did the Fund use derivatives and how did they affect performance?
| • | | The Fund primarily trades in listed exchange-traded commodity futures contracts. These futures are a form of derivatives, based on the underlying price of a specific commodity. |
Current outlook
At the moment, the portfolio is positioned with an overweight to the energy sector (both the petroleum complex as well as natural gas), underweight positions held in the precious metals and livestock sectors (sectors which have historically demonstrated lower betas (risk measures) to the performance of the asset class) and an intra-sector relative value position in grains in which corn and the two wheat contracts (Chicago and Kansas City) are overweighted while the soybean complex (soybeans, soybean meal and soybean oil) are underweighted. Additionally, deferred calendar months futures contracts are held to varying extents across the portfolio.
| | |
| 26 | | Visit our website at pgiminvestments.com |
Prudential QMA US Broad Market Index Fund
Strategy and Performance Overview
How did the Fund perform?
The Prudential QMA Broad Index Fund’s Class Q shares returned 13.84% for the period since the Fund’s inception on November 17, 2016, through July 31, 2017. During the same period, the S&P 1500 Composite Index (the Index) gained 13.25%.
What were market conditions?
| • | | Stocks turned in strong performance during the reporting period. As a result of some turbulence in November just after the US presidential election, stocks initially plummeted but quickly reversed course and maintained gains through the reporting period on strong earnings and positive investor sentiment. |
| • | | Headline macro-events included fiercely contested disputes in the US Congress over the Trump administration’s policy initiatives, especially on health care and tax reform. Investors shrugged off the political impasse, as stocks sailed smoothly to new highs on strong earnings and positive investor sentiment. However, the extended low-volatility environment had some investors worried over concerns that a sense of complacency may have taken hold. |
| • | | Solid economic fundamentals in the US included moderate GDP expansion, robust employment, and accelerating corporate profit growth. Inflation remained benign. The Federal Reserve raised the federal funds target rate to 1.00%–1.25%. |
What worked?
| • | | The Fund closely tracked the performance of the Index over the period ending July 31, 2017. |
| • | | The Fund held all stocks included in the Index in approximately the same proportions. |
Did the Fund use derivatives and how did they affect performance?
| • | | The Fund held S&P 500 E-Mini stock index futures, a form of derivatives, to maintain exposure to equities and provide portfolio liquidity. Futures had minimal impact on performance over the year to date. |
| | | | |
| Prudential Day One Underlying Funds | | | 27 | |
Prudential QMA Mid-Cap Core Equity Fund
Strategy and Performance Overview
How did the Fund perform?
The Prudential QMA Mid-Cap Core Fund’s Class Q Shares returned 11.72% for the period since its inception on November 17, 2016 through July 31, 2017. The Fund outperformed the 9.26% return of the S&P Mid-Cap 400 Index (the Index).
What were market conditions?
| • | | Stocks turned in strong performance during the reporting period. As a result of some turbulence in November just after the US presidential election, stocks initially plummeted but quickly reversed course and maintained gains through the reporting period on strong earnings and positive investor sentiment. |
| • | | Headline macro-events included fiercely contested disputes in the US Congress over the Trump administration’s policy initiatives, especially on health care and tax reform. Investors shrugged off the political impasse, as stocks sailed smoothly to new highs on strong earnings and positive investor sentiment. However, the extended low-volatility environment had some investors worried over concerns that a sense of complacency may have taken hold. |
| • | | Solid economic fundamentals in the US included moderate GDP expansion, robust employment, and accelerating corporate profit growth. Inflation remained benign. The Federal Reserve raised the federal funds target rate to 1.00%–1.25%. |
What worked?
| • | | The Fund’s positions are based on a quantitative stock selection model that favors companies that are a good value, are high quality and have good earnings prospects relative to peers. QMA’s quality factors in stock selection were particularly powerful over the period, and accounted for much of the excess return. |
| • | | Growth factors, including measures of analyst revision and adjustments to target prices, were a positive contributor as well, but to a lesser degree. |
| • | | QMA maintains diversified portfolios built from the bottom up, with limited deviations from the benchmark with respect to sector and industry. These risk controls ensured unintended bets did not unwind the strength of the signals from QMA’s stock selection model. |
What did not work?
| • | | Relative value factors in QMA’s model detracted from performance. In general, stocks that were more expensive relative to peers when using earnings, book and sales-based |
| | multiples meaningfully outperformed attractively priced stocks. This was concentrated in the second quarter of 2017. |
| • | | Stock selection among technology stocks struggled as investors reached for growth with little regard for the relative value or quality of the companies. |
| | |
| 28 | | Visit our website at pgiminvestments.com |
Current outlook:
| • | | While valuation signals were less effective in the second quarter, QMA continues to see potential among attractively priced stocks. Through the second quarter QMA observed that the difference in valuations between the most and least expensive stocks (the valuation spread) had widened to extreme levels when compared to historical levels. QMA’s research shows that during this type of environment, there tends to be a stronger payoff to valuation factors. The valuation spread remains above average and points to ongoing opportunities among undervalued stocks. |
| | | | |
| Prudential Day One Underlying Funds | | | 29 | |
Fees and Expenses
As a shareholder of a Fund, you incur two types of costs: (1) transaction costs, including sales charges (loads) on purchase payments and redemptions, as applicable, and (2) ongoing costs, including management fees, distribution, and/or service (12b-1) fees, and other Fund expenses, as applicable. This example is intended to help you understand your ongoing costs (in dollars) of investing in the Fund and to compare these costs with the ongoing costs of investing in other mutual funds.
The example is based on an investment of $1,000 held through the six-month period ended July 31, 2017. The example is for illustrative purposes only; you should consult the Prospectus for information on initial and subsequent minimum investment requirements.
Actual Expenses
The first line for each share class in the table on the following page provides information about actual account values and actual expenses. You may use the information on this line, together with the amount you invested, to estimate the expenses that you paid over the period. Simply divide your account value by $1,000 (for example, an $8,600 account value ÷ $1,000 = 8.6), then multiply the result by the number on the first line under the heading “Expenses Paid During the Six-Month Period” to estimate the expenses you paid on your account during this period.
Hypothetical Example for Comparison Purposes
The second line for each share class in the table on the following page provides information about hypothetical account values and hypothetical expenses based on the Fund’s actual expense ratio and an assumed rate of return of 5% per year before expenses, which is not the Fund’s actual return. The hypothetical account values and expenses may not be used to estimate the actual ending account balance or expenses you paid for the period. You may use this information to compare the ongoing costs of investing in the Fund and other funds. To do so, compare this 5% hypothetical example with the 5% hypothetical examples that appear in the shareholder reports of the other funds.
Please note that the expenses shown in the table are meant to highlight your ongoing costs only and do not reflect any transactional costs such as sales charges (loads). Therefore, the second line for each share class in the table is useful in comparing ongoing costs only and will not help you determine the relative total costs of owning different funds. In addition, if these transactional costs were included, your costs would have been higher.
| | | | | | | | | | | | | | | | | | |
Prudential Jennison
Small-Cap Core
Equity Fund | | Beginning Account
Value
February 1, 2017 | | | Ending Account
Value
July 31, 2017 | | | Annualized
Expense Ratio
Based on the
Six-Month Period | | | Expenses Paid
During the
Six-Month Period* | |
| Class Q | | Actual | | $ | 1,000.00 | | | $ | 1,071.30 | | | | 0.95 | % | | $ | 4.88 | |
| | Hypothetical | | $ | 1,000.00 | | | $ | 1,020.08 | | | | 0.95 | % | | $ | 4.76 | |
| | |
| 30 | | Visit our website at pgiminvestments.com |
| | | | | | | | | | | | | | | | | | |
Prudential Core
Conservative Bond Fund | | Beginning Account
Value
February 1, 2017 | | | Ending Account
Value
July 31, 2017 | | | Annualized
Expense Ratio
Based on the
Six-Month Period | | | Expenses Paid
During the
Six-Month Period* | |
| Class Q | | Actual | | $ | 1,000.00 | | | $ | 1,022.80 | | | | 0.50 | % | | $ | 2.51 | |
| | Hypothetical | | $ | 1,000.00 | | | $ | 1,022.32 | | | | 0.50 | % | | $ | 2.51 | |
| | | | | | | | | | | | | | | | | | |
Prudential
TIPS Fund | | Beginning Account
Value
February 1, 2017 | | | Ending Account
Value
July 31, 2017 | | | Annualized
Expense Ratio
Based on the
Six-Month Period | | | Expenses Paid
During the
Six-Month Period* | |
| Class Q | | Actual | | $ | 1,000.00 | | | $ | 1,001.90 | | | | 0.40 | % | | $ | 1.99 | |
| | Hypothetical | | $ | 1,000.00 | | | $ | 1,022.81 | | | | 0.40 | % | | $ | 2.01 | |
| | | | | | | | | | | | | | | | | | |
Prudential Commodity
Strategies Fund | | Beginning Account
Value
February 1, 2017 | | | Ending Account
Value
July 31, 2017 | | | Annualized
Expense Ratio
Based on the
Six-Month Period | | | Expenses Paid
During the
Six-Month Period* | |
| Class Q | | Actual | | $ | 1,000.00 | | | $ | 962.10 | | | | 1.01 | % | | $ | 4.91 | |
| | Hypothetical | | $ | 1,000.00 | | | $ | 1,019.84 | | | | 1.01 | % | | $ | 5.06 | |
| | | | | | | | | | | | | | | | | | |
Prudential QMA
US Broad Market
Index Fund | | Beginning Account
Value
February 1, 2017 | | | Ending Account
Value
July 31, 2017 | | | Annualized
Expense Ratio
Based on the
Six-Month Period | | | Expenses Paid
During the
Six-Month Period* | |
| Class Q | | Actual | | $ | 1,000.00 | | | $ | 1,089.20 | | | | 0.20 | % | | $ | 1.04 | |
| | Hypothetical | | $ | 1,000.00 | | | $ | 1,023.80 | | | | 0.20 | % | | $ | 1.00 | |
| | | | | | | | | | | | | | | | | | |
Prudential QMA
Mid-Cap Core Equity Fund | | Beginning Account
Value
February 1, 2017 | | | Ending Account
Value
July 31, 2017 | | | Annualized
Expense Ratio
Based on the
Six-Month Period | | | Expenses Paid
During the
Six-Month Period* | |
| Class Q | | Actual | | $ | 1,000.00 | | | $ | 1,052.80 | | | | 0.85 | % | | $ | 4.33 | |
| | Hypothetical | | $ | 1,000.00 | | | $ | 1,020.58 | | | | 0.85 | % | | $ | 4.26 | |
*Fund expenses (net of fee waivers or subsidies, if any) for each share class are equal to the annualized expense ratio for each share class (provided in the tables), multiplied by the average account value over the period, multiplied by the 181 days in the six-month period ended July 31, 2017, and divided by the 365 days in the Fund’s fiscal year ended July 31, 2017 (to reflect the six-month period). Expenses presented in the tables include the expenses of any underlying portfolios in which the Fund may invest.
| | | | |
| Prudential Day One Underlying Funds | | | 31 | |
Prudential Jennison Small-Cap Core Equity Fund
Schedule of Investments
as of July 31, 2017
| | | | | | | | |
| Description | | Shares | | | Value | |
LONG-TERM INVESTMENTS 95.3% | |
| | |
COMMON STOCKS | | | | | | | | |
| | |
Aerospace & Defense 0.7% | | | | | | | | |
KLX, Inc.* | | | 1,739 | | | $ | 90,289 | |
| | |
Airlines 0.8% | | | | | | | | |
Spirit Airlines, Inc.* | | | 2,506 | | | | 97,358 | |
| | |
Auto Components 0.1% | | | | | | | | |
Dorman Products, Inc.* | | | 203 | | | | 15,850 | |
| | |
Banks 13.2% | | | | | | | | |
Bank of the Ozarks, Inc. | | | 3,493 | | | | 150,723 | |
BankUnited, Inc. | | | 4,726 | | | | 162,669 | |
Brookline Bancorp, Inc. | | | 4,165 | | | | 61,850 | |
Byline Bancorp, Inc.* | | | 1,253 | | | | 25,260 | |
Columbia Banking System, Inc. | | | 3,183 | | | | 126,811 | |
Eagle Bancorp, Inc.* | | | 2,743 | | | | 171,300 | |
East West Bancorp, Inc. | | | 4,641 | | | | 264,444 | |
Pinnacle Financial Partners, Inc. | | | 3,325 | | | | 212,468 | |
Renasant Corp. | | | 2,314 | | | | 98,090 | |
Seacoast Banking Corp. of Florida* | | | 3,559 | | | | 83,174 | |
Signature Bank* | | | 739 | | | | 102,411 | |
Wintrust Financial Corp. | | | 2,670 | | | | 201,078 | |
| | | | | | | | |
| | | | | | | 1,660,278 | |
| | |
Beverages 0.3% | | | | | | | | |
MGP Ingredients, Inc. | | | 640 | | | | 37,734 | |
| | |
Biotechnology 2.9% | | | | | | | | |
Amicus Therapeutics, Inc.* | | | 9,609 | | | | 124,436 | |
DBV Technologies SA (France), ADR* | | | 1,139 | | | | 50,731 | |
Juno Therapeutics, Inc.* | | | 1,725 | | | | 49,042 | |
La Jolla Pharmaceutical Co.* | | | 1,946 | | | | 57,660 | |
Otonomy, Inc.* | | | 4,100 | | | | 77,080 | |
| | | | | | | | |
| | | | | | | 358,949 | |
| | |
Building Products 0.7% | | | | | | | | |
JELD-WEN Holding, Inc.* | | | 572 | | | | 18,676 | |
PGT Innovations, Inc.* | | | 5,794 | | | | 75,322 | |
| | | | | | | | |
| | | | | | | 93,998 | |
See Notes to Financial Statements.
| | | | |
| Prudential Day One Underlying Funds | | | 33 | |
Prudential Jennison Small-Cap Core Equity Fund
Schedule of Investments (continued)
as of July 31, 2017
| | | | | | | | |
| Description | | Shares | | | Value | |
COMMON STOCKS (Continued) | | | | | | | | |
| | |
Capital Markets 0.9% | | | | | | | | |
Moelis & Co. (Class A Stock) | | | 1,639 | | | $ | 67,035 | |
OM Asset Management PLC | | | 3,316 | | | | 49,972 | |
| | | | | | | | |
| | | | | | | 117,007 | |
| | |
Chemicals 2.2% | | | | | | | | |
Ferro Corp.* | | | 8,468 | | | | 162,925 | |
PolyOne Corp. | | | 3,185 | | | | 116,507 | |
| | | | | | | | |
| | | | | | | 279,432 | |
| | |
Commercial Services & Supplies 2.1% | | | | | | | | |
Advanced Disposal Services, Inc.* | | | 4,651 | | | | 112,461 | |
Mobile Mini, Inc. | | | 3,735 | | | | 115,038 | |
West Corp. | | | 1,467 | | | | 34,284 | |
| | | | | | | | |
| | | | | | | 261,783 | |
| | |
Construction & Engineering 0.2% | | | | | | | | |
Great Lakes Dredge & Dock Corp.* | | | 5,320 | | | | 21,014 | |
| | |
Construction Materials 1.8% | | | | | | | | |
Summit Materials, Inc. (Class A Stock)* | | | 7,851 | | | | 223,282 | |
| | |
Distributors 0.6% | | | | | | | | |
Core-Mark Holding Co., Inc. | | | 2,001 | | | | 73,377 | |
| | |
Diversified Telecommunication Services 1.2% | | | | | | | | |
Cogent Communications Holdings, Inc. | | | 3,756 | | | | 156,813 | |
| | |
Electric Utilities 1.7% | | | | | | | | |
El Paso Electric Co. | | | 2,186 | | | | 113,454 | |
Portland General Electric Co. | | | 2,357 | | | | 105,334 | |
| | | | | | | | |
| | | | | | | 218,788 | |
| | |
Electronic Equipment, Instruments & Components 1.4% | | | | | | | | |
Anixter International, Inc.* | | | 1,203 | | | | 94,736 | |
Littelfuse, Inc. | | | 450 | | | | 81,081 | |
| | | | | | | | |
| | | | | | | 175,817 | |
| | |
Energy Equipment & Services 0.7% | | | | | | | | |
Basic Energy Services, Inc.* | | | 680 | | | | 15,232 | |
Forum Energy Technologies, Inc.* | | | 5,687 | | | | 75,353 | |
| | | | | | | | |
| | | | | | | 90,585 | |
See Notes to Financial Statements.
| | | | | | | | |
| Description | | Shares | | | Value | |
COMMON STOCKS (Continued) | | | | | | | | |
| | |
Equity Real Estate Investment Trusts (REITs) 7.2% | | | | | | | | |
Chatham Lodging Trust | | | 4,557 | | | $ | 94,239 | |
Colony NorthStar, Inc. (Class A Stock) | | | 9,085 | | | | 133,004 | |
Cousins Properties, Inc. | | | 8,852 | | | | 81,350 | |
Gaming & Leisure Properties, Inc. | | | 2,370 | | | | 89,918 | |
Hersha Hospitality Trust | | | 6,495 | | | | 121,846 | |
National Storage Affiliates Trust | | | 3,520 | | | | 80,819 | |
Pebblebrook Hotel Trust | | | 2,859 | | | | 96,262 | |
QTS Realty Trust, Inc. (Class A Stock) | | | 1,634 | | | | 87,370 | |
Retail Opportunity Investments Corp. | | | 5,828 | | | | 118,192 | |
| | | | | | | | |
| | | | | | | 903,000 | |
| | |
Food & Staples Retailing 1.9% | | | | | | | | |
Performance Food Group Co.* | | | 5,538 | | | | 159,494 | |
Sprouts Farmers Market, Inc.* | | | 3,321 | | | | 79,937 | |
| | | | | | | | |
| | | | | | | 239,431 | |
| | |
Food Products 2.0% | | | | | | | | |
Adecoagro SA (Argentina)* | | | 11,660 | | | | 118,582 | |
Darling Ingredients, Inc.* | | | 5,271 | | | | 85,759 | |
Hain Celestial Group, Inc. (The)* | | | 937 | | | | 41,894 | |
| | | | | | | | |
| | | | | | | 246,235 | |
| | |
Health Care Equipment & Supplies 3.1% | | | | | | | | |
GenMark Diagnostics, Inc.* | | | 9,511 | | | | 112,515 | |
Integra LifeSciences Holdings Corp.* | | | 2,016 | | | | 100,115 | |
Nevro Corp.* | | | 1,440 | | | | 123,926 | |
NuVasive, Inc.* | | | 857 | | | | 56,382 | |
| | | | | | | | |
| | | | | | | 392,938 | |
| | |
Health Care Providers & Services 2.8% | | | | | | | | |
Acadia Healthcare Co., Inc.*(a) | | | 1,907 | | | | 100,938 | |
Premier, Inc. (Class A Stock)* | | | 1,400 | | | | 48,860 | |
Teladoc, Inc.* | | | 2,544 | | | | 83,443 | |
Tivity Health, Inc.* | | | 2,920 | | | | 115,778 | |
| | | | | | | | |
| | | | | | | 349,019 | |
| | |
Hotels, Restaurants & Leisure 6.2% | | | | | | | | |
ClubCorp Holdings, Inc. | | | 4,175 | | | | 70,766 | |
Pinnacle Entertainment, Inc.* | | | 8,087 | | | | 153,653 | |
Planet Fitness, Inc. (Class A Stock) | | | 6,609 | | | | 149,760 | |
Texas Roadhouse, Inc. | | | 1,322 | | | | 62,531 | |
Vail Resorts, Inc. | | | 902 | | | | 190,105 | |
Wingstop, Inc.* | | | 3,655 | | | | 109,687 | |
Zoe’s Kitchen, Inc.*(a) | | | 3,697 | | | | 41,813 | |
| | | | | | | | |
| | | | | | | 778,315 | |
See Notes to Financial Statements.
| | | | |
| Prudential Day One Underlying Funds | | | 35 | |
Prudential Jennison Small-Cap Core Equity Fund
Schedule of Investments (continued)
as of July 31, 2017
| | | | | | | | |
| Description | | Shares | | | Value | |
COMMON STOCKS (Continued) | | | | | | | | |
| | |
Insurance 2.1% | | | | | | | | |
Validus Holdings Ltd. | | | 2,637 | | | $ | 141,844 | |
White Mountains Insurance Group Ltd. | | | 142 | | | | 122,773 | |
| | | | | | | | |
| | | | | | | 264,617 | |
| | |
Internet & Direct Marketing Retail 0.4% | | | | | | | | |
Wayfair, Inc. (Class A Stock)*(a) | | | 635 | | | | 48,482 | |
| | | | | | | | |
| | |
Internet Software & Services 3.2% | | | | | | | | |
Criteo SA (France), ADR* | | | 1,644 | | | | 83,186 | |
MINDBODY, Inc. (Class A Stock)* | | | 2,618 | | | | 67,937 | |
MuleSoft, Inc. (Class A Stock)*(a) | | | 2,256 | | | | 49,045 | |
New Relic, Inc.* | | | 1,452 | | | | 68,186 | |
Q2 Holdings, Inc.* | | | 2,655 | | | | 103,280 | |
Shutterstock, Inc.* | | | 870 | | | | 36,662 | |
| | | | | | | | |
| | | | | | | 408,296 | |
| | |
IT Services 2.1% | | | | | | | | |
Global Payments, Inc. | | | 796 | | | | 75,119 | |
InterXion Holding NV (Netherlands)* | | | 2,654 | | | | 127,047 | |
Presidio, Inc.* | | | 4,826 | | | | 65,778 | |
| | | | | | | | |
| | | | | | | 267,944 | |
| | |
Life Sciences Tools & Services 1.1% | | | | | | | | |
INC Research Holdings, Inc. (Class A Stock)* | | | 1,411 | | | | 77,605 | |
NanoString Technologies, Inc.* | | | 2,175 | | | | 33,082 | |
VWR Corp.* | | | 1,040 | | | | 34,320 | |
| | | | | | | | |
| | | | | | | 145,007 | |
| | |
Machinery 4.5% | | | | | | | | |
Actuant Corp. (Class A Stock) | | | 2,727 | | | | 65,993 | |
Gardner Denver Holdings, Inc.* | | | 4,411 | | | | 101,277 | |
Mueller Water Products, Inc. (Class A Stock) | | | 5,177 | | | | 60,053 | |
NN, Inc. | | | 3,343 | | | | 92,601 | |
Rexnord Corp.* | | | 6,987 | | | | 161,819 | |
Terex Corp. | | | 2,252 | | | | 88,661 | |
| | | | | | | | |
| | | | | | | 570,404 | |
| | |
Media 1.2% | | | | | | | | |
Cinemark Holdings, Inc. | | | 3,928 | | | | 152,799 | |
See Notes to Financial Statements.
| | | | | | | | |
| Description | | Shares | | | Value | |
COMMON STOCKS (Continued) | | | | | | | | |
| |
Mortgage Real Estate Investment Trusts (REITs) 1.1% | | | | | |
MFA Financial, Inc. | | | 15,638 | | | $ | 132,767 | |
| | |
Oil, Gas & Consumable Fuels 3.0% | | | | | | | | |
Arch Coal, Inc. (Class A Stock) | | | 660 | | | | 50,206 | |
PDC Energy, Inc.* | | | 729 | | | | 34,380 | |
SemGroup Corp. (Class A Stock) | | | 3,260 | | | | 88,183 | |
Tallgrass Energy GP LP | | | 2,854 | | | | 74,061 | |
WPX Energy, Inc.* | | | 11,575 | | | | 124,779 | |
| | | | | | | | |
| | | | | | | 371,609 | |
|
Personal Products 0.7% | |
elf Beauty, Inc.* | | | 3,256 | | | | 82,605 | |
|
Pharmaceuticals 2.7% | |
Dermira, Inc.* | | | 3,174 | | | | 87,380 | |
GW Pharmaceuticals PLC (United Kingdom), ADR*(a) | | | 464 | | | | 51,866 | |
Intersect ENT, Inc.* | | | 3,545 | | | | 97,133 | |
Prestige Brands Holdings, Inc.* | | | 1,851 | | | | 99,269 | |
| | | | | | | | |
| | | | 335,648 | |
|
Professional Services 1.0% | |
Korn/Ferry International | | | 3,642 | | | | 121,825 | |
|
Real Estate Management & Development 0.2% | |
Marcus & Millichap, Inc.* | | | 1,218 | | | | 31,181 | |
|
Road & Rail 0.3% | |
Saia, Inc.* | | | 723 | | | | 39,295 | |
|
Semiconductors & Semiconductor Equipment 4.2% | |
Cavium, Inc.* | | | 2,571 | | | | 159,248 | |
MACOM Technology Solutions Holdings, Inc.* | | | 3,572 | | | | 216,285 | |
MaxLinear, Inc. (Class A Stock)* | | | 3,380 | | | | 88,556 | |
Monolithic Power Systems, Inc. | | | 679 | | | | 69,475 | |
| | | | | | | | |
| | | | 533,564 | |
|
Software 8.1% | |
Callidus Software, Inc.* | | | 4,442 | | | | 107,940 | |
CommVault Systems, Inc.* | | | 938 | | | | 55,858 | |
CyberArk Software Ltd. (Israel)* | | | 2,053 | | | | 85,569 | |
Fortinet, Inc.* | | | 2,268 | | | | 83,712 | |
HubSpot, Inc.* | | | 1,831 | | | | 132,473 | |
Paycom Software, Inc.* | | | 3,142 | | | | 220,223 | |
See Notes to Financial Statements.
| | | | |
| Prudential Day One Underlying Funds | | | 37 | |
Prudential Jennison Small-Cap Core Equity Fund
Schedule of Investments (continued)
as of July 31, 2017
| | | | | | | | |
| Description | | Shares | | | Value | |
COMMON STOCKS (Continued) | | | | | | | | |
|
Software (cont’d.) | |
Proofpoint, Inc.* | | | 1,453 | | | $ | 123,853 | |
Varonis Systems, Inc.* | | | 3,379 | | | | 125,868 | |
Zendesk, Inc.* | | | 2,843 | | | | 83,357 | |
| | | | | | | | |
| | | | 1,018,853 | |
|
Specialty Retail 2.3% | |
Five Below, Inc.* | | | 4,010 | | | | 193,723 | |
Party City Holdco, Inc.*(a) | | | 6,481 | | | | 90,410 | |
| | | | | | | | |
| | | | 284,133 | |
|
Thrifts & Mortgage Finance 0.2% | |
WSFS Financial Corp. | | | 511 | | | | 23,072 | |
|
Trading Companies & Distributors 2.2% | |
Beacon Roofing Supply, Inc.* | | | 1,444 | | | | 66,323 | |
Univar, Inc.* | | | 6,929 | | | | 215,076 | |
| | | | | | | | |
| | | | 281,399 | |
| | | | | | | | |
TOTAL LONG-TERM INVESTMENTS
(cost $10,937,984) | | | | 11,994,792 | |
| | | | | | | | |
| | |
SHORT-TERM INVESTMENTS 7.8% | | | | | | | | |
| | |
AFFILIATED MUTUAL FUNDS | | | | | | | | |
Prudential Investment Portfolios 2 - Prudential Core Ultra Short Bond Fund(w) | | | 653,270 | | | | 653,270 | |
Prudential Investment Portfolios 2 - Prudential Institutional Money Market Fund
(cost $329,204; includes $328,829 of cash collateral for securities on loan)(b)(w) | | | 329,171 | | | | 329,204 | |
| | | | | | | | |
TOTAL SHORT-TERM INVESTMENTS
(cost $982,474) | | | | 982,474 | |
| | | | | | | | |
TOTAL INVESTMENTS 103.1%
(cost $11,920,458) | | | | 12,977,266 | |
Liabilities in excess of other assets (3.1)% | | | | (393,627 | ) |
| | | | | | | | |
NET ASSETS 100.0% | | | $ | 12,583,639 | |
| | | | | | | | |
See the Glossary for abbreviations used in the annual report.
| * | Non-income producing security. |
| (a) | All or a portion of security is on loan. The aggregate market value of such securities, including those sold and pending settlement is $317,420; cash collateral of $328,829 (included in liabilities) was received with which the Fund purchased highly liquid short-term investments. |
| (b) | Represents security purchased with cash collateral received for securities on loan and includes dividend reinvestment. |
| (w) | PGIM Investments LLC, the manager of the Fund, also serves as manager of the Prudential Investment Portfolios 2—Prudential Core Ultra Short Bond Fund and Prudential Institutional Money Market Fund. |
See Notes to Financial Statements.
Fair Value Measurements:
Various inputs are used in determining the value of the Fund’s investments. These inputs are summarized in the three broad levels listed below.
Level 1—unadjusted quoted prices generally in active markets for identical securities.
Level 2—quoted prices for similar securities, interest rates and yield curves, prepayment speeds, foreign currency exchange rates and other observable inputs.
Level 3—unobservable inputs for securities valued in accordance with Board approved fair valuation procedures.
The following is a summary of the inputs used as of July 31, 2017 in valuing such portfolio securities:
| | | | | | | | | | | | |
| | | Level 1 | | | Level 2 | | | Level 3 | |
Investments in Securities | | | | | | | | | | | | |
Common Stocks | | | | | | | | | | | | |
Aerospace & Defense | | $ | 90,289 | | | $ | — | | | $ | — | |
Airlines | | | 97,358 | | | | — | | | | — | |
Auto Components | | | 15,850 | | | | — | | | | — | |
Banks | | | 1,660,278 | | | | — | | | | — | |
Beverages | | | 37,734 | | | | — | | | | — | |
Biotechnology | | | 358,949 | | | | — | | | | — | |
Building Products | | | 93,998 | | | | — | | | | — | |
Capital Markets | | | 117,007 | | | | — | | | | — | |
Chemicals | | | 279,432 | | | | — | | | | — | |
Commercial Services & Supplies | | | 261,783 | | | | — | | | | — | |
Construction & Engineering | | | 21,014 | | | | — | | | | — | |
Construction Materials | | | 223,282 | | | | — | | | | — | |
Distributors | | | 73,377 | | | | — | | | | — | |
Diversified Telecommunication Services | | | 156,813 | | | | — | | | | — | |
Electric Utilities | | | 218,788 | | | | — | | | | — | |
Electronic Equipment, Instruments & Components | | | 175,817 | | | | — | | | | — | |
Energy Equipment & Services | | | 90,585 | | | | — | | | | — | |
Equity Real Estate Investment Trusts (REITs) | | | 903,000 | | | | — | | | | — | |
Food & Staples Retailing | | | 239,431 | | | | — | | | | — | |
Food Products | | | 246,235 | | | | — | | | | — | |
Health Care Equipment & Supplies | | | 392,938 | | | | — | | | | — | |
Health Care Providers & Services | | | 349,019 | | | | — | | | | — | |
Hotels, Restaurants & Leisure | | | 778,315 | | | | — | | | | — | |
Insurance | | | 264,617 | | | | — | | | | — | |
Internet & Direct Marketing Retail | | | 48,482 | | | | — | | | | — | |
Internet Software & Services | | | 408,296 | | | | — | | | | — | |
See Notes to Financial Statements.
| | | | |
| Prudential Day One Underlying Funds | | | 39 | |
Prudential Jennison Small-Cap Core Equity Fund
Schedule of Investments (continued)
as of July 31, 2017
| | | | | | | | | | | | |
| | | Level 1 | | | Level 2 | | | Level 3 | |
Investments in Securities (continued) | | | | | | | | | | | | |
Common Stocks (continued) | | | | | | | | | | | | |
IT Services | | $ | 267,944 | | | $ | — | | | $ | — | |
Life Sciences Tools & Services | | | 145,007 | | | | — | | | | — | |
Machinery | | | 570,404 | | | | — | | | | — | |
Media | | | 152,799 | | | | — | | | | — | |
Mortgage Real Estate Investment Trusts (REITs) | | | 132,767 | | | | — | | | | — | |
Oil, Gas & Consumable Fuels | | | 371,609 | | | | — | | | | — | |
Personal Products | | | 82,605 | | | | — | | | | — | |
Pharmaceuticals | | | 335,648 | | | | — | | | | — | |
Professional Services | | | 121,825 | | | | — | | | | — | |
Real Estate Management & Development | | | 31,181 | | | | — | | | | — | |
Road & Rail | | | 39,295 | | | | — | | | | — | |
Semiconductors & Semiconductor Equipment | | | 533,564 | | | | — | | | | — | |
Software | | | 1,018,853 | | | | — | | | | — | |
Specialty Retail | | | 284,133 | | | | — | | | | — | |
Thrifts & Mortgage Finance | | | 23,072 | | | | — | | | | — | |
Trading Companies & Distributors | | | 281,399 | | | | — | | | | — | |
Affiliated Mutual Funds | | | 982,474 | | | | — | | | | — | |
| | | | | | | | | | | | |
Total | | $ | 12,977,266 | | | $ | — | | | $ | — | |
| | | | | | | | | | | | |
During the period, there were no transfers between Level 1, Level 2 and Level 3 to report.
Industry Classification:
The industry classification of investments and liabilities in excess of other assets shown as a percentage of net assets as of July 31, 2017 were as follows (unaudited):
| | | | |
Banks | | | 13.2 | % |
Software | | | 8.1 | |
Affiliated Mutual Funds (including 2.6% of collateral for securities on loan) | | | 7.8 | |
Equity Real Estate Investment Trusts (REITs) | | | 7.2 | |
Hotels, Restaurants & Leisure | | | 6.2 | |
Machinery | | | 4.5 | |
Semiconductors & Semiconductor Equipment | | | 4.2 | |
Internet Software & Services | | | 3.2 | |
Health Care Equipment & Supplies | | | 3.1 | |
Oil, Gas & Consumable Fuels | | | 3.0 | |
Biotechnology | | | 2.9 | |
Health Care Providers & Services | | | 2.8 | |
Pharmaceuticals | | | 2.7 | |
Specialty Retail | | | 2.3 | |
Trading Companies & Distributors | | | 2.2 | |
Chemicals | | | 2.2 | |
IT Services | | | 2.1 | |
Insurance | | | 2.1 | |
Commercial Services & Supplies | | | 2.1 | % |
Food Products | | | 2.0 | |
Food & Staples Retailing | | | 1.9 | |
Construction Materials | | | 1.8 | |
Electric Utilities | | | 1.7 | |
Electronic Equipment, Instruments & Components | | | 1.4 | |
Diversified Telecommunication Services | | | 1.2 | |
Media | | | 1.2 | |
Life Sciences Tools & Services | | | 1.1 | |
Mortgage Real Estate Investment Trusts (REITs) | | | 1.1 | |
Professional Services | | | 1.0 | |
Capital Markets | | | 0.9 | |
Airlines | | | 0.8 | |
Building Products | | | 0.7 | |
Energy Equipment & Services | | | 0.7 | |
Aerospace & Defense | | | 0.7 | |
Personal Products | | | 0.7 | |
Distributors | | | 0.6 | |
Internet & Direct Marketing Retail | | | 0.4 | |
See Notes to Financial Statements.
| | | | |
Industry Classification (cont’d.) | | | |
Road & Rail | | | 0.3 | % |
Beverages | | | 0.3 | |
Real Estate Management & Development | | | 0.2 | |
Thrifts & Mortgage Finance | | | 0.2 | |
Construction & Engineering | | | 0.2 | |
| | | | |
Auto Components | | | 0.1 | % |
| | | | |
| | | 103.1 | |
Liabilities in excess of other assets | | | (3.1 | ) |
| | | | |
| | | 100.0 | % |
| | | | |
Financial Instruments/Transactions—Summary of Offsetting and Netting Arrangements:
The Fund entered into financial instruments/transactions during the reporting period that are either offset in accordance with current requirements or are subject to enforceable master netting arrangements or similar agreements that permit offsetting. The information about offsetting and related netting arrangements for financial instruments/transactions, where the legal right to set-off exists, is presented in the summary below.
Offsetting of financial instrument/transaction assets and liabilities:
| | | | | | | | | | | | |
Description | | Gross
Amounts of
Recognized
Assets(1) | | | Collateral
Received(2) | | | Net
Amount | |
Securities on Loan | | $ | 317,420 | | | $ | (317,420 | ) | | $ | — | |
| | | | | | | | | | | | |
| (1) | Amount represents market value. |
| (2) | Collateral amount disclosed by the Fund is limited to the market value of financial instruments/transactions. |
See Notes to Financial Statements.
| | | | |
| Prudential Day One Underlying Funds | | | 41 | |
Prudential Core Conservative Bond Fund
Schedule of Investments
as of July 31, 2017
| | | | | | | | | | | | | | | | |
| Description | | Interest
Rate | | | Maturity
Date | | | Principal
Amount (000)# | | | Value | |
LONG-TERM INVESTMENTS 99.3% | |
|
COMMERCIAL MORTGAGE-BACKED SECURITIES 2.6% | |
Citigroup Commercial Mortgage Trust, Series 2016-P6, Class A4 | | | 3.458 | % | | | 12/10/49 | | | | 125 | | | $ | 129,125 | |
Fannie Mae-Aces,
Series 2015-M7, Class AB2 | | | 2.502 | | | | 12/25/24 | | | | 49 | | | | 47,921 | |
Series 2016-M11, Class A2 | | | 2.369 | (c) | | | 07/25/26 | | | | 75 | | | | 72,313 | |
Series 2017-M1, Class A2 | | | 2.417 | (c) | | | 10/25/26 | | | | 40 | | | | 38,714 | |
JPMorgan Chase Commercial Mortgage Securities Trust,
Series 2016-JP4, Class A3 | | | 3.393 | | | | 12/15/49 | | | | 125 | | | | 128,548 | |
Morgan Stanley Bank of America Merrill Lynch Trust, Series 2016-C32, Class A3 | | | 3.459 | | | | 12/15/49 | | | | 125 | | | | 128,767 | |
Morgan Stanley Capital I Trust, Series 2016-UB12, Class A3 | | | 3.337 | | | | 12/15/49 | | | | 125 | | | | 127,761 | |
Wells Fargo Commercial Mortgage Trust, Series 2016-LC25, Class A3 | | | 3.374 | | | | 12/15/59 | | | | 125 | | | | 127,862 | |
| | | | | | | | | | | | | | | | |
TOTAL COMMERCIAL MORTGAGE-BACKED SECURITIES
(cost $787,599) | | | | 801,011 | |
| | | | | | | | | | | | | | | | |
| | |
CORPORATE BONDS 29.0% | | | | | | | | | |
|
Aerospace & Defense 0.2% | |
Lockheed Martin Corp., Sr. Unsec’d. Notes | | | 3.800 | | | | 03/01/45 | | | | 15 | | | | 14,688 | |
Northrop Grumman Corp., Sr. Unsec’d. Notes | | | 4.750 | | | | 06/01/43 | | | | 25 | | | | 28,020 | |
Rockwell Collins, Inc., | | | | | | | | | | | | | | | | |
Sr. Unsec’d. Notes | | | 3.500 | | | | 03/15/27 | | | | 20 | | | | 20,546 | |
Sr. Unsec’d. Notes | | | 4.350 | | | | 04/15/47 | | | | 10 | | | | 10,499 | |
| | | | | | | | | | | | | | | | |
| | | | 73,753 | |
| | | | |
Agriculture 0.4% | | | | | | | | | | | | | | | | |
Altria Group, Inc., Gtd. Notes | | | 2.850 | | | | 08/09/22 | | | | 65 | | | | 66,320 | |
Philip Morris International, Inc., | | | | | | | | | | | | | | | | |
Sr. Unsec’d. Notes | | | 2.625 | | | | 03/06/23 | | | | 50 | | | | 50,142 | |
Sr. Unsec’d. Notes | | | 4.250 | | | | 11/10/44 | | | | 10 | | | | 10,257 | |
| | | | | | | | | | | | | | | | |
| | | | 126,719 | |
| | | | |
Airlines 0.1% | | | | | | | | | | | | | | | | |
Continental Airlines, Inc., Pass-Through Certificates | | | 4.150 | | | | 10/11/25 | | | | 28 | | | | 29,585 | |
| | | | |
Auto Manufacturers 0.7% | | | | | | | | | | | | | | | | |
Ford Motor Co., Sr. Unsec’d. Notes | | | 6.375 | | | | 02/01/29 | | | | 60 | | | | 69,452 | |
Ford Motor Credit Co. LLC, | | | | | | | | | | | | | | | | |
Sr. Unsec’d. Notes | | | 3.096 | | | | 05/04/23 | | | | 15 | | | | 14,881 | |
Sr. Unsec’d. Notes | | | 3.200 | | | | 01/15/21 | | | | 25 | | | | 25,509 | |
General Motors Co., Sr. Unsec’d. Notes | | | 6.250 | | | | 10/02/43 | | | | 15 | | | | 16,991 | |
General Motors Financial Co., Inc., Gtd. Notes | | | 3.950 | | | | 04/13/24 | | | | 90 | | | | 91,537 | |
| | | | | | | | | | | | | | | | |
| | | | 218,370 | |
See Notes to Financial Statements.
| | | | | | | | | | | | | | | | |
| Description | | Interest
Rate | | | Maturity
Date | | | Principal
Amount (000)# | | | Value | |
CORPORATE BONDS (Continued) | | | | | | | | | | | | | | | | |
|
Banks 5.2% | |
Bank of America Corp., | | | | | | | | | | | | | | | | |
Sr. Unsec’d. Notes, GMTN | | | 3.300 | % | | | 01/11/23 | | | | 200 | | | $ | 205,240 | |
Sr. Unsec’d. Notes, MTN | | | 3.875 | | | | 08/01/25 | | | | 40 | | | | 41,684 | |
Sr. Unsec’d. Notes, MTN | | | 4.125 | | | | 01/22/24 | | | | 50 | | | | 53,233 | |
Sr. Unsec’d. Notes, MTN | | | 4.000 | | | | 04/01/24 | | | | 5 | | | | 5,281 | |
Citigroup, Inc., | | | | | | | | | | | | | | | | |
Sr. Unsec’d. Notes | | | 2.900 | | | | 12/08/21 | | | | 20 | | | | 20,284 | |
Sr. Unsec’d. Notes | | | 3.400 | | | | 05/01/26 | | | | 40 | | | | 39,900 | |
Sr. Unsec’d. Notes | | | 3.700 | | | | 01/12/26 | | | | 125 | | | | 127,218 | |
Goldman Sachs Group, Inc. (The), Sr. Unsec’d. Notes, MTN | | | 4.000 | | | | 03/03/24 | | | | 240 | | | | 252,214 | |
HSBC Holdings PLC (United Kingdom), Sr. Unsec’d. Notes | | | 4.000 | | | | 03/30/22 | | | | 115 | | | | 122,147 | |
JPMorgan Chase & Co., | | | | | | | | | | | | | | | | |
Sr. Unsec’d. Notes | | | 3.875 | | | | 02/01/24 | | | | 45 | | | | 47,450 | |
Sub. Notes | | | 3.875 | | | | 09/10/24 | | | | 215 | | | | 223,012 | |
Morgan Stanley, Sr. Unsec’d. Notes, GMTN | | | 3.750 | | | | 02/25/23 | | | | 235 | | | | 245,277 | |
PNC Financial Services Group, Inc. (The), Sub. Notes | | | 3.900 | | | | 04/29/24 | | | | 50 | | | | 52,707 | |
SunTrust Banks, Inc., Sr. Unsec’d. Notes | | | 2.700 | | | | 01/27/22 | | | | 20 | | | | 20,142 | |
US Bancorp, Sr. Unsec’d. Notes, MTN | | | 2.625 | | | | 01/24/22 | | | | 50 | | | | 50,719 | |
Wells Fargo & Co.,
Sr. Unsec’d. Notes | | | 3.000 | | | | 10/23/26 | | | | 20 | | | | 19,610 | |
Sr. Unsec’d. Notes, MTN | | | 3.000 | | | | 02/19/25 | | | | 90 | | | | 89,627 | |
| | | | | | | | | | | | | | | | |
| | | | | | | | | | | | | | | 1,615,745 | |
| | | | |
Beverages 0.8% | | | | | | | | | | | | | | | | |
Anheuser-Busch InBev Finance, Inc.
(Belgium), Gtd. Notes | | | 3.300 | | | | 02/01/23 | | | | 125 | | | | 129,702 | |
(Belgium), Gtd. Notes | | | 4.900 | | | | 02/01/46 | | | | 30 | | | | 33,692 | |
PepsiCo, Inc.,
Sr. Unsec’d. Notes | | | 2.750 | | | | 03/05/22 | | | | 75 | | | | 76,695 | |
Sr. Unsec’d. Notes | | | 3.600 | | | | 03/01/24 | | | | 10 | | | | 10,584 | |
| | | | | | | | | | | | | | | | |
| | | | | | | | | | | | | | | 250,673 | |
| | | | |
Biotechnology 0.8% | | | | | | | | | | | | | | | | |
Amgen, Inc., Sr. Unsec’d. Notes | | | 3.625 | | | | 05/22/24 | | | | 150 | | | | 157,698 | |
Celgene Corp., Sr. Unsec’d. Notes | | | 3.625 | | | | 05/15/24 | | | | 40 | | | | 41,803 | |
Gilead Sciences, Inc.,
Sr. Unsec’d. Notes | | | 4.400 | | | | 12/01/21 | | | | 20 | | | | 21,694 | |
Sr. Unsec’d. Notes | | | 4.800 | | | | 04/01/44 | | | | 20 | | | | 22,059 | |
| | | | | | | | | | | | | | | | |
| | | | | | | | | | | | | | | 243,254 | |
| | | | |
Chemicals 0.7% | | | | | | | | | | | | | | | | |
Agrium, Inc. (Canada), Sr. Unsec’d. Notes | | | 5.250 | | | | 01/15/45 | | | | 15 | | | | 16,994 | |
Dow Chemical Co. (The), Sr. Unsec’d. Notes | | | 4.125 | | | | 11/15/21 | | | | 75 | | | | 80,551 | |
Eastman Chemical Co., Sr. Unsec’d. Notes | | | 4.650 | | | | 10/15/44 | | | | 20 | | | | 21,196 | |
See Notes to Financial Statements.
| | | | |
| Prudential Day One Underlying Funds | | | 43 | |
Prudential Core Conservative Bond Fund
Schedule of Investments (continued)
as of July 31, 2017
| | | | | | | | | | | | | | | | |
| Description | | Interest
Rate | | | Maturity
Date | | | Principal
Amount (000)# | | | Value | |
CORPORATE BONDS (Continued) | | | | | | | | | | | | | | | | |
| | | | |
Chemicals (cont’d.) | | | | | | | | | | | | | | | | |
EI du Pont de Nemours & Co., Sr. Unsec’d. Notes | | | 2.800 | % | | | 02/15/23 | | | | 15 | | | $ | 15,232 | |
LYB International Finance II BV, Gtd. Notes | | | 3.500 | | | | 03/02/27 | | | | 35 | | | | 35,055 | |
LyondellBasell Industries NV, Sr. Unsec’d. Notes | | | 6.000 | | | | 11/15/21 | | | | 50 | | | | 56,709 | |
Sherwin-Williams Co. (The), Sr. Unsec’d. Notes | | | 4.500 | | | | 06/01/47 | | | | 5 | | | | 5,276 | |
| | | | | | | | | | | | | | | | |
| | | | | | | | | | | | | | | 231,013 | |
| | | | |
Commercial Services 0.1% | | | | | | | | | | | | | | | | |
President & Fellows of Harvard College, Unsec’d. Notes | | | 3.150 | | | | 07/15/46 | | | | 9 | | | | 8,533 | |
University of Southern California, Unsec’d. Notes | | | 3.841 | | | | 10/01/47 | | | | 10 | | | | 10,381 | |
| | | | | | | | | | | | | | | | |
| | | | | | | | | | | | | | | 18,914 | |
| | | | |
Computers 1.3% | | | | | | | | | | | | | | | | |
Apple, Inc.,
Sr. Unsec’d. Notes | | | 2.400 | | | | 05/03/23 | | | | 120 | | | | 120,075 | |
Sr. Unsec’d. Notes | | | 2.850 | | | | 05/11/24 | | | | 45 | | | | 45,491 | |
Sr. Unsec’d. Notes | | | 3.000 | | | | 06/20/27 | | | | 35 | | | | 34,879 | |
Dell International LLC/EMC Corp., Sr. Sec’d. Notes, 144A | | | 4.420 | | | | 06/15/21 | | | | 40 | | | | 42,215 | |
Hewlett Packard Enterprise Co., Sr. Unsec’d. Notes | | | 2.850 | | | | 10/05/18 | | | | 50 | | | | 50,603 | |
International Business Machines Corp., Sr. Unsec’d. Notes | | | 3.625 | | | | 02/12/24 | | | | 100 | | | | 105,171 | |
| | | | | | | | | | | | | | | | |
| | | | | | | | | | | | | | | 398,434 | |
| | | | |
Diversified Financial Services 0.4% | | | | | | | | | | | | | | | | |
American Express Credit Corp., Sr. Unsec’d. Notes, MTN | | | 2.200 | | | | 03/03/20 | | | | 35 | | | | 35,286 | |
Capital One Bank USA NA, Sub. Notes | | | 3.375 | | | | 02/15/23 | | | | 20 | | | | 20,298 | |
Discover Financial Services, Sr. Unsec’d. Notes | | | 4.100 | | | | 02/09/27 | | | | 20 | | | | 20,242 | |
Mastercard, Inc., Sr. Unsec’d. Notes | | | 3.375 | | | | 04/01/24 | | | | 50 | | | | 52,381 | |
| | | | | | | | | | | | | | | | |
| | | | | | | | | | | | | | | 128,207 | |
| | | | |
Electric 1.7% | | | | | | | | | | | | | | | | |
Ameren Illinois Co., Sr. Sec’d. Notes | | | 4.150 | | | | 03/15/46 | | | | 5 | | | | 5,326 | |
Appalachian Power Co., Sr. Unsec’d. Notes | | | 3.300 | | | | 06/01/27 | | | | 10 | | | | 10,216 | |
Arizona Public Service Co., Sr. Unsec’d. Notes | | | 3.750 | | | | 05/15/46 | | | | 15 | | | | 14,566 | |
Berkshire Hathaway Energy Co., Sr. Unsec’d. Notes | | | 4.500 | | | | 02/01/45 | | | | 35 | | | | 38,439 | |
Commonwealth Edison Co., First Mortgage | | | 4.600 | | | | 08/15/43 | | | | 35 | | | | 38,923 | |
Duke Energy Carolinas LLC,
1st Ref Mort | | | 2.950 | | | | 12/01/26 | | | | 20 | | | | 20,004 | |
First Mortgage | | | 4.250 | | | | 12/15/41 | | | | 5 | | | | 5,370 | |
Duke Energy Corp., Sr. Unsec’d. Notes | | | 2.650 | | | | 09/01/26 | | | | 75 | | | | 72,567 | |
Entergy Louisiana LLC, First Mortgage | | | 4.050 | | | | 09/01/23 | | | | 35 | | | | 37,585 | |
Exelon Corp., Jr. Sub. Notes | | | 3.497 | | | | 06/01/22 | | | | 10 | | | | 10,354 | |
Florida Power & Light Co., First Mortgage | | | 2.750 | | | | 06/01/23 | | | | 25 | | | | 25,458 | |
Hydro-Quebec (Canada), Local Gov’t. Gtd. Notes | | | 8.050 | | | | 07/07/24 | | | | 10 | | | | 13,094 | |
See Notes to Financial Statements.
| | | | | | | | | | | | | | | | |
| Description | | Interest
Rate | | | Maturity
Date | | | Principal
Amount (000)# | | | Value | |
CORPORATE BONDS (Continued) | | | | | | | | | | | | | | | | |
| | | | |
Electric (cont’d.) | | | | | | | | | | | | | | | | |
Louisville Gas & Electric Co., First Mortgage | | | 5.125 | % | | | 11/15/40 | | | | 5 | | | $ | 5,784 | |
Northern States Power Co., First Mortgage | | | 3.400 | | | | 08/15/42 | | | | 15 | | | | 14,252 | |
Pacific Gas & Electric Co., Sr. Unsec’d. Notes | | | 5.125 | | | | 11/15/43 | | | | 55 | | | | 65,674 | |
PPL Electric Utilities Corp., First Mortgage | | | 6.250 | | | | 05/15/39 | | | | 10 | | | | 13,265 | |
Public Service Electric & Gas Co., First Mortgage, MTN | | | 2.250 | | | | 09/15/26 | | | | 25 | | | | 23,616 | |
Puget Energy, Inc., Sr. Sec’d. Notes | | | 3.650 | | | | 05/15/25 | | | | 20 | | | | 20,022 | |
San Diego Gas & Electric Co.,
First Mortgage | | | 2.500 | | | | 05/15/26 | | | | 20 | | | | 19,425 | |
First Mortgage | | | 3.750 | | | | 06/01/47 | | | | 5 | | | | 5,038 | |
Southern California Edison Co., First Refinance Mortgage | | | 4.650 | | | | 10/01/43 | | | | 40 | | | | 46,407 | |
Virginia Electric & Power Co., Sr. Unsec’d. Notes | | | 6.000 | | | | 05/15/37 | | | | 20 | | | | 25,754 | |
| | | | | | | | | | | | | | | | |
| | | | | | | | | | | | | | | 531,139 | |
| | | | |
Foods 0.2% | | | | | | | | | | | | | | | | |
Kraft Heinz Foods Co., Gtd. Notes | | | 3.000 | | | | 06/01/26 | | | | 50 | | | | 48,155 | |
| | | | |
Forest Products & Paper 0.4% | | | | | | | | | | | | | | | | |
International Paper Co., Sr. Unsec’d. Notes | | | 3.650 | | | | 06/15/24 | | | | 130 | | | | 134,450 | |
| | | | |
Gas 0.2% | | | | | | | | | | | | | | | | |
NiSource Finance Corp., Gtd. Notes | | | 4.800 | | | | 02/15/44 | | | | 25 | | | | 27,462 | |
Southern Co. Gas Capital Corp., Gtd. Notes | | | 4.400 | | | | 06/01/43 | | | | 25 | | | | 25,724 | |
| | | | | | | | | | | | | | | | |
| | | | | | | | | | | | | | | 53,186 | |
| | | | |
Healthcare-Products 0.9% | | | | | | | | | | | | | | | | |
Abbott Laboratories, Sr. Unsec’d. Notes | | | 2.900 | | | | 11/30/21 | | | | 40 | | | | 40,707 | |
Becton Dickinson and Co., Sr. Unsec’d. Notes | | | 3.734 | | | | 12/15/24 | | | | 32 | | | | 33,053 | |
Covidien International Finance SA, Gtd. Notes | | | 2.950 | | | | 06/15/23 | | | | 75 | | | | 75,683 | |
Medtronic, Inc., Gtd. Notes | | | 3.625 | | | | 03/15/24 | | | | 65 | | | | 68,599 | |
Stryker Corp., Sr. Unsec’d. Notes | | | 3.375 | | | | 05/15/24 | | | | 25 | | | | 25,831 | |
Thermo Fisher Scientific, Inc., Sr. Unsec’d. Notes | | | 3.000 | | | | 04/15/23 | | | | 25 | | | | 25,434 | |
| | | | | | | | | | | | | | | | |
| | | | | | | | | | | | | | | 269,307 | |
| | | | |
Healthcare-Services 1.9% | | | | | | | | | | | | | | | | |
Aetna, Inc., Sr. Unsec’d. Notes | | | 2.750 | | | | 11/15/22 | | | | 70 | | | | 70,919 | |
Anthem, Inc., Sr. Unsec’d. Notes | | | 3.125 | | | | 05/15/22 | | | | 135 | | | | 138,834 | |
Ascension Health, Unsec’d. Notes | | | 4.847 | | | | 11/15/53 | | | | 30 | | | | 34,042 | |
Children’s Hospital Corp. (The), Unsec’d. Notes | | | 4.115 | | | | 01/01/47 | | | | 15 | | | | 15,811 | |
Cigna Corp., Sr. Unsec’d. Notes | | | 4.000 | | | | 02/15/22 | | | | 35 | | | | 37,189 | |
Duke University Health System, Inc., Sr Unsecured | | | 3.920 | | | | 06/01/47 | | | | 10 | | | | 10,152 | |
Hackensack Meridian Health, Inc., Sr. Unsec’d. Notes | | | 4.500 | | | | 07/01/57 | | | | 5 | | | | 5,350 | |
See Notes to Financial Statements.
| | | | |
| Prudential Day One Underlying Funds | | | 45 | |
Prudential Core Conservative Bond Fund
Schedule of Investments (continued)
as of July 31, 2017
| | | | | | | | | | | | | | | | |
| Description | | Interest
Rate | | | Maturity
Date | | | Principal
Amount (000)# | | | Value | |
CORPORATE BONDS (Continued) | | | | | | | | | | | | | | | | |
| | | | |
Healthcare-Services (cont’d.) | | | | | | | | | | | | | | | | |
Kaiser Foundation Hospitals, Gtd. Notes | | | 4.150 | % | | | 05/01/47 | | | | 20 | | | $ | 20,919 | |
Laboratory Corp. of America Holdings, Sr. Unsec’d. Notes | | | 4.700 | | | | 02/01/45 | | | | 25 | | | | 25,960 | |
Memorial Sloan-Kettering Cancer Center, Sr. Unsec’d. Notes | | | 5.000 | | | | 07/01/42 | | | | 25 | | | | 28,958 | |
New York and Presbyterian Hospital (The), Unsec’d. Notes | | | 4.024 | | | | 08/01/45 | | | | 20 | | | | 20,209 | |
NYU Hospitals Center, Sec’d. Notes | | | 4.368 | | | | 07/01/47 | | | | 15 | | | | 15,710 | |
Providence St. Joseph Health Obligated Group, Unsec’d. Notes | | | 2.746 | | | | 10/01/26 | | | | 50 | | | | 47,941 | |
UnitedHealth Group, Inc., Sr. Unsec’d. Notes | | | 2.875 | | | | 03/15/23 | | | | 135 | | | | 137,565 | |
| | | | | | | | | | | | | | | | |
| | | | | | | | | | | | | | | 609,559 | |
| | | | |
Insurance 1.1% | | | | | | | | | | | | | | | | |
American International Group, Inc., Sr. Unsec’d. Notes | | | 4.500 | | | | 07/16/44 | | | | 50 | | | | 51,727 | |
Arch Capital Finance LLC, Gtd. Notes | | | 4.011 | | | | 12/15/26 | | | | 5 | | | | 5,203 | |
Berkshire Hathaway, Inc., Sr. Unsec’d. Notes | | | 3.125 | | | | 03/15/26 | | | | 80 | | | | 81,524 | |
Chubb Corp. (The), Gtd. Notes | | | 6.000 | | | | 05/11/37 | | | | 30 | | | | 39,102 | |
Hartford Financial Services Group, Inc. (The),
Sr. Unsec’d. Notes | | | 5.500 | | | | 03/30/20 | | | | 65 | | | | 70,618 | |
MetLife, Inc., Sr. Unsec’d. Notes | | | 7.717 | | | | 02/15/19 | | | | 60 | | | | 65,405 | |
Travelers Cos., Inc. (The), Sr. Unsec’d. Notes | | | 4.600 | | | | 08/01/43 | | | | 15 | | | | 16,857 | |
| | | | | | | | | | | | | | | | |
| | | | | | | | | | | | | | | 330,436 | |
| | | | |
Lodging 0.1% | | | | | | | | | | | | | | | | |
Marriott International, Inc., Sr. Unsec’d. Notes | | | 3.125 | | | | 06/15/26 | | | | 45 | | | | 44,598 | |
| | | | |
Machinery-Construction & Mining 0.1% | | | | | | | | | | | | | | | | |
Caterpillar, Inc., Sr. Unsec’d. Notes | | | 2.600 | | | | 06/26/22 | | | | 45 | | | | 45,678 | |
| | | | |
Machinery-Diversified 0.3% | | | | | | | | | | | | | | | | |
John Deere Capital Corp., Sr. Unsec’d. Notes, MTN | | | 2.800 | | | | 03/06/23 | | | | 65 | | | | 66,165 | |
Xylem, Inc., Sr. Unsec’d. Notes | | | 3.250 | | | | 11/01/26 | | | | 35 | | | | 35,154 | |
| | | | | | | | | | | | | | | | |
| | | | | | | | | | | | | | | 101,319 | |
| | | | |
Media 1.4% | | | | | | | | | | | | | | | | |
21st Century Fox America, Inc., Gtd. Notes | | | 5.400 | | | | 10/01/43 | | | | 60 | | | | 69,578 | |
Charter Communications Operating LLC/Charter Communications Operating Capital, Sr. Sec’d. Notes | | | 6.484 | | | | 10/23/45 | | | | 50 | | | | 58,940 | |
Comcast Corp., Gtd. Notes | | | 4.600 | | | | 08/15/45 | | | | 65 | | | | 70,961 | |
Scripps Networks Interactive, Inc., Sr. Unsec’d. Notes | | | 3.500 | | | | 06/15/22 | | | | 50 | | | | 51,152 | |
Time Warner Cable LLC, Sr. Sec’d. Notes | | | 8.750 | | | | 02/14/19 | | | | 25 | | | | 27,507 | |
Time Warner, Inc., Gtd. Notes | | | 3.550 | | | | 06/01/24 | | | | 100 | | | | 102,231 | |
Viacom, Inc., Sr. Unsec’d. Notes | | | 5.850 | | | | 09/01/43 | | | | 10 | | | | 10,674 | |
Walt Disney Co. (The), Sr. Unsec’d. Notes | | | 2.750 | | | | 08/16/21 | | | | 50 | | | | 51,331 | |
| | | | | | | | | | | | | | | | |
| | | | | | | | | | | | | | | 442,374 | |
| | | | | | | | | | | | | | | | |
See Notes to Financial Statements.
| | | | | | | | | | | | | | | | |
| Description | | Interest
Rate | | | Maturity
Date | | | Principal
Amount (000)# | | | Value | |
CORPORATE BONDS (Continued) | |
| | | | |
Mining 0.2% | | | | | | | | | | | | | | | | |
Barrick North America Finance LLC (Canada), Gtd. Notes | | | 5.750 | % | | | 05/01/43 | | | | 5 | | | $ | 6,099 | |
BHP Billiton Finance USA Ltd. (Australia), Gtd. Notes | | | 5.000 | | | | 09/30/43 | | | | 10 | | | | 11,782 | |
Rio Tinto Finance USA Ltd. (United Kingdom), Gtd. Notes | | | 3.750 | | | | 06/15/25 | | | | 45 | | | | 47,715 | |
| | | | | | | | | | | | | | | | |
| | | | | | | | | | | | | | | 65,596 | |
| | | | |
Miscellaneous Manufacturing 0.8% | | | | | | | | | | | | | | | | |
General Electric Co., Sr. Unsec’d. Notes, GMTN | | | 3.100 | | | | 01/09/23 | | | | 235 | | | | 244,665 | |
| | | | |
Oil & Gas 2.0% | | | | | | | | | | | | | | | | |
Anadarko Petroleum Corp., Sr. Unsec’d. Notes | | | 5.550 | | | | 03/15/26 | | | | 15 | | | | 16,833 | |
Apache Corp., Sr. Unsec’d. Notes | | | 3.250 | | | | 04/15/22 | | | | 25 | | | | 25,509 | |
BP Capital Markets PLC (United Kingdom), Gtd. Notes | | | 3.245 | | | | 05/06/22 | | | | 60 | | | | 62,097 | |
Cenovus Energy, Inc. (Canada), Sr. Unsec’d. Notes, 144A | | | 5.250 | | | | 06/15/37 | | | | 10 | | | | 9,532 | |
Chevron Corp., Sr. Unsec’d. Notes | | | 1.961 | | | | 03/03/20 | | | | 150 | | | | 150,656 | |
ConocoPhillips Co., Gtd. Notes | | | 4.950 | | | | 03/15/26 | | | | 30 | | | | 33,792 | |
Devon Energy Corp., Sr. Unsec’d. Notes | | | 5.600 | | | | 07/15/41 | | | | 20 | | | | 21,754 | |
Encana Corp. (Canada), Sr. Unsec’d. Notes | | | 6.500 | | | | 08/15/34 | | | | 20 | | | | 23,031 | |
EOG Resources, Inc., Sr. Unsec’d. Notes | | | 3.900 | | | | 04/01/35 | | | | 25 | | | | 24,514 | |
Exxon Mobil Corp., Sr. Unsec’d. Notes | | | 4.114 | | | | 03/01/46 | | | | 20 | | | | 21,322 | |
Noble Energy, Inc., Sr. Unsec’d. Notes | | | 6.000 | | | | 03/01/41 | | | | 20 | | | | 22,572 | |
Occidental Petroleum Corp., Sr. Unsec’d. Notes | | | 3.125 | | | | 02/15/22 | | | | 40 | | | | 41,366 | |
Petroleos Mexicanos (Mexico),
Gtd. Notes, 144A | | | 6.500 | | | | 03/13/27 | | | | 15 | | | | 16,515 | |
Gtd. Notes, MTN | | | 4.250 | | | | 01/15/25 | | | | 40 | | | | 39,780 | |
Shell International Finance BV (Netherlands), Gtd. Notes | | | 2.125 | | | | 05/11/20 | | | | 125 | | | | 126,010 | |
| | | | | | | | | | | | | | | | |
| | | | | | | | | | | | | | | 635,283 | |
| | | | |
Oil & Gas Services 0.1% | | | | | | | | | | | | | | | | |
Halliburton Co., Sr. Unsec’d. Notes | | | 4.750 | | | | 08/01/43 | | | | 15 | | | | 15,683 | |
| | | | |
Pharmaceuticals 1.7% | | | | | | | | | | | | | | | | |
AbbVie, Inc., Sr. Unsec’d. Notes | | | 3.600 | | | | 05/14/25 | | | | 60 | | | | 61,836 | |
Allergan Funding SCS, Gtd. Notes | | | 4.750 | | | | 03/15/45 | | | | 21 | | | | 22,881 | |
GlaxoSmithkline Capital PLC (United Kingdom), Gtd. Notes | | | 2.850 | | | | 05/08/22 | | | | 45 | | | | 46,296 | |
Johnson & Johnson,
Sr. Unsec’d. Notes | | | 2.450 | | | | 03/01/26 | | | | 25 | | | | 24,589 | |
Sr. Unsec’d. Notes | | | 3.625 | | | | 03/03/37 | | | | 20 | | | | 20,772 | |
McKesson Corp., Sr. Unsec’d. Notes | | | 6.000 | | | | 03/01/41 | | | | 10 | | | | 12,398 | |
Merck & Co., Inc., Sr. Unsec’d. Notes | | | 2.400 | | | | 09/15/22 | | | | 100 | | | | 101,275 | |
Novartis Capital Corp. (Switzerland), Gtd. Notes | | | 4.400 | | | | 05/06/44 | | | | 40 | | | | 44,704 | |
Pfizer, Inc., Sr. Unsec’d. Notes | | | 3.000 | | | | 12/15/26 | | | | 35 | | | | 35,428 | |
Shire Acquisitions Investments Ireland DAC, Gtd. Notes | | | 2.875 | | | | 09/23/23 | | | | 65 | | | | 64,879 | |
Teva Pharmaceutical Finance Netherlands III BV
(Israel), Gtd. Notes | | | 2.800 | | | | 07/21/23 | | | | 65 | | | | 63,795 | |
Wyeth LLC, Gtd. Notes | | | 6.450 | | | | 02/01/24 | | | | 35 | | | | 42,531 | |
| | | | | | | | | | | | | | | | |
| | | | | | | | | | | | | | | 541,384 | |
See Notes to Financial Statements.
| | | | |
| Prudential Day One Underlying Funds | | | 47 | |
Prudential Core Conservative Bond Fund
Schedule of Investments (continued)
as of July 31, 2017
| | | | | | | | | | | | | | | | |
| Description | | Interest
Rate | | | Maturity
Date | | | Principal
Amount (000)# | | | Value | |
CORPORATE BONDS (Continued) | |
| | | | |
Pipelines 0.8% | | | | | | | | | | | | | | | | |
Energy Transfer LP, Sr. Unsec’d. Notes | | | 4.900 | % | | | 03/15/35 | | | | 30 | | | $ | 29,537 | |
Enterprise Products Operating LLC, Gtd. Notes | | | 3.750 | | | | 02/15/25 | | | | 80 | | | | 83,168 | |
Kinder Morgan Energy Partners LP, Gtd. Notes | | | 5.950 | | | | 02/15/18 | | | | 50 | | | | 51,070 | |
MPLX LP, Sr. Unsec’d. Notes | | | 4.500 | | | | 07/15/23 | | | | 20 | | | | 21,331 | |
ONEOK Partners LP, Gtd. Notes | | | 3.375 | | | | 10/01/22 | | | | 35 | | | | 35,488 | |
ONEOK, Inc., Gtd. Notes | | | 4.950 | | | | 07/13/47 | | | | 10 | | | | 10,029 | |
Williams Partners LP, Sr. Unsec’d. Notes | | | 3.750 | | | | 06/15/27 | | | | 30 | | | | 29,992 | |
| | | | | | | | | | | | | | | | |
| | | | | | | | | | | | | | | 260,615 | |
| | | | |
Real Estate Investment Trusts (REITs) 0.3% | | | | | | | | | | | | | | | | |
Boston Properties LP, Sr. Unsec’d. Notes | | | 3.850 | | | | 02/01/23 | | | | 20 | | | | 21,208 | |
Realty Income Corp., Sr. Unsec’d. Notes | | | 3.000 | | | | 01/15/27 | | | | 20 | | | | 19,063 | |
Simon Property Group LP, Sr. Unsec’d. Notes | | | 3.250 | | | | 11/30/26 | | | | 35 | | | | 35,160 | |
Ventas Realty LP, Gtd. Notes | | | 3.850 | | | | 04/01/27 | | | | 15 | | | | 15,237 | |
| | | | | | | | | | | | | | | | |
| | | | | | | | | | | | | | | 90,668 | |
| | | | |
Retail 0.8% | | | | | | | | | | | | | | | | |
CVS Health Corp., Sr. Unsec’d. Notes | | | 5.125 | | | | 07/20/45 | | | | 15 | | | | 17,213 | |
Home Depot, Inc. (The), Sr. Unsec’d. Notes | | | 3.750 | | | | 02/15/24 | | | | 125 | | | | 133,429 | |
Lowe’s Cos., Inc., Sr. Unsec’d. Notes | | | 3.100 | | | | 05/03/27 | | | | 20 | | | | 20,078 | |
McDonald’s Corp.,
Sr. Unsec’d. Notes, MTN | | | 2.625 | | | | 01/15/22 | | | | 45 | | | | 45,590 | |
Sr. Unsec’d. Notes, MTN | | | 4.700 | | | | 12/09/35 | | | | 25 | | | | 27,724 | |
Wal-Mart Stores, Inc., Sr. Unsec’d. Notes | | | 4.300 | | | | 04/22/44 | | | | 20 | | | | 22,222 | |
| | | | | | | | | | | | | | | | |
| | | | | | | | | | | | | | | 266,256 | |
| | | | |
Software 1.5% | | | | | | | | | | | | | | | | |
Fidelity National Information Services, Inc., Gtd. Notes | | | 3.875 | | | | 06/05/24 | | | | 10 | | | | 10,487 | |
Fiserv, Inc., Sr. Unsec’d. Notes | | | 3.850 | | | | 06/01/25 | | | | 35 | | | | 36,765 | |
Microsoft Corp.,
Sr. Unsec’d. Notes | | | 2.875 | | | | 02/06/24 | | | | 220 | | | | 225,037 | |
Sr. Unsec’d. Notes | | | 4.100 | | | | 02/06/37 | | | | 10 | | | | 10,775 | |
Oracle Corp.,
Sr. Unsec’d. Notes | | | 2.650 | | | | 07/15/26 | | | | 130 | | | | 126,650 | |
Sr. Unsec’d. Notes | | | 2.950 | | | | 05/15/25 | | | | 50 | | | | 50,542 | |
| | | | | | | | | | | | | | | | |
| | | | | | | | | | | | | | | 460,256 | |
| | | | |
Telecommunications 1.2% | | | | | | | | | | | | | | | | |
AT&T, Inc.,
Sr. Unsec’d. Notes | | | 3.600 | | | | 02/17/23 | | | | 130 | | | | 134,475 | |
Sr. Unsec’d. Notes | | | 4.750 | | | | 05/15/46 | | | | 75 | | | | 72,020 | |
Sr. Unsec’d. Notes | | | 5.300 | | | | 08/14/58 | | | | 2 | | | | 2,000 | |
British Telecommunications PLC (United Kingdom),
Sr. Unsec’d. Notes | | | 9.125 | | | | 12/15/30 | | | | 25 | | | | 38,224 | |
Cisco Systems, Inc., Sr. Unsec’d. Notes | | | 2.900 | | | | 03/04/21 | | | | 60 | | | | 61,913 | |
Verizon Communications, Inc., Sr. Unsec’d. Notes | | | 4.522 | | | | 09/15/48 | | | | 78 | | | | 72,461 | |
| | | | | | | | | | | | | | | | |
| | | | | | | | | | | | | | | 381,093 | |
See Notes to Financial Statements.
| | | | | | | | | | | | | | | | |
| Description | | Interest
Rate | | | Maturity
Date | | | Principal
Amount (000)# | | | Value | |
CORPORATE BONDS (Continued) | |
| | | | |
Textiles 0.1% | | | | | | | | | | | | | | | | |
Cintas Corp. No 2, Gtd. Notes | | | 3.700 | % | | | 04/01/27 | | | | 20 | | | $ | 20,916 | |
| | | | |
Transportation 0.5% | | | | | | | | | | | | | | | | |
Burlington Northern Santa Fe LLC, Sr. Unsec’d. Notes | | | 3.750 | | | | 04/01/24 | | | | 75 | | | | 79,901 | |
Norfolk Southern Corp., Sr. Unsec’d. Notes | | | 5.900 | | | | 06/15/19 | | | | 45 | | | | 48,333 | |
Union Pacific Corp., Sr. Unsec’d. Notes | | | 3.000 | | | | 04/15/27 | | | | 20 | | | | 20,105 | |
| | | | | | | | | | | | | | | | |
| | | | | | | | | | | | | | | 148,339 | |
| | | | | | | | | | | | | | | | |
TOTAL CORPORATE BONDS
(cost $8,943,024) | | | | | | | | | | | | | | | 9,075,622 | |
| | | | | | | | | | | | | | | | |
| | | | |
FOREIGN GOVERNMENT BONDS 0.7% | | | | | | | | | | | | | | | | |
Chile Government International Bond (Chile),
Sr. Unsec’d. Notes | | | 3.250 | | | | 09/14/21 | | | | 100 | | | | 104,190 | |
Mexico Government International Bond (Mexico),
Sr. Unsec’d. Notes, MTN | | | 4.750 | | | | 03/08/44 | | | | 76 | | | | 76,912 | |
Province of Quebec (Canada), Deb. Notes | | | 7.125 | | | | 02/09/24 | | | | 40 | | | | 49,941 | |
| | | | | | | | | | | | | | | | |
TOTAL FOREIGN GOVERNMENT BONDS
(cost $223,439) | | | | | | | | | | | | | | | 231,043 | |
| | | | | | | | | | | | | | | | |
|
| |
MUNICIPAL BONDS 1.2% | | | | | | | | | | | | | | | | |
| | | | |
Arizona 0.1% | | | | | | | | | | | | | | | | |
Salt River Project Agricultural Improvement & Power District, Revenue Bonds, BABs | | | 4.839 | | | | 01/01/41 | | | | 20 | | | | 23,477 | |
| | | | |
California 0.4% | | | | | | | | | | | | | | | | |
Los Angeles Department of Water & Power System Revenue, Revenue Bonds, BABs | | | 5.716 | | | | 07/01/39 | | | | 20 | | | | 25,662 | |
State of California, General Obligation Unlimited, BABs | | | 7.550 | | | | 04/01/39 | | | | 65 | | | | 100,635 | |
| | | | | | | | | | | | | | | | |
| | | | | | | | | | | | | | | 126,297 | |
| | | | |
Maryland 0.2% | | | | | | | | | | | | | | | | |
Maryland State Transportation Authority,
Revenue Bonds, BABs | | | 5.888 | | | | 07/01/43 | | | | 40 | | | | 52,106 | |
| | | | |
New Jersey 0.2% | | | | | | | | | | | | | | | | |
New Jersey Turnpike Authority, Revenue Bonds,
Series F, BABs | | | 7.414 | | | | 01/01/40 | | | | 50 | | | | 75,604 | |
| | | | |
New York 0.2% | | | | | | | | | | | | | | | | |
New York City Water & Sewer System, Revenue Bonds, BABs | | | 5.882 | | | | 06/15/44 | | | | 20 | | | | 27,456 | |
Port Authority of New York & New Jersey, Revenue Bonds | | | 4.960 | | | | 08/01/46 | | | | 20 | | | | 23,963 | |
| | | | | | | | | | | | | | | | |
| �� | | | | | | | | | | | | | | 51,419 | |
See Notes to Financial Statements.
| | | | |
| Prudential Day One Underlying Funds | | | 49 | |
Prudential Core Conservative Bond Fund
Schedule of Investments (continued)
as of July 31, 2017
| | | | | | | | | | | | | | | | |
| Description | | Interest
Rate | | | Maturity
Date | | | Principal
Amount (000)# | | | Value | |
MUNICIPAL BONDS (Continued) | |
| | | | |
Ohio 0.0% | | | | | | | | | | | | | | | | |
Ohio State University (The), Revenue Bonds | | | 4.048 | % | | | 12/01/56 | | | | 12 | | | $ | 12,146 | |
| | | | | | | | | | | | | | | | |
| | | | |
Texas 0.1% | | | | | | | | | | | | | | | | |
City of San Antonio TX Electric & Gas Systems Revenue, Revenue Bonds, BABs | | | 5.718 | | | | 02/01/41 | | | | 20 | | | | 25,348 | |
| | | | | | | | | | | | | | | | |
TOTAL MUNICIPAL BONDS
(cost $351,255) | | | | | | | | | | | | | | | 366,397 | |
| | | | | | | | | | | | | | | | |
| | | | |
U.S. GOVERNMENT AGENCY OBLIGATIONS 27.9% | | | | | | | | | | | | | | | | |
Federal Home Loan Mortgage Corp. | | | 1.375 | | | | 08/15/19 | | | | 105 | | | | 104,890 | |
Federal Home Loan Mortgage Corp. | | | 1.375 | | | | 04/20/20 | | | | 75 | | | | 74,662 | |
Federal Home Loan Mortgage Corp. | | | 1.500 | | | | 01/17/20 | | | | 70 | | | | 70,018 | |
Federal Home Loan Mortgage Corp. | | | 3.000 | | | | 12/01/42 | | | | 228 | | | | 229,650 | |
Federal Home Loan Mortgage Corp. | | | 3.000 | | | | 01/01/47 | | | | 146 | | | | 146,211 | |
Federal Home Loan Mortgage Corp. | | | 3.500 | | | | TBA | | | | 250 | | | | 257,559 | |
Federal Home Loan Mortgage Corp. | | | 3.500 | | | | 06/01/42 | | | | 82 | | | | 85,040 | |
Federal Home Loan Mortgage Corp. | | | 4.000 | | | | TBA | | | | 250 | | | | 263,320 | |
Federal National Mortgage Assoc. | | | 1.875 | | | | 09/24/26 | | | | 115 | | | | 109,717 | |
Federal National Mortgage Assoc. | | | 2.500 | | | | 11/01/31 | | | | 479 | | | | 483,633 | |
Federal National Mortgage Assoc. | | | 3.000 | | | | TBA | | | | 500 | | | | 514,316 | |
Federal National Mortgage Assoc. | | | 3.000 | | | | 12/01/36 | | | | 99 | | | | 100,792 | |
Federal National Mortgage Assoc. | | | 3.000 | | | | 10/01/42 | | | | 37 | | | | 37,377 | |
Federal National Mortgage Assoc. | | | 3.000 | | | | 02/01/43 | | | | 476 | | | | 479,523 | |
Federal National Mortgage Assoc. | | | 3.000 | | | | 04/01/43 | | | | 156 | | | | 156,963 | |
Federal National Mortgage Assoc. | | | 3.500 | | | | TBA | | | | 250 | | | | 257,383 | |
Federal National Mortgage Assoc. | | | 3.500 | | | | 08/01/31 | | | | 92 | | | | 95,878 | |
Federal National Mortgage Assoc. | | | 3.500 | | | | 03/01/42 | | | | 233 | | | | 241,252 | |
Federal National Mortgage Assoc. | | | 3.500 | | | | 11/01/42 | | | | 130 | | | | 134,570 | |
Federal National Mortgage Assoc. | | | 3.500 | | | | 08/01/43 | | | | 194 | | | | 200,725 | |
Federal National Mortgage Assoc. | | | 3.500 | | | | 03/01/45 | | | | 455 | | | | 468,247 | |
Federal National Mortgage Assoc. | | | 4.000 | | | | 01/01/41 | | | | 420 | | | | 443,861 | |
Federal National Mortgage Assoc. | | | 4.000 | | | | 04/01/41 | | | | 216 | | | | 228,738 | |
Federal National Mortgage Assoc. | | | 4.500 | | | | 02/01/44 | | | | 249 | | | | 267,440 | |
Federal National Mortgage Assoc. | | | 4.500 | | | | 01/01/45 | | | | 250 | | | | 268,444 | |
Federal National Mortgage Assoc. | | | 5.000 | | | | TBA | | | | 250 | | | | 273,301 | |
Federal National Mortgage Assoc. | | | 5.000 | | | | 06/01/40 | | | | 69 | | | | 75,141 | |
Federal National Mortgage Assoc. | | | 5.000 | | | | 03/01/42 | | | | 130 | | | | 142,513 | |
Government National Mortgage Assoc. | | | 3.000 | | | | 01/20/43 | | | | 233 | | | | 237,583 | |
Government National Mortgage Assoc. | | | 3.000 | | | | 07/20/46 | | | | 245 | | | | 249,222 | |
Government National Mortgage Assoc. | | | 3.000 | | | | 09/20/46 | | | | 243 | | | | 246,822 | |
Government National Mortgage Assoc. | | | 3.500 | | | | 12/20/42 | | | | 469 | | | | 489,860 | |
See Notes to Financial Statements.
| | | | | | | | | | | | | | | | |
| Description | | Interest
Rate | | | Maturity
Date | | | Principal
Amount (000)# | | | Value | |
U.S. GOVERNMENT AGENCY OBLIGATIONS (Continued) | |
Government National Mortgage Assoc. | | | 3.500 | % | | | 04/20/45 | | | | 114 | | | $ | 118,262 | |
Government National Mortgage Assoc. | | | 3.500 | | | | 07/20/46 | | | | 394 | | | | 410,052 | |
Government National Mortgage Assoc. | | | 4.000 | | | | TBA | | | | 250 | | | | 262,861 | |
Government National Mortgage Assoc. | | | 4.000 | | | | 12/20/45 | | | | 297 | | | | 312,478 | |
Government National Mortgage Assoc. | | | 4.500 | | | | 04/20/41 | | | | 50 | | | | 54,024 | |
Government National Mortgage Assoc. | | | 4.500 | | | | 12/20/44 | | | | 122 | | | | 130,044 | |
Government National Mortgage Assoc. | | | 5.500 | | | | 12/15/33 | | | | 31 | | | | 34,927 | |
| | | | | | | | | | | | | | | | |
TOTAL U.S. GOVERNMENT AGENCY OBLIGATIONS
(cost $8,717,290) | | | | | | | | | | | | | | | 8,757,299 | |
| | | | | | | | | | | | | | | | |
| | | | |
U.S. TREASURY OBLIGATIONS 37.9% | | | | | | | | | | | | | | | | |
U.S. Treasury Bonds | | | 2.875 | | | | 05/15/43 | | | | 625 | | | | 624,805 | |
U.S. Treasury Bonds | | | 3.000 | | | | 05/15/45 | | | | 790 | | | | 805,862 | |
U.S. Treasury Bonds | | | 3.000 | | | | 02/15/47 | | | | 25 | | | | 25,480 | |
U.S. Treasury Bonds | | | 3.625 | | | | 08/15/43 | | | | 155 | | | | 176,603 | |
U.S. Treasury Bonds | | | 4.250 | | | | 11/15/40 | | | | 250 | | | | 311,768 | |
U.S. Treasury Bonds | | | 4.625 | | | | 02/15/40 | | | | 175 | | | | 229,038 | |
U.S. Treasury Bonds | | | 8.000 | | | | 11/15/21 | | | | 55 | | | | 69,199 | |
U.S. Treasury Notes | | | 0.750 | | | | 10/31/18 | | | | 245 | | | | 243,411 | |
U.S. Treasury Notes | | | 1.000 | | | | 11/15/19 | | | | 170 | | | | 168,499 | |
U.S. Treasury Notes | | | 1.250 | | | | 11/30/18 | | | | 830 | | | | 829,546 | |
U.S. Treasury Notes | | | 1.250 | | | | 12/31/18 | | | | 785 | | | | 784,479 | |
U.S. Treasury Notes | | | 1.375 | | | | 04/30/21 | | | | 410 | | | | 405,660 | |
U.S. Treasury Notes | | | 1.375 | | | | 05/31/21 | | | | 165 | | | | 163,118 | |
U.S. Treasury Notes | | | 1.500 | | | | 01/31/19 | | | | 1,195 | | | | 1,198,360 | |
U.S. Treasury Notes | | | 1.500 | | | | 10/31/19 | | | | 300 | | | | 300,797 | |
U.S. Treasury Notes | | | 1.500 | | | | 07/15/20 | | | | 500 | | | | 499,942 | |
U.S. Treasury Notes | | | 1.625 | | | | 04/30/19 | | | | 685 | | | | 688,318 | |
U.S. Treasury Notes | | | 1.625 | | | | 06/30/20 | | | | 790 | | | | 792,747 | |
U.S. Treasury Notes | | | 1.625 | | | | 04/30/23 | | | | 195 | | | | 191,466 | |
U.S. Treasury Notes | | | 1.750 | | | | 05/15/23 | | | | 5 | | | | 4,941 | |
U.S. Treasury Notes | | | 1.875 | | | | 07/31/22 | | | | 240 | | | | 240,478 | |
U.S. Treasury Notes | | | 2.000 | | | | 11/30/20 | | | | 715 | | | | 724,608 | |
U.S. Treasury Notes | | | 2.000 | | | | 11/30/22 | | | | 320 | | | | 321,612 | |
U.S. Treasury Notes | | | 2.125 | | | | 06/30/21 | | | | 170 | | | | 172,809 | |
U.S. Treasury Notes | | | 2.125 | | | | 09/30/21 | | | | 75 | | | | 76,178 | |
U.S. Treasury Notes | | | 2.125 | | | | 06/30/22 | | | | 120 | | | | 121,608 | |
U.S. Treasury Notes | | | 2.125 | | | | 12/31/22 | | | | 150 | | | | 151,617 | |
U.S. Treasury Notes | | | 2.125 | | | | 07/31/24 | | | | 195 | | | | 195,236 | |
U.S. Treasury Notes | | | 2.125 | | | | 05/15/25 | | | | 270 | | | | 268,935 | |
U.S. Treasury Notes | | | 2.250 | | | | 11/15/25 | | | | 340 | | | | 340,770 | |
See Notes to Financial Statements.
| | | | |
| Prudential Day One Underlying Funds | | | 51 | |
Prudential Core Conservative Bond Fund
Schedule of Investments (continued)
as of July 31, 2017
| | | | | | | | | | | | | | | | |
| Description | | Interest
Rate | | | Maturity
Date | | | Principal
Amount (000)# | | | Value | |
U.S. TREASURY OBLIGATIONS (Continued) | |
U.S. Treasury Notes | | | 2.375 | % | | | 08/15/24 | | | | 40 | | | $ | 40,708 | |
U.S. Treasury Notes | | | 2.375 | | | | 05/15/27 | | | | 35 | | | | 35,250 | |
U.S. Treasury Notes | | | 2.625 | | | | 11/15/20 | | | | 670 | | | | 692,377 | |
| | | | | | | | | | | | | | | | |
TOTAL U.S. TREASURY OBLIGATIONS
(cost $11,867,902) | | | | | | | | | | | | | | | 11,896,225 | |
| | | | | | | | | | | | | | | | |
TOTAL LONG-TERM INVESTMENTS
(cost $30,890,509) | | | | | | | | | | | | | | | 31,127,597 | |
| | | | | | | | | | | | | | | | |
| | | | |
SHORT-TERM INVESTMENT 11.3% | | | | | | | | | | | | | | | | |
| | | | |
| | | | | | | | | Shares | | | | |
| | | | |
AFFILIATED MUTUAL FUND | | | | | | | | | | | | | | | | |
Prudential Investment Portfolios 2 - Prudential Core Ultra Short Bond Fund
(cost $3,545,327)(w) | | | | | | | | | | | 3,545,327 | | | | 3,545,327 | |
| | | | | | | | | | | | | | | | |
| | | | |
TOTAL INVESTMENTS 110.6%
(cost $34,435,836) | | | | | | | | | | | | | | | 34,672,924 | |
Liabilities in excess of other assets (10.6)% | | | | | | | | | | | | | | | (3,315,471 | ) |
| | | | | | | | | | | | | | | | |
NET ASSETS 100.0% | | | | | | | | | | | | | | $ | 31,357,453 | |
| | | | | | | | | | | | | | | | |
See the Glossary for abbreviations used in the annual report.
| # | Principal amount is shown in U.S. dollars unless otherwise stated. |
| (c) | Variable rate instrument. The interest rate shown reflects the rate in effect at July 31, 2017. |
| (w) | PGIM Investments LLC, the manager of the Fund, also serves as manager of the Prudential Investment Portfolios 2—Prudential Core Ultra Short Bond Fund. |
Fair Value Measurements:
Various inputs are used in determining the value of the Fund’s investments. These inputs are summarized in the three broad levels listed below.
Level 1—unadjusted quoted prices generally in active markets for identical securities.
Level 2—quoted prices for similar securities, interest rates and yield curves, prepayment speeds, foreign currency exchange rates and other observable inputs.
Level 3—unobservable inputs for securities valued in accordance with Board approved fair valuation procedures.
See Notes to Financial Statements.
The following is a summary of the inputs used as of July 31, 2017 in valuing such portfolio securities:
| | | | | | | | | | | | |
| | | Level 1 | | | Level 2 | | | Level 3 | |
Investments in Securities | | | | | | | | | | | | |
Commercial Mortgage-Backed Securities | | $ | — | | | $ | 801,011 | | | $ | — | |
Corporate Bonds | | | — | | | | 9,075,622 | | | | — | |
Foreign Government Bonds | | | — | | | | 231,043 | | | | — | |
Municipal Bonds | | | — | | | | 366,397 | | | | — | |
U.S. Government Agency Obligations | | | — | | | | 8,757,299 | | | | — | |
U.S. Treasury Obligations | | | — | | | | 11,896,225 | | | | — | |
Affiliated Mutual Fund | | | 3,545,327 | | | | — | | | | — | |
| | | | | | | | | | | | |
Total | | $ | 3,545,327 | | | $ | 31,127,597 | | | $ | — | |
| | | | | | | | | | | | |
During the period, there were no transfers between Level 1, Level 2 and Level 3 to report.
Industry Classification:
The industry classification of investments and liabilities in excess of other assets shown as a percentage of net assets as of July 31, 2017 were as follows (unaudited):
| | | | |
U.S. Treasury Obligations | | | 37.9 | % |
U.S. Government Agency Obligations | | | 27.9 | |
Affiliated Mutual Fund | | | 11.3 | |
Banks | | | 5.2 | |
Commercial Mortgage-Backed Securities | | | 2.6 | |
Oil & Gas | | | 2.0 | |
Healthcare-Services | | | 1.9 | |
Pharmaceuticals | | | 1.7 | |
Electric | | | 1.7 | |
Software | | | 1.5 | |
Media | | | 1.4 | |
Computers | | | 1.3 | |
Telecommunications | | | 1.2 | |
Municipal Bonds | | | 1.2 | |
Insurance | | | 1.1 | |
Healthcare-Products | | | 0.9 | |
Retail | | | 0.8 | |
Pipelines | | | 0.8 | |
Beverages | | | 0.8 | |
Miscellaneous Manufacturing | | | 0.8 | |
Biotechnology | | | 0.8 | |
Foreign Government Bonds | | | 0.7 | |
Chemicals | | | 0.7 | % |
Auto Manufacturers | | | 0.7 | |
Transportation | | | 0.5 | |
Forest Products & Paper | | | 0.4 | |
Diversified Financial Services | | | 0.4 | |
Agriculture | | | 0.4 | |
Machinery-Diversified | | | 0.3 | |
Real Estate Investment Trusts (REITs) | | | 0.3 | |
Aerospace & Defense | | | 0.2 | |
Mining | | | 0.2 | |
Gas | | | 0.2 | |
Foods | | | 0.2 | |
Machinery-Construction & Mining | | | 0.1 | |
Lodging | | | 0.1 | |
Airlines | | | 0.1 | |
Textiles | | | 0.1 | |
Commercial Services | | | 0.1 | |
Oil & Gas Services | | | 0.1 | |
| | | | |
| | | 110.6 | |
Liabilities in excess of other assets | | | (10.6 | ) |
| | | | |
| | | 100.0 | % |
| | | | |
See Notes to Financial Statements.
| | | | |
| Prudential Day One Underlying Funds | | | 53 | |
Prudential TIPS Fund
Schedule of Investments
as of July 31, 2017
| | | | | | | | | | | | | | | | |
| Description | | Interest
Rate | | | Maturity
Date | | | Principal
Amount (000)# | | | Value | |
LONG-TERM INVESTMENTS 99.5% | | | | | | | | | | | | | | | | |
| | | | |
U.S. TREASURY OBLIGATIONS | | | | | | | | | | | | | | | | |
U.S. Treasury Inflation Indexed Bonds, TIPS | | | 0.125 | % | | | 04/15/21 | | | | 595 | | | $ | 615,411 | |
U.S. Treasury Inflation Indexed Bonds, TIPS | | | 0.125 | | | | 04/15/19 | | | | 810 | | | | 847,121 | |
U.S. Treasury Inflation Indexed Bonds, TIPS | | | 0.125 | | | | 04/15/20 | | | | 845 | | | | 886,364 | |
U.S. Treasury Inflation Indexed Bonds, TIPS | | | 0.125 | | | | 01/15/22 | | | | 2,085 | | | | 2,260,011 | |
U.S. Treasury Inflation Indexed Bonds, TIPS | | | 0.125 | | | | 01/15/23 | | | | 825 | | | | 871,309 | |
U.S. Treasury Inflation Indexed Bonds, TIPS | | | 0.250 | | | | 01/15/25 | | | | 370 | | | | 377,712 | |
U.S. Treasury Inflation Indexed Bonds, TIPS | | | 0.375 | | | | 01/15/27 | | | | 640 | | | | 639,860 | |
U.S. Treasury Inflation Indexed Bonds, TIPS | | | 0.625 | | | | 01/15/24 | | | | 810 | | | | 866,433 | |
U.S. Treasury Inflation Indexed Bonds, TIPS | | | 0.625 | | | | 01/15/26 | | | | 480 | | | | 500,143 | |
U.S. Treasury Inflation Indexed Bonds, TIPS | | | 0.750 | | | | 02/15/42 | | | | 270 | | | | 277,504 | |
U.S. Treasury Inflation Indexed Bonds, TIPS | | | 0.750 | | | | 02/15/45 | | | | 200 | | | | 194,466 | |
U.S. Treasury Inflation Indexed Bonds, TIPS | | | 1.000 | | | | 02/15/46 | | | | 320 | | | | 329,092 | |
U.S. Treasury Inflation Indexed Bonds, TIPS | | | 1.125 | | | | 01/15/21 | | | | 505 | | | | 587,704 | |
U.S. Treasury Inflation Indexed Bonds, TIPS | | | 1.375 | | | | 01/15/20 | | | | 550 | | | | 645,443 | |
U.S. Treasury Inflation Indexed Bonds, TIPS | | | 1.375 | | | | 02/15/44 | | | | 745 | | | | 848,684 | |
U.S. Treasury Inflation Indexed Bonds, TIPS | | | 1.750 | | | | 01/15/28 | | | | 100 | | | | 130,872 | |
U.S. Treasury Inflation Indexed Bonds, TIPS | | | 2.000 | | | | 01/15/26 | | | | 430 | | | | 596,768 | |
U.S. Treasury Inflation Indexed Bonds, TIPS | | | 2.125 | | | | 01/15/19 | | | | 45 | | | | 52,912 | |
U.S. Treasury Inflation Indexed Bonds, TIPS | | | 2.125 | | | | 02/15/40 | | | | 85 | | | | 119,534 | |
U.S. Treasury Inflation Indexed Bonds, TIPS | | | 2.125 | | | | 02/15/41 | | | | 150 | | | | 209,017 | |
U.S. Treasury Inflation Indexed Bonds, TIPS | | | 2.375 | | | | 01/15/25 | | | | 1,500 | | | | 2,227,943 | |
U.S. Treasury Inflation Indexed Bonds, TIPS | | | 2.375 | | | | 01/15/27 | | | | 270 | | | | 383,464 | |
U.S. Treasury Inflation Indexed Bonds, TIPS | | | 2.500 | | | | 01/15/29 | | | | 105 | | | | 144,617 | |
U.S. Treasury Inflation Indexed Bonds, TIPS | | | 3.625 | | | | 04/15/28 | | | | 280 | | | | 555,546 | |
U.S. Treasury Inflation Indexed Bonds, TIPS | | | 3.875 | | | | 04/15/29 | | | | 375 | | | | 760,396 | |
| | | | | | | | | | | | | | | | |
TOTAL LONG-TERM INVESTMENTS
(cost $15,915,537) | | | | | | | | | | | | | | | 15,928,326 | |
| | | | | | | | | | | | | | | | |
| | | | | | | | | Shares | | | | |
| | | | |
SHORT-TERM INVESTMENT 0.5% | | | | | | | | | | | | | | | | |
| | | | |
AFFILIATED MUTUAL FUND | | | | | | | | | | | | | | | | |
Prudential Investment Portfolios 2 - Prudential Core Ultra Short Bond Fund(w)
(cost $80,331) | | | | | | | | | | | 80,331 | | | | 80,331 | |
| | | | | | | | | | | | | | | | |
TOTAL INVESTMENTS 100.0%
(cost $15,995,868) | | | | | | | | | | | | | | | 16,008,657 | |
Other assets in excess of liabilities 0.0% | | | | | | | | | | | | | | | 2,094 | |
| | | | | | | | | | | | | | | | |
NET ASSETS 100.0% | | | | | | | | | | | | | | $ | 16,010,751 | |
| | | | | | | | | | | | | | | | |
See the Glossary for abbreviations used in the annual report.
| # | Principal amount is shown in U.S. dollars unless otherwise stated. |
| (w) | PGIM Investments LLC, the manager of the Fund, also serves as manager of the Prudential Investment Portfolios 2 - Prudential Core Ultra Short Bond Fund. |
See Notes to Financial Statements.
Fair Value Measurements:
Various inputs are used in determining the value of the Fund’s investments. These inputs are summarized in the three broad levels listed below.
Level 1—unadjusted quoted prices generally in active markets for identical securities.
Level 2—quoted prices for similar securities, interest rates and yield curves, prepayment speeds, foreign currency exchange rates and other observable inputs.
Level 3—unobservable inputs for securities valued in accordance with Board approved fair valuation procedures.
The following is a summary of the inputs used as of July 31, 2017 in valuing such portfolio securities:
| | | | | | | | | | | | |
| | | Level 1 | | | Level 2 | | | Level 3 | |
Investments in Securities | | | | | | | | | | | | |
U.S. Treasury Obligations | | $ | — | | | $ | 15,928,326 | | | $ | — | |
Affiliated Mutual Fund | | | 80,331 | | | | — | | | | — | |
| | | | | | | | | | | | |
Total | | $ | 80,331 | | | $ | 15,928,326 | | | $ | — | |
| | | | | | | | | | | | |
During the period, there were no transfers between Level 1, Level 2 and Level 3 to report.
Sector Allocations:
The sector allocations of investments and other assets in excess of liabilities shown as a percentage of net assets as of July 31, 2017 were as follows (unaudited):
| | | | |
U.S. Treasury Obligations | | | 99.5 | % |
Affiliated Mutual Fund | | | 0.5 | |
| | | | |
| | | 100.0 | |
Other assets in excess of liabilities | | | 0.0 | * |
| | | | |
| | | 100.0 | % |
| | | | |
See Notes to Financial Statements.
| | | | |
| Prudential Day One Underlying Funds | | | 55 | |
Prudential Commodity Strategies Fund
Consolidated Schedule of Investments
as of July 31, 2017
| | | | | | | | | | | | | | |
| Description | | Interest
Rate | | | Maturity
Date | | Principal
Amount (000)# | | | Value | |
SHORT-TERM INVESTMENTS 99.9% | |
|
U.S. TREASURY OBLIGATIONS(n) 80.3% | |
U.S. Treasury Bills | | | 0.977 | % | | 09/07/17 | | | 1,100 | | | $ | 1,098,907 | |
U.S. Treasury Bills(cc)(k) | | | 0.912 | | | 08/24/17 | | | 800 | | | | 799,503 | |
U.S. Treasury Bills | | | 0.957 | | | 08/31/17 | | | 6,800 | | | | 6,794,608 | |
U.S. Treasury Bills(cc)(k) | | | 1.023 | | | 10/12/17 | | | 1,000 | | | | 997,839 | |
U.S. Treasury Bills | | | 1.025 | | | 10/05/17 | | | 500 | | | | 499,052 | |
U.S. Treasury Bills | | | 1.138 | | | 10/26/17 | | | 900 | | | | 897,689 | |
| | | | | | | | | | | | | | |
TOTAL U.S. TREASURY OBLIGATIONS
(cost $11,087,618) | | | | 11,087,598 | |
| | | | | | | | | | | | | | |
| | | | |
| | | | | | | | Shares | | | | |
|
UNAFFILIATED FUND 19.6% | |
Dreyfus Treasury Securities Cash Management(cc)
(cost $2,715,423) | | | 2,715,423 | | | | 2,715,423 | |
| | | | | | | | | | | | | | |
TOTAL INVESTMENTS 99.9%
(cost $13,803,041) | | | | 13,803,021 | |
Other assets in excess of liabilities(z) 0.1% | | | | 8,283 | |
| | | | | | | | | | | | | | |
NET ASSETS 100.0% | | | $ | 13,811,304 | |
| | | | | | | | | | | | | | |
See the Glossary for abbreviations used in the annual report.
| # | Principal amount is shown in U.S. dollars unless otherwise stated. |
| (cc) | Represents security, or a portion thereof, held in the Cayman Subsidiary. |
| (k) | Represents security, or a portion thereof, segregated as collateral for futures contracts. |
| (n) | Rate shown is the effective yield at purchase date. |
| (z) | Includes net unrealized appreciation (depreciation) on the following derivative contracts held at reporting period end: |
Commodity futures contracts outstanding at July 31, 2017(1):
| | | | | | | | | | | | | | | | | | | | |
Number of
Contracts | | | Type | | Expiration
Date | | | Value at
Trade Date | | | Value at
July 31,
2017 | | | Unrealized
Appreciation
(Depreciation) | |
| | | | Long Positions: | | | | | | | | | | | | | |
| | 23 | | | Brent Crude | | | Nov. 2017 | | | $ | 1,117,730 | | | $ | 1,216,010 | | | $ | 98,280 | |
| | 2 | | | Brent Crude | | | May 2018 | | | | 98,830 | | | | 106,760 | | | | 7,930 | |
| | 5 | | | Coffee ‘C’ | | | Sep. 2017 | | | | 241,331 | | | | 261,094 | | | | 19,763 | |
| | 1 | | | Coffee ‘C’ | | | Jul. 2018 | | | | 52,537 | | | | 56,475 | | | | 3,938 | |
| | 10 | | | Copper | | | Sep. 2017 | | | | 658,550 | | | | 722,875 | | | | 64,325 | |
| | 4 | | | Copper | | | Dec. 2017 | | | | 261,613 | | | | 291,250 | | | | 29,637 | |
| | 2 | | | Copper | | | Jul. 2018 | | | | 141,100 | | | | 147,400 | | | | 6,300 | |
| | 61 | | | Corn | | | Sep. 2017 | | | | 1,193,572 | | | | 1,130,788 | | | | (62,784 | ) |
See Notes to Financial Statements.
Commodity futures contracts outstanding at July 31, 2017(1): (continued)
| | | | | | | | | | | | | | | | | | | | |
Number of
Contracts | | | Type | | Expiration
Date | | | Value at
Trade Date | | | Value at
July 31,
2017 | | | Unrealized
Appreciation
(Depreciation) | |
| | | | Long Positions: (cont’d) | | | | | | | | | | | | | | | | |
| | 4 | | | Cotton No. 2 | | | Dec. 2017 | | | $ | 136,730 | | | $ | 137,720 | | | $ | 990 | |
| | 6 | | | Gasoline RBOB | | | Sep. 2017 | | | | 379,109 | | | | 422,503 | | | | 43,394 | |
| | 3 | | | Gasoline RBOB | | | Nov. 2017 | | | | 186,203 | | | | 192,352 | | | | 6,149 | |
| | 1 | | | Gasoline RBOB | | | Jan. 2018 | | | | 56,179 | | | | 62,790 | | | | 6,611 | |
| | 7 | | | Gold 100 OZ | | | Dec. 2017 | | | | 858,360 | | | | 891,380 | | | | 33,020 | |
| | 1 | | | Gold 100 OZ | | | Jun. 2018 | | | | 123,740 | | | | 128,380 | | | | 4,640 | |
| | 11 | | | Hard Red Winter Wheat | | | Sep. 2017 | | | | 272,513 | | | | 261,113 | | | | (11,400 | ) |
| | 6 | | | Lean Hogs | | | Oct. 2017 | | | | 164,980 | | | | 158,460 | | | | (6,520 | ) |
| | 1 | | | Lean Hogs | | | Apr. 2018 | | | | 27,970 | | | | 27,890 | | | | (80 | ) |
| | 6 | | | Live Cattle | | | Oct. 2017 | | | | 280,120 | | | | 268,680 | | | | (11,440 | ) |
| | 1 | | | Live Cattle | | | Apr. 2018 | | | | 45,720 | | | | 45,920 | | | | 200 | |
| | 5 | | | LME Nickel | | | Sep. 2017 | | | | 265,439 | | | | 305,775 | | | | 40,336 | |
| | 4 | | | LME Nickel | | | Dec. 2017 | | | | 247,542 | | | | 246,012 | | | | (1,530 | ) |
| | 1 | | | LME Nickel | | | Feb. 2018 | | | | 63,732 | | | | 61,725 | | | | (2,007 | ) |
| | 2 | | | LME Nickel | | | Jun. 2018 | | | | 115,740 | | | | 124,278 | | | | 8,538 | |
| | 1 | | | LME PRI Aluminum | | | Aug. 2017 | | | | 45,949 | | | | 47,494 | | | | 1,545 | |
| | 7 | | | LME PRI Aluminum | | | Sep. 2017 | | | | 332,204 | | | | 333,988 | | | | 1,784 | |
| | 9 | | | LME PRI Aluminum | | | Dec. 2017 | | | | 429,515 | | | | 433,238 | | | | 3,723 | |
| | 4 | | | LME PRI Aluminum | | | Mar. 2018 | | | | 192,408 | | | | 193,650 | | | | 1,242 | |
| | 3 | | | LME Zinc | | | Sep. 2017 | | | | 193,615 | | | | 209,231 | | | | 15,616 | |
| | 2 | | | LME Zinc | | | Dec. 2017 | | | | 141,149 | | | | 140,025 | | | | (1,124 | ) |
| | 1 | | | LME Zinc | | | Mar. 2018 | | | | 65,505 | | | | 70,000 | | | | 4,495 | |
| | 1 | | | LME Zinc | | | May 2018 | | | | 69,224 | | | | 69,800 | | | | 576 | |
| | 19 | | | Natural Gas | | | Sep. 2017 | | | | 568,767 | | | | 530,860 | | | | (37,907 | ) |
| | 12 | | | Natural Gas | | | Dec. 2017 | | | | 405,903 | | | | 369,480 | | | | (36,423 | ) |
| | 4 | | | Natural Gas | | | Mar. 2018 | | | | 128,883 | | | | 124,760 | | | | (4,123 | ) |
| | 25 | | | No. 2 Soft Red Winter Wheat | | | Sep. 2017 | | | | 597,113 | | | | 593,125 | | | | (3,988 | ) |
| | 7 | | | NY Harbor ULSD | | | Sep. 2017 | | | | 441,706 | | | | 490,216 | | | | 48,510 | |
| | 3 | | | NY Harbor ULSD | | | Nov. 2017 | | | | 207,211 | | | | 210,622 | | | | 3,411 | |
| | 3 | | | Silver | | | Sep. 2017 | | | | 259,170 | | | | 251,790 | | | | (7,380 | ) |
| | 2 | | | Silver | | | Dec. 2017 | | | | 176,350 | | | | 168,840 | | | | (7,510 | ) |
| | 1 | | | Silver | | | May 2018 | | | | 88,825 | | | | 85,245 | | | | (3,580 | ) |
| | 15 | | | Soybean | | | Nov. 2017 | | | | 724,763 | | | | 755,438 | | | | 30,675 | |
| | 11 | | | Soybean Meal | | | Dec. 2017 | | | | 347,200 | | | | 357,940 | | | | 10,740 | |
| | 9 | | | Soybean Oil | | | Dec. 2017 | | | | 177,840 | | | | 189,702 | | | | 11,862 | |
| | 8 | | | Soybean Oil | | | Mar. 2018 | | | | 163,572 | | | | 169,776 | | | | 6,204 | |
| | 17 | | | Sugar #11 (World) | | | Oct. 2017 | | | | 275,526 | | | | 283,886 | | | | 8,360 | |
| | 3 | | | Sugar #11 (World) | | | Mar. 2018 | | | | 50,613 | | | | 52,416 | | | | 1,803 | |
| | 11 | | | WTI Crude | | | Sep. 2017 | | | | 505,240 | | | | 551,870 | | | | 46,630 | |
See Notes to Financial Statements.
| | | | |
| Prudential Day One Underlying Funds | | | 57 | |
Prudential Commodity Strategies Fund
Consolidated Schedule of Investments (continued)
as of July 31, 2017
Commodity futures contracts outstanding at July 31, 2017(1): (continued)
| | | | | | | | | | | | | | | | | | | | |
Number of
Contracts | | | Type | | Expiration
Date | | | Value at
Trade Date | | | Value at
July 31,
2017 | | | Unrealized
Appreciation
(Depreciation) | |
| | | | Long Positions: (cont’d) | | | | | | | | | | | | | | | | |
| | 6 | | | WTI Crude | | | Nov. 2017 | | | $ | 299,480 | | | $ | 302,220 | | | $ | 2,740 | |
| | 3 | | | WTI Crude | | | May 2018 | | | | 143,150 | | | | 151,710 | | | | 8,560 | |
| | | | | | | | | | | | | | | | | | | | |
| | | | | | | | | | | | | | | | | | | 384,731 | |
| | | | | | | | | | | | | | | | | | | | |
| | | | Short Positions: | | | | | | | | | | | | | | | | |
| | 2 | | | LME Nickel | | | Dec. 2017 | | | | 121,764 | | | | 123,006 | | | | (1,242 | ) |
| | 1 | | | LME Nickel | | | Feb. 2018 | | | | 53,478 | | | | 61,725 | | | | (8,247 | ) |
| | 1 | | | LME Nickel | | | Jun. 2018 | | | | 58,773 | | | | 62,139 | | | | (3,366 | ) |
| | 1 | | | LME PRI Aluminum | | | Aug. 2017 | | | | 48,281 | | | | 47,494 | | | | 787 | |
| | 5 | | | LME PRI Aluminum | | | Dec. 2017 | | | | 236,309 | | | | 240,687 | | | | (4,378 | ) |
| | 2 | | | LME PRI Aluminum | | | Mar. 2018 | | | | 95,196 | | | | 96,825 | | | | (1,629 | ) |
| | 1 | | | LME Zinc | | | Mar. 2018 | | | | 69,494 | | | | 70,000 | | | | (506 | ) |
| | | | | | | | | | | | | | | | | | | | |
| | | | | | | | | | | | | | | | | | | (18,581 | ) |
| | | | | | | | | | | | | | | | | | | | |
| | | | | | | | | | | | | | | | | | $ | 366,150 | |
| | | | | | | | | | | | | | | | | | | | |
Cash of $54,467 and securities with a combined market value of $899,287 have been segregated with Morgan Stanley to cover requirements for open futures contracts at July 31, 2017.
| (1) | Represents positions held in the Cayman Subsidiary. |
Fair Value Measurements:
Various inputs are used in determining the value of the Fund’s investments. These inputs are summarized in the three broad levels listed below.
Level 1—unadjusted quoted prices generally in active markets for identical securities.
Level 2—quoted prices for similar securities, interest rates and yield curves, prepayment speeds, foreign currency exchange rates and other observable inputs.
Level 3—unobservable inputs for securities valued in accordance with Board approved fair valuation procedures.
See Notes to Financial Statements.
The following is a summary of the inputs used as of July 31, 2017 in valuing such portfolio securities:
| | | | | | | | | | | | |
| | | Level 1 | | | Level 2 | | | Level 3 | |
Investments in Securities | | | | | | | | | | | | |
U.S. Treasury Obligations | | $ | — | | | $ | 11,087,598 | | | $ | — | |
Unaffiliated Fund | | | 2,715,423 | | | | — | | | | — | |
Other Financial Instruments* | | | | | | | | | | | | |
Commodity Futures Contracts | | | 366,150 | | | | — | | | | — | |
| | | | | | | | | | | | |
Total | | $ | 3,081,573 | | | $ | 11,087,598 | | | $ | — | |
| | | | | | | | | | | | |
| * | Other financial instruments are derivative instruments not reflected in the Consolidated Schedule of Investments, such as futures, forwards and centrally cleared swap contracts, which are recorded at the unrealized appreciation (depreciation) on the instrument, and OTC swap contracts which are recorded at fair value. |
During the period, there were no transfers between Level 1, Level 2 and Level 3 to report.
Investment Allocation:
The investment allocation of portfolio holdings and other assets in excess of liabilities shown as a percentage of net assets as of July 31, 2017 were as follows (unaudited):
| | | | |
U.S. Treasury Obligations | | | 80.3 | % |
Unaffiliated Fund | | | 19.6 | |
| | | | |
| | | 99.9 | |
Other assets in excess of liabilities | | | 0.1 | |
| | | | |
| | | 100.0 | % |
| | | | |
Effects of Derivative Instruments on the Financial Statements and Primary Underlying Risk Exposure:
The Fund invested in derivative instruments during the reporting period. The primary type of risk associated with these derivative instruments is commodity contracts risk. The effect of such derivative instruments on the Fund’s financial position and financial performance as reflected in the Consolidated Statement of Assets and Liabilities and Consolidated Statement of Operations is presented in the summary below.
See Notes to Financial Statements.
| | | | |
| Prudential Day One Underlying Funds | | | 59 | |
Prudential Commodity Strategies Fund
Consolidated Schedule of Investments (continued)
as of July 31, 2017
Fair values of derivative instruments as of July 31, 2017 as presented in the Consolidated Statement of Assets and Liabilities:
| | | | | | | | | | | | |
| | | Asset Derivatives | | | Liability Derivatives | |
Derivatives not accounted
for as hedging instruments,
carried at fair value | | Balance Sheet
Location | | Fair
Value | | | Balance Sheet
Location | | Fair
Value | |
| Commodity contracts | | Due from/to broker—
variation margin
futures | | $ | 583,314 | * | | Due from/to broker—
variation margin
futures | | $ | 217,164 | * |
| | | | | | | | | | | | |
| * | Includes cumulative appreciation (depreciation) as reported in the schedule of open futures and centrally cleared swap contracts. Only unsettled variation margin receivable (payable) is reported within the Consolidated Statement of Assets and Liabilities. |
The effects of derivative instruments on the Consolidated Statement of Operations for the period ended July 31, 2017 are as follows:
| | | | |
Amount of Realized Gain (Loss) on Derivatives Recognized in Income | |
Derivatives not accounted for as hedging
instruments, carried at fair value | | Futures | |
Commodity contracts | | $ | (82,404 | ) |
| | | | |
| | | | |
Change in Unrealized Appreciation (Depreciation) on Derivatives Recognized in Income | |
Derivatives not accounted for as hedging
instruments, carried at fair value | | Futures | |
Commodity contracts | | $ | 366,150 | |
| | | | |
For the period ended July 31, 2017, the Fund’s average value at trade date for futures long positions was $12,325,734 and for short positions was $860,288.
See Notes to Financial Statements.
Prudential QMA US Broad Market Index Fund
Schedule of Investments
as of July 31, 2017
| | | | | | | | |
| Description | | Shares | | | Value | |
LONG-TERM INVESTMENTS 94.9% | | | | | | | | |
| | |
COMMON STOCKS 91.7% | | | | | | | | |
| | |
Aerospace & Defense 2.2% | | | | | | | | |
AAR Corp. | | | 20 | | | $ | 746 | |
Aerojet Rocketdyne Holdings, Inc.* | | | 30 | | | | 704 | |
Aerovironment, Inc.* | | | 14 | | | | 529 | |
Arconic, Inc. | | | 350 | | | | 8,676 | |
Axon Enterprise, Inc.* | | | 20 | | | | 492 | |
Boeing Co. (The) | | | 492 | | | | 119,290 | |
Cubic Corp. | | | 10 | | | | 477 | |
Curtiss-Wright Corp. | | | 48 | | | | 4,628 | |
Engility Holdings, Inc.* | | | 20 | | | | 583 | |
Esterline Technologies Corp.* | | | 30 | | | | 2,895 | |
General Dynamics Corp. | | | 253 | | | | 49,671 | |
Huntington Ingalls Industries, Inc. | | | 40 | | | | 8,244 | |
KLX, Inc.* | | | 50 | | | | 2,596 | |
L3 Technologies, Inc. | | | 72 | | | | 12,598 | |
Lockheed Martin Corp. | | | 221 | | | | 64,561 | |
Mercury Systems, Inc.* | | | 50 | | | | 2,196 | |
Moog, Inc. (Class A Stock)* | | | 38 | | | | 2,824 | |
National Presto Industries, Inc. | | | 8 | | | | 905 | |
Northrop Grumman Corp. | | | 151 | | | | 39,733 | |
Orbital ATK, Inc. | | | 50 | | | | 5,109 | |
Raytheon Co. | | | 259 | | | | 44,488 | |
Rockwell Collins, Inc. | | | 145 | | | | 15,447 | |
Teledyne Technologies, Inc.* | | | 39 | | | | 5,317 | |
Textron, Inc. | | | 230 | | | | 11,300 | |
TransDigm Group, Inc. | | | 42 | | | | 11,850 | |
Triumph Group, Inc. | | | 20 | | | | 512 | |
United Technologies Corp. | | | 655 | | | | 77,663 | |
| | | | | | | | |
| | | | | | | 494,034 | |
| | |
Air Freight & Logistics 0.6% | | | | | | | | |
Atlas Air Worldwide Holdings, Inc.* | | | 30 | | | | 1,782 | |
C.H. Robinson Worldwide, Inc. | | | 118 | | | | 7,741 | |
Echo Global Logistics, Inc.* | | | 20 | | | | 273 | |
Expeditors International of Washington, Inc. | | | 160 | | | | 9,421 | |
FedEx Corp. | | | 213 | | | | 44,310 | |
Forward Air Corp. | | | 40 | | | | 2,073 | |
Hub Group, Inc. (Class A Stock)* | | | 10 | | | | 341 | |
United Parcel Service, Inc. (Class B Stock) | | | 600 | | | | 66,174 | |
| | | | | | | | |
| | | | | | | 132,115 | |
See Notes to Financial Statements.
| | | | |
| Prudential Day One Underlying Funds | | | 61 | |
Prudential QMA US Broad Market Index Fund
Schedule of Investments (continued)
as of July 31, 2017
| | | | | | | | |
| Description | | Shares | | | Value | |
COMMON STOCKS (Continued) | | | | | | | | |
| | |
Airlines 0.5% | | | | | | | | |
Alaska Air Group, Inc. | | | 113 | | | $ | 9,631 | |
Allegiant Travel Co. | | | 18 | | | | 2,327 | |
American Airlines Group, Inc. | | | 436 | | | | 21,992 | |
Delta Air Lines, Inc. | | | 640 | | | | 31,590 | |
Hawaiian Holdings, Inc.* | | | 50 | | | | 2,070 | |
JetBlue Airways Corp.* | | | 260 | | | | 5,702 | |
SkyWest, Inc. | | | 40 | | | | 1,460 | |
Southwest Airlines Co. | | | 530 | | | | 29,420 | |
United Continental Holdings, Inc.* | | | 250 | | | | 16,920 | |
| | | | | | | | |
| | | | | | | 121,112 | |
| | |
Auto Components 0.2% | | | | | | | | |
American Axle & Manufacturing Holdings, Inc.* | | | 35 | | | | 516 | |
BorgWarner, Inc. | | | 180 | | | | 8,413 | |
Cooper Tire & Rubber Co. | | | 53 | | | | 1,937 | |
Cooper-Standard Holdings, Inc.* | | | 20 | | | | 2,045 | |
Dana, Inc. | | | 110 | | | | 2,609 | |
Delphi Automotive PLC | | | 240 | | | | 21,701 | |
Dorman Products, Inc.* | | | 20 | | | | 1,562 | |
Fox Factory Holding Corp.* | | | 20 | | | | 769 | |
Gentex Corp. | | | 220 | | | | 3,744 | |
Gentherm, Inc.* | | | 20 | | | | 669 | |
Goodyear Tire & Rubber Co. (The) | | | 200 | | | | 6,302 | |
LCI Industries | | | 25 | | | | 2,669 | |
Motorcar Parts of America, Inc.* | | | 20 | | | | 559 | |
Standard Motor Products, Inc. | | | 10 | | | | 504 | |
Superior Industries International, Inc. | | | 20 | | | | 391 | |
| | | | | | | | |
| | | | | | | 54,390 | |
| | |
Automobiles 0.4% | | | | | | | | |
Ford Motor Co. | | | 3,400 | | | | 38,148 | |
General Motors Co. | | | 1,190 | | | | 42,816 | |
Harley-Davidson, Inc. | | | 160 | | | | 7,787 | |
Thor Industries, Inc. | | | 50 | | | | 5,268 | |
Winnebago Industries, Inc. | | | 20 | | | | 736 | |
| | | | | | | | |
| | | | | | | 94,755 | |
| | |
Banks 6.0% | | | | | | | | |
Ameris Bancorp. | | | 40 | | | | 1,832 | |
Associated Banc-Corp. | | | 120 | | | | 2,874 | |
Banc of California, Inc. | | | 30 | | | | 617 | |
BancorpSouth, Inc. | | | 70 | | | | 2,104 | |
See Notes to Financial Statements.
| | | | | | | | |
| Description | | Shares | | | Value | |
COMMON STOCKS (Continued) | | | | | | | | |
| | |
Banks (cont’d.) | | | | | | | | |
Bank of America Corp. | | | 8,650 | | | $ | 208,638 | |
Bank of Hawaii Corp. | | | 40 | | | | 3,347 | |
Bank of the Ozarks | | | 110 | | | | 4,746 | |
Banner Corp. | | | 30 | | | | 1,733 | |
BB&T Corp. | | | 700 | | | | 33,124 | |
Boston Private Financial Holdings, Inc. | | | 40 | | | | 614 | |
Brookline Bancorp, Inc. | | | 33 | | | | 490 | |
Cathay General Bancorp | | | 70 | | | | 2,622 | |
Central Pacific Financial Corp. | | | 20 | | | | 619 | |
Chemical Financial Corp. | | | 70 | | | | 3,373 | |
Citigroup, Inc. | | | 2,400 | | | | 164,280 | |
Citizens Financial Group, Inc. | | | 436 | | | | 15,295 | |
City Holding Co. | | | 10 | | | | 656 | |
Columbia Banking System, Inc. | | | 30 | | | | 1,195 | |
Comerica, Inc. | | | 160 | | | | 11,570 | |
Commerce Bancshares, Inc. | | | 72 | | | | 4,179 | |
Community Bank System, Inc. | | | 52 | | | | 2,855 | |
Cullen Frost Bankers, Inc. | | | 50 | | | | 4,539 | |
Customers Bancorp, Inc.* | | | 20 | | | | 597 | |
CVB Financial Corp. | | | 80 | | | | 1,723 | |
East West Bancorp, Inc. | | | 120 | | | | 6,838 | |
Fidelity Southern Corp. | | | 20 | | | | 421 | |
Fifth Third Bancorp | | | 640 | | | | 17,088 | |
First BanCorp. (Puerto Rico)* | | | 80 | | | | 469 | |
First Commonwealth Financial Corp. | | | 40 | | | | 521 | |
First Financial Bancorp | | | 30 | | | | 768 | |
First Financial Bankshares, Inc. | | | 60 | | | | 2,595 | |
First Horizon National Corp. | | | 200 | | | | 3,486 | |
First Midwest Bancorp, Inc. | | | 40 | | | | 888 | |
FNB Corp. | | | 250 | | | | 3,425 | |
Fulton Financial Corp. | | | 140 | | | | 2,555 | |
Glacier Bancorp, Inc. | | | 60 | | | | 2,095 | |
Great Western Bancorp, Inc. | | | 56 | | | | 2,185 | |
Hancock Holding Co. | | | 82 | | | | 3,772 | |
Hanmi Financial Corp. | | | 20 | | | | 573 | |
Home BancShares, Inc. | | | 100 | | | | 2,480 | |
Hope Bancorp, Inc. | | | 110 | | | | 1,939 | |
Huntington Bancshares, Inc. | | | 940 | | | | 12,455 | |
Independent Bank Corp. | | | 35 | | | | 2,497 | |
International Bancshares Corp. | | | 50 | | | | 1,770 | |
JPMorgan Chase & Co. | | | 3,094 | | | | 284,029 | |
KeyCorp | | | 930 | | | | 16,777 | |
See Notes to Financial Statements.
| | | | |
| Prudential Day One Underlying Funds | | | 63 | |
Prudential QMA US Broad Market Index Fund
Schedule of Investments (continued)
as of July 31, 2017
| | | | | | | | |
| Description | | Shares | | | Value | |
COMMON STOCKS (Continued) | | | | | | | | |
| | |
Banks (cont’d.) | | | | | | | | |
LegacyTexas Financial Group, Inc. | | | 20 | | | $ | 774 | |
M&T Bank Corp. | | | 135 | | | | 22,025 | |
MB Financial, Inc. | | | 70 | | | | 2,863 | |
National Bank Holdings Corp. (Class A Stock) | | | 10 | | | | 341 | |
NBT Bancorp, Inc. | | | 20 | | | | 723 | |
OFG Bancorp (Puerto Rico) | | | 40 | | | | 402 | |
Old National Bancorp | | | 110 | | | | 1,793 | |
Opus Bank | | | 20 | | | | 476 | |
PacWest Bancorp | | | 100 | | | | 4,802 | |
People’s United Financial, Inc. | | | 270 | | | | 4,709 | |
Pinnacle Financial Partners, Inc. | | | 60 | | | | 3,834 | |
PNC Financial Services Group, Inc. (The) | | | 419 | | | | 53,967 | |
Prosperity Bancshares, Inc. | | | 70 | | | | 4,487 | |
Regions Financial Corp. | | | 1,020 | | | | 14,892 | |
S&T Bancorp, Inc. | | | 20 | | | | 758 | |
ServisFirst Bancshares, Inc. | | | 20 | | | | 727 | |
Signature Bank* | | | 50 | | | | 6,929 | |
Simmons First National Corp. (Class A Stock) | | | 30 | | | | 1,637 | |
Southside Bancshares, Inc. | | | 21 | | | | 729 | |
Sterling Bancorp | | | 110 | | | | 2,541 | |
SunTrust Banks, Inc. | | | 430 | | | | 24,635 | |
SVB Financial Group* | | | 51 | | | | 9,100 | |
Synovus Financial Corp. | | | 110 | | | | 4,783 | |
TCF Financial Corp. | | | 140 | | | | 2,206 | |
Texas Capital Bancshares, Inc.* | | | 50 | | | | 3,917 | |
Tompkins Financial Corp. | | | 10 | | | | 787 | |
Trustmark Corp. | | | 60 | | | | 1,918 | |
U.S. Bancorp | | | 1,380 | | | | 72,836 | |
UMB Financial Corp. | | | 46 | | | | 3,204 | |
Umpqua Holdings Corp. | | | 150 | | | | 2,781 | |
United Bankshares, Inc. | | | 89 | | | | 3,071 | |
United Community Banks, Inc. | | | 60 | | | | 1,666 | |
Valley National Bancorp | | | 220 | | | | 2,614 | |
Webster Financial Corp. | | | 80 | | | | 4,154 | |
Wells Fargo & Co. | | | 3,912 | | | | 211,013 | |
Westamerica Bancorporation | | | 30 | | | | 1,642 | |
Wintrust Financial Corp. | | | 50 | | | | 3,765 | |
Zions Bancorporation | | | 180 | | | | 8,158 | |
| | | | | | | | |
| | | | | | | 1,334,907 | |
| | |
Beverages 1.7% | | | | | | | | |
Boston Beer Co., Inc. (The) (Class A Stock)* | | | 10 | | | | 1,568 | |
Brown-Forman Corp. (Class B Stock) | | | 160 | | | | 7,904 | |
See Notes to Financial Statements.
| | | | | | | | |
| Description | | Shares | | | Value | |
COMMON STOCKS (Continued) | | | | | | | | |
| | |
Beverages (cont’d.) | | | | | | | | |
Coca-Cola Bottling Co. Consolidated | | | 12 | | | $ | 2,881 | |
Coca-Cola Co. (The) | | | 3,340 | | | | 153,106 | |
Constellation Brands, Inc. (Class A Stock) | | | 153 | | | | 29,582 | |
Dr. Pepper Snapple Group, Inc. | | | 160 | | | | 14,586 | |
Molson Coors Brewing Co. (Class B Stock) | | | 160 | | | | 14,237 | |
Monster Beverage Corp.* | | | 340 | | | | 17,935 | |
PepsiCo, Inc. | | | 1,248 | | | | 145,529 | |
| | | | | | | | |
| | | | | | | 387,328 | |
| | |
Biotechnology 2.6% | | | | | | | | |
AbbVie, Inc. | | | 1,388 | | | | 97,035 | |
Acorda Therapeutics, Inc.* | | | 20 | | | | 433 | |
Alexion Pharmaceuticals, Inc.* | | | 194 | | | | 26,644 | |
AMAG Pharmaceuticals, Inc.* | | | 20 | | | | 393 | |
Amgen, Inc. | | | 642 | | | | 112,036 | |
Biogen, Inc.* | | | 192 | | | | 55,601 | |
Bioverativ, Inc.* | | | 92 | | | | 5,701 | |
Celgene Corp.* | | | 680 | | | | 92,079 | |
Cytokinetics, Inc.* | | | 25 | | | | 351 | |
Eagle Pharmaceuticals, Inc.* | | | 8 | | | | 393 | |
Emergent BioSolutions, Inc.* | | | 20 | | | | 727 | |
Enanta Pharmaceuticals, Inc.* | | | 16 | | | | 610 | |
Gilead Sciences, Inc. | | | 1,144 | | | | 87,047 | |
Incyte Corp.* | | | 154 | | | | 20,527 | |
Ligand Pharmaceuticals, Inc.* | | | 25 | | | | 3,023 | |
MiMedx Group, Inc.* | | | 50 | | | | 748 | |
Momenta Pharmaceuticals, Inc.* | | | 40 | | | | 662 | |
Myriad Genetics, Inc.* | | | 30 | | | | 728 | |
Progenics Pharmaceuticals, Inc.* | | | 30 | | | | 181 | |
Regeneron Pharmaceuticals, Inc.* | | | 70 | | | | 34,414 | |
Repligen Corp.* | | | 20 | | | | 805 | |
Spectrum Pharmaceuticals, Inc.* | | | 80 | | | | 597 | |
United Therapeutics Corp.* | | | 50 | | | | 6,420 | |
Vertex Pharmaceuticals, Inc.* | | | 220 | | | | 33,400 | |
| | | | | | | | |
| | | | | | | 580,555 | |
| | |
Building Products 0.4% | | | | | | | | |
A.O. Smith Corp. | | | 120 | | | | 6,426 | |
AAON, Inc. | | | 20 | | | | 676 | |
Allegion PLC | | | 80 | | | | 6,499 | |
American Woodmark Corp.* | | | 10 | | | | 981 | |
Apogee Enterprises, Inc. | | | 20 | | | | 1,042 | |
See Notes to Financial Statements.
| | | | |
| Prudential Day One Underlying Funds | | | 65 | |
Prudential QMA US Broad Market Index Fund
Schedule of Investments (continued)
as of July 31, 2017
| | | | | | | | |
| Description | | Shares | | | Value | |
COMMON STOCKS (Continued) | | | | | | | | |
| | |
Building Products (cont’d.) | | | | | | | | |
Fortune Brands Home & Security, Inc. | | | 140 | | | $ | 9,194 | |
Gibraltar Industries, Inc.* | | | 10 | | | | 299 | |
Griffon Corp. | | | 20 | | | | 410 | |
Insteel Industries, Inc. | | | 10 | | | | 263 | |
Johnson Controls International PLC | | | 820 | | | | 31,939 | |
Lennox International, Inc. | | | 40 | | | | 6,840 | |
Masco Corp. | | | 280 | | | | 10,676 | |
Patrick Industries, Inc.* | | | 10 | | | | 761 | |
PGT Innovations, Inc.* | | | 40 | | | | 520 | |
Quanex Building Products Corp. | | | 30 | | | | 645 | |
Simpson Manufacturing Co., Inc. | | | 40 | | | | 1,772 | |
Trex Co., Inc.* | | | 37 | | | | 2,783 | |
Universal Forest Products, Inc. | | | 30 | | | | 2,515 | |
| | | | | | | | |
| | | | | | | 84,241 | |
| | |
Capital Markets 2.7% | | | | | | | | |
Affiliated Managers Group, Inc. | | | 53 | | | | 9,849 | |
Ameriprise Financial, Inc. | | | 136 | | | | 19,704 | |
Bank of New York Mellon Corp. (The) | | | 900 | | | | 47,727 | |
BlackRock, Inc. | | | 108 | | | | 46,065 | |
CBOE Holdings, Inc. | | | 85 | | | | 8,035 | |
Charles Schwab Corp. (The) | | | 1,060 | | | | 45,474 | |
CME Group, Inc. | | | 298 | | | | 36,541 | |
Donnelley Financial Solutions, Inc.* | | | 20 | | | | 464 | |
E*TRADE Financial Corp.* | | | 240 | | | | 9,840 | |
Eaton Vance Corp. | | | 110 | | | | 5,400 | |
Evercore Partners, Inc. (Class A Stock) | | | 50 | | | | 3,932 | |
FactSet Research Systems, Inc. | | | 35 | | | | 5,853 | |
Federated Investors, Inc. (Class B Stock) | | | 80 | | | | 2,306 | |
Financial Engines, Inc. | | | 50 | | | | 1,923 | |
Franklin Resources, Inc. | | | 300 | | | | 13,434 | |
Goldman Sachs Group, Inc. (The) | | | 324 | | | | 73,007 | |
Greenhill & Co., Inc. | | | 20 | | | | 370 | |
Interactive Brokers Group, Inc. (Class A Stock) | | | 60 | | | | 2,403 | |
Intercontinental Exchange, Inc. | | | 520 | | | | 34,689 | |
INTL FCStone, Inc.* | | | 20 | | | | 783 | |
Invesco Ltd. | | | 350 | | | | 12,169 | |
Investment Technology Group, Inc. | | | 30 | | | | 662 | |
Janus Henderson Group PLC (United Kingdom)* | | | 148 | | | | 4,957 | |
Legg Mason, Inc. | | | 80 | | | | 3,201 | |
MarketAxess Holdings, Inc. | | | 40 | | | | 8,116 | |
Moody’s Corp. | | | 150 | | | | 19,744 | |
See Notes to Financial Statements.
| | | | | | | | |
| Description | | Shares | | | Value | |
COMMON STOCKS (Continued) | | | | | | | | |
| | |
Capital Markets (cont’d.) | | | | | | | | |
Morgan Stanley | | | 1,240 | | | $ | 58,156 | |
MSCI, Inc. | | | 80 | | | | 8,716 | |
Nasdaq, Inc. | | | 110 | | | | 8,181 | |
Northern Trust Corp. | | | 190 | | | | 16,627 | |
Piper Jaffray Cos. | | | 10 | | | | 624 | |
Raymond James Financial, Inc. | | | 120 | | | | 9,983 | |
S&P Global, Inc. | | | 230 | | | | 35,326 | |
SEI Investments Co. | | | 110 | | | | 6,216 | |
State Street Corp. | | | 310 | | | | 28,901 | |
Stifel Financial Corp.* | | | 70 | | | | 3,559 | |
T. Rowe Price Group, Inc. | | | 210 | | | | 17,371 | |
Virtus Investment Partners, Inc. | | | 8 | | | | 942 | |
Waddell & Reed Financial, Inc. (Class A Stock) | | | 40 | | | | 827 | |
WisdomTree Investments, Inc. | | | 50 | | | | 522 | |
| | | | | | | | |
| | | | | | | 612,599 | |
| | |
Chemicals 2.0% | | | | | | | | |
A Schulman, Inc. | | | 20 | | | | 526 | |
AdvanSix, Inc.* | | | 24 | | | | 804 | |
Air Products & Chemicals, Inc. | | | 190 | | | | 27,008 | |
Albemarle Corp. | | | 100 | | | | 11,580 | |
American Vanguard Corp. | | | 30 | | | | 531 | |
Ashland Global Holdings, Inc. | | | 60 | | | | 3,898 | |
Balchem Corp. | | | 30 | | | | 2,328 | |
Cabot Corp. | | | 60 | | | | 3,260 | |
Calgon Carbon Corp. | | | 30 | | | | 480 | |
CF Industries Holdings, Inc. | | | 180 | | | | 5,283 | |
Chemours Co. (The) | | | 168 | | | | 7,998 | |
Dow Chemical Co. (The) | | | 970 | | | | 62,313 | |
E.I. du Pont de Nemours & Co. | | | 760 | | | | 62,480 | |
Eastman Chemical Co. | | | 130 | | | | 10,811 | |
Ecolab, Inc. | | | 234 | | | | 30,811 | |
Flotek Industries, Inc.* | | | 40 | | | | 337 | |
FMC Corp. | | | 110 | | | | 8,402 | |
FutureFuel Corp. | | | 30 | | | | 437 | |
H.B. Fuller Co. | | | 50 | | | | 2,576 | |
Hawkins, Inc. | | | 10 | | | | 449 | |
Ingevity Corp.* | | | 50 | | | | 2,925 | |
Innophos Holdings, Inc. | | | 10 | | | | 418 | |
Innospec, Inc. | | | 26 | | | | 1,622 | |
International Flavors & Fragrances, Inc. | | | 74 | | | | 9,855 | |
Koppers Holdings, Inc.* | | | 20 | | | | 726 | |
See Notes to Financial Statements.
| | | | |
| Prudential Day One Underlying Funds | | | 67 | |
Prudential QMA US Broad Market Index Fund
Schedule of Investments (continued)
as of July 31, 2017
| | | | | | | | |
| Description | | Shares | | | Value | |
COMMON STOCKS (Continued) | | | | | | | | |
| | |
Chemicals (cont’d.) | | | | | | | | |
Kraton Corp.* | | | 20 | | | $ | 744 | |
LSB Industries, Inc.* | | | 50 | | | | 354 | |
LyondellBasell Industries NV (Class A Stock) | | | 290 | | | | 26,126 | |
Minerals Technologies, Inc. | | | 38 | | | | 2,690 | |
Monsanto Co. | | | 380 | | | | 44,392 | |
Mosaic Co. (The) | | | 280 | | | | 6,759 | |
NewMarket Corp. | | | 10 | | | | 4,601 | |
Olin Corp. | | | 130 | | | | 3,832 | |
PolyOne Corp. | | | 70 | | | | 2,561 | |
PPG Industries, Inc. | | | 228 | | | | 23,997 | |
Praxair, Inc. | | | 250 | | | | 32,540 | |
Quaker Chemical Corp. | | | 10 | | | | 1,419 | |
Rayonier Advanced Materials, Inc. | | | 30 | | | | 447 | |
RPM International, Inc. | | | 110 | | | | 5,706 | |
Scotts Miracle-Gro Co. (The) | | | 50 | | | | 4,799 | |
Sensient Technologies Corp. | | | 40 | | | | 2,974 | |
Sherwin-Williams Co. (The) | | | 75 | | | | 25,295 | |
Stepan Co. | | | 28 | | | | 2,301 | |
Tredegar Corp. | | | 20 | | | | 302 | |
Valvoline, Inc. | | | 162 | | | | 3,673 | |
| | | | | | | | |
| | | | | | | 453,370 | |
| | |
Commercial Services & Supplies 0.5% | | | | | | | | |
ABM Industries, Inc. | | | 50 | | | | 2,231 | |
Brady Corp. (Class A Stock) | | | 20 | | | | 664 | |
Brink’s Co. (The) | | | 50 | | | | 3,907 | |
Cintas Corp. | | | 80 | | | | 10,788 | |
Clean Harbors, Inc.* | | | 55 | | | | 3,124 | |
Copart, Inc.* | | | 160 | | | | 5,038 | |
Deluxe Corp. | | | 50 | | | | 3,610 | |
Essendant, Inc. | | | 30 | | | | 374 | |
Healthcare Services Group, Inc. | | | 70 | | | | 3,657 | |
Herman Miller, Inc. | | | 30 | | | | 1,010 | |
HNI Corp. | | | 20 | | | | 755 | |
Interface, Inc. | | | 30 | | | | 569 | |
LSC Communications, Inc. | | | 24 | | | | 513 | |
Matthews International Corp. (Class A Stock) | | | 20 | | | | 1,311 | |
Mobile Mini, Inc. | | | 20 | | | | 616 | |
MSA Safety, Inc. | | | 37 | | | | 2,966 | |
Multi-Color Corp. | | | 10 | | | | 805 | |
Pitney Bowes, Inc. | | | 150 | | | | 2,361 | |
Republic Services, Inc. | | | 210 | | | | 13,486 | |
See Notes to Financial Statements.
| | | | | | | | |
| Description | | Shares | | | Value | |
COMMON STOCKS (Continued) | | | | | | | | |
| | |
Commercial Services & Supplies (cont’d.) | | | | | | | | |
Rollins, Inc. | | | 80 | | | $ | 3,473 | |
RR Donnelley & Sons Co. | | | 30 | | | | 371 | |
Stericycle, Inc.* | | | 86 | | | | 6,629 | |
Team, Inc.* | | | 20 | | | | 287 | |
Tetra Tech, Inc. | | | 60 | | | | 2,847 | |
UniFirst Corp. | | | 20 | | | | 2,845 | |
US Ecology, Inc. | | | 10 | | | | 519 | |
Viad Corp. | | | 10 | | | | 536 | |
Waste Management, Inc. | | | 351 | | | | 26,378 | |
| | | | | | | | |
| | | | | | | 101,670 | |
| | |
Communications Equipment 1.0% | | | | | | | | |
ADTRAN, Inc. | | | 20 | | | | 469 | |
Applied Optoelectronics, Inc.* | | | 20 | | | | 1,950 | |
ARRIS International PLC* | | | 150 | | | | 4,194 | |
Black Box Corp. | | | 60 | | | | 474 | |
Brocade Communications Systems, Inc. | | | 320 | | | | 4,042 | |
CalAmp Corp.* | | | 30 | | | | 573 | |
Ciena Corp.* | | | 110 | | | | 2,832 | |
Cisco Systems, Inc. | | | 4,350 | | | | 136,807 | |
Comtech Telecommunications Corp. | | | 32 | | | | 576 | |
Digi International, Inc.* | | | 30 | | | | 313 | |
F5 Networks, Inc.* | | | 60 | | | | 7,245 | |
Harmonic, Inc.* | | | 50 | | | | 205 | |
Harris Corp. | | | 110 | | | | 12,592 | |
InterDigital, Inc. | | | 40 | | | | 2,914 | |
Juniper Networks, Inc. | | | 350 | | | | 9,782 | |
Lumentum Holdings, Inc.* | | | 60 | | | | 3,756 | |
Motorola Solutions, Inc. | | | 145 | | | | 13,149 | |
NETGEAR, Inc.* | | | 30 | | | | 1,437 | |
NetScout Systems, Inc.* | | | 70 | | | | 2,415 | |
Oclaro, Inc.* | | | 60 | | | | 587 | |
Plantronics, Inc. | | | 20 | | | | 904 | |
ViaSat, Inc.* | | | 55 | | | | 3,635 | |
Viavi Solutions, Inc.* | | | 190 | | | | 2,084 | |
| | | | | | | | |
| | | | | | | 212,935 | |
| | |
Construction & Engineering 0.2% | | | | | | | | |
AECOM* | | | 124 | | | | 3,956 | |
Aegion Corp.* | | | 20 | | | | 479 | |
Comfort Systems USA, Inc. | | | 20 | | | | 666 | |
Dycom Industries, Inc.* | | | 40 | | | | 3,624 | |
See Notes to Financial Statements.
| | | | |
| Prudential Day One Underlying Funds | | | 69 | |
Prudential QMA US Broad Market Index Fund
Schedule of Investments (continued)
as of July 31, 2017
| | | | | | | | |
| Description | | Shares | | | Value | |
COMMON STOCKS (Continued) | | | | | | | | |
| | |
Construction & Engineering (cont’d.) | | | | | | | | |
EMCOR Group, Inc. | | | 60 | | | $ | 4,050 | |
Fluor Corp. | | | 110 | | | | 4,777 | |
Granite Construction, Inc. | | | 40 | | | | 1,961 | |
Jacobs Engineering Group, Inc. | | | 100 | | | | 5,272 | |
KBR, Inc. | | | 120 | | | | 1,790 | |
MYR Group, Inc.* | | | 20 | | | | 636 | |
Orion Group Holdings, Inc.* | | | 50 | | | | 351 | |
Quanta Services, Inc.* | | | 120 | | | | 4,048 | |
Valmont Industries, Inc. | | | 25 | | | | 3,817 | |
| | | | | | | | |
| | | | | | | 35,427 | |
| | |
Construction Materials 0.1% | | | | | | | | |
Eagle Materials, Inc. | | | 48 | | | | 4,517 | |
Martin Marietta Materials, Inc. | | | 60 | | | | 13,586 | |
U.S. Concrete, Inc.* | | | 10 | | | | 783 | |
Vulcan Materials Co. | | | 120 | | | | 14,774 | |
| | | | | | | | |
| | | | | | | 33,660 | |
| | |
Consumer Finance 0.7% | | | | | | | | |
American Express Co. | | | 650 | | | | 55,399 | |
Capital One Financial Corp. | | | 420 | | | | 36,196 | |
Discover Financial Services | | | 330 | | | | 20,110 | |
Encore Capital Group, Inc.* | | | 20 | | | | 802 | |
Enova International, Inc.* | | | 40 | | | | 580 | |
EZCORP, Inc. (Class A Stock)* | | | 40 | | | | 312 | |
FirstCash, Inc. | | | 50 | | | | 2,907 | |
Green Dot Corp. (Class A Stock)* | | | 40 | | | | 1,610 | |
Navient Corp. | | | 220 | | | | 3,245 | |
PRA Group, Inc.* | | | 20 | | | | 784 | |
SLM Corp.* | | | 340 | | | | 3,767 | |
Synchrony Financial | | | 650 | | | | 19,708 | |
World Acceptance Corp.* | | | 10 | | | | 756 | |
| | | | | | | | |
| | | | | | | 146,176 | |
| | |
Containers & Packaging 0.4% | | | | | | | | |
AptarGroup, Inc. | | | 60 | | | | 4,856 | |
Avery Dennison Corp. | | | 80 | | | | 7,434 | |
Ball Corp. | | | 300 | | | | 12,570 | |
Bemis Co., Inc. | | | 80 | | | | 3,390 | |
Greif, Inc. (Class A Stock) | | | 14 | | | | 785 | |
International Paper Co. | | | 350 | | | | 19,243 | |
See Notes to Financial Statements.
| | | | | | | | |
| Description | | Shares | | | Value | |
COMMON STOCKS (Continued) | | | | | | | | |
| | |
Containers & Packaging (cont’d.) | | | | | | | | |
Myers Industries, Inc. | | | 30 | | | $ | 510 | |
Owens-Illinois, Inc.* | | | 130 | | | | 3,107 | |
Packaging Corp. of America | | | 80 | | | | 8,758 | |
Sealed Air Corp. | | | 160 | | | | 6,962 | |
Silgan Holdings, Inc. | | | 40 | | | | 1,212 | |
Sonoco Products Co. | | | 80 | | | | 3,878 | |
WestRock Co. | | | 220 | | | | 12,633 | |
| | | | | | | | |
| | | | | | | 85,338 | |
| | |
Distributors 0.1% | | | | | | | | |
Core-Mark Holding Co., Inc. | | | 20 | | | | 733 | |
Genuine Parts Co. | | | 130 | | | | 11,041 | |
LKQ Corp.* | | | 270 | | | | 9,331 | |
Pool Corp. | | | 41 | | | | 4,433 | |
| | | | | | | | |
| | | | | | | 25,538 | |
| | |
Diversified Consumer Services 0.1% | | | | | | | | |
Adtalem Global Education, Inc. | | | 50 | | | | 1,625 | |
American Public Education, Inc.* | | | 20 | | | | 426 | |
Capella Education Co. | | | 10 | | | | 687 | |
Career Education Corp.* | | | 50 | | | | 421 | |
Graham Holdings Co. (Class B Stock) | | | 5 | | | | 2,962 | |
H&R Block, Inc. | | | 160 | | | | 4,880 | |
Regis Corp.* | | | 30 | | | | 316 | |
Service Corp. International | | | 150 | | | | 5,209 | |
Sotheby’s* | | | 50 | | | | 2,830 | |
Strayer Education, Inc. | | | 10 | | | | 786 | |
| | | | | | | | |
| | | | | | | 20,142 | |
| | |
Diversified Financial Services 1.3% | | | | | | | | |
Berkshire Hathaway, Inc. (Class B Stock)* | | | 1,650 | | | | 288,700 | |
Leucadia National Corp. | | | 256 | | | | 6,664 | |
| | | | | | | | |
| | | | | | | 295,364 | |
| | |
Diversified Telecommunication Services 1.8% | | | | | | | | |
AT&T, Inc. | | | 5,350 | | | | 208,650 | |
ATN International, Inc. | | | 10 | | | | 580 | |
CenturyLink, Inc.(a) | | | 470 | | | | 10,937 | |
Cincinnati Bell, Inc.* | | | 30 | | | | 560 | |
Cogent Communications Holdings, Inc. | | | 40 | | | | 1,670 | |
Consolidated Communications Holdings, Inc. | | | 20 | | | | 360 | |
See Notes to Financial Statements.
| | | | |
| Prudential Day One Underlying Funds | | | 71 | |
Prudential QMA US Broad Market Index Fund
Schedule of Investments (continued)
as of July 31, 2017
| | | | | | | | |
| Description | | Shares | | | Value | |
COMMON STOCKS (Continued) | | | | | | | | |
| | |
Diversified Telecommunication Services (cont’d.) | | | | | | | | |
Frontier Communications Corp. | | | 35 | | | $ | 536 | |
General Communication, Inc. (Class A Stock)* | | | 30 | | | | 1,280 | |
Iridium Communications, Inc.* | | | 50 | | | | 498 | |
Level 3 Communications, Inc.* | | | 250 | | | | 14,670 | |
Lumos Networks Corp.* | | | 30 | | | | 537 | |
Verizon Communications, Inc. | | | 3,546 | | | | 171,626 | |
| | | | | | | | |
| | | | | | | 411,904 | |
| | |
Electric Utilities 1.8% | | | | | | | | |
ALLETE, Inc. | | | 50 | | | | 3,664 | |
Alliant Energy Corp. | | | 200 | | | | 8,106 | |
American Electric Power Co., Inc. | | | 420 | | | | 29,627 | |
Duke Energy Corp. | | | 610 | | | | 51,923 | |
Edison International | | | 280 | | | | 22,030 | |
El Paso Electric Co. | | | 40 | | | | 2,076 | |
Entergy Corp. | | | 150 | | | | 11,508 | |
Eversource Energy | | | 270 | | | | 16,413 | |
Exelon Corp. | | | 806 | | | | 30,902 | |
FirstEnergy Corp. | | | 380 | | | | 12,126 | |
Great Plains Energy, Inc. | | | 170 | | | | 5,246 | |
Hawaiian Electric Industries, Inc. | | | 90 | | | | 2,969 | |
IDACORP, Inc. | | | 50 | | | | 4,318 | |
NextEra Energy, Inc. | | | 407 | | | | 59,459 | |
OGE Energy Corp. | | | 160 | | | | 5,738 | |
PG&E Corp. | | | 450 | | | | 30,460 | |
Pinnacle West Capital Corp. | | | 100 | | | | 8,673 | |
PNM Resources, Inc. | | | 70 | | | | 2,790 | |
PPL Corp. | | | 574 | | | | 22,001 | |
Southern Co. (The) | | | 860 | | | | 41,220 | |
Westar Energy, Inc. | | | 130 | | | | 6,598 | |
Xcel Energy, Inc. | | | 440 | | | | 20,816 | |
| | | | | | | | |
| | | | | | | 398,663 | |
| | |
Electrical Equipment 0.6% | | | | | | | | |
Acuity Brands, Inc. | | | 45 | | | | 9,119 | |
AMETEK, Inc. | | | 210 | | | | 12,932 | |
AZZ, Inc. | | | 30 | | | | 1,521 | |
Eaton Corp. PLC | | | 400 | | | | 31,300 | |
Emerson Electric Co. | | | 570 | | | | 33,978 | |
Encore Wire Corp. | | | 10 | | | | 446 | |
EnerSys | | | 45 | | | | 3,252 | |
See Notes to Financial Statements.
| | | | | | | | |
| Description | | Shares | | | Value | |
COMMON STOCKS (Continued) | | | | | | | | |
| | |
Electrical Equipment (cont’d.) | | | | | | | | |
General Cable Corp. | | | 30 | | | $ | 579 | |
Hubbell, Inc. | | | 46 | | | | 5,464 | |
Powell Industries, Inc. | | | 10 | | | | 319 | |
Regal Beloit Corp. | | | 50 | | | | 4,167 | |
Rockwell Automation, Inc. | | | 120 | | | | 19,804 | |
Vicor Corp.* | | | 30 | | | | 532 | |
| | | | | | | | |
| | | | | | | 123,413 | |
| | |
Electronic Equipment, Instruments & Components 0.8% | | | | | | | | |
Amphenol Corp. (Class A Stock) | | | 270 | | | | 20,687 | |
Anixter International, Inc.* | | | 30 | | | | 2,363 | |
Arrow Electronics, Inc.* | | | 80 | | | | 6,503 | |
Avnet, Inc. | | | 100 | | | | 3,838 | |
Badger Meter, Inc. | | | 20 | | | | 905 | |
Bel Fuse, Inc. (Class B Stock) | | | 20 | | | | 505 | |
Belden, Inc. | | | 40 | | | | 2,878 | |
Benchmark Electronics, Inc.* | | | 20 | | | | 673 | |
Cognex Corp. | | | 80 | | | | 7,605 | |
Coherent, Inc.* | | | 23 | | | | 6,095 | |
Corning, Inc. | | | 800 | | | | 23,312 | |
CTS Corp. | | | 20 | | | | 440 | |
Daktronics, Inc. | | | 50 | | | | 489 | |
Electro Scientific Industries, Inc.* | | | 60 | | | | 519 | |
ePlus, Inc.* | | | 16 | | | | 1,294 | |
Fabrinet (Thailand)* | | | 20 | | | | 900 | |
FARO Technologies, Inc.* | | | 20 | | | | 790 | |
FLIR Systems, Inc. | | | 110 | | | | 4,105 | |
II-VI, Inc.* | | | 50 | | | | 1,905 | |
Insight Enterprises, Inc.* | | | 20 | | | | 810 | |
IPG Photonics Corp.* | | | 38 | | | | 5,800 | |
Itron, Inc.* | | | 40 | | | | 2,920 | |
Jabil, Inc. | | | 150 | | | | 4,575 | |
Keysight Technologies, Inc.* | | | 165 | | | | 6,862 | |
Knowles Corp.* | | | 40 | | | | 606 | |
Littelfuse, Inc. | | | 25 | | | | 4,504 | |
Methode Electronics, Inc. | | | 20 | | | | 795 | |
MTS Systems Corp. | | | 10 | | | | 527 | |
National Instruments Corp. | | | 90 | | | | 3,703 | |
OSI Systems, Inc.* | | | 10 | | | | 800 | |
Park Electrochemical Corp. | | | 23 | | | | 432 | |
Plexus Corp.* | | | 37 | | | | 1,984 | |
Rogers Corp.* | | | 20 | | | | 2,359 | |
See Notes to Financial Statements.
| | | | |
| Prudential Day One Underlying Funds | | | 73 | |
Prudential QMA US Broad Market Index Fund
Schedule of Investments (continued)
as of July 31, 2017
| | | | | | | | |
| Description | | Shares | | | Value | |
COMMON STOCKS (Continued) | | | | | | | | |
| | |
Electronic Equipment, Instruments & Components (cont’d.) | | | | | | | | |
Sanmina Corp.* | | | 70 | | | $ | 2,510 | |
ScanSource, Inc.* | | | 20 | | | | 792 | |
SYNNEX Corp. | | | 36 | | | | 4,281 | |
TE Connectivity Ltd. | | | 310 | | | | 24,921 | |
Tech Data Corp.* | | | 42 | | | | 4,301 | |
Trimble, Inc.* | | | 200 | | | | 7,486 | |
TTM Technologies, Inc.* | | | 40 | | | | 695 | |
VeriFone Systems, Inc.* | | | 50 | | | | 976 | |
Vishay Intertechnology, Inc. | | | 110 | | | | 1,964 | |
Zebra Technologies Corp. (Class A Stock)* | | | 50 | | | | 5,086 | |
| | | | | | | | |
| | | | | | | 175,495 | |
| | |
Energy Equipment & Services 0.8% | | | | | | | | |
Archrock, Inc. | | | 40 | | | | 438 | |
Atwood Oceanics, Inc.* | | | 40 | | | | 314 | |
Baker Hughes A Ge Co. | | | 370 | | | | 13,649 | |
Bristow Group, Inc. | | | 30 | | | | 221 | |
CARBO Ceramics, Inc.* | | | 30 | | | | 212 | |
Core Laboratories NV | | | 45 | | | | 4,524 | |
Diamond Offshore Drilling, Inc.* | | | 30 | | | | 373 | |
Dril-Quip, Inc.* | | | 40 | | | | 1,784 | |
Ensco PLC (Class A Stock) | | | 140 | | | | 741 | |
Era Group, Inc.* | | | 30 | | | | 263 | |
Exterran Corp.* | | | 18 | | | | 498 | |
Geospace Technologies Corp.* | | | 20 | | | | 308 | |
Gulf Island Fabrication, Inc. | | | 40 | | | | 456 | |
Halliburton Co. | | | 750 | | | | 31,830 | |
Helix Energy Solutions Group, Inc.* | | | 60 | | | | 392 | |
Helmerich & Payne, Inc. | | | 90 | | | | 4,556 | |
Matrix Service Co.* | | | 20 | | | | 207 | |
McDermott International, Inc.* | | | 150 | | | | 1,016 | |
Nabors Industries Ltd. | | | 240 | | | | 1,850 | |
National Oilwell Varco, Inc. | | | 330 | | | | 10,794 | |
Newpark Resources, Inc.* | | | 60 | | | | 501 | |
Noble Corp. PLC | | | 110 | | | | 440 | |
Oceaneering International, Inc. | | | 70 | | | | 1,796 | |
Oil States International, Inc.* | | | 20 | | | | 497 | |
Patterson-UTI Energy, Inc. | | | 130 | | | | 2,514 | |
Pioneer Energy Services Corp.* | | | 75 | | | | 165 | |
Rowan Cos. PLC (Class A Stock)* | | | 60 | | | | 700 | |
Schlumberger Ltd. | | | 1,214 | | | | 83,280 | |
SEACOR Holdings, Inc.* | | | 10 | | | | 341 | |
See Notes to Financial Statements.
| | | | | | | | |
| Description | | Shares | | | Value | |
COMMON STOCKS (Continued) | | | | | | | | |
| | |
Energy Equipment & Services (cont’d.) | | | | | | | | |
Superior Energy Services, Inc.* | | | 70 | | | $ | 753 | |
TechnipFMC PLC (United Kingdom)* | | | 400 | | | | 11,416 | |
Tesco Corp.* | | | 40 | | | | 184 | |
TETRA Technologies, Inc.* | | | 90 | | | | 253 | |
Transocean Ltd.*(a) | | | 330 | | | | 2,855 | |
U.S. Silica Holdings, Inc. | | | 60 | | | | 1,748 | |
Unit Corp.* | | | 30 | | | | 539 | |
| | | | | | | | |
| | | | | | | 182,408 | |
| | |
Equity Real Estate Investment Trusts (REITs) 3.1% | | | | | | | | |
Acadia Realty Trust | | | 70 | | | | 2,082 | |
Agree Realty Corp. | | | 30 | | | | 1,475 | |
Alexandria Real Estate Equities, Inc. | | | 78 | | | | 9,457 | |
American Assets Trust, Inc. | | | 40 | | | | 1,624 | |
American Campus Communities, Inc. | | | 120 | | | | 5,753 | |
American Tower Corp. | | | 369 | | | | 50,306 | |
Apartment Investment & Management Co. (Class A Stock) | | | 130 | | | | 5,921 | |
Armada Hoffler Properties, Inc. | | | 30 | | | | 398 | |
AvalonBay Communities, Inc. | | | 126 | | | | 24,236 | |
Boston Properties, Inc. | | | 140 | | | | 16,927 | |
Camden Property Trust | | | 80 | | | | 7,176 | |
Care Capital Properties, Inc. | | | 70 | | | | 1,695 | |
CareTrust REIT, Inc. | | | 30 | | | | 547 | |
CBL & Associates Properties, Inc. | | | 85 | | | | 747 | |
Cedar Realty Trust, Inc. | | | 70 | | | | 363 | |
Chatham Lodging Trust | | | 20 | | | | 414 | |
Chesapeake Lodging Trust | | | 30 | | | | 757 | |
CoreCivic, Inc. | | | 90 | | | | 2,493 | |
CoreSite Realty Corp. | | | 35 | | | | 3,800 | |
Corporate Office Properties Trust | | | 90 | | | | 2,996 | |
Cousins Properties, Inc. | | | 300 | | | | 2,757 | |
Crown Castle International Corp. | | | 353 | | | | 35,505 | |
CyrusOne, Inc. | | | 70 | | | | 4,180 | |
DCT Industrial Trust, Inc. | | | 80 | | | | 4,507 | |
DiamondRock Hospitality Co. | | | 170 | | | | 1,986 | |
Digital Realty Trust, Inc. | | | 145 | | | | 16,724 | |
Douglas Emmett, Inc. | | | 120 | | | | 4,591 | |
Duke Realty Corp. | | | 280 | | | | 8,005 | |
EastGroup Properties, Inc. | | | 40 | | | | 3,487 | |
Education Realty Trust, Inc. | | | 70 | | | | 2,629 | |
EPR Properties | | | 70 | | | | 5,067 | |
Equinix, Inc. | | | 73 | | | | 32,903 | |
See Notes to Financial Statements.
| | | | |
| Prudential Day One Underlying Funds | | | 75 | |
Prudential QMA US Broad Market Index Fund
Schedule of Investments (continued)
as of July 31, 2017
| | | | | | | | |
| Description | | Shares | | | Value | |
COMMON STOCKS (Continued) | | | | | | | | |
| | |
Equity Real Estate Investment Trusts (REITs) (cont’d.) | | | | | | | | |
Equity Residential | | | 314 | | | $ | 21,371 | |
Essex Property Trust, Inc. | | | 60 | | | | 15,702 | |
Extra Space Storage, Inc. | | | 120 | | | | 9,540 | |
Federal Realty Investment Trust | | | 63 | | | | 8,356 | |
First Industrial Realty Trust, Inc. | | | 90 | | | | 2,747 | |
Four Corners Property Trust, Inc. | | | 30 | | | | 761 | |
Franklin Street Properties Corp. | | | 50 | | | | 529 | |
GEO Group, Inc. (The) | | | 105 | | | | 3,082 | |
Getty Realty Corp. | | | 25 | | | | 650 | |
GGP, Inc. | | | 500 | | | | 11,305 | |
Government Properties Income Trust | | | 45 | | | | 798 | |
HCP, Inc. | | | 400 | | | | 12,660 | |
Healthcare Realty Trust, Inc. | | | 100 | | | | 3,330 | |
Hersha Hospitality Trust | | | 20 | | | | 375 | |
Highwoods Properties, Inc. | | | 80 | | | | 4,122 | |
Hospitality Properties Trust | | | 130 | | | | 3,778 | |
Host Hotels & Resorts, Inc. | | | 640 | | | | 11,942 | |
Independence Realty Trust, Inc. | | | 30 | | | | 304 | |
Iron Mountain, Inc. | | | 190 | | | | 6,922 | |
JBG Smith Properties* | | | 70 | | | | 2,484 | |
Kilroy Realty Corp. | | | 90 | | | | 6,247 | |
Kimco Realty Corp. | | | 340 | | | | 6,861 | |
Kite Realty Group Trust | | | 40 | | | | 821 | |
Lamar Advertising Co. (Class A Stock) | | | 80 | | | | 5,646 | |
LaSalle Hotel Properties | | | 90 | | | | 2,659 | |
Lexington Realty Trust | | | 180 | | | | 1,832 | |
Liberty Property Trust | | | 124 | | | | 5,210 | |
Life Storage, Inc. | | | 53 | | | | 3,871 | |
LTC Properties, Inc. | | | 40 | | | | 2,066 | |
Macerich Co. (The) | | | 96 | | | | 5,509 | |
Mack-Cali Realty Corp. | | | 40 | | | | 1,050 | |
Medical Properties Trust, Inc. | | | 290 | | | | 3,764 | |
Mid-America Apartment Communities, Inc. | | | 104 | | | | 10,767 | |
National Retail Properties, Inc. | | | 124 | | | | 4,958 | |
National Storage Affiliates Trust | | | 25 | | | | 574 | |
Omega Healthcare Investors, Inc. | | | 150 | | | | 4,738 | |
Parkway, Inc. | | | 30 | | | | 690 | |
Pennsylvania Real Estate Investment Trust | | | 30 | | | | 357 | |
Potlatch Corp. | | | 40 | | | | 1,914 | |
Prologis, Inc. | | | 470 | | | | 28,581 | |
PS Business Parks, Inc. | | | 20 | | | | 2,689 | |
Public Storage | | | 134 | | | | 27,546 | |
See Notes to Financial Statements.
| | | | | | | | |
| Description | | Shares | | | Value | |
COMMON STOCKS (Continued) | | | | | | | | |
| | |
Equity Real Estate Investment Trusts (REITs) (cont’d.) | | | | | | | | |
Quality Care Properties, Inc.* | | | 40 | | | $ | 673 | |
Ramco-Gershenson Properties Trust | | | 40 | | | | 564 | |
Rayonier, Inc. | | | 100 | | | | 2,907 | |
Realty Income Corp. | | | 240 | | | | 13,694 | |
Regency Centers Corp. | | | 138 | | | | 9,138 | |
Retail Opportunity Investments Corp. | | | 90 | | | | 1,825 | |
Sabra Health Care REIT, Inc. | | | 30 | | | | 696 | |
Saul Centers, Inc. | | | 10 | | | | 592 | |
Senior Housing Properties Trust | | | 190 | | | | 3,695 | |
Simon Property Group, Inc. | | | 275 | | | | 43,587 | |
SL Green Realty Corp. | | | 86 | | | | 8,881 | |
Summit Hotel Properties, Inc. | | | 45 | | | | 807 | |
Tanger Factory Outlet Centers, Inc. | | | 80 | | | | 2,114 | |
Taubman Centers, Inc. | | | 60 | | | | 3,412 | |
UDR, Inc. | | | 215 | | | | 8,404 | |
Uniti Group, Inc. | | | 130 | | | | 3,328 | |
Universal Health Realty Income Trust | | | 10 | | | | 775 | |
Urban Edge Properties | | | 85 | | | | 2,136 | |
Urstadt Biddle Properties, Inc. (Class A Stock) | | | 20 | | | | 419 | |
Ventas, Inc. | | | 306 | | | | 20,609 | |
Vornado Realty Trust | | | 160 | | | | 12,696 | |
Washington Prime Group, Inc. | | | 80 | | | | 722 | |
Weingarten Realty Investors | | | 100 | | | | 3,246 | |
Welltower, Inc. | | | 330 | | | | 24,219 | |
Weyerhaeuser Co. | | | 630 | | | | 20,803 | |
| | | | | | | | |
| | | | | | | 700,558 | |
| | |
Food & Staples Retailing 1.6% | | | | | | | | |
Andersons, Inc. (The) | | | 20 | | | | 689 | |
Casey’s General Stores, Inc. | | | 40 | | | | 4,270 | |
Costco Wholesale Corp. | | | 382 | | | | 60,551 | |
CVS Health Corp. | | | 883 | | | | 70,578 | |
Kroger Co. (The) | | | 772 | | | | 18,929 | |
SpartanNash Co. | | | 20 | | | | 555 | |
Sprouts Farmers Market, Inc.* | | | 110 | | | | 2,648 | |
SUPERVALU, Inc.* | | | 120 | | | | 430 | |
Sysco Corp. | | | 420 | | | | 22,100 | |
United Natural Foods, Inc.* | | | 50 | | | | 1,927 | |
Wal-Mart Stores, Inc. | | | 1,290 | | | | 103,187 | |
Walgreens Boots Alliance, Inc. | | | 744 | | | | 60,018 | |
Whole Foods Market, Inc. | | | 280 | | | | 11,693 | |
| | | | | | | | |
| | | | | | | 357,575 | |
See Notes to Financial Statements.
| | | | |
| Prudential Day One Underlying Funds | | | 77 | |
Prudential QMA US Broad Market Index Fund
Schedule of Investments (continued)
as of July 31, 2017
| | | | | | | | |
| Description | | Shares | | | Value | |
COMMON STOCKS (Continued) | | | | | | | | |
| | |
Food Products 1.3% | | | | | | | | |
Archer-Daniels-Midland Co. | | | 490 | | | $ | 20,668 | |
B&G Foods, Inc. | | | 56 | | | | 2,030 | |
Cal-Maine Foods, Inc.* | | | 20 | | | | 763 | |
Calavo Growers, Inc. | | | 10 | | | | 741 | |
Campbell Soup Co. | | | 170 | | | | 8,981 | |
Conagra Brands, Inc. | | | 350 | | | | 11,984 | |
Darling Ingredients, Inc.* | | | 130 | | | | 2,115 | |
Dean Foods Co. | | | 40 | | | | 600 | |
Flowers Foods, Inc. | | | 150 | | | | 2,639 | |
General Mills, Inc. | | | 510 | | | | 28,387 | |
Hain Celestial Group, Inc. (The)* | | | 90 | | | | 4,024 | |
Hershey Co. (The) | | | 125 | | | | 13,164 | |
Hormel Foods Corp. | | | 210 | | | | 7,176 | |
Ingredion, Inc. | | | 68 | | | | 8,386 | |
J&J Snack Foods Corp. | | | 20 | | | | 2,628 | |
J.M. Smucker Co. (The) | | | 102 | | | | 12,434 | |
John B. Sanfilippo & Son, Inc. | | | 10 | | | | 643 | |
Kellogg Co. | | | 220 | | | | 14,960 | |
Kraft Heinz Co. (The) | | | 518 | | | | 45,304 | |
Lamb Weston Holdings, Inc. | | | 120 | | | | 5,278 | |
Lancaster Colony Corp. | | | 25 | | | | 3,065 | |
McCormick & Co., Inc. | | | 100 | | | | 9,530 | |
Mondelez International, Inc. (Class A Stock) | | | 1,320 | | | | 58,106 | |
Post Holdings, Inc.* | | | 60 | | | | 4,992 | |
Sanderson Farms, Inc. | | | 25 | | | | 3,269 | |
Seneca Foods Corp. (Class A Stock)* | | | 16 | | | | 459 | |
Snyder’s-Lance, Inc. | | | 80 | | | | 2,783 | |
Tootsie Roll Industries, Inc. | | | 20 | | | | 744 | |
TreeHouse Foods, Inc.* | | | 50 | | | | 4,241 | |
Tyson Foods, Inc. (Class A Stock) | | | 250 | | | | 15,840 | |
| | | | | | | | |
| | | | | | | 295,934 | |
| | |
Gas Utilities 0.2% | | | | | | | | |
Atmos Energy Corp. | | | 90 | | | | 7,808 | |
National Fuel Gas Co. | | | 70 | | | | 4,145 | |
New Jersey Resources Corp. | | | 80 | | | | 3,372 | |
Northwest Natural Gas Co. | | | 40 | | | | 2,524 | |
ONE Gas, Inc. | | | 60 | | | | 4,367 | |
South Jersey Industries, Inc. | | | 60 | | | | 2,038 | |
Southwest Gas Holdings, Inc. | | | 46 | | | | 3,684 | |
Spire, Inc. | | | 48 | | | | 3,485 | |
See Notes to Financial Statements.
| | | | | | | | |
| Description | | Shares | | | Value | |
COMMON STOCKS (Continued) | | | | | | | | |
| | |
Gas Utilities (cont’d.) | | | | | | | | |
UGI Corp. | | | 140 | | | $ | 7,066 | |
WGL Holdings, Inc. | | | 50 | | | | 4,286 | |
| | | | | | | | |
| | | | | | | 42,775 | |
| | |
Health Care Equipment & Supplies 2.7% | | | | | | | | |
Abaxis, Inc. | | | 10 | | | | 470 | |
Abbott Laboratories | | | 1,513 | | | | 74,409 | |
ABIOMED, Inc.* | | | 41 | | | | 6,072 | |
Align Technology, Inc.* | | | 65 | | | | 10,870 | |
Analogic Corp. | | | 10 | | | | 702 | |
AngioDynamics, Inc.* | | | 30 | | | | 487 | |
Anika Therapeutics, Inc.* | | | 10 | | | | 512 | |
Baxter International, Inc. | | | 430 | | | | 26,006 | |
Becton Dickinson and Co. | | | 203 | | | | 40,884 | |
Boston Scientific Corp.* | | | 1,190 | | | | 31,678 | |
C.R. Bard, Inc. | | | 68 | | | | 21,801 | |
Cantel Medical Corp. | | | 40 | | | | 2,968 | |
CONMED Corp. | | | 26 | | | | 1,334 | |
Cooper Cos., Inc. (The) | | | 50 | | | | 12,193 | |
CryoLife, Inc.* | | | 30 | | | | 562 | |
Danaher Corp. | | | 536 | | | | 43,679 | |
DENTSPLY SIRONA, Inc. | | | 200 | | | | 12,406 | |
Edwards Lifesciences Corp.* | | | 188 | | | | 21,654 | |
Globus Medical, Inc. (Class A Stock)* | | | 60 | | | | 1,845 | |
Haemonetics Corp.* | | | 50 | | | | 2,056 | |
Halyard Health, Inc.* | | | 40 | | | | 1,609 | |
Hill-Rom Holdings, Inc. | | | 50 | | | | 3,726 | |
Hologic, Inc.* | | | 240 | | | | 10,610 | |
ICU Medical, Inc.* | | | 20 | | | | 3,438 | |
IDEXX Laboratories, Inc.* | | | 80 | | | | 13,317 | |
Inogen, Inc.* | | | 20 | | | | 1,888 | |
Integer Holdings Corp.* | | | 20 | | | | 916 | |
Integra LifeSciences Holdings Corp.* | | | 60 | | | | 2,980 | |
Intuitive Surgical, Inc.* | | | 36 | | | | 33,777 | |
Invacare Corp. | | | 40 | | | | 626 | |
Lantheus Holdings, Inc.* | | | 10 | | | | 185 | |
LeMaitre Vascular, Inc. | | | 17 | | | | 613 | |
LivaNova PLC* | | | 45 | | | | 2,742 | |
Masimo Corp.* | | | 47 | | | | 4,446 | |
Medtronic PLC | | | 1,192 | | | | 100,092 | |
Meridian Bioscience, Inc. | | | 44 | | | | 596 | |
Merit Medical Systems, Inc.* | | | 40 | | | | 1,640 | |
See Notes to Financial Statements.
| | | | |
| Prudential Day One Underlying Funds | | | 79 | |
Prudential QMA US Broad Market Index Fund
Schedule of Investments (continued)
as of July 31, 2017
| | | | | | | | |
| Description | | Shares | | | Value | |
COMMON STOCKS (Continued) | | | | | | | | |
| | |
Health Care Equipment & Supplies (cont’d.) | | | | | | | | |
Natus Medical, Inc.* | | | 10 | | | $ | 352 | |
Neogen Corp.* | | | 40 | | | | 2,635 | |
NuVasive, Inc.* | | | 45 | | | | 2,961 | |
OraSure Technologies, Inc.* | | | 25 | | | | 439 | |
Orthofix International NV* | | | 10 | | | | 434 | |
ResMed, Inc. | | | 116 | | | | 8,946 | |
STERIS PLC | | | 77 | | | | 6,302 | |
Stryker Corp. | | | 272 | | | | 40,011 | |
Surmodics, Inc.* | | | 20 | | | | 526 | |
Teleflex, Inc. | | | 40 | | | | 8,289 | |
Varex Imaging Corp.* | | | 16 | | | | 494 | |
Varian Medical Systems, Inc.* | | | 80 | | | | 7,770 | |
West Pharmaceutical Services, Inc. | | | 70 | | | | 6,209 | |
Zimmer Biomet Holdings, Inc. | | | 180 | | | | 21,838 | |
| | | | | | | | |
| | | | | | | 602,995 | |
| | |
Health Care Providers & Services 2.5% | | | | | | | | |
Acadia Healthcare Co., Inc.* | | | 75 | | | | 3,970 | |
Aceto Corp. | | | 30 | | | | 506 | |
Aetna, Inc. | | | 290 | | | | 44,750 | |
Almost Family, Inc.* | | | 10 | | | | 494 | |
Amedisys, Inc.* | | | 12 | | | | 568 | |
AmerisourceBergen Corp. | | | 150 | | | | 14,073 | |
AMN Healthcare Services, Inc.* | | | 20 | | | | 738 | |
Anthem, Inc. | | | 238 | | | | 44,318 | |
BioTelemetry, Inc.* | | | 26 | | | | 889 | |
Cardinal Health, Inc. | | | 270 | | | | 20,860 | |
Centene Corp.* | | | 156 | | | | 12,390 | |
Chemed Corp. | | | 15 | | | | 2,962 | |
Cigna Corp. | | | 230 | | | | 39,919 | |
Community Health Systems, Inc.* | | | 60 | | | | 429 | |
CorVel Corp.* | | | 14 | | | | 666 | |
Cross Country Healthcare, Inc.* | | | 30 | | | | 353 | |
DaVita, Inc.* | | | 130 | | | | 8,421 | |
Diplomat Pharmacy, Inc.* | | | 30 | | | | 476 | |
Ensign Group, Inc. (The) | | | 20 | | | | 447 | |
Envision Healthcare Corp.* | | | 92 | | | | 5,192 | |
Express Scripts Holding Co.* | | | 520 | | | | 32,573 | |
HCA Healthcare, Inc.* | | | 255 | | | | 20,487 | |
HealthEquity, Inc.* | | | 50 | | | | 2,293 | |
HealthSouth Corp. | | | 80 | | | | 3,405 | |
Henry Schein, Inc.* | | | 74 | | | | 13,484 | |
See Notes to Financial Statements.
| | | | | | | | |
| Description | | Shares | | | Value | |
COMMON STOCKS (Continued) | | | | | | | | |
| | |
Health Care Providers & Services (cont’d.) | | | | | | | | |
Humana, Inc. | | | 130 | | | $ | 30,056 | |
Kindred Healthcare, Inc. | | | 60 | | | | 537 | |
Laboratory Corp. of America Holdings* | | | 97 | | | | 15,414 | |
Landauer, Inc. | | | 6 | | | | 327 | |
LHC Group, Inc.* | | | 10 | | | | 579 | |
LifePoint Health, Inc.* | | | 50 | | | | 2,970 | |
Magellan Health, Inc.* | | | 24 | | | | 1,789 | |
McKesson Corp. | | | 183 | | | | 29,622 | |
MEDNAX, Inc.* | | | 80 | | | | 3,758 | |
Molina Healthcare, Inc.* | | | 50 | | | | 3,340 | |
Owens & Minor, Inc. | | | 30 | | | | 967 | |
Patterson Cos., Inc. | | | 74 | | | | 3,087 | |
PharMerica Corp.* | | | 20 | | | | 503 | |
Providence Service Corp. (The)* | | | 16 | | | | 825 | |
Quest Diagnostics, Inc. | | | 118 | | | | 12,781 | |
Quorum Health Corp.* | | | 50 | | | | 171 | |
Select Medical Holdings Corp.* | | | 50 | | | | 810 | |
Tenet Healthcare Corp.* | | | 30 | | | | 520 | |
Tivity Health, Inc.* | | | 20 | | | | 793 | |
UnitedHealth Group, Inc. | | | 841 | | | | 161,312 | |
Universal Health Services, Inc. (Class B Stock) | | | 80 | | | | 8,866 | |
US Physical Therapy, Inc. | | | 10 | | | | 631 | |
VCA, Inc.* | | | 70 | | | | 6,481 | |
WellCare Health Plans, Inc.* | | | 40 | | | | 7,080 | |
| | | | | | | | |
| | | | | | | 567,882 | |
| | |
Health Care Technology 0.1% | | | | | | | | |
Allscripts Healthcare Solutions, Inc.* | | | 150 | | | | 1,847 | |
Cerner Corp.* | | | 260 | | | | 16,736 | |
Computer Programs & Systems, Inc. | | | 20 | | | | 613 | |
HealthStream, Inc.* | | | 20 | | | | 472 | |
HMS Holdings Corp.* | | | 40 | | | | 803 | |
Medidata Solutions, Inc.* | | | 50 | | | | 3,841 | |
Omnicell, Inc.* | | | 40 | | | | 1,984 | |
Quality Systems, Inc.* | | | 30 | | | | 513 | |
| | | | | | | | |
| | | | | | | 26,809 | |
| | |
Hotels, Restaurants & Leisure 1.7% | | | | | | | | |
Belmond Ltd. (United Kingdom) (Class A Stock)* | | | 40 | | | | 522 | |
Biglari Holdings, Inc.* | | | 3 | | | | 1,123 | |
BJ’s Restaurants, Inc.* | | | 20 | | | | 706 | |
Bob Evans Farms, Inc. | | | 10 | | | | 692 | |
See Notes to Financial Statements.
| | | | |
| Prudential Day One Underlying Funds | | | 81 | |
Prudential QMA US Broad Market Index Fund
Schedule of Investments (continued)
as of July 31, 2017
| | | | | | | | |
| Description | | Shares | | | Value | |
COMMON STOCKS (Continued) | | | | | | | | |
| | |
Hotels, Restaurants & Leisure (cont’d.) | | | | | | | | |
Boyd Gaming Corp. | | | 32 | | | $ | 802 | |
Brinker International, Inc. | | | 20 | | | | 709 | |
Buffalo Wild Wings, Inc.* | | | 20 | | | | 2,150 | |
Carnival Corp. | | | 360 | | | | 24,041 | |
Cheesecake Factory, Inc. (The) | | | 50 | | | | 2,379 | |
Chipotle Mexican Grill, Inc.* | | | 30 | | | | 10,313 | |
Churchill Downs, Inc. | | | 10 | | | | 1,871 | |
Chuy’s Holdings, Inc.* | | | 20 | | | | 471 | |
Cracker Barrel Old Country Store, Inc. | | | 24 | | | | 3,731 | |
Darden Restaurants, Inc. | | | 110 | | | | 9,227 | |
Dave & Buster’s Entertainment, Inc.* | | | 40 | | | | 2,484 | |
DineEquity, Inc. | | | 10 | | | | 411 | |
Domino’s Pizza, Inc. | | | 42 | | | | 7,833 | |
Dunkin’ Brands Group, Inc. | | | 80 | | | | 4,242 | |
El Pollo Loco Holdings, Inc.* | | | 31 | | | | 403 | |
Fiesta Restaurant Group, Inc.* | | | 30 | | | | 504 | |
Hilton Worldwide Holdings, Inc. | | | 186 | | | | 11,631 | |
ILG, Inc. | | | 86 | | | | 2,280 | |
International Speedway Corp. (Class A Stock) | | | 20 | | | | 716 | |
Jack in the Box, Inc. | | | 34 | | | | 3,154 | |
Marcus Corp. (The) | | | 20 | | | | 544 | |
Marriott International, Inc. (Class A Stock) | | | 270 | | | | 28,131 | |
Marriott Vacations Worldwide Corp. | | | 30 | | | | 3,506 | |
McDonald’s Corp. | | | 708 | | | | 109,839 | |
MGM Resorts International | | | 410 | | | | 13,501 | |
Monarch Casino & Resort, Inc.* | | | 20 | | | | 662 | |
Papa John’s International, Inc. | | | 16 | | | | 1,141 | |
Penn National Gaming, Inc.* | | | 40 | | | | 806 | |
Red Robin Gourmet Burgers, Inc.* | | | 10 | | | | 598 | |
Royal Caribbean Cruises Ltd. | | | 150 | | | | 16,961 | |
Ruby Tuesday, Inc.* | | | 140 | | | | 283 | |
Ruth’s Hospitality Group, Inc. | | | 30 | | | | 600 | |
Scientific Games Corp. (Class A Stock)* | | | 30 | | | | 1,112 | |
Shake Shack, Inc. (Class A Stock)* | | | 10 | | | | 330 | |
Sonic Corp. | | | 20 | | | | 473 | |
Starbucks Corp. | | | 1,263 | | | | 68,177 | |
Texas Roadhouse, Inc. | | | 60 | | | | 2,838 | |
Wendy’s Co. (The) | | | 160 | | | | 2,470 | |
Wingstop, Inc.* | | | 10 | | | | 300 | |
Wyndham Worldwide Corp. | | | 90 | | | | 9,393 | |
Wynn Resorts Ltd. | | | 77 | | | | 9,959 | |
Yum! Brands, Inc. | | | 290 | | | | 21,889 | |
| | | | | | | | |
| | | | | | | 385,908 | |
See Notes to Financial Statements.
| | | | | | | | |
| Description | | Shares | | | Value | |
COMMON STOCKS (Continued) | | | | | | | | |
| | |
Household Durables 0.6% | | | | | | | | |
CalAtlantic Group, Inc. | | | 60 | | | $ | 2,106 | |
Cavco Industries, Inc.* | | | 10 | | | | 1,304 | |
D.R. Horton, Inc. | | | 300 | | | | 10,707 | |
Ethan Allen Interiors, Inc. | | | 20 | | | | 641 | |
Garmin Ltd. | | | 90 | | | | 4,517 | |
Helen of Troy Ltd.* | | | 28 | | | | 2,821 | |
Installed Building Products, Inc.* | | | 20 | | | | 1,076 | |
iRobot Corp.* | | | 29 | | | | 3,060 | |
KB Home | | | 40 | | | | 917 | |
La-Z-Boy, Inc. | | | 20 | | | | 676 | |
Leggett & Platt, Inc. | | | 110 | | | | 5,300 | |
Lennar Corp. (Class A Stock) | | | 180 | | | | 9,439 | |
LGI Homes, Inc.* | | | 20 | | | | 886 | |
M/I Homes, Inc.* | | | 20 | | | | 519 | |
MDC Holdings, Inc. | | | 21 | | | | 720 | |
Meritage Homes Corp.* | | | 20 | | | | 815 | |
Mohawk Industries, Inc.* | | | 60 | | | | 14,939 | |
Newell Brands, Inc. | | | 426 | | | | 22,459 | |
NVR, Inc.* | | | 4 | | | | 10,442 | |
PulteGroup, Inc. | | | 220 | | | | 5,372 | |
Tempur Sealy International, Inc.* | | | 50 | | | | 2,883 | |
Toll Brothers, Inc. | | | 120 | | | | 4,631 | |
TopBuild Corp.* | | | 40 | | | | 2,111 | |
TRI Pointe Group, Inc.* | | | 135 | | | | 1,796 | |
Tupperware Brands Corp. | | | 50 | | | | 3,035 | |
Universal Electronics, Inc.* | | | 10 | | | | 685 | |
Whirlpool Corp. | | | 65 | | | | 11,562 | |
William Lyon Homes (Class A Stock)* | | | 10 | | | | 226 | |
| | | | | | | | |
| | | | | | | 125,645 | |
| | |
Household Products 1.5% | | | | | | | | |
Central Garden & Pet Co.* | | | 20 | | | | 640 | |
Central Garden & Pet Co. (Class A Stock)* | | | 20 | | | | 615 | |
Church & Dwight Co., Inc. | | | 220 | | | | 11,737 | |
Clorox Co. (The) | | | 110 | | | | 14,684 | |
Colgate-Palmolive Co. | | | 770 | | | | 55,594 | |
Energizer Holdings, Inc. | | | 56 | | | | 2,580 | |
Kimberly-Clark Corp. | | | 310 | | | | 38,180 | |
Procter & Gamble Co. (The) | | | 2,212 | | | | 200,894 | |
WD-40 Co. | | | 10 | | | | 1,066 | |
| | | | | | | | |
| | | | | | | 325,990 | |
See Notes to Financial Statements.
| | | | |
| Prudential Day One Underlying Funds | | | 83 | |
Prudential QMA US Broad Market Index Fund
Schedule of Investments (continued)
as of July 31, 2017
| | | | | | | | |
| Description | | Shares | | | Value | |
COMMON STOCKS (Continued) | | | | | | | | |
| | |
Independent Power & Renewable Electricity Producers 0.1% | | | | | | | | |
AES Corp. | | | 520 | | | $ | 5,814 | |
NRG Energy, Inc. | | | 250 | | | | 6,155 | |
| | | | | | | | |
| | | | | | | 11,969 | |
| | |
Industrial Conglomerates 1.9% | | | | | | | | |
3M Co. | | | 520 | | | | 104,609 | |
Carlisle Cos., Inc. | | | 60 | | | | 5,855 | |
General Electric Co. | | | 7,520 | | | | 192,587 | |
Honeywell International, Inc. | | | 666 | | | | 90,656 | |
Raven Industries, Inc. | | | 20 | | | | 688 | |
Roper Technologies, Inc. | | | 94 | | | | 21,851 | |
| | | | | | | | |
| | | | | | | 416,246 | |
| | |
Insurance 2.7% | | | | | | | | |
Aflac, Inc. | | | 340 | | | | 27,115 | |
Alleghany Corp.* | | | 14 | | | | 8,587 | |
Allstate Corp. (The) | | | 320 | | | | 29,120 | |
American Equity Investment Life Holding Co. | | | 70 | | | | 1,875 | |
American Financial Group, Inc. | | | 68 | | | | 6,895 | |
American International Group, Inc. | | | 765 | | | | 50,069 | |
AMERISAFE, Inc. | | | 10 | | | | 578 | |
Aon PLC | | | 228 | | | | 31,503 | |
Arthur J Gallagher & Co. | | | 160 | | | | 9,406 | |
Aspen Insurance Holdings Ltd. (Bermuda) | | | 60 | | | | 2,928 | |
Assurant, Inc. | | | 50 | | | | 5,263 | |
Brown & Brown, Inc. | | | 90 | | | | 4,014 | |
Chubb Ltd. | | | 405 | | | | 59,316 | |
Cincinnati Financial Corp. | | | 134 | | | | 10,205 | |
CNO Financial Group, Inc. | | | 140 | | | | 3,203 | |
eHealth, Inc.* | | | 30 | | | | 510 | |
Employers Holdings, Inc. | | | 20 | | | | 867 | |
Everest Re Group Ltd. | | | 35 | | | | 9,184 | |
First American Financial Corp. | | | 90 | | | | 4,357 | |
Genworth Financial, Inc. (Class A Stock)* | | | 330 | | | | 1,132 | |
Hanover Insurance Group, Inc. (The) | | | 48 | | | | 4,553 | |
Hartford Financial Services Group, Inc. (The) | | | 310 | | | | 17,050 | |
HCI Group, Inc. | | | 14 | | | | 631 | |
Horace Mann Educators Corp. | | | 20 | | | | 738 | |
Infinity Property & Casualty Corp. | | | 10 | | | | 1,001 | |
Kemper Corp. | | | 20 | | | | 785 | |
Lincoln National Corp. | | | 200 | | | | 14,612 | |
See Notes to Financial Statements.
| | | | | | | | |
| Description | | Shares | | | Value | |
COMMON STOCKS (Continued) | | | | | | | | |
| | |
Insurance (cont’d.) | | | | | | | | |
Loews Corp. | | | 240 | | | $ | 11,683 | |
Maiden Holdings Ltd. | | | 30 | | | | 333 | |
Marsh & McLennan Cos., Inc. | | | 455 | | | | 35,476 | |
Mercury General Corp. | | | 40 | | | | 2,396 | |
MetLife, Inc. | | | 930 | | | | 51,150 | |
Navigators Group, Inc. (The) | | | 20 | | | | 1,140 | |
Old Republic International Corp. | | | 190 | | | | 3,728 | |
Primerica, Inc. | | | 50 | | | | 4,053 | |
Principal Financial Group, Inc. | | | 240 | | | | 16,020 | |
ProAssurance Corp. | | | 60 | | | | 3,708 | |
Progressive Corp. (The) | | | 498 | | | | 23,471 | |
Prudential Financial, Inc. | | | 380 | | | | 43,027 | |
Reinsurance Group of America, Inc. | | | 58 | | | | 8,132 | |
RenaissanceRe Holdings Ltd. (Bermuda) | | | 41 | | | | 6,023 | |
RLI Corp. | | | 40 | | | | 2,322 | |
Safety Insurance Group, Inc. | | | 10 | | | | 710 | |
Selective Insurance Group, Inc. | | | 60 | | | | 3,039 | |
Stewart Information Services Corp. | | | 10 | | | | 393 | |
Torchmark Corp. | | | 90 | | | | 7,107 | |
Travelers Cos., Inc. (The) | | | 248 | | | | 31,766 | |
United Fire Group, Inc. | | | 10 | | | | 451 | |
United Insurance Holdings Corp. | | | 30 | | | | 479 | |
Universal Insurance Holdings, Inc. | | | 20 | | | | 477 | |
Unum Group | | | 205 | | | | 10,277 | |
W.R. Berkley Corp. | | | 80 | | | | 5,518 | |
Willis Towers Watson PLC | | | 110 | | | | 16,377 | |
XL Group Ltd. (Bermuda) | | | 230 | | | | 10,212 | |
| | | | | | | | |
| | | | | | | 604,965 | |
| | |
Internet & Direct Marketing Retail 2.3% | | | | | | | | |
Amazon.com, Inc.* | | | 342 | | | | 337,821 | |
Expedia, Inc. | | | 107 | | | | 16,742 | |
FTD Cos., Inc.* | | | 20 | | | | 393 | |
HSN, Inc. | | | 20 | | | | 793 | |
Netflix, Inc.* | | | 377 | | | | 68,486 | |
Nutrisystem, Inc. | | | 20 | | | | 1,115 | |
PetMed Express, Inc. | | | 20 | | | | 951 | |
Priceline Group, Inc. (The)* | | | 43 | | | | 87,226 | |
Shutterfly, Inc.* | | | 35 | | | | 1,716 | |
TripAdvisor, Inc.* | | | 100 | | | | 3,902 | |
| | | | | | | | |
| | | | | | | 519,145 | |
See Notes to Financial Statements.
| | | | |
| Prudential Day One Underlying Funds | | | 85 | |
Prudential QMA US Broad Market Index Fund
Schedule of Investments (continued)
as of July 31, 2017
| | | | | | | | |
| Description | | Shares | | | Value | |
COMMON STOCKS (Continued) | | | | | | | | |
| | |
Internet Software & Services 4.0% | | | | | | | | |
Akamai Technologies, Inc.* | | | 140 | | | $ | 6,600 | |
Alphabet, Inc. | | | | | | | | |
(Class A Stock)* | | | 261 | | | | 246,775 | |
(Class C Stock)* | | | 260 | | | | 241,930 | |
Blucora, Inc.* | | | 30 | | | | 672 | |
Cars.com, Inc.* | | | 33 | | | | 802 | |
DHI Group, Inc.* | | | 70 | | | | 154 | |
eBay, Inc.* | | | 880 | | | | 31,442 | |
Facebook, Inc. (Class A Stock)* | | | 2,058 | | | | 348,316 | |
j2 Global, Inc. | | | 47 | | | | 3,978 | |
Liquidity Services, Inc.* | | | 50 | | | | 340 | |
LivePerson, Inc.* | | | 50 | | | | 678 | |
LogMeIn, Inc. | | | 50 | | | | 5,823 | |
NIC, Inc. | | | 30 | | | | 488 | |
QuinStreet, Inc.* | | | 110 | | | | 428 | |
Shutterstock, Inc.* | | | 10 | | | | 421 | |
SPS Commerce, Inc.* | | | 10 | | | | 578 | |
Stamps.com, Inc.* | | | 20 | | | | 2,962 | |
VeriSign, Inc.* | | | 84 | | | | 8,498 | |
WebMD Health Corp.* | | | 40 | | | | 2,650 | |
XO Group, Inc.* | | | 30 | | | | 548 | |
| | | | | | | | |
| | | | | | | 904,083 | |
| | |
IT Services 3.5% | | | | | | | | |
Accenture PLC (Class A Stock) | | | 538 | | | | 69,305 | |
Acxiom Corp.* | | | 60 | | | | 1,618 | |
Alliance Data Systems Corp. | | | 50 | | | | 12,071 | |
Automatic Data Processing, Inc. | | | 390 | | | | 46,375 | |
Broadridge Financial Solutions, Inc. | | | 114 | | | | 8,648 | |
CACI International, Inc. (Class A Stock)* | | | 26 | | | | 3,253 | |
Cardtronics PLC (Class A Stock)* | | | 20 | | | | 626 | |
Cognizant Technology Solutions Corp. (Class A Stock) | | | 520 | | | | 36,046 | |
Convergys Corp. | | | 80 | | | | 1,918 | |
CoreLogic, Inc.* | | | 80 | | | | 3,644 | |
CSG Systems International, Inc. | | | 30 | | | | 1,241 | |
CSRA, Inc. | | | 110 | | | | 3,587 | |
DST Systems, Inc. | | | 60 | | | | 3,294 | |
DXC Technology Co. | | | 249 | | | | 19,517 | |
ExlService Holdings, Inc.* | | | 34 | | | | 1,957 | |
Fidelity National Information Services, Inc. | | | 290 | | | | 26,454 | |
Fiserv, Inc.* | | | 190 | | | | 24,415 | |
Forrester Research, Inc. | | | 16 | | | | 653 | |
Gartner, Inc.* | | | 82 | | | | 10,522 | |
See Notes to Financial Statements.
| | | | | | | | |
| Description | | Shares | | | Value | |
COMMON STOCKS (Continued) | | | | | | | | |
| | |
IT Services (cont’d.) | | | | | | | | |
Global Payments, Inc. | | | 137 | | | $ | 12,929 | |
International Business Machines Corp. | | | 745 | | | | 107,779 | |
Jack Henry & Associates, Inc. | | | 70 | | | | 7,512 | |
Leidos Holdings, Inc. | | | 130 | | | | 6,947 | |
ManTech International Corp. (Class A Stock) | | | 10 | | | | 397 | |
Mastercard, Inc. (Class A Stock) | | | 815 | | | | 104,157 | |
MAXIMUS, Inc. | | | 60 | | | | 3,622 | |
NeuStar, Inc. (Class A Stock)* | | | 50 | | | | 1,670 | |
Paychex, Inc. | | | 278 | | | | 16,082 | |
PayPal Holdings, Inc.* | | | 963 | | | | 56,384 | |
Perficient, Inc.* | | | 30 | | | | 564 | |
Sabre Corp. | | | 160 | | | | 3,541 | |
Science Applications International Corp. | | | 50 | | | | 3,520 | |
Sykes Enterprises, Inc.* | | | 20 | | | | 680 | |
TeleTech Holdings, Inc. | | | 20 | | | | 836 | |
Teradata Corp.* | | | 110 | | | | 3,500 | |
Total System Services, Inc. | | | 150 | | | | 9,519 | |
Virtusa Corp.* | | | 20 | | | | 663 | |
Visa, Inc. (Class A Stock) | | | 1,607 | | | | 159,993 | |
Western Union Co. (The) | | | 370 | | | | 7,307 | |
WEX, Inc.* | | | 40 | | | | 4,347 | |
| | | | | | | | |
| | | | | | | 787,093 | |
| | |
Leisure Products 0.1% | | | | | | | | |
Brunswick Corp. | | | 80 | | | | 4,529 | |
Callaway Golf Co. | | | 40 | | | | 509 | |
Hasbro, Inc. | | | 100 | | | | 10,588 | |
Mattel, Inc. | | | 270 | | | | 5,406 | |
Nautilus, Inc.* | | | 30 | | | | 528 | |
Polaris Industries, Inc. | | | 50 | | | | 4,483 | |
Sturm Ruger & Co., Inc. | | | 10 | | | | 576 | |
Vista Outdoor, Inc.* | | | 24 | | | | 554 | |
| | | | | | | | |
| | | | | | | 27,173 | |
| | |
Life Sciences Tools & Services 0.7% | | | | | | | | |
Agilent Technologies, Inc. | | | 280 | | | | 16,741 | |
Albany Molecular Research, Inc.* | | | 30 | | | | 652 | |
Bio-Rad Laboratories, Inc. (Class A Stock)* | | | 24 | | | | 5,655 | |
Bio-Techne Corp. | | | 40 | | | | 4,636 | |
Cambrex Corp.* | | | 36 | | | | 2,196 | |
Charles River Laboratories International, Inc.* | | | 50 | | | | 4,910 | |
Illumina, Inc.* | | | 130 | | | | 22,601 | |
See Notes to Financial Statements.
| | | | |
| Prudential Day One Underlying Funds | | | 87 | |
Prudential QMA US Broad Market Index Fund
Schedule of Investments (continued)
as of July 31, 2017
| | | | | | | | |
| Description | | Shares | | | Value | |
COMMON STOCKS (Continued) | | | | | | | | |
| | |
Life Sciences Tools & Services (cont’d.) | | | | | | | | |
INC Research Holdings, Inc. (Class A Stock)* | | | 55 | | | $ | 3,025 | |
Luminex Corp. | | | 20 | | | | 409 | |
Mettler-Toledo International, Inc.* | | | 23 | | | | 13,181 | |
PAREXEL International Corp.* | | | 46 | | | | 4,026 | |
PerkinElmer, Inc. | | | 90 | | | | 5,925 | |
Thermo Fisher Scientific, Inc. | | | 346 | | | | 60,733 | |
Waters Corp.* | | | 77 | | | | 13,355 | |
| | | | | | | | |
| | | | | | | 158,045 | |
| | |
Machinery 1.8% | | | | | | | | |
Actuant Corp. (Class A Stock) | | | 30 | | | | 726 | |
AGCO Corp. | | | 70 | | | | 5,050 | |
Alamo Group, Inc. | | | 10 | | | | 930 | |
Albany International Corp. (Class A Stock) | | | 30 | | | | 1,605 | |
Astec Industries, Inc. | | | 10 | | | | 503 | |
Barnes Group, Inc. | | | 50 | | | | 3,009 | |
Briggs & Stratton Corp. | | | 20 | | | | 468 | |
Caterpillar, Inc. | | | 513 | | | | 58,456 | |
Chart Industries, Inc.* | | | 20 | | | | 680 | |
CIRCOR International, Inc. | | | 10 | | | | 501 | |
Crane Co. | | | 50 | | | | 3,775 | |
Cummins, Inc. | | | 136 | | | | 22,834 | |
Deere & Co. | | | 258 | | | | 33,096 | |
Donaldson Co., Inc. | | | 110 | | | | 5,224 | |
Dover Corp. | | | 146 | | | | 12,264 | |
EnPro Industries, Inc. | | | 30 | | | | 2,311 | |
ESCO Technologies, Inc. | | | 30 | | | | 1,851 | |
Federal Signal Corp. | | | 30 | | | | 555 | |
Flowserve Corp. | | | 100 | | | | 4,113 | |
Fortive Corp. | | | 260 | | | | 16,832 | |
Franklin Electric Co., Inc. | | | 20 | | | | 808 | |
Graco, Inc. | | | 52 | | | | 6,034 | |
Greenbrier Cos., Inc. (The) | | | 20 | | | | 900 | |
Harsco Corp.* | | | 40 | | | | 618 | |
Hillenbrand, Inc. | | | 54 | | | | 1,944 | |
IDEX Corp. | | | 70 | | | | 8,158 | |
Illinois Tool Works, Inc. | | | 274 | | | | 38,555 | |
Ingersoll-Rand PLC | | | 220 | | | | 19,334 | |
ITT, Inc. | | | 80 | | | | 3,280 | |
John Bean Technologies Corp. | | | 40 | | | | 3,696 | |
Kennametal, Inc. | | | 70 | | | | 2,583 | |
Lincoln Electric Holdings, Inc. | | | 60 | | | | 5,236 | |
See Notes to Financial Statements.
| | | | | | | | |
| Description | | Shares | | | Value | |
COMMON STOCKS (Continued) | | | | | | | | |
| | |
Machinery (cont’d.) | | | | | | | | |
Lindsay Corp. | | | 10 | | | $ | 917 | |
Lydall, Inc.* | | | 10 | | | | 495 | |
Mueller Industries, Inc. | | | 50 | | | | 1,575 | |
Nordson Corp. | | | 50 | | | | 6,350 | |
Oshkosh Corp. | | | 70 | | | | 4,820 | |
PACCAR, Inc. | | | 300 | | | | 20,535 | |
Parker-Hannifin Corp. | | | 124 | | | | 20,582 | |
Pentair PLC (United Kingdom) | | | 140 | | | | 8,830 | |
Proto Labs, Inc.* | | | 27 | | | | 1,995 | |
Snap-on, Inc. | | | 50 | | | | 7,710 | |
SPX Corp.* | | | 20 | | | | 550 | |
SPX FLOW, Inc.* | | | 20 | | | | 709 | |
Standex International Corp. | | | 10 | | | | 959 | |
Stanley Black & Decker, Inc. | | | 136 | | | | 19,134 | |
Tennant Co. | | | 10 | | | | 755 | |
Terex Corp. | | | 80 | | | | 3,150 | |
Timken Co. (The) | | | 70 | | | | 3,185 | |
Titan International, Inc. | | | 42 | | | | 536 | |
Toro Co. (The) | | | 90 | | | | 6,398 | |
Trinity Industries, Inc. | | | 130 | | | | 3,563 | |
Wabash National Corp. | | | 30 | | | | 572 | |
Wabtec Corp. | | | 70 | | | | 5,275 | |
Watts Water Technologies, Inc. (Class A Stock) | | | 35 | | | | 2,254 | |
Woodward, Inc. | | | 60 | | | | 4,196 | |
Xylem, Inc. | | | 160 | | | | 9,077 | |
| | | | | | | | |
| | | | | | | 400,051 | |
| | |
Marine 0.0% | | | | | | | | |
Kirby Corp.* | | | 60 | | | | 3,654 | |
Matson, Inc. | | | 20 | | | | 564 | |
| | | | | | | | |
| | | | | | | 4,218 | |
| | |
Media 2.7% | | | | | | | | |
AMC Networks, Inc. (Class A Stock)* | | | 50 | | | | 3,197 | |
Cable One, Inc. | | | 13 | | | | 9,879 | |
CBS Corp. (Class B Stock) | | | 320 | | | | 21,066 | |
Charter Communications, Inc. (Class A Stock)* | | | 190 | | | | 74,463 | |
Cinemark Holdings, Inc. | | | 85 | | | | 3,306 | |
Comcast Corp. (Class A Stock) | | | 4,116 | | | | 166,492 | |
Discovery Communications, Inc. | | | | | | | | |
(Class A Stock)* | | | 120 | | | | 2,952 | |
(Class C Stock)* | | | 160 | | | | 3,701 | |
See Notes to Financial Statements.
| | | | |
| Prudential Day One Underlying Funds | | | 89 | |
Prudential QMA US Broad Market Index Fund
Schedule of Investments (continued)
as of July 31, 2017
| | | | | | | | |
| Description | | Shares | | | Value | |
COMMON STOCKS (Continued) | | | | | | | | |
| | |
Media (cont’d.) | | | | | | | | |
DISH Network Corp. (Class A Stock)* | | | 200 | | | $ | 12,806 | |
EW Scripps Co. (The) (Class A Stock)* | | | 30 | | | | 589 | |
Gannett Co., Inc. | | | 50 | | | | 449 | |
Interpublic Group of Cos., Inc. (The) | | | 310 | | | | 6,699 | |
John Wiley & Sons, Inc. (Class A Stock) | | | 50 | | | | 2,762 | |
Live Nation Entertainment, Inc.* | | | 110 | | | | 4,100 | |
Meredith Corp. | | | 40 | | | | 2,378 | |
New Media Investment Group, Inc. | | | 20 | | | | 279 | |
New York Times Co. (The) (Class A Stock) | | | 100 | | | | 1,900 | |
News Corp. | | | | | | | | |
(Class A Stock) | | | 300 | | | | 4,293 | |
(Class B Stock) | | | 50 | | | | 735 | |
Omnicom Group, Inc. | | | 204 | | | | 16,063 | |
Scholastic Corp. | | | 10 | | | | 414 | |
Scripps Networks Interactive, Inc. (Class A Stock) | | | 90 | | | | 7,867 | |
TEGNA, Inc. | | | 180 | | | | 2,669 | |
Time Warner, Inc. | | | 680 | | | | 69,646 | |
Time, Inc. | | | 40 | | | | 562 | |
Twenty-First Century Fox, Inc. | | | | | | | | |
(Class A Stock) | | | 910 | | | | 26,481 | |
(Class B Stock) | | | 420 | | | | 12,050 | |
Viacom, Inc. (Class B Stock) | | | 310 | | | | 10,825 | |
Walt Disney Co. (The) | | | 1,269 | | | | 139,501 | |
World Wrestling Entertainment, Inc. (Class A Stock) | | | 30 | | | | 635 | |
| | | | | | | | |
| | | | | | | 608,759 | |
| | |
Metals & Mining 0.4% | | | | | | | | |
AK Steel Holding Corp.* | | | 140 | | | | 792 | |
Allegheny Technologies, Inc. | | | 50 | | | | 947 | |
Carpenter Technology Corp. | | | 40 | | | | 1,617 | |
Century Aluminum Co.* | | | 40 | | | | 671 | |
Commercial Metals Co. | | | 100 | | | | 1,860 | |
Compass Minerals International, Inc. | | | 40 | | | | 2,762 | |
Freeport-McMoRan, Inc.* | | | 1,140 | | | | 16,667 | |
Haynes International, Inc. | | | 16 | | | | 500 | |
Kaiser Aluminum Corp. | | | 20 | | | | 1,946 | |
Materion Corp. | | | 20 | | | | 769 | |
Newmont Mining Corp. | | | 450 | | | | 16,726 | |
Nucor Corp. | | | 280 | | | | 16,148 | |
Olympic Steel, Inc. | | | 20 | | | | 342 | |
Reliance Steel & Aluminum Co. | | | 70 | | | | 5,065 | |
Royal Gold, Inc. | | | 56 | | | | 4,853 | |
See Notes to Financial Statements.
| | | | | | | | |
| Description | | Shares | | | Value | |
COMMON STOCKS (Continued) | | | | | | | | |
| | |
Metals & Mining (cont’d.) | | | | | | | | |
Steel Dynamics, Inc. | | | 190 | | | $ | 6,728 | |
SunCoke Energy, Inc.* | | | 40 | | | | 358 | |
TimkenSteel Corp.* | | | 30 | | | | 477 | |
United States Steel Corp. | | | 140 | | | | 3,289 | |
Worthington Industries, Inc. | | | 50 | | | | 2,534 | |
| | | | | | | | |
| | | | | | | 85,051 | |
| | |
Mortgage Real Estate Investment Trusts (REITs) 0.0% | | | | | | | | |
Apollo Commercial Real Estate Finance, Inc. | | | 50 | | | | 902 | |
Capstead Mortgage Corp. | | | 40 | | | | 391 | |
| | | | | | | | |
| | | | | | | 1,293 | |
| | |
Multi-Utilities 0.9% | | | | | | | | |
Ameren Corp. | | | 210 | | | | 11,781 | |
Avista Corp. | | | 50 | | | | 2,631 | |
Black Hills Corp. | | | 60 | | | | 4,180 | |
CenterPoint Energy, Inc. | | | 390 | | | | 10,994 | |
CMS Energy Corp. | | | 240 | | | | 11,098 | |
Consolidated Edison, Inc. | | | 272 | | | | 22,538 | |
Dominion Energy, Inc. | | | 542 | | | | 41,832 | |
DTE Energy Co. | | | 158 | | | | 16,915 | |
MDU Resources Group, Inc. | | | 150 | | | | 3,952 | |
NiSource, Inc. | | | 250 | | | | 6,515 | |
NorthWestern Corp. | | | 50 | | | | 2,889 | |
Public Service Enterprise Group, Inc. | | | 430 | | | | 19,337 | |
SCANA Corp. | | | 120 | | | | 7,724 | |
Sempra Energy | | | 216 | | | | 24,410 | |
Vectren Corp. | | | 70 | | | | 4,208 | |
WEC Energy Group, Inc. | | | 270 | | | | 17,002 | |
| | | | | | | | |
| | | | | | | 208,006 | |
| | |
Multiline Retail 0.4% | | | | | | | | |
Big Lots, Inc. | | | 50 | | | | 2,484 | |
Dillard’s, Inc. (Class A Stock) | | | 30 | | | | 2,215 | |
Dollar General Corp. | | | 220 | | | | 16,535 | |
Dollar Tree, Inc.* | | | 206 | | | | 14,848 | |
Fred’s, Inc. (Class A Stock) | | | 30 | | | | 203 | |
J.C. Penney Co., Inc.* | | | 140 | | | | 757 | |
Kohl’s Corp. | | | 150 | | | | 6,203 | |
Macy’s, Inc. | | | 240 | | | | 5,700 | |
Nordstrom, Inc. | | | 90 | | | | 4,371 | |
See Notes to Financial Statements.
| | | | |
| Prudential Day One Underlying Funds | | | 91 | |
Prudential QMA US Broad Market Index Fund
Schedule of Investments (continued)
as of July 31, 2017
| | | | | | | | |
| Description | | Shares | | | Value | |
COMMON STOCKS (Continued) | | | | | | | | |
| | |
Multiline Retail (cont’d.) | | | | | | | | |
Ollie’s Bargain Outlet Holdings, Inc.* | | | 50 | | | $ | 2,235 | |
Target Corp. | | | 484 | | | | 27,428 | |
| | | | | | | | |
| | | | | | | 82,979 | |
| | |
Oil, Gas & Consumable Fuels 4.4% | | | | | | | | |
Anadarko Petroleum Corp. | | | 480 | | | | 21,922 | |
Apache Corp. | | | 330 | | | | 16,328 | |
Bill Barrett Corp.* | | | 55 | | | | 186 | |
Cabot Oil & Gas Corp. | | | 370 | | | | 9,202 | |
Carrizo Oil & Gas, Inc.* | | | 40 | | | | 630 | |
Chesapeake Energy Corp.*(a) | | | 640 | | | | 3,174 | |
Chevron Corp. | | | 1,646 | | | | 179,727 | |
Cimarex Energy Co. | | | 80 | | | | 7,922 | |
Cloud Peak Energy, Inc.* | | | 75 | | | | 260 | |
Concho Resources, Inc.* | | | 130 | | | | 16,934 | |
ConocoPhillips | | | 1,080 | | | | 49,000 | |
CONSOL Energy, Inc.* | | | 140 | | | | 2,346 | |
Contango Oil & Gas Co.* | | | 50 | | | | 300 | |
Denbury Resources, Inc.* | | | 180 | | | | 263 | |
Devon Energy Corp. | | | 450 | | | | 14,989 | |
Energen Corp.* | | | 90 | | | | 4,795 | |
EOG Resources, Inc. | | | 506 | | | | 48,141 | |
EQT Corp. | | | 160 | | | | 10,192 | |
Exxon Mobil Corp. | | | 3,669 | | | | 293,667 | |
Green Plains, Inc. | | | 20 | | | | 395 | |
Gulfport Energy Corp.* | | | 130 | | | | 1,641 | |
Hess Corp. | | | 240 | | | | 10,690 | |
HollyFrontier Corp. | | | 140 | | | | 4,038 | |
Kinder Morgan, Inc. | | | 1,670 | | | | 34,118 | |
Marathon Oil Corp. | | | 680 | | | | 8,316 | |
Marathon Petroleum Corp. | | | 454 | | | | 25,419 | |
Matador Resources Co.* | | | 50 | | | | 1,213 | |
Murphy Oil Corp. | | | 130 | | | | 3,455 | |
Newfield Exploration Co.* | | | 150 | | | | 4,310 | |
Noble Energy, Inc. | | | 390 | | | | 11,275 | |
Northern Oil and Gas, Inc.* | | | 100 | | | | 125 | |
Occidental Petroleum Corp. | | | 658 | | | | 40,750 | |
ONEOK, Inc. | | | 340 | | | | 19,234 | |
PBF Energy, Inc. (Class A Stock) | | | 95 | | | | 2,163 | |
PDC Energy, Inc.* | | | 50 | | | | 2,358 | |
Phillips 66 | | | 380 | | | | 31,825 | |
Pioneer Natural Resources Co. | | | 153 | | | | 24,954 | |
See Notes to Financial Statements.
| | | | | | | | |
| Description | | Shares | | | Value | |
COMMON STOCKS (Continued) | | | | | | | | |
| | |
Oil, Gas & Consumable Fuels (cont’d.) | | | | | | | | |
QEP Resources, Inc.* | | | 110 | | | $ | 943 | |
Range Resources Corp. | | | 160 | | | | 3,378 | |
REX American Resources Corp.* | | | 6 | | | | 600 | |
SM Energy Co. | | | 45 | | | | 783 | |
Southwestern Energy Co.* | | | 420 | | | | 2,394 | |
SRC Energy, Inc.* | | | 90 | | | | 766 | |
Tesoro Corp. | | | 140 | | | | 13,934 | |
Valero Energy Corp. | | | 400 | | | | 27,588 | |
Williams Cos., Inc. (The) | | | 700 | | | | 22,246 | |
World Fuel Services Corp. | | | 60 | | | | 1,940 | |
WPX Energy, Inc.* | | | 330 | | | | 3,557 | |
| | | | | | | | |
| | | | | | | 984,386 | |
| | |
Paper & Forest Products 0.0% | | | | | | | | |
Boise Cascade Co.* | | | 20 | | | | 607 | |
Clearwater Paper Corp.* | | | 10 | | | | 492 | |
Deltic Timber Corp. | | | 10 | | | | 721 | |
Domtar Corp. | | | 60 | | | | 2,344 | |
KapStone Paper & Packaging Corp. | | | 40 | | | | 915 | |
Louisiana-Pacific Corp.* | | | 110 | | | | 2,762 | |
Neenah Paper, Inc. | | | 20 | | | | 1,598 | |
P.H. Glatfelter Co. | | | 20 | | | | 409 | |
Schweitzer-Mauduit International, Inc. | | | 10 | | | | 384 | |
| | | | | | | | |
| | | | | | | 10,232 | |
| | |
Personal Products 0.2% | | | | | | | | |
Avon Products, Inc. (United Kingdom)* | | | 200 | | | | 728 | |
Coty, Inc. (Class A Stock) | | | 370 | | | | 7,578 | |
Edgewell Personal Care Co.* | | | 60 | | | | 4,332 | |
Estee Lauder Cos., Inc. (The) (Class A Stock) | | | 196 | | | | 19,402 | |
Inter Parfums, Inc. | | | 20 | | | | 776 | |
Medifast, Inc. | | | 12 | | | | 512 | |
Nu Skin Enterprises, Inc. (Class A Stock) | | | 52 | | | | 3,295 | |
| | | | | | | | |
| | | | | | | 36,623 | |
| | |
Pharmaceuticals 4.2% | | | | | | | | |
Akorn, Inc.* | | | 78 | | | | 2,622 | |
Allergan PLC | | | 300 | | | | 75,699 | |
Amphastar Pharmaceuticals, Inc.* | | | 20 | | | | 346 | |
ANI Pharmaceuticals, Inc.* | | | 10 | | | | 487 | |
Bristol-Myers Squibb Co. | | | 1,433 | | | | 81,538 | |
See Notes to Financial Statements.
| | | | |
| Prudential Day One Underlying Funds | | | 93 | |
Prudential QMA US Broad Market Index Fund
Schedule of Investments (continued)
as of July 31, 2017
| | | | | | | | |
| Description | | Shares | | | Value | |
COMMON STOCKS (Continued) | | | | | | | | |
| | |
Pharmaceuticals (cont’d.) | | | | | | | | |
Catalent, Inc.* | | | 110 | | | $ | 3,817 | |
Depomed, Inc.* | | | 30 | | | | 309 | |
Eli Lilly & Co. | | | 850 | | | | 70,261 | |
Endo International PLC* | | | 170 | | | | 1,873 | |
Heska Corp.* | | | 3 | | | | 329 | |
Impax Laboratories, Inc.* | | | 30 | | | | 581 | |
Innoviva, Inc.* | | | 40 | | | | 549 | |
Johnson & Johnson | | | 2,339 | | | | 310,432 | |
Lannett Co., Inc.* | | | 20 | | | | 407 | |
Mallinckrodt PLC* | | | 90 | | | | 4,122 | |
Medicines Co. (The)* | | | 70 | | | | 2,691 | |
Merck & Co., Inc. | | | 2,383 | | | | 152,226 | |
Mylan NV* | | | 396 | | | | 15,440 | |
Nektar Therapeutics* | | | 130 | | | | 2,838 | |
Perrigo Co. PLC | | | 120 | | | | 8,990 | |
Pfizer, Inc. | | | 5,190 | | | | 172,100 | |
Phibro Animal Health Corp. (Class A Stock) | | | 20 | | | | 764 | |
Prestige Brands Holdings, Inc.* | | | 50 | | | | 2,682 | |
SciClone Pharmaceuticals, Inc.* | | | 40 | | | | 438 | |
Sucampo Pharmaceuticals, Inc. (Class A Stock)* | | | 10 | | | | 109 | |
Supernus Pharmaceuticals, Inc.* | | | 50 | | | | 2,023 | |
Zoetis, Inc. | | | 420 | | | | 26,258 | |
| | | | | | | | |
| | | | | | | 939,931 | |
| | |
Professional Services 0.4% | | | | | | | | |
CDI Corp.* | | | 40 | | | | 330 | |
Dun & Bradstreet Corp. (The) | | | 40 | | | | 4,430 | |
Equifax, Inc. | | | 107 | | | | 15,562 | |
Exponent, Inc. | | | 30 | | | | 1,956 | |
FTI Consulting, Inc.* | | | 20 | | | | 656 | |
Heidrick & Struggles International, Inc. | | | 20 | | | | 362 | |
IHS Markit Ltd.* | | | 270 | | | | 12,595 | |
Insperity, Inc. | | | 10 | | | | 755 | |
Kelly Services, Inc. (Class A Stock) | | | 20 | | | | 445 | |
Korn/Ferry International | | | 50 | | | | 1,673 | |
ManpowerGroup, Inc. | | | 60 | | | | 6,429 | |
Navigant Consulting, Inc.* | | | 20 | | | | 339 | |
Nielsen Holdings PLC | | | 290 | | | | 12,473 | |
On Assignment, Inc.* | | | 50 | | | | 2,463 | |
Resources Connection, Inc. | | | 30 | | | | 401 | |
Robert Half International, Inc. | | | 100 | | | | 4,525 | |
TrueBlue, Inc.* | | | 20 | | | | 511 | |
See Notes to Financial Statements.
| | | | | | | | |
| Description | | Shares | | | Value | |
COMMON STOCKS (Continued) | | | | | | | | |
| | |
Professional Services (cont’d.) | | | | | | | | |
Verisk Analytics, Inc.* | | | 140 | | | $ | 12,216 | |
WageWorks, Inc.* | | | 40 | | | | 2,608 | |
| | | | | | | | |
| | | | | | | 80,729 | |
| | |
Real Estate Management & Development 0.1% | | | | | | | | |
Alexander & Baldwin, Inc. | | | 40 | | | | 1,677 | |
CBRE Group, Inc. (Class A Stock)* | | | 240 | | | | 9,118 | |
Forestar Group, Inc.* | | | 40 | | | | 686 | |
HFF, Inc. (Class A Stock) | | | 20 | | | | 734 | |
Jones Lang LaSalle, Inc. | | | 48 | | | | 6,107 | |
RE/MAX Holdings, Inc. (Class A Stock) | | | 10 | | | | 581 | |
| | | | | | | | |
| | | | | | | 18,903 | |
| | |
Road & Rail 0.8% | | | | | | | | |
ArcBest Corp. | | | 20 | | | | 556 | |
Avis Budget Group, Inc.* | | | 70 | | | | 2,155 | |
CSX Corp. | | | 800 | | | | 39,472 | |
Genesee & Wyoming, Inc. (Class A Stock)* | | | 62 | | | | 4,040 | |
Heartland Express, Inc. | | | 20 | | | | 423 | |
J.B. Hunt Transport Services, Inc. | | | 80 | | | | 7,257 | |
Kansas City Southern | | | 90 | | | | 9,287 | |
Knight Transportation, Inc. | | | 60 | | | | 2,139 | |
Landstar System, Inc. | | | 40 | | | | 3,326 | |
Marten Transport Ltd. | | | 33 | | | | 526 | |
Norfolk Southern Corp. | | | 250 | | | | 28,145 | |
Old Dominion Freight Line, Inc. | | | 60 | | | | 5,754 | |
Roadrunner Transportation Systems, Inc.* | | | 40 | | | | 279 | |
Ryder System, Inc. | | | 60 | | | | 4,366 | |
Saia, Inc.* | | | 30 | | | | 1,630 | |
Union Pacific Corp. | | | 700 | | | | 72,072 | |
Werner Enterprises, Inc. | | | 20 | | | | 593 | |
| | | | | | | | |
| | | | | | | 182,020 | |
| | |
Semiconductors & Semiconductor Equipment 3.2% | | | | | | | | |
Advanced Energy Industries, Inc.* | | | 50 | | | | 3,628 | |
Advanced Micro Devices, Inc.*(a) | | | 620 | | | | 8,438 | |
Analog Devices, Inc. | | | 315 | | | | 24,888 | |
Applied Materials, Inc. | | | 930 | | | | 41,208 | |
Broadcom Ltd. | | | 355 | | | | 87,564 | |
Brooks Automation, Inc. | | | 30 | | | | 737 | |
Cabot Microelectronics Corp. | | | 30 | | | | 2,225 | |
See Notes to Financial Statements.
| | | | |
| Prudential Day One Underlying Funds | | | 95 | |
Prudential QMA US Broad Market Index Fund
Schedule of Investments (continued)
as of July 31, 2017
| | | | | | | | |
| Description | | Shares | | | Value | |
COMMON STOCKS (Continued) | | | | | | | | |
| | |
Semiconductors & Semiconductor Equipment (cont’d.) | | | | | | | | |
CEVA, Inc.* | | | 16 | | | $ | 740 | |
Cirrus Logic, Inc.* | | | 60 | | | | 3,686 | |
Cohu, Inc. | | | 40 | | | | 729 | |
Cree, Inc.* | | | 80 | | | | 2,073 | |
Cypress Semiconductor Corp. | | | 260 | | | | 3,692 | |
Diodes, Inc.* | | | 30 | | | | 796 | |
DSP Group, Inc.* | | | 40 | | | | 504 | |
First Solar, Inc.* | | | 70 | | | | 3,452 | |
Integrated Device Technology, Inc.* | | | 80 | | | | 2,091 | |
Intel Corp. | | | 4,090 | | | | 145,072 | |
KLA-Tencor Corp. | | | 140 | | | | 12,968 | |
Kopin Corp.* | | | 130 | | | | 494 | |
Kulicke & Soffa Industries, Inc. (Singapore)* | | | 30 | | | | 646 | |
Lam Research Corp. | | | 145 | | | | 23,122 | |
MaxLinear, Inc.* | | | 30 | | | | 786 | |
Microchip Technology, Inc. | | | 205 | | | | 16,408 | |
Micron Technology, Inc.* | | | 904 | | | | 25,421 | |
Microsemi Corp.* | | | 100 | | | | 5,208 | |
MKS Instruments, Inc. | | | 55 | | | | 4,601 | |
Monolithic Power Systems, Inc. | | | 40 | | | | 4,093 | |
Nanometrics, Inc.* | | | 20 | | | | 533 | |
NVIDIA Corp. | | | 517 | | | | 84,018 | |
Power Integrations, Inc. | | | 33 | | | | 2,331 | |
Qorvo, Inc.* | | | 104 | | | | 7,130 | |
QUALCOMM, Inc. | | | 1,290 | | | | 68,615 | |
Rambus, Inc.* | | | 50 | | | | 645 | |
Rudolph Technologies, Inc.* | | | 30 | | | | 743 | |
Semtech Corp.* | | | 60 | | | | 2,376 | |
Silicon Laboratories, Inc.* | | | 50 | | | | 3,755 | |
Skyworks Solutions, Inc. | | | 160 | | | | 16,779 | |
SolarEdge Technologies, Inc.* | | | 20 | | | | 459 | |
Synaptics, Inc.* | | | 20 | | | | 1,052 | |
Teradyne, Inc. | | | 160 | | | | 5,534 | |
Texas Instruments, Inc. | | | 870 | | | | 70,801 | |
Veeco Instruments, Inc.* | | | 25 | | | | 770 | |
Versum Materials, Inc. | | | 90 | | | | 3,173 | |
Xilinx, Inc. | | | 220 | | | | 13,917 | |
Xperi Corp. | | | 20 | | | | 585 | |
| | | | | | | | |
| | | | | | | 708,486 | |
| | |
Software 4.4% | | | | | | | | |
8x8, Inc.* | | | 40 | | | | 508 | |
ACI Worldwide, Inc.* | | | 90 | | | | 2,085 | |
See Notes to Financial Statements.
| | | | | | | | |
| Description | | Shares | | | Value | |
COMMON STOCKS (Continued) | | | | | | | | |
| | |
Software (cont’d.) | | | | | | | | |
Activision Blizzard, Inc. | | | 610 | | | $ | 37,686 | |
Adobe Systems, Inc.* | | | 438 | | | | 64,163 | |
Agilysys, Inc.* | | | 40 | | | | 402 | |
ANSYS, Inc.* | | | 77 | | | | 9,975 | |
Autodesk, Inc.* | | | 172 | | | | 19,056 | |
Blackbaud, Inc. | | | 50 | | | | 4,617 | |
Bottomline Technologies de, Inc.* | | | 20 | | | | 570 | |
CA, Inc. | | | 250 | | | | 7,760 | |
Cadence Design Systems, Inc.* | | | 220 | | | | 8,118 | |
CDK Global, Inc. | | | 120 | | | | 7,894 | |
Citrix Systems, Inc.* | | | 140 | | | | 11,057 | |
CommVault Systems, Inc.* | | | 50 | | | | 2,977 | |
Ebix, Inc. | | | 10 | | | | 578 | |
Electronic Arts, Inc.* | | | 276 | | | | 32,220 | |
Fair Isaac Corp. | | | 40 | | | | 5,702 | |
Fortinet, Inc.* | | | 120 | | | | 4,429 | |
Gigamon, Inc.* | | | 15 | | | | 596 | |
Intuit, Inc. | | | 218 | | | | 29,912 | |
Manhattan Associates, Inc.* | | | 70 | | | | 3,094 | |
Microsoft Corp. | | | 6,690 | | | | 486,363 | |
MicroStrategy, Inc. (Class A Stock)* | | | 8 | | | | 1,076 | |
Monotype Imaging Holdings, Inc. | | | 30 | | | | 566 | |
Oracle Corp. | | | 2,610 | | | | 130,317 | |
Progress Software Corp. | | | 28 | | | | 896 | |
PTC, Inc.* | | | 90 | | | | 4,967 | |
Qualys, Inc.* | | | 20 | | | | 803 | |
Red Hat, Inc.* | | | 153 | | | | 15,127 | |
salesforce.com, Inc.* | | | 586 | | | | 53,209 | |
Symantec Corp. | | | 520 | | | | 16,115 | |
Synchronoss Technologies, Inc.* | | | 20 | | | | 338 | |
Synopsys, Inc.* | | | 140 | | | | 10,720 | |
Take-Two Interactive Software, Inc.* | | | 90 | | | | 7,153 | |
TiVo Corp. | | | 100 | | | | 1,960 | |
Tyler Technologies, Inc.* | | | 32 | | | | 5,498 | |
Ultimate Software Group, Inc. (The)* | | | 26 | | | | 5,868 | |
VASCO Data Security International, Inc.* | | | 30 | | | | 405 | |
| | | | | | | | |
| | | | | | | 994,780 | |
| | |
Specialty Retail 2.0% | | | | | | | | |
Aaron’s, Inc. | | | 60 | | | | 2,777 | |
Abercrombie & Fitch Co. (Class A Stock) | | | 30 | | | | 295 | |
Advance Auto Parts, Inc. | | | 63 | | | | 7,057 | |
See Notes to Financial Statements.
| | | | |
| Prudential Day One Underlying Funds | | | 97 | |
Prudential QMA US Broad Market Index Fund
Schedule of Investments (continued)
as of July 31, 2017
| | | | | | | | |
| Description | | Shares | | | Value | |
COMMON STOCKS (Continued) | | | | | | | | |
| | |
Specialty Retail (cont’d.) | | | | | | | | |
American Eagle Outfitters, Inc. | | | 80 | | | $ | 947 | |
Asbury Automotive Group, Inc.* | | | 10 | | | | 540 | |
Ascena Retail Group, Inc.* | | | 70 | | | | 164 | |
AutoNation, Inc.* | | | 60 | | | | 2,543 | |
AutoZone, Inc.* | | | 25 | | | | 13,495 | |
Barnes & Noble Education, Inc.* | | | 40 | | | | 289 | |
Barnes & Noble, Inc. | | | 40 | | | | 326 | |
Bed Bath & Beyond, Inc. | | | 120 | | | | 3,588 | |
Best Buy Co., Inc. | | | 230 | | | | 13,418 | |
Big 5 Sporting Goods Corp. | | | 30 | | | | 323 | |
Buckle, Inc. (The) | | | 20 | | | | 342 | |
Cabela’s, Inc.* | | | 54 | | | | 3,077 | |
Caleres, Inc. | | | 20 | | | | 546 | |
CarMax, Inc.* | | | 170 | | | | 11,262 | |
Cato Corp. (The) (Class A Stock) | | | 20 | | | | 340 | |
Chico’s FAS, Inc. | | | 60 | | | | 549 | |
Children’s Place, Inc. (The) | | | 20 | | | | 2,113 | |
Dick’s Sporting Goods, Inc. | | | 80 | | | | 2,987 | |
DSW, Inc. (Class A Stock) | | | 30 | | | | 541 | |
Express, Inc.* | | | 30 | | | | 182 | |
Finish Line, Inc. (The) (Class A Stock) | | | 20 | | | | 275 | |
Five Below, Inc.* | | | 50 | | | | 2,415 | |
Foot Locker, Inc. | | | 110 | | | | 5,191 | |
Francesca’s Holdings Corp.* | | | 30 | | | | 292 | |
GameStop Corp. (Class A Stock) | | | 50 | | | | 1,084 | |
Gap, Inc. (The) | | | 170 | | | | 4,051 | |
Genesco, Inc.* | | | 10 | | | | 321 | |
Group 1 Automotive, Inc. | | | 10 | | | | 596 | |
Guess?, Inc. | | | 30 | | | | 392 | |
Haverty Furniture Cos., Inc. | | | 20 | | | | 445 | |
Hibbett Sports, Inc.* | | | 10 | | | | 156 | |
Home Depot, Inc. (The) | | | 1,042 | | | | 155,883 | |
Kirkland’s, Inc.* | | | 30 | | | | 281 | |
L Brands, Inc. | | | 210 | | | | 9,742 | |
Lithia Motors, Inc. (Class A Stock) | | | 20 | | | | 2,065 | |
Lowe’s Cos., Inc. | | | 740 | | | | 57,276 | |
Lumber Liquidators Holdings, Inc.* | | | 30 | | | | 741 | |
MarineMax, Inc.* | | | 26 | | | | 389 | |
Michaels Cos., Inc. (The)* | | | 90 | | | | 1,813 | |
Monro Muffler Brake, Inc. | | | 35 | | | | 1,631 | |
Murphy USA, Inc.* | | | 40 | | | | 3,029 | |
O’Reilly Automotive, Inc.* | | | 83 | | | | 16,957 | |
See Notes to Financial Statements.
| | | | | | | | |
| Description | | Shares | | | Value | |
COMMON STOCKS (Continued) | | | | | | | | |
| | |
Specialty Retail (cont’d.) | | | | | | | | |
Office Depot, Inc. | | | 430 | | | $ | 2,524 | |
Rent-A-Center, Inc. | | | 40 | | | | 529 | |
RH* | | | 20 | | | | 1,303 | |
Ross Stores, Inc. | | | 350 | | | | 19,362 | |
Sally Beauty Holdings, Inc.* | | | 112 | | | | 2,266 | |
Select Comfort Corp.* | | | 20 | | | | 676 | |
Shoe Carnival, Inc. | | | 20 | | | | 365 | |
Signet Jewelers Ltd. | | | 70 | | | | 4,281 | |
Sonic Automotive, Inc. (Class A Stock) | | | 20 | | | | 363 | |
Staples, Inc. | | | 520 | | | | 5,278 | |
Tailored Brands, Inc. | | | 30 | | | | 376 | |
Tiffany & Co. | | | 100 | | | | 9,551 | |
Tile Shop Holdings, Inc. | | | 30 | | | | 438 | |
TJX Cos., Inc. (The) | | | 560 | | | | 39,374 | |
Tractor Supply Co. | | | 120 | | | | 6,734 | |
Ulta Beauty, Inc.* | | | 56 | | | | 14,068 | |
Urban Outfitters, Inc.* | | | 40 | | | | 784 | |
Vitamin Shoppe, Inc.* | | | 20 | | | | 220 | |
Williams-Sonoma, Inc. | | | 80 | | | | 3,714 | |
Zumiez, Inc.* | | | 20 | | | | 254 | |
| | | | | | | | |
| | | | | | | 445,186 | |
| | |
Technology Hardware, Storage & Peripherals 3.5% | | | | | | | | |
3D Systems Corp.* | | | 50 | | | | 840 | |
Apple, Inc. | | | 4,510 | | | | 670,772 | |
Cray, Inc.* | | | 30 | | | | 618 | |
Diebold Nixdorf, Inc. | | | 30 | | | | 702 | |
Electronics For Imaging, Inc.* | | | 50 | | | | 2,429 | |
Hewlett Packard Enterprise Co. | | | 1,404 | | | | 24,584 | |
HP, Inc. | | | 1,420 | | | | 27,122 | |
NCR Corp.* | | | 104 | | | | 3,936 | |
NetApp, Inc. | | | 240 | | | | 10,421 | |
Seagate Technology PLC | | | 240 | | | | 7,911 | |
Super Micro Computer, Inc.* | | | 20 | | | | 537 | |
Western Digital Corp. | | | 260 | | | | 22,131 | |
Xerox Corp. | | | 167 | | | | 5,122 | |
| | | | | | | | |
| | | | | | | 777,125 | |
| | |
Textiles, Apparel & Luxury Goods 0.6% | | | | | | | | |
Carter’s, Inc. | | | 50 | | | | 4,336 | |
Coach, Inc. | | | 248 | | | | 11,691 | |
Crocs, Inc.* | | | 50 | | | | 397 | |
See Notes to Financial Statements.
��
| | | | |
| Prudential Day One Underlying Funds | | | 99 | |
Prudential QMA US Broad Market Index Fund
Schedule of Investments (continued)
as of July 31, 2017
| | | | | | | | |
| Description | | Shares | | | Value | |
COMMON STOCKS (Continued) | | | | | | | | |
| | |
Textiles, Apparel & Luxury Goods (cont’d.) | | | | | | | | |
Deckers Outdoor Corp.* | | | 31 | | | $ | 2,011 | |
Fossil Group, Inc.* | | | 20 | | | | 225 | |
G-III Apparel Group Ltd.* | | | 20 | | | | 521 | |
Hanesbrands, Inc. | | | 283 | | | | 6,486 | |
Iconix Brand Group, Inc.* | | | 50 | | | | 334 | |
Michael Kors Holdings Ltd.* | | | 130 | | | | 4,737 | |
Movado Group, Inc. | | | 20 | | | | 492 | |
NIKE, Inc. (Class B Stock) | | | 1,156 | | | | 68,262 | |
Oxford Industries, Inc. | | | 10 | | | | 631 | |
Perry Ellis International, Inc.* | | | 20 | | | | 393 | |
PVH Corp. | | | 70 | | | | 8,350 | |
Ralph Lauren Corp. | | | 60 | | | | 4,539 | |
Skechers U.S.A., Inc. (Class A Stock)* | | | 100 | | | | 2,809 | |
Steven Madden Ltd.* | | | 40 | | | | 1,640 | |
Under Armour, Inc. | | | | | | | | |
(Class A Stock)* | | | 150 | | | | 3,003 | |
(Class C Stock)* | | | 150 | | | | 2,717 | |
Unifi, Inc.* | | | 20 | | | | 655 | |
Vera Bradley, Inc.* | | | 30 | | | | 302 | |
VF Corp. | | | 273 | | | | 16,978 | |
Wolverine World Wide, Inc. | | | 80 | | | | 2,256 | |
| | | | | | | | |
| | | | | | | 143,765 | |
| | |
Thrifts & Mortgage Finance 0.1% | | | | | | | | |
Astoria Financial Corp. | | | 40 | | | | 807 | |
Bank Mutual Corp. | | | 50 | | | | 497 | |
Bofi Holding, Inc.* | | | 30 | | | | 836 | |
Dime Community Bancshares, Inc. | | | 30 | | | | 624 | |
HomeStreet, Inc.* | | | 10 | | | | 262 | |
LendingTree, Inc.* | | | 8 | | | | 1,765 | |
New York Community Bancorp, Inc. | | | 390 | | | | 5,121 | |
Northfield Bancorp, Inc. | | | 30 | | | | 504 | |
Northwest Bancshares, Inc. | | | 50 | | | | 805 | |
Oritani Financial Corp. | | | 30 | | | | 498 | |
Provident Financial Services, Inc. | | | 30 | | | | 796 | |
TrustCo Bank Corp. | | | 50 | | | | 415 | |
Walker & Dunlop, Inc.* | | | 20 | | | | 1,005 | |
Washington Federal, Inc. | | | 80 | | | | 2,676 | |
| | | | | | | | |
| | | | | | | 16,611 | |
| | |
Tobacco 1.2% | | | | | | | | |
Altria Group, Inc. | | | 1,680 | | | | 109,149 | |
Philip Morris International, Inc. | | | 1,356 | | | | 158,259 | |
Universal Corp. | | | 24 | | | | 1,535 | |
| | | | | | | | |
| | | | | | | 268,943 | |
See Notes to Financial Statements.
| | | | | | | | | | | | | | | | |
| Description | | | | | | | | Shares | | | Value | |
COMMON STOCKS (Continued) | | | | | | | | | | | | | | | | |
|
Trading Companies & Distributors 0.2% | |
Applied Industrial Technologies, Inc. | | | | | | | | | | | 40 | | | $ | 2,260 | |
DXP Enterprises, Inc.* | | | | | | | | | | | 20 | | | | 572 | |
Fastenal Co. | | | | | | | | | | | 250 | | | | 10,740 | |
GATX Corp. | | | | | | | | | | | 40 | | | | 2,473 | |
Kaman Corp. | | | | | | | | | | | 30 | | | | 1,534 | |
MSC Industrial Direct Co., Inc. (Class A Stock) | | | | | | | | | | | 50 | | | | 3,560 | |
NOW, Inc.* | | | | | | | | | | | 90 | | | | 1,434 | |
United Rentals, Inc.* | | | | | | | | | | | 80 | | | | 9,517 | |
Veritiv Corp.* | | | | | | | | | | | 6 | | | | 223 | |
W.W. Grainger, Inc. | | | | | | | | | | | 46 | | | | 7,670 | |
Watsco, Inc. | | | | | | | | | | | 25 | | | | 3,769 | |
| | | | | | | | | | | | | | | | |
| | | | | | | | | | | | | | | 43,752 | |
|
Water Utilities 0.1% | |
American States Water Co. | | | | | | | | | | | 40 | | | | 1,978 | |
American Water Works Co., Inc. | | | | | | | | | | | 158 | | | | 12,814 | |
Aqua America, Inc. | | | | | | | | | | | 140 | | | | 4,673 | |
California Water Service Group | | | | | | | | | | | 20 | | | | 778 | |
| | | | | | | | | | | | | | | | |
| | | | | | | | | | | | | | | 20,243 | |
|
Wireless Telecommunication Services 0.0% | |
Spok Holdings, Inc. | | | | | | | | | | | 30 | | | | 492 | |
Telephone & Data Systems, Inc. | | | | | | | | | | | 80 | | | | 2,274 | |
| | | | | | | | | | | | | | | | |
| | | | | | | | | | | | | | | 2,766 | |
| | | | | | | | | | | | | | | | |
TOTAL COMMON STOCKS
(cost $19,160,785) | | | | | | | | | | | | | | | 20,523,167 | |
| | | | | | | | | | | | | | | | |
|
UNAFFILIATED EXCHANGE TRADED FUNDS 3.2% | |
SPDR S&P 500 ETF Trust | | | | | | | | | | | 2,613 | | | | 644,810 | |
iShares Core S&P Mid-Cap ETF | | | | | | | | | | | 305 | | | | 53,524 | |
iShares Core S&P Small-Cap ETF | | | | | | | | | | | 300 | | | | 21,243 | |
| | | | | | | | | | | | | | | | |
TOTAL UNAFFILIATED EXCHANGE TRADED FUNDS
(cost $684,497) | | | | | | | | | | | | | | | 719,577 | |
| | | | | | | | | | | | | | | | |
TOTAL LONG-TERM INVESTMENTS
(cost $19,845,282) | | | | | | | | | | | | | | | 21,242,744 | |
| | | | | | | | | | | | | | | | |
See Notes to Financial Statements.
| | | | |
| Prudential Day One Underlying Funds | | | 101 | |
Prudential QMA US Broad Market Index Fund
Schedule of Investments (continued)
as of July 31, 2017
| | | | | | | | | | | | | | | | |
| Description | | Interest
Rate | | | Maturity
Date | | | Shares | | | Value | |
SHORT-TERM INVESTMENTS 13.1% | | | | | | | | | | | | | | | | |
| | | | |
AFFILIATED MUTUAL FUNDS 12.8% | | | | | | | | | | | | | | | | |
Prudential Investment Portfolios 2 - Prudential Core Ultra Short Bond Fund(w) | | | | | | | | | | | 2,837,115 | | | $ | 2,837,115 | |
Prudential Investment Portfolios 2 - Prudential Institutional Money Market Fund
(cost $13,879; includes $13,867 of cash collateral for securities on loan)(b)(w) | | | | | | | | | | | 13,877 | | | | 13,878 | |
| | | | | | | | | | | | | | | | |
TOTAL AFFILIATED MUTUAL FUNDS
(cost $2,850,994) | | | | | | | | | | | | | | | 2,850,993 | |
| | | | | | | | | | | | | | | | |
| | | | |
| | | | | | | | | Principal
Amount (000)# | | | | |
U.S. TREASURY OBLIGATION(k)(n) 0.3% | | | | | | | | | | | | | | | | |
U.S. Treasury Bill
(cost $59,919) | | | 0.960 | % | | | 09/21/17 | | | | 60 | | | | 59,919 | |
| | | | | | | | | | | | | | | | |
TOTAL SHORT-TERM INVESTMENTS
(cost $2,910,913) | | | | | | | | | | | | | | | 2,910,912 | |
| | | | | | | | | | | | | | | | |
TOTAL INVESTMENTS 108.0%
(cost $22,756,195) | | | | | | | | | | | | | | | 24,153,656 | |
Liabilities in excess of other assets(z) (8.0)% | | | | | | | | | | | | | | | (1,779,383 | ) |
| | | | | | | | | | | | | | | | |
NET ASSETS 100.0% | | | | | | | | | | | | | | $ | 22,374,273 | |
| | | | | | | | | | | | | | | | |
See the Glossary for abbreviations used in the annual report.
| # | Principal amount is shown in U.S. dollars unless otherwise stated. |
| * | Non-income producing security. |
| (a) | All or a portion of security is on loan. The aggregate market value of such securities, including those sold and pending settlement, is $13,417; cash collateral of $13,867 (included with liabilities) was received with which the Portfolio purchased highly liquid short-term investments. Securities on loan are subject to contractual netting arrangements. |
| (b) | Represents security purchased with cash collateral received for securities on loan and includes dividend reinvestment. |
| (k) | Represents security, or a portion thereof, segregated as collateral for futures contracts. |
| (n) | Rates shown reflect yield to maturity at purchase date. |
| (w) | PGIM Investments LLC, the manager of the Fund, also serves as manager of the Prudential Investment Portfolios 2 - Prudential Core Ultra Short Bond Fund and Prudential Institutional Money Market Fund. |
| (z) | Includes net unrealized appreciation (depreciation) on the following derivative contracts held at reporting period end: |
See Notes to Financial Statements.
Futures contracts outstanding at July 31, 2017:
| | | | | | | | | | | | | | | | | | | | |
Number of
Contracts | | | Type | | Expiration
Date | | | Value at
Trade Date | | | Value at
July 31,
2017 | | | Unrealized
Appreciation
(Depreciation) | |
| | | | Long Position: | | | | | | | | | | | | | | | | |
| | 9 | | | S&P 500 E-Mini Index | | | Sep. 2017 | | | $ | 1,112,225 | | | $ | 1,110,600 | | | $ | (1,625 | ) |
| | | | | | | | | | | | | | | | | | | | |
A Security with a market value of $59,919 has been segregated with Morgan Stanley to cover requirements for open futures contracts at July 31, 2017.
Fair Value Measurements:
Various inputs are used in determining the value of the Fund’s investments. These inputs are summarized in the three broad levels listed below.
Level 1—unadjusted quoted prices generally in active markets for identical securities.
Level 2—quoted prices for similar securities, interest rates and yield curves, prepayment speeds, foreign currency exchange rates and other observable inputs.
Level 3—unobservable inputs for securities valued in accordance with Board approved fair valuation procedures.
The following is a summary of the inputs used as of July 31, 2017 in valuing such portfolio securities:
| | | | | | | | | | | | |
| | | Level 1 | | | Level 2 | | | Level 3 | |
Investments in Securities | | | | | | | | | | | | |
Common Stocks | | | | | | | | | | | | |
Aerospace & Defense | | $ | 494,034 | | | $ | — | | | $ | — | |
Air Freight & Logistics | | | 132,115 | | | | — | | | | — | |
Airlines | | | 121,112 | | | | — | | | | — | |
Auto Components | | | 54,390 | | | | — | | | | — | |
Automobiles | | | 94,755 | | | | — | | | | — | |
Banks | | | 1,334,907 | | | | — | | | | — | |
Beverages | | | 387,328 | | | | — | | | | — | |
Biotechnology | | | 580,555 | | | | — | | | | — | |
Building Products | | | 84,241 | | | | — | | | | — | |
Capital Markets | | | 612,599 | | | | — | | | | — | |
Chemicals | | | 453,370 | | | | — | | | | — | |
Commercial Services & Supplies | | | 101,670 | | | | — | | | | — | |
Communications Equipment | | | 212,935 | | | | — | | | | — | |
See Notes to Financial Statements.
| | | | |
| Prudential Day One Underlying Funds | | | 103 | |
Prudential QMA US Broad Market Index Fund
Schedule of Investments (continued)
as of July 31, 2017
| | | | | | | | | | | | |
| | | Level 1 | | | Level 2 | | | Level 3 | |
Investments in Securities (continued) | | | | | | | | | | | | |
Common Stocks (continued) | | | | | | | | | | | | |
Construction & Engineering | | $ | 35,427 | | | $ | — | | | $ | — | |
Construction Materials | | | 33,660 | | | | — | | | | — | |
Consumer Finance | | | 146,176 | | | | — | | | | — | |
Containers & Packaging | | | 85,338 | | | | — | | | | — | |
Distributors | | | 25,538 | | | | — | | | | — | |
Diversified Consumer Services | | | 20,142 | | | | — | | | | — | |
Diversified Financial Services | | | 295,364 | | | | — | | | | — | |
Diversified Telecommunication Services | | | 411,904 | | | | — | | | | — | |
Electric Utilities | | | 398,663 | | | | — | | | | — | |
Electrical Equipment | | | 123,413 | | | | — | | | | — | |
Electronic Equipment, Instruments & Components | | | 175,495 | | | | — | | | | — | |
Energy Equipment & Services | | | 182,408 | | | | — | | | | — | |
Equity Real Estate Investment Trusts (REITs) | | | 700,558 | | | | — | | | | — | |
Food & Staples Retailing | | | 357,575 | | | | — | | | | — | |
Food Products | | | 295,934 | | | | — | | | | — | |
Gas Utilities | | | 42,775 | | | | — | | | | — | |
Health Care Equipment & Supplies | | | 602,995 | | | | — | | | | — | |
Health Care Providers & Services | | | 567,882 | | | | — | | | | — | |
Health Care Technology | | | 26,809 | | | | — | | | | — | |
Hotels, Restaurants & Leisure | | | 385,908 | | | | — | | | | — | |
Household Durables | | | 125,645 | | | | — | | | | — | |
Household Products | | | 325,990 | | | | — | | | | — | |
Independent Power & Renewable Electricity Producers | | | 11,969 | | | | — | | | | — | |
Industrial Conglomerates | | | 416,246 | | | | — | | | | — | |
Insurance | | | 604,965 | | | | — | | | | — | |
Internet & Direct Marketing Retail | | | 519,145 | | | | — | | | | — | |
Internet Software & Services | | | 904,083 | | | | — | | | | — | |
IT Services | | | 787,093 | | | | — | | | | — | |
Leisure Products | | | 27,173 | | | | — | | | | — | |
Life Sciences Tools & Services | | | 158,045 | | | | — | | | | — | |
Machinery | | | 400,051 | | | | — | | | | — | |
Marine | | | 4,218 | | | | — | | | | — | |
Media | | | 608,759 | | | | — | | | | — | |
Metals & Mining | | | 85,051 | | | | — | | | | — | |
Mortgage Real Estate Investment Trusts (REITs) | | | 1,293 | | | | — | | | | — | |
Multi-Utilities | | | 208,006 | | | | — | | | | — | |
Multiline Retail | | | 82,979 | | | | — | | | | — | |
Oil, Gas & Consumable Fuels | | | 984,386 | | | | — | | | | — | |
Paper & Forest Products | | | 10,232 | | | | — | | | | — | |
Personal Products | | | 36,623 | | | | — | | | | — | |
Pharmaceuticals | | | 939,931 | | | | — | | | | — | |
Professional Services | | | 80,729 | | | | — | | | | — | |
Real Estate Management & Development | | | 18,903 | | | | — | | | | — | |
Road & Rail | | | 182,020 | | | | — | | | | — | |
See Notes to Financial Statements.
| | | | | | | | | | | | |
| | | Level 1 | | | Level 2 | | | Level 3 | |
Investments in Securities (continued) | | | | | | | | | | | | |
Common Stocks (continued) | | | | | | | | | | | | |
Semiconductors & Semiconductor Equipment | | $ | 708,486 | | | $ | — | | | $ | — | |
Software | | | 994,780 | | | | — | | | | — | |
Specialty Retail | | | 445,186 | | | | — | | | | — | |
Technology Hardware, Storage & Peripherals | | | 777,125 | | | | — | | | | — | |
Textiles, Apparel & Luxury Goods | | | 143,765 | | | | — | | | | — | |
Thrifts & Mortgage Finance | | | 16,611 | | | | — | | | | — | |
Tobacco | | | 268,943 | | | | — | | | | — | |
Trading Companies & Distributors | | | 43,752 | | | | — | | | | — | |
Water Utilities | | | 20,243 | | | | — | | | | — | |
Wireless Telecommunication Services | | | 2,766 | | | | — | | | | — | |
Unaffiliated Exchange Traded Funds | | | 719,577 | | | | — | | | | — | |
Affiliated Mutual Funds | | | 2,850,993 | | | | — | | | | — | |
U.S. Treasury Obligation | | | — | | | | 59,919 | | | | — | |
Other Financial Instruments* | | | | | | | | | | | | |
Futures Contracts | | | (1,625 | ) | | | — | | | | — | |
| | | | | | | | | | | | |
Total | | $ | 24,092,112 | | | $ | 59,919 | | | $ | — | |
| | | | | | | | | | | | |
| * | Other financial instruments are derivative instruments not reflected in the Schedule of Investments, such as futures, forwards and centrally cleared swap contracts, which are recorded at the unrealized appreciation (depreciation) on the instrument, and OTC swap contracts which are recorded at fair value. |
During the period, there were no transfers between Level 1, Level 2 and Level 3 to report.
Industry Classification:
The industry classification of investments and liabilities in excess of other assets shown as a percentage of net assets as of July 31, 2017 were as follows (unaudited):
| | | | |
Affiliated Mutual Funds (including 0.1% of collateral for securities on loan) | | | 12.8 | % |
Banks | | | 6.0 | |
Software | | | 4.4 | |
Oil, Gas & Consumable Fuels | | | 4.4 | |
Pharmaceuticals | | | 4.2 | |
Internet Software & Services | | | 4.0 | |
IT Services | | | 3.5 | |
Technology Hardware, Storage & Peripherals | | | 3.5 | |
Unaffiliated Exchange Traded Funds | | | 3.2 | |
Semiconductors & Semiconductor Equipment | | | 3.2 | |
Equity Real Estate Investment Trusts (REITs) | | | 3.1 | |
Capital Markets | | | 2.7 | |
Media | | | 2.7 | |
Insurance | | | 2.7 | |
Health Care Equipment & Supplies | | | 2.7 | |
Biotechnology | | | 2.6 | |
Health Care Providers & Services | | | 2.5 | % |
Internet & Direct Marketing Retail | | | 2.3 | |
Aerospace & Defense | | | 2.2 | |
Chemicals | | | 2.0 | |
Specialty Retail | | | 2.0 | |
Industrial Conglomerates | | | 1.9 | |
Diversified Telecommunication Services | | | 1.8 | |
Machinery | | | 1.8 | |
Electric Utilities | | | 1.8 | |
Beverages | | | 1.7 | |
Hotels, Restaurants & Leisure | | | 1.7 | |
Food & Staples Retailing | | | 1.6 | |
Household Products | | | 1.5 | |
Food Products | | | 1.3 | |
Diversified Financial Services | | | 1.3 | |
Tobacco | | | 1.2 | |
Communications Equipment | | | 1.0 | |
See Notes to Financial Statements.
| | | | |
| Prudential Day One Underlying Funds | | | 105 | |
Prudential QMA US Broad Market Index Fund
Schedule of Investments (continued)
as of July 31, 2017
| | | | |
Industry Classification (cont’d.) | | | |
Multi-Utilities | | | 0.9 | % |
Energy Equipment & Services | | | 0.8 | |
Road & Rail | | | 0.8 | |
Electronic Equipment, Instruments & Components | | | 0.8 | |
Life Sciences Tools & Services | | | 0.7 | |
Consumer Finance | | | 0.7 | |
Textiles, Apparel & Luxury Goods | | | 0.6 | |
Air Freight & Logistics | | | 0.6 | |
Household Durables | | | 0.6 | |
Electrical Equipment | | | 0.6 | |
Airlines | | | 0.5 | |
Commercial Services & Supplies | | | 0.5 | |
Automobiles | | | 0.4 | |
Containers & Packaging | | | 0.4 | |
Metals & Mining | | | 0.4 | |
Building Products | | | 0.4 | |
Multiline Retail | | | 0.4 | |
Professional Services | | | 0.4 | |
U.S. Treasury Obligation | | | 0.3 | |
Auto Components | | | 0.2 | |
Trading Companies & Distributors | | | 0.2 | |
Gas Utilities | | | 0.2 | |
| | | | |
Personal Products | | | 0.2 | % |
Construction & Engineering | | | 0.2 | |
Construction Materials | | | 0.1 | |
Leisure Products | | | 0.1 | |
Health Care Technology | | | 0.1 | |
Distributors | | | 0.1 | |
Water Utilities | | | 0.1 | |
Diversified Consumer Services | | | 0.1 | |
Real Estate Management & Development | | | 0.1 | |
Thrifts & Mortgage Finance | | | 0.1 | |
Independent Power & Renewable Electricity Producers | | | 0.1 | |
Paper & Forest Products | | | 0.0 | * |
Marine | | | 0.0 | * |
Wireless Telecommunication Services | | | 0.0 | * |
Mortgage Real Estate Investment Trusts (REITs) | | | 0.0 | * |
| | | | |
| | | 108.0 | |
Liabilities in excess of other assets | | | (8.0 | ) |
| | | | |
| | | 100.0 | % |
| | | | |
Effects of Derivative Instruments on the Financial Statements and Primary Underlying Risk Exposure:
The Fund invested in derivative instruments during the reporting period. The primary type of risk associated with these derivative instruments is equity contracts risk. The effect of such derivative instruments on the Fund’s financial position and financial performance as reflected in the Statement of Assets and Liabilities and Statement of Operations is presented in the summary below.
Fair values of derivative instruments as of July 31, 2017 as presented in the Statement of Assets and Liabilities:
| | | | | | | | | | | | |
| | | Asset Derivatives | | | Liability Derivatives | |
Derivatives not accounted
for as hedging instruments,
carried at fair value | | Balance Sheet
Location | | Fair
Value | | | Balance Sheet
Location | | Fair
Value | |
| Equity contracts | | — | | $ | — | | | Due from/to broker—
variation margin futures | | $ | 1,625 | * |
| | | | | | | | | | | | |
| * | Includes cumulative appreciation (depreciation) as reported in the schedule of open futures and centrally cleared swap contracts. Only unsettled variation margin receivable (payable) is reported within the Statement of Assets and Liabilities. |
See Notes to Financial Statements.
The effects of derivative instruments on the Statement of Operations for the period ended July 31, 2017 are as follows:
| | | | |
Amount of Realized Gain (Loss) on Derivatives Recognized in Income | |
Derivatives not accounted for as hedging
instruments, carried at fair value | | Futures | |
Equity contracts | | $ | 34,268 | |
| | | | |
| | | | |
Change in Unrealized Appreciation (Depreciation) on Derivatives Recognized in Income | |
Derivatives not accounted for as hedging
instruments, carried at fair value | | Futures | |
Equity contracts | | $ | (1,625 | ) |
| | | | |
For the period ended July 31, 2017, the Fund’s average value at trade date for futures long positions was $564,802.
Financial Instruments/Transactions—Summary of Offsetting and Netting Arrangements:
The Fund entered into financial instruments/transactions during the reporting period that are either offset in accordance with current requirements or are subject to enforceable master netting arrangements or similar agreements that permit offsetting. The information about offsetting and related netting arrangements for financial instruments/transactions, where the legal right to set-off exists, is presented in the summary below.
Offsetting of financial instrument/transaction assets and liabilities:
| | | | | | | | | | | | |
Description | | Gross
Amounts of
Recognized
Assets(1) | | | Collateral
Received(2) | | | Net
Amount | |
Securities on Loan | | $ | 13,417 | | | $ | (13,417 | ) | | $ | — | |
| | | | | | | | | | | | |
| (1) | Amount represents market value. |
| (2) | Collateral amount disclosed by the Fund is limited to the market value of financial instruments/transactions. |
See Notes to Financial Statements.
| | | | |
| Prudential Day One Underlying Funds | | | 107 | |
Prudential QMA Mid-Cap Core Equity Fund
Schedule of Investments
as of July 31, 2017
| | | | | | | | |
| Description | | Shares | | | Value | |
LONG-TERM INVESTMENTS 100.1% | | | | | | | | |
| | |
COMMON STOCKS 98.1% | | | | | | | | |
| | |
Aerospace & Defense 2.5% | | | | | | | | |
Curtiss-Wright Corp. | | | 650 | | | $ | 62,673 | |
Esterline Technologies Corp.* | | | 410 | | | | 39,565 | |
Huntington Ingalls Industries, Inc. | | | 410 | | | | 84,505 | |
Orbital ATK, Inc. | | | 190 | | | | 19,414 | |
Vectrus, Inc.* | | | 200 | | | | 6,802 | |
| | | | | | | | |
| | | | | | | 212,959 | |
| | |
Airlines 0.5% | | | | | | | | |
JetBlue Airways Corp.* | | | 2,100 | | | | 46,053 | |
| | |
Auto Components 0.0% | | | | | | | | |
Adient PLC | | | 60 | | | | 3,928 | |
| | |
Automobiles 0.8% | | | | | | | | |
Thor Industries, Inc. | | | 600 | | | | 63,210 | |
| | |
Banks 7.2% | | | | | | | | |
Associated Banc-Corp. | | | 2,200 | | | | 52,690 | |
Cathay General Bancorp | | | 890 | | | | 33,331 | |
Cullen/Frost Bankers, Inc. | | | 430 | | | | 39,035 | |
East West Bancorp, Inc. | | | 1,380 | | | | 78,633 | |
Financial Institutions, Inc. | | | 190 | | | | 5,586 | |
Fulton Financial Corp. | | | 2,100 | | | | 38,325 | |
Hancock Holding Co. | | | 560 | | | | 25,760 | |
Independent Bank Corp. | | | 200 | | | | 4,240 | |
International Bancshares Corp. | | | 1,260 | | | | 44,604 | |
PacWest Bancorp | | | 1,020 | | | | 48,980 | |
Popular, Inc. (Puerto Rico) | | | 910 | | | | 38,347 | |
QCR Holdings, Inc. | | | 100 | | | | 4,595 | |
Signature Bank* | | | 150 | | | | 20,787 | |
Synovus Financial Corp. | | | 1,570 | | | | 68,264 | |
Umpqua Holdings Corp. | | | 2,100 | | | | 38,934 | |
Wintrust Financial Corp. | | | 830 | | | | 62,507 | |
| | | | | | | | |
| | | | | | | 604,618 | |
| | |
Biotechnology 1.5% | | | | | | | | |
Bioverativ, Inc.* | | | 1,170 | | | | 72,505 | |
United Therapeutics Corp.* | | | 400 | | | | 51,360 | |
| | | | | | | | |
| | | | | | | 123,865 | |
See Notes to Financial Statements.
| | | | | | | | |
| Description | | Shares | | | Value | |
COMMON STOCKS (Continued) | | | | | | | | |
| | |
Building Products 0.2% | | | | | | | | |
A.O. Smith Corp. | | | 260 | | | $ | 13,923 | |
Continental Building Products, Inc.* | | | 200 | | | | 4,400 | |
| | | | | | | | |
| | | | | | | 18,323 | |
| | |
Capital Markets 3.3% | | | | | | | | |
BGC Partners, Inc. (Class A Stock) | | | 200 | | | | 2,522 | |
Eaton Vance Corp. | | | 380 | | | | 18,654 | |
INTL. FCStone, Inc.* | | | 60 | | | | 2,348 | |
LPL Financial Holdings, Inc. | | | 410 | | | | 18,762 | |
MarketAxess Holdings, Inc. | | | 90 | | | | 18,260 | |
MSCI, Inc. | | | 830 | | | | 90,429 | |
Raymond James Financial, Inc. | | | 660 | | | | 54,905 | |
SEI Investments Co. | | | 1,310 | | | | 74,028 | |
| | | | | | | | |
| | | | | | | 279,908 | |
| | |
Chemicals 2.9% | | | | | | | | |
Cabot Corp. | | | 1,000 | | | | 54,330 | |
Chemours Co. (The) | | | 2,090 | | | | 99,505 | |
Minerals Technologies, Inc. | | | 70 | | | | 4,956 | |
Olin Corp. | | | 2,060 | | | | 60,729 | |
PolyOne Corp. | | | 780 | | | | 28,532 | |
| | | | | | | | |
| | | | | | | 248,052 | |
| | |
Commercial Services & Supplies 1.0% | | | | | | | | |
Brink’s Co. (The) | | | 30 | | | | 2,345 | |
Ennis, Inc. | | | 500 | | | | 9,625 | |
Herman Miller, Inc. | | | 1,550 | | | | 52,196 | |
Pitney Bowes, Inc. | | | 1,100 | | | | 17,314 | |
| | | | | | | | |
| | | | | | | 81,480 | |
| | |
Communications Equipment 0.8% | | | | | | | | |
ARRIS International PLC* | | | 1,000 | | | | 27,960 | |
Plantronics, Inc. | | | 940 | | | | 42,469 | |
| | | | | | | | |
| | | | | | | 70,429 | |
| | |
Construction & Engineering 1.7% | | | | | | | | |
AECOM* | | | 540 | | | | 17,226 | |
EMCOR Group, Inc. | | | 950 | | | | 64,125 | |
Valmont Industries, Inc. | | | 380 | | | | 58,026 | |
| | | | | | | | |
| | | | | | | 139,377 | |
See Notes to Financial Statements.
| | | | |
| Prudential Day One Underlying Funds | | | 109 | |
Prudential QMA Mid-Cap Core Equity Fund
Schedule of Investments (continued)
as of July 31, 2017
| | | | | | | | |
| Description | | Shares | | | Value | |
COMMON STOCKS (Continued) | | | | | | | | |
| | |
Construction Materials 0.8% | | | | | | | | |
Eagle Materials, Inc. | | | 690 | | | $ | 64,929 | |
| | |
Consumer Finance 0.3% | | | | | | | | |
Navient Corp. | | | 1,700 | | | | 25,075 | |
| | |
Containers & Packaging 1.2% | | | | | | | | |
Greif, Inc. (Class A Stock) | | | 500 | | | | 28,045 | |
Owens-Illinois, Inc.* | | | 2,600 | | | | 62,140 | |
Sonoco Products Co. | | | 310 | | | | 15,029 | |
| | | | | | | | |
| | | | | | | 105,214 | |
| | |
Distributors 0.4% | | | | | | | | |
Pool Corp. | | | 280 | | | | 30,274 | |
| | |
Diversified Consumer Services 0.7% | | | | | | | | |
Service Corp. International | | | 1,630 | | | | 56,610 | |
Sotheby’s* | | | 80 | | | | 4,527 | |
| | | | | | | | |
| | | | | | | 61,137 | |
| | |
Diversified Financial Services 0.1% | | | | | | | | |
NewStar Financial, Inc. | | | 900 | | | | 9,846 | |
| | |
Electric Utilities 1.2% | | | | | | | | |
Hawaiian Electric Industries, Inc. | | | 840 | | | | 27,712 | |
MGE Energy, Inc. | | | 270 | | | | 17,968 | |
OGE Energy Corp. | | | 1,450 | | | | 51,997 | |
| | | | | | | | |
| | | | | | | 97,677 | |
| | |
Electrical Equipment 1.2% | | | | | | | | |
EnerSys | | | 800 | | | | 57,816 | |
Regal Beloit Corp. | | | 530 | | | | 44,176 | |
| | | | | | | | |
| | | | | | | 101,992 | |
| | |
Electronic Equipment, Instruments & Components 5.8% | | | | | | | | |
Arrow Electronics, Inc.* | | | 630 | | | | 51,213 | |
Avnet, Inc. | | | 1,750 | | | | 67,165 | |
Cognex Corp. | | | 890 | | | | 84,603 | |
IPG Photonics Corp.* | | | 450 | | | | 68,688 | |
Jabil, Inc. | | | 1,600 | | | | 48,800 | |
SYNNEX Corp. | | | 320 | | | | 38,054 | |
Tech Data Corp.* | | | 120 | | | | 12,288 | |
Trimble, Inc.* | | | 1,820 | | | | 68,123 | |
Vishay Intertechnology, Inc. | | | 3,000 | | | | 53,550 | |
| | | | | | | | |
| | | | | | | 492,484 | |
See Notes to Financial Statements.
| | | | | | | | |
| Description | | Shares | | | Value | |
COMMON STOCKS (Continued) | | | | | | | | |
| | |
Energy Equipment & Services 0.7% | | | | | | | | |
Core Laboratories NV | | | 40 | | | $ | 4,021 | |
Ensco PLC (Class A Stock)(a) | | | 4,700 | | | | 24,863 | |
Nabors Industries Ltd. | | | 4,000 | | | | 30,840 | |
| | | | | | | | |
| | | | | | | 59,724 | |
| | |
Equity Real Estate Investment Trusts (REITs) 8.5% | | | | | | | | |
American Campus Communities, Inc. | | | 180 | | | | 8,629 | |
Ashford Hospitality Prime, Inc. | | | 1,200 | | | | 12,432 | |
Ashford Hospitality Trust, Inc. | | | 700 | | | | 4,403 | |
Camden Property Trust | | | 40 | | | | 3,588 | |
Care Capital Properties, Inc. | | | 700 | | | | 16,954 | |
Chesapeake Lodging Trust | | | 1,000 | | | | 25,230 | |
CoreCivic, Inc. | | | 2,100 | | | | 58,170 | |
DCT Industrial Trust, Inc. | | | 60 | | | | 3,380 | |
Douglas Emmett, Inc. | | | 400 | | | | 15,304 | |
EPR Properties | | | 320 | | | | 23,162 | |
First Industrial Realty Trust, Inc. | | | 180 | | | | 5,494 | |
Franklin Street Properties Corp. | | | 700 | | | | 7,399 | |
GEO Group, Inc. (The) | | | 2,030 | | | | 59,580 | |
Hospitality Properties Trust | | | 2,340 | | | | 68,000 | |
Liberty Property Trust | | | 850 | | | | 35,717 | |
Medical Properties Trust, Inc. | | | 4,600 | | | | 59,708 | |
Omega Healthcare Investors, Inc. | | | 340 | | | | 10,741 | |
Park Hotels & Resorts, Inc. | | | 1,400 | | | | 37,702 | |
Ramco-Gershenson Properties Trust | | | 400 | | | | 5,636 | |
Senior Housing Properties Trust | | | 3,400 | | | | 66,130 | |
Spirit Realty Capital, Inc. | | | 1,400 | | | | 11,102 | |
Tier REIT, Inc. | | | 500 | | | | 9,240 | |
Uniti Group, Inc. | | | 700 | | | | 17,920 | |
Urban Edge Properties | | | 600 | | | | 15,078 | |
VEREIT, Inc. | | | 4,100 | | | | 34,071 | |
Washington Prime Group, Inc. | | | 5,200 | | | | 46,904 | |
Weingarten Realty Investors | | | 430 | | | | 13,958 | |
Xenia Hotels & Resorts, Inc. | | | 2,100 | | | | 42,672 | |
| | | | | | | | |
| | | | | | | 718,304 | |
| | |
Food Products 2.7% | | | | | | | | |
Flowers Foods, Inc. | | | 1,600 | | | | 28,144 | |
Ingredion, Inc. | | | 540 | | | | 66,593 | |
Lamb Weston Holdings, Inc. | | | 1,250 | | | | 54,975 | |
Lancaster Colony Corp. | | | 350 | | | | 42,917 | |
See Notes to Financial Statements.
| | | | |
| Prudential Day One Underlying Funds | | | 111 | |
Prudential QMA Mid-Cap Core Equity Fund
Schedule of Investments (continued)
as of July 31, 2017
| | | | | | | | |
| Description | | Shares | | | Value | |
COMMON STOCKS (Continued) | | | | | | | | |
| | |
Food Products (cont’d.) | | | | | | | | |
Omega Protein Corp. | | | 100 | | | $ | 1,600 | |
Post Holdings, Inc.* | | | 370 | | | | 30,784 | |
| | | | | | | | |
| | | | | | | 225,013 | |
| | |
Gas Utilities 2.7% | | | | | | | | |
Atmos Energy Corp. | | | 1,010 | | | | 87,628 | |
ONE Gas, Inc. | | | 80 | | | | 5,822 | |
Southwest Gas Holdings, Inc. | | | 580 | | | | 46,458 | |
UGI Corp. | | | 1,690 | | | | 85,294 | |
| | | | | | | | |
| | | | | | | 225,202 | |
| | |
Health Care Equipment & Supplies 3.6% | | | | | | | | |
Halyard Health, Inc.* | | | 560 | | | | 22,523 | |
Hill-Rom Holdings, Inc. | | | 870 | | | | 64,833 | |
IDEXX Laboratories, Inc.* | | | 170 | | | | 28,298 | |
Masimo Corp.* | | | 420 | | | | 39,732 | |
Teleflex, Inc. | | | 400 | | | | 82,888 | |
West Pharmaceutical Services, Inc. | | | 690 | | | | 61,203 | |
| | | | | | | | |
| | | | | | | 299,477 | |
| | |
Health Care Providers & Services 1.6% | | | | | | | | |
LifePoint Health, Inc.* | | | 840 | | | | 49,896 | |
WellCare Health Plans, Inc.* | | | 460 | | | | 81,415 | |
| | | | | | | | |
| | | | | | | 131,311 | |
| | |
Hotels, Restaurants & Leisure 2.4% | | | | | | | | |
Domino’s Pizza, Inc. | | | 180 | | | | 33,570 | |
Dunkin’ Brands Group, Inc. | | | 420 | | | | 22,273 | |
Extended Stay America, Inc. | | | 1,100 | | | | 21,747 | |
Papa John’s International, Inc. | | | 400 | | | | 28,532 | |
Texas Roadhouse, Inc. | | | 1,160 | | | | 54,868 | |
Wendy’s Co. (The) | | | 2,500 | | | | 38,600 | |
| | | | | | | | |
| | | | | | | 199,590 | |
| | |
Household Durables 2.4% | | | | | | | | |
CalAtlantic Group, Inc. | | | 400 | | | | 14,040 | |
NVR, Inc.* | | | 26 | | | | 67,871 | |
Taylor Morrison Home Corp. (Class A Stock)* | | | 200 | | | | 4,524 | |
Tempur Sealy International, Inc.*(a) | | | 780 | | | | 44,983 | |
Toll Brothers, Inc. | | | 1,790 | | | | 69,076 | |
| | | | | | | | |
| | | | | | | 200,494 | |
See Notes to Financial Statements.
| | | | | | | | |
| Description | | Shares | | | Value | |
COMMON STOCKS (Continued) | | | | | | | | |
| | |
Independent Power & Renewable Electricity Producers 0.1% | | | | | | | | |
AES Corp. | | | 400 | | | $ | 4,472 | |
| | |
Insurance 4.6% | | | | | | | | |
Alleghany Corp.* | | | 13 | | | | 7,973 | |
American Financial Group, Inc. | | | 670 | | | | 67,938 | |
Brown & Brown, Inc. | | | 920 | | | | 41,032 | |
CNO Financial Group, Inc. | | | 2,700 | | | | 61,776 | |
First American Financial Corp. | | | 1,450 | | | | 70,195 | |
Genworth Financial, Inc. (Class A Stock)* | | | 9,900 | | | | 33,957 | |
Hanover Insurance Group, Inc. (The) | | | 430 | | | | 40,790 | |
Old Republic International Corp. | | | 3,100 | | | | 60,822 | |
| | | | | | | | |
| | | | | | | 384,483 | |
| | |
Internet Software & Services 0.1% | | | | | | | | |
CoStar Group, Inc.* | | | 20 | | | | 5,511 | |
GrubHub, Inc.* | | | 80 | | | | 3,690 | |
| | | | | | | | |
| | | | | | | 9,201 | |
| | |
IT Services 3.0% | | | | | | | | |
CACI International, Inc. (Class A Stock)* | | | 150 | | | | 18,765 | |
DST Systems, Inc. | | | 1,000 | | | | 54,900 | |
Leidos Holdings, Inc. | | | 1,170 | | | | 62,525 | |
MAXIMUS, Inc. | | | 1,000 | | | | 60,360 | |
Science Applications International Corp. | | | 800 | | | | 56,328 | |
| | | | | | | | |
| | | | | | | 252,878 | |
| | |
Leisure Products 0.8% | | | | | | | | |
Brunswick Corp. | | | 1,140 | | | | 64,535 | |
| | |
Life Sciences Tools & Services 1.3% | | | | | | | | |
Bio-Rad Laboratories, Inc. (Class A Stock)* | | | 150 | | | | 35,344 | |
Bruker Corp. | | | 500 | | | | 14,340 | |
Charles River Laboratories International, Inc.* | | | 650 | | | | 63,830 | |
| | | | | | | | |
| | | | | | | 113,514 | |
| | |
Machinery 5.7% | | | | | | | | |
AGCO Corp. | | | 120 | | | | 8,657 | |
Crane Co. | | | 690 | | | | 52,095 | |
Donaldson Co., Inc. | | | 810 | | | | 38,467 | |
Global Brass & Copper Holdings, Inc. | | | 330 | | | | 10,576 | |
Graco, Inc. | | | 580 | | | | 67,303 | |
See Notes to Financial Statements.
| | | | |
| Prudential Day One Underlying Funds | | | 113 | |
Prudential QMA Mid-Cap Core Equity Fund
Schedule of Investments (continued)
as of July 31, 2017
| | | | | | | | |
| Description | | Shares | | | Value | |
COMMON STOCKS (Continued) | | | | | | | | |
| | |
Machinery (cont’d.) | | | | | | | | |
IDEX Corp. | | | 500 | | | $ | 58,270 | |
Lincoln Electric Holdings, Inc. | | | 320 | | | | 27,923 | |
Oshkosh Corp. | | | 930 | | | | 64,040 | |
Terex Corp. | | | 1,570 | | | | 61,811 | |
Timken Co. (The) | | | 340 | | | | 15,470 | |
Toro Co. (The) | | | 1,120 | | | | 79,621 | |
| | | | | | | | |
| | | | | | | 484,233 | |
| | |
Media 0.8% | | | | | | | | |
AMC Networks, Inc. (Class A Stock)* | | | 200 | | | | 12,790 | |
Cable One, Inc. | | | 29 | | | | 22,037 | |
Cinemark Holdings, Inc. | | | 590 | | | | 22,951 | |
John Wiley & Sons, Inc. (Class A Stock) | | | 60 | | | | 3,315 | |
tronc, Inc.* | | | 600 | | | | 7,662 | |
| | | | | | | | |
| | | | | | | 68,755 | |
| | |
Metals & Mining 2.6% | | | | | | | | |
Reliance Steel & Aluminum Co. | | | 860 | | | | 62,230 | |
Royal Gold, Inc. | | | 270 | | | | 23,398 | |
Steel Dynamics, Inc. | | | 2,400 | | | | 84,984 | |
Worthington Industries, Inc. | | | 1,020 | | | | 51,683 | |
| | | | | | | | |
| | | | | | | 222,295 | |
| | |
Mortgage Real Estate Investment Trusts (REITs) 0.0% | | | | | | | | |
New Residential Investment Corp. | | | 200 | | | | 3,400 | |
| | |
Multi-Utilities 1.5% | | | | | | | | |
MDU Resources Group, Inc. | | | 2,600 | | | | 68,510 | |
NorthWestern Corp. | | | 940 | | | | 54,323 | |
| | | | | | | | |
| | | | | | | 122,833 | |
| | |
Multiline Retail 0.5% | | | | | | | | |
Big Lots, Inc. | | | 880 | | | | 43,710 | |
| | |
Oil, Gas & Consumable Fuels 2.1% | | | | | | | | |
CONSOL Energy, Inc.* | | | 1,600 | | | | 26,816 | |
Newfield Exploration Co.* | | | 130 | | | | 3,735 | |
Pacific Ethanol, Inc.* | | | 1,600 | | | | 10,000 | |
Panhandle Oil and Gas, Inc. (Class A Stock) | | | 1,100 | | | | 24,200 | |
QEP Resources, Inc.* | | | 3,000 | | | | 25,710 | |
Renewable Energy Group, Inc.* | | | 1,800 | | | | 22,500 | |
World Fuel Services Corp. | | | 1,390 | | | | 44,952 | |
See Notes to Financial Statements.
| | | | | | | | |
| Description | | Shares | | | Value | |
COMMON STOCKS (Continued) | | | | | | | | |
| | |
Oil, Gas & Consumable Fuels (cont’d.) | | | | | | | | |
WPX Energy, Inc.* | | | 2,100 | | | $ | 22,638 | |
| | | | | | | | |
| | | | | | | 180,551 | |
| | |
Paper & Forest Products 0.2% | | | | | | | | |
Louisiana-Pacific Corp.* | | | 500 | | | | 12,555 | |
| | |
Personal Products 0.3% | | | | | | | | |
Avon Products, Inc. (United Kingdom)* | | | 7,400 | | | | 26,936 | |
| | |
Pharmaceuticals 0.6% | | | | | | | | |
Endo International PLC* | | | 4,700 | | | | 51,794 | |
| | |
Professional Services 1.0% | | | | | | | | |
ICF International, Inc.* | | | 50 | | | | 2,263 | |
Insperity, Inc. | | | 60 | | | | 4,530 | |
ManpowerGroup, Inc. | | | 730 | | | | 78,219 | |
| | | | | | | | |
| | | | | | | 85,012 | |
| | |
Real Estate Management & Development 0.7% | | | | | | | | |
Jones Lang LaSalle, Inc. | | | 300 | | | | 38,166 | |
RMR Group, Inc. (The) (Class A Stock) | | | 460 | | | | 22,471 | |
| | | | | | | | |
| | | | | | | 60,637 | |
| | |
Road & Rail 0.9% | | | | | | | | |
Landstar System, Inc. | | | 510 | | | | 42,407 | |
Old Dominion Freight Line, Inc. | | | 310 | | | | 29,732 | |
| | | | | | | | |
| | | | | | | 72,139 | |
| | |
Semiconductors & Semiconductor Equipment 3.3% | | | | | | | | |
Advanced Energy Industries, Inc.* | | | 30 | | | | 2,177 | |
Alpha & Omega Semiconductor Ltd.* | | | 500 | | | | 8,850 | |
Cirrus Logic, Inc.* | | | 970 | | | | 59,597 | |
Microsemi Corp.* | | | 480 | | | | 24,998 | |
Silicon Laboratories, Inc.* | | | 100 | | | | 7,510 | |
Synaptics, Inc.* | | | 840 | | | | 44,192 | |
Teradyne, Inc. | | | 2,070 | | | | 71,601 | |
Versum Materials, Inc. | | | 1,660 | | | | 58,532 | |
| | | | | | | | |
| | | | | | | 277,457 | |
See Notes to Financial Statements.
| | | | |
| Prudential Day One Underlying Funds | | | 115 | |
Prudential QMA Mid-Cap Core Equity Fund
Schedule of Investments (continued)
as of July 31, 2017
| | | | | | | | |
| Description | | Shares | | | Value | |
COMMON STOCKS (Continued) | | | | | | | | |
| | |
Software 4.6% | | | | | | | | |
Cadence Design Systems, Inc.* | | | 2,580 | | | $ | 95,202 | |
CDK Global, Inc. | | | 1,320 | | | | 86,829 | |
CommVault Systems, Inc.* | | | 880 | | | | 52,404 | |
Fair Isaac Corp. | | | 440 | | | | 62,722 | |
Fortinet, Inc.* | | | 1,780 | | | | 65,700 | |
Manhattan Associates, Inc.* | | | 350 | | | | 15,470 | |
Synopsys, Inc.* | | | 100 | | | | 7,657 | |
| | | | | | | | |
| | | | | | | 385,984 | |
| | |
Specialty Retail 2.9% | | | | | | | | |
Aaron’s, Inc. | | | 1,270 | | | | 58,775 | |
Burlington Stores, Inc.* | | | 60 | | | | 5,222 | |
Chico’s FAS, Inc. | | | 400 | | | | 3,660 | |
Dick’s Sporting Goods, Inc. | | | 470 | | | | 17,550 | |
GameStop Corp. (Class A Stock)(a) | | | 2,400 | | | | 52,056 | |
Michaels Cos., Inc. (The)* | | | 2,200 | | | | 44,308 | |
Office Depot, Inc. | | | 9,700 | | | | 56,939 | |
Tilly’s, Inc. (Class A Stock) | | | 200 | | | | 1,996 | |
| | | | | | | | |
| | | | | | | 240,506 | |
| | |
Technology Hardware, Storage & Peripherals 0.6% | | | | | | | | |
NCR Corp.* | | | 1,390 | | | | 52,612 | |
| | |
Textiles, Apparel & Luxury Goods 0.3% | | | | | | | | |
Carter’s, Inc. | | | 110 | | | | 9,540 | |
Skechers U.S.A., Inc. (Class A Stock)* | | | 620 | | | | 17,416 | |
| | | | | | | | |
| | | | | | | 26,956 | |
| | |
Thrifts & Mortgage Finance 0.1% | | | | | | | | |
Washington Federal, Inc. | | | 270 | | | | 9,032 | |
| | |
Trading Companies & Distributors 0.0% | | | | | | | | |
MSC Industrial Direct Co., Inc. (Class A Stock) | | | 30 | | | | 2,136 | |
| | |
Wireless Telecommunication Services 0.8% | | | | | | | | |
Telephone & Data Systems, Inc. | | | 1,900 | | | | 54,017 | |
United States Cellular Corp.* | | | 250 | | | | 9,470 | |
| | | | | | | | |
| | | | | | | 63,487 | |
| | | | | | | | |
TOTAL COMMON STOCKS
(cost $7,826,519) | | | | | | | 8,262,048 | |
| | | | | | | | |
See Notes to Financial Statements.
| | | | | | | | |
| Description | | Shares | | | Value | |
UNAFFILIATED EXCHANGE TRADED FUNDS 2.0% | | | | | | | | |
SPDR S&P Mid-Cap 400 ETF Trust Fund | | | 220 | | | $ | 70,510 | |
iShares Core S&P Mid-Cap ETF | | | 550 | | | | 96,520 | |
| | | | | | | | |
TOTAL UNAFFILIATED EXCHANGE TRADED FUNDS
(cost $166,726) | | | | | | | 167,030 | |
| | | | | | | | |
TOTAL LONG-TERM INVESTMENTS
(cost $7,993,245) | | | | | | | 8,429,078 | |
| | | | | | | | |
|
SHORT-TERM INVESTMENTS 9.3% | |
|
AFFILIATED MUTUAL FUNDS | |
Prudential Investment Portfolios 2 - Prudential Core Ultra Short Bond Fund(w) | | | 679,545 | | | | 679,545 | |
Prudential Investment Portfolios 2 - Prudential Institutional Money Market Fund
(cost $106,531; includes $106,479 of cash collateral for securities on loan)(b)(w) | | | 106,521 | | | | 106,531 | |
| | | | | | | | |
TOTAL SHORT-TERM INVESTMENTS
(cost $786,076) | | | | | | | 786,076 | |
| | | | | | | | |
TOTAL INVESTMENTS 109.4%
(cost $8,779,321) | | | | | | | 9,215,154 | |
Liabilities in excess of other assets (9.4)% | | | | | | | (788,882 | ) |
| | | | | | | | |
NET ASSETS 100.0% | | | | | | $ | 8,426,272 | |
| | | | | | | | |
See the Glossary for abbreviations used in the annual report.
| * | Non-income producing security. |
| (a) | All or a portion of security is on loan. The aggregate market value of such securities, including those sold and pending settlement, is $103,745; cash collateral of $106,479 (included in liabilities) was received with which the Fund purchased highly liquid short-term investments. |
| (b) | Represents security purchased with cash collateral received for securities on loan and includes dividend reinvestment. |
| (w) | PGIM Investments LLC, the manager of the Fund, also serves as manager of the Prudential Investment Portfolios 2 - Prudential Core Ultra Short Bond Fund and Prudential Institutional Money Market Fund. |
Fair Value Measurements:
Various inputs are used in determining the value of the Fund’s investments. These inputs are summarized in the three broad levels listed below.
Level 1—unadjusted quoted prices generally in active markets for identical securities.
Level 2—quoted prices for similar securities, interest rates and yield curves, prepayment speeds, foreign currency exchange rates and other observable inputs.
Level 3—unobservable inputs for securities valued in accordance with Board approved fair valuation procedures.
See Notes to Financial Statements.
| | | | |
| Prudential Day One Underlying Funds | | | 117 | |
Prudential QMA Mid-Cap Core Equity Fund
Schedule of Investments (continued)
as of July 31, 2017
The following is a summary of the inputs used as of July 31, 2017 in valuing such portfolio securities:
| | | | | | | | | | | | |
| | | Level 1 | | | Level 2 | | | Level 3 | |
Investments in Securities | | | | | | | | | | | | |
Common Stocks | |
Aerospace & Defense | | $ | 212,959 | | | $ | — | | | $ | — | |
Airlines | | | 46,053 | | | | — | | | | — | |
Auto Components | | | 3,928 | | | | — | | | | — | |
Automobiles | | | 63,210 | | | | — | | | | — | |
Banks | | | 604,618 | | | | — | | | | — | |
Biotechnology | | | 123,865 | | | | — | | | | — | |
Building Products | | | 18,323 | | | | — | | | | — | |
Capital Markets | | | 279,908 | | | | — | | | | — | |
Chemicals | | | 248,052 | | | | — | | | | — | |
Commercial Services & Supplies | | | 81,480 | | | | — | | | | — | |
Communications Equipment | | | 70,429 | | | | — | | | | — | |
Construction & Engineering | | | 139,377 | | | | — | | | | — | |
Construction Materials | | | 64,929 | | | | — | | | | — | |
Consumer Finance | | | 25,075 | | | | — | | | | — | |
Containers & Packaging | | | 105,214 | | | | — | | | | — | |
Distributors | | | 30,274 | | | | — | | | | — | |
Diversified Consumer Services | | | 61,137 | | | | — | | | | — | |
Diversified Financial Services | | | 9,846 | | | | — | | | | — | |
Electric Utilities | | | 97,677 | | | | — | | | | — | |
Electrical Equipment | | | 101,992 | | | | — | | | | — | |
Electronic Equipment, Instruments & Components | | | 492,484 | | | | — | | | | — | |
Energy Equipment & Services | | | 59,724 | | | | — | | | | — | |
Equity Real Estate Investment Trusts (REITs) | | | 718,304 | | | | — | | | | — | |
Food Products | | | 225,013 | | | | — | | | | — | |
Gas Utilities | | | 225,202 | | | | — | | | | — | |
Health Care Equipment & Supplies | | | 299,477 | | | | — | | | | — | |
Health Care Providers & Services | | | 131,311 | | | | — | | | | — | |
Hotels, Restaurants & Leisure | | | 199,590 | | | | — | | | | — | |
Household Durables | | | 200,494 | | | | — | | | | — | |
Independent Power & Renewable Electricity Producers | | | 4,472 | | | | — | | | | — | |
Insurance | | | 384,483 | | | | — | | | | — | |
Internet Software & Services | | | 9,201 | | | | — | | | | — | |
IT Services | | | 252,878 | | | | — | | | | — | |
Leisure Products | | | 64,535 | | | | — | | | | — | |
Life Sciences Tools & Services | | | 113,514 | | | | — | | | | — | |
Machinery | | | 484,233 | | | | — | | | | — | |
Media | | | 68,755 | | | | — | | | | — | |
Metals & Mining | | | 222,295 | | | | — | | | | — | |
Mortgage Real Estate Investment Trusts (REITs) | | | 3,400 | | | | — | | | | — | |
See Notes to Financial Statements.
| | | | | | | | | | | | |
| | | Level 1 | | | Level 2 | | | Level 3 | |
Investments in Securities (continued) | | | | | | | | | | | | |
Common Stocks (continued) | | | | | | | | | | | | |
Multi-Utilities | | $ | 122,833 | | | $ | — | | | $ | — | |
Multiline Retail | | | 43,710 | | | | — | | | | — | |
Oil, Gas & Consumable Fuels | | | 180,551 | | | | — | | | | — | |
Paper & Forest Products | | | 12,555 | | | | — | | | | — | |
Personal Products | | | 26,936 | | | | — | | | | — | |
Pharmaceuticals | | | 51,794 | | | | — | | | | — | |
Professional Services | | | 85,012 | | | | — | | | | — | |
Real Estate Management & Development | | | 60,637 | | | | — | | | | — | |
Road & Rail | | | 72,139 | | | | — | | | | — | |
Semiconductors & Semiconductor Equipment | | | 277,457 | | | | — | | | | — | |
Software | | | 385,984 | | | | — | | | | — | |
Specialty Retail | | | 240,506 | | | | — | | | | — | |
Technology Hardware, Storage & Peripherals | | | 52,612 | | | | — | | | | — | |
Textiles, Apparel & Luxury Goods | | | 26,956 | | | | — | | | | — | |
Thrifts & Mortgage Finance | | | 9,032 | | | | — | | | | — | |
Trading Companies & Distributors | | | 2,136 | | | | — | | | | — | |
Wireless Telecommunication Services | | | 63,487 | | | | — | | | | — | |
Unaffiliated Exchange Traded Funds | | | 167,030 | | | | — | | | | — | |
Affiliated Mutual Funds | | | 786,076 | | | | — | | | | — | |
| | | | | | | | | | | | |
Total | | $ | 9,215,154 | | | $ | — | | | $ | — | |
| | | | | | | | | | | | |
During the period, there were no transfers between Level 1, Level 2 and Level 3 to report.
Industry Classification:
The industry classification of investments and liabilities in excess of other assets shown as a percentage of net assets as of July 31, 2017 were as follows (unaudited):
| | | | |
Affiliated Mutual Funds (including 1.3% of collateral for securities on loan) | | | 9.3 | % |
Equity Real Estate Investment Trusts (REITs) | | | 8.5 | |
Banks | | | 7.2 | |
Electronic Equipment, Instruments & Components | | | 5.8 | |
Machinery | | | 5.7 | |
Software | | | 4.6 | |
Insurance | | | 4.6 | |
Health Care Equipment & Supplies | | | 3.6 | |
Capital Markets | | | 3.3 | |
Semiconductors & Semiconductor Equipment | | | 3.3 | |
IT Services | | | 3.0 | |
Chemicals | | | 2.9 | |
Specialty Retail | | | 2.9 | |
Gas Utilities | | | 2.7 | |
Food Products | | | 2.7 | % |
Metals & Mining | | | 2.6 | |
Aerospace & Defense | | | 2.5 | |
Household Durables | | | 2.4 | |
Hotels, Restaurants & Leisure | | | 2.4 | |
Oil, Gas & Consumable Fuels | | | 2.1 | |
Unaffiliated Exchange Traded Funds | | | 2.0 | |
Construction & Engineering | | | 1.7 | |
Health Care Providers & Services | | | 1.6 | |
Biotechnology | | | 1.5 | |
Multi-Utilities | | | 1.5 | |
Life Sciences Tools & Services | | | 1.3 | |
Containers & Packaging | | | 1.2 | |
Electrical Equipment | | | 1.2 | |
Electric Utilities | | | 1.2 | |
See Notes to Financial Statements.
| | | | |
| Prudential Day One Underlying Funds | | | 119 | |
Prudential QMA Mid-Cap Core Equity Fund
Schedule of Investments (continued)
as of July 31, 2017
| | | | |
Industry Classification (cont’d.) | | | |
Professional Services | | | 1.0 | % |
Commercial Services & Supplies | | | 1.0 | |
Road & Rail | | | 0.9 | |
Communications Equipment | | | 0.8 | |
Media | | | 0.8 | |
Construction Materials | | | 0.8 | |
Leisure Products | | | 0.8 | |
Wireless Telecommunication Services | | | 0.8 | |
Automobiles | | | 0.8 | |
Diversified Consumer Services | | | 0.7 | |
Real Estate Management & Development | | | 0.7 | |
Energy Equipment & Services | | | 0.7 | |
Technology Hardware, Storage & Peripherals | | | 0.6 | |
Pharmaceuticals | | | 0.6 | |
Airlines | | | 0.5 | |
Multiline Retail | | | 0.5 | |
Distributors | | | 0.4 | |
Textiles, Apparel & Luxury Goods | | | 0.3 | |
| | | | |
Personal Products | | | 0.3 | % |
Consumer Finance | | | 0.3 | |
Building Products | | | 0.2 | |
Paper & Forest Products | | | 0.2 | |
Diversified Financial Services | | | 0.1 | |
Internet Software & Services | | | 0.1 | |
Thrifts & Mortgage Finance | | | 0.1 | |
Independent Power & Renewable Electricity Producers | | | 0.1 | |
Auto Components | | | 0.0 | * |
Mortgage Real Estate Investment Trusts (REITs) | | | 0.0 | * |
Trading Companies & Distributors | | | 0.0 | * |
| | | | |
| | | 109.4 | |
Liabilities in excess of other assets | | | (9.4 | ) |
| | | | |
| | | 100.0 | % |
| | | | |
Financial Instruments/Transactions—Summary of Offsetting and Netting Arrangements:
The Fund entered into financial instruments/transactions during the reporting period that are either offset in accordance with current requirements or are subject to enforceable master netting arrangements or similar agreements that permit offsetting. The information about offsetting and related netting arrangements for financial instruments/transactions, where the legal right to set-off exists, is presented in the summary below.
Offsetting of financial instrument/transaction assets and liabilities:
| | | | | | | | | | | | |
Description | | Gross
Amounts of
Recognized
Assets(1) | | | Collateral
Received(2) | | | Net
Amount | |
Securities on Loan | | $ | 103,745 | | | $ | (103,745 | ) | | $ | — | |
| | | | | | | | | | | | |
| (1) | Amount represents market value. |
| (2) | Collateral amount disclosed by the Fund is limited to the market value of financial instruments/transactions. |
See Notes to Financial Statements.
Glossary:
The following abbreviations are used in the annual report:
Exchange:
LME—London Metal Exchange
OTC—Over-the-counter
Other:
144A—Security was purchased pursuant to Rule 144A under the Securities Act of 1933 and may not be resold subject to that rule except to qualified institutional buyers. Unless otherwise noted, 144A securities are deemed to be liquid.
Aces—Alternative Credit Enhancements Securities
ADR—American Depositary Receipt
BABs—Build America Bonds
ETF—Exchange Traded Fund
GMTN—Global Medium Term Note
LIBOR—London Interbank Offered Rate
MTN—Medium Term Note
PRI—Primary Rate Interface
RBOB—Reformulated Gasoline Blendstock for Oxygen Blending
REIT—Real Estate Investment Trust
SPDR—Standard & Poor’s Depository Receipts
TBA—To Be Announced
TIPS—Treasury Inflation-Protected Securities
ULSD—Ultra-Low Sulfur Diesel
WTI—West Texas Intermediate
See Notes to Financial Statements.
| | | | |
| Prudential Day One Underlying Funds | | | 121 | |
Prudential Jennison Small-Cap Core Equity Fund
Statement of Assets & Liabilities
as of July 31, 2017
| | | | |
Assets | | | | |
Investments at value, including securities on loan of $317,420: | | | | |
Unaffiliated investments (cost $10,937,984) | | $ | 11,994,792 | |
Affiliated investments (cost $982,474) | | | 982,474 | |
Receivable for investments sold | | | 62,940 | |
Receivable for Fund shares sold | | | 12,558 | |
Due from manager | | | 5,995 | |
Dividends and interest receivable | | | 2,531 | |
| | | | |
Total assets | | | 13,061,290 | |
| | | | |
| |
Liabilities | | | | |
Payable to broker for collateral for securities on loan | | | 328,829 | |
Payable for investments purchased | | | 98,261 | |
Accrued expenses and other liabilities | | | 26,506 | |
Audit fee payable | | | 24,000 | |
Affiliated transfer agent fee payable | | | 55 | |
| | | | |
Total liabilities | | | 477,651 | |
| | | | |
| |
Net Assets | | $ | 12,583,639 | |
| | | | |
| | | | | |
Net assets were comprised of: | | | | |
Shares of beneficial interest, at par | | $ | 1,116 | |
Paid-in capital in excess of par | | | 11,294,150 | |
| | | | |
| | | 11,295,266 | |
Undistributed net investment income | | | 188 | |
Accumulated net realized gain on investment transactions | | | 231,377 | |
Net unrealized appreciation on investments | | | 1,056,808 | |
| | | | |
Net assets, July 31, 2017 | | $ | 12,583,639 | |
| | | | |
| |
Class Q | | | | |
Net asset value, offering price and redemption price per share,
($12,583,639 ÷ 1,116,295 shares of beneficial interest and outstanding) | | $ | 11.27 | |
| | | | |
See Notes to Financial Statements.
Prudential Core Conservative Bond Fund
Statement of Assets & Liabilities
as of July 31, 2017
| | | | |
Assets | | | | |
Investments at value: | | | | |
Unaffiliated investments (cost $30,890,509) | | $ | 31,127,597 | |
Affiliated investments (cost $3,545,327) | | | 3,545,327 | |
Receivable for investments sold | | | 2,575,367 | |
Interest receivable | | | 164,822 | |
Receivable for Fund shares sold | | | 62,614 | |
Due from manager | | | 906 | |
| | | | |
Total assets | | | 37,476,633 | |
| | | | |
| |
Liabilities | | | | |
Payable for investments purchased | | | 6,046,159 | |
Accrued expenses and other liabilities | | | 72,975 | |
Affiliated transfer agent fee payable | | | 46 | |
| | | | |
Total liabilities | | | 6,119,180 | |
| | | | |
| |
Net Assets | | $ | 31,357,453 | |
| | | | |
| | | | | |
Net assets were comprised of: | | | | |
Shares of beneficial interest, at par | | $ | 3,126 | |
Paid-in capital in excess of par | | | 31,245,100 | |
| | | | |
| | | 31,248,226 | |
Undistributed net investment income | | | 1,844 | |
Accumulated net realized loss on investment transactions | | | (129,705 | ) |
Net unrealized appreciation on investments | | | 237,088 | |
| | | | |
Net assets, July 31, 2017 | | $ | 31,357,453 | |
| | | | |
|
Class Q | |
Net asset value, offering price and redemption price per share,
($31,357,453 ÷ 3,126,241 shares of beneficial interest issued and outstanding) | | $ | 10.03 | |
| | | | |
See Notes to Financial Statements.
| | | | |
| Prudential Day One Underlying Funds | | | 123 | |
Prudential TIPS Fund
Statement of Assets & Liabilities
as of July 31, 2017
| | | | |
Assets | | | | |
Investments at value: | | | | |
Unaffiliated investments (cost $15,915,537) | | $ | 15,928,326 | |
Affiliated investments (cost $80,331) | | | 80,331 | |
Receivable for investments sold | | | 536,358 | |
Receivable for Fund shares sold | | | 84,211 | |
Interest receivable | | | 27,203 | |
Due from manager | | | 6,588 | |
| | | | |
Total assets | | | 16,663,017 | |
| | | | |
| |
Liabilities | | | | |
Payable for investments purchased | | | 597,604 | |
Accrued expenses and other liabilities | | | 54,616 | |
Affiliated transfer agent fee payable | | | 46 | |
| | | | |
Total liabilities | | | 652,266 | |
| | | | |
| |
Net Assets | | $ | 16,010,751 | |
| | | | |
| | | | | |
Net assets were comprised of: | | | | |
Shares of beneficial interest, at par | | $ | 1,623 | |
Paid-in capital in excess of par | | | 16,036,858 | |
| | | | |
| | | 16,038,481 | |
Undistributed net investment income | | | 3,506 | |
Accumulated net realized loss on investment transactions | | | (44,025 | ) |
Net unrealized appreciation on investments | | | 12,789 | |
| | | | |
Net assets, July 31, 2017 | | $ | 16,010,751 | |
| | | | |
|
Class Q | |
Net asset value, offering price and redemption price per share,
($16,010,751 ÷ 1,623,252 shares of beneficial interest issued and outstanding) | | $ | 9.86 | |
| | | | |
See Notes to Financial Statements.
Prudential Commodity Strategies Fund
Consolidated Statement of Assets & Liabilities
as of July 31, 2017
| | | | |
Assets | | | | |
Unaffiliated investments (cost $13,803,041) | | $ | 13,803,021 | |
Cash | | | 64,422 | |
Deposit with broker for futures | | | 54,467 | |
Receivable for fund shares sold | | | 5,802 | |
Due from manager | | | 1,922 | |
Interest receivable | | | 1,514 | |
Receivable for investments sold | | | 155 | |
Prepaid offering expenses | | | 10,260 | |
| | | | |
Total assets | | | 13,941,563 | |
| | | | |
| |
Liabilities | | | | |
Payable for Fund shares reacquired | | | 69,854 | |
Audit fee payable | | | 28,000 | |
Custodian and accounting fees payable | | | 19,835 | |
Due to broker—variation margin futures | | | 11,709 | |
Accrued expenses and other liabilities | | | 806 | |
Affiliated transfer agent fee payable | | | 55 | |
| | | | |
Total liabilities | | | 130,259 | |
| | | | |
| |
Net Assets | | $ | 13,811,304 | |
| | | | |
| | | | | |
Net assets were comprised of: | | | | |
Shares of beneficial interest, at par | | $ | 1,360 | |
Paid-in capital in excess of par | | | 13,577,375 | |
| | | | |
| | | 13,578,735 | |
Undistributed net investment income | | | 177,975 | |
Accumulated net realized loss on investment transactions | | | (311,536 | ) |
Net unrealized appreciation on investments | | | 366,130 | |
| | | | |
Net assets, July 31, 2017 | | $ | 13,811,304 | |
| | | | |
|
Class Q | |
Net asset value, offering price and redemption price per share
($13,811,304 ÷ 1,360,431 shares of beneficial interest issued and outstanding) | | $ | 10.15 | |
| | | | |
See Notes to Financial Statements.
| | | | |
| Prudential Day One Underlying Funds | | | 125 | |
Prudential QMA US Broad Market Index Fund
Statement of Assets & Liabilities
as of July 31, 2017
| | | | |
Assets | | | | |
Investments at value, including securities on loan of $13,417: | | | | |
Unaffiliated investments (cost $19,905,201) | | $ | 21,302,663 | |
Affiliated investments (cost $2,850,994) | | | 2,850,993 | |
Receivable for investments sold | | | 159,183 | |
Due from manager | | | 33,402 | |
Receivable for Fund shares sold | | | 19,357 | |
Dividends and interest receivable | | | 13,845 | |
| | | | |
Total assets | | | 24,379,443 | |
| | | | |
| |
Liabilities | | | | |
Payable for investments purchased | | | 1,890,513 | |
Accrued expenses and other liabilities | | | 81,446 | |
Payable for Fund shares reacquired | | | 18,254 | |
Payable to broker for collateral for securities on loan | | | 13,867 | |
Due to broker—variation margin futures | | | 1,035 | |
Affiliated transfer agent fee payable | | | 55 | |
| | | | |
Total liabilities | | | 2,005,170 | |
| | | | |
| |
Net Assets | | $ | 22,374,273 | |
| | | | |
| | | | | |
Net assets were comprised of: | | | | |
Shares of beneficial interest, at par | | $ | 1,970 | |
Paid-in capital in excess of par | | | 20,805,345 | |
| | | | |
| | | 20,807,315 | |
Undistributed net investment income | | | 119,284 | |
Accumulated net realized gain on investment transactions | | | 51,838 | |
Net unrealized appreciation on investments | | | 1,395,836 | |
| | | | |
Net assets, July 31, 2017 | | $ | 22,374,273 | |
| | | | |
|
Class Q | |
Net asset value, offering price and redemption price per share
($22,374,273 ÷ 1,969,726 shares of beneficial interest issued and outstanding) | | $ | 11.36 | |
| | | | |
See Notes to Financial Statements.
Prudential QMA Mid-Cap Core Equity Fund
Statement of Assets & Liabilities
as of July 31, 2017
| | | | |
Assets | | | | |
Investments at value, including securities on loan of $103,745: | | | | |
Unaffiliated investments (cost $7,993,245) | | $ | 8,429,078 | |
Affiliated investments (cost $786,076) | | | 786,076 | |
Receivable for investments sold | | | 33,847 | |
Receivable for Fund shares sold | | | 22,457 | |
Due from manager | | | 5,791 | |
Dividends receivable | | | 3,462 | |
| | | | |
Total assets | | | 9,280,711 | |
| | | | |
| |
Liabilities | | | | |
Payable for investments purchased | | | 698,557 | |
Payable to broker for collateral for securities on loan | | | 106,479 | |
Accrued expenses | | | 49,348 | |
Affiliated transfer agent fee payable | | | 55 | |
| | | | |
Total liabilities | | | 854,439 | |
| | | | |
| |
Net Assets | | $ | 8,426,272 | |
| | | | |
| | | | | |
Net assets were comprised of: | | | | |
Shares of beneficial interest, at par | | $ | 755 | |
Paid-in capital in excess of par | | | 7,819,474 | |
| | | | |
| | | 7,820,229 | |
Undistributed net investment income | | | 19,790 | |
Accumulated net realized gain on investment transactions | | | 150,420 | |
Net unrealized appreciation on investments | | | 435,833 | |
| | | | |
Net assets, July 31, 2017 | | $ | 8,426,272 | |
| | | | |
|
Class Q | |
Net asset value, offering price and redemption price per share,
($8,426,272 ÷ 755,014 shares of beneficial interest issued and outstanding) | | $ | 11.16 | |
| | | | |
See Notes to Financial Statements.
| | | | |
| Prudential Day One Underlying Funds | | | 127 | |
Prudential Jennison Small-Cap Core Equity Fund
Statement of Operations
Period* Ended July 31, 2017
| | | | |
Net Investment Income (Loss) | | | | |
Income | | | | |
Unaffiliated dividend income | | $ | 90,619 | |
Income from securities lending, net (including affiliated income of $295) | | | 2,254 | |
Affiliated dividend income | | | 3,483 | |
| | | | |
Total income | | | 96,356 | |
| | | | |
| |
Expenses | | | | |
Management fee | | | 58,015 | |
Custodian and accounting fees | | | 32,000 | |
Audit fee | | | 24,000 | |
Legal fees and expenses | | | 22,000 | |
Trustees’ fees | | | 8,000 | |
Shareholders’ reports | | | 6,000 | |
Insurance expenses | | | 1,000 | |
Transfer agent’s fees and expenses (including affiliated expense of $200) | | | 1,000 | |
Miscellaneous | | | 6,016 | |
| | | | |
Total expenses | | | 158,031 | |
Less: Management fee waiver and/or expense reimbursement | | | (78,810 | ) |
| | | | |
Net expenses | | | 79,221 | |
| | | | |
Net investment income (loss) | | | 17,135 | |
| | | | |
| |
Realized And Unrealized Gain (Loss) On Investments | | | | |
Net realized gain (loss) on investment transactions | | | 231,377 | |
Net change in unrealized appreciation (depreciation) on investments | | | 1,056,808 | |
| | | | |
Net gain (loss) on investment transactions | | | 1,288,185 | |
| | | | |
Net Increase (Decrease) In Net Assets Resulting From Operations | | $ | 1,305,320 | |
| | | | |
| * | Commencement of operations was November 15, 2016. |
See Notes to Financial Statements.
Prudential Core Conservative Bond Fund
Statement of Operations
Period* Ended July 31, 2017
| | | | |
Net Investment Income (Loss) | | | | |
Income | | | | |
Interest income | | $ | 382,139 | |
Affiliated dividend income | | | 28,426 | |
| | | | |
Total income | | | 410,565 | |
| | | | |
| |
Expenses | | | | |
Management fee | | | 49,290 | |
Custodian and accounting fees | | | 42,000 | |
Audit fee | | | 40,000 | |
Legal fees and expenses | | | 22,000 | |
Trustees’ fees | | | 8,000 | |
Shareholders’ reports | | | 6,000 | |
Insurance expenses | | | 1,000 | |
Transfer agent’s fees and expenses (including affiliated expense of $200) | | | 1,000 | |
Miscellaneous | | | 4,820 | |
| | | | |
Total expenses | | | 174,110 | |
Less: Management fee waiver and/or expense reimbursement | | | (77,661 | ) |
| | | | |
Net expenses | | | 96,449 | |
| | | | |
Net investment income (loss) | | | 314,116 | |
| | | | |
| |
Realized And Unrealized Gain (Loss) On Investments | | | | |
Net realized gain (loss) on investment transactions | | | (76,821 | ) |
Net change in unrealized appreciation (depreciation) on investments | | | 237,088 | |
| | | | |
Net gain (loss) on investment transactions | | | 160,267 | |
| | | | |
Net Increase (Decrease) In Net Assets Resulting From Operations | | $ | 474,383 | |
| | | | |
| * | Commencement of operations was November 15, 2016. |
See Notes to Financial Statements.
| | | | |
| Prudential Day One Underlying Funds | | | 129 | |
Prudential TIPS Fund
Statement of Operations
Period* Ended July 31, 2017
| | | | |
Net Investment Income (Loss) | | | | |
Income | | | | |
Interest income | | $ | 106,078 | |
Affiliated dividend income | | | 678 | |
| | | | |
Total income | | | 106,756 | |
| | | | |
| |
Expenses | | | | |
Management fee | | | 10,534 | |
Audit fee | | | 32,000 | |
Custodian and accounting fees | | | 25,000 | |
Legal fees and expenses | | | 22,000 | |
Trustees’ fees | | | 8,000 | |
Shareholders’ reports | | | 6,000 | |
Insurance expenses | | | 1,000 | |
Transfer agent’s fees and expenses (including affiliated expense of $200) | | | 1,000 | |
Miscellaneous | | | 4,796 | |
| | | | |
Total expenses | | | 110,330 | |
Less: Management fee waiver and/or expense reimbursement | | | (85,333 | ) |
| | | | |
Net expenses | | | 24,997 | |
| | | | |
Net investment income (loss) | | | 81,759 | |
| | | | |
| |
Realized And Unrealized Gain (Loss) On Investments | | | | |
Net realized gain (loss) on investment transactions | | | (6,674 | ) |
Net change in unrealized appreciation (depreciation) on investments | | | 12,789 | |
| | | | |
Net gain (loss) on investment transactions | | | 6,115 | |
| | | | |
Net Increase (Decrease) In Net Assets Resulting From Operations | | $ | 87,874 | |
| | | | |
| * | Commencement of operations was November 15, 2016. |
See Notes to Financial Statements.
Prudential Commodity Strategies Fund
Consolidated Statement of Operations
Period* Ended July 31, 2017
| | | | |
Net Investment Income (Loss) | | | | |
Income | | | | |
Interest income | | $ | 47,177 | |
| | | | |
| |
Expenses | | | | |
Management fee | | | 53,825 | |
Organizational and prepaid offering expenses | | | 40,000 | |
Custodian and accounting fees | | | 35,000 | |
Audit fee | | | 28,000 | |
Legal fees and expenses | | | 22,000 | |
Trustees’ fees | | | 8,000 | |
Shareholders’ reports | | | 5,000 | |
Transfer agent’s fees and expenses (including affiliated expense of $200) | | | 1,000 | |
Miscellaneous | | | 7,675 | |
| | | | |
Total expenses | | | 200,500 | |
Less: Management fee waiver and/or expense reimbursement | | | (102,183 | ) |
| | | | |
Net expenses | | | 98,317 | |
| | | | |
Net investment income (loss) | | | (51,140 | ) |
| | | | |
| |
Realized And Unrealized Gain (Loss) On Investments | | | | |
Net realized gain (loss) on: | | | | |
Investment transactions | | | (17 | ) |
Futures transactions | | | (82,404 | ) |
| | | | |
| | | (82,421 | ) |
| | | | |
Net change in unrealized appreciation (depreciation) on: | | | | |
Investments | | | (20 | ) |
Futures | | | 366,150 | |
| | | | |
| | | 366,130 | |
| | | | |
Net gain (loss) on investment transactions | | | 283,709 | |
| | | | |
Net Increase (Decrease) In Net Assets Resulting From Operations | | $ | 232,569 | |
| | | | |
| * | Commencement of operations was November 15, 2016. |
See Notes to Financial Statements.
| | | | |
| Prudential Day One Underlying Funds | | | 131 | |
Prudential QMA US Broad Market Index Fund
Statement of Operations
Period* Ended July 31, 2017
| | | | |
Net Investment Income (Loss) | | | | |
Income | | | | |
Unaffiliated dividend income (net of foreign withholding taxes of $5) | | $ | 159,061 | |
Affiliated dividend income | | | 4,282 | |
Interest income | | | 588 | |
Income from securities lending, net (including affiliated income of $1) | | | 10 | |
| | | | |
Total income | | | 163,941 | |
| | | | |
| |
Expenses | | | | |
Management fee | | | 15,600 | |
Custodian and accounting fees | | | 73,000 | |
Audit fee | | | 24,000 | |
Legal fees and expenses | | | 22,000 | |
Shareholders’ reports | | | 10,000 | |
Trustees’ fees | | | 8,000 | |
Transfer agent’s fees and expenses (including affiliated expense of $200) | | | 1,000 | |
Miscellaneous | | | 7,297 | |
| | | | |
Total expenses | | | 160,897 | |
Less: Management fee waiver and/or expense reimbursement | | | (137,933 | ) |
| | | | |
Net expenses | | | 22,964 | |
| | | | |
Net investment income (loss) | | | 140,977 | |
| | | | |
| |
Realized And Unrealized Gain (Loss) On Investments | | | | |
Net realized gain (loss) on: | | | | |
Investment transactions | | | 17,570 | |
Futures transactions | | | 34,268 | |
| | | | |
| | | 51,838 | |
| | | | |
Net change in unrealized appreciation (depreciation) on: | | | | |
Investments | | | 1,397,461 | |
Futures | | | (1,625 | ) |
| | | | |
| | | 1,395,836 | |
| | | | |
Net gain (loss) on investment transactions | | | 1,447,674 | |
| | | | |
Net Increase (Decrease) In Net Assets Resulting From Operations | | $ | 1,588,651 | |
| | | | |
| * | Commencement of operations was November 17, 2016. |
See Notes to Financial Statements.
Prudential QMA Mid-Cap Core Equity Fund
Statement of Operations
Period* Ended July 31, 2017
| | | | |
Net Investment Income (Loss) | |
Income | | | | |
Unaffiliated dividend income | | $ | 63,914 | |
Affiliated dividend income | | | 985 | |
Income from securities lending, net (including affiliated income of $11) | | | 29 | |
| | | | |
Total income | | | 64,928 | |
| | | | |
| |
Expenses | | | | |
Management fee | | | 20,317 | |
Custodian and accounting fees | | | 31,000 | |
Audit fee | | | 24,000 | |
Legal fees and expenses | | | 22,000 | |
Trustees’ fees | | | 8,000 | |
Shareholders’ reports | | | 6,000 | |
Transfer agent’s fees and expenses (including affiliated expense of $200) | | | 1,000 | |
Miscellaneous | | | 6,121 | |
| | | | |
Total expenses | | | 118,438 | |
Less: Management fee waiver and/or expense reimbursement | | | (78,833 | ) |
| | | | |
Net expenses | | | 39,605 | |
| | | | |
Net investment income (loss) | | | 25,323 | |
| | | | |
| |
Realized And Unrealized Gain (Loss) On Investments | | | | |
Net realized gain (loss) on investment transactions (including affiliated of $(3)) | | | 150,420 | |
Net change in unrealized appreciation (depreciation) on investments | | | 435,833 | |
| | | | |
Net gain (loss) on investment transactions | | | 586,253 | |
| | | | |
Net Increase (Decrease) In Net Assets Resulting From Operations | | $ | 611,576 | |
| | | | |
| * | Commencement of operations was November 17, 2016. |
See Notes to Financial Statements.
| | | | |
| Prudential Day One Underlying Funds | | | 133 | |
Prudential Jennison Small-Cap Core Equity Fund
Statement of Changes in Net Assets
| | | | |
| | | November 15, 2016*
through
July 31, 2017 | |
Increase (Decrease) in Net Assets | | | | |
Operations | | | | |
Net investment income (loss) | | $ | 17,135 | |
Net realized gain (loss) on investment transactions | | | 231,377 | |
Net change in unrealized appreciation (depreciation) on investments | | | 1,056,808 | |
| | | | |
Net increase (decrease) in net assets resulting from operations | | | 1,305,320 | |
| | | | |
| |
Dividends from net investment income | | | | |
Class Q | | | (16,947 | ) |
| | | | |
| |
Fund share transactions | | | | |
Net proceeds from shares sold | | | 11,329,854 | |
Net asset value of shares issued in reinvestment of dividends and distributions | | | 16,947 | |
Cost of shares reacquired | | | (51,535 | ) |
| | | | |
Net increase (decrease) in net assets from Fund share transactions | | | 11,295,266 | |
| | | | |
Total increase (decrease) | | | 12,583,639 | |
| |
Net Assets: | | | | |
Beginning of period | | | — | |
| | | | |
End of period(a) | | $ | 12,583,639 | |
| | | | |
(a) Includes undistributed net investment income of: | | $ | 188 | |
| | | | |
| * | Commencement of operations. |
See Notes to Financial Statements.
Prudential Core Conservative Bond Fund
Statement of Changes in Net Assets
| | | | |
| | | November 15, 2016* through July 31, 2017 | |
Increase (Decrease) in Net Assets | | | | |
Operations | | | | |
Net investment income (loss) | | $ | 314,116 | |
Net realized gain (loss) on investment transactions | | | (76,821 | ) |
Net change in unrealized appreciation (depreciation) on investments | | | 237,088 | |
| | | | |
Net increase (decrease) in net assets resulting from operations | | | 474,383 | |
| | | | |
| |
Dividends from net investment income | | | | |
Class Q | | | (365,156 | ) |
| | | | |
| |
Fund share transactions | | | | |
Net proceeds from shares sold | | | 31,148,943 | |
Net asset value of shares issued in reinvestment of dividends and distributions | | | 365,155 | |
Cost of shares reacquired | | | (265,872 | ) |
| | | | |
Net increase (decrease) in net assets from Fund share transactions | | | 31,248,226 | |
| | | | |
Total increase (decrease) | | | 31,357,453 | |
| |
Net Assets: | | | | |
Beginning of period | | | — | |
| | | | |
End of period(a) | | $ | 31,357,453 | |
| | | | |
(a) Includes undistributed net investment income of: | | $ | 1,844 | |
| | | | |
| * | Commencement of operations. |
See Notes to Financial Statements.
| | | | |
| Prudential Day One Underlying Funds | | | 135 | |
Prudential TIPS Fund
Statement of Changes in Net Assets
| | | | |
| | | November 15, 2016*
through July 31, 2017 | |
Increase (Decrease) in Net Assets | | | | |
Operations | | | | |
Net investment income (loss) | | $ | 81,759 | |
Net realized gain (loss) on investment transactions | | | (6,674 | ) |
Net change in unrealized appreciation (depreciation) on investments | | | 12,789 | |
| | | | |
Net increase (decrease) in net assets resulting from operations | | | 87,874 | |
| | | | |
| |
Dividends from net investment income | | | | |
Class Q | | | (115,604 | ) |
| | | | |
| |
Fund share transactions | | | | |
Net proceeds from shares sold | | | 16,410,866 | |
Net asset value of shares issued in reinvestment of dividends and distributions | | | 115,603 | |
Cost of shares reacquired | | | (487,988 | ) |
| | | | |
Net increase (decrease) in net assets from Fund share transactions | | | 16,038,481 | |
| | | | |
Total increase (decrease) | | | 16,010,751 | |
| |
Net Assets: | | | | |
Beginning of period | | | — | |
| | | | |
End of period(a) | | $ | 16,010,751 | |
| | | | |
(a) Includes undistributed net investment income of: | | $ | 3,506 | |
| | | | |
| * | Commencement of operations. |
See Notes to Financial Statements.
Prudential Commodity Strategies Fund
Consolidated Statement of Changes in Net Assets
| | | | |
| | | November 15, 2016*
through July 31, 2017 | |
Increase (Decrease) in Net Assets | |
Operations | |
Net investment income (loss) | | $ | (51,140 | ) |
Net realized gain (loss) on investment transactions | | | (82,421 | ) |
Net change in unrealized appreciation (depreciation) on investments | | | 366,130 | |
| | | | |
Net increase (decrease) in net assets resulting from operations | | | 232,569 | |
| | | | |
Fund share transactions | |
Net proceeds from shares sold | | | 13,792,034 | |
Cost of shares reacquired | | | (213,299 | ) |
| | | | |
Net increase (decrease) in net assets from Fund share transactions | | | 13,578,735 | |
| | | | |
Total increase (decrease) | | | 13,811,304 | |
|
Net Assets: | |
| |
Beginning of period | | | — | |
| | | | |
End of period(a) | | $ | 13,811,304 | |
| | | | |
(a) Includes undistributed net investment income of: | | $ | 177,975 | |
| | | | |
| * | Commencement of operations. |
See Notes to Financial Statements.
| | | | |
| Prudential Day One Underlying Funds | | | 137 | |
Prudential QMA US Broad Market Index Fund
Statement of Changes in Net Assets
| | | | |
| | | November 17, 2016*
through
July 31, 2017 | |
Increase (Decrease) in Net Assets | | | | |
Operations | | | | |
Net investment income (loss) | | $ | 140,977 | |
Net realized gain (loss) on investment transactions | | | 51,838 | |
Net change in unrealized appreciation (depreciation) on investments | | | 1,395,836 | |
| | | | |
Net increase (decrease) in net assets resulting from operations | | | 1,588,651 | |
| | | | |
| |
Dividends from net investment income | | | | |
Class Q | | | (21,693 | ) |
| | | | |
| |
Fund share transactions | | | | |
Net proceeds from shares sold | | | 21,146,670 | |
Net asset value of shares issued in reinvestment of dividends and distributions | | | 21,693 | |
Cost of shares reacquired | | | (361,048 | ) |
| | | | |
Net increase (decrease) in net assets from Fund share transactions | | | 20,807,315 | |
| | | | |
Total increase (decrease) | | | 22,374,273 | |
| |
Net Assets: | | | | |
Beginning of period | | | — | |
| | | | |
End of period(a) | | $ | 22,374,273 | |
| | | | |
(a) Includes undistributed net investment income of: | | $ | 119,284 | |
| | | | |
| * | Commencement of operations. |
See Notes to Financial Statements.
Prudential QMA Mid-Cap Core Equity Fund
Statement of Changes in Net Assets
| | | | |
| | | November 17, 2016* through
July 31, 2017 | |
Increase (Decrease) in Net Assets | | | | |
Operations | | | | |
Net investment income (loss) | | $ | 25,323 | |
Net realized gain (loss) on investment transactions | | | 150,420 | |
Net change in unrealized appreciation (depreciation) on investments | | | 435,833 | |
| | | | |
Net increase (decrease) in net assets resulting from operations | | | 611,576 | |
| | | | |
| |
Dividends from net investment income | | | | |
Class Q | | | (5,533 | ) |
| | | | |
| |
Fund share transactions | | | | |
Net proceeds from shares sold | | | 7,907,520 | |
Net asset value of shares issued in reinvestment of dividends and distributions | | | 5,533 | |
Cost of shares reacquired | | | (92,824 | ) |
| | | | |
Net increase (decrease) in net assets from Fund share transactions | | | 7,820,229 | |
| | | | |
Total increase (decrease) | | | 8,426,272 | |
| |
Net Assets: | | | | |
Beginning of period | | | — | |
| | | | |
End of period(a) | | $ | 8,426,272 | |
| | | | |
(a) Includes undistributed net investment income of: | | $ | 19,790 | |
| | | | |
| * | Commencement of operations. |
See Notes to Financial Statements.
| | | | |
| Prudential Day One Underlying Funds | | | 139 | |
Notes to Financial Statements/Consolidated Financial Statements
Prudential Investment Portfolios 2 (“PIP 2”) is registered under the Investment Company Act of 1940, as amended (“1940 Act”), as an open-end management investment company. PIP 2 consists of eleven separate series: Prudential Commodity Strategies Fund, Prudential Core Conservative Bond Fund, Prudential Core Short-Term Bond Fund, Prudential Core Ultra Short Bond Fund, Prudential Institutional Money Market Fund, Prudential Jennison Small-Cap Core Equity Fund, Prudential QMA Emerging Markets Equity Fund, Prudential QMA International Developed Markets Index Fund, Prudential QMA Mid-Cap Core Equity Fund, Prudential QMA US Broad Market Index Fund and Prudential TIPS Fund. These financial statements (consolidated financial statements for Prudential Commodity Strategies Fund) relate to the Prudential Commodity Strategies Fund, Prudential Core Conservative Bond Fund, Prudential Jennison Small-Cap Core Equity Fund, Prudential QMA Mid-Cap Core Equity Fund, Prudential QMA US Broad Market Index Fund and Prudential TIPS Fund (each, a “Fund” and collectively, the “Funds”). The Prudential Commodity Strategies Fund, Prudential Core Conservative Bond Fund and Prudential Jennison Small-Cap Core Equity Fund commenced operations on November 15, 2016. The Prudential QMA Mid-Cap Core Equity Fund and Prudential QMA US Broad Market Index Fund commenced operations on November 17, 2016.
The Commodity Strategies Fund wholly owns and controls the Prudential Commodity Strategies Subsidiary Ltd. (the “Subsidiary”), a company organized under the laws of the Cayman Islands. The Subsidiary is not registered as an investment company under the 1940 Act. The Commodity Strategies Fund’s Board of Trustees has oversight responsibility for the investment activities of the Commodity Strategies Fund, including its investment in the Subsidiary, and the Commodity Strategies Fund’s role as sole shareholder of the Subsidiary. The Subsidiary is subject to the same investment restrictions and limitations, and follows the same compliance policies and procedures, as the Commodity Strategies Fund. The consolidated financial statements of the Commodity Strategies Fund include the financial results of its wholly-owned subsidiary.
In accordance with the accounting rules relating to reporting of a wholly-owned subsidiary, the Consolidated Schedule of Investments includes positions of the Commodity Strategies Fund and the Subsidiary. These consolidated financial statements include the accounts of the Commodity Strategies Fund and the Subsidiary. All significant inter-company balances and transactions between the Commodity Strategies Fund and the Subsidiary have been eliminated in consolidation. The Commodity Strategies Fund will seek to gain exposure to commodities, commodities-related instruments, derivatives and other investments by directly investing in those instruments or through investments in the Subsidiary. The Subsidiary participates in the same investment goal as the Commodity Strategies Fund. The Subsidiary pursues its investment goal by investing in commodities, commodities-related instruments, derivatives and other investments. The Subsidiary (unlike the Commodity Strategies Fund) may invest without limitation in these instruments. However, the
Subsidiary is otherwise subject to the same fundamental, non-fundamental and certain other investment restrictions as the Commodity Strategies Fund. The portion of the Commodity Strategies Fund’s or Subsidiary’s assets exposed to any particular commodity, derivative or other investment will vary based on market conditions, but from time to time some exposure could be substantial.
To the extent of the Commodity Strategies Fund’s investment through the Subsidiary, it will be subject to the risks associated with the commodities, derivatives and other instruments in which the Subsidiary invests. By investing in the Subsidiary, the Commodity Strategies Fund is indirectly exposed to the risks associated with the Subsidiary’s investments. The derivatives and other investments held by the Subsidiary are generally similar to those that are permitted to be held by the Commodity Strategies Fund’s commodity and gold/defensive asset classes and are subject to the same risks that apply to similar investments if held directly by the Commodity Strategies Fund.
The Commodity Strategies Fund’s disclosures and operations will be subject to compliance with applicable regulations governing commodity pools in accordance to recent Commodity Futures Trading Commission rule amendments.
As of July 31, 2017, the Subsidiary had net assets of $2,589,133, representing 19.0% of the Commodity Strategies Fund’s net assets.
The Funds of PIP 2 have the following investment objectives and Subadvisers:
| | | | |
| | | Objective | | Subadviser(s) |
| Prudential Jennison Small-Cap Core Equity Fund (“Jennison Small-Cap Core Equity”) | | Outperform the Russell 2000 Index. | | Jennison Associates, LLC (“Jennison”) |
| | |
| Prudential Core Conservative Bond Fund (“Core Conservative Bond”) | | Outperform the Bloomberg Barclays U.S. Aggregate Bond Index over full market cycles. | | PGIM Fixed Income, (formerly, Prudential Fixed Income), which is a business unit of PGIM, Inc. |
| | |
| Prudential TIPS Fund (“TIPS”) | | Outperform the Bloomberg Barclays US Treasury Inflation-Protected Index. | | PGIM Fixed Income, (formerly, Prudential Fixed Income), which is a business unit of PGIM, Inc. |
| | |
| Prudential Commodity Strategies Fund (“Commodity Strategies”) | | Generate returns over time in excess of the Bloomberg Commodity Index. | | CoreCommodity Management, LLC (“Core”) |
| | |
| Prudential QMA US Broad Market Index Fund (“QMA US Broad Market Index”) | | Seek to provide investment results that approximate the performance of the S&P Composite 1500 Index. | | Quantitative Management Associates, LLC (“QMA”) |
| | |
| Prudential QMA Mid-Cap Core Equity Fund (“QMA Mid-Cap Core Equity”) | | Outperform the S&P Mid-Cap 400 Index. | | QMA |
| | | | |
| Prudential Day One Underlying Funds | | | 141 | |
Notes to Financial Statements/Consolidated Financial Statements (continued)
1. Accounting Policies
The Funds follow investment company accounting and reporting guidance of the Financial Accounting Standards Board (“FASB”) Accounting Standard Codification Topic 946 Financial Services—Investment Companies. The following accounting policies conform to U.S. generally accepted accounting principles. The Funds consistently follow such policies in the preparation of their financial statements (consolidated financial statements for Commodity Strategies).
Securities Valuation: Each Fund holds securities and other assets and liabilities that are fair valued at the close of each day (generally, 4:00 PM Eastern time) the New York Stock Exchange (“NYSE”) is open for trading. Fair value is the price that would be received to sell an asset or paid to transfer a liability in an orderly transaction between market participants on the measurement date. The Board of Trustees (the “Board”) has adopted valuation procedures for security valuation under which fair valuation responsibilities have been delegated to PGIM Investments LLC (“PGIM Investments” or “the Manager”) (formerly known as Prudential Investments LLC). Under the current valuation procedures, the Valuation Committee is responsible for supervising the valuation of portfolio securities and other assets and liabilities. The valuation procedures permit the Funds to utilize independent pricing vendor services, quotations from market makers, and alternative valuation methods when market quotations are either not readily available or not deemed representative of fair value. A record of the Valuation Committee’s actions is subject to the Board’s review, approval, and ratification at its next regularly scheduled quarterly meeting.
Various inputs determine how each Fund’s investments are valued, all of which are categorized according to the three broad levels (Level 1, 2, or 3) detailed in the Schedule of Investments (Consolidated Schedule of Investments for Commodity Strategies).
Common and preferred stocks, exchange-traded funds, and derivative instruments, such as futures or options, that are traded on a national securities exchange are valued at the last sale price as of the close of trading on the applicable exchange where the security principally trades. Securities traded via NASDAQ are valued at the NASDAQ official closing price. To the extent these securities are valued at the last sale price or NASDAQ official closing price, they are classified as Level 1 in the fair value hierarchy. In the event that no sale or official closing price on valuation date exists, these securities are generally valued at the mean between the last reported bid and ask prices, or at the last bid price in the absence of an ask price. These securities are classified as Level 2 in the fair value hierarchy.
Foreign equities traded on foreign securities exchanges are generally valued using pricing vendor services that provide model prices derived using adjustment factors based on information such as local closing price, relevant general and sector indices, currency
fluctuations, depositary receipts, and futures, as applicable. Securities valued using such model prices are classified as Level 2 in the fair value hierarchy. The models generate an evaluated adjustment factor for each security, which is applied to the local closing price to adjust it for post closing market movements. Utilizing that evaluated adjustment factor, the vendor provides an evaluated price for each security. If the vendor does not provide an evaluated price, securities are valued in accordance with exchange-traded common and preferred stock valuation policies discussed above.
Derivative instruments, such as futures or options, that are traded on a national securities exchange are valued at the last sale price as of the close of trading on the applicable exchange where the security principally trades. Securities traded via NASDAQ are valued at the NASDAQ official closing price. To the extent these securities are valued at the last sale price or NASDAQ official closing price, they are classified as Level 1 in the fair value hierarchy.
Investments in open-end, non-exchange-traded mutual funds are valued at their net asset values as of the close of the NYSE on the date of valuation. These securities are classified as Level 1 in the fair value hierarchy since they may be purchased or sold at their net asset values on the date of valuation.
Fixed income securities traded in the OTC market are generally classified as Level 2 in the fair value hierarchy. Such fixed income securities are typically valued using the market approach which generally involves obtaining data from an approved independent third-party vendor source. Each Fund utilizes the market approach as the primary method to value securities when market prices of identical or comparable instruments are available. The third-party vendors’ valuation techniques used to derive the evaluated bid price are based on evaluating observable inputs, including but not limited to, yield curves, yield spreads, credit ratings, deal terms, tranche level attributes, default rates, cash flows, prepayment speeds, broker/dealer quotations and reported trades. Certain Level 3 securities are also valued using the market approach when obtaining a single broker quote or when utilizing recent transaction prices for identical or comparable securities. During the reporting period, there were no changes to report with respect to the valuation approach and/or valuation techniques discussed above.
Securities and other assets that cannot be priced according to the methods described above are valued based on pricing methodologies approved by the Board. In the event that unobservable inputs are used when determining such valuations, the securities will be classified as Level 3 in the fair value hierarchy.
When determining the fair value of securities, some of the factors influencing the valuation include: the nature of any restrictions on disposition of the securities; assessment of the general liquidity of the securities; the issuer’s financial condition and the markets in which it does business; the cost of the investment; the size of the holding and the capitalization of the issuer; the prices of any recent transactions or bids/offers for such securities or any comparable securities; any available analyst media or other reports or information deemed reliable by the investment adviser regarding the issuer or the markets or industry in which it
| | | | |
| Prudential Day One Underlying Funds | | | 143 | |
Notes to Financial Statements/Consolidated Financial Statements (continued)
operates. Using fair value to price securities may result in a value that is different from a security’s most recent closing price and from the price used by other unaffiliated mutual funds to calculate their net asset values.
Restricted and Illiquid Securities: Subject to guidelines adopted by the Board, each Fund may invest up to 15% of its net assets in illiquid securities, including those which are restricted as to disposition under securities law (“restricted securities”). Restricted securities are valued pursuant to the valuation procedures noted above. Illiquid securities are those that, because of the absence of a readily available market or due to legal or contractual restrictions on resale, cannot be sold within seven days in the ordinary course of business at approximately the amount at which the Fund has valued the investment. Therefore, the Fund may find it difficult to sell illiquid securities at the time considered most advantageous by its Subadviser and may incur expenses that would not be incurred in the sale of securities that were freely marketable. Certain securities that would otherwise be considered illiquid because of legal restrictions on resale to the general public may be traded among qualified institutional buyers under Rule 144A of the Securities Act of 1933. These Rule 144A securities, as well as commercial paper that is sold in private placements under Section 4(2) of the Securities Act, may be deemed liquid by the Fund’s Subadviser under the guidelines adopted by the Trustees of the Fund. However, the liquidity of the Fund’s investments in Rule 144A securities could be impaired if trading does not develop or declines.
Foreign Currency Translation: The books and records of the Funds are maintained in U.S. dollars. Foreign currency amounts are translated into U.S. dollars on the following basis:
(i) market value of investment securities, other assets and liabilities—at the current rates of exchange;
(ii) purchases and sales of investment securities, income and expenses—at the rates of exchange prevailing on the respective dates of such transactions.
Although the net assets of the Funds are presented at the foreign exchange rates and market values at the close of the period, the Funds do not generally isolate that portion of the results of operations arising as a result of changes in the foreign exchange rates from the fluctuations arising from changes in the market prices of long-term portfolio securities held at the end of the period. Similarly, the Funds do not isolate the effect of changes in foreign exchange rates from the fluctuations arising from changes in the market prices of long-term portfolio securities sold during the period. Accordingly, holding period realized foreign currency gains (losses) are included in the reported net realized gains (losses) on investment transactions. Notwithstanding the above, the Funds do isolate the effect of fluctuations in foreign currency exchange rates when determining the gain (loss) upon the sale or maturity of foreign currency denominated debt obligations; such amounts are included in net realized gains (losses) on foreign currency transactions.
Additionally, net realized gains (losses) on foreign currency transactions represent net foreign exchange gains (losses) from the disposition of holdings of foreign currencies, forward currency contracts, currency gains (losses) realized between the trade and settlement dates on securities transactions, and the difference between the amounts of interest, dividends and foreign withholding taxes recorded on the Funds’ books and the U.S. dollar equivalent amounts actually received or paid. Net unrealized currency gains (losses) from valuing foreign currency denominated assets and liabilities (other than investments) at period end exchange rates are reflected as a component of net unrealized appreciation (depreciation) on foreign currencies.
Commodities: The Commodity Strategies Fund gains exposure to commodity markets through direct investment of the Commodity Strategies Fund’s assets or through the Subsidiary. The Commodity Strategies Fund gains exposure to the commodity markets primarily through exchange-traded futures on commodities held by the Subsidiary. The Commodity Strategies Fund may invest up to 25% of its total assets in the Subsidiary. The Subsidiary may invest in commodity investments without limit. The Commodity Strategies Fund invests in the Subsidiary in order to gain exposure to commodities within the limitations of the federal tax law requirements applicable to regulated investment companies such as the Fund. The Commodity Strategies Fund may invest directly in commodity-linked structured notes (CLNs). The Commodity Strategies Fund may also gain direct exposure to commodities through direct investment in certain exchange-traded funds (ETFs) whose returns are linked to commodities or commodity indices within the limit of applicable tax law. Commodities are assets that have tangible properties, such as oil, agriculture products and precious metals. The value of commodities may be affected by, among other things, changes in overall market movements, commodity index volatility, changes in interest rates, or factors affecting a particular industry or commodity, such as drought, floods, weather, livestock disease, embargos, tariffs and international economic, political and regulatory developments. These factors may have a larger impact on commodity prices and commodity linked instruments than on traditional securities. Certain commodities are also subject to limited pricing flexibility because of supply and demand factors. Others are subject to broad price fluctuations as a result of the volatility of the prices for certain raw materials and the instability of supplies of other materials. These additional variables may create additional risks which subject the Fund’s investments to greater volatility than investments in traditional securities.
Financial Futures Contracts: A financial futures contract is an agreement to purchase (long) or sell (short) an agreed amount of securities at a set price for delivery on a future date. Upon entering into a financial futures contract, the Fund is required to pledge to the broker an amount of cash and/or other assets equal to a certain percentage of the contract amount. This amount is known as the “initial margin.” Subsequent payments, known as “variation margin,” are made or received by the Fund each day, depending on the daily fluctuations in the value of the underlying security. Such variation margin is recorded for financial statement purposes on a daily basis as unrealized gain (loss). When the contract expires or is closed, the gain (loss) is realized and is presented in the Statement of Operations (Consolidated Statement of Operations for Commodity Strategies) as net realized gain (loss) on futures transactions.
| | | | |
| Prudential Day One Underlying Funds | | | 145 | |
Notes to Financial Statements/Consolidated Financial Statements (continued)
The Fund invested in financial futures contracts in order to hedge its existing portfolio securities, or securities the Fund intends to purchase, against fluctuations in value caused by changes in prevailing interest rates, value of equities or foreign currency exchange rates. Should interest rates move unexpectedly, the Fund may not achieve the anticipated benefits of the financial futures contracts and may realize a loss. Commodity Strategies invested in financial futures contracts in order to hedge or gain exposure to commodity markets. The use of futures transactions involves the risk of imperfect correlation in movements in the price of futures contracts, interest rates and the underlying hedged assets. Since futures contracts are exchange-traded, there is minimal counterparty credit risk to the Fund since the exchanges’ clearinghouse acts as counterparty to all exchange-traded futures and guarantees the futures contracts against default.
Master Netting Arrangements: PIP 2, on behalf of the Fund, is subject to various Master Agreements, or netting arrangements, with select counterparties. These are agreements which a subadviser may have negotiated and entered into on behalf of the Fund. A master netting arrangement between the Fund and the counterparty permits the Fund to offset amounts payable by the Fund to the same counterparty against amounts to be received; and by the receipt of collateral from the counterparty by the Fund to cover the Fund’s exposure to the counterparty. However, there is no assurance that such mitigating factors are easily enforceable. In addition to master netting arrangements, the right to set-off exists when all the conditions are met such that each of the parties owes the other determinable amounts, the reporting party has the right to set-off the amount owed with the amount owed by the other party, the reporting party intends to set-off and the right of set-off is enforceable by law. During the reporting period, there was no intention to settle on a net basis and all amounts are presented on a gross basis on the Statement of Assets and Liabilities (Consolidated Statement of Assets and Liabilities for Commodity Strategies).
Securities Lending: The Funds may lend their portfolio securities to banks and broker-dealers. The loans are secured by collateral at least equal to the market value of the securities loaned. Collateral pledged by each borrower is invested in an affiliated money market fund and is marked to market daily, based on the previous day’s market value, such that the value of the collateral exceeds the value of the loaned securities. Loans are subject to termination at the option of the borrower or the Fund. Upon termination of the loan, the borrower will return to the Fund securities identical to the loaned securities. Should the borrower of the securities fail financially, the Fund has the right to repurchase the securities in the open market using the collateral. The Fund recognizes income, net of any rebate and securities lending agent fees, for lending its securities in the form of fees or interest on the investment of any cash received as collateral. The borrower receives all interest and dividends from the securities loaned and such payments are passed back to the lender in amounts equivalent thereto. The Fund also continues to recognize any unrealized gain (loss) in the market price of the securities loaned and on the change in the value of the collateral invested that may occur during the term of the loan. In addition, realized gain
(loss) is recognized on changes in the value of the collateral invested upon liquidation of the collateral. Net earnings from securities lending are disclosed on the Statement of Operations (Consolidated Statement of Operations for Commodity Strategies) as “Income from securities lending, net”.
Concentration of Risk: The ability of debt securities issuers (other than those issued or guaranteed by the U.S. Government) held by the Funds to meet their obligations may be affected by the economic or political developments in a specific industry, region or country. Foreign security and currency transactions may involve certain considerations and risks not typically associated with those of domestic origin as a result of, among other factors, the possibility of political or economic instability or the level of governmental supervision and regulation of foreign securities markets.
Offering and Organization Costs: The Prudential Commodity Strategies Fund offering costs paid in connection with the offering of shares of the Fund are amortized on a straight-line basis over 12 months from the date of commencement of operations. Organization costs paid in connection with the organization of the Fund are expensed on the first day of operations.
Securities Transactions and Net Investment Income: Securities transactions are recorded on the trade date. Realized gains (losses) from investment and currency transactions are calculated on the specific identification method. Dividend income is recorded on the ex-date. Interest income, including amortization of premium and accretion of discount on debt securities, as required, is recorded on the accrual basis. Expenses are recorded on an accrual basis, which may require the use of certain estimates by management that may differ from actual.
Net investment income or loss (other than distribution fees which are charged directly to the respective class) and unrealized and realized gains (losses) are allocated daily to each class of shares based upon the relative proportion of adjusted net assets of each class at the beginning of the day.
Equity Real Estate Investment Trusts (REITs): The Funds invest in Equity REITs, which report information on the source of their distributions annually. Based on current and historical information, a portion of distributions received from Equity REITs during the period is estimated to be dividend income, capital gain or return of capital and recorded accordingly. When material these estimates are adjusted periodically when the actual source of distributions is disclosed by the Equity REITs.
Concentration of Risk for REITs: Real estate securities are subject to the same risks as direct investments in real estate and mortgages, and their value will depend on the value of the underlying properties or the underlying loans or interests. The underlying loans may be subject to the risks of default or of prepayments that occur earlier or later than expected, and such loans may also include so-called “subprime” mortgages. The value of these securities will rise and fall in response to many factors, including economic conditions, the demand for rental property and interest rates. In particular, the value of these securities may decline when interest rates rise and will also be affected by the real estate market and by the management of the underlying properties.
| | | | |
| Prudential Day One Underlying Funds | | | 147 | |
Notes to Financial Statements/Consolidated Financial Statements (continued)
In addition, investing in REITs involves certain unique risks in addition to those risks associated with investing in the real estate industry in general. Equity REITs may be affected by changes in the value of the underlying property owned by the REITs, while mortgage REITs may be affected by the quality of any credit extended. REITs are dependent upon management skills, may not be diversified geographically or by property/mortgage asset type, and are subject to heavy cash flow dependency, default by borrowers and self-liquidation. REITs may be more volatile and/or more illiquid than other types of equity securities. REITs (especially mortgage REITs) are subject to interest rate risks. REITs may incur significant amounts of leverage. The Fund will indirectly bear a portion of the expenses, including management fees, paid by each REIT in which it invests, in addition to the expenses of the Fund.
Taxes: It is each Fund’s policy to continue to meet the requirements of the Internal Revenue Code applicable to regulated investment companies and to distribute all of its taxable net investment income and capital gains, if any, to its shareholders. Therefore, no federal income tax provision is required. Withholding taxes on foreign dividends, interest and capital gains, if any, are recorded, net of reclaimable amounts, at the time the related income is earned.
Dividends and Distributions: Core Conservative Bond and TIPS expect to pay dividends from net investment income monthly and distributions from net realized capital gains, if any, annually. Commodity Strategies, Jennison Small-Cap Core Equity, QMA Mid-Cap Core Equity and QMA US Broad Market Index expect to pay dividends from net investment income and distributions from net realized capital gains, if any, annually. Dividends and distributions to shareholders, which are determined in accordance with federal income tax regulations and which may differ from generally accepted accounting principles, are recorded on the ex-date. Permanent book/tax differences relating to income and gain (loss) are reclassified amongst undistributed net investment income, accumulated net realized gain (loss) and paid-in capital in excess of par, as appropriate.
Estimates: The preparation of financial statements (consolidated financial statements for Commodity Strategies) requires management to make estimates and assumptions that affect the reported amounts and disclosures in the financial statements. Actual results could differ from those estimates.
2. Agreements
PIP 2, on behalf of the Funds, has a management agreement with PGIM Investments. Pursuant to this agreement, PGIM Investments has responsibility for all investment advisory services and supervises the subadviser’s performance of such services. At July 31, 2017, PGIM Investments has engaged the firms referenced in Note 1 as Subadvisers for their respective Funds.
The management fee payable to PGIM Investments is accrued daily and payable monthly at an annual rate of the Funds’ average daily net assets specified below and PGIM Investments, in turn, pays each subadviser a fee for its services.
| | | | | | |
| | | Management
Fees | | Effective
Management Fees,
Net of Waiver | | Effective December 1, 2016
Fee Waivers and/or
Expense Limitations
through November 30, 2018 |
Jennison Small-Cap Core Equity | | .75% | | — # | | contractually limit expenses to .95%. |
Core Conservative Bond | | .27% | | — # | | contractually limit expenses to .50%. |
TIPS | | .23% | | — # | | contractually limit expenses to .40%. |
Commodity Strategies | | .60% | | — # | | contractually limit expenses to 1.00%.* |
QMA US Broad Market Index | | .18% | | — # | | contractually limit expenses to .20%. |
QMA Mid-Cap Core Equity | | .50% | | — # | | contractually limit expenses to .85%. |
| # | The management fee amount waived and/or expense reimbursement exceeds the management fee for the current period due to expense limitations described above. |
| * | The manager has contractually agreed to waive any management fees it receives from the Fund in an amount equal to the management fees paid by the Cayman Subsidiary. This waiver will remain in effect for as long as the Fund remains invested or intends to invest in the Cayman Subsidiary. |
PIP 2, on behalf of the Funds, has a distribution agreement with Prudential Investment Management Services LLC (“PIMS”), which acts as the distributor of the Class Q shares of the Fund. No distribution or service fees are paid to PIMS as distributor for Class Q shares of the Fund.
PGIM Investments, PGIM, Inc., Jennison and QMA are indirect, wholly-owned subsidiaries of Prudential Financial, Inc. (“Prudential”).
3. Other Transactions with Affiliates
Prudential Mutual Fund Services LLC (“PMFS”), an affiliate of PGIM Investments and an indirect, wholly-owned subsidiary of Prudential, serves as the transfer agent of the Funds. The transfer agent’s fees and expenses in the Statement of Operations (Consolidated Statement of Operations for Commodity Strategies) include certain out-of-pocket expenses paid to non-affiliates, where applicable.
The Funds may enter into certain securities purchase or sale transactions under Board approved Rule 17a-7 procedures. Rule 17a-7 is an exemptive rule under the 1940 Act, that permits purchase and sale transactions among affiliated investment companies, or between an investment company and a person that is affiliated solely by reason of having a common (or affiliated) investment adviser, common directors, and/or common officers. Such transactions are subject to ratification by the Board. For the period ended July 31, 2017 no such transactions were entered into by the Funds.
The Funds may invest their overnight sweep cash in the Prudential Core Ultra Short Bond Fund (the “Core Fund”) and their securities lending cash collateral in the Prudential Institutional Money Market Fund (the “Money Market Fund”). Earnings from the Core Fund
| | | | |
| Prudential Day One Underlying Funds | | | 149 | |
Notes to Financial Statements/Consolidated Financial Statements (continued)
and the Money Market Fund are disclosed on the Statement of Operations (Consolidated Statement of Operations for Commodity Strategies) as “Affiliated dividend income” and “Income from securities lending, net”, respectively.
For the reporting period ended July 31, 2017, PGIM, Inc. was compensated by PGIM Investments for managing the Funds’ securities lending cash collateral as subadviser to the Money Market Fund:
| | | | |
| | | Amount | |
Jennison Small-Cap Core Equity | | $ | 236 | |
QMA US Broad Market Index | | | 2 | |
QMA Mid-Cap Core Equity | | | 11 | |
4. Portfolio Securities
The aggregate cost of purchases and proceeds from sales of portfolio securities (excluding short-term investments and U.S. Treasury securities) for the period ended July 31, 2017, were as follows:
| | | | | | | | |
| | | Cost of
Purchases | | | Proceeds
from Sales | |
Jennison Small-Cap Core Equity | | $ | 13,722,315 | | | $ | 3,017,382 | |
Core Conservative Bond | | | 81,449,878 | | | | 60,393,657 | |
TIPS | | | 18,672,395 | | | | 2,809,518 | |
Commodity Strategies | | | — | | | | — | |
QMA US Broad Market Index | | | 20,381,569 | | | | 582,681 | |
QMA Mid-Cap Core Equity | | | 11,617,893 | | | | 3,770,252 | |
5. Distributions and Tax Information
Distributions to shareholders, which are determined in accordance with federal income tax regulations, which may differ from generally accepted accounting principles, are recorded on the ex-date. In order to present undistributed net investment income, accumulated net realized gain/loss on investment transactions and paid-in capital in excess of par on the Statement of Assets and Liabilities that more closely represent their tax character, certain adjustments have been made to undistributed net investment income and accumulated net realized gain/loss on investment transactions.
For the period ended July 31, 2017, the adjustments were as follows:
| | | | | | | | |
| | | Undistributed
Net Investment
Income | | | Accumulated
Net Realized
Gain/Loss on
Investment
Transactions | |
Core Conservative Bond(a)(b) | | $ | 52,884 | | | $ | (52,884 | ) |
TIPS(a) | | | 37,351 | | | | (37,351 | ) |
Commodity Strategies(c) | | | 229,115 | | | | (229,115 | ) |
| (a) | Differences in the tax treatment of premium amortization. |
| (b) | Reclassification of paydowns. |
| (c) | Differences in the treatment for book and tax purposes related to the investment in the Subsidiary. |
Net investment income or loss, net realized gains or losses and net assets were not affected by these adjustments.
For the period ended July 31, 2017, the tax character of dividends paid as reflected in the Statement of Changes in Net Assets were as follows:
| | | | |
| | | Ordinary
Income | |
Jennison Small-Cap Core Equity | | $ | 16,947 | |
Core Conservative Bond | | | 365,156 | |
TIPS | | | 115,604 | |
QMA US Broad Market Index | | | 21,693 | |
QMA Mid-Cap Core Equity | | | 5,533 | |
Commodity Strategies had no dividends paid during the period ended July 31, 2017.
For the period ended July 31, 2017, the Funds had the following amounts of accumulated undistributed earnings on a tax basis:
| | | | | | | | |
| | | Undistributed
Ordinary
Income | | | Undistributed
Long-Term
Capital Gains | |
Jennison Small-Cap Core Equity | | $ | 233,836 | | | $ | 1,853 | |
Core Conservative Bond | | | 2,299 | | | | — | |
TIPS | | | 3,506 | | | | — | |
Commodity Strategies | | | 214,882 | | | | — | |
QMA US Broad Market Index | | | 148,986 | | | | 21,365 | |
QMA Mid-Cap Core Equity | | | 178,332 | | | | 1,967 | |
These amounts may differ from the amounts shown on the Statement of Assets and Liabilities primarily due to cumulative timing differences between financial and tax reporting.
| | | | |
| Prudential Day One Underlying Funds | | | 151 | |
Notes to Financial Statements/Consolidated Financial Statements (continued)
The United States federal income tax basis of the Funds’ investments and the total net unrealized appreciation/depreciation as of July 31, 2017 were as follows:
| | | | | | | | | | | | | | | | | | | | | | | | |
| | | Tax Basis | | | Appreciation | | | Depreciation | | | Net
Unrealized
Appreciation/
Depreciation | | | Other Cost
Basis
Adjustments | | | Total Net
Unrealized
Appreciation/
Depreciation | |
Jennison Small-Cap Core Equity | | $ | 11,923,793 | | | $ | 1,397,122 | | | $ | (343,649 | ) | | $ | 1,053,473 | | | $ | — | | | $ | 1,053,473 | |
Core Conservative Bond | | | 34,483,302 | | | | 215,424 | | | | (25,802 | ) | | | 189,622 | | | | — | | | | 189,622 | |
TIPS | | | 16,026,995 | | | | 70,280 | | | | (88,618 | ) | | | (18,338 | ) | | | — | | | | (18,338 | ) |
Commodity Strategies | | | 13,803,041 | | | | — | | | | (20 | ) | | | (20 | ) | | | 54,614 | | | | 54,594 | |
QMA US Broad Market Index | | | 22,757,049 | | | | 1,652,480 | | | | (255,873 | ) | | | 1,396,607 | | | | — | | | | 1,396,607 | |
QMA Mid-Cap Core Equity | | | 8,789,410 | | | | 601,617 | | | | (175,873 | ) | | | 425,744 | | | | — | | | | 425,744 | |
The difference between book basis and tax basis was primarily attributable to deferred losses on wash sales. The other cost basis adjustments were primarily attributable to appreciation/depreciation on foreign currencies and futures.
For federal income tax purposes, the following Funds had a capital loss carryforward as of July 31, 2017 which can be carried forward for an unlimited period. No capital gains distributions are expected to be paid to shareholders until net gains have been realized in excess of such losses.
| | | | |
| | | Capital Loss
Carryforward | |
Core Conservative Bond | | $ | 82,239 | |
TIPS | | | 12,898 | |
Management has analyzed the Funds’ tax positions and has concluded that no provision for income tax is required in the Funds’ financial statements (consolidated financial statements for Commodity Strategies) for the current reporting period. The Funds’ federal excise tax returns for tax years for which the applicable statutes of limitations have not expired are subject to examination by the Internal Revenue Service.
6. Capital
The Funds offer Class Q shares. Effective as of May 22, 2017, shares of the Funds are registered under the Securities Act of 1933, as amended.
PIP 2 has authorized an unlimited number of shares of beneficial interest at $.001 par value per share.
At reporting period, Prudential owned the following number of shares of the Funds:
| | | | |
| | | Class Q | |
Jennison Small-Cap Core Equity | | | 1,001,654 | |
Core Conservative Bond | | | 2,535,355 | |
TIPS | | | 509,038 | |
Commodity Strategies | | | 1,000,000 | |
QMA US Broad Market Index | | | 1,002,078 | |
QMA Mid-Cap Core Equity | | | 500,529 | |
In addition, the following number of shareholders held the following percentages of outstanding shares of the Funds on behalf of multiple beneficial owners:
| | | | | | | | |
| | | Number of
Shareholders | | | % of
Outstanding Shares | |
Jennison Small-Cap Core Equity | | | 1 | | | | 90 | |
Core Conservative Bond | | | 1 | | | | 81 | |
TIPS | | | 6 | | | | 94 | |
Commodity Strategies | | | 3 | | | | 86 | |
QMA US Broad Market Index | | | 5 | | | | 87 | |
QMA Mid-Cap Core Equity | | | 4 | | | | 87 | |
Transactions in shares of beneficial interest were as follows:
Jennison Small-Cap Core Equity
| | | | | | | | |
Class Q | | Shares | | | Amount | |
Period ended July 31, 2017*: | | | | | | | | |
Shares sold | | | 1,119,251 | | | $ | 11,329,854 | |
Shares issued in reinvestment of dividends and distributions | | | 1,657 | | | | 16,947 | |
Shares reacquired | | | (4,613 | ) | | | (51,535 | ) |
| | | | | | | | |
Net increase (decrease) in shares outstanding | | | 1,116,295 | | | $ | 11,295,266 | |
| | | | | | | | |
| * | Commencement of operations was November 15, 2016. |
Core Conservative Bond
| | | | | | | | |
Class Q | | Shares | | | Amount | |
Period ended July 31, 2017*: | | | | | | | | |
Shares sold | | | 3,116,135 | | | $ | 31,148,943 | |
Shares issued in reinvestment of dividends and distributions | | | 36,615 | | | | 365,155 | |
Shares reacquired | | | (26,509 | ) | | | (265,872 | ) |
| | | | | | | | |
Net increase (decrease) in shares outstanding | | | 3,126,241 | | | $ | 31,248,226 | |
| | | | | | | | |
| * | Commencement of operations was November 15, 2016. |
| | | | |
| Prudential Day One Underlying Funds | | | 153 | |
Notes to Financial Statements/Consolidated Financial Statements (continued)
TIPS
| | | | | | | | |
Class Q | | Shares | | | Amount | |
Period ended July 31, 2017*: | | | | | | | | |
Shares sold | | | 1,660,933 | | | $ | 16,410,866 | |
Shares issued in reinvestment of dividends and distributions | | | 11,648 | | | | 115,603 | |
Shares reacquired | | | (49,329 | ) | | | (487,988 | ) |
| | | | | | | | |
Net increase (decrease) in shares outstanding | | | 1,623,252 | | | $ | 16,038,481 | |
| | | | | | | | |
| * | Commencement of operations was November 15, 2016. |
Commodity Strategies
| | | | | | | | |
Class Q | | Shares | | | Amount | |
Period ended July 31, 2017*: | | | | | | | | |
Shares sold | | | 1,381,783 | | | $ | 13,792,034 | |
Shares reacquired | | | (21,352 | ) | | | (213,299 | ) |
| | | | | | | | |
Net increase (decrease) in shares outstanding | | | 1,360,431 | | | $ | 13,578,735 | |
| | | | | | | | |
| * | Commencement of operations was November 15, 2016. |
QMA US Broad Market Index
| | | | | | | | |
Class Q | | Shares | | | Amount | |
Period ended July 31, 2017*: | | | | | | | | |
Shares sold | | | 1,999,808 | | | $ | 21,146,670 | |
Shares issued in reinvestment of dividends and distributions | | | 2,100 | | | | 21,693 | |
Shares reacquired | | | (32,182 | ) | | | (361,048 | ) |
| | | | | | | | |
Net increase (decrease) in shares outstanding | | | 1,969,726 | | | $ | 20,807,315 | |
| | | | | | | | |
| * | Commencement of operations was November 17, 2016. |
QMA Mid-Cap Core Equity
| | | | | | | | |
Class Q | | Shares | | | Amount | |
Period ended July 31, 2017*: | | | | | | | | |
Shares sold | | | 762,851 | | | $ | 7,907,520 | |
Shares issued in reinvestment of dividends and distributions | | | 532 | | | | 5,533 | |
Shares reacquired | | | (8,369 | ) | | | (92,824 | ) |
| | | | | | | | |
Net increase (decrease) in shares outstanding | | | 755,014 | | | $ | 7,820,229 | |
| | | | | | | | |
| * | Commencement of operations was November 17, 2016. |
7. Borrowings
PIP 2, on behalf of the Funds, along with other affiliated registered investment companies (the “Funds”), is a party to a Syndicated Credit Agreement (“SCA”) with a group of banks. The purpose of the SCA is to provide an alternative source of temporary funding for capital share redemptions. The SCA provides for a commitment of $900 million for the period October 6, 2016 through October 5, 2017. The Funds pay an annualized commitment fee of .15% of the unused portion of the SCA. Each Fund’s portion of the commitment fee for the unused amount, allocated based upon a method approved by the Board, is accrued daily and paid quarterly. The interest on borrowings under the SCA is paid monthly and at a per annum interest rate based upon a contractual spread plus the higher of (1) the effective federal funds rate, (2) the 1-month LIBOR rate or (3) zero percent.
Other affiliated registered investment companies that are parties to the SCA include portfolios that are subject to a predetermined mathematical formula used to manage certain benefit guarantees offered under variable annuity contracts. The formula may result in large scale asset flows into and out of the portfolios. Consequently, the portfolios may be more likely to utilize the SCA for purposes of funding redemptions. It may be possible for those portfolios to fully exhaust the committed amount of the SCA, thereby requiring the Manager to allocate available funding per a Board-approved methodology designed to treat the Funds in the SCA equitably.
The Funds did not utilize the SCA during the period ended July 31, 2017.
8. Recent Accounting Pronouncements and Reporting Updates
On October 13, 2016, the Securities and Exchange Commission (the “SEC”) adopted new rules and forms and amended existing rules and forms which are intended to modernize and enhance the reporting and disclosure of information by registered investment companies and to improve the quality of information that funds provide to investors, including modifications to Regulation S-X which would require standardized, enhanced disclosure about derivatives in investment company financial statements. The compliance dates of the modifications to Regulation S-X are August 1, 2017 and other amendments and rules are generally June 1, 2018 and December 1, 2018. Management is currently evaluating the impacts to the financial statement disclosures.
| | | | |
| Prudential Day One Underlying Funds | | | 155 | |
Prudential Jennison Small-Cap Core Equity Fund
Financial Highlights
| | | | |
| Class Q Shares | |
| | | November 15, 2016(a)
through
July 31, 2017 | |
| Per Share Operating Performance(b): | | | | |
| Net Asset Value, Beginning of Period | | | $10.00 | |
| Income (loss) from investment operations: | | | | |
| Net investment income | | | .02 | |
| Net realized and unrealized gain (loss) on investments | | | 1.27 | |
| Total from investment operations | | | 1.29 | |
| Less Dividends and Distributions: | | | | |
| Dividends from net investment income | | | (.02 | ) |
| Net asset value, end of period | | | $11.27 | |
| Total Return(c): | | | 12.89% | |
| | | | |
| Ratios/Supplemental Data: | | | |
| Net assets, end of period (000) | | | $12,584 | |
| Average net assets (000) | | | $10,943 | |
| Ratios to average net assets:(d) | | | | |
| Expenses after waivers and/or expense reimbursement | | | 1.02% | (e) |
| Expenses before waivers and/or expense reimbursement | | | 2.04% | (e) |
| Net investment income (loss) | | | .22% | (e) |
| Portfolio turnover rate | | | 28% | (f) |
| (a) | Commencement of operations. |
| (b) | Calculations are based on average shares outstanding during the period. |
| (c) | Total return is calculated assuming a purchase of a share on the first day and a sale on the last day of each period reported and includes reinvestment of dividends and distributions. if any. Total returns may reflect adjustments to conform to generally accepted accounting principles. Total returns for periods less than one full year are not annualized. |
| (d) | Does not include expenses of the underlying portfolio in which the Fund invests. |
See Notes to Financial Statements/Consolidated Financial Statements.
Prudential Core Conservative Bond Fund
Financial Highlights
| | | | |
| Class Q Shares | |
| | | November 15, 2016(a)
through
July 31, 2017 | |
| Per Share Operating Performance(b): | | | | |
| Net Asset Value, Beginning of Period | | | $10.00 | |
| Income (loss) from investment operations: | | | | |
| Net investment income (loss) | | | .12 | |
| Net realized and unrealized gain (loss) on investments | | | .05 | |
| Total from investment operations | | | .17 | |
| Less Dividends and Distributions: | | | | |
| Dividends from net investment income | | | (.14 | ) |
| Net asset value, end of period | | | $10.03 | |
| Total Return(c): | | | 1.72% | |
| | | | |
| Ratios/Supplemental Data: | |
| Net assets, end of period (000) | | | $31,357 | |
| Average net assets (000) | | | $25,827 | |
| Ratios to average net assets(d): | | | | |
| Expenses after waivers and/or expense reimbursement | | | .53% | (e) |
| Expenses before waivers and/or expense reimbursement | | | .95% | (e) |
| Net investment income (loss) | | | 1.72% | (e) |
| Portfolio turnover rate | | | 348% | (f) |
| (a) | Commencement of operations. |
| (b) | Calculated based on average shares outstanding during the period. |
| (c) | Total return is calculated assuming a purchase of a share on the first day and a sale on the last day of each period reported and includes reinvestment of dividends and distributions, if any. Total returns may reflect adjustments to conform to generally accepted accounting principles. Total returns for periods less than one full year are not annualized. |
| (d) | Does not include expenses of the underlying portfolios in which the Fund invests. |
See Notes to Financial Statements/Consolidated Financial Statements.
| | | | |
| Prudential Day One Underlying Funds | | | 157 | |
Prudential TIPS Fund
Financial Highlights
| | | | |
| Class Q Shares | | | |
| | | November 15, 2016(a)
through
July 31, 2017 | |
| Per Share Operating Performance(b): | | | | |
| Net Asset Value, Beginning of Period | | | $10.00 | |
| Income (loss) from investment operations: | | | | |
| Net investment income (loss) | | | .13 | |
| Net realized and unrealized gain (loss) on investments | | | (.09) | |
| Total from investment operations | | | 0.04 | |
| Less Dividends and Distributions: | | | | |
| Dividends from net investment income | | | (.18) | |
| Net asset value, end of period | | | $9.86 | |
| Total Return(c): | | | .38% | |
| | | | |
| Ratios/Supplemental Data: | | | |
| Net assets, end of period (000) | | | $16,011 | |
| Average net assets (000) | | | $6,479 | |
| Ratios to average net assets(d): | | | | |
| Expenses after waivers and/or expense reimbursement | | | .55% | (e) |
| Expenses before waivers and/or expense reimbursement | | | 2.41% | (e) |
| Net investment income (loss) | | | 1.79% | (e) |
| Portfolio turnover rate | | | 41% | (f) |
| (a) | Commencement of operations. |
| (b) | Calculated based on average shares outstanding during the period. |
| (c) | Total return is calculated assuming a purchase of a share on the first day and a sale on the last day of each period reported and includes reinvestment of dividends and distributions, if any. Total returns may reflect adjustments to conform to generally accepted accounting principles. Total returns for periods less than one year are not annualized. |
| (d) | Does not include expenses of the underlying funds in which the Fund invests. |
See Notes to Financial Statements/Consolidated Financial Statements.
Prudential Commodity Strategies Fund
Consolidated Financial Highlights
| | | | |
| Class Q Shares | |
| | | November 15, 2016(a)
through
July 31, 2017 | |
| Per Share Operating Performance(b): | | | | |
| Net Asset Value, Beginning of Period | | | $10.00 | |
| Income (loss) from investment operations: | | | | |
| Net investment income (loss) | | | (.05 | ) |
| Net realized and unrealized gain (loss) on investments | | | .20 | |
| Total from investment operations | | | .15 | |
| Net asset value, end of period | | | $10.15 | |
| Total Return(c): | | | 1.50% | |
| | | | |
| Ratios/Supplemental Data: | | | |
| Net assets, end of period (000) | | | $13,811 | |
| Average net assets (000) | | | $10,738 | |
| Ratios to average net assets(d): | | | | |
| Expenses after waivers and/or expense reimbursement | | | 1.30% | (e) |
| Expenses before waivers and/or expense reimbursement | | | 2.64% | (e) |
| Net investment income (loss) | | | (.67)% | (e) |
| Portfolio turnover rate | | | 0% | (f)(g) |
| (a) | Commencement of operations. |
| (b) | Calculated based on average shares outstanding during the period. |
| (c) | Total return is calculated assuming a purchase of a share on the first day and a sale on the last day of each period reported and includes reinvestment of dividends and distributions, if any. Total returns may reflect adjustments to conform to generally accepted accounting principles. Total returns for periods less than one full year are not annualized. |
| (d) | Does not include expenses of the underlying portfolio in which the Fund invests. |
| (g) | The Fund’s portfolio turnover rate is calculated in accordance with regulatory requirements, without regard to transactions involving short term investments and certain derivatives. If such transactions were included, the Fund’s portfolio turnover rate may be higher. |
See Notes to Financial Statements/Consolidated Financial Statements.
| | | | |
| Prudential Day One Underlying Funds | | | 159 | |
Prudential QMA US Broad Market Index Fund
Financial Highlights
| | | | |
| Class Q Shares | |
| | | November 17, 2016(a)
through
July 31, 2017 | |
| Per Share Operating Performance(b): | | | | |
| Net Asset Value, Beginning of Period | | | $10.00 | |
| Income (loss) from investment operations: | | | | |
| Net investment income (loss) | | | .12 | |
| Net realized and unrealized gain (loss) on investments | | | 1.26 | |
| Total from investment operations | | | 1.38 | |
| Less Dividends and Distributions: | | | | |
| Dividends from net investment income | | | (.02 | ) |
| Net asset value, end of period | | | $11.36 | |
| Total Return(c): | | | 13.84% | |
| | | | |
| Ratios/Supplemental Data: | |
| Net assets, end of period (000) | | | $22,374 | |
| Average net assets (000) | | | $12,357 | |
| Ratios to average net assets(d): | | | | |
| Expenses after waivers and/or expense reimbursement | | | .26% | (e) |
| Expenses before waivers and/or expense reimbursement | | | 1.86% | (e) |
| Net investment income (loss) | | | 1.63% | (e) |
| Portfolio turnover rate | | | 5% | (f) |
| (a) | Commencement of operations. |
| (b) | Calculated based on average shares outstanding during the period. |
| (c) | Total return is calculated assuming a purchase of a share on the first day and a sale on the last day of each period reported and includes reinvestment of dividends and distributions, if any. Total returns may reflect adjustments to conform to generally accepted accounting principles. Total returns for periods less than one full year are not annualized. |
| (d) | Does not include expenses of the underlying portfolios in which the Fund invests. |
See Notes to Financial Statements/Consolidated Financial Statements.
Prudential QMA Mid-Cap Core Equity Fund
Financial Highlights
| | | | |
| Class Q Shares | | | |
| | | November 17, 2016(a)
through
July 31, 2017 | |
| Per Share Operating Performance(b): | | | | |
| Net Asset Value, Beginning of Period | | | $10.00 | |
| Income (loss) from investment operations: | | | | |
| Net investment income (loss) | | | .05 | |
| Net realized and unrealized gain (loss) on investment transactions | | | 1.12 | |
| Total from investment operations | | | 1.17 | |
| Less Dividends and Distributions: | | | | |
| Dividends from net investment income | | | (.01 | ) |
| Net asset value, end of period | | | $11.16 | |
| Total Return(c): | | | 11.72% | |
| |
| Ratios/Supplemental Data: | | | |
| Net assets, end of period (000) | | | $8,426 | |
| Average net assets (000) | | | $5,794 | |
| Ratios to average net assets(d): | | | | |
| Expenses after waivers and/or expense reimbursement | | | .97% | (e) |
| Expenses before waivers and/or expense reimbursement | | | 2.91% | (e) |
| Net investment income (loss) | | | .62% | (e) |
| Portfolio turnover rate | | | 64% | (f) |
| (a) | Commencement of operations. |
| (b) | Calculated based on average shares outstanding during the period. |
| (c) | Total return is calculated assuming a purchase of a share on the first day and a sale on the last day of each period reported and includes reinvestment of dividends and distributions, if any. Total returns may reflect adjustments to conform to generally accepted accounting principles. Total returns for periods of less than one full year are not annualized. |
| (d) | Does not include expenses of the underlying funds in which the Fund invests. |
See Notes to Financial Statements/Consolidated Financial Statements.
| | | | |
| Prudential Day One Underlying Funds | | | 161 | |
Report of Independent Registered Public Accounting Firm
The Board of Trustees and Shareholders
Prudential Investment Portfolios 2:
We have audited the accompanying statements of assets and liabilities, including the schedules of investments, of Prudential Jennison Small-Cap Core Equity Fund, Prudential Core Conservative Bond Fund, Prudential TIPS Fund, Prudential QMA US Broad Market Index Fund, and Prudential QMA Mid-Cap Core Equity Fund, and the consolidated statement of assets and liabilities, including the consolidated schedule of investments, of Prudential Commodity Strategies Fund (hereafter referred to as the “Funds”), each a series of Prudential Investment Portfolios 2, as of July 31, 2017, and the related statements of operations, changes in net assets, and the financial highlights for the period from November 15, 2016 (commencement of operations) to July 31, 2017 for Prudential Jennison Small-Cap Core Equity Fund, Prudential Core Conservative Bond Fund and Prudential TIPS Fund, and for the period from November 17, 2016 (commencement of operations) to July 31, 2017 for Prudential QMA US Broad Market Index Fund and Prudential QMA Mid-Cap Core Equity Fund. We have also audited the consolidated statement of operations, consolidated statement of changes in net assets, and the consolidated financial highlights for the period from November 15, 2016 (commencement of operations) through July 31, 2017 for Prudential Commodity Strategies Fund. These financial statements and consolidated financial statements and financial highlights and consolidated financial highlights are the responsibility of the Funds’ management. Our responsibility is to express an opinion on these financial statements and consolidated financial statements and financial highlights and consolidated financial highlights based on our audits.
We conducted our audits in accordance with the standards of the Public Company Accounting Oversight Board (United States). Those standards require that we plan and perform the audit to obtain reasonable assurance about whether the financial statements and financial highlights are free of material misstatement. An audit includes examining, on a test basis, evidence supporting the amounts and disclosures in the financial statements. Our procedures included confirmation of securities owned as of July 31, 2017, by correspondence with the custodian, transfer agents and brokers or by other appropriate auditing procedures when replies from brokers or transfer agents were not received. An audit also includes assessing the accounting principles used and significant estimates made by management, as well as evaluating the overall financial statement presentation. We believe that our audits provide a reasonable basis for our opinion.
In our opinion, the financial statements and consolidated financial statements and financial highlights and consolidated financial highlights referred to above present fairly, in all material respects, the financial position of the Funds as of July 31, 2017, and the results of
their operations, the changes in their net assets and their financial highlights for the periods described in the first paragraph above, in conformity with U.S. generally accepted accounting principles.

New York, New York
September 19, 2017
| | | | |
| Prudential Day One Underlying Funds | | | 163 | |
Tax Information (unaudited)
For the period ended July 31, 2017, the following Funds reports the maximum amount allowable but not less than the following percentages of ordinary income dividends paid as: 1) qualified dividend income in accordance with Section 854 of the Internal Revenue Code (QDI); 2) eligible for the corporate dividends received deduction in accordance with Section 854 of the Internal Revenue Code (DRD); and 3) interest-related dividends in accordance with Section 871(k)(1) and 881(e)(1) of the Internal Revenue Code (IRD):
| | | | | | | | | | | | |
| | | QDI | | | DRD | | | IRD | |
Jennison Small-Cap Core Equity | | | 19.40% | | | | 20.73% | | | | — | |
Core Conservative Bond | | | — | | | | — | | | | 88.74% | |
TIPS | | | — | | | | — | | | | 100.00% | |
QMA US Broad Market Index | | | 82.22% | | | | 79.83% | | | | — | |
QMA Mid-Cap Core Equity | | | 22.84% | | | | 22.93% | | | | — | |
In January 2018, you will be advised on IRS Form 1099-DIV or substitute 1099-DIV as to the federal tax status of the distributions received by you in calendar year 2017.
We are required by Massachusetts, Missouri and Oregon to inform you that dividends which have been derived from interest on federal obligations are not taxable to shareholders providing the Mutual Fund meets certain requirements mandated by the respective state’s taxing authorities. We are pleased to report that the dividends paid by the following funds qualify for such deduction.
| | | | |
Core Conservative Bond | | | 28.09% | |
TIPS | | | 100.00% | |
For more detailed information regarding your state and local taxes, you should contact your tax adviser or the state/local taxing authorities.
INFORMATION ABOUT BOARD MEMBERS AND OFFICERS
(Unaudited)
Information about Board Members and Officers of the Fund is set forth below. Board Members who are not deemed to be “interested persons” of the Fund, as defined in the 1940 Act, are referred to as “Independent Board Members.” Board Members who are deemed to be “interested persons” of the Fund are referred to as “Interested Board Members.” The Board Members are responsible for the overall supervision of the operations of the Fund and perform the various duties imposed on the directors of investment companies by the 1940 Act. The Board in turn elects the Officers, who are responsible for administering the day-to-day operations of the Fund.
| | | | |
| Independent Board Members(1) |
Name, Address, Age Position(s) Portfolios Overseen | | Principal Occupation(s) During Past Five Years | | Other Directorships Held During Past Five Years |
Ellen S. Alberding (59) Board Member Portfolios Overseen: 87 | | President and Board Member, The Joyce Foundation (charitable foundation) (since 2002); Vice Chair, City Colleges of Chicago (community college system) (since 2011); Trustee, Skills for America’s Future (national initiative to connect employers to community colleges) (since 2011); Trustee, National Park Foundation (charitable foundation for national park system) (since 2009); Trustee, Economic Club of Chicago (since 2009). | | None. |
Kevin J. Bannon (65) Board Member Portfolios Overseen: 87 | | Retired; Managing Director (April 2008-May 2015) and Chief Investment Officer (October 2008-November 2013) of Highmount Capital LLC (registered investment adviser); formerly Executive Vice President and Chief Investment Officer (April 1993-August 2007) of Bank of New York Company; President (May 2003-May 2007) of BNY Hamilton Family of Mutual Funds. | | Director of Urstadt Biddle Properties (equity real estate investment trust) (since September 2008). |
Linda W. Bynoe (65) Board Member Portfolios Overseen: 87 | | President and Chief Executive Officer (since March 1995) and formerly Chief Operating Officer (December 1989-February 1995) of Telemat Ltd. (management consulting); formerly Vice President (January 1985-June 1989) at Morgan Stanley & Co. (broker-dealer). | | Director of Simon Property Group, Inc. (retail real estate) (May 2003-May 2012); Director of Anixter International, Inc. (communication products distributor) (since January 2006); Director of Northern Trust Corporation (financial services) (since April 2006); Trustee of Equity Residential (residential real estate) (since December 2009). |
Prudential Day One Underlying Funds
| | | | |
| Independent Board Members(1) |
Name, Address, Age Position(s) Portfolios Overseen | | Principal Occupation(s) During Past Five Years | | Other Directorships Held During Past Five Years |
Barry H. Evans (56)± Board Member Portfolios Overseen: 87 | | Retired; Formerly President (2005–2016), Global Chief Operating Officer (2014–2016), Chief Investment Officer–Global Head of Fixed Income (1998-2014), and various portfolio manager roles (1986-2006), Manulife Asset Management U.S. | | Director, Manulife Trust Company (2011-present); Director, Manulife Asset Management Limited (2015-present); Formerly Chairman of the Board of Directors of Manulife Asset Management U.S. (2005-2016); Formerly Chairman of the Board, Declaration Investment Management and Research (2008-2016) |
Keith F. Hartstein (60) Board Member & Independent Chair Portfolios Overseen: 87 | | Retired; Member (since November 2014) of the Governing Council of the Independent Directors Council (organization of independent mutual fund directors); formerly President and Chief Executive Officer (2005-2012), Senior Vice President (2004-2005), Senior Vice President of Sales and Marketing (1997-2004), and various executive management positions (1990-1997), John Hancock Funds, LLC (asset management); Chairman, Investment Company Institute’s Sales Force Marketing Committee (2003-2008). | | None. |
Laurie Simon Hodrick (55)± Board Member Portfolios Overseen: 87 | | A. Barton Hepburn Professor of Economics in the Faculty of Business, Columbia Business School (since 1996); Visiting Professor of Law and Rock Center for Corporate Governance Fellow, Stanford Law School (since 2015); Visiting Fellow, Hoover Institution, Stanford University (since 2015); Sole Member, ReidCourt LLC (since 2008) (a consulting firm); Formerly Managing Director, Global Head of Alternative Investment Strategies, Deutsche Bank (2006-2008); Formerly Director/Trustee, Merrill Lynch Investment Managers Funds (1999-2006) | | Independent Director, Corporate Capital Trust (since April 2017) (a business development company) |
Michael S. Hyland, CFA (71) Board Member Portfolios Overseen: 87 | | Retired (since February 2005); formerly Senior Managing Director (July 2001-February 2005) of Bear Stearns & Co, Inc.; Global Partner, INVESCO (1999-2001); Managing Director and President of Salomon Brothers Asset Management (1989-1999). | | None. |
Visit our website at pgiminvestments.com
| | | | |
| Independent Board Members(1) |
Name, Address, Age Position(s) Portfolios Overseen | | Principal Occupation(s) During Past Five Years | | Other Directorships Held During Past Five Years |
Richard A. Redeker (74) Board Member & Independent Vice Chair Portfolios Overseen: 87 | | Retired Mutual Fund Senior Executive (47 years); Management Consultant; Director, Mutual Fund Directors Forum (since 2014); Independent Directors Council (organization of independent mutual fund directors)-Executive Committee, Chair of Policy Steering Committee, Governing Council. | | None. |
Stephen G. Stoneburn (74) Board Member Portfolios Overseen: 87 | | Chairman (since July 2011), President and Chief Executive Officer (since June 1996) of Frontline Medical Communications (publishing company); formerly President (June 1995-June 1996) of Argus Integrated Media, Inc.; Senior Vice President and Managing Director (January 1993-1995) of Cowles Business Media; Senior Vice President of Fairchild Publications, Inc. (1975-1989). | | None. |
| ± | Mr. Evans and Ms. Hodrick joined the Board effective as of September 1, 2017. |
| | | | |
| Interested Board Members(1) |
Name, Address, Age Position(s) Portfolios Overseen | | Principal Occupation(s) During Past Five Years | | Other Directorships Held During Past Five Years |
Stuart S. Parker (54) Board Member & President Portfolios Overseen: 87 | | President of PGIM Investments LLC (formerly known as Prudential Investments LLC) (since January 2012); Executive Vice President of Prudential Investment Management Services LLC (since December 2012); Executive Vice President of Jennison Associates LLC and Head of Retail Distribution of PGIM Investments LLC (June 2005-December 2011). | | None. |
Prudential Day One Underlying Funds
| | | | |
| Interested Board Members(1) |
Name, Address, Age Position(s) Portfolios Overseen | | Principal Occupation(s) During Past Five Years | | Other Directorships Held During Past Five Years |
Scott E. Benjamin (44) Board Member & Vice President Portfolios Overseen: 87 | | Executive Vice President (since June 2009) of PGIM Investments LLC; Executive Vice President (June 2009-June 2012) and Vice President (since June 2012) of Prudential Investment Management Services LLC; Executive Vice President (since September 2009) of AST Investment Services, Inc.; Senior Vice President of Product Development and Marketing, PGIM Investments (since February 2006); Vice President of Product Development and Product Management, Prudential Investments (2003-2006). | | None. |
Grace C. Torres* (58) Board Member Portfolios Overseen: 86 | | Retired; formerly Treasurer and Principal Financial and Accounting Officer of the Prudential Funds, Target Funds, Advanced Series Trust, Prudential Variable Contract Accounts and The Prudential Series Fund (1998-June 2014); Assistant Treasurer (March 1999-June 2014) and Senior Vice President (September 1999-June 2014) of PGIM Investments LLC; Assistant Treasurer (May 2003-June 2014) and Vice President (June 2005-June 2014) of AST Investment Services, Inc.; Senior Vice President and Assistant Treasurer (May 2003-June 2014) of Prudential Annuities Advisory Services, Inc. | | Director (since July 2015) of Sun Bancorp, Inc. N.A. and Sun National Bank |
| * | Note: Prior to her retirement in 2014, Ms. Torres was employed by PGIM Investments LLC. Due to her prior employment, she is considered to be an “interested person” under the 1940 Act. Ms. Torres is a Non-Management Interested Board Member. |
| (1) | The year that each Board Member joined the Fund’s Board is as follows: |
Ellen S. Alberding, 2013; Kevin J. Bannon, 2008; Linda W. Bynoe, 2005; Barry H. Evans, 2017; Keith F. Hartstein, 2013; Laurie Simon Hodrick, 2017; Michael S. Hyland, 2008; Richard A. Redeker, 2003; Stephen G. Stoneburn, 1999; Grace C. Torres, 2014; Stuart S. Parker, Board Member and President since 2012; Scott E. Benjamin, Board Member since 2010 and Vice President since 2009.
Visit our website at pgiminvestments.com
| | | | |
| Fund Officers(a) |
Name, Address and Age Position with Fund | | Principal Occupation(s) During Past Five Years | | Length of Service as Fund Officer |
Raymond A. O’Hara (62) Chief Legal Officer | | Vice President and Corporate Counsel (since July 2010) of Prudential Insurance Company of America (Prudential); Vice President (March 2011-Present) of Pruco Life Insurance Company and Pruco Life Insurance Company of New Jersey; Vice President and Corporate Counsel (March 2011-Present) of Prudential Annuities Life Assurance Corporation; Chief Legal Officer of PGIM Investments LLC (since June 2012); Chief Legal Officer of Prudential Mutual Fund Services LLC (since June 2012) and Corporate Counsel of AST Investment Services, Inc. (since June 2012); formerly Assistant Vice President and Corporate Counsel (September 2008-July 2010) of The Hartford Financial Services Group, Inc.; formerly Associate (September 1980-December 1987) and Partner (January 1988–August 2008) of Blazzard & Hasenauer, P.C. (formerly, Blazzard, Grodd & Hasenauer, P.C.). | | Since 2012 |
Chad A. Earnst (42) Chief Compliance Officer | | Chief Compliance Officer (September 2014-Present) of PGIM Investments LLC; Chief Compliance Officer (September 2014-Present) of the Prudential Funds, Target Funds, Advanced Series Trust, The Prudential Series Fund, Prudential’s Gibraltar Fund, Inc., Prudential Global Short Duration High Yield Income Fund, Inc., Prudential Short Duration High Yield Fund, Inc. and Prudential Jennison MLP Income Fund, Inc.; formerly Assistant Director (March 2010-August 2014) of the Asset Management Unit, Division of Enforcement, US Securities & Exchange Commission; Assistant Regional Director (January 2010-August 2014), Branch Chief (June 2006–December 2009) and Senior Counsel (April 2003-May 2006) of the Miami Regional Office, Division of Enforcement, US Securities & Exchange Commission. | | Since 2014 |
Deborah A. Docs (59) Secretary | | Vice President and Corporate Counsel (since January 2001) of Prudential; Vice President (since December 1996) and Assistant Secretary (since March 1999) of PGIM Investments LLC; formerly Vice President and Assistant Secretary (May 2003-June 2005) of AST Investment Services, Inc. | | Since 2004 |
Jonathan D. Shain (59) Assistant Secretary | | Vice President and Corporate Counsel (since August 1998) of Prudential; Vice President and Assistant Secretary (since May 2001) of PGIM Investments LLC; Vice President and Assistant Secretary (since February 2001) of Prudential Mutual Fund Services LLC; formerly Vice President and Assistant Secretary (May 2003-June 2005) of AST Investment Services, Inc. | | Since 2005 |
Claudia DiGiacomo (42) Assistant Secretary | | Vice President and Corporate Counsel (since January 2005) of Prudential; Vice President and Assistant Secretary of PGIM Investments LLC (since December 2005); Associate at Sidley Austin Brown & Wood LLP (1999-2004). | | Since 2005 |
Prudential Day One Underlying Funds
| | | | |
| Fund Officers(a) |
Name, Address and Age Position with Fund | | Principal Occupation(s) During Past Five Years | | Length of Service as Fund Officer |
Andrew R. French (54) Assistant Secretary | | Vice President and Corporate Counsel (since February 2010) of Prudential; formerly Director and Corporate Counsel (2006-2010) of Prudential; Vice President and Assistant Secretary (since January 2007) of PGIM Investments LLC; Vice President and Assistant Secretary (since January 2007) of Prudential Mutual Fund Services LLC. | | Since 2006 |
Charles H. Smith (44) Anti-Money Laundering Compliance Officer | | Vice President, Corporate Compliance, Anti-Money Laundering Unit (since January 2015) of Prudential; committee member of the American Council of Life Insurers Anti-Money Laundering and Critical Infrastructure Committee (since January 2016); formerly Global Head of Economic Sanctions Compliance at AIG Property Casualty (February 2007–December 2014); Assistant Attorney General at the New York State Attorney General’s Office, Division of Public Advocacy. (August 1998—January 2007). | | Since 2016 |
M. Sadiq Peshimam (53) Treasurer and Principal Financial and Accounting Officer | | Vice President (since 2005) of PGIM Investments LLC; formerly Assistant Treasurer of funds in the Prudential Mutual Fund Complex (2006-2014). | | Since 2006 |
Peter Parrella (59) Assistant Treasurer | | Vice President (since 2007) and Director (2004-2007) within Prudential Mutual Fund Administration; formerly Tax Manager at SSB Citi Fund Management LLC (1997-2004). | | Since 2007 |
Lana Lomuti (50) Assistant Treasurer | | Vice President (since 2007) and Director (2005-2007), within Prudential Mutual Fund Administration; formerly Assistant Treasurer (December 2007-February 2014) of The Greater China Fund, Inc. | | Since 2014 |
Linda McMullin (56) Assistant Treasurer | | Vice President (since 2011) and Director (2008-2011) within Prudential Mutual Fund Administration. | | Since 2014 |
Kelly A. Coyne (49) Assistant Treasurer | | Director, Investment Operations of Prudential Mutual Fund Services LLC (since 2010). | | Since 2015 |
| (a) | Excludes Mr. Parker and Mr. Benjamin, interested Board Members who also serve as President and Vice President, respectively. |
Explanatory Notes to Tables:
| • | | Board Members are deemed to be “Interested,” as defined in the 1940 Act, by reason of their affiliation with PGIM Investments LLC and/or an affiliate of PGIM Investments LLC. |
| • | | Unless otherwise noted, the address of all Board Members and Officers is c/o PGIM Investments LLC, 655 Broad Street, Newark, New Jersey 07102-4410. |
| • | | There is no set term of office for Board Members or Officers. The Board Members have adopted a retirement policy, which calls for the retirement of Board Members on December 31 of the year in which they reach the age of 75. |
| • | | “Other Directorships Held” includes only directorships of companies required to register or file reports with the SEC under the 1934 Act (that is, “public companies”) or other investment companies registered under the 1940 Act. |
| • | | “Portfolios Overseen” includes all investment companies managed by PGIM Investments LLC. The investment companies for which PGIM Investments LLC serves as manager include the Prudential Mutual Funds, The Prudential Variable Contract Accounts, Target Mutual Funds, Prudential Short Duration High Yield Fund, Inc., Prudential Global Short Duration High Yield Fund, Inc., The Prudential Series Fund, Prudential’s Gibraltar Fund, Inc. and the Advanced Series Trust. |
Visit our website at pgiminvestments.com
| | | | |
| ∎ MAIL | | ∎ TELEPHONE | | ∎ WEBSITE |
655 Broad Street Newark, NJ 07102 | | (800) 225-1852 | | www.pgiminvestments.com |
|
| PROXY VOTING |
| The Board of Trustees of the Funds have delegated to the Fund’s investment subadvisers the responsibility for voting any proxies and maintaining proxy recordkeeping with respect to the Funds. A description of these proxy voting policies and procedures is available without charge, upon request, by calling (800) 225-1852 or by visiting the Securities and Exchange Commission’s website at www.sec.gov. Information regarding how the Funds voted proxies relating to portfolio securities during the most recent 12-month period ended June 30 are available on the Funds’ website and on the Securities and Exchange Commission’s website at the end of August. |
|
| DIRECTORS |
| Ellen S. Alberding • Kevin J. Bannon • Scott E. Benjamin • Linda W. Bynoe • Barry H. Evans • Keith F. Hartstein • Laurie Simon Hodrick • Michael S. Hyland • Stuart S. Parker • Richard A. Redeker • Stephen G. Stoneburn • Grace C. Torres |
|
| OFFICERS |
| Stuart S. Parker, President • Scott E. Benjamin, Vice President • M. Sadiq Peshimam, Treasurer and Principal Financial and Accounting Officer • Raymond A. O’Hara, Chief Legal Officer • Deborah A. Docs, Secretary • Chad A. Earnst, Chief Compliance Officer • Charles H. Smith, Anti-Money Laundering Compliance Officer • Jonathan D. Shain, Assistant Secretary • Claudia DiGiacomo, Assistant Secretary • Andrew R. French, Assistant Secretary • Peter Parrella, Assistant Treasurer • Lana Lomuti, Assistant Treasurer • Linda McMullin, Assistant Treasurer • Kelly A. Coyne, Assistant Treasurer |
| | | | |
| MANAGER | | PGIM Investments LLC | | 655 Broad Street
Newark, NJ 07102 |
|
| INVESTMENT SUBADVISERS | | Quantitative Management Associates LLC | | Gateway Center Two
100 Mulberry Street
Newark, NJ 07102 |
| | |
| | Jennison Associates LLC | | 466 Lexington Avenue
New York, NY 10017 |
| | |
| | PGIM Fixed Income | | 655 Broad Street
Newark, NJ 07102 |
|
| DISTRIBUTOR | | Prudential Investment
Management Services LLC | | 655 Broad Street
Newark, NJ 07102 |
|
| CUSTODIAN | | The Bank of New York Mellon | | 225 Liberty Street
New York, NY 10286 |
|
| TRANSFER AGENT | | Prudential Mutual Fund
Services LLC | | PO Box 9658
Providence, RI 02940 |
|
| INDEPENDENT REGISTERED PUBLIC ACCOUNTING FIRM | | KPMG LLP | | 345 Park Avenue New York, NY 10154 |
|
| FUND COUNSEL | | Willkie Farr & Gallagher LLP | | 787 Seventh Avenue
New York, NY 10019 |
|
|
| An investor should consider the investment objectives, risks, charges, and expenses of the Fund carefully before investing. The prospectus and summary prospectus contains this and other information about the Funds. An investor may obtain a prospectus and summary prospectus by visiting our website at www.pgiminvestments.com or by calling (800) 225-1852. The prospectus and summary prospectus should be read carefully before investing. |
|
| SHAREHOLDER COMMUNICATIONS WITH DIRECTORS |
| Shareholders can communicate directly with the Board of Trustees by writing to the Chair of the Board, Prudential Day One Underlying Funds PGIM Investments, Attn: Board of Trustees, 655 Broad Street, Newark, NJ 07102. Shareholders can communicate directly with an individual Trustee by writing to the same address. Communications are not screened before being delivered to the addressee. |
|
| AVAILABILITY OF PORTFOLIO SCHEDULE |
| The Funds file their complete schedule of portfolio holdings with the Securities and Exchange Commission for the first and third quarters of each fiscal year on Form N-Q. The Funds’ Forms N-Q are available on the Commission’s website at www.sec.gov. The Funds’ Forms N-Q may also be reviewed and copied at the Commission’s Public Reference Room in Washington, D.C. Information on the operation and location of the Public Reference Room may be obtained by calling (202) 551-8090. |
|
The Funds’ Statement of Additional Information contains additional information about the Funds’ Trustees
and is available without charge, upon request, by calling (800) 225-1852. |
Mutual Funds:
| | | | |
ARE NOT INSURED BY THE FDIC OR ANY
FEDERAL GOVERNMENT AGENCY | | MAY LOSE VALUE | | ARE NOT A DEPOSIT OF OR GUARANTEED
BY ANY BANK OR ANY BANK AFFILIATE |
| | | | | | | | | | | | |
| | | NASDAQ | | CUSIP | | | | | | NASDAQ | | CUSIP |
| PRUDENTIAL JENNISON SMALL-CAP CORE EQUITY FUND (CLASS Q) | | PQJCX | | 74440E805 | | | | PRUDENTIAL COMMODITY STRATEGIES FUND (CLASS Q) | | PQCMX | | 74440E862 |
| PRUDENTIAL CORE CONSERVATIVE BOND FUND (CLASS Q) | | PQCNX | | 74440E888 | | | | PRUDENTIAL QMA US BROAD MARKET INDEX FUND (CLASS Q) | | PQBMX | | 74440E409 |
| PRUDENTIAL TIPS FUND (CLASS Q) | | PQTSX | | 74440E870 | | | | PRUDENTIAL QMA MID-CAP CORE EQUITY FUND (CLASS Q) | | PQCCX | | 74440E508 |
Item 2 – Code of Ethics – – See Exhibit (a)
As of the end of the period covered by this report, the registrant has adopted a code of ethics (the “Section 406 Standards for Investment Companies – Ethical Standards for Principal Executive and Financial Officers”) that applies to the registrant’s Principal Executive Officer and Principal Financial Officer; the registrant’s Principal Financial Officer also serves as the Principal Accounting Officer.
The registrant hereby undertakes to provide any person, without charge, upon request, a copy of the code of ethics. To request a copy of the code of ethics, contact the registrant 800-225-1852, and ask for a copy of the Section 406 Standards for Investment Companies - Ethical Standards for Principal Executive and Financial Officers.
Item 3 – Audit Committee Financial Expert –
The registrant’s Board has determined that Mr. Kevin J. Bannon, member of the Board’s Audit Committee is an “audit committee financial expert,” and that he is “independent,” for purposes of this Item.
Item 4 – Principal Accountant Fees and Services –
(a) Audit Fees
For the fiscal period ended July 31, 2017, KPMG LLP (“KPMG”), the Registrant’s principal accountant, billed the Registrant $157,000, for professional services rendered for the audit of the Registrant’s annual financial statements or services that are normally provided in connection with statutory and regulatory filings.
(b) Audit-Related Fees
For the fiscal period ended July 31, 2017: none.
(c) Tax Fees
For the fiscal period ended July 31, 2017: none.
(d) All Other Fees
For the fiscal period ended July 31, 2017: none.
(e) (1) Audit Committee Pre-Approval Policies and Procedures
THE PRUDENTIAL MUTUAL FUNDS
AUDIT COMMITTEE POLICY
on
Pre-Approval of Services Provided by the Independent Accountants
The Audit Committee of each Prudential Mutual Fund is charged with the responsibility to monitor the independence of the Fund’s independent accountants. As part of this responsibility, the Audit Committee must pre-approve the independent accounting firm’s engagement to render audit and/or permissible non-audit services, as required by law. In evaluating a proposed engagement of the independent accountants, the Audit Committee will assess the effect that the engagement might reasonably be expected to have on the accountant’s independence. The Committee’s evaluation will be based on:
| | ● | | a review of the nature of the professional services expected to be provided, |
| | ● | | a review of the safeguards put into place by the accounting firm to safeguard independence, and |
| | ● | | periodic meetings with the accounting firm. |
Policy for Audit and Non-Audit Services Provided to the Funds
On an annual basis, the scope of audits for each Fund, audit fees and expenses, and audit-related and non-audit services (and fees proposed in respect thereof) proposed to be performed by the Fund’s independent accountants will be presented by the Treasurer and the independent accountants to the Audit Committee for review and, as appropriate, approval prior to the initiation of such services. Such presentation shall be accompanied by confirmation by both the Treasurer and the independent accountants that the proposed non-audit services will not adversely affect the independence of the independent accountants. Such proposed non-audit services shall be described in sufficient detail to enable the Audit Committee to assess the appropriateness of such services and fees, and the compatibility of the provision of such services with the auditor’s independence. The Committee shall receive periodic reports on the progress of the audit and other services which are approved by the Committee or by the Committee Chair pursuant to authority delegated in this Policy.
The categories of services enumerated under “Audit Services”, “Audit-related Services”, and “Tax Services” are intended to provide guidance to the Treasurer and the independent accountants as to those categories of services which the Committee believes are generally consistent with the independence of the independent accountants and which the Committee (or the Committee Chair) would expect upon the presentation of specific proposals to pre-approve. The enumerated categories are not intended as an exclusive list of audit, audit-related or tax services, which the Committee (or the Committee Chair) would consider for pre-approval.
Audit Services
The following categories of audit services are considered to be consistent with the role of the Fund’s independent accountants:
| | Ø | Annual Fund financial statement audits |
| | Ø | Seed audits (related to new product filings, as required) |
| | Ø | SEC and regulatory filings and consents |
Audit-related Services
The following categories of audit-related services are considered to be consistent with the role of the Fund’s independent accountants:
| | Ø | Accounting consultations |
| | Ø | Fund merger support services |
| | Ø | Agreed Upon Procedure Reports |
| | Ø | Other Internal Control Reports |
Individual audit-related services that fall within one of these categories (except for fund merger support services) and are not presented to the Audit Committee as part of the annual pre-approval process are subject to an authorized pre-approval by the Audit Committee so long as the estimated fee for those services does not exceed $30,000. Any services provided under such pre-approval will be reported to the Audit Committee at its next regular meeting. Should the amount of such services exceed $30,000 any additional fees will be subject to pre-approval by the Committee Chair (or any other Committee member on whom this responsibility has been delegated). Fees related to fund merger support services are subject to a separate authorized pre-approval by the Audit Committee with fees determined on a per occurrence and merger complexity basis.
Tax Services
The following categories of tax services are considered to be consistent with the role of the Fund’s independent accountants:
| | Ø | Tax compliance services related to the filing or amendment of the following: |
| | ◾ | Federal, state and local income tax compliance; and, |
| | ◾ | Sales and use tax compliance |
| | Ø | Timely RIC qualification reviews |
| | Ø | Tax distribution analysis and planning |
| | Ø | Tax authority examination services |
| | Ø | Tax appeals support services |
| | Ø | Accounting methods studies |
| | Ø | Fund merger support services |
| | Ø | Tax consulting services and related projects |
Individual tax services that fall within one of these categories and are not presented to the Audit Committee as part of the annual pre-approval process are subject to an authorized pre-approval by the Audit Committee so long as the estimated fee for those services does not exceed $30,000. Any services provided under such pre-approval will be reported to the Audit Committee at its next regular meeting. Should the amount of such services exceed $30,000 any additional fees will
be subject to pre-approval by the Committee Chair (or any other Committee member on whom this responsibility has been delegated).
Other Non-Audit Services
Certain non-audit services that the independent accountants are legally permitted to render will be subject to pre-approval by the Committee or by one or more Committee members to whom the Committee has delegated this authority and who will report to the full Committee any pre-approval decisions made pursuant to this Policy. Non-audit services presented for pre-approval pursuant to this paragraph will be accompanied by a confirmation from both the Treasurer and the independent accountants that the proposed services will not adversely affect the independence of the independent accountants.
Proscribed Services
The Fund’s independent accountants will not render services in the following categories of non-audit services:
| | Ø | Bookkeeping or other services related to the accounting records or financial statements of the Fund |
| | Ø | Financial information systems design and implementation |
| | Ø | Appraisal or valuation services, fairness opinions, or contribution-in-kind reports |
| | Ø | Internal audit outsourcing services |
| | Ø | Management functions or human resources |
| | Ø | Broker or dealer, investment adviser, or investment banking services |
| | Ø | Legal services and expert services unrelated to the audit |
| | Ø | Any other service that the Public Company Accounting Oversight Board determines, by regulation, is impermissible. |
Pre-approval of Non-Audit Services Provided to Other Entities Within the Prudential Fund Complex
Certain non-audit services provided to PGIM Investments LLC or any of its affiliates that also provide ongoing services to the Prudential Mutual Funds will be subject to pre-approval by the Audit Committee. The only non-audit services provided to these entities that will require pre-approval are those related directly to the operations and financial reporting of the Funds. Individual projects that are not presented to the Audit Committee as part of the annual pre-approval process will be subject to pre-approval by the Committee Chair (or any other Committee member on whom this responsibility has been delegated) so long as the estimated fee for those services does not exceed $30,000. Services presented for pre-approval pursuant to this paragraph will be accompanied by a confirmation from both the Treasurer and the independent accountants that the proposed services will not adversely affect the independence of the independent accountants.
Although the Audit Committee will not pre-approve all services provided to PGIM Investments LLC and its affiliates, the Committee will receive an annual report from the Fund’s
independent accounting firm showing the aggregate fees for all services provided to PGIM Investments LLC and its affiliates.
(e) (2) Percentage of services referred to in 4(b) – 4(d) that were approved by the audit committee –
For the fiscal period ended July 31, 2017: none.
| (f) | Percentage of hours expended attributable to work performed by other than full time employees of principal accountant if greater than 50%. |
The percentage of hours expended on the principal accountant’s engagement to audit the registrant’s financial statements for the most recent fiscal period that were attributed to work performed by persons other than the principal accountant’s full-time, permanent employees was 0%.
(g) Non-Audit Fees
The aggregate non-audit fees billed by KPMG for services rendered to the registrant’s investment adviser and any entity controlling, controlled by, or under common control with the investment adviser that provides ongoing services to the registrant for the fiscal period ended July 31, 2017 was $0.
(h) Principal Accountant’s Independence
Not applicable as KPMG has not provided non-audit services to the registrant’s investment adviser and any entity controlling, controlled by, or under common control with the investment adviser that provides ongoing services to the registrant that were not pre-approved pursuant to Rule 2-01(c)(7)(ii) of Regulation S-X.
| | |
| Item 5 – | | Audit Committee of Listed Registrants – Not applicable. |
| |
| Item 6 – | | Schedule of Investments – The schedule is included as part of the report to shareholders filed under Item 1 of this Form. |
| |
| Item 7 – | | Disclosure of Proxy Voting Policies and Procedures for Closed-End Management Investment Companies – Not applicable. |
| |
| Item 8 – | | Portfolio Managers of Closed-End Management Investment Companies – Not applicable. |
| |
| Item 9 – | | Purchases of Equity Securities by Closed-End Management Investment Company and Affiliated Purchasers – Not applicable. |
| | |
| |
| Item 10 – | | Submission of Matters to a Vote of Security Holders – Not applicable. |
| |
| Item 11 – | | Controls and Procedures |
| |
| (a) | | It is the conclusion of the registrant’s principal executive officer and principal financial officer that the effectiveness of the registrant’s current disclosure controls and procedures (such disclosure controls and procedures having been evaluated within 90 days of the date of this filing) provide reasonable assurance that the information required to be disclosed by the registrant has been recorded, processed, summarized and reported within the time period specified in the Commission’s rules and forms and that the information |
| | required to be disclosed by the registrant has been accumulated and communicated to the registrant’s principal executive officer and principal financial officer in order to allow timely decisions regarding required disclosure. |
| | (b) | There has been no significant change in the registrant’s internal control over financial reporting that occurred during the registrant’s most recent fiscal quarter of the period covered by this report that has materially affected, or is likely to materially affect, the registrant’s internal control over financial reporting. |
Item 12 – Exhibits
| | (a) (1) | Code of Ethics – Attached hereto as Exhibit EX-99.CODE-ETH |
| | (2) | Certifications pursuant to Section 302 of the Sarbanes-Oxley Act – Attached hereto as Exhibit EX-99.CERT. |
| | (3) | Any written solicitation to purchase securities under Rule 23c-1. – Not applicable. |
| | (b) | Certifications pursuant to Section 906 of the Sarbanes-Oxley Act – Attached hereto as Exhibit EX-99.906CERT. |
SIGNATURES
Pursuant to the requirements of the Securities Exchange Act of 1934 and the Investment Company Act of 1940, the registrant has duly caused this report to be signed on its behalf by the undersigned, thereunto duly authorized.
| | |
| Registrant | | Prudential Investment Portfolios 2 |
| |
| By: | | /s/ Deborah A. Docs |
| | Deborah A. Docs |
| | Secretary |
| |
| Date: | | September 21, 2017 |
Pursuant to the requirements of the Securities Exchange Act of 1934 and the Investment Company Act of 1940, this report has been signed below by the following persons on behalf of the registrant and in the capacities and on the dates indicated.
| | |
| By: | | /s/ Stuart S. Parker |
| | Stuart S. Parker |
| | President and Principal Executive Officer |
| |
| Date: | | September 21, 2017 |
| |
| By: | | /s/ M. Sadiq Peshimam |
| | M. Sadiq Peshimam |
| | Treasurer and Principal Financial and Accounting Officer |
| |
| Date: | | September 21, 2017 |