UNITED STATES
SECURITIES AND EXCHANGE COMMISSION
Washington, D.C. 20549
FORM N-CSR
CERTIFIED SHAREHOLDER REPORT OF REGISTERED MANAGEMENT INVESTMENT COMPANIES
| | |
| Investment Company Act file number: | | 811-09999 |
| |
| Exact name of registrant as specified in charter: | | Prudential Investment Portfolios 2 |
|
| (This Form N-CSR relates solely to the Registrant’s: Prudential QMA Emerging Markets Equity Fund and Prudential QMA International Developed Markets Index Fund) |
| |
| Address of principal executive offices: | | 655 Broad Street, 17th Floor |
| | Newark, New Jersey 07102 |
| |
| Name and address of agent for service: | | Deborah A. Docs |
| | 655 Broad Street, 17th Floor |
| | Newark, New Jersey 07102 |
| |
| Registrant’s telephone number, including area code: | | 800-225-1852 |
| |
| Date of fiscal year end: | | 10/31/2017 |
| |
| Date of reporting period: | | 10/31/2017 |
Item 1 – Reports to Stockholders

PRUDENTIAL QMA EMERGING MARKETS EQUITY FUND
ANNUAL REPORT
OCTOBER 31, 2017

|
Objective: To provide returns in excess of the Morgan Stanley Capital
International Emerging Markets Index over full market cycles. |
Highlights
| • | | All the Fund’s valuation factors produced positive returns in the fourth quarter of 2016. Thereafter, valuation struggled, but this weakness was offset by the strong performance of the growth and financial momentum factors. |
| • | | Among countries, China provided the strongest returns, with the bulk of the gains stemming from the consumer discretionary sector, where the Fund was helped by an overweight position and effective stock picking in the automotive industry. |
| • | | The Fund was hurt by difficult stock selection and an overweight position in South African consumer staples, one of the country’s worst-performing sectors. |
This report is not authorized for distribution to prospective investors unless preceded or accompanied by a current prospectus.
The views expressed in this report and information about the Fund’s portfolio holdings are for the period covered by this report and are subject to change thereafter.
Mutual funds are distributed by Prudential Investment Management Services LLC, a Prudential Financial company and member SIPC. QMA is the primary business name of Quantitative Management Associates LLC, a wholly owned subsidiary of PGIM, Inc. (PGIM), a Prudential Financial company. © 2017 Prudential Financial, Inc. and its related entities. PGIM and the PGIM logo are service marks of Prudential Financial, Inc. and its related entities, registered in many jurisdictions worldwide.
| | |
| 2 | | Visit our website at pgiminvestments.com |
PRUDENTIAL FUNDS — UPDATE
The Board of Directors/Trustees for the Fund has approved renaming the Fund’s Class Q shares as Class R6 shares, effective on or about June 15, 2018. The renaming of Class Q shares as Class R6 shares will not result in any changes to pricing, eligibility, or shareholder rights and obligations. The renamed Class R6 shares will not be exchangeable with Class R6 shares of the Prudential Day One Funds or the Prudential 60/40 Allocation Fund.
LR993
| | | | |
| Prudential QMA Emerging Markets Equity Fund | | | 3 | |
This Page Intentionally Left Blank
| | |
| 4 | | Visit our website at pgiminvestments.com |
Your Fund’s Performance
Performance data quoted represents past performance. Past performance does not guarantee future results. The investment return and principal value of an investment will fluctuate, so that an investor’s shares, when redeemed, may be worth more or less than their original cost. Current performance may be lower or higher than the past performance data quoted.
| | |
| | | Total Returns as of 10/31/17 |
| | | Since Inception* (%) |
| Class Q | | 32.58 (11/29/16) |
| MSCI Emerging Markets Index | | 32.55 |
| Lipper Emerging Markets Funds Average | | 29.68 |
*Not annualized
Growth of a $10,000 Investment
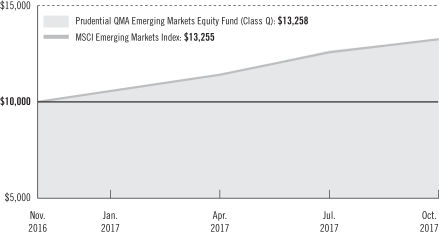
The graph compares a $10,000 investment in the Fund’s Class Q shares with a similar investment in the MSCI Emerging Markets Index by portraying the initial account values at the commencement of operations of Class Q shares (November 29, 2016) and the account values at the end of the current fiscal period (October 31, 2017), as measured on a quarterly basis. For purposes of the graph, and unless otherwise indicated, it has been assumed that (a) all recurring fees (including management fees) were deducted; and (b) all dividends and distributions were reinvested. The line graph provides information for Class Q shares only. Without waiver of fees and/or expense reimbursments, the returns would have been lower.
| | | | |
| Prudential QMA Emerging Markets Equity Fund | | | 5 | |
Your Fund’s Performance (continued)
Past performance does not predict future performance. Total returns and the ending account values in the graph include changes in share price and reinvestment of dividends and capital gains distributions in a hypothetical investment for the periods shown. The Fund’s total returns do not reflect the deduction of income taxes on an individual’s investment. Taxes may reduce your actual investment returns on income or gains paid by the Fund or any gains you may realize if you sell your shares.
Source: PGIM Investments LLC and Lipper Inc.
The returns in the tables do not reflect the deduction of taxes that a shareholder would pay on Fund distributions or following the redemption of Fund shares. Since Inception returns for the Index and the Lipper Average are measured from the closest month-end to the Fund’s inception date.
Benchmark Definitions
MSCI Emerging Markets Index—The MSCI Emerging Markets Index is a free float-adjusted market capitalization index that is designed to measure equity market performance of emerging markets. It consists of the following 23 emerging market country indexes: Brazil, Chile, China, Colombia, Czech Republic, Egypt, Greece, Hungary, India, Indonesia, Korea, Malaysia, Mexico, Peru, Philippines, Poland, Qatar, Russia, South Africa, Taiwan, Thailand, Turkey, and the United Arab Emirates.
Lipper Emerging Markets Funds Average—The Lipper Emerging Markets Funds Average (Lipper Average) are funds that seek long-term capital appreciation by investing at least 65% of total assets in emerging market equity securities, where “emerging market” is defined by a country’s GNP per capita or other economic measures.
Investors cannot invest directly in an index or average. The returns for the Index would be lower if they included the effects of sales charges, operating expenses of a mutual fund, or taxes. Returns for the Lipper Average reflect the deduction of operating expenses, but not sales charges or taxes.
| | |
| 6 | | Visit our website at pgiminvestments.com |
Presentation of Fund Holdings
| | | | |
Five Largest Holdings expressed as a
percentage of net assets as of 10/31/17 (%) | |
| Samsung Electronics Co. Ltd., Technology Hardware, Storage & Peripherals | | | 5.4 | |
| Tencent Holdings Ltd., Internet Software & Services | | | 4.6 | |
| Alibaba Group Holding Ltd., ADR, Internet Software & Services | | | 3.3 | |
| Taiwan Semiconductor Manufacturing Co. Ltd., Semiconductors & Semiconductor Equipment | | | 3.2 | |
| iShares MSCI Emerging Markets ETF, Exchange Traded Fund | | | 2.4 | |
Holdings reflect only long-term investments and are subject to change.
| | | | |
Five Largest Industries expressed as a
percentage of net assets as of 10/31/17 (%) | |
| Banks | | | 16.7 | |
| Internet Software & Services | | | 10.5 | |
| Oil, Gas & Consumable Fuels | | | 6.7 | |
| Technology Hardware, Storage & Peripherals | | | 6.6 | |
| Semiconductors & Semiconductor Equipment | | | 5.5 | |
Industry weightings reflect only long-term investments and are subject to change.
| | | | |
| Prudential QMA Emerging Markets Equity Fund | | | 7 | |
Strategy and Performance Overview
How did the Fund perform?
The Prudential QMA Emerging Markets Equity Fund returned 32.58% for the fiscal period ended October 31, 2017, outperforming the 32.55% return of the MSCI Emerging Markets Index (the Index). The Fund outperformed the 29.68% return of the Lipper Emerging Markets Fund Average.
What were market conditions?
| • | | Equity returns were strong during the reporting period, as global economic growth increased at a healthy pace, long-term interest rates remained close to historical lows, and central banks tightened monetary policy prudently and gradually in light of subdued inflation. |
| • | | In the US, solid fundamentals included stable and moderate economic expansion, robust employment, accelerating corporate profit growth, and accumulating cash on company balance sheets. |
| • | | North Korean missile activity, ongoing investigations into Russia’s interference in the 2016 US election, and turnover in key US administration positions contributed to investor uncertainty. |
| • | | Europe’s economic recovery proceeded. Japan likewise showed healthier trends in economic activity. |
| • | | In this environment, emerging markets equities had their best performance since the 2008-2009 financial crisis. |
| • | | Within the Index, all sectors advanced, with information technology, financials, materials, and industrials posting the largest gains. Returns in the telecommunication services and consumer staples sectors were more modest. |
| • | | All regions in the Index generated positive returns, led by the emerging markets. |
What worked?
| • | | All the Fund’s valuation factors produced positive returns in the fourth quarter of 2016. Thereafter, valuation struggled, but this weakness was offset by the strong performance of the growth and financial momentum factors. Quality factors turned in mixed results for the period, but were effective regarding the Fund’s performance. |
| • | | Regarding sectors, the Fund benefited most from its positioning in consumer discretionary, led by effective stock selection in China and an underweight in Indonesia. In the energy sector, gains were highlighted by an underweight in China and an overweight in India. In the health care sector, stock picking and an overweight in Brazil added to the Fund’s performance, which was further buttressed by an underweight in India. |
| • | | Among countries, China provided the strongest returns, with the bulk of the gains stemming from the consumer discretionary sector, where the Fund was helped by an overweight position and effective stock picking in the automobile industry. In Brazil, the |
| | |
| 8 | | Visit our website at pgiminvestments.com |
| | Fund benefited from overweights in the health care, financials, and an underweight in energy. Stock selection among Brazilian health care stocks also added to performance. In South Korea, efficient stock picking in the financials sector was bolstered by underweight positions in industrials and consumer staples. In addition, stock selection in South Korea’s consumer staples sector was advantageous. |
| • | | As for individual holdings, the Fund benefited most from its overweights in Geely Automobile Holdings Limited, a Chinese multinational automotive manufacturing company; Qualicorp, a Brazilian benefits administrator and health management services provider; SK Hynix, a South Korean semiconductor maker; Nanya Technology Corporation, a Taiwan-based manufacturer of dynamic random-access memory products; and Guangzhou Automobile Group, a Chinese automaker. |
What didn’t work?
| • | | In terms of sectors, Fund performance was weakest in the real estate sector due to difficult stock selection in China. Within information technology, the Fund’s losses were driven by challenging selection in India and China, as well as an underweight position in China, the Index’s best-performing country. In consumer staples, the Fund was hurt by stock selection and overweight in South Africa, stock picks in Thailand, and an underweight in Mexico. |
| • | | Among countries, South Africa detracted most from relative performance. The Fund was hurt by difficult stock selection and an overweight position in consumer staples, one of South Africa’s worst-performing sectors. An underweight in South Africa’s consumer discretionary sector also dampened returns. In Greece, the Fund’s overweight in consumer discretionary hampered performance, especially between July and the end of the period. In Malaysia, losses were led by weak stock picking in the industrials and financials sectors. |
| • | | Regarding individual holdings, the Fund was hurt most by its avoidance of property developer China Evergrande Group. Among other detractors were overweights in Folli Follie, a Greece-based designer and manufacturer of luxury jewelry, watches, and fashion accessories; AirAsia Berhad, a Malaysian low-cost airline; and Ooredoo, a Qatar-based telecommunications company. An underweight in Brazilian conglomerate Itausa — Investimentos Itau also detracted from performance. |
Current outlook
| • | | Quantitative Management Associates LLC (QMA) will continue to manage the Fund as a risk-controlled portfolio, using a bottom-up process that focuses on factors within four broad groups: valuation, growth (analyst revisions), financial momentum/profitability, and quality. |
| • | | All overweight and underweight positions in the Fund will be the result of QMA’s stock selection process and not a reflection of its sentiment on any particular market segment. |
| | | | |
| Prudential QMA Emerging Markets Equity Fund | | | 9 | |
Fees and Expenses
As a shareholder of the Fund, you incur two types of costs: (1) transaction costs, including sales charges (loads) on purchase payments and redemptions, as applicable, and (2) ongoing costs, including management fees, distribution, and/or service (12b-1) fees, and other Fund expenses, as applicable. This example is intended to help you understand your ongoing costs (in dollars) of investing in the Fund and to compare these costs with the ongoing costs of investing in other mutual funds.
The example is based on an investment of $1,000 held through the six-month period ended October 31, 2017. The example is for illustrative purposes only; you should consult the Prospectus for information on initial and subsequent minimum investment requirements.
Actual Expenses
The first line for each share class in the table on the following page provides information about actual account values and actual expenses. You may use the information on this line, together with the amount you invested, to estimate the expenses that you paid over the period. Simply divide your account value by $1,000 (for example, an $8,600 account value ÷ $1,000 = 8.6), then multiply the result by the number on the first line under the heading “Expenses Paid During the Six-Month Period” to estimate the expenses you paid on your account during this period.
Hypothetical Example for Comparison Purposes
The second line for each share class in the table on the following page provides information about hypothetical account values and hypothetical expenses based on the Fund’s actual expense ratio and an assumed rate of return of 5% per year before expenses, which is not the Fund’s actual return. The hypothetical account values and expenses may not be used to estimate the actual ending account balance or expenses you paid for the period. You may use this information to compare the ongoing costs of investing in the Fund and other funds. To do so, compare this 5% hypothetical example with the 5% hypothetical examples that appear in the shareholder reports of the other funds.
The Fund’s transfer agent may charge additional fees to holders of certain accounts that are not included in the expenses shown in the table on the following page. These fees apply to individual retirement accounts (IRAs) and Section 403(b) accounts. As of the close of the six-month period covered by the table, IRA fees included an annual maintenance fee of $15 per account (subject to a maximum annual maintenance fee of $25 for all accounts held by the same shareholder). Section 403(b) accounts are charged an annual $25 fiduciary maintenance fee. Some of the fees may vary in amount, or may be waived, based on your total account balance or the number of Prudential funds, including the Fund, that you own. You should consider the additional fees that were charged to your Fund account over the six-month period when you estimate the total ongoing expenses paid over the
| | |
| 10 | | Visit our website at pgiminvestments.com |
period and the impact of these fees on your ending account value, as these additional expenses are not reflected in the information provided in the expense table. Additional fees have the effect of reducing investment returns.
Please note that the expenses shown in the table are meant to highlight your ongoing costs only and do not reflect any transactional costs such as sales charges (loads). Therefore, the second line for each share class in the table is useful in comparing ongoing costs only and will not help you determine the relative total costs of owning different funds. In addition, if these transactional costs were included, your costs would have been higher.
| | | | | | | | | | | | | | | | | | |
Prudential QMA
Emerging Markets
Equity Fund | | Beginning Account
Value
May 1, 2017 | | | Ending Account
Value
October 31, 2017 | | | Annualized
Expense Ratio
Based on the
Six-Month Period | | | Expenses Paid
During the
Six-Month Period* | |
| Class Q | | Actual | | $ | 1,000.00 | | | $ | 1,160.80 | | |
| 1.20
| %
| | $ | 6.54 | |
| | | Hypothetical | | $ | 1,000.00 | | | $ | 1,019.16 | | | | 1.20 | % | | $ | 6.11 | |
*Fund expenses (net of fee waivers or subsidies, if any) are equal to the annualized expense ratio (provided in the table), multiplied by the average account value over the period, multiplied by the 184 days in the six-month period ended October 31, 2017, and divided by the 365 days in the Fund’s fiscal year ended October 31, 2017. Expenses presented in the table include the expenses of any underlying funds in which the Fund may invest.
| | | | |
| Prudential QMA Emerging Markets Equity Fund | | | 11 | |
Schedule of Investments
as of October 31, 2017
| | | | | | | | |
| Description | | Shares | | | Value | |
LONG-TERM INVESTMENTS 99.9% | | | | | | | | |
|
COMMON STOCKS 94.9% | |
|
Brazil 5.6% | |
Ambev SA | | | 25,700 | | | $ | 164,038 | |
Banco Bradesco SA | | | 4,510 | | | | 45,247 | |
Banco Santander Brasil SA, UTS | | | 19,900 | | | | 174,588 | |
Cia de Saneamento Basico do Estado de Sao Paulo | | | 18,000 | | | | 164,687 | |
Engie Brasil Energia SA | | | 15,400 | | | | 169,709 | |
Klabin SA, UTS | | | 2,700 | | | | 15,641 | |
Kroton Educacional SA | | | 7,400 | | | | 41,034 | |
Localiza Rent a Car SA | | | 9,310 | | | | 163,785 | |
Lojas Renner SA | | | 3,800 | | | | 39,960 | |
Odontoprev SA | | | 35,000 | | | | 167,976 | |
Petroleo Brasileiro SA* | | | 15,300 | | | | 81,334 | |
Qualicorp SA | | | 1,200 | | | | 12,832 | |
TIM Participacoes SA | | | 52,500 | | | | 194,349 | |
Vale SA | | | 14,800 | | | | 145,996 | |
| | | | | | | | |
| | | | | | | 1,581,176 | |
|
Chile 0.9% | |
Cencosud SA | | | 20,357 | | | | 60,935 | |
Enel Generacion Chile SA | | | 228,727 | | | | 199,412 | |
| | | | | | | | |
| | | | | | | 260,347 | |
|
China 28.5% | |
Agricultural Bank of China Ltd. (Class H Stock) | | | 498,000 | | | | 234,555 | |
Alibaba Group Holding Ltd., ADR* | | | 5,100 | | | | 942,939 | |
Anhui Conch Cement Co. Ltd. (Class H Stock) | | | 6,500 | | | | 27,844 | |
ANTA Sports Products Ltd. | | | 30,000 | | | | 134,186 | |
Autohome, Inc., ADR* | | | 3,100 | | | | 178,281 | |
Baidu, Inc., ADR* | | | 1,200 | | | | 292,728 | |
Bank of China Ltd. (Class H Stock) | | | 600,000 | | | | 299,858 | |
Bank of Communications Co. Ltd. (Class H Stock) | | | 87,000 | | | | 65,679 | |
China Cinda Asset Management Co. Ltd. (Class H Stock) | | | 44,000 | | | | 17,098 | |
China CITIC Bank Corp. Ltd. (Class H Stock) | | | 45,000 | | | | 28,996 | |
China Construction Bank Corp. (Class H Stock) | | | 630,000 | | | | 563,041 | |
China Everbright International Ltd. | | | 13,000 | | | | 18,341 | |
China Huarong Asset Management Co. Ltd. (Class H Stock), 144A | | | 294,000 | | | | 138,299 | |
China Medical System Holdings Ltd. | | | 42,000 | | | | 77,663 | |
China Merchants Bank Co. Ltd. (Class H Stock) | | | 19,500 | | | | 74,464 | |
China Mobile Ltd. | | | 16,500 | | | | 165,963 | |
China Shenhua Energy Co. Ltd. (Class H Stock) | | | 18,000 | | | | 43,061 | |
China Telecom Corp. Ltd. (Class H Stock) | | | 396,000 | | | | 198,593 | |
China Vanke Co. Ltd. (Class H Stock) | | | 62,900 | | | | 223,907 | |
See Notes to Financial Statements.
| | | | |
| Prudential QMA Emerging Markets Equity Fund | | | 13 | |
Schedule of Investments (continued)
as of October 31, 2017
| | | | | | | | |
| Description | | Shares | | | Value | |
COMMON STOCKS (Continued) | |
| | |
China (cont’d.) | | | | | | | | |
CITIC Ltd. | | | 30,000 | | | $ | 43,948 | |
Country Garden Holdings Co. Ltd. | | | 42,000 | | | | 66,579 | |
CSPC Pharmaceutical Group Ltd. | | | 20,000 | | | | 34,795 | |
Geely Automobile Holdings Ltd. | | | 88,000 | | | | 272,877 | |
Guangzhou Automobile Group Co. Ltd. (Class H Stock) | | | 96,000 | | | | 238,735 | |
Haitian International Holdings Ltd. | | | 63,000 | | | | 188,658 | |
Hengan International Group Co. Ltd. | | | 11,500 | | | | 113,406 | |
Industrial & Commercial Bank of China Ltd. (Class H Stock) | | | 612,000 | | | | 486,947 | |
JD.com, Inc., ADR* | | | 4,100 | | | | 153,832 | |
Longfor Properties Co. Ltd. | | | 65,000 | | | | 151,835 | |
People’s Insurance Co. Group of China Ltd. (The) (Class H Stock) | | | 36,000 | | | | 17,134 | |
Ping An Insurance Group Co. of China Ltd. (Class H Stock) | | | 28,000 | | | | 246,062 | |
Shandong Weigao Group Medical Polymer Co. Ltd. (Class H Stock) | | | 64,000 | | | | 45,964 | |
Shanghai Industrial Holdings Ltd. | | | 57,000 | | | | 175,102 | |
Shanghai Pharmaceuticals Holding Co. Ltd. (Class H Stock) | | | 35,400 | | | | 91,510 | |
Sihuan Pharmaceutical Holdings Group Ltd. | | | 19,000 | | | | 6,874 | |
Sino-Ocean Group Holding Ltd. | | | 271,000 | | | | 176,976 | |
Sinopec Shanghai Petrochemical Co. Ltd. (Class H Stock) | | | 168,000 | | | | 100,208 | |
Sinopharm Group Co. Ltd. (Class H Stock) | | | 6,400 | | | | 28,656 | |
Sunny Optical Technology Group Co. Ltd. | | | 4,000 | | | | 58,670 | |
Tencent Holdings Ltd. | | | 29,400 | | | | 1,321,386 | |
Weibo Corp., ADR* | | | 200 | | | | 18,530 | |
Weichai Power Co. Ltd. (Class H Stock) | | | 90,000 | | | | 112,070 | |
YY, Inc., ADR* | | | 2,500 | | | | 225,975 | |
| | | | | | | | |
| | | | | | | 8,102,225 | |
|
Colombia 0.1% | |
Grupo de Inversiones Suramericana SA | | | 1,190 | | | | 15,108 | |
|
Greece 0.6% | |
FF Group* | | | 8,228 | | | | 172,384 | |
|
Hong Kong 0.7% | |
Haier Electronics Group Co. Ltd.* | | | 67,000 | | | | 176,663 | |
Sun Art Retail Group Ltd. | | | 12,500 | | | | 12,635 | |
| | | | | | | | |
| | | | | | | 189,298 | |
|
Hungary 1.3% | |
MOL Hungarian Oil & Gas PLC | | | 16,744 | | | | 200,521 | |
OTP Bank PLC | | | 1,187 | | | | 47,855 | |
Richter Gedeon Nyrt | | | 5,009 | | | | 124,596 | |
| | | | | | | | |
| | | | | | | 372,972 | |
See Notes to Financial Statements.
| | | | | | | | |
| Description | | Shares | | | Value | |
COMMON STOCKS (Continued) | | | | | |
|
India 7.5% | |
Bajaj Finance Ltd. | | | 5,879 | | | $ | 163,506 | |
Bharti Infratel Ltd. | | | 10,767 | | | | 73,606 | |
Grasim Industries Ltd. | | | 1,777 | | | | 33,696 | |
HCL Technologies Ltd. | | | 14,977 | | | | 197,926 | |
Hero MotoCorp Ltd. | | | 257 | | | | 15,295 | |
Hindustan Petroleum Corp. Ltd. | | | 29,692 | | | | 205,099 | |
Hindustan Unilever Ltd. | | | 3,394 | | | | 64,863 | |
Housing Development Finance Corp. Ltd. | | | 2,094 | | | | 55,225 | |
Indian Oil Corp. Ltd. | | | 30,537 | | | | 196,072 | |
Infosys Ltd., ADR | | | 9,200 | | | | 136,620 | |
JSW Steel Ltd. | | | 39,829 | | | | 159,137 | |
Mahindra & Mahindra Ltd., GDR | | | 5,179 | | | | 107,982 | |
Reliance Industries Ltd., GDR, 144A | | | 5,056 | | | | 145,107 | |
Tata Steel Ltd., GDR | | | 6,675 | | | | 71,089 | |
Tech Mahindra Ltd. | | | 2,494 | | | | 18,556 | |
Titan Co. Ltd. | | | 19,587 | | | | 192,132 | |
Vedanta Ltd., ADR | | | 5,300 | | | | 109,180 | |
Wipro Ltd., ADR(a) | | | 34,000 | | | | 182,240 | |
| | | | | | | | |
| | | | | | | 2,127,331 | |
|
Indonesia 1.3% | |
AKR Corporindo Tbk PT | | | 223,200 | | | | 122,634 | |
Bank Rakyat Indonesia Persero Tbk PT | | | 40,800 | | | | 46,941 | |
Gudang Garam Tbk PT | | | 2,600 | | | | 13,418 | |
Indofood Sukses Makmur Tbk PT | | | 22,500 | | | | 13,603 | |
Jasa Marga Persero Tbk PT | | | 391,300 | | | | 187,541 | |
| | | | | | | | |
| | | | | | | 384,137 | |
|
Malaysia 1.4% | |
AirAsia Bhd | | | 134,700 | | | | 106,296 | |
Genting Bhd | | | 82,500 | | | | 176,351 | |
HAP Seng Consolidated Bhd | | | 2,900 | | | | 6,359 | |
Hong Leong Bank Bhd | | | 3,500 | | | | 13,177 | |
Petronas Chemicals Group Bhd | | | 12,200 | | | | 21,238 | |
PPB Group Bhd | | | 2,600 | | | | 10,310 | |
Tenaga Nasional Bhd | | | 17,200 | | | | 60,942 | |
| | | | | | | | |
| | | | | | | 394,673 | |
|
Mexico 2.6% | |
America Movil SAB de CV (Class L Stock) | | | 93,800 | | | | 80,875 | |
Coca-Cola Femsa SAB de CV (Class L Stock) | | | 2,700 | | | | 18,252 | |
Gruma SAB de CV (Class B Stock) | | | 9,385 | | | | 123,179 | |
See Notes to Financial Statements.
| | | | |
| Prudential QMA Emerging Markets Equity Fund | | | 15 | |
Schedule of Investments (continued)
as of October 31, 2017
| | | | | | | | |
| Description | | Shares | | | Value | |
COMMON STOCKS (Continued) | | | | | |
| | |
Mexico (cont’d.) | | | | | | | | |
Grupo Aeroportuario del Pacifico SAB de CV (Class B Stock) | | | 4,400 | | | $ | 41,836 | |
Grupo Financiero Banorte SAB de CV (Class O Stock) | | | 18,800 | | | | 111,397 | |
Grupo Financiero Santander Mexico SAB de CV (Class B Stock) | | | 91,800 | | | | 154,279 | |
Wal-Mart de Mexico SAB de CV | | | 97,600 | | | | 218,498 | |
| | | | | | | | |
| | | | | | | 748,316 | |
|
Philippines 1.1% | |
DMCI Holdings, Inc. | | | 524,000 | | | | 155,642 | |
Globe Telecom, Inc. | | | 3,655 | | | | 144,651 | |
SM Investments Corp. | | | 1,300 | | | | 24,076 | |
| | | | | | | | |
| | | | | | | 324,369 | |
|
Poland 0.8% | |
Cyfrowy Polsat SA | | | 1,658 | | | | 11,548 | |
Polski Koncern Naftowy ORLEN SA | | | 6,051 | | | | 214,021 | |
| | | | | | | | |
| | | | | | | 225,569 | |
|
Qatar 0.6% | |
Ooredoo QPSC | | | 7,106 | | | | 167,358 | |
|
Romania 0.1% | |
NEPI Rockcastle PLC | | | 1,758 | | | | 24,473 | |
|
Russia 3.1% | |
Alrosa PJSC | | | 24,300 | | | | 31,233 | |
Gazprom PJSC | | | 65,870 | | | | 141,730 | |
Inter RAO UES PJSC | | | 489,000 | | | | 29,916 | |
LUKOIL PJSC | | | 2,489 | | | | 132,000 | |
Magnit PJSC, GDR | | | 974 | | | | 27,564 | |
MMC Norilsk Nickel PJSC | | | 491 | | | | 88,873 | |
Mobile TeleSystems PJSC, ADR | | | 4,200 | | | | 44,562 | |
Novatek PJSC, GDR | | | 244 | | | | 27,840 | |
Novolipetsk Steel PJSC | | | 6,260 | | | | 14,258 | |
PhosAgro PJSC, GDR | | | 489 | | | | 6,724 | |
Rosneft Oil Co. PJSC | | | 2,040 | | | | 11,122 | |
Rostelecom PJSC | | | 9,990 | | | | 11,663 | |
Sberbank of Russia PJSC, ADR | | | 15,073 | | | | 216,298 | |
Severstal PJSC | | | 3,350 | | | | 51,441 | |
Surgutneftegas OJSC, ADR | | | 2,756 | | | | 13,769 | |
Tatneft PJSC | | | 3,820 | | | | 28,574 | |
| | | | | | | | |
| | | | | | | 877,567 | |
See Notes to Financial Statements.
| | | | | | | | |
| Description | | Shares | | | Value | |
COMMON STOCKS (Continued) | | | | | |
| |
South Africa 5.1% | | | | | |
Aspen Pharmacare Holdings Ltd. | | | 2,082 | | | $ | 47,042 | |
Bid Corp. Ltd. | | | 1,674 | | | | 36,811 | |
Gold Fields Ltd. | | | 9,446 | | | | 37,601 | |
Growthpoint Properties Ltd., REIT | | | 56,815 | | | | 98,552 | |
Massmart Holdings Ltd. | | | 11,999 | | | | 90,968 | |
Mondi Ltd. | | | 2,066 | | | | 49,558 | |
Naspers Ltd. (Class N Stock) | | | 2,385 | | | | 581,064 | |
Rand Merchant Investment Holdings Ltd. | | | 3,552 | | | | 9,931 | |
Sappi Ltd. | | | 22,779 | | | | 152,540 | |
Shoprite Holdings Ltd. | | | 12,330 | | | | 176,517 | |
Standard Bank Group Ltd. | | | 6,970 | | | | 80,938 | |
Steinhoff International Holdings NV | | | 14,699 | | | | 63,810 | |
Telkom SA SOC Ltd. | | | 1,333 | | | | 4,993 | |
Tiger Brands Ltd. | | | 880 | | | | 24,034 | |
| | | | | | | | |
| | | | | | | 1,454,359 | |
|
South Korea 15.5% | |
Cheil Worldwide, Inc. | | | 3,894 | | | | 72,336 | |
Dongbu Insurance Co. Ltd. | | | 276 | | | | 17,376 | |
Hana Financial Group, Inc. | | | 5,885 | | | | 251,871 | |
Hanwha Chemical Corp. | | | 1,320 | | | | 35,957 | |
Hanwha Corp. | | | 238 | | | | 9,497 | |
Hyundai Marine & Fire Insurance Co. Ltd. | | | 4,228 | | | | 171,305 | |
Hyundai Steel Co. | | | 469 | | | | 24,104 | |
Industrial Bank of Korea | | | 5,191 | | | | 71,123 | |
KB Financial Group, Inc. | | | 5,108 | | | | 267,068 | |
KT Corp. | | | 40 | | | | 1,050 | |
KT&G Corp. | | | 2,373 | | | | 224,713 | |
LG Chem Ltd. | | | 387 | | | | 139,536 | |
LG Corp. | | | 503 | | | | 38,676 | |
LG Display Co. Ltd. | | | 1,453 | | | | 38,011 | |
LG Uplus Corp. | | | 13,661 | | | | 156,865 | |
Lotte Chemical Corp. | | | 83 | | | | 27,415 | |
POSCO | | | 920 | | | | 268,167 | |
Samsung Electronics Co. Ltd. | | | 618 | | | | 1,523,436 | |
Shinhan Financial Group Co. Ltd. | | | 5,496 | | | | 246,870 | |
SK Hynix, Inc. | | | 6,158 | | | | 454,046 | |
SK Telecom Co. Ltd. | | | 803 | | | | 189,572 | |
Woori Bank | | | 13,239 | | | | 193,742 | |
| | | | | | | | |
| | | | | | | 4,422,736 | |
See Notes to Financial Statements.
| | | | |
| Prudential QMA Emerging Markets Equity Fund | | | 17 | |
Schedule of Investments (continued)
as of October 31, 2017
| | | | | | | | |
| Description | | Shares | | | Value | |
COMMON STOCKS (Continued) | | | | | |
| |
Taiwan 11.4% | | | | | |
AU Optronics Corp. | | | 442,000 | | | $ | 181,117 | |
Catcher Technology Co. Ltd. | | | 3,000 | | | | 31,929 | |
Cathay Financial Holding Co. Ltd. | | | 148,000 | | | | 244,558 | |
Chailease Holding Co. Ltd. | | | 40,000 | | | | 103,182 | |
CTBC Financial Holding Co. Ltd. | | | 89,000 | | | | 56,983 | |
First Financial Holding Co. Ltd. | | | 48,000 | | | | 30,967 | |
Formosa Plastics Corp. | | | 21,000 | | | | 64,018 | |
Fubon Financial Holding Co. Ltd. | | | 139,000 | | | | 221,526 | |
Hon Hai Precision Industry Co. Ltd. | | | 61,000 | | | | 226,734 | |
Innolux Corp. | | | 418,000 | | | | 183,212 | |
Nanya Technology Corp. | | | 80,000 | | | | 217,482 | |
Pegatron Corp. | | | 52,000 | | | | 134,745 | |
Powertech Technology, Inc. | | | 3,000 | | | | 9,395 | |
Shin Kong Financial Holding Co. Ltd. | | | 175,000 | | | | 55,995 | |
Synnex Technology International Corp. | | | 149,000 | | | | 188,876 | |
Taiwan Cooperative Financial Holding Co. Ltd. | | | 41,200 | | | | 22,275 | |
Taiwan Semiconductor Manufacturing Co. Ltd. | | | 111,000 | | | | 897,358 | |
Uni-President Enterprises Corp. | | | 91,000 | | | | 190,136 | |
Yuanta Financial Holding Co. Ltd. | | | 444,000 | | | | 197,463 | |
| | | | | | | | |
| | | | | | | 3,257,951 | |
|
Thailand 3.1% | |
Airports of Thailand PCL | | | 92,900 | | | | 166,551 | |
Bumrungrad Hospital PCL | | | 1,600 | | | | 10,598 | |
Charoen Pokphand Foods PCL | | | 215,200 | | | | 168,358 | |
Kasikornbank PCL | | | 8,900 | | | | 61,089 | |
PTT Global Chemical PCL | | | 10,500 | | | | 25,292 | |
PTT PCL | | | 17,200 | | | | 217,610 | |
Siam Cement PCL (The) | | | 2,600 | | | | 38,186 | |
Thai Oil PCL | | | 67,400 | | | | 207,003 | |
| | | | | | | | |
| | | | | | | 894,687 | |
|
Turkey 2.1% | |
Akbank TAS | | | 12,781 | | | | 33,811 | |
Eregli Demir ve Celik Fabrikalari TAS | | | 6,774 | | | | 15,920 | |
Ford Otomotiv Sanayi A/S | | | 12,821 | | | | 181,131 | |
Haci Omer Sabanci Holding A/S | | | 5,028 | | | | 13,996 | |
KOC Holding A/S | | | 3,179 | | | | 14,235 | |
Turkiye Garanti Bankasi A/S | | | 63,342 | | | | 174,514 | |
Turkiye Is Bankasi (Class C Stock) | | | 83,081 | | | | 156,805 | |
| | | | | | | | |
| | | | | | | 590,412 | |
See Notes to Financial Statements.
| | | | | | | | |
| Description | | Shares | | | Value | |
COMMON STOCKS (Continued) | | | | | |
|
United Arab Emirates 0.7% | |
Aldar Properties PJSC | | | 16,510 | | | $ | 10,711 | |
DAMAC Properties Dubai Co. PJSC | | | 9,749 | | | | 10,460 | |
Dubai Islamic Bank PJSC | | | 109,029 | | | | 181,700 | |
| | | | | | | | |
| | | | | | | 202,871 | |
|
United States 0.8% | |
Yum China Holdings, Inc.* | | | 6,000 | | | | 242,100 | |
| | | | | | | | |
TOTAL COMMON STOCKS
(cost $22,380,587) | | | | 27,032,419 | |
| | | | | | | | |
|
EXCHANGE TRADED FUND 2.4% | |
|
United States | |
iShares MSCI Emerging Markets ETF(a)
(cost $596,974) | | | 14,538 | | | | 672,818 | |
| | | | | | | | |
|
PREFERRED STOCKS 2.6% | |
|
Brazil 1.8% | |
Banco Bradesco SA (PRFC) | | | 2,000 | | | | 21,251 | |
Cia Paranaense de Energia (PRFC B) | | | 600 | | | | 4,613 | |
Itau Unibanco Holding SA (PRFC) | | | 17,300 | | | | 223,224 | |
Itausa - Investimentos Itau SA (PRFC) | | | 36,400 | | | | 117,391 | |
Vale SA (PRFC) | | | 17,500 | | | | 160,326 | |
| | | | | | | | |
| | | | | | | 526,805 | |
|
Russia 0.1% | |
Transneft PJSC (PRFC) | | | 11 | | | | 34,796 | |
|
South Korea 0.7% | |
Samsung Electronics Co. Ltd. (PRFC) | | | 96 | | | | 192,273 | |
| | | | | | | | |
TOTAL PREFERRED STOCKS
(cost $645,573) | | | | 753,874 | |
| | | | | | | | |
| | |
| | | Units | | | | |
RIGHTS* 0.0% | |
|
Hong Kong 0.0% | |
China Literature Ltd., expiring 11/01/17^ | | | 23 | | | | — | |
See Notes to Financial Statements.
| | | | |
| Prudential QMA Emerging Markets Equity Fund | | | 19 | |
Schedule of Investments (continued)
as of October 31, 2017
| | | | | | | | |
| Description | | Units | | | Value | |
RIGHTS* (Continued) | | | | | |
|
Taiwan 0.0% | |
CTBC Financial Holding Co., Ltd., expiring 12/17/17 | | | 1,219 | | | $ | — | |
| | | | | | | | |
TOTAL RIGHTS
(cost $—) | | | | — | |
| | | | | | | | |
TOTAL LONG-TERM INVESTMENTS
(cost $23,623,134) | | | | 28,459,111 | |
| | | | | | | | |
| | |
| | | Shares | | | | |
SHORT-TERM INVESTMENTS 1.8% | |
|
AFFILIATED MUTUAL FUNDS | |
Prudential Investment Portfolios 2 - Prudential Core Ultra Short Bond Fund(w) | | | 18,470 | | | | 18,470 | |
Prudential Investment Portfolios 2 - Prudential Institutional Money Market Fund
(cost $481,949; includes $481,411 of cash collateral for securities on loan)(b)(w) | | | 481,900 | | | | 481,949 | |
| | | | | | | | |
TOTAL SHORT-TERM INVESTMENTS
(cost $500,419) | | | | | | | 500,419 | |
| | | | | | | | |
TOTAL INVESTMENTS 101.7%
(cost $24,123,553) | | | | | | | 28,959,530 | |
Liabilities in excess of other assets (1.7)% | | | | | | | (489,644 | ) |
| | | | | | | | |
NET ASSETS 100.0% | | | | | | $ | 28,469,886 | |
| | | | | | | | |
The following abbreviations are used in the annual report:
144A—Security was purchased pursuant to Rule 144A under the Securities Act of 1933 and may not be resold subject to that rule except to qualified institutional buyers. Unless otherwise noted, 144A securities are deemed to be liquid.
ADR—American Depositary Receipt
ETF—Exchange Traded Fund
GDR—Global Depositary Receipt
LIBOR—London Interbank Offered Rate
MSCI—Morgan Stanley Capital International
PRFC—Preference Shares
REIT(s)—Real Estate Investment Trust(s)
UTS—Unit Trust Security
| * | Non-income producing security. |
| ^ | Indicates a Level 3 security. The aggregate value of Level 3 securities is $0 and 0.0% of net assets. |
| (a) | All or a portion of security is on loan. The aggregate market value of such securities, including those sold and pending settlement, is $477,080; cash collateral of $481,411 (included in liabilities) was received with which the Fund purchased highly liquid short-term investments. |
| (b) | Represents security purchased with cash collateral received for securities on loan and includes dividend reinvestment. |
| (w) | PGIM Investments LLC, the manager of the Fund, also serves as manager of the Prudential Investment Portfolios 2 - Prudential Core Ultra Short Bond Fund and Prudential Institutional Money Market Fund. |
See Notes to Financial Statements.
Fair Value Measurements:
Various inputs are used in determining the value of the Fund’s investments. These inputs are summarized in the three broad levels listed below.
Level 1—unadjusted quoted prices generally in active markets for identical securities.
Level 2—quoted prices for similar securities, interest rates and yield curves, prepayment speeds, foreign currency exchange rates and other observable inputs.
Level 3—unobservable inputs for securities valued in accordance with Board approved fair valuation procedures.
The following is a summary of the inputs used as of October 31, 2017 in valuing such portfolio securities:
| | | | | | | | | | | | |
| | | Level 1 | | | Level 2 | | | Level 3 | |
Investments in Securities | | | | | | | | | | | | |
Common Stocks | | | | | | | | | | | | |
Brazil | | $ | 1,581,176 | | | $ | — | | | $ | — | |
Chile | | | 260,347 | | | | — | | | | — | |
China | | | 1,812,285 | | | | 6,289,940 | | | | — | |
Colombia | | | 15,108 | | | | — | | | | — | |
Greece | | | — | | | | 172,384 | | | | — | |
Hong Kong | | | — | | | | 189,298 | | | | — | |
Hungary | | | — | | | | 372,972 | | | | — | |
India | | | 752,218 | | | | 1,375,113 | | | | — | |
Indonesia | | | — | | | | 384,137 | | | | — | |
Malaysia | | | — | | | | 394,673 | | | | — | |
Mexico | | | 748,316 | | | | — | | | | — | |
Philippines | | | — | | | | 324,369 | | | | — | |
Poland | | | — | | | | 225,569 | | | | — | |
Qatar | | | — | | | | 167,358 | | | | — | |
Romania | | | — | | | | 24,473 | | | | — | |
Russia | | | 336,757 | | | | 540,810 | | | | — | |
South Africa | | | — | | | | 1,454,359 | | | | — | |
South Korea | | | — | | | | 4,422,736 | | | | — | |
Taiwan | | | — | | | | 3,257,951 | | | | — | |
Thailand | | | — | | | | 894,687 | | | | — | |
Turkey | | | — | | | | 590,412 | | | | — | |
United Arab Emirates | | | — | | | | 202,871 | | | | — | |
United States | | | 242,100 | | | | — | | | | — | |
Exchange Traded Fund | |
United States | | | 672,818 | | | | — | | | | — | |
See Notes to Financial Statements.
| | | | |
| Prudential QMA Emerging Markets Equity Fund | | | 21 | |
Schedule of Investments (continued)
as of October 31, 2017
| | | | | | | | | | | | |
| | | Level 1 | | | Level 2 | | | Level 3 | |
Investments in Securities (continued) | | | | | | | | | | | | |
Preferred Stocks | |
Brazil | | $ | 526,805 | | | $ | — | | | $ | — | |
Russia | | | — | | | | 34,796 | | | | — | |
South Korea | | | — | | | | 192,273 | | | | — | |
Rights | | | | | | | | | | | | |
Hong Kong | | | — | | | | — | | | | — | |
Taiwan | | | — | | | | — | | | | — | |
Affiliated Mutual Funds | | | 500,419 | | | | — | | | | — | |
| | | | | | | | | | | | |
Total | | $ | 7,448,349 | | | $ | 21,511,181 | | | $ | — | |
| | | | | | | | | | | | |
During the period, there were no transfers between Level 1, Level 2 and Level 3 to report.
Industry Classification:
The industry classification of investments and liabilities in excess of other assets shown as a percentage of net assets as of October 31, 2017 were as follows (unaudited):
| | | | |
Banks | | | 16.7 | % |
Internet Software & Services | | | 10.5 | |
Oil, Gas & Consumable Fuels | | | 6.7 | |
Technology Hardware, Storage & Peripherals | | | 6.6 | |
Semiconductors & Semiconductor Equipment | | | 5.5 | |
Metals & Mining | | | 4.1 | |
Electronic Equipment, Instruments & Components | | | 3.1 | |
Wireless Telecommunication Services | | | 2.9 | |
Automobiles | | | 2.9 | |
Insurance | | | 2.7 | |
Exchange Traded Fund | | | 2.4 | |
Media | | | 2.3 | |
Real Estate Management & Development | | | 2.3 | |
Food & Staples Retailing | | | 2.2 | |
Diversified Telecommunication Services | | | 2.2 | |
IT Services | | | 1.9 | |
Food Products | | | 1.9 | |
Affiliated Mutual Funds (including 1.7% of collateral for securities on loan) | | | 1.8 | |
Industrial Conglomerates | | | 1.6 | |
Chemicals | | | 1.5 | |
Hotels, Restaurants & Leisure | | | 1.5 | |
Transportation Infrastructure | | | 1.4 | |
Independent Power & Renewable Electricity Producers | | | 1.3 | |
Diversified Financial Services | | | 1.2 | |
Capital Markets | | | 1.2 | |
Textiles, Apparel & Luxury Goods | | | 1.1 | |
Health Care Providers & Services | | | 1.1 | % |
Machinery | | | 1.1 | |
Pharmaceuticals | | | 1.0 | |
Household Durables | | | 0.8 | |
Tobacco | | | 0.8 | |
Paper & Forest Products | | | 0.7 | |
Beverages | | | 0.6 | |
Specialty Retail | | | 0.6 | |
Water Utilities | | | 0.6 | |
Road & Rail | | | 0.6 | |
Consumer Finance | | | 0.6 | |
Internet & Direct Marketing Retail | | | 0.5 | |
Trading Companies & Distributors | | | 0.4 | |
Personal Products | | | 0.4 | |
Airlines | | | 0.4 | |
Construction Materials | | | 0.4 | |
Equity Real Estate Investment Trusts (REITs) | | | 0.3 | |
Electric Utilities | | | 0.3 | |
Household Products | | | 0.2 | |
Thrifts & Mortgage Finance | | | 0.2 | |
Health Care Equipment & Supplies | | | 0.2 | |
Diversified Consumer Services | | | 0.1 | |
Multiline Retail | | | 0.1 | |
Commercial Services & Supplies | | | 0.1 | |
Containers & Packaging | | | 0.1 | |
| | | | |
| | | 101.7 | |
Liabilities in excess of other assets | | | (1.7 | ) |
| | | | |
| | | 100.0 | % |
| | | | |
See Notes to Financial Statements.
Effects of Derivative Instruments on the Financial Statements and Primary Underlying Risk Exposure:
The Fund invested in derivative instruments during the reporting period. The primary type of risk associated with these derivative instruments is equity contracts risk. The effect of such derivative instruments on the Fund's financial position and financial performance as reflected in the Statement of Assets and Liabilities and Statement of Operations is presented in the summary below.
Fair values of derivative instruments as of October 31, 2017 as presented in the Statement of Assets and Liabilities:
| | | | | | | | | | | | |
Derivatives not accounted
for as hedging instruments,
carried at fair value | | Asset Derivatives | | | Liability Derivatives | |
| | Balance Sheet
Location | | Fair
Value | | | Balance Sheet
Location | | Fair
Value | |
| Equity contracts | | Unaffiliated
Investments | | $ | — | | | — | | $ | — | |
| | | | | | | | | | | | |
The effects of derivative instruments on the Statement of Operations for the period ended October 31, 2017 are as follows:
| | | | |
Amount of Realized Gain (Loss) on Derivatives Recognized in Income | |
Derivatives not accounted for as hedging
instruments, carried at fair value | | Rights(1) | |
Equity contracts | | $ | 622 | |
| | | | |
| (1) | Included in net realized gain (loss) on investment transactions in the Statement of Operations. |
| | | | |
Change in Unrealized Appreciation (Depreciation) on Derivatives Recognized in Income | |
Derivatives not accounted for as hedging
instruments, carried at fair value | | Rights(2) | |
Equity contracts | | $ | — | |
| | | | |
| (2) | Included in net change in unrealized appreciation (depreciation) on investments in the Statement of Operations. |
Financial Instruments/Transactions—Summary of Offsetting and Netting Arrangements:
The Fund entered into financial instruments/transactions during the reporting period that are either offset in accordance with current requirements or are subject to enforceable master netting arrangements or similar agreements that permit offsetting. The information
See Notes to Financial Statements.
| | | | |
| Prudential QMA Emerging Markets Equity Fund | | | 23 | |
Schedule of Investments (continued)
as of October 31, 2017
about offsetting and related netting arrangements for financial instruments/transactions, where the legal right to set-off exists, is presented in the summary below.
Offsetting of financial instruments/transactions assets and liabilities:
| | | | | | | | | | | | |
Description | | Gross Market
Value of
Recognized
Assets/(Liabilities) | | | Collateral
Pledged/(Received)(1) | | | Net
Amount | |
Securities on Loan | | $ | 477,080 | | | $ | (477,080 | ) | | $ | — | |
| | | | | | | | | | | | |
| (1) | Collateral amount disclosed by the Fund is limited to the market value of financial instruments/transactions. |
See Notes to Financial Statements.
Statement of Assets & Liabilities
as of October 31, 2017
| | | | |
Assets | |
Investments at value, including securities on loan of $477,080: | |
Unaffiliated investments (cost $23,623,134) | | $ | 28,459,111 | |
Affiliated investments (cost $500,419) | | | 500,419 | |
Foreign currency, at value (cost $22,416) | | | 22,107 | |
Dividends and interest receivable | | | 17,746 | |
Receivable for Fund shares sold | | | 16,445 | |
Tax reclaim receivable | | | 707 | |
Prepaid expenses | | | 835 | |
| | | | |
Total assets | | | 29,017,370 | |
| | | | |
|
Liabilities | |
Payable to broker for collateral for securities on loan | | | 481,411 | |
Accrued expenses and other liabilities | | | 31,252 | |
Payable for Fund shares reacquired | | | 15,439 | |
Foreign capital gains tax liability | | | 13,809 | |
Management fee payable | | | 5,504 | |
Payable for investments purchased | | | 35 | |
Affiliated transfer agent fee payable | | | 34 | |
| | | | |
Total liabilities | | | 547,484 | |
| | | | |
| |
Net Assets | | $ | 28,469,886 | |
| | | | |
| | | | | |
Net assets were comprised of: | |
Shares of beneficial interest, at par | | $ | 2,156 | |
Paid-in capital in excess of par | | | 21,875,965 | |
| | | | |
| | | 21,878,121 | |
Undistributed net investment income | | | 298,463 | |
Accumulated net realized gain on investment and foreign currency transactions | | | 1,471,430 | |
Net unrealized appreciation on investments and foreign currencies | | | 4,821,872 | |
| | | | |
Net assets, October 31, 2017 | | $ | 28,469,886 | |
| | | | |
|
Class Q | |
Net asset value, offering price and redemption price per share, | |
($28,469,886 ÷ 2,155,827 shares of beneficial interest issued and outstanding) | | $ | 13.21 | |
| | | | |
See Notes to Financial Statements.
| | | | |
| Prudential QMA Emerging Markets Equity Fund | | | 25 | |
Statement of Operations
Period* Ended October 31, 2017
| | | | |
Net Investment Income (Loss) | |
Income | |
Unaffiliated dividend income (net of foreign withholding taxes of $79,921) | | $ | 591,530 | |
Income from securities lending, net (including affiliated income of $630) | | | 1,748 | |
Affiliated dividend income | | | 2,125 | |
| | | | |
Total income | | | 595,403 | |
| | | | |
|
Expenses | |
Management fee | | | 165,817 | |
Custodian and accounting fees | | | 104,000 | |
Audit fee | | | 32,000 | |
Legal fees and expenses | | | 28,000 | |
Shareholders’ reports | | | 15,000 | |
Trustees’ fees | | | 11,000 | |
Transfer agent’s fees and expenses (including affiliated expense of $210) | | | 304 | |
Miscellaneous | | | 29,475 | |
| | | | |
Total expenses | | | 385,596 | |
Less: Management fee waiver and/or expense reimbursement | | | (120,104 | ) |
| | | | |
Net expenses | | | 265,492 | |
| | | | |
Net investment income (loss) | | | 329,911 | |
| | | | |
|
Realized And Unrealized Gain (Loss) On Investments And Foreign Currency Transactions | |
Net realized gain (loss) on: | |
Investment transactions (including affiliated $(35)) (net of foreign capital gains taxes $(1,175)) | | | 1,544,610 | |
Foreign currency transactions | | | (31,981 | ) |
| | | | |
| | | 1,512,629 | |
| | | | |
Net change in unrealized appreciation (depreciation) on: | |
Investments (net change in foreign capital gains taxes $(13,730)) | | | 4,822,247 | |
Foreign currencies | | | (375 | ) |
| | | | |
| | | 4,821,872 | |
| | | | |
Net gain (loss) on investment and foreign currency transactions | | | 6,334,501 | |
| | | | |
Net Increase (Decrease) In Net Assets Resulting From Operations | | $ | 6,664,412 | |
| | | | |
| * | Commencement of operations was November 29, 2016. |
See Notes to Financial Statements.
Statement of Changes in Net Assets
| | | | |
| | | November 29, 2016* through October 31, 2017 | |
Increase (Decrease) in Net Assets | |
Operations | |
Net investment income (loss) | | $ | 329,911 | |
Net realized gain (loss) on investment and foreign currency transactions | | | 1,512,629 | |
Net change in unrealized appreciation (depreciation) on investments and foreign currencies | | | 4,821,872 | |
| | | | |
Net increase (decrease) in net assets resulting from operations | | | 6,664,412 | |
| | | | |
|
Dividends from net investment income | |
Class Q | | | (72,647 | ) |
| | | | |
|
Fund share transactions | |
Net proceeds from shares sold | | | 22,189,446 | |
Net asset value of shares issued in reinvestment of dividends and distributions | | | 72,647 | |
Cost of shares reacquired | | | (383,972 | ) |
| | | | |
Net increase (decrease) in net assets from Fund share transactions | | | 21,878,121 | |
| | | | |
Total increase (decrease) | | | 28,469,886 | |
|
Net Assets: | |
Beginning of period | | | — | |
| | | | |
End of period(a) | | $ | 28,469,886 | |
| | | | |
(a) Includes undistributed net investment income of: | | $ | 298,463 | |
| | | | |
| * | Commencement of operations. |
See Notes to Financial Statements.
| | | | |
| Prudential QMA Emerging Markets Equity Fund | | | 27 | |
Notes to Financial Statements
Prudential Investment Portfolios 2 (the “PIP2”) is registered under the Investment Company Act of 1940, as amended (“1940 Act”), as an open-end management investment company. PIP2 consists of eleven separate series: Prudential Commodity Strategies Fund, Prudential Core Conservative Bond Fund, Prudential Core Short-Term Bond Fund, Prudential Core Ultra Short Bond Fund, Prudential Institutional Money Market Fund, Prudential Jennison Small-Cap Core Equity Fund, Prudential QMA Emerging Markets Equity Fund, Prudential QMA International Developed Markets Index Fund, Prudential QMA Mid-Cap Core Equity Fund, Prudential QMA US Broad Market Index Fund and Prudential TIPS Fund. These financial statements relate to the Prudential QMA Emerging Markets Equity Fund (the “Fund”), a diversified series of the PIP2. The Fund commenced operations on November 29, 2016.
The investment objective of the Fund is to seek to provide returns in excess of the Morgan Stanley Capital International Emerging Markets Index over full market cycles.
1. Accounting Policies
The Fund follows investment company accounting and reporting guidance of the Financial Accounting Standards Board (“FASB”) Accounting Standard Codification Topic 946 Financial Services—Investment Companies. The following accounting policies conform to U.S. generally accepted accounting principles. The Fund consistently follows such policies in the preparation of its financial statements.
Securities Valuation: The Fund holds securities and other assets and liabilities that are fair valued at the close of each day (generally, 4:00 PM Eastern time) the New York Stock Exchange (“NYSE”) is open for trading. Fair value is the price that would be received to sell an asset or paid to transfer a liability in an orderly transaction between market participants on the measurement date. The Board of Trustees (the “Board”) has adopted valuation procedures for security valuation under which fair valuation responsibilities have been delegated to PGIM Investments LLC (“PGIM Investments” or “the Manager”) (formerly known as Prudential Investments LLC). Under the current valuation procedures, the Valuation Committee is responsible for supervising the valuation of portfolio securities and other assets and liabilities. The valuation procedures permit the Fund to utilize independent pricing vendor services, quotations from market makers, and alternative valuation methods when market quotations are either not readily available or not deemed representative of fair value. A record of the Valuation Committee’s actions is subject to the Board’s review, approval, and ratification at its next regularly scheduled quarterly meeting.
Various inputs determine how the Fund’s investments are valued, all of which are categorized according to the three broad levels (Level 1, 2, or 3) detailed in the Schedule of Investments.
Common and preferred stocks, exchange-traded funds, and derivative instruments, such as futures or options, that are traded on a national securities exchange are valued at the last sale price as of the close of trading on the applicable exchange where the security principally trades. Securities traded via NASDAQ are valued at the NASDAQ official closing price. To the extent these securities are valued at the last sale price or NASDAQ official closing price, they are classified as Level 1 in the fair value hierarchy. In the event that no sale or official closing price on valuation date exists, these securities are generally valued at the mean between the last reported bid and ask prices, or at the last bid price in the absence of an ask price. These securities are classified as Level 2 in the fair value hierarchy.
Foreign equities traded on foreign securities exchanges are generally valued using pricing vendor services that provide model prices derived using adjustment factors based on information such as local closing price, relevant general and sector indices, currency fluctuations, depositary receipts, and futures, as applicable. Securities valued using such model prices are classified as Level 2 in the fair value hierarchy. The models generate an evaluated adjustment factor for each security, which is applied to the local closing price to adjust it for post closing market movements. Utilizing that evaluated adjustment factor, the vendor provides an evaluated price for each security. If the vendor does not provide an evaluated price, securities are valued in accordance with exchange-traded common and preferred stock valuation policies discussed above.
Investments in open-end, non-exchange-traded mutual funds are valued at their net asset values as of the close of the NYSE on the date of valuation. These securities are classified as Level 1 in the fair value hierarchy since they may be purchased or sold at their net asset values on the date of valuation.
Securities and other assets that cannot be priced according to the methods described above are valued based on pricing methodologies approved by the Board. In the event that unobservable inputs are used when determining such valuations, the securities will be classified as Level 3 in the fair value hierarchy.
When determining the fair value of securities, some of the factors influencing the valuation include: the nature of any restrictions on disposition of the securities; assessment of the general liquidity of the securities; the issuer’s financial condition and the markets in which it does business; the cost of the investment; the size of the holding and the capitalization of the issuer; the prices of any recent transactions or bids/offers for such securities or any comparable securities; any available analyst media or other reports or information deemed reliable by the investment manager regarding the issuer or the markets or industry in which it operates. Using fair value to price securities may result in a value that is different from a security’s most recent closing price and from the price used by other unaffiliated mutual funds to calculate their net asset values.
| | | | |
| Prudential QMA Emerging Markets Equity Fund | | | 29 | |
Notes to Financial Statements (continued)
Foreign Currency Translation: The books and records of the Fund are maintained in U.S. dollars. Foreign currency amounts are translated into U.S. dollars on the following basis:
(i) market value of investment securities, other assets and liabilities—at the current rates of exchange;
(ii) purchases and sales of investment securities, income and expenses—at the rates of exchange prevailing on the respective dates of such transactions.
Although the net assets of the Fund are presented at the foreign exchange rates and market values at the close of the period, the Fund does not generally isolate that portion of the results of operations arising as a result of changes in the foreign exchange rates from the fluctuations arising from changes in the market prices of long-term portfolio securities held at the end of the period. Similarly, the Fund does not isolate the effect of changes in foreign exchange rates from the fluctuations arising from changes in the market prices of long-term portfolio securities sold during the period. Accordingly, holding period realized foreign currency gains (losses) are included in the reported net realized gains (losses) on investment transactions.
Net realized gains (losses) on foreign currency transactions represent net foreign exchange gains (losses) from the disposition of holdings of foreign currencies, forward currency contracts, currency gains (losses) realized between the trade and settlement dates on securities transactions, and the difference between the amounts of interest, dividends and foreign withholding taxes recorded on the Fund’s books and the U.S. dollar equivalent amounts actually received or paid. Net unrealized currency gains (losses) from valuing foreign currency denominated assets and liabilities (other than investments) at period end exchange rates are reflected as a component of net unrealized appreciation (depreciation) on foreign currencies.
Master Netting Arrangements: PIP2, on behalf of the Fund, is subject to various Master Agreements, or netting arrangements, with select counterparties. These are agreements which a subadviser may have negotiated and entered into on behalf of the Fund. A master netting arrangement between the Fund and the counterparty permits the Fund to offset amounts payable by the Fund to the same counterparty against amounts to be received; and by the receipt of collateral from the counterparty by the Fund to cover the Fund’s exposure to the counterparty. However, there is no assurance that such mitigating factors are easily enforceable. In addition to master netting arrangements, the right to set-off exists when all the conditions are met such that each of the parties owes the other determinable amounts, the reporting party has the right to set-off the amount owed with the amount owed by the other party, the reporting party intends to set-off and the right of set-off is enforceable by law. During the reporting period, there was no intention to settle on a net basis and all amounts are presented on a gross basis on the Statement of Assets and Liabilities.
Warrants and Rights: The Fund may hold warrants and rights acquired either through a direct purchase, included as part of a private placement, or pursuant to corporate actions. Warrants and rights entitle the holder to buy a proportionate amount of common stock, or such other security that the issuer may specify, at a specific price and time through the expiration dates. Such warrants and rights are held as long positions by the Fund until exercised, sold or expired. Warrants and rights are valued at fair value in accordance with the Board approved fair valuation procedures.
Securities Lending: The Fund may lend its portfolio securities to banks and broker-dealers. The loans are secured by collateral at least equal to the market value of the securities loaned. Collateral pledged by each borrower is invested in an affiliated money market fund and is marked to market daily, based on the previous day’s market value, such that the value of the collateral exceeds the value of the loaned securities. Loans are subject to termination at the option of the borrower or the Fund. Upon termination of the loan, the borrower will return to the Fund securities identical to the loaned securities. Should the borrower of the securities fail financially, the Fund has the right to repurchase the securities in the open market using the collateral. The Fund recognizes income, net of any rebate and securities lending agent fees, for lending its securities in the form of fees or interest on the investment of any cash received as collateral. The borrower receives all interest and dividends from the securities loaned and such payments are passed back to the lender in amounts equivalent thereto. The Fund also continues to recognize any unrealized gain (loss) in the market price of the securities loaned and on the change in the value of the collateral invested that may occur during the term of the loan. In addition, realized gain (loss) is recognized on changes in the value of the collateral invested upon liquidation of the collateral. Net earnings from securities lending are disclosed on the Statement of Operations as “Income from securities lending, net”.
Concentration of Risk: Foreign security and currency transactions may involve certain considerations and risks not typically associated with those of domestic origin as a result of, among other factors, the possibility of political or economic instability or the level of governmental supervision and regulation of foreign securities markets.
Securities Transactions and Net Investment Income: Securities transactions are recorded on the trade date. Realized gains (losses) from investment and currency transactions are calculated on the specific identification method. Dividend income is recorded on the ex-date. Interest income, including amortization of premium and accretion of discount on debt securities, as required, is recorded on the accrual basis. Expenses are recorded on an accrual basis, which may require the use of certain estimates by management that may differ from actual.
Taxes: It is the Fund’s policy to meet the requirements of the Internal Revenue Code applicable to regulated investment companies and to distribute all of its taxable net investment income and capital gains, if any, to its shareholders. Therefore, no federal income tax provision is required. Withholding taxes on foreign dividends, interest and capital gains, if any, are recorded, net of reclaimable amounts, at the time the related income is earned.
| | | | |
| Prudential QMA Emerging Markets Equity Fund | | | 31 | |
Notes to Financial Statements (continued)
Dividends and Distributions: The Fund expects to pay dividends from net investment income and distributions from net realized capital gains, if any, annually. Dividends and distributions to shareholders, which are determined in accordance with federal income tax regulations and which may differ from generally accepted accounting principles, are recorded on the ex-date. Permanent book/tax differences relating to income and gain (loss) are reclassified amongst undistributed net investment income, accumulated net realized gain (loss) and paid-in capital in excess of par, as appropriate.
Estimates: The preparation of financial statements requires management to make estimates and assumptions that affect the reported amounts and disclosures in the financial statements. Actual results could differ from those estimates.
2. Agreements
PIP2, on behalf of the Fund, has a management agreement with PGIM Investments. Pursuant to this agreement, PGIM Investments has responsibility for all investment advisory services and supervises the subadviser’s performance of such services. PGIM Investments has entered into a subadvisory agreement with Quantitative Management Associates LLC (“QMA”). The subadvisory agreement provides that QMA will furnish investment advisory services in connection with the management of the Fund. In connection therewith, QMA is obligated to keep certain books and records of the Fund. PGIM Investments pays for the services of QMA, the cost of compensation of officers of the Fund, occupancy and certain clerical and bookkeeping costs of the Fund. The Fund bears all other costs and expenses.
The management fee paid to PGIM Investments is accrued daily and payable monthly at an annual rate of .75% of the Fund’s average daily net assets. The effective management fee rate, net of waivers and/or expense reimbursement was .21% for the period ended October 31, 2017.
Effective December 1, 2016, PGIM Investments has contractually agreed through February 28, 2019 to limit the net annual operating expenses (exclusive of distribution and service (12b-1) fees, taxes (such as income and foreign withholdings taxes, stamp duty and deferred tax expenses), interest, underlying funds, brokerage, extraordinary and certain other expenses such as dividend, broker charges and interest expense on short sales) of the Fund to 1.20% of the Fund’s average daily net assets. Expenses waived/reimbursed by the Manager in accordance with this agreement may be recouped by the Manager within the same fiscal year during which such waiver/reimbursement is made if such recoupment can be realized without exceeding the expense limit in effect at the time of the recoupment for that fiscal year.
PIP2, on behalf of the Funds, has a distribution agreement with Prudential Investment Management Services LLC (“PIMS”), which acts as the distributor of the Class Q shares of the Fund. No distribution or service fees are paid to PIMS as distributor for Class Q shares of the Fund.
PGIM Investments, PIMS and QMA are indirect, wholly-owned subsidiaries of Prudential Financial, Inc. (“Prudential”).
3. Other Transactions with Affiliates
Prudential Mutual Fund Services LLC (“PMFS”), an affiliate of PGIM Investments and an indirect, wholly-owned subsidiary of Prudential, serves as the Fund’s transfer agent. Transfer agent’s fees and expenses in the Statement of Operations include certain out-of-pocket expenses paid to non-affiliates, where applicable.
The Fund may enter into certain securities purchase or sale transactions under Board approved Rule 17a-7 procedures. Rule 17a-7 is an exemptive rule under the 1940 Act, that permits purchase and sale transactions among affiliated investment companies, or between an investment company and a person that is affiliated solely by reason of having a common (or affiliated) investment adviser, common directors, and/or common officers. Such transactions are subject to ratification by the Board. For the reporting period ended October 31, 2017 no such transactions were entered into by the Fund.
The Fund may invest its overnight sweep cash in the Prudential Core Ultra Short Bond Fund (the “Core Fund”), and its securities lending cash collateral in the Prudential Institutional Money Market Fund (the “Money Market Fund”), each a series of Prudential Investment Portfolios 2, registered under the 1940 Act and managed by PGIM Investments. For the reporting period ended October 31, 2017, PGIM, Inc. was compensated $579 by PGIM Investments for managing the Fund’s securities lending cash collateral as subadviser to the Money Market Fund. Earnings from the Core Fund and Money Market Fund are disclosed on the Statement of Operations as “Affiliated dividend income” and “Income from securities lending, net”, respectively.
4. Portfolio Securities
The aggregate cost of purchases and proceeds from sales of portfolio securities (excluding short-term investments and U.S. Government securities) for the period ended October 31, 2017, were $45,378,432 and $23,363,145, respectively.
5. Distributions and Tax Information
Distributions to shareholders, which are determined in accordance with federal income tax regulations and which may differ from generally accepted accounting principles, are recorded on the ex-date. In order to present undistributed net investment income, accumulated net realized gain on investment and foreign currency transactions and paid-in
| | | | |
| Prudential QMA Emerging Markets Equity Fund | | | 33 | |
Notes to Financial Statements (continued)
capital in excess of par on the Statement of Assets and Liabilities that more closely represent their tax character, certain adjustments have been made to undistributed net investment income and accumulated net realized gain on investment and foreign currency transactions. For the period ended October 31, 2017 the adjustments were to increase undistributed net investment income and decrease accumulated net realized gain on investment and foreign currency transactions by $41,199 due to differences in the treatment for book and tax purposes of certain transactions involving foreign securities and passive foreign investment companies. Net investment income, net realized gain (loss) on investments and foreign currency transactions and net assets were not affected by this change.
For the period ended October 31, 2017, the tax character of dividends paid by the fund was $72,647 of ordinary income.
As of October 31, 2017, the accumulated undistributed earnings on a tax basis was $1,808,944 of ordinary income.
The United States federal income tax basis of the Fund’s investments and the net unrealized appreciation as of October 31, 2017 were as follows:
| | | | | | |
Tax Basis | | Gross
Unrealized
Appreciation | | Gross
Unrealized
Depreciation | | Net
Unrealized
Appreciation |
| $24,176,709 | | $5,119,669 | | $(336,848) | | $4,782,821 |
The differences between book basis and tax basis were primarily attributable to deferred losses on wash sales and other cost basis differences between financial and tax accounting.
Management has analyzed the Fund’s tax positions taken and has concluded that no provision for income tax is required in the Fund’s financial statements for the current reporting period. The Fund’s federal excise tax returns for tax years for which the applicable statues of limitations have not expired are subject to examination by the Internal Revenue Service and state departments of revenue.
6. Capital
The Fund offers Class Q shares. Effective as of May 22, 2017, shares of the Fund are registered under the Securities Act of 1933, as amended.
PIP2 has authorized an unlimited number of shares of beneficial interest at $.001 par value per share.
As of October 31, 2017, Prudential through its affiliate entities, including affiliated funds, owned 2,154,600 Class Q shares of the Fund, which represents 93% of the Fund’s outstanding shares on behalf of multiple beneficial owners.
Transactions in shares of beneficial interest were as follows:
| | | | | | | | |
Class Q | | Shares | | | Amount | |
Period* ended October 31, 2017: | |
Shares sold | | | 2,178,550 | | | $ | 22,189,446 | |
Shares issued in reinvestment of dividends and distributions | | | 7,286 | | | | 72,647 | |
Shares reacquired | | | (30,009 | ) | | | (383,972 | ) |
| | | | | | | | |
Net increase (decrease) in shares outstanding | | | 2,155,827 | | | $ | 21,878,121 | |
| | | | | | | | |
| * | Commencement of operations was November 29, 2016. |
7. Borrowings
PIP2, along with other affiliated registered investment companies (the “Funds”), is a party to a Syndicated Credit Agreement (“SCA”) with a group of banks. The purpose of the SCA is to provide an alternative source of temporary funding for capital share redemptions. The SCA provides for a commitment of $900 million for the period October 5, 2017 through October 4, 2018. The Funds pay an annualized commitment fee of .15% of the unused portion of the SCA. Each Fund’s portion of the commitment fee for the unused amount, allocated based upon a method approved by the Board, is accrued daily and paid quarterly. Prior to October 5, 2017, the Funds had another SCA that provided a commitment of $900 million and the Funds paid an annualized commitment fee of .15% of the unused portion of the SCA. The interest on borrowings under the SCAs is paid monthly and at a per annum interest rate based upon a contractual spread plus the higher of (1) the effective federal funds rate, (2) the 1-month LIBOR rate or (3) zero percent.
Other affiliated registered investment companies that are parties to the SCA include portfolios that are subject to a predetermined mathematical formula used to manage certain benefit guarantees offered under variable annuity contracts. The formula may result in large scale asset flows into and out of these portfolios. Consequently, these portfolios may be more likely to utilize the SCA for purposes of funding redemptions. It may be possible for those portfolios to fully exhaust the committed amount of the SCA, thereby requiring the Manager to allocate available funding per a Board-approved methodology designed to treat the Funds in the SCA equitably.
The Fund did not utilize the SCA during the reporting period ended October 31, 2017.
| | | | |
| Prudential QMA Emerging Markets Equity Fund | | | 35 | |
Financial Highlights
| | | | |
| Class Q Shares | |
| | | November 29,
2016(a)
through
October 31,
2017 | |
| Per Share Operating Performance(b): | | | | |
| Net Asset Value, Beginning of Period | | | $10.00 | |
| Income (loss) from investment operations: | | | | |
| Net investment income (loss) | | | .16 | |
| Net realized and unrealized gain (loss) on investments | | | 3.09 | |
| Total from investment operations | | | 3.25 | |
| Less Dividends: | | | | |
| Dividends from net investment income | | | (.04 | ) |
| Net asset value, end of period | | | $13.21 | |
| Total Return(c): | | | 32.58% | |
| | | | |
| Ratios/Supplemental Data: | |
| Net assets, end of period (000) | | | $28,470 | |
| Average net assets (000) | | | $24,017 | |
| Ratios to average net assets(d): | | | | |
| Expense after waivers and/or expense reimbursement | | | 1.20% | (e) |
| Expense before waivers and/or expense reimbursement | | | 1.74% | (e) |
| Net investment income (loss) | | | 1.49% | (e) |
| Portfolio turnover rate | | | 102% | (f) |
| (a) | Commencement of operations. |
| (b) | Calculated based on average shares outstanding during the period. |
| (c) | Total return is calculated assuming a purchase of a share on the first day and a sale on the last day of each period reported and includes reinvestment of dividends and distributions, if any. Total returns may reflect adjustments to conform to generally accepted accounting principles. Total returns for periods less than one full year are not annualized. |
| (d) | Does not include expenses of the underlying funds in which the Fund invests. |
See Notes to Financial Statements.
Report of Independent Registered Public Accounting Firm
The Board of Trustees and Shareholders
Prudential Investment Portfolios 2:
We have audited the accompanying statement of assets and liabilities of Prudential QMA Emerging Markets Equity Fund (the “Fund”), a series of Prudential Investment Portfolios 2, including the portfolio of investments, as of October 31, 2017, and the related statements of operations, changes in net assets, and the financial highlights for the period from November 29, 2016 (commencement of operations) through October 31, 2017. These financial statements and financial highlights are the responsibility of the Fund’s management. Our responsibility is to express an opinion on these financial statements and financial highlights based on our audit.
We conducted our audit in accordance with the standards of the Public Company Accounting Oversight Board (United States). Those standards require that we plan and perform the audit to obtain reasonable assurance about whether the financial statements and financial highlights are free of material misstatement. An audit includes examining, on a test basis, evidence supporting the amounts and disclosures in the financial statements. Our procedures included confirmation of securities owned as of October 31, 2017, by correspondence with the custodian, transfer agent and brokers or by other appropriate auditing procedures when replies from brokers were not received. An audit also includes assessing the accounting principles used and significant estimates made by management, as well as evaluating the overall financial statement presentation. We believe that our audit provides a reasonable basis for our opinion.
In our opinion, the financial statements and financial highlights referred to above present fairly, in all material respects, the financial position of the Fund as of October 31, 2017, and the results of its operations, the changes in its net assets, and the financial highlights for the period described in the first paragraph, in conformity with U.S. generally accepted accounting principles.

New York, New York
December 15, 2017
| | | | |
| Prudential QMA Emerging Markets Equity Fund | | | 37 | |
Federal Income Tax Information (unaudited)
For the period ended October 31, 2017, the Fund reports the maximum amount allowable, but not less than 20.53% of the ordinary income dividends paid during the period as qualified dividend income in accordance with Section 854 of the Internal Revenue Code.
For the period ended October 31, 2017, the Fund made an election to pass through the maximum amount of the portion of the ordinary income dividends paid derived from foreign source income as well as any foreign taxes paid by the Fund in accordance with Section 853 of the Internal Revenue Code of the following amounts: $79,730 foreign tax credit from recognized foreign source income of $698,503.
In January 2018, you will be advised on IRS Form 1099-DIV or substitute 1099-DIV as to the federal tax status of the dividends received by you in calendar year 2017.
INFORMATION ABOUT BOARD MEMBERS AND OFFICERS
(Unaudited)
Information about Board Members and Officers of the Fund is set forth below. Board Members who are not deemed to be “interested persons” of the Fund, as defined in the 1940 Act, are referred to as “Independent Board Members.” Board Members who are deemed to be “interested persons” of the Fund are referred to as “Interested Board Members.” The Board Members are responsible for the overall supervision of the operations of the Fund and perform the various duties imposed on the directors of investment companies by the 1940 Act. The Board in turn elects the Officers, who are responsible for administering the day-to-day operations of the Fund.
| | | | |
| Independent Board Members(1) |
| | | |
Name, Address, Age
Position(s)
Portfolios Overseen | | Principal Occupation(s) During Past Five Years | | Other Directorships Held During Past Five Years |
Ellen S. Alberding (59) Board Member Portfolios Overseen: 89 | | President and Board Member, The Joyce Foundation (charitable foundation) (since 2002); Vice Chair, City Colleges of Chicago (community college system) (since 2011); Trustee, Skills for America’s Future (national initiative to connect employers to community colleges) (since 2011); Trustee, National Park Foundation (charitable foundation for national park system) (since 2009); Trustee, Economic Club of Chicago (since 2009). | | None. |
Kevin J. Bannon (65) Board Member Portfolios Overseen: 89 | | Retired; Managing Director (April 2008-May 2015) and Chief Investment Officer (October 2008-November 2013) of Highmount Capital LLC (registered investment adviser); formerly Executive Vice President and Chief Investment Officer (April 1993-August 2007) of Bank of New York Company; President (May 2003-May 2007) of BNY Hamilton Family of Mutual Funds. | | Director of Urstadt Biddle Properties (equity real estate investment trust) (since September 2008). |
Linda W. Bynoe (65) Board Member Portfolios Overseen: 89 | | President and Chief Executive Officer (since March 1995) and formerly Chief Operating Officer (December 1989-February 1995) of Telemat Ltd. (management consulting); formerly Vice President (January 1985-June 1989) at Morgan Stanley & Co. (broker-dealer). | | Director of Simon Property Group, Inc. (retail real estate) (May 2003-May 2012); Director of Anixter International, Inc. (communication products distributor) (since January 2006); Director of Northern Trust Corporation (financial services) (since April 2006); Trustee of Equity Residential (residential real estate) (since December 2009). |
Prudential QMA Emerging Markets Equity Fund
| | | | |
| Independent Board Members(1) |
| | | |
Name, Address, Age
Position(s)
Portfolios Overseen | | Principal Occupation(s) During Past Five Years | | Other Directorships Held During Past Five Years |
Barry H. Evans (57)± Board Member Portfolios Overseen: 89 | | Retired; Formerly President (2005-2016), Global Chief Operating Officer (2014-2016), Chief Investment Officer-Global Head of Fixed Income (1998-2014), and various portfolio manager roles (1986-2006), Manulife Asset Management U.S. | | Director, Manulife Trust Company (2011-present); Director, Manulife Asset Management Limited (2015-present); Formerly Chairman of the Board of Directors of Manulife Asset Management U.S. (2005-2016); Formerly Chairman of the Board, Declaration Investment Management and Research (2008-2016). |
Keith F. Hartstein (61) Board Member & Independent Chair Portfolios Overseen: 89 | | Retired; Member (since November 2014) of the Governing Council of the Independent Directors Council (organization of independent mutual fund directors); formerly President and Chief Executive Officer (2005-2012), Senior Vice President (2004-2005), Senior Vice President of Sales and Marketing (1997-2004), and various executive management positions (1990-1997), John Hancock Funds, LLC (asset management); Chairman, Investment Company Institute’s Sales Force Marketing Committee (2003-2008). | | None. |
Laurie Simon Hodrick (55)± Board Member Portfolios Overseen: 89 | | A. Barton Hepburn Professor of Economics in the Faculty of Business, Columbia Business School (since 1996); Visiting Professor of Law and Rock Center for Corporate Governance Fellow, Stanford Law School (since 2015); Visiting Fellow, Hoover Institution, Stanford University (since 2015); Sole Member, ReidCourt LLC (since 2008) (a consulting firm); Formerly Managing Director, Global Head of Alternative Investment Strategies, Deutsche Bank (2006-2008); Formerly Director/Trustee, Merrill Lynch Investment Managers Funds (1999-2006). | | Independent Director, Corporate Capital Trust (since April 2017) (a business development company). |
Michael S. Hyland, CFA (72) Board Member Portfolios Overseen: 89 | | Retired (since February 2005); formerly Senior Managing Director (July 2001-February 2005) of Bear Stearns & Co, Inc.; Global Partner, INVESCO (1999-2001); Managing Director and President of Salomon Brothers Asset Management (1989-1999). | | None. |
Visit our website at pgiminvestments.com
| | | | |
| Independent Board Members(1) |
| | | |
Name, Address, Age
Position(s)
Portfolios Overseen | | Principal Occupation(s) During Past Five Years | | Other Directorships Held During Past Five Years |
Richard A. Redeker (74) Board Member & Independent Vice Chair9 Portfolios Overseen: 87 | | Retired Mutual Fund Senior Executive (47 years); Management Consultant; Director, Mutual Fund Directors Forum (since 2014); Independent Directors Council (organization of independent mutual fund directors)-Executive Committee, Chair of Policy Steering Committee, Governing Council. | | None. |
Stephen G. Stoneburn (74) Board Member Portfolios Overseen: 89 | | Chairman (since July 2011), President and Chief Executive Officer (since June 1996) of Frontline Medical Communications (publishing company); formerly President (June 1995-June 1996) of Argus Integrated Media, Inc.; Senior Vice President and Managing Director (January 1993-1995) of Cowles Business Media; Senior Vice President of Fairchild Publications, Inc. (1975-1989). | | None. |
± Mr. Evans and Ms. Hodrick joined the Board effective as of September 1, 2017.
| | | | |
| Interested Board Members(1) |
| | | |
Name, Address, Age
Position(s)
Portfolios Overseen | | Principal Occupation(s) During Past Five Years | | Other Directorships Held During Past Five Years |
Stuart S. Parker (55) Board Member & President Portfolios Overseen: 89 | | President of PGIM Investments LLC (formerly known as Prudential Investments LLC) (since January 2012); Executive Vice President of Prudential Investment Management Services LLC (since December 2012); Executive Vice President of Jennison Associates LLC and Head of Retail Distribution of PGIM Investments LLC (June 2005-December 2011). | | None. |
Prudential QMA Emerging Markets Equity Fund
| | | | |
| Interested Board Members(1) |
| | | |
Name, Address, Age
Position(s)
Portfolios Overseen | | Principal Occupation(s) During Past Five Years | | Other Directorships Held During Past Five Years |
Scott E. Benjamin (44) Board Member & Vice President Portfolios Overseen: 89 | | Executive Vice President (since June 2009) of PGIM Investments LLC; Executive Vice President (June 2009-June 2012) and Vice President (since June 2012) of Prudential Investment Management Services LLC; Executive Vice President (since September 2009) of AST Investment Services, Inc.; Senior Vice President of Product Development and Marketing, PGIM Investments (since February 2006); Vice President of Product Development and Product Management, Prudential Investments (2003-2006). | | None. |
Grace C. Torres* (58) Board Member Portfolios Overseen: 88 | | Retired; formerly Treasurer and Principal Financial and Accounting Officer of the Prudential Funds, Target Funds, Advanced Series Trust, Prudential Variable Contract Accounts and The Prudential Series Fund (1998-June 2014); Assistant Treasurer (March 1999-June 2014) and Senior Vice President (September 1999-June 2014) of PGIM Investments LLC; Assistant Treasurer (May 2003-June 2014) and Vice President (June 2005-June 2014) of AST Investment Services, Inc.; Senior Vice President and Assistant Treasurer (May 2003-June 2014) of Prudential Annuities Advisory Services, Inc. | | Director (since July 2015) of Sun Bancorp, Inc. N.A. and Sun National Bank |
* Note: Prior to her retirement in 2014, Ms. Torres was employed by PGIM Investments LLC. Due to her prior employment, she is considered to be an “interested person” under the 1940 Act. Ms. Torres is a Non-Management Interested Board Member.
(1) The year that each Board Member joined the Fund’s Board is as follows:
Ellen S. Alberding, 2013; Kevin J. Bannon, 2008; Linda W. Bynoe, 2005; Barry H. Evans, 2017; Keith F. Hartstein, 2013; Laurie Simon Hodrick, 2017; Michael S. Hyland, 2008; Richard A. Redeker, 2003; Stephen G. Stoneburn, 1999; Grace C. Torres, 2014; Stuart S. Parker, Board Member and President since 2012; Scott E. Benjamin, Board Member since 2010 and Vice President since 2009.
Visit our website at pgiminvestments.com
| | | | |
| Fund Officers(a) |
| | | |
Name, Address and Age
Position with Fund | | Principal Occupation(s) During Past Five Years | | Length of
Service as Fund
Officer |
Raymond A. O’Hara (62) Chief Legal Officer | | Vice President and Corporate Counsel (since July 2010) of Prudential Insurance Company of America (Prudential); Vice President (March 2011-Present) of Pruco Life Insurance Company and Pruco Life Insurance Company of New Jersey; Vice President and Corporate Counsel (March 2011-Present) of Prudential Annuities Life Assurance Corporation; Chief Legal Officer of PGIM Investments LLC (since June 2012); Chief Legal Officer of Prudential Mutual Fund Services LLC (since June 2012) and Corporate Counsel of AST Investment Services, Inc. (since June 2012); formerly Assistant Vice President and Corporate Counsel (September 2008-July 2010) of The Hartford Financial Services Group, Inc.; formerly Associate (September 1980-December 1987) and Partner (January 1988-August 2008) of Blazzard & Hasenauer, P.C. (formerly, Blazzard, Grodd & Hasenauer, P.C.). | | Since 2012 |
Chad A. Earnst (42) Chief Compliance Officer | | Chief Compliance Officer (September 2014-Present) of PGIM Investments LLC; Chief Compliance Officer (September 2014-Present) of the Prudential Funds, Target Funds, Advanced Series Trust, The Prudential Series Fund, Prudential’s Gibraltar Fund, Inc., Prudential Global Short Duration High Yield Income Fund, Inc., Prudential Short Duration High Yield Fund, Inc. and Prudential Jennison MLP Income Fund, Inc.; formerly Assistant Director (March 2010-August 2014) of the Asset Management Unit, Division of Enforcement, US Securities & Exchange Commission; Assistant Regional Director (January 2010-August 2014), Branch Chief (June 2006-December 2009) and Senior Counsel (April 2003-May 2006) of the Miami Regional Office, Division of Enforcement, US Securities & Exchange Commission. | | Since 2014 |
Deborah A. Docs (59) Secretary | | Vice President and Corporate Counsel (since January 2001) of Prudential; Vice President (since December 1996) and Assistant Secretary (since March 1999) of PGIM Investments LLC; formerly Vice President and Assistant Secretary (May 2003-June 2005) of AST Investment Services, Inc. | | Since 2004 |
Jonathan D. Shain (59) Assistant Secretary | | Vice President and Corporate Counsel (since August 1998) of Prudential; Vice President and Assistant Secretary (since May 2001) of PGIM Investments LLC; Vice President and Assistant Secretary (since February 2001) of Prudential Mutual Fund Services LLC; formerly Vice President and Assistant Secretary (May 2003-June 2005) of AST Investment Services, Inc. | | Since 2005 |
Claudia DiGiacomo (43) Assistant Secretary | | Vice President and Corporate Counsel (since January 2005) of Prudential; Vice President and Assistant Secretary of PGIM Investments LLC (since December 2005); Associate at Sidley Austin Brown & Wood LLP (1999-2004). | | Since 2005 |
Prudential QMA Emerging Markets Equity Fund
| | | | |
| Fund Officers(a) |
| | | |
Name, Address and Age
Position with Fund | | Principal Occupation(s) During Past Five Years | | Length of
Service as Fund
Officer |
Andrew R. French (54) Assistant Secretary | | Vice President and Corporate Counsel (since February 2010) of Prudential; formerly Director and Corporate Counsel (2006-2010) of Prudential; Vice President and Assistant Secretary (since January 2007) of PGIM Investments LLC; Vice President and Assistant Secretary (since January 2007) of Prudential Mutual Fund Services LLC. | | Since 2006 |
Charles H. Smith (44) Anti-Money Laundering Compliance Officer | | Vice President, Corporate Compliance, Anti-Money Laundering Unit (since January 2015) of Prudential; committee member of the American Council of Life Insurers Anti-Money Laundering and Critical Infrastructure Committee (since January 2016); formerly Global Head of Economic Sanctions Compliance at AIG Property Casualty (February 2007-December 2014); Assistant Attorney General at the New York State Attorney General’s Office, Division of Public Advocacy. (August 1998-January 2007). | | Since 2016 |
M. Sadiq Peshimam (53) Treasurer and Principal
Financial
and Accounting Officer | | Vice President (since 2005) of PGIM Investments LLC; formerly Assistant Treasurer of funds in the Prudential Mutual Fund Complex (2006-2014). | | Since 2006 |
Peter Parrella (59) Assistant Treasurer | | Vice President (since 2007) and Director (2004-2007) within Prudential Mutual Fund Administration; formerly Tax Manager at SSB Citi Fund Management LLC (1997-2004). | | Since 2007 |
Lana Lomuti (50) Assistant Treasurer | | Vice President (since 2007) and Director (2005-2007), within Prudential Mutual Fund Administration; formerly Assistant Treasurer (December 2007-February 2014) of The Greater China Fund, Inc. | | Since 2014 |
Linda McMullin (56) Assistant Treasurer | | Vice President (since 2011) and Director (2008-2011) within Prudential Mutual Fund Administration. | | Since 2014 |
Kelly A. Coyne (49) Assistant Treasurer | | Director, Investment Operations of Prudential Mutual Fund Services LLC (since 2010). | | Since 2015 |
(a) Excludes Mr. Parker and Mr. Benjamin, interested Board Members who also serve as President and Vice President, respectively.
Explanatory Notes to Tables:
| ∎ | | Board Members are deemed to be “Interested,” as defined in the 1940 Act, by reason of their affiliation with PGIM Investments LLC and/or an affiliate of PGIM Investments LLC. |
| ∎ | | Unless otherwise noted, the address of all Board Members and Officers is c/o PGIM Investments LLC, 655 Broad Street, Newark, New Jersey 07102-4410. |
| ∎ | | There is no set term of office for Board Members or Officers. The Board Members have adopted a retirement policy, which calls for the retirement of Board Members on December 31 of the year in which they reach the age of 75. |
| ∎ | | “Other Directorships Held” includes only directorships of companies required to register or file reports with the SEC under the 1934 Act (that is, “public companies”) or other investment companies registered under the 1940 Act. |
| ∎ | | “Portfolios Overseen” includes all investment companies managed by PGIM Investments LLC. The investment companies for which PGIM Investments LLC serves as manager include the Prudential Mutual Funds, The Prudential Variable Contract Accounts, Target Mutual Funds, Prudential Short Duration High Yield Fund, Inc., Prudential Global Short Duration High Yield Fund, Inc., The Prudential Series Fund, Prudential’s Gibraltar Fund, Inc. and the Advanced Series Trust. |
Visit our website at pgiminvestments.com
| | | | |
| ∎ MAIL | | ∎ TELEPHONE | | ∎ WEBSITE |
655 Broad Street Newark, NJ 07102 | | (800) 225-1852 | | www.pgiminvestments.com |
|
| PROXY VOTING |
| The Board of Trustees of the Fund has delegated to the Fund’s investment subadviser the responsibility for voting any proxies and maintaining proxy recordkeeping with respect to the Fund. A description of these proxy voting policies and procedures is available without charge, upon request, by calling (800) 225-1852. Information regarding how the Fund voted proxies relating to portfolio securities during the most recent 12-month period ended June 30 will be available on the Fund’s website and on the Securities and Exchange Commission’s website at the end of August. |
|
| DIRECTORS |
| Ellen S. Alberding • Kevin J. Bannon • Scott E. Benjamin • Linda W. Bynoe • Barry H. Evans • Keith F. Hartstein • Laurie Simon Hodrick • Michael S. Hyland • Stuart S. Parker • Richard A. Redeker • Stephen G. Stoneburn • Grace C. Torres |
|
| OFFICERS |
| Stuart S. Parker, President • Scott E. Benjamin, Vice President • M. Sadiq Peshimam, Treasurer and Principal Financial and Accounting Officer • Raymond A. O’Hara, Chief Legal Officer • Deborah A. Docs, Secretary • Chad A. Earnst, Chief Compliance Officer • Charles H. Smith, Anti-Money Laundering Compliance Officer • Jonathan D. Shain, Assistant Secretary • Claudia DiGiacomo, Assistant Secretary • Andrew R. French, Assistant Secretary • Peter Parrella, Assistant Treasurer • Lana Lomuti, Assistant Treasurer • Linda McMullin, Assistant Treasurer • Kelly A. Coyne, Assistant Treasurer |
| | | | |
| MANAGER | | PGIM Investments LLC | | 655 Broad Street
Newark, NJ 07102 |
|
| INVESTMENT SUBADVISER | | Quantitative Management Associates LLC | | Gateway Center Two
100 Mulberry Street
Newark, NJ 07102 |
|
| DISTRIBUTOR | | Prudential Investment
Management Services LLC | | 655 Broad Street
Newark, NJ 07102 |
|
| CUSTODIAN | | The Bank of New York Mellon | | 225 Liberty Street
New York, NY 10286 |
|
| TRANSFER AGENT | | Prudential Mutual Fund
Services LLC | | PO Box 9658
Providence, RI 02940 |
|
| INDEPENDENT REGISTERED PUBLIC ACCOUNTING FIRM | | KPMG LLP | | 345 Park Avenue New York, NY 10154 |
|
| FUND COUNSEL | | Willkie Farr & Gallagher LLP | | 787 Seventh Avenue
New York, NY 10019 |
|
|
| An investor should consider the investment objectives, risks, charges, and expenses of the Fund carefully before investing. The prospectus and summary prospectus contains this and other information about the Fund. An investor may obtain a prospectus and summary prospectus by visiting our website at www.pgiminvestments.com or by calling (800) 225-1852. The prospectus and summary prospectus should be read carefully before investing. |
|
| SHAREHOLDER COMMUNICATIONS WITH DIRECTORS |
| Shareholders can communicate directly with the Board of Trustees by writing to the Chair of the Board, Prudential QMA Emerging Markets Equity Fund, PGIM Investments, Attn: Board of Trustees, 655 Broad Street, Newark, NJ 07102. Shareholders can communicate directly with an individual Trustee by writing to the same address. Communications are not screened before being delivered to the addressee. |
|
| AVAILABILITY OF PORTFOLIO SCHEDULE |
| The Fund files its complete schedule of portfolio holdings with the Securities and Exchange Commission for the first and third quarters of each fiscal year on Form N-Q. The Fund’s Forms N-Q are available on the Commission’s website at www.sec.gov. The Fund’s Forms N-Q may also be reviewed and copied at the Commission’s Public Reference Room in Washington, D.C. Information on the operation and location of the Public Reference Room may be obtained by calling 1-800-SEC-0330. |
Mutual Funds:
| | | | |
ARE NOT INSURED BY THE FDIC OR ANY
FEDERAL GOVERNMENT AGENCY | | MAY LOSE VALUE | | ARE NOT A DEPOSIT OF OR GUARANTEED
BY ANY BANK OR ANY BANK AFFILIATE |
PRUDENTIAL QMA EMERGING MARKETS EQUITY FUND
| | |
| SHARE CLASS | | Q |
| NASDAQ | | PQEMX |
| CUSIP | | 74440E706 |

PRUDENTIAL QMA INTERNATIONAL DEVELOPED MARKETS INDEX FUND
ANNUAL REPORT
OCTOBER 31, 2017

|
Objective: To provide investment results that approximate the performance of
the Russell Developed Ex-North America Large Cap Index. |
Highlights
| • | | The Fund closely tracked the performance of the Russell Developed Ex North America Large-Cap Index (the Index) over the year to date, ended October 31, 2017. |
| • | | The Fund holds almost all stocks included in the Index in approximately the same proportions. |
This report is not authorized for distribution to prospective investors unless preceded or accompanied by a current prospectus.
The views expressed in this report and information about the Fund’s portfolio holdings are for the period covered by this report and are subject to change thereafter.
Mutual funds are distributed by Prudential Investment Management Services LLC, a Prudential Financial company and member SIPC. QMA is the primary business name of Quantitative Management Associates LLC, a wholly owned subsidiary of PGIM, Inc. (PGIM), a Prudential Financial company. © 2017 Prudential Financial, Inc. and its related entities. PGIM and the PGIM logo are service marks of Prudential Financial, Inc. and its related entities, registered in many jurisdictions worldwide.
| | |
| 2 | | Visit our website at pgiminvestments.com |
PRUDENTIAL FUNDS — UPDATE
The Board of Directors/Trustees for the Fund has approved renaming the Fund’s Class Q shares as Class R6 shares, effective on or about June 15, 2018. The renaming of Class Q shares as Class R6 shares will not result in any changes to pricing, eligibility, or shareholder rights and obligations. The renamed Class R6 shares will not be exchangeable with Class R6 shares of the Prudential Day One Funds or the Prudential 60/40 Allocation Fund.
LR993
| | | | |
| Prudential QMA International Developed Markets Index Fund | | | 3 | |
Your Fund’s Performance (unaudited)
Performance data quoted represents past performance. Past performance does not guarantee future results. The investment return and principal value of an investment will fluctuate, so that an investor’s shares, when redeemed, may be worth more or less than their original cost. Current performance may be lower or higher than the past performance data quoted.
| | |
| | | Total Returns as of 10/31/17 |
| | | Since Inception* (%) |
| Class Q | | 25.61 (11/17/16) |
| Russell Developed Ex-North America Large Cap Index | | 26.93 |
| Lipper International Large-Cap Core Funds Average** | | 24.88 |
| Lipper International Multi-Cap Core Funds Average** | | 25.66 |
*Not annualized
**The Fund is compared to the Lipper International Large-Cap Core performance universe, although Lipper classifies the Fund in the Lipper International Multi-Cap Core Funds performance universe. The Lipper International Large-Cap Core performance universe is utilized because the Fund’s manager believes that the funds included in this universe provide a more appropriate basis for Fund performance comparisons.
| | |
| 4 | | Visit our website at pgiminvestments.com |
Growth of a $10,000 Investment
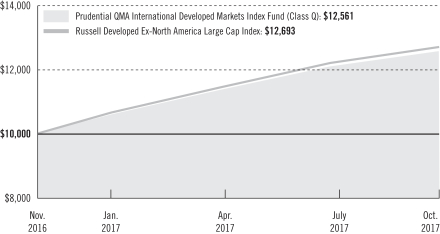
The graph compares a $10,000 investment in the Fund’s Class Q shares with a similar investment in the Russell Developed Ex-North America Large Cap Index by portraying the initial account values at the commencement of operations of Class Q shares (November 17, 2016) and the account values at the end of the current fiscal year (October 31, 2017), as measured on a quarterly basis. For purposes of the graph, and unless otherwise indicated, it has been assumed that (a) all recurring fees (including management fees) were deducted; and (b) all dividends and distributions were reinvested. The line graph provides information for Class Q shares only. Without waiver of fees and/or expense reimbursements, the returns would have been lower.
Past performance does not predict future performance. Total returns and the ending account values in the graph include changes in share price and reinvestment of dividends and capital gains distributions in a hypothetical investment for the periods shown. The Fund’s total returns do not reflect the deduction of income taxes on an individual’s investment. Taxes may reduce your actual investment returns on income or gains paid by the Fund or any gains you may realize if you sell your shares.
Source: PGIM Investments LLC and Lipper Inc.
The returns in the tables do not reflect the deduction of taxes that a shareholder would pay on Fund distributions or following the redemption of Fund shares. Since Inception returns for the index and the Lipper Averages are measured from the closest month-end to the Fund’s inception date.
| | | | |
| Prudential QMA International Developed Markets Index Fund | | | 5 | |
Your Fund’s Performance (unaudited)
Benchmark Definitions
Russell Developed Ex-North America Large Cap Index—The Russell Developed Ex-North America Large Cap Index measures the performance of the largest investable securities in developed countries globally, excluding companies assigned to the United States.
Lipper International Large-Cap Core Funds Average—The Lipper International Large-Cap Core Funds Average are funds that, by portfolio practice, invest at least 75% of their equity assets in companies strictly outside of the US with market capitalizations (on a three-year weighted basis) above Lipper’s international large-cap floor. International large-cap core funds typically have average characteristics compared to their large-cap-specific subset of the MSCI EAFE Index.
Lipper International Multi-Cap Core Funds Average—The Lipper International Multi-Cap Core Funds Average are funds that, by portfolio practice, invest in a variety of market capitalization ranges without concentrating 75% of their equity assets in any one market capitalization range over an extended period of time. International multi-cap core funds typically have average characteristics compared to the MSCI EAFE Index.
Investors cannot invest directly in an index or average. The returns for the Index would be lower if they included the effects of sales charges, operating expenses of a mutual fund, or taxes. Returns for the Lipper Averages reflect the deduction of operating expenses, but not sales charges or taxes.
Presentation of Fund Holdings
| | | | |
Five Largest Holdings expressed as a
percentage of net assets as of 10/31/17 (%) | |
| iShares MSCI EAFE ETF, Exchange Traded Funds | | | 2.1 | |
| Nestle SA, Food Products | | | 1.6 | |
| HSBC Holdings PLC, Banks | | | 1.2 | |
| Novartis AG, Pharmaceuticals | | | 1.2 | |
| Toyota Motor Corp., Automobiles | | | 1.0 | |
Holdings reflect only long-term investments and are subject to change.
| | | | |
Five Largest Industries expressed as a
percentage of net assets as of 10/31/17 (%) | |
| Banks | | | 11.2 | |
| Pharmaceuticals | | | 6.6 | |
| Insurance | | | 5.0 | |
| Oil, Gas & Consumable Fuels | | | 4.4 | |
| Chemicals | | | 3.6 | |
Industry weightings reflect only long-term investments and are subject to change.
| | |
| 6 | | Visit our website at pgiminvestments.com |
Strategy and Performance Overview
How did the Fund perform?
The Prudential QMA International Developed Markets Index Fund’s Class Q shares returned 25.61% for the period since the Fund’s inception on November 17, 2016, through October 31, 2017. During the same period, the Russell Developed Ex North America Large-Cap Index (the Index) gained 26.93%.
What was the market environment?
| • | | Equity returns were strong in the 12-month period ended October 31, 2017, as global gross domestic product advanced at a healthy pace, long-term interest rates remained close to historical lows, and central banks tightened monetary policy prudently and gradually in light of subdued inflation. |
| • | | In the US, solid economic fundamentals included stable and moderate economic expansion, robust employment, accelerating corporate profit growth, and accumulating cash on company balance sheets. |
| • | | North Korean missile activity, ongoing investigations into Russia’s interference in the 2016 election, and turnover in key administration positions contributed to uncertainty. |
| • | | Europe’s economic recovery proceeded, and emerging markets had their best performance since the aftermath of the financial crisis. Japan likewise showed healthier trends in economic activity. |
| • | | Most sectors advanced, with information technology, financials, materials, and industrials posting the largest gains, while returns in telecommunications services and consumer staples were more modest. |
| • | | Likewise, all regions were positive, with developed Europe and emerging markets leading the others. |
How was the Fund managed?
| • | | The Fund closely tracked the performance of the Index over the year to date ended October 31, 2017. |
| • | | The Fund holds almost all stocks included in the Index in approximately the same proportions. |
Did the Fund use derivatives and how did they affect performance?
| • | | The Fund held several international stock index futures, including Topix Index Futures DJ Euro Stoxx Futures, FTSE 100 Futures and MSCI-EAFE Mini Futures. These derivatives were used to maintain exposure to equities and provide portfolio liquidity. Futures had minimal impact on performance over the year to date. |
| | | | |
| Prudential QMA International Developed Markets Index Fund | | | 7 | |
Fees and Expenses
As a shareholder of the Fund, you incur two types of costs: (1) transaction costs, including sales charges (loads) on purchase payments and redemptions, as applicable, and (2) ongoing costs, including management fees, distribution, and/or service (12b-1) fees, and other Fund expenses, as applicable. This example is intended to help you understand your ongoing costs (in dollars) of investing in the Fund and to compare these costs with the ongoing costs of investing in other mutual funds.
The example is based on an investment of $1,000 held through the six-month period ended October 31, 2017. The example is for illustrative purposes only; you should consult the Prospectus for information on initial and subsequent minimum investment requirements.
Actual Expenses
The first line for each share class in the table on the following page provides information about actual account values and actual expenses. You may use the information on this line, together with the amount you invested, to estimate the expenses that you paid over the period. Simply divide your account value by $1,000 (for example, an $8,600 account value ÷ $1,000 = 8.6), then multiply the result by the number on the first line under the heading “Expenses Paid During the Six-Month Period” to estimate the expenses you paid on your account during this period.
Hypothetical Example for Comparison Purposes
The second line for each share class in the table on the following page provides information about hypothetical account values and hypothetical expenses based on the Fund’s actual expense ratio and an assumed rate of return of 5% per year before expenses, which is not the Fund’s actual return. The hypothetical account values and expenses may not be used to estimate the actual ending account balance or expenses you paid for the period. You may use this information to compare the ongoing costs of investing in the Fund and other funds. To do so, compare this 5% hypothetical example with the 5% hypothetical examples that appear in the shareholder reports of the other funds.
The Fund’s transfer agent may charge additional fees to holders of certain accounts that are not included in the expenses shown in the table on the following page. These fees apply to individual retirement accounts (IRAs) and Section 403(b) accounts. As of the close of the six-month period covered by the table, IRA fees included an annual maintenance fee of $15 per account (subject to a maximum annual maintenance fee of $25 for all accounts held by the same shareholder). Section 403(b) accounts are charged an annual $25 fiduciary maintenance fee. Some of the fees may vary in amount, or may be waived, based on your total account balance or the number of Prudential funds, including the Fund, that you own. You should consider the additional fees that were charged to your Fund account over the six-month period when you estimate the total ongoing expenses paid over the
| | |
| 8 | | Visit our website at pgiminvestments.com |
period and the impact of these fees on your ending account value, as these additional expenses are not reflected in the information provided in the expense table. Additional fees have the effect of reducing investment returns.
Please note that the expenses shown in the table are meant to highlight your ongoing costs only and do not reflect any transactional costs such as sales charges (loads). Therefore, the second line for each share class in the table is useful in comparing ongoing costs only and will not help you determine the relative total costs of owning different funds. In addition, if these transactional costs were included, your costs would have been higher.
| | | | | | | | | | | | | | | | | | |
Prudential QMA
International
Developed Markets
Index Fund | | Beginning Account
Value
May 1, 2017 | | | Ending Account
Value
October 31, 2017 | | | Annualized
Expense Ratio
Based on the
Six-Month Period | | | Expenses Paid
During the
Six-Month Period* | |
| Class Q | | Actual | | $ | 1,000.00 | | | $ | 1,106.70 | | | | 0.30 | % | | $ | 1.59 | |
| | | Hypothetical | | $ | 1,000.00 | | | $ | 1,023.69 | | | | 0.30 | % | | $ | 1.53 | |
*Fund expenses (net of fee waivers or subsidies, if any) are equal to the annualized expense ratio (provided in the table), multiplied by the average account value over the period, multiplied by the 184 days in the six-month period ended October 31, 2017, and divided by the 365 days in the Fund’s fiscal year ended October 31, 2017. Expenses presented in the table include the expenses of any underlying funds in which the Fund may invest.
| | | | |
| Prudential QMA International Developed Markets Index Fund | | | 9 | |
Schedule of Investments
as of October 31, 2017
| | | | | | | | | | | | | | | | |
| Description | | | | | | | | Shares | | | Value | |
LONG-TERM INVESTMENTS 95.1% | |
|
COMMON STOCKS 92.4% | |
|
Australia 6.1% | |
Adelaide Brighton Ltd. | | | | | | | | | | | 719 | | | $ | 3,423 | |
AGL Energy Ltd. | | | | | | | | | | | 1,179 | | | | 22,827 | |
Alumina Ltd. | | | | | | | | | | | 4,633 | | | | 8,314 | |
Amcor Ltd. | | | | | | | | | | | 2,126 | | | | 25,802 | |
AMP Ltd. | | | | | | | | | | | 5,300 | | | | 20,198 | |
Ansell Ltd. | | | | | | | | | | | 270 | | | | 4,970 | |
APA Group | | | | | | | | | | | 2,010 | | | | 13,191 | |
Aristocrat Leisure Ltd. | | | | | | | | | | | 1,154 | | | | 20,862 | |
ASX Ltd. | | | | | | | | | | | 348 | | | | 14,399 | |
Aurizon Holdings Ltd. | | | | | | | | | | | 3,543 | | | | 14,061 | |
AusNet Services | | | | | | | | | | | 3,613 | | | | 4,899 | |
Australia & New Zealand Banking Group Ltd. | | | | | | | | | | | 5,342 | | | | 122,591 | |
Bank of Queensland Ltd. | | | | | | | | | | | 717 | | | | 7,340 | |
Bendigo & Adelaide Bank Ltd. | | | | | | | | | | | 853 | | | | 7,440 | |
BHP Billiton Ltd. | | | | | | | | | | | 5,854 | | | | 120,527 | |
BHP Billiton PLC | | | | | | | | | | | 3,819 | | | | 69,145 | |
Boral Ltd. | | | | | | | | | | | 2,023 | | | | 11,101 | |
Brambles Ltd. | | | | | | | | | | | 2,875 | | | | 20,847 | |
Caltex Australia Ltd. | | | | | | | | | | | 452 | | | | 11,868 | |
Challenger Ltd. | | | | | | | | | | | 995 | | | | 10,150 | |
CIMIC Group Ltd. | | | | | | | | | | | 185 | | | | 6,863 | |
Coca-Cola Amatil Ltd. | | | | | | | | | | | 1,004 | | | | 6,268 | |
Cochlear Ltd. | | | | | | | | | | | 102 | | | | 13,740 | |
Commonwealth Bank of Australia | | | | | | | | | | | 3,150 | | | | 187,379 | |
Computershare Ltd. | | | | | | | | | | | 868 | | | | 10,377 | |
Crown Resorts Ltd. | | | | | | | | | | | 698 | | | | 6,207 | |
CSL Ltd. | | | | | | | | | | | 827 | | | | 88,044 | |
Dexus, REIT | | | | | | | | | | | 1,840 | | | | 13,778 | |
Domino’s Pizza Enterprises Ltd. | | | | | | | | | | | 128 | | | | 4,576 | |
Flight Centre Travel Group Ltd. | | | | | | | | | | | 89 | | | | 3,191 | |
Fortescue Metals Group Ltd. | | | | | | | | | | | 2,894 | | | | 10,290 | |
Goodman Group, REIT | | | | | | | | | | | 3,176 | | | | 20,364 | |
GPT Group (The), REIT | | | | | | | | | | | 3,286 | | | | 12,831 | |
Harvey Norman Holdings Ltd. | | | | | | | | | | | 910 | | | | 2,636 | |
Healthscope Ltd. | | | | | | | | | | | 3,349 | | | | 5,031 | |
Iluka Resources Ltd. | | | | | | | | | | | 800 | | | | 5,765 | |
Incitec Pivot Ltd. | | | | | | | | | | | 2,936 | | | | 8,612 | |
Insurance Australia Group Ltd. | | | | | | | | | | | 4,282 | | | | 21,532 | |
LendLease Group | | | | | | | | | | | 1,000 | | | | 12,418 | |
Link Administration Holdings Ltd. | | | | | | | | | | | 933 | | | | 5,892 | |
Macquarie Group Ltd. | | | | | | | | | | | 557 | | | | 42,020 | |
See Notes to Financial Statements.
| | | | |
| Prudential QMA International Developed Markets Index Fund | | | 11 | |
Schedule of Investments (continued)
as of October 31, 2017
| | | | | | | | | | | | | | | | |
| Description | | | | | | | | Shares | | | Value | |
COMMON STOCKS (Continued) | |
|
Australia (cont’d.) | |
Magellan Financial Group Ltd. | | | | | | | | | | | 210 | | | $ | 3,905 | |
Medibank Private Ltd. | | | | | | | | | | | 5,012 | | | | 11,797 | |
Mirvac Group, REIT | | | | | | | | | | | 6,412 | | | | 11,852 | |
National Australia Bank Ltd. | | | | | | | | | | | 4,872 | | | | 122,074 | |
Newcrest Mining Ltd. | | | | | | | | | | | 1,375 | | | | 23,509 | |
Orica Ltd. | | | | | | | | | | | 654 | | | | 10,475 | |
Origin Energy Ltd.* | | | | | | | | | | | 3,166 | | | | 19,283 | |
Platinum Asset Management Ltd. | | | | | | | | | | | 508 | | | | 2,839 | |
Qantas Airways Ltd. | | | | | | | | | | | 1,640 | | | | 7,740 | |
QBE Insurance Group Ltd. | | | | | | | | | | | 2,479 | | | | 20,327 | |
Ramsay Health Care Ltd. | | | | | | | | | | | 227 | | | | 11,638 | |
REA Group Ltd. | | | | | | | | | | | 92 | | | | 5,101 | |
Reece Ltd. | | | | | | | | | | | 188 | | | | 6,378 | |
Santos Ltd.* | | | | | | | | | | | 3,162 | | | | 10,926 | |
Scentre Group, REIT | | | | | | | | | | | 9,249 | | | | 28,519 | |
SEEK Ltd. | | | | | | | | | | | 594 | | | | 8,364 | |
Sonic Healthcare Ltd. | | | | | | | | | | | 742 | | | | 12,393 | |
South32 Ltd. | | | | | | | | | | | 9,442 | | | | 24,663 | |
Star Entertainment Group Ltd. (The) | | | | | | | | | | | 1,561 | | | | 6,883 | |
Stockland, REIT | | | | | | | | | | | 4,331 | | | | 15,011 | |
Suncorp Group Ltd. | | | | | | | | | | | 2,350 | | | | 24,461 | |
Sydney Airport | | | | | | | | | | | 1,920 | | | | 10,461 | |
Tabcorp Holdings Ltd. | | | | | | | | | | | 1,528 | | | | 5,258 | |
Tatts Group Ltd. | | | | | | | | | | | 2,443 | | | | 7,809 | |
Telstra Corp. Ltd. | | | | | | | | | | | 7,581 | | | | 20,575 | |
TPG Telecom Ltd. | | | | | | | | | | | 570 | | | | 2,359 | |
Transurban Group | | | | | | | | | | | 3,710 | | | | 34,488 | |
Treasury Wine Estates Ltd. | | | | | | | | | | | 1,396 | | | | 16,758 | |
Vicinity Centres, REIT | | | | | | | | | | | 5,999 | | | | 12,194 | |
Vocus Group Ltd. | | | | | | | | | | | 945 | | | | 2,087 | |
Washington H Soul Pattinson & Co. Ltd. | | | | | | | | | | | 193 | | | | 2,469 | |
Wesfarmers Ltd. | | | | | | | | | | | 2,047 | | | | 65,567 | |
Westfield Corp., REIT | | | | | | | | | | | 3,464 | | | | 20,646 | |
Westpac Banking Corp. | | | | | | | | | | | 6,175 | | | | 156,410 | |
Woodside Petroleum Ltd. | | | | | | | | | | | 1,318 | | | | 31,069 | |
Woolworths Ltd. | | | | | | | | | | | 2,344 | | | | 46,469 | |
| | | | | | | | | | | | | | | | |
| | | | | | | | | | | | | | | 1,844,526 | |
|
Austria 0.3% | |
ams AG* | | | | | | | | | | | 94 | | | | 8,576 | |
ANDRITZ AG | | | | | | | | | | | 125 | | | | 7,068 | |
Erste Group Bank AG* | | | | | | | | | | | 519 | | | | 22,278 | |
EVN AG | | | | | | | | | | | 51 | | | | 805 | |
See Notes to Financial Statements.
| | | | | | | | | | | | | | | | |
| Description | | | | | | | | Shares | | | Value | |
COMMON STOCKS (Continued) | |
|
Austria (cont’d.) | |
IMMOFINANZ AG* | | | | | | | | | | | 1,688 | | | $ | 4,266 | |
Mayr Melnhof Karton AG | | | | | | | | | | | 18 | | | | 2,613 | |
Oesterreichische Post AG | | | | | | | | | | | 54 | | | | 2,398 | |
OMV AG | | | | | | | | | | | 260 | | | | 15,604 | |
Raiffeisen Bank International AG* | | | | | | | | | | | 239 | | | | 8,312 | |
Strabag SE | | | | | | | | | | | 18 | | | | 752 | |
Telekom Austria AG* | | | | | | | | | | | 216 | | | | 2,022 | |
UNIQA Insurance Group AG | | | | | | | | | | | 231 | | | | 2,367 | |
Verbund AG | | | | | | | | | | | 85 | | | | 2,064 | |
Vienna Insurance Group AG Wiener Versicherung Gruppe | | | | | | | | | | | 69 | | | | 2,020 | |
voestalpine AG | | | | | | | | | | | 198 | | | | 10,886 | |
| | | | | | | | | | | | | | | | |
| | | | | | | | | | | | | | | 92,031 | |
|
Belgium 1.1% | |
Ackermans & Van Haaren NV | | | | | | | | | | | 42 | | | | 7,193 | |
Ageas | | | | | | | | | | | 347 | | | | 16,828 | |
Anheuser-Busch InBev SA/NV | | | | | | | | | | | 1,373 | | | | 168,359 | |
Bekaert SA | | | | | | | | | | | 55 | | | | 2,602 | |
bpost SA | | | | | | | | | | | 196 | | | | 5,526 | |
Cie d’Entreprises CFE | | | | | | | | | | | 12 | | | | 1,755 | |
Colruyt SA | | | | | | | | | | | 128 | | | | 6,547 | |
D’ieteren SA/NV | | | | | | | | | | | 42 | | | | 1,921 | |
Elia System Operator SA/NV | | | | | | | | | | | 51 | | | | 2,958 | |
Financiere de Tubize SA | | | | | | | | | | | 34 | | | | 2,389 | |
Galapagos NV* | | | | | | | | | | | 73 | | | | 7,099 | |
Groupe Bruxelles Lambert SA | | | | | | | | | | | 131 | | | | 14,070 | |
KBC Ancora | | | | | | | | | | | 56 | | | | 3,339 | |
KBC Group NV | | | | | | | | | | | 498 | | | | 41,368 | |
Proximus SADP | | | | | | | | | | | 249 | | | | 8,268 | |
Sofina SA | | | | | | | | | | | 31 | | | | 4,662 | |
Solvay SA | | | | | | | | | | | 126 | | | | 18,718 | |
Telenet Group Holding NV* | | | | | | | | | | | 84 | | | | 5,810 | |
UCB SA | | | | | | | | | | | 214 | | | | 15,578 | |
Umicore SA | | | | | | | | | | | 336 | | | | 15,016 | |
| | | | | | | | | | | | | | | | |
| | | | | | | | | | | | | | | 350,006 | |
|
Chile 0.0% | |
Antofagasta PLC | | | | | | | | | | | 639 | | | | 8,098 | |
|
China 0.3% | |
AAC Technologies Holdings, Inc. | | | | | | | | | | | 1,200 | | | | 22,005 | |
BOC Hong Kong Holdings Ltd. | | | | | | | | | | | 6,900 | | | | 32,880 | |
See Notes to Financial Statements.
| | | | |
| Prudential QMA International Developed Markets Index Fund | | | 13 | |
Schedule of Investments (continued)
as of October 31, 2017
| | | | | | | | | | | | | | | | |
| Description | | | | | | | | Shares | | | Value | |
COMMON STOCKS (Continued) | |
|
China (cont’d.) | |
China Mengniu Dairy Co. Ltd.* | | | | | | | | | | | 5,400 | | | $ | 14,964 | |
FIH Mobile Ltd. | | | | | | | | | | | 6,000 | | | | 1,884 | |
Guotai Junan International Holdings Ltd. | | | | | | | | | | | 6,000 | | | | 1,918 | |
Minth Group Ltd. | | | | | | | | | | | 500 | | | | 2,701 | |
Semiconductor Manufacturing International Corp.* | | | | | | | | | | | 5,000 | | | | 7,672 | |
Shui On Land Ltd. | | | | | | | | | | | 8,000 | | | | 1,981 | |
Tingyi Cayman Islands Holding Corp. | | | | | | | | | | | 2,600 | | | | 4,100 | |
Uni-President China Holdings Ltd. | | | | | | | | | | | 2,200 | | | | 1,840 | |
Want Want China Holdings Ltd. | | | | | | | | | | | 10,000 | | | | 8,187 | |
Xinyi Solar Holdings Ltd.* | | | | | | | | | | | 8,000 | | | | 2,771 | |
Yangzijiang Shipbuilding Holdings Ltd. | | | | | | | | | | | 3,400 | | | | 3,928 | |
| | | | | | | | | | | | | | | | |
| | | | | | | | | | | | | | | 106,831 | |
|
Colombia 0.0% | |
Millicom International Cellular SA, SDR | | | | | | | | | | | 182 | | | | 11,639 | |
|
Denmark 1.7% | |
AP Moller - Maersk A/S (Class A Stock) | | | | | | | | | | | 8 | | | | 14,828 | |
AP Moller - Maersk A/S (Class B Stock) | | | | | | | | | | | 12 | | | | 23,004 | |
Carlsberg A/S (Class B Stock) | | | | | | | | | | | 188 | | | | 21,477 | |
Chr Hansen Holding A/S | | | | | | | | | | | 161 | | | | 14,089 | |
Coloplast A/S (Class B Stock) | | | | | | | | | | | 249 | | | | 21,916 | |
Danske Bank A/S | | | | | | | | | | | 1,276 | | | | 48,697 | |
Dfds A/S | | | | | | | | | | | 44 | | | | 2,552 | |
DSV A/S | | | | | | | | | | | 333 | | | | 25,750 | |
FLSmidth & Co. A/S | | | | | | | | | | | 86 | | | | 5,895 | |
Genmab A/S* | | | | | | | | | | | 100 | | | | 20,194 | |
GN Store Nord A/S | | | | | | | | | | | 245 | | | | 8,108 | |
H. Lundbeck A/S | | | | | | | | | | | 112 | | | | 6,658 | |
ISS A/S | | | | | | | | | | | 336 | | | | 14,229 | |
Jyske Bank A/S | | | | | | | | | | | 117 | | | | 6,611 | |
Nets A/S, 144A* | | | | | | | | | | | 232 | | | | 5,922 | |
Novo Nordisk A/S (Class B Stock) | | | | | | | | | | | 3,221 | | | | 160,370 | |
Novozymes A/S (Class B Stock) | | | | | | | | | | | 393 | | | | 21,714 | |
Orsted A/S, 144A | | | | | | | | | | | 293 | | | | 16,419 | |
Pandora A/S | | | | | | | | | | | 191 | | | | 18,035 | |
Rockwool International A/S (Class A Stock) | | | | | | | | | | | 13 | | | | 3,224 | |
Rockwool International A/S (Class B Stock) | | | | | | | | | | | 10 | | | | 2,715 | |
TDC A/S | | | | | | | | | | | 1,380 | | | | 8,159 | |
Topdanmark A/S* | | | | | | | | | | | 94 | | | | 3,864 | |
Tryg A/S | | | | | | | | | | | 205 | | | | 4,884 | |
Vestas Wind Systems A/S | | | | | | | | | | | 376 | | | | 33,195 | |
See Notes to Financial Statements.
| | | | | | | | | | | | | | | | |
| Description | | | | | | | | Shares | | | Value | |
COMMON STOCKS (Continued) | | | | | | | | | | | | | | | | |
| | | | |
Denmark (cont’d.) | | | | | | | | | | | | | | | | |
William Demant Holding A/S* | | | | | | | | | | | 214 | | | $ | 6,176 | |
| | | | | | | | | | | | | | | | |
| | | | | | | | | | | | | | | 518,685 | |
| | | | |
Finland 1.0% | | | | | | | | | | | | | | | | |
Amer Sports OYJ* | | | | | | | | | | | 223 | | | | 5,549 | |
Cargotec OYJ (Class B Stock) | | | | | | | | | | | 76 | | | | 4,487 | |
Elisa OYJ | | | | | | | | | | | 250 | | | | 10,067 | |
Fortum OYJ | | | | | | | | | | | 784 | | | | 16,640 | |
Huhtamaki OYJ | | | | | | | | | | | 182 | | | | 7,752 | |
Kesko OYJ (Class A Stock) | | | | | | | | | | | 50 | | | | 2,535 | |
Kesko OYJ (Class B Stock) | | | | | | | | | | | 127 | | | | 6,486 | |
Kone OYJ (Class B Stock) | | | | | | | | | | | 688 | | | | 37,237 | |
Metso OYJ | | | | | | | | | | | 189 | | | | 6,864 | |
Neste OYJ | | | | | | | | | | | 222 | | | | 12,359 | |
Nokia OYJ | | | | | | | | | | | 10,225 | | | | 50,286 | |
Nokian Renkaat OYJ | | | | | | | | | | | 235 | | | | 10,774 | |
Orion OYJ (Class A Stock) | | | | | | | | | | | 59 | | | | 2,422 | |
Orion OYJ (Class B Stock) | | | | | | | | | | | 180 | | | | 7,377 | |
Outokumpu OYJ | | | | | | | | | | | 590 | | | | 5,577 | |
Sampo OYJ (Class A Stock) | | | | | | | | | | | 846 | | | | 44,271 | |
Stora Enso OYJ (Class R Stock) | | | | | | | | | | | 1,083 | | | | 16,925 | |
UPM-Kymmene OYJ | | | | | | | | | | | 951 | | | | 28,561 | |
Wartsila OYJ Abp | | | | | | | | | | | 279 | | | | 17,958 | |
| | | | | | | | | | | | | | | | |
| | | | | | | | | | | | | | | 294,127 | |
|
France 9.0% | |
Accor SA | | | | | | | | | | | 308 | | | | 15,365 | |
Aeroports de Paris | | | | | | | | | | | 50 | | | | 8,418 | |
Air France-KLM* | | | | | | | | | | | 263 | | | | 4,118 | |
Air Liquide SA | | | | | | | | | | | 765 | | | | 97,403 | |
Airbus SE | | | | | | | | | | | 996 | | | | 102,205 | |
ALD SA, 144A* | | | | | | | | | | | 148 | | | | 2,061 | |
Alstom SA | | | | | | | | | | | 267 | | | | 10,802 | |
Altarea SCA, REIT | | | | | | | | | | | 7 | | | | 1,577 | |
Altran Technologies SA | | | | | | | | | | | 287 | | | | 5,308 | |
Amundi SA, 144A | | | | | | | | | | | 90 | | | | 7,628 | |
Arkema SA | | | | | | | | | | | 135 | | | | 17,055 | |
Atos SE | | | | | | | | | | | 164 | | | | 25,472 | |
AXA SA | | | | | | | | | | | 3,471 | | | | 104,784 | |
BioMerieux | | | | | | | | | | | 75 | | | | 5,883 | |
BNP Paribas SA | | | | | | | | | | | 1,970 | | | | 153,757 | |
Bollore SA* | | | | | | | | | | | 1,697 | | | | 8,197 | |
See Notes to Financial Statements.
| | | | |
| Prudential QMA International Developed Markets Index Fund | | | 15 | |
Schedule of Investments (continued)
as of October 31, 2017
| | | | | | | | | | | | | | | | |
| Description | | | | | | | | Shares | | | Value | |
COMMON STOCKS (Continued) | |
|
France (cont’d.) | |
Bollore SA-New | | | | | | | | | | | 8 | | | $ | 38 | |
Bouygues SA | | | | | | | | | | | 355 | | | | 17,038 | |
Bureau Veritas SA | | | | | | | | | | | 486 | | | | 13,014 | |
Capgemini SE | | | | | | | | | | | 279 | | | | 33,894 | |
Carrefour SA | | | | | | | | | | | 993 | | | | 19,985 | |
Casino Guichard Perrachon SA | | | | | | | | | | | 101 | | | | 5,767 | |
Christian Dior SE | | | | | | | | | | | 26 | | | | 8,924 | |
Cie de Saint-Gobain | | | | | | | | | | | 914 | | | | 53,590 | |
Cie Plastic Omnium SA | | | | | | | | | | | 105 | | | | 4,378 | |
CNP Assurances | | | | | | | | | | | 303 | | | | 7,049 | |
Credit Agricole SA | | | | | | | | | | | 2,058 | | | | 35,919 | |
Criteo SA, ADR* | | | | | | | | | | | 115 | | | | 4,804 | |
Danone SA | | | | | | | | | | | 1,067 | | | | 87,207 | |
Dassault Aviation SA | | | | | | | | | | | 4 | | | | 6,237 | |
Dassault Systemes SE | | | | | | | | | | | 232 | | | | 24,628 | |
Edenred | | | | | | | | | | | 444 | | | | 12,800 | |
Eiffage SA | | | | | | | | | | | 130 | | | | 13,579 | |
Electricite de France SA | | | | | | | | | | | 863 | | | | 11,295 | |
Elior Group SA, 144A | | | | | | | | | | | 233 | | | | 6,617 | |
Engie SA | | | | | | | | | | | 2,975 | | | | 50,284 | |
Essilor International SA | | | | | | | | | | | 368 | | | | 46,590 | |
Euler Hermes Group | | | | | | | | | | | 25 | | | | 2,900 | |
Eurazeo SA | | | | | | | | | | | 83 | | | | 7,716 | |
Eutelsat Communications SA | | | | | | | | | | | 308 | | | | 7,715 | |
Faurecia | | | | | | | | | | | 129 | | | | 9,378 | |
Financiere de L’Odet | | | | | | | | | | | 2 | | | | 2,184 | |
Fonciere Des Regions, REIT | | | | | | | | | | | 73 | | | | 7,433 | |
Gecina SA, REIT | | | | | | | | | | | 79 | | | | 12,831 | |
Groupe Eurotunnel SE | | | | | | | | | | | 865 | | | | 10,870 | |
Havas SA | | | | | | | | | | | 263 | | | | 2,828 | |
ICADE, REIT | | | | | | | | | | | 68 | | | | 5,943 | |
Iliad SA | | | | | | | | | | | 42 | | | | 10,484 | |
Imerys SA | | | | | | | | | | | 70 | | | | 6,374 | |
Ingenico Group SA | | | | | | | | | | | 109 | | | | 10,585 | |
Ipsen SA | | | | | | | | | | | 60 | | | | 7,254 | |
JCDecaux SA | | | | | | | | | | | 133 | | | | 5,088 | |
Kering | | | | | | | | | | | 136 | | | | 62,370 | |
Klepierre SA, REIT | | | | | | | | | | | 368 | | | | 14,649 | |
Korian SA | | | | | | | | | | | 74 | | | | 2,405 | |
L’Oreal SA | | | | | | | | | | | 439 | | | | 97,705 | |
Legrand SA | | | | | | | | | | | 481 | | | | 35,695 | |
LVMH Moet Hennessy Louis Vuitton SE | | | | | | | | | | | 452 | | | | 134,815 | |
See Notes to Financial Statements.
| | | | | | | | | | | | | | | | |
| Description | | | | | | | | Shares | | | Value | |
COMMON STOCKS (Continued) | |
|
France (cont’d.) | |
Mercialys SA, REIT | | | | | | | | | | | 55 | | | $ | 1,071 | |
Metropole Television SA | | | | | | | | | | | 109 | | | | 2,520 | |
Natixis SA | | | | | | | | | | | 1,599 | | | | 12,540 | |
Nexity SA* | | | | | | | | | | | 79 | | | | 4,855 | |
Orange SA | | | | | | | | | | | 3,461 | | | | 56,856 | |
Orpea | | | | | | | | | | | 74 | | | | 8,866 | |
Pernod Ricard SA | | | | | | | | | | | 387 | | | | 58,028 | |
Peugeot SA | | | | | | | | | | | 798 | | | | 18,933 | |
Publicis Groupe SA | | | | | | | | | | | 365 | | | | 23,759 | |
Remy Cointreau SA | | | | | | | | | | | 43 | | | | 5,585 | |
Renault SA | | | | | | | | | | | 310 | | | | 30,741 | |
Rexel SA | | | | | | | | | | | 588 | | | | 10,485 | |
Safran SA | | | | | | | | | | | 537 | | | | 56,558 | |
Sanofi | | | | | | | | | | | 1,993 | | | | 188,710 | |
Sartorius Stedim Biotech | | | | | | | | | | | 38 | | | | 2,590 | |
Schneider Electric SE* | | | | | | | | | | | 956 | | | | 83,995 | |
SCOR SE | | | | | | | | | | | 296 | | | | 12,288 | |
SEB SA | | | | | | | | | | | 47 | | | | 8,759 | |
Societe BIC SA | | | | | | | | | | | 47 | | | | 4,963 | |
Societe Fonciere Lyonnaise SA, REIT | | | | | | | | | | | 13 | | | | 833 | |
Societe Generale SA | | | | | | | | | | | 1,325 | | | | 73,742 | |
Sodexo SA | | | | | | | | | | | 157 | | | | 19,974 | |
Somfy SA | | | | | | | | | | | 10 | | | | 1,013 | |
Sopra Steria Group | | | | | | | | | | | 25 | | | | 4,690 | |
SPIE SA | | | | | | | | | | | 157 | | | | 4,131 | |
Suez | | | | | | | | | | | 642 | | | | 11,291 | |
Technicolor SA | | | | | | | | | | | 614 | | | | 2,176 | |
Teleperformance | | | | | | | | | | | 102 | | | | 14,896 | |
Television Francaise 1 | | | | | | | | | | | 178 | | | | 2,531 | |
Thales SA | | | | | | | | | | | 184 | | | | 19,175 | |
TOTAL SA | | | | | | | | | | | 4,028 | | | | 224,513 | |
Ubisoft Entertainment SA* | | | | | | | | | | | 136 | | | | 10,377 | |
Unibail-Rodamco SE, REIT | | | | | | | | | | | 179 | | | | 44,805 | |
Valeo SA | | | | | | | | | | | 430 | | | | 29,113 | |
Veolia Environnement SA | | | | | | | | | | | 883 | | | | 20,919 | |
Vicat SA | | | | | | | | | | | 23 | | | | 1,779 | |
Vinci SA | | | | | | | | | | | 848 | | | | 83,085 | |
Vivendi SA | | | | | | | | | | | 1,930 | | | | 47,925 | |
Wendel SA | | | | | | | | | | | 50 | | | | 8,433 | |
Worldline SA, 144A* | | | | | | | | | | | 65 | | | | 3,178 | |
Zodiac Aerospace | | | | | | | | | | | 341 | | | | 9,747 | |
| | | | | | | | | | | | | | | | |
| | | | | | | | | | | | | | | 2,721,320 | |
See Notes to Financial Statements.
| | | | |
| Prudential QMA International Developed Markets Index Fund | | | 17 | |
Schedule of Investments (continued)
as of October 31, 2017
| | | | | | | | | | | | | | | | |
| Description | | | | | | | | Shares | | | Value | |
COMMON STOCKS (Continued) | |
| | | | |
Germany 8.4% | | | | | | | | | | | | | | | | |
adidas AG | | | | | | | | | | | 358 | | | $ | 79,685 | |
Allianz SE | | | | | | | | | | | 814 | | | | 190,035 | |
Aurubis AG | | | | | | | | | | | 65 | | | | 5,327 | |
Axel Springer SE | | | | | | | | | | | 86 | | | | 5,790 | |
BASF SE | | | | | | | | | | | 1,665 | | | | 182,073 | |
Bayer AG | | | | | | | | | | | 1,505 | | | | 195,769 | |
Bayerische Motoren Werke AG | | | | | | | | | | | 581 | | | | 59,588 | |
Beiersdorf AG | | | | | | | | | | | 180 | | | | 20,248 | |
Bilfinger SE | | | | | | | | | | | 52 | | | | 2,098 | |
Brenntag AG | | | | | | | | | | | 275 | | | | 15,602 | |
Carl Zeiss Meditec AG | | | | | | | | | | | 54 | | | | 2,879 | |
CECONOMY AG | | | | | | | | | | | 346 | | | | 4,516 | |
Commerzbank AG* | | | | | | | | | | | 1,864 | | | | 25,831 | |
Continental AG | | | | | | | | | | | 195 | | | | 49,626 | |
Covestro AG, 144A | | | | | | | | | | | 232 | | | | 22,302 | |
CTS Eventim AG & Co. KGaA | | | | | | | | | | | 112 | | | | 4,633 | |
Daimler AG | | | | | | | | | | | 1,757 | | | | 146,685 | |
Delivery Hero AG, 144A* | | | | | | | | | | | 66 | | | | 2,869 | |
Deutsche Bank AG | | | | | | | | | | | 3,621 | | | | 59,345 | |
Deutsche Boerse AG | | | | | | | | | | | 338 | | | | 35,005 | |
Deutsche Lufthansa AG | | | | | | | | | | | 415 | | | | 13,333 | |
Deutsche Post AG | | | | | | | | | | | 1,725 | | | | 79,074 | |
Deutsche Telekom AG | | | | | | | | | | | 5,879 | | | | 106,453 | |
Deutsche Wohnen SE | | | | | | | | | | | 633 | | | | 27,093 | |
DMG Mori AG | | | | | | | | | | | 38 | | | | 2,200 | |
Duerr AG | | | | | | | | | | | 48 | | | | 6,643 | |
E.ON SE | | | | | | | | | | | 3,724 | | | | 44,109 | |
Evonik Industries AG | | | | | | | | | | | 265 | | | | 9,640 | |
Fielmann AG | | | | | | | | | | | 51 | | | | 4,481 | |
Fraport AG Frankfurt Airport Services Worldwide | | | | | | | | | | | 60 | | | | 5,701 | |
Freenet AG | | | | | | | | | | | 223 | | | | 7,468 | |
Fresenius Medical Care AG & Co. KGaA | | | | | | | | | | | 384 | | | | 37,180 | |
Fresenius SE & Co. KGaA | | | | | | | | | | | 731 | | | | 61,197 | |
FUCHS PETROLUB SE | | | | | | | | | | | 53 | | | | 2,639 | |
GEA Group AG | | | | | | | | | | | 312 | | | | 15,072 | |
GRENKE AG | | | | | | | | | | | 42 | | | | 4,113 | |
Hannover Rueck SE | | | | | | | | | | | 109 | | | | 13,717 | |
Hapag-Lloyd AG, 144A* | | | | | | | | | | | 58 | | | | 2,549 | |
HeidelbergCement AG | | | | | | | | | | | 266 | | | | 27,220 | |
Hella GmbH & Co. KGaA | | | | | | | | | | | 82 | | | | 4,953 | |
Henkel AG & Co. KGaA | | | | | | | | | | | 209 | | | | 26,360 | |
HOCHTIEF AG | | | | | | | | | | | 39 | | | | 6,889 | |
See Notes to Financial Statements.
| | | | | | | | | | | | | | | | |
| Description | | | | | | | | Shares | | | Value | |
COMMON STOCKS (Continued) | |
| | | | |
Germany (cont’d.) | | | | | | | | | | | | | | | | |
HUGO BOSS AG | | | | | | | | | | | 114 | | | $ | 10,196 | |
Infineon Technologies AG | | | | | | | | | | | 2,043 | | | | 56,505 | |
Innogy SE, 144A | | | | | | | | | | | 226 | | | | 10,510 | |
K+S AG | | | | | | | | | | | 375 | | | | 9,117 | |
KION Group AG | | | | | | | | | | | 124 | | | | 9,936 | |
Krones AG | | | | | | | | | | | 25 | | | | 3,163 | |
LANXESS AG | | | | | | | | | | | 167 | | | | 13,094 | |
LEG Immobilien AG | | | | | | | | | | | 121 | | | | 12,326 | |
Linde AG | | | | | | | | | | | 336 | | | | 72,568 | |
MAN SE | | | | | | | | | | | 65 | | | | 7,197 | |
Merck KGaA | | | | | | | | | | | 234 | | | | 25,107 | |
METRO AG* | | | | | | | | | | | 308 | | | | 5,839 | |
MTU Aero Engines AG | | | | | | | | | | | 91 | | | | 15,399 | |
Muenchener Rueckversicherungs-Gesellschaft AG in Muenchen | | | | | | | | | | | 243 | | | | 54,554 | |
Nordex SE* | | | | | | | | | | | 93 | | | | 966 | |
OSRAM Licht AG | | | | | | | | | | | 169 | | | | 12,940 | |
ProSiebenSat.1 Media SE | | | | | | | | | | | 406 | | | | 14,301 | |
Puma SE | | | | | | | | | | | 4 | | | | 1,807 | |
Rational AG | | | | | | | | | | | 6 | | | | 3,959 | |
Rheinmetall AG | | | | | | | | | | | 77 | | | | 9,145 | |
RHOEN-KLINIKUM AG | | | | | | | | | | | 40 | | | | 1,397 | |
RWE AG* | | | | | | | | | | | 860 | | | | 21,624 | |
Salzgitter AG | | | | | | | | | | | 62 | | | | 3,000 | |
SAP SE | | | | | | | | | | | 1,653 | | | | 188,876 | |
Scout24 AG, 144A | | | | | | | | | | | 159 | | | | 6,374 | |
Siemens AG | | | | | | | | | | | 1,383 | | | | 198,644 | |
Software AG | | | | | | | | | | | 99 | | | | 5,032 | |
STADA Arzneimittel AG | | | | | | | | | | | 70 | | | | 6,761 | |
Stroeer SE & Co. KGaA | | | | | | | | | | | 42 | | | | 2,686 | |
Suedzucker AG | | | | | | | | | | | 153 | | | | 3,032 | |
Symrise AG | | | | | | | | | | | 217 | | | | 16,910 | |
Talanx AG | | | | | | | | | | | 63 | | | | 2,479 | |
Telefonica Deutschland Holding AG | | | | | | | | | | | 1,252 | | | | 6,386 | |
thyssenkrupp AG | | | | | | | | | | | 841 | | | | 22,561 | |
Trivago NV, ADR*(a) | | | | | | | | | | | 411 | | | | 3,004 | |
Uniper SE | | | | | | | | | | | 343 | | | | 9,638 | |
United Internet AG | | | | | | | | | | | 211 | | | | 13,382 | |
Volkswagen AG | | | | | | | | | | | 51 | | | | 9,524 | |
Vonovia SE | | | | | | | | | | | 878 | | | | 38,784 | |
Wacker Chemie AG | | | | | | | | | | | 32 | | | | 4,998 | |
Wirecard AG | | | | | | | | | | | 204 | | | | 20,267 | |
Zalando SE, 144A* | | | | | | | | | | | 182 | | | | 9,162 | |
| | | | | | | | | | | | | | | | |
| | | | | | | | | | | | | | | 2,561,140 | |
See Notes to Financial Statements.
| | | | |
| Prudential QMA International Developed Markets Index Fund | | | 19 | |
Schedule of Investments (continued)
as of October 31, 2017
| | | | | | | | | | | | | | | | |
| Description | | | | | | | | Shares | | | Value | |
COMMON STOCKS (Continued) | |
| | | | |
Ghana 0.0% | | | | | | | | | | | | | | | | |
Tullow Oil PLC* | | | | | | | | | | | 2,604 | | | $ | 6,301 | |
| | | | |
Hong Kong 3.0% | | | | | | | | | | | | | | | | |
AIA Group Ltd. | | | | | | | | | | | 21,900 | | | | 165,027 | |
ASM Pacific Technology Ltd. | | | | | | | | | | | 500 | | | | 7,295 | |
Bank of East Asia Ltd. (The) | | | | | | | | | | | 2,200 | | | | 9,654 | |
Brightoil Petroleum Holdings Ltd.*^ | | | | | | | | | | | 7,000 | | | | 1,346 | |
Cathay Pacific Airways Ltd.* | | | | | | | | | | | 1,300 | | | | 2,224 | |
Champion, REIT | | | | | | | | | | | 4,000 | | | | 2,887 | |
China Goldjoy Group Ltd. | | | | | | | | | | | 19,000 | | | | 1,461 | |
Chinese Estates Holdings Ltd. | | | | | | | | | | | 1,000 | | | | 1,700 | |
Chow Tai Fook Jewellery Group Ltd. | | | | | | | | | | | 1,600 | | | | 1,672 | |
CK Asset Holdings Ltd. | | | | | | | | | | | 4,900 | | | | 40,326 | |
CK Hutchison Holdings Ltd. | | | | | | | | | | | 4,900 | | | | 62,238 | |
CK Infrastructure Holdings Ltd. | | | | | | | | | | | 1,200 | | | | 10,448 | |
CLP Holdings Ltd. | | | | | | | | | | | 3,000 | | | | 30,534 | |
CP Pokphand Co. Ltd. | | | | | | | | | | | 12,000 | | | | 970 | |
Dah Sing Banking Group Ltd. | | | | | | | | | | | 800 | | | | 1,770 | |
Dairy Farm International Holdings Ltd. | | | | | | | | | | | 600 | | | | 4,908 | |
First Pacific Co. Ltd. | | | | | | | | | | | 4,000 | | | | 3,048 | |
Galaxy Entertainment Group Ltd. | | | | | | | | | | | 3,600 | | | | 24,550 | |
Genting Hong Kong Ltd. | | | | | | | | | | | 5,000 | | | | 1,200 | |
Haitong International Securities Group Ltd. | | | | | | | | | | | 5,000 | | | | 2,836 | |
Hang Lung Group Ltd. | | | | | | | | | | | 1,200 | | | | 4,216 | |
Hang Lung Properties Ltd. | | | | | | | | | | | 4,000 | | | | 9,185 | |
Hang Seng Bank Ltd. | | | | | | | | | | | 1,310 | | | | 31,051 | |
Henderson Land Development Co. Ltd. | | | | | | | | | | | 2,100 | | | | 13,704 | |
HK Electric Investments & HK Electric Investments Ltd., 144A | | | | | | | | | | | 5,500 | | | | 5,062 | |
Hong Kong & China Gas Co. Ltd. | | | | | | | | | | | 14,420 | | | | 27,335 | |
Hong Kong Exchanges & Clearing Ltd. | | | | | | | | | | | 2,300 | | | | 64,088 | |
Hongkong & Shanghai Hotels Ltd. (The) | | | | | | | | | | | 1,500 | | | | 2,444 | |
Hongkong Land Holdings Ltd. | | | | | | | | | | | 2,100 | | | | 15,225 | |
Hopewell Holdings Ltd. | | | | | | | | | | | 1,100 | | | | 4,224 | |
Hutchison Port Holdings Trust, UTS | | | | | | | | | | | 9,000 | | | | 3,870 | |
Hysan Development Co. Ltd. | | | | | | | | | | | 1,300 | | | | 6,281 | |
I-CABLE Communications Ltd.* | | | | | | | | | | | 2,366 | | | | 74 | |
Jardine Matheson Holdings Ltd. | | | | | | | | | | | 350 | | | | 22,421 | |
Jardine Strategic Holdings Ltd. | | | | | | | | | | | 300 | | | | 12,582 | |
Johnson Electric Holdings Ltd. | | | | | | | | | | | 1,000 | | | | 4,035 | |
Kerry Logistics Network Ltd. | | | | | | | | | | | 1,000 | | | | 1,379 | |
Kerry Properties Ltd. | | | | | | | | | | | 1,400 | | | | 6,300 | |
Kingston Financial Group Ltd. | | | | | | | | | | | 6,000 | | | | 4,633 | |
KuangChi Science Ltd.* | | | | | | | | | | | 3,000 | | | | 1,139 | |
See Notes to Financial Statements.
| | | | | | | | | | | | | | | | |
| Description | | | | | | | | Shares | | | Value | |
COMMON STOCKS (Continued) | |
| | | | |
Hong Kong (cont’d.) | | | | | | | | | | | | | | | | |
Li & Fung Ltd. | | | | | | | | | | | 10,000 | | | $ | 5,040 | |
Lifestyle China Group Ltd.* | | | | | | | | | | | 4,500 | | | | 1,500 | |
Lifestyle International Holdings Ltd. | | | | | | | | | | | 1,000 | | | | 1,371 | |
Link, REIT | | | | | | | | | | | 4,200 | | | | 35,311 | |
Melco International Development Ltd. | | | | | | | | | | | 1,000 | | | | 2,741 | |
Melco Resorts & Entertainment Ltd., ADR | | | | | | | | | | | 234 | | | | 5,916 | |
MTR Corp. Ltd. | | | | | | | | | | | 2,300 | | | | 13,334 | |
New World Development Co. Ltd. | | | | | | | | | | | 10,000 | | | | 14,909 | |
NWS Holdings Ltd. | | | | | | | | | | | 3,000 | | | | 6,072 | |
Orient Overseas International Ltd. | | | | | | | | | | | 500 | | | | 4,815 | |
PCCW Ltd. | | | | | | | | | | | 7,000 | | | | 3,860 | |
Power Assets Holdings Ltd. | | | | | | | | | | | 2,200 | | | | 19,072 | |
Sands China Ltd. | | | | | | | | | | | 4,400 | | | | 20,758 | |
Shangri-La Asia Ltd. | | | | | | | | | | | 2,000 | | | | 3,982 | |
Sino Land Co. Ltd. | | | | | | | | | | | 6,000 | | | | 10,341 | |
SJM Holdings Ltd. | | | | | | | | | | | 3,600 | | | | 3,095 | |
Sun Art Retail Group Ltd. | | | | | | | | | | | 4,500 | | | | 4,548 | |
Sun Hung Kai Properties Ltd. | | | | | | | | | | | 2,200 | | | | 35,991 | |
Swire Pacific Ltd. (Class A Stock) | | | | | | | | | | | 1,000 | | | | 9,882 | |
Swire Pacific Ltd. (Class B Stock) | | | | | | | | | | | 1,500 | | | | 2,593 | |
Swire Properties Ltd. | | | | | | | | | | | 2,000 | | | | 6,758 | |
Techtronic Industries Co. Ltd. | | | | | | | | | | | 2,300 | | | | 13,501 | |
Value Partners Group Ltd. | | | | | | | | | | | 2,000 | | | | 1,984 | |
VTech Holdings Ltd. | | | | | | | | | | | 300 | | | | 4,265 | |
WH Group Ltd., 144A | | | | | | | | | | | 15,000 | | | | 15,201 | |
Wharf Holdings Ltd. (The) | | | | | | | | | | | 2,300 | | | | 20,949 | |
Wheelock & Co. Ltd. | | | | | | | | | | | 1,000 | | | | 6,966 | |
Xinyi Glass Holdings Ltd.* | | | | | | | | | | | 4,000 | | | | 3,876 | |
Yue Yuen Industrial Holdings Ltd. | | | | | | | | | | | 1,300 | | | | 4,980 | |
| | | | | | | | | | | | | | | | |
| | | | | | | | | | | | | | | 898,953 | |
| | | | |
Ireland 0.6% | | | | | | | | | | | | | | | | |
AerCap Holdings NV* | | | | | | | | | | | 270 | | | | 14,213 | |
Bank of Ireland Group PLC* | | | | | | | | | | | 1,638 | | | | 12,834 | |
CRH PLC | | | | | | | | | | | 1,541 | | | | 57,991 | |
Glanbia PLC | | | | | | | | | | | 346 | | | | 6,692 | |
James Hardie Industries PLC, CDI | | | | | | | | | | | 839 | | | | 12,810 | |
Kerry Group PLC (Class A Stock) | | | | | | | | | | | 266 | | | | 26,787 | |
Kingspan Group PLC | | | | | | | | | | | 282 | | | | 11,789 | |
Paddy Power Betfair PLC | | | | | | | | | | | 148 | | | | 15,156 | |
Smurfit Kappa Group PLC | | | | | | | | | | | 433 | | | | 12,917 | |
| | | | | | | | | | | | | | | | |
| | | | | | | | | | | | | | | 171,189 | |
See Notes to Financial Statements.
| | | | |
| Prudential QMA International Developed Markets Index Fund | | | 21 | |
Schedule of Investments (continued)
as of October 31, 2017
| | | | | | | | | | | | | | | | |
| Description | | | | | | | | Shares | | | Value | |
COMMON STOCKS (Continued) | |
| | | | |
Isle of Man 0.0% | | | | | | | | | | | | | | | | |
Paysafe Group PLC* | | | | | | | | | | | 887 | | | $ | 6,904 | |
| | | | |
Israel 0.4% | | | | | | | | | | | | | | | | |
Azrieli Group Ltd. | | | | | | | | | | | 49 | | | | 2,768 | |
Bank Hapoalim BM | | | | | | | | | | | 1,876 | | | | 13,282 | |
Bank Leumi Le-Israel BM | | | | | | | | | | | 2,595 | | | | 14,345 | |
Bezeq The Israeli Telecommunication Corp. Ltd. | | | | | | | | | | | 3,915 | | | | 5,849 | |
Check Point Software Technologies Ltd.* | | | | | | | | | | | 223 | | | | 26,249 | |
Delek Energy Systems Ltd. | | | | | | | | | | | 2 | | | | 781 | |
Delek Group Ltd. | | | | | | | | | | | 9 | | | | 1,477 | |
Elbit Systems Ltd. | | | | | | | | | | | 45 | | | | 6,679 | |
Frutarom Industries Ltd. | | | | | | | | | | | 66 | | | | 5,435 | |
Israel Chemicals Ltd. | | | | | | | | | | | 801 | | | | 3,340 | |
Mizrahi Tefahot Bank Ltd. | | | | | | | | | | | 203 | | | | 3,665 | |
Nice Ltd. | | | | | | | | | | | 103 | | | | 8,573 | |
Teva Pharmaceutical Industries Ltd. | | | | | | | | | | | 1,652 | | | | 22,783 | |
| | | | | | | | | | | | | | | | |
| | | | | | | | | | | | | | | 115,226 | |
| | | | |
Italy 2.2% | | | | | | | | | | | | | | | | |
A2A SpA | | | | | | | | | | | 3,051 | | | | 5,240 | |
ACEA SpA | | | | | | | | | | | 53 | | | | 863 | |
Assicurazioni Generali SpA | | | | | | | | | | | 2,387 | | | | 43,443 | |
Atlantia SpA | | | | | | | | | | | 961 | | | | 31,329 | |
Autogrill SpA | | | | | | | | | | | 206 | | | | 2,694 | |
Azimut Holding SpA | | | | | | | | | | | 188 | | | | 3,711 | |
Banca Generali SpA | | | | | | | | | | | 91 | | | | 2,994 | |
Banca Mediolanum SpA | | | | | | | | | | | 525 | | | | 4,473 | |
Banco BPM SpA* | | | | | | | | | | | 2,663 | | | | 9,272 | |
BPER Banca | | | | | | | | | | | 802 | | | | 3,904 | |
Brembo SpA | | | | | | | | | | | 282 | | | | 4,655 | |
Buzzi Unicem SpA | | | | | | | | | | | 153 | | | | 4,259 | |
Buzzi Unicem SpA (Savings Share) | | | | | | | | | | | 53 | | | | 839 | |
Credito Emiliano SpA | | | | | | | | | | | 104 | | | | 911 | |
Davide Campari-Milano SpA | | | | | | | | | | | 989 | | | | 7,919 | |
De’ Longhi SpA | | | | | | | | | | | 90 | | | | 2,950 | |
DiaSorin SpA | | | | | | | | | | | 48 | | | | 4,366 | |
Enel SpA | | | | | | | | | | | 14,173 | | | | 87,896 | |
Eni SpA | | | | | | | | | | | 4,524 | | | | 73,958 | |
Ferrari NV | | | | | | | | | | | 224 | | | | 26,821 | |
FinecoBank Banca Fineco SpA | | | | | | | | | | | 736 | | | | 6,884 | |
GEDI Gruppo Editoriale SpA* | | | | | | | | | | | 67 | | | | 60 | |
Hera SpA | | | | | | | | | | | 1,485 | | | | 4,777 | |
See Notes to Financial Statements.
| | | | | | | | | | | | | | | | |
| Description | | | | | | | | Shares | | | Value | |
COMMON STOCKS (Continued) | |
| | | | |
Italy (cont’d.) | | | | | | | | | | | | | | | | |
Infrastrutture Wireless Italiane SpA, 144A | | | | | | | | | | | 406 | | | $ | 2,775 | |
Intesa Sanpaolo SpA | | | | | | | | | | | 23,295 | | | | 78,316 | |
Intesa Sanpaolo SpA (Savings Share) | | | | | | | | | | | 1,698 | | | | 5,352 | |
Italgas SpA | | | | | | | | | | | 907 | | | | 5,299 | |
Leonardo SpA | | | | | | | | | | | 705 | | | | 12,170 | |
Luxottica Group SpA | | | | | | | | | | | 283 | | | | 16,225 | |
Mediaset SpA* | | | | | | | | | | | 839 | | | | 3,081 | |
Mediobanca SpA | | | | | | | | | | | 1,010 | | | | 11,064 | |
Moncler SpA | | | | | | | | | | | 291 | | | | 8,261 | |
Parmalat SpA | | | | | | | | | | | 289 | | | | 1,094 | |
Poste Italiane SpA, 144A | | | | | | | | | | | 883 | | | | 6,451 | |
PRADA SpA | | | | | | | | | | | 1,000 | | | | 3,449 | |
Prysmian SpA | | | | | | | | | | | 399 | | | | 13,729 | |
Recordati SpA | | | | | | | | | | | 180 | | | | 8,365 | |
Saipem SpA* | | | | | | | | | | | 971 | | | | 4,082 | |
Salvatore Ferragamo SpA | | | | | | | | | | | 68 | | | | 1,785 | |
Snam SpA | | | | | | | | | | | 4,268 | | | | 21,792 | |
Telecom Italia SpA* | | | | | | | | | | | 20,633 | | | | 17,853 | |
Telecom Italia SpA (Savings Share) | | | | | | | | | | | 10,752 | | | | 7,639 | |
Terna Rete Elettrica Nazionale SpA | | | | | | | | | | | 2,530 | | | | 15,261 | |
Tod’s SpA | | | | | | | | | | | 18 | | | | 1,197 | |
UniCredit SpA* | | | | | | | | | | | 4,028 | | | | 76,978 | |
Unione di Banche Italiane SpA | | | | | | | | | | | 1,865 | | | | 8,753 | |
Unipol Gruppo SpA | | | | | | | | | | | 1,011 | | | | 4,559 | |
UnipolSai Assicurazioni SpA | | | | | | | | | | | 1,961 | | | | 4,462 | |
Yoox Net-A-Porter Group SpA* | | | | | | | | | | | 121 | | | | 4,520 | |
| | | | | | | | | | | | | | | | |
| | | | | | | | | | | | | | | 678,730 | |
| | | | |
Japan 21.9% | | | | | | | | | | | | | | | | |
Acom Co. Ltd.* | | | | | | | | | | | 900 | | | | 3,742 | |
Activia Properties, Inc., REIT | | | | | | | | | | | 1 | | | | 3,913 | |
Advance Residence Investment Corp., REIT | | | | | | | | | | | 2 | | | | 4,702 | |
Advantest Corp. | | | | | | | | | | | 400 | | | | 9,137 | |
Aeon Co. Ltd. | | | | | | | | | | | 1,280 | | | | 19,798 | |
AEON Financial Service Co. Ltd. | | | | | | | | | | | 200 | | | | 4,295 | |
Aeon Mall Co. Ltd. | | | | | | | | | | | 230 | | | | 4,113 | |
Air Water, Inc. | | | | | | | | | | | 310 | | | | 5,949 | |
Aisin Seiki Co. Ltd. | | | | | | | | | | | 350 | | | | 18,131 | |
Ajinomoto Co., Inc. | | | | | | | | | | | 970 | | | | 19,513 | |
Alfresa Holdings Corp. | | | | | | | | | | | 350 | | | | 6,687 | |
Alps Electric Co. Ltd. | | | | | | | | | | | 400 | | | | 12,242 | |
Amada Holdings Co. Ltd. | | | | | | | | | | | 600 | | | | 7,456 | |
See Notes to Financial Statements.
| | | | |
| Prudential QMA International Developed Markets Index Fund | | | 23 | |
Schedule of Investments (continued)
as of October 31, 2017
| | | | | | | | | | | | | | | | |
| Description | | | | | | | | Shares | | | Value | |
COMMON STOCKS (Continued) | |
| | | | |
Japan (cont’d.) | | | | | | | | | | | | | | | | |
ANA Holdings, Inc. | | | | | | | | | | | 230 | | | $ | 8,840 | |
Aozora Bank Ltd. | | | | | | | | | | | 240 | | | | 9,394 | |
Asahi Glass Co. Ltd. | | | | | | | | | | | 300 | | | | 11,757 | |
Asahi Group Holdings Ltd. | | | | | | | | | | | 720 | | | | 32,874 | |
Asahi Intecc Co. Ltd. | | | | | | | | | | | 100 | | | | 5,770 | |
Asahi Kasei Corp. | | | | | | | | | | | 2,100 | | | | 25,430 | |
Asics Corp. | | | | | | | | | | | 400 | | | | 6,115 | |
Astellas Pharma, Inc. | | | | | | | | | | | 3,780 | | | | 50,307 | |
Bandai Namco Holdings, Inc. | | | | | | | | | | | 440 | | | | 15,078 | |
Bank of Kyoto Ltd. (The) | | | | | | | | | | | 130 | | | | 6,827 | |
Benesse Holdings, Inc. | | | | | | | | | | | 150 | | | | 5,085 | |
Bridgestone Corp. | | | | | | | | | | | 1,140 | | | | 54,458 | |
Brother Industries Ltd. | | | | | | | | | | | 500 | | | | 12,167 | |
Calbee, Inc. | | | | | | | | | | | 170 | | | | 5,737 | |
Canon Marketing Japan, Inc. | | | | | | | | | | | 100 | | | | 2,515 | |
Canon, Inc. | | | | | | | | | | | 1,920 | | | | 72,129 | |
Casio Computer Co. Ltd. | | | | | | | | | | | 400 | | | | 5,903 | |
Central Japan Railway Co. | | | | | | | | | | | 324 | | | | 58,854 | |
Chiba Bank Ltd. (The) | | | | | | | | | | | 1,500 | | | | 11,498 | |
Chubu Electric Power Co., Inc. | | | | | | | | | | | 1,300 | | | | 16,765 | |
Chugai Pharmaceutical Co. Ltd. | | | | | | | | | | | 390 | | | | 18,594 | |
Chugoku Bank Ltd. (The) | | | | | | | | | | | 350 | | | | 5,017 | |
Chugoku Electric Power Co., Inc. (The) | | | | | | | | | | | 500 | | | | 5,575 | |
Citizen Watch Co. Ltd. | | | | | | | | | | | 480 | | | | 3,529 | |
Coca-Cola Bottlers Japan, Inc. | | | | | | | | | | | 220 | | | | 7,698 | |
Concordia Financial Group Ltd. | | | | | | | | | | | 2,200 | | | | 11,651 | |
Credit Saison Co. Ltd. | | | | | | | | | | | 300 | | | | 6,041 | |
CyberAgent, Inc. | | | | | | | | | | | 200 | | | | 6,194 | |
CYBERDYNE, Inc.* | | | | | | | | | | | 300 | | | | 3,974 | |
Dai Nippon Printing Co. Ltd. | | | | | | | | | | | 500 | | | | 11,985 | |
Dai-ichi Life Holdings, Inc. | | | | | | | | | | | 2,100 | | | | 40,106 | |
Daicel Corp. | | | | | | | | | | | 580 | | | | 7,242 | |
Daiichi Sankyo Co. Ltd. | | | | | | | | | | | 1,150 | | | | 26,414 | |
Daikin Industries Ltd. | | | | | | | | | | | 480 | | | | 53,045 | |
Daito Trust Construction Co. Ltd. | | | | | | | | | | | 100 | | | | 17,483 | |
Daiwa House Industry Co. Ltd. | | | | | | | | | | | 1,150 | | | | 42,151 | |
Daiwa Securities Group, Inc. | | | | | | | | | | | 3,100 | | | | 19,436 | |
DeNA Co. Ltd. | | | | | | | | | | | 200 | | | | 4,703 | |
Denso Corp. | | | | | | | | | | | 900 | | | | 49,567 | |
Dentsu, Inc. | | | | | | | | | | | 400 | | | | 17,110 | |
Disco Corp. | | | | | | | | | | | 20 | | | | 4,635 | |
Don Quijote Holdings Co. Ltd. | | | | | | | | | | | 180 | | | | 7,550 | |
See Notes to Financial Statements.
| | | | | | | | | | | | | | | | |
| Description | | | | | | | | Shares | | | Value | |
COMMON STOCKS (Continued) | |
| | | | |
Japan (cont’d.) | | | | | | | | | | | | | | | | |
East Japan Railway Co. | | | | | | | | | | | 650 | | | $ | 63,037 | |
Eisai Co. Ltd. | | | | | | | | | | | 440 | | | | 24,489 | |
Electric Power Development Co. Ltd. | | | | | | | | | | | 300 | | | | 7,560 | |
Ezaki Glico Co. Ltd. | | | | | | | | | | | 130 | | | | 7,210 | |
FamilyMart UNY Holdings Co. Ltd. | | | | | | | | | | | 170 | | | | 9,662 | |
FANUC Corp. | | | | | | | | | | | 325 | | | | 75,993 | |
Fast Retailing Co. Ltd. | | | | | | | | | | | 75 | | | | 25,093 | |
Fuji Electric Co. Ltd. | | | | | | | | | | | 1,400 | | | | 10,143 | |
FUJIFILM Holdings Corp. | | | | | | | | | | | 700 | | | | 28,635 | |
Fujitsu Ltd. | | | | | | | | | | | 3,800 | | | | 29,611 | |
Fukuoka Financial Group, Inc. | | | | | | | | | | | 1,000 | | | | 5,161 | |
GLP J-Reit, REIT | | | | | | | | | | | 5 | | | | 5,012 | |
GungHo Online Entertainment, Inc. | | | | | | | | | | | 900 | | | | 2,422 | |
Gunma Bank Ltd. (The) | | | | | | | | | | | 900 | | | | 5,794 | |
Hachijuni Bank Ltd. (The) | | | | | | | | | | | 790 | | | | 4,947 | |
Hakuhodo DY Holdings, Inc. | | | | | | | | | | | 500 | | | | 6,916 | |
Hamamatsu Photonics KK | | | | | | | | | | | 300 | | | | 9,713 | |
Hankyu Hanshin Holdings, Inc. | | | | | | | | | | | 470 | | | | 18,324 | |
Haseko Corp. | | | | | | | | | | | 500 | | | | 7,261 | |
Hino Motors Ltd. | | | | | | | | | | | 500 | | | | 6,435 | |
Hirose Electric Co. Ltd. | | | | | | | | | | | 30 | | | | 4,513 | |
Hiroshima Bank Ltd. (The) | | | | | | | | | | | 700 | | | | 5,927 | |
Hisamitsu Pharmaceutical Co., Inc. | | | | | | | | | | | 100 | | | | 5,506 | |
Hitachi Capital Corp. | | | | | | | | | | | 100 | | | | 2,445 | |
Hitachi Chemical Co. Ltd. | | | | | | | | | | | 250 | | | | 7,129 | |
Hitachi Construction Machinery Co. Ltd. | | | | | | | | | | | 200 | | | | 6,861 | |
Hitachi High-Technologies Corp. | | | | | | | | | | | 150 | | | | 6,277 | |
Hitachi Ltd. | | | | | | | | | | | 8,400 | | | | 66,892 | |
Hitachi Metals Ltd. | | | | | | | | | | | 400 | | | | 5,182 | |
Hokuriku Electric Power Co. | | | | | | | | | | | 300 | | | | 2,651 | |
Honda Motor Co. Ltd. | | | | | | | | | | | 3,240 | | | | 101,532 | |
Hoshizaki Corp. | | | | | | | | | | | 130 | | | | 12,302 | |
Hoya Corp. | | | | | | | | | | | 640 | | | | 34,772 | |
Hulic Co. Ltd. | | | | | | | | | | | 660 | | | | 6,809 | |
Ibiden Co. Ltd. | | | | | | | | | | | 200 | | | | 3,349 | |
Idemitsu Kosan Co. Ltd. | | | | | | | | | | | 350 | | | | 10,230 | |
IHI Corp. | | | | | | | | | | | 300 | | | | 10,806 | |
Iida Group Holdings Co. Ltd. | | | | | | | | | | | 270 | | | | 5,179 | |
Inpex Corp. | | | | | | | | | | | 1,700 | | | | 18,202 | |
Isetan Mitsukoshi Holdings Ltd. | | | | | | | | | | | 700 | | | | 7,631 | |
Isuzu Motors Ltd. | | | | | | | | | | | 1,000 | | | | 14,605 | |
Ito En Ltd. | | | | | | | | | | | 130 | | | | 4,552 | |
See Notes to Financial Statements.
| | | | |
| Prudential QMA International Developed Markets Index Fund | | | 25 | |
Schedule of Investments (continued)
as of October 31, 2017
| | | | | | | | | | | | | | | | |
| Description | | | | | | | | Shares | | | Value | |
COMMON STOCKS (Continued) | |
| | | | |
Japan (cont’d.) | | | | | | | | | | | | | | | | |
ITOCHU Corp. | | | | | | | | | | | 2,600 | | | $ | 45,543 | |
Itochu Techno-Solutions Corp. | | | | | | | | | | | 100 | | | | 3,895 | |
Itoham Yonekyu Holdings, Inc. | | | | | | | | | | | 300 | | | | 2,862 | |
Iyo Bank Ltd. (The) | | | | | | | | | | | 470 | | | | 4,057 | |
Izumi Co. Ltd. | | | | | | | | | | | 100 | | | | 5,186 | |
J Front Retailing Co. Ltd. | | | | | | | | | | | 500 | | | | 7,421 | |
Japan Airport Terminal Co. Ltd. | | | | | | | | | | | 100 | | | | 3,555 | |
Japan Exchange Group, Inc. | | | | | | | | | | | 1,000 | | | | 18,028 | |
Japan Hotel REIT Investment Corp., REIT | | | | | | | | | | | 7 | | | | 4,635 | |
Japan Post Bank Co. Ltd. | | | | | | | | | | | 800 | | | | 10,132 | |
Japan Post Holdings Co. Ltd. | | | | | | | | | | | 2,400 | | | | 27,764 | |
Japan Post Insurance Co. Ltd. | | | | | | | | | | | 200 | | | | 4,334 | |
Japan Prime Realty Investment Corp., REIT | | | | | | | | | | | 1 | | | | 3,216 | |
Japan Real Estate Investment Corp., REIT | | | | | | | | | | | 2 | | | | 9,376 | |
Japan Retail Fund Investment Corp., REIT | | | | | | | | | | | 5 | | | | 8,873 | |
Japan Tobacco, Inc. | | | | | | | | | | | 2,180 | | | | 72,158 | |
JFE Holdings, Inc. | | | | | | | | | | | 900 | | | | 19,342 | |
JGC Corp. | | | | | | | | | | | 400 | | | | 6,709 | |
JSR Corp. | | | | | | | | | | | 400 | | | | 7,754 | |
JTEKT Corp. | | | | | | | | | | | 400 | | | | 6,628 | |
JXTG Holdings, Inc. | | | | | | | | | | | 5,710 | | | | 29,485 | |
Kajima Corp. | | | | | | | | | | | 1,200 | | | | 12,446 | |
Kakaku.com, Inc. | | | | | | | | | | | 300 | | | | 4,119 | |
Kaken Pharmaceutical Co. Ltd. | | | | | | | | | | | 100 | | | | 5,068 | |
Kamigumi Co. Ltd. | | | | | | | | | | | 180 | | | | 4,309 | |
Kaneka Corp. | | | | | | | | | | | 200 | | | | 1,652 | |
Kansai Electric Power Co., Inc. (The) | | | | | | | | | | | 1,300 | | | | 17,802 | |
Kansai Paint Co. Ltd. | | | | | | | | | | | 380 | | | | 9,767 | |
Kao Corp. | | | | | | | | | | | 870 | | | | 52,579 | |
Kawasaki Heavy Industries Ltd. | | | | | | | | | | | 230 | | | | 8,024 | |
KDDI Corp. | | | | | | | | | | | 3,330 | | | | 88,720 | |
Keihan Holdings Co. Ltd. | | | | | | | | | | | 200 | | | | 6,111 | |
Keikyu Corp. | | | | | | | | | | | 400 | | | | 8,274 | |
Keio Corp. | | | | | | | | | | | 250 | | | | 10,907 | |
Keisei Electric Railway Co. Ltd. | | | | | | | | | | | 250 | | | | 7,552 | |
Kewpie Corp. | | | | | | | | | | | 200 | | | | 4,989 | |
Keyence Corp. | | | | | | | | | | | 154 | | | | 85,505 | |
Kikkoman Corp. | | | | | | | | | | | 330 | | | | 11,326 | |
Kintetsu Group Holdings Co. Ltd. | | | | | | | | | | | 360 | | | | 13,843 | |
Kirin Holdings Co. Ltd. | | | | | | | | | | | 1,480 | | | | 35,526 | |
Kobayashi Pharmaceutical Co. Ltd. | | | | | | | | | | | 140 | | | | 8,095 | |
Kobe Steel Ltd.* | | | | | | | | | | | 600 | | | | 5,066 | |
See Notes to Financial Statements.
| | | | | | | | | | | | | | | | |
| Description | | | | | | | | Shares | | | Value | |
COMMON STOCKS (Continued) | |
| | | | |
Japan (cont’d.) | | | | | | | | | | | | | | | | |
Koito Manufacturing Co. Ltd. | | | | | | | | | | | 220 | | | $ | 14,752 | |
Komatsu Ltd. | | | | | | | | | | | 1,650 | | | | 53,915 | |
Konami Holdings Corp. | | | | | | | | | | | 140 | | | | 6,819 | |
Konica Minolta, Inc. | | | | | | | | | | | 800 | | | | 7,018 | |
Kose Corp. | | | | | | | | | | | 10 | | | | 1,216 | |
Kubota Corp. | | | | | | | | | | | 2,100 | | | | 39,513 | |
Kuraray Co. Ltd. | | | | | | | | | | | 700 | | | | 13,786 | |
Kurita Water Industries Ltd. | | | | | | | | | | | 190 | | | | 6,037 | |
Kyocera Corp. | | | | | | | | | | | 580 | | | | 38,795 | |
Kyowa Hakko Kirin Co. Ltd. | | | | | | | | | | | 540 | | | | 9,968 | |
Kyushu Electric Power Co., Inc. | | | | | | | | | | | 900 | | | | 10,265 | |
Kyushu Railway Co. | | | | | | | | | | | 260 | | | | 8,310 | |
Lawson, Inc. | | | | | | | | | | | 100 | | | | 6,530 | |
LINE Corp.* | | | | | | | | | | | 40 | | | | 1,657 | |
Lion Corp. | | | | | | | | | | | 540 | | | | 10,391 | |
LIXIL Group Corp. | | | | | | | | | | | 430 | | | | 11,843 | |
M3, Inc. | | | | | | | | | | | 380 | | | | 11,334 | |
Mabuchi Motor Co. Ltd. | | | | | | | | | | | 100 | | | | 5,248 | |
Makita Corp. | | | | | | | | | | | 450 | | | | 18,859 | |
Marubeni Corp. | | | | | | | | | | | 2,900 | | | | 19,445 | |
Marui Group Co. Ltd. | | | | | | | | | | | 400 | | | | 6,122 | |
Maruichi Steel Tube Ltd. | | | | | | | | | | | 200 | | | | 6,110 | |
Matsumotokiyoshi Holdings Co. Ltd. | | | | | | | | | | | 30 | | | | 2,157 | |
Mazda Motor Corp. | | | | | | | | | | | 1,100 | | | | 15,879 | |
McDonald’s Holdings Co. Japan Ltd. | | | | | | | | | | | 150 | | | | 6,440 | |
Medipal Holdings Corp. | | | | | | | | | | | 300 | | | | 5,571 | |
MEIJI Holdings Co. Ltd. | | | | | | | | | | | 256 | | | | 20,928 | |
MINEBEA MITSUMI, Inc. | | | | | | | | | | | 800 | | | | 14,666 | |
MISUMI Group, Inc. | | | | | | | | | | | 500 | | | | 13,699 | |
Mitsubishi Chemical Holdings Corp. | | | | | | | | | | | 2,400 | | | | 25,069 | |
Mitsubishi Corp. | | | | | | | | | | | 2,360 | | | | 55,266 | |
Mitsubishi Electric Corp. | | | | | | | | | | | 3,580 | | | | 61,266 | |
Mitsubishi Estate Co. Ltd. | | | | | | | | | | | 2,100 | | | | 38,083 | |
Mitsubishi Gas Chemical Co., Inc. | | | | | | | | | | | 390 | | | | 9,540 | |
Mitsubishi Heavy Industries Ltd. | | | | | | | | | | | 530 | | | | 20,737 | |
Mitsubishi Materials Corp. | | | | | | | | | | | 240 | | | | 9,126 | |
Mitsubishi Motors Corp. | | | | | | | | | | | 1,500 | | | | 12,012 | |
Mitsubishi Tanabe Pharma Corp. | | | | | | | | | | | 440 | | | | 9,684 | |
Mitsubishi UFJ Financial Group, Inc. | | | | | | | | | | | 23,200 | | | | 157,369 | |
Mitsubishi UFJ Lease & Finance Co. Ltd. | | | | | | | | | | | 850 | | | | 4,485 | |
Mitsui & Co. Ltd. | | | | | | | | | | | 3,100 | | | | 46,296 | |
Mitsui Chemicals, Inc. | | | | | | | | | | | 340 | | | | 10,484 | |
See Notes to Financial Statements.
| | | | |
| Prudential QMA International Developed Markets Index Fund | | | 27 | |
Schedule of Investments (continued)
as of October 31, 2017
| | | | | | | | | | | | | | | | |
| Description | | | | | | | | Shares | | | Value | |
COMMON STOCKS (Continued) | |
| | | | |
Japan (cont’d.) | | | | | | | | | | | | | | | | |
Mitsui Fudosan Co. Ltd. | | | | | | | | | | | 1,660 | | | $ | 38,746 | |
Mitsui OSK Lines Ltd. | | | | | | | | | | | 200 | | | | 6,124 | |
Mixi, Inc. | | | | | | | | | | | 180 | | | | 8,775 | |
Mizuho Financial Group, Inc. | | | | | | | | | | | 45,900 | | | | 83,395 | |
MonotaRO Co. Ltd. | | | | | | | | | | | 150 | | | | 4,131 | |
MS&AD Insurance Group Holdings, Inc. | | | | | | | | | | | 900 | | | | 30,575 | |
Murata Manufacturing Co. Ltd. | | | | | | | | | | | 350 | | | | 55,007 | |
Nabtesco Corp. | | | | | | | | | | | 260 | | | | 10,329 | |
Nagoya Railroad Co. Ltd. | | | | | | | | | | | 360 | | | | 8,088 | |
Nankai Electric Railway Co. Ltd. | | | | | | | | | | | 260 | | | | 6,722 | |
NEC Corp. | | | | | | | | | | | 510 | | | | 13,994 | |
Nexon Co. Ltd.* | | | | | | | | | | | 400 | | | | 10,760 | |
NGK Insulators Ltd. | | | | | | | | | | | 530 | | | | 10,495 | |
NGK Spark Plug Co. Ltd. | | | | | | | | | | | 350 | | | | 7,987 | |
NH Foods Ltd. | | | | | | | | | | | 160 | | | | 4,602 | |
NHK Spring Co. Ltd. | | | | | | | | | | | 380 | | | | 4,349 | |
Nidec Corp. | | | | | | | | | | | 380 | | | | 50,534 | |
Nifco, Inc. | | | | | | | | | | | 30 | | | | 1,958 | |
Nikon Corp. | | | | | | | | | | | 670 | | | | 12,724 | |
Nintendo Co. Ltd. | | | | | | | | | | | 176 | | | | 68,281 | |
Nippon Building Fund, Inc., REIT | | | | | | | | | | | 2 | | | | 9,656 | |
Nippon Electric Glass Co. Ltd. | | | | | | | | | | | 170 | | | | 6,941 | |
Nippon Express Co. Ltd. | | | | | | | | | | | 100 | | | | 6,345 | |
Nippon Paint Holdings Co. Ltd. | | | | | | | | | | | 340 | | | | 11,995 | |
Nippon Prologis REIT, Inc., REIT | | | | | | | | | | | 4 | | | | 8,410 | |
Nippon Shinyaku Co. Ltd. | | | | | | | | | | | 120 | | | | 8,504 | |
Nippon Shokubai Co. Ltd. | | | | | | | | | | | 20 | | | | 1,509 | |
Nippon Steel & Sumitomo Metal Corp. | | | | | | | | | | | 1,450 | | | | 34,764 | |
Nippon Telegraph & Telephone Corp. | | | | | | | | | | | 1,220 | | | | 58,984 | |
Nippon Yusen KK* | | | | | | | | | | | 350 | | | | 7,402 | |
Nissan Chemical Industries Ltd. | | | | | | | | | | | 270 | | | | 10,071 | |
Nissan Motor Co. Ltd. | | | | | | | | | | | 3,500 | | | | 34,039 | |
Nisshin Seifun Group, Inc. | | | | | | | | | | | 500 | | | | 8,787 | |
Nissin Foods Holdings Co. Ltd. | | | | | | | | | | | 140 | | | | 8,815 | |
Nitori Holdings Co. Ltd. | | | | | | | | | | | 100 | | | | 14,533 | |
Nitto Denko Corp. | | | | | | | | | | | 290 | | | | 26,966 | |
NOK Corp. | | | | | | | | | | | 250 | | | | 6,141 | |
Nomura Holdings, Inc. | | | | | | | | | | | 6,100 | | | | 34,909 | |
Nomura Real Estate Holdings, Inc. | | | | | | | | | | | 270 | | | | 5,943 | |
Nomura Real Estate Master Fund, Inc., REIT | | | | | | | | | | | 7 | | | | 8,755 | |
Nomura Research Institute Ltd. | | | | | | | | | | | 210 | | | | 8,903 | |
NSK Ltd. | | | | | | | | | | | 900 | | | | 12,959 | |
See Notes to Financial Statements.
| | | | | | | | | | | | | | | | |
| Description | | | | | | | | Shares | | | Value | |
COMMON STOCKS (Continued) | |
| | | | |
Japan (cont’d.) | | | | | | | | | | | | | | | | |
NTN Corp. | | | | | | | | | | | 300 | | | $ | 1,457 | |
NTT Data Corp. | | | | | | | | | | | 1,200 | | | | 13,976 | |
NTT DOCOMO, Inc. | | | | | | | | | | | 2,380 | | | | 57,641 | |
NTT Urban Development Corp. | | | | | | | | | | | 260 | | | | 2,691 | |
Obayashi Corp. | | | | | | | | | | | 1,200 | | | | 15,712 | |
Obic Co. Ltd. | | | | | | | | | | | 150 | | | | 9,929 | |
Odakyu Electric Railway Co. Ltd. | | | | | | | | | | | 600 | | | | 11,737 | |
Oji Holdings Corp. | | | | | | | | | | | 1,700 | | | | 9,964 | |
Olympus Corp. | | | | | | | | | | | 570 | | | | 21,212 | |
Omron Corp. | | | | | | | | | | | 370 | | | | 20,733 | |
Ono Pharmaceutical Co. Ltd. | | | | | | | | | | | 770 | | | | 17,648 | |
Oracle Corp. | | | | | | | | | | | 100 | | | | 8,462 | |
Orient Corp. | | | | | | | | | | | 1,400 | | | | 2,269 | |
Oriental Land Co. Ltd. | | | | | | | | | | | 360 | | | | 28,794 | |
ORIX Corp. | | | | | | | | | | | 2,400 | | | | 41,265 | |
Orix JREIT, Inc., REIT | | | | | | | | | | | 5 | | | | 6,870 | |
Osaka Gas Co. Ltd. | | | | | | | | | | | 740 | | | | 14,333 | |
Otsuka Corp. | | | | | | | | | | | 100 | | | | 6,817 | |
Otsuka Holdings Co. Ltd. | | | | | | | | | | | 780 | | | | 32,584 | |
Panasonic Corp. | | | | | | | | | | | 3,900 | | | | 58,888 | |
Park24 Co. Ltd. | | | | | | | | | | | 200 | | | | 4,623 | |
PeptiDream, Inc.* | | | | | | | | | | | 160 | | | | 5,077 | |
Persol Holdings Co. Ltd. | | | | | | | | | | | 350 | | | | 8,678 | |
Pigeon Corp. | | | | | | | | | | | 200 | | | | 7,098 | |
Pola Orbis Holdings, Inc. | | | | | | | | | | | 170 | | | | 5,419 | |
Rakuten, Inc. | | | | | | | | | | | 1,450 | | | | 15,516 | |
Recruit Holdings Co. Ltd. | | | | | | | | | | | 2,130 | | | | 52,223 | |
Renesas Electronics Corp.* | | | | | | | | | | | 820 | | | | 10,602 | |
Resona Holdings, Inc. | | | | | | | | | | | 3,900 | | | | 21,081 | |
Ricoh Co. Ltd. | | | | | | | | | | | 1,300 | | | | 12,064 | |
Rinnai Corp. | | | | | | | | | | | 30 | | | | 2,570 | |
Rohm Co. Ltd. | | | | | | | | | | | 160 | | | | 14,894 | |
Ryohin Keikaku Co. Ltd. | | | | | | | | | | | 20 | | | | 5,900 | |
Sankyo Co. Ltd. | | | | | | | | | | | 100 | | | | 3,228 | |
Santen Pharmaceutical Co. Ltd. | | | | | | | | | | | 700 | | | | 11,123 | |
Sawai Pharmaceutical Co. Ltd. | | | | | | | | | | | 100 | | | | 5,672 | |
SBI Holdings, Inc. | | | | | | | | | | | 400 | | | | 6,313 | |
SCSK Corp. | | | | | | | | | | | 100 | | | | 4,312 | |
Secom Co. Ltd. | | | | | | | | | | | 360 | | | | 27,411 | |
Sega Sammy Holdings, Inc. | | | | | | | | | | | 350 | | | | 4,927 | |
Seibu Holdings, Inc. | | | | | | | | | | | 450 | | | | 8,045 | |
Seiko Epson Corp. | | | | | | | | | | | 500 | | | | 11,932 | |
See Notes to Financial Statements.
| | | | |
| Prudential QMA International Developed Markets Index Fund | | | 29 | |
Schedule of Investments (continued)
as of October 31, 2017
| | | | | | | | | | | | | | | | |
| Description | | | | | | | | Shares | | | Value | |
COMMON STOCKS (Continued) | |
| | | | |
Japan (cont’d.) | | | | | | | | | | | | | | | | |
Sekisui Chemical Co. Ltd. | | | | | | | | | | | 700 | | | $ | 14,129 | |
Sekisui House Ltd. | | | | | | | | | | | 1,080 | | | | 20,194 | |
Seven & i Holdings Co. Ltd. | | | | | | | | | | | 1,430 | | | | 57,635 | |
Seven Bank Ltd. | | | | | | | | | | | 1,300 | | | | 4,808 | |
Sharp Corp.* | | | | | | | | | | | 240 | | | | 7,635 | |
Shikoku Electric Power Co., Inc. | | | | | | | | | | | 300 | | | | 3,926 | |
Shimadzu Corp. | | | | | | | | | | | 550 | | | | 11,436 | |
Shimamura Co. Ltd. | | | | | | | | | | | 20 | | | | 2,228 | |
Shimano, Inc. | | | | | | | | | | | 140 | | | | 19,158 | |
Shimizu Corp. | | | | | | | | | | | 1,300 | | | | 15,302 | |
Shin-Etsu Chemical Co. Ltd. | | | | | | | | | | | 720 | | | | 75,932 | |
Shinsei Bank Ltd. | | | | | | | | | | | 280 | | | | 4,725 | |
Shionogi & Co. Ltd. | | | | | | | | | | | 520 | | | | 27,995 | |
Shiseido Co. Ltd. | | | | | | | | | | | 680 | | | | 28,048 | |
Shizuoka Bank Ltd. (The) | | | | | | | | | | | 1,260 | | | | 12,262 | |
Showa Shell Sekiyu KK | | | | | | | | | | | 380 | | | | 4,483 | |
SMC Corp. | | | | | | | | | | | 86 | | | | 32,900 | |
SoftBank Group Corp. | | | | | | | | | | | 1,570 | | | | 139,137 | |
Sohgo Security Services Co. Ltd. | | | | | | | | | | | 150 | | | | 7,227 | |
Sojitz Corp. | | | | | | | | | | | 2,200 | | | | 6,640 | |
Sompo Holdings, Inc. | | | | | | | | | | | 680 | | | | 27,333 | |
Sony Corp. | | | | | | | | | | | 2,290 | | | | 95,801 | |
Sony Financial Holdings, Inc. | | | | | | | | | | | 380 | | | | 6,313 | |
Sotetsu Holdings, Inc. | | | | | | | | | | | 200 | | | | 5,160 | |
Square Enix Holdings Co. Ltd. | | | | | | | | | | | 140 | | | | 5,646 | |
Stanley Electric Co. Ltd. | | | | | | | | | | | 300 | | | | 11,074 | |
Start Today Co. Ltd. | | | | | | | | | | | 340 | | | | 9,312 | |
Subaru Corp. | | | | | | | | | | | 1,110 | | | | 38,350 | |
Sugi Holdings Co. Ltd. | | | | | | | | | | | 100 | | | | 5,075 | |
SUMCO Corp. | | | | | | | | | | | 380 | | | | 8,370 | |
Sumitomo Chemical Co. Ltd. | | | | | | | | | | | 2,300 | | | | 16,164 | |
Sumitomo Corp. | | | | | | | | | | | 2,100 | | | | 30,375 | |
Sumitomo Dainippon Pharma Co. Ltd. | | | | | | | | | | | 300 | | | | 4,282 | |
Sumitomo Electric Industries Ltd. | | | | | | | | | | | 1,370 | | | | 23,325 | |
Sumitomo Heavy Industries Ltd. | | | | | | | | | | | 160 | | | | 6,722 | |
Sumitomo Metal Mining Co. Ltd. | | | | | | | | | | | 450 | | | | 17,753 | |
Sumitomo Mitsui Financial Group, Inc. | | | | | | | | | | | 2,450 | | | | 98,154 | |
Sumitomo Mitsui Trust Holdings, Inc. | | | | | | | | | | | 700 | | | | 27,629 | |
Sumitomo Realty & Development Co. Ltd. | | | | | | | | | | | 620 | | | | 20,765 | |
Sumitomo Rubber Industries Ltd. | | | | | | | | | | | 400 | | | | 7,595 | |
Sundrug Co. Ltd. | | | | | | | | | | | 80 | | | | 3,481 | |
Suntory Beverage & Food Ltd. | | | | | | | | | | | 250 | | | | 11,503 | |
See Notes to Financial Statements.
| | | | | | | | | | | | | | | | |
| Description | | | | | | | | Shares | | | Value | |
COMMON STOCKS (Continued) | |
| | | | |
Japan (cont’d.) | | | | | | | | | | | | | | | | |
Suruga Bank Ltd. | | | | | | | | | | | 400 | | | $ | 9,107 | |
Suzuken Co. Ltd. | | | | | | | | | | | 180 | | | | 6,489 | |
Suzuki Motor Corp. | | | | | | | | | | | 740 | | | | 40,532 | |
Sysmex Corp. | | | | | | | | | | | 240 | | | | 16,426 | |
T&D Holdings, Inc. | | | | | | | | | | | 1,100 | | | | 17,161 | |
Taiheiyo Cement Corp. | | | | | | | | | | | 240 | | | | 9,593 | |
Taisei Corp. | | | | | | | | | | | 400 | | | | 22,163 | |
Taisho Pharmaceutical Holdings Co. Ltd. | | | | | | | | | | | 80 | | | | 6,093 | |
Taiyo Nippon Sanso Corp. | | | | | | | | | | | 320 | | | | 3,842 | |
Takashimaya Co. Ltd. | | | | | | | | | | | 400 | | | | 3,680 | |
Takeda Pharmaceutical Co. Ltd. | | | | | | | | | | | 1,400 | | | | 78,939 | |
TDK Corp. | | | | | | | | | | | 260 | | | | 19,978 | |
Teijin Ltd. | | | | | | | | | | | 340 | | | | 7,196 | |
Terumo Corp. | | | | | | | | | | | 540 | | | | 22,502 | |
THK Co. Ltd. | | | | | | | | | | | 200 | | | | 7,295 | |
Tobu Railway Co. Ltd. | | | | | | | | | | | 400 | | | | 11,735 | |
Toho Co. Ltd. | | | | | | | | | | | 200 | | | | 6,626 | |
Toho Gas Co. Ltd. | | | | | | | | | | | 240 | | | | 6,710 | |
Tohoku Electric Power Co., Inc. | | | | | | | | | | | 880 | | | | 11,545 | |
Tokio Marine Holdings, Inc. | | | | | | | | | | | 1,260 | | | | 54,315 | |
Tokyo Broadcasting System Holdings, Inc. | | | | | | | | | | | 100 | | | | 2,036 | |
Tokyo Century Corp. | | | | | | | | | | | 100 | | | | 4,362 | |
Tokyo Electric Power Co. Holdings, Inc.* | | | | | | | | | | | 3,000 | | | | 12,314 | |
Tokyo Electron Ltd. | | | | | | | | | | | 270 | | | | 47,542 | |
Tokyo Gas Co. Ltd. | | | | | | | | | | | 740 | | | | 18,460 | |
Tokyo Tatemono Co. Ltd. | | | | | | | | | | | 410 | | | | 5,752 | |
Tokyu Corp. | | | | | | | | | | | 1,000 | | | | 15,127 | |
Tokyu Fudosan Holdings Corp. | | | | | | | | | | | 1,000 | | | | 6,556 | |
Toppan Printing Co. Ltd. | | | | | | | | | | | 700 | | | | 7,122 | |
Toray Industries, Inc. | | | | | | | | | | | 2,790 | | | | 28,239 | |
Toshiba Corp.* | | | | | | | | | | | 7,100 | | | | 20,527 | |
Tosoh Corp. | | | | | | | | | | | 650 | | | | 14,027 | |
TOTO Ltd. | | | | | | | | | | | 300 | | | | 14,692 | |
Toyo Seikan Group Holdings Ltd. | | | | | | | | | | | 350 | | | | 6,191 | |
Toyo Suisan Kaisha Ltd. | | | | | | | | | | | 220 | | | | 8,463 | |
Toyoda Gosei Co. Ltd. | | | | | | | | | | | 210 | | | | 5,135 | |
Toyota Boshoku Corp. | | | | | | | | | | | 130 | | | | 2,618 | |
Toyota Industries Corp. | | | | | | | | | | | 320 | | | | 19,696 | |
Toyota Motor Corp. | | | | | | | | | | | 4,750 | | | | 294,624 | |
Toyota Tsusho Corp. | | | | | | | | | | | 420 | | | | 15,276 | |
Trend Micro, Inc. | | | | | | | | | | | 230 | | | | 12,333 | |
Tsuruha Holdings, Inc. | | | | | | | | | | | 20 | | | | 2,480 | |
See Notes to Financial Statements.
| | | | |
| Prudential QMA International Developed Markets Index Fund | | | 31 | |
Schedule of Investments (continued)
as of October 31, 2017
| | | | | | | | | | | | | | | | |
| Description | | | | | | | | Shares | | | Value | |
COMMON STOCKS (Continued) | |
| | | | |
Japan (cont’d.) | | | | | | | | | | | | | | | | |
Unicharm Corp. | | | | | | | | | | | 700 | | | $ | 15,929 | |
United Urban Investment Corp., REIT | | | | | | | | | | | 6 | | | | 8,632 | |
USS Co. Ltd. | | | | | | | | | | | 400 | | | | 8,086 | |
Welcia Holdings Co. Ltd. | | | | | | | | | | | 90 | | | | 3,416 | |
West Japan Railway Co. | | | | | | | | | | | 360 | | | | 25,386 | |
Yahoo Japan Corp. | | | | | | | | | | | 2,500 | | | | 11,177 | |
Yakult Honsha Co. Ltd. | | | | | | | | | | | 150 | | | | 12,402 | |
Yamada Denki Co. Ltd. | | | | | | | | | | | 1,400 | | | | 7,447 | |
Yamaha Corp. | | | | | | | | | | | 360 | | | | 14,145 | |
Yamaha Motor Co. Ltd. | | | | | | | | | | | 560 | | | | 16,807 | |
Yamato Holdings Co. Ltd. | | | | | | | | | | | 690 | | | | 14,108 | |
Yamazaki Baking Co. Ltd. | | | | | | | | | | | 300 | | | | 5,400 | |
Yaskawa Electric Corp. | | | | | | | | | | | 460 | | | | 16,482 | |
Yokogawa Electric Corp. | | | | | | | | | | | 500 | | | | 9,498 | |
Yokohama Rubber Co. Ltd. (The) | | | | | | | | | | | 230 | | | | 5,171 | |
| | | | | | | | | | | | | | | | |
| | | | | | | | | | | | | | | 6,633,138 | |
| | | | |
Luxembourg 0.3% | | | | | | | | | | | | | | | | |
APERAM SA | | | | | | | | | | | 88 | | | | 4,732 | |
ArcelorMittal* | | | | | | | | | | | 1,086 | | | | 31,098 | |
B&M European Value Retail SA | | | | | | | | | | | 1,483 | | | | 7,825 | |
Eurofins Scientific SE | | | | | | | | | | | 17 | | | | 10,634 | |
L’Occitane International SA | | | | | | | | | | | 750 | | | | 1,425 | |
RTL Group SA | | | | | | | | | | | 73 | | | | 5,424 | |
SES SA | | | | | | | | | | | 628 | | | | 10,214 | |
Tenaris SA | | | | | | | | | | | 858 | | | | 11,713 | |
Ternium SA, ADR | | | | | | | | | | | 81 | | | | 2,512 | |
| | | | | | | | | | | | | | | | |
| | | | | | | | | | | | | | | 85,577 | |
| | | | |
Macau 0.0% | | | | | | | | | | | | | | | | |
MGM China Holdings Ltd. | | | | | | | | | | | 1,200 | | | | 2,707 | |
Wynn Macau Ltd. | | | | | | | | | | | 2,800 | | | | 7,189 | |
| | | | | | | | | | | | | | | | |
| | | | | | | | | | | | | | | 9,896 | |
| | | | |
Malta 0.0% | | | | | | | | | | | | | | | | |
Kindred Group PLC, SDR | | | | | | | | | | | 404 | | | | 5,159 | |
| | | | |
Netherlands 4.0% | | | | | | | | | | | | | | | | |
Aalberts Industries NV | | | | | | | | | | | 175 | | | | 8,629 | |
ABN AMRO Group NV, CVA, 144A | | | | | | | | | | | 755 | | | | 23,318 | |
Aegon NV | | | | | | | | | | | 3,088 | | | | 18,231 | |
Akzo Nobel NV | | | | | | | | | | | 456 | | | | 41,168 | |
See Notes to Financial Statements.
| | | | | | | | | | | | | | | | |
| Description | | | | | | | | Shares | | | Value | |
COMMON STOCKS (Continued) | |
| | | | |
Netherlands (cont’d.) | | | | | | | | | | | | | | | | |
Altice NV (Class A Stock)* | | | | | | | | | | | 1,148 | | | $ | 21,650 | |
Altice NV (Class B Stock)* | | | | | | | | | | | 146 | | | | 2,753 | |
ASM International NV | | | | | | | | | | | 91 | | | | 6,098 | |
ASML Holding NV | | | | | | | | | | | 574 | | | | 103,566 | |
ASR Nederland NV | | | | | | | | | | | 265 | | | | 10,864 | |
Axfood AB | | | | | | | | | | | 165 | | | | 2,983 | |
Boskalis Westminster | | | | | | | | | | | 157 | | | | 5,612 | |
Euronext NV, 144A | | | | | | | | | | | 122 | | | | 7,246 | |
EXOR NV | | | | | | | | | | | 186 | | | | 11,924 | |
Gemalto NV | | | | | | | | | | | 149 | | | | 5,897 | |
GrandVision NV, 144A | | | | | | | | | | | 86 | | | | 2,146 | |
HAL Trust | | | | | | | | | | | 146 | | | | 27,071 | |
Heineken Holding NV | | | | | | | | | | | 187 | | | | 17,358 | |
Heineken NV | | | | | | | | | | | 426 | | | | 41,506 | |
ING Groep NV | | | | | | | | | | | 7,089 | | | | 131,001 | |
InterXion Holding NV* | | | | | | | | | | | 108 | | | | 5,766 | |
Koninklijke Ahold Delhaize NV | | | | | | | | | | | 2,302 | | | | 43,313 | |
Koninklijke DSM NV | | | | | | | | | | | 317 | | | | 27,046 | |
Koninklijke KPN NV | | | | | | | | | | | 5,573 | | | | 19,176 | |
Koninklijke Philips NV | | | | | | | | | | | 1,696 | | | | 69,117 | |
Koninklijke Vopak NV | | | | | | | | | | | 125 | | | | 5,410 | |
NN Group NV | | | | | | | | | | | 610 | | | | 25,545 | |
OCI NV* | | | | | | | | | | | 152 | | | | 3,606 | |
Philips Lighting NV, 144A | | | | | | | | | | | 163 | | | | 6,178 | |
Randstad Holding NV | | | | | | | | | | | 202 | | | | 12,427 | |
Royal Dutch Shell PLC (Class A Stock) | | | | | | | | | | | 8,175 | | | | 257,412 | |
Royal Dutch Shell PLC (Class B Stock) | | | | | | | | | | | 6,860 | | | | 220,873 | |
SBM Offshore NV | | | | | | | | | | | 338 | | | | 6,032 | |
VEON Ltd., ADR | | | | | | | | | | | 461 | | | | 1,802 | |
Wolters Kluwer NV | | | | | | | | | | | 521 | | | | 25,536 | |
| | | | | | | | | | | | | | | | |
| | | | | | | | | | | | | | | 1,218,260 | |
| | | | |
New Zealand 0.2% | | | | | | | | | | | | | | | | |
Auckland International Airport Ltd. | | | | | | | | | | | 1,599 | | | | 6,815 | |
Contact Energy Ltd. | | | | | | | | | | | 1,287 | | | | 5,065 | |
Fisher & Paykel Healthcare Corp. Ltd. | | | | | | | | | | | 1,013 | | | | 9,188 | |
Fletcher Building Ltd. | | | | | | | | | | | 1,262 | | | | 6,366 | |
Fonterra Co-operative Group Ltd., UTS | | | | | | | | | | | 206 | | | | 898 | |
Mercury NZ Ltd. | | | | | | | | | | | 1,077 | | | | 2,425 | |
Meridian Energy Ltd. | | | | | | | | | | | 2,450 | | | | 4,780 | |
Ryman Healthcare Ltd. | | | | | | | | | | | 802 | | | | 5,106 | |
Spark New Zealand Ltd. | | | | | | | | | | | 3,231 | | | | 8,140 | |
| | | | | | | | | | | | | | | | |
| | | | | | | | | | | | | | | 48,783 | |
See Notes to Financial Statements.
| | | | |
| Prudential QMA International Developed Markets Index Fund | | | 33 | |
Schedule of Investments (continued)
as of October 31, 2017
| | | | | | | | | | | | | | | | |
| Description | | | | | | | | Shares | | | Value | |
COMMON STOCKS (Continued) | |
| | | | |
Norway 0.6% | | | | | | | | | | | | | | | | |
DNB ASA | | | | | | | | | | | 1,945 | | | $ | 37,537 | |
Gjensidige Forsikring ASA | | | | | | | | | | | 323 | | | | 6,079 | |
Kongsberg Gruppen ASA | | | | | | | | | | | 117 | | | | 2,136 | |
Leroy Seafood Group ASA | | | | | | | | | | | 420 | | | | 2,522 | |
Marine Harvest ASA* | | | | | | | | | | | 714 | | | | 13,944 | |
Norsk Hydro ASA | | | | | | | | | | | 2,377 | | | | 18,394 | |
Orkla ASA | | | | | | | | | | | 1,395 | | | | 13,664 | |
Salmar ASA | | | | | | | | | | | 87 | | | | 2,594 | |
Schibsted ASA (Class A Stock) | | | | | | | | | | | 169 | | | | 4,357 | |
Schibsted ASA (Class B Stock) | | | | | | | | | | | 187 | | | | 4,388 | |
Statoil ASA | | | | | | | | | | | 1,741 | | | | 35,373 | |
Telenor ASA | | | | | | | | | | | 1,229 | | | | 26,096 | |
Yara International ASA | | | | | | | | | | | 310 | | | | 14,723 | |
| | | | | | | | | | | | | | | | |
| | | | | | | | | | | | | | | 181,807 | |
| | | | |
Portugal 0.2% | | | | | | | | | | | | | | | | |
Banco Comercial Portugues SA (Class R Stock)* | | | | | | | | | | | 15,312 | | | | 4,576 | |
EDP—Energias de Portugal SA | | | | | | | | | | | 4,282 | | | | 15,270 | |
Galp Energia SGPS SA | | | | | | | | | | | 920 | | | | 17,105 | |
Jeronimo Martins SGPS SA | | | | | | | | | | | 421 | | | | 7,649 | |
Navigator Co. SA (The) | | | | | | | | | | | 406 | | | | 2,071 | |
NOS SGPS SA | | | | | | | | | | | 376 | | | | 2,253 | |
Sonae SGPS SA | | | | | | | | | | | 1,496 | | | | 1,791 | |
| | | | | | | | | | | | | | | | |
| | | | | | | | | | | | | | | 50,715 | |
| | | | |
Russia 0.1% | | | | | | | | | | | | | | | | |
Evraz PLC | | | | | | | | | | | 765 | | | | 2,932 | |
X5 Retail Group NV, GDR* | | | | | | | | | | | 181 | | | | 7,439 | |
Yandex NV (Class A Stock)* | | | | | | | | | | | 512 | | | | 17,321 | |
| | | | | | | | | | | | | | | | |
| | | | | | | | | | | | | | | 27,692 | |
| | | | |
Singapore 1.2% | | | | | | | | | | | | | | | | |
Ascendas Real Estate Investment Trust, REIT | | | | | | | | | | | 4,100 | | | | 8,244 | |
BOC Aviation Ltd., 144A | | | | | | | | | | | 500 | | | | 2,689 | |
CapitaLand Commercial Trust, REIT | | | | | | | | | | | 4,197 | | | | 5,346 | |
CapitaLand Ltd. | | | | | | | | | | | 4,400 | | | | 11,849 | |
CapitaLand Mall Trust, REIT | | | | | | | | | | | 4,200 | | | | 6,226 | |
City Developments Ltd. | | | | | | | | | | | 900 | | | | 8,547 | |
ComfortDelGro Corp. Ltd. | | | | | | | | | | | 3,600 | | | | 5,337 | |
DBS Group Holdings Ltd. | | | | | | | | | | | 3,232 | | | | 53,970 | |
First Resources Ltd. | | | | | | | | | | | 700 | | | | 1,012 | |
Frasers Centrepoint Ltd. | | | | | | | | | | | 500 | | | | 763 | |
See Notes to Financial Statements.
| | | | | | | | | | | | | | | | |
| Description | | | | | | | | Shares | | | Value | |
COMMON STOCKS (Continued) | |
| | | | |
Singapore (cont’d.) | | | | | | | | | | | | | | | | |
Genting Singapore PLC | | | | | | | | | | | 10,300 | | | $ | 9,219 | |
Global Logistic Properties Ltd. | | | | | | | | | | | 5,200 | | | | 12,667 | |
Great Eastern Holdings Ltd. | | | | | | | | | | | 240 | | | | 4,619 | |
Jardine Cycle & Carriage Ltd. | | | | | | | | | | | 200 | | | | 5,783 | |
Keppel, REIT | | | | | | | | | | | 4,300 | | | | 3,707 | |
Keppel Corp. Ltd. | | | | | | | | | | | 2,700 | | | | 14,862 | |
Olam International Ltd. | | | | | | | | | | | 800 | | | | 1,380 | |
Oversea-Chinese Banking Corp. Ltd. | | | | | | | | | | | 5,900 | | | | 51,528 | |
SATS Ltd. | | | | | | | | | | | 1,200 | | | | 4,139 | |
Sembcorp Industries Ltd. | | | | | | | | | | | 1,600 | | | | 3,875 | |
Sembcorp Marine Ltd. | | | | | | | | | | | 1,300 | | | | 1,843 | |
SIA Engineering Co. Ltd. | | | | | | | | | | | 300 | | | | 718 | |
Singapore Airlines Ltd. | | | | | | | | | | | 900 | | | | 6,783 | |
Singapore Exchange Ltd. | | | | | | | | | | | 1,600 | | | | 9,004 | |
Singapore Post Ltd. | | | | | | | | | | | 2,400 | | | | 2,262 | |
Singapore Press Holdings Ltd. | | | | | | | | | | | 3,000 | | | | 5,941 | |
Singapore Technologies Engineering Ltd. | | | | | | | | | | | 2,800 | | | | 7,148 | |
Singapore Telecommunications Ltd. | | | | | | | | | | | 13,400 | | | | 36,876 | |
StarHub Ltd. | | | | | | | | | | | 1,200 | | | | 2,316 | |
Suntec Real Estate Investment Trust, REIT | | | | | | | | | | | 4,500 | | | | 6,442 | |
United Industrial Corp. Ltd. | | | | | | | | | | | 800 | | | | 1,933 | |
United Overseas Bank Ltd. | | | | | | | | | | | 2,357 | | | | 42,581 | |
UOL Group Ltd. | | | | | | | | | | | 900 | | | | 5,968 | |
Wilmar International Ltd. | | | | | | | | | | | 3,800 | | | | 9,456 | |
| | | | | | | | | | | | | | | | |
| | | | | | | | | | | | | | | 355,033 | |
| | | | |
South Africa 0.1% | | | | | | | | | | | | | | | | |
Investec PLC | | | | | | | | | | | 1,233 | | | | 8,437 | |
Mondi PLC | | | | | | | | | | | 663 | | | | 16,034 | |
| | | | | | | | | | | | | | | | |
| | | | | | | | | | | | | | | 24,471 | |
| | | | |
Spain 3.1% | | | | | | | | | | | | | | | | |
Abertis Infraestructuras SA | | | | | | | | | | | 1,121 | | | | 24,246 | |
Acciona SA | | | | | | | | | | | 54 | | | | 4,471 | |
Acerinox SA | | | | | | | | | | | 239 | | | | 3,434 | |
ACS Actividades de Construccion y Servicios SA | | | | | | | | | | | 437 | | | | 17,226 | |
Aena SME SA, 144a, 144A | | | | | | | | | | | 114 | | | | 20,916 | |
Almirall SA | | | | | | | | | | | 128 | | | | 1,239 | |
Amadeus IT Group SA | | | | | | | | | | | 747 | | | | 50,683 | |
Atresmedia Corp. de Medios de Comunicacion SA | | | | | | | | | | | 150 | | | | 1,541 | |
Banco Bilbao Vizcaya Argentaria SA | | | | | | | | | | | 12,157 | | | | 106,307 | |
Banco de Sabadell SA | | | | | | | | | | | 9,987 | | | | 19,996 | |
See Notes to Financial Statements.
| | | | |
| Prudential QMA International Developed Markets Index Fund | | | 35 | |
Schedule of Investments (continued)
as of October 31, 2017
| | | | | | | | | | | | | | | | |
| Description | | | | | | | | Shares | | | Value | |
COMMON STOCKS (Continued) | |
| | | | |
Spain (cont’d.) | | | | | | | | | | | | | | | | |
Banco Santander SA* | | | | | | | | | | | 28,712 | | | $ | 194,648 | |
Bankia SA | | | | | | | | | | | 2,167 | | | | 10,341 | |
Bankinter SA | | | | | | | | | | | 1,305 | | | | 12,315 | |
Bolsas y Mercados Espanoles SHMSF SA | | | | | | | | | | | 140 | | | | 4,809 | |
CaixaBank SA | | | | | | | | | | | 6,490 | | | | 30,363 | |
Cellnex Telecom SA, 144A | | | | | | | | | | | 298 | | | | 7,397 | |
Cia de Distribucion Integral Logista Holdings SA | | | | | | | | | | | 81 | | | | 1,898 | |
Corp Financiera Alba SA | | | | | | | | | | | 32 | | | | 1,874 | |
Distribuidora Internacional de Alimentacion SA | | | | | | | | | | | 1,071 | | | | 5,238 | |
Ebro Foods SA | | | | | | | | | | | 109 | | | | 2,622 | |
EDP Renovaveis SA | | | | | | | | | | | 265 | | | | 2,191 | |
Enagas SA | | | | | | | | | | | 433 | | | | 12,472 | |
Endesa SA | | | | | | | | | | | 573 | | | | 13,115 | |
Ferrovial SA* | | | | | | | | | | | 872 | | | | 18,937 | |
Fomento de Construcciones y Contratas SA* | | | | | | | | | | | 110 | | | | 1,166 | |
Gas Natural SDG SA | | | | | | | | | | | 562 | | | | 12,025 | |
Gestamp Automocion SA, 144A* | | | | | | | | | | | 246 | | | | 1,634 | |
Grifols SA | | | | | | | | | | | 586 | | | | 18,339 | |
Grupo Catalana Occidente SA | | | | | | | | | | | 70 | | | | 2,947 | |
Iberdrola SA | | | | | | | | | | | 10,239 | | | | 82,742 | |
Industria de Diseno Textil SA | | | | | | | | | | | 1,930 | | | | 72,140 | |
Mapfre SA | | | | | | | | | | | 1,886 | | | | 6,168 | |
Mediaset Espana Comunicacion SA | | | | | | | | | | | 287 | | | | 3,119 | |
Melia Hotels International SA | | | | | | | | | | | 172 | | | | 2,353 | |
Merlin Properties Socimi SA, REIT | | | | | | | | | | | 622 | | | | 8,213 | |
Obrascon Huarte Lain SA* | | | | | | | | | | | 192 | | | | 1,077 | |
Prosegur Cash SA, 144A* | | | | | | | | | | | 593 | | | | 1,933 | |
Prosegur Cia de Seguridad SA | | | | | | | | | | | 418 | | | | 3,190 | |
Red Electrica Corp. SA | | | | | | | | | | | 779 | | | | 17,249 | |
Repsol SA | | | | | | | | | | | 2,091 | | | | 39,184 | |
Siemens Gamesa Renewable Energy SA | | | | | | | | | | | 421 | | | | 6,104 | |
Tecnicas Reunidas SA | | | | | | | | | | | 64 | | | | 2,061 | |
Telefonica SA | | | | | | | | | | | 8,021 | | | | 84,104 | |
Zardoya Otis SA | | | | | | | | | | | 283 | | | | 3,066 | |
| | | | | | | | | | | | | | | | |
| | | | | | | | | | | | | | | 937,093 | |
| | | | |
Sweden 2.7% | | | | | | | | | | | | | | | | |
AAK AB | | | | | | | | | | | 45 | | | | 3,637 | |
Ahlsell AB, 144A | | | | | | | | | | | 594 | | | | 3,932 | |
Alfa Laval AB | | | | | | | | | | | 573 | | | | 14,511 | |
Assa Abloy AB (Class B Stock) | | | | | | | | | | | 1,690 | | | | 35,630 | |
Atlas Copco AB (Class A Stock) | | | | | | | | | | | 1,137 | | | | 49,859 | |
See Notes to Financial Statements.
| | | | | | | | | | | | | | | | |
| Description | | | | | | | | Shares | | | Value | |
COMMON STOCKS (Continued) | |
| | | | |
Sweden (cont’d.) | | | | | | | | | | | | | | | | |
Atlas Copco AB (Class B Stock) | | | | | | | | | | | 682 | | | $ | 27,074 | |
Autoliv, Inc.(a) | | | | | | | | | | | 162 | | | | 20,227 | |
Axis Communications AB | | | | | | | | | | | 40 | | | | 1,751 | |
BillerudKorsnas AB | | | | | | | | | | | 344 | | | | 5,921 | |
Boliden AB | | | | | | | | | | | 488 | | | | 17,076 | |
Castellum AB | | | | | | | | | | | 470 | | | | 7,542 | |
Electrolux AB (Class B Stock) | | | | | | | | | | | 411 | | | | 14,527 | |
Elekta AB (Class B Stock) | | | | | | | | | | | 674 | | | | 6,481 | |
Essity AB (Class A Stock)* | | | | | | | | | | | 48 | | | | 1,431 | |
Essity AB (Class B Stock)* | | | | | | | | | | | 1,069 | | | | 31,952 | |
Fabege AB | | | | | | | | | | | 259 | | | | 5,469 | |
Fastighets AB Balder (Class B Stock)* | | | | | | | | | | | 194 | | | | 5,050 | |
Fingerprint Cards AB (Class B Stock)* | | | | | | | | | | | 359 | | | | 888 | |
Getinge AB (Class B Stock) | | | | | | | | | | | 404 | | | | 7,952 | |
Hennes & Mauritz AB (Class B Stock) | | | | | | | | | | | 1,707 | | | | 42,837 | |
Hexagon AB (Class B Stock) | | | | | | | | | | | 464 | | | | 23,792 | |
Hexpol AB | | | | | | | | | | | 458 | | | | 4,632 | |
Holmen AB (Class B Stock) | | | | | | | | | | | 103 | | | | 5,062 | |
Hufvudstaden AB (Class A Stock) | | | | | | | | | | | 173 | | | | 2,847 | |
Husqvarna AB (Class B Stock) | | | | | | | | | | | 693 | | | | 6,770 | |
ICA Gruppen AB | | | | | | | | | | | 148 | | | | 5,458 | |
Investment AB Latour (Class B Stock) | | | | | | | | | | | 206 | | | | 2,862 | |
L E Lundbergforetagen AB (Class B Stock) | | | | | | | | | | | 68 | | | | 5,308 | |
Lifco AB (Class B Stock) | | | | | | | | | | | 76 | | | | 2,724 | |
Lundin Petroleum AB* | | | | | | | | | | | 306 | | | | 7,199 | |
Melker Schorling AB | | | | | | | | | | | 17 | | | | 1,174 | |
Modern Times Group MTG AB (Class B Stock) | | | | | | | | | | | 83 | | | | 3,166 | |
NCC AB (Class A Stock) | | | | | | | | | | | 33 | | | | 711 | |
NCC AB (Class B Stock) | | | | | | | | | | | 197 | | | | 4,250 | |
Nibe Industrier AB (Class B Stock) | | | | | | | | | | | 696 | | | | 6,960 | |
Nordea Bank AB | | | | | | | | | | | 5,745 | | | | 69,427 | |
Ratos AB (Class B Stock) | | | | | | | | | | | 435 | | | | 2,088 | |
Saab AB (Class B Stock) | | | | | | | | | | | 70 | | | | 3,576 | |
Sandvik AB | | | | | | | | | | | 1,941 | | | | 35,430 | |
Securitas AB (Class B Stock) | | | | | | | | | | | 565 | | | | 9,913 | |
Skandinaviska Enskilda Banken AB (Class A Stock) | | | | | | | | | | | 2,582 | | | | 31,820 | |
Skanska AB (Class B Stock) | | | | | | | | | | | 639 | | | | 14,012 | |
SKF AB (Class A Stock) | | | | | | | | | | | 33 | | | | 768 | |
SKF AB (Class B Stock) | | | | | | | | | | | 671 | | | | 15,593 | |
SSAB AB (Class A Stock)* | | | | | | | | | | | 390 | | | | 1,915 | |
SSAB AB (Class B Stock)* | | | | | | | | | | | 854 | | | | 3,443 | |
Svenska Cellulosa AB SCA (Class A Stock) | | | | | | | | | | | 22 | | | | 214 | |
See Notes to Financial Statements.
| | | | |
| Prudential QMA International Developed Markets Index Fund | | | 37 | |
Schedule of Investments (continued)
as of October 31, 2017
| | | | | | | | | | | | | | | | |
| Description | | | | | | | | Shares | | | Value | |
COMMON STOCKS (Continued) | |
| | | | |
Sweden (cont’d.) | | | | | | | | | | | | | | | | |
Svenska Cellulosa AB SCA (Class B Stock) | | | | | | | | | | | 1,144 | | | $ | 10,742 | |
Svenska Handelsbanken AB (Class A Stock) | | | | | | | | | | | 2,640 | | | | 37,837 | |
Svenska Handelsbanken AB (Class B Stock) | | | | | | | | | | | 44 | | | | 636 | |
Swedbank AB (Class A Stock) | | | | | | | | | | | 1,896 | | | | 47,054 | |
Swedish Match AB | | | | | | | | | | | 315 | | | | 11,866 | |
Swedish Orphan Biovitrum AB* | | | | | | | | | | | 331 | | | | 4,905 | |
Tele2 AB (Class B Stock) | | | | | | | | | | | 607 | | | | 7,721 | |
Telefonaktiebolaget LM Ericsson (Class A Stock) | | | | | | | | | | | 104 | | | | 656 | |
Telefonaktiebolaget LM Ericsson (Class B Stock) | | | | | | | | | | | 5,340 | | | | 33,605 | |
Telia Co. AB | | | | | | | | | | | 4,668 | | | | 21,606 | |
Trelleborg AB (Class B Stock) | | | | | | | | | | | 425 | | | | 10,525 | |
Volvo AB (Class A Stock) | | | | | | | | | | | 390 | | | | 7,724 | |
Volvo AB (Class B Stock) | | | | | | | | | | | 2,879 | | | | 57,022 | |
Wallenstam AB (Class B Stock) | | | | | | | | | | | 317 | | | | 2,961 | |
| | | | | | | | | | | | | | | | |
| | | | | | | | | | | | | | | 829,721 | |
| | | | |
Switzerland 8.0% | | | | | | | | | | | | | | | | |
ABB Ltd. | | | | | | | | | | | 3,516 | | | | 91,820 | |
Adecco Group AG | | | | | | | | | | | 300 | | | | 23,801 | |
Allreal Holding AG* | | | | | | | | | | | 26 | | | | 4,346 | |
Alpiq Holding AG* | | | | | | | | | | | 18 | | | | 1,155 | |
Aryzta AG* | | | | | | | | | | | 158 | | | | 5,016 | |
Baloise Holding AG | | | | | | | | | | | 88 | | | | 13,874 | |
Banque Cantonale Vaudoise | | | | | | | | | | | 5 | | | | 3,595 | |
Barry Callebaut AG* | | | | | | | | | | | 4 | | | | 6,250 | |
Basellandschaftliche Kantonalbank | | | | | | | | | | | 1 | | | | 908 | |
Basler Kantonalbank | | | | | | | | | | | 21 | | | | 1,464 | |
Berner Kantonalbank AG | | | | | | | | | | | 10 | | | | 1,805 | |
Bucher Industries AG | | | | | | | | | | | 11 | | | | 4,304 | |
Chocoladefabriken Lindt & Spruengli AG | | | | | | | | | | | 2 | | | | 11,578 | |
Cie Financiere Richemont SA | | | | | | | | | | | 929 | | | | 85,641 | |
Clariant AG* | | | | | | | | | | | 519 | | | | 13,058 | |
Coca-Cola HBC AG* | | | | | | | | | | | 375 | | | | 12,674 | |
Credit Suisse Group AG* | | | | | | | | | | | 4,687 | | | | 73,862 | |
DKSH Holding AG | | | | | | | | | | | 55 | | | | 4,614 | |
dormakaba Holding AG* | | | | | | | | | | | 6 | | | | 5,939 | |
Dufry AG* | | | | | | | | | | | 60 | | | | 8,931 | |
Emmi AG* | | | | | | | | | | | 3 | | | | 1,873 | |
EMS-Chemie Holding AG | | | | | | | | | | | 13 | | | | 8,522 | |
Ferguson PLC | | | | | | | | | | | 463 | | | | 32,377 | |
Flughafen Zurich AG | | | | | | | | | | | 34 | | | | 7,394 | |
GAM Holding AG* | | | | | | | | | | | 294 | | | | 4,583 | |
See Notes to Financial Statements.
| | | | | | | | | | | | | | | | |
| Description | | | | | | | | Shares | | | Value | |
COMMON STOCKS (Continued) | |
| | | | |
Switzerland (cont’d.) | | | | | | | | | | | | | | | | |
Geberit AG | | | | | | | | | | | 66 | | | $ | 29,882 | |
Georg Fischer AG | | | | | | | | | | | 8 | | | | 9,857 | |
Givaudan SA | | | | | | | | | | | 17 | | | | 37,966 | |
Glencore PLC* | | | | | | | | | | | 21,245 | | | | 102,468 | |
Helvetia Holding AG | | | | | | | | | | | 12 | | | | 6,451 | |
Idorsia Ltd.* | | | | | | | | | | | 162 | | | | 3,193 | |
IWG PLC | | | | | | | | | | | 1,211 | | | | 3,465 | |
Julius Baer Group Ltd.* | | | | | | | | | | | 389 | | | | 23,008 | |
Kuehne + Nagel International AG | | | | | | | | | | | 90 | | | | 15,724 | |
LafargeHolcim Ltd.* | | | | | | | | | | | 868 | | | | 49,011 | |
Lonza Group AG* | | | | | | | | | | | 134 | | | | 35,599 | |
Luzerner Kantonalbank AG | | | | | | | | | | | 4 | | | | 1,802 | |
Nestle SA | | | | | | | | | | | 5,658 | | | | 476,056 | |
Novartis AG | | | | | | | | | | | 4,292 | | | | 354,001 | |
OC Oerlikon Corp. AG* | | | | | | | | | | | 352 | | | | 5,647 | |
Panalpina Welttransport Holding AG | | | | | | | | | | | 28 | | | | 3,848 | |
Partners Group Holding AG | | | | | | | | | | | 31 | | | | 20,850 | |
PSP Swiss Property AG | | | | | | | | | | | 75 | | | | 6,601 | |
Roche Holding AG (TRQX) | | | | | | | | | | | 50 | | | | 11,619 | |
Roche Holding AG (XBRN) | | | | | | | | | | | 1,269 | | | | 293,305 | |
Schindler Holding AG (AQXE) | | | | | | | | | | | 72 | | | | 16,316 | |
Schindler Holding AG (TRQX) | | | | | | | | | | | 35 | | | | 7,730 | |
SFS Group AG* | | | | | | | | | | | 36 | | | | 4,267 | |
SGS SA | | | | | | | | | | | 9 | | | | 22,226 | |
Sika AG | | | | | | | | | | | 4 | | | | 29,606 | |
Sonova Holding AG | | | | | | | | | | | 90 | | | | 16,248 | |
St Galler Kantonalbank AG | | | | | | | | | | | 5 | | | | 2,258 | |
STMicroelectronics NV | | | | | | | | | | | 1,128 | | | | 26,569 | |
Straumann Holding AG | | | | | | | | | | | 19 | | | | 13,266 | |
Sulzer AG | | | | | | | | | | | 21 | | | | 2,690 | |
Sunrise Communications Group AG, 144A* | | | | | | | | | | | 62 | | | | 5,158 | |
Swatch Group AG (The) (AQXE) | | | | | | | | | | | 54 | | | | 21,165 | |
Swatch Group AG (The) (TRQX) | | | | | | | | | | | 80 | | | | 6,030 | |
Swiss Life Holding AG* | | | | | | | | | | | 58 | | | | 20,159 | |
Swiss Prime Site AG* | | | | | | | | | | | 136 | | | | 11,613 | |
Swiss Re AG | | | | | | | | | | | 561 | | | | 52,796 | |
Swisscom AG | | | | | | | | | | | 41 | | | | 20,714 | |
Temenos Group AG* | | | | | | | | | | | 103 | | | | 11,894 | |
UBS Group AG* | | | | | | | | | | | 6,326 | | | | 107,625 | |
Vifor Pharma AG | | | | | | | | | | | 91 | | | | 11,704 | |
Zurich Insurance Group AG | | | | | | | | | | | 275 | | | | 83,920 | |
| | | | | | | | | | | | | | | | |
| | | | | | | | | | | | | | | 2,413,691 | |
See Notes to Financial Statements.
| | | | |
| Prudential QMA International Developed Markets Index Fund | | | 39 | |
Schedule of Investments (continued)
as of October 31, 2017
| | | | | | | | | | | | | | | | |
| Description | | | | | | | | Shares | | | Value | |
COMMON STOCKS (Continued) | |
| | | | |
Taiwan 0.0% | | | | | | | | | | | | | | | | |
Fit Hon Teng Ltd., 144A* | | | | | | | | | | | 2,000 | | | $ | 1,364 | |
| | | | |
United Kingdom 15.1% | | | | | | | | | | | | | | | | |
3i Group PLC | | | | | | | | | | | 1,689 | | | | 21,555 | |
AA PLC | | | | | | | | | | | 958 | | | | 2,179 | |
Admiral Group PLC | | | | | | | | | | | 355 | | | | 9,069 | |
Aggreko PLC | | | | | | | | | | | 439 | | | | 5,463 | |
Anglo American PLC | | | | | | | | | | | 2,027 | | | | 38,235 | |
Ashmore Group PLC | | | | | | | | | | | 825 | | | | 4,218 | |
Ashtead Group PLC | | | | | | | | | | | 929 | | | | 23,930 | |
ASOS PLC* | | | | | | | | | | | 94 | | | | 7,111 | |
Associated British Foods PLC | | | | | | | | | | | 621 | | | | 27,485 | |
AstraZeneca PLC | | | | | | | | | | | 2,320 | | | | 156,973 | |
Auto Trader Group PLC, 144A | | | | | | | | | | | 1,626 | | | | 7,394 | |
Aviva PLC | | | | | | | | | | | 7,336 | | | | 49,213 | |
Babcock International Group PLC | | | | | | | | | | | 420 | | | | 4,529 | |
BAE Systems PLC | | | | | | | | | | | 5,754 | | | | 45,326 | |
Balfour Beatty PLC | | | | | | | | | | | 1,278 | | | | 4,649 | |
Barclays PLC | | | | | | | | | | | 31,066 | | | | 76,662 | |
Barratt Developments PLC | | | | | | | | | | | 1,796 | | | | 15,616 | |
BBA Aviation PLC | | | | | | | | | | | 1,823 | | | | 7,701 | |
Beazley PLC | | | | | | | | | | | 968 | | | | 6,493 | |
Bellway PLC | | | | | | | | | | | 218 | | | | 10,570 | |
Berkeley Group Holdings PLC | | | | | | | | | | | 224 | | | | 11,131 | |
Booker Group PLC | | | | | | | | | | | 2,882 | | | | 7,700 | |
BP PLC | | | | | | | | | | | 35,036 | | | | 237,636 | |
British American Tobacco PLC | | | | | | | | | | | 4,166 | | | | 269,163 | |
British Land Co. PLC (The), REIT | | | | | | | | | | | 1,838 | | | | 14,675 | |
Britvic PLC | | | | | | | | | | | 484 | | | | 4,865 | |
BT Group PLC | | | | | | | | | | | 15,466 | | | | 53,288 | |
BTG PLC* | | | | | | | | | | | 726 | | | | 7,268 | |
Bunzl PLC | | | | | | | | | | | 606 | | | | 18,877 | |
Burberry Group PLC | | | | | | | | | | | 805 | | | | 20,332 | |
Capita PLC | | | | | | | | | | | 1,158 | | | | 8,064 | |
Capital & Counties Properties PLC | | | | | | | | | | | 1,355 | | | | 4,792 | |
Centrica PLC | | | | | | | | | | | 10,111 | | | | 22,802 | |
Close Brothers Group PLC | | | | | | | | | | | 291 | | | | 5,367 | |
CNH Industrial NV | | | | | | | | | | | 1,705 | | | | 21,753 | |
Cobham PLC* | | | | | | | | | | | 4,701 | | | | 8,676 | |
Coca-Cola European Partners PLC | | | | | | | | | | | 401 | | | | 16,385 | |
Compass Group PLC | | | | | | | | | | | 2,856 | | | | 62,701 | |
ConvaTec Group PLC, 144A | | | | | | | | | | | 2,318 | | | | 6,031 | |
See Notes to Financial Statements.
| | | | | | | | | | | | | | | | |
| Description | | | | | | | | Shares | | | Value | |
COMMON STOCKS (Continued) | |
| | | | |
United Kingdom (cont’d.) | | | | | | | | | | | | | | | | |
Croda International PLC | | | | | | | | | | | 234 | | | $ | 13,004 | |
CYBG PLC* | | | | | | | | | | | 1,662 | | | | 6,951 | |
Daily Mail & General Trust PLC (Class A Stock) | | | | | | | | | | | 550 | | | | 5,065 | |
DCC PLC | | | | | | | | | | | 159 | | | | 15,078 | |
Derwent London PLC, REIT | | | | | | | | | | | 186 | | | | 6,611 | |
Diageo PLC | | | | | | | | | | | 4,526 | | | | 154,557 | |
Dialog Semiconductor PLC* | | | | | | | | | | | 138 | | | | 6,895 | |
Direct Line Insurance Group PLC | | | | | | | | | | | 2,600 | | | | 12,832 | |
Dixons Carphone PLC | | | | | | | | | | | 1,865 | | | | 4,296 | |
Drax Group PLC | | | | | | | | | | | 643 | | | | 2,372 | |
DS Smith PLC | | | | | | | | | | | 1,737 | | | | 12,013 | |
Dunelm Group PLC | | | | | | | | | | | 237 | | | | 2,304 | |
easyJet PLC | | | | | | | | | | | 408 | | | | 7,256 | |
Essentra PLC | | | | | | | | | | | 413 | | | | 2,920 | |
Experian PLC | | | | | | | | | | | 1,682 | | | | 35,437 | |
Fiat Chrysler Automobiles NV* | | | | | | | | | | | 1,947 | | | | 33,666 | |
G4S PLC | | | | | | | | | | | 2,671 | | | | 9,967 | |
GKN PLC | | | | | | | | | | | 3,126 | | | | 13,176 | |
GlaxoSmithKline PLC | | | | | | | | | | | 8,798 | | | | 157,900 | |
Great Portland Estates PLC, REIT | | | | | | | | | | | 600 | | | | 4,956 | |
Greene King PLC | | | | | | | | | | | 642 | | | | 4,613 | |
Halma PLC | | | | | | | | | | | 666 | | | | 10,450 | |
Hammerson PLC, REIT | | | | | | | | | | | 1,546 | | | | 10,762 | |
Hargreaves Lansdown PLC | | | | | | | | | | | 425 | | | | 8,928 | |
Hays PLC | | | | | | | | | | | 2,578 | | | | 6,382 | |
Hiscox Ltd. | | | | | | | | | | | 493 | | | | 9,349 | |
Howden Joinery Group PLC | | | | | | | | | | | 1,111 | | | | 6,050 | |
HSBC Holdings PLC | | | | | | | | | | | 36,579 | | | | 357,197 | |
IG Group Holdings PLC | | | | | | | | | | | 652 | | | | 5,658 | |
IMI PLC | | | | | | | | | | | 467 | | | | 7,577 | |
Imperial Brands PLC | | | | | | | | | | | 1,726 | | | | 70,371 | |
Inchcape PLC | | | | | | | | | | | 722 | | | | 7,494 | |
Indivior PLC* | | | | | | | | | | | 1,328 | | | | 6,553 | |
Informa PLC | | | | | | | | | | | 1,453 | | | | 13,449 | |
Inmarsat PLC | | | | | | | | | | | 783 | | | | 6,459 | |
InterContinental Hotels Group PLC | | | | | | | | | | | 343 | | | | 19,003 | |
Intermediate Capital Group PLC | | | | | | | | | | | 524 | | | | 6,766 | |
International Consolidated Airlines Group SA | | | | | | | | | | | 1,883 | | | | 15,903 | |
Intertek Group PLC | | | | | | | | | | | 292 | | | | 21,036 | |
Intu Properties PLC, REIT | | | | | | | | | | | 1,729 | | | | 4,964 | |
ITV PLC | | | | | | | | | | | 6,635 | | | | 14,503 | |
J Sainsbury PLC | | | | | | | | | | | 2,845 | | | | 9,161 | |
See Notes to Financial Statements.
| | | | |
| Prudential QMA International Developed Markets Index Fund | | | 41 | |
Schedule of Investments (continued)
as of October 31, 2017
| | | | | | | | | | | | | | | | |
| Description | | | | | | | | Shares | | | Value | |
COMMON STOCKS (Continued) | |
| | | | |
United Kingdom (cont’d.) | | | | | | | | | | | | | | | | |
Janus Henderson Group PLC*(a) | | | | | | | | | | | 347 | | | $ | 12,058 | |
Jardine Lloyd Thompson Group PLC | | | | | | | | | | | 192 | | | | 3,323 | |
JD Sports Fashion PLC | | | | | | | | | | | 575 | | | | 2,731 | |
John Wood Group PLC | | | | | | | | | | | 1,162 | | | | 10,988 | |
Johnson Matthey PLC | | | | | | | | | | | 348 | | | | 15,624 | |
Jupiter Fund Management PLC | | | | | | | | | | | 808 | | | | 6,375 | |
Just Eat PLC* | | | | | | | | | | | 1,012 | | | | 10,484 | |
Kingfisher PLC | | | | | | | | | | | 3,953 | | | | 16,435 | |
Land Securities Group PLC, REIT | | | | | | | | | | | 1,288 | | | | 16,543 | |
Legal & General Group PLC | | | | | | | | | | | 10,693 | | | | 37,913 | |
Liberty Global PLC (Class A Stock)* | | | | | | | | | | | 433 | | | | 13,358 | |
Liberty Global PLC (Class C Stock)* | | | | | | | | | | | 1,084 | | | | 32,401 | |
Liberty Global PLC LiLAC (Class A Stock)* | | | | | | | | | | | 87 | | | | 1,890 | |
Liberty Global PLC LiLAC (Class C Stock)* | | | | | | | | | | | 212 | | | | 4,664 | |
Lloyds Banking Group PLC | | | | | | | | | | | 130,075 | | | | 117,904 | |
London Stock Exchange Group PLC | | | | | | | | | | | 565 | | | | 28,215 | |
Man Group PLC | | | | | | | | | | | 2,956 | | | | 7,602 | |
Manchester United PLC (Class A Stock) | | | | | | | | | | | 81 | | | | 1,454 | |
Marks & Spencer Group PLC | | | | | | | | | | | 2,952 | | | | 13,492 | |
Meggitt PLC | | | | | | | | | | | 1,491 | | | | 10,264 | |
Merlin Entertainments PLC, 144A | | | | | | | | | | | 1,221 | | | | 6,142 | |
Metro Bank PLC* | | | | | | | | | | | 150 | | | | 7,083 | |
Micro Focus International PLC | | | | | | | | | | | 787 | | | | 27,643 | |
Millennium & Copthorne Hotels PLC | | | | | | | | | | | 304 | | | | 2,443 | |
Moneysupermarket.com Group PLC | | | | | | | | | | | 1,094 | | | | 4,720 | |
National Grid PLC | | | | | | | | | | | 6,310 | | | | 75,956 | |
NEX Group PLC | | | | | | | | | | | 578 | | | | 4,864 | |
Next PLC | | | | | | | | | | | 255 | | | | 16,668 | |
Ocado Group PLC* | | | | | | | | | | | 702 | | | | 2,682 | |
Old Mutual PLC | | | | | | | | | | | 8,590 | | | | 21,790 | |
Pearson PLC | | | | | | | | | | | 1,497 | | | | 13,978 | |
Pennon Group PLC | | | | | | | | | | | 722 | | | | 7,615 | |
Persimmon PLC | | | | | | | | | | | 569 | | | | 21,176 | |
Petrofac Ltd. | | | | | | | | | | | 423 | | | | 2,357 | |
Phoenix Group Holdings | | | | | | | | | | | 690 | | | | 6,935 | |
Playtech PLC | | | | | | | | | | | 545 | | | | 7,121 | |
Provident Financial PLC | | | | | | | | | | | 260 | | | | 3,218 | |
Prudential PLC | | | | | | | | | | | 4,707 | | | | 115,535 | |
Randgold Resources Ltd. | | | | | | | | | | | 174 | | | | 17,098 | |
Reckitt Benckiser Group PLC | | | | | | | | | | | 1,134 | | | | 101,455 | |
RELX NV | | | | | | | | | | | 1,616 | | | | 36,484 | |
RELX PLC | | | | | | | | | | | 1,920 | | | | 44,181 | |
See Notes to Financial Statements.
| | | | | | | | | | | | | | | | |
| Description | | | | | | | | Shares | | | Value | |
COMMON STOCKS (Continued) | |
| | | | |
United Kingdom (cont’d.) | | | | | | | | | | | | | | | | |
Rentokil Initial PLC | | | | | | | | | | | 3,349 | | | $ | 14,934 | |
Rightmove PLC | | | | | | | | | | | 162 | | | | 8,937 | |
Rio Tinto Ltd. | | | | | | | | | | | 773 | | | | 41,190 | |
Rio Tinto PLC | | | | | | | | | | | 2,164 | | | | 102,272 | |
Rolls-Royce Holdings PLC* | | | | | | | | | | | 2,969 | | | | 38,368 | |
Rolls-Royce Holdings PLC-ENT | | | | | | | | | | | 136,574 | | | | 181 | |
Rotork PLC | | | | | | | | | | | 1,572 | | | | 5,486 | |
Royal Bank of Scotland Group PLC* | | | | | | | | | | | 5,826 | | | | 21,886 | |
Royal Mail PLC | | | | | | | | | | | 1,579 | | | | 7,846 | |
RPC Group PLC | | | | | | | | | | | 728 | | | | 9,111 | |
RSA Insurance Group PLC | | | | | | | | | | | 1,810 | | | | 15,114 | |
Saga PLC | | | | | | | | | | | 2,155 | | | | 5,469 | |
Sage Group PLC (The) | | | | | | | | | | | 1,955 | | | | 19,352 | |
Schroders PLC (AQXE) | | | | | | | | | | | 198 | | | | 9,187 | |
Schroders PLC (SGMX) | | | | | | | | | | | 82 | | | | 2,742 | |
Segro PLC, REIT | | | | | | | | | | | 1,815 | | | | 13,103 | |
Serco Group PLC* | | | | | | | | | | | 1,763 | | | | 2,731 | |
Severn Trent PLC | | | | | | | | | | | 447 | | | | 12,534 | |
Shaftesbury PLC, REIT | | | | | | | | | | | 452 | | | | 5,947 | |
Sky PLC* | | | | | | | | | | | 1,940 | | | | 24,297 | |
Smith & Nephew PLC | | | | | | | | | | | 1,582 | | | | 29,839 | |
Smiths Group PLC | | | | | | | | | | | 711 | | | | 14,836 | |
Spectris PLC | | | | | | | | | | | 210 | | | | 7,140 | |
Spirax-Sarco Engineering PLC | | | | | | | | | | | 129 | | | | 9,680 | |
Sports Direct International PLC* | | | | | | | | | | | 516 | | | | 2,710 | |
SSE PLC | | | | | | | | | | | 1,845 | | | | 33,885 | |
St. James’s Place PLC | | | | | | | | | | | 932 | | | | 14,567 | |
Stagecoach Group PLC | | | | | | | | | | | 892 | | | | 1,976 | |
Standard Chartered PLC* | | | | | | | | | | | 4,871 | | | | 48,514 | |
Standard Life Aberdeen PLC | | | | | | | | | | | 5,001 | | | | 28,537 | |
Subsea 7 SA | | | | | | | | | | | 451 | | | | 7,603 | |
TalkTalk Telecom Group PLC | | | | | | | | | | | 900 | | | | 2,552 | |
Tate & Lyle PLC | | | | | | | | | | | 812 | | | | 6,975 | |
Taylor Wimpey PLC | | | | | | | | | | | 5,822 | | | | 15,429 | |
TechnipFMC PLC* | | | | | | | | | | | 827 | | | | 22,486 | |
Tesco PLC | | | | | | | | | | | 14,760 | | | | 35,565 | |
Thomas Cook Group PLC | | | | | | | | | | | 2,264 | | | | 3,602 | |
Travis Perkins PLC | | | | | | | | | | | 447 | | | | 9,023 | |
UBM PLC | | | | | | | | | | | 729 | | | | 6,810 | |
Unilever NV, CVA | | | | | | | | | | | 2,792 | | | | 162,187 | |
Unilever PLC | | | | | | | | | | | 2,147 | | | | 121,679 | |
United Utilities Group PLC | | | | | | | | | | | 1,225 | | | | 13,553 | |
See Notes to Financial Statements.
| | | | |
| Prudential QMA International Developed Markets Index Fund | | | 43 | |
Schedule of Investments (continued)
as of October 31, 2017
| | | | | | | | | | | | | | | | |
| Description | | | | | | | | Shares | | | Value | |
COMMON STOCKS (Continued) | |
| | | | |
United Kingdom (cont’d.) | | | | | | | | | | | | | | | | |
Vodafone Group PLC | | | | | | | | | | | 48,509 | | | $ | 138,752 | |
Weir Group PLC (The) | | | | | | | | | | | 424 | | | | 10,992 | |
WH Smith PLC | | | | | | | | | | | 212 | | | | 5,764 | |
Whitbread PLC | | | | | | | | | | | 331 | | | | 16,234 | |
William Hill PLC | | | | | | | | | | | 1,681 | | | | 5,768 | |
Wm Morrison Supermarkets PLC | | | | | | | | | | | 3,935 | | | | 11,715 | |
Worldpay Group PLC, 144A | | | | | | | | | | | 3,393 | | | | 18,290 | |
WPP PLC | | | | | | | | | | | 2,238 | | | | 39,566 | |
| | | | | | | | | | | | | | | | |
| | | | | | | | | | | | | | | 4,573,539 | |
| | | | |
United States 0.8% | | | | | | | | | | | | | | | | |
Carnival PLC | | | | | | | | | | | 325 | | | | 21,427 | |
Core Laboratories NV | | | | | | | | | | | 85 | | | | 8,492 | |
Flex Ltd.* | | | | | | | | | | | 958 | | | | 17,052 | |
ICON PLC* | | | | | | | | | | | 95 | | | | 11,292 | |
Jazz Pharmaceuticals PLC* | | | | | | | | | | | 97 | | | | 13,728 | |
Samsonite International SA | | | | | | | | | | | 2,400 | | | | 10,020 | |
Seagate Technology PLC | | | | | | | | | | | 527 | | | | 19,483 | |
Shire PLC | | | | | | | | | | | 1,630 | | | | 80,286 | |
Taro Pharmaceutical Industries Ltd.* | | | | | | | | | | | 23 | | | | 2,586 | |
TE Connectivity Ltd. | | | | | | | | | | | 638 | | | | 58,039 | |
| | | | | | | | | | | | | | | | |
| | | | | | | | | | | | | | | 242,405 | |
| | | | | | | | | | | | | | | | |
TOTAL COMMON STOCKS
(cost $24,196,899) | | | | | | | | | | | | | | | 28,024,050 | |
| | | | | | | | | | | | | | | | |
| | | | |
PREFERRED STOCKS 0.6% | | | | | | | | | | | | | | | | |
| | | | |
Germany 0.5% | | | | | | | | | | | | | | | | |
Bayerische Motoren Werke AG (PRFC) | | | | | | | | | | | 96 | | | | 8,423 | |
FUCHS PETROLUB SE (PRFC) | | | | | | | | | | | 122 | | | | 6,870 | |
Henkel AG & Co. KGaA (PRFC) | | | | | | | | | | | 316 | | | | 44,372 | |
Jungheinrich AG (PRFC) | | | | | | | | | | | 101 | | | | 4,600 | |
MAN SE (PRFC) | | | | | | | | | | | 16 | | | | 1,746 | |
Porsche Automobil Holding SE (PRFC) | | | | | | | | | | | 272 | | | | 19,904 | |
RWE AG (PRFC) | | | | | | | | | | | 60 | | | | 1,138 | |
Sartorius AG (PRFC) | | | | | | | | | | | 65 | | | | 6,069 | |
Schaeffler AG (PRFC) | | | | | | | | | | | 157 | | | | 2,503 | |
Volkswagen AG (PRFC) | | | | | | | | | | | 332 | | | | 60,790 | |
| | | | | | | | | | | | | | | | |
| | | | | | | | | | | | | | | 156,415 | |
See Notes to Financial Statements.
| | | | | | | | | | | | | | | | |
| Description | | | | | | | | Shares | | | Value | |
PREFERRED STOCKS (Continued) | |
| | | | |
Japan 0.0% | | | | | | | | | | | | | | | | |
Ito En Ltd. (PRFC) | | | | | | | | | | | 100 | | | $ | 1,787 | |
Shinkin Central Bank (PRFC A) | | | | | | | | | | | 2 | | | | 4,094 | |
| | | | | | | | | | | | | | | | |
| | | | | | | | | | | | | | | 5,881 | |
| | | | |
Spain 0.1% | | | | | | | | | | | | | | | | |
Grifols SA (PRFC B) | | | | | | | | | | | 454 | | | | 10,663 | |
| | | | | | | | | | | | | | | | |
TOTAL PREFERRED STOCKS
(cost $138,182) | | | | | | | | | | | | | | | 172,959 | |
| | | | | | | | | | | | | | | | |
| | | | |
EXCHANGE TRADED FUND 2.1% | | | | | | | | | | | | | | | | |
| | | | |
United States | | | | | | | | | | | | | | | | |
iShares MSCI EAFE ETF
(cost $558,883) | | | | | | | | | | | 9,170 | | | | 638,507 | |
| | | | | | | | | | | | | | | | |
| | | | |
| | | | | | | | | Units | | | | |
| | | | |
RIGHTS* 0.0% | | | | | | | | | | | | | | | | |
| | | | |
Spain | | | | | | | | | | | | | | | | |
Banco Santander SA, expiring 11/01/17 | | | | | | | | | | | 28,552 | | | | 1,364 | |
Ferrovial SA, expiring 11/13/17 | | | | | | | | | | | 872 | | | | 419 | |
| | | | | | | | | | | | | | | | |
TOTAL RIGHTS
(cost $1,753) | | | | | | | | | | | | | | | 1,783 | |
| | | | | | | | | | | | | | | | |
TOTAL LONG-TERM INVESTMENTS
(cost $24,895,717) | | | | | | | | | | | | | | | 28,837,299 | |
| | | | | | | | | | | | | | | | |
| | | | |
| | | | | | | | | Shares | | | | |
| | | | |
SHORT-TERM INVESTMENTS 2.7% | | | | | | | | | | | | | | | | |
| | | | |
AFFILIATED MUTUAL FUNDS 2.4% | | | | | | | | | | | | | | | | |
Prudential Investment Portfolios 2 - Prudential Core Ultra Short Bond Fund(w) | | | | | | | | | | | 729,158 | | | | 729,158 | |
Prudential Investment Portfolios 2 - Prudential Institutional Money Market Fund (cost $16,877; includes $16,856 of cash collateral for securities on loan)(b)(w) | | | | | | | | | | | 16,875 | | | | 16,877 | |
| | | | | | | | | | | | | | | | |
TOTAL AFFILIATED MUTUAL FUNDS
(cost $746,035) | | | | | | | | | | | | | | | 746,035 | |
| | | | | | | | | | | | | | | | |
See Notes to Financial Statements.
| | | | |
| Prudential QMA International Developed Markets Index Fund | | | 45 | |
Schedule of Investments (continued)
as of October 31, 2017
| | | | | | | | | | | | | | | | |
| Description | | Interest
Rate | | | Maturity
Date | | | Principal
Amount (000)# | | | Value | |
SHORT-TERM INVESTMENTS (Continued) | | | | | | | | | | | | | | | | |
| | | | |
U.S. TREASURY OBLIGATION(n) 0.3% | | | | | | | | | | | | | | | | |
U.S. Treasury Bills(k)
(cost $79,887) | | | 1.015 | % | | | 12/21/17 | | | | 80 | | | $ | 79,893 | |
| | | | | | | | | | | | | | | | |
TOTAL SHORT-TERM INVESTMENTS
(cost $825,922) | | | | | | | | | | | | | | | 825,928 | |
| | | | | | | | | | | | | | | | |
TOTAL INVESTMENTS 97.8%
(cost $25,721,639) | | | | | | | | | | | | | | | 29,663,227 | |
Other assets in excess of liabilities(z) 2.2% | | | | | | | | | | | | | | | 657,058 | |
| | | | | | | | | | | | | | | | |
NET ASSETS 100.0% | | | | | | | | | | | | | | $ | 30,320,285 | |
| | | | | | | | | | | | | | | | |
The following abbreviations are used in the annual report:
144A—Security was purchased pursuant to Rule 144A under the Securities Act of 1933 and may not be resold subject to that rule except to qualified institutional buyers. Unless otherwise noted, 144A securities are deemed to be liquid.
ADR—American Depositary Receipt
AQXE—Aquis Exchange
CDI—Chess Depository Interest
CVA—Certificate Van Aandelen (Bearer)
EAFE—Europe, Australasia and Far East
ETF—Exchange Traded Fund
FTSE—Financial Times Stock Exchange
GDR—Global Depositary Receipt
MSCI—Morgan Stanley Capital International
OTC—Over-the-counter
PRFC—Preference Shares
REIT—Real Estate Investment Trust
SDR—Swedish Depositary Receipt
SGMX—Sigma X MTF
STOXX—Stock Index of the Eurozone
TOPIX—Tokyo Stock Price Index
TRQX—Turquoise Exchange
UTS—Unit Trust Security
XBRN—BX Worldcaps Exchange
| * | Non-income producing security. |
| ^ | Indicates a Level 3 security. The aggregate value of Level 3 securities is $1,346 and 0.0% of net assets. |
| # | Principal amount is shown in U.S. dollars unless otherwise stated. |
| (a) | All or a portion of security is on loan. The aggregate market value of such securities, including those sold and pending settlement, is $16,692; cash collateral of $16,856 (included in liabilities) was received with which the Fund purchased highly liquid short-term investments. |
| (b) | Represents security purchased with cash collateral received for securities on loan and includes dividend reinvestment. |
| (k) | Represents security, or a portion thereof, segregated as collateral for centrally cleared/exchange-traded derivatives. |
| (n) | Rate shown is the effective yield at purchase date. |
| (w) | PGIM Investments LLC, the manager of the Fund, also serves as manager of the Prudential Investment Portfolios 2 - Prudential Core Ultra Short Bond Fund and Prudential Institutional Money Market Fund. |
| (z) | Includes net unrealized appreciation (depreciation) on the following derivative contracts held at reporting period end: |
See Notes to Financial Statements.
Futures contracts outstanding at October 31, 2017:
| | | | | | | | | | | | | | | | | | | | |
Number of
Contracts | | | Type | | Expiration
Date | | | Value at
Trade Date | | | Current
Notional
Amount | | | Value/
Unrealized
Appreciation
(Depreciation) | |
| | | | Long Positions: | | | | | | | | | | | | | | | | |
| | 6 | | | Euro STOXX 50 Index | | | Dec. 2017 | | | $ | 244,199 | | | $ | 257,059 | | | $ | 12,860 | |
| | 1 | | | FTSE 100 Index | | | Dec. 2017 | | | | 97,844 | | | | 99,179 | | | | 1,335 | |
| | 7 | | | Mini MSCI EAFE Index | | | Dec. 2017 | | | | 688,234 | | | | 702,590 | | | | 14,356 | |
| | 1 | | | TOPIX Index | | | Dec. 2017 | | | | 138,208 | | | | 155,050 | | | | 16,842 | |
| | | | | | | | | | | | | | | | | | | | |
| | | | | | | | | | | | | | | | | | $ | 45,393 | |
| | | | | | | | | | | | | | | | | | | | |
Foreign currency of $1,178 and a security with a market value of $79,893 have been segregated with Morgan Stanley to cover requirements for open futures contracts at October 31, 2017.
Fair Value Measurements:
Various inputs are used in determining the value of the Fund’s investments. These inputs are summarized in the three broad levels listed below.
Level 1—unadjusted quoted prices generally in active markets for identical securities.
Level 2—quoted prices for similar securities, interest rates and yield curves, prepayment speeds, foreign currency exchange rates and other observable inputs.
Level 3—unobservable inputs for securities valued in accordance with Board approved fair valuation procedures.
The following is a summary of the inputs used as of October 31, 2017 in valuing such portfolio securities:
| | | | | | | | | | | | |
| | | Level 1 | | | Level 2 | | | Level 3 | |
Investments in Securities | | | | | | | | | | | | |
Common Stocks | | | | | | | | | | | | |
Australia | | $ | — | | | $ | 1,844,526 | | | $ | — | |
Austria | | | — | | | | 92,031 | | | | — | |
Belgium | | | — | | | | 350,006 | | | | — | |
Chile | | | — | | | | 8,098 | | | | — | |
China | | | — | | | | 106,831 | | | | — | |
Colombia | | | — | | | | 11,639 | | | | — | |
Denmark | | | — | | | | 518,685 | | | | — | |
Finland | | | — | | | | 294,127 | | | | — | |
France | | | 4,842 | | | | 2,716,478 | | | | — | |
See Notes to Financial Statements.
| | | | |
| Prudential QMA International Developed Markets Index Fund | | | 47 | |
Schedule of Investments (continued)
as of October 31, 2017
| | | | | | | | | | | | |
| | | Level 1 | | | Level 2 | | | Level 3 | |
Investments in Securities (continued) | | | | | | | | | | | | |
Common Stocks (continued) | | | | | | | | | | | | |
Germany | | $ | 3,004 | | | $ | 2,558,136 | | | $ | — | |
Ghana | | | — | | | | 6,301 | | | | — | |
Hong Kong | | | 66,122 | | | | 831,485 | | | | 1,346 | |
Ireland | | | 14,213 | | | | 156,976 | | | | — | |
Isle of Man | | | — | | | | 6,904 | | | | — | |
Israel | | | 26,249 | | | | 88,977 | | | | — | |
Italy | | | — | | | | 678,730 | | | | — | |
Japan | | | — | | | | 6,633,138 | | | | — | |
Luxembourg | | | 2,512 | | | | 83,065 | | | | — | |
Macau | | | — | | | | 9,896 | | | | — | |
Malta | | | — | | | | 5,159 | | | | — | |
Netherlands | | | 7,568 | | | | 1,210,692 | | | | — | |
New Zealand | | | — | | | | 48,783 | | | | — | |
Norway | | | — | | | | 181,807 | | | | — | |
Portugal | | | — | | | | 50,715 | | | | — | |
Russia | | | 24,760 | | | | 2,932 | | | | — | |
Singapore | | | — | | | | 355,033 | | | | — | |
South Africa | | | — | | | | 24,471 | | | | — | |
Spain | | | — | | | | 937,093 | | | | — | |
Sweden | | | 20,227 | | | | 809,494 | | | | — | |
Switzerland | | | — | | | | 2,413,691 | | | | — | |
Taiwan | | | — | | | | 1,364 | | | | — | |
United Kingdom | | | 82,210 | | | | 4,491,329 | | | | — | |
United States | | | 130,672 | | | | 111,733 | | | | — | |
Preferred Stocks | | | | | | | | | | | | |
Germany | | | — | | | | 156,415 | | | | — | |
Japan | | | — | | | | 5,881 | | | | — | |
Spain | | | — | | | | 10,663 | | | | — | |
Exchange Traded Fund | | | | | | | | | | | | |
United States | | | 638,507 | | | | — | | | | — | |
Rights | | | | | | | | | | | | |
Spain | | | 1,783 | | | | — | | | | — | |
Affiliated Mutual Funds | | | 746,035 | | | | — | | | | — | |
U.S. Treasury Obligation | | | — | | | | 79,893 | | | | — | |
Other Financial Instruments* | | | | | | | | | | | | |
Futures Contracts | | | 45,393 | | | | — | | | | — | |
| | | | | | | | | | | | |
Total | | $ | 1,814,097 | | | $ | 27,893,177 | | | $ | 1,346 | |
| | | | | | | | | | | | |
| * | Other financial instruments are derivative instruments not reflected in the Schedule of Investments, such as futures, forwards and centrally cleared swap contracts, which are recorded at the unrealized appreciation (depreciation) on the instrument, and OTC swap contracts which are recorded at fair value. |
See Notes to Financial Statements.
During the period, there were no transfers between Level 1, Level 2 and Level 3 to report.
Industry Classification:
The industry classification of investments and other assets in excess of liabilities shown as a percentage of net assets as of October 31, 2017 were as follows (unaudited):
| | | | |
Banks | | | 11.2 | % |
Pharmaceuticals | | | 6.6 | |
Insurance | | | 5.0 | |
Oil, Gas & Consumable Fuels | | | 4.4 | |
Chemicals | | | 3.6 | |
Automobiles | | | 3.2 | |
Machinery | | | 2.9 | |
Food Products | | | 2.8 | |
Metals & Mining | | | 2.7 | |
Capital Markets | | | 2.5 | |
Affiliated Mutual Funds (including 0.1% of collateral for securities on loan) | | | 2.4 | |
Exchange Traded Fund | | | 2.1 | |
Beverages | | | 2.1 | |
Diversified Telecommunication Services | | | 2.1 | |
Real Estate Management & Development | | | 2.0 | |
Electronic Equipment, Instruments & Components | | | 1.7 | |
Textiles, Apparel & Luxury Goods | | | 1.7 | |
Personal Products | | | 1.6 | |
Electric Utilities | | | 1.6 | |
Equity Real Estate Investment Trusts (REITs) | | | 1.5 | |
Software | | | 1.5 | |
Wireless Telecommunication Services | | | 1.5 | |
Electrical Equipment | | | 1.4 | |
Food & Staples Retailing | | | 1.4 | |
Media | | | 1.4 | |
Tobacco | | | 1.4 | |
Auto Components | | | 1.3 | |
Health Care Equipment & Supplies | | | 1.3 | |
Hotels, Restaurants & Leisure | | | 1.3 | |
Industrial Conglomerates | | | 1.3 | |
Trading Companies & Distributors | | | 1.3 | |
Road & Rail | | | 1.2 | |
Aerospace & Defense | | | 1.1 | |
Household Durables | | | 1.1 | |
Professional Services | | | 1.1 | |
Semiconductors & Semiconductor Equipment | | | 1.1 | |
Multi-Utilities | | | 1.0 | % |
Construction & Engineering | | | 0.9 | |
IT Services | | | 0.9 | |
Biotechnology | | | 0.8 | |
Building Products | | | 0.8 | |
Household Products | | | 0.8 | |
Specialty Retail | | | 0.8 | |
Diversified Financial Services | | | 0.7 | |
Commercial Services & Supplies | | | 0.6 | |
Technology Hardware, Storage & Peripherals | | | 0.6 | |
Transportation Infrastructure | | | 0.6 | |
Health Care Providers & Services | | | 0.5 | |
Air Freight & Logistics | | | 0.4 | |
Internet Software & Services | | | 0.4 | |
Communications Equipment | | | 0.3 | |
Containers & Packaging | | | 0.3 | |
Energy Equipment & Services | | | 0.3 | |
Gas Utilities | | | 0.3 | |
Marine | | | 0.3 | |
Multiline Retail | | | 0.3 | |
Paper & Forest Products | | | 0.3 | |
U.S. Treasury Obligations | | | 0.3 | |
Airlines | | | 0.2 | |
Internet & Direct Marketing Retail | | | 0.2 | |
Leisure Products | | | 0.2 | |
Life Sciences Tools & Services | | | 0.2 | |
Consumer Finance | | | 0.1 | |
Distributors | | | 0.1 | |
Independent Power & Renewable Electricity Producers | | | 0.1 | |
Water Utilities | | | 0.1 | |
Diversified Consumer Services | | | 0.0 | * |
Health Care Technology | | | 0.0 | * |
| | | | |
| | | 97.8 | |
Other assets in excess of liabilities | | | 2.2 | |
| | | | |
| | | 100.0 | % |
| | | | |
See Notes to Financial Statements.
| | | | |
| Prudential QMA International Developed Markets Index Fund | | | 49 | |
Schedule of Investments (continued)
as of October 31, 2017
Effects of Derivative Instruments on the Financial Statements and Primary Underlying Risk Exposure:
The Fund invested in derivative instruments during the reporting period. The primary type of risk associated with these derivative instruments is equity contracts risk. The effect of such derivative instruments on the Fund's financial position and financial performance as reflected in the Statement of Assets and Liabilities and Statement of Operations is presented in the summary below.
Fair values of derivative instruments as of October 31, 2017 as presented in the Statement of Assets and Liabilities:
| | | | | | | | | | | | |
| | | Asset Derivatives | | | Liability Derivatives | |
Derivatives not accounted
for as hedging instruments,
carried at fair value | | Balance Sheet
Location | | Fair
Value | | | Balance Sheet
Location | | Fair
Value | |
| Equity contracts | | Due from/to broker—variation margin futures | | $ | 45,393 | * | | — | | $ | — | |
| Equity contracts | | Unaffiliated investments | | | 1,783 | | | — | | | — | |
| | | | | | | | | | | | |
Total | | | | $ | 47,176 | | | | | $ | — | |
| | | | | | | | | | | | |
| * | Includes cumulative appreciation (depreciation) as reported in the schedule of open futures and centrally cleared swap contracts. Only unsettled variation margin receivable (payable) is reported within the Statement of Assets and Liabilities. |
The effects of derivative instruments on the Statement of Operations for the period ended October 31, 2017 are as follows:
| | | | | | | | | | | | |
Amount of Realized Gain (Loss) on Derivatives Recognized in Income | |
Derivatives not accounted for as hedging
instruments, carried at fair value | | Rights(1) | | | Futures | | | Total | |
Equity contracts | | $ | 1,660 | | | $ | 105,681 | | | $ | 107,341 | |
| | | | | | | | | | | | |
| (1) | Included in net realized gain (loss) on investment transactions in the Statement of Operations. |
| | | | | | | | | | | | |
Change in Unrealized Appreciation (Depreciation) on Derivatives Recognized in Income | |
Derivatives not accounted for as hedging
instruments, carried at fair value | | Rights(2) | | | Futures | | | Total | |
Equity contracts | | $ | 30 | | | $ | 45,393 | | | $ | 45,423 | |
| | | | | | | | | | | | |
| (2) | Included in net change in unrealized appreciation (depreciation) on investments in the Statement of Operations. |
See Notes to Financial Statements.
For the period ended October 31, 2017, the Fund's average volume of derivative activities is as follows:
| | | | | | | | | | | | |
| | | Futures Contracts—
Long Positions(1) | | | | | | | |
| | $ | 918,507 | | | | | | | | | |
| | | | | | | | | | | | |
Financial Instruments/Transactions—Summary of Offsetting and Netting Arrangements:
The Fund entered into financial instruments/transactions during the reporting period that are either offset in accordance with current requirements or are subject to enforceable master netting arrangements or similar agreements that permit offsetting. The information about offsetting and related netting arrangements for financial instruments/transactions, where the legal right to set-off exists, is presented in the summary below.
Offsetting of financial instruments/transactions assets and liabilities:
| | | | | | | | | | | | |
Description | | Gross Market
Value of
Recognized
Assets/(Liabilities) | | | Collateral
Pledged/(Received)(1) | | | Net Amount | |
Securities on Loan | | $ | 16,692 | | | $ | (16,692 | ) | | $ | — | |
| | | | | | | | | | | | |
| (1) | Collateral amount disclosed by the Fund is limited to the market value of financial instruments/transactions. |
See Notes to Financial Statements.
| | | | |
| Prudential QMA International Developed Markets Index Fund | | | 51 | |
Statement of Assets & Liabilities
as of October 31, 2017
| | | | |
Assets | | | | |
Investments at value, including securities on loan of $16,692: | | | | |
Unaffiliated investments (cost $24,975,604) | | $ | 28,917,192 | |
Affiliated investments (cost $746,035) | | | 746,035 | |
Foreign currency, at value (cost $422,428) | | | 425,890 | |
Deposit with broker for futures | | | 1,178 | |
Due for Fund shares sold | | | 172,557 | |
Due from Manager | | | 162,789 | |
Dividends and interest receivable | | | 58,595 | |
Tax reclaim receivable | | | 12,612 | |
Receivable for investments sold | | | 6,172 | |
Due from broker—variation margin futures | | | 3,911 | |
Prepaid expenses | | | 835 | |
| | | | |
Total assets | | | 30,507,766 | |
| | | | |
| |
Liabilities | | | | |
Payable for investments purchased | | | 52,261 | |
Custodian and accounting fees payable | | | 41,610 | |
Payable for Fund shares reacquired | | | 37,671 | |
Miscellaneous fees payable | | | 26,169 | |
Payable to broker for collateral for securities on loan | | | 16,856 | |
Accrued expenses and other liabilities | | | 12,858 | |
Affiliated transfer agent fee payable | | | 56 | |
| | | | |
Total liabilities | | | 187,481 | |
| | | | |
| |
Net Assets | | $ | 30,320,285 | |
| | | | |
| | | | | |
Net assets were comprised of: | | | | |
Shares of beneficial interest, at par | | $ | 2,415 | |
Paid-in capital in excess of par | | | 25,749,875 | |
| | | | |
| | | 25,752,290 | |
Undistributed net investment income | | | 419,616 | |
Accumulated net realized gain on investment and foreign currency transactions | | | 157,853 | |
Net unrealized appreciation on investments and foreign currencies | | | 3,990,526 | |
| | | | |
Net assets, October 31, 2017 | | $ | 30,320,285 | |
| | | | |
| |
Class Q | | | | |
Net asset value, offering price and redemption price per share, | | | | |
($30,320,285 ÷ 2,415,115 shares of beneficial interest issued and outstanding) | | $ | 12.55 | |
| | | | |
See Notes to Financial Statements.
Statement of Operations
Period* Ended October 31, 2017
| | | | |
Net Investment Income (Loss) | | | | |
Income | | | | |
Unaffiliated dividend income (net of foreign withholding taxes of $54,912) | | $ | 529,473 | |
Affiliated dividend income | | | 7,191 | |
Interest income | | | 905 | |
Income from securities lending, net (including affiliated income of $8) | | | 122 | |
| | | | |
Total income | | | 537,691 | |
| | | | |
| |
Expenses | | | | |
Management fee | | | 49,413 | |
Custodian and accounting fees | | | 217,000 | |
Pricing fees | | | 143,197 | |
Audit fee | | | 32,000 | |
Legal fees and expenses | | | 28,000 | |
Shareholders’ reports | | | 18,000 | |
Directors’ fees | | | 11,000 | |
Transfer agent’s fees and expenses (including affiliated expense of $300) | | | 467 | |
Miscellaneous | | | 16,780 | |
| | | | |
Total expenses | | | 515,857 | |
Less: Management fee waiver and/or expense reimbursement | | | (451,235 | ) |
| | | | |
Net expenses | | | 64,622 | |
| | | | |
Net investment income (loss) | | | 473,069 | |
| | | | |
| |
Realized And Unrealized Gain (Loss) On Investments And Foreign Currency Transactions | | | | |
Net realized gain (loss) on: | | | | |
Investment transactions | | | 61,494 | |
Futures transactions | | | 105,681 | |
Foreign currency transactions | | | (48,940 | ) |
| | | | |
| | | 118,235 | |
| | | | |
Net change in unrealized appreciation (depreciation) on: | | | | |
Investments | | | 3,941,588 | |
Futures | | | 45,393 | |
Foreign currencies | | | 3,545 | |
| | | | |
| | | 3,990,526 | |
| | | | |
Net gain (loss) on investment and foreign currency transactions | | | 4,108,761 | |
| | | | |
Net Increase (Decrease) In Net Assets Resulting From Operations | | $ | 4,581,830 | |
| | | | |
| * | Commencement of operations was November 17, 2016. |
See Notes to Financial Statements.
| | | | |
| Prudential QMA International Developed Markets Index Fund | | | 53 | |
Statement of Changes in Net Assets
| | | | |
| | | November 17, 2016*
through
October 31, 2017 | |
Increase (Decrease) in Net Assets | | | | |
Operations | | | | |
Net investment income (loss) | | $ | 473,069 | |
Net realized gain (loss) on investment and foreign currency transactions | | | 118,235 | |
Net change in unrealized appreciation (depreciation) on investments and foreign currencies | | | 3,990,526 | |
| | | | |
Net increase (decrease) in net assets resulting from operations | | | 4,581,830 | |
| | | | |
| |
Dividends from net investment income | | | | |
Class Q | | | (13,835 | ) |
| |
Fund share transactions | | | | |
Net proceeds from shares sold | | | 27,757,899 | |
Net asset value of shares issued in reinvestment of dividends and distributions | | | 13,835 | |
Cost of shares reacquired | | | (2,019,444 | ) |
| | | | |
Net increase (decrease) in net assets from Fund share transactions | | | 25,752,290 | |
| | | | |
Total increase (decrease) | | | 30,320,285 | |
| |
Net Assets: | | | | |
Beginning of period | | | — | |
| | | | |
End of period(a) | | $ | 30,320,285 | |
| | | | |
(a) Includes undistributed net investment income of: | | $ | 419,616 | |
| | | | |
| * | Commencement of operations. |
See Notes to Financial Statements.
Notes to Financial Statements
Prudential Investment Portfolios 2 (the “PIP2”) is registered under the Investment Company Act of 1940, as amended (“1940 Act”), as an open-end management investment company. PIP2 consists of eleven separate series: Prudential Commodity Strategies Fund, Prudential Core Conservative Bond Fund, Prudential Core Short-Term Bond Fund, Prudential Core Ultra Short Bond Fund, Prudential Institutional Money Market Fund, Prudential Jennison Small-Cap Core Equity Fund, Prudential QMA Emerging Markets Equity Fund, Prudential QMA International Developed Markets Index Fund, Prudential QMA Mid-Cap Core Equity Fund, Prudential QMA US Broad Market Index Fund and Prudential TIPS Fund. These financial statements relate to the Prudential QMA International Developed Markets Index Fund (the “Fund”). The Fund commenced operations on November 17, 2016.
The investment objective of the Fund is to seek to provide investment results that approximate the performance of the Russell Developed Ex North America Large Cap Index.
1. Accounting Policies
The Fund follows investment company accounting and reporting guidance of the Financial Accounting Standards Board (“FASB”) Accounting Standard Codification Topic 946 Financial Services—Investment Companies. The following accounting policies conform to U.S. generally accepted accounting principles. The Fund consistently follows such policies in the preparation of its financial statements.
Securities Valuation: The Fund holds securities and other assets and liabilities that are fair valued at the close of each day (generally, 4:00 PM Eastern time) the New York Stock Exchange (“NYSE”) is open for trading. Fair value is the price that would be received to sell an asset or paid to transfer a liability in an orderly transaction between market participants on the measurement date. The Board of Trustees (the “Board”) has adopted valuation procedures for security valuation under which fair valuation responsibilities have been delegated to PGIM Investments LLC (“PGIM Investments” or “the Manager”) (formerly known as Prudential Investments LLC). Under the current valuation procedures, the Valuation Committee is responsible for supervising the valuation of portfolio securities and other assets and liabilities. The valuation procedures permit the Fund to utilize independent pricing vendor services, quotations from market makers, and alternative valuation methods when market quotations are either not readily available or not deemed representative of fair value. A record of the Valuation Committee’s actions is subject to the Board’s review, approval, and ratification at its next regularly scheduled quarterly meeting.
Various inputs determine how the Fund’s investments are valued, all of which are categorized according to the three broad levels (Level 1, 2, or 3) detailed in the Schedule of Investments.
| | | | |
| Prudential QMA International Developed Markets Index Fund | | | 55 | |
Notes to Financial Statements (continued)
Common and preferred stocks, exchange-traded funds, and derivative instruments, such as futures or options, that are traded on a national securities exchange are valued at the last sale price as of the close of trading on the applicable exchange where the security principally trades. Securities traded via NASDAQ are valued at the NASDAQ official closing price. To the extent these securities are valued at the last sale price or NASDAQ official closing price, they are classified as Level 1 in the fair value hierarchy. In the event that no sale or official closing price on valuation date exists, these securities are generally valued at the mean between the last reported bid and ask prices, or at the last bid price in the absence of an ask price. These securities are classified as Level 2 in the fair value hierarchy.
Foreign equities traded on foreign securities exchanges are generally valued using pricing vendor services that provide model prices derived using adjustment factors based on information such as local closing price, relevant general and sector indices, currency fluctuations, depositary receipts, and futures, as applicable. Securities valued using such model prices are classified as Level 2 in the fair value hierarchy. The models generate an evaluated adjustment factor for each security, which is applied to the local closing price to adjust it for post closing market movements. Utilizing that evaluated adjustment factor, the vendor provides an evaluated price for each security. If the vendor does not provide an evaluated price, securities are valued in accordance with exchange-traded common and preferred stock valuation policies discussed above.
Investments in open-end, non-exchange-traded mutual funds are valued at their net asset values as of the close of the NYSE on the date of valuation. These securities are classified as Level 1 in the fair value hierarchy since they may be purchased or sold at their net asset values on the date of valuation.
Fixed income securities traded in the OTC market are generally classified as Level 2 in the fair value hierarchy. Such fixed income securities are typically valued using the market approach which generally involves obtaining data from an approved independent third-party vendor source. The Fund utilizes the market approach as the primary method to value securities when market prices of identical or comparable instruments are available. The third-party vendors’ valuation techniques used to derive the evaluated bid price are based on evaluating observable inputs, including but not limited to, yield curves, yield spreads, credit ratings, deal terms, tranche level attributes, default rates, cash flows, prepayment speeds, broker/dealer quotations and reported trades. Certain Level 3 securities are also valued using the market approach when obtaining a single broker quote or when utilizing recent transaction prices for identical or comparable securities. During the reporting period, there were no changes to report with respect to the valuation approach and/or valuation techniques discussed above.
Securities and other assets that cannot be priced according to the methods described above are valued based on pricing methodologies approved by the Board. In the event that unobservable inputs are used when determining such valuations, the securities will be classified as Level 3 in the fair value hierarchy.
When determining the fair value of securities, some of the factors influencing the valuation include: the nature of any restrictions on disposition of the securities; assessment of the general liquidity of the securities; the issuer’s financial condition and the markets in which it does business; the cost of the investment; the size of the holding and the capitalization of the issuer; the prices of any recent transactions or bids/offers for such securities or any comparable securities; any available analyst media or other reports or information deemed reliable by the investment manager regarding the issuer or the markets or industry in which it operates. Using fair value to price securities may result in a value that is different from a security’s most recent closing price and from the price used by other unaffiliated mutual funds to calculate their net asset values.
Foreign Currency Translation: The books and records of the Fund are maintained in U.S. dollars. Foreign currency amounts are translated into U.S. dollars on the following basis:
(i) market value of investment securities, other assets and liabilities—at the current rates of exchange;
(ii) purchases and sales of investment securities, income and expenses—at the rates of exchange prevailing on the respective dates of such transactions.
Although the net assets of the Fund are presented at the foreign exchange rates and market values at the close of the period, the Fund does not generally isolate that portion of the results of operations arising as a result of changes in the foreign exchange rates from the fluctuations arising from changes in the market prices of long-term portfolio securities held at the end of the period. Similarly, the Fund does not isolate the effect of changes in foreign exchange rates from the fluctuations arising from changes in the market prices of long-term portfolio securities sold during the period. Accordingly, holding period realized foreign currency gains (losses) are included in the reported net realized gains (losses) on investment transactions.
Net realized gains (losses) on foreign currency transactions represent net foreign exchange gains (losses) from the disposition of holdings of foreign currencies, forward currency contracts, currency gains (losses) realized between the trade and settlement dates on securities transactions, and the difference between the amounts of interest, dividends and foreign withholding taxes recorded on the Fund’s books and the U.S. dollar equivalent amounts actually received or paid. Net unrealized currency gains (losses) from valuing foreign currency denominated assets and liabilities (other than investments) at period end exchange rates are reflected as a component of net unrealized appreciation (depreciation) on foreign currencies.
| | | | |
| Prudential QMA International Developed Markets Index Fund | | | 57 | |
Notes to Financial Statements (continued)
Restricted and Illiquid Securities: Subject to guidelines adopted by the Board, the Fund may invest up to 15% of its net assets in illiquid securities, including those which are restricted as to disposition under securities law (“restricted securities”). Restricted securities are valued pursuant to the valuation procedures noted above. Illiquid securities are those that, because of the absence of a readily available market or due to legal or contractual restrictions on resale, cannot be sold within seven days in the ordinary course of business at approximately the amount at which the Fund has valued the investment. Therefore, the Fund may find it difficult to sell illiquid securities at the time considered most advantageous by its Subadviser and may incur expenses that would not be incurred in the sale of securities that were freely marketable. Certain securities that would otherwise be considered illiquid because of legal restrictions on resale to the general public may be traded among qualified institutional buyers under Rule 144A of the Securities Act of 1933. These Rule 144A securities, as well as commercial paper that is sold in private placements under Section 4(2) of the Securities Act, may be deemed liquid by the Fund’s Subadviser under the guidelines adopted by the Trustees of the Fund. However, the liquidity of the Fund’s investments in Rule 144A securities could be impaired if trading does not develop or declines.
Financial Futures Contracts: A financial futures contract is an agreement to purchase (long) or sell (short) an agreed amount of securities at a set price for delivery on a future date. Upon entering into a financial futures contract, the Fund is required to pledge to the broker an amount of cash and/or other assets equal to a certain percentage of the contract amount. This amount is known as the “initial margin.” Subsequent payments, known as “variation margin,” are made or received by the Fund each day, depending on the daily fluctuations in the value of the underlying security. Such variation margin is recorded for financial statement purposes on a daily basis as unrealized gain (loss). When the contract expires or is closed, the gain (loss) is realized and is presented in the Statement of Operations as net realized gain (loss) on futures transactions.
The Fund invested in financial futures contracts in order to hedge its existing portfolio securities, or securities the Fund intends to purchase, against fluctuations in value caused by changes in value of equities. The use of futures transactions involves the risk of imperfect correlation in movements in the price of futures contracts and the underlying hedged assets. Since futures contracts are exchange-traded, there is minimal counterparty credit risk to the Fund since the exchanges’ clearinghouse acts as counterparty to all exchange-traded futures and guarantees the futures contracts against default.
Master Netting Arrangements: PIP2, on behalf of the Fund, is subject to various Master Agreements, or netting arrangements, with select counterparties. These are agreements which a subadviser may have negotiated and entered into on behalf of the Fund. A master
netting arrangement between the Fund and the counterparty permits the Fund to offset amounts payable by the Fund to the same counterparty against amounts to be received; and by the receipt of collateral from the counterparty by the Fund to cover the Fund’s exposure to the counterparty. However, there is no assurance that such mitigating factors are easily enforceable. In addition to master netting arrangements, the right to set-off exists when all the conditions are met such that each of the parties owes the other determinable amounts, the reporting party has the right to set-off the amount owed with the amount owed by the other party, the reporting party intends to set-off and the right of set-off is enforceable by law. During the reporting period, there was no intention to settle on a net basis and all amounts are presented on a gross basis on the Statement of Assets and Liabilities.
Warrants and Rights: The Fund may hold warrants and rights acquired either through a direct purchase, included as part of a private placement, or pursuant to corporate actions. Warrants and rights entitle the holder to buy a proportionate amount of common stock, or such other security that the issuer may specify, at a specific price and time through the expiration dates. Such warrants and rights are held as long positions by the Fund until exercised, sold or expired. Warrants and rights are valued at fair value in accordance with the Board approved fair valuation procedures.
Securities Lending: The Fund may lend its portfolio securities to banks and broker-dealers. The loans are secured by collateral at least equal to the market value of the securities loaned. Collateral pledged by each borrower is invested in an affiliated money market fund and is marked to market daily, based on the previous day’s market value, such that the value of the collateral exceeds the value of the loaned securities. Loans are subject to termination at the option of the borrower or the Fund. Upon termination of the loan, the borrower will return to the Fund securities identical to the loaned securities. Should the borrower of the securities fail financially, the Fund has the right to repurchase the securities in the open market using the collateral. The Fund recognizes income, net of any rebate and securities lending agent fees, for lending its securities in the form of fees or interest on the investment of any cash received as collateral. The borrower receives all interest and dividends from the securities loaned and such payments are passed back to the lender in amounts equivalent thereto. The Fund also continues to recognize any unrealized gain (loss) in the market price of the securities loaned and on the change in the value of the collateral invested that may occur during the term of the loan. In addition, realized gain (loss) is recognized on changes in the value of the collateral invested upon liquidation of the collateral. Net earnings from securities lending are disclosed on the Statement of Operations as “Income from securities lending, net”.
Concentration of Risk: Foreign security and currency transactions may involve certain considerations and risks not typically associated with those of domestic origin as a result of, among other factors, the possibility of political or economic instability or the level of governmental supervision and regulation of foreign securities markets.
| | | | |
| Prudential QMA International Developed Markets Index Fund | | | 59 | |
Notes to Financial Statements (continued)
Securities Transactions and Net Investment Income: Securities transactions are recorded on the trade date. Realized gains (losses) from investment and currency transactions are calculated on the specific identification method. Dividend income is recorded on the ex-date. Interest income, including amortization of premium and accretion of discount on debt securities, as required, is recorded on the accrual basis. Expenses are recorded on an accrual basis, which may require the use of certain estimates by management that may differ from actual.
Equity and Mortgage Real Estate Investment Trusts (REITs): The Fund invests in equity REITs, which report information on the source of their distributions annually. Based on current and historical information, a portion of distributions received from equity REITs during the period is estimated to be dividend income, capital gain or return of capital and recorded accordingly. When material, these estimates are adjusted periodically when the actual source of distributions is disclosed by the equity REITs.
Taxes: It is the Fund’s policy to meet the requirements of the Internal Revenue Code applicable to regulated investment companies and to distribute all of its taxable net investment income and capital gains, if any, to its shareholders. Therefore, no federal income tax provision is required. Withholding taxes on foreign dividends, interest and capital gains, if any, are recorded, net of reclaimable amounts, at the time the related income is earned.
Dividends and Distributions: The Fund expects to pay dividends from net investment income and distributions from net realized capital gains, if any, annually. Dividends and distributions to shareholders, which are determined in accordance with federal income tax regulations and which may differ from generally accepted accounting principles, are recorded on the ex-date. Permanent book/tax differences relating to income and gain (loss) are reclassified amongst undistributed net investment income, accumulated net realized gain (loss) and paid-in capital in excess of par, as appropriate.
Estimates: The preparation of financial statements requires management to make estimates and assumptions that affect the reported amounts and disclosures in the financial statements. Actual results could differ from those estimates.
2. Agreements
PIP2, on behalf of the Fund, has a management agreement with PGIM Investments. Pursuant to this agreement, PGIM Investments has responsibility for all investment advisory services and supervises the subadviser’s performance of such services. PGIM Investments has entered into a subadvisory agreement with Quantitative Management Associates, LLC
(“QMA”). The subadvisory agreement provides that QMA will furnish investment advisory services in connection with the management of the Fund. In connection therewith, QMA is obligated to keep certain books and records of the Fund. PGIM Investments pays for the services of QMA, the cost of compensation of officers of the Fund, occupancy and certain clerical and bookkeeping costs of the Fund. The Fund bears all other costs and expenses.
The management fee paid to PGIM Investments is accrued daily and payable monthly at an annual rate of .25% of the Fund’s average daily net assets. For the period ended October 31, 2017, the waiver and/or expense reimbursement exceeded the effective management fee rate.
Effective December 1, 2016, PGIM Investments has contractually agreed through February 28, 2019 to limit the net annual operating expenses (exclusive of distribution and service (12b-1) fees, taxes (such as income and foreign withholdings taxes, stamp duty and deferred tax expenses), interest, underlying funds, brokerage, extraordinary and certain other expenses such as dividend, broker charges and interest expense on short sales) of the Fund to .30% of the Fund’s average daily net assets. Expenses waived/reimbursed by the Manager in accordance with this agreement may be recouped by the Manager within the same fiscal year during which such waiver/reimbursement is made if such recoupment can be realized without exceeding the expense limit in effect at the time of the recoupment for that fiscal year.
PIP2, on behalf of the Funds, has a distribution agreement with Prudential Investment Management Services LLC (“PIMS”), which acts as the distributor of the Class Q shares of the Fund. No distribution or service fees are paid to PIMS as distributor for Class Q shares of the Fund.
PGIM, Inc., PGIM Investments, PIMS and QMA are indirect, wholly-owned subsidiaries of Prudential Financial, Inc. (“Prudential”).
3. Other Transactions with Affiliates
Prudential Mutual Fund Services LLC (“PMFS”), an affiliate of PGIM Investments and an indirect, wholly-owned subsidiary of Prudential, serves as the Fund’s transfer agent. Transfer agent’s fees and expenses in the Statement of Operations include certain out-of-pocket expenses paid to non-affiliates, where applicable.
The Fund may enter into certain securities purchase or sale transactions under Board approved Rule 17a-7 procedures. Rule 17a-7 is an exemptive rule under the 1940 Act, that permits purchase and sale transactions among affiliated investment companies, or between an investment company and a person that is affiliated solely by reason of having a common (or affiliated) investment adviser, common directors, and/or common officers. Such transactions are subject to ratification by the Board. For the reporting period ended October 31, 2017 no such transactions were entered into by the Fund.
| | | | |
| Prudential QMA International Developed Markets Index Fund | | | 61 | |
Notes to Financial Statements (continued)
The Fund may invest its overnight sweep cash in the Prudential Core Ultra Short Bond Fund (the “Core Fund”), and its securities lending cash collateral in the Prudential Institutional Money Market Fund (the “Money Market Fund”), each a series of Prudential Investment Portfolios 2, registered under the 1940 Act and managed by PGIM Investments. For the reporting period ended October 31, 2017, PGIM, Inc. was compensated $8 by PGIM Investments for managing the Fund’s securities lending cash collateral as subadviser to the Money Market Fund. Earnings from the Core Fund and Money Market Fund are disclosed on the Statement of Operations as “Affiliated dividend income” and “Income from securities lending, net”, respectively.
4. Portfolio Securities
The aggregate cost of purchases and proceeds from sales of portfolio securities (excluding short-term investments and U.S. Government securities) for the period ended October 31, 2017, were $26,203,526 and $1,412,962, respectively.
5. Distributions and Tax Information
Distributions to shareholders, which are determined in accordance with federal income tax regulations and which may differ from generally accepted accounting principles, are recorded on the ex-date. In order to present undistributed net investment income, accumulated net realized gain on investment and foreign currency transactions and paid-in capital in excess of par on the Statement of Assets and Liabilities that more closely represent their tax character, certain adjustments have been made to undistributed net investment income and accumulated net realized gain on investment and foreign currency transactions. For the period ended October 31, 2017 the adjustments were to decrease undistributed net investment income and increase accumulated net realized gain on investment and foreign currency transactions by $39,618 due to differences in the treatment for book and tax purposes of certain transactions involving foreign securities and currencies and other book to tax differences. Net investment income, net realized gain (loss) on investments and foreign currency transactions and net assets were not affected by this change.
For the period ended October 31, 2017, the tax character of dividends paid by the fund was $13,835 of ordinary income.
As of October 31, 2017, the accumulated undistributed earnings on a tax basis were $598,586 of ordinary income and $82,659 of long-term capital gains. This differs from the amount shown on the Statement of Assets and Liabilities primarily due to cumulative timing differences between financial and tax reporting.
The United States federal income tax basis of the Fund’s investments and the net unrealized appreciation as of October 31, 2017 were as follows:
| | | | | | |
Tax Basis | | Gross
Unrealized
Appreciation | | Gross
Unrealized
Depreciation | | Net
Unrealized
Appreciation |
| $25,821,870 | | $4,128,064 | | $(241,314) | | $3,886,750 |
The differences between book basis and tax basis was primarily attributable to deferred losses on wash sales, investments in passive foreign investment companies and other cost basis differences between financial and tax accounting.
Management has analyzed the Fund’s tax positions and has concluded that no provision for income tax is required in the Fund’s financial statements for the current reporting period. The Fund’s federal excise tax returns for tax years for which the applicable statues of limitations have not expired are subject to examination by the Internal Revenue Service and state departments of revenue.
6. Capital
The Fund offers Class Q shares. Effective as of May 22, 2017, shares of the Fund are registered under the Securities Act of 1933, as amended.
PIP2 has authorized an unlimited number of shares of beneficial interest at $.001 par value per share.
As of October 31, 2017, Prudential through its affiliate entities, including affiliated funds, owned 2,401,819 shares of Class Q. At reporting period end, four shareholders of record held 86% of the Fund’s outstanding shares on behalf of multiple beneficial owners, of which all were held by the affiliates of Prudential.
Transactions in shares of beneficial interest were as follows:
| | | | | | | | |
Class Q | | Shares | | | Amount | |
Period* ended October 31, 2017: | | | | | | | | |
Shares sold | | | 2,580,198 | | | $ | 27,757,899 | |
Shares issued in reinvestment of dividends and distributions | | | 1,359 | | | | 13,835 | |
Shares reacquired | | | (166,442 | ) | | | (2,019,444 | ) |
| | | | | | | | |
Net increase (decrease) in shares outstanding | | | 2,415,115 | | | $ | 25,752,290 | |
| | | | | | | | |
| * | Commencement of operations was November 17, 2016. |
7. Borrowings
PIP2, along with other affiliated registered investment companies (the “Funds”), is a party to a Syndicated Credit Agreement (“SCA”) with a group of banks. The purpose of the SCA
| | | | |
| Prudential QMA International Developed Markets Index Fund | | | 63 | |
Notes to Financial Statements (continued)
is to provide an alternative source of temporary funding for capital share redemptions. The SCA provides for a commitment of $900 million for the period October 5, 2017 through October 4, 2018. The Funds pay an annualized commitment fee of .15% of the unused portion of the SCA. Each Fund’s portion of the commitment fee for the unused amount, allocated based upon a method approved by the Board, is accrued daily and paid quarterly. Prior to October 5, 2017, the Funds had another SCA that provided a commitment of $900 million and the Funds paid an annualized commitment fee of .15% of the unused portion of the SCA. The interest on borrowings under the SCAs is paid monthly and at a per annum interest rate based upon a contractual spread plus the higher of (1) the effective federal funds rate, (2) the 1-month LIBOR rate or (3) zero percent.
Other affiliated registered investment companies that are parties to the SCA include portfolios that are subject to a predetermined mathematical formula used to manage certain benefit guarantees offered under variable annuity contracts. The formula may result in large scale asset flows into and out of these portfolios. Consequently, these portfolios may be more likely to utilize the SCA for purposes of funding redemptions. It may be possible for those portfolios to fully exhaust the committed amount of the SCA, thereby requiring the Manager to allocate available funding per a Board-approved methodology designed to treat the Funds in the SCA equitably.
The Fund did not utilize the SCA during the reporting period ended October 31, 2017.
8. Dividends and Distributions to Shareholders
Subsequent to the year ended October 31, 2017, the Fund declared ordinary income dividends and capital gain distributions on December 13, 2017 to shareholders of record on December 14, 2017. The ex-date was December 15, 2017. The per share amounts declared were as follows:
| | | | | | | | | | | | |
| | | Ordinary Income | | | Short-Term
Capital Gains | | | Long-Term
Capital Gains | |
Class Q | | $ | 0.22829 | | | $ | 0.04606 | | | $ | 0.03289 | |
Financial Highlights
| | | | |
| Class Q Shares | |
| | | November 17,
2016(a)
through
October 31,
2017 | |
| Per Share Operating Performance(b): | | | | |
| Net Asset Value, Beginning of Period | | | $10.00 | |
| Income (loss) from investment operations: | | | | |
| Net investment income (loss) | | | .26 | |
| Net realized and unrealized gain (loss) on investments | | | 2.30 | |
| Total from investment operations | | | 2.56 | |
| Less Dividends and Distributions: | | | | |
| Dividends from net investment income | | | (.01 | ) |
| Net asset value, end of period | | | $12.55 | |
| Total Return(c): | | | 25.61% | |
| | | | |
| Ratios/Supplemental Data: | |
| Net assets, end of period (000) | | | $30,320 | |
| Average net assets (000) | | | $20,731 | |
| Ratios to average net assets(d): | | | | |
| Expense after waivers and/or expense reimbursement | | | .33% | (e) |
| Expense before waivers and/or expense reimbursement | | | 2.61% | (e) |
| Net investment income (loss) | | | 2.39% | (e) |
| Portfolio turnover rate | | | 7% | (f) |
| (a) | Commencement of operations. |
| (b) | Calculated based on average shares outstanding during the period. |
| (c) | Total return is calculated assuming a purchase of a share on the first day and a sale on the last day of each period reported and includes reinvestment of dividends and distributions, if any. Total returns may reflect adjustments to conform to generally accepted accounting principles. Total returns for periods less than one full year are not annualized. |
| (d) | Does not include expenses of the underlying funds in which the Fund invests. |
See Notes to Financial Statements.
| | | | |
| Prudential QMA International Developed Markets Index Fund | | | 65 | |
Report of Independent Registered Public Accounting Firm
The Board of Trustees and Shareholders
Prudential Investment Portfolios 2:
We have audited the accompanying statement of assets and liabilities of Prudential QMA International Developed Markets Index Fund (the “Fund”), a series of Prudential Investment Portfolios 2, including the portfolio of investments, as of October 31, 2017, and the related statements of operations, changes in net assets, and the financial highlights for the period from November 17, 2016 (commencement of operations) through October 31, 2017. These financial statements and financial highlights are the responsibility of the Fund’s management. Our responsibility is to express an opinion on these financial statements and financial highlights based on our audit.
We conducted our audit in accordance with the standards of the Public Company Accounting Oversight Board (United States). Those standards require that we plan and perform the audit to obtain reasonable assurance about whether the financial statements and financial highlights are free of material misstatement. An audit includes examining, on a test basis, evidence supporting the amounts and disclosures in the financial statements. Our procedures included confirmation of securities owned as of October 31, 2017, by correspondence with the custodian, transfer agent and brokers or by other appropriate auditing procedures when replies from brokers were not received. An audit also includes assessing the accounting principles used and significant estimates made by management, as well as evaluating the overall financial statement presentation. We believe that our audit provides a reasonable basis for our opinion.
In our opinion, the financial statements and financial highlights referred to above present fairly, in all material respects, the financial position of the Fund as of October 31, 2017, and the results of its operations, the changes in its net assets, and the financial highlights for the period described in the first paragraph above, in conformity with U.S. generally accepted accounting principles.

New York, New York
December 15, 2017
Federal Income Tax Information (unaudited)
For the period ended October 31, 2017, the Fund reports the maximum amount allowable under Section 854 of the Internal Revenue Code, but not less than, the following percentages of the ordinary income dividends paid as 1) qualified dividend income (QDI):
| | | | |
| | | QDI | |
Prudential QMA International Developed Markets Index Fund | | | 85.77 | % |
For the period ended October 31, 2017, the Fund made an election to pass through the maximum amount of the portion of the ordinary income dividends paid derived from foreign source income as well as any foreign taxes paid by the Fund in accordance with Section 853 of the Internal Revenue Code of the following amounts: $45,552 foreign tax credit from recognized foreign source income of $583,393.
In January 2018, you will be advised on IRS Form 1099-DIV or substitute 1099-DIV, as to the federal tax status of dividends received by you in calendar year 2017.
| | | | |
| Prudential QMA International Developed Markets Index Fund | | | 67 | |
INFORMATION ABOUT BOARD MEMBERS AND OFFICERS
(Unaudited)
Information about Board Members and Officers of the Fund is set forth below. Board Members who are not deemed to be “interested persons” of the Fund, as defined in the 1940 Act, are referred to as “Independent Board Members.” Board Members who are deemed to be “interested persons” of the Fund are referred to as “Interested Board Members.” The Board Members are responsible for the overall supervision of the operations of the Fund and perform the various duties imposed on the directors of investment companies by the 1940 Act. The Board in turn elects the Officers, who are responsible for administering the day-to-day operations of the Fund.
| | | | |
| Independent Board Members(1) |
| | | |
Name, Address, Age Position(s) Portfolios Overseen | | Principal Occupation(s) During Past Five Years | | Other Directorships Held During Past Five Years |
Ellen S. Alberding (59) Board Member Portfolios Overseen: 89 | | President and Board Member, The Joyce Foundation (charitable foundation) (since 2002); Vice Chair, City Colleges of Chicago (community college system) (since 2011); Trustee, Skills for America’s Future (national initiative to connect employers to community colleges) (since 2011); Trustee, National Park Foundation (charitable foundation for national park system) (since 2009); Trustee, Economic Club of Chicago (since 2009). | | None. |
Kevin J. Bannon (65) Board Member Portfolios Overseen: 89 | | Retired; Managing Director (April 2008-May 2015) and Chief Investment Officer (October 2008-November 2013) of Highmount Capital LLC (registered investment adviser); formerly Executive Vice President and Chief Investment Officer (April 1993-August 2007) of Bank of New York Company; President (May 2003-May 2007) of BNY Hamilton Family of Mutual Funds. | | Director of Urstadt Biddle Properties (equity real estate investment trust) (since September 2008). |
Linda W. Bynoe (65) Board Member Portfolios Overseen: 89 | | President and Chief Executive Officer (since March 1995) and formerly Chief Operating Officer (December 1989-February 1995) of Telemat Ltd. (management consulting); formerly Vice President (January 1985-June 1989) at Morgan Stanley & Co. (broker-dealer). | | Director of Simon Property Group, Inc. (retail real estate) (May 2003-May 2012); Director of Anixter International, Inc. (communication products distributor) (since January 2006); Director of Northern Trust Corporation (financial services) (since April 2006); Trustee of Equity Residential (residential real estate) (since December 2009). |
Prudential QMA International Developed Markets Index Fund
| | | | |
| Independent Board Members(1) |
| | | |
Name, Address, Age Position(s) Portfolios Overseen | | Principal Occupation(s) During Past Five Years | | Other Directorships Held During Past Five Years |
Barry H. Evans (57)± Board Member Portfolios Overseen: 89 | | Retired; Formerly President (2005-2016), Global Chief Operating Officer (2014-2016), Chief Investment Officer-Global Head of Fixed Income (1998-2014), and various portfolio manager roles (1986-2006), Manulife Asset Management U.S. | | Director, Manulife Trust Company (2011-present); Director, Manulife Asset Management Limited (2015-present); Formerly Chairman of the Board of Directors of Manulife Asset Management U.S. (2005-2016); Formerly Chairman of the Board, Declaration Investment Management and Research (2008-2016). |
Keith F. Hartstein (61) Board Member & Independent Chair Portfolios Overseen: 89 | | Retired; Member (since November 2014) of the Governing Council of the Independent Directors Council (organization of independent mutual fund directors); formerly President and Chief Executive Officer (2005-2012), Senior Vice President (2004-2005), Senior Vice President of Sales and Marketing (1997-2004), and various executive management positions (1990-1997), John Hancock Funds, LLC (asset management); Chairman, Investment Company Institute’s Sales Force Marketing Committee (2003-2008). | | None. |
Laurie Simon Hodrick (55)± Board Member Portfolios Overseen: 89 | | A. Barton Hepburn Professor of Economics in the Faculty of Business, Columbia Business School (since 1996); Visiting Professor of Law and Rock Center for Corporate Governance Fellow, Stanford Law School (since 2015); Visiting Fellow, Hoover Institution, Stanford University (since 2015); Sole Member, ReidCourt LLC (since 2008) (a consulting firm); Formerly Managing Director, Global Head of Alternative Investment Strategies, Deutsche Bank (2006-2008); Formerly Director/Trustee, Merrill Lynch Investment Managers Funds (1999-2006). | | Independent Director, Corporate Capital Trust (since April 2017) (a business development company). |
Michael S. Hyland, CFA (72) Board Member Portfolios Overseen: 89 | | Retired (since February 2005); formerly Senior Managing Director (July 2001-February 2005) of Bear Stearns & Co, Inc.; Global Partner, INVESCO (1999-2001); Managing Director and President of Salomon Brothers Asset Management (1989-1999). | | None. |
Visit our website at pgiminvestments.com
| | | | |
| Independent Board Members(1) |
| | | |
Name, Address, Age Position(s) Portfolios Overseen | | Principal Occupation(s) During Past Five Years | | Other Directorships Held During Past Five Years |
Richard A. Redeker (74) Board Member & Independent Vice Chair9 Portfolios Overseen: 87 | | Retired Mutual Fund Senior Executive (47 years); Management Consultant; Director, Mutual Fund Directors Forum (since 2014); Independent Directors Council (organization of independent mutual fund directors)-Executive Committee, Chair of Policy Steering Committee, Governing Council. | | None. |
Stephen G. Stoneburn (74) Board Member Portfolios Overseen: 89 | | Chairman (since July 2011), President and Chief Executive Officer (since June 1996) of Frontline Medical Communications (publishing company); formerly President (June 1995-June 1996) of Argus Integrated Media, Inc.; Senior Vice President and Managing Director (January 1993-1995) of Cowles Business Media; Senior Vice President of Fairchild Publications, Inc. (1975-1989). | | None. |
± Mr. Evans and Ms. Hodrick joined the Board effective as of September 1, 2017.
| | | | |
| Interested Board Members(1) |
| | | |
Name, Address, Age Position(s) Portfolios Overseen | | Principal Occupation(s) During Past Five Years | | Other Directorships Held During Past Five Years |
Stuart S. Parker (55) Board Member & President Portfolios Overseen: 89 | | President of PGIM Investments LLC (formerly known as Prudential Investments LLC) (since January 2012); Executive Vice President of Prudential Investment Management Services LLC (since December 2012); Executive Vice President of Jennison Associates LLC and Head of Retail Distribution of PGIM Investments LLC (June 2005-December 2011). | | None. |
Prudential QMA International Developed Markets Index Fund
| | | | |
| Interested Board Members(1) |
| | | |
Name, Address, Age Position(s) Portfolios Overseen | | Principal Occupation(s) During Past Five Years | | Other Directorships Held During Past Five Years |
Scott E. Benjamin (44) Board Member & Vice President Portfolios Overseen: 89 | | Executive Vice President (since June 2009) of PGIM Investments LLC; Executive Vice President (June 2009-June 2012) and Vice President (since June 2012) of Prudential Investment Management Services LLC; Executive Vice President (since September 2009) of AST Investment Services, Inc.; Senior Vice President of Product Development and Marketing, PGIM Investments (since February 2006); Vice President of Product Development and Product Management, Prudential Investments (2003-2006). | | None. |
Grace C. Torres* (58) Board Member Portfolios Overseen: 88 | | Retired; formerly Treasurer and Principal Financial and Accounting Officer of the Prudential Funds, Target Funds, Advanced Series Trust, Prudential Variable Contract Accounts and The Prudential Series Fund (1998-June 2014); Assistant Treasurer (March 1999-June 2014) and Senior Vice President (September 1999-June 2014) of PGIM Investments LLC; Assistant Treasurer (May 2003-June 2014) and Vice President (June 2005-June 2014) of AST Investment Services, Inc.; Senior Vice President and Assistant Treasurer (May 2003-June 2014) of Prudential Annuities Advisory Services, Inc. | | Director (since July 2015) of Sun Bancorp, Inc. N.A. and Sun National Bank |
* Note: Prior to her retirement in 2014, Ms. Torres was employed by PGIM Investments LLC. Due to her prior employment, she is considered to be an “interested person” under the 1940 Act. Ms. Torres is a Non-Management Interested Board Member.
(1) The year that each Board Member joined the Fund’s Board is as follows:
Ellen S. Alberding, 2013; Kevin J. Bannon, 2008; Linda W. Bynoe, 2005; Barry H. Evans, 2017; Keith F. Hartstein, 2013; Laurie Simon Hodrick, 2017; Michael S. Hyland, 2008; Richard A. Redeker, 2003; Stephen G. Stoneburn, 1999; Grace C. Torres, 2014; Stuart S. Parker, Board Member and President since 2012; Scott E. Benjamin, Board Member since 2010 and Vice President since 2009.
Visit our website at pgiminvestments.com
| | | | |
| Fund Officers(a) |
| | | |
Name, Address and Age Position with Fund | | Principal Occupation(s) During Past Five Years | | Length of Service as Fund Officer |
Raymond A. O’Hara (62) Chief Legal Officer | | Vice President and Corporate Counsel (since July 2010) of Prudential Insurance Company of America (Prudential); Vice President (March 2011-Present) of Pruco Life Insurance Company and Pruco Life Insurance Company of New Jersey; Vice President and Corporate Counsel (March 2011-Present) of Prudential Annuities Life Assurance Corporation; Chief Legal Officer of PGIM Investments LLC (since June 2012); Chief Legal Officer of Prudential Mutual Fund Services LLC (since June 2012) and Corporate Counsel of AST Investment Services, Inc. (since June 2012); formerly Assistant Vice President and Corporate Counsel (September 2008-July 2010) of The Hartford Financial Services Group, Inc.; formerly Associate (September 1980-December 1987) and Partner (January 1988-August 2008) of Blazzard & Hasenauer, P.C. (formerly, Blazzard, Grodd & Hasenauer, P.C.). | | Since 2012 |
Chad A. Earnst (42) Chief Compliance Officer | | Chief Compliance Officer (September 2014-Present) of PGIM Investments LLC; Chief Compliance Officer (September 2014-Present) of the Prudential Funds, Target Funds, Advanced Series Trust, The Prudential Series Fund, Prudential’s Gibraltar Fund, Inc., Prudential Global Short Duration High Yield Income Fund, Inc., Prudential Short Duration High Yield Fund, Inc. and Prudential Jennison MLP Income Fund, Inc.; formerly Assistant Director (March 2010-August 2014) of the Asset Management Unit, Division of Enforcement, US Securities & Exchange Commission; Assistant Regional Director (January 2010-August 2014), Branch Chief (June 2006-December 2009) and Senior Counsel (April 2003-May 2006) of the Miami Regional Office, Division of Enforcement, US Securities & Exchange Commission. | | Since 2014 |
Deborah A. Docs (59) Secretary | | Vice President and Corporate Counsel (since January 2001) of Prudential; Vice President (since December 1996) and Assistant Secretary (since March 1999) of PGIM Investments LLC; formerly Vice President and Assistant Secretary (May 2003-June 2005) of AST Investment Services, Inc. | | Since 2004 |
Jonathan D. Shain (59) Assistant Secretary | | Vice President and Corporate Counsel (since August 1998) of Prudential; Vice President and Assistant Secretary (since May 2001) of PGIM Investments LLC; Vice President and Assistant Secretary (since February 2001) of Prudential Mutual Fund Services LLC; formerly Vice President and Assistant Secretary (May 2003-June 2005) of AST Investment Services, Inc. | | Since 2005 |
Claudia DiGiacomo (43) Assistant Secretary | | Vice President and Corporate Counsel (since January 2005) of Prudential; Vice President and Assistant Secretary of PGIM Investments LLC (since December 2005); Associate at Sidley Austin Brown & Wood LLP (1999-2004). | | Since 2005 |
Prudential QMA International Developed Markets Index Fund
| | | | |
Fund Officers(a) |
| | | |
Name, Address and Age Position with Fund | | Principal Occupation(s) During Past Five Years | | Length of Service as Fund Officer |
Andrew R. French (54) Assistant Secretary | | Vice President and Corporate Counsel (since February 2010) of Prudential; formerly Director and Corporate Counsel (2006-2010) of Prudential; Vice President and Assistant Secretary (since January 2007) of PGIM Investments LLC; Vice President and Assistant Secretary (since January 2007) of Prudential Mutual Fund Services LLC. | | Since 2006 |
Charles H. Smith (44) Anti-Money Laundering Compliance Officer | | Vice President, Corporate Compliance, Anti-Money Laundering Unit (since January 2015) of Prudential; committee member of the American Council of Life Insurers Anti-Money Laundering and Critical Infrastructure Committee (since January 2016); formerly Global Head of Economic Sanctions Compliance at AIG Property Casualty (February 2007-December 2014); Assistant Attorney General at the New York State Attorney General’s Office, Division of Public Advocacy. (August 1998-January 2007). | | Since 2016 |
M. Sadiq Peshimam (53) Treasurer and Principal Financial and Accounting Officer | | Vice President (since 2005) of PGIM Investments LLC; formerly Assistant Treasurer of funds in the Prudential Mutual Fund Complex (2006-2014). | | Since 2006 |
Peter Parrella (59) Assistant Treasurer | | Vice President (since 2007) and Director (2004-2007) within Prudential Mutual Fund Administration; formerly Tax Manager at SSB Citi Fund Management LLC (1997-2004). | | Since 2007 |
Lana Lomuti (50) Assistant Treasurer | | Vice President (since 2007) and Director (2005-2007), within Prudential Mutual Fund Administration; formerly Assistant Treasurer (December 2007-February 2014) of The Greater China Fund, Inc. | | Since 2014 |
Linda McMullin (56) Assistant Treasurer | | Vice President (since 2011) and Director (2008-2011) within Prudential Mutual Fund Administration. | | Since 2014 |
Kelly A. Coyne (49) Assistant Treasurer | | Director, Investment Operations of Prudential Mutual Fund Services LLC (since 2010). | | Since 2015 |
(a) Excludes Mr. Parker and Mr. Benjamin, interested Board Members who also serve as President and Vice President, respectively.
Explanatory Notes to Tables:
| ∎ | | Board Members are deemed to be “Interested,” as defined in the 1940 Act, by reason of their affiliation with PGIM Investments LLC and/or an affiliate of PGIM Investments LLC. |
| ∎ | | Unless otherwise noted, the address of all Board Members and Officers is c/o PGIM Investments LLC, 655 Broad Street, Newark, New Jersey 07102-4410. |
| ∎ | | There is no set term of office for Board Members or Officers. The Board Members have adopted a retirement policy, which calls for the retirement of Board Members on December 31 of the year in which they reach the age of 75. |
| ∎ | | “Other Directorships Held” includes only directorships of companies required to register or file reports with the SEC under the 1934 Act (that is, “public companies”) or other investment companies registered under the 1940 Act. |
| ∎ | | “Portfolios Overseen” includes all investment companies managed by PGIM Investments LLC. The investment companies for which PGIM Investments LLC serves as manager include the Prudential Mutual Funds, The Prudential Variable Contract Accounts, Target Mutual Funds, Prudential Short Duration High Yield Fund, Inc., Prudential Global Short Duration High Yield Fund, Inc., The Prudential Series Fund, Prudential’s Gibraltar Fund, Inc. and the Advanced Series Trust. |
Visit our website at pgiminvestments.com
| | | | |
| ∎ MAIL | | ∎ TELEPHONE | | ∎ WEBSITE |
655 Broad Street Newark, NJ 07102 | | (800) 225-1852 | | www.pgiminvestments.com |
|
| PROXY VOTING |
| The Board of Trustees of the Fund has delegated to the Fund’s investment subadviser the responsibility for voting any proxies and maintaining proxy recordkeeping with respect to the Fund. A description of these proxy voting policies and procedures is available without charge, upon request, by calling (800) 225-1852. Information regarding how the Fund voted proxies relating to portfolio securities during the most recent 12-month period ended June 30 will be available on the Fund’s website and on the Securities and Exchange Commission’s website at the end of August. |
|
| DIRECTORS |
| Ellen S. Alberding • Kevin J. Bannon • Scott E. Benjamin • Linda W. Bynoe • Barry H. Evans • Keith F. Hartstein • Laurie Simon Hodrick • Michael S. Hyland • Stuart S. Parker • Richard A. Redeker • Stephen G. Stoneburn • Grace C. Torres |
|
| OFFICERS |
| Stuart S. Parker, President • Scott E. Benjamin, Vice President • M. Sadiq Peshimam, Treasurer and Principal Financial and Accounting Officer • Raymond A. O’Hara, Chief Legal Officer • Deborah A. Docs, Secretary • Chad A. Earnst, Chief Compliance Officer • Charles H. Smith, Anti-Money Laundering Compliance Officer • Jonathan D. Shain, Assistant Secretary • Claudia DiGiacomo, Assistant Secretary • Andrew R. French, Assistant Secretary • Peter Parrella, Assistant Treasurer • Lana Lomuti, Assistant Treasurer • Linda McMullin, Assistant Treasurer • Kelly A. Coyne, Assistant Treasurer |
| | | | |
| MANAGER | | PGIM Investments LLC | | 655 Broad Street
Newark, NJ 07102 |
|
| INVESTMENT SUBADVISER | | Quantitative Management Associates LLC | | Gateway Center Two
100 Mulberry Street
Newark, NJ 07102 |
|
| DISTRIBUTOR | | Prudential Investment
Management Services LLC | | 655 Broad Street
Newark, NJ 07102 |
|
| CUSTODIAN | | The Bank of New York Mellon | | 225 Liberty Street
New York, NY 10286 |
|
| TRANSFER AGENT | | Prudential Mutual Fund
Services LLC | | PO Box 9658
Providence, RI 02940 |
|
| INDEPENDENT REGISTERED PUBLIC ACCOUNTING FIRM | | KPMG LLP | | 345 Park Avenue New York, NY 10154 |
|
| FUND COUNSEL | | Willkie Farr & Gallagher LLP | | 787 Seventh Avenue
New York, NY 10019 |
|
|
| An investor should consider the investment objectives, risks, charges, and expenses of the Fund carefully before investing. The prospectus and summary prospectus contains this and other information about the Fund. An investor may obtain a prospectus and summary prospectus by visiting our website at www.pgiminvestments.com or by calling (800) 225-1852. The prospectus and summary prospectus should be read carefully before investing. |
|
| SHAREHOLDER COMMUNICATIONS WITH DIRECTORS |
| Shareholders can communicate directly with the Board of Trustees by writing to the Chair of the Board, Prudential QMA International Developed Markets Index Fund, PGIM Investments, Attn: Board of Trustees, 655 Broad Street, Newark, NJ 07102. Shareholders can communicate directly with an individual Trustee by writing to the same address. Communications are not screened before being delivered to the addressee. |
|
| AVAILABILITY OF PORTFOLIO SCHEDULE |
| The Fund files its complete schedule of portfolio holdings with the Securities and Exchange Commission for the first and third quarters of each fiscal year on Form N-Q. The Fund’s Forms N-Q are available on the Commission’s website at www.sec.gov. The Fund’s Forms N-Q may also be reviewed and copied at the Commission’s Public Reference Room in Washington, D.C. Information on the operation and location of the Public Reference Room may be obtained by calling 1-800-SEC-0330. |
Mutual Funds:
| | | | |
ARE NOT INSURED BY THE FDIC OR ANY
FEDERAL GOVERNMENT AGENCY | | MAY LOSE VALUE | | ARE NOT A DEPOSIT OF OR GUARANTEED
BY ANY BANK OR ANY BANK AFFILIATE |
PRUDENTIAL QMA INTERNATIONAL DEVELOPED MARKETS INDEX FUND
| | |
| SHARE CLASS | | Q |
| NASDAQ | | PQDMX |
| CUSIP | | 74440E607 |
Item 2 – Code of Ethics – See Exhibit (a)
As of the end of the period covered by this report, the registrant has adopted a code of ethics (the “Section 406 Standards for Investment Companies – Ethical Standards for Principal Executive and Financial Officers”) that applies to the registrant’s Principal Executive Officer and Principal Financial Officer; the registrant’s Principal Financial Officer also serves as the Principal Accounting Officer.
The registrant hereby undertakes to provide any person, without charge, upon request, a copy of the code of ethics. To request a copy of the code of ethics, contact the registrant 800-225-1852, and ask for a copy of the Section 406 Standards for Investment Companies - Ethical Standards for Principal Executive and Financial Officers.
Item 3 – Audit Committee Financial Expert –
The registrant’s Board has determined that Mr. Kevin J. Bannon, member of the Board’s Audit Committee is an “audit committee financial expert,” and that he is “independent,” for purposes of this Item.
Item 4 – Principal Accountant Fees and Services –
(a) Audit Fees
For the fiscal period ended October 31, 2017, KPMG LLP (“KPMG”), the Registrant’s principal accountant, billed the Registrant $64,000 for professional services rendered for the audit of the Registrant’s annual financial statements or services that are normally provided in connection with statutory and regulatory filings.
(b) Audit-Related Fees
For the fiscal period ended October 31, 2017: none.
(c) Tax Fees
For the fiscal period ended October 31, 2017: none.
(d) All Other Fees
For the fiscal period ended October 31, 2017: none.
(e) (1) Audit Committee Pre-Approval Policies and Procedures
THE PRUDENTIAL MUTUAL FUNDS
AUDIT COMMITTEE POLICY
on
Pre-Approval of Services Provided by the Independent Accountants
The Audit Committee of each Prudential Mutual Fund is charged with the responsibility to monitor the independence of the Fund’s independent accountants. As part of this responsibility, the Audit Committee must pre-approve the independent accounting firm’s engagement to render audit and/or permissible non-audit services, as required by law. In evaluating a proposed engagement of the independent accountants, the Audit Committee will assess the effect that the engagement might reasonably be expected to have on the accountant’s independence. The Committee’s evaluation will be based on:
| | • | | a review of the nature of the professional services expected to be provided, |
| | • | | a review of the safeguards put into place by the accounting firm to safeguard independence, and |
| | • | | periodic meetings with the accounting firm. |
Policy for Audit and Non-Audit Services Provided to the Funds
On an annual basis, the scope of audits for each Fund, audit fees and expenses, and audit-related and non-audit services (and fees proposed in respect thereof) proposed to be performed by the Fund’s independent accountants will be presented by the Treasurer and the independent accountants to the Audit Committee for review and, as appropriate, approval prior to the initiation of such services. Such presentation shall be accompanied by confirmation by both the Treasurer and the independent accountants that the proposed non-audit services will not adversely affect the independence of the independent accountants. Such proposed non-audit services shall be described in sufficient detail to enable the Audit Committee to assess the appropriateness of such services and fees, and the compatibility of the provision of such services with the auditor’s independence. The Committee shall receive periodic reports on the progress of the audit and other services which are approved by the Committee or by the Committee Chair pursuant to authority delegated in this Policy.
The categories of services enumerated under “Audit Services”, “Audit-related Services”, and “Tax Services” are intended to provide guidance to the Treasurer and the independent accountants as to those categories of services which the Committee believes are generally consistent with the independence of the independent accountants and which the Committee (or the Committee Chair) would expect upon the presentation of specific proposals to pre-approve. The enumerated categories are not intended as an exclusive list of audit, audit-related or tax services, which the Committee (or the Committee Chair) would consider for pre-approval.
Audit Services
The following categories of audit services are considered to be consistent with the role of the Fund’s independent accountants:
| | Ø | Annual Fund financial statement audits |
| | Ø | Seed audits (related to new product filings, as required) |
| | Ø | SEC and regulatory filings and consents |
Audit-related Services
The following categories of audit-related services are considered to be consistent with the role of the Fund’s independent accountants:
| | Ø | Accounting consultations |
| | Ø | Fund merger support services |
| | Ø | Agreed Upon Procedure Reports |
| | Ø | Other Internal Control Reports |
Individual audit-related services that fall within one of these categories (except for fund merger support services) and are not presented to the Audit Committee as part of the annual pre-approval process are subject to an authorized pre-approval by the Audit Committee so long as the estimated fee for those services does not exceed $30,000. Any services provided under such pre-approval will be reported to the Audit Committee at its next regular meeting. Should the amount of such services exceed $30,000 any additional fees will be subject to pre-approval by the Committee Chair (or any other Committee member on whom this responsibility has been delegated). Fees related to fund merger support services are subject to a separate authorized pre-approval by the Audit Committee with fees determined on a per occurrence and merger complexity basis.
Tax Services
The following categories of tax services are considered to be consistent with the role of the Fund’s independent accountants:
| | Ø | Tax compliance services related to the filing or amendment of the following: |
| | | ◾ Federal, state and local income tax compliance; and, |
| | | ◾ Sales and use tax compliance |
| | Ø | Timely RIC qualification reviews |
| | Ø | Tax distribution analysis and planning |
| | Ø | Tax authority examination services |
| | Ø | Tax appeals support services |
| | Ø | Accounting methods studies |
| | Ø | Fund merger support services |
| | Ø | Tax consulting services and related projects |
Individual tax services that fall within one of these categories and are not presented to the Audit
Committee as part of the annual pre-approval process are subject to an authorized pre-approval by the Audit Committee so long as the estimated fee for those services does not exceed $30,000. Any services provided under such pre-approval will be reported to the Audit Committee at its next regular meeting. Should the amount of such services exceed $30,000 any additional fees will be subject to pre-approval by the Committee Chair (or any other Committee member on whom this responsibility has been delegated).
Other Non-Audit Services
Certain non-audit services that the independent accountants are legally permitted to render will be subject to pre-approval by the Committee or by one or more Committee members to whom the Committee has
delegated this authority and who will report to the full Committee any pre-approval decisions made pursuant to this Policy. Non-audit services presented for pre-approval pursuant to this paragraph will be accompanied by a confirmation from both the Treasurer and the independent accountants that the proposed services will not adversely affect the independence of the independent accountants.
Proscribed Services
The Fund’s independent accountants will not render services in the following categories of non-audit services:
| | Ø | Bookkeeping or other services related to the accounting records or financial statements of the Fund |
| | Ø | Financial information systems design and implementation |
| | Ø | Appraisal or valuation services, fairness opinions, or contribution-in-kind reports |
| | Ø | Internal audit outsourcing services |
| | Ø | Management functions or human resources |
| | Ø | Broker or dealer, investment adviser, or investment banking services |
| | Ø | Legal services and expert services unrelated to the audit |
| | Ø | Any other service that the Public Company Accounting Oversight Board determines, by regulation, is impermissible. |
Pre-approval of Non-Audit Services Provided to Other Entities Within the Prudential Fund Complex
Certain non-audit services provided to PGIM Investments LLC or any of its affiliates that also provide ongoing services to the 30 Mutual Funds will be subject to pre-approval by the Audit Committee. The only non-audit services provided to these entities that will require pre-approval are those related directly to the operations and financial reporting of the Funds. Individual projects that are not presented to the Audit Committee as part of the annual pre-approval process will be subject to pre-approval by the Committee Chair (or any other Committee member on whom this responsibility has been delegated) so long as the estimated fee for those services does not exceed $30,000. Services presented for pre-approval pursuant to this paragraph will be accompanied by a confirmation from both the Treasurer and the independent accountants that the proposed services will not adversely affect the independence of the independent accountants.
Although the Audit Committee will not pre-approve all services provided to PGIM Investments LLC and its affiliates, the Committee will receive an annual report from the Fund’s independent accounting firm showing the aggregate fees for all services provided to PGIM Investments LLC and its affiliates.
(e) (2) Percentage of services referred to in 4(b) – 4(d) that were approved by the audit committee –
For the fiscal period ended October 31, 2017: none.
(f) Percentage of hours expended attributable to work performed by other than full time employees of principal accountant if greater than 50%.
The percentage of hours expended on the principal accountant’s engagement to audit the registrant’s financial statements for the most recent fiscal year that were attributed to work performed by persons other than the principal accountant’s full-time, permanent employees was 0%.
(g) Non-Audit Fees
The aggregate non-audit fees billed by KPMG for services rendered to the registrant’s investment adviser and any entity controlling, controlled by, or under common control with the investment adviser that provides ongoing services to the registrant for the fiscal period ended October 31, 2017 was $0.
(h) Principal Accountant’s Independence
Not applicable as KPMG has not provided non-audit services to the registrant’s investment adviser and any entity controlling, controlled by, or under common control with the investment adviser that provides ongoing services to the registrant that were not pre-approved pursuant to Rule 2-01(c)(7)(ii) of Regulation S-X.
| | |
| Item 5 – | | Audit Committee of Listed Registrants – Not applicable. |
| |
| Item 6 – | | Schedule of Investments – The schedule is included as part of the report to shareholders filed under Item 1 of this Form. |
| |
| Item 7 – | | Disclosure of Proxy Voting Policies and Procedures for Closed-End Management Investment Companies – Not applicable. |
| |
| Item 8 – | | Portfolio Managers of Closed-End Management Investment Companies – Not applicable. |
| |
| Item 9 – | | Purchases of Equity Securities by Closed-End Management Investment Company and Affiliated Purchasers – Not applicable. |
| |
| Item 10 – | | Submission of Matters to a Vote of Security Holders – Not applicable. |
| |
| Item 11 – | | Controls and Procedures |
| | (a) | It is the conclusion of the registrant’s principal executive officer and principal financial officer that the effectiveness of the registrant’s current disclosure controls and procedures (such disclosure controls and procedures having been evaluated within 90 days of the date of this filing) provide reasonable assurance that the information required to be disclosed by the registrant has been recorded, processed, summarized and reported within the time period specified in the Commission’s rules and forms and that the information required to be disclosed by the registrant has been accumulated and communicated to the registrant’s principal executive officer and principal financial officer in order to allow timely decisions regarding required disclosure. |
| | (b) | There has been no significant change in the registrant’s internal control over financial reporting that occurred during the registrant’s most recent fiscal quarter of the period covered by this report that has materially affected, or is likely to materially affect, the registrant’s internal control over financial reporting. |
| | | | | | |
| | (a) | | (1) | | Code of Ethics – Attached hereto as Exhibit EX-99.CODE-ETH |
| | | | | | |
| | | | (2) | | Certifications pursuant to Section 302 of the Sarbanes-Oxley Act – Attached hereto as Exhibit EX-99.CERT. |
| | | |
| | | | (3) | | Any written solicitation to purchase securities under Rule 23c-1. – Not applicable. |
| | |
| | (b) | | Certifications pursuant to Section 906 of the Sarbanes-Oxley Act – Attached hereto as Exhibit EX-99.906CERT. |
SIGNATURES
Pursuant to the requirements of the Securities Exchange Act of 1934 and the Investment Company Act of 1940, the registrant has duly caused this report to be signed on its behalf by the undersigned, thereunto duly authorized.
| | |
| Registrant | | Prudential Investment Portfolios 2 |
| |
| By: | | /s/ Deborah A. Docs |
| | Deborah A. Docs |
| | Secretary |
| |
| Date: | | December 20, 2017 |
Pursuant to the requirements of the Securities Exchange Act of 1934 and the Investment Company Act of 1940, this report has been signed below by the following persons on behalf of the registrant and in the capacities and on the dates indicated.
| | |
| By: | | /s/ Stuart S. Parker |
| | Stuart S. Parker |
| | President and Principal Executive Officer |
| |
| Date: | | December 20, 2017 |
| |
| By: | | /s/ M. Sadiq Peshimam |
| | M. Sadiq Peshimam |
| | Treasurer and Principal Financial and Accounting Officer |
| |
| Date: | | December 20, 2017 |