UNITED STATES
SECURITIES AND EXCHANGE COMMISSION
Washington, D.C. 20549
FORM N-CSR
CERTIFIED SHAREHOLDER REPORT OF REGISTERED MANAGEMENT
INVESTMENT COMPANIES
| | |
Investment Company Act file number: | | 811-09999 |
| |
Exact name of registrant as specified in charter: | | Prudential Investment Portfolios 2 |
|
(This Form N-CSR relates solely to the Registrant’s: PGIM QMA Commodity Strategies Fund, PGIM Core Conservative Bond Fund, PGIM Jennison Small-Cap Core Equity Fund, PGIM QMA Mid-Cap Core Equity Fund, PGIM QMA US Broad Market Index Fund and PGIM TIPS Fund.) |
| |
Address of principal executive offices: | | 655 Broad Street, 17th Floor |
| | Newark, New Jersey 07102 |
| |
Name and address of agent for service: | | Deborah A. Docs |
| | 655 Broad Street, 17th Floor |
| | Newark, New Jersey 07102 |
| |
Registrant’s telephone number, including area code: | | 973-367-7521 |
| |
Date of fiscal period end: | | 7/31/2018 |
| |
Date of reporting period: | | 7/31/2018 |
Item 1 – Reports to Stockholders

PGIM Jennison Small-Cap Core Equity Fund
PGIM Core Conservative Bond Fund
PGIM TIPS Fund
PGIM QMA Commodity Strategies Fund
PGIM QMA US Broad Market Index Fund
PGIM QMA Mid-Cap Core Equity Fund
(Formerly known as Prudential Jennison Small-Cap Core Equity Fund, Prudential Core Conservative Bond Fund, Prudential TIPS Fund, Prudential Commodity Strategies Fund, Prudential QMA US Broad Market Index Fund and Prudential QMA Mid-Cap Core Equity Fund)
ANNUAL REPORT
JULY 31, 2018

|
PGIM Jennison Small-Cap Core Equity Fund—Objective: To outperform the
Russell 2000 Index PGIM Core Conservative Bond Fund—Objective: To outperform the Bloomberg
Barclays US Aggregate Bond Index over full market cycles PGIM TIPS Fund—Objective: To seek to outperform the Bloomberg Barclays
US Treasury Inflation-Protected Securities (TIPS) Index PGIM QMA Commodity Strategies Fund—Objective: To generate returns over
time in excess of the Bloomberg Commodity Index PGIM QMA US Broad Market Index Fund—Objective: To seek to provide investment
results that approximate the performance of the S&P Composite 1500 Index PGIM QMA Mid-Cap Core Equity Fund—Objective: To outperform the
S&P MidCap 400 Index |
This report is not authorized for distribution to prospective investors unless preceded or accompanied by a current prospectus.
The views expressed in this report and information about the Funds’ portfolio holdings are for the period covered by this report and are subject to change thereafter.
Mutual funds are distributed by Prudential Investment Management Services LLC, a Prudential Financial company and member SIPC. Jennison Associates LLC is a registered investment adviser. PGIM Fixed Income is a unit of PGIM, Inc. (PGIM), a registered investment adviser. QMA is the primary business name of Quantitative Management Associates LLC, a wholly owned subsidiary of PGIM, Inc. (PGIM), a Prudential Financial company. © 2018 Prudential Financial, Inc. and its related entities. PGIM and the PGIM logo are service marks of Prudential Financial, Inc. and its related entities, registered in many jurisdictions worldwide.
| | |
| 2 | | Visit our website at pgiminvestments.com |
PGIM Day One Underlying Funds
TABLE OF CONTENTS
| | | | |
| PGIM Day One Underlying Funds | | | 3 | |
This Page Intentionally Left Blank
PGIM Jennison Small-Cap Core Equity Fund
Your Fund’s Performance (unaudited)
Performance data quoted represent past performance. Past performance does not guarantee future results. The investment return and principal value of an investment will fluctuate, so that an investor’s shares, when redeemed, may be worth more or less than their original cost. Current performance may be lower or higher than the past performance data quoted.
| | | | |
| | | Average Annual Total Returns as of 7/31/18 |
| | | One Year (%) | | Since Inception (%) |
| Class R6* | | 17.75 | | 18.12 (11/15/16) |
| Russell 2000 Index | | | | |
| | 18.73 | | 16.56 |
| Lipper Small Cap Core Funds Average | | | | |
| | | 15.04 | | 13.45 |
Source: PGIM Investments LLC and Lipper Inc.
Growth of a $10,000 Investment
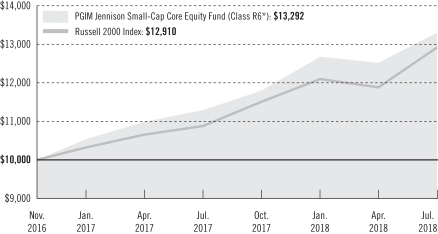
The graph compares a $10,000 investment in the Fund’s Class R6* shares with a similar investment in the Russell 2000 Index by portraying the initial account values at the commencement of operations of Class R6* shares (November 15, 2016) and the account values at the end of the current fiscal year (July 31, 2018), as measured on a quarterly basis. For purposes of the graph, and unless otherwise indicated, it has been assumed that (a) all recurring fees (including management fees) were deducted; and (b) all dividends and distributions were reinvested. Without waiver of fees and/or expense reimbursements, the returns would have been lower.
*Formerly known as Class Q shares
| | | | |
| PGIM Day One Underlying Funds | | | 5 | |
PGIM Jennison Small-Cap Core Equity Fund
Your Fund’s Performance (continued)
Past performance does not predict future performance. Total returns and the ending account values in the graph include changes in share price and reinvestment of dividends and capital gains distributions in a hypothetical investment for the periods shown. The Fund’s total returns do not reflect the deduction of income taxes on an individual’s investment. Taxes may reduce your actual investment returns on income or gains paid by the Fund or any gains you may realize if you sell your shares.
The returns in the tables do not reflect the deduction of taxes that a shareholder would pay on Fund distributions or following the redemption of Fund shares. Inception returns are provided since the Fund has less than 10 fiscal years of returns. Since Inception returns for the Index and the Lipper Average are measured from the closest month-end to the Fund’s inception date.
Benchmark Definitions
Russell 2000 Index—The Russell 2000 Index is an unmanaged index of the 2,000 smallest US companies included in the Russell 3000 Index. It gives an indication of how stock prices of smaller companies have performed.
Lipper Small Cap Core Funds Average—Funds that, by portfolio practice, invest at least 75% of their equity assets in companies with market capitalizations (on a three-year weighted basis) below Lipper’s USDE small-cap ceiling.
Investors cannot invest directly in an index. The returns for the Index would be lower if they included the effects of sales charges, operating expenses of a mutual fund, or taxes. Returns for the Lipper Average reflect the deduction of operating expenses, but not sales charges or taxes.
Presentation of Fund Holdings
| | | | |
Five Largest Holdings expressed as a
percentage of net assets as of 7/31/18 (%) | |
| WPX Energy, Inc., Oil, Gas & Consumable Fuels | | | 2.0 | |
| East West Bancorp, Inc., Banks | | | 2.0 | |
| Summit Materials, Inc., (Class A Stock), Construction Materials | | | 1.9 | |
| Planet Fitness, Inc., Hotels, Restaurants & Leisure | | | 1.8 | |
| Five Below, Inc., (Class A Stock), Specialty Retail | | | 1.7 | |
Holdings reflect only long-term investments and are subject to change.
| | | | |
Five Largest Industries expressed as a
percentage of net assets as of 7/31/18 (%) | |
| Banks | | | 13.5 | |
| Software | | | 7.8 | |
| Equity Real Estate Investment Trusts (REITs) | | | 7.6 | |
| Machinery | | | 6.1 | |
| Hotels, Restaurants & Leisure | | | 4.2 | |
Industry weightings reflect only long-term investments and are subject to change
| | |
| 6 | | Visit our website at pgiminvestments.com |
PGIM Core Conservative Bond Fund
Your Fund’s Performance (unaudited)
Performance data quoted represent past performance. Past performance does not guarantee future results. The investment return and principal value of an investment will fluctuate, so that an investor’s shares, when redeemed, may be worth more or less than their original cost. Current performance may be lower or higher than the past performance data quoted.
| | | | |
| | | Average Annual Total Returns as of 7/31/18 |
| | | One Year (%) | | Since Inception (%) |
| Class R6* | | -1.31 | | 0.23 (11/15/16) |
| Bloomberg Barclays US Aggregate Bond Index | | | | |
| | -0.80 | | 1.22 |
| Lipper Core Bond Funds Average | | | | |
| | | -0.86 | | 1.34 |
Source: PGIM Investments LLC and Lipper Inc.
Growth of a $10,000 Investment
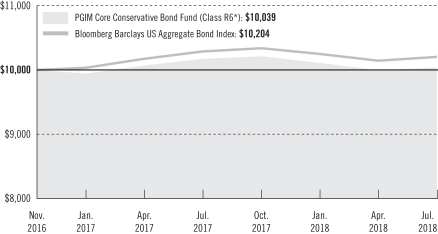
The graph compares a $10,000 investment in the Fund’s Class R6* shares with a similar investment in the Bloomberg Barclays US Aggregate Bond Index by portraying the initial account values at the commencement of operations of Class R6* shares (November 15, 2016) and the account values at the end of the current fiscal year (July 31, 2018), as measured on a quarterly basis. For purposes of the graph, and unless otherwise indicated, it has been assumed that (a) all recurring fees (including management fees) were deducted; and (b) all dividends and distributions were reinvested. Without waiver of fees and/or expense reimbursements, the returns would have been lower.
*Formerly known as Class Q shares
| | | | |
| PGIM Day One Underlying Funds | | | 7 | |
PGIM Core Conservative Bond Fund
Your Fund’s Performance (continued)
Past performance does not predict future performance. Total returns and the ending account values in the graph include changes in share price and reinvestment of dividends and capital gains distributions in a hypothetical investment for the periods shown. The Fund’s total returns do not reflect the deduction of income taxes on an individual’s investment. Taxes may reduce your actual investment returns on income or gains paid by the Fund or any gains you may realize if you sell your shares.
The returns in the tables do not reflect the deduction of taxes that a shareholder would pay on Fund distributions or following the redemption of Fund shares. Inception returns are provided since the Fund has less than 10 fiscal years of returns. Since Inception returns for the Index and the Lipper Averages are measured from the closest month-end to the Fund’s inception date.
Benchmark Definitions
Bloomberg Barclays US Aggregate Bond Index—The Bloomberg Barclays US Aggregate Bond Index is unmanaged and represents securities that are SEC registered, taxable, and dollar denominated. It covers the US investment-grade fixed rate bond market, with index components for government and corporate securities, mortgage pass-through securities, and asset-backed securities.
Lipper Core Bond Funds Average—Funds that invest at least 85% in domestic investment-grade debt issues (rated in the top four grades) with any remaining investment in non-benchmark sectors such as high yield, global and emerging markets debt. These funds maintain dollar-weighted average maturities of five to ten years.
Investors cannot invest directly in an index. The returns for the Index would be lower if they included the effects of sales charges, operating expenses of a mutual fund, or taxes. Returns for the Lipper Average reflect the deduction of operating expenses, but not sales charges or taxes.
Presentation of Fund Holdings
| | | | |
Five Largest Holdings expressed as a
percentage of net assets as of 7/31/18 (%) | |
| U.S. Treasury Notes, 2.000%, 11/30/2020 | | | 3.2 | |
| U.S. Treasury Notes, 2.375%, 08/15/2024 | | | 3.0 | |
| U.S. Treasury Notes, 2.625%, 07/15/2021 | | | 2.6 | |
| U.S. Treasury Bonds, 3.000%, 05/15/2045 | | | 2.5 | |
| U.S. Treasury Notes, 1.625%, 06/30/2020 | | | 2.4 | |
Holdings reflect only long-term investments and are subject to change.
| | | | |
Fund Composition expressed as a
percentage of net assets as of 7/31/18 (%) | |
| U.S. Treasury Obligations | | | 39.4 | |
| U.S. Government Agency Obligations | | | 28.1 | |
| Corporate Bonds | | | 25.4 | |
| Commercial Mortgage-Backed Securities | | | 4.3 | |
| Municipal Bonds | | | 1.0 | |
Fund Composition reflects only long-term investments and are subject to change.
| | |
| 8 | | Visit our website at pgiminvestments.com |
PGIM TIPS Fund
Your Fund’s Performance (unaudited)
Performance data quoted represent past performance. Past performance does not guarantee future results. The investment return and principal value of an investment will fluctuate, so that an investor’s shares, when redeemed, may be worth more or less than their original cost. Current performance may be lower or higher than the past performance data quoted.
| | | | |
| | | Average Annual Total Returns as of 7/31/18 |
| | | One Year (%) | | Since Inception (%) |
| Class R6* | | 0.87 | | 0.73 (11/15/16) |
| Bloomberg Barclays US Treasury Inflation-Protected Securities (TIPS) Index | | | | |
| | 1.17 | | 1.42 |
| Lipper Inflation Protected Bond Funds Average | | | | |
| | | 1.08 | | 1.42 |
Source: PGIM Investments LLC and Lipper Inc.
Growth of a $10,000 Investment
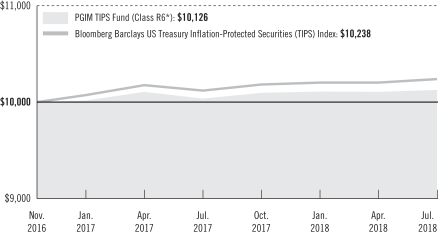
The graph compares a $10,000 investment in the Fund’s Class R6* shares with a similar investment in the Bloomberg Barclays US Treasury Inflation-Protected Securities (TIPS) Index by portraying the initial account values at the commencement of operations of Class R6* shares (November 15, 2016) and the account values at the end of the current fiscal year (July 31, 2018), as measured on a quarterly basis. For purposes of the graph, and unless otherwise indicated, it has been assumed that (a) all recurring fees (including management fees) were deducted; and (b) all dividends and distributions were reinvested. Without waiver of fees and/or expense reimbursements, the returns would have been lower.
*Formerly known as Class Q shares
| | | | |
| PGIM Day One Underlying Funds | | | 9 | |
PGIM TIPS Fund
Your Fund’s Performance (continued)
Past performance does not predict future performance. Total returns and the ending account values in the graph include changes in share price and reinvestment of dividends and capital gains distributions in a hypothetical investment for the periods shown. The Fund’s total returns do not reflect the deduction of income taxes on an individual’s investment. Taxes may reduce your actual investment returns on income or gains paid by the Fund or any gains you may realize if you sell your shares.
The returns in the tables do not reflect the deduction of taxes that a shareholder would pay on Fund distributions or following the redemption of Fund shares. Inception returns are provided since the Fund has less than 10 fiscal years of returns. Since Inception returns for the Index and the Lipper Average are measured from the closest month-end to the Fund’s inception date.
Benchmark Definitions
Bloomberg Barclays US Treasury Inflation-Protected Securities (TIPS) Index—The Bloomberg Barclays US Treasury Inflation-Protected Securities (TIPS) Index is an unmanaged index that consists of inflation-protected securities issued by the US Treasury.
Lipper Inflation Protected Bond Funds Average—Funds that invest primarily in inflation-indexed fixed income securities. Inflation-linked bonds are fixed income securities structured to provide protection against inflation.
Investors cannot invest directly in an index. The returns for the Index would be lower if they included the effects of sales charges, operating expenses of a mutual fund, or taxes. Returns for the Lipper Average reflect the deduction of operating expenses, but not sales charges or taxes.
Presentation of Fund Holdings
| | | | |
Five Largest Holdings expressed as a
percentage of net assets as of 7/31/18 (%) | |
| U.S. Treasury Inflation Indexed Bonds, TIPS, 0.125%, 01/15/23 | | | 8.5 | |
| U.S. Treasury Inflation Indexed Bonds, TIPS, 2.375%, 01/15/22 | | | 7.4 | |
| U.S. Treasury Inflation Indexed Bonds, TIPS, 0.125%, 01/15/22 | | | 7.1 | |
| U.S. Treasury Inflation Indexed Bonds, TIPS, 0.250%, 01/15/25 | | | 6.6 | |
| U.S. Treasury Inflation Indexed Bonds, TIPS, 0.125%, 04/15/20 | | | 6.1 | |
Holdings reflect only long-term investments and are subject to change.
| | | | |
Fund Composition expressed as a
percentage of net assets as of 7/31/18 (%) | |
U.S. Treasury Obligations | | | 98.8 | |
Fund Composition reflects only long-term investments and is subject to change.
| | |
| 10 | | Visit our website at pgiminvestments.com |
PGIM QMA Commodity Strategies Fund
Your Fund’s Performance (unaudited)
Performance data quoted represent past performance. Past performance does not guarantee future results. The investment return and principal value of an investment will fluctuate, so that an investor’s shares, when redeemed, may be worth more or less than their original cost. Current performance may be lower or higher than the past performance data quoted.
| | | | |
| | | Average Annual Total Returns as of 7/31/18 |
| | | One Year (%) | | Since Inception (%) |
| Class R6* | | 2.99 | | 2.63 (11/15/16) |
| Bloomberg Commodity Index | | | | |
| | 2.73 | | 0.79 |
| Lipper Commodities General Funds Average | | | | |
| | | 6.70 | | 2.94 |
Source: PGIM Investments LLC and Lipper Inc.
Growth of a $10,000 Investment
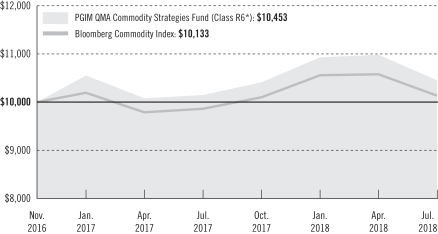
The graph compares a $10,000 investment in the Fund’s Class R6* shares with a similar investment in the Bloomberg Commodity Index by portraying the initial account values at the commencement of operations of Class R6* shares (November 15, 2016) and the account values at the end of the current fiscal year (July 31, 2018), as measured on a quarterly basis. For purposes of the graph, and unless otherwise indicated, it has been assumed that (a) all recurring fees (including management fees) were deducted; and (b) all dividends and distributions were reinvested. Without waiver of fees and/or expense reimbursements, the returns would have been lower.
*Formerly known as Class Q shares
| | | | |
| PGIM Day One Underlying Funds | | | 11 | |
PGIM QMA Commodity Strategies Fund
Your Fund’s Performance (continued)
Past performance does not predict future performance. Total returns and the ending account values in the graph include changes in share price and reinvestment of dividends and capital gains distributions in a hypothetical investment for the periods shown. The Fund’s total returns do not reflect the deduction of income taxes on an individual’s investment. Taxes may reduce your actual investment returns on income or gains paid by the Fund or any gains you may realize if you sell your shares.
The returns in the tables do not reflect the deduction of taxes that a shareholder would pay on Fund distributions or following the redemption of Fund shares. Inception returns are provided since the Fund has less than 10 fiscal years of returns. Since Inception returns for the Index and the Lipper Average are measured from the closest month-end to the Fund’s inception date.
Benchmark Definitions
Bloomberg Commodity Index—The Bloomberg Commodity Index is a diversified benchmark for the commodity futures market. It is composed of futures contracts on 19 physical commodities traded on US exchanges, with the exception of aluminum, nickel, and zinc, which trade on the London Metal Exchange (LME).
Lipper Commodities General Funds Average—Funds that invest primarily in a blended basket of commodity-linked derivative instruments or physicals.
Investors cannot invest directly in an index. The returns for the Index would be lower if they included the effects of sales charges, operating expenses of a mutual fund, or taxes. Returns for the Lipper Average reflect the deduction of operating expenses, but not sales charges or taxes.
Presentation of Fund Holdings
| | | | |
Top Five Commodities Futures Exposures as a
percentage of net assets as of 7/31/18 (%) | |
Gold 100 oz | | | 12.2 | |
| WTI Crude | | | 9.1 | |
| Natural Gas | | | 8.9 | |
| Brent Crude | | | 8.6 | |
Copper | | | 6.6 | |
Commodity Futures contracts reflect net exposure and are subject to change.
| | |
| 12 | | Visit our website at pgiminvestments.com |
PGIM QMA US Broad Market Index Fund
Your Fund’s Performance (unaudited)
Performance data quoted represent past performance. Past performance does not guarantee future results. The investment return and principal value of an investment will fluctuate, so that an investor’s shares, when redeemed, may be worth more or less than their original cost. Current performance may be lower or higher than the past performance data quoted.
| | | | |
| | | Average Annual Total Returns as of 7/31/18 |
| | | One Year (%) | | Since Inception (%) |
| Class R6* | | 16.05 | | 17.77 (11/17/16) |
| S&P Composite 1500 Index | | | | |
| | 16.33 | | 17.98 |
| Lipper Multi-Cap Core Funds Average** | | | | |
| | 13.83 | | 15.63 |
| Lipper Large-Cap Core Funds Average** | | | | |
| | | 14.73 | | 16.71 |
*Formerly known as Class Q shares
**The Fund is compared to the Lipper Multi-Cap Core Funds Universe, although Lipper classifies the Fund in the Lipper Large-Cap Core Funds Universe. The Lipper Multi-Cap Core Funds universe is utilized because the Fund’s manager believes that the funds included in the universe provide a more appropriate basis for Fund performance comparisons.
Source: PGIM Investments LLC and Lipper Inc.
Growth of a $10,000 Investment

The graph compares a $10,000 investment in the Fund’s Class R6* shares with a similar investment in the S&P Composite 1500 Index by portraying the initial account values at the
| | | | |
| PGIM Day One Underlying Funds | | | 13 | |
PGIM QMA US Broad Market Index Fund
Your Fund’s Performance (continued)
commencement of operations of Class R6* shares (November 17, 2016) and the account values at the end of the current fiscal year (July 31, 2018), as measured on a quarterly basis. For purposes of the graph, and unless otherwise indicated, it has been assumed that (a) all recurring fees (including management fees) were deducted; and (b) all dividends and distributions were reinvested. Without waiver of fees and/or expense reimbursements, the returns would have been lower.
Past performance does not predict future performance. Total returns and the ending account values in the graph include changes in share price and reinvestment of dividends and capital gains distributions in a hypothetical investment for the periods shown. The Fund’s total returns do not reflect the deduction of income taxes on an individual’s investment. Taxes may reduce your actual investment returns on income or gains paid by the Fund or any gains you may realize if you sell your shares.
*Formerly known as Class Q shares
The returns in the tables do not reflect the deduction of taxes that a shareholder would pay on Fund distributions or following the redemption of Fund shares. Inception returns are provided since the Fund has less than 10 fiscal years of returns. Since Inception returns for the Index and the Lipper Averages are measured from the closest month-end to the Fund’s inception date.
Benchmark Definitions
S&P Composite 1500 Index—The S&P Composite 1500® Index is an unmanaged index of stocks of 1,500 US companies, with market capitalizations ranging from small to large. The SP Composite 1500 Index is a combination of three leading US stock indices: The S&P 500 Index (which measures the performance of US Large Cap stocks), the S&P MidCap 400 Index (which measures the performance of Mid Cap stocks) and the S&P 600 Index (which measures the performance of US Small Cap stocks) and gives an indication of how the broad US stock market has performed. Index returns do not include the effect of any sales charges, mutual fund operating expenses or taxes. These returns would be lower if they included the effect of these expenses.
Lipper Multi-Cap Core Funds Average—Funds that, by portfolio practice, invest in a variety of market capitalization ranges without concentrating 75% of their equity assets in any one market capitalization range over an extended period of time.
Lipper Large-Cap Core Funds Average—Funds that, by portfolio practice, invest at least 75% of their equity assets in companies with market capitalizations (on a three-year weighted basis) above Lipper’s USDE large cap floor.
Investors cannot invest directly in an index. The returns for the Index would be lower if they included the effects of sales charges, operating expenses of a mutual fund, or taxes. Returns for the Lipper Average reflect the deduction of operating expenses, but not sales charges or taxes.
| | |
| 14 | | Visit our website at pgiminvestments.com |
Presentation of Fund Holdings
| | | | |
Five Largest Holdings expressed as a
percentage of net assets as of 7/31/18 (%) | |
Apple, Inc., Technology Hardware, Storage & Peripherals | | | 3.3 | |
| Microsoft Corp., Software | | | 2.9 | |
| Amazon.com, Inc., Internet & Direct Marketing Retail | | | 2.5 | |
| Facebook, Inc., Internet Software & Services | | | 1.5 | |
| SPDR S&P 500 ETF Trust, Exchange Traded Funds | | | 1.4 | |
Holdings reflect only long-term investments and are subject to change.
| | | | |
Five Largest Industries expressed as a
percentage of net assets as of 7/31/18 (%) | |
Banks | | | 6.1 | |
| Software | | | 5.5 | |
| Oil, Gas & Consumable Fuels | | | 4.9 | |
| Internet Software & Services | | | 4.4 | |
| IT Services | | | 4.1 | |
Industry weightings reflect only long-term investments and are subject to change.
| | | | |
| PGIM Day One Underlying Funds | | | 15 | |
PGIM QMA Mid-Cap Core Equity Fund
Your Fund’s Performance (unaudited)
Performance data quoted represent past performance. Past performance does not guarantee future results. The investment return and principal value of an investment will fluctuate, so that an investor’s shares, when redeemed, may be worth more or less than their original cost. Current performance may be lower or higher than the past performance data quoted.
| | | | |
| | | Average Annual Total Returns as of 7/31/18 |
| | | One Year (%) | | Since Inception (%) |
| Class R6* | | 11.36 | | 13.68 (11/17/16) |
| S&P MidCap 400 Index | | | | |
| | 14.50 | | 14.38 |
| Lipper Mid-Cap Core Funds Average | | | | |
| | | 11.84 | | 12.56 |
Source: PGIM Investments LLC and Lipper Inc.
Growth of a $10,000 Investment
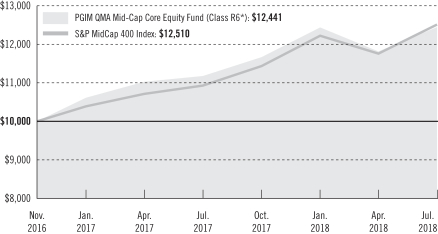
The graph compares a $10,000 investment in the Fund’s Class R6* shares with a similar investment in the S&P MidCap 400 Index by portraying the initial account values at the commencement of operations of Class R6* shares (November 17, 2016) and the account values at the end of the current fiscal year (July 31, 2018), as measured on a quarterly basis. For purposes of the graph, and unless otherwise indicated, it has been assumed that (a) all recurring fees (including management fees) were deducted; and (b) all dividends and distributions were reinvested. Without waiver of fees and/or expense reimbursements, the returns would have been lower.
*Formerly known as Class Q shares
| | |
| 16 | | Visit our website at pgiminvestments.com |
Past performance does not predict future performance. Total returns and the ending account values in the graph include changes in share price and reinvestment of dividends and capital gains distributions in a hypothetical investment for the periods shown. The Fund’s total returns do not reflect the deduction of income taxes on an individual’s investment. Taxes may reduce your actual investment returns on income or gains paid by the Fund or any gains you may realize if you sell your shares.
The returns in the tables do not reflect the deduction of taxes that a shareholder would pay on Fund distributions or following the redemption of Fund shares. Inception returns are provided since the Fund has less than 10 fiscal years of returns. Since Inception returns for the Index and the Lipper Average are measured from the closest month-end to the Fund’s inception date.
Benchmark Definitions
S&P MidCap 400 Index—The S&P MidCap 400 Index is designed to measure the performance of 400 mid-sized companies in the US.
Lipper Mid-Cap Core Funds Average—Funds that, by portfolio practice, invest at least 75% of their equity assets in companies with market capitalizations (on a three-year weighted basis) below Lipper’s USDE large-cap floor.
Investors cannot invest directly in an index. The returns for the Index would be lower if they included the effects of sales charges, operating expenses of a mutual fund, or taxes. Returns for the Lipper Average reflect the deduction of operating expenses, but not sales charges or taxes.
Presentation of Fund Holdings
| | | | |
Five Largest Holdings expressed as a
percentage of net assets as of 7/31/18 (%) | |
| iShares Core S&P Mid-Cap ETF, Exchange Traded Funds | | | 2.1 | |
| Steel Dynamics, Inc., Steel | | | 1.1 | |
| Fortinet, Inc., Systems Software | | | 1.0 | |
| NVR, Inc., Homebuilding | | | 1.0 | |
| STERIS PLC, Health Care Equipment | | | 1.0 | |
Holdings reflect only long-term investments and are subject to change.
| | | | |
Five Largest Industries expressed as a
percentage of net assets as of 7/31/18 (%) | |
| Equity Real Estate Investment Trusts (REITs) | | | 8.0 | |
| Banks | | | 7.4 | |
| Electronic Equipment, Instruments & Components | | | 5.0 | |
| Health Care Equipment & Supplies | | | 4.6 | |
| Insurance | | | 4.6 | |
Industry weightings reflect only long-term investments and are subject to change.
| | | | |
| PGIM Day One Underlying Funds | | | 17 | |
PGIM Jennison Small-Cap Core Equity Fund
Strategy and Performance Overview
How did the Fund perform?
The PGIM Jennison Small-Cap Core Equity Fund’s Class R6 shares rose 17.75% for the 12-month reporting period that ended July 31, 2018. In the same period, the Russell 2000® Index (the Index) advanced 18.73%.
What was the market environment?
| • | | Equity markets posted strong gains in the period. Small-cap stocks especially performed well, while growth stocks outperformed value in general. |
| • | | Early in the period, investors responded enthusiastically to corporate tax legislation passed in late 2017, perhaps on the belief that it would enhance profits and spur repatriation of offshore cash that could potentially fund increased business investment and capital returns to shareholders. |
| • | | Strong corporate-sector financial results and 2018 forecasts added to investors’ positive sentiment, as did improved consumer confidence, which reached its highest level since the 2008 financial crisis. |
| • | | The equity market advance reversed abruptly and turbulently in late January 2018 amid concerns that White House moves to reset global trade practices, using new tariffs and penalties for intellectual property infringement, could jeopardize global growth. Fears that the expanding US economy could trigger a rebound in inflation and accelerate the pace of Federal Reserve (the Fed) interest rate hikes added to the volatility. |
| • | | Markets recovered incrementally on the strength of corporate earnings gains, and healthy consumer and business sentiment. |
What worked?
| • | | Information technology contributed strongly to performance, led by HubSpot. The provider of cloud-based marketing and sales software platforms to small- and medium-sized businesses enjoyed growth in billings, revenues, and earnings. Jennison believes the company is only in the early stages of selling its new Customer Relationship Management and Customer Service products, which Jennison anticipates should be significant growth drivers for the next several quarters. At the same time, the company is experiencing minimal competition in a fast-growing market. |
| • | | In consumer discretionary, there were several strong contributors: |
| | • | | Five Below shares rose on strong growth in same-store sales. With over 600 stores in 32 states, the discount retailer sells a range of specialty accessories, beauty products, sports and fitness products, novelty and party items, and school supplies. Jennison believes the company is nicely positioned for a brand-awareness tipping point. With plans for 125 new stores this year, and a goal of more than 2,500 stores in the long term, Five Below’s expansion plans remain robust. |
| | |
| 18 | | Visit our website at pgiminvestments.com |
| | • | | Planet Fitness beat earnings expectations. Several factors that Jennison believes bode well for growth include an increasing average royalty rate, increasing the pricing of the Black Card for new members, continuing improvement to the real estate site selection, upgrading technology by enhancing member experience, and elevating equipment in the future, which Jennison believes could lead to further customer acquisition. |
| | • | | Shares of Pinnacle Entertainment rose significantly earlier in the period on solid earnings. Jennison believes this is an operationally strong company that generates impressive free cash flow. Jennison sees a lot of potential upside given the company’s operating and financial leverage. |
| • | | While healthcare holdings detracted in aggregate, Juno Therapeutics was a standout. Celgene announced it was acquiring the biopharmaceutical company, which develops cell-based cancer immunotherapies, at a significant premium. Celgene stated that Juno complements its portfolio and that Celgene can use its global infrastructure in hematology and oncology to commercialize Juno’s platform. |
What didn’t work?
| • | | Healthcare was a significant detractor. |
| | • | | GenMark Diagnostics, a molecular diagnostics company that develops and commercializes molecular tests based on its proprietary eSensor electrochemical detection technology, detracted from performance. Several developments weighed on the share price: The European Union’s environment was difficult, which Jennison believes will limit revenues in that geography; an FDA submission has been delayed until mid-2018; and a lower mix of capital sales are expected in the U.S. as a result of increasing competitive pressure. Jennison continues to see value in the ePlex platform and the company’s ability to ramp the launch later this year. |
| | • | | Otonomy, a biopharmaceutical company that focuses on the development and commercialization of therapeutics for ear disease and disorders, was a detractor. The highly anticipated Phase III trial for OTIVIDEX, which treats Meniere’s disease, missed the primary and secondary endpoints. The company discontinued all clinical work on the drug, and Jennison eliminated its position. |
| • | | In information technology, MACOM Technology Solutions Holdings was a poor performer. The company, which provides high-performance analog semiconductor solutions that enable Internet applications, the cloud-connected applications economy, and the networked battlefield, reported weak results driven by a supply shortage in data center products in addition to Optical weakness in China, and guidance was significantly lowered. While the investment thesis is taking a bit longer than expected to play out, Jennison believes the company can drive top-line growth and margin leverage through market share gains, design wins, and higher-margin new-product ramps. |
| | | | |
| PGIM Day One Underlying Funds | | | 19 | |
PGIM Jennison Small-Cap Core Equity Fund
Strategy and Performance Overview (continued)
| • | | In consumer discretionary, Criteo, a technology-driven company that uses predictive data to manage targeted campaigns at scale and deliver high return on investment outcomes for advertisers, detracted from performance. The company’s shares fell sharply when it was announced that Apple’s latest iOS 11.2 update disables the workaround that Criteo was using to reach Safari users. Jennison believes this should have a meaningful impact on 2018 revenue but that the company remains a valuable advertising platform and has an attractive valuation given the growth potential. |
| • | | Colony Capital was another large detractor. The portfolio of properties it acquired early in 2017 has not performed as expected. Nevertheless, Jennison thinks management is taking the right steps like paying down debt, buying back stock, and developing a plan to turn the business around. |
The percentage points shown in the tables identify each security’s positive or negative contribution to the Fund’s return, which is the sum of all contributions by individual holdings.
| | | | | | |
| Top Contributors (%) | | Top Detractors (%) |
| Five Below | | 1.33 | | MACOM Technology Solutions | | –1.08 |
| Planet Fitness | | 1.23 | | Colony Capital | | –0.64 |
| Juno Therapeutics | | 1.17 | | GenMark Diagnostics | | –0.57 |
| Pinnacle Entertainment | | 1.05
| | Otonomy | | –0.53 |
| HubSpot | | 1.00 | | Criteo | | –0.44 |
Current outlook
| • | | Generally, Jennison continues to see a solid overall economy due to improving consumer spending, industrial/manufacturing capital spending, and ongoing robust technology spending. Jennison believes the passage of tax reform means more certainty for businesses as real dollars will be available, and that certainty will allow managements to greenlight long-term capital projects, engage in mergers and acquisitions, and/or return capital to shareholders in the form of share repurchases and dividends. |
| • | | While Jennison is mostly positive on stock markets this year, it sees headwinds that could lead to greater volatility. The impact of rising rates and the Fed’s planned acceleration of its balance sheet liquidation have yet to affect the economy or market. Jennison is also concerned about the potential for decelerating earnings growth as the year progresses based on more difficult comparisons and pauses in business spending in light of tariff rhetoric. In addition, the potential for a modest but steady rise in inflation has historically curtailed multiples. |
| | |
| 20 | | Visit our website at pgiminvestments.com |
| • | | Jennison maintains its conviction in the fundamental strength of companies included in its portfolios. Recent earnings of holdings have generally met or exceeded estimates, and individual outlooks remain favorable. |
| • | | Jennison remains positive on technology and industrial holdings in its portfolios and expects a continued rebound in some segments of consumer discretionary. It believes that rising rates, lower taxes, and an improving economy will benefit financial stocks. |
| | | | |
| PGIM Day One Underlying Funds | | | 21 | |
PGIM Core Conservative Bond Fund
Strategy and Performance Overview
How did the Fund perform?
The PGIM Core Conservative Bond Fund’s Class R6 shares declined -1.31% for the 12-month reporting period that ended July 31, 2018, underperforming the 0.80% decline of the Bloomberg Barclays US Aggregate Bond Index (the Index).
What were market conditions?
| • | | 2017 was not expected to be a good year for bonds. There was so much for the bond market to fear. European and Japanese interest rates had risen as the European Central Bank (ECB) and Bank of Japan (BoJ) began their respective stylized tapering. The U.S. had its Republican sweep, bringing with it expectations for pro-cyclical fiscal stimuli and upside risks for Federal Reserve (Fed) rate hikes. All said, this confluence of events was expected to finally torpedo the decades-old bond bull market. |
| • | | While European political fears turned out to be a bit overblown, all of the other fears were more or less grounded. The ECB and BoJ continued to reduce their purchases, fiscal stimulus in the U.S. was on the way, and the world’s economy generally continued to improve. But thanks to positive yield curves lending a little yield and roll-down advantage relative to cash, coupled with a little more spread tightening (i.e., narrower spreads between yields on U.S. Treasuries versus other types of bonds with comparable maturities), 2017 confounded many of the initial expectations and turned out to be yet another solid year for fixed income. Broad benchmarks generally outperformed cash and, as many expected, the higher-yielding sectors turned in particularly impressive performances. |
| • | | The markets struggled at the end of the period as the fears on the trade and political fronts that emerged early in 2018 were realized in the second quarter to varying degrees, while the long shadow of quantitative tightening continued to stretch across the markets. The trade conflicts started getting uneasy at the G20 but then became real as U.S. barbs were met with tit-for-tat measures, which PGIM Fixed Income believes are at risk of intensifying during the third quarter of this year and beyond. (The G20, or Group of Twenty, is an international forum for governments representing 19 of the world’s largest economies and the European Union.) The results from the elections in Italy in the first quarter of 2018 transformed into a market nightmare in the second quarter as renegade parties entered a coalition with a platform that appeared to jeopardize Italy’s finances and its relationship with Europe. Meanwhile, emerging market developments, including elections in Turkey and Mexico, raised concerns about the potential rise in policy heterodoxy. Over the first half of 2018, these concerns fueled a continued widening of spreads from the tight spreads in the first quarter, which may have gotten a bit ahead of fundamentals. |
| • | | The fixed income markets, as represented by the Bloomberg Barclays US Aggregate Bond Index, posted a modestly negative return of -0.80%. |
| | |
| 22 | | Visit our website at pgiminvestments.com |
| • | | U.S. corporate bonds, as represented by the Bloomberg Barclays Corporate Index, returned -0.73% with an excess return to U.S. Treasuries of +76 basis points (bps) during the reporting period. (One basis point equals 0.01%.) Industrials outperformed financials and utilities, albeit all sectors posted negative returns over the reporting period. Metals & mining, energy, and telecom were among the strongest sectors over the period, while cable & satellite, finance companies, and capital goods were amongst the largest underperformers. |
| • | | The Bloomberg Barclays Agency MBS Index posted its best month in July since September 2017 as strong broad-based demand returned with a sell-off in rates to 3%, muted volatility, and contained supply coming off peak seasonals. The 30-year mortgage rate has remained sticky recently. It dipped to about 4.63% in June and ended July at 4.75%. |
What worked?
| • | | Overweights to investment-grade corporates, commercial mortgage-backed securities (CMBS), and municipals added value. |
| • | | Security selection in U.S. Treasuries and investment-grade corporate bonds added to performance. |
| • | | Within corporates, security selection in the banking, consumer non-cyclical, and media & entertainment sectors was positive. |
| • | | In individual security selection, the Fund benefited from overweights to Twenty-First Century Fox (media & entertainment), and JPMorgan Chase and Goldman Sachs (banking). |
| • | | The Fund’s yield curve positioning was a modest contributor, while the Fund’s duration-positioning detracted slightly. Duration measures the sensitivity of the price (the value of principal) of a bond to a change in interest rates. |
What didn’t work?
| • | | Underweights in agencies and emerging markets debt detracted modestly from performance. |
| • | | Security selection in emerging markets debt and mortgage-backed securities (MBS) limited results. |
| • | | The Fund’s positioning in the electric utilities, metals & mining, and foreign non-corporate sectors detracted from performance. |
| • | | In individual security selection, the Fund’s overweight positions in electric utilities issuers PG&E and Edison International hurt performance for the reporting period. An overweight in Teva Pharmaceutical Industries (healthcare & pharmaceutical) was also a negative. |
Did the Fund use derivatives and how did they affect performance?
| | • | | There were no derivatives used during the reporting period. |
| | | | |
| PGIM Day One Underlying Funds | | | 23 | |
PGIM Core Conservative Bond Fund
Strategy and Performance Overview (continued)
Current outlook
| • | | At the outset of the second quarter of 2018, PGIM Fixed Income anticipated a trading range on the U.S. Treasury 10-year yield between 2.65% and 2.95% with U.S. Treasuries poised to outperform derivatives (both futures and interest rate swaps). While the 10-year trading range was slightly higher at 2.75% to 3.10%, cash Treasuries outperformed swaps as spreads at the intermediate and long portions of the yield curve widened during the quarter. Looking ahead, given the potential for further changes to the interest rate on excess reserves (IOER) toward the lower end of the Fed’s rate corridor, U.S. Treasury funding rates should trade lower in tandem, thus richening U.S Treasuries relative to fixed-rate derivatives. |
| • | | Overall, PGIM Fixed Income anticipates that it will likely add duration when the 10-year yield approaches the top of the recent trading range of 2.75%-3.00%, while potentially shedding duration when the yield moves toward the bottom of the range. More specifically, PGIM Fixed Income is maintaining long positioning in the seven-year portion of the U.S. yield curve and short positioning at the front of the curve. PGIM Fixed Income believes the market continues to underprice future Fed tightening given that PGIM Fixed Income’s base case calls for a total of four fed funds rate hikes in 2018 (i.e., two more hikes in the second half of this year) and two additional hikes in 2019. |
| • | | In investment-grade corporate bonds, as we enter the later stage of the credit cycle, PGIM Fixed Income continues to favor better-quality financials and electric utilities over industrials that are subject to event risk. Within industrials, PGIM Fixed Income is focusing on names where an “event” has passed, as higher-quality corporates continue to lever up and mergers and acquisitions (M&A) activity remains a concern. |
| • | | With regard to municipal bonds, PGIM Fixed Income’s positive outlook is based on extremely favorable near-term technicals and a more attractive entry point for investors following the year-to-date back up in rates. Additionally, a relatively stable rate environment should be supportive of steady mutual fund inflows. Continued selling of tax-exempt bonds from bank portfolios could weigh on the market in the second half of 2018. PGIM Fixed Income expects taxable municipals to perform in line with corporate bonds, with potential for outperformance should corporate M&A activity persist. |
| • | | Regarding mortgage products, PGIM Fixed Income is neutral versus rates while it remains underweight versus other spread products. PGIM Fixed Income prefers higher-coupon bonds in both the 30- and 15-year sectors to maximize carry relative to the Index. PGIM Fixed Income remains a holder of seasoned pools given better prepayment behavior and better convexity. |
| • | | Within CMBS, PGIM Fixed Income continues to find value in high-quality securities of new issue conduit deals. |
| | |
| 24 | | Visit our website at pgiminvestments.com |
PGIM TIPS Fund
Strategy and Performance Overview
How did the Fund perform?
The PGIM TIPS Fund’s Class R6 shares returned 0.87% for the 12-month reporting period that ended July 31, 2018, underperforming the 1.17% return of the Bloomberg Barclays US Treasury Inflation-Protected Securities (TIPS) Index.
What were market conditions?
| • | | Early in the period, wage growth remained anemic, in part reflecting overall sluggish productivity developments, but signs of an upturn in investment may yet spur wage inflation. Commodity prices settled in at lukewarm levels—up from 2016’s lows but well off their 2014 peaks. The level of commodity prices seemed to have struck a balance between providing reasonable terms-of-trade support for commodity exporters while still not creating widespread pressure on prices or sapping the profit margins of importing firms. |
| • | | As we entered 2018, unemployment rates had fallen to low levels in many countries, notably including the United States, Germany, Japan, and the United Kingdom. Nevertheless, inflation has remained subdued. In the years before the 2008 global financial crisis, inflation generally trended up as the unemployment rate declined. In contrast, following the crisis, inflation has been comparatively unresponsive as unemployment has dropped sharply. With tightening labor markets, PGIM Fixed Income expected inflation to pick up gradually during the year ahead. However, the recent behavior of inflation has been difficult to forecast, and a surprise in either direction was possible. |
| • | | Toward the end of the period, oil prices moved up to their highest levels since late 2014. They have been lifted by concerns about Iranian production as President Trump withdrew from the Joint Comprehensive Plan of Action (JCPOA1, also referred to as the “Iran Nuclear Deal”), and by continued strong oil demand (in line with an overall solid pace of global activity). The Federal Reserve (Fed) has continued to gradually hike rates, in the context of a strong U.S. economy, but the Fed’s communication has been somewhat more forceful regarding the need for further rate hikes than markets had anticipated. This, in turn, has helped fuel a 5% appreciation of the dollar. U.S. inflation reached the Fed’s 2% target, give or take. But upside inflation pressures remain muted. Wage growth continues to run at a moderate pace. Household credit growth slowed to a 3.3% annualized pace in the first quarter of 2018, and household indebtedness remains high. PGIM Fixed Income believes all of this suggests pricing power may still be limited for many industries. |
What worked?
| • | | Security selection added to performance for the reporting period. |
| | | | |
| PGIM Day One Underlying Funds | | | 25 | |
PGIM TIPS Fund
Strategy and Performance Overview (continued)
| • | | The duration of the Fund was closely matched to that of the Index for the reporting period. Duration measures the sensitivity of the price (the value of principal) of a bond to a change in interest rates. Duration positioning added to performance during the period. The Fund ended the period with a modest underweight position relative to the Index. |
What didn’t work?
| • | | The Fund maintained a yield curve flattener position, expecting the yield differential between short-maturity bonds and long-maturity bonds to narrow, which hurt performance modestly over the reporting period. |
Did the Fund use derivatives and how did they affect performance?
| • | | No derivatives were used during the reporting period. |
Current outlook
| • | | Given stronger growth and slightly firmer inflation, PGIM Fixed Income expects the Fed to hike rates a total of four times this calendar year, followed by a couple more hikes next year. However, the risks around this assessment are likely tilted to the downside in PGIM Fixed Income’s view. Other relatively dovish developed market (DM) central banks, elevated global trade tensions, and increased emerging market (EM) risks have contributed to the dollar’s rise since mid-April, which in turn has reinforced the effects of the Fed’s monetary tightening. |
| • | | PGIM Fixed Income believes that, in aggregate, various inflation measures suggest the Fed has effectively reached its 2% mandate, but core inflation figures also suggest the Fed is not behind the curve. Higher-than-expected oil prices are keeping headline inflation elevated for a little longer than expected, but a sharp acceleration in monthly core inflation figures early this year quickly subsided, leaving underlying inflation appearing capped. Wage gains remain fairly steady, at 2.7% on a year-over-year rate—roughly in line with headline inflation, and thus implying ongoing low real wage gains for the average worker. |
| | |
| 26 | | Visit our website at pgiminvestments.com |
PGIM QMA Commodity Strategies Fund
Strategy and Performance Overview
How did the Fund perform?
The PGIM QMA Commodity Strategies Fund’s Class R6 shares rose 2.99% for the 12-month reporting period that ended July 31, 2018. The Fund outperformed its benchmark, the Bloomberg Commodity Index (the Index), which returned 2.73% for the period.
What were market conditions?
For the reporting period, the energy sector delivered strong gains, which drove the positive results generated by the Index. Most of the other sectors in the Index posted negative results, led by declines in the grains, agriculture, and livestock sectors.
What worked?
| • | | For much of the last half of 2017, the Fund’s overweight position in the petroleum sector added value, as that sector of the commodities market rallied. The Fund’s positioning in the grains and industrial metals sectors also benefited performance in the second half of 2017. The overweight in the petroleum sector continued to contribute to the Fund’s performance going into 2018, and its positioning in the grains sector contributed to returns in the first half of 2018. |
What didn’t work?
| • | | An overweight position in wheat detracted from returns for most of the period. The Fund’s positioning in industrial metals in the second quarter of 2018 also detracted from performance. |
Did the Fund use derivatives?
| • | | The Fund primarily trades in listed exchange-traded commodities futures contracts. These futures are a form of derivatives, based on the underlying price of a specific commodity. |
Current outlook
At the moment, the portfolio is positioned with an overweight in the energy sector (both the petroleum complex as well as natural gas), livestock, and precious metals sectors, against underweight positions in the industrial metals, grains, and soft commodities sectors. Within industrial metals, the Fund was overweight nickel and underweight aluminum and zinc.
| | | | |
| PGIM Day One Underlying Funds | | | 27 | |
PGIM QMA US Broad Market Index Fund
Strategy and Performance Overview
How did the Fund perform?
The PGIM QMA US Broad Market Index Fund’s Class R6 shares returned 16.05% for the 12-month reporting period that ended July 31, 2018. During the same period, the S&P 1500 Composite Index (the Index) gained 16.33%.
What were market conditions?
| • | | US equities delivered strong gains during the 12-month period ending July 31, 2018, with the Index returning 16.3%. |
| • | | During this period, growth stocks significantly outperformed value stocks across all capitalizations. Growth stocks benefited from strong results in the information technology sector. |
| • | | Conversely, the telecommunication services and utilities sectors both underperformed the broad stock market. |
| • | | Small-cap stocks outperformed their mid- and large-cap counterparts for this period. Small-cap stocks (as measured by the Russell 2000® Index) returned 18.7%, while mid-cap stocks (as measured by the Russell Midcap® Index) returned 14.48% and large-cap stocks (as measured by the S&P 500 Index) returned 16.2%. |
What worked?
| • | | The Fund closely tracked the performance of the Index over the 12-month reporting period that ended July 31, 2018. |
| • | | The Fund held all stocks included in the Index in approximately the same proportions. |
Did the Fund use derivatives and how did they affect performance?
| • | | The Fund held S&P 500 and S&P 400 E-Mini stock index futures, a form of derivatives, to maintain exposure to equities and provide portfolio liquidity. Futures had minimal impact on performance over the year. |
| | |
| 28 | | Visit our website at pgiminvestments.com |
PGIM QMA Mid-Cap Core Equity Fund
Strategy and Performance Overview
How did the Fund perform?
The PGIM QMA Mid-Cap Core Fund’s Class R6 Shares returned 11.36% for the 12-month reporting period that ended July 31, 2018. The Fund underperformed the 14.50% return of the S&P MidCap 400 Index (the Index).
What were market conditions?
| • | | US equities delivered strong gains for the one-year ending July 31, 2018, with the S&P Composite 1500 Index returning 16.3%. During this time period, growth stocks significantly outperformed value stocks, across all capitalizations. Growth stocks were benefited by strong results from the technology sector. Conversely, the telecom and utilities sectors both underperformed the broad stock market. Small-cap stocks outperformed their mid- and large-cap counterparts for the one-year period. Small cap stocks (as measured by the Russell 2000 Index) retuned 18.7%, while mid-cap stocks (as measured by the Russell Mid Cap Index) returned 13.5% and large cap stocks (as measured by the S&P 500 Index) returned 16.2%. |
What worked?
| • | | In the mid cap portfolio, Quality and Growth factors continued to lag in July, but Value factors bounced back after struggling for the past 18 months. Additionally, towards the end of 2017, we added new elements to our model. These modest enhancements have helped diversify our factors, and have mitigated the underperformance. |
| • | | QMA’s portfolio construction process uses a proprietary quantitative stock selection model to evaluate over 3000 stocks in the US market. The model evaluates stocks with regard to industry-adjusted valuation, earnings expectations, and quality metrics. The portfolio is comprised of positions in stocks deemed attractive by the model based on these metrics. QMA maintains diversified portfolios built from the bottom up, with limited deviations from the benchmark with respect to sector, industry, size, style, and position size. These risk controls ensure that unintended bets do not unwind the strength of the signals from QMA’s stock selection model. |
What did not work?
| • | | QMA’s Value, Growth, and Quality factors all struggled over the past year, resulting in below benchmark performance. In general, stocks that were more expensive relative to peers when using earnings, book, and sales-based multiples meaningfully outperformed attractively priced stocks. This was concentrated in the second quarter of 2018. |
| • | | Among cheap stocks, low quality stocks (which QMA avoids) outperformed stocks that were high quality (which QMA holds). Historically, the combination of quality and valuation is a powerful alpha driver, and QMA’s model prefers stocks that are both cheap and high quality. QMA has seen this pattern periodically in the past, but it tends to be short lived. |
| | | | |
| PGIM Day One Underlying Funds | | | 29 | |
PGIM QMA Mid-Cap Core Equity Fund
Strategy and Performance Overview (continued)
Current outlook:
| • | | Investors tend to overreact to headline news, which provides opportunities for a disciplined approach. The overreaction is evident in the widening of the e/p spread. The healthy spread between expensive and cheap stocks relative to earnings is currently in the 71st percentile compared to historical spreads. This indicates that valuation factors are underpriced, and highlights the potential for solid returns to value factors in the future. |
| | |
| 30 | | Visit our website at pgiminvestments.com |
Fees and Expenses (unaudited)
As a shareholder of a Fund, you incur two types of costs: (1) transaction costs, including sales charges (loads) on purchase payments and redemptions, as applicable, and (2) ongoing costs, including management fees, distribution, and/or service (12b-1) fees, and other Fund expenses, as applicable. This example is intended to help you understand your ongoing costs (in dollars) of investing in the Fund and to compare these costs with the ongoing costs of investing in other mutual funds.
The example is based on an investment of $1,000 held through the six-month period ended July 31, 2018. The example is for illustrative purposes only; you should consult the Prospectus for information on initial and subsequent minimum investment requirements.
Actual Expenses
The first line for each share class in the table on the following page provides information about actual account values and actual expenses. You may use the information on this line, together with the amount you invested, to estimate the expenses that you paid over the period. Simply divide your account value by $1,000 (for example, an $8,600 account value ÷ $1,000 = 8.6), then multiply the result by the number on the first line under the heading “Expenses Paid During the Six-Month Period” to estimate the expenses you paid on your account during this period.
Hypothetical Example for Comparison Purposes
The second line for each share class in the table on the following page provides information about hypothetical account values and hypothetical expenses based on the Fund’s actual expense ratio and an assumed rate of return of 5% per year before expenses, which is not the Fund’s actual return. The hypothetical account values and expenses may not be used to estimate the actual ending account balance or expenses you paid for the period. You may use this information to compare the ongoing costs of investing in the Fund and other funds. To do so, compare this 5% hypothetical example with the 5% hypothetical examples that appear in the shareholder reports of the other funds.
Please note that the expenses shown in the table are meant to highlight your ongoing costs only and do not reflect any transactional costs such as sales charges (loads). Therefore, the second line for each share class in the table is useful in comparing ongoing costs only and will not help you determine the relative total costs of owning different funds. In addition, if these transactional costs were included, your costs would have been higher.
| | | | | | | | | | | | | | | | | | |
PGIM Jennison
Small-Cap Core
Equity Fund | | Beginning Account
Value
February 1, 2018 | | | Ending Account
Value
July 31, 2018 | | | Annualized
Expense Ratio
Based on the
Six-Month Period | | | Expenses Paid
During the
Six-Month Period* | |
| Class R6** | | Actual | | $ | 1,000.00 | | | $ | 1,049.10 | | | | 0.95 | % | | $ | 4.83 | |
| | Hypothetical | | $ | 1,000.00 | | | $ | 1,020.08 | | | | 0.95 | % | | $ | 4.76 | |
| | | | |
| PGIM Day One Underlying Funds | | | 31 | |
Fees and Expenses (continued)
| | | | | | | | | | | | | | | | | | |
PGIM Core
Conservative Bond Fund | | Beginning Account
Value
February 1, 2018 | | | Ending Account
Value
July 31, 2018 | | | Annualized
Expense Ratio
Based on the
Six-Month Period | | | Expenses Paid
During the
Six-Month Period* | |
| Class R6** | | Actual | | $ | 1,000.00 | | | $ | 993.40 | | | | 0.50 | % | | $ | 2.47 | |
| | Hypothetical | | $ | 1,000.00 | | | $ | 1,022.32 | | | | 0.50 | % | | $ | 2.51 | |
| | | | | | | | | | | | | | | | | | |
PGIM
TIPS Fund | | Beginning Account
Value
February 1, 2018 | | | Ending Account
Value
July 31, 2018 | | | Annualized
Expense Ratio
Based on the
Six-Month Period | | | Expenses Paid
During the
Six-Month Period* | |
| Class R6** | | Actual | | $ | 1,000.00 | | | $ | 1,001.50 | | | | 0.40 | % | | $ | 1.99 | |
| | Hypothetical | | $ | 1,000.00 | | | $ | 1,022.81 | | | | 0.40 | % | | $ | 2.01 | |
| | | | | | | | | | | | | | | | | | |
PGIM QMA Commodity
Strategies Fund | | Beginning Account
Value
February 1, 2018 | | | Ending Account
Value
July 31, 2018 | | | Annualized
Expense Ratio
Based on the
Six-Month Period | | | Expenses Paid
During the
Six-Month Period* | |
| Class R6** | | Actual | | $ | 1,000.00 | | | $ | 956.40 | | | | 0.92 | % | | $ | 4.46 | |
| | Hypothetical | | $ | 1,000.00 | | | $ | 1,020.23 | | | | 0.92 | % | | $ | 4.61 | |
| | | | | | | | | | | | | | | | | | |
PGIM QMA
US Broad Market
Index Fund | | Beginning Account
Value
February 1, 2018 | | | Ending Account
Value
July 31, 2018 | | | Annualized
Expense Ratio
Based on the
Six-Month Period | | | Expenses Paid
During the
Six-Month Period* | |
| Class R6** | | Actual | | $ | 1,000.00 | | | $ | 1,009.30 | | | | 0.20 | % | | $ | 1.00 | |
| | Hypothetical | | $ | 1,000.00 | | | $ | 1,023.80 | | | | 0.20 | % | | $ | 1.00 | |
| | | | | | | | | | | | | | | | | | |
PGIM QMA
Mid-Cap Core Equity Fund | | Beginning Account
Value
February 1, 2018 | | | Ending Account
Value
July 31, 2018 | | | Annualized
Expense Ratio
Based on the
Six-Month Period | | | Expenses Paid
During the
Six-Month Period* | |
| Class R6** | | Actual | | $ | 1,000.00 | | | $ | 1,000.80 | | | | 0.85 | % | | $ | 4.22 | |
| | Hypothetical | | $ | 1,000.00 | | | $ | 1,020.58 | | | | 0.85 | % | | $ | 4.26 | |
*Fund expenses (net of fee waivers or subsidies, if any) are equal to the annualized expense ratio (provided in the table), multiplied by the average account value over the period, multiplied by the 181 days in the six-month period ended July 31, 2018, and divided by the 365 days in the Fund’s fiscal year ended July 31, 2018 (to reflect the six-month period). Expenses presented in the table include the expenses of any underlying portfolios in which the Fund may invest.
**Formerly known as Class Q shares.
| | |
| 32 | | Visit our website at pgiminvestments.com |
PGIM Jennison Small-Cap Core Equity Fund
Schedule of Investments
as of July 31, 2018
| | | | | | | | |
| Description | | Shares | | | Value | |
LONG-TERM INVESTMENTS 96.3% | | | | | | | | |
| | |
COMMON STOCKS | | | | | | | | |
| | |
Aerospace & Defense 1.2% | | | | | | | | |
KLX, Inc.* | | | 2,742 | | | $ | 200,303 | |
| | |
Airlines 0.5% | | | | | | | | |
Spirit Airlines, Inc.* | | | 1,999 | | | | 86,837 | |
| | |
Auto Components 0.1% | | | | | | | | |
Dorman Products, Inc.* | | | 193 | | | | 14,413 | |
| | |
Banks 13.5% | | | | | | | | |
Ameris Bancorp | | | 1,357 | | | | 63,236 | |
Bank OZK | | | 3,251 | | | | 132,966 | |
BankUnited, Inc. | | | 6,614 | | | | 257,020 | |
Brookline Bancorp, Inc. | | | 9,089 | | | | 165,420 | |
Byline Bancorp, Inc.* | | | 3,936 | | | | 88,717 | |
Eagle Bancorp, Inc.* | | | 3,026 | | | | 163,555 | |
East West Bancorp, Inc. | | | 4,982 | | | | 322,535 | |
First Bancorp/Southern Pines NC | | | 2,078 | | | | 86,071 | |
Heritage Financial Corp. | | | 501 | | | | 17,560 | |
Old Line Bancshares, Inc. | | | 957 | | | | 32,806 | |
Pinnacle Financial Partners, Inc. | | | 3,668 | | | | 229,250 | |
Renasant Corp. | | | 3,833 | | | | 171,258 | |
Seacoast Banking Corp. of Florida* | | | 4,259 | | | | 124,831 | |
Union Bankshares Corp. | | | 1,631 | | | | 66,072 | |
Wintrust Financial Corp. | | | 2,945 | | | | 258,365 | |
| | | | | | | | |
| | | | | | | 2,179,662 | |
| | |
Beverages 0.8% | | | | | | | | |
MGP Ingredients, Inc. | | | 1,584 | | | | 129,999 | |
| | |
Biotechnology 3.3% | | | | | | | | |
Amicus Therapeutics, Inc.* | | | 11,416 | | | | 166,103 | |
DBV Technologies SA (France), ADR* | | | 3,827 | | | | 69,001 | |
FibroGen, Inc.* | | | 938 | | | | 59,188 | |
La Jolla Pharmaceutical Co.* | | | 3,591 | | | | 118,754 | |
Natera, Inc.* | | | 2,036 | | | | 46,746 | |
Puma Biotechnology, Inc.* | | | 1,653 | | | | 79,592 | |
| | | | | | | | |
| | | | | | | 539,384 | |
See Notes to Financial Statements.
| | | | |
| PGIM Day One Underlying Funds | | | 33 | |
PGIM Jennison Small-Cap Core Equity Fund
Schedule of Investments (continued)
as of July 31, 2018
| | | | | | | | |
| Description | | Shares | | | Value | |
COMMON STOCKS (Continued) | | | | | | | | |
| | |
Building Products 1.4% | | | | | | | | |
JELD-WEN Holding, Inc.* | | | 3,000 | | | $ | 82,320 | |
PGT Innovations, Inc.* | | | 6,236 | | | | 149,664 | |
| | | | | | | | |
| | | | | | | 231,984 | |
| | |
Capital Markets 2.0% | | | | | | | | |
BrightSphere Investment Group PLC | | | 11,224 | | | | 159,942 | |
Focus Financial Partners, Inc. (Class A Stock)* | | | 1,201 | | | | 48,929 | |
Moelis & Co. (Class A Stock) | | | 1,809 | | | | 115,052 | |
| | | | | | | | |
| | | | | | | 323,923 | |
| | |
Chemicals 2.7% | | | | | | | | |
Ferro Corp.* | | | 8,718 | | | | 196,329 | |
PolyOne Corp. | | | 3,541 | | | | 158,814 | |
Venator Materials PLC* | | | 5,817 | | | | 85,045 | |
| | | | | | | | |
| | | | | | | 440,188 | |
| | |
Commercial Services & Supplies 3.0% | | | | | | | | |
Advanced Disposal Services, Inc.* | | | 4,818 | | | | 118,523 | |
BrightView Holdings, Inc.* | | | 2,199 | | | | 49,324 | |
Healthcare Services Group, Inc. | | | 2,536 | | | | 102,099 | |
Mobile Mini, Inc. | | | 5,065 | | | | 216,022 | |
| | | | | | | | |
| | | | | | | 485,968 | |
| | |
Construction & Engineering 0.3% | | | | | | | | |
Great Lakes Dredge & Dock Corp.* | | | 10,287 | | | | 55,550 | |
| | |
Construction Materials 1.9% | | | | | | | | |
Summit Materials, Inc. (Class A Stock)* | | | 12,369 | | | | 310,462 | |
| | |
Diversified Telecommunication Services 1.0% | | | | | | | | |
Cogent Communications Holdings, Inc. | | | 3,210 | | | | 166,759 | |
| | |
Electric Utilities 1.2% | | | | | | | | |
El Paso Electric Co. | | | 3,036 | | | | 189,143 | |
| | |
Electronic Equipment, Instruments & Components 0.7% | | | | | | | | |
Anixter International, Inc.* | | | 1,261 | | | | 91,927 | |
Littelfuse, Inc. | | | 139 | | | | 30,138 | |
| | | | | | | | |
| | | | | | | 122,065 | |
See Notes to Financial Statements.
| | | | | | | | |
| Description | | Shares | | | Value | |
COMMON STOCKS (Continued) | | | | | | | | |
|
Energy Equipment & Services 0.4% | |
Cactus, Inc. (Class A Stock)* | | | 1,824 | | | $ | 59,681 | |
| | |
Equity Real Estate Investment Trusts (REITs) 7.6% | | | | | | | | |
Colony Capital, Inc. | | | 10,260 | | | | 63,202 | |
Columbia Property Trust, Inc., REIT | | | 6,332 | | | | 146,776 | |
Cousins Properties, Inc. | | | 12,486 | | | | 116,370 | |
Gaming and Leisure Properties, Inc. | | | 2,614 | | | | 94,940 | |
Hersha Hospitality Trust | | | 7,139 | | | | 154,131 | |
Independence Realty Trust, Inc. | | | 8,249 | | | | 83,727 | |
National Storage Affiliates Trust | | | 3,884 | | | | 111,976 | |
Pebblebrook Hotel Trust | | | 3,368 | | | | 129,836 | |
QTS Realty Trust, Inc. (Class A Stock) | | | 2,167 | | | | 92,639 | |
Retail Opportunity Investments Corp. | | | 7,669 | | | | 145,021 | |
Summit Hotel Properties, Inc. | | | 5,836 | | | | 82,579 | |
| | | | | | | | |
| | | | | | | 1,221,197 | |
| | |
Food & Staples Retailing 2.0% | | | | | | | | |
Performance Food Group Co.* | | | 5,416 | | | | 194,163 | |
Sprouts Farmers Market, Inc.* | | | 6,140 | | | | 131,949 | |
| | | | | | | | |
| | | | | | | 326,112 | |
| | |
Food Products 2.3% | | | | | | | | |
Adecoagro SA (Argentina)* | | | 12,864 | | | | 108,058 | |
B&G Foods, Inc.(a) | | | 3,423 | | | | 107,482 | |
Darling Ingredients, Inc.* | | | 7,993 | | | | 160,579 | |
| | | | | | | | |
| | | | | | | 376,119 | |
| | |
Health Care Equipment & Supplies 3.1% | | | | | | | | |
Glaukos Corp.* | | | 2,386 | | | | 99,282 | |
Inogen, Inc.* | | | 457 | | | | 91,057 | |
Integra LifeSciences Holdings Corp.* | | | 2,276 | | | | 141,863 | |
Nevro Corp.* | | | 1,701 | | | | 95,698 | |
NuVasive, Inc.* | | | 1,191 | | | | 69,138 | |
| | | | | | | | |
| | | | | | | 497,038 | |
| | |
Health Care Providers & Services 2.1% | | | | | | | | |
Acadia Healthcare Co., Inc.*(a) | | | 1,814 | | | | 71,617 | |
HealthEquity, Inc.* | | | 629 | | | | 47,490 | |
See Notes to Financial Statements.
| | | | |
| PGIM Day One Underlying Funds | | | 35 | |
PGIM Jennison Small-Cap Core Equity Fund
Schedule of Investments (continued)
as of July 31, 2018
| | | | | | | | |
| Description | | Shares | | | Value | |
COMMON STOCKS (Continued) | | | | | | | | |
|
Health Care Providers & Services (cont’d.) | |
Premier, Inc. (Class A Stock)* | | | 2,491 | | | $ | 93,163 | |
Tivity Health, Inc.* | | | 3,667 | | | | 123,578 | |
| | | | | | | | |
| | | | | | | 335,848 | |
| | |
Health Care Technology 1.0% | | | | | | | | |
Tabula Rasa HealthCare, Inc.* | | | 843 | | | | 49,097 | |
Teladoc, Inc.* | | | 1,912 | | | | 114,433 | |
| | | | | | | | |
| | | | | | | 163,530 | |
| | |
Hotels, Restaurants & Leisure 4.2% | | | | | | | | |
Pinnacle Entertainment, Inc.* | | | 4,941 | | | | 164,239 | |
Planet Fitness, Inc. (Class A Stock)* | | | 6,125 | | | | 291,060 | |
Texas Roadhouse, Inc. | | | 1,487 | | | | 93,443 | |
Vail Resorts, Inc. | | | 176 | | | | 48,729 | |
Wingstop, Inc. | | | 1,578 | | | | 77,874 | |
| | | | | | | | |
| | | | | | | 675,345 | |
| | |
Insurance 0.7% | | | | | | | | |
Goosehead Insurance, Inc. (Class A Stock)* | | | 4,041 | | | | 109,794 | |
| | |
Internet Software & Services 3.7% | | | | | | | | |
Box, Inc. (Class A Stock)* | | | 2,746 | | | | 65,794 | |
Cardlytics, Inc.* | | | 1,756 | | | | 33,048 | |
MINDBODY, Inc. (Class A Stock)* | | | 3,236 | | | | 120,865 | |
New Relic, Inc.* | | | 1,325 | | | | 129,452 | |
Q2 Holdings, Inc.* | | | 1,979 | | | | 117,058 | |
Stamps.com, Inc.* | | | 199 | | | | 51,939 | |
Trade Desk, Inc. (The) (Class A Stock)* | | | 868 | | | | 73,190 | |
| | | | | | | | |
| | | | | | | 591,346 | |
| | |
IT Services 1.7% | | | | | | | | |
Evo Payments, Inc. (Class A Stock)* | | | 4,181 | | | | 88,428 | |
InterXion Holding NV (Netherlands)* | | | 2,929 | | | | 190,034 | |
| | | | | | | | |
| | | | | | | 278,462 | |
| | |
Life Sciences Tools & Services 0.4% | | | | | | | | |
Syneos Health, Inc.* | | | 1,318 | | | | 64,944 | |
See Notes to Financial Statements.
| | | | | | | | |
| Description | | Shares | | | Value | |
COMMON STOCKS (Continued) | | | | | | | | |
| | |
Machinery 6.1% | | | | | | | | |
Actuant Corp. (Class A Stock) | | | 3,840 | | | $ | 109,632 | |
Evoqua Water Technologies Corp.* | | | 6,311 | | | | 134,677 | |
Gardner Denver Holdings, Inc.* | | | 4,392 | | | | 125,655 | |
Milacron Holdings Corp.* | | | 5,872 | | | | 122,431 | |
NN, Inc. | | | 4,973 | | | | 106,920 | |
REV Group, Inc. | | | 2,513 | | | | 43,148 | |
Rexnord Corp.* | | | 7,666 | | | | 231,820 | |
Terex Corp. | | | 2,485 | | | | 109,638 | |
Welbilt, Inc.* | | | 100 | | | | 2,280 | |
| | | | | | | | |
| | | | | | | 986,201 | |
| | |
Media 0.4% | | | | | | | | |
IMAX Corp.* | | | 3,332 | | | | 73,637 | |
| | |
Mortgage Real Estate Investment Trusts (REITs) 0.9% | | | | | | | | |
MFA Financial, Inc. | | | 17,253 | | | | 138,887 | |
| | |
Oil, Gas & Consumable Fuels 2.9% | | | | | | | | |
SemGroup Corp. (Class A Stock) | | | 2,566 | | | | 64,535 | |
Tallgrass Energy LP(a) | | | 3,148 | | | | 73,443 | |
WPX Energy, Inc.* | | | 17,389 | | | | 326,391 | |
| | | | | | | | |
| | | | | | | 464,369 | |
| | |
Pharmaceuticals 1.9% | | | | | | | | |
GW Pharmaceuticals PLC (United Kingdom), ADR* | | | 511 | | | | 69,021 | |
Intersect ENT, Inc.* | | | 2,851 | | | | 92,230 | |
Prestige Brands Holdings, Inc.* | | | 2,572 | | | | 91,897 | |
Revance Therapeutics, Inc.* | | | 1,820 | | | | 52,325 | |
| | | | | | | | |
| | | | | | | 305,473 | |
| | |
Professional Services 1.7% | | | | | | | | |
Huron Consulting Group, Inc.* | | | 1,839 | | | | 80,272 | |
Korn/Ferry International | | | 3,067 | | | | 202,361 | |
| | | | | | | | |
| | | | | | | 282,633 | |
| | |
Road & Rail 1.1% | | | | | | | | |
Saia, Inc.* | | | 2,422 | | | | 182,498 | |
See Notes to Financial Statements.
| | | | |
| PGIM Day One Underlying Funds | | | 37 | |
PGIM Jennison Small-Cap Core Equity Fund
Schedule of Investments (continued)
as of July 31, 2018
| | | | | | | | |
| Description | | Shares | | | Value | |
COMMON STOCKS (Continued) | | | | | | | | |
|
Semiconductors & Semiconductor Equipment 2.4% | |
Brooks Automation, Inc. | | | 3,414 | | | $ | 104,400 | |
Marvell Technology Group Ltd. | | | 3,097 | | | | 65,997 | |
MaxLinear, Inc.* | | | 7,527 | | | | 130,292 | |
Monolithic Power Systems, Inc. | | | 626 | | | | 83,058 | |
| | | | | | | | |
| | | | | | | 383,747 | |
| | |
Software 7.8% | | | | | | | | |
Carbon Black, Inc.* | | | 3,929 | | | | 81,566 | |
CyberArk Software Ltd. (Israel)* | | | 2,610 | | | | 158,453 | |
Everbridge, Inc.* | | | 1,049 | | | | 47,184 | |
HubSpot, Inc.* | | | 1,909 | | | | 236,907 | |
Paycom Software, Inc.* | | | 1,618 | | | | 171,913 | |
Proofpoint, Inc.* | | | 1,603 | | | | 182,822 | |
Tenable Holdings, Inc.* | | | 202 | | | | 6,040 | |
Varonis Systems, Inc.* | | | 3,652 | | | | 218,298 | |
Zendesk, Inc.* | | | 2,813 | | | | 153,224 | |
| | | | | | | | |
| | | | | | | 1,256,407 | |
| | |
Specialty Retail 3.7% | | | | | | | | |
Five Below, Inc.* | | | 2,879 | | | | 279,724 | |
Hudson Ltd. (Class A Stock)* | | | 5,935 | | | | 100,301 | |
Monro, Inc. | | | 1,402 | | | | 94,565 | |
Party City Holdco, Inc.* | | | 7,427 | | | | 116,975 | |
| | | | | | | | |
| | | | | | | 591,565 | |
| | |
Textiles, Apparel & Luxury Goods 1.5% | | | | | | | | |
G-III Apparel Group Ltd.* | | | 1,845 | | | | 84,317 | |
Steven Madden Ltd. | | | 2,887 | | | | 156,042 | |
| | | | | | | | |
| | | | | | | 240,359 | |
| | |
Thrifts & Mortgage Finance 0.4% | | | | | | | | |
Luther Burbank Corp. | | | 2,393 | | | | 26,036 | |
WSFS Financial Corp. | | | 564 | | | | 31,979 | |
| | | | | | | | |
| | | | | | | 58,015 | |
See Notes to Financial Statements.
| | | | | | | | |
| Description | | Shares | | | Value | |
COMMON STOCKS (Continued) | | | | | | | | |
| | |
Trading Companies & Distributors 2.7% | | | | | | | | |
Beacon Roofing Supply, Inc.* | | | 5,223 | | | $ | 219,784 | |
Univar, Inc.* | | | 7,645 | | | | 210,161 | |
| | | | | | | | |
| | | | | | | 429,945 | |
| | | | | | | | |
TOTAL LONG-TERM INVESTMENTS
(cost $12,777,639) | | | | | | | 15,569,792 | |
| | | | | | | | |
| | |
SHORT-TERM INVESTMENTS 4.7% | | | | | | | | |
| | |
AFFILIATED MUTUAL FUNDS | | | | | | | | |
PGIM Core Ultra Short Bond Fund(w) | | | 575,177 | | | | 575,177 | |
PGIM Institutional Money Market Fund
(cost $179,173; includes $178,546 of cash collateral for securities on loan)(b)(w) | | | 179,174 | | | | 179,192 | |
| | | | | | | | |
TOTAL SHORT-TERM INVESTMENTS
(cost $754,350) | | | | | | | 754,369 | |
| | | | | | | | |
TOTAL INVESTMENTS 101.0%
(cost $13,531,989) | | | | | | | 16,324,161 | |
Liabilities in excess of other assets (1.0)% | | | | | | | (165,823 | ) |
| | | | | | | | |
NET ASSETS 100.0% | | | | | | $ | 16,158,338 | |
| | | | | | | | |
See the Glossary for abbreviations used in the annual report.
| * | Non-income producing security. |
| (a) | All or a portion of security is on loan. The aggregate market value of such securities, including those sold and pending settlement, is $169,223; cash collateral of $178,546 (including in liabilities) was received with which the Fund purchased highly liquid short-term investments. |
| (b) | Represents security purchased with cash collateral received for securities on loan and includes dividend reinvestment. |
| (w) | PGIM Investments LLC, the manager of the Fund, also serves as manager of the PGIM Core Ultra Short Bond Fund and PGIM Institutional Money Market Fund. |
Fair Value Measurements:
Various inputs are used in determining the value of the Fund’s investments. These inputs are summarized in the three broad levels listed below.
Level 1—unadjusted quoted prices generally in active markets for identical securities.
Level 2—quoted prices for similar securities, interest rates and yield curves, prepayment speeds, foreign currency exchange rates and other observable inputs.
Level 3—unobservable inputs for securities valued in accordance with Board approved fair valuation procedures.
See Notes to Financial Statements.
| | | | |
| PGIM Day One Underlying Funds | | | 39 | |
PGIM Jennison Small-Cap Core Equity Fund
Schedule of Investments (continued)
as of July 31, 2018
The following is a summary of the inputs used as of July 31, 2018 in valuing such portfolio securities:
| | | | | | | | | | | | |
| | | Level 1 | | | Level 2 | | | Level 3 | |
Investments in Securities | | | | | | | | | | | | |
Common Stocks | | | | | | | | | | | | |
Aerospace & Defense | | $ | 200,303 | | | $ | — | | | $ | — | |
Airlines | | | 86,837 | | | | — | | | | — | |
Auto Components | | | 14,413 | | | | — | | | | — | |
Banks | | | 2,179,662 | | | | — | | | | — | |
Beverages | | | 129,999 | | | | — | | | | — | |
Biotechnology | | | 539,384 | | | | — | | | | — | |
Building Products | | | 231,984 | | | | — | | | | — | |
Capital Markets | | | 323,923 | | | | — | | | | — | |
Chemicals | | | 440,188 | | | | — | | | | — | |
Commercial Services & Supplies | | | 485,968 | | | | — | | | | — | |
Construction & Engineering | | | 55,550 | | | | — | | | | — | |
Construction Materials | | | 310,462 | | | | — | | | | — | |
Diversified Telecommunication Services | | | 166,759 | | | | — | | | | — | |
Electric Utilities | | | 189,143 | | | | — | | | | — | |
Electronic Equipment, Instruments & Components | | | 122,065 | | | | — | | | | — | |
Energy Equipment & Services | | | 59,681 | | | | — | | | | — | |
Equity Real Estate Investment Trusts (REITs) | | | 1,221,197 | | | | — | | | | — | |
Food & Staples Retailing | | | 326,112 | | | | — | | | | — | |
Food Products | | | 376,119 | | | | — | | | | — | |
Health Care Equipment & Supplies | | | 497,038 | | | | — | | | | — | |
Health Care Providers & Services | | | 335,848 | | | | — | | | | — | |
Health Care Technology | | | 163,530 | | | | — | | | | — | |
Hotels, Restaurants & Leisure | | | 675,345 | | | | — | | | | — | |
Insurance | | | 109,794 | | | | — | | | | — | |
Internet Software & Services | | | 591,346 | | | | — | | | | — | |
IT Services | | | 278,462 | | | | — | | | | — | |
Life Sciences Tools & Services | | | 64,944 | | | | — | | | | — | |
Machinery | | | 986,201 | | | | — | | | | — | |
Media | | | 73,637 | | | | — | | | | — | |
Mortgage Real Estate Investment Trusts (REITs) | | | 138,887 | | | | — | | | | — | |
Oil, Gas & Consumable Fuels | | | 464,369 | | | | — | | | | — | |
Pharmaceuticals | | | 305,473 | | | | — | | | | — | |
Professional Services | | | 282,633 | | | | — | | | | — | |
Road & Rail | | | 182,498 | | | | — | | | | — | |
Semiconductors & Semiconductor Equipment | | | 383,747 | | | | — | | | | — | |
Software | | | 1,256,407 | | | | — | | | | — | |
Specialty Retail | | | 591,565 | | | | — | | | | — | |
Textiles, Apparel & Luxury Goods | | | 240,359 | | | | — | | | | — | |
Thrifts & Mortgage Finance | | | 58,015 | | | | — | | | | — | |
Trading Companies & Distributors | | | 429,945 | | | | — | | | | — | |
Affiliated Mutual Funds | | | 754,369 | | | | — | | | | — | |
| | | | | | | | | | | | |
Total | | $ | 16,324,161 | | | $ | — | | | $ | — | |
| | | | | | | | | | | | |
During the period, there were no transfers between Level 1, Level 2 and Level 3 to report.
See Notes to Financial Statements.
Industry Classification:
The industry classification of investments and liabilities in excess of other assets shown as a percentage of net assets as of July 31, 2018 were as follows (unaudited):
| | | | |
Banks | | | 13.5 | % |
Software | | | 7.8 | |
Equity Real Estate Investment Trusts (REITs) | | | 7.6 | |
Machinery | | | 6.1 | |
Affiliated Mutual Funds (1.1% represents investments purchased with collateral from securities on loan) | | | 4.7 | |
Hotels, Restaurants & Leisure | | | 4.2 | |
Specialty Retail | | | 3.7 | |
Internet Software & Services | | | 3.7 | |
Biotechnology | | | 3.3 | |
Health Care Equipment & Supplies | | | 3.1 | |
Commercial Services & Supplies | | | 3.0 | |
Oil, Gas & Consumable Fuels | | | 2.9 | |
Chemicals | | | 2.7 | |
Trading Companies & Distributors | | | 2.7 | |
Semiconductors & Semiconductor Equipment | | | 2.4 | |
Food Products | | | 2.3 | |
Health Care Providers & Services | | | 2.1 | |
Food & Staples Retailing | | | 2.0 | |
Capital Markets | | | 2.0 | |
Construction Materials | | | 1.9 | |
Pharmaceuticals | | | 1.9 | |
Professional Services | | | 1.7 | |
IT Services | | | 1.7 | |
Textiles, Apparel & Luxury Goods | | | 1.5 | % |
Building Products | | | 1.4 | |
Aerospace & Defense | | | 1.2 | |
Electric Utilities | | | 1.2 | |
Road & Rail | | | 1.1 | |
Diversified Telecommunication Services | | | 1.0 | |
Health Care Technology | | | 1.0 | |
Mortgage Real Estate Investment Trusts (REITs) | | | 0.9 | |
Beverages | | | 0.8 | |
Electronic Equipment, Instruments & Components | | | 0.7 | |
Insurance | | | 0.7 | |
Airlines | | | 0.5 | |
Media | | | 0.4 | |
Life Sciences Tools & Services | | | 0.4 | |
Energy Equipment & Services | | | 0.4 | |
Thrifts & Mortgage Finance | | | 0.4 | |
Construction & Engineering | | | 0.3 | |
Auto Components | | | 0.1 | |
| | | | |
| | | 101.0 | |
Liabilities in excess of other assets | | | (1.0 | ) |
| | | | |
| | | 100.0 | % |
| | | | |
Financial Instruments/Transactions—Summary of Offsetting and Netting Arrangements:
The Fund entered into financial instruments/transactions during the reporting period that are either offset in accordance with current requirements or are subject to enforceable master netting arrangements or similar agreements that permit offsetting. The information about offsetting and related netting arrangements for financial instruments/transactions, where the legal right to set-off exists, is presented in the summary below.
Offsetting of financial instrument/transaction assets and liabilities:
| | | | | | | | | | | | |
Description | | Gross
Market
Value of
Recognized
Assets/
(Liabilities) | | | Collateral
Pledged/
(Received)(1) | | | Net Amount | |
Securities on Loan | | $ | 169,223 | | | $ | (169,223 | ) | | $ | — | |
| | | | | | | | | | | | |
See Notes to Financial Statements.
| | | | |
| PGIM Day One Underlying Funds | | | 41 | |
PGIM Jennison Small-Cap Core Equity Fund
Schedule of Investments (continued)
as of July 31, 2018
| (1) | Collateral amount disclosed by the Fund is limited to the market value of financial instruments/transactions. |
See Notes to Financial Statements.
PGIM Jennison Small-Cap Core Equity Fund
Statement of Assets & Liabilities
as of July 31, 2018
| | | | |
Assets | | | | |
Investments at value, including securities on loan of $169,223: | | | | |
Unaffiliated investments (cost $12,777,639) | | $ | 15,569,792 | |
Affiliated investments (cost $754,350) | | | 754,369 | |
Receivable for investments sold | | | 78,722 | |
Receivable for Fund shares sold | | | 68,366 | |
Dividends and interest receivable | | | 3,386 | |
| | | | |
Total Assets | | | 16,474,635 | |
| | | | |
| |
Liabilities | | | | |
Payable to broker for collateral for securities on loan | | | 178,546 | |
Payable for investments purchased | | | 89,645 | |
Audit fee payable | | | 24,240 | |
Custodian and accounting fee payable | | | 11,616 | |
Accrued expenses and other liabilities | | | 7,089 | |
Shareholders’ reports payable | | | 3,603 | |
Management fee payable | | | 999 | |
Payable for Fund shares reacquired | | | 505 | |
Affiliated transfer agent fee payable | | | 54 | |
| | | | |
Total Liabilities | | | 316,297 | |
| | | | |
| |
Net Assets | | $ | 16,158,338 | |
| | | | |
| | | | | |
Net assets were comprised of: | | | | |
Shares of beneficial interest, at par | | $ | 1,239 | |
Paid-in capital in excess of par | | | 12,765,002 | |
| | | | |
| | | 12,766,241 | |
Distributions in excess of net investment income | | | (734 | ) |
Accumulated net realized gain on investment transactions | | | 600,659 | |
Net unrealized appreciation on investments | | | 2,792,172 | |
| | | | |
Net assets, July 31, 2018 | | $ | 16,158,338 | |
| | | | |
| |
Class R6 | | | | |
Net asset value, offering price and redemption price per share,
($16,158,338 ÷ 1,238,866 shares of beneficial interest issued and outstanding) | | $ | 13.04 | |
| | | | |
See Notes to Financial Statements.
| | | | |
| PGIM Day One Underlying Funds | | | 43 | |
PGIM Jennison Small-Cap Core Equity Fund
Statement of Operations
Year Ended July 31, 2018
| | | | |
Net Investment Income (Loss) | | | | |
Income | | | | |
Unaffiliated dividend income | | $ | 124,894 | |
Affiliated dividend income | | | 8,594 | |
Income from securities lending, net (including affiliated income of $308) | | | 3,376 | |
| | | | |
Total income | | | 136,864 | |
| | | | |
| |
Expenses | | | | |
Management fee | | | 107,774 | |
Custodian and accounting fees | | | 49,340 | |
Audit fee | | | 24,240 | |
Legal fees and expenses | | | 20,937 | |
Shareholders’ reports | | | 14,349 | |
Trustees’ fees | | | 12,187 | |
Commitment fee on syndicated credit agreement | | | 1,824 | |
Transfer agent’s fees and expenses (including affiliated expense of $332) | | | 430 | |
Registration fees | | | 63 | |
Miscellaneous | | | 10,579 | |
| | | | |
Total expenses | | | 241,723 | |
Less: Fee waiver and/or expense reimbursement | | | (105,209 | ) |
| | | | |
Net expenses | | | 136,514 | |
| | | | |
Net investment income (loss) | | | 350 | |
| | | | |
| |
Realized And Unrealized Gain (Loss) On Investments | | | | |
Net realized gain (loss) on investment transactions (including affiliated of $(14)) | | | 605,939 | |
Net change in unrealized appreciation (depreciation) on investments (including affiliated of $19) | | | 1,735,364 | |
| | | | |
Net gain (loss) on investment transactions | | | 2,341,303 | |
| | | | |
Net Increase (Decrease) In Net Assets Resulting From Operations | | $ | 2,341,653 | |
| | | | |
See Notes to Financial Statements.
PGIM Jennison Small-Cap Core Equity Fund
Statements of Changes in Net Assets
| | | | | | | | |
| | | Year
Ended
July 31, 2018 | | | November 15, 2016*
through
July 31, 2017 | |
Increase (Decrease) in Net Assets | | | | | | | | |
Operations | | | | | | | | |
Net investment income (loss) | | $ | 350 | | | $ | 17,135 | |
Net realized gain (loss) on investment transactions | | | 605,939 | | | | 231,377 | |
Net change in unrealized appreciation (depreciation) on investments | | | 1,735,364 | | | | 1,056,808 | |
| | | | | | | | |
Net increase (decrease) in net assets resulting from operations | | | 2,341,653 | | | | 1,305,320 | |
| | | | | | | | |
| | |
Dividends and Distributions | | | | | | | | |
Dividends from net investment income | | | | | | | | |
Class R6 | | | (2,113 | ) | | | (16,947 | ) |
| | | | | | | | |
Distributions from net realized gains | | | | | | | | |
Class R6 | | | (235,816 | ) | | | — | |
| | | | | | | | |
| | |
Fund share transactions | | | | | | | | |
Net proceeds from shares sold | | | 2,127,195 | | | | 11,329,854 | |
Net asset value of shares issued in reinvestment of dividends and distributions | | | 237,929 | | | | 16,947 | |
Cost of shares reacquired | | | (894,149 | ) | | | (51,535 | ) |
| | | | | | | | |
Net increase (decrease) in net assets from Fund share transactions | | | 1,470,975 | | | | 11,295,266 | |
| | | | | | | | |
Total increase (decrease) | | | 3,574,699 | | | | 12,583,639 | |
| | |
Net Assets: | | | | | | | | |
Beginning of period | | | 12,583,639 | | | | — | |
| | | | | | | | |
End of period(a) | | $ | 16,158,338 | | | $ | 12,583,639 | |
| | | | | | | | |
(a) Includes undistributed/(distributions in excess of) net investment income of: | | $ | (734 | ) | | $ | 188 | |
| | | | | | | | |
| * | Commencement of operations. |
See Notes to Financial Statements.
| | | | |
| PGIM Day One Underlying Funds | | | 45 | |
PGIM Core Conservative Bond Fund
Schedule of Investments
as of July 31, 2018
| | | | | | | | | | | | | | | | |
| Description | | Interest
Rate | | | Maturity
Date | | | Principal
Amount (000)# | | | Value | |
LONG-TERM INVESTMENTS 99.1% | | | | | | | | | | | | | | | | |
| | | | |
ASSET-BACKED SECURITY 0.3% | | | | | | | | | | | | | | | | |
| | | | |
Credit Card | | | | | | | | | | | | | | | | |
Citibank Credit Card Issuance Trust, Series 2018-A03, Class A3 (cost $99,996) | | | 3.290 | % | | | 05/23/25 | | | | 100 | | | $ | 100,278 | |
| | | | |
COMMERCIAL MORTGAGE-BACKED SECURITIES 4.3% | | | | | | | | | | | | | | | | |
Benchmark Mortgage Trust, Series 2018-B3, Class A3 | | | 3.746 | | | | 04/10/51 | | | | 30 | | | | 30,015 | |
CCUBS Commercial Mortgage Trust, Series 2017-C1, Class A3 | | | 3.283 | | | | 11/15/50 | | | | 90 | | | | 86,072 | |
CD Mortgage Trust, Series 2017-CD6, Class A3 | | | 3.104 | | | | 11/13/50 | | | | 40 | | | | 38,749 | |
Citigroup Commercial Mortgage Trust,
Series 2016-P6, Class A4 | | | 3.458 | | | | 12/10/49 | | | | 125 | | | | 122,680 | |
Series 2017-P08, Class A3 | | | 3.203 | | | | 09/15/50 | | | | 75 | | | | 71,653 | |
Commercial Mortgage Trust,
Series 2015-CR26, Class A4 | | | 3.630 | | | | 10/10/48 | | | | 55 | | | | 54,688 | |
Series 2016-DC02, Class A5 | | | 3.765 | | | | 02/10/49 | | | | 25 | | | | 25,031 | |
Fannie Mae-Aces,
Series 2015-M07, Class AB2 | | | 2.502 | | | | 12/25/24 | | | | 49 | | | | 46,837 | |
Series 2016-M11, Class A2 | | | 2.369 | (cc) | | | 07/25/26 | | | | 75 | | | | 69,164 | |
Series 2017-M01, Class A2 | | | 2.417 | (cc) | | | 10/25/26 | | | | 40 | | | | 36,938 | |
FHLMC Multifamily Structured Pass-Through Certificates,
Series K070, Class A2 | | | 3.303 | (cc) | | | 11/25/27 | | | | 50 | | | | 49,241 | |
Series K070, Class AM | | | 3.364 | (cc) | | | 12/25/27 | | | | 25 | | | | 24,559 | |
Series K076, Class A2 | | | 3.900 | | | | 04/25/28 | | | | 90 | | | | 92,610 | |
Series K076, Class AM | | | 3.900 | | | | 04/25/28 | | | | 50 | | | | 51,088 | |
Series K077, Class A2 | | | 3.850 | (cc) | | | 05/25/28 | | | | 60 | | | | 61,455 | |
Series K077, Class AM | | | 3.850 | (cc) | | | 05/25/28 | | | | 10 | | | | 10,153 | |
JPMorgan Chase Commercial Mortgage Securities Trust, Series 2016-JP4, Class A3 | | | 3.393 | | | | 12/15/49 | | | | 125 | | | | 121,782 | |
Morgan Stanley Bank of America Merrill Lynch Trust,
Series 2015-C21, Class A3 | | | 3.077 | | | | 03/15/48 | | | | 70 | | | | 67,635 | |
Series 2016-C32, Class A3 | | | 3.459 | | | | 12/15/49 | | | | 125 | | | | 122,608 | |
Morgan Stanley Capital I Trust, Series 2016-UB12, Class A3 | | | 3.337 | | | | 12/15/49 | | | | 125 | | | | 121,219 | |
UBS Commercial Mortgage Trust,
Series 2018-C09, Class ASB | | | 4.090 | | | | 03/15/51 | | | | 60 | | | | 61,178 | |
Series 2018-C11, Class A3 | | | 4.312 | | | | 06/15/51 | | | | 75 | | | | 76,921 | |
Wells Fargo Commercial Mortgage Trust,
Series 2016-LC25, Class A3 | | | 3.374 | | | | 12/15/59 | | | | 125 | | | | 121,550 | |
See Notes to Financial Statements.
| | | | | | | | | | | | | | | | |
| Description | | Interest Rate | | | Maturity
Date | | | Principal
Amount (000)# | | | Value | |
COMMERCIAL MORTGAGE-BACKED SECURITIES (Continued) | | | | | | | | | | | | | | | | |
Wells Fargo Commercial Mortgage Trust, (cont’d.) | | | | | | | | | | | | | | | | |
Series 2017-C39, Class A3 | | | 2.878 | % | | | 09/15/50 | | | | 100 | | | $ | 95,748 | |
| | | | | | | | | | | | | | | | |
TOTAL COMMERCIAL MORTGAGE-BACKED SECURITIES
(cost $1,706,581) | | | | 1,659,574 | |
| | | | | | | | | | | | | | | | |
| | | | |
CORPORATE BONDS 25.4% | | | | | | | | | | | | | | | | |
|
Aerospace & Defense 0.6% | |
General Dynamics Corp., Gtd. Notes | | | 3.500 | | | | 05/15/25 | | | | 70 | | | | 70,208 | |
Lockheed Martin Corp.,
Sr. Unsec’d. Notes | | | 2.900 | | | | 03/01/25 | | | | 55 | | | | 52,469 | |
Sr. Unsec’d. Notes | | | 3.800 | | | | 03/01/45 | | | | 15 | | | | 14,157 | |
Northrop Grumman Corp., Sr. Unsec’d. Notes | | | 4.750 | | | | 06/01/43 | | | | 25 | | | | 26,181 | |
Rockwell Collins, Inc.,
Sr. Unsec’d. Notes | | | 3.500 | | | | 03/15/27 | | | | 20 | | | | 19,198 | |
Sr. Unsec’d. Notes | | | 4.350 | | | | 04/15/47 | | | | 10 | | | | 9,821 | |
United Technologies Corp., Sr. Unsec’d. Notes | | | 2.800 | | | | 05/04/24 | | | | 45 | | | | 42,683 | |
| | | | | | | | | | | | | | | | |
| | | | | | | | | | | | | | | 234,717 | |
| | | | |
Agriculture 0.5% | | | | | | | | | | | | | | | | |
Altria Group, Inc., Gtd. Notes | | | 2.850 | | | | 08/09/22 | | | | 65 | | | | 63,499 | |
BAT Capital Corp. (United Kingdom),
Gtd. Notes, 144A | | | 3.222 | | | | 08/15/24 | | | | 55 | | | | 52,531 | |
Gtd. Notes, 144A | | | 3.557 | | | | 08/15/27 | | | | 20 | | | | 18,914 | |
Philip Morris International, Inc.,
Sr. Unsec’d. Notes | | | 2.625 | | | | 03/06/23 | | | | 50 | | | | 47,987 | |
Sr. Unsec’d. Notes | | | 4.125 | | | | 03/04/43 | | | | 10 | | | | 9,471 | |
| | | | | | | | | | | | | | | | |
| | | | | | | | | | | | | | | 192,402 | |
| | | | |
Airlines 0.1% | | | | | | | | | | | | | | | | |
Continental Airlines 2012-1 Class A Pass-Through Trust, Pass-Through Certificates | | | 4.150 | | | | 10/11/25 | | | | 26 | | | | 26,679 | |
Delta Air Lines, Inc., Sr. Unsec’d. Notes | | | 3.400 | | | | 04/19/21 | | | | 20 | | | | 19,880 | |
| | | | | | | | | | | | | | | | |
| | | | | | | | | | | | | | | 46,559 | |
See Notes to Financial Statements.
| | | | |
| PGIM Day One Underlying Funds | |
| 47
|
|
PGIM Core Conservative Bond Fund
Schedule of Investments (continued)
as of July 31, 2018
| | | | | | | | | | | | | | | | |
| Description | | Interest
Rate | | | Maturity
Date | | | Principal
Amount (000)# | | | Value | |
CORPORATE BONDS (Continued) | | | | | | | | | | | | | | | | |
| | | | |
Auto Manufacturers 0.5% | | | | | | | | | | | | | | | | |
Ford Motor Co., Sr. Unsec’d. Notes | | | 6.375 | % | | | 02/01/29 | | | | 60 | | | $ | 64,459 | |
Ford Motor Credit Co. LLC,
Sr. Unsec’d. Notes | | | 3.664 | | | | 09/08/24 | | | | 10 | | | | 9,540 | |
Sr. Unsec’d. Notes | | | 3.810 | | | | 01/09/24 | | | | 10 | | | | 9,684 | |
Sr. Unsec’d. Notes | | | 4.134 | | | | 08/04/25 | | | | 10 | | | | 9,668 | |
General Motors Co., Sr. Unsec’d. Notes | | | 6.250 | | | | 10/02/43 | | | | 15 | | | | 15,658 | |
General Motors Financial Co., Inc.,
Gtd. Notes | | | 3.200 | | | | 07/06/21 | | | | 10 | | | | 9,859 | |
Gtd. Notes | | | 4.000 | | | | 01/15/25 | | | | 80 | | | | 78,049 | |
| | | | | | | | | | | | | | | | |
| | | | | | | | | | | | | | | 196,917 | |
| | | | |
Banks 5.4% | | | | | | | | | | | | | | | | |
Bank of America Corp.,
Sr. Unsec’d. Notes | | | 3.419 | | | | 12/20/28 | | | | 42 | | | | 39,498 | |
Sr. Unsec’d. Notes, GMTN | | | 3.300 | | | | 01/11/23 | | | | 115 | | | | 113,515 | |
Sr. Unsec’d. Notes, MTN | | | 3.970 | | | | 03/05/29 | | | | 25 | | | | 24,514 | |
Sr. Unsec’d. Notes, MTN | | | 4.125 | | | | 01/22/24 | | | | 50 | | | | 50,911 | |
Sub. Notes, MTN | | | 3.950 | | | | 04/21/25 | | | | 45 | | | | 44,165 | |
Sub. Notes, MTN | | | 4.000 | | | | 01/22/25 | | | | 30 | | | | 29,622 | |
Barclays PLC (United Kingdom), Sr. Unsec’d. Notes | | | 3.650 | | | | 03/16/25 | | | | 200 | | | | 189,026 | |
Citigroup, Inc.,
Sr. Unsec’d. Notes | | | 2.900 | | | | 12/08/21 | | | | 20 | | | | 19,557 | |
Sr. Unsec’d. Notes | | | 3.400 | | | | 05/01/26 | | | | 40 | | | | 38,172 | |
Sr. Unsec’d. Notes | | | 3.700 | | | | 01/12/26 | | | | 125 | | | | 121,477 | |
Sr. Unsec’d. Notes | | | 4.650 | | | | 07/23/48 | | | | 45 | | | | 45,776 | |
Sub. Notes | | | 4.450 | | | | 09/29/27 | | | | 35 | | | | 34,603 | |
Goldman Sachs Group, Inc. (The),
Sr. Unsec’d. Notes | | | 3.500 | | | | 01/23/25 | | | | 250 | | | | 242,041 | |
Sr. Unsec’d. Notes | | | 4.223 | | | | 05/01/29 | | | | 140 | | | | 138,165 | |
HSBC Holdings PLC (United Kingdom), Sr. Unsec’d. Notes | | | 4.875 | | | | 01/14/22 | | | | 115 | | | | 119,613 | |
JPMorgan Chase & Co.,
Sr. Unsec’d. Notes | | | 3.509 | | | | 01/23/29 | | | | 75 | | | | 71,247 | |
Sr. Unsec’d. Notes | | | 3.625 | | | | 05/13/24 | | | | 10 | | | | 9,932 | |
Sr. Unsec’d. Notes | | | 3.875 | | | | 02/01/24 | | | | 35 | | | | 35,269 | |
Sr. Unsec’d. Notes | | | 3.882 | | | | 07/24/38 | | | | 95 | | | | 89,025 | |
Sub. Notes | | | 3.875 | | | | 09/10/24 | | | | 120 | | | | 118,825 | |
See Notes to Financial Statements.
| | | | | | | | | | | | | | | | |
| Description | | Interest
Rate | | | Maturity
Date | | | Principal
Amount (000)# | | | Value | |
CORPORATE BONDS (Continued) | | | | | | | | | | | | | | | | |
| | | | |
Banks (cont’d.) | | | | | | | | | | | | | | | | |
Morgan Stanley,
Sr. Unsec’d. Notes | | | 4.375 | % | | | 01/22/47 | | | | 55 | | | $ | 54,384 | |
Sr. Unsec’d. Notes, GMTN | | | 3.875 | | | | 01/27/26 | | | | 35 | | | | 34,569 | |
Sr. Unsec’d. Notes, GMTN | | | 4.000 | | | | 07/23/25 | | | | 135 | | | | 135,120 | |
Sub. Notes | | | 5.000 | | | | 11/24/25 | | | | 30 | | | | 31,177 | |
PNC Financial Services Group, Inc. (The), Sub. Notes | | | 3.900 | | | | 04/29/24 | | | | 50 | | | | 49,914 | |
SunTrust Banks, Inc., Sr. Unsec’d. Notes | | | 2.700 | | | | 01/27/22 | | | | 20 | | | | 19,428 | |
U.S. Bancorp, Sr. Unsec’d. Notes | | | 2.625 | | | | 01/24/22 | | | | 50 | | | | 48,850 | |
Wells Fargo & Co.,
Sr. Unsec’d. Notes | | | 3.000 | | | | 04/22/26 | | | | 55 | | | | 51,356 | |
Sr. Unsec’d. Notes, MTN | | | 3.000 | | | | 02/19/25 | | | | 90 | | | | 85,391 | |
| | | | | | | | | | | | | | | | |
| | | | | | | | | | | | | | | 2,085,142 | |
| | | | |
Beverages 0.6% | | | | | | | | | | | | | | | | |
Anheuser-Busch InBev Finance, Inc. (Belgium),
Gtd. Notes | | | 3.300 | | | | 02/01/23 | | | | 5 | | | | 4,966 | |
Gtd. Notes | | | 3.650 | | | | 02/01/26 | | | | 100 | | | | 98,173 | |
Gtd. Notes | | | 4.700 | | | | 02/01/36 | | | | 20 | | | | 20,656 | |
Gtd. Notes | | | 4.900 | | | | 02/01/46 | | | | 30 | | | | 31,307 | |
PepsiCo, Inc.,
Sr. Unsec’d. Notes | | | 2.750 | | | | 03/05/22 | | | | 75 | | | | 74,118 | |
Sr. Unsec’d. Notes | | | 3.600 | | | | 03/01/24 | | | | 10 | | | | 10,084 | |
| | | | | | | | | | | | | | | | |
| | | | | | | | | | | | | | | 239,304 | |
| | | | |
Biotechnology 0.5% | | | | | | | | | | | | | | | | |
Amgen, Inc., Sr. Unsec’d. Notes | | | 3.625 | | | | 05/22/24 | | | | 150 | | | | 149,778 | |
Celgene Corp., Sr. Unsec’d. Notes | | | 3.625 | | | | 05/15/24 | | | | 40 | | | | 39,373 | |
Gilead Sciences, Inc., Sr. Unsec’d. Notes | | | 4.400 | | | | 12/01/21 | | | | 20 | | | | 20,594 | |
| | | | | | | | | | | | | | | | |
| | | | | | | | | | | | | | | 209,745 | |
| | | | |
Building Materials 0.0% | | | | | | | | | | | | | | | | |
Johnson Controls International PLC, Sr. Unsec’d. Notes | | | 4.950 | | | | 07/02/64 | | | | 5 | | | | 4,713 | |
See Notes to Financial Statements.
| | | | |
| PGIM Day One Underlying Funds | | | 49 | |
PGIM Core Conservative Bond Fund
Schedule of Investments (continued)
as of July 31, 2018
| | | | | | | | | | | | | | | | |
| Description | | Interest
Rate | | | Maturity
Date | | | Principal
Amount (000)# | | | Value | |
CORPORATE BONDS (Continued) | | | | | | | | | | | | | | | | |
| | | | |
Chemicals 0.6% | | | | | | | | | | | | | | | | |
Dow Chemical Co. (The), Sr. Unsec’d. Notes | | | 4.125 | % | | | 11/15/21 | | | | 75 | | | $ | 76,400 | |
Eastman Chemical Co., Sr. Unsec’d. Notes | | | 4.650 | | | | 10/15/44 | | | | 20 | | | | 19,672 | |
EI du Pont de Nemours & Co., Sr. Unsec’d. Notes | | | 2.800 | | | | 02/15/23 | | | | 15 | | | | 14,492 | |
LYB International Finance II BV, Gtd. Notes | | | 3.500 | | | | 03/02/27 | | | | 35 | | | | 33,167 | |
LyondellBasell Industries NV,
Sr. Unsec’d. Notes | | | 5.750 | | | | 04/15/24 | | | | 15 | | | | 16,235 | |
Sr. Unsec’d. Notes | | | 6.000 | | | | 11/15/21 | | | | 30 | | | | 31,965 | |
Nutrien Ltd. (Canada), Sr. Unsec’d. Notes | | | 5.250 | | | | 01/15/45 | | | | 15 | | | | 15,599 | |
Sherwin-Williams Co. (The), Sr. Unsec’d. Notes | | | 4.500 | | | | 06/01/47 | | | | 5 | | | | 4,916 | |
| | | | | | | | | | | | | | | | |
| | | | | | | | | | | | | | | 212,446 | |
| | | | |
Commercial Services 0.1% | | | | | | | | | | | | | | | | |
IHS Markit Ltd., Sr. Unsec’d. Notes | | | 4.125 | | | | 08/01/23 | | | | 5 | | | | 4,992 | |
President & Fellows of Harvard College, Unsec’d. Notes | | | 3.150 | | | | 07/15/46 | | | | 9 | | | | 8,033 | |
University of Southern California, Unsec’d. Notes | | | 3.841 | | | | 10/01/47 | | | | 10 | | | | 9,977 | |
| | | | | | | | | | | | | | | | |
| | | | | | | | | | | | | | | 23,002 | |
| | | | |
Computers 0.8% | | | | | | | | | | | | | | | | |
Apple, Inc.,
Sr. Unsec’d. Notes | | | 2.400 | | | | 05/03/23 | | | | 120 | | | | 115,815 | |
Sr. Unsec’d. Notes | | | 2.850 | | | | 05/11/24 | | | | 45 | | | | 43,728 | |
Sr. Unsec’d. Notes | | | 3.250 | | | | 02/23/26 | | | | 40 | | | | 39,250 | |
International Business Machines Corp., Sr. Unsec’d. Notes | | | 3.625 | | | | 02/12/24 | | | | 100 | | | | 100,453 | |
| | | | | | | | | | | | | | | | |
| | | | | | | | | | | | | | | 299,246 | |
| | | | |
Diversified Financial Services 0.4% | | | | | | | | | | | | | | | | |
American Express Credit Corp., Sr. Unsec’d. Notes, MTN | | | 2.200 | | | | 03/03/20 | | | | 35 | | | | 34,541 | |
See Notes to Financial Statements.
| | | | | | | | | | | | | | | | |
| Description | | Interest
Rate | | | Maturity
Date | | | Principal
Amount (000)# | | | Value | |
CORPORATE BONDS (Continued) | | | | | | | | | | | | | | | | |
| | | | |
Diversified Financial Services (cont’d.) | | | | | | | | | | | | | | | | |
Capital One Bank USA NA, Sub. Notes | | | 3.375 | % | | | 02/15/23 | | | | 20 | | | $ | 19,493 | |
Discover Financial Services, Sr. Unsec’d. Notes | | | 4.100 | | | | 02/09/27 | | | | 20 | | | | 19,341 | |
Mastercard, Inc., Sr. Unsec’d. Notes | | | 3.375 | | | | 04/01/24 | | | | 50 | | | | 50,012 | |
Private Export Funding Corp., Gov’t. Gtd. Notes | | | 3.550 | | | | 01/15/24 | | | | 25 | | | | 25,523 | |
| | | | | | | | | | | | | | | | |
| | | | | | | | | | | | | | | 148,910 | |
| | | | |
Electric 1.6% | | | | | | | | | | | | | | | | |
Appalachian Power Co., Sr. Unsec’d. Notes | | | 3.300 | | | | 06/01/27 | | | | 10 | | | | 9,498 | |
Arizona Public Service Co., Sr. Unsec’d. Notes | | | 3.750 | | | | 05/15/46 | | | | 15 | | | | 13,797 | |
Commonwealth Edison Co.,
First Mortgage | | | 3.650 | | | | 06/15/46 | | | | 5 | | | | 4,593 | |
First Mortgage | | | 3.750 | | | | 08/15/47 | | | | 5 | | | | 4,664 | |
First Mortgage | | | 4.000 | | | | 03/01/48 | | | | 5 | | | | 4,955 | |
First Mortgage | | | 4.600 | | | | 08/15/43 | | | | 35 | | | | 37,053 | |
Duke Energy Carolinas LLC,
First Ref. Mortgage | | | 2.950 | | | | 12/01/26 | | | | 20 | | | | 19,015 | |
First Ref. Mtge. | | | 4.250 | | | | 12/15/41 | | | | 5 | | | | 5,063 | |
Duke Energy Corp., Sr. Unsec’d. Notes | | | 2.650 | | | | 09/01/26 | | | | 75 | | | | 68,089 | |
Entergy Louisiana LLC,
Collateral Trust | | | 4.000 | | | | 03/15/33 | | | | 15 | | | | 15,005 | |
First Mortgage | | | 4.050 | | | | 09/01/23 | | | | 35 | | | | 35,569 | |
Exelon Corp., Jr. Sub. Notes | | | 3.497 | | | | 06/01/22 | | | | 10 | | | | 9,896 | |
Florida Power & Light Co.,
First Mortgage | | | 2.750 | | | | 06/01/23 | | | | 25 | | | | 24,312 | |
First Mortgage | | | 5.250 | | | | 02/01/41 | | | | 25 | | | | 29,027 | |
Fortis, Inc. (Canada), Sr. Unsec’d. Notes | | | 3.055 | | | | 10/04/26 | | | | 10 | | | | 9,160 | |
Hydro-Quebec (Canada), Gov’t. Gtd. Notes | | | 8.050 | | | | 07/07/24 | | | | 10 | | | | 12,262 | |
Louisville Gas & Electric Co., First Mortgage | | | 5.125 | | | | 11/15/40 | | | | 5 | | | | 5,683 | |
See Notes to Financial Statements.
| | | | |
| PGIM Day One Underlying Funds | | | 51 | |
PGIM Core Conservative Bond Fund
Schedule of Investments (continued)
as of July 31, 2018
| | | | | | | | | | | | | | | | |
| Description | | Interest
Rate | | | Maturity
Date | | | Principal
Amount (000)# | | | Value | |
CORPORATE BONDS (Continued) | | | | | | | | | | | | | | | | |
| | | | |
Electric (cont’d.) | | | | | | | | | | | | | | | | |
MidAmerican Energy Co., First Mortgage | | | 3.650 | % | | | 08/01/48 | | | | 25 | | | $ | 23,021 | |
Northern States Power Co., First Mortgage | | | 3.400 | | | | 08/15/42 | | | | 15 | | | | 13,431 | |
Pacific Gas & Electric Co., Sr. Unsec’d. Notes | | | 5.125 | | | | 11/15/43 | | | | 55 | | | | 54,932 | |
PacifiCorp, First Mortgage | | | 5.250 | | | | 06/15/35 | | | | 45 | | | | 50,761 | |
PPL Electric Utilities Corp., First Mortgage | | | 6.250 | | | | 05/15/39 | | | | 10 | | | | 12,623 | |
Public Service Electric & Gas Co.,
First Mortgage, MTN | | | 2.250 | | | | 09/15/26 | | | | 25 | | | | 22,562 | |
First Mortgage, MTN | | | 3.600 | | | | 12/01/47 | | | | 5 | | | | 4,629 | |
Puget Energy, Inc., Sr. Sec’d. Notes | | | 3.650 | | | | 05/15/25 | | | | 20 | | | | 19,361 | |
San Diego Gas & Electric Co., First Mortgage | | | 3.750 | | | | 06/01/47 | | | | 5 | | | | 4,623 | |
Sempra Energy, Sr. Unsec’d. Notes | | | 4.000 | | | | 02/01/48 | | | | 10 | | | | 9,063 | |
South Carolina Electric & Gas Co., First Mortgage | | | 5.100 | | | | 06/01/65 | | | | 5 | | | | 5,113 | |
Southern California Edison Co., First Ref. Mortgage | | | 4.650 | | | | 10/01/43 | | | | 40 | | | | 41,368 | |
Southwestern Electric Power Co., Sr. Unsec’d. Notes | | | 3.850 | | | | 02/01/48 | | | | 15 | | | | 13,634 | |
Virginia Electric & Power Co., Sr. Unsec’d. Notes | | | 6.000 | | | | 05/15/37 | | | | 20 | | | | 23,956 | |
| | | | | | | | | | | | | | | | |
| | | | | | | | | | | | | | | 606,718 | |
| | | | |
Foods 0.1% | | | | | | | | | | | | | | | | |
Kraft Heinz Foods Co.,
Gtd. Notes | | | 3.000 | | | | 06/01/26 | | | | 50 | | | | 45,824 | |
Gtd. Notes | | | 4.375 | | | | 06/01/46 | | | | 10 | | | | 8,891 | |
| | | | | | | | | | | | | | | | |
| | | | | | | | | | | | | | | 54,715 | |
| | | | |
Forest Products & Paper 0.3% | | | | | | | | | | | | | | | | |
International Paper Co., Sr. Unsec’d. Notes | | | 3.650 | | | | 06/15/24 | | | | 130 | | | | 129,006 | |
See Notes to Financial Statements.
| | | | | | | | | | | | | | | | |
| Description | | Interest
Rate | | | Maturity
Date | | | Principal
Amount (000)# | | | Value | |
CORPORATE BONDS (Continued) | | | | | | | | | | | | | | | | |
| | | | |
Gas 0.1% | | | | | | | | | | | | | | | | |
NiSource, Inc., Sr. Unsec’d. Notes | | | 4.800 | % | | | 02/15/44 | | | | 25 | | | $ | 26,104 | |
Southern Co. Gas Capital Corp., Gtd. Notes | | | 4.400 | | | | 06/01/43 | | | | 25 | | | | 24,900 | |
| | | | | | | | | | | | | | | | |
| | | | | | | | | | | | | | | 51,004 | |
| | | | |
Healthcare-Products 0.7% | | | | | | | | | | | | | | | | |
Abbott Laboratories,
Sr. Unsec’d. Notes | | | 2.900 | | | | 11/30/21 | | | | 40 | | | | 39,455 | |
Sr. Unsec’d. Notes | | | 3.750 | | | | 11/30/26 | | | | 15 | | | | 14,917 | |
Becton, Dickinson & Co., Sr. Unsec’d. Notes | | | 3.734 | | | | 12/15/24 | | | | 32 | | | | 31,372 | |
Covidien International Finance SA, Gtd. Notes | | | 2.950 | | | | 06/15/23 | | | | 75 | | | | 73,194 | |
Medtronic, Inc., Gtd. Notes | | | 3.625 | | | | 03/15/24 | | | | 65 | | | | 65,256 | |
Stryker Corp., Sr. Unsec’d. Notes | | | 3.375 | | | | 05/15/24 | | | | 25 | | | | 24,591 | |
Thermo Fisher Scientific, Inc., Sr. Unsec’d. Notes | | | 4.150 | | | | 02/01/24 | | | | 20 | | | | 20,393 | |
| | | | | | | | | | | | | | | | |
| | | | | | | | | | | | | | | 269,178 | |
| | | | |
Healthcare-Services 1.6% | | | | | | | | | | | | | | | | |
Aetna, Inc., Sr. Unsec’d. Notes | | | 2.750 | | | | 11/15/22 | | | | 70 | | | | 67,354 | |
Anthem, Inc., Sr. Unsec’d. Notes | | | 3.125 | | | | 05/15/22 | | | | 135 | | | | 133,030 | |
Ascension Health, Unsec’d. Notes | | | 4.847 | | | | 11/15/53 | | | | 30 | | | | 33,441 | |
Children’s Hospital Corp. (The), Gtd. Notes | | | 4.115 | | | | 01/01/47 | | | | 15 | | | | 14,985 | |
Cigna Corp., Sr. Unsec’d. Notes | | | 4.000 | | | | 02/15/22 | | | | 35 | | | | 35,541 | |
Duke University Health System, Inc., Sr. Unsec’d. Notes | | | 3.920 | | | | 06/01/47 | | | | 10 | | | | 9,728 | |
Hackensack Meridian Health, Inc., Sr. Unsec’d. Notes | | | 4.500 | | | | 07/01/57 | | | | 5 | | | | 5,122 | |
Kaiser Foundation Hospitals, Gtd. Notes | | | 4.150 | | | | 05/01/47 | | | | 20 | | | | 20,180 | |
See Notes to Financial Statements.
| | | | |
| PGIM Day One Underlying Funds | | | 53 | |
PGIM Core Conservative Bond Fund
Schedule of Investments (continued)
as of July 31, 2018
| | | | | | | | | | | | | | | | |
| Description | | Interest
Rate | | | Maturity
Date | | | Principal
Amount (000)# | | | Value | |
CORPORATE BONDS (Continued) | | | | | | | | | | | | | | | | |
| | | | |
Healthcare-Services (cont’d.) | | | | | | | | | | | | | | | | |
Laboratory Corp. of America Holdings, Sr. Unsec’d. Notes | | | 4.700 | % | | | 02/01/45 | | | | 25 | | | $ | 24,748 | |
Memorial Sloan-Kettering Cancer Center, Sr. Unsec’d. Notes | | | 5.000 | | | | 07/01/42 | | | | 25 | | | | 28,641 | |
New York & Presbyterian Hospital (The), Unsec’d. Notes | | | 4.024 | | | | 08/01/45 | | | | 20 | | | | 19,674 | |
NYU Langone Hospitals, Sec’d. Notes | | | 4.368 | | | | 07/01/47 | | | | 15 | | | | 15,206 | |
Providence St Joseph Health Obligated Group, Unsec’d. Notes | | | 2.746 | | | | 10/01/26 | | | | 50 | | | | 46,345 | |
Sutter Health, Unsec’d. Notes | | | 4.091 | | | | 08/15/48 | | | | 60 | | | | 56,999 | |
UnitedHealth Group, Inc.,
Sr. Unsec’d. Notes | | | 3.750 | | | | 07/15/25 | | | | 90 | | | | 90,390 | |
Sr. Unsec’d. Notes | | | 4.250 | | | | 06/15/48 | | | | 5 | | | | 5,107 | |
| | | | | | | | | | | | | | | | |
| | | | | | | | | | | | | | | 606,491 | |
| | | | |
Insurance 0.7% | | | | | | | | | | | | | | | | |
American International Group, Inc., Sr. Unsec’d. Notes | | | 4.500 | | | | 07/16/44 | | | | 50 | | | | 47,768 | |
Arch Capital Finance LLC, Gtd. Notes | | | 4.011 | | | | 12/15/26 | | | | 5 | | | | 4,928 | |
Berkshire Hathaway, Inc., Sr. Unsec’d. Notes | | | 3.125 | | | | 03/15/26 | | | | 80 | | | | 77,465 | |
Chubb Corp. (The), Gtd. Notes | | | 6.000 | | | | 05/11/37 | | | | 30 | | | | 36,680 | |
Hartford Financial Services Group, Inc. (The), Sr. Unsec’d. Notes | | | 5.500 | | | | 03/30/20 | | | | 65 | | | | 67,320 | |
Lincoln National Corp., Sr. Unsec’d. Notes | | | 4.350 | | | | 03/01/48 | | | | 5 | | | | 4,762 | |
Travelers Cos., Inc. (The), Sr. Unsec’d. Notes | | | 4.600 | | | | 08/01/43 | | | | 15 | | | | 15,690 | |
| | | | | | | | | | | | | | | | |
| | | | | | | | | | | | | | | 254,613 | |
| | | | |
Internet 0.0% | | | | | | | | | | | | | | | | |
Amazon.com, Inc., Sr. Unsec’d. Notes | | | 2.800 | | | | 08/22/24 | | | | 15 | | | | 14,491 | |
See Notes to Financial Statements.
| | | | | | | | | | | | | | | | |
| Description | | Interest
Rate | | | Maturity
Date | | | Principal
Amount (000)# | | | Value | |
CORPORATE BONDS (Continued) | | | | | | | | | | | | | | | | |
| | | | |
Lodging 0.1% | | | | | | | | | | | | | | | | |
Marriott International, Inc., Sr. Unsec’d. Notes | | | 3.125 | % | | | 06/15/26 | | | | 45 | | | $ | 41,780 | |
| | | | |
Machinery-Construction & Mining 0.1% | | | | | | | | | | | | | | | | |
Caterpillar, Inc., Sr. Unsec’d. Notes | | | 2.600 | | | | 06/26/22 | | | | 45 | | | | 43,856 | |
| | | | |
Machinery-Diversified 0.2% | | | | | | | | | | | | | | | | |
John Deere Capital Corp.,
Sr. Unsec’d. Notes, MTN | | | 2.650 | | | | 06/24/24 | | | | 10 | | | | 9,526 | |
Sr. Unsec’d. Notes, MTN | | | 2.800 | | | | 03/06/23 | | | | 40 | | | | 38,993 | |
Xylem, Inc., Sr. Unsec’d. Notes | | | 3.250 | | | | 11/01/26 | | | | 35 | | | | 32,860 | |
| | | | | | | | | | | | | | | | |
| | | | | | | | | | | | | | | 81,379 | |
| | | | |
Media 1.2% | | | | | | | | | | | | | | | | |
21st Century Fox America, Inc., Gtd. Notes | | | 5.400 | | | | 10/01/43 | | | | 60 | | | | 68,932 | |
Charter Communications Operating LLC/Charter Communications Operating Capital,
Sr. Sec’d. Notes | | | 5.375 | | | | 04/01/38 | | | | 20 | | | | 19,765 | |
Sr. Sec’d. Notes | | | 6.484 | | | | 10/23/45 | | | | 50 | | | | 54,553 | |
Comcast Corp.,
Gtd. Notes | | | 3.000 | | | | 02/01/24 | | | | 30 | | | | 28,817 | |
Gtd. Notes | | | 4.600 | | | | 08/15/45 | | | | 55 | | | | 54,329 | |
Discovery Communications LLC,
Gtd. Notes | | | 5.000 | | | | 09/20/37 | | | | 5 | | | | 4,901 | |
Gtd. Notes, 144A | | | 3.500 | | | | 06/15/22 | | | | 50 | | | | 49,339 | |
Viacom, Inc.,
Sr. Unsec’d. Notes | | | 3.875 | | | | 04/01/24 | | | | 20 | | | | 19,435 | |
Sr. Unsec’d. Notes | | | 5.850 | | | | 09/01/43 | | | | 10 | | | | 10,518 | |
Walt Disney Co. (The), Sr. Unsec’d. Notes | | | 2.750 | | | | 08/16/21 | | | | 50 | | | | 49,358 | |
Warner Media LLC, Gtd. Notes | | | 3.550 | | | | 06/01/24 | | | | 100 | | | | 96,929 | |
| | | | | | | | | | | | | | | | |
| | | | | | | | | | | | | | | 456,876 | |
See Notes to Financial Statements.
| | | | |
| PGIM Day One Underlying Funds | | | 55 | |
PGIM Core Conservative Bond Fund
Schedule of Investments (continued)
as of July 31, 2018
| | | | | | | | | | | | | | | | |
| Description | | Interest
Rate | | | Maturity
Date | | | Principal
Amount (000)# | | | Value | |
CORPORATE BONDS (Continued) | | | | | | | | | | | | | | | | |
| | | | |
Mining 0.1% | | | | | | | | | | | | | | | | |
Barrick North America Finance LLC (Canada), Gtd. Notes | | | 5.750 | % | | | 05/01/43 | | | | 5 | | | $ | 5,535 | |
Rio Tinto Finance USA Ltd. (Australia), Gtd. Notes | | | 3.750 | | | | 06/15/25 | | | | 45 | | | | 45,098 | |
| | | | | | | | | | | | | | | | |
| | | | | | | | | | | | | | | 50,633 | |
| | | | |
Miscellaneous Manufacturing 0.6% | | | | | | | | | | | | | | | | |
General Electric Co.,
Sr. Unsec’d. Notes | | | 2.700 | | | | 10/09/22 | | | | 155 | | | | 150,211 | |
Sr. Unsec’d. Notes, GMTN | | | 3.150 | | | | 09/07/22 | | | | 95 | | | | 93,910 | |
| | | | | | | | | | | | | | | | |
| | | | | | | | | | | | | | | 244,121 | |
| | | | |
Oil & Gas 1.7% | | | | | | | | | | | | | | | | |
Anadarko Petroleum Corp., Sr. Unsec’d. Notes | | | 5.550 | | | | 03/15/26 | | | | 15 | | | | 16,200 | |
Apache Corp., Sr. Unsec’d. Notes | | | 3.250 | | | | 04/15/22 | | | | 25 | | | | 24,667 | |
BP Capital Markets PLC (United Kingdom), Gtd. Notes | | | 3.245 | | | | 05/06/22 | | | | 60 | | | | 59,773 | |
Cenovus Energy, Inc. (Canada), Sr. Unsec’d. Notes | | | 5.250 | | | | 06/15/37 | | | | 10 | | | | 10,056 | |
Chevron Corp., Sr. Unsec’d. Notes | | | 1.961 | | | | 03/03/20 | | | | 150 | | | | 148,124 | |
Concho Resources, Inc.,
Gtd. Notes | | | 4.300 | | | | 08/15/28 | | | | 5 | | | | 5,006 | |
Gtd. Notes | | | 4.875 | | | | 10/01/47 | | | | 5 | | | | 5,086 | |
ConocoPhillips Co., Gtd. Notes | | | 4.950 | | | | 03/15/26 | | | | 30 | | | | 32,308 | |
Devon Energy Corp., Sr. Unsec’d. Notes | | | 5.600 | | | | 07/15/41 | | | | 20 | | | | 21,796 | |
Encana Corp. (Canada), Sr. Unsec’d. Notes | | | 6.500 | | | | 08/15/34 | | | | 20 | | | | 23,527 | |
EOG Resources, Inc., Sr. Unsec’d. Notes | | | 3.900 | | | | 04/01/35 | | | | 25 | | | | 24,473 | |
Exxon Mobil Corp., Sr. Unsec’d. Notes | | | 4.114 | | | | 03/01/46 | | | | 20 | | | | 20,511 | |
Noble Energy, Inc., Sr. Unsec’d. Notes | | | 6.000 | | | | 03/01/41 | | | | 20 | | | | 22,192 | |
See Notes to Financial Statements.
| | | | | | | | | | | | | | | | |
| Description | | Interest
Rate | | | Maturity
Date | | | Principal
Amount (000)# | | | Value | |
CORPORATE BONDS (Continued) | | | | | | | | | | | | | | | | |
| | | | |
Oil & Gas (cont’d.) | | | | | | | | | | | | | | | | |
Occidental Petroleum Corp., Sr. Unsec’d. Notes | | | 3.125 | % | | | 02/15/22 | | | | 40 | | | $ | 39,768 | |
Petroleos Mexicanos (Mexico),
Gtd. Notes | | | 4.250 | | | | 01/15/25 | | | | 40 | | | | 37,300 | |
Gtd. Notes | | | 6.500 | | | | 03/13/27 | | | | 15 | | | | 15,225 | |
Gtd. Notes | | | 6.500 | | | | 06/02/41 | | | | 20 | | | | 18,508 | |
Shell International Finance BV (Netherlands), Gtd. Notes | | | 2.125 | | | | 05/11/20 | | | | 125 | | | | 123,409 | |
| | | | | | | | | | | | | | | | |
| | | | | | | | | | | | | | | 647,929 | |
| | | | |
Oil & Gas Services 0.1% | | | | | | | | | | | | | | | | |
Baker Hughes a GE Co. LLC/Baker Hughes Co-Obligor, Inc., Sr. Unsec’d. Notes | | | 4.080 | | | | 12/15/47 | | | | 5 | | | | 4,596 | |
Halliburton Co., Sr. Unsec’d. Notes | | | 4.750 | | | | 08/01/43 | | | | 25 | | | | 25,533 | |
| | | | | | | | | | | | | | | | |
| | | | | | | | | | | | | | | 30,129 | |
| | | | |
Pharmaceuticals 1.5% | | | | | | | | | | | | | | | | |
AbbVie, Inc., Sr. Unsec’d. Notes | | | 3.600 | | | | 05/14/25 | | | | 60 | | | | 58,525 | |
Allergan Funding SCS,
Gtd. Notes | | | 3.800 | | | | 03/15/25 | | | | 15 | | | | 14,717 | |
Gtd. Notes | | | 3.850 | | | | 06/15/24 | | | | 5 | | | | 4,936 | |
Gtd. Notes | | | 4.550 | | | | 03/15/35 | | | | 15 | | | | 14,629 | |
Gtd. Notes | | | 4.850 | | | | 06/15/44 | | | | 21 | | | | 20,712 | |
CVS Health Corp.,
Sr. Unsec’d. Notes | | | 3.875 | | | | 07/20/25 | | | | 25 | | | | 24,622 | |
Sr. Unsec’d. Notes | | | 4.780 | | | | 03/25/38 | | | | 10 | | | | 10,078 | |
Sr. Unsec’d. Notes | | | 5.050 | | | | 03/25/48 | | | | 20 | | | | 20,726 | |
Sr. Unsec’d. Notes | | | 5.125 | | | | 07/20/45 | | | | 15 | | | | 15,607 | |
Express Scripts Holding Co., Gtd. Notes | | | 4.500 | | | | 02/25/26 | | | | 15 | | | | 15,093 | |
GlaxoSmithKline Capital PLC (United Kingdom), Gtd. Notes | | | 2.850 | | | | 05/08/22 | | | | 45 | | | | 44,370 | |
Johnson & Johnson,
Sr. Unsec’d. Notes | | | 2.450 | | | | 03/01/26 | | | | 25 | | | | 23,536 | |
Sr. Unsec’d. Notes | | | 3.625 | | | | 03/03/37 | | | | 20 | | | | 19,527 | |
Merck & Co., Inc., Sr. Unsec’d. Notes | | | 2.400 | | | | 09/15/22 | | | | 100 | | | | 96,998 | |
See Notes to Financial Statements.
| | | | |
| PGIM Day One Underlying Funds | | | 57 | |
PGIM Core Conservative Bond Fund
Schedule of Investments (continued)
as of July 31, 2018
| | | | | | | | | | | | | | | | |
| Description | | Interest
Rate | | | Maturity
Date | | | Principal
Amount (000)# | | | Value | |
CORPORATE BONDS (Continued) | | | | | | | | | | | | | | | | |
| | | | |
Pharmaceuticals (cont’d.) | | | | | | | | | | | | | | | | |
Mylan, Inc., Gtd. Notes, 144A | | | 5.200 | % | | | 04/15/48 | | | | 35 | | | $ | 34,442 | |
Novartis Capital Corp. (Switzerland), Gtd. Notes | | | 4.400 | | | | 05/06/44 | | | | 40 | | | | 42,663 | |
Shire Acquisitions Investments Ireland DAC, Gtd. Notes | | | 2.875 | | | | 09/23/23 | | | | 65 | | | | 61,397 | |
Wyeth LLC, Gtd. Notes | | | 6.450 | | | | 02/01/24 | | | | 60 | | | | 68,930 | |
Zoetis, Inc., Sr. Unsec’d. Notes | | | 3.000 | | | | 09/12/27 | | | | 5 | | | | 4,667 | |
| | | | | | | | | | | | | | | | |
| | | | | | | | | | | | | | | 596,175 | |
| | | | |
Pipelines 0.7% | | | | | | | | | | | | | | | | |
Energy Transfer Partners LP,
Gtd. Notes | | | 4.900 | | | | 03/15/35 | | | | 30 | | | | 28,196 | |
Gtd. Notes | | | 6.625 | | | | 10/15/36 | | | | 10 | | | | 11,091 | |
Enterprise Products Operating LLC, Gtd. Notes | | | 3.750 | | | | 02/15/25 | | | | 80 | | | | 79,843 | |
Magellan Midstream Partners LP, Sr. Unsec’d. Notes | | | 4.200 | | | | 10/03/47 | | | | 10 | | | | 9,384 | |
MPLX LP,
Sr. Unsec’d. Notes | | | 4.500 | | | | 07/15/23 | | | | 20 | | | | 20,451 | |
Sr. Unsec’d. Notes | | | 4.500 | | | | 04/15/38 | | | | 20 | | | | 18,999 | |
Sr. Unsec’d. Notes | | | 4.875 | | | | 06/01/25 | | | | 10 | | | | 10,388 | |
ONEOK Partners LP, Gtd. Notes | | | 3.375 | | | | 10/01/22 | | | | 35 | | | | 34,431 | |
ONEOK, Inc., Gtd. Notes | | | 4.950 | | | | 07/13/47 | | | | 10 | | | | 10,141 | |
Phillips 66 Partners LP, Sr. Unsec’d. Notes | | | 3.750 | | | | 03/01/28 | | | | 10 | | | | 9,507 | |
Western Gas Partners LP, Sr. Unsec’d. Notes | | | 5.300 | | | | 03/01/48 | | | | 10 | | | | 9,576 | |
Williams Partners LP,
Sr. Unsec’d. Notes | | | 3.750 | | | | 06/15/27 | | | | 30 | | | | 28,915 | |
Sr. Unsec’d. Notes | | | 4.850 | | | | 03/01/48 | | | | 5 | | | | 4,912 | |
| | | | | | | | | | | | | | | | |
| | | | | | | | | | | | | | | 275,834 | |
See Notes to Financial Statements.
| | | | | | | | | | | | | | | | |
| Description | | Interest
Rate | | | Maturity
Date | | | Principal
Amount (000)# | | | Value | |
CORPORATE BONDS (Continued) | | | | | | | | | | | | | | | | |
| | | | |
Real Estate Investment Trusts (REITs) 0.4% | | | | | | | | | | | | | | | | |
Boston Properties LP, Sr. Unsec’d. Notes | | | 3.850 | % | | | 02/01/23 | | | | 20 | | | $ | 20,099 | |
Realty Income Corp., Sr. Unsec’d. Notes | | | 3.000 | | | | 01/15/27 | | | | 20 | | | | 18,263 | |
Simon Property Group LP, Sr. Unsec’d. Notes | | | 3.375 | | | | 10/01/24 | | | | 90 | | | | 88,024 | |
Ventas Realty LP, Gtd. Notes | | | 3.850 | | | | 04/01/27 | | | | 15 | | | | 14,395 | |
| | | | | | | | | | | | | | | | |
| | | | | | | | | | | | | | | 140,781 | |
| | | | |
Retail 0.6% | | | | | | | | | | | | | | | | |
Dollar Tree, Inc., Sr. Unsec’d. Notes | | | 4.200 | | | | 05/15/28 | | | | 30 | | | | 29,604 | |
Home Depot, Inc. (The), Sr. Unsec’d. Notes | | | 3.750 | | | | 02/15/24 | | | | 125 | | | | 127,282 | |
Lowe’s Cos., Inc., Sr. Unsec’d. Notes | | | 3.100 | | | | 05/03/27 | | | | 20 | | | | 19,081 | |
McDonald’s Corp.,
Sr. Unsec’d. Notes, MTN | | | 2.625 | | | | 01/15/22 | | | | 45 | | | | 43,985 | |
Sr. Unsec’d. Notes, MTN | | | 4.700 | | | | 12/09/35 | | | | 25 | | | | 26,254 | |
| | | | | | | | | | | | | | | | |
| | | | | | | | | | | | | | | 246,206 | |
| | | | |
Semiconductors 0.1% | | | | | | | | | | | | | | | | |
Broadcom Corp/Broadcom Cayman Finance Ltd., Gtd. Notes | | | 3.125 | | | | 01/15/25 | | | | 20 | | | | 18,391 | |
| | | | |
Software 1.1% | | | | | | | | | | | | | | | | |
Fidelity National Information Services, Inc., Gtd. Notes | | | 3.875 | | | | 06/05/24 | | | | 10 | | | | 9,987 | |
Fiserv, Inc., Sr. Unsec’d. Notes | | | 3.850 | | | | 06/01/25 | | | | 35 | | | | 34,929 | |
Microsoft Corp.,
Sr. Unsec’d. Notes | | | 2.875 | | | | 02/06/24 | | | | 220 | | | | 215,618 | |
Sr. Unsec’d. Notes | | | 4.100 | | | | 02/06/37 | | | | 10 | | | | 10,488 | |
Oracle Corp.,
Sr. Unsec’d. Notes | | | 2.650 | | | | 07/15/26 | | | | 130 | | | | 121,496 | |
Sr. Unsec’d. Notes | | | 2.950 | | | | 05/15/25 | | | | 50 | | | | 48,202 | |
| | | | | | | | | | | | | | | | |
| | | | | | | | | | | | | | | 440,720 | |
See Notes to Financial Statements.
| | | | |
| PGIM Day One Underlying Funds | | | 59 | |
PGIM Core Conservative Bond Fund
Schedule of Investments (continued)
as of July 31, 2018
| | | | | | | | | | | | | | | | |
| Description | | Interest
Rate | | | Maturity
Date | | | Principal
Amount (000)# | | | Value | |
CORPORATE BONDS (Continued) | | | | | | | | | | | | | | | | |
| | | | |
Telecommunications 1.1% | | | | | | | | | | | | | | | | |
AT&T, Inc.,
Sr. Unsec’d. Notes | | | 3.950 | % | | | 01/15/25 | | | | 30 | | | $ | 29,548 | |
Sr. Unsec’d. Notes | | | 4.450 | | | | 04/01/24 | | | | 95 | | | | 96,818 | |
Sr. Unsec’d. Notes | | | 4.750 | | | | 05/15/46 | | | | 75 | | | | 68,768 | |
British Telecommunications PLC (United Kingdom), Sr. Unsec’d. Notes | | | 9.625 | | | | 12/15/30 | | | | 25 | | | | 35,928 | |
Cisco Systems, Inc., Sr. Unsec’d. Notes | | | 2.900 | | | | 03/04/21 | | | | 60 | | | | 59,823 | |
Verizon Communications, Inc.,
Sr. Unsec’d. Notes | | | 3.376 | | | | 02/15/25 | | | | 25 | | | | 24,229 | |
Sr. Unsec’d. Notes | | | 3.500 | | | | 11/01/24 | | | | 5 | | | | 4,899 | |
Sr. Unsec’d. Notes | | | 4.500 | | | | 08/10/33 | | | | 10 | | | | 9,919 | |
Sr. Unsec’d. Notes | | | 4.522 | | | | 09/15/48 | | | | 78 | | | | 74,569 | |
| | | | | | | | | | | | | | | | |
| | | | | | | | | | | | | | | 404,501 | |
| | | | |
Textiles 0.1% | | | | | | | | | | | | | | | | |
Cintas Corp. No 2, Gtd. Notes | | | 3.700 | | | | 04/01/27 | | | | 20 | | | | 19,734 | |
| | | | |
Transportation 0.5% | | | | | | | | | | | | | | | | |
Burlington Northern Santa Fe LLC, Sr. Unsec’d. Notes | | | 3.750 | | | | 04/01/24 | | | | 75 | | | | 75,624 | |
CSX Corp., Sr. Unsec’d. Notes | | | 3.800 | | | | 03/01/28 | | | | 40 | | | | 39,538 | |
Norfolk Southern Corp., Sr. Unsec’d. Notes | | | 5.900 | | | | 06/15/19 | | | | 45 | | | | 46,164 | |
Union Pacific Corp.,
Sr. Unsec’d. Notes | | | 3.000 | | | | 04/15/27 | | | | 20 | | | | 18,938 | |
Sr. Unsec’d. Notes | | | 3.600 | | | | 09/15/37 | | | | 10 | | | | 9,268 | |
| | | | | | | | | | | | | | | | |
| | | | | | | | | | | | | | | 189,532 | |
| | | | | | | | | | | | | | | | |
TOTAL CORPORATE BONDS
(cost $10,082,363) | | | | 9,807,896 | |
| | | | | | | | | | | | | | | | |
| | |
MUNICIPAL BONDS 1.0% | | | | | | | | | |
|
Arizona 0.1% | |
Salt River Project Agricultural Improvement & Power District, Revenue Bonds, BABs | | | 4.839 | | | | 01/01/41 | | | | 20 | | | | 22,567 | |
See Notes to Financial Statements.
| | | | | | | | | | | | | | | | |
| Description | | Interest
Rate | | | Maturity
Date | | | Principal
Amount (000)# | | | Value | |
MUNICIPAL BONDS (Continued) | | | | | | | | | | | | | | | | |
| | | | |
California 0.4% | | | | | | | | | | | | | | | | |
Bay Area Toll Authority, BABs, Revenue Bonds | | | 6.263 | % | | | 04/01/49 | | | | 40 | | | $ | 54,766 | |
Los Angeles Department of Water & Power, BABs, Revenue Bonds | | | 5.716 | | | | 07/01/39 | | | | 20 | | | | 24,591 | |
State of California, GO UnlimitedBABs, Taxable | | | 7.550 | | | | 04/01/39 | | | | 65 | | | | 95,943 | |
| | | | | | | | | | | | | | | | |
| | | | | | | | | | | | | | | 175,300 | |
| | | | |
Maryland 0.1% | | | | | | | | | | | | | | | | |
Maryland State Transportation Authority, Revenue Bonds, BABs | | | 5.888 | | | | 07/01/43 | | | | 40 | | | | 50,757 | |
| | | | |
New Jersey 0.2% | | | | | | | | | | | | | | | | |
New Jersey State Turnpike Authority, BABs, Revenue Bonds, Series F | | | 7.414 | | | | 01/01/40 | | | | 50 | | | | 72,090 | |
| | | | |
New York 0.1% | | | | | | | | | | | | | | | | |
New York City Water & Sewer System, BABs, Taxable, Revenue Bonds | | | 5.882 | | | | 06/15/44 | | | | 20 | | | | 25,816 | |
| | | | |
Ohio 0.1% | | | | | | | | | | | | | | | | |
Ohio State University (The),
Revenue Bonds, Series A | | | 4.048 | | | | 12/01/56 | | | | 12 | | | | 11,973 | |
Taxable, Revenue Bonds, Series A | | | 4.800 | | | | 06/01/2111 | | | | 25 | | | | 26,640 | |
| | | | | | | | | | | | | | | | |
| | | | | | | | | | | | | | | 38,613 | |
| | | | | | | | | | | | | | | | |
TOTAL MUNICIPAL BONDS
(cost $382,836) | | | | 385,143 | |
| | | | | | | | | | | | | | | | |
| | | | |
SOVEREIGN BONDS 0.6% | | | | | | | | | | | | | | | | |
Chile Government International Bond (Chile), Sr. Unsec’d. Notes | | | 3.250 | | | | 09/14/21 | | | | 100 | | | | 99,900 | |
Mexico Government International Bond (Mexico), Sr. Unsec’d. Notes, MTN | | | 4.750 | | | | 03/08/44 | | | | 76 | | | | 71,326 | |
Province of Quebec (Canada), Debentures | | | 7.125 | | | | 02/09/24 | | | | 40 | | | | 47,368 | |
Uruguay Government International Bond (Uruguay), Sr. Unsec’d. Notes | | | 4.975 | | | | 04/20/55 | | | | 10 | | | | 9,910 | |
| | | | | | | | | | | | | | | | |
TOTAL SOVEREIGN BONDS
(cost $231,077) | | | | 228,504 | |
| | | | | | | | | | | | | | | | |
See Notes to Financial Statements.
| | | | |
| PGIM Day One Underlying Funds | | | 61 | |
PGIM Core Conservative Bond Fund
Schedule of Investments (continued)
as of July 31, 2018
| | | | | | | | | | | | | | | | |
| Description | | Interest
Rate | | | Maturity
Date | | | Principal
Amount (000)# | | | Value | |
U.S. GOVERNMENT AGENCY OBLIGATIONS 28.1% | | | | | | | | | | | | | | | | |
Federal Home Loan Banks | | | 1.375 | % | | | 09/28/20 | | | | 120 | | | $ | 116,596 | |
Federal Home Loan Banks | | | 2.125 | | | | 02/11/20 | | | | 40 | | | | 39,675 | |
Federal Home Loan Mortgage Corp. | | | 1.375 | | | | 08/15/19 | | | | 60 | | | | 59,323 | |
Federal Home Loan Mortgage Corp. | | | 1.500 | | | | 01/17/20 | | | | 40 | | | | 39,382 | |
Federal Home Loan Mortgage Corp. | | | 2.000 | | | | 01/01/32 | | | | 83 | | | | 77,882 | |
Federal Home Loan Mortgage Corp. | | | 2.375 | | | | 02/16/21 | | | | 55 | | | | 54,429 | |
Federal Home Loan Mortgage Corp. | | | 2.500 | | | | 07/01/31 | | | | 208 | | | | 201,394 | |
Federal Home Loan Mortgage Corp. | | | 3.000 | | | | 01/01/37 | | | | 27 | | | | 26,943 | |
Federal Home Loan Mortgage Corp. | | | 3.000 | | | | 12/01/37 | | | | 48 | | | | 46,672 | |
Federal Home Loan Mortgage Corp. | | | 3.000 | | | | 12/01/42 | | | | 200 | | | | 193,937 | |
Federal Home Loan Mortgage Corp. | | | 3.000 | | | | 11/01/46 | | | | 88 | | | | 84,859 | |
Federal Home Loan Mortgage Corp. | | | 3.000 | | | | 01/01/47 | | | | 158 | | | | 151,844 | |
Federal Home Loan Mortgage Corp. | | | 3.500 | | | | TBA | | | | 250 | | | | 247,286 | |
Federal Home Loan Mortgage Corp. | | | 3.500 | | | | 06/01/42 | | | | 71 | | | | 71,167 | |
Federal Home Loan Mortgage Corp. | | | 3.500 | | | | 04/01/46 | | | | 129 | | | | 128,616 | |
Federal Home Loan Mortgage Corp. | | | 3.500 | | | | 11/01/47 | | | | 145 | | | | 143,700 | |
Federal Home Loan Mortgage Corp. | | | 4.000 | | | | 10/01/45 | | | | 114 | | | | 116,088 | |
Federal Home Loan Mortgage Corp. | | | 4.000 | | | | 05/01/46 | | | | 222 | | | | 226,077 | |
Federal Home Loan Mortgage Corp. | | | 4.500 | | | | TBA | | | | 250 | | | | 258,821 | |
Federal National Mortgage Assoc. | | | 1.875 | | | | 09/24/26 | | | | 140 | | | | 127,217 | |
Federal National Mortgage Assoc. | | | 2.000 | | | | 10/05/22 | | | | 25 | | | | 24,100 | |
Federal National Mortgage Assoc. | | | 2.375 | | | | 01/19/23 | | | | 25 | | | | 24,429 | |
Federal National Mortgage Assoc. | | | 2.500 | | | | 04/13/21 | | | | 30 | | | | 29,741 | |
Federal National Mortgage Assoc. | | | 2.500 | | | | 09/01/46 | | | | 84 | | | | 78,403 | |
Federal National Mortgage Assoc. | | | 2.750 | | | | 06/22/21 | | | | 70 | | | | 69,838 | |
Federal National Mortgage Assoc. | | | 3.000 | | | | 01/01/30 | | | | 261 | | | | 260,089 | |
Federal National Mortgage Assoc. | | | 3.000 | | | | 12/01/36 | | | | 89 | | | | 87,289 | |
Federal National Mortgage Assoc. | | | 3.000 | | | | 10/01/42 | | | | 32 | | | | 31,044 | |
Federal National Mortgage Assoc. | | | 3.000 | | | | 02/01/43 | | | | 416 | | | | 403,956 | |
Federal National Mortgage Assoc. | | | 3.000 | | | | 04/01/43 | | | | 138 | | | | 133,697 | |
Federal National Mortgage Assoc. | | | 3.000 | | | | 01/01/47 | | | | 482 | | | | 464,873 | |
Federal National Mortgage Assoc. | | | 3.500 | | | | TBA | | | | 250 | | | | 251,924 | |
Federal National Mortgage Assoc. | | | 3.500 | | | | 08/01/31 | | | | 75 | | | | 76,159 | |
Federal National Mortgage Assoc. | | | 3.500 | | | | 12/01/32 | | | | 99 | | | | 99,623 | |
Federal National Mortgage Assoc. | | | 3.500 | | | | 01/01/42 | | | | 215 | | | | 214,930 | |
Federal National Mortgage Assoc. | | | 3.500 | | | | 03/01/42 | | | | 203 | | | | 202,544 | |
Federal National Mortgage Assoc. | | | 3.500 | | | | 11/01/42 | | | | 118 | | | | 117,418 | |
Federal National Mortgage Assoc. | | | 3.500 | | | | 08/01/43 | | | | 165 | | | | 164,709 | |
Federal National Mortgage Assoc. | | | 3.500 | | | | 03/01/45 | | | | 379 | | | | 377,050 | |
Federal National Mortgage Assoc. | | | 3.500 | | | | 01/01/46 | | | | 84 | | | | 83,488 | |
Federal National Mortgage Assoc. | | | 3.500 | | | | 12/01/46 | | | | 91 | | | | 90,822 | |
Federal National Mortgage Assoc. | | | 3.500 | | | | 01/01/47 | | | | 172 | | | | 170,622 | |
Federal National Mortgage Assoc. | | | 4.000 | | | | TBA | | | | 750 | | | | 760,781 | |
See Notes to Financial Statements.
| | | | | | | | | | | | | | | | |
| Description | | Interest
Rate | | | Maturity
Date | | | Principal
Amount (000)# | | | Value | |
U.S. GOVERNMENT AGENCY OBLIGATIONS (Continued) | | | | | | | | | | | | | | | | |
Federal National Mortgage Assoc. | | | 4.000 | % | | | 01/01/41 | | | | 343 | | | $ | 351,250 | |
Federal National Mortgage Assoc. | | | 4.000 | | | | 04/01/41 | | | | 186 | | | | 189,921 | |
Federal National Mortgage Assoc. | | | 4.500 | | | | 03/01/41 | | | | 175 | | | | 183,091 | |
Federal National Mortgage Assoc. | | | 4.500 | | | | 02/01/44 | | | | 197 | | | | 205,631 | |
Federal National Mortgage Assoc. | | | 4.500 | | | | 01/01/45 | | | | 200 | | | | 208,571 | |
Federal National Mortgage Assoc. | | | 5.000 | | | | 11/01/35 | | | | 213 | | | | 227,298 | |
Federal National Mortgage Assoc. | | | 5.000 | | | | 06/01/40 | | | | 56 | | | | 59,920 | |
Federal National Mortgage Assoc. | | | 5.000 | | | | 03/01/42 | | | | 105 | | | | 112,003 | |
Government National Mortgage Assoc. | | | 2.500 | | | | 12/20/46 | | | | 44 | | | | 41,733 | |
Government National Mortgage Assoc. | | | 3.000 | | | | 01/20/43 | | | | 197 | | | | 193,965 | |
Government National Mortgage Assoc. | | | 3.000 | | | | 04/20/45 | | | | 120 | | | | 117,523 | |
Government National Mortgage Assoc. | | | 3.000 | | | | 07/20/46 | | | | 214 | | | | 209,360 | |
Government National Mortgage Assoc. | | | 3.000 | | | | 09/20/46 | | | | 214 | | | | 209,361 | |
Government National Mortgage Assoc. | | | 3.000 | | | | 11/20/46 | | | | 149 | | | | 145,485 | |
Government National Mortgage Assoc. | | | 3.500 | | | | 12/20/42 | | | | 391 | | | | 394,684 | |
Government National Mortgage Assoc. | | | 3.500 | | | | 01/20/44 | | | | 131 | | | | 132,161 | |
Government National Mortgage Assoc. | | | 3.500 | | | | 04/20/45 | | | | 89 | | | | 89,552 | |
Government National Mortgage Assoc. | | | 3.500 | | | | 07/20/46 | | | | 331 | | | | 331,277 | |
Government National Mortgage Assoc. | | | 4.000 | | | | 12/20/45 | | | | 235 | | | | 242,551 | |
Government National Mortgage Assoc. | | | 4.000 | | | | 10/20/46 | | | | 15 | | | | 15,488 | |
Government National Mortgage Assoc. | | | 4.000 | | | | 03/20/47 | | | | 160 | | | | 164,423 | |
Government National Mortgage Assoc. | | | 4.500 | | | | 04/20/41 | | | | 40 | | | | 42,003 | |
Government National Mortgage Assoc. | | | 4.500 | | | | 12/20/44 | | | | 93 | | | | 97,368 | |
Government National Mortgage Assoc. | | | 4.500 | | | | 11/20/46 | | | | 63 | | | | 67,066 | |
Government National Mortgage Assoc. | | | 4.500 | | | | 01/20/47 | | | | 19 | | | | 20,286 | |
Government National Mortgage Assoc. | | | 5.000 | | | | 04/20/45 | | | | 65 | | | | 69,149 | |
Government National Mortgage Assoc. | | | 5.500 | | | | 12/15/33 | | | | 25 | | | | 27,524 | |
Tennessee Valley Authority, Sr. Unsec’d. Notes | | | 2.250 | | | | 03/15/20 | | | | 80 | | | | 79,396 | |
| | | | | | | | | | | | | | | | |
TOTAL U.S. GOVERNMENT AGENCY OBLIGATIONS
(cost $11,083,712) | | | | | | | | | | | | | | | 10,857,477 | |
| | | | | | | | | | | | | | | | |
|
U.S. TREASURY OBLIGATIONS 39.4% | |
U.S. Treasury Bonds | | | 2.750 | | | | 08/15/47 | | | | 115 | | | | 107,615 | |
U.S. Treasury Bonds | | | 2.875 | | | | 08/15/45 | | | | 500 | | | | 480,801 | |
U.S. Treasury Bonds | | | 2.875 | | | | 11/15/46 | | | | 245 | | | | 235,248 | |
U.S. Treasury Bonds | | | 3.000 | | | | 11/15/44 | | | | 150 | | | | 147,768 | |
U.S. Treasury Bonds | | | 3.000 | | | | 05/15/45 | | | | 990 | | | | 975,150 | |
U.S. Treasury Bonds | | | 3.000 | | | | 02/15/48 | | | | 55 | | | | 54,108 | |
U.S. Treasury Bonds | | | 3.625 | | | | 08/15/43 | | | | 415 | | | | 454,214 | |
U.S. Treasury Bonds | | | 3.750 | | | | 11/15/43 | | | | 130 | | | | 145,199 | |
U.S. Treasury Notes | | | 1.000 | | | | 11/15/19 | | | | 445 | | | | 436,309 | |
U.S. Treasury Notes | | | 1.250 | | | | 06/30/19 | | | | 25 | | | | 24,732 | |
U.S. Treasury Notes | | | 1.375 | | | | 09/30/19 | | | | 890 | | | | 878,354 | |
See Notes to Financial Statements.
| | | | |
| PGIM Day One Underlying Funds | | | 63 | |
PGIM Core Conservative Bond Fund
Schedule of Investments (continued)
as of July 31, 2018
| | | | | | | | | | | | | | | | |
| Description | | Interest
Rate | | | Maturity
Date | | | Principal
Amount (000)# | | | Value | |
U.S. TREASURY OBLIGATIONS (Continued) | |
U.S. Treasury Notes | | | 1.375 | % | | | 08/31/20 | | | | 940 | | | $ | 915,068 | |
U.S. Treasury Notes | | | 1.375 | | | | 04/30/21 | | | | 520 | | | | 501,109 | |
U.S. Treasury Notes | | | 1.375 | | | | 05/31/21 | | | | 625 | | | | 601,440 | |
U.S. Treasury Notes | | | 1.625 | | | | 12/31/19 | | | | 510 | | | | 503,326 | |
U.S. Treasury Notes | | | 1.625 | | | | 06/30/20 | | | | 935 | | | | 916,884 | |
U.S. Treasury Notes | | | 1.625 | | | | 04/30/23 | | | | 125 | | | | 118,262 | |
U.S. Treasury Notes | | | 1.875 | | | | 03/31/22 | | | | 40 | | | | 38,705 | |
U.S. Treasury Notes | | | 1.875 | | | | 04/30/22 | | | | 525 | | | | 507,609 | |
U.S. Treasury Notes | | | 1.875 | | | | 09/30/22 | | | | 817 | | | | 786,586 | |
U.S. Treasury Notes | | | 2.000 | | | | 11/30/20 | | | | 1,240 | | | | 1,219,850 | |
U.S. Treasury Notes | | | 2.000 | | | | 02/15/25 | | | | 90 | | | | 85,071 | |
U.S. Treasury Notes | | | 2.125 | | | | 09/30/21 | | | | 400 | | | | 392,094 | |
U.S. Treasury Notes | | | 2.125 | | | | 06/30/22 | | | | 180 | | | | 175,437 | |
U.S. Treasury Notes | | | 2.125 | | | | 05/15/25 | | | | 765 | | | | 727,348 | |
U.S. Treasury Notes | | | 2.250 | | | | 02/15/27 | | | | 295 | | | | 279,363 | |
U.S. Treasury Notes | | | 2.375 | | | | 08/15/24 | | | | 1,185 | | | | 1,150,376 | |
U.S. Treasury Notes | | | 2.625 | | | | 07/31/20 | | | | 275 | | | | 274,753 | |
U.S. Treasury Notes | | | 2.625 | | | | 11/15/20 | | | | 590 | | | | 588,663 | |
U.S. Treasury Notes | | | 2.625 | | | | 07/15/21 | | | | 1,000 | | | | 996,016 | |
U.S. Treasury Notes | | | 2.750 | | | | 07/31/23 | | | | 200 | | | | 199,078 | |
U.S. Treasury Notes | | | 2.875 | | | | 07/31/25 | | | | 60 | | | | 59,798 | |
U.S. Treasury Notes | | | 2.875 | | | | 05/15/28 | | | | 245 | | | | 243,124 | |
| | | | | | | | | | | | | | | | |
TOTAL U.S. TREASURY OBLIGATIONS
(cost $15,452,460) | | | | | | | | | | | | | | | 15,219,458 | |
| | | | | | | | | | | | | | | | |
TOTAL LONG-TERM INVESTMENTS
(cost $39,039,025) | | | | | | | | | | | | | | | 38,258,330 | |
| | | | | | | | | | | | | | | | |
| | | | |
| | | | | | | | | Shares | | | | |
| | | | |
SHORT-TERM INVESTMENT 5.7% | | | | | | | | | | | | | | | | |
| | | | |
AFFILIATED MUTUAL FUND | | | | | | | | | | | | | | | | |
PGIM Core Ultra Short Bond Fund
(cost $2,184,942)(w) | | | | | | | | | | | 2,184,942 | | �� | | 2,184,942 | |
| | | | | | | | | | | | | | | | |
TOTAL INVESTMENTS 104.8%
(cost $41,223,967) | | | | | | | | | | | | | | | 40,443,272 | |
Liabilities in excess of other assets (4.8)% | | | | | | | | | | | | | | | (1,851,458 | ) |
| | | | | | | | | | | | | | | | |
NET ASSETS 100.0% | | | | | | | | | | | | | | $ | 38,591,814 | |
| | | | | | | | | | | | | | | | |
See the Glossary for abbreviations used in the annual report.
See Notes to Financial Statements.
| # | Principal amount is shown in U.S. dollars unless otherwise stated. |
| (cc) | Variable rate instrument. The rate shown is based on the latest available information as of July 31, 2018. Certain variable rate securities are not based on a published reference rate and spread but are determined by the issuer or agent and are based on current market conditions. These securities do not indicate a reference rate and spread in their description. |
| (w) | PGIM Investments LLC, the manager of the Fund, also serves as manager of the PGIM Core Ultra Short Bond Fund. |
Fair Value Measurements:
Various inputs are used in determining the value of the Fund’s investments. These inputs are summarized in the three broad levels listed below.
Level 1—unadjusted quoted prices generally in active markets for identical securities.
Level 2—quoted prices for similar securities, interest rates and yield curves, prepayment speeds, foreign currency exchange rates and other observable inputs.
Level 3—unobservable inputs for securities valued in accordance with Board approved fair valuation procedures.
The following is a summary of the inputs used as of July 31, 2018 in valuing such portfolio securities:
| | | | | | | | | | | | |
| | | Level 1 | | | Level 2 | | | Level 3 | |
Investments in Securities | | | | | | | | | | | | |
Asset-Backed Security | | | | | | | | | | | | |
Credit Card | | $ | — | | | $ | 100,278 | | | $ | — | |
Commercial Mortgage-Backed Securities | | | — | | | | 1,659,574 | | | | — | |
Corporate Bonds | | | — | | | | 9,807,896 | | | | — | |
Municipal Bonds | | | — | | | | 385,143 | | | | — | |
Sovereign Bonds | | | — | | | | 228,504 | | | | — | |
U.S. Government Agency Obligations | | | — | | | | 10,857,477 | | | | — | |
U.S. Treasury Obligations | | | — | | | | 15,219,458 | | | | — | |
Affiliated Mutual Fund | | | 2,184,942 | | | | — | | | | — | |
| | | | | | | | | | | | |
Total | | $ | 2,184,942 | | | $ | 38,258,330 | | | $ | — | |
| | | | | | | | | | | | |
During the period, there were no transfers between Level 1, Level 2 and Level 3 to report.
Industry Classification:
The industry classification of investments and liabilities in excess of other assets shown as a percentage of net assets as of July 31, 2018 were as follows (unaudited):
| | | | |
U.S. Treasury Obligations | | | 39.4 | % |
U.S. Government Agency Obligations | | | 28.1 | |
Affiliated Mutual Fund | | | 5.7 | |
Banks | | | 5.4 | |
Commercial Mortgage-Backed Securities | | | 4.3 | |
Oil & Gas | | | 1.7 | |
Electric | | | 1.6 | |
Healthcare-Services | | | 1.6 | |
Pharmaceuticals | | | 1.5 | % |
Media | | | 1.2 | |
Software | | | 1.1 | |
Telecommunications | | | 1.1 | |
Municipal Bonds | | | 1.0 | |
Computers | | | 0.8 | |
Pipelines | | | 0.7 | |
Healthcare-Products | | | 0.7 | |
See Notes to Financial Statements.
| | | | |
| PGIM Day One Underlying Funds | | | 65 | |
PGIM Core Conservative Bond Fund
Schedule of Investments (continued)
as of July 31, 2018
Industry Classification (continued):
| | | | |
Insurance | | | 0.7 | % |
Retail | | | 0.6 | |
Miscellaneous Manufacturing | | | 0.6 | |
Beverages | | | 0.6 | |
Aerospace & Defense | | | 0.6 | |
Sovereign Bonds | | | 0.6 | |
Chemicals | | | 0.6 | |
Biotechnology | | | 0.5 | |
Auto Manufacturers | | | 0.5 | |
Agriculture | | | 0.5 | |
Transportation | | | 0.5 | |
Diversified Financial Services | | | 0.4 | |
Real Estate Investment Trusts (REITs) | | | 0.4 | |
Forest Products & Paper | | | 0.3 | |
Credit Card | | | 0.3 | |
Machinery-Diversified | | | 0.2 | |
Foods | | | 0.1 | |
Gas | | | 0.1 | |
| | | | |
Mining | | | 0.1 | % |
Airlines | | | 0.1 | |
Machinery-Construction & Mining | | | 0.1 | |
Lodging | | | 0.1 | |
Oil & Gas Services | | | 0.1 | |
Commercial Services | | | 0.1 | |
Textiles | | | 0.1 | |
Semiconductors | | | 0.1 | |
Internet | | | 0.0 | * |
Building Materials | | | 0.0 | * |
| | | | |
| | | 104.8 | |
Liabilities in excess of other assets | | | (4.8 | ) |
| | | | |
| | | 100.0 | % |
| | | | |
See Notes to Financial Statements.
PGIM Core Conservative Bond Fund
Statement of Assets & Liabilities
as of July 31, 2018
| | | | |
Assets | | | | |
Investments at value: | | | | |
Unaffiliated investments (cost $39,039,025) | | $ | 38,258,330 | |
Affiliated investments (cost $2,184,942) | | | 2,184,942 | |
Receivable for investments sold | | | 2,123,810 | |
Interest receivable | | | 225,016 | |
Receivable for Fund shares sold | | | 73,879 | |
| | | | |
Total Assets | | | 42,865,977 | |
| | | | |
| |
Liabilities | | | | |
Payable for investments purchased | | | 4,178,833 | |
Accrued expenses and other liabilities | | | 80,902 | |
Management fee payable | | | 10,317 | |
Shareholders’ reports payable | | | 3,594 | |
Payable for Fund shares reacquired | | | 471 | |
Affiliated transfer agent fee payable | | | 46 | |
| | | | |
Total Liabilities | | | 4,274,163 | |
| | | | |
| |
Net Assets | | $ | 38,591,814 | |
| | | | |
| | | | | |
Net assets were comprised of: | | | | |
Shares of beneficial interest, at par | | $ | 3,993 | |
Paid-in capital in excess of par | | | 39,778,806 | |
| | | | |
| | | 39,782,799 | |
Undistributed net investment income | | | 2,355 | |
Accumulated net realized loss on investment transactions | | | (412,645 | ) |
Net unrealized depreciation on investments | | | (780,695 | ) |
| | | | |
Net assets, July 31, 2018 | | $ | 38,591,814 | |
| | | | |
| |
Class R6 | | | | |
Net asset value, offering price and redemption price per share,
($38,591,814 ÷ 3,992,964 shares of beneficial interest issued and outstanding) | | $ | 9.66 | |
| | | | |
See Notes to Financial Statements.
| | | | |
| PGIM Day One Underlying Funds | | | 67 | |
PGIM Core Conservative Bond Fund
Statement of Operations
Year Ended July 31, 2018
| | | | |
Net Investment Income (Loss) | | | | |
Income | | | | |
Interest income | | $ | 883,760 | |
Affiliated dividend income | | | 21,414 | |
| | | | |
Total income | | | 905,174 | |
| | | | |
| |
Expenses | | | | |
Management fee | | | 93,791 | |
Custodian and accounting fees | | | 61,150 | |
Audit fee | | | 55,550 | |
Legal fees and expenses | | | 19,599 | |
Shareholders’ reports | | | 14,491 | |
Trustees’ fees | | | 12,393 | |
Transfer agent’s fees and expenses (including affiliated expense of $ 281) | | | 365 | |
Registration fees | | | 63 | |
Miscellaneous | | | 13,386 | |
| | | | |
Total expenses | | | 270,788 | |
Less: Fee waiver and/or expense reimbursement | | | (97,101 | ) |
| | | | |
Net expenses | | | 173,687 | |
| | | | |
Net investment income (loss) | | | 731,487 | |
| | | | |
| |
Realized And Unrealized Gain (Loss) On Investments | | | | |
Net realized gain (loss) on investment transactions | | | (160,312 | ) |
Net change in unrealized appreciation (depreciation) on investments | | | (1,017,783 | ) |
| | | | |
Net gain (loss) on investment transactions | | | (1,178,095 | ) |
| | | | |
Net Increase (Decrease) In Net Assets Resulting From Operations | | $ | (446,608 | ) |
| | | | |
See Notes to Financial Statements.
PGIM Core Conservative Bond Fund
Statements of Changes in Net Assets
| | | | | | | | |
| | | Year Ended July 31, 2018 | | | November 15, 2016*
through July 31, 2017 | |
Increase (Decrease) in Net Assets | | | | | | | | |
Operations | | | | | | | | |
Net investment income (loss) | | $ | 731,487 | | | $ | 314,116 | |
Net realized gain (loss) on investment transactions | | | (160,312 | ) | | | (76,821 | ) |
Net change in unrealized appreciation (depreciation) on investments | | | (1,017,783 | ) | | | 237,088 | |
| | | | | | | | |
Net increase (decrease) in net assets resulting from operations | | | (446,608 | ) | | | 474,383 | |
| | | | | | | | |
| | |
Dividends from net investment income | | | | | | | | |
Class R6 | | | (853,604 | ) | | | (365,156 | ) |
| | | | | | | | |
| | |
Fund share transactions | | | | | | | | |
Net proceeds from shares sold | | | 10,806,386 | | | | 31,148,943 | |
Net asset value of shares issued in reinvestment of dividends | | | 853,603 | | | | 365,155 | |
Cost of shares reacquired | | | (3,125,416 | ) | | | (265,872 | ) |
| | | | | | | | |
Net increase (decrease) in net assets from Fund share transactions | | | 8,534,573 | | | | 31,248,226 | |
| | | | | | | | |
Total increase (decrease) | | | 7,234,361 | | | | 31,357,453 | |
| | |
Net Assets: | | | | | | | | |
Beginning of period | | | 31,357,453 | | | | — | |
| | | | | | | | |
End of period(a) | | $ | 38,591,814 | | | $ | 31,357,453 | |
| | | | | | | | |
(a) Includes undistributed/(distributions in excess of) net investment income of: | | $ | 2,355 | | | $ | 1,844 | |
| | | | | | | | |
| * | Commencement of operations. |
See Notes to Financial Statements.
| | | | |
| PGIM Day One Underlying Funds | | | 69 | |
PGIM TIPS Fund
Schedule of Investments
as of July 31, 2018
| | | | | | | | | | | | | | | | |
| Description | | Interest
Rate | | | Maturity
Date | | | Principal
Amount (000)# | | | Value | |
LONG-TERM INVESTMENTS 98.8% | | | | | | | | | | | | | | | | |
| | | | |
U.S. TREASURY OBLIGATIONS | | | | | | | | | | | | | | | | |
U.S. Treasury Inflation Indexed Bonds, TIPS | | | 0.125 | % | | | 04/15/20 | | | | 1,360 | | | $ | 1,438,500 | |
U.S. Treasury Inflation Indexed Bonds, TIPS | | | 0.125 | | | | 04/15/21 | | | | 1,205 | | | | 1,250,911 | |
U.S. Treasury Inflation Indexed Bonds, TIPS | | | 0.125 | | | | 01/15/22 | | | | 1,560 | | | | 1,690,880 | |
U.S. Treasury Inflation Indexed Bonds, TIPS | | | 0.125 | | | | 04/15/22 | | | | 825 | | | | 829,738 | |
U.S. Treasury Inflation Indexed Bonds, TIPS | | | 0.125 | | | | 01/15/23 | | | | 1,905 | | | | 2,013,133 | |
U.S. Treasury Inflation Indexed Bonds, TIPS | | | 0.250 | | | | 01/15/25 | | | | 1,520 | | | | 1,555,801 | |
U.S. Treasury Inflation Indexed Bonds, TIPS | | | 0.375 | | | | 01/15/27 | | | | 745 | | | | 745,307 | |
U.S. Treasury Inflation Indexed Bonds, TIPS | | | 0.625 | | | | 04/15/23 | | | | 275 | | | | 275,689 | |
U.S. Treasury Inflation Indexed Bonds, TIPS | | | 0.625 | | | | 01/15/24 | | | | 1,175 | | | | 1,253,899 | |
U.S. Treasury Inflation Indexed Bonds, TIPS | | | 0.625 | | | | 01/15/26 | | | | 1,160 | | | | 1,208,904 | |
U.S. Treasury Inflation Indexed Bonds, TIPS | | | 0.625 | | | | 02/15/43 | | | | 45 | | | | 45,897 | |
U.S. Treasury Inflation Indexed Bonds, TIPS | | | 0.750 | | | | 02/15/42 | | | | 140 | | | | 149,906 | |
U.S. Treasury Inflation Indexed Bonds, TIPS | | | 0.750 | | | | 02/15/45 | | | | 795 | | | | 811,253 | |
U.S. Treasury Inflation Indexed Bonds, TIPS | | | 0.875 | | | | 02/15/47 | | | | 90 | | | | 92,293 | |
U.S. Treasury Inflation Indexed Bonds, TIPS | | | 1.000 | | | | 02/15/46 | | | | 350 | | | | 376,752 | |
U.S. Treasury Inflation Indexed Bonds, TIPS | | | 1.000 | | | | 02/15/48 | | | | 295 | | | | 305,733 | |
U.S. Treasury Inflation Indexed Bonds, TIPS | | | 1.125 | | | | 01/15/21 | | | | 575 | | | | 665,057 | |
U.S. Treasury Inflation Indexed Bonds, TIPS | | | 1.250 | | | | 07/15/20 | | | | 160 | | | | 186,501 | |
U.S. Treasury Inflation Indexed Bonds, TIPS | | | 1.375 | | | | 01/15/20 | | | | 370 | | | | 433,056 | |
U.S. Treasury Inflation Indexed Bonds, TIPS | | | 1.375 | | | | 02/15/44 | | | | 815 | | | | 967,272 | |
U.S. Treasury Inflation Indexed Bonds, TIPS | | | 1.750 | | | | 01/15/28 | | | | 355 | | | | 459,967 | |
U.S. Treasury Inflation Indexed Bonds, TIPS | | | 2.000 | | | | 01/15/26 | | | | 710 | | | | 974,950 | |
U.S. Treasury Inflation Indexed Bonds, TIPS | | | 2.125 | | | | 02/15/40 | | | | 165 | | | | 237,764 | |
U.S. Treasury Inflation Indexed Bonds, TIPS | | | 2.125 | | | | 02/15/41 | | | | 140 | | | | 200,608 | |
U.S. Treasury Inflation Indexed Bonds, TIPS | | | 2.375 | | | | 01/15/25 | | | | 1,190 | | | | 1,742,693 | |
U.S. Treasury Inflation Indexed Bonds, TIPS | | | 2.375 | | | | 01/15/27 | | | | 400 | | | | 560,703 | |
U.S. Treasury Inflation Indexed Bonds, TIPS | | | 2.500 | | | | 01/15/29 | | | | 625 | | | | 849,795 | |
U.S. Treasury Inflation Indexed Bonds, TIPS | | | 3.625 | | | | 04/15/28 | | | | 520 | | | | 1,013,983 | |
U.S. Treasury Inflation Indexed Bonds, TIPS | | | 3.875 | | | | 04/15/29 | | | | 535 | | | | 1,065,391 | |
| | | | | | | | | | | | | | | | |
TOTAL LONG-TERM INVESTMENTS
(cost $23,760,103) | | | | | | | | | | | | | | | 23,402,336 | |
| | | | | | | | | | | | | | | | |
See Notes to Financial Statements.
| | | | | | | | | | | | | | | | |
| Description | | | | | | | | Shares | | | Value | |
SHORT-TERM INVESTMENT 1.2% | | | | | | | | | | | | | | | | |
| | | | |
AFFILIATED MUTUAL FUND | | | | | | | | | | | | | | | | |
PGIM Core Ultra Short Bond Fund
(cost $300,948)(w) | | | | | | | | | | | 300,948 | | | $ | 300,948 | |
| | | | | | | | | | | | | | | | |
TOTAL INVESTMENTS 100.0%
(cost $24,061,051) | | | | | | | | | | | | | | | 23,703,284 | |
Liabilities in excess of other assets (0.0)% | | | | | | | | | | | | | | | (10,666 | ) |
| | | | | | | | | | | | | | | | |
NET ASSETS 100.0% | | | | | | | | | | | | | | $ | 23,692,618 | |
| | | | | | | | | | | | | | | | |
See the Glossary for abbreviations used in the annual report.
| # | Principal amount is shown in U.S. dollars unless otherwise stated. |
| (w) | PGIM Investments LLC, the manager of the Fund, also serves as manager of the PGIM Core Ultra Short Bond Fund. |
Fair Value Measurements:
Various inputs are used in determining the value of the Fund’s investments. These inputs are summarized in the three broad levels listed below.
Level 1—unadjusted quoted prices generally in active markets for identical securities.
Level 2—quoted prices for similar securities, interest rates and yield curves, prepayment speeds, foreign currency exchange rates and other observable inputs.
Level 3—unobservable inputs for securities valued in accordance with Board approved fair valuation procedures.
The following is a summary of the inputs used as of July 31, 2018 in valuing such portfolio securities:
| | | | | | | | | | | | |
| | | Level 1 | | | Level 2 | | | Level 3 | |
Investments in Securities | | | | | | | | | | | | |
U.S. Treasury Obligations | | $ | — | | | $ | 23,402,336 | | | $ | — | |
Affiliated Mutual Fund | | | 300,948 | | | | — | | | | — | |
| | | | | | | | | | | | |
Total | | $ | 300,948 | | | $ | 23,402,336 | | | $ | — | |
| | | | | | | | | | | | |
During the period, there were no transfers between Level 1, Level 2 and Level 3 to report.
See Notes to Financial Statements.
| | | | |
| PGIM Day One Underlying Funds | | | 71 | |
PGIM TIPS Fund
Schedule of Investments (continued)
as of July 31, 2018
Sector Allocations:
The sector allocations of investments and liabilities in excess of other assets shown as a percentage of net assets as of July 31, 2018 were as follows (unaudited):
| | | | |
U.S. Treasury Obligations | | | 98.8 | % |
Affiliated Mutual Fund | | | 1.2 | |
| | | | |
| | | 100.0 | |
Liabilities in excess of other assets | | | — | * |
| | | | |
| | | 100.0 | % |
| | | | |
See Notes to Financial Statements.
PGIM TIPS Fund
Statement of Assets & Liabilities
as of July 31, 2018
| | | | |
Assets | | | | |
Investments at value: | | | | |
Unaffiliated investments (cost $23,760,103) | | $ | 23,402,336 | |
Affiliated investments (cost $300,948) | | | 300,948 | |
Receivable for investments sold | | | 327,991 | |
Receivable for Fund shares sold | | | 245,395 | |
Dividends and interest receivable | | | 42,257 | |
Due from Manager | | | 7,605 | |
| | | | |
Total Assets | | | 24,326,532 | |
| | | | |
| |
Liabilities | | | | |
Payable for investments purchased | | | 578,640 | |
Audit fee payable | | | 32,320 | |
Accrued expenses and other liabilities | | | 18,458 | |
Shareholders’ reports payable | | | 3,615 | |
Payable for Fund shares reacquired | | | 839 | |
Affiliated transfer agent fee payable | | | 42 | |
| | | | |
Total Liabilities | | | 633,914 | |
| | | | |
| |
Net Assets | | $ | 23,692,618 | |
| | | | |
| | | | | |
Net assets were comprised of: | | | | |
Shares of beneficial interest, at par | | $ | 2,465 | |
Paid-in capital in excess of par | | | 24,310,240 | |
| | | | |
| | | 24,312,705 | |
Undistributed net investment income | | | 11,790 | |
Accumulated net realized loss on investment transactions | | | (274,457 | ) |
Net unrealized depreciation on investments and foreign currencies | | | (357,420 | ) |
| | | | |
Net assets, July 31, 2018 | | $ | 23,692,618 | |
| | | | |
| |
Class R6 | | | | |
Net asset value, offering price and redemption price per share,
($23,692,618 ÷ 2,464,862 shares of beneficial interest issued and outstanding) | | $ | 9.61 | |
| | | | |
See Notes to Financial Statements.
| | | | |
| PGIM Day One Underlying Funds | | | 73 | |
PGIM TIPS Fund
Statement of Operations
Year Ended July 31, 2018
| | | | |
Net Investment Income (Loss) | | | | |
Income | | | | |
Interest income | | $ | 641,533 | |
Affiliated dividend income | | | 1,922 | |
| | | | |
Total income | | | 643,455 | |
| | | | |
| |
Expenses | | | | |
Management fee | | | 45,806 | |
Custodian and accounting fees | | | 50,056 | |
Audit fee | | | 32,320 | |
Legal fees and expenses | | | 19,553 | |
Shareholders’ reports | | | 14,565 | |
Trustees’ fees | | | 12,233 | |
Commitment fee on syndicated credit agreement | | | 2,136 | |
Insurance expenses | | | 1,000 | |
Transfer agent’s fees and expenses (including affiliated expense of $271) | | | 352 | |
Registration fees | | | 63 | |
Miscellaneous | | | 8,848 | |
| | | | |
Total expenses | | | 186,932 | |
Less: Fee waiver and/or expense reimbursement | | | (107,153 | ) |
| | | | |
Net expenses | | | 79,779 | |
| | | | |
Net investment income (loss) | | | 563,676 | |
| | | | |
| |
Realized And Unrealized Gain (Loss) On Investment And Foreign Currency Transactions | | | | |
Net realized gain (loss) on investment transactions | | | (98,092 | ) |
| | | | |
Net change in unrealized appreciation (depreciation) on: | | | | |
Investments | | | (370,556 | ) |
Foreign currencies | | | 347 | |
| | | | |
| | | (370,209 | ) |
| | | | |
Net gain (loss) on investment and foreign currency transactions | | | (468,301 | ) |
| | | | |
Net Increase (Decrease) In Net Assets Resulting From Operations | | $ | 95,375 | |
| | | | |
See Notes to Financial Statements.
PGIM TIPS Fund
Statements of Changes in Net Assets
| | | | | | | | |
| | | Year Ended July 31, 2018 | | | November 15, 2016*
through July 31, 2017 | |
Increase (Decrease) in Net Assets | | | | | | | | |
Operations | | | | | | | | |
Net investment income (loss) | | $ | 563,676 | | | $ | 81,759 | |
Net realized gain (loss) on investment transactions | | | (98,092 | ) | | | (6,674 | ) |
Net change in unrealized appreciation (depreciation) on investments and foreign currencies | | | (370,209 | ) | | | 12,789 | |
| | | | | | | | |
Net increase (decrease) in net assets resulting from operations | | | 95,375 | | | | 87,874 | |
| | | | | | | | |
| | |
Dividends from net investment income | | | | | | | | |
Class R6 | | | (687,732 | ) | | | (115,604 | ) |
| | | | | | | | |
| | |
Fund share transactions | | | | | | | | |
Net proceeds from shares sold | | | 18,258,971 | | | | 16,410,866 | |
Net asset value of shares issued in reinvestment of dividends | | | 687,633 | | | | 115,603 | |
Cost of shares reacquired | | | (10,672,380 | ) | | | (487,988 | ) |
| | | | | | | | |
Net increase (decrease) in net assets from Fund share transactions | | | 8,274,224 | | | | 16,038,481 | |
| | | | | | | | |
Total increase (decrease) | | | 7,681,867 | | | | 16,010,751 | |
| | |
Net Assets: | | | | | | | | |
Beginning of period | | | 16,010,751 | | | | — | |
| | | | | | | | |
End of period(a) | | $ | 23,692,618 | | | $ | 16,010,751 | |
| | | | | | | | |
(a) Includes undistributed/(distributions in excess of) net investment income of: | | $ | 11,790 | | | $ | 3,506 | |
| | | | | | | | |
| * | Commencement of operations. |
See Notes to Financial Statements.
| | | | |
| PGIM Day One Underlying Funds | | | 75 | |
PGIM QMA Commodity Strategies Fund
Consolidated Schedule of Investments
as of July 31, 2018
| | | | | | | | | | | | | | | | |
| Description | | | | | | | | Shares | | | Value | |
SHORT-TERM INVESTMENTS 100.9% | | | | | | | | | | | | | | | | |
| | | | |
UNAFFILIATED FUND 36.7% | | | | | | | | | | | | | | | | |
Dreyfus Treasury Securities Cash Management(bb)
(cost $6,681,827) | | | | | | | | | | | 6,681,827 | | | $ | 6,681,827 | |
| | | | | | | | | | | | | | | | |
| | | | |
| | | Interest
Rate | | | Maturity
Date | | | Principal
Amount (000)# | | | | |
U.S. TREASURY OBLIGATIONS(n) 64.2% | | | | | | | | | | | | | | | | |
U.S. Treasury Bills | | | 1.875 | % | | | 09/20/18 | (bb)(k) | | | 308 | | | | 307,490 | |
U.S. Treasury Bills | | | 1.887 | | | | 09/20/18 | (bb)(k) | | | 692 | | | | 689,882 | |
U.S. Treasury Bills | | | 1.887 | | | | 09/20/18 | | | | 2,929 | | | | 2,921,401 | |
U.S. Treasury Bills | | | 1.892 | | | | 09/20/18 | (bb)(k) | | | 1,200 | | | | 1,196,846 | |
U.S. Treasury Bills | | | 2.017 | | | | 09/20/18 | | | | 6,571 | | | | 6,553,628 | |
| | | | | | | | | | | | | | | | |
TOTAL U.S. TREASURY OBLIGATIONS
(cost $11,667,614) | | | | | | | | | | | | | | | 11,669,247 | |
| | | | | | | | | | | | | | | | |
TOTAL INVESTMENTS 100.9%
(cost $18,349,441) | | | | | | | | | | | | | | | 18,351,074 | |
Liabilities in excess of other assets(z) (0.9)% | | | | | | | | | | | | | | | (163,949 | ) |
| | | | | | | | | | | | | | | | |
NET ASSETS 100.0% | | | | | | | | | | | | | | $ | 18,187,125 | |
| | | | | | | | | | | | | | | | |
See the Glossary for abbreviations used in the annual report.
| # | Principal amount is shown in U.S. dollars unless otherwise stated. |
| (bb) | Represents security, or a portion thereof, held in the Cayman Subsidiary. |
| (k) | Represents security, or a portion thereof, segregated as collateral for centrally cleared/exchange-traded derivatives. |
| (n) | Rate shown is the effective yield at purchase date. |
| (z) | Includes net unrealized appreciation (depreciation) on the following derivative contracts held at reporting period end: |
Commodity futures contracts outstanding at July 31, 2018(1):
| | | | | | | | | | | | | | | | |
Number of
Contracts | | | Type | | Expiration
Date | | | Current
Notional
Amount | | | Value/
Unrealized
Appreciation
Depreciation | |
| | | | Long Positions: | | | | | | | | | | | | |
| | 21 | | | Brent Crude | | | Oct. 2018 | | | $ | 1,558,410 | | | $ | 1,550 | |
| | 6 | | | Coffee ‘C’ | | | Sep. 2018 | | | | 247,275 | | | | (20,100 | ) |
| | 17 | | | Copper | | | Sep. 2018 | | | | 1,203,387 | | | | (88,188 | ) |
| | 62 | | | Corn | | | Sep. 2018 | | | | 1,153,975 | | | | 29,763 | |
| | 7 | | | Cotton No. 2 | | | Dec. 2018 | | | | 313,565 | | | | 12,105 | |
| | 11 | | | Gasoline RBOB | | | Sep. 2018 | | | | 961,191 | | | | 2,726 | |
See Notes to Financial Statements.
Commodity futures contracts outstanding at July 31, 2018(1) (continued):
| | | | | | | | | | | | | | | | |
Number of
Contracts | | | Type | | Expiration
Date | | | Current
Notional
Amount | | | Value/
Unrealized
Appreciation
Depreciation | |
| | | | Long Positions (cont’d): | | | | | | | | | | | | |
| | 18 | | | Gold 100 OZ | | | Oct. 2018 | | | $ | 2,211,300 | | | $ | (1,800 | ) |
| | 10 | | | Hard Red Winter Wheat | | | Sep. 2018 | | | | 278,250 | | | | 21,475 | |
| | 24 | | | Lean Hogs | | | Oct. 2018 | | | | 486,960 | | | | (2,440 | ) |
| | 17 | | | Live Cattle | | | Oct. 2018 | | | | 743,240 | | | | (1,660 | ) |
| | 7 | | | LME Nickel | | | Aug. 2018 | | | | 586,026 | | | | 1,003 | |
| | 7 | | | LME Nickel | | | Sep. 2018 | | | | 587,475 | | | | 5,643 | |
| | 4 | | | LME Nickel | | | Dec. 2018 | | | | 338,016 | | | | 25,677 | |
| | 10 | | | LME PRI Aluminum | | | Aug. 2018 | | | | 516,812 | | | | (8,003 | ) |
| | 13 | | | LME PRI Aluminum | | | Sep. 2018 | | | | 674,619 | | | | (4,016 | ) |
| | 7 | | | LME PRI Aluminum | | | Dec. 2018 | | | | 365,487 | | | | (10,385 | ) |
| | 5 | | | LME Zinc | | | Aug. 2018 | | | | 329,500 | | | | (2,794 | ) |
| | 5 | | | LME Zinc | | | Sep. 2018 | | | | 329,125 | | | | 5,625 | |
| | 2 | | | LME Zinc | | | Oct. 2018 | | | | 131,288 | | | | (28,704 | ) |
| | 3 | | | LME Zinc | | | Dec. 2018 | | | | 196,425 | | | | (55,015 | ) |
| | 58 | | | Natural Gas | | | Sep. 2018 | | | | 1,613,560 | | | | 48,120 | |
| | 15 | | | No. 2 Soft Red Winter Wheat | | | Sep. 2018 | | | | 415,312 | | | | 39,475 | |
| | 9 | | | NY Harbor ULSD | | | Sep. 2018 | | | | 807,937 | | | | (3,952 | ) |
| | 7 | | | Silver | | | Sep. 2018 | | | | 544,565 | | | | (30,835 | ) |
| | 16 | | | Soybean | | | Sep. 2018 | | | | 727,000 | | | | 36,200 | |
| | 17 | | | Soybean Meal | | | Sep. 2018 | | | | 577,830 | | | | 20,060 | |
| | 12 | | | Soybean Oil | | | Sep. 2018 | | | | 208,008 | | | | 2,952 | |
| | 30 | | | Sugar #11 (World) | | | Oct. 2018 | | | | 354,480 | | | | (48,406 | ) |
| | 24 | | | WTI Crude | | | Sep. 2018 | | | | 1,650,240 | | | | (93,210 | ) |
| | | | | | | | | | | | | | | | |
| | | | | | | | | | | | | | | (147,134 | ) |
| | | | | | | | | | | | | | | | |
| | | | Short Positions: | | | | | | | | | | | | |
| | 7 | | | LME Nickel | | | Aug. 2018 | | | | 586,026 | | | | (13,323 | ) |
| | 4 | | | LME Nickel | | | Dec. 2018 | | | | 338,016 | | | | (13,149 | ) |
| | 10 | | | LME PRI Aluminum | | | Aug. 2018 | | | | 516,812 | | | | (625 | ) |
| | 2 | | | LME PRI Aluminum | | | Sep. 2018 | | | | 103,788 | | | | 4,019 | |
| | 7 | | | LME PRI Aluminum | | | Dec. 2018 | | | | 365,488 | | | | 368 | |
| | 5 | | | LME Zinc | | | Aug. 2018 | | | | 329,500 | | | | (5,531 | ) |
| | 2 | | | LME Zinc | | | Oct. 2018 | | | | 131,288 | | | | 37,262 | |
| | 3 | | | LME Zinc | | | Dec. 2018 | | | | 196,425 | | | | 49,125 | |
| | | | | | | | | | | | | | | | |
| | | | | | | | | | | | | | | 58,146 | |
| | | | | | | | | | | | | | | | |
| | | | | | | | | | | | | | $ | (88,988 | ) |
| | | | | | | | | | | | | | | | |
Securities with a market value of $1,196,846 have been segregated with Morgan Stanley to cover requirements for open futures contracts at July 31, 2018.
See Notes to Financial Statements.
| | | | |
| PGIM Day One Underlying Funds | | | 77 | |
PGIM QMA Commodity Strategies Fund
Consolidated Schedule of Investments (continued)
as of July 31, 2018
| (1) | Represents positions held in the Cayman Subsidiary. |
Fair Value Measurements:
Various inputs are used in determining the value of the Fund’s investments. These inputs are summarized in the three broad levels listed below.
Level 1—unadjusted quoted prices generally in active markets for identical securities.
Level 2—quoted prices for similar securities, interest rates and yield curves, prepayment speeds, foreign currency exchange rates and other observable inputs.
Level 3—unobservable inputs for securities valued in accordance with Board approved fair valuation procedures.
The following is a summary of the inputs used as of July 31, 2018 in valuing such portfolio securities:
| | | | | | | | | | | | |
| | | Level 1 | | | Level 2 | | | Level 3 | |
Investments in Securities | | | | | | | | | | | | |
Unaffiliated Fund | | $ | 6,681,827 | | | $ | — | | | $ | — | |
U.S. Treasury Obligations | | | — | | | | 11,669,247 | | | | — | |
Other Financial Instruments* | | | | | | | | | | | | |
Commodity Futures Contracts | | | (88,988 | ) | | | — | | | | — | |
| | | | | | | | | | | | |
Total | | $ | 6,592,839 | | | $ | 11,669,247 | | | $ | — | |
| | | | | | | | | | | | |
| * | Other financial instruments are derivative instruments not reflected in the Consolidated Schedule of Investments, such as futures, forwards and centrally cleared swap contracts, which are recorded at the unrealized appreciation (depreciation) on the instrument, and OTC swap contracts which are recorded at fair value. |
During the period, there were no transfers between Level 1, Level 2 and Level 3 to report.
Sector Allocation:
The sector allocation of portfolio holdings and liabilities in excess of other assets shown as a percentage of net assets as of July 31, 2018 were as follows (unaudited):
| | | | |
U.S. Treasury Obligations | | | 64.2 | % |
Unaffiliated Fund | | | 36.7 | |
| | | | |
| | | 100.9 | |
Liabilities in excess of other assets | | | (0.9 | ) |
| | | | |
| | | 100.0 | % |
| | | | |
Effects of Derivative Instruments on the Consolidated Financial Statements and Primary Underlying Risk Exposure:
The Fund invested in derivative instruments during the reporting period. The primary type of risk associated with these derivative instruments is commodity contracts risk. The effect of such derivative instruments on the Fund’s financial position and financial performance as reflected in the Consolidated Statement of Assets and Liabilities and Consolidated Statement of Operations is presented in the summary below.
See Notes to Financial Statements.
Fair values of derivative instruments as of July 31, 2018 as presented in the Consolidated Statement of Assets and Liabilities:
| | | | | | | | | | | | |
| | | Asset Derivatives | | | Liability Derivatives | |
Derivatives not accounted
for as hedging instruments,
carried at fair value | | Balance Sheet
Location | | Fair
Value | | | Balance Sheet
Location | | Fair
Value | |
| Commodity contracts | | Due from/to
broker—variation
margin futures | | $ | 343,148 | * | | Due from/to
broker—variation
margin futures | | $ | 432,136 | * |
| | | | | | | | | | | | |
| * | Includes cumulative appreciation (depreciation) as reported in the schedule of open futures and centrally cleared swap contracts. Only unsettled variation margin receivable (payable) is reported within the Consolidated Statement of Assets and Liabilities. |
The effects of derivative instruments on the Consolidated Statement of Operations for the year ended July 31, 2018 are as follows:
| | | | |
Amount of Realized Gain (Loss) on Derivatives Recognized in Income | |
Derivatives not accounted for as hedging
instruments, carried at fair value | | Futures | |
Commodity contracts | | $ | 781,968 | |
| | | | |
| | | | |
Change in Unrealized Appreciation (Depreciation) on Derivatives Recognized in Income | |
Derivatives not accounted for as hedging
instruments, carried at fair value | | Futures | |
Commodity contracts | | $ | (455,138 | ) |
| | | | |
For the year ended July 31, 2018, the Fund’s average volume of derivative activities is as follows:
| | |
Futures
Contracts—
Long
Positions(1) | | Futures
Contracts—
Short
Positions(1) |
| $ 18,064,795 | | $ 2,032,619 |
| (1) | Notional Amount in USD. |
See Notes to Financial Statements.
| | | | |
| PGIM Day One Underlying Funds | | | 79 | |
PGIM QMA Commodity Strategies Fund
Consolidated Statement of Assets & Liabilities
as of July 31, 2018
| | | | |
Assets | | | | |
Unaffiliated investments (cost $18,349,441) | | $ | 18,351,074 | |
Cash | | | 105,477 | |
Due from Manager | | | 21,546 | |
Interest receivable | | | 9,511 | |
Receivable for Fund shares sold | | | 9,070 | |
| | | | |
Total Assets | | | 18,496,678 | |
| | | | |
| |
Liabilities | | | | |
Payable for Fund shares reacquired | | | 171,055 | |
Due to broker—variation margin futures | | | 38,893 | |
Custodian and accounting fees payable | | | 34,170 | |
Audit fee payable | | | 28,280 | |
Legal fees and expenses payable | | | 19,389 | |
Deposit due to broker—futures | | | 12,433 | |
Accrued expenses and other liabilities | | | 5,279 | |
Affiliated transfer agent fee payable | | | 54 | |
| | | | |
Total Liabilities | | | 309,553 | |
| | | | |
| |
Net Assets | | $ | 18,187,125 | |
| | | | |
| | | | | |
Net assets were comprised of: | | | | |
Shares of beneficial interest, at par | | $ | 1,764 | |
Paid-in capital in excess of par | | | 17,779,877 | |
| | | | |
| | | 17,781,641 | |
Undistributed net investment income | | | 416,673 | |
Accumulated net realized gain on investment transactions | | | 76,166 | |
Net unrealized depreciation on investments | | | (87,355 | ) |
| | | | |
Net assets, July 31, 2018 | | $ | 18,187,125 | |
| | | | |
| |
Class R6 | | | | |
Net asset value, offering price and redemption price per share,
($18,187,125 ÷ 1,764,208 shares of beneficial interest issued and outstanding) | | $ | 10.31 | |
| | | | |
See Notes to Financial Statements.
PGIM QMA Commodity Strategies Fund
Consolidated Statement of Operations
Year Ended July 31, 2018
| | | | |
Net Investment Income (Loss) | | | | |
Income | | | | |
Interest income | | $ | 163,020 | |
Unaffiliated dividend income | | | 52,626 | |
| | | | |
Total income | | | 215,646 | |
| | | | |
| |
Expenses | | | | |
Management fee | | | 100,993 | |
Custodian and accounting fees | | | 64,759 | |
Legal fees and expenses | | | 45,614 | |
Audit fee | | | 28,280 | |
Offering expenses | | | 23,090 | |
Shareholders’ reports | | | 15,779 | |
Trustees’ fees | | | 12,187 | |
Transfer agent’s fees and expenses (including affiliated expense of $ 332) | | | 430 | |
Registration fees | | | 63 | |
Miscellaneous | | | 11,558 | |
| | | | |
Total expenses | | | 302,753 | |
Less: Fee waiver and/or expense reimbursement | | | (153,560 | ) |
| | | | |
Net expenses | | | 149,193 | |
| | | | |
Net investment income (loss) | | | 66,453 | |
| | | | |
| |
Realized And Unrealized Gain (Loss) On Investments | | | | |
Net realized gain (loss) on futures transactions | | | 781,968 | |
| | | | |
Net change in unrealized appreciation (depreciation) on: | | | | |
Investments | | | 1,653 | |
Futures | | | (455,138 | ) |
| | | | |
| | | (453,485 | ) |
| | | | |
Net gain (loss) on investment transactions | | | 328,483 | |
| | | | |
Net Increase (Decrease) In Net Assets Resulting From Operations | | $ | 394,936 | |
| | | | |
See Notes to Financial Statements.
| | | | |
| PGIM Day One Underlying Funds | | | 81 | |
PGIM QMA Commodity Strategies Fund
Consolidated Statements of Changes in Net Assets
| | | | | | | | |
| | | Year Ended July 31, 2018 | | | November 15, 2016*
through July 31, 2017 | |
Increase (Decrease) in Net Assets | | | | | | | | |
Operations | | | | | | | | |
Net investment income (loss) | | $ | 66,453 | | | $ | (51,140 | ) |
Net realized gain (loss) on investment transactions | | | 781,968 | | | | (82,421 | ) |
Net change in unrealized appreciation (depreciation) on investments | | | (453,485 | ) | | | 366,130 | |
| | | | | | | | |
Net increase (decrease) in net assets resulting from operations | | | 394,936 | | | | 232,569 | |
| | | | | | | | |
| | |
Dividends from net investment income | | | | | | | | |
Class R6 | | | (222,021 | ) | | | — | |
| | | | | | | | |
| | |
Fund share transactions | | | | | | | | |
Net proceeds from shares sold | | | 6,137,208 | | | | 13,792,034 | |
Net asset value of shares issued in reinvestment of dividends and distributions | | | 222,021 | | | | — | |
Cost of shares reacquired | | | (2,156,323 | ) | | | (213,299 | ) |
| | | | | | | | |
Net increase (decrease) in net assets from Fund share transactions | | | 4,202,906 | | | | 13,578,735 | |
| | | | | | | | |
Total increase (decrease) | | | 4,375,821 | | | | 13,811,304 | |
| | |
Net Assets: | | | | | | | | |
Beginning of period | | | 13,811,304 | | | | — | |
| | | | | | | | |
End of period(a) | | $ | 18,187,125 | | | $ | 13,811,304 | |
| | | | | | | | |
(a) Includes undistributed/(distributions in excess of) net investment income of: | | $ | 416,673 | | | $ | 177,975 | |
| | | | | | | | |
| * | Commencement of operations. |
See Notes to Financial Statements.
PGIM QMA Mid-Cap Core Equity Fund
Schedule of Investments
as of July 31, 2018
| | | | | | | | |
| Description | | Shares | | | Value | |
LONG-TERM INVESTMENTS 99.3% | | | | | | | | |
| | |
COMMON STOCKS 97.1% | | | | | | | | |
| | |
Aerospace & Defense 1.5% | | | | | | | | |
Curtiss-Wright Corp. | | | 650 | | | $ | 86,469 | |
Esterline Technologies Corp.* | | | 470 | | | | 40,091 | |
Teledyne Technologies, Inc.* | | | 230 | | | | 50,467 | |
| | | | | | | | |
| | | | | | | 177,027 | |
| | |
Airlines 0.3% | | | | | | | | |
JetBlue Airways Corp.* | | | 1,900 | | | | 34,200 | |
| | |
Auto Components 0.4% | | | | | | | | |
Dana, Inc. | | | 600 | | | | 12,810 | |
Delphi Technologies PLC | | | 900 | | | | 40,653 | |
| | | | | | | | |
| | | | | | | 53,463 | |
| | |
Automobiles 0.5% | | | | | | | | |
Thor Industries, Inc. | | | 650 | | | | 61,653 | |
| | |
Banks 7.4% | | | | | | | | |
Associated Banc-Corp. | | | 1,400 | | | | 37,800 | |
BankUnited, Inc. | | | 900 | | | | 34,974 | |
Cathay General Bancorp | | | 200 | | | | 8,318 | |
Cullen/Frost Bankers, Inc. | | | 30 | | | | 3,315 | |
East West Bancorp, Inc. | | | 1,490 | | | | 96,463 | |
Financial Institutions, Inc. | | | 190 | | | | 6,023 | |
First BanCorp. (Puerto Rico)* | | | 1,000 | | | | 8,220 | |
First Horizon National Corp. | | | 2,100 | | | | 37,569 | |
Fulton Financial Corp. | | | 900 | | | | 15,615 | |
Hancock Whitney Corp. | | | 1,410 | | | | 70,852 | |
Hilltop Holdings, Inc. | | | 600 | | | | 12,480 | |
International Bancshares Corp. | | | 1,060 | | | | 47,117 | |
PacWest Bancorp | | | 1,330 | | | | 66,793 | |
Shore Bancshares, Inc. | | | 600 | | | | 11,592 | |
Signature Bank | | | 330 | | | | 36,204 | |
Synovus Financial Corp. | | | 2,010 | | | | 99,334 | |
TCF Financial Corp. | | | 2,600 | | | | 65,286 | |
Texas Capital Bancshares, Inc.* | | | 800 | | | | 72,640 | |
UMB Financial Corp. | | | 570 | | | | 40,977 | |
Umpqua Holdings Corp. | | | 1,600 | | | | 34,080 | |
Wintrust Financial Corp. | | | 1,040 | | | | 91,239 | |
| | | | | | | | |
| | | | | | | 896,891 | |
See Notes to Financial Statements.
| | | | |
| PGIM Day One Underlying Funds | | | 83 | |
PGIM QMA Mid-Cap Core Equity Fund
Schedule of Investments (continued)
as of July 31, 2018
| | | | | | | | |
| Description | | Shares | | | Value | |
COMMON STOCKS (Continued) | | | | | | | | |
| | |
Beverages 0.3% | | | | | | | | |
Boston Beer Co., Inc. (The) (Class A Stock)* | | | 150 | | | $ | 41,243 | |
| | |
Biotechnology 0.9% | | | | | | | | |
Genomic Health, Inc.* | | | 400 | | | | 21,472 | |
United Therapeutics Corp.* | | | 720 | | | | 88,495 | |
| | | | | | | | |
| | | | | | | 109,967 | |
| | |
Building Products 0.1% | | | | | | | | |
Universal Forest Products, Inc. | | | 300 | | | | 11,052 | |
| | |
Capital Markets 2.2% | | | | | | | | |
Evercore, Inc. (Class A Stock) | | | 800 | | | | 90,400 | |
Federated Investors, Inc. | | | 900 | | | | 21,780 | |
Interactive Brokers Group, Inc. (Class A Stock) | | | 860 | | | | 51,479 | |
Investment Technology Group, Inc. | | | 200 | | | | 4,430 | |
Janus Henderson Group PLC (United Kingdom) | | | 2,300 | | | | 74,865 | |
Stifel Financial Corp. | | | 460 | | | | 25,360 | |
| | | | | | | | |
| | | | | | | 268,314 | |
| | |
Chemicals 2.4% | | | | | | | | |
Chemours Co. (The) | | | 2,490 | | | | 114,067 | |
Minerals Technologies, Inc. | | | 150 | | | | 11,340 | |
Olin Corp. | | | 3,160 | | | | 93,251 | |
PolyOne Corp. | | | 1,580 | | | | 70,863 | |
| | | | | | | | |
| | | | | | | 289,521 | |
| | |
Commercial Services & Supplies 1.3% | | | | | | | | |
ACCO Brands Corp. | | | 400 | | | | 5,120 | |
Copart, Inc.* | | | 300 | | | | 17,217 | |
Deluxe Corp. | | | 320 | | | | 18,858 | |
Herman Miller, Inc. | | | 1,650 | | | | 62,453 | |
McGrath RentCorp | | | 80 | | | | 4,750 | |
Pitney Bowes, Inc. | | | 5,600 | | | | 48,888 | |
| | | | | | | | |
| | | | | | | 157,286 | |
| | |
Communications Equipment 1.3% | | | | | | | | |
ARRIS International PLC* | | | 3,000 | | | | 75,780 | |
See Notes to Financial Statements.
| | | | | | | | |
| Description | | Shares | | | Value | |
COMMON STOCKS (Continued) | | | | | | | | |
| | |
Communications Equipment (cont’d.) | | | | | | | | |
Lumentum Holdings, Inc.* | | | 250 | | | $ | 13,062 | |
Plantronics, Inc. | | | 1,050 | | | | 72,093 | |
| | | | | | | | |
| | | | | | | 160,935 | |
| | |
Construction & Engineering 1.3% | | | | | | | | |
EMCOR Group, Inc. | | | 1,150 | | | | 88,493 | |
KBR, Inc. | | | 3,300 | | | | 65,934 | |
| | | | | | | | |
| | | | | | | 154,427 | |
| | |
Consumer Finance 0.6% | | | | | | | | |
Navient Corp. | | | 3,500 | | | | 46,235 | |
SLM Corp.* | | | 2,600 | | | | 29,354 | |
| | | | | | | | |
| | | | | | | 75,589 | |
| | |
Containers & Packaging 1.4% | | | | | | | | |
Greif, Inc. (Class A Stock) | | | 830 | | | | 45,194 | |
Owens-Illinois, Inc.* | | | 2,800 | | | | 52,304 | |
Sonoco Products Co. | | | 1,220 | | | | 68,100 | |
| | | | | | | | |
| | | | | | | 165,598 | |
| | |
Diversified Consumer Services 1.2% | | | | | | | | |
Grand Canyon Education, Inc.* | | | 370 | | | | 43,116 | |
Service Corp. International | | | 2,730 | | | | 107,426 | |
| | | | | | | | |
| | | | | | | 150,542 | |
| | |
Diversified Financial Services 0.1% | | | | | | | | |
Marlin Business Services Corp. | | | 500 | | | | 15,400 | |
| | |
Electric Utilities 0.7% | | | | | | | | |
Hawaiian Electric Industries, Inc. | | | 1,740 | | | | 61,196 | |
PNM Resources, Inc. | | | 600 | | | | 23,610 | |
| | | | | | | | |
| | | | | | | 84,806 | |
| | |
Electrical Equipment 2.0% | | | | | | | | |
Acuity Brands, Inc. | | | 270 | | | | 37,538 | |
EnerSys | | | 1,020 | | | | 83,711 | |
See Notes to Financial Statements.
| | | | |
| PGIM Day One Underlying Funds | | | 85 | |
PGIM QMA Mid-Cap Core Equity Fund
Schedule of Investments (continued)
as of July 31, 2018
| | | | | | | | |
| Description | | Shares | | | Value | |
COMMON STOCKS (Continued) | | | | | | | | |
| | |
Electrical Equipment (cont’d.) | | | | | | | | |
Hubbell, Inc. | | | 250 | | | $ | 30,813 | |
Regal Beloit Corp. | | | 1,000 | | | | 85,950 | |
| | | | | | | | |
| | | | | | | 238,012 | |
| | |
Electronic Equipment, Instruments & Components 5.0% | | | | | | | | |
Arrow Electronics, Inc.* | | | 1,360 | | | | 103,142 | |
Avnet, Inc. | | | 1,750 | | | | 76,738 | |
Jabil, Inc. | | | 3,200 | | | | 90,144 | |
Keysight Technologies, Inc.* | | | 890 | | | | 51,620 | |
SYNNEX Corp. | | | 600 | | | | 57,882 | |
Tech Data Corp.* | | | 810 | | | | 67,562 | |
Trimble, Inc.* | | | 1,520 | | | | 53,656 | |
Vishay Intertechnology, Inc. | | | 300 | | | | 7,500 | |
Zebra Technologies Corp. (Class A Stock)* | | | 750 | | | | 103,447 | |
| | | | | | | | |
| | | | | | | 611,691 | |
| | |
Energy Equipment & Services 1.4% | | | | | | | | |
Archrock, Inc. | | | 2,700 | | | | 36,855 | |
Bristow Group, Inc.* | | | 500 | | | | 6,990 | |
Core Laboratories NV | | | 140 | | | | 15,697 | |
Exterran Corp.* | | | 200 | | | | 5,544 | |
Matrix Service Co.* | | | 1,100 | | | | 21,945 | |
SEACOR Holdings, Inc.* | | | 180 | | | | 9,498 | |
Superior Energy Services, Inc.* | | | 7,700 | | | | 75,768 | |
| | | | | | | | |
| | | | | | | 172,297 | |
| | |
Equity Real Estate Investment Trusts (REITs) 8.0% | | | | | | | | |
American Campus Communities, Inc. | | | 800 | | | | 33,000 | |
Apple Hospitality REIT, Inc. | | | 400 | | | | 7,196 | |
Brixmor Property Group, Inc. | | | 1,600 | | | | 28,304 | |
Camden Property Trust, REIT | | | 1,100 | | | | 101,849 | |
Chesapeake Lodging Trust | | | 300 | | | | 9,606 | |
CoreCivic, Inc. | | | 3,500 | | | | 89,740 | |
Franklin Street Properties Corp. | | | 500 | | | | 4,405 | |
Gaming and Leisure Properties, Inc. | | | 1,600 | | | | 58,112 | |
GEO Group, Inc. (The) | | | 3,130 | | | | 81,004 | |
Hospitality Properties Trust | | | 1,840 | | | | 52,017 | |
LaSalle Hotel Properties | | | 2,400 | | | | 83,208 | |
Liberty Property Trust | | | 2,060 | | | | 88,292 | |
Mack-Cali Realty Corp. | | | 2,800 | | | | 54,516 | |
PotlatchDeltic Corp. | | | 1,410 | | | | 65,917 | |
See Notes to Financial Statements.
| | | | | | | | |
| Description | | Shares | | | Value | |
COMMON STOCKS (Continued) | | | | | | | | |
| | |
Equity Real Estate Investment Trusts (REITs) (cont’d.) | | | | | | | | |
Rayonier, Inc. | | | 2,300 | | | $ | 80,523 | |
Ryman Hospitality Properties, Inc. | | | 370 | | | | 31,454 | |
Senior Housing Properties Trust | | | 5,100 | | | | 90,984 | |
Xenia Hotels & Resorts, Inc. | | | 600 | | | | 14,634 | |
| | | | | | | | |
| | | | | | | 974,761 | |
| | |
Food Products 1.8% | | | | | | | | |
Flowers Foods, Inc. | | | 2,400 | | | | 48,960 | |
Ingredion, Inc. | | | 540 | | | | 54,702 | |
Lamb Weston Holdings, Inc. | | | 1,670 | | | | 117,351 | |
| | | | | | | | |
| | | | | | | 221,013 | |
| | |
Gas Utilities 1.4% | | | | | | | | |
National Fuel Gas Co. | | | 470 | | | | 25,239 | |
Southwest Gas Holdings, Inc. | | | 310 | | | | 24,242 | |
UGI Corp. | | | 2,210 | | | | 117,439 | |
| | | | | | | | |
| | | | | | | 166,920 | |
| | |
Health Care Equipment & Supplies 4.6% | | | | | | | | |
Cantel Medical Corp. | | | 260 | | | | 24,105 | |
CONMED Corp. | | | 30 | | | | 2,220 | |
Globus Medical, Inc. (Class A Stock)* | | | 1,200 | | | | 61,776 | |
Hill-Rom Holdings, Inc. | | | 1,070 | | | | 100,794 | |
ICU Medical, Inc.* | | | 160 | | | | 45,888 | |
Integer Holdings Corp.* | | | 190 | | | | 13,575 | |
Masimo Corp.* | | | 930 | | | | 92,461 | |
STERIS PLC | | | 1,080 | | | | 123,628 | |
Teleflex, Inc. | | | 340 | | | | 92,721 | |
| | | | | | | | |
| | | | | | | 557,168 | |
| | |
Health Care Providers & Services 2.6% | | | | | | | | |
Encompass Health Corp. | | | 830 | | | | 62,773 | |
LifePoint Health, Inc.* | | | 100 | | | | 6,480 | |
MEDNAX, Inc.* | | | 1,220 | | | | 52,204 | |
Tenet Healthcare Corp.* | | | 2,300 | | | | 86,549 | |
WellCare Health Plans, Inc.* | | | 400 | | | | 106,968 | |
| | | | | | | | |
| | | | | | | 314,974 | |
See Notes to Financial Statements.
| | | | |
| PGIM Day One Underlying Funds | | | 87 | |
PGIM QMA Mid-Cap Core Equity Fund
Schedule of Investments (continued)
as of July 31, 2018
| | | | | | | | |
| Description | | Shares | | | Value | |
COMMON STOCKS (Continued) | | | | | | | | |
| | |
Hotels, Restaurants & Leisure 2.7% | | | | | | | | |
Bloomin’ Brands, Inc. | | | 3,000 | | | $ | 58,020 | |
Boyd Gaming Corp. | | | 600 | | | | 22,410 | |
Brinker International, Inc. | | | 1,600 | | | | 75,472 | |
Churchill Downs, Inc. | | | 70 | | | | 20,016 | |
International Speedway Corp. (Class A Stock) | | | 100 | | | | 4,330 | |
Jack in the Box, Inc. | | | 780 | | | | 65,707 | |
Texas Roadhouse, Inc. | | | 1,340 | | | | 84,206 | |
| | | | | | | | |
| | | | | | | 330,161 | |
| | |
Household Durables 1.9% | | | | | | | | |
KB Home | | | 400 | | | | 9,500 | |
Meritage Homes Corp.* | | | 100 | | | | 4,315 | |
NVR, Inc.* | | | 43 | | | | 118,656 | |
Toll Brothers, Inc. | | | 1,390 | | | | 49,011 | |
TRI Pointe Group, Inc.* | | | 3,400 | | | | 48,178 | |
| | | | | | | | |
| | | | | | | 229,660 | |
| | |
Independent Power & Renewable Electricity Producers 0.7% | | | | | | | | |
AES Corp. | | | 2,200 | | | | 29,392 | |
NRG Energy, Inc. | | | 1,700 | | | | 53,839 | |
| | | | | | | | |
| | | | | | | 83,231 | |
| | |
Industrial Conglomerates 0.2% | | | | | | | | |
Carlisle Cos., Inc. | | | 160 | | | | 19,654 | |
| | |
Insurance 4.6% | | | | | | | | |
Alleghany Corp. | | | 41 | | | | 25,800 | |
American Financial Group, Inc. | | | 940 | | | | 105,929 | |
CNO Financial Group, Inc. | | | 3,400 | | | | 69,190 | |
First American Financial Corp. | | | 1,830 | | | | 102,480 | |
Genworth Financial, Inc. (Class A Stock)* | | | 6,300 | | | | 28,980 | |
Hanover Insurance Group, Inc. (The) | | | 750 | | | | 94,065 | |
National General Holdings Corp. | | | 1,000 | | | | 27,580 | |
Old Republic International Corp. | | | 4,400 | | | | 93,764 | |
Reinsurance Group of America, Inc. | | | 130 | | | | 18,395 | |
| | | | | | | | |
| | | | | | | 566,183 | |
| | |
Internet Software & Services 0.7% | | | | | | | | |
LogMeIn, Inc. | | | 890 | | | | 72,135 | |
See Notes to Financial Statements.
| | | | | | | | |
| Description | | Shares | | | Value | |
COMMON STOCKS (Continued) | | | | | | | | |
| | |
Internet Software & Services (cont’d.) | | | | | | | | |
XO Group, Inc.* | | | 400 | | | $ | 11,272 | |
Yelp, Inc.* | | | 100 | | | | 3,688 | |
| | | | | | | | |
| | | | | | | 87,095 | |
| | |
IT Services 2.6% | | | | | | | | |
Booz Allen Hamilton Holding Corp. | | | 200 | | | | 9,454 | |
CoreLogic, Inc.* | | | 1,100 | | | | 53,570 | |
Leidos Holdings, Inc. | | | 1,450 | | | | 99,209 | |
MAXIMUS, Inc. | | | 1,190 | | | | 77,124 | |
Science Applications International Corp. | | | 920 | | | | 77,620 | |
| | | | | | | | |
| | | | | | | 316,977 | |
| | |
Leisure Products 0.8% | | | | | | | | |
Brunswick Corp. | | | 1,460 | | | | 93,878 | |
Vista Outdoor, Inc.* | | | 600 | | | | 9,744 | |
| | | | | | | | |
| | | | | | | 103,622 | |
| | |
Life Sciences Tools & Services 1.8% | | | | | | | | |
Bio-Rad Laboratories, Inc. (Class A Stock)* | | | 300 | | | | 91,995 | |
Bio-Techne Corp. | | | 190 | | | | 30,522 | |
Charles River Laboratories International, Inc.* | | | 790 | | | | 98,197 | |
| | | | | | | | |
| | | | | | | 220,714 | |
| | |
Machinery 4.5% | | | | | | | | |
AGCO Corp. | | | 1,250 | | | | 78,775 | |
Crane Co. | | | 830 | | | | 75,173 | |
Global Brass & Copper Holdings, Inc. | | | 230 | | | | 7,579 | |
IDEX Corp. | | | 600 | | | | 92,148 | |
ITT, Inc. | | | 460 | | | | 26,068 | |
Lincoln Electric Holdings, Inc. | | | 380 | | | | 35,697 | |
Oshkosh Corp. | | | 950 | | | | 71,487 | |
Timken Co. (The) | | | 1,820 | | | | 89,635 | |
Toro Co. (The) | | | 1,100 | | | | 66,209 | |
| | | | | | | | |
| | | | | | | 542,771 | |
See Notes to Financial Statements.
| | | | |
| PGIM Day One Underlying Funds | | | 89 | |
PGIM QMA Mid-Cap Core Equity Fund
Schedule of Investments (continued)
as of July 31, 2018
| | | | | | | | |
| Description | | Shares | | | Value | |
COMMON STOCKS (Continued) | | | | | | | | |
| | |
Media 0.9% | | | | | | | | |
John Wiley & Sons, Inc. (Class A Stock) | | | 570 | | | $ | 35,996 | |
TEGNA, Inc. | | | 7,000 | | | | 77,210 | |
| | | | | | | | |
| | | | | | | 113,206 | |
| | |
Metals & Mining 3.0% | | | | | | | | |
Commercial Metals Co. | | | 1,400 | | | | 31,276 | |
Reliance Steel & Aluminum Co. | | | 1,080 | | | | 97,416 | |
Royal Gold, Inc. | | | 290 | | | | 24,537 | |
Steel Dynamics, Inc. | | | 2,800 | | | | 131,852 | |
United States Steel Corp. | | | 2,300 | | | | 83,789 | |
| | | | | | | | |
| | | | | | | 368,870 | |
| | |
Mortgage Real Estate Investment Trusts (REITs) 0.5% | | | | | | | | |
Ladder Capital Corp. | | | 2,300 | | | | 36,777 | |
Western Asset Mortgage Capital Corp. | | | 2,600 | | | | 28,782 | |
| | | | | | | | |
| | | | | | | 65,559 | |
| | |
Multiline Retail 0.9% | | | | | | | | |
Macy’s, Inc. | | | 1,700 | | | | 67,541 | |
Ollie’s Bargain Outlet Holdings, Inc.* | | | 630 | | | | 43,785 | |
| | | | | | | | |
| | | | | | | 111,326 | |
| | |
Multi-Utilities 1.0% | | | | | | | | |
MDU Resources Group, Inc. | | | 3,300 | | | | 95,700 | |
NorthWestern Corp. | | | 460 | | | | 27,292 | |
| | | | | | | | |
| | | | | | | 122,992 | |
| | |
Oil, Gas & Consumable Fuels 3.9% | | | | | | | | |
CNX Resources Corp.* | | | 4,800 | | | | 78,144 | |
Energen Corp.* | | | 1,430 | | | | 106,077 | |
HollyFrontier Corp. | | | 1,230 | | | | 91,733 | |
Murphy Oil Corp. | | | 2,900 | | | | 96,454 | |
Panhandle Oil and Gas, Inc. (Class A Stock) | | | 400 | | | | 8,160 | |
Range Resources Corp. | | | 1,900 | | | | 29,317 | |
World Fuel Services Corp. | | | 2,490 | | | | 69,297 | |
| | | | | | | | |
| | | | | | | 479,182 | |
See Notes to Financial Statements.
| | | | | | | | |
| Description | | Shares | | | Value | |
COMMON STOCKS (Continued) | | | | | | | | |
| | |
Paper & Forest Products 0.5% | | | | | | | | |
Louisiana-Pacific Corp. | | | 2,100 | | | $ | 56,532 | |
| | |
Personal Products 0.8% | | | | | | | | |
Avon Products, Inc. (United Kingdom)* | | | 700 | | | | 1,113 | |
Herbalife Nutrition Ltd.* | | | 100 | | | | 5,163 | |
Nu Skin Enterprises, Inc. (Class A Stock) | | | 1,180 | | | | 85,963 | |
| | | | | | | | |
| | | | | | | 92,239 | |
| | |
Pharmaceuticals 0.1% | | | | | | | | |
Mallinckrodt PLC* | | | 770 | | | | 18,057 | |
| | |
Professional Services 0.9% | | | | | | | | |
Dun & Bradstreet Corp. (The) | | | 40 | | | | 5,036 | |
ManpowerGroup, Inc. | | | 1,070 | | | | 99,788 | |
| | | | | | | | |
| | | | | | | 104,824 | |
| | |
Real Estate Management & Development 0.9% | | | | | | | | |
Jones Lang LaSalle, Inc. | | | 570 | | | | 97,476 | |
RMR Group, Inc. (The) (Class A Stock) | | | 200 | | | | 17,360 | |
| | | | | | | | |
| | | | | | | 114,836 | |
| | |
Road & Rail 1.6% | | | | | | | | |
Landstar System, Inc. | | | 90 | | | | 10,003 | |
Old Dominion Freight Line, Inc. | | | 750 | | | | 110,100 | |
Ryder System, Inc. | | | 1,020 | | | | 79,866 | |
| | | | | | | | |
| | | | | | | 199,969 | |
| | |
Semiconductors & Semiconductor Equipment 2.4% | | | | | | | | |
Cypress Semiconductor Corp. | | | 5,900 | | | | 105,079 | |
First Solar, Inc.* | | | 240 | | | | 12,564 | |
MKS Instruments, Inc. | | | 940 | | | | 88,642 | |
Versum Materials, Inc. | | | 2,160 | | | | 83,268 | |
| | | | | | | | |
| | | | | | | 289,553 | |
| | |
Software 3.5% | | | | | | | | |
CDK Global, Inc. | | | 830 | | | | 51,834 | |
CommVault Systems, Inc.* | | | 220 | | | | 14,278 | |
Fair Isaac Corp.* | | | 290 | | | | 58,423 | |
Fortinet, Inc.* | | | 1,980 | | | | 124,562 | |
See Notes to Financial Statements.
| | | | |
| PGIM Day One Underlying Funds | | | 91 | |
PGIM QMA Mid-Cap Core Equity Fund
Schedule of Investments (continued)
as of July 31, 2018
| | | | | | | | |
| Description | | Shares | | | Value | |
COMMON STOCKS (Continued) | | | | | | | | |
| | |
Software (cont’d.) | | | | | | | | |
PTC, Inc.* | | | 630 | | | $ | 57,903 | |
Tyler Technologies, Inc.* | | | 250 | | | | 56,247 | |
Ultimate Software Group, Inc. (The)* | | | 240 | | | | 66,454 | |
| | | | | | | | |
| | | | | | | 429,701 | |
| | |
Specialty Retail 2.9% | | | | | | | | |
AutoNation, Inc.* | | | 1,660 | | | | 80,560 | |
Dick’s Sporting Goods, Inc. | | | 2,300 | | | | 78,522 | |
Five Below, Inc.* | | | 30 | | | | 2,915 | |
Michaels Cos., Inc. The* | | | 3,800 | | | | 77,558 | |
Murphy USA, Inc.* | | | 470 | | | | 37,243 | |
Signet Jewelers Ltd. | | | 1,010 | | | | 58,317 | |
Urban Outfitters, Inc.* | | | 300 | | | | 13,320 | |
| | | | | | | | |
| | | | | | | 348,435 | |
| | |
Technology Hardware, Storage & Peripherals 0.4% | | | | | | | | |
NCR Corp.* | | | 1,600 | | | | 44,672 | |
| | |
Textiles, Apparel & Luxury Goods 0.5% | | | | | | | | |
Carter’s, Inc. | | | 100 | | | | 10,483 | |
Skechers U.S.A., Inc. (Class A Stock)* | | | 1,720 | | | | 47,678 | |
| | | | | | | | |
| | | | | | | 58,161 | |
| | |
Trading Companies & Distributors 0.7% | | | | | | | | |
MSC Industrial Direct Co., Inc. (Class A Stock) | | | 640 | | | | 54,163 | |
WESCO International, Inc.* | | | 520 | | | | 31,720 | |
| | | | | | | | |
| | | | | | | 85,883 | |
| | |
Wireless Telecommunication Services 0.5% | | | | | | | | |
Telephone & Data Systems, Inc. | | | 2,500 | | | | 63,125 | |
| | | | | | | | |
TOTAL COMMON STOCKS
(cost $10,911,974) | | | | | | | 11,831,940 | |
| | | | | | | | |
See Notes to Financial Statements.
| | | | | | | | |
| Description | | Shares | | | Value | |
EXCHANGE TRADED FUND 2.2% | | | | | | | | |
iShares Core S&P Mid-Cap ETF
(cost $236,207) | | | 1,320 | | | $ | 261,492 | |
| | | | | | | | |
TOTAL LONG-TERM INVESTMENTS
(cost $11,148,181) | | | | | | | 12,093,432 | |
| | | | | | | | |
| | |
SHORT-TERM INVESTMENT 0.7% | | | | | | | | |
| | |
AFFILIATED MUTUAL FUND | | | | | | | | |
PGIM Core Ultra Short Bond Fund
(cost $82,959)(w) | | | 82,959 | | | | 82,959 | |
| | | | | | | | |
TOTAL INVESTMENTS 100.0%
(cost $11,231,140) | | | | | | | 12,176,391 | |
Other assets in excess of liabilities 0.0% | | | | | | | 5,174 | |
| | | | | | | | |
NET ASSETS 100.0% | | | | | | $ | 12,181,565 | |
| | | | | | | | |
See the Glossary for abbreviations used in the annual report.
| * | Non-income producing security. |
| (w) | PGIM Investments LLC, the manager of the Fund, also serves as manager of the PGIM Core Ultra Short Bond Fund. |
Fair Value Measurements:
Various inputs are used in determining the value of the Fund’s investments. These inputs are summarized in the three broad levels listed below.
Level 1—unadjusted quoted prices generally in active markets for identical securities.
Level 2—quoted prices for similar securities, interest rates and yield curves, prepayment speeds, foreign currency exchange rates and other observable inputs.
Level 3—unobservable inputs for securities valued in accordance with Board approved fair valuation procedures.
The following is a summary of the inputs used as of July 31, 2018 in valuing such portfolio securities:
| | | | | | | | | | | | |
| | | Level 1 | | | Level 2 | | | Level 3 | |
Investments in Securities | | | | | | | | | | | | |
Common Stocks | | | | | | | | | | | | |
Aerospace & Defense | | $ | 177,027 | | | $ | — | | | $ | — | |
Airlines | | | 34,200 | | | | — | | | | — | |
Auto Components | | | 53,463 | | | | — | | | | — | |
Automobiles | | | 61,653 | | | | — | | | | — | |
Banks | | | 896,891 | | | | — | | | | — | |
Beverages | | | 41,243 | | | | — | | | | — | |
Biotechnology | | | 109,967 | | | | — | | | | — | |
Building Products | | | 11,052 | | | | — | | | | — | |
See Notes to Financial Statements.
| | | | |
| PGIM Day One Underlying Funds | | | 93 | |
PGIM QMA Mid-Cap Core Equity Fund
Schedule of Investments (continued)
as of July 31, 2018
| | | | | | | | | | | | |
| | | Level 1 | | | Level 2 | | | Level 3 | |
Investments in Securities (continued) | | | | | | | | | | | | |
Common Stocks (continued) | | | | | | | | | | | | |
Capital Markets | | $ | 268,314 | | | $ | — | | | $ | — | |
Chemicals | | | 289,521 | | | | — | | | | — | |
Commercial Services & Supplies | | | 157,286 | | | | — | | | | — | |
Communications Equipment | | | 160,935 | | | | — | | | | — | |
Construction & Engineering | | | 154,427 | | | | — | | | | — | |
Consumer Finance | | | 75,589 | | | | — | | | | — | |
Containers & Packaging | | | 165,598 | | | | — | | | | — | |
Diversified Consumer Services | | | 150,542 | | | | — | | | | — | |
Diversified Financial Services | | | 15,400 | | | | — | | | | — | |
Electric Utilities | | | 84,806 | | | | — | | | | — | |
Electrical Equipment | | | 238,012 | | | | — | | | | — | |
Electronic Equipment, Instruments & Components | | | 611,691 | | | | — | | | | — | |
Energy Equipment & Services | | | 172,297 | | | | — | | | | — | |
Equity Real Estate Investment Trusts (REITs) | | | 974,761 | | | | — | | | | — | |
Food Products | | | 221,013 | | | | — | | | | — | |
Gas Utilities | | | 166,920 | | | | — | | | | — | |
Health Care Equipment & Supplies | | | 557,168 | | | | — | | | | — | |
Health Care Providers & Services | | | 314,974 | | | | — | | | | — | |
Hotels, Restaurants & Leisure | | | 330,161 | | | | — | | | | — | |
Household Durables | | | 229,660 | | | | — | | | | — | |
Independent Power & Renewable Electricity Producers | | | 83,231 | | | | — | | | | — | |
Industrial Conglomerates | | | 19,654 | | | | — | | | | — | |
Insurance | | | 566,183 | | | | — | | | | — | |
Internet Software & Services | | | 87,095 | | | | — | | | | — | |
IT Services | | | 316,977 | | | | — | | | | — | |
Leisure Products | | | 103,622 | | | | — | | | | — | |
Life Sciences Tools & Services | | | 220,714 | | | | — | | | | — | |
Machinery | | | 542,771 | | | | — | | | | — | |
Media | | | 113,206 | | | | — | | | | — | |
Metals & Mining | | | 368,870 | | | | — | | | | — | |
Mortgage Real Estate Investment Trusts (REITs) | | | 65,559 | | | | — | | | | — | |
Multiline Retail | | | 111,326 | | | | — | | | | — | |
Multi-Utilities | | | 122,992 | | | | — | | | | — | |
Oil, Gas & Consumable Fuels | | | 479,182 | | | | — | | | | — | |
Paper & Forest Products | | | 56,532 | | | | — | | | | — | |
Personal Products | | | 92,239 | | | | — | | | | — | |
Pharmaceuticals | | | 18,057 | | | | — | | | | — | |
Professional Services | | | 104,824 | | | | — | | | | — | |
Real Estate Management & Development | | | 114,836 | | | | — | | | | — | |
Road & Rail | | | 199,969 | | | | — | | | | — | |
Semiconductors & Semiconductor Equipment | | | 289,553 | | | | — | | | | — | |
Software | | | 429,701 | | | | — | | | | — | |
Specialty Retail | | | 348,435 | | | | — | | | | — | |
Technology Hardware, Storage & Peripherals | | | 44,672 | | | | — | | | | — | |
Textiles, Apparel & Luxury Goods | | | 58,161 | | | | — | | | | — | |
See Notes to Financial Statements.
| | | | | | | | | | | | |
| | | Level 1 | | | Level 2 | | | Level 3 | |
Investments in Securities (continued) | | | | | | | | | | | | |
Common Stocks (continued) | | | | | | | | | | | | |
Trading Companies & Distributors | | $ | 85,883 | | | $ | — | | | $ | — | |
Wireless Telecommunication Services | | | 63,125 | | | | — | | | | — | |
Exchange Traded Fund | | | 261,492 | | | | — | | | | — | |
Affiliated Mutual Fund | | | 82,959 | | | | — | | | | — | |
| | | | | | | | | | | | |
Total | | $ | 12,176,391 | | | $ | — | | | $ | — | |
| | | | | | | | | | | | |
During the period, there were no transfers between Level 1, Level 2 and Level 3 to report.
Industry Classification:
The industry classification of investments and other assets in excess of liabilities shown as a percentage of net assets as of July 31, 2018 were as follows (unaudited):
| | | | |
Equity Real Estate Investment Trusts (REITs) | | | 8.0 | % |
Banks | | | 7.4 | |
Electronic Equipment, Instruments & Components | | | 5.0 | |
Insurance | | | 4.6 | |
Health Care Equipment & Supplies | | | 4.6 | |
Machinery | | | 4.5 | |
Oil, Gas & Consumable Fuels | | | 3.9 | |
Software | | | 3.5 | |
Metals & Mining | | | 3.0 | |
Specialty Retail | | | 2.9 | |
Hotels, Restaurants & Leisure | | | 2.7 | |
IT Services | | | 2.6 | |
Health Care Providers & Services | | | 2.6 | |
Semiconductors & Semiconductor Equipment | | | 2.4 | |
Chemicals | | | 2.4 | |
Capital Markets | | | 2.2 | |
Exchange Traded Fund | | | 2.2 | |
Electrical Equipment | | | 2.0 | |
Household Durables | | | 1.9 | |
Food Products | | | 1.8 | |
Life Sciences Tools & Services | | | 1.8 | |
Road & Rail | | | 1.6 | |
Aerospace & Defense | | | 1.5 | |
Energy Equipment & Services | | | 1.4 | |
Gas Utilities | | | 1.4 | |
Containers & Packaging | | | 1.4 | |
Communications Equipment | | | 1.3 | |
Commercial Services & Supplies | | | 1.3 | |
Construction & Engineering | | | 1.3 | |
Diversified Consumer Services | | | 1.2 | % |
Multi-Utilities | | | 1.0 | |
Real Estate Management & Development | | | 0.9 | |
Media | | | 0.9 | |
Multiline Retail | | | 0.9 | |
Biotechnology | | | 0.9 | |
Professional Services | | | 0.9 | |
Leisure Products | | | 0.8 | |
Personal Products | | | 0.8 | |
Internet Software & Services | | | 0.7 | |
Trading Companies & Distributors | | | 0.7 | |
Electric Utilities | | | 0.7 | |
Independent Power & Renewable Electricity Producers | | | 0.7 | |
Affiliated Mutual Fund | | | 0.7 | |
Consumer Finance | | | 0.6 | |
Mortgage Real Estate Investment Trusts (REITs) | | | 0.5 | |
Wireless Telecommunication Services | | | 0.5 | |
Automobiles | | | 0.5 | |
Textiles, Apparel & Luxury Goods | | | 0.5 | |
Paper & Forest Products | | | 0.5 | |
Auto Components | | | 0.4 | |
Technology Hardware, Storage & Peripherals | | | 0.4 | |
Beverages | | | 0.3 | |
Airlines | | | 0.3 | |
Industrial Conglomerates | | | 0.2 | |
Pharmaceuticals | | | 0.1 | |
Diversified Financial Services | | | 0.1 | |
See Notes to Financial Statements.
| | | | |
| PGIM Day One Underlying Funds | | | 95 | |
PGIM QMA Mid-Cap Core Equity Fund
Schedule of Investments (continued)
as of July 31, 2018
Industry Classification (continued):
| | | | |
Building Products | | | 0.1 | % |
| | | 100.0 | |
Other assets in excess of liabilities | | | — | * |
| | | | |
| | | 100.0 | % |
| | | | |
See Notes to Financial Statements.
PGIM QMA Mid-Cap Core Equity Fund
Statement of Assets & Liabilities
as of July 31, 2018
| | | | |
Assets | | | | |
Investments at value: | | | | |
Unaffiliated investments (cost $11,148,181) | | $ | 12,093,432 | |
Affiliated investments (cost $82,959) | | | 82,959 | |
Receivable for Fund shares sold | | | 63,201 | |
Due from Manager | | | 4,152 | |
Dividends receivable | | | 3,738 | |
| | | | |
Total Assets | | | 12,247,482 | |
| | | | |
| |
Liabilities | | | | |
Audit fee payable | | | 24,240 | |
Payable for investments purchased | | | 17,785 | |
Custodian and accounting fees payable | | | 11,934 | |
Legal fees and expenses payable | | | 4,931 | |
Shareholders’ reports payable | | | 3,614 | |
Accrued expenses and other liabilities | | | 2,424 | |
Payable for Fund shares reacquired | | | 935 | |
Affiliated transfer agent fee payable | | | 54 | |
| | | | |
Total Liabilities | | | 65,917 | |
| | | | |
| |
Net Assets | | $ | 12,181,565 | |
| | | | |
| | | | | |
Net assets were comprised of: | | | | |
Shares of beneficial interest, at par | | $ | 1,009 | |
Paid-in capital in excess of par | | | 10,769,201 | |
| | | | |
| | | 10,770,210 | |
Undistributed net investment income | | | 39,571 | |
Accumulated net realized gain on investment transactions | | | 426,533 | |
Net unrealized appreciation on investments | | | 945,251 | |
| | | | |
Net assets, July 31, 2018 | | $ | 12,181,565 | |
| | | | |
| |
Class R6 | | | | |
Net asset value, offering price and redemption price per share,
($12,181,565 ÷ 1,008,696 shares of beneficial interest issued and outstanding) | | $ | 12.08 | |
| | | | |
See Notes to Financial Statements.
| | | | |
| PGIM Day One Underlying Funds | | | 97 | |
PGIM QMA Mid-Cap Core Equity Fund
Statement of Operations
Year Ended July 31, 2018
| | | | |
Net Investment Income (Loss) | | | | |
Income | | | | |
Unaffiliated dividend income (net of $24 foreign withholding tax) | | $ | 165,966 | |
Affiliated dividend income | | | 1,210 | |
Income from securities lending, net (including affiliated income of $23) | | | 117 | |
| | | | |
Total income | | | 167,293 | |
| | | | |
| |
Expenses | | | | |
Management fee | | | 51,256 | |
Custodian and accounting fees | | | 48,562 | |
Audit fee | | | 24,240 | |
Legal fees and expenses | | | 21,150 | |
Shareholders’ reports | | | 14,771 | |
Trustees’ fees | | | 12,167 | |
Commitment fee on syndicated credit agreement | | | 2,073 | |
Insurance expenses | | | 1,000 | |
Transfer agent’s fees and expenses (including affiliated expense of $332) | | | 430 | |
Registration fees | | | 63 | |
Miscellaneous | | | 9,219 | |
| | | | |
Total expenses | | | 184,931 | |
Less: Fee waiver and/or expense reimbursement | | | (97,752 | ) |
| | | | |
Net expenses | | | 87,179 | |
| | | | |
Net investment income (loss) | | | 80,114 | |
| | | | |
| |
Realized And Unrealized Gain (Loss) On Investments | | | | |
Net realized gain (loss) on investment transactions (including affiliated of $(4)) | | | 494,282 | |
Net change in unrealized appreciation (depreciation) on investments | | | 509,418 | |
| | | | |
Net gain (loss) on investment transactions | | | 1,003,700 | |
| | | | |
Net Increase (Decrease) In Net Assets Resulting From Operations | | $ | 1,083,814 | |
| | | | |
See Notes to Financial Statements.
PGIM QMA Mid-Cap Core Equity Fund
Statements of Changes in Net Assets
| | | | | | | | |
| | | Year Ended
July 31, 2018 | | | November 17, 2016*
through
July 31, 2017 | |
Increase (Decrease) in Net Assets | | | | | | | | |
Operations | | | | | | | | |
Net investment income (loss) | | $ | 80,114 | | | $ | 25,323 | |
Net realized gain (loss) on investment transactions | | | 494,282 | | | | 150,420 | |
Net change in unrealized appreciation (depreciation) on investments | | | 509,418 | | | | 435,833 | |
| | | | | | | | |
Net increase (decrease) in net assets resulting from operations | | | 1,083,814 | | | | 611,576 | |
| | | | | | | | |
| | |
Dividends and Distributions | | | | | | | | |
Dividends from net investment income | | | | | | | | |
Class R6 | | | (60,333 | ) | | | (5,533 | ) |
| | | | | | | | |
Distributions from net realized gains | | | | | | | | |
Class R6 | | | (218,169 | ) | | | — | |
| | | | | | | | |
| | |
Fund share transactions | | | | | | | | |
Net proceeds from shares sold | | | 4,425,757 | | | | 7,907,520 | |
Net asset value of shares issued in reinvestment of dividends and distributions | | | 278,502 | | | | 5,533 | |
Cost of shares reacquired | | | (1,754,278 | ) | | | (92,824 | ) |
| | | | | | | | |
Net increase (decrease) in net assets from Fund share transactions | | | 2,949,981 | | | | 7,820,229 | |
| | | | | | | | |
Total increase (decrease) | | | 3,755,293 | | | | 8,426,272 | |
| | |
Net Assets: | | | | | | | | |
Beginning of period | | | 8,426,272 | | | | — | |
| | | | | | | | |
End of period(a) | | $ | 12,181,565 | | | $ | 8,426,272 | |
| | | | | | | | |
(a) Includes undistributed/(distributions in excess of) net investment income of: | | $ | 39,571 | | | $ | 19,790 | |
| | | | | | | | |
| * | Commencement of operations. |
See Notes to Financial Statements.
| | | | |
| PGIM Day One Underlying Funds | | | 99 | |
PGIM QMA US Broad Market Index Fund
Schedule of Investments
as of July 31, 2018
| | | | | | | | |
| Description | | Shares | | | Value | |
LONG-TERM INVESTMENTS 95.4% | | | | | | | | |
| | |
COMMON STOCKS 93.7% | | | | | | | | |
| | |
Aerospace & Defense 2.5% | | | | | | | | |
AAR Corp. | | | 33 | | | $ | 1,565 | |
Aerojet Rocketdyne Holdings, Inc.* | | | 100 | | | | 3,370 | |
Aerovironment, Inc.* | | | 24 | | | | 1,767 | |
Arconic, Inc. | | | 500 | | | | 10,845 | |
Axon Enterprise, Inc.* | | | 80 | | | | 5,434 | |
Boeing Co. (The) | | | 719 | | | | 256,180 | |
Cubic Corp. | | | 30 | | | | 2,043 | |
Curtiss-Wright Corp. | | | 58 | | | | 7,716 | |
Engility Holdings, Inc.* | | | 20 | | | | 692 | |
Esterline Technologies Corp.* | | | 30 | | | | 2,559 | |
General Dynamics Corp. | | | 363 | | | | 72,513 | |
Harris Corp. | | | 160 | | | | 26,392 | |
Huntington Ingalls Industries, Inc. | | | 60 | | | | 13,983 | |
KLX, Inc.* | | | 70 | | | | 5,113 | |
L3 Technologies, Inc. | | | 109 | | | | 23,374 | |
Lockheed Martin Corp. | | | 325 | | | | 105,982 | |
Mercury Systems, Inc.* | | | 50 | | | | 2,086 | |
Moog, Inc. (Class A Stock) | | | 38 | | | | 2,850 | |
National Presto Industries, Inc. | | | 8 | | | | 997 | |
Northrop Grumman Corp. | | | 233 | | | | 70,014 | |
Raytheon Co. | | | 385 | | | | 76,242 | |
Rockwell Collins, Inc. | | | 220 | | | | 30,578 | |
Teledyne Technologies, Inc.* | | | 49 | | | | 10,752 | |
Textron, Inc. | | | 340 | | | | 23,212 | |
TransDigm Group, Inc. | | | 68 | | | | 25,537 | |
Triumph Group, Inc. | | | 40 | | | | 834 | |
United Technologies Corp. | | | 975 | | | | 132,346 | |
| | | | | | | | |
| | | | | | | 914,976 | |
| | |
Air Freight & Logistics 0.6% | | | | | | | | |
Atlas Air Worldwide Holdings, Inc.* | | | 30 | | | | 2,012 | |
C.H. Robinson Worldwide, Inc. | | | 196 | | | | 18,077 | |
Echo Global Logistics, Inc.* | | | 20 | | | | 689 | |
Expeditors International of Washington, Inc. | | | 240 | | | | 18,281 | |
FedEx Corp. | | | 327 | | | | 80,399 | |
Forward Air Corp. | | | 40 | | | | 2,556 | |
Hub Group, Inc. (Class A Stock)* | | | 40 | | | | 1,856 | |
United Parcel Service, Inc. (Class B Stock) | | | 910 | | | | 109,100 | |
| | | | | | | | |
| | | | | | | 232,970 | |
See Notes to Financial Statements.
| | | | | | | | |
| Description | | Shares | | | Value | |
COMMON STOCKS (Continued) | | | | | | | | |
| | |
Airlines 0.4% | | | | | | | | |
Alaska Air Group, Inc. | | | 163 | | | $ | 10,241 | |
Allegiant Travel Co. | | | 18 | | | | 2,225 | |
American Airlines Group, Inc. | | | 556 | | | | 21,984 | |
Delta Air Lines, Inc. | | | 850 | | | | 46,257 | |
Hawaiian Holdings, Inc. | | | 50 | | | | 2,005 | |
JetBlue Airways Corp.* | | | 410 | | | | 7,380 | |
SkyWest, Inc. | | | 60 | | | | 3,594 | |
Southwest Airlines Co. | | | 700 | | | | 40,712 | |
United Continental Holdings, Inc.* | | | 310 | | | | 24,924 | |
| | | | | | | | |
| | | | | | | 159,322 | |
| | |
Auto Components 0.2% | | | | | | | | |
American Axle & Manufacturing Holdings, Inc.* | | | 80 | | | | 1,338 | |
Aptiv PLC | | | 360 | | | | 35,305 | |
BorgWarner, Inc. | | | 260 | | | | 11,965 | |
Cooper Tire & Rubber Co. | | | 53 | | | | 1,513 | |
Cooper-Standard Holdings, Inc.* | | | 20 | | | | 2,696 | |
Dana, Inc. | | | 160 | | | | 3,416 | |
Delphi Technologies PLC | | | 113 | | | | 5,104 | |
Dorman Products, Inc.* | | | 40 | | | | 2,987 | |
Fox Factory Holding Corp.* | | | 50 | | | | 2,485 | |
Gentex Corp. | | | 320 | | | | 7,424 | |
Gentherm, Inc.* | | | 40 | | | | 1,812 | |
Goodyear Tire & Rubber Co. (The) | | | 290 | | | | 7,021 | |
LCI Industries | | | 35 | | | | 3,218 | |
Motorcar Parts of America, Inc.* | | | 20 | | | | 432 | |
Standard Motor Products, Inc. | | | 18 | | | | 878 | |
Superior Industries International, Inc. | | | 20 | | | | 367 | |
Visteon Corp.* | | | 40 | | | | 4,683 | |
| | | | | | | | |
| | | | | | | 92,644 | |
| | |
Automobiles 0.4% | | | | | | | | |
Ford Motor Co. | | | 5,100 | | | | 51,204 | |
General Motors Co. | | | 1,670 | | | | 63,310 | |
Harley-Davidson, Inc. | | | 210 | | | | 9,007 | |
Thor Industries, Inc. | | | 64 | | | | 6,070 | |
Winnebago Industries, Inc. | | | 30 | | | | 1,197 | |
| | | | | | | | |
| | | | | | | 130,788 | |
| | |
Banks 6.1% | | | | | | | | |
Ameris Bancorp | | | 60 | | | | 2,796 | |
See Notes to Financial Statements.
| | | | |
| PGIM Day One Underlying Funds | | | 101 | |
PGIM QMA US Broad Market Index Fund
Schedule of Investments (continued)
as of July 31, 2018
| | | | | | | | |
| Description | | Shares | | | Value | |
COMMON STOCKS (Continued) | | | | | | | | |
| | |
Banks (cont’d.) | | | | | | | | |
Associated Banc-Corp. | | | 221 | | | $ | 5,967 | |
Banc of California, Inc. | | | 30 | | | | 600 | |
BancorpSouth Bank | | | 100 | | | | 3,290 | |
Bank of America Corp. | | | 12,356 | | | | 381,553 | |
Bank of Hawaii Corp. | | | 50 | | | | 4,024 | |
Bank OZK | | | 160 | | | | 6,544 | |
Banner Corp. | | | 50 | | | | 3,148 | |
BB&T Corp. | | | 1,028 | | | | 52,233 | |
Berkshire Hills Bancorp, Inc. | | | 45 | | | | 1,827 | |
Boston Private Financial Holdings, Inc. | | | 70 | | | | 1,008 | |
Brookline Bancorp, Inc. | | | 63 | | | | 1,147 | |
Cathay General Bancorp | | | 100 | | | | 4,159 | |
Central Pacific Financial Corp. | | | 20 | | | | 551 | |
Chemical Financial Corp. | | | 90 | | | | 5,112 | |
Citigroup, Inc. | | | 3,340 | | | | 240,113 | |
Citizens Financial Group, Inc. | | | 636 | | | | 25,300 | |
City Holding Co. | | | 20 | | | | 1,610 | |
Columbia Banking System, Inc. | | | 85 | | | | 3,479 | |
Comerica, Inc. | | | 237 | | | | 22,975 | |
Commerce Bancshares, Inc. | | | 116 | | | | 7,749 | |
Community Bank System, Inc. | | | 60 | | | | 3,795 | |
Cullen/Frost Bankers, Inc. | | | 80 | | | | 8,839 | |
Customers Bancorp, Inc.* | | | 20 | | | | 509 | |
CVB Financial Corp. | | | 130 | | | | 3,110 | |
East West Bancorp, Inc. | | | 200 | | | | 12,948 | |
Fidelity Southern Corp. | | | 20 | | | | 479 | |
Fifth Third Bancorp | | | 900 | | | | 26,631 | |
First BanCorp. (Puerto Rico)* | | | 190 | | | | 1,562 | |
First Commonwealth Financial Corp. | | | 70 | | | | 1,181 | |
First Financial Bancorp | | | 115 | | | | 3,490 | |
First Financial Bankshares, Inc. | | | 90 | | | | 5,094 | |
First Horizon National Corp. | | | 390 | | | | 6,977 | |
First Midwest Bancorp, Inc. | | | 130 | | | | 3,467 | |
FNB Corp. | | | 390 | | | | 5,004 | |
Franklin Financial Network, Inc.* | | | 30 | | | | 1,175 | |
Fulton Financial Corp. | | | 200 | | | | 3,470 | |
Glacier Bancorp, Inc. | | | 103 | | | | 4,398 | |
Great Western Bancorp, Inc. | | | 86 | | | | 3,599 | |
Green Bancorp, Inc. | | | 25 | | | | 608 | |
Hancock Whitney Corp. | | | 122 | | | | 6,130 | |
Hanmi Financial Corp. | | | 20 | | | | 501 | |
Heritage Financial Corp. | | | 35 | | | | 1,227 | |
Home BancShares, Inc. | | | 170 | | | | 3,942 | |
See Notes to Financial Statements.
| | | | | | | | |
| Description | | Shares | | | Value | |
COMMON STOCKS (Continued) | | | | | | | | |
| | |
Banks (cont’d.) | | | | | | | | |
Hope Bancorp, Inc. | | | 110 | | | $ | 1,846 | |
Huntington Bancshares, Inc. | | | 1,440 | | | | 22,234 | |
Independent Bank Corp. | | | 35 | | | | 3,094 | |
International Bancshares Corp. | | | 80 | | | | 3,556 | |
JPMorgan Chase & Co. | | | 4,465 | | | | 513,252 | |
KeyCorp | | | 1,360 | | | | 28,383 | |
LegacyTexas Financial Group, Inc. | | | 40 | | | | 1,753 | |
M&T Bank Corp. | | | 199 | | | | 34,497 | |
MB Financial, Inc. | | | 110 | | | | 5,329 | |
National Bank Holdings Corp. (Class A Stock) | | | 23 | | | | 910 | |
NBT Bancorp, Inc. | | | 40 | | | | 1,610 | |
OFG Bancorp (Puerto Rico) | | | 40 | | | | 666 | |
Old National Bancorp | | | 170 | | | | 3,306 | |
Opus Bank | | | 20 | | | | 566 | |
Pacific Premier Bancorp, Inc.* | | | 40 | | | | 1,480 | |
PacWest Bancorp | | | 170 | | | | 8,537 | |
People’s United Financial, Inc. | | | 430 | | | | 7,839 | |
Pinnacle Financial Partners, Inc. | | | 100 | | | | 6,250 | |
PNC Financial Services Group, Inc. (The) | | | 619 | | | | 89,650 | |
Preferred Bank/Los Angeles CA | | | 20 | | | | 1,245 | |
Prosperity Bancshares, Inc. | | | 90 | | | | 6,313 | |
Regions Financial Corp. | | | 1,440 | | | | 26,798 | |
S&T Bancorp, Inc. | | | 36 | | | | 1,611 | |
Seacoast Banking Corp. of Florida* | | | 50 | | | | 1,466 | |
ServisFirst Bancshares, Inc. | | | 50 | | | | 2,112 | |
Signature Bank | | | 70 | | | | 7,680 | |
Simmons First National Corp. (Class A Stock) | | | 80 | | | | 2,384 | |
Southside Bancshares, Inc. | | | 21 | | | | 720 | |
Sterling Bancorp | | | 265 | | | | 5,883 | |
SunTrust Banks, Inc. | | | 620 | | | | 44,683 | |
SVB Financial Group* | | | 78 | | | | 24,015 | |
Synovus Financial Corp. | | | 150 | | | | 7,413 | |
TCF Financial Corp. | | | 190 | | | | 4,771 | |
Texas Capital Bancshares, Inc.* | | | 70 | | | | 6,356 | |
Tompkins Financial Corp. | | | 20 | | | | 1,714 | |
Trustmark Corp. | | | 90 | | | | 3,167 | |
U.S. Bancorp | | | 2,040 | | | | 108,140 | |
UMB Financial Corp. | | | 66 | | | | 4,745 | |
Umpqua Holdings Corp. | | | 260 | | | | 5,538 | |
United Bankshares, Inc. | | | 132 | | | | 4,877 | |
United Community Banks, Inc. | | | 100 | | | | 3,003 | |
Valley National Bancorp | | | 310 | | | | 3,611 | |
Webster Financial Corp. | | | 120 | | | | 7,744 | |
See Notes to Financial Statements.
| | | | |
| PGIM Day One Underlying Funds | | | 103 | |
PGIM QMA US Broad Market Index Fund
Schedule of Investments (continued)
as of July 31, 2018
| | | | | | | | |
| Description | | Shares | | | Value | |
COMMON STOCKS (Continued) | | | | | | | | |
| | |
Banks (cont’d.) | | | | | | | | |
Wells Fargo & Co. | | | 5,752 | | | $ | 329,532 | |
Westamerica Bancorporation | | | 30 | | | | 1,801 | |
Wintrust Financial Corp. | | | 70 | | | | 6,141 | |
Zions Bancorporation | | | 254 | | | | 13,132 | |
| | | | | | | | |
| | | | | | | 2,254,674 | |
| | |
Beverages 1.5% | | | | | | | | |
Boston Beer Co., Inc. (The) (Class A Stock)* | | | 20 | | | | 5,499 | |
Brown-Forman Corp. (Class B Stock) | | | 337 | | | | 17,935 | |
Coca-Cola Bottling Co. Consolidated | | | 12 | | | | 1,741 | |
Coca-Cola Co. (The) | | | 5,020 | | | | 234,083 | |
Constellation Brands, Inc. (Class A Stock) | | | 221 | | | | 46,461 | |
MGP Ingredients, Inc. | | | 17 | | | | 1,395 | |
Molson Coors Brewing Co. (Class B Stock) | | | 240 | | | | 16,080 | |
Monster Beverage Corp.* | | | 548 | | | | 32,891 | |
PepsiCo, Inc. | | | 1,857 | | | | 213,555 | |
| | | | | | | | |
| | | | | | | 569,640 | |
| | |
Biotechnology 2.3% | | | | | | | | |
AbbVie, Inc. | | | 2,004 | | | | 184,829 | |
Acorda Therapeutics, Inc.* | | | 40 | | | | 998 | |
Alexion Pharmaceuticals, Inc.* | | | 294 | | | | 39,090 | |
AMAG Pharmaceuticals, Inc.* | | | 20 | | | | 441 | |
Amgen, Inc. | | | 872 | | | | 171,392 | |
Biogen, Inc.* | | | 285 | | | | 95,295 | |
Celgene Corp.* | | | 954 | | | | 85,946 | |
Cytokinetics, Inc.* | | | 30 | | | | 220 | |
Eagle Pharmaceuticals, Inc.* | | | 8 | | | | 634 | |
Emergent BioSolutions, Inc.* | | | 40 | | | | 2,174 | |
Enanta Pharmaceuticals, Inc.* | | | 26 | | | | 2,536 | |
Exelixis, Inc.* | | | 350 | | | | 7,245 | |
Gilead Sciences, Inc. | | | 1,714 | | | | 133,401 | |
Incyte Corp.* | | | 230 | | | | 15,304 | |
Ligand Pharmaceuticals, Inc.* | | | 31 | | | | 6,768 | |
MiMedx Group, Inc.* | | | 50 | | | | 212 | |
Momenta Pharmaceuticals, Inc.* | | | 90 | | | | 2,664 | |
Myriad Genetics, Inc.* | | | 90 | | | | 3,937 | |
Progenics Pharmaceuticals, Inc.* | | | 30 | | | | 240 | |
Regeneron Pharmaceuticals, Inc.* | | | 103 | | | | 37,905 | |
REGENXBIO, Inc.* | | | 30 | | | | 2,109 | |
Repligen Corp.* | | | 40 | | | | 1,933 | |
Spectrum Pharmaceuticals, Inc.* | | | 95 | | | | 2,023 | |
See Notes to Financial Statements.
| | | | | | | | |
| Description | | Shares | | | Value | |
COMMON STOCKS (Continued) | | | | | | | | |
| | |
Biotechnology (cont’d.) | | | | | | | | |
United Therapeutics Corp.* | | | 60 | | | $ | 7,375 | |
Vertex Pharmaceuticals, Inc.* | | | 340 | | | | 59,517 | |
| | | | | | | | |
| | | | | | | 864,188 | |
| | |
Building Products 0.3% | | | | | | | | |
A.O. Smith Corp. | | | 200 | | | | 11,906 | |
AAON, Inc. | | | 43 | | | | 1,622 | |
Allegion PLC | | | 130 | | | | 10,600 | |
American Woodmark Corp.* | | | 20 | | | | 1,669 | |
Apogee Enterprises, Inc. | | | 36 | | | | 1,827 | |
Fortune Brands Home & Security, Inc. | | | 190 | | | | 11,020 | |
Gibraltar Industries, Inc.* | | | 26 | | | | 1,130 | |
Griffon Corp. | | | 25 | | | | 448 | |
Insteel Industries, Inc. | | | 10 | | | | 411 | |
Johnson Controls International PLC | | | 1,210 | | | | 45,387 | |
Lennox International, Inc. | | | 51 | | | | 11,071 | |
Masco Corp. | | | 400 | | | | 16,132 | |
Patrick Industries, Inc.* | | | 30 | | | | 1,837 | |
PGT Innovations, Inc.* | | | 40 | | | | 960 | |
Quanex Building Products Corp. | | | 30 | | | | 531 | |
Simpson Manufacturing Co., Inc. | | | 60 | | | | 4,378 | |
Trex Co., Inc.* | | | 74 | | | | 5,753 | |
Universal Forest Products, Inc. | | | 90 | | | | 3,316 | |
| | | | | | | | |
| | | | | | | 129,998 | |
| | |
Capital Markets 2.7% | | | | | | | | |
Affiliated Managers Group, Inc. | | | 73 | | | | 11,681 | |
Ameriprise Financial, Inc. | | | 196 | | | | 28,551 | |
Bank of New York Mellon Corp. (The) | | | 1,318 | | | | 70,473 | |
BlackRock, Inc. | | | 165 | | | | 82,955 | |
Cboe Global Markets, Inc. | | | 146 | | | | 14,181 | |
Charles Schwab Corp. (The) | | | 1,578 | | | | 80,573 | |
CME Group, Inc. | | | 451 | | | | 71,763 | |
Donnelley Financial Solutions, Inc.* | | | 20 | | | | 416 | |
E*TRADE Financial Corp.* | | | 355 | | | | 21,232 | |
Eaton Vance Corp. | | | 150 | | | | 7,969 | |
Evercore, Inc. (Class A Stock) | | | 60 | | | | 6,780 | |
FactSet Research Systems, Inc. | | | 52 | | | | 10,471 | |
Federated Investors, Inc. | | | 110 | | | | 2,662 | |
Franklin Resources, Inc. | | | 410 | | | | 14,071 | |
Goldman Sachs Group, Inc. (The) | | | 463 | | | | 109,930 | |
Greenhill & Co., Inc. | | | 20 | | | | 654 | |
See Notes to Financial Statements.
| | | | |
| PGIM Day One Underlying Funds | | | 105 | |
PGIM QMA US Broad Market Index Fund
Schedule of Investments (continued)
as of July 31, 2018
| | | | | | | | |
| Description | | Shares | | | Value | |
COMMON STOCKS (Continued) | | | | | | | | |
| | |
Capital Markets (cont’d.) | | | | | | | | |
Interactive Brokers Group, Inc. (Class A Stock) | | | 105 | | | $ | 6,285 | |
Intercontinental Exchange, Inc. | | | 758 | | | | 56,024 | |
INTL. FCStone, Inc.* | | | 20 | | | | 1,072 | |
Invesco Ltd. | | | 520 | | | | 14,035 | |
Investment Technology Group, Inc. | | | 30 | | | | 664 | |
Janus Henderson Group PLC (United Kingdom) | | | 208 | | | | 6,770 | |
Legg Mason, Inc. | | | 110 | | | | 3,754 | |
MarketAxess Holdings, Inc. | | | 51 | | | | 9,882 | |
Moody’s Corp. | | | 226 | | | | 38,673 | |
Morgan Stanley | | | 1,780 | | | | 89,997 | |
MSCI, Inc. | | | 120 | | | | 19,943 | |
Nasdaq, Inc. | | | 158 | | | | 14,441 | |
Northern Trust Corp. | | | 277 | | | | 30,254 | |
Piper Jaffray Cos. | | | 16 | | | | 1,238 | |
Raymond James Financial, Inc. | | | 166 | | | | 15,204 | |
S&P Global, Inc. | | | 331 | | | | 66,346 | |
SEI Investments Co. | | | 170 | | | | 10,190 | |
State Street Corp. | | | 480 | | | | 42,389 | |
Stifel Financial Corp. | | | 90 | | | | 4,962 | |
T. Rowe Price Group, Inc. | | | 320 | | | | 38,106 | |
Virtus Investment Partners, Inc. | | | 8 | | | | 1,066 | |
Waddell & Reed Financial, Inc. (Class A Stock) | | | 80 | | | | 1,657 | |
WisdomTree Investments, Inc. | | | 90 | | | | 787 | |
| | | | | | | | |
| | | | | | | 1,008,101 | |
| | |
Chemicals 1.9% | | | | | | | | |
A Schulman, Inc. | | | 33 | | | | 1,431 | |
AdvanSix, Inc.* | | | 24 | | | | 971 | |
Air Products & Chemicals, Inc. | | | 290 | | | | 47,609 | |
Albemarle Corp. | | | 141 | | | | 13,282 | |
American Vanguard Corp. | | | 30 | | | | 651 | |
Ashland Global Holdings, Inc. | | | 82 | | | | 6,733 | |
Balchem Corp. | | | 50 | | | | 5,014 | |
Cabot Corp. | | | 90 | | | | 5,949 | |
CF Industries Holdings, Inc. | | | 300 | | | | 13,326 | |
Chemours Co. (The) | | | 228 | | | | 10,445 | |
DowDuPont, Inc. | | | 3,053 | | | | 209,955 | |
Eastman Chemical Co. | | | 190 | | | | 19,688 | |
Ecolab, Inc. | | | 341 | | | | 47,979 | |
Flotek Industries, Inc.* | | | 40 | | | | 124 | |
FMC Corp. | | | 185 | | | | 16,628 | |
FutureFuel Corp. | | | 30 | | | | 413 | |
See Notes to Financial Statements.
| | | | | | | | |
| Description | | Shares | | | Value | |
COMMON STOCKS (Continued) | | | | | | | | |
| | |
Chemicals (cont’d.) | | | | | | | | |
Hawkins, Inc. | | | 10 | | | $ | 373 | |
HB Fuller Co. | | | 70 | | | | 3,968 | |
Ingevity Corp.* | | | 50 | | | | 4,983 | |
Innophos Holdings, Inc. | | | 30 | | | | 1,355 | |
Innospec, Inc. | | | 36 | | | | 2,914 | |
International Flavors & Fragrances, Inc. | | | 102 | | | | 13,542 | |
Koppers Holdings, Inc.* | | | 20 | | | | 751 | |
Kraton Corp.* | | | 32 | | | | 1,539 | |
LSB Industries, Inc.* | | | 50 | | | | 328 | |
LyondellBasell Industries NV (Class A Stock) | | | 420 | | | | 46,532 | |
Minerals Technologies, Inc. | | | 54 | | | | 4,082 | |
Mosaic Co. (The) | | | 450 | | | | 13,549 | |
NewMarket Corp. | | | 20 | | | | 8,189 | |
Olin Corp. | | | 200 | | | | 5,902 | |
PolyOne Corp. | | | 117 | | | | 5,247 | |
PPG Industries, Inc. | | | 333 | | | | 36,850 | |
Praxair, Inc. | | | 380 | | | | 63,650 | |
Quaker Chemical Corp. | | | 20 | | | | 3,551 | |
Rayonier Advanced Materials, Inc. | | | 40 | | | | 722 | |
RPM International, Inc. | | | 170 | | | | 10,943 | |
Scotts Miracle-Gro Co. (The) | | | 50 | | | | 3,971 | |
Sensient Technologies Corp. | | | 50 | | | | 3,468 | |
Sherwin-Williams Co. (The) | | | 108 | | | | 47,599 | |
Stepan Co. | | | 28 | | | | 2,452 | |
Tredegar Corp. | | | 20 | | | | 521 | |
Valvoline, Inc. | | | 242 | | | | 5,467 | |
| | | | | | | | |
| | | | | | | 692,646 | |
| | |
Commercial Services & Supplies 0.5% | | | | | | | | |
ABM Industries, Inc. | | | 60 | | | | 1,872 | |
Brady Corp. (Class A Stock) | | | 50 | | | | 1,913 | |
Brink’s Co. (The) | | | 70 | | | | 5,589 | |
Cintas Corp. | | | 116 | | | | 23,720 | |
Clean Harbors, Inc.* | | | 75 | | | | 4,270 | |
Copart, Inc.* | | | 260 | | | | 14,921 | |
Deluxe Corp. | | | 70 | | | | 4,125 | |
Essendant, Inc. | | | 30 | | | | 499 | |
Healthcare Services Group, Inc. | | | 100 | | | | 4,026 | |
Herman Miller, Inc. | | | 76 | | | | 2,877 | |
HNI Corp. | | | 50 | | | | 2,163 | |
Interface, Inc. | | | 60 | | | | 1,344 | |
LSC Communications, Inc. | | | 24 | | | | 360 | |
See Notes to Financial Statements.
| | | | |
| PGIM Day One Underlying Funds | | | 107 | |
PGIM QMA US Broad Market Index Fund
Schedule of Investments (continued)
as of July 31, 2018
| | | | | | | | |
| Description | | Shares | | | Value | |
COMMON STOCKS (Continued) | | | | | | | | |
| | |
Commercial Services & Supplies (cont’d.) | | | | | | | | |
Matthews International Corp. (Class A Stock) | | | 40 | | | $ | 2,102 | |
Mobile Mini, Inc. | | | 60 | | | | 2,559 | |
MSA Safety, Inc. | | | 53 | | | | 5,347 | |
Multi-Color Corp. | | | 15 | | | | 995 | |
Pitney Bowes, Inc. | | | 150 | | | | 1,310 | |
Republic Services, Inc. | | | 290 | | | | 21,019 | |
Rollins, Inc. | | | 120 | | | | 6,593 | |
RR Donnelley & Sons Co. | | | 30 | | | | 177 | |
Stericycle, Inc.* | | | 116 | | | | 8,104 | |
Team, Inc.* | | | 20 | | | | 436 | |
Tetra Tech, Inc. | | | 80 | | | | 4,864 | |
UniFirst Corp. | | | 20 | | | | 3,743 | |
US Ecology, Inc. | | | 30 | | | | 2,034 | |
Viad Corp. | | | 30 | | | | 1,722 | |
Waste Management, Inc. | | | 517 | | | | 46,530 | |
| | | | | | | | |
| | | | | | | 175,214 | |
| | |
Communications Equipment 1.0% | | | | | | | | |
ADTRAN, Inc. | | | 20 | | | | 325 | |
Applied Optoelectronics, Inc.* | | | 20 | | | | 769 | |
ARRIS International PLC* | | | 230 | | | | 5,810 | |
CalAmp Corp.* | | | 30 | | | | 683 | |
Ciena Corp.* | | | 156 | | | | 3,962 | |
Cisco Systems, Inc. | | | 6,150 | | | | 260,083 | |
Comtech Telecommunications Corp. | | | 32 | | | | 1,075 | |
Digi International, Inc.* | | | 30 | | | | 405 | |
Extreme Networks, Inc.* | | | 120 | | | | 1,020 | |
F5 Networks, Inc.* | | | 80 | | | | 13,710 | |
Finisar Corp.* | | | 110 | | | | 1,854 | |
Harmonic, Inc.* | | | 50 | | | | 230 | |
InterDigital, Inc. | | | 40 | | | | 3,298 | |
Juniper Networks, Inc. | | | 430 | | | | 11,326 | |
Lumentum Holdings, Inc.* | | | 80 | | | | 4,180 | |
Motorola Solutions, Inc. | | | 213 | | | | 25,837 | |
NETGEAR, Inc.* | | | 50 | | | | 3,293 | |
NetScout Systems, Inc.* | | | 100 | | | | 2,680 | |
Oclaro, Inc.* | | | 160 | | | | 1,354 | |
Plantronics, Inc. | | | 52 | | | | 3,570 | |
ViaSat, Inc.* | | | 75 | | | | 5,275 | |
Viavi Solutions, Inc.* | | | 290 | | | | 2,935 | |
| | | | | | | | |
| | | | | | | 353,674 | |
See Notes to Financial Statements.
| | | | | | | | |
| Description | | Shares | | | Value | |
COMMON STOCKS (Continued) | | | | | | | | |
| | |
Construction & Engineering 0.2% | | | | | | | | |
AECOM* | | | 214 | | | $ | 7,182 | |
Aegion Corp.* | | | 20 | | | | 496 | |
Comfort Systems USA, Inc. | | | 37 | | | | 2,055 | |
Dycom Industries, Inc.* | | | 40 | | | | 3,566 | |
EMCOR Group, Inc. | | | 80 | | | | 6,156 | |
Fluor Corp. | | | 180 | | | | 9,225 | |
Granite Construction, Inc. | | | 60 | | | | 3,237 | |
Jacobs Engineering Group, Inc. | | | 160 | | | | 10,821 | |
KBR, Inc. | | | 170 | | | | 3,397 | |
MYR Group, Inc.* | | | 20 | | | | 738 | |
Orion Group Holdings, Inc.* | | | 50 | | | | 458 | |
Quanta Services, Inc.* | | | 180 | | | | 6,132 | |
Valmont Industries, Inc. | | | 35 | | | | 4,888 | |
| | | | | | | | |
| | | | | | | 58,351 | |
| | |
Construction Materials 0.1% | | | | | | | | |
Eagle Materials, Inc. | | | 63 | | | | 6,259 | |
Martin Marietta Materials, Inc. | | | 83 | | | | 16,552 | |
U.S. Concrete, Inc.* | | | 20 | | | | 1,010 | |
Vulcan Materials Co. | | | 176 | | | | 19,712 | |
| | | | | | | | |
| | | | | | | 43,533 | |
| | |
Consumer Finance 0.6% | | | | | | | | |
American Express Co. | | | 942 | | | | 93,748 | |
Capital One Financial Corp. | | | 635 | | | | 59,893 | |
Discover Financial Services | | | 458 | | | | 32,706 | |
Encore Capital Group, Inc.* | | | 20 | | | | 722 | |
Enova International, Inc.* | | | 40 | | | | 1,240 | |
EZCORP, Inc. (Class A Stock)* | | | 40 | | | | 458 | |
FirstCash, Inc. | | | 62 | | | | 5,035 | |
Green Dot Corp. (Class A Stock)* | | | 60 | | | | 4,759 | |
Navient Corp. | | | 310 | | | | 4,095 | |
PRA Group, Inc.* | | | 50 | | | | 1,960 | |
SLM Corp.* | | | 510 | | | | 5,758 | |
Synchrony Financial | | | 930 | | | | 26,914 | |
World Acceptance Corp.* | | | 10 | | | | 999 | |
| | | | | | | | |
| | | | | | | 238,287 | |
| | |
Containers & Packaging 0.4% | | | | | | | | |
AptarGroup, Inc. | | | 80 | | | | 8,194 | |
Avery Dennison Corp. | | | 120 | | | | 13,762 | |
See Notes to Financial Statements.
| | | | |
| PGIM Day One Underlying Funds | | | 109 | |
PGIM QMA US Broad Market Index Fund
Schedule of Investments (continued)
as of July 31, 2018
| | | | | | | | |
| Description | | Shares | | | Value | |
COMMON STOCKS (Continued) | | | | | | | | |
| | |
Containers & Packaging (cont’d.) | | | | | | | | |
Ball Corp. | | | 440 | | | $ | 17,147 | |
Bemis Co., Inc. | | | 110 | | | | 5,050 | |
Greif, Inc. (Class A Stock) | | | 28 | | | | 1,525 | |
International Paper Co. | | | 550 | | | | 29,551 | |
Myers Industries, Inc. | | | 35 | | | | 754 | |
Owens-Illinois, Inc.* | | | 180 | | | | 3,362 | |
Packaging Corp. of America | | | 130 | | | | 14,677 | |
Sealed Air Corp. | | | 200 | | | | 8,814 | |
Silgan Holdings, Inc. | | | 70 | | | | 1,926 | |
Sonoco Products Co. | | | 130 | | | | 7,257 | |
WestRock Co. | | | 340 | | | | 19,713 | |
| | | | | | | | |
| | | | | | | 131,732 | |
| | |
Distributors 0.1% | | | | | | | | |
Core-Mark Holding Co., Inc. | | | 30 | | | | 725 | |
Genuine Parts Co. | | | 202 | | | | 19,657 | |
LKQ Corp.* | | | 410 | | | | 13,743 | |
Pool Corp. | | | 57 | | | | 8,735 | |
| | | | | | | | |
| | | | | | | 42,860 | |
| | |
Diversified Consumer Services 0.1% | | | | | | | | |
Adtalem Global Education, Inc.* | | | 80 | | | | 4,364 | |
American Public Education, Inc.* | | | 20 | | | | 882 | |
Capella Education Co. | | | 18 | | | | 1,872 | |
Career Education Corp.* | | | 50 | | | | 920 | |
Graham Holdings Co. | | | 7 | | | | 3,913 | |
H&R Block, Inc. | | | 270 | | | | 6,793 | |
Regis Corp.* | | | 30 | | | | 524 | |
Service Corp. International | | | 230 | | | | 9,051 | |
Sotheby’s* | | | 40 | | | | 2,124 | |
Strayer Education, Inc. | | | 14 | | | | 1,650 | |
| | | | | | | | |
| | | | | | | 32,093 | |
| | |
Diversified Financial Services 1.4% | | | | | | | | |
Berkshire Hathaway, Inc. (Class B Stock)* | | | 2,527 | | | | 500,017 | |
Jefferies Financial Group, Inc. | | | 366 | | | | 8,876 | |
| | | | | | | | |
| | | | | | | 508,893 | |
| | |
Diversified Telecommunication Services 1.7% | | | | | | | | |
AT&T, Inc. | | | 9,492 | | | | 303,459 | |
See Notes to Financial Statements.
| | | | | | | | |
| Description | | Shares | | | Value | |
COMMON STOCKS (Continued) | | | | | | | | |
| | |
Diversified Telecommunication Services (cont’d.) | | | | | �� | | | |
ATN International, Inc. | | | 10 | | | $ | 639 | |
CenturyLink, Inc. | | | 1,268 | | | | 23,800 | |
Cincinnati Bell, Inc.* | | | 40 | | | | 534 | |
Cogent Communications Holdings, Inc. | | | 60 | | | | 3,117 | |
Consolidated Communications Holdings, Inc. | | | 20 | | | | 255 | |
Frontier Communications Corp. | | | 35 | | | | 183 | |
Iridium Communications, Inc.* | | | 50 | | | | 865 | |
Verizon Communications, Inc. | | | 5,422 | | | | 279,992 | |
Vonage Holdings Corp.* | | | 250 | | | | 3,202 | |
| | | | | | | | |
| | | | | | | 616,046 | |
| | |
Electric Utilities 1.6% | | | | | | | | |
ALLETE, Inc. | | | 70 | | | | 5,427 | |
Alliant Energy Corp. | | | 310 | | | | 13,321 | |
American Electric Power Co., Inc. | | | 640 | | | | 45,530 | |
Duke Energy Corp. | | | 928 | | | | 75,743 | |
Edison International | | | 430 | | | | 28,651 | |
El Paso Electric Co. | | | 60 | | | | 3,738 | |
Entergy Corp. | | | 240 | | | | 19,507 | |
Evergy, Inc. | | | 361 | | | | 20,248 | |
Eversource Energy | | | 420 | | | | 25,502 | |
Exelon Corp. | | | 1,262 | | | | 53,635 | |
FirstEnergy Corp. | | | 590 | | | | 20,904 | |
Hawaiian Electric Industries, Inc. | | | 130 | | | | 4,572 | |
IDACORP, Inc. | | | 70 | | | | 6,597 | |
NextEra Energy, Inc. | | | 620 | | | | 103,875 | |
OGE Energy Corp. | | | 263 | | | | 9,531 | |
PG&E Corp. | | | 670 | | | | 28,864 | |
Pinnacle West Capital Corp. | | | 142 | | | | 11,421 | |
PNM Resources, Inc. | | | 100 | | | | 3,935 | |
PPL Corp. | | | 894 | | | | 25,720 | |
Southern Co. (The) | | | 1,336 | | | | 64,930 | |
Xcel Energy, Inc. | | | 660 | | | | 30,928 | |
| | | | | | | | |
| | | | | | | 602,579 | |
| | |
Electrical Equipment 0.5% | | | | | | | | |
Acuity Brands, Inc. | | | 53 | | | | 7,369 | |
AMETEK, Inc. | | | 310 | | | | 24,118 | |
AZZ, Inc. | | | 30 | | | | 1,626 | |
Eaton Corp. PLC | | | 578 | | | | 48,072 | |
Emerson Electric Co. | | | 830 | | | | 59,992 | |
Encore Wire Corp. | | | 22 | | | | 1,073 | |
See Notes to Financial Statements.
| | | | |
| PGIM Day One Underlying Funds | | | 111 | |
PGIM QMA US Broad Market Index Fund
Schedule of Investments (continued)
as of July 31, 2018
| | | | | | | | |
| Description | | Shares | | | Value | |
COMMON STOCKS (Continued) | | | | | | | | |
| | |
Electrical Equipment (cont’d.) | | | | | | | | |
EnerSys | | | 65 | | | $ | 5,335 | |
Hubbell, Inc. | | | 76 | | | | 9,367 | |
nVent Electric PLC (United Kingdom) | | | 210 | | | | 5,754 | |
Powell Industries, Inc. | | | 10 | | | | 367 | |
Regal Beloit Corp. | | | 70 | | | | 6,016 | |
Rockwell Automation, Inc. | | | 170 | | | | 31,885 | |
Vicor Corp.* | | | 30 | | | | 1,726 | |
| | | | | | | | |
| | | | | | | 202,700 | |
| | |
Electronic Equipment, Instruments & Components 0.7% | | | | | | | | |
Amphenol Corp. (Class A Stock) | | | 400 | | | | 37,404 | |
Anixter International, Inc.* | | | 42 | | | | 3,062 | |
Arrow Electronics, Inc.* | | | 110 | | | | 8,342 | |
Avnet, Inc. | | | 150 | | | | 6,577 | |
Badger Meter, Inc. | | | 30 | | | | 1,564 | |
Bel Fuse, Inc. (Class B Stock) | | | 20 | | | | 450 | |
Belden, Inc. | | | 60 | | | | 3,885 | |
Benchmark Electronics, Inc. | | | 50 | | | | 1,210 | |
Cognex Corp. | | | 220 | | | | 11,612 | |
Coherent, Inc.* | | | 34 | | | | 5,374 | |
Control4 Corp.* | | | 20 | | | | 509 | |
Corning, Inc. | | | 1,100 | | | | 36,498 | |
CTS Corp. | | | 40 | | | | 1,396 | |
Daktronics, Inc. | | | 50 | | | | 429 | |
Electro Scientific Industries, Inc.* | | | 10 | | | | 180 | |
ePlus, Inc.* | | | 16 | | | | 1,578 | |
Fabrinet (Thailand)* | | | 40 | | | | 1,565 | |
FARO Technologies, Inc.* | | | 20 | | | | 1,302 | |
FLIR Systems, Inc. | | | 180 | | | | 10,548 | |
II-VI, Inc.* | | | 60 | | | | 2,352 | |
Insight Enterprises, Inc.* | | | 40 | | | | 2,011 | |
IPG Photonics Corp.* | | | 52 | | | | 8,530 | |
Itron, Inc.* | | | 40 | | | | 2,448 | |
Jabil, Inc. | | | 210 | | | | 5,916 | |
KEMET Corp.* | | | 45 | | | | 1,170 | |
Keysight Technologies, Inc.* | | | 245 | | | | 14,210 | |
Knowles Corp.* | | | 80 | | | | 1,389 | |
Littelfuse, Inc. | | | 35 | | | | 7,589 | |
Methode Electronics, Inc. | | | 36 | | | | 1,413 | |
MTS Systems Corp. | | | 20 | | | | 1,090 | |
National Instruments Corp. | | | 130 | | | | 5,695 | |
OSI Systems, Inc.* | | | 20 | | | | 1,595 | |
See Notes to Financial Statements.
| | | | | | | | |
| Description | | Shares | | | Value | |
COMMON STOCKS (Continued) | | | | | | | | |
| | |
Electronic Equipment, Instruments & Components (cont’d.) | | | | | | | | |
Park Electrochemical Corp. | | | 23 | | | $ | 509 | |
Plexus Corp.* | | | 37 | | | | 2,199 | |
Rogers Corp.* | | | 26 | | | | 3,031 | |
Sanmina Corp.* | | | 70 | | | | 2,037 | |
ScanSource, Inc.* | | | 20 | | | | 825 | |
SYNNEX Corp. | | | 46 | | | | 4,438 | |
TE Connectivity Ltd. | | | 454 | | | | 42,481 | |
Tech Data Corp.* | | | 42 | | | | 3,503 | |
Trimble, Inc.* | | | 310 | | | | 10,943 | |
TTM Technologies, Inc.* | | | 70 | | | | 1,215 | |
VeriFone Systems, Inc.* | | | 100 | | | | 2,290 | |
Vishay Intertechnology, Inc. | | | 160 | | | | 4,000 | |
Zebra Technologies Corp. (Class A Stock)* | | | 70 | | | | 9,655 | |
| | | | | | | | |
| | | | | | | 276,019 | |
| | |
Energy Equipment & Services 0.8% | | | | | | | | |
Apergy Corp.* | | | 96 | | | | 3,936 | |
Archrock, Inc. | | | 110 | | | | 1,502 | |
Baker Hughes a GE Co. | | | 530 | | | | 18,328 | |
Bristow Group, Inc.* | | | 50 | | | | 699 | |
C&J Energy Services, Inc.* | | | 70 | | | | 1,628 | |
CARBO Ceramics, Inc.* | | | 30 | | | | 280 | |
Core Laboratories NV | | | 65 | | | | 7,288 | |
Diamond Offshore Drilling, Inc.* | | | 30 | | | | 576 | |
Dril-Quip, Inc.* | | | 50 | | | | 2,578 | |
Ensco PLC (Class A Stock) | | | 564 | | | | 4,191 | |
Era Group, Inc.* | | | 30 | | | | 424 | |
Exterran Corp.* | | | 18 | | | | 499 | |
Geospace Technologies Corp.* | | | 20 | | | | 281 | |
Gulf Island Fabrication, Inc. | | | 40 | | | | 362 | |
Halliburton Co. | | | 1,154 | | | | 48,953 | |
Helix Energy Solutions Group, Inc.* | | | 140 | | | | 1,401 | |
Helmerich & Payne, Inc. | | | 140 | | | | 8,589 | |
Matrix Service Co.* | | | 40 | | | | 798 | |
McDermott International, Inc.* | | | 220 | | | | 3,962 | |
Nabors Industries Ltd. | | | 437 | | | | 2,613 | |
National Oilwell Varco, Inc. | | | 510 | | | | 24,796 | |
Newpark Resources, Inc.* | | | 60 | | | | 663 | |
Noble Corp. PLC* | | | 200 | | | | 1,168 | |
Oceaneering International, Inc. | | | 120 | | | | 3,283 | |
Oil States International, Inc.* | | | 70 | | | | 2,443 | |
Patterson-UTI Energy, Inc. | | | 260 | | | | 4,472 | |
See Notes to Financial Statements.
| | | | |
| PGIM Day One Underlying Funds | | | 113 | |
PGIM QMA US Broad Market Index Fund
Schedule of Investments (continued)
as of July 31, 2018
| | | | | | | | |
| Description | | Shares | | | Value | |
COMMON STOCKS (Continued) | | | | | | | | |
| | |
Energy Equipment & Services (cont’d.) | | | | | | | | |
Pioneer Energy Services Corp.* | | | 75 | | | $ | 248 | |
ProPetro Holding Corp.* | | | 85 | | | | 1,397 | |
Rowan Cos. PLC (Class A Stock)* | | | 90 | | | | 1,303 | |
Schlumberger Ltd. | | | 1,813 | | | | 122,414 | |
SEACOR Holdings, Inc.* | | | 25 | | | | 1,319 | |
Superior Energy Services, Inc.* | | | 110 | | | | 1,082 | |
TechnipFMC PLC (United Kingdom) | | | 560 | | | | 18,228 | |
TETRA Technologies, Inc.* | | | 90 | | | | 388 | |
Transocean Ltd.* | | | 510 | | | | 6,564 | |
Unit Corp.* | | | 50 | | | | 1,245 | |
US Silica Holdings, Inc. | | | 90 | | | | 2,426 | |
| | | | | | | | |
| | | | | | | 302,327 | |
| | |
Equity Real Estate Investment Trusts (REITs) 3.0% | | | | | | | | |
Acadia Realty Trust | | | 110 | | | | 2,979 | |
Agree Realty Corp. | | | 50 | | | | 2,662 | |
Alexander & Baldwin, Inc. | | | 62 | | | | 1,485 | |
Alexandria Real Estate Equities, Inc. | | | 142 | | | | 18,096 | |
American Assets Trust, Inc., REIT | | | 40 | | | | 1,537 | |
American Campus Communities, Inc. | | | 170 | | | | 7,013 | |
American Tower Corp., REIT | | | 583 | | | | 86,424 | |
Apartment Investment & Management Co. (Class A Stock) | | | 210 | | | | 8,957 | |
Armada Hoffler Properties, Inc. | | | 30 | | | | 453 | |
AvalonBay Communities, Inc., REIT | | | 180 | | | | 31,833 | |
Boston Properties, Inc. | | | 204 | | | | 25,608 | |
Camden Property Trust, REIT | | | 126 | | | | 11,666 | |
CareTrust REIT, Inc. | | | 60 | | | | 1,015 | |
CBL & Associates Properties, Inc. | | | 85 | | | | 463 | |
Cedar Realty Trust, Inc. | | | 70 | | | | 333 | |
Chatham Lodging Trust | | | 25 | | | | 539 | |
Chesapeake Lodging Trust | | | 90 | | | | 2,882 | |
Community Healthcare Trust, Inc., REIT | | | 20 | | | | 600 | |
CoreCivic, Inc. | | | 140 | | | | 3,590 | |
CoreSite Realty Corp., REIT | | | 45 | | | | 5,045 | |
Corporate Office Properties Trust | | | 130 | | | | 3,866 | |
Cousins Properties, Inc. | | | 510 | | | | 4,753 | |
Crown Castle International Corp., REIT | | | 546 | | | | 60,513 | |
CyrusOne, Inc. | | | 130 | | | | 8,050 | |
DCT Industrial Trust, Inc. | | | 130 | | | | 8,693 | |
DiamondRock Hospitality Co., REIT | | | 250 | | | | 2,980 | |
Digital Realty Trust, Inc., REIT | | | 270 | | | | 32,783 | |
Douglas Emmett, Inc. | | | 200 | | | | 7,768 | |
See Notes to Financial Statements.
| | | | | | | | |
| Description | | Shares | | | Value | |
COMMON STOCKS (Continued) | | | | | | | | |
| | |
Equity Real Estate Investment Trusts (REITs) (cont’d.) | | | | | | | | |
Duke Realty Corp., REIT | | | 470 | | | $ | 13,686 | |
Easterly Government Properties, Inc., REIT | | | 55 | | | | 1,042 | |
EastGroup Properties, Inc. | | | 52 | | | | 4,957 | |
Education Realty Trust, Inc. | | | 110 | | | | 4,550 | |
EPR Properties | | | 90 | | | | 5,984 | |
Equinix, Inc., REIT | | | 104 | | | | 45,685 | |
Equity Residential | | | 494 | | | | 32,322 | |
Essex Property Trust, Inc. | | | 94 | | | | 22,602 | |
Extra Space Storage, Inc., REIT | | | 169 | | | | 15,881 | |
Federal Realty Investment Trust, REIT | | | 103 | | | | 12,927 | |
First Industrial Realty Trust, Inc., REIT | | | 160 | | | | 5,208 | |
Four Corners Property Trust, Inc., REIT | | | 50 | | | | 1,245 | |
Franklin Street Properties Corp. | | | 50 | | | | 441 | |
GEO Group, Inc. (The) | | | 155 | | | | 4,011 | |
Getty Realty Corp. | | | 25 | | | | 716 | |
GGP, Inc. | | | 796 | | | | 16,971 | |
Global Net Lease, Inc. | | | 70 | | | | 1,481 | |
Government Properties Income Trust | | | 75 | | | | 1,130 | |
HCP, Inc. | | | 610 | | | | 15,799 | |
Healthcare Realty Trust, Inc. | | | 145 | | | | 4,308 | |
Hersha Hospitality Trust | | | 20 | | | | 432 | |
Highwoods Properties, Inc., REIT | | | 130 | | | | 6,384 | |
Hospitality Properties Trust | | | 200 | | | | 5,654 | |
Host Hotels & Resorts, Inc. | | | 970 | | | | 20,312 | |
Independence Realty Trust, Inc. | | | 40 | | | | 406 | |
Iron Mountain, Inc. | | | 370 | | | | 12,991 | |
JBG SMITH Properties, REIT | | | 130 | | | | 4,745 | |
Kilroy Realty Corp., REIT | | | 130 | | | | 9,484 | |
Kimco Realty Corp. | | | 520 | | | | 8,679 | |
Kite Realty Group Trust | | | 80 | | | | 1,350 | |
Lamar Advertising Co. (Class A Stock) | | | 110 | | | | 8,099 | |
LaSalle Hotel Properties | | | 150 | | | | 5,201 | |
Lexington Realty Trust | | | 180 | | | | 1,582 | |
Liberty Property Trust | | | 204 | | | | 8,743 | |
Life Storage, Inc., REIT | | | 65 | | | | 6,237 | |
LTC Properties, Inc. | | | 40 | | | | 1,687 | |
Macerich Co. (The), REIT | | | 136 | | | | 8,032 | |
Mack-Cali Realty Corp. | | | 80 | | | | 1,558 | |
Medical Properties Trust, Inc. | | | 430 | | | | 6,196 | |
Mid-America Apartment Communities, Inc. | | | 154 | | | | 15,520 | |
National Retail Properties, Inc. | | | 194 | | | | 8,654 | |
National Storage Affiliates Trust | | | 60 | | | | 1,730 | |
Omega Healthcare Investors, Inc. | | | 260 | | | | 7,719 | |
See Notes to Financial Statements.
| | | | |
| PGIM Day One Underlying Funds | | | 115 | |
PGIM QMA US Broad Market Index Fund
Schedule of Investments (continued)
as of July 31, 2018
| | | | | | | | |
| Description | | Shares | | | Value | |
COMMON STOCKS (Continued) | | | | | | | | |
| | |
Equity Real Estate Investment Trusts (REITs) (cont’d.) | | | | | | | | |
Pennsylvania Real Estate Investment Trust | | | 30 | | | $ | 319 | |
PotlatchDeltic Corp. | | | 78 | | | | 3,647 | |
ProLogis, Inc., REIT | | | 710 | | | | 46,590 | |
PS Business Parks, Inc. | | | 26 | | | | 3,322 | |
Public Storage | | | 201 | | | | 43,784 | |
Ramco-Gershenson Properties Trust | | | 40 | | | | 526 | |
Rayonier, Inc. | | | 160 | | | | 5,602 | |
Realty Income Corp. | | | 370 | | | | 20,635 | |
Regency Centers Corp. | | | 198 | | | | 12,599 | |
Retail Opportunity Investments Corp. | | | 90 | | | | 1,702 | |
Sabra Health Care REIT, Inc. | | | 213 | | | | 4,603 | |
Saul Centers, Inc. | | | 10 | | | | 533 | |
SBA Communications Corp., REIT* | | | 154 | | | | 24,370 | |
Senior Housing Properties Trust | | | 310 | | | | 5,530 | |
Simon Property Group, Inc., REIT | | | 410 | | | | 72,246 | |
SL Green Realty Corp. | | | 121 | | | | 12,476 | |
Summit Hotel Properties, Inc. | | | 95 | | | | 1,344 | |
Tanger Factory Outlet Centers, Inc. | | | 80 | | | | 1,908 | |
Taubman Centers, Inc. | | | 80 | | | | 4,964 | |
UDR, Inc., REIT | | | 355 | | | | 13,660 | |
Uniti Group, Inc. | | | 200 | | | | 3,536 | |
Universal Health Realty Income Trust | | | 10 | | | | 673 | |
Urban Edge Properties | | | 90 | | | | 2,041 | |
Urstadt Biddle Properties, Inc. (Class A Stock) | | | 20 | | | | 445 | |
Ventas, Inc. | | | 466 | | | | 26,273 | |
Vornado Realty Trust | | | 230 | | | | 16,542 | |
Washington Prime Group, Inc. | | | 130 | | | | 1,044 | |
Weingarten Realty Investors | | | 140 | | | | 4,231 | |
Welltower, Inc., REIT | | | 480 | | | | 30,048 | |
Weyerhaeuser Co. | | | 980 | | | | 33,496 | |
Whitestone REIT | | | 30 | | | | 390 | |
| | | | | | | | |
| | | | | | | 1,104,006 | |
| | |
Food & Staples Retailing 1.2% | | | | | | | | |
Andersons, Inc. (The) | | | 20 | | | | 705 | |
Casey’s General Stores, Inc. | | | 50 | | | | 5,469 | |
Costco Wholesale Corp. | | | 581 | | | | 127,070 | |
Kroger Co. (The) | | | 1,052 | | | | 30,508 | |
SpartanNash Co. | | | 20 | | | | 479 | |
Sprouts Farmers Market, Inc.* | | | 130 | | | | 2,794 | |
SUPERVALU, Inc.* | | | 17 | | | | 549 | |
Sysco Corp. | | | 622 | | | | 41,805 | |
See Notes to Financial Statements.
| | | | | | | | |
| Description | | Shares | | | Value | |
COMMON STOCKS (Continued) | | | | | | | | |
| | |
Food & Staples Retailing (cont’d.) | | | | | | | | |
United Natural Foods, Inc.* | | | 50 | | | $ | 1,610 | |
Walgreens Boots Alliance, Inc. | | | 1,114 | | | | 75,329 | |
Walmart, Inc. | | | 1,901 | | | | 169,626 | |
| | | | | | | | |
| | | | | | | 455,944 | |
| | |
Food Products 1.1% | | | | | | | | |
Archer-Daniels-Midland Co. | | | 720 | | | | 34,747 | |
B&G Foods, Inc. | | | 76 | | | | 2,386 | |
Calavo Growers, Inc. | | | 20 | | | | 1,850 | |
Cal-Maine Foods, Inc.* | | | 43 | | | | 1,935 | |
Campbell Soup Co. | | | 240 | | | | 9,816 | |
Conagra Brands, Inc. | | | 506 | | | | 18,575 | |
Darling Ingredients, Inc.* | | | 190 | | | | 3,817 | |
Dean Foods Co. | | | 40 | | | | 393 | |
Flowers Foods, Inc. | | | 200 | | | | 4,080 | |
General Mills, Inc. | | | 790 | | | | 36,388 | |
Hain Celestial Group, Inc. (The)* | | | 110 | | | | 3,128 | |
Hershey Co. (The) | | | 195 | | | | 19,151 | |
Hormel Foods Corp. | | | 360 | | | | 12,949 | |
Ingredion, Inc. | | | 98 | | | | 9,928 | |
J&J Snack Foods Corp. | | | 20 | | | | 2,899 | |
J.M. Smucker Co. (The) | | | 152 | | | | 16,890 | |
John B Sanfilippo & Son, Inc. | | | 10 | | | | 769 | |
Kellogg Co. | | | 340 | | | | 24,150 | |
Kraft Heinz Co. (The) | | | 788 | | | | 47,477 | |
Lamb Weston Holdings, Inc. | | | 200 | | | | 14,054 | |
Lancaster Colony Corp. | | | 25 | | | | 3,626 | |
McCormick & Co., Inc. | | | 160 | | | | 18,807 | |
Mondelez International, Inc. (Class A Stock) | | | 1,936 | | | | 83,984 | |
Post Holdings, Inc.* | | | 90 | | | | 7,790 | |
Sanderson Farms, Inc. | | | 25 | | | | 2,521 | |
Seneca Foods Corp. (Class A Stock)* | | | 16 | | | | 431 | |
Tootsie Roll Industries, Inc. | | | 20 | | | | 598 | |
TreeHouse Foods, Inc.* | | | 70 | | | | 3,324 | |
Tyson Foods, Inc. (Class A Stock) | | | 402 | | | | 23,175 | |
| | | | | | | | |
| | | | | | | 409,638 | |
| | |
Gas Utilities 0.2% | | | | | | | | |
Atmos Energy Corp. | | | 146 | | | | 13,413 | |
National Fuel Gas Co. | | | 110 | | | | 5,907 | |
New Jersey Resources Corp. | | | 100 | | | | 4,625 | |
Northwest Natural Gas Co. | | | 36 | | | | 2,345 | |
See Notes to Financial Statements.
| | | | |
| PGIM Day One Underlying Funds | | | 117 | |
PGIM QMA US Broad Market Index Fund
Schedule of Investments (continued)
as of July 31, 2018
| | | | | | | | |
| Description | | Shares | | | Value | |
COMMON STOCKS (Continued) | | | | | | | | |
| | |
Gas Utilities (cont’d.) | | | | | | | | |
ONE Gas, Inc. | | | 72 | | | $ | 5,547 | |
South Jersey Industries, Inc. | | | 120 | | | | 4,072 | |
Southwest Gas Holdings, Inc. | | | 66 | | | | 5,161 | |
Spire, Inc. | | | 68 | | | | 4,869 | |
UGI Corp. | | | 230 | | | | 12,222 | |
| | | | | | | | |
| | | | | | | 58,161 | |
| | |
Health Care Equipment & Supplies 3.0% | | | | | | | | |
Abaxis, Inc. | | | 32 | | | | 2,656 | |
Abbott Laboratories | | | 2,292 | | | | 150,218 | |
ABIOMED, Inc.* | | | 57 | | | | 20,208 | |
Align Technology, Inc.* | | | 96 | | | | 34,238 | |
AngioDynamics, Inc.* | | | 30 | | | | 634 | |
Anika Therapeutics, Inc.* | | | 10 | | | | 400 | |
Avanos Medical, Inc.* | | | 70 | | | | 3,864 | |
Baxter International, Inc. | | | 650 | | | | 47,093 | |
Becton, Dickinson and Co. | | | 356 | | | | 89,132 | |
Boston Scientific Corp.* | | | 1,810 | | | | 60,834 | |
Cantel Medical Corp. | | | 50 | | | | 4,636 | |
CONMED Corp. | | | 30 | | | | 2,220 | |
Cooper Cos., Inc. (The) | | | 66 | | | | 17,193 | |
CryoLife, Inc.* | | | 30 | | | | 894 | |
Cutera, Inc.* | | | 10 | | | | 400 | |
Danaher Corp. | | | 811 | | | | 83,192 | |
DENTSPLY SIRONA, Inc. | | | 310 | | | | 14,914 | |
Edwards Lifesciences Corp.* | | | 278 | | | | 39,601 | |
Globus Medical, Inc. (Class A Stock)* | | | 102 | | | | 5,251 | |
Haemonetics Corp.* | | | 70 | | | | 6,835 | |
Heska Corp.* | | | 7 | | | | 702 | |
Hill-Rom Holdings, Inc. | | | 90 | | | | 8,478 | |
Hologic, Inc.* | | | 360 | | | | 15,448 | |
ICU Medical, Inc.* | | | 20 | | | | 5,736 | |
IDEXX Laboratories, Inc.* | | | 120 | | | | 29,392 | |
Inogen, Inc.* | | | 26 | | | | 5,181 | |
Integer Holdings Corp.* | | | 40 | | | | 2,858 | |
Integra LifeSciences Holdings Corp.* | | | 95 | | | | 5,921 | |
Intuitive Surgical, Inc.* | | | 155 | | | | 78,769 | |
Invacare Corp. | | | 40 | | | | 714 | |
Lantheus Holdings, Inc.* | | | 10 | | | | 145 | |
LeMaitre Vascular, Inc. | | | 17 | | | | 612 | |
LivaNova PLC* | | | 65 | | | | 7,158 | |
Masimo Corp.* | | | 67 | | | | 6,661 | |
See Notes to Financial Statements.
| | | | | | | | |
| Description | | Shares | | | Value | |
COMMON STOCKS (Continued) | | | | | | | | |
| | |
Health Care Equipment & Supplies (cont’d.) | | | | | | | | |
Medtronic PLC | | | 1,786 | | | $ | 161,151 | |
Meridian Bioscience, Inc. | | | 44 | | | | 695 | |
Merit Medical Systems, Inc.* | | | 66 | | | | 3,584 | |
Natus Medical, Inc.* | | | 40 | | | | 1,460 | |
Neogen Corp.* | | | 73 | | | | 6,015 | |
NuVasive, Inc.* | | | 65 | | | | 3,773 | |
OraSure Technologies, Inc.* | | | 25 | | | | 420 | |
Orthofix International NV* | | | 20 | | | | 1,210 | |
ResMed, Inc. | | | 186 | | | | 19,675 | |
STERIS PLC | | | 113 | | | | 12,935 | |
Stryker Corp. | | | 422 | | | | 68,891 | |
Surmodics, Inc.* | | | 20 | | | | 1,176 | |
Tactile Systems Technology, Inc.* | | | 15 | | | �� | 721 | |
Teleflex, Inc. | | | 67 | | | | 18,272 | |
Varex Imaging Corp.* | | | 39 | | | | 1,491 | |
Varian Medical Systems, Inc.* | | | 120 | | | | 13,854 | |
West Pharmaceutical Services, Inc. | | | 100 | | | | 10,965 | |
Zimmer Biomet Holdings, Inc. | | | 266 | | | | 33,388 | |
| | | | | | | | |
| | | | | | | 1,111,864 | |
| | |
Health Care Providers & Services 2.9% | | | | | | | | |
Acadia Healthcare Co., Inc.* | | | 105 | | | | 4,145 | |
Aceto Corp. | | | 30 | | | | 98 | |
Aetna, Inc. | | | 435 | | | | 81,950 | |
Amedisys, Inc.* | | | 46 | | | | 4,307 | |
AmerisourceBergen Corp. | | | 216 | | | | 17,675 | |
AMN Healthcare Services, Inc.* | | | 60 | | | | 3,630 | |
Anthem, Inc. | | | 335 | | | | 84,755 | |
BioTelemetry, Inc.* | | | 39 | | | | 2,048 | |
Cardinal Health, Inc. | | | 410 | | | | 20,480 | |
Centene Corp.* | | | 272 | | | | 35,450 | |
Chemed Corp. | | | 26 | | | | 8,217 | |
Cigna Corp. | | | 319 | | | | 57,235 | |
Community Health Systems, Inc.* | | | 60 | | | | 200 | |
CorVel Corp.* | | | 14 | | | | 803 | |
Cross Country Healthcare, Inc.* | | | 30 | | | | 352 | |
CVS Health Corp. | | | 1,339 | | | | 86,848 | |
DaVita, Inc.* | | | 190 | | | | 13,353 | |
Diplomat Pharmacy, Inc.* | | | 40 | | | | 831 | |
Encompass Health Corp. | | | 130 | | | | 9,832 | |
Ensign Group, Inc. (The) | | | 60 | | | | 2,164 | |
Envision Healthcare Corp.* | | | 159 | | | | 7,037 | |
See Notes to Financial Statements.
| | | | |
| PGIM Day One Underlying Funds | | | 119 | |
PGIM QMA US Broad Market Index Fund
Schedule of Investments (continued)
as of July 31, 2018
| | | | | | | | |
| Description | | Shares | | | Value | |
COMMON STOCKS (Continued) | | | | | | | | |
| | |
Health Care Providers & Services (cont’d.) | | | | | | | | |
Express Scripts Holding Co.* | | | 746 | | | $ | 59,277 | |
HCA Healthcare, Inc. | | | 369 | | | | 45,841 | |
HealthEquity, Inc.* | | | 70 | | | | 5,285 | |
Henry Schein, Inc.* | | | 208 | | | | 16,517 | |
Humana, Inc. | | | 185 | | | | 58,123 | |
Laboratory Corp. of America Holdings* | | | 135 | | | | 23,671 | |
LHC Group, Inc.* | | | 49 | | | | 4,218 | |
LifePoint Health, Inc.* | | | 50 | | | | 3,240 | |
Magellan Health, Inc.* | | | 34 | | | | 2,474 | |
McKesson Corp. | | | 271 | | | | 34,038 | |
MEDNAX, Inc.* | | | 120 | | | | 5,135 | |
Molina Healthcare, Inc.* | | | 60 | | | | 6,245 | |
Owens & Minor, Inc. | | | 30 | | | | 566 | |
Patterson Cos., Inc. | | | 74 | | | | 1,814 | |
Providence Service Corp. (The)* | | | 16 | | | | 1,121 | |
Quest Diagnostics, Inc. | | | 184 | | | | 19,821 | |
Quorum Health Corp.* | | | 50 | | | | 242 | |
Select Medical Holdings Corp.* | | | 100 | | | | 2,080 | |
Tenet Healthcare Corp.* | | | 100 | | | | 3,763 | |
Tivity Health, Inc.* | | | 28 | | | | 944 | |
UnitedHealth Group, Inc. | | | 1,261 | | | | 319,310 | |
Universal Health Services, Inc. (Class B Stock) | | | 120 | | | | 14,652 | |
US Physical Therapy, Inc. | | | 20 | | | | 2,095 | |
WellCare Health Plans, Inc.* | | | 60 | | | | 16,045 | |
| | | | | | | | |
| | | | | | | 1,087,927 | |
| | |
Health Care Technology 0.1% | | | | | | | | |
Allscripts Healthcare Solutions, Inc.* | | | 230 | | | | 2,815 | |
Cerner Corp.* | | | 420 | | | | 26,074 | |
Computer Programs & Systems, Inc. | | | 20 | | | | 624 | |
HealthStream, Inc. | | | 20 | | | | 562 | |
HMS Holdings Corp.* | | | 70 | | | | 1,675 | |
Medidata Solutions, Inc.* | | | 85 | | | | 6,316 | |
Omnicell, Inc.* | | | 50 | | | | 2,975 | |
Quality Systems, Inc.* | | | 30 | | | | 604 | |
Tabula Rasa HealthCare, Inc.* | | | 20 | | | | 1,165 | |
| | | | | | | | |
| | | | | | | 42,810 | |
| | |
Hotels, Restaurants & Leisure 1.7% | | | | | | | | |
Belmond Ltd. (United Kingdom) (Class A Stock)* | | | 40 | | | | 450 | |
BJ’s Restaurants, Inc. | | | 20 | | | | 1,265 | |
Boyd Gaming Corp. | | | 102 | | | | 3,810 | |
See Notes to Financial Statements.
| | | | | | | | |
| Description | | Shares | | | Value | |
COMMON STOCKS (Continued) | | | | | | | | |
| | |
Hotels, Restaurants & Leisure (cont’d.) | | | | | | | | |
Brinker International, Inc. | | | 50 | | | $ | 2,358 | |
Carnival Corp. | | | 540 | | | | 31,990 | |
Cheesecake Factory, Inc. (The) | | | 50 | | | | 2,801 | |
Chipotle Mexican Grill, Inc.* | | | 35 | | | | 15,178 | |
Churchill Downs, Inc. | | | 19 | | | | 5,433 | |
Chuy’s Holdings, Inc.* | | | 20 | | | | 633 | |
Cracker Barrel Old Country Store, Inc. | | | 32 | | | | 4,688 | |
Darden Restaurants, Inc. | | | 170 | | | | 18,180 | |
Dave & Buster’s Entertainment, Inc.* | | | 50 | | | | 2,457 | |
Dine Brands Global, Inc. | | | 20 | | | | 1,421 | |
Domino’s Pizza, Inc. | | | 58 | | | | 15,234 | |
Dunkin’ Brands Group, Inc. | | | 112 | | | | 7,799 | |
El Pollo Loco Holdings, Inc.* | | | 31 | | | | 360 | |
Fiesta Restaurant Group, Inc.* | | | 30 | | | | 872 | |
Hilton Worldwide Holdings, Inc. | | | 363 | | | | 28,554 | |
ILG, Inc. | | | 136 | | | | 4,669 | |
International Speedway Corp. (Class A Stock) | | | 20 | | | | 866 | |
Jack in the Box, Inc. | | | 34 | | | | 2,864 | |
Marriott International, Inc. (Class A Stock) | | | 395 | | | | 50,497 | |
Marriott Vacations Worldwide Corp. | | | 30 | | | | 3,573 | |
McDonald’s Corp. | | | 1,028 | | | | 161,951 | |
MGM Resorts International | | | 632 | | | | 19,826 | |
Monarch Casino & Resort, Inc.* | | | 20 | | | | 953 | |
Norwegian Cruise Line Holdings Ltd.* | | | 276 | | | | 13,808 | |
Papa John’s International, Inc. | | | 36 | | | | 1,511 | |
Penn National Gaming, Inc.* | | | 110 | | | | 3,525 | |
Red Robin Gourmet Burgers, Inc.* | | | 10 | | | | 473 | |
Royal Caribbean Cruises Ltd. | | | 220 | | | | 24,807 | |
Ruth’s Hospitality Group, Inc. | | | 30 | | | | 869 | |
Scientific Games Corp.* | | | 80 | | | | 3,844 | |
Shake Shack, Inc. (Class A Stock)* | | | 20 | | | | 1,247 | |
Six Flags Entertainment Corp. | | | 110 | | | | 7,144 | |
Sonic Corp. | | | 40 | | | | 1,406 | |
Starbucks Corp. | | | 1,801 | | | | 94,354 | |
Texas Roadhouse, Inc. | | | 80 | | | | 5,027 | |
Wendy’s Co. (The) | | | 220 | | | | 3,670 | |
Wingstop, Inc. | | | 30 | | | | 1,480 | |
Wyndham Hotels & Resorts, Inc. | | | 130 | | | | 7,540 | |
Wyndham Worldwide Corp. | | | 130 | | | | 5,996 | |
Wynn Resorts Ltd. | | | 118 | | | | 19,680 | |
Yum! Brands, Inc. | | | 427 | | | | 33,857 | |
| | | | | | | | |
| | | | | | | 618,920 | |
See Notes to Financial Statements.
| | | | |
| PGIM Day One Underlying Funds | | | 121 | |
PGIM QMA US Broad Market Index Fund
Schedule of Investments (continued)
as of July 31, 2018
| | | | | | | | |
| Description | | Shares | | | Value | |
COMMON STOCKS (Continued) | | | | | | | | |
| | |
Household Durables 0.4% | | | | | | | | |
Cavco Industries, Inc.* | | | 14 | | | $ | 2,974 | |
D.R. Horton, Inc. | | | 450 | | | | 19,665 | |
Ethan Allen Interiors, Inc. | | | 20 | | | | 450 | |
Garmin Ltd. | | | 146 | | | | 9,118 | |
Helen of Troy Ltd.* | | | 40 | | | | 4,582 | |
Installed Building Products, Inc.* | | | 20 | | | | 1,092 | |
iRobot Corp.* | | | 35 | | | | 2,774 | |
KB Home | | | 80 | | | | 1,900 | |
La-Z-Boy, Inc. | | | 50 | | | | 1,525 | |
Leggett & Platt, Inc. | | | 180 | | | | 7,843 | |
Lennar Corp. (Class A Stock) | | | 362 | | | | 18,922 | |
LGI Homes, Inc.* | | | 20 | | | | 1,034 | |
M/I Homes, Inc.* | | | 20 | | | | 517 | |
MDC Holdings, Inc. | | | 44 | | | | 1,278 | |
Meritage Homes Corp.* | | | 40 | | | | 1,726 | |
Mohawk Industries, Inc.* | | | 90 | | | | 16,952 | |
Newell Brands, Inc. | | | 626 | | | | 16,395 | |
NVR, Inc.* | | | 5 | | | | 13,797 | |
PulteGroup, Inc. | | | 330 | | | | 9,402 | |
Tempur Sealy International, Inc.* | | | 70 | | | | 3,421 | |
Toll Brothers, Inc. | | | 180 | | | | 6,347 | |
TopBuild Corp.* | | | 50 | | | | 3,714 | |
TRI Pointe Group, Inc.* | | | 195 | | | | 2,763 | |
Tupperware Brands Corp. | | | 80 | | | | 2,937 | |
Universal Electronics, Inc.* | | | 10 | | | | 349 | |
Whirlpool Corp. | | | 86 | | | | 11,274 | |
William Lyon Homes (Class A Stock)* | | | 15 | | | | 327 | |
| | | | | | | | |
| | | | | | | 163,078 | |
| | |
Household Products 1.2% | | | | | | | | |
Central Garden & Pet Co.* | | | 20 | | | | 863 | |
Central Garden & Pet Co. (Class A Stock)* | | | 30 | | | | 1,204 | |
Church & Dwight Co., Inc. | | | 327 | | | | 18,279 | |
Clorox Co. (The) | | | 176 | | | | 23,790 | |
Colgate-Palmolive Co. | | | 1,140 | | | | 76,391 | |
Energizer Holdings, Inc. | | | 76 | | | | 4,840 | |
Kimberly-Clark Corp. | | | 462 | | | | 52,603 | |
Procter & Gamble Co. (The) | | | 3,292 | | | | 266,257 | |
WD-40 Co. | | | 19 | | | | 3,043 | |
| | | | | | | | |
| | | | | | | 447,270 | |
See Notes to Financial Statements.
| | | | | | | | |
| Description | | Shares | | | Value | |
COMMON STOCKS (Continued) | | | | | | | | |
| | |
Independent Power & Renewable Electricity Producers 0.1% | | | | | | | | |
AES Corp. | | | 930 | | | $ | 12,425 | |
NRG Energy, Inc. | | | 370 | | | | 11,718 | |
| | | | | | | | |
| | | | | | | 24,143 | |
| | |
Industrial Conglomerates 1.4% | | | | | | | | |
3M Co. | | | 780 | | | | 165,610 | |
Carlisle Cos., Inc. | | | 85 | | | | 10,441 | |
General Electric Co. | | | 11,310 | | | | 154,155 | |
Honeywell International, Inc. | | | 986 | | | | 157,415 | |
Raven Industries, Inc. | | | 40 | | | | 1,552 | |
Roper Technologies, Inc. | | | 138 | | | | 41,662 | |
| | | | | | | | |
| | | | | | | 530,835 | |
| | |
Insurance 2.5% | | | | | | | | |
Aflac, Inc. | | | 1,008 | | | | 46,912 | |
Alleghany Corp. | | | 21 | | | | 13,215 | |
Allstate Corp. (The) | | | 460 | | | | 43,755 | |
Ambac Financial Group, Inc.* | | | 55 | | | | 1,123 | |
American Equity Investment Life Holding Co. | | | 100 | | | | 3,573 | |
American Financial Group, Inc. | | | 98 | | | | 11,044 | |
American International Group, Inc. | | | 1,180 | | | | 65,148 | |
AMERISAFE, Inc. | | | 22 | | | | 1,382 | |
Aon PLC | | | 322 | | | | 46,223 | |
Arthur J. Gallagher & Co. | | | 240 | | | | 17,124 | |
Aspen Insurance Holdings Ltd. (Bermuda) | | | 80 | | | | 3,236 | |
Assurant, Inc. | | | 80 | | | | 8,824 | |
Brighthouse Financial, Inc.* | | | 140 | | | | 6,080 | |
Brown & Brown, Inc. | | | 300 | | | | 8,778 | |
Chubb Ltd. | | | 612 | | | | 85,509 | |
Cincinnati Financial Corp. | | | 194 | | | | 14,672 | |
CNO Financial Group, Inc. | | | 170 | | | | 3,459 | |
eHealth, Inc.* | | | 30 | | | | 712 | |
Employers Holdings, Inc. | | | 36 | | | | 1,672 | |
Everest Re Group Ltd. | | | 56 | | | | 12,228 | |
First American Financial Corp. | | | 150 | | | | 8,400 | |
Genworth Financial, Inc. (Class A Stock)* | | | 550 | | | | 2,530 | |
Hanover Insurance Group, Inc. (The) | | | 58 | | | | 7,274 | |
Hartford Financial Services Group, Inc. (The) | | | 480 | | | | 25,296 | |
HCI Group, Inc. | | | 14 | | | | 599 | |
Horace Mann Educators Corp. | | | 40 | | | | 1,748 | |
James River Group Holdings Ltd. | | | 35 | | | | 1,449 | |
Kemper Corp. | | | 81 | | | | 6,464 | |
See Notes to Financial Statements.
| | | | |
| PGIM Day One Underlying Funds | | | 123 | |
PGIM QMA US Broad Market Index Fund
Schedule of Investments (continued)
as of July 31, 2018
| | | | | | | | |
| Description | | Shares | | | Value | |
COMMON STOCKS (Continued) | | | | | | | | |
| | |
Insurance (cont’d.) | | | | | | | | |
Lincoln National Corp. | | | 280 | | | $ | 19,068 | |
Loews Corp. | | | 336 | | | | 17,062 | |
Maiden Holdings Ltd. | | | 30 | | | | 261 | |
Marsh & McLennan Cos., Inc. | | | 662 | | | | 55,184 | |
Mercury General Corp. | | | 40 | | | | 2,057 | |
MetLife, Inc. | | | 1,340 | | | | 61,292 | |
Navigators Group, Inc. (The) | | | 30 | | | | 1,810 | |
Old Republic International Corp. | | | 290 | | | | 6,180 | |
Primerica, Inc. | | | 70 | | | | 8,036 | |
Principal Financial Group, Inc. | | | 360 | | | | 20,909 | |
ProAssurance Corp. | | | 60 | | | | 2,478 | |
Progressive Corp. (The) | | | 768 | | | | 46,088 | |
Prudential Financial, Inc. | | | 550 | | | | 55,500 | |
Reinsurance Group of America, Inc. | | | 92 | | | | 13,018 | |
RenaissanceRe Holdings Ltd. (Bermuda) | | | 51 | | | | 6,724 | |
RLI Corp. | | | 60 | | | | 4,486 | |
Safety Insurance Group, Inc. | | | 18 | | | | 1,649 | |
Selective Insurance Group, Inc. | | | 80 | | | | 4,784 | |
Stewart Information Services Corp. | | | 23 | | | | 1,045 | |
Third Point Reinsurance Ltd. (Bermuda)* | | | 80 | | | | 1,008 | |
Torchmark Corp. | | | 150 | | | | 13,210 | |
Travelers Cos., Inc. (The) | | | 358 | | | | 46,590 | |
United Fire Group, Inc. | | | 20 | | | | 1,206 | |
United Insurance Holdings Corp. | | | 30 | | | | 623 | |
Universal Insurance Holdings, Inc. | | | 30 | | | | 1,332 | |
Unum Group | | | 275 | | | | 10,926 | |
Willis Towers Watson PLC | | | 176 | | | | 28,058 | |
WR Berkley Corp. | | | 132 | | | | 10,007 | |
XL Group Ltd. (Bermuda) | | | 342 | | | | 19,231 | |
| | | | | | | | |
| | | | | | | 908,251 | |
| | |
Internet & Direct Marketing Retail 3.5% | | | | | | | | |
Amazon.com, Inc.* | | | 527 | | | | 936,711 | |
Booking Holdings, Inc.* | | | 64 | | | | 129,838 | |
Expedia Group, Inc. | | | 161 | | | | 21,548 | |
FTD Cos., Inc.* | | | 20 | | | | 72 | |
Netflix, Inc.* | | | 572 | | | | 193,021 | |
Nutrisystem, Inc. | | | 40 | | | | 1,600 | |
PetMed Express, Inc. | | | 20 | | | | 743 | |
Shutterfly, Inc.* | | | 47 | | | | 3,866 | |
TripAdvisor, Inc.* | | | 150 | | | | 8,699 | |
| | | | | | | | |
| | | | | | | 1,296,098 | |
See Notes to Financial Statements.
| | | | | | | | |
| Description | | Shares | | | Value | |
COMMON STOCKS (Continued) | | | | | | | | |
| | |
Internet Software & Services 4.4% | | | | | | | | |
Akamai Technologies, Inc.* | | | 230 | | | $ | 17,310 | |
Alarm.com Holdings, Inc.* | | | 30 | | | | 1,286 | |
Alphabet, Inc. (Class A Stock)* | | | 394 | | | | 483,525 | |
Alphabet, Inc. (Class C Stock)* | | | 398 | | | | 484,469 | |
Blucora, Inc.* | | | 60 | | | | 2,085 | |
Cars.com, Inc.* | | | 83 | | | | 2,355 | |
eBay, Inc.* | | | 1,200 | | | | 40,140 | |
Facebook, Inc. (Class A Stock)* | | | 3,145 | | | | 542,764 | |
j2 Global, Inc. | | | 61 | | | | 5,175 | |
Liquidity Services, Inc.* | | | 50 | | | | 353 | |
LivePerson, Inc.* | | | 50 | | | | 1,160 | |
LogMeIn, Inc. | | | 67 | | | | 5,430 | |
NIC, Inc. | | | 30 | | | | 492 | |
QuinStreet, Inc.* | | | 90 | | | | 1,193 | |
Shutterstock, Inc.* | | | 20 | | | | 921 | |
SPS Commerce, Inc.* | | | 28 | | | | 2,402 | |
Stamps.com, Inc.* | | | 23 | | | | 6,003 | |
Twitter, Inc.* | | | 850 | | | | 27,090 | |
VeriSign, Inc.* | | | 129 | | | | 18,735 | |
XO Group, Inc.* | | | 60 | | | | 1,691 | |
| | | | | | | | |
| | | | | | | 1,644,579 | |
| | |
IT Services 4.1% | | | | | | | | |
Accenture PLC (Class A Stock) | | | 848 | | | | 135,112 | |
Acxiom Corp.* | | | 100 | | | | 4,054 | |
Alliance Data Systems Corp. | | | 65 | | | | 14,617 | |
Automatic Data Processing, Inc. | | | 582 | | | | 78,564 | |
Broadridge Financial Solutions, Inc. | | | 158 | | | | 17,851 | |
CACI International, Inc. (Class A Stock)* | | | 36 | | | | 6,307 | |
Cardtronics PLC (Class A Stock)* | | | 34 | | | | 861 | |
Cognizant Technology Solutions Corp. (Class A Stock) | | | 780 | | | | 63,570 | |
Convergys Corp. | | | 120 | | | | 2,952 | |
CoreLogic, Inc.* | | | 110 | | | | 5,357 | |
CSG Systems International, Inc. | | | 30 | | | | 1,220 | |
DXC Technology Co. | | | 383 | | | | 32,455 | |
EVERTEC, Inc. (Puerto Rico) | | | 60 | | | | 1,398 | |
ExlService Holdings, Inc.* | | | 54 | | | | 3,221 | |
Fidelity National Information Services, Inc. | | | 441 | | | | 45,480 | |
Fiserv, Inc.* | | | 550 | | | | 41,514 | |
FleetCor Technologies, Inc.* | | | 124 | | | | 26,908 | |
Gartner, Inc.* | | | 121 | | | | 16,387 | |
Global Payments, Inc. | | | 207 | | | | 23,302 | |
See Notes to Financial Statements.
| | | | |
| PGIM Day One Underlying Funds | | | 125 | |
PGIM QMA US Broad Market Index Fund
Schedule of Investments (continued)
as of July 31, 2018
| | | | | | | | |
| Description | | Shares | | | Value | |
COMMON STOCKS (Continued) | | | | | | | | |
| | |
IT Services (cont’d.) | | | | | | | | |
International Business Machines Corp. | | | 1,125 | | | $ | 163,046 | |
Jack Henry & Associates, Inc. | | | 100 | | | | 13,470 | |
Leidos Holdings, Inc. | | | 190 | | | | 13,000 | |
ManTech International Corp. (Class A Stock) | | | 36 | | | | 2,155 | |
Mastercard, Inc. (Class A Stock) | | | 1,206 | | | | 238,788 | |
MAXIMUS, Inc. | | | 90 | | | | 5,833 | |
Paychex, Inc. | | | 424 | | | | 29,265 | |
PayPal Holdings, Inc.* | | | 1,472 | | | | 120,910 | |
Perficient, Inc.* | | | 30 | | | | 790 | |
Perspecta, Inc. | | | 181 | | | | 3,928 | |
Sabre Corp. | | | 315 | | | | 7,755 | |
Science Applications International Corp. | | | 50 | | | | 4,219 | |
Sykes Enterprises, Inc.* | | | 40 | | | | 1,186 | |
Teradata Corp.* | | | 170 | | | | 6,509 | |
Total System Services, Inc. | | | 230 | | | | 21,054 | |
Travelport Worldwide Ltd. | | | 160 | | | | 3,024 | |
TTEC Holdings, Inc. | | | 20 | | | | 643 | |
Virtusa Corp.* | | | 40 | | | | 2,113 | |
Visa, Inc. (Class A Stock) | | | 2,343 | | | | 320,382 | |
Western Union Co. (The) | | | 590 | | | | 11,894 | |
WEX, Inc.* | | | 53 | | | | 10,061 | |
| | | | | | | | |
| | | | | | | 1,501,155 | |
| | |
Leisure Products 0.1% | | | | | | | | |
Brunswick Corp. | | | 120 | | | | 7,716 | |
Callaway Golf Co. | | | 90 | | | | 1,732 | |
Hasbro, Inc. | | | 150 | | | | 14,941 | |
Mattel, Inc. | | | 410 | | | | 6,507 | |
Nautilus, Inc.* | | | 30 | | | | 427 | |
Polaris Industries, Inc. | | | 80 | | | | 8,434 | |
Sturm Ruger & Co., Inc. | | | 18 | | | | 976 | |
Vista Outdoor, Inc.* | | | 60 | | | | 974 | |
| | | | | | | | |
| | | | | | | 41,707 | |
| | |
Life Sciences Tools & Services 0.9% | | | | | | | | |
Agilent Technologies, Inc. | | | 420 | | | | 27,737 | |
Bio-Rad Laboratories, Inc. (Class A Stock)* | | | 30 | | | | 9,200 | |
Bio-Techne Corp. | | | 57 | | | | 9,156 | |
Cambrex Corp.* | | | 36 | | | | 2,250 | |
Charles River Laboratories International, Inc.* | | | 70 | | | | 8,701 | |
Illumina, Inc.* | | | 196 | | | | 63,575 | |
IQVIA Holdings, Inc.* | | | 215 | | | | 26,217 | |
See Notes to Financial Statements.
| | | | | | | | |
| Description | | Shares | | | Value | |
COMMON STOCKS (Continued) | | | | | | | | |
| | |
Life Sciences Tools & Services (cont’d.) | | | | | | | | |
Luminex Corp. | | | 43 | | | $ | 1,456 | |
Mettler-Toledo International, Inc.* | | | 34 | | | | 20,145 | |
PerkinElmer, Inc. | | | 148 | | | | 11,719 | |
PRA Health Sciences, Inc.* | | | 72 | | | | 7,570 | |
Syneos Health, Inc.* | | | 85 | | | | 4,188 | |
Thermo Fisher Scientific, Inc. | | | 532 | | | | 124,770 | |
Waters Corp.* | | | 103 | | | | 20,319 | |
| | | | | | | | |
| | | | | | | 337,003 | |
| | |
Machinery 1.8% | | | | | | | | |
Actuant Corp. (Class A Stock) | | | 50 | | | | 1,428 | |
AGCO Corp. | | | 90 | | | | 5,672 | |
Alamo Group, Inc. | | | 10 | | | | 930 | |
Albany International Corp. (Class A Stock) | | | 50 | | | | 3,308 | |
Astec Industries, Inc. | | | 20 | | | | 983 | |
Barnes Group, Inc. | | | 70 | | | | 4,750 | |
Briggs & Stratton Corp. | | | 20 | | | | 354 | |
Caterpillar, Inc. | | | 786 | | | | 113,027 | |
Chart Industries, Inc.* | | | 38 | | | | 2,967 | |
CIRCOR International, Inc. | | | 16 | | | | 710 | |
Crane Co. | | | 64 | | | | 5,796 | |
Cummins, Inc. | | | 206 | | | | 29,419 | |
Deere & Co. | | | 431 | | | | 62,404 | |
Donaldson Co., Inc. | | | 160 | | | | 7,632 | |
Dover Corp. | | | 202 | | | | 16,762 | |
EnPro Industries, Inc. | | | 30 | | | | 2,292 | |
ESCO Technologies, Inc. | | | 30 | | | | 1,868 | |
Federal Signal Corp. | | | 60 | | | | 1,425 | |
Flowserve Corp. | | | 160 | | | | 7,093 | |
Fortive Corp. | | | 400 | | | | 32,832 | |
Franklin Electric Co., Inc. | | | 43 | | | | 2,126 | |
Graco, Inc. | | | 216 | | | | 9,966 | |
Greenbrier Cos., Inc. (The) | | | 40 | | | | 2,266 | |
Harsco Corp.* | | | 80 | | | | 2,028 | |
Hillenbrand, Inc. | | | 74 | | | | 3,715 | |
IDEX Corp. | | | 100 | | | | 15,358 | |
Illinois Tool Works, Inc. | | | 405 | | | | 58,049 | |
Ingersoll-Rand PLC | | | 326 | | | | 32,114 | |
ITT, Inc. | | | 120 | | | | 6,800 | |
John Bean Technologies Corp. | | | 40 | | | | 4,424 | |
Kennametal, Inc. | | | 90 | | | | 3,506 | |
Lincoln Electric Holdings, Inc. | | | 76 | | | | 7,139 | |
See Notes to Financial Statements.
| | | | |
| PGIM Day One Underlying Funds | | | 127 | |
PGIM QMA US Broad Market Index Fund
Schedule of Investments (continued)
as of July 31, 2018
| | | | | | | | |
| Description | | Shares | | | Value | |
COMMON STOCKS (Continued) | | | | | | | | |
| | |
Machinery (cont’d.) | | | | | | | | |
Lindsay Corp. | | | 15 | | | $ | 1,412 | |
Lydall, Inc.* | | | 10 | | | | 464 | |
Mueller Industries, Inc. | | | 50 | | | | 1,656 | |
Nordson Corp. | | | 66 | | | | 8,851 | |
Oshkosh Corp. | | | 100 | | | | 7,525 | |
PACCAR, Inc. | | | 460 | | | | 30,231 | |
Parker-Hannifin Corp. | | | 174 | | | | 29,415 | |
Pentair PLC (United Kingdom) | | | 210 | | | | 9,376 | |
Proto Labs, Inc.* | | | 37 | | | | 4,612 | |
Snap-on, Inc. | | | 75 | | | | 12,719 | |
SPX Corp.* | | | 50 | | | | 1,855 | |
SPX FLOW, Inc.* | | | 60 | | | | 2,851 | |
Standex International Corp. | | | 16 | | | | 1,658 | |
Stanley Black & Decker, Inc. | | | 204 | | | | 30,492 | |
Tennant Co. | | | 18 | | | | 1,464 | |
Terex Corp. | | | 90 | | | | 3,971 | |
Timken Co. (The) | | | 100 | | | | 4,925 | |
Titan International, Inc. | | | 42 | | | | 445 | |
Toro Co. (The) | | | 150 | | | | 9,028 | |
Trinity Industries, Inc. | | | 190 | | | | 7,239 | |
Wabash National Corp. | | | 30 | | | | 594 | |
Wabtec Corp. | | | 115 | | | | 12,687 | |
Watts Water Technologies, Inc. (Class A Stock) | | | 35 | | | | 2,994 | |
Woodward, Inc. | | | 70 | | | | 5,825 | |
Xylem, Inc. | | | 230 | | | | 17,609 | |
| | | | | | | | |
| | | | | | | 659,041 | |
| | |
Marine 0.0% | | | | | | | | |
Kirby Corp.* | | | 72 | | | | 6,008 | |
Matson, Inc. | | | 40 | | | | 1,440 | |
| | | | | | | | |
| | | | | | | 7,448 | |
| | |
Media 2.0% | | | | | | | | |
AMC Networks, Inc. (Class A Stock)* | | | 70 | | | | 4,220 | |
Cable One, Inc. | | | 13 | | | | 9,410 | |
CBS Corp. (Class B Stock) | | | 440 | | | | 23,175 | |
Charter Communications, Inc. (Class A Stock)* | | | 243 | | | | 74,013 | |
Cinemark Holdings, Inc. | | | 135 | | | | 4,849 | |
Comcast Corp. (Class A Stock) | | | 6,006 | | | | 214,895 | |
Discovery, Inc. (Class A Stock)* | | | 200 | | | | 5,316 | |
Discovery, Inc. (Class C Stock)* | | | 440 | | | | 10,802 | |
DISH Network Corp. (Class A Stock)* | | | 300 | | | | 9,468 | |
See Notes to Financial Statements.
| | | | | | | | |
| Description | | Shares | | | Value | |
COMMON STOCKS (Continued) | | | | | | | | |
| | |
Media (cont’d.) | | | | | | | | |
EW Scripps Co. (The) (Class A Stock) | | | 30 | | | $ | 393 | |
Gannett Co., Inc. | | | 140 | | | | 1,480 | |
Interpublic Group of Cos., Inc. (The) | | | 500 | | | | 11,275 | |
John Wiley & Sons, Inc. (Class A Stock) | | | 60 | | | | 3,789 | |
Live Nation Entertainment, Inc.* | | | 180 | | | | 8,870 | |
Marcus Corp. (The) | | | 20 | | | | 771 | |
Meredith Corp. | | | 60 | | | | 3,189 | |
New Media Investment Group, Inc. | | | 30 | | | | 540 | |
New York Times Co. (The) (Class A Stock) | | | 160 | | | | 3,968 | |
News Corp. (Class A Stock) | | | 450 | | | | 6,781 | |
News Corp. (Class B Stock) | | | 150 | | | | 2,295 | |
Omnicom Group, Inc. | | | 300 | | | | 20,649 | |
Scholastic Corp. | | | 30 | | | | 1,253 | |
TEGNA, Inc. | | | 220 | | | | 2,427 | |
Twenty-First Century Fox, Inc. (Class A Stock) | | | 1,370 | | | | 61,650 | |
Twenty-First Century Fox, Inc. (Class B Stock) | | | 580 | | | | 25,764 | |
Viacom, Inc. (Class B Stock) | | | 460 | | | | 13,363 | |
Walt Disney Co. (The) | | | 1,949 | | | | 221,328 | |
World Wrestling Entertainment, Inc. (Class A Stock) | | | 60 | | | | 4,747 | |
| | | | | | | | |
| | | | | | | 750,680 | |
| | |
Metals & Mining 0.4% | | | | | | | | |
AK Steel Holding Corp.* | | | 290 | | | | 1,343 | |
Allegheny Technologies, Inc.* | | | 155 | | | | 4,309 | |
Carpenter Technology Corp. | | | 60 | | | | 3,286 | |
Century Aluminum Co.* | | | 40 | | | | 513 | |
Commercial Metals Co. | | | 150 | | | | 3,351 | |
Compass Minerals International, Inc. | | | 40 | | | | 2,714 | |
Freeport-McMoRan, Inc. | | | 1,720 | | | | 28,380 | |
Haynes International, Inc. | | | 16 | | | | 679 | |
Kaiser Aluminum Corp. | | | 20 | | | | 2,233 | |
Materion Corp. | | | 20 | | | | 1,254 | |
Newmont Mining Corp. | | | 690 | | | | 25,309 | |
Nucor Corp. | | | 426 | | | | 28,512 | |
Olympic Steel, Inc. | | | 20 | | | | 442 | |
Reliance Steel & Aluminum Co. | | | 90 | | | | 8,118 | |
Royal Gold, Inc. | | | 98 | | | | 8,292 | |
Steel Dynamics, Inc. | | | 310 | | | | 14,598 | |
SunCoke Energy, Inc.* | | | 40 | | | | 456 | |
TimkenSteel Corp.* | | | 30 | | | | 417 | |
See Notes to Financial Statements.
| | | | |
| PGIM Day One Underlying Funds | | | 129 | |
PGIM QMA US Broad Market Index Fund
Schedule of Investments (continued)
as of July 31, 2018
| | | | | | | | |
| Description | | Shares | | | Value | |
COMMON STOCKS (Continued) | | | | | | | | |
| | |
Metals & Mining (cont’d.) | | | | | | | | |
United States Steel Corp. | | | 230 | | | $ | 8,379 | |
Worthington Industries, Inc. | | | 50 | | | | 2,341 | |
| | | | | | | | |
| | | | | | | 144,926 | |
| | |
Mortgage Real Estate Investment Trusts (REITs) 0.0% | | | | | | | | |
Apollo Commercial Real Estate Finance, Inc. | | | 100 | | | | 1,909 | |
ARMOUR Residential REIT, Inc. | | | 30 | | | | 713 | |
Capstead Mortgage Corp. | | | 40 | | | | 335 | |
Granite Point Mortgage Trust, Inc. | | | 50 | | | | 950 | |
Invesco Mortgage Capital, Inc. | | | 110 | | | | 1,825 | |
New York Mortgage Trust, Inc. | | | 110 | | | | 683 | |
PennyMac Mortgage Investment Trust | | | 50 | | | | 964 | |
Redwood Trust, Inc. | | | 90 | | | | 1,513 | |
| | | | | | | | |
| | | | | | | 8,892 | |
| | |
Multiline Retail 0.5% | | | | | | | | |
Big Lots, Inc. | | | 50 | | | | 2,171 | |
Dillard’s, Inc. (Class A Stock) | | | 30 | | | | 2,408 | |
Dollar General Corp. | | | 340 | | | | 33,371 | |
Dollar Tree, Inc.* | | | 311 | | | | 28,388 | |
J.C. Penney Co., Inc.* | | | 140 | | | | 343 | |
Kohl’s Corp. | | | 230 | | | | 16,990 | |
Macy’s, Inc. | | | 390 | | | | 15,495 | |
Nordstrom, Inc. | | | 156 | | | | 8,176 | |
Ollie’s Bargain Outlet Holdings, Inc.* | | | 70 | | | | 4,865 | |
Target Corp. | | | 704 | | | | 56,799 | |
| | | | | | | | |
| | | | | | | 169,006 | |
| | |
Multi-Utilities 0.9% | | | | | | | | |
Ameren Corp. | | | 320 | | | | 19,859 | |
Avista Corp. | | | 90 | | | | 4,552 | |
Black Hills Corp. | | | 80 | | | | 4,798 | |
CenterPoint Energy, Inc. | | | 544 | | | | 15,493 | |
CMS Energy Corp. | | | 370 | | | | 17,886 | |
Consolidated Edison, Inc. | | | 412 | | | | 32,519 | |
Dominion Energy, Inc. | | | 862 | | | | 61,814 | |
DTE Energy Co. | | | 241 | | | | 26,158 | |
MDU Resources Group, Inc. | | | 230 | | | | 6,670 | |
NiSource, Inc. | | | 410 | | | | 10,734 | |
NorthWestern Corp. | | | 70 | | | | 4,153 | |
Public Service Enterprise Group, Inc. | | | 660 | | | | 34,029 | |
See Notes to Financial Statements.
| | | | | | | | |
| Description | | Shares | | | Value | |
COMMON STOCKS (Continued) | | | | | | | | |
| | |
Multi-Utilities (cont’d.) | | | | | | | | |
SCANA Corp. | | | 170 | | | $ | 6,798 | |
Sempra Energy | | | 334 | | | | 38,607 | |
Vectren Corp. | | | 110 | | | | 7,862 | |
WEC Energy Group, Inc. | | | 410 | | | | 27,212 | |
| | | | | | | | |
| | | | | | | 319,144 | |
| | |
Oil, Gas & Consumable Fuels 4.9% | | | | | | | | |
Anadarko Petroleum Corp. | | | 670 | | | | 49,011 | |
Andeavor | | | 190 | | | | 28,511 | |
Apache Corp. | | | 510 | | | | 23,460 | |
Bonanza Creek Energy, Inc.* | | | 30 | | | | 1,116 | |
Cabot Oil & Gas Corp. | | | 590 | | | | 13,865 | |
Callon Petroleum Co.* | | | 215 | | | | 2,313 | |
Carrizo Oil & Gas, Inc.* | | | 110 | | | | 3,100 | |
Chesapeake Energy Corp.* | | | 1,130 | | | | 5,334 | |
Chevron Corp. | | | 2,504 | | | | 316,180 | |
Cimarex Energy Co. | | | 136 | | | | 13,410 | |
Cloud Peak Energy, Inc.* | | | 75 | | | | 196 | |
CNX Resources Corp.* | | | 200 | | | | 3,256 | |
Concho Resources, Inc.* | | | 250 | | | | 36,463 | |
ConocoPhillips | | | 1,542 | | | | 111,286 | |
CONSOL Energy, Inc.* | | | 25 | | | | 1,041 | |
Denbury Resources, Inc.* | | | 420 | | | | 1,894 | |
Devon Energy Corp. | | | 680 | | | | 30,607 | |
Energen Corp.* | | | 130 | | | | 9,643 | |
EOG Resources, Inc. | | | 759 | | | | 97,865 | |
EQT Corp. | | | 340 | | | | 16,891 | |
Exxon Mobil Corp. | | | 5,557 | | | | 452,951 | |
Green Plains, Inc. | | | 20 | | | | 332 | |
Gulfport Energy Corp.* | | | 130 | | | | 1,496 | |
Hess Corp. | | | 340 | | | | 22,314 | |
HighPoint Resources Corp.* | | | 75 | | | | 491 | |
HollyFrontier Corp. | | | 230 | | | | 17,153 | |
Kinder Morgan, Inc. | | | 2,440 | | | | 43,383 | |
Marathon Oil Corp. | | | 1,070 | | | | 22,598 | |
Marathon Petroleum Corp. | | | 604 | | | | 48,821 | |
Matador Resources Co.* | | | 115 | | | | 3,853 | |
Murphy Oil Corp. | | | 200 | | | | 6,652 | |
Newfield Exploration Co.* | | | 240 | | | | 6,893 | |
Noble Energy, Inc. | | | 640 | | | | 23,098 | |
Oasis Petroleum, Inc.* | | | 300 | | | | 3,666 | |
Occidental Petroleum Corp. | | | 1,004 | | | | 84,266 | |
See Notes to Financial Statements.
| | | | |
| PGIM Day One Underlying Funds | | | 131 | |
PGIM QMA US Broad Market Index Fund
Schedule of Investments (continued)
as of July 31, 2018
| | | | | | | | |
| Description | | Shares | | | Value | |
COMMON STOCKS (Continued) | | | | | | | | |
| | |
Oil, Gas & Consumable Fuels (cont’d.) | | | | | | | | |
ONEOK, Inc. | | | 550 | | | $ | 38,742 | |
Par Pacific Holdings, Inc.* | | | 20 | | | | 350 | |
PBF Energy, Inc. (Class A Stock) | | | 145 | | | | 6,772 | |
PDC Energy, Inc.* | | | 90 | | | | 5,668 | |
Penn Virginia Corp.* | | | 20 | | | | 1,690 | |
Phillips 66 | | | 557 | | | | 68,700 | |
Pioneer Natural Resources Co. | | | 231 | | | | 43,721 | |
QEP Resources, Inc.* | | | 300 | | | | 3,117 | |
Range Resources Corp. | | | 280 | | | | 4,320 | |
Renewable Energy Group, Inc.* | | | 40 | | | | 682 | |
REX American Resources Corp.* | | | 6 | | | | 462 | |
Ring Energy, Inc.* | | | 50 | | | | 618 | |
SM Energy Co. | | | 135 | | | | 3,714 | |
Southwestern Energy Co.* | | | 640 | | | | 3,290 | |
SRC Energy, Inc.* | | | 300 | | | | 3,396 | |
Valero Energy Corp. | | | 568 | | | | 67,223 | |
Williams Cos., Inc. (The) | | | 1,056 | | | | 31,416 | |
World Fuel Services Corp. | | | 60 | | | | 1,670 | |
WPX Energy, Inc.* | | | 470 | | | | 8,822 | |
| | | | | | | | |
| | | | | | | 1,797,782 | |
| | |
Paper & Forest Products 0.0% | | | | | | | | |
Boise Cascade Co. | | | 40 | | | | 1,730 | |
Clearwater Paper Corp.* | | | 10 | | | | 226 | |
Domtar Corp. | | | 80 | | | | 3,858 | |
KapStone Paper & Packaging Corp. | | | 110 | | | | 3,826 | |
Louisiana-Pacific Corp. | | | 180 | | | | 4,845 | |
Neenah, Inc. | | | 20 | | | | 1,756 | |
P.H. Glatfelter Co. | | | 20 | | | | 327 | |
Schweitzer-Mauduit International, Inc. | | | 30 | | | | 1,245 | |
| | | | | | | | |
| | | | | | | 17,813 | |
| | |
Personal Products 0.2% | | | | | | | | |
Avon Products, Inc. (United Kingdom)* | | | 200 | | | | 318 | |
Coty, Inc. (Class A Stock) | | | 550 | | | | 7,376 | |
Edgewell Personal Care Co.* | | | 80 | | | | 4,309 | |
Estee Lauder Cos., Inc. (The) (Class A Stock) | | | 296 | | | | 39,942 | |
Inter Parfums, Inc. | | | 20 | | | | 1,204 | |
Medifast, Inc. | | | 18 | | | | 3,090 | |
Nu Skin Enterprises, Inc. (Class A Stock) | | | 77 | | | | 5,609 | |
| | | | | | | | |
| | | | | | | 61,848 | |
See Notes to Financial Statements.
| | | | | | | | |
| Description | | Shares | | | Value | |
COMMON STOCKS (Continued) | | | | | | | | |
| | |
Pharmaceuticals 4.0% | | | | | | | | |
Akorn, Inc.* | | | 88 | | | $ | 1,630 | |
Allergan PLC | | | 450 | | | | 82,840 | |
Amphastar Pharmaceuticals, Inc.* | | | 20 | | | | 349 | |
ANI Pharmaceuticals, Inc.* | | | 10 | | | | 670 | |
Bristol-Myers Squibb Co. | | | 2,140 | | | | 125,725 | |
Catalent, Inc.* | | | 175 | | | | 7,297 | |
Corcept Therapeutics, Inc.* | | | 90 | | | | 1,182 | |
Depomed, Inc.* | | | 30 | | | | 266 | |
Eli Lilly & Co. | | | 1,260 | | | | 124,501 | |
Endo International PLC* | | | 260 | | | | 3,234 | |
Innoviva, Inc.* | | | 40 | | | | 566 | |
Johnson & Johnson | | | 3,519 | | | | 466,338 | |
Lannett Co., Inc.* | | | 20 | | | | 255 | |
Mallinckrodt PLC* | | | 90 | | | | 2,111 | |
Medicines Co. (The)* | | | 70 | | | | 2,781 | |
Merck & Co., Inc. | | | 3,527 | | | | 232,323 | |
Mylan NV* | | | 676 | | | | 25,222 | |
Nektar Therapeutics* | | | 200 | | | | 10,520 | |
Perrigo Co. PLC | | | 180 | | | | 14,494 | |
Pfizer, Inc. | | | 7,648 | | | | 305,385 | |
Phibro Animal Health Corp. (Class A Stock) | | | 20 | | | | 958 | |
Prestige Brands Holdings, Inc.* | | | 80 | | | | 2,858 | |
Supernus Pharmaceuticals, Inc.* | | | 70 | | | | 3,706 | |
Zoetis, Inc. | | | 640 | | | | 55,347 | |
| | | | | | | | |
| | | | | | | 1,470,558 | |
| | |
Professional Services 0.4% | | | | | | | | |
ASGN, Inc.* | | | 70 | | | | 6,321 | |
Dun & Bradstreet Corp. (The) | | | 50 | | | | 6,294 | |
Equifax, Inc. | | | 157 | | | | 19,703 | |
Exponent, Inc. | | | 80 | | | | 3,912 | |
Forrester Research, Inc. | | | 16 | | | | 740 | |
FTI Consulting, Inc.* | | | 60 | | | | 4,738 | |
Heidrick & Struggles International, Inc. | | | 20 | | | | 818 | |
IHS Markit Ltd.* | | | 470 | | | | 24,924 | |
Insperity, Inc. | | | 60 | | | | 5,706 | |
Kelly Services, Inc. (Class A Stock) | | | 20 | | | | 486 | |
Korn/Ferry International | | | 70 | | | | 4,619 | |
ManpowerGroup, Inc. | | | 83 | | | | 7,740 | |
Navigant Consulting, Inc.* | | | 20 | | | | 435 | |
Nielsen Holdings PLC | | | 430 | | | | 10,131 | |
Resources Connection, Inc. | | | 30 | | | | 477 | |
See Notes to Financial Statements.
| | | | |
| PGIM Day One Underlying Funds | | | 133 | |
PGIM QMA US Broad Market Index Fund
Schedule of Investments (continued)
as of July 31, 2018
| | | | | | | | |
| Description | | Shares | | | Value | |
COMMON STOCKS (Continued) | | | | | | | | |
| | |
Professional Services (cont’d.) | | | | | | | | |
Robert Half International, Inc. | | | 160 | | | $ | 12,122 | |
TrueBlue, Inc.* | | | 20 | | | | 541 | |
Verisk Analytics, Inc.* | | | 206 | | | | 22,788 | |
WageWorks, Inc.* | | | 60 | | | | 3,168 | |
| | | | | | | | |
| | | | | | | 135,663 | |
| |
Real Estate Management & Development 0.1% | | | | | |
CBRE Group, Inc. (Class A Stock)* | | | 390 | | | | 19,422 | |
HFF, Inc. (Class A Stock) | | | 40 | | | | 1,800 | |
Jones Lang LaSalle, Inc. | | | 68 | | | | 11,629 | |
RE/MAX Holdings, Inc. (Class A Stock) | | | 20 | | | | 1,016 | |
| | | | | | | | |
| | | | | | | 33,867 | |
| | |
Road & Rail 1.0% | | | | | | | | |
ArcBest Corp. | | | 20 | | | | 931 | |
Avis Budget Group, Inc.* | | | 90 | | | | 3,136 | |
CSX Corp. | | | 1,155 | | | | 81,635 | |
Genesee & Wyoming, Inc. (Class A Stock)* | | | 74 | | | | 6,364 | |
Heartland Express, Inc. | | | 20 | | | | 384 | |
J.B. Hunt Transport Services, Inc. | | | 120 | | | | 14,388 | |
Kansas City Southern | | | 140 | | | | 16,278 | |
Knight-Swift Transportation Holdings, Inc. | | | 165 | | | | 5,371 | |
Landstar System, Inc. | | | 60 | | | | 6,669 | |
Marten Transport Ltd. | | | 33 | | | | 721 | |
Norfolk Southern Corp. | | | 370 | | | | 62,530 | |
Old Dominion Freight Line, Inc. | | | 90 | | | | 13,212 | |
Ryder System, Inc. | | | 80 | | | | 6,264 | |
Saia, Inc.* | | | 30 | | | | 2,261 | |
Union Pacific Corp. | | | 1,020 | | | | 152,888 | |
Werner Enterprises, Inc. | | | 53 | | | | 1,974 | |
| | | | | | | | |
| | | | | | | 375,006 | |
| | |
Semiconductors & Semiconductor Equipment 3.6% | | | | | | | | |
Advanced Energy Industries, Inc.* | | | 46 | | | | 2,817 | |
Advanced Micro Devices, Inc.*(a) | | | 1,040 | | | | 19,063 | |
Analog Devices, Inc. | | | 498 | | | | 47,878 | |
Applied Materials, Inc. | | | 1,332 | | | | 64,775 | |
Axcelis Technologies, Inc.* | | | 30 | | | | 660 | |
Broadcom, Inc. | | | 534 | | | | 118,425 | |
Brooks Automation, Inc. | | | 100 | | | | 3,058 | |
Cabot Microelectronics Corp. | | | 42 | | | | 5,059 | |
See Notes to Financial Statements.
| | | | | | | | |
| Description | | Shares | | | Value | |
COMMON STOCKS (Continued) | | | | | | | | |
| | |
Semiconductors & Semiconductor Equipment (cont’d.) | | | | | | | | |
CEVA, Inc.* | | | 16 | | | $ | 482 | |
Cirrus Logic, Inc.* | | | 80 | | | | 3,461 | |
Cohu, Inc. | | | 40 | | | | 1,007 | |
Cree, Inc.* | | | 123 | | | | 5,799 | |
Cypress Semiconductor Corp. | | | 440 | | | | 7,836 | |
Diodes, Inc.* | | | 50 | | | | 1,858 | |
DSP Group, Inc.* | | | 40 | | | | 500 | |
First Solar, Inc.* | | | 110 | | | | 5,759 | |
FormFactor, Inc.* | | | 75 | | | | 971 | |
Integrated Device Technology, Inc.* | | | 150 | | | | 5,165 | |
Intel Corp. | | | 6,111 | | | | 293,939 | |
KLA-Tencor Corp. | | | 207 | | | | 24,306 | |
Kopin Corp.* | | | 130 | | | | 398 | |
Kulicke & Soffa Industries, Inc. (Singapore) | | | 70 | | | | 1,845 | |
Lam Research Corp. | | | 218 | | | | 41,560 | |
MaxLinear, Inc.* | | | 50 | | | | 866 | |
Microchip Technology, Inc. | | | 305 | | | | 28,496 | |
Micron Technology, Inc.* | | | 1,524 | | | | 80,452 | |
MKS Instruments, Inc. | | | 75 | | | | 7,072 | |
Monolithic Power Systems, Inc. | | | 55 | | | | 7,297 | |
Nanometrics, Inc.* | | | 20 | | | | 753 | |
NVIDIA Corp. | | | 797 | | | | 195,153 | |
PDF Solutions, Inc.* | | | 30 | | | | 315 | |
Photronics, Inc.* | | | 60 | | | | 540 | |
Power Integrations, Inc. | | | 33 | | | | 2,360 | |
Qorvo, Inc.* | | | 164 | | | | 13,409 | |
QUALCOMM, Inc. | | | 1,936 | | | | 124,078 | |
Rambus, Inc.* | | | 80 | | | | 989 | |
Rudolph Technologies, Inc.* | | | 30 | | | | 858 | |
Semtech Corp.* | | | 90 | | | | 4,271 | |
Silicon Laboratories, Inc.* | | | 60 | | | | 5,715 | |
Skyworks Solutions, Inc. | | | 240 | | | | 22,699 | |
SolarEdge Technologies, Inc.* | | | 60 | | | | 3,195 | |
Synaptics, Inc.* | | | 40 | | | | 2,004 | |
Teradyne, Inc. | | | 250 | | | | 10,812 | |
Texas Instruments, Inc. | | | 1,281 | | | | 142,601 | |
Ultra Clean Holdings, Inc.* | | | 35 | | | | 470 | |
Veeco Instruments, Inc.* | | | 25 | | | | 366 | |
Versum Materials, Inc. | | | 140 | | | | 5,397 | |
Xilinx, Inc. | | | 344 | | | | 24,792 | |
Xperi Corp. | | | 20 | | | | 333 | |
| | | | | | | | |
| | | | | | | 1,341,914 | |
See Notes to Financial Statements.
| | | | |
| PGIM Day One Underlying Funds | | | 135 | |
PGIM QMA US Broad Market Index Fund
Schedule of Investments (continued)
as of July 31, 2018
| | | | | | | | |
| Description | | Shares | | | Value | |
COMMON STOCKS (Continued) | | | | | | | | |
| | |
Software 5.5% | | | | | | | | |
8x8, Inc.* | | | 90 | | | $ | 1,795 | |
ACI Worldwide, Inc.* | | | 130 | | | | 3,359 | |
Activision Blizzard, Inc. | | | 1,000 | | | | 73,420 | |
Adobe Systems, Inc.* | | | 648 | | | | 158,553 | |
Agilysys, Inc.* | | | 40 | | | | 658 | |
ANSYS, Inc.* | | | 117 | | | | 19,759 | |
Autodesk, Inc.* | | | 292 | | | | 37,504 | |
Blackbaud, Inc. | | | 70 | | | | 6,987 | |
Bottomline Technologies de, Inc.* | | | 40 | | | | 2,156 | |
CA, Inc. | | | 400 | | | | 17,684 | |
Cadence Design Systems, Inc.* | | | 360 | | | | 15,872 | |
CDK Global, Inc. | | | 160 | | | | 9,992 | |
Citrix Systems, Inc.* | | | 170 | | | | 18,695 | |
CommVault Systems, Inc.* | | | 50 | | | | 3,245 | |
Ebix, Inc. | | | 28 | | | | 2,222 | |
Electronic Arts, Inc.* | | | 409 | | | | 52,659 | |
Fair Isaac Corp.* | | | 43 | | | | 8,663 | |
Fortinet, Inc.* | | | 190 | | | | 11,953 | |
Intuit, Inc. | | | 326 | | | | 66,582 | |
Manhattan Associates, Inc.* | | | 100 | | | | 4,812 | |
Microsoft Corp. | | | 10,071 | | | | 1,068,332 | |
MicroStrategy, Inc. (Class A Stock)* | | | 16 | | | | 2,082 | |
Monotype Imaging Holdings, Inc. | | | 44 | | | | 909 | |
OneSpan, Inc.* | | | 30 | | | | 489 | |
Oracle Corp. | | | 3,912 | | | | 186,524 | |
Progress Software Corp. | | | 48 | | | | 1,766 | |
PTC, Inc.* | | | 160 | | | | 14,706 | |
Qualys, Inc.* | | | 38 | | | | 3,310 | |
Red Hat, Inc.* | | | 238 | | | | 33,613 | |
salesforce.com, Inc.* | | | 932 | | | | 127,824 | |
Symantec Corp. | | | 770 | | | | 15,569 | |
Synopsys, Inc.* | | | 190 | | | | 16,992 | |
Take-Two Interactive Software, Inc.* | | | 150 | | | | 16,953 | |
TiVo Corp. | | | 100 | | | | 1,215 | |
Tyler Technologies, Inc.* | | | 46 | | | | 10,349 | |
Ultimate Software Group, Inc. (The)* | | | 43 | | | | 11,906 | |
| | | | | | | | |
| | | | | | | 2,029,109 | |
| | |
Specialty Retail 2.2% | | | | | | | | |
Aaron’s, Inc. | | | 80 | | | | 3,465 | |
Abercrombie & Fitch Co. (Class A Stock) | | | 60 | | | | 1,421 | |
Advance Auto Parts, Inc. | | | 103 | | | | 14,547 | |
See Notes to Financial Statements.
| | | | | | | | |
| Description | | Shares | | | Value | |
COMMON STOCKS (Continued) | | | | | | | | |
| | |
Specialty Retail (cont’d.) | | | | | | | | |
American Eagle Outfitters, Inc. | | | 200 | | | $ | 5,036 | |
Asbury Automotive Group, Inc.* | | | 26 | | | | 1,828 | |
Ascena Retail Group, Inc.* | | | 70 | | | | 258 | |
AutoNation, Inc.* | | | 79 | | | | 3,834 | |
AutoZone, Inc.* | | | 35 | | | | 24,693 | |
Barnes & Noble Education, Inc.* | | | 40 | | | | 225 | |
Barnes & Noble, Inc. | | | 40 | | | | 244 | |
Bed Bath & Beyond, Inc. | | | 190 | | | | 3,559 | |
Best Buy Co., Inc. | | | 326 | | | | 24,460 | |
Big 5 Sporting Goods Corp. | | | 30 | | | | 193 | |
Buckle, Inc. (The) | | | 20 | | | | 481 | |
Caleres, Inc. | | | 43 | | | | 1,440 | |
CarMax, Inc.* | | | 230 | | | | 17,176 | |
Cato Corp. (The) (Class A Stock) | | | 20 | | | | 498 | |
Chico’s FAS, Inc. | | | 60 | | | | 522 | |
Children’s Place, Inc. (The) | | | 20 | | | | 2,458 | |
Dick’s Sporting Goods, Inc. | | | 110 | | | | 3,755 | |
DSW, Inc. (Class A Stock) | | | 70 | | | | 1,921 | |
Express, Inc.* | | | 30 | | | | 289 | |
Five Below, Inc.* | | | 80 | | | | 7,773 | |
Foot Locker, Inc. | | | 160 | | | | 7,810 | |
Francesca’s Holdings Corp.* | | | 30 | | | | 244 | |
GameStop Corp. (Class A Stock) | | | 90 | | | | 1,297 | |
Gap, Inc. (The) | | | 280 | | | | 8,448 | |
Genesco, Inc.* | | | 30 | | | | 1,221 | |
Group 1 Automotive, Inc. | | | 20 | | | | 1,400 | |
Guess?, Inc. | | | 50 | | | | 1,133 | |
Haverty Furniture Cos., Inc. | | | 20 | | | | 396 | |
Hibbett Sports, Inc.* | | | 10 | | | | 229 | |
Home Depot, Inc. (The) | | | 1,511 | | | | 298,453 | |
Kirkland’s, Inc.* | | | 30 | | | | 341 | |
L Brands, Inc. | | | 320 | | | | 10,134 | |
Lithia Motors, Inc. (Class A Stock) | | | 30 | | | | 2,671 | |
Lowe’s Cos., Inc. | | | 1,084 | | | | 107,685 | |
Lumber Liquidators Holdings, Inc.* | | | 30 | | | | 580 | |
MarineMax, Inc.* | | | 26 | | | | 487 | |
Michaels Cos., Inc. The* | | | 140 | | | | 2,857 | |
Monro, Inc. | | | 43 | | | | 2,900 | |
Murphy USA, Inc.* | | | 40 | | | | 3,170 | |
Office Depot, Inc. | | | 430 | | | | 1,079 | |
O’Reilly Automotive, Inc.* | | | 108 | | | | 33,048 | |
Rent-A-Center, Inc.* | | | 40 | | | | 594 | |
RH* | | | 30 | | | | 4,076 | |
See Notes to Financial Statements.
| | | | |
| PGIM Day One Underlying Funds | | | 137 | |
PGIM QMA US Broad Market Index Fund
Schedule of Investments (continued)
as of July 31, 2018
| | | | | | | | |
| Description | | Shares | | | Value | |
COMMON STOCKS (Continued) | | | | | | | | |
| | |
Specialty Retail (cont’d.) | | | | | | | | |
Ross Stores, Inc. | | | 506 | | | $ | 44,240 | |
Sally Beauty Holdings, Inc.* | | | 112 | | | | 1,847 | |
Shoe Carnival, Inc. | | | 20 | | | | 627 | |
Signet Jewelers Ltd. | | | 70 | | | | 4,042 | |
Sleep Number Corp.* | | | 40 | | | | 1,140 | |
Sonic Automotive, Inc. (Class A Stock) | | | 20 | | | | 407 | |
Tailored Brands, Inc. | | | 60 | | | | 1,210 | |
Tiffany & Co. | | | 132 | | | | 18,158 | |
Tile Shop Holdings, Inc. | | | 30 | | | | 249 | |
TJX Cos., Inc. (The) | | | 830 | | | | 80,726 | |
Tractor Supply Co. | | | 160 | | | | 12,486 | |
Ulta Beauty, Inc.* | | | 78 | | | | 19,062 | |
Urban Outfitters, Inc.* | | | 100 | | | | 4,440 | |
Vitamin Shoppe, Inc.* | | | 20 | | | | 167 | |
Williams-Sonoma, Inc. | | | 100 | | | | 5,849 | |
Zumiez, Inc.* | | | 20 | | | | 453 | |
| | | | | | | | |
| | | | | | | 805,432 | |
| | |
Technology Hardware, Storage & Peripherals 3.8% | | | | | | | | |
3D Systems Corp.* | | | 140 | | | | 1,704 | |
Apple, Inc. | | | 6,440 | | | | 1,225,468 | |
Cray, Inc.* | | | 30 | | | | 748 | |
Diebold Nixdorf, Inc. | | | 40 | | | | 454 | |
Electronics For Imaging, Inc.* | | | 50 | | | | 1,706 | |
Hewlett Packard Enterprise Co. | | | 1,934 | | | | 29,861 | |
HP, Inc. | | | 2,130 | | | | 49,160 | |
NCR Corp.* | | | 134 | | | | 3,741 | |
NetApp, Inc. | | | 360 | | | | 27,907 | |
Seagate Technology PLC | | | 380 | | | | 19,996 | |
Super Micro Computer, Inc.* | | | 20 | | | | 442 | |
Western Digital Corp. | | | 392 | | | | 27,499 | |
Xerox Corp. | | | 277 | | | | 7,194 | |
| | | | | | | | |
| | | | | | | 1,395,880 | |
| | |
Textiles, Apparel & Luxury Goods 0.7% | | | | | | | | |
Carter’s, Inc. | | | 60 | | | | 6,290 | |
Crocs, Inc.* | | | 50 | | | | 906 | |
Deckers Outdoor Corp.* | | | 51 | | | | 5,754 | |
Fossil Group, Inc.* | | | 40 | | | | 1,048 | |
G-III Apparel Group Ltd.* | | | 40 | | | | 1,828 | |
Hanesbrands, Inc. | | | 423 | | | | 9,416 | |
Michael Kors Holdings Ltd.* | | | 190 | | | | 12,679 | |
See Notes to Financial Statements.
| | | | | | | | |
| Description | | Shares | | | Value | |
COMMON STOCKS (Continued) | | | | | | | | |
| | |
Textiles, Apparel & Luxury Goods (cont’d.) | | | | | | | | |
Movado Group, Inc. | | | 20 | | | $ | 996 | |
NIKE, Inc. (Class B Stock) | | | 1,678 | | | | 129,055 | |
Oxford Industries, Inc. | | | 20 | | | | 1,842 | |
Perry Ellis International, Inc.* | | | 20 | | | | 561 | |
PVH Corp. | | | 108 | | | | 16,580 | |
Ralph Lauren Corp. | | | 80 | | | | 10,798 | |
Skechers U.S.A., Inc. (Class A Stock)* | | | 160 | | | | 4,435 | |
Steven Madden Ltd. | | | 80 | | | | 4,324 | |
Tapestry, Inc. | | | 388 | | | | 18,283 | |
Under Armour, Inc. (Class A Stock)* | | | 210 | | | | 4,194 | |
Under Armour, Inc. (Class C Stock)* | | | 220 | | | | 4,123 | |
Unifi, Inc.* | | | 20 | | | | 603 | |
Vera Bradley, Inc.* | | | 30 | | | | 399 | |
VF Corp. | | | 433 | | | | 39,866 | |
Wolverine World Wide, Inc. | | | 110 | | | | 3,892 | |
| | | | | | | | |
| | | | | | | 277,872 | |
| | |
Thrifts & Mortgage Finance 0.1% | | | | | | | | |
BofI Holding, Inc.* | | | 64 | | | | 2,497 | |
Dime Community Bancshares, Inc. | | | 30 | | | | 516 | |
HomeStreet, Inc.* | | | 10 | | | | 296 | |
LendingTree, Inc.* | | | 11 | | | | 2,627 | |
Meta Financial Group, Inc. | | | 14 | | | | 1,252 | |
New York Community Bancorp, Inc. | | | 620 | | | | 6,677 | |
NMI Holdings, Inc. (Class A Stock)* | | | 55 | | | | 1,150 | |
Northfield Bancorp, Inc. | | | 30 | | | | 500 | |
Northwest Bancshares, Inc. | | | 80 | | | | 1,442 | |
Oritani Financial Corp. | | | 30 | | | | 480 | |
Provident Financial Services, Inc. | | | 50 | | | | 1,277 | |
TrustCo Bank Corp. NY | | | 50 | | | | 455 | |
Walker & Dunlop, Inc. | | | 32 | | | | 1,896 | |
Washington Federal, Inc. | | | 110 | | | | 3,690 | |
| | | | | | | | |
| | | | | | | 24,755 | |
| | |
Tobacco 0.9% | | | | | | | | |
Altria Group, Inc. | | | 2,490 | | | | 146,113 | |
Philip Morris International, Inc. | | | 2,048 | | | | 176,742 | |
Universal Corp. | | | 38 | | | | 2,626 | |
| | | | | | | | |
| | | | | | | 325,481 | |
See Notes to Financial Statements.
| | | | |
| PGIM Day One Underlying Funds | | | 139 | |
PGIM QMA US Broad Market Index Fund
Schedule of Investments (continued)
as of July 31, 2018
| | | | | | | | |
| Description | | Shares | | | Value | |
COMMON STOCKS (Continued) | | | | | | | | |
| | |
Trading Companies & Distributors 0.2% | | | | | | | | |
Applied Industrial Technologies, Inc. | | | 60 | | | $ | 4,479 | |
DXP Enterprises, Inc.* | | | 20 | | | | 827 | |
Fastenal Co. | | | 370 | | | | 21,064 | |
GATX Corp. | | | 60 | | | | 4,940 | |
Kaman Corp. | | | 30 | | | | 1,987 | |
MSC Industrial Direct Co., Inc. (Class A Stock) | | | 70 | | | | 5,924 | |
NOW, Inc.* | | | 90 | | | | 1,345 | |
United Rentals, Inc.* | | | 116 | | | | 17,261 | |
Veritiv Corp.* | | | 6 | | | | 230 | |
W.W. Grainger, Inc. | | | 73 | | | | 25,299 | |
Watsco, Inc. | | | 45 | | | | 7,763 | |
| | | | | | | | |
| | | | | | | 91,119 | |
| | |
Water Utilities 0.1% | | | | | | | | |
American States Water Co. | | | 50 | | | | 3,006 | |
American Water Works Co., Inc. | | | 238 | | | | 21,003 | |
Aqua America, Inc. | | | 220 | | | | 8,127 | |
California Water Service Group | | | 50 | | | | 2,055 | |
| | | | | | | | |
| | | | | | | 34,191 | |
| | |
Wireless Telecommunication Services 0.0% | | | | | | | | |
Spok Holdings, Inc. | | | 30 | | | | 435 | |
Telephone & Data Systems, Inc. | | | 120 | | | | 3,030 | |
| | | | | | | | |
| | | | | | | 3,465 | |
| | | | | | | | |
TOTAL COMMON STOCKS
(cost $29,690,596) | | | | | | | 34,698,536 | |
| | | | | | | | |
| | |
EXCHANGE TRADED FUNDS 1.7% | | | | | | | | |
iShares Core S&P Mid-Cap ETF | | | 306 | | | | 60,618 | |
iShares Core S&P Small-Cap ETF | | | 410 | | | | 35,326 | |
SPDR S&P 500 ETF Trust | | | 1,908 | | | | 536,778 | |
| | | | | | | | |
TOTAL EXCHANGE TRADED FUNDS
(cost $525,020) | | | | | | | 632,722 | |
| | | | | | | | |
TOTAL LONG-TERM INVESTMENTS
(cost $30,215,616) | | | | | | | 35,331,258 | |
| | | | | | | | |
See Notes to Financial Statements.
| | | | | | | | | | | | | | | | |
| Description | | | | | | | | Shares | | | Value | |
SHORT-TERM INVESTMENTS 4.6% | | | | | | | | | | | | | |
| | | |
AFFILIATED MUTUAL FUNDS 4.3% | | | | | | | | | | | | | |
PGIM Core Ultra Short Bond Fund(w) | | | | | | | | 1,578,230 | | | $ | 1,578,230 | |
PGIM Institutional Money Market Fund
(cost $5,963; includes $5,499 of cash collateral for securities on loan)(b)(w) | | | | | | | | 5,963 | | | | 5,964 | |
| | | | | | | | | | | | | | | | |
TOTAL AFFILIATED MUTUAL FUNDS
(cost $1,584,193) | | | | | | | | | | | | 1,584,194 | |
| | | | | | | | | | | | | | | | |
| | | | |
| | | Interest
Rate | | | Maturity
Date | | | Principal
Amount (000)# | | | | |
U.S. TREASURY OBLIGATION 0.3% | | | | | | | | | | | | | | | | |
U.S. Treasury Bills
(cost $99,738) | | | 1.889% | (n) | | | 09/20/18 | (k) | | | 100 | | | | 99,738 | |
| | | | | | | | | | | | | | | | |
TOTAL SHORT-TERM INVESTMENTS
(cost $1,683,931) | | | | | | | | | | | | | | | 1,683,932 | |
| | | | | | | | | | | | | | | | |
TOTAL INVESTMENTS 100.0%
(cost $31,899,547) | | | | | | | | | | | | | | | 37,015,190 | |
Other assets in excess of liabilities(z) 0.0% | | | | | | | | | | | | | | | 4,771 | |
| | | | | | | | | | | | | | | | |
NET ASSETS 100.0% | | | | | | | | | | | | | | $ | 37,019,961 | |
| | | | | | | | | | | | | | | | |
See the Glossary for abbreviations used in the annual report.
| * | Non-income producing security. |
| # | Principal amount is shown in U.S. dollars unless otherwise stated. |
| (a) | All or a portion of security is on loan. The aggregate market value of such securities, including those sold and pending settlement, is $5,499; cash collateral of $5,955 (including in liabilities) was received with which the Fund purchased highly liquid short-term investments. |
| (b) | Represents security purchased with cash collateral received for securities on loan and includes dividend reinvestment. |
| (k) | Represents security, or a portion thereof, segregated as collateral for centrally cleared/exchange-traded derivatives. |
| (n) | Rate shown is the effective yield at purchase date. |
| (w) | PGIM Investments LLC, the manager of the Fund, also serves as manager of the PGIM Core Ultra Short Bond Fund and PGIM Institutional Money Market Fund. |
| (z) | Includes net unrealized appreciation (depreciation) on the following derivative contracts held at reporting period end: |
See Notes to Financial Statements.
| | | | |
| PGIM Day One Underlying Funds | | | 141 | |
PGIM QMA US Broad Market Index Fund
Schedule of Investments (continued)
as of July 31, 2018
Futures contracts outstanding at July 31, 2018:
| | | | | | | | | | | | | | | | |
Number of
Contracts | | | Type | | Expiration
Date | | | Current
Notional
Amount | | | Value /
Unrealized
Appreciation
(Depreciation) | |
| | | | Long Positions: | | | | | | | | | | | | |
| | 10 | | | S&P 500 E-Mini Index | | | Sep. 2018 | | | $ | 1,408,550 | | | $ | 14,325 | |
| | 1 | | | S&P Mid Cap 400 E-Mini Index | | | Sep. 2018 | | | | 198,600 | | | | (2,032 | ) |
| | | | | | | | | | | | | | | | |
| | | | | | | | | | | | | | $ | 12,293 | |
| | | | | | | | | | | | | | | | |
A security with a market value of $99,738 has been segregated with Morgan Stanley to cover requirements for open futures contracts at July 31, 2018.
Fair Value Measurements:
Various inputs are used in determining the value of the Fund’s investments. These inputs are summarized in the three broad levels listed below.
Level 1—unadjusted quoted prices generally in active markets for identical securities.
Level 2—quoted prices for similar securities, interest rates and yield curves, prepayment speeds, foreign currency exchange rates and other observable inputs.
Level 3—unobservable inputs for securities valued in accordance with Board approved fair valuation procedures.
The following is a summary of the inputs used as of July 31, 2018 in valuing such portfolio securities:
| | | | | | | | | | | | |
| | | Level 1 | | | Level 2 | | | Level 3 | |
Investments in Securities | | | | | | | | | | | | |
Common Stocks | | | | | | | | | | | | |
Aerospace & Defense | | $ | 914,976 | | | $ | — | | | $ | — | |
Air Freight & Logistics | | | 232,970 | | | | — | | | | — | |
Airlines | | | 159,322 | | | | — | | | | — | |
Auto Components | | | 92,644 | | | | — | | | | — | |
Automobiles | | | 130,788 | | | | — | | | | — | |
Banks | | | 2,254,674 | | | | — | | | | — | |
Beverages | | | 569,640 | | | | — | | | | — | |
Biotechnology | | | 864,188 | | | | — | | | | — | |
Building Products | | | 129,998 | | | | — | | | | — | |
Capital Markets | | | 1,008,101 | | | | — | | | | — | |
Chemicals | | | 692,646 | | | | — | | | | — | |
Commercial Services & Supplies | | | 175,214 | | | | — | | | | — | |
Communications Equipment | | | 353,674 | | | | — | | | | — | |
Construction & Engineering | | | 58,351 | | | | — | | | | — | |
Construction Materials | | | 43,533 | | | | — | | | | — | |
Consumer Finance | | | 238,287 | | | | — | | | | — | |
Containers & Packaging | | | 131,732 | | | | — | | | | — | |
See Notes to Financial Statements.
| | | | | | | | | | | | |
| | | Level 1 | | | Level 2 | | | Level 3 | |
Investments in Securities (continued) | | | | | | | | | | | | |
Common Stocks (continued) | | | | | | | | | | | | |
Distributors | | $ | 42,860 | | | $ | — | | | $ | — | |
Diversified Consumer Services | | | 32,093 | | | | — | | | | — | |
Diversified Financial Services | | | 508,893 | | | | — | | | | — | |
Diversified Telecommunication Services | | | 616,046 | | | | — | | | | — | |
Electric Utilities | | | 602,579 | | | | — | | | | — | |
Electrical Equipment | | | 202,700 | | | | — | | | | — | |
Electronic Equipment, Instruments & Components | | | 276,019 | | | | — | | | | — | |
Energy Equipment & Services | | | 302,327 | | | | — | | | | — | |
Equity Real Estate Investment Trusts (REITs) | | | 1,104,006 | | | | — | | | | — | |
Food & Staples Retailing | | | 455,944 | | | | — | | | | — | |
Food Products | | | 409,638 | | | | — | | | | — | |
Gas Utilities | | | 58,161 | | | | — | | | | — | |
Health Care Equipment & Supplies | | | 1,111,864 | | | | — | | | | — | |
Health Care Providers & Services | | | 1,087,927 | | | | — | | | | — | |
Health Care Technology | | | 42,810 | | | | — | | | | — | |
Hotels, Restaurants & Leisure | | | 618,920 | | | | — | | | | — | |
Household Durables | | | 163,078 | | | | — | | | | — | |
Household Products | | | 447,270 | | | | — | | | | — | |
Independent Power & Renewable Electricity Producers | | | 24,143 | | | | — | | | | — | |
Industrial Conglomerates | | | 530,835 | | | | — | | | | — | |
Insurance | | | 908,251 | | | | — | | | | — | |
Internet & Direct Marketing Retail | | | 1,296,098 | | | | — | | | | — | |
Internet Software & Services | | | 1,644,579 | | | | — | | | | — | |
IT Services | | | 1,501,155 | | | | — | | | | — | |
Leisure Products | | | 41,707 | | | | — | | | | — | |
Life Sciences Tools & Services | | | 337,003 | | | | — | | | | — | |
Machinery | | | 659,041 | | | | — | | | | — | |
Marine | | | 7,448 | | | | — | | | | — | |
Media | | | 750,680 | | | | — | | | | — | |
Metals & Mining | | | 144,926 | | | | — | | | | — | |
Mortgage Real Estate Investment Trusts (REITs) | | | 8,892 | | | | — | | | | — | |
Multiline Retail | | | 169,006 | | | | — | | | | — | |
Multi-Utilities | | | 319,144 | | | | — | | | | — | |
Oil, Gas & Consumable Fuels | | | 1,797,782 | | | | — | | | | — | |
Paper & Forest Products | | | 17,813 | | | | — | | | | — | |
Personal Products | | | 61,848 | | | | — | | | | — | |
Pharmaceuticals | | | 1,470,558 | | | | — | | | | — | |
Professional Services | | | 135,663 | | | | — | | | | — | |
Real Estate Management & Development | | | 33,867 | | | | — | | | | — | |
Road & Rail | | | 375,006 | | | | — | | | | — | |
Semiconductors & Semiconductor Equipment | | | 1,341,914 | | | | — | | | | — | |
Software | | | 2,029,109 | | | | — | | | | — | |
Specialty Retail | | | 805,432 | | | | — | | | | — | |
Technology Hardware, Storage & Peripherals | | | 1,395,880 | | | | — | | | | — | |
Textiles, Apparel & Luxury Goods | | | 277,872 | | | | — | | | | — | |
See Notes to Financial Statements.
| | | | |
| PGIM Day One Underlying Funds | | | 143 | |
PGIM QMA US Broad Market Index Fund
Schedule of Investments (continued)
as of July 31, 2018
| | | | | | | | | | | | |
| | | Level 1 | | | Level 2 | | | Level 3 | |
Investments in Securities (continued) | | | | | | | | | | | | |
Common Stocks (continued) | | | | | | | | | | | | |
Thrifts & Mortgage Finance | | $ | 24,755 | | | $ | — | | | $ | — | |
Tobacco | | | 325,481 | | | | — | | | | — | |
Trading Companies & Distributors | | | 91,119 | | | | — | | | | — | |
Water Utilities | | | 34,191 | | | | — | | | | — | |
Wireless Telecommunication Services | | | 3,465 | | | | — | | | | — | |
Exchange Traded Funds | | | 632,722 | | | | — | | | | — | |
Affiliated Mutual Funds | | | 1,584,194 | | | | — | | | | — | |
U.S. Treasury Obligation | | | — | | | | 99,738 | | | | — | |
Other Financial Instruments* | | | | | | | | | | | | |
Futures Contracts | | | 12,293 | | | | — | | | | — | |
| | | | | | | | | | | | |
Total | | $ | 36,927,745 | | | $ | 99,738 | | | $ | — | |
| | | | | | | | | | | | |
| * | Other financial instruments are derivative instruments not reflected in the Schedule of Investments, such as futures, forwards and centrally cleared swap contracts, which are recorded at the unrealized appreciation (depreciation) on the instrument, and OTC swap contracts which are recorded at fair value. |
During the period, there were no transfers between Level 1, Level 2 and Level 3 to report.
Industry Classification:
The industry classification of investments and other assets in excess of liabilities shown as a percentage of net assets as of July 31, 2018 were as follows (unaudited):
| | | | |
Banks | | | 6.1 | % |
Software | | | 5.5 | |
Oil, Gas & Consumable Fuels | | | 4.9 | |
Internet Software & Services | | | 4.4 | |
Affiliated Mutual Funds (0.0% represents investments purchased with collateral from securities on loan) | | | 4.3 | |
IT Services | | | 4.1 | |
Pharmaceuticals | | | 4.0 | |
Technology Hardware, Storage & Peripherals | | | 3.8 | |
Semiconductors & Semiconductor Equipment | | | 3.6 | |
Internet & Direct Marketing Retail | | | 3.5 | |
Health Care Equipment & Supplies | | | 3.0 | |
Equity Real Estate Investment Trusts (REITs) | | | 3.0 | |
Health Care Providers & Services | | | 2.9 | |
Capital Markets | | | 2.7 | |
Aerospace & Defense | | | 2.5 | |
Insurance | | | 2.5 | |
Biotechnology | | | 2.3 | |
Specialty Retail | | | 2.2 | |
| | | | |
Media | | | 2.0 | % |
Chemicals | | | 1.9 | |
Machinery | | | 1.8 | |
Exchange Traded Funds | | | 1.7 | |
Hotels, Restaurants & Leisure | | | 1.7 | |
Diversified Telecommunication Services | | | 1.7 | |
Electric Utilities | | | 1.6 | |
Beverages | | | 1.5 | |
Industrial Conglomerates | | | 1.4 | |
Diversified Financial Services | | | 1.4 | |
Food & Staples Retailing | | | 1.2 | |
Household Products | | | 1.2 | |
Food Products | | | 1.1 | |
Road & Rail | | | 1.0 | |
Communications Equipment | | | 1.0 | |
Life Sciences Tools & Services | | | 0.9 | |
Tobacco | | | 0.9 | |
Multi-Utilities | | | 0.9 | |
Energy Equipment & Services | | | 0.8 | |
Textiles, Apparel & Luxury Goods | | | 0.7 | |
See Notes to Financial Statements.
Industry Classification (continued):
| | | | |
Electronic Equipment, Instruments & Components | | | 0.7 | % |
Consumer Finance | | | 0.6 | |
Air Freight & Logistics | | | 0.6 | |
Electrical Equipment | | | 0.5 | |
Commercial Services & Supplies | | | 0.5 | |
Multiline Retail | | | 0.5 | |
Household Durables | | | 0.4 | |
Airlines | | | 0.4 | |
Metals & Mining | | | 0.4 | |
Professional Services | | | 0.4 | |
Containers & Packaging | | | 0.4 | |
Automobiles | | | 0.4 | |
Building Products | | | 0.3 | |
U.S. Treasury Obligation | | | 0.3 | |
Auto Components | | | 0.2 | |
Trading Companies & Distributors | | | 0.2 | |
Personal Products | | | 0.2 | |
Construction & Engineering | | | 0.2 | |
Gas Utilities | | | 0.2 | |
Construction Materials | | | 0.1 | |
Distributors | | | 0.1 | |
| | | | |
Health Care Technology | | | 0.1 | % |
Leisure Products | | | 0.1 | |
Water Utilities | | | 0.1 | |
Real Estate Management & Development | | | 0.1 | |
Diversified Consumer Services | | | 0.1 | |
Thrifts & Mortgage Finance | | | 0.1 | |
Independent Power & Renewable Electricity Producers | | | 0.1 | |
Paper & Forest Products | | | 0.0 | * |
Mortgage Real Estate Investment Trusts (REITs) | | | 0.0 | * |
Marine | | | 0.0 | * |
Wireless Telecommunication Services | | | 0.0 | * |
| | | | |
| | | 100.0 | |
Other assets in excess of liabilities | | | — | * |
| | | | |
| | | 100.0 | % |
| | | | |
Effects of Derivative Instruments on the Financial Statements and Primary Underlying Risk Exposure:
The Fund invested in derivative instruments during the reporting period. The primary type of risk associated with these derivative instruments is equity contracts risk. The effect of such derivative instruments on the Fund’s financial position and financial performance as reflected in the Statement of Assets and Liabilities and Statement of Operations is presented in the summary below.
Fair values of derivative instruments as of July 31, 2018 as presented in the Statement of Assets and Liabilities:
| | | | | | | | | | | | |
| | | Asset Derivatives | | | Liability Derivatives | |
Derivatives not accounted
for as hedging instruments,
carried at fair value | | Balance Sheet
Location | | Fair
Value | | | Balance Sheet
Location | | Fair
Value | |
| Equity contracts | | Due from/to broker—variation margin futures | | $ | 14,325 | * | | Due from/to broker—variation margin futures | | $ | 2,032 | * |
| | | | | | | | | | | | |
| * | Includes cumulative appreciation (depreciation) as reported in the schedule of open futures and centrally cleared swap contracts. Only unsettled variation margin receivable (payable) is reported within the Statement of Assets and Liabilities. |
The effects of derivative instruments on the Statement of Operations for the year ended July 31, 2018 are as follows:
See Notes to Financial Statements.
| | | | |
| PGIM Day One Underlying Funds | | | 145 | |
PGIM QMA US Broad Market Index Fund
Schedule of Investments (continued)
as of July 31, 2018
| | | | |
Amount of Realized Gain (Loss) on Derivatives Recognized in Income | |
Derivatives not accounted for as hedging
instruments, carried at fair value | | Futures | |
Equity contracts | | $ | 161,472 | |
| | | | |
|
Change in Unrealized Appreciation (Depreciation) on Derivatives Recognized in Income | |
Derivatives not accounted for as hedging
instruments, carried at fair value | | Futures | |
Equity contracts | | $ | 13,918 | |
| | | | |
For the year ended July 31, 2018, the Fund’s average volume of derivative activities is as follows:
| | |
Futures
Contracts—
Long
Positions(1) | |
| $ | 1,167,071 | |
| (1) | Notional Amount in USD. |
Financial Instruments/Transactions—Summary of Offsetting and Netting Arrangements:
The Fund entered into financial instruments/transactions during the reporting period that are either offset in accordance with current requirements or are subject to enforceable master netting arrangements or similar agreements that permit offsetting. The information about offsetting and related netting arrangements for financial instruments/transactions, where the legal right to set-off exists, is presented in the summary below.
Offsetting of financial instrument/transaction assets and liabilities:
| | | | | | | | | | | | |
Description | | Gross
Market
Value of
Recognized
Assets/
(Liabilities) | | | Collateral
Pledged/
(Received)(1) | | | Net
Amount | |
Securities on Loan | | $ | 5,499 | | | $ | (5,499 | ) | | $ | — | |
| | | | | | | | | | | | |
| (1) | Collateral amount disclosed by the Fund is limited to the market value of financial instruments/transactions. |
See Notes to Financial Statements.
PGIM QMA US Broad Market Index Fund
Statement of Assets & Liabilities
as of July 31, 2018
| | | | |
Assets | | | | |
Investments at value, including securities on loan of $5,499: | | | | |
Unaffiliated investments (cost $30,315,354) | | $ | 35,430,996 | |
Affiliated investments (cost $1,584,193) | | | 1,584,194 | |
Receivable for Fund shares sold | | | 40,482 | |
Dividends and interest receivable | | | 26,995 | |
Due from broker—variation margin futures | | | 8,730 | |
Due from Manager | | | 3,664 | |
| | | | |
Total Assets | | | 37,095,061 | |
| | | | |
| |
Liabilities | | | | |
Audit fee payable | | | 24,240 | |
Custodian and accounting fees payable | | | 19,484 | |
Payable for Fund shares reacquired | | | 13,888 | |
Payable to broker for collateral for securities on loan | | | 5,955 | |
Legal fees and expenses payable | | | 4,610 | |
Shareholders’ reports payable | | | 3,603 | |
Payable for investments purchased | | | 2,067 | |
Accrued expenses and other liabilities | | | 1,199 | |
Affiliated transfer agent fee payable | | | 54 | |
| | | | |
Total Liabilities | | | 75,100 | |
| | | | |
| |
Net Assets | | $ | 37,019,961 | |
| | | | |
| | | | | |
Net assets were comprised of: | | | | |
Shares of beneficial interest, at par | | $ | 2,850 | |
Paid-in capital in excess of par | | | 31,426,146 | |
| | | | |
| | | 31,428,996 | |
Undistributed net investment income | | | 292,053 | |
Accumulated net realized gain on investment transactions | | | 170,977 | |
Net unrealized appreciation on investments | | | 5,127,935 | |
| | | | |
Net assets, July 31, 2018 | | $ | 37,019,961 | |
| | | | |
| |
Class R6 | | | | |
Net asset value, offering price and redemption price per share,
($37,019,961 ÷ 2,850,251 shares of beneficial interest issued and outstanding) | | $ | 12.99 | |
| | | | |
See Notes to Financial Statements.
| | | | |
| PGIM Day One Underlying Funds | | | 147 | |
PGIM QMA US Broad Market Index Fund
Statement of Operations
Year Ended July 31, 2018
| | | | |
Net Investment Income (Loss) | | | | |
Income | | | | |
Unaffiliated dividend income (net of $18 foreign withholding tax) | | $ | 520,025 | |
Affiliated dividend income | | | 19,259 | |
Interest income | | | 1,454 | |
Income from securities lending, net (including affiliated income of $11) | | | 36 | |
| | | | |
Total income | | | 540,774 | |
| | | | |
| |
Expenses | | | | |
Management fee | | | 52,937 | |
Custodian and accounting fees | | | 54,895 | |
Audit fee | | | 24,240 | |
Legal fees and expenses | | | 20,491 | |
Trustees’ fees | | | 12,283 | |
Shareholders’ reports | | | 12,075 | |
Class action services | | | 2,250 | |
Insurance expenses | | | 1,000 | |
Commitment fee on syndicated credit agreement | | | 939 | |
Transfer agent’s fees and expenses (including affiliated expense of $332) | | | 430 | |
Registration fees | | | 63 | |
Miscellaneous | | | 8,580 | |
| | | | |
Total expenses | | | 190,183 | |
Less: Fee waiver and/or expense reimbursement | | | (131,364 | ) |
| | | | |
Net expenses | | | 58,819 | |
| | | | |
Net investment income (loss) | | | 481,955 | |
| | | | |
| |
Realized And Unrealized Gain (Loss) On Investments | | | | |
Net realized gain (loss) on: | | | | |
Investment transactions (including affiliated of $(1)) | | | 59,007 | |
Futures transactions | | | 161,472 | |
| | | | |
| | | 220,479 | |
| | | | |
Net change in unrealized appreciation (depreciation) on: | | | | |
Investments (including affiliated of $1) | | | 3,718,181 | |
Futures | | | 13,918 | |
| | | | |
| | | 3,732,099 | |
| | | | |
Net gain (loss) on investment transactions | | | 3,952,578 | |
| | | | |
Net Increase (Decrease) In Net Assets Resulting From Operations | | $ | 4,434,533 | |
| | | | |
See Notes to Financial Statements.
PGIM QMA US Broad Market Index Fund
Statements of Changes in Net Assets
| | | | | | | | |
| | | Year Ended July 31, 2018 | | | November 17, 2016*
through July 31, 2017 | |
Increase (Decrease) in Net Assets | | | | | | | | |
Operations | | | | | | | | |
Net investment income (loss) | | $ | 481,955 | | | $ | 140,977 | |
Net realized gain (loss) on investment transactions | | | 220,479 | | | | 51,838 | |
Net change in unrealized appreciation (depreciation) on investments | | | 3,732,099 | | | | 1,395,836 | |
| | | | | | | | |
Net increase (decrease) in net assets resulting from operations | | | 4,434,533 | | | | 1,588,651 | |
| | | | | | | | |
| | |
Dividends and Distributions | | | | | | | | |
Dividends from net investment income | | | | | | | | |
Class R6 | | | (309,186 | ) | | | (21,693 | ) |
| | | | | | | | |
Distributions from net realized gains | | | | | | | | |
Class R6 | | | (101,340 | ) | | | — | |
| | | | | | | | |
| | |
Fund share transactions | | | | | | | | |
Net proceeds from shares sold | | | 17,165,928 | | | | 21,146,670 | |
Net asset value of shares issued in reinvestment of dividends and distributions | | | 410,526 | | | | 21,693 | |
Cost of shares reacquired | | | (6,954,773 | ) | | | (361,048 | ) |
| | | | | | | | |
Net increase (decrease) in net assets from Fund share transactions | | | 10,621,681 | | | | 20,807,315 | |
| | | | | | | | |
Total increase (decrease) | | | 14,645,688 | | | | 22,374,273 | |
| | |
Net Assets: | | | | | | | | |
Beginning of period | | | 22,374,273 | | | | — | |
| | | | | | | | |
End of period(a) | | $ | 37,019,961 | | | $ | 22,374,273 | |
| | | | | | | | |
(a) Includes undistributed/(distributions in excess of) net investment income of: | | $ | 292,053 | | | $ | 119,284 | |
| | | | | | | | |
| * | Commencement of operations. |
See Notes to Financial Statements.
| | | | |
| PGIM Day One Underlying Funds | | | 149 | |
Glossary:
The following abbreviations are used in the annual report:
Exchange:
LME—London Metal Exchange
OTC—Over-the-counter
Other:
144A—Security was purchased pursuant to Rule 144A under the Securities Act of 1933 and may not be resold subject to that rule except to qualified institutional buyers. Unless otherwise noted, 144A securities are deemed to be liquid.
Aces—Alternative Credit Enhancements Securities
ADR—American Depositary Receipt
AMBAC—American Municipal Bond Assurance Corp.
BABs—Build America Bonds
ETF—Exchange Traded Fund
FHLMC—Federal Home Loan Mortgage Corporation
GMTN—Global Medium Term Note
MTN—Medium Term Note
NASDAQ—National Association of Securities Dealers Automated
PRI—Primary Rate Interface
RBOB—Reformulated Gasoline Blendstock for Oxygen Blending
REITs—Real Estate Investment Trusts
S&P—Standard & Poor
SPDR—Standard & Poor’s Depository Receipts
TBA—To Be Announced
TIPS—Treasury Inflation-Protected Securities
ULSD—Ultra-Low Sulfur Diesel
WTI—West Texas Intermediate
See Notes to Financial Statements.
Notes to Financial Statements/Consolidated Financial Statements
Prudential Investment Portfolios 2 (“PIP2”) is registered under the Investment Company Act of 1940, as amended (“1940 Act”), as an open-end management investment company. PIP2 consists of eleven separate series: PGIM Core Conservative Bond Fund, PGIM Core Short-Term Bond Fund, PGIM Core Ultra Short Bond Fund, PGIM Institutional Money Market Fund, PGIM Jennison Small-Cap Core Equity Fund, PGIM QMA Emerging Markets Equity Fund, PGIM QMA International Developed Markets Index Fund, PGIM QMA Mid-Cap Core Equity Fund, PGIM QMA US Broad Market Index Fund and PGIM TIPS Fund, each of which are diversified funds and PGIM QMA Commodity Strategies Fund (the “Commodity Strategies Fund”) (formerly known as Prudential Commodity Strategies Fund), which is a non-diversified fund for purposes of the 1940 Act and may invest a greater percentage of its assets in the securities of a single company or other issuer than a diversified portfolio. These financial statements (consolidated financial statements for PGIM QMA Commodity Strategies Fund) relate only to the PGIM QMA Commodity Strategies Fund, PGIM Core Conservative Bond Fund, PGIM Jennison Small-Cap Core Equity Fund, PGIM QMA Mid-Cap Core Equity Fund, PGIM QMA US Broad Market Index Fund and PGIM TIPS Fund (each, a “Fund” and collectively, the “Funds”). Effective June 11, 2018, the Funds’ names were changed by replacing “Prudential” with “PGIM”, and Class Q shares were renamed Class R6 shares.
The Commodity Strategies Fund wholly owns and controls the PGIM QMA Commodity Strategies Subsidiary, Ltd. (the “Cayman Subsidiary”), a company organized under the laws of the Cayman Islands. The Cayman Subsidiary is not registered as an investment company under the 1940 Act. The Commodity Strategies Fund’s Board of Trustees has oversight responsibility for the investment activities of the Commodity Strategies Fund, including its investment in the Cayman Subsidiary, and the Commodity Strategies Fund’s role as sole shareholder of the Cayman Subsidiary. The Cayman Subsidiary is subject to the same investment restrictions and limitations, and follows the same compliance policies and procedures, as the Commodity Strategies Fund. The consolidated financial statements of the Commodity Strategies Fund include the financial results of its wholly-owned subsidiary.
In accordance with the accounting rules relating to reporting of a wholly-owned subsidiary, the Consolidated Schedule of Investments includes positions of the Commodity Strategies Fund and the Cayman Subsidiary. These consolidated financial statements include the accounts of the Commodity Strategies Fund and the Cayman Subsidiary. All significant inter-company balances and transactions between the Commodity Strategies Fund and the Cayman Subsidiary have been eliminated in consolidation. The Commodity Strategies Fund will seek to gain exposure to commodities, commodities-related instruments, derivatives and other investments by directly investing in those instruments or through investments in the Cayman Subsidiary. The Cayman Subsidiary participates in the same investment goal as the Commodity Strategies Fund. The Cayman Subsidiary pursues its investment goal by investing in commodities, commodities-related instruments, derivatives and other
| | | | |
| Prudential Day One Underlying Funds | | | 151 | |
Notes to Financial Statements/Consolidated Financial Statements (continued)
investments. The Cayman Subsidiary (unlike the Commodity Strategies Fund) may invest without limitation in these instruments. However, the Cayman Subsidiary is otherwise subject to the same fundamental, non-fundamental and certain other investment restrictions as the Commodity Strategies Fund. The portion of the Commodity Strategies Fund’s or Cayman Subsidiary’s assets exposed to any particular commodity, derivative or other investment will vary based on market conditions, but from time to time some exposure could be substantial.
To the extent of the Commodity Strategies Fund’s investment through the Cayman Subsidiary, it will be subject to the risks associated with the commodities, derivatives and other instruments in which the Cayman Subsidiary invests. By investing in the Cayman Subsidiary, the Commodity Strategies Fund is indirectly exposed to the risks associated with the Cayman Subsidiary’s investments. The derivatives and other investments held by the Cayman Subsidiary are generally similar to those that are permitted to be held by the Commodity Strategies Fund’s commodity and gold/defensive asset classes and are subject to the same risks that apply to similar investments if held directly by the Commodity Strategies Fund.
The Commodity Strategies Fund’s disclosures and operations will be subject to compliance with applicable regulations governing commodity pools in accordance to recent Commodity Futures Trading Commission rule amendments.
As of July 31, 2018, the Cayman Subsidiary had net assets of $3,288,177, representing 18.1% of the Commodity Strategies Fund’s net assets.
The Funds of PIP 2 have the following investment objectives and Subadvisers:
| | | | |
| | | Objective | | Subadviser(s) |
| Jennison Small-Cap Core Equity Fund | | Outperform the Russell 2000 Index. | | Jennison Associates, LLC (“Jennison”) |
| Core Conservative Bond Fund | | Outperform the Bloomberg Barclays U.S. Aggregate Bond Index over full market cycles. | | PGIM Fixed Income, which is a business unit of PGIM, Inc. |
| TIPS Fund | | Outperform the BLoomberg Barclays US Treasury Inflation-Protected Index. | | PGIM Fixed Income, which is a business unit of PGIM, Inc. |
| QMA Commodity Strategies Fund | | Generate returns over time in excess of the Bloomberg Commodity Index. | | Quantitative Management Associates, LLC (“QMA”) |
| QMA Mid-Cap Core Equity Fund | | Outperform the S&P Mid-Cap 400 Index. | | QMA |
| QMA US Broad Market Index Fund | | Seek to provide investment results that approximate the performance of the S&P Composite 1500 Index. | | QMA |
1. Accounting Policies
The Funds follow investment company accounting and reporting guidance of the Financial Accounting Standards Board (“FASB”) Accounting Standard Codification Topic 946 Financial Services—Investment Companies. The following accounting policies conform to U.S. generally accepted accounting principles. The Funds consistently follow such policies in the preparation of their financial statements (consolidated financial statements for Commodity Strategies).
Securities Valuation: Each Fund holds securities and other assets and liabilities that are fair valued at the close of each day (generally, 4:00 PM Eastern time) the New York Stock Exchange (“NYSE”) is open for trading. Fair value is the price that would be received to sell an asset or paid to transfer a liability in an orderly transaction between market participants on the measurement date. The Board of Trustees (the “Board”) has adopted valuation procedures for security valuation under which fair valuation responsibilities have been delegated to PGIM Investments LLC (“PGIM Investments” or “the Manager”). Pursuant to the Board’s delegation, a Valuation Committee has been established as two persons, being one or more officers of the Trust, including: the Trust’s Treasurer (or the Treasurer’s direct reports); and the Trust’s Chief or Deputy Chief Compliance Officer (or Vice-President-level direct reports of the Chief or Deputy Chief Compliance Officer). Under the current valuation procedures, the Valuation Committee of the Board is responsible for supervising the valuation of portfolio securities and other assets and liabilities. The valuation procedures permit the Funds to utilize independent pricing vendor services, quotations from market makers, and alternative valuation methods when market quotations are either not readily available or not deemed representative of fair value. A record of the Valuation Committee’s actions is subject to the Board’s review, approval, and ratification at its next regularly scheduled quarterly meeting.
For the fiscal reporting period-end, securities and other assets and liabilities were fair valued at the close of the last U.S. business day. Trading in certain foreign securities may occur when the NYSE is closed (including weekends and holidays). Because such foreign securities trade in markets that are open on weekends and U.S. holidays, the values of some of the Funds’ foreign investments may change on days when investors cannot purchase or redeem Fund shares.
Various inputs determine how each Fund’s investments are valued, all of which are categorized according to the three broad levels (Level 1, 2, or 3) detailed in the Schedule of Investments (Consolidated Schedule of Investments for Commodity Strategies).
Common and preferred stocks, exchange-traded funds, and derivative instruments, such as futures or options, that are traded on a national securities exchange are valued at the last sale price as of the close of trading on the applicable exchange where the security principally trades. Securities traded via NASDAQ are valued at the NASDAQ official closing price. To the extent these securities are valued at the last sale price or NASDAQ official closing price, they are classified as Level 1 in the fair value hierarchy. In the event that no sale or official closing price on valuation date exists, these securities are generally valued at
| | | | |
| Prudential Day One Underlying Funds | | | 153 | |
Notes to Financial Statements/Consolidated Financial Statements (continued)
the mean between the last reported bid and ask prices, or at the last bid price in the absence of an ask price. These securities are classified as Level 2 in the fair value hierarchy.
Foreign equities traded on foreign securities exchanges are generally valued using pricing vendor services that provide model prices derived using adjustment factors based on information such as local closing price, relevant general and sector indices, currency fluctuations, depositary receipts, and futures, as applicable. Securities valued using such model prices are classified as Level 2 in the fair value hierarchy. The models generate an evaluated adjustment factor for each security, which is applied to the local closing price to adjust it for post closing market movements. Utilizing that evaluated adjustment factor, the vendor provides an evaluated price for each security. If the vendor does not provide an evaluated price, securities are valued in accordance with exchange-traded common and preferred stock valuation policies discussed above.
Derivative instruments, such as futures or options, that are traded on a national securities exchange are valued at the last sale price as of the close of trading on the applicable exchange where the security principally trades.
Securities traded via NASDAQ are valued at the NASDAQ official closing price. To the extent these securities are valued at the last sale price or NASDAQ official closing price, they are classified as Level 1 in the fair value hierarchy.
Investments in open-end, non-exchange-traded mutual funds are valued at their net asset values as of the close of the NYSE on the date of valuation. These securities are classified as Level 1 in the fair value hierarchy since they may be purchased or sold at their net asset values on the date of valuation.
Fixed income securities traded in the OTC market are generally classified as Level 2 in the fair value hierarchy. Such fixed income securities are typically valued using the market approach which generally involves obtaining data from an approved independent third-party vendor source. Each Fund utilizes the market approach as the primary method to value securities when market prices of identical or comparable instruments are available.
The third-party vendors’ valuation techniques used to derive the evaluated bid price are based on evaluating observable inputs, including but not limited to, yield curves, yield spreads, credit ratings, deal terms, tranche level attributes, default rates, cash flows, prepayment speeds, broker/dealer quotations and reported trades. Certain Level 3 securities are also valued using the market approach when obtaining a single broker quote or when utilizing transaction prices for identical securities that have been used in excess of five business days. During the reporting period, there were no changes to report with respect to the valuation approach and/or valuation techniques discussed above.
Securities and other assets that cannot be priced according to the methods described above are valued based on pricing methodologies approved by the Board. In the event that unobservable inputs are used when determining such valuations, the securities will be classified as Level 3 in the fair value hierarchy.
When determining the fair value of securities, some of the factors influencing the valuation include: the nature of any restrictions on disposition of the securities; assessment of the general liquidity of the securities; the issuer’s financial condition and the markets in which it does business; the cost of the investment; the size of the holding and the capitalization of the issuer; the prices of any recent transactions or bids/offers for such securities or any comparable securities; any available analyst media or other reports or information deemed reliable by the Manager regarding the issuer or the markets or industry in which it operates. Using fair value to price securities may result in a value that is different from a security’s most recent closing price and from the price used by other unaffiliated mutual funds to calculate their net asset values.
Restricted and Illiquid Securities: Subject to guidelines adopted by the Board, each Fund may invest up to 15% of its net assets in illiquid securities, including those which are restricted as to disposition under securities law (“restricted securities”). Restricted securities are valued pursuant to the valuation procedures noted above. Illiquid securities are those that, because of the absence of a readily available market or due to legal or contractual restrictions on resale, cannot be sold within seven days in the ordinary course of business at approximately the amount at which the Fund has valued the investment. Therefore, the Fund may find it difficult to sell illiquid securities at the time considered most advantageous by its Subadviser and may incur transaction costs that would not be incurred in the sale of securities that were freely marketable. Certain securities that would otherwise be considered illiquid because of legal restrictions on resale to the general public may be traded among qualified institutional buyers under Rule 144A of the Securities Act of 1933. These Rule 144A securities, as well as commercial paper that is sold in private placements under Section 4(2) of the Securities Act, may be deemed liquid by the Fund’s Subadviser under the guidelines adopted by the Trustees of the Trust. However, the liquidity of the Fund’s investments in Rule 144A securities could be impaired if trading does not develop or declines.
Foreign Currency Translation: The books and records of the Funds are maintained in U.S. dollars. Foreign currency amounts are translated into U.S. dollars on the following basis:
(i) market value of investment securities, other assets and liabilities—at the current rates of exchange;
(ii) purchases and sales of investment securities, income and expenses—at the rates of exchange prevailing on the respective dates of such transactions.
Although the net assets of the Funds are presented at the foreign exchange rates and market values at the close of the period, the Funds do not generally isolate that portion of the results of operations arising as a result of changes in the foreign exchange rates from the
| | | | |
| Prudential Day One Underlying Funds | | | 155 | |
Notes to Financial Statements/Consolidated Financial Statements (continued)
fluctuations arising from changes in the market prices of long-term portfolio securities held at the end of the period. Similarly, the Funds do not isolate the effect of changes in foreign exchange rates from the fluctuations arising from changes in the market prices of long-term portfolio securities sold during the period. Accordingly, holding period realized foreign currency gains (losses) are included in the reported net realized gains (losses) on investment transactions. Notwithstanding the above, the Funds do isolate the effect of fluctuations in foreign currency exchange rates when determining the gain (loss) upon the sale or maturity of foreign currency denominated debt obligations; such amounts are included in net realized gains (losses) on foreign currency transactions.
Additionally, net realized gains (losses) on foreign currency transactions represent net foreign exchange gains (losses) from the disposition of holdings of foreign currencies, forward currency contracts, currency gains (losses) realized between the trade and settlement dates on securities transactions, and the difference between the amounts of interest, dividends and foreign withholding taxes recorded on the Funds’ books and the U.S. dollar equivalent amounts actually received or paid. Net unrealized currency gains (losses) from valuing foreign currency denominated assets and liabilities (other than investments) at period end exchange rates are reflected as a component of net unrealized appreciation (depreciation) on foreign currencies.
Commodities: The Commodity Strategies Fund gains exposure to commodity markets through direct investment of the Commodity Strategies Fund’s assets or through the Cayman Subsidiary. The Commodity Strategies Fund gains exposure to the commodity markets primarily through exchange-traded futures on commodities held by the Cayman Subsidiary. The Commodity Strategies Fund may invest up to 25% of its Commodity Strategies Fund’s total assets in the Cayman Subsidiary. The Cayman Subsidiary may invest in commodity investments without limit. The Fund invests in the Cayman Subsidiary in order to gain exposure to commodities within the limitations of the federal tax law requirements applicable to regulated investment companies such as the Fund. The Commodity Strategies Fund may invest directly in commodity-linked structured notes (CLNs). The Commodity Strategies Fund may also gain direct exposure to commodities through direct investment in certain exchange-traded funds (ETFs) whose returns are linked to commodities or commodity indices within the limit of applicable tax law. Commodities are assets that have tangible properties, such as oil, agriculture products and precious metals. The value of commodities may be affected by, among other things, changes in overall market movements, commodity index volatility, changes in interest rates, or factors affecting a particular industry or commodity, such as drought, floods, weather, livestock disease, embargos, tariffs and international economic, political and regulatory developments. These factors may have a larger impact on commodity prices and commodity linked instruments than on traditional securities. Certain commodities are also subject to limited pricing flexibility because of supply and demand factors. Others are subject to broad price fluctuations as a result of the
volatility of the prices for certain raw materials and the instability of supplies of other materials. These additional variables may create additional risks which subject the Commodity Strategies Fund’s investments to greater volatility than investments in traditional securities.
Financial/Commodity Futures Contracts: A financial futures contract is an agreement to purchase (long) or sell (short) an agreed amount of securities at a set price for delivery on a future date. Upon entering into a financial futures contract, the Fund is required to pledge to the broker an amount of cash and/or other assets equal to a certain percentage of the contract amount. This amount is known as the “initial margin.” Subsequent payments, known as “variation margin,” are made or received by the Fund each day, depending on the daily fluctuations in the value of the underlying security. Such variation margin is recorded for financial statement purposes on a daily basis as unrealized gain (loss). When the contract expires or is closed, the gain (loss) is realized and is presented in the Statement of Operations (Consolidated Statement of Operations for Commodity Strategies) as net realized gain (loss) on futures transactions.
The Funds invested in financial and/or commodity futures contracts in order to hedge its existing portfolio securities, or securities the Fund intend to purchase, against fluctuations in value caused by changes in prevailing interest rates, value of equities or foreign currency exchange rates and to gain exposure to commodities. Should interest rates move unexpectedly, the Fund may not achieve the anticipated benefits of the financial futures contracts and may realize a loss. The Commodity Strategies Fund invested in financial futures contracts in order to hedge or gain exposure to commodity markets. The use of futures transactions involves the risk of imperfect correlation in movements in the price of futures contracts, interest rates and the underlying hedged assets. Since futures contracts are exchange-traded, there is minimal counterparty credit risk to the Fund since the exchanges’ clearinghouse acts as counterparty to all exchange-traded futures and guarantees the futures contracts against default.
Master Netting Arrangements: PIP 2, on behalf of the Funds, is subject to various Master Agreements, or netting arrangements, with select counterparties. These are agreements which a subadviser may have negotiated and entered into on behalf of the Fund. A master netting arrangement between the Fund and the counterparty permits the Fund to offset amounts payable by the Fund to the same counterparty against amounts to be received; and by the receipt of collateral from the counterparty by the Fund to cover the Fund’s exposure to the counterparty. However, there is no assurance that such mitigating factors are easily enforceable. In addition to master netting arrangements, the right to set-off exists when all the conditions are met such that each of the parties owes the other determinable amounts, the reporting party has the right to set-off the amount owed with the amount owed by the other party, the reporting party intends to set-off and the right of set-off is enforceable by law. During the reporting period, there was no intention to settle on a net basis and all amounts are presented on a gross basis on the Statement of Assets and Liabilities (Consolidated Statement of Assets and Liabilities for Commodity Strategies).
| | | | |
| Prudential Day One Underlying Funds | | | 157 | |
Notes to Financial Statements/Consolidated Financial Statements (continued)
Securities Lending: The Funds may lend their portfolio securities to banks and broker-dealers. The loans are secured by collateral at least equal to the market value of the securities loaned. Collateral pledged by each borrower is invested in an affiliated money market fund and is marked to market daily, based on the previous day’s market value, such that the value of the collateral exceeds the value of the loaned securities. Loans are subject to termination at the option of the borrower or the Fund. Upon termination of the loan, the borrower will return to the Fund securities identical to the loaned securities. Should the borrower of the securities fail financially, the Fund has the right to repurchase the securities in the open market using the collateral.
The Fund recognizes income, net of any rebate and securities lending agent fees, for lending its securities in the form of fees or interest on the investment of any cash received as collateral. The borrower receives all interest and dividends from the securities loaned and such payments are passed back to the lender in amounts equivalent thereto. The Fund also continues to recognize any unrealized gain (loss) in the market price of the securities loaned and on the change in the value of the collateral invested that may occur during the term of the loan. In addition, realized gain (loss) is recognized on changes in the value of the collateral invested upon liquidation of the collateral. Net earnings from securities lending are disclosed on the Statement of Operations (Consolidated Statement of Operations for Commodity Strategies) as “Income from securities lending, net”.
Offering and Organization Costs: The Commodity Strategies Fund offering costs paid in connection with the offering of shares of the Fund were amortized on a straight-line basis over 12 months from the date of commencement of operations. Organization costs paid in connection with the organization of the Fund are expensed on the first day of operations.
Securities Transactions and Net Investment Income: Securities transactions are recorded on the trade date. Realized gains (losses) from investment and currency transactions are calculated on the specific identification method. Dividend income is recorded on the ex-date. Interest income, including amortization of premium and accretion of discount on debt securities, as required, is recorded on the accrual basis. Expenses are recorded on an accrual basis, which may require the use of certain estimates by management that may differ from actual.
Equity Real Estate Investment Trusts (collectively REITs): Certain Funds invest in Equity REITs, which report information on the source of their distributions annually. Based on current and historical information, a portion of distributions received from Equity REITs during the period is estimated to be dividend income, capital gain or return of capital and recorded accordingly. When material these estimates are adjusted periodically when the actual source of distributions is disclosed by the Equity REITs.
Taxes: It is each Fund’s policy to continue to meet the requirements of the Internal Revenue Code applicable to regulated investment companies and to distribute all of its taxable net investment income and capital gains, if any, to its shareholders. Therefore, no federal income tax provision is required. Withholding taxes on foreign dividends, interest and capital gains, if any, are recorded, net of reclaimable amounts, at the time the related income is earned.
Dividends and Distributions: Core Conservative Bond and TIPS declare daily dividends from net investment income and payment is made monthly. Distributions of net realized capital and currency gains, if any, are made annually. QMA Commodity Strategies, Jennison Small-Cap Core Equity, QMA Mid-Cap Core Equity and QMA US Broad Market Index expect to pay dividends from net investment income and distributions from net realized capital gains, if any, annually. Dividends and distributions to shareholders, which are determined in accordance with federal income tax regulations and which may differ from generally accepted accounting principles, are recorded on the ex-date. Permanent book/tax differences relating to income and gain (loss) are reclassified amongst undistributed net investment income, accumulated net realized gain (loss) and paid-in capital in excess of par, as appropriate.
Estimates: The preparation of financial statements (consolidated financial statements for Commodity Strategies) requires management to make estimates and assumptions that affect the reported amounts and disclosures in the financial statements. Actual results could differ from those estimates.
2. Agreements
PIP 2, on behalf of the Funds, has a management agreement with PGIM Investments. Pursuant to this agreement, PGIM Investments has responsibility for all investment advisory services and supervises the subadviser’s performance of such services. At July 31, 2018, PGIM Investments has engaged the firms referenced in Note 1 as Subadvisers for their respective Funds.
The management fee payable to PGIM Investments is accrued daily and payable monthly at an annual rate of the Funds’ average daily net assets specified below and PGIM Investments, in turn, pays each subadviser a fee for its services.
| | | | | | | | | | |
Fund | | Management Fee | | | Effective
Management Fee | | | Fee Waivers and/or
Expense Limitations
through November 30, 2019 |
Jennison Small-Cap Core Equity | | | 0.75 | % | | | 0.02 | % | | contractually limit expenses to 0.95%. |
Core Conservative Bond | | | 0.27 | | | | — | # | | contractually limit expenses to 0.50%. |
TIPS | | | 0.23 | | | | — | # | | contractually limit expenses to 0.40%. |
QMA Commodity Strategies | | | 0.40 | ** | | | — | # | | contractually limit expenses to 0.80%.* |
QMA Mid-Cap Core Equity | | | 0.50 | | | | — | # | | contractually limit expenses to 0.85%. |
QMA US Broad Market Index | | | 0.18 | | | | — | # | | contractually limit expenses to 0.20%. |
| | | | |
| Prudential Day One Underlying Funds | | | 159 | |
Notes to Financial Statements/Consolidated Financial Statements (continued)
| # | The management fee amount waived and/or expense reimbursement exceeded the management fee for the current period due to expense limitations described above. |
| * | The manager has contractually agreed to waive any management fees it receives from the Fund in an amount equal to the management fees paid by the Cayman Subsidiary. This waiver will remain in effect for as long as the Fund remains invested or intends to invest in the Cayman Subsidiary. Effective March 30, 2018, PGIM Investments has contractually agreed through November 30, 2020, to limit expenses to 0.80%. Prior to March 30, 2018 PGIM Investments had contractually agreed to limit expenses to 1.00% |
| ** | Effective March 30, 2018, the management fee paid to PGIM Investments is 0.40% on the Fund’s net assets. Prior to March 30, 2018, the management fee paid to PGIM Investments was 0.60% on the Fund’s net assets. |
PIP2, on behalf of the Funds, has a distribution agreement with Prudential Investment Management Services LLC (“PIMS”), which acts as the distributor of the Class R6 shares of the Fund. No distribution or service fees are paid to PIMS as distributor for Class R6 shares of the Fund.
PGIM Investments, PGIM, Inc., Jennison and QMA are indirect, wholly-owned subsidiaries of Prudential Financial, Inc. (“Prudential”).
3. Other Transactions with Affiliates
Prudential Mutual Fund Services LLC (“PMFS”), an affiliate of PGIM Investments and an indirect, wholly-owned subsidiary of Prudential, serves as the transfer agent of the Funds. The transfer agent’s fees and expenses in the Statement of Operations (Consolidated Statement of Operations for Commodity Strategies) include certain out-of-pocket expenses paid to non-affiliates, where applicable.
The Funds may enter into certain securities purchase or sale transactions under Board approved Rule 17a-7 procedures. Rule 17a-7 is an exemptive rule under the 1940 Act, that permits purchase and sale transactions among affiliated investment companies, or between an investment company and a person that is affiliated solely by reason of having a common (or affiliated) investment adviser, common directors, and/or common officers. Such transactions are subject to ratification by the Board. For the year ended July 31, 2018 no such transactions were entered into by the Funds.
The Funds may invest their overnight sweep cash in the PGIM Core Ultra Short Bond Fund (the “Core Fund”) and their securities lending cash collateral in the PGIM Institutional Money Market Fund (the “Money Market Fund”). Earnings from the Core Fund and the Money Market Fund are disclosed on the Statement of Operations (Consolidated Statement of Operations for Commodity Strategies) as “Affiliated dividend income” and “Income from securities lending, net”, respectively.
For the reporting period ended July 31, 2018, PGIM, Inc. was compensated by PGIM Investments for managing the Funds’ securities lending cash collateral as subadviser to the Money Market Fund:
| | | | |
| | | Amount | |
Jennison Small-Cap Core Equity | | $ | 234 | |
QMA Mid-Cap Core Equity | | | 15 | |
QMA US Broad Market Index | | | 6 | |
4. Portfolio Securities
The aggregate cost of purchases and proceeds from sales of portfolio securities (excluding short-term investments and U.S. Government securities) for the year ended July 31, 2018, were as follows:
| | | | | | | | |
| | | Cost of
Purchases | | | Proceeds
from Sales | |
Jennison Small-Cap Core Equity | | $ | 6,548,109 | | | $ | 5,401,286 | |
Core Conservative Bond | | | 35,143,008 | | | | 31,247,093 | |
QMA Mid-Cap Core Equity | | | 14,197,616 | | | | 11,520,036 | |
QMA US Broad Market Index | | | 14,444,815 | | | | 4,183,630 | |
A summary of the cost of purchases and proceeds from sales of shares of affiliated mutual funds for the year ended July 31, 2018, is presented as follows:
Jennison Small-Cap Core Equity
| | | | | | | | | | | | | | | | | | | | | | | | | | | | | | | | |
Affiliated
Mutual
Funds* | | Value,
Beginning
of Year | | | Cost of
Purchases | | | Proceeds
from Sales | | | Change in
Unrealized
Gain
(Loss) | | | Realized
Gain
(Loss) | | | Value,
End of
Year | | | Shares,
End of
Year | | | Dividend
Income | |
PGIM Core Ultra Short Bond Fund | | $ | 653,270 | | | $ | 3,803,844 | | | $ | 3,881,937 | | | $ | — | | | $ | — | | | $ | 575,177 | | | | 575,177 | | | $ | 8,594 | |
PGIM Institutional Money Market Fund | | | 329,204 | | | | 3,473,950 | | | | 3,623,967 | | | | 19 | | | | (14 | ) | | | 179,192 | | | | 179,174 | | | | 308 | ** |
| | | | | | | | | | | | | | | | | | | | | | | | | | | | | | | | |
| | $ | 982,474 | | | $ | 7,277,794 | | | $ | 7,505,904 | | | $ | 19 | | | $ | (14 | ) | | $ | 754,369 | | | | | | | $ | 8,902 | |
| | | | | | | | | | | | | | | | | | | | | | | | | | | | | | | | |
Core Conservative Bond
| | | | | | | | | | | | | | | | | | | | | | | | | | | | | | | | |
Affiliated
Mutual
Funds* | | Value,
Beginning
of Year | | | Cost of
Purchases | | | Proceeds
from Sales | | | Change in
Unrealized
Gain
(Loss) | | | Realized
Gain
(Loss) | | | Value,
End of
Year | | | Shares,
End of
Year | | | Dividend
Income | |
PGIM Core Ultra Short Bond Fund | | $ | 3,545,327 | | | $ | 66,450,039 | | | $ | 67,810,424 | | | $ | — | | | $ | — | | | $ | 2,184,942 | | | | 2,184,942 | | | $ | 21,414 | |
| | | | | | | | | | | | | | | | | | | | | | | | | | | | | | | | |
| | | | |
| Prudential Day One Underlying Funds | | | 161 | |
Notes to Financial Statements/Consolidated Financial Statements (continued)
TIPS
| | | | | | | | | | | | | | | | | | | | | | | | | | | | | | | | |
Affiliated
Mutual
Funds* | | Value,
Beginning
of Year | | | Cost of
Purchases | | | Proceeds
from Sales | | | Change in
Unrealized
Gain
(Loss) | | | Realized
Gain
(Loss) | | | Value,
End of
Year | | | Shares,
End of
Year | | | Dividend
Income | |
PGIM Core Ultra Short Bond Fund | | $ | 80,331 | | | $ | 13,556,325 | | | $ | 13,335,708 | | | $ | — | | | $ | — | | | $ | 300,948 | | | | 300,948 | | | $ | 1,922 | |
| | | | | | | | | | | | | | | | | | | | | | | | | | | | | | | | |
QMA Mid-Cap Core Equity
| | | | | | | | | | | | | | | | | | | | | | | | | | | | | | | | |
Affiliated
Mutual
Funds* | | Value,
Beginning
of Year | | | Cost of
Purchases | | | Proceeds
from Sales | | | Change in
Unrealized
Gain
(Loss) | | | Realized
Gain
(Loss) | | | Value,
End of
Year | | | Shares,
End of
Year | | | Dividend
Income | |
PGIM Core Ultra Short Bond Fund | | $ | 786,076 | | | $ | 43,715,021 | | | $ | 44,418,138 | | | $ | — | | | $ | — | | | $ | 82,959 | | | | 82,959 | | | $ | 1,210 | |
PGIM Institutional Money Market Fund | | | — | | | | 285,049 | | | | 285,045 | | | | — | | | | (4 | ) | | | — | | | | — | | | | 23 | ** |
| | | | | | | | | | | | | | | | | | | | | | | | | | | | | | | | |
| | $ | 786,076 | | | $ | 44,000,070 | | | $ | 44,703,183 | | | $ | — | | | $ | (4 | ) | | $ | 82,959 | | | | | | | $ | 1,233 | |
| | | | | | | | | | | | | | | | | | | | | | | | | | | | | | | | |
QMA US Broad Market Index
| | | | | | | | | | | | | | | | | | | | | | | | | | | | | | | | |
Affiliated
Mutual
Funds* | | Value,
Beginning
of Year | | | Cost of
Purchases | | | Proceeds
from Sales | | | Change in
Unrealized
Gain
(Loss) | | | Realized
Gain
(Loss) | | | Value,
End of
Year | | | Shares,
End of
Year | | | Dividend
Income | |
PGIM Core Ultra Short Bond Fund | | $ | 2,837,115 | | | $ | 126,808,407 | | | $ | 128,067,292 | | | $ | — | | | $ | — | | | $ | 1,578,230 | | | | 1,578,230 | | | $ | 19,259 | |
PGIM Institutional Money Market Fund | | | 13,878 | | | | 188,348 | | | | 196,262 | | | | 1 | | | | (1 | ) | | | 5,964 | | | | 5,963 | | | | 11 | ** |
| | | | | | | | | | | | | | | | | | | | | | | | | | | | | | | | |
| | $ | 2,850,993 | | | $ | 126,996,755 | | | $ | 128,263,554 | | | $ | 1 | | | $ | (1 | ) | | $ | 1,584,194 | | | | | | | $ | 19,270 | |
| | | | | | | | | | | | | | | | | | | | | | | | | | | | | | | | |
| * | The Funds did not have any capital gain distributions during the reporting period. |
| ** | This amount is included in “Income from securities lending, net” on the Statement of Operations. |
5. Distribution and Tax Information
Distributions to shareholders, which are determined in accordance with federal income tax regulations, which may differ from generally accepted accounting principles, are recorded on the ex-date. In order to present undistributed (distributions in excess of) net investment income, accumulated net realized gain/loss on investment transactions and paid-in capital in excess of par on the Statement of Assets and Liabilities that more closely represent their tax character, certain adjustments have been made to undistributed (distributions in excess of) net investment income and accumulated net realized gain/loss on investment transactions.
For the year ended July 31, 2018, the adjustments were as follows:
| | | | | | | | |
| | | Undistributed
(Distribution in
Excess of)
Net Investment
Income | | | Accumulated
Net Realized Gain/Loss
on Investment Transactions | |
Jennison Small-Cap Core
Equity(a) | | $ | 841 | | | $ | (841 | ) |
Core Conservative Bond(b)(c) | | | 122,628 | | | | (122,628 | ) |
TIPS(b) | | | 132,340 | | | | (132,340 | ) |
QMA Commodity Strategies(d)(e) | | | 394,266 | | | | (394,266 | ) |
| (a) | Redesignation of dividends paid. |
| (b) | Differences in the tax treatment of premium amortization. |
| (c) | Reclassification of paydowns. |
| (d) | Differences in the treatment for book and tax purposes related to the investment in the Cayman Subsidiary. |
| (e) | Certain transactions involving foreign securities. |
Net investment income or loss, net realized gains or losses and net assets were not affected by these adjustments.
For the year ended July 31, 2018, the tax character of dividends paid as reflected in the Statement of Changes in Net Assets were as follows:
| | | | | | | | | | | | |
| | | Ordinary
Income | | | Long-Term
Capital Gains | | | Total Dividends
and Distributions | |
Jennison Small-Cap Core Equity | | $ | 236,024 | | | $ | 1,905 | | | $ | 237,929 | |
Core Conservative Bond | | | 853,604 | | | | — | | | | 853,604 | |
TIPS | | | 687,732 | | | | — | | | | 687,732 | |
QMA Commodity Strategies | | | 222,021 | | | | — | | | | 222,021 | |
QMA Mid-Cap Core Equity | | | 276,399 | | | | 2,103 | | | | 278,502 | |
QMA US Broad Market Index | | | 364,750 | | | | 45,776 | | | | 410,526 | |
For the period ended July 31, 2017, the tax character of dividends paid as reflected in the Statement of Changes in Net Assets were as follows:
| | | | |
| | | Ordinary Income | |
Jennison Small-Cap Core Equity | | $ | 16,947 | |
Core Conservative Bond | | | 365,156 | |
TIPS | | | 115,604 | |
QMA Mid-Cap Core Equity | | | 5,533 | |
QMA US Broad Market Index | | | 21,693 | |
Commodity Strategies had no dividends paid during the period ended July 31, 2017.
| | | | |
| Prudential Day One Underlying Funds | | | 163 | |
Notes to Financial Statements/Consolidated Financial Statements (continued)
For the year ended July 31, 2018, the Funds had the following amounts of accumulated undistributed earnings on a tax basis:
| | | | | | | | |
| | | Undistributed
Ordinary
Income | | | Undistributed
Long-Term
Capital Gains | |
Jennison Small-Cap Core Equity | | $ | 260,194 | | | $ | 343,993 | |
Core Conservative Bond | | | 2,778 | | | | — | |
TIPS | | | 11,790 | | | | — | |
QMA Commodity Strategies | | | 450,990 | | | | — | |
QMA Mid-Cap Core Equity | | | 291,159 | | | | 187,813 | |
QMA US Broad Market Index | | | 401,194 | | | | 111,721 | |
These amounts may differ from the amounts shown on the Statement of Assets and Liabilities primarily due to cumulative timing differences between financial and tax reporting.
The United States federal income tax basis of the Funds’ investments and the net unrealized appreciation/(depreciation) as of July 31, 2018 were as follows:
| | | | | | | | | | | | | | | | |
| | | Tax Basis | | | Gross
Unrealized
Appreciation | | | Gross
Unrealized
Depreciation | | | Net
Unrealized
Appreciation
(Depreciation) | |
Jennison Small-Cap | | | | | | | | | | | | | | | | |
Core Equity | | $ | 13,535,517 | | | $ | 3,315,068 | | | $ | (526,424 | ) | | $ | 2,788,644 | |
Core Conservative Bond | | | 41,332,230 | | | | 26,326 | | | | (915,284 | ) | | | (888,958 | ) |
TIPS | | | 24,162,460 | | | | 60,796 | | | | (519,972 | ) | | | (459,176 | ) |
QMA Commodity Strategies | | | 18,273,275 | | | | 632,337 | | | | (643,526 | ) | | | (11,189 | ) |
QMA Mid-Cap Core Equity | | | 11,244,008 | | | | 1,230,495 | | | | (298,112 | ) | | | 932,383 | |
QMA US Broad Market Index | | | 31,949,433 | | | | 5,826,807 | | | | (748,757 | ) | | | 5,078,050 | |
The difference between book basis and tax basis was primarily attributable to deferred losses on wash sales and other cost basis adjustments.
For federal income tax purposes, the following Funds had a capital loss carryforward as of July 31, 2018 which can be carried forward for an unlimited period. No capital gains
distributions are expected to be paid to shareholders until net gains have been realized in excess of such losses.
| | | | |
| | | Capital Loss
Carryforward | |
Core Conservative Bond | | $ | 304,382 | |
TIPS | | | 172,701 | |
Management has analyzed the Funds’ tax positions taken on federal, state and local tax returns for all open tax years and has concluded that no provision for income tax is required in the Funds’ financial statements (consolidated financial statements for Commodity Strategies) for the current reporting period. The Funds’ federal, state and local income and federal excise tax returns for tax years for which the applicable statutes of limitations have not expired are subject to examination by the Internal Revenue Service.
6. Capital and Ownership
The Funds offer Class R6 shares. Effective as of May 22, 2017, shares of the Funds are registered under the Securities Act of 1933, as amended.
PIP2 has authorized an unlimited number of shares of beneficial interest at $0.001 par value per share.
At reporting period end, Prudential owned all shares of the Funds.
Transactions in shares of beneficial interest were as follows:
| | | | | | | | | | | | |
| | | Number of
Shareholders | | | % of Outstanding
Shares | | | % Held by an
Affiliate
of Prudential | |
Jennison Small-Cap Core Equity | | | 1 | | | | 82 | | | | 82 | |
Core Conservative Bond | | | 4 | | | | 89 | | | | 89 | |
TIPS | | | 6 | | | | 95 | | | | 95 | |
QMA Commodity Strategies | | | 4 | | | | 81 | | | | 81 | |
QMA Mid-Cap Core Equity | | | 5 | | | | 86 | | | | 86 | |
QMA US Broad Market Index | | | 6 | | | | 90 | | | | 90 | |
| | | | |
| Prudential Day One Underlying Funds | | | 165 | |
Notes to Financial Statements/Consolidated Financial Statements (continued)
Jennison Small-Cap Core Equity
| | | | | | | | |
Class R6 | | Shares | | | Amount | |
Year ended July 31, 2018: | | | | | | | | |
Shares sold | | | 176,117 | | | $ | 2,127,195 | |
Shares issued in reinvestment of dividends and distributions | | | 20,353 | | | | 237,929 | |
Shares reacquired | | | (73,899 | ) | | | (894,149 | ) |
| | | | | | | | |
Net increase (decrease) in shares outstanding | | | 122,571 | | | $ | 1,470,975 | |
| | | | | | | | |
Period ended July 31, 2017*: | | | | | | | | |
Shares sold | | | 1,119,251 | | | $ | 11,329,854 | |
Shares issued in reinvestment of dividends and distributions | | | 1,657 | | | | 16,947 | |
Shares reacquired | | | (4,613 | ) | | | (51,535 | ) |
| | | | | | | | |
Net increase (decrease) in shares outstanding | | | 1,116,295 | | | $ | 11,295,266 | |
| | | | | | | | |
| * | Commencement of operations was November 15, 2016. |
Core Conservative Bond
| | | | | | | | |
Class R6 | | Shares | | | Amount | |
Year ended July 31, 2018: | | | | | | | | |
Shares sold | | | 1,096,332 | | | $ | 10,806,386 | |
Shares issued in reinvestment of dividends and distributions | | | 86,804 | | | | 853,603 | |
Shares reacquired | | | (316,413 | ) | | | (3,125,416 | ) |
| | | | | | | | |
Net increase (decrease) in shares outstanding | | | 866,723 | | | $ | 8,534,573 | |
| | | | | | | | |
Period ended July 31, 2017*: | | | | | | | | |
Shares sold | | | 3,116,135 | | | $ | 31,148,943 | |
Shares issued in reinvestment of dividends and distributions | | | 36,615 | | | | 365,155 | |
Shares reacquired | | | (26,509 | ) | | | (265,872 | ) |
| | | | | | | | |
Net increase (decrease) in shares outstanding | | | 3,126,241 | | | $ | 31,248,226 | |
| | | | | | | | |
| * | Commencement of operations was November 15, 2016. |
TIPS
| | | | | | | | |
Class R6 | | Shares | | | Amount | |
Year ended July 31, 2018: | | | | | | | | |
Shares sold | | | 1,865,204 | | | $ | 18,258,971 | |
Shares issued in reinvestment of dividends and distributions | | | 70,559 | | | | 687,633 | |
Shares reacquired | | | (1,094,153 | ) | | | (10,672,380 | ) |
| | | | | | | | |
Net increase (decrease) in shares outstanding | | | 841,610 | | | $ | 8,274,224 | |
| | | | | | | | |
Period ended July 31, 2017*: | | | | | | | | |
Shares sold | | | 1,660,933 | | | $ | 16,410,866 | |
Shares issued in reinvestment of dividends and distributions | | | 11,648 | | | | 115,603 | |
Shares reacquired | | | (49,329 | ) | | | (487,988 | ) |
| | | | | | | | |
Net increase (decrease) in shares outstanding | | | 1,623,252 | | | $ | 16,038,481 | |
| | | | | | | | |
| * | Commencement of operations was November 15, 2016. |
QMA Commodity Strategies
| | | | | | | | |
Class R6 | | Shares | | | Amount | |
Year ended July 31, 2018: | | | | | | | | |
Shares sold | | | 588,588 | | | $ | 6,137,208 | |
Shares issued in reinvestment of dividends and distributions | | | 22,048 | | | | 222,021 | |
Shares reacquired | | | (206,859 | ) | | | (2,156,323 | ) |
| | | | | | | | |
Net increase (decrease) in shares outstanding | | | 403,777 | | | $ | 4,202,906 | |
| | | | | | | | |
Period ended July 31, 2017*: | | | | | | | | |
Shares sold | | | 1,381,783 | | | $ | 13,792,034 | |
Shares reacquired | | | (21,352 | ) | | | (213,299 | ) |
| | | | | | | | |
Net increase (decrease) in shares outstanding | | | 1,360,431 | | | $ | 13,578,735 | |
| | | | | | | | |
| * | Commencement of operations was November 15, 2016. |
QMA Mid-Cap Core Equity
| | | | | | | | |
Class R6 | | Shares | | | Amount | |
Year ended July 31, 2018: | | | | | | | | |
Shares sold | | | 380,457 | | | $ | 4,425,757 | |
Shares issued in reinvestment of dividends and distributions | | | 24,009 | | | | 278,502 | |
Shares reacquired | | | (150,784 | ) | | | (1,754,278 | ) |
| | | | | | | | |
Net increase (decrease) in shares outstanding | | | 253,682 | | | $ | 2,949,981 | |
| | | | | | | | |
Period ended July 31, 2017*: | | | | | | | | |
Shares sold | | | 762,851 | | | $ | 7,907,520 | |
Shares issued in reinvestment of dividends and distributions | | | 532 | | | | 5,533 | |
Shares reacquired | | | (8,369 | ) | | | (92,824 | ) |
| | | | | | | | |
Net increase (decrease) in shares outstanding | | | 755,014 | | | $ | 7,820,229 | |
| | | | | | | | |
| * | Commencement of operations was November 17, 2016. |
QMA US Broad Market Index
| | | | | | | | |
Class R6 | | Shares | | | Amount | |
Year ended July 31, 2018: | | | | | | | | |
Shares sold | | | 1,417,563 | | | $ | 17,165,928 | |
Shares issued in reinvestment of dividends and distributions | | | 33,955 | | | | 410,526 | |
Shares reacquired | | | (570,993 | ) | | | (6,954,773 | ) |
| | | | | | | | |
Net increase (decrease) in shares outstanding | | | 880,525 | | | $ | 10,621,681 | |
| | | | | | | | |
Period ended July 31, 2017*: | | | | | | | | |
Shares sold | | | 1,999,808 | | | $ | 21,146,670 | |
Shares issued in reinvestment of dividends and distributions | | | 2,100 | | | | 21,693 | |
Shares reacquired | | | (32,182 | ) | | | (361,048 | ) |
| | | | | | | | |
Net increase (decrease) in shares outstanding | | | 1,969,726 | | | $ | 20,807,315 | |
| | | | | | | | |
| * | Commencement of operations was November 17, 2016. |
7. Borrowings
PIP2, on behalf of the Funds, along with other affiliated registered investment companies (the “Funds”), is a party to a Syndicated Credit Agreement (“SCA”) with a group of banks.
| | | | |
| Prudential Day One Underlying Funds | | | 167 | |
Notes to Financial Statements/Consolidated Financial Statements (continued)
The purpose of the SCA is to provide an alternative source of temporary funding for capital share redemptions. The SCA provides for a commitment of $900 million for the period October 5, 2017 through October 4, 2018. The Funds pay an annualized commitment fee of 0.15% of the unused portion of the SCA. Each Fund’s portion of the commitment fee for the unused amount, allocated based upon a method approved by the Board, is accrued daily and paid quarterly. Prior to October 5, 2017, the Funds had another SCA that provided a commitment of $900 million and the Funds paid an annualized commitment fee of 0.15% of the unused portion of the SCA. The interest on borrowings under the SCAs is paid monthly and at a per annum interest rate based upon a contractual spread plus the higher of (1) the effective federal funds rate, (2) the 1-month London Interbank Offering Rate or (3) zero percent.
Other affiliated registered investment companies that are parties to the SCA include portfolios that are subject to a predetermined mathematical formula used to manage certain benefit guarantees offered under variable annuity contracts. The formula may result in large scale asset flows into and out of these portfolios. Consequently, these portfolios may be more likely to utilize the SCA for purposes of funding redemptions. It may be possible for those portfolios to fully exhaust the committed amount of the SCA, thereby requiring the Manager to allocate available funding per a Board-approved methodology designed to treat the Funds in the SCA equitably.
The following Funds utilized the SCA during the reporting period ended July 31, 2018. The average balance outstanding is for the number of days the Funds had utilized the credit facility.
| | | | | | | | | | | | | | | | | | | | |
Fund | | Average
Balance
Outstanding | | | Weighted
Average
Interest Rates | | | Number
of Days
Outstanding | | | Maximum
Balance
Outstanding | | | Balance
Outstanding at
July 31, 2018 | |
PGIM TIPS Fund | | $ | 253,667 | | | | 2.76 | % | | | 6 | | | $ | 486,000 | | | $ | — | |
PGIM QMA Mid-Cap Core Equity Fund | | | 281,000 | | | | 2.81 | | | | 2 | | | | 281,000 | | | | — | |
8. Other Risks
The Funds’ risks include, but are not limited to, the risks discussed below:
Bond Obligations Risk: The Fund’s holdings, share price, yield and total return may fluctuate in response to bond market movements. The value of bonds may decline for issuer-related reasons, including management performance, financial leverage and reduced demand for the issuer’s goods and services. Certain types of fixed-income obligations also may be subject to “call and redemption risk,” which is the risk that the issuer may call a bond held
by the Fund for redemption before it matures and the Fund may not be able to reinvest at the same level and therefore would earn less income.
Derivatives Risk: Derivatives involve special risks and costs and may result in losses to the Fund. The prices of derivatives may move in unexpected ways, especially in abnormal market conditions. Some derivatives are “leveraged” and therefore may magnify or otherwise increase investment losses to the Fund. The Fund’s use of derivatives may also increase the amount of taxes payable by shareholders. Other risks arise from the potential inability to terminate or close out of derivatives positions. A liquid secondary market may not always exist for the Fund’s derivatives positions. Generally, many OTC derivative instruments will not have liquidity beyond the counterparty to the instrument. OTC derivative instruments also involve the risk that the other party will not meet its obligations to the Fund.
Foreign Securities Risk: The Fund’s investments in securities of foreign issuers or issuers with significant exposure to foreign markets involve additional risk. Foreign countries in which the Fund may invest may have markets that are less liquid, less regulated and more volatile than US markets. The value of the Fund’s investments may decline because of factors affecting the particular issuer as well as foreign markets and issuers generally, such as unfavorable government actions, and political or financial instability.
Interest Rate Risk: The market price of the Fund’s investments will change in response to changes in interest rate and other factors. During periods of rising interest rates, the market price of fixed income instruments generally declines. As interest rates increase, slower than expected principal payments may extend the average life of securities, potentially locking in below-market interest rates and reducing the Fund’s value. In typical market interest rate environments, the prices of long-term debt obligations generally fluctuate more than prices of short-term debt obligations as interest rates change. Fluctuations in the market price of the Fund’s instruments will not affect interest income derived from the instruments already owned by the Fund, but will be reflected in the Fund’s NAV.
Liquidity Risk: The Funds may invest in instruments that trade in lower volumes and are less liquid than other investments. Liquidity risk includes the risk that the Fund may make investments that may become less liquid in response to market developments or adverse investor perceptions. Investments that are illiquid or that trade in lower volumes may be more difficult to value. When there is no willing buyer and investments cannot be readily sold at the desired time or price, the Fund may have to accept a lower price or may not be able to sell the instrument at all. An inability to sell a portfolio position can adversely affect the Fund’s value or prevent the Fund from being able to take advantage of other investment opportunities.
Market and Credit Risk: Securities markets may be volatile and the market prices of the Fund’s securities may decline. Securities fluctuate in price based on changes in an issuer’s financial condition and overall market and economic conditions. If the market prices of the securities owned by the Fund fall, the value of an investment in the Fund will decline. Additionally, the Fund may also be exposed to credit risk in the event that an issuer or
| | | | |
| Prudential Day One Underlying Funds | | | 169 | |
Notes to Financial Statements/Consolidated Financial Statements (continued)
guarantor fails to perform or that an institution or entity with which the Fund has unsettled or open transactions defaults.
Non-Diversification Risk: The Commodity Strategies Fund is non-diversified, meaning that the Fund may invest a greater percentage of its assets in the securities of a single company or other issuer than a diversified Fund. Investing in a non-diversified Fund involves greater risk than investing in a diversified Fund because a loss resulting from the decline in value of any one security may represent a greater portion of the total assets of a non-diversified Fund.
Risks of Investing in Real Estate Investment Trusts (REITs): Real estate securities are subject to similar risks as direct investments in real estate and mortgages, and their value will depend on the value of the underlying properties or the underlying loans or interests. The underlying loans may be subject to the risks of default or of payments that occur earlier or later than expected, and such loans may also include so-called “subprime” mortgages. The value of these securities will rise and fall in response to many factors, Including economic conditions, the demand for rental property and interest rates. In particular, the value of these securities may decline when interest rates rise and will also be affected by the real estate market and by the management of the underlying properties.
In addition, investing in REITs involves certain unique risks in addition to those risks associated with investing in the real estate industry in general. Equity REITs may be affected by changes in the value of the underlying property owned by the REITs, while mortgage REITs may be affected by the quality of any credit extended. REITs are dependent upon management skills, may not be diversified geographically or by property/mortgage asset type, and are subject to heavy cash flow dependency, default by borrowers and self-liquidation. Since REITs are relatively smaller in size when compared to the broader market, and smaller companies tend to be more volatile than larger companies, they may be more volatile and/or more illiquid than other types of equity securities. REITs (especially mortgage REITs) are subject to interest rate risks. REITs may incur significant amounts of leverage. The Fund will indirectly bear a portion of the expenses, including management fees, paid by each REIT in which it invests, in addition to the expenses of the Fund.
Risks of Investing in Treasury Inflation Protected Securities (TIPS): The value of TIPS generally fluctuates in response to inflationary concerns. As inflationary expectations increase, TIPS will become more attractive, because they protect future interest payments against inflation. Conversely, as inflationary concerns decrease, TIPS will become less attractive and less valuable. Although the principal value of TIPS declines in periods of deflation, holders at maturity receive no less than the par value of the bond. However, if the Portfolios purchase TIPS in the secondary market, where principal values have been adjusted upward due to inflation since issuance, they may experience a loss if there is a
subsequent period of deflation. If inflation is lower than expected during the period the Portfolios hold TIPS, the Portfolios may earn less on the security than on a conventional bond.
U.S. Government and Agency Securities Risk: U.S. Government and agency securities are subject to market risk, interest rate risk and credit risk. Not all U.S. Government securities are insured or guaranteed by the full faith and credit of the U.S. Government; some are only insured or guaranteed by the issuing agency, which must rely on its own resources to repay the debt. In addition, the value of U.S. Government securities may be affected by changes in the credit rating of the U.S. Government.
| | | | |
| Prudential Day One Underlying Funds | | | 171 | |
PGIM Jennison Small-Cap Core Equity Fund
Financial Highlights
| | | | | | | | | | | | |
| Class R6 Shares | | | | | | | | | |
| | | Year Ended
July 31, 2018 | | | | | | November 15, 2016(a)
through
July 31, 2017 | |
| Per Share Operating Performance(b): | | | | | | | | | | | | |
| Net Asset Value, Beginning of Period | | | $11.27 | | | | | | | | $10.00 | |
| Income (loss) from investment operations: | | | | | | | | | | | | |
| Net investment income (loss) | | | - | (c) | | | | | | | 0.02 | |
| Net realized and unrealized gain (loss) on investment transactions | | | 1.97 | | | | | | | | 1.27 | |
| Total from investment operations | | | 1.97 | | | | | | | | 1.29 | |
| Less Dividends and Distributions: | | | | | | | | | | | | |
| Dividends from net investment income | | | - | (c) | | | | | | | (0.02 | ) |
| Distributions from net realized gains | | | (0.20 | ) | | | | | | | - | |
| Total dividends and distributions | | | (0.20 | ) | | | | | | | (0.02 | ) |
| Net asset value, end of period | | | $13.04 | | | | | | | | $11.27 | |
| Total Return(d): | | | 17.75% | | | | | | | | 12.89% | |
| |
| Ratios/Supplemental Data: | | | | | | | | | |
| Net assets, end of period (000) | | | $16,158 | | | | | | | | $12,584 | |
| Average net assets (000) | | | $14,370 | | | | | | | | $10,943 | |
| Ratios to average net assets(e): | | | | | | | | | | | | |
| Expenses after waivers and/or expense reimbursement | | | 0.95% | | | | | | | | 1.02% | (f) |
| Expenses before waivers and/or expense reimbursement | | | 1.68% | | | | | | | | 2.04% | (f) |
| Net investment income (loss) | | | -% | (g) | | | | | | | 0.22% | (f) |
| Portfolio turnover rate(h) | | | 39% | | | | | | | | 28% | (i) |
| (a) | Commencement of operations. |
| (b) | Calculated based on average shares outstanding during the period. |
| (c) | Less than $0.005 per share. |
| (d) | Total return is calculated assuming a purchase of a share on the first day and a sale on the last day of each period reported and includes reinvestment of dividends and distributions, if any. Total returns may reflect adjustments to conform to generally accepted accounting principles. Total returns for periods less than one full year are not annualized. |
| (e) | Does not include expenses of the underlying funds in which the Fund invests. |
| (h) | The Fund’s portfolio turnover rate is calculated in accordance with regulatory requirements, without regard to transactions involving short term investments and certain derivatives. If such transactions were included, the Fund’s portfolio turnover rate may be higher. |
See Notes to Financial Statements.
PGIM Core Conservative Bond Fund
Financial Highlights
| | | | | | | | | | | | |
| Class R6 Shares | | | | | | | | | |
| | | Year Ended
July 31, 2018 | | | | | | November 15, 2016(a)
through
July 31, 2017 | |
| Per Share Operating Performance(b): | | | | | | | | | | | | |
| Net Asset Value, Beginning of Period | | | $10.03 | | | | | | | | $10.00 | |
| Income (loss) from investment operations: | | | | | | | | | | | | |
| Net investment income (loss) | | | 0.21 | | | | | | | | 0.12 | |
| Net realized and unrealized gain (loss) on investment transactions | | | (0.34 | ) | | | | | | | 0.05 | |
| Total from investment operations | | | (0.13 | ) | | | | | | | 0.17 | |
| Less Dividends and Distributions: | | | | | | | | | | | | |
| Dividends from net investment income | | | (0.24 | ) | | | | | | | (0.14 | ) |
| Net asset value, end of period | | | $9.66 | | | | | | | | $10.03 | |
| Total Return(c): | | | (1.31)% | | | | | | | | 1.72% | |
| |
| Ratios/Supplemental Data: | | | | | | | | | |
| Net assets, end of period (000) | | | $38,592 | | | | | | | | $31,357 | |
| Average net assets (000) | | | $34,737 | | | | | | | | $25,827 | |
| Ratios to average net assets(d): | | | | | | | | | | | | |
| Expenses after waivers and/or expense reimbursement | | | 0.50% | | | | | | | | 0.53% | (e) |
| Expenses before waivers and/or expense reimbursement | | | 0.78% | | | | | | | | 0.95% | (e) |
| Net investment income (loss) | | | 2.11% | | | | | | | | 1.72% | (e) |
| Portfolio turnover rate(f) | | | 171% | | | | | | | | 348% | (g) |
| (a) | Commencement of operations. |
| (b) | Calculated based on average shares outstanding during the period. |
| (c) | Total return is calculated assuming a purchase of a share on the first day and a sale on the last day of each period reported and includes reinvestment of dividends and distributions, if any. Total returns may reflect adjustments to conform to generally accepted accounting principles. Total returns for periods less than one full year are not annualized. |
| (d) | Does not include expenses of the underlying funds in which the Fund invests. |
| (f) | The Fund’s portfolio turnover rate is calculated in accordance with regulatory requirements, without regard to transactions involving short term investments and certain derivatives. If such transactions were included, the Fund’s portfolio turnover rate may be higher. |
See Notes to Financial Statements.
| | | | |
| PGIM Day One Underlying Funds | | | 173 | |
PGIM TIPS Fund
Financial Highlights
| | | | | | | | | | | | |
| Class R6 Shares | | | | | | | | | |
| | | Year Ended
July 31, 2018 | | | | | | November 15, 2016(a)
through
July 31, 2017 | |
| Per Share Operating Performance(b): | | | | | | | | | | | | |
| Net Asset Value, Beginning of Period | | | $9.86 | | | | | | | | $10.00 | |
| Income (loss) from investment operations: | | | | | | | | | | | | |
| Net investment income (loss) | | | 0.28 | | | | | | | | 0.13 | |
| Net realized and unrealized gain (loss) on investment and foreign currency transactions | | | (0.19 | ) | | | | | | | (0.09 | ) |
| Total from investment operations | | | 0.09 | | | | | | | | 0.04 | |
| Less Dividends and Distributions: | | | | | | | | | | | | |
| Dividends from net investment income | | | (0.34 | ) | | | | | | | (0.18 | ) |
| Net asset value, end of period | | | $9.61 | | | | | | | | $9.86 | |
| Total Return(c): | | | 0.87% | | | | | | | | 0.38% | |
| |
| Ratios/Supplemental Data: | | | | | | | | | |
| Net assets, end of period (000) | | | $23,693 | | | | | | | | $16,011 | |
| Average net assets (000) | | | $19,916 | | | | | | | | $6,479 | |
| Ratios to average net assets(d): | | | | | | | | | | | | |
| Expenses after waivers and/or expense reimbursement | | | 0.40% | | | | | | | | 0.55% | (e) |
| Expenses before waivers and/or expense reimbursement | | | 0.94% | | | | | | | | 2.41% | (e) |
| Net investment income (loss) | | | 2.83% | | | | | | | | 1.79% | (e) |
| Portfolio turnover rate(f) | | | 54% | | | | | | | | 41% | (g) |
| (a) | Commencement of operations. |
| (b) | Calculated based on average shares outstanding during the period. |
| (c) | Total return is calculated assuming a purchase of a share on the first day and a sale on the last day of each period reported and includes reinvestment of dividends and distributions, if any. Total returns may reflect adjustments to conform to generally accepted accounting principles. Total returns for periods less than one full year are not annualized. |
| (d) | Does not include expenses of the underlying funds in which the Fund invests. |
| (f) | The Fund’s portfolio turnover rate is calculated in accordance with regulatory requirements, without regard to transactions involving short term investments and certain derivatives. If such transactions were included, the Fund’s portfolio turnover rate may be higher. |
See Notes to Financial Statements.
PGIM QMA Commodity Strategies Fund
Consolidated Financial Highlights
| | | | | | | | | | | | |
| Class R6 Shares | | | | | | | | | |
| | | Year Ended
July 31, 2018 | | | | | | November 15, 2016(a)
through
July 31, 2017 | |
| Per Share Operating Performance(b): | | | | | | | | | | | | |
| Net Asset Value, Beginning of Period | | | $10.15 | | | | | | | | $10.00 | |
| Income (loss) from investment operations: | | | | | | | | | | | | |
| Net investment income (loss) | | | 0.04 | | | | | | | | (0.05 | ) |
| Net realized and unrealized gain (loss) on investment transactions | | | 0.27 | | | | | | | | 0.20 | |
| Total from investment operations | | | 0.31 | | | | | | | | 0.15 | |
| Less Dividends and Distributions: | | | | | | | | | | | | |
| Dividends from net investment income | | | (0.15 | ) | | | | | | | - | |
| Net asset value, end of period | | | $10.31 | | | | | | | | $10.15 | |
| Total Return(c): | | | 3.09% | | | | | | | | 1.50% | |
| |
| Ratios/Supplemental Data: | | | | | | | | | |
| Net assets, end of period (000) | | | $18,187 | | | | | | | | $13,811 | |
| Average net assets (000) | | | $16,136 | | | | | | | | $10,738 | |
| Ratios to average net assets(d): | | | | | | | | | | | | |
| Expenses after waivers and/or expense reimbursement | | | 0.92% | | | | | | | | 1.30% | (e) |
| Expenses before waivers and/or expense reimbursement | | | 1.88% | | | | | | | | 2.64% | (e) |
| Net investment income (loss) | | | 0.41% | | | | | | | | (0.67)% | (e) |
| Portfolio turnover rate(f) | | | 0% | | | | | | | | 0% | (g) |
| (a) | Commencement of operations. |
| (b) | Calculated based on average shares outstanding during the period. |
| (c) | Total return is calculated assuming a purchase of a share on the first day and a sale on the last day of each period reported, and includes reinvestment of dividends and distributions, if any. Total returns may reflect adjustments to conform to generally accepted accounting principles. Total returns for periods less than one full year are not annualized. |
| (d) | Does not include expenses of the underlying funds in which the Fund invests. |
| (f) | The Fund’s portfolio turnover rate is calculated in accordance with regulatory requirements, without regard to transactions involving short term investments and certain derivatives. If such transactions were included, the Fund’s portfolio turnover rate may be higher. |
See Notes to Financial Statements.
| | | | |
| PGIM Day One Underlying Funds | | | 175 | |
PGIM QMA Mid-Cap Core Equity Fund
Financial Highlights
| | | | | | | | | | | | |
| Class R6 Shares | | | | | | | | | |
| | | Year Ended
July 31, 2018 | | | | | | November 17, 2016(a)
through
July 31, 2017 | |
| Per Share Operating Performance(b): | | | | | | | | | | | | |
| Net Asset Value, Beginning of Period | | | $11.16 | | | | | | | | $10.00 | |
| Income (loss) from investment operations: | | | | | | | | | | | | |
| Net investment income (loss) | | | 0.09 | | | | | | | | 0.05 | |
| Net realized and unrealized gain (loss) on investment transactions | | | 1.16 | | | | | | | | 1.12 | |
| Total from investment operations | | | 1.25 | | | | | | | | 1.17 | |
| Less Dividends and Distributions: | | | | | | | | | | | | |
| Dividends from net investment income | | | (0.07 | ) | | | | | | | (0.01 | ) |
| Distributions from net realized gains | | | (0.26 | ) | | | | | | | - | |
| Total dividends and distributions | | | (0.33 | ) | | | | | | | (0.01 | ) |
| Net asset value, end of period | | | $12.08 | | | | | | | | $11.16 | |
| Total Return(c): | | | 11.36% | | | | | | | | 11.72% | |
| |
| Ratios/Supplemental Data: | | | | | | | | | |
| Net assets, end of period (000) | | | $12,182 | | | | | | | | $8,426 | |
| Average net assets (000) | | | $10,251 | | | | | | | | $5,794 | |
| Ratios to average net assets(d): | | | | | | | | | | | | |
| Expenses after waivers and/or expense reimbursement | | | 0.85% | | | | | | | | 0.97% | (e) |
| Expenses before waivers and/or expense reimbursement | | | 1.80% | | | | | | | | 2.91% | (e) |
| Net investment income (loss) | | | 0.78% | | | | | | | | 0.62% | (e) |
| Portfolio turnover rate(f) | | | 113% | | | | | | | | 64% | (g) |
| (a) | Commencement of operations. |
| (b) | Calculated based on average shares outstanding during the period. |
| (c) | Total return is calculated assuming a purchase of a share on the first day and a sale on the last day of each period reported and includes reinvestment of dividends and distributions, if any. Total returns may reflect adjustments to conform to generally accepted accounting principles. Total returns for periods less than one full year are not annualized. |
| (d) | Does not include expenses of the underlying funds in which the Fund invests. |
| (f) | The Fund’s portfolio turnover rate is calculated in accordance with regulatory requirements, without regard to transactions involving short term investments and certain derivatives. If such transactions were included, the Fund’s portfolio turnover rate may be higher. |
See Notes to Financial Statements.
PGIM QMA US Broad Market Index Fund
Financial Highlights
| | | | | | | | | | | | |
| Class R6 Shares | | | | | | | | | |
| | | Year Ended
July 31, 2018 | | | | | | November 17, 2016(a)
through
July 31, 2017 | |
| Per Share Operating Performance(b): | | | | | | | | | | | | |
| Net Asset Value, Beginning of Period | | | $11.36 | | | | | | | | $10.00 | |
| Income (loss) from investment operations: | | | | | | | | | | | | |
| Net investment income (loss) | | | 0.20 | | | | | | | | 0.12 | |
| Net realized and unrealized gain (loss) on investment transactions | | | 1.61 | | | | | | | | 1.26 | |
| Total from investment operations | | | 1.81 | | | | | | | | 1.38 | |
| Less Dividends and Distributions: | | | | | | | | | | | | |
| Dividends from net investment income | | | (0.14 | ) | | | | | | | (0.02 | ) |
| Distributions from net realized gains | | | (0.04 | ) | | | | | | | - | |
| Total dividends and distributions | | | (0.18 | ) | | | | | | | (0.02 | ) |
| Net asset value, end of period | | | $12.99 | | | | | | | | $11.36 | |
| Total Return(c): | | | 16.05% | | | | | | | | 13.84% | |
| |
| Ratios/Supplemental Data: | | | | | | | | | |
| Net assets, end of period (000) | | | $37,020 | | | | | | | | $22,374 | |
| Average net assets (000) | | | $29,409 | | | | | | | | $12,357 | |
| Ratios to average net assets(d): | | | | | | | | | | | | |
| Expenses after waivers and/or expense reimbursement | | | 0.20% | | | | | | | | 0.26% | (e) |
| Expenses before waivers and/or expense reimbursement | | | 0.65% | | | | | | | | 1.86% | (e) |
| Net investment income (loss) | | | 1.64% | | | | | | | | 1.63% | (e) |
| Portfolio turnover rate(f) | | | 15% | | | | | | | | 5% | (g) |
| (a) | Commencement of operations. |
| (b) | Calculated based on average shares outstanding during the period. |
| (c) | Total return is calculated assuming a purchase of a share on the first day and a sale on the last day of each period reported and includes reinvestment of dividends and distributions, if any. Total returns may reflect adjustments to conform to generally accepted accounting principles. Total returns for periods less than one full year are not annualized. |
| (d) | Does not include expenses of the underlying funds in which the Fund invests. |
| (f) | The Fund’s portfolio turnover rate is calculated in accordance with regulatory requirements, without regard to transactions involving short term investments and certain derivatives. If such transactions were included, the Fund’s portfolio turnover rate may be higher. |
See Notes to Financial Statements.
| | | | |
| PGIM Day One Underlying Funds | | | 177 | |
Report of Independent Registered Public Accounting Firm
The Board of Trustees and Shareholders
Prudential Investment Portfolios 2:
Opinion on the Financial Statements
We have audited the accompanying statement of assets and liabilities or consolidated statement of assets and liabilities of each of the funds listed in the Appendix (the Funds), each a series of Prudential Investment Portfolios 2, including the schedule of investments or consolidated schedule of investments, as of July 31, 2018, the related statement of operations or consolidated statement of operations for the year then ended, the statements of changes in net assets or consolidated statements of changes in net assets for the year and the period listed in the Appendix, and the related notes (collectively, the financial statements or consolidated financial statements) and the financial highlights or consolidated financial highlights for the year or period indicated therein. In our opinion, the financial statements and consolidated financial statements and financial highlights and consolidated financial highlights present fairly, in all material respects, the financial position of each of the Funds as of July 31, 2018, the results of its operations for the year then ended, the changes in its net assets for the year and the period listed in the Appendix, and the financial highlights for the year or period indicated therein, in conformity with U.S. generally accepted accounting principles.
Basis for Opinion
These financial statements and consolidated financial statements and financial highlights and consolidated financial highlights are the responsibility of the Funds’ management. Our responsibility is to express an opinion on these financial statements and consolidated financial statements and financial highlights and consolidated financial highlights based on our audits. We are a public accounting firm registered with the Public Company Accounting Oversight Board (United States) (“PCAOB”) and are required to be independent with respect to the Funds in accordance with the U.S. federal securities laws and the applicable rules and regulations of the Securities and Exchange Commission and the PCAOB.
We conducted our audits in accordance with the standards of the PCAOB. Those standards require that we plan and perform the audit to obtain reasonable assurance about whether the financial statements and financial highlights are free of material misstatement, whether due to error or fraud. Our audits included performing procedures to assess the risks of material misstatement of the financial statements and financial highlights, whether due to error or fraud, and performing procedures that respond to those risks. Such procedures included examining, on a test basis, evidence regarding the amounts and disclosures in the financial statements and financial highlights. Such procedures also included confirmation of securities owned as of July 31, 2018, by correspondence with the custodians, transfer agents and brokers or by other appropriate auditing procedures when replies from brokers were not received. Our audits also included evaluating the accounting principles used and significant estimates made by management, as well as evaluating the overall presentation of the financial statements and financial highlights. We believe that our audits provide a reasonable basis for our opinion.

We have served as the auditor of one or more PGIM and/or Prudential Retail investment companies since 2003.
New York, New York
September 24, 2018
Appendix A
PGIM Jennison Small-Cap Core Equity Fund (formerly Prudential Jennison Small-Cap Core Equity Fund)
Statement of changes in net assets for the year ended July 31, 2018 and the period from November 15, 2016 (inception) through July 31, 2017
PGIM Core Conservative Bond Fund (formerly Prudential Core Conservative Bond Fund)
Statement of changes in net assets for the year ended July 31, 2018 and the period from November 15, 2016 (inception) through July 31, 2017
PGIM TIPS Fund (formerly Prudential TIPS Fund)
Statement of changes in net assets for the year ended July 31, 2018 and the period from November 15, 2016 (inception) through July 31, 2017
PGIM QMA Commodity Strategies Fund (formerly Prudential Commodity Strategies Fund)
Consolidated statement of changes in net assets for the year ended July 31, 2018 and the period from November 15, 2016 (inception) through July 31, 2017
PGIM QMA Mid-Cap Core Equity Fund (formerly Prudential QMA Mid-Cap Core Equity Fund
Statement of changes in net assets for the year ended July 31, 2018 and the period from November 17, 2016 (inception) through July 31, 2017
PGIM QMA US Broad Market Index Fund (formerly Prudential QMA US Broad Market Index Fund)
Statement of changes in net assets for the year ended July 31, 2018 and the period from November 17, 2016 (inception) through July 31, 2017
| | | | |
| PGIM Day One Underlying Funds | | | 179 | |
Tax Information (unaudited)
We are advising you that during the fiscal year ended July 31, 2018, QMA US Broad Market Index reported the maximum amount allowed per share but not less than $0.02 per share for Class R6 shares as a capital gain distribution in accordance with Section 852(b)(3)(C) of the Internal Revenue Code.
For the year ended July 31, 2018, the following Funds reports the maximum amount allowable but not less than the following percentages of ordinary income dividends paid as: 1) qualified dividend income in accordance with Section 854 of the Internal Revenue Code (QDI); 2) eligible for the corporate dividends received deduction in accordance with Section 854 of the Internal Revenue Code (DRD); and 3) interest-related dividends in accordance with Section 871(k)(1) and 881(e)(1) of the Internal Revenue Code (IRD):
| | | | | | | | | | | | |
| | | QDI | | | DRD | | | IRD | |
Jennison Small-Cap Core Equity | | | 19.51% | | | | 20.82% | | | | — | |
Core Conservative Bond | | | — | | | | — | | | | 94.24% | |
TIPS | | | — | | | | — | | | | 100.00% | |
QMA US Broad Market Index | | | 79.89% | | | | 77.53% | | | | — | |
QMA Mid-Cap Core Equity | | | 25.71% | | | | 25.79% | | | | — | |
In January 2019, you will be advised on IRS Form 1099-DIV or substitute 1099-DIV as to the federal tax status of the distributions received by you in calendar year 2018.
We are required by Massachusetts, Missouri and Oregon to inform you that dividends which have been derived from interest on federal obligations are not taxable to shareholders providing the Mutual Fund meets certain requirements mandated by the respective state’s taxing authorities. We are pleased to report that the dividends paid by the following funds qualify for such deduction.
| | | | |
Core Conservative Bond | | | 30.93% | |
TIPS | | | 99.70% | |
For more detailed information regarding your state and local taxes, you should contact your tax adviser or the state/local taxing authorities.
INFORMATION ABOUT BOARD MEMBERS AND OFFICERS
(Unaudited)
Information about Board Members and Officers of the Fund is set forth below. Board Members who are not deemed to be “interested persons” of the Fund, as defined in the 1940 Act, are referred to as “Independent Board Members.” Board Members who are deemed to be “interested persons” of the Fund are referred to as “Interested Board Members.” The Board Members are responsible for the overall supervision of the operations of the Fund and perform the various duties imposed on the directors of investment companies by the 1940 Act. The Board in turn elects the Officers, who are responsible for administering the day-to-day operations of the Fund.
| | | | | | |
| | | |
Independent Board Members | | | | |
| | | | |
Name, Address, Age Position(s) Portfolios Overseen | | Principal Occupation(s) During Past Five Years | | Other Directorships Held During Past Five Years | | Length of Board Service |
| | | | |
Ellen S. Alberding (60) Board Member Portfolios Overseen: 91 | | President and Board Member, The Joyce Foundation (charitable foundation) (since 2002); Vice Chair, City Colleges of Chicago (community college system) (2011-2015); Trustee, National Park Foundation (charitable foundation for national park system) (2009-2018); Trustee, Economic Club of Chicago (since 2009); Trustee, Loyola University (since 2018). | | None. | | Since September 2013 |
| | | | |
Kevin J. Bannon (66) Board Member Portfolios Overseen: 91 | | Retired; Managing Director (April 2008-May 2015) and Chief Investment Officer (October 2008-November 2013) of Highmount Capital LLC (registered investment adviser); formerly Executive Vice President and Chief Investment Officer (April 1993-August 2007) of Bank of New York Company; President (May 2003-May 2007) of BNY Hamilton Family of Mutual Funds. | | Director of Urstadt Biddle Properties (equity real estate investment trust) (since September 2008). | | Since July 2008 |
| | | | |
Linda W. Bynoe (66) Board Member Portfolios Overseen: 91 | | President and Chief Executive Officer (since March 1995) and formerly Chief Operating Officer (December 1989-February 1995) of Telemat Ltd. (management consulting); formerly Vice President (January 1985-June 1989) at Morgan Stanley & Co. (broker-dealer). | | Director of Anixter International, Inc. (communication products distributor) (since January 2006); Director of Northern Trust Corporation (financial services) (since April 2006); Trustee of Equity Residential (residential real estate) (since December 2009). | | Since March 2005 |
PGIM Day One Underlying Funds
| | | | | | |
| | | |
Independent Board Members | | | | |
| | | | |
Name, Address, Age Position(s) Portfolios Overseen | | Principal Occupation(s) During Past Five Years | | Other Directorships Held During Past Five Years | | Length of Board Service |
| | | | |
Barry H. Evans (57) Board Member Portfolios Overseen: 90 | | Retired; formerly President (2005 – 2016), Global Chief Operating Officer (2014– 2016), Chief Investment Officer – Global Head of Fixed Income (1998-2014), and various portfolio manager roles (1986-2006), Manulife Asset Management U.S. | | Director, Manulife Trust Company (since 2011); formerly Director, Manulife Asset Management Limited (2015-2017); formerly Chairman of the Board of Directors of Manulife Asset Management U.S. (2005-2016); formerly Chairman of the Board, Declaration Investment Management and Research (2008-2016). | | Since September 2017 |
| | | | |
Keith F. Hartstein (61) Board Member & Independent Chair Portfolios Overseen: 91 | | Retired; Member (since November 2014) of the Governing Council of the Independent Directors Council (organization of independent mutual fund directors); formerly President and Chief Executive Officer (2005-2012), Senior Vice President (2004-2005), Senior Vice President of Sales and Marketing (1997-2004), and various executive management positions (1990-1997), John Hancock Funds, LLC (asset management); Chairman, Investment Company Institute’s Sales Force Marketing Committee (2003-2008). | | None. | | Since September 2013 |
Visit our website at pgiminvestments.com
| | | | | | |
| | | |
Independent Board Members | | | | |
| | | | |
Name, Address, Age Position(s) Portfolios Overseen | | Principal Occupation(s) During Past Five Years | | Other Directorships Held During Past Five Years | | Length of Board Service |
| | | | |
Laurie Simon Hodrick (56) Board Member Portfolios Overseen: 90 | | A. Barton Hepburn Professor Emerita of Economics in the Faculty of Business, Columbia Business School (since 2018); Visiting Professor of Law, Stanford Law School (since 2015); Visiting Fellow at the Hoover Institution, Stanford University (since 2015); Sole Member, ReidCourt LLC (since 2008) (a consulting firm); formerly A. Barton Hepburn Professor of Economics in the Faculty of Business, Columbia Business School (1996-2017); formerly Managing Director, Global Head of Alternative Investment Strategies, Deutsche Bank (2006-2008); Independent Director Kabbage, Inc. (since July 2018) (financial services). | | Independent Director, Corporate Capital Trust (since April 2017) (a business development company); Independent Director, Kabbage, Inc. (since July 2018) (financial services). | | Since September 2017 |
| | | | |
Michael S. Hyland, CFA (72) Board Member Portfolios Overseen: 91 | | Retired (since February 2005); formerly Senior Managing Director (July 2001-February 2005) of Bear Stearns & Co, Inc.; Global Partner, INVESCO (1999-2001); Managing Director and President of Salomon Brothers Asset Management (1989-1999). | | None. | | Since July 2008 |
| | | | |
Richard A. Redeker (75) Board Member Portfolios Overseen: 91 | | Retired Mutual Fund Senior Executive (50 years); Management Consultant; Director, Mutual Fund Directors Forum (since 2014); Independent Directors Council (organization of independent mutual fund directors)-Executive Committee, Chair of Policy Steering Committee, Governing Council. | | None. | | Since October 1993 |
PGIM Day One Underlying Funds
| | | | | | |
| | | |
Independent Board Members | | | | |
| | | | |
Name, Address, Age Position(s) Portfolios Overseen | | Principal Occupation(s) During Past Five Years | | Other Directorships Held During Past Five Years | | Length of Board Service |
| | | | |
Brian K. Reid (56)# Board Member Portfolios Overseen: 90 | | Retired; formerly Chief Economist for the Investment Company Institute (ICI) (2005-2017); formerly Senior Economist and Director of Industry and Financial Analysis at the ICI (1998-2004); formerly Senior Economist, Industry and Financial Analysis at the ICI (1996-1998); formerly Staff Economist at the Federal Reserve Board (1989-1996); Director, ICI Mutual Insurance Company (2012-2017). | | None. | | Since March 2018 |
# Mr. Reid joined the Board effective as of March 1, 2018.
| | | | | | |
| | | |
Interested Board Members | | | | |
| | | | |
Name, Address, Age Position(s) Portfolios Overseen | | Principal Occupation(s) During Past Five Years | | Other Directorships Held During Past Five Years | | Length of Board Service |
| | | | |
Stuart S. Parker (55) Board Member & President Portfolios Overseen: 91 | | President of PGIM Investments LLC (formerly known as Prudential Investments LLC) (since January 2012); Executive Vice President of Prudential Investment Management Services LLC (since December 2012); formerly Executive Vice President of Jennison Associates LLC and Head of Retail Distribution of PGIM Investments LLC (June 2005-December 2011). | | None. | | Since January 2012 |
Visit our website at pgiminvestments.com
| | | | | | |
| | | |
Interested Board Members | | | | |
| | | | |
Name, Address, Age Position(s) Portfolios Overseen | | Principal Occupation(s) During Past Five Years | | Other Directorships Held During Past Five Years | | Length of Board Service |
| | | | |
Scott E. Benjamin (45) Board Member & Vice President Portfolios Overseen:91 | | Executive Vice President (since June 2009) of PGIM Investments LLC; Executive Vice President (June 2009-June 2012) and Vice President (since June 2012) of Prudential Investment Management Services LLC; Executive Vice President (since September 2009) of AST Investment Services, Inc.; Senior Vice President of Product Development and Marketing, PGIM Investments (since February 2006); formerly Vice President of Product Development and Product Management, PGIM Investments LLC (2003-2006). | | None. | | Since March 2010 |
| | | | |
Grace C. Torres* (59) Board Member Portfolios Overseen: 90 | | Retired; formerly Treasurer and Principal Financial and Accounting Officer of the PGIM Funds, Target Funds, Advanced Series Trust, Prudential Variable Contract Accounts and The Prudential Series Fund (1998-June 2014); Assistant Treasurer (March 1999-June 2014) and Senior Vice President (September 1999-June 2014) of PGIM Investments LLC; Assistant Treasurer (May 2003-June 2014) and Vice President (June 2005-June 2014) of AST Investment Services, Inc.; Senior Vice President and Assistant Treasurer (May 2003-June 2014) of Prudential Annuities Advisory Services, Inc. | | Director (July 2015-January 2018) of Sun Bancorp, Inc. N.A. and Sun National Bank; Director (since January 2018) of OceanFirst Financial Corp. and OceanFirst Bank. | | Since November 2014 |
* Note: Prior to her retirement in 2014, Ms. Torres was employed by PGIM Investments LLC. Due to her prior employment, she is considered to be an “interested person” under the 1940 Act. Ms. Torres is a Non-Management Interested Board Member.
PGIM Day One Underlying Funds
| | | | |
| |
Fund Officers(a) |
| | | |
| Name, Address and Age Position with Fund | | Principal Occupation(s) During Past Five Years | | Length of Service as Fund Officer |
| | | |
Raymond A. O’Hara (63) Chief Legal Officer | | Vice President and Corporate Counsel (since July 2010) of Prudential Insurance Company of America (Prudential); Vice President (March 2011-Present) of Pruco Life Insurance Company and Pruco Life Insurance Company of New Jersey; Vice President and Corporate Counsel (March 2011-Present) of Prudential Annuities Life Assurance Corporation; Chief Legal Officer of PGIM Investments LLC (since June 2012); Chief Legal Officer of Prudential Mutual Fund Services LLC (since June 2012) and Corporate Counsel of AST Investment Services, Inc. (since June 2012); formerly Assistant Vice President and Corporate Counsel (September 2008-July 2010) of The Hartford Financial Services Group, Inc.; formerly Associate (September 1980-December 1987) and Partner (January 1988–August 2008) of Blazzard & Hasenauer, P.C. (formerly, Blazzard, Grodd & Hasenauer, P.C.). | | Since June 2012 |
| | | |
Chad A. Earnst (43) Chief Compliance Officer | | Chief Compliance Officer (September 2014-Present) of PGIM Investments LLC; Chief Compliance Officer (September 2014-Present) of the PGIM Funds, Target Funds, Advanced Series Trust, The Prudential Series Fund, Prudential’s Gibraltar Fund, Inc., PGIM Global Short Duration High Yield Income Fund, Inc., PGIM Short Duration High Yield Fund, Inc. and PGIM Jennison MLP Income Fund, Inc.; formerly Assistant Director (March 2010-August 2014) of the Asset Management Unit, Division of Enforcement, US Securities & Exchange Commission; Assistant Regional Director (January 2010-August 2014), Branch Chief (June 2006–December 2009) and Senior Counsel (April 2003-May 2006) of the Miami Regional Office, Division of Enforcement, US Securities & Exchange Commission. | | Since September 2014 |
| | | |
Dino Capasso (44) Deputy Chief Compliance Officer | | Vice President and Deputy Chief Compliance Officer (June 2017-Present) of PGIM Investments LLC; formerly, Senior Vice President and Senior Counsel (January 2016-June 2017), and Vice President and Counsel (February 2012-December 2015) of Pacific Investment Management Company LLC. | | Since March 2018 |
| | | |
Deborah A. Docs (60) Secretary | | Vice President and Corporate Counsel (since January 2001) of Prudential; Vice President (since December 1996) and Assistant Secretary (since March 1999) of PGIM Investments LLC; formerly Vice President and Assistant Secretary (May 2003-June 2005) of AST Investment Services, Inc. | | Since May 2004 |
| | | |
Jonathan D. Shain (60) Assistant Secretary | | Vice President and Corporate Counsel (since August 1998) of Prudential; Vice President and Assistant Secretary (since May 2001) of PGIM Investments LLC; Vice President and Assistant Secretary (since February 2001) of Prudential Mutual Fund Services LLC; formerly Vice President and Assistant Secretary (May 2003-June 2005) of AST Investment Services, Inc. | | Since May 2005 |
Visit our website at pgiminvestments.com
| | | | |
| |
Fund Officers(a) |
| | | |
Name, Address and Age Position with Fund | | Principal Occupation(s) During Past Five Years | | Length of Service as Fund Officer |
| | | |
Claudia DiGiacomo (43) Assistant Secretary | | Vice President and Corporate Counsel (since January 2005) of Prudential; Vice President and Assistant Secretary of PGIM Investments LLC (since December 2005); formerly Associate at Sidley Austin Brown & Wood LLP (1999-2004). | | Since December 2005 |
| | | |
Andrew R. French (55) Assistant Secretary | | Vice President and Corporate Counsel (since February 2010) of Prudential; formerly Director and Corporate Counsel (2006-2010) of Prudential; Vice President and Assistant Secretary (since January 2007) of PGIM Investments LLC; Vice President and Assistant Secretary (since January 2007) of Prudential Mutual Fund Services LLC. | | Since October 2006 |
| | | |
Charles H. Smith (45) Anti-Money Laundering Compliance Officer | | Vice President, Corporate Compliance, Anti-Money Laundering Unit (since January 2015) of Prudential; committee member of the American Council of Life Insurers Anti-Money Laundering and Critical Infrastructure Committee (since January 2016); formerly Global Head of Economic Sanctions Compliance at AIG Property Casualty (February 2007 – December 2014); Assistant Attorney General at the New York State Attorney General’s Office, Division of Public Advocacy. (August 1998 —January 2007). | | Since January 2017 |
| | | |
Brian D. Nee (52) Treasurer and Principal Financial and Accounting Officer | | Vice President and Head of Finance of PGIM Investments LLC (since August 2015) and PGIM Global Partners (since February 2017); formerly, Vice President, Treasurer’s Department of Prudential (September 2007-August 2015). | | Since July 2018 |
| | | |
Peter Parrella (60) Assistant Treasurer | | Vice President (since 2007) and Director (2004-2007) within Prudential Mutual Fund Administration; formerly Tax Manager at SSB Citi Fund Management LLC (1997-2004). | | Since June 2007 |
| | | |
Lana Lomuti (51) Assistant Treasurer | | Vice President (since 2007) and Director (2005-2007), within Prudential Mutual Fund Administration; formerly Assistant Treasurer (December 2007-February 2014) of The Greater China Fund, Inc. | | Since April 2014 |
| | | |
Linda McMullin (57) Assistant Treasurer | | Vice President (since 2011) and Director (2008-2011) within Prudential Mutual Fund Administration. | | Since April 2014 |
| | | |
Kelly A. Coyne (50) Assistant Treasurer | | Director, Investment Operations of Prudential Mutual Fund Services LLC (since 2010). | | Since March 2015 |
(a) Excludes Mr. Parker and Mr. Benjamin, interested Board Members who also serve as President and Vice President, respectively.
Explanatory Notes to Tables:
| ∎ | | Board Members are deemed to be “Interested,” as defined in the 1940 Act, by reason of their affiliation with PGIM Investments LLC and/or an affiliate of PGIM Investments LLC. |
| ∎ | | Unless otherwise noted, the address of all Board Members and Officers is c/o PGIM Investments LLC, 655 Broad Street, Newark, New Jersey 07102-4410. |
| ∎ | | There is no set term of office for Board Members or Officers. The Board Members have adopted a retirement policy, which calls for the retirement of Board Members on December 31 of the year in which they reach the age of 75. |
| ∎ | | “Other Directorships Held” includes only directorships of companies required to register or file reports with the SEC under the 1934 Act (that is, “public companies”) or other investment companies registered under the 1940 Act. |
PGIM Day One Underlying Funds
| ∎ | | “Portfolios Overseen” includes all investment companies managed by PGIM Investments LLC. The investment companies for which PGIM Investments LLC serves as manager include the PGIM Funds, The Prudential Variable Contract Accounts, PGIM ETF Trust, PGIM Short Duration High Yield Fund, Inc., PGIM Global Short Duration High Yield Fund, Inc., The Prudential Series Fund, Prudential’s Gibraltar Fund, Inc. and the Advanced Series Trust. |
Visit our website at pgiminvestments.com
Approval of Advisory Agreements
The Funds’ Board of Trustees
The Board of Trustees (the “Board”) of the PGIM Day One Underlying Funds (each, a “Fund, and collectively, the “Funds”)1 consists of twelve individuals, nine of whom are not “interested persons” of the Funds, as defined in the Investment Company Act of 1940, as amended (the “1940 Act”) (the “Independent Trustees”). The Board is responsible for the oversight of each Fund and its operations, and performs the various duties imposed on the directors of investment companies by the 1940 Act. The Independent Trustees have retained independent legal counsel to assist them in connection with their duties. The Chair of the Board is an Independent Trustee. The Board has established four standing committees: the Audit Committee, the Nominating and Governance Committee, and two Investment Committees. Each committee is chaired by, and composed of, Independent Trustees.
Annual Approval of the Funds’ Advisory Agreements
As required under the 1940 Act, the Board determines annually whether to renew each Fund’s management agreement with PGIM Investments LLC (“PGIM Investments”) and each Fund’s subadvisory agreement with Quantitative Management Associates LLC (“QMA”), Jennison Associates LLC (“Jennison”) and PGIM, Inc., on behalf of its PGIM Fixed Income unit, as applicable. In considering the renewal of the agreements, the Board, including all of the Independent Trustees, met on June 7, 2018 and on June 19-21, 2018 and approved the renewal of the agreements through July 31, 2019, after concluding that the renewal of the agreements was in the best interests of each Fund and its shareholders.
In advance of the meetings, the Board requested and received materials relating to the agreements, and had the opportunity to ask questions and request further information in connection with its consideration. Among other things, the Board considered comparative fee information from PGIM Investments, QMA and Jennison. Also, the Board considered comparisons with other mutual funds in relevant Peer Universes and Peer Groups, as is further discussed below.
In approving the agreements, the Board, including the Independent Trustees advised by independent legal counsel, considered the factors it deemed relevant, including the nature, quality and extent of services provided, the performance of each Fund, the profitability of PGIM Investments and its affiliates, expenses and fees, and the potential for economies of scale that may be shared with each Fund and its shareholders as each Fund’s assets grow. In their deliberations, the Trustees did not identify any single factor which alone was responsible for the Board’s decision to approve the agreements with respect to each Fund.
| 1 | Each of the PGIM Day One Underlying Funds is a series of Prudential Investment Portfolios 2. The PGIM Day One Underlying Funds discussed herein are: PGIM Jennison Small-Cap Core Equity Fund, PGIM Core Conservative Bond Fund, PGIM TIPS Fund, PGIM QMA Commodity Strategies Fund, PGIM QMA US Broad Market Index Fund and PGIM QMA Mid-Cap Core Equity Fund. |
| | |
| PGIM Day One Underlying Funds |
Approval of Advisory Agreements (continued)
In connection with its deliberations, the Board considered information provided by PGIM Investments throughout the year at regular Board meetings, presentations from portfolio managers and other information, as well as information furnished at or in advance of the meetings on June 7, 2018 and on June 19-21, 2018.
The Trustees determined that the overall arrangements between each Fund and PGIM Investments, which serves as each Fund’s investment manager pursuant to a management agreement, and between PGIM Investments and each of QMA, Jennison and PGIM Fixed Income as applicable, each of which serves as each Fund’s subadviser pursuant to the terms of subadvisory agreements with PGIM Investments, are in the best interests of each Fund and its shareholders in light of the services performed, fees charged and such other matters as the Trustees considered relevant in the exercise of their business judgment.
The material factors and conclusions that formed the basis for the Trustees’ reaching their determinations to approve the continuance of the agreements are separately discussed below.
Nature, Quality and Extent of Services
The Board received and considered information regarding the nature, quality and extent of services provided to each Fund by PGIM Investments, QMA, Jennison and PGIM Fixed Income. The Board considered the services provided by PGIM Investments, including but not limited to the oversight of the subadviser for each Fund, as well as the provision of fund recordkeeping, compliance, and other services to each Fund. With respect to PGIM Investments’ oversight of the subadvisers, the Board noted that PGIM Investments’ Strategic Investment Research Group (“SIRG”), which is a business unit of PGIM Investments, is responsible for monitoring and reporting to PGIM Investments’ senior management on the performance and operations of the subadvisers. The Board also considered that PGIM Investments pays the salaries of all of the officers and interested Trustees of the Funds who are part of Fund management. The Board also considered the investment subadvisory services provided by QMA, Jennison, and PGIM Fixed Income, including investment research and security selection, as well as adherence to each Fund’s investment restrictions and compliance with applicable Fund policies and procedures. The Board considered PGIM Investments’ evaluation of the subadvisers, as well as PGIM Investments’ recommendation, based on its review of the subadvisers, to renew the subadvisory agreements.
The Board considered the qualifications, backgrounds and responsibilities of PGIM Investments’ senior management responsible for the oversight of each Fund, QMA, Jennison, and PGIM Fixed Income and also considered the qualifications, backgrounds and responsibilities of the QMA, Jennison and PGIM Fixed Income portfolio managers who are responsible for the day-to-day management of each Fund’s portfolio. The Board was
| | |
| Visit our website at pgiminvestments.com | | |
provided with information pertaining to PGIM Investments’, QMA’s, Jennison’s and PGIM Fixed Income’s organizational structure, senior management, investment operations, and other relevant information pertaining to PGIM Investments, Jennison, QMA and PGIM Fixed Income. The Board also noted that it received favorable compliance reports from the Funds’ Chief Compliance Officer (“CCO”) as to each of PGIM Investments, QMA, Jennison and PGIM Fixed Income. The Board noted that QMA, Jennison and PGIM Fixed Income are affiliated with PGIM Investments.
The Board concluded that it was satisfied with the nature, extent and quality of the investment management services provided by PGIM Investments and the subadvisory services provided to each Fund by QMA, Jennison, and PGIM Fixed Income and that there was a reasonable basis on which to conclude that each Fund benefits from the services provided by PGIM Investments, QMA and Jennison under the management and subadvisory agreements.
Costs of Services and Profits Realized by PGIM Investments
The Board was provided with information on the profitability of PGIM Investments and its affiliates in serving as each Fund’s investment manager. The Board discussed with PGIM Investments the methodology utilized in assembling the information regarding profitability and considered its reasonableness. The Board recognized that it is difficult to make comparisons of profitability from fund management contracts because comparative information is not generally publicly available and is affected by numerous factors, including the structure of the particular adviser, the types of funds it manages, its business mix, numerous assumptions regarding allocations and the adviser’s capital structure and cost of capital. However, the Board considered that the cost of services provided by PGIM Investments during the year ended December 31, 2017 exceeded the management fees paid by each Fund, resulting in an operating loss to PGIM Investments. Taking these factors into account, the Board concluded that the profitability of PGIM Investments and its affiliates in relation to the services rendered was not unreasonable.
Economies of Scale
The Board received and discussed information concerning economies of scale that PGIM Investments may realize as each Fund’s assets grow beyond current levels. During the course of time, the Board has considered information regarding the launch date of each Fund, the management fees of each Fund compared to those of similarly managed funds and PGIM Investments’ investment in each Fund over time. The Board noted that, while the management fee schedule for each Fund does not have breakpoints in its management fees, economies of scale can be shared with each Fund in other ways, including low management fees from inception, additional technological and personnel investments to enhance shareholder services, and maintaining existing expense structures in the face of a
| | |
| PGIM Day One Underlying Funds |
Approval of Advisory Agreements (continued)
rising cost environment. The Board also considered PGIM Investments’ assertion that it continually evaluates the management fee schedule of each Fund and the potential to share economies of scale through breakpoints or fee waivers as asset levels increase.
The Board recognized the inherent limitations of any analysis of economies of scale, stemming largely from the Board’s understanding that most of PGIM Investments’ costs are not specific to individual funds, but rather are incurred across a variety of products and services.
Other Benefits to PGIM Investments, QMA, Jennison and PGIM Fixed Income
The Board considered potential ancillary benefits that might be received by PGIM Investments, QMA, Jennison and their affiliates as a result of their relationship with each Fund. The Board concluded that potential benefits to be derived by PGIM Investments included transfer agency fees received by each Fund’s transfer agent (which is affiliated with PGIM Investments), and benefits to its reputation as well as other intangible benefits resulting from PGIM Investments’ association with the Funds. The Board concluded that the potential benefits to be derived by QMA and Jennison included their ability to use soft dollar credits, as well as the potential benefits consistent with those generally resulting from an increase in assets under management, specifically, potential access to additional research resources and benefits to their reputations. The Board concluded that the benefits derived by PGIM Investments, QMA and Jennison were consistent with the types of benefits generally derived by investment managers and subadvisers to mutual funds.
Performance of the Funds / Fees and Expenses
The Board considered certain additional specific factors and made related conclusions relating to the historical performance of each Fund for the one-year period ended December 31, 2017. The Board considered that PGIM QMA US Broad Market Index Fund and PGIM QMA Mid-Cap Core Equity Fund each commenced operations on November 17, 2016 and that all of the other Funds commenced operations on November 15, 2016 and that longer-term performance was not yet available.
The Board also considered each Fund’s actual management fee, as well as each Fund’s net total expense ratio, for the fiscal period ended July 31, 2017. The Board considered the management fee for each Fund as compared to the management fee charged by PGIM Investments to other funds and the fee charged by other advisers to comparable mutual funds in a Peer Group. The actual management fee represents the fee rate actually paid by Fund shareholders and includes any fee waivers or reimbursements. The net total expense ratio for each Fund represents the actual expense ratio incurred by Fund shareholders.
| | |
| Visit our website at pgiminvestments.com | | |
The mutual funds included in the Peer Universe, which was used to consider performance, and the Peer Group, which was used to consider expenses and fees, for each Fund were objectively determined by Broadridge, an independent provider of mutual fund data. In certain circumstances, PGIM Investments also may have provided supplemental Peer Universe or Peer Group information, for reasons addressed with the Board. The comparisons placed each Fund in various quartiles, with the first quartile being the best 25% of the mutual funds (for performance, the best performing mutual funds and, for expenses, the lowest cost mutual funds).
The section below summarizes key factors considered by the Board and the Board’s conclusions regarding each Fund’s performance, fees and overall expenses. For each Fund, the table sets forth gross performance comparisons (which do not reflect the impact on performance of any subsidies, expense caps or waivers that may be applicable) with the Peer Universe, actual management fees with the Peer Group (which reflect the impact of fund expenses, or any subsidies or fee waivers), and net total expenses with the Peer Group, each of which were key factors considered by the Board.
PGIM QMA US Broad Market Index Fund
| | | | | | | | |
| Gross Performance | | 1 Year | | 3 Years | | 5 Years | | 10 Years |
| | | 3rd Quartile | | N/A | | N/A | | N/A |
| Actual Management Fees: 1st Quartile |
| Net Total Expenses: 2nd Quartile |
| | • | | The Board noted that the Fund underperformed its benchmark index over the one-year period. |
| | • | | The Board noted that the Fund does not yet have a three-year performance record and that, therefore, the subadviser should have more time to develop that record. |
| | • | | The Board noted that effective as of December 1, 2016 the Manager contractually agreed to cap Fund expenses (exclusive of certain fees and expenses) at 0.20% for Class R6 shares through November 30, 2018, and that if the cap had been in effect for the full fiscal period, the Fund’s net total expenses would have ranked in the first quartile. |
| | • | | The Board concluded that in light of the above, it would be in the best interests of the Fund and its shareholders to continue to allow the Fund to create a performance record, and to renew the agreements. |
| | • | | The Board concluded that the management fees (including subadvisory fees) and total expenses were reasonable in light of the services provided. |
| | |
| PGIM Day One Underlying Funds |
Approval of Advisory Agreements (continued)
PGIM QMA Mid-Cap Core Equity Fund
| | | | | | | | |
| Gross Performance | | 1 Year | | 3 Years | | 5 Years | | 10 Years |
| | | 2nd Quartile | | N/A | | N/A | | N/A |
| Actual Management Fees: 1st Quartile |
| Net Total Expenses: 4th Quartile |
| | • | | The Board noted that the Fund outperformed its benchmark index over the one-year period. |
| | • | | The Board noted that the Fund does not yet have a three-year performance record and that, therefore, the subadviser should have more time to develop that record. |
| | • | | The Board noted that effective as of December 1, 2016 the Manager contractually agreed to cap Fund expenses (exclusive of certain fees and expenses) at 0.85% for Class R6 shares through November 30, 2018, and that if the cap had been in effect for the full fiscal period, the Fund’s net total expenses would have ranked in the second quartile. |
| | • | | The Board concluded that in light of the above, it would be in the best interests of the Fund and its shareholders to continue to allow the Fund to create a performance record, and to renew the agreements. |
| | • | | The Board concluded that the management fees (including subadvisory fees) and total expenses were reasonable in light of the services provided. |
PGIM Jennison Small-Cap Core Equity Fund
| | | | | | | | |
| Gross Performance | | 1 Year | | 3 Years | | 5 Years | | 10 Years |
| | | 1st Quartile | | N/A | | N/A | | N/A |
| Actual Management Fees: 1st Quartile |
| Net Total Expenses: 3rd Quartile |
| | • | | The Board noted that the Fund outperformed its benchmark index over the one-year period. |
| | • | | The Board noted that the Fund does not yet have a three-year performance record and that, therefore, the subadviser should have more time to develop that record. |
| | • | | The Board noted that effective as of December 1, 2016 the Manager contractually agreed to cap Fund expenses (exclusive of certain fees and expenses) at 0.95% for Class R6 shares through November 30, 2018, and that if the cap had been in effect for the full fiscal period, the Fund’s net total expenses would have ranked in the second quartile. |
| | • | | The Board concluded that in light of the above, it would be in the best interests of the Fund and its shareholders to continue to allow the Fund to create a performance record, and to renew the agreements. |
| | • | | The Board concluded that the management fees (including subadvisory fees) and total expenses were reasonable in light of the services provided. |
| | |
| Visit our website at pgiminvestments.com | | |
PGIM Core Conservative Bond Fund
| | | | | | | | |
| Gross Performance | | 1 Year | | 3 Years | | 5 Years | | 10 Years |
| | | 4th Quartile | | N/A | | N/A | | N/A |
| Actual Management Fees: 1st Quartile |
| Net Total Expenses: 3rd Quartile |
| | • | | The Board noted that the Fund outperformed its benchmark index over the one-year period. |
| | • | | The Board noted that the Fund does not yet have a three-year performance record and that, therefore, the subadviser should have more time to develop that record. |
| | • | | The Board noted that effective as of December 1, 2016 the Manager contractually agreed to cap Fund expenses (exclusive of certain fees and expenses) at 0.50% for Class R6 shares through November 30, 2018, and that if the cap had been in effect for the full fiscal period, the Fund’s net total expenses would have ranked in the second quartile. |
| | • | | The Board concluded that in light of the above, it would be in the best interests of the Fund and its shareholders to continue to allow the Fund to create a performance record, and to renew the agreements. |
| | • | | The Board concluded that the management fees (including subadvisory fees) and total expenses were reasonable in light of the services provided. |
PGIM TIPS Fund
| | | | | | | | |
| Gross Performance | | 1 Year | | 3 Years | | 5 Years | | 10 Years |
| | | 2nd Quartile | | N/A | | N/A | | N/A |
| Actual Management Fees: 1st Quartile |
| Net Total Expenses: 4th Quartile |
| | • | | The Board noted that the Fund outperformed its benchmark index over the one-year period. |
| | • | | The Board noted that the Fund does not yet have a three-year performance record and that, therefore, the subadviser should have more time to develop that record. |
| | • | | The Board noted that effective as of December 1, 2016 the Manager contractually agreed to cap Fund expenses (exclusive of certain fees and expenses) at 0.40% for Class R6 shares through November 30, 2018, and that if the cap had been in effect for the full fiscal period, the Fund’s net total expenses would have ranked in the second quartile. |
| | • | | The Board concluded that in light of the above, it would be in the best interests of the Fund and its shareholders to continue to allow the Fund to create a performance record, and to renew the agreements. |
| | • | | The Board concluded that the management fees (including subadvisory fees) and total expenses were reasonable in light of the services provided. |
| | |
| PGIM Day One Underlying Funds |
Approval of Advisory Agreements (continued)
PGIM QMA Commodity Strategies Fund
| | | | | | | | |
| Gross Performance | | 1 Year | | 3 Years | | 5 Years | | 10 Years |
| | | 4th Quartile | | N/A | | N/A | | N/A |
| Actual Management Fees: 1st Quartile |
| Net Total Expenses: 4th Quartile |
| | • | | The Board noted that the Fund outperformed its benchmark index over the one-year period. |
| | • | | The Board noted that the Fund does not yet have a three-year performance record and that, therefore, the subadviser should have more time to develop that record. |
| | • | | The Board noted that the Manager contractually agreed to cap Fund expenses (exclusive of certain fees and expenses) at 0.80% for Class R6 shares through November 30, 2020, and that if the cap had been in effect for the full fiscal period, the Fund’s net total expenses would have ranked in the second quartile. |
| | • | | The Board concluded that in light of the above, it would be in the best interests of the Fund and its shareholders to continue to allow the Fund to create a performance record, and to renew the agreements. |
| | • | | The Board concluded that the management fees (including subadvisory fees) and total expenses were reasonable in light of the services provided. |
* * *
After full consideration of these factors, the Board concluded that approval of the agreements was in the best interests of each Fund and its shareholders.
| | |
| Visit our website at pgiminvestments.com | | |
| | | | |
| ∎ MAIL | | ∎ TELEPHONE | | ∎ WEBSITE |
655 Broad Street Newark, NJ 07102 | | (800) 225-1852 | | www.pgiminvestments.com |
|
| PROXY VOTING |
| The Board of Trustees of the Funds have delegated to the Funds’ investment subadvisers the responsibility for voting any proxies and maintaining proxy recordkeeping with respect to the Funds. A description of these proxy voting policies and procedures is available without charge, upon request, by calling (800) 225-1852 or by visiting the Securities and Exchange Commission’s website at www.sec.gov. Information regarding how the Funds voted proxies relating to portfolio securities during the most recent 12-month period ended June 30 are available on the Funds’ website and on the Securities and Exchange Commission’s website at www.sec.gov. |
|
| TRUSTEES |
| Ellen S. Alberding • Kevin J. Bannon • Scott E. Benjamin • Linda W. Bynoe • Barry H. Evans • Keith F. Hartstein • Laurie Simon Hodrick • Michael S. Hyland • Stuart S. Parker • Richard A. Redeker • Brian K. Reid • Grace C. Torres |
|
| OFFICERS |
| Stuart S. Parker, President • Scott E. Benjamin, Vice President • Brian D. Nee, Treasurer and Principal Financial and Accounting Officer • Raymond A. O’Hara, Chief Legal Officer • Deborah A. Docs, Secretary • Dino Capasso, Vice President and Deputy Chief Compliance Officer • Chad A. Earnst, Chief Compliance Officer • Charles H. Smith, Anti-Money Laundering Compliance Officer • Jonathan D. Shain, Assistant Secretary • Claudia DiGiacomo, Assistant Secretary • Andrew R. French, Assistant Secretary • Peter Parrella, Assistant Treasurer • Lana Lomuti, Assistant Treasurer • Linda McMullin, Assistant Treasurer • Kelly A. Coyne, Assistant Treasurer |
| | | | |
| MANAGER | | PGIM Investments LLC | | 655 Broad Street
Newark, NJ 07102 |
|
| INVESTMENT SUBADVISERS | | Quantitative Management Associates LLC | | Gateway Center Two
100 Mulberry Street
Newark, NJ 07102 |
| | |
| | Jennison Associates LLC | | 466 Lexington Avenue
New York, NY 10017 |
| | |
| | PGIM Fixed Income | | 655 Broad Street
Newark, NJ 07102 |
|
| DISTRIBUTOR | | Prudential Investment
Management Services LLC | | 655 Broad Street
Newark, NJ 07102 |
|
| CUSTODIAN | | The Bank of New York Mellon | | 225 Liberty Street
New York, NY 10286 |
|
| TRANSFER AGENT | | Prudential Mutual Fund
Services LLC | | PO Box 9658
Providence, RI 02940 |
|
| INDEPENDENT REGISTERED PUBLIC ACCOUNTING FIRM | | KPMG LLP | | 345 Park Avenue New York, NY 10154 |
|
| FUND COUNSEL | | Willkie Farr & Gallagher LLP | | 787 Seventh Avenue
New York, NY 10019 |
|
|
| An investor should consider the investment objectives, risks, charges, and expenses of the Fund carefully before investing. The prospectus and summary prospectus contains this and other information about the Funds. An investor may obtain a prospectus and summary prospectus by visiting our website at www.pgiminvestments.com or by calling (800) 225-1852. The prospectus and summary prospectus should be read carefully before investing. |
|
| SHAREHOLDER COMMUNICATIONS WITH DIRECTORS |
| Shareholders can communicate directly with the Board of Trustees by writing to the Chair of the Board, PGIM Day One Underlying Funds c/o PGIM Investments, Attn: Board of Trustees, 655 Broad Street, Newark, NJ 07102. Shareholders can communicate directly with an individual Trustee by writing to the same address. Communications are not screened before being delivered to the addressee. |
|
| AVAILABILITY OF PORTFOLIO SCHEDULE |
| The Funds file their complete schedule of portfolio holdings with the Securities and Exchange Commission for the first and third quarters of each fiscal year on Form N-Q. The Funds’ Forms N-Q are available on the Commission’s website at www.sec.gov. The Funds’ Forms N-Q may also be reviewed and copied at the Commission’s Public Reference Room in Washington, D.C. Information on the operation and location of the Public Reference Room may be obtained by calling 1-800-SEC-0330. |
|
| The Fund’s Statement of Additional Information contains additional information about the Fund’s Trustees and is available without charge, upon request, by calling (800) 225-1852. |
Mutual Funds:
| | | | |
ARE NOT INSURED BY THE FDIC OR ANY
FEDERAL GOVERNMENT AGENCY | | MAY LOSE VALUE | | ARE NOT A DEPOSIT OF OR GUARANTEED
BY ANY BANK OR ANY BANK AFFILIATE |
| | | | | | | | | | |
| | | NASDAQ | | CUSIP | | | | NASDAQ | | CUSIP |
| PGIM JENNISON SMALL-CAP CORE EQUITY FUND | | PQJCX | | 74440E805 | | PGIM QMA COMMODITY STRATEGIES FUND | | PQCMX | | 74440E862 |
| PGIM CORE CONSERVATIVE BOND FUND | | PQCNX | | 74440E888 | | PGIM QMA US BROAD MARKET INDEX FUND | | PQBMX | | 74440E409 |
| PGIM TIPS FUND | | PQTSX | | 74440E870 | | PGIM QMA MID-CAP CORE EQUITY FUND | | PQCCX | | 74440E508 |
Item 2 – Code of Ethics — See Exhibit (a)
As of the end of the period covered by this report, the registrant has adopted a code of ethics (the “Section 406 Standards for Investment Companies – Ethical Standards for Principal Executive and Financial Officers”) that applies to the registrant’s Principal Executive Officer and Principal Financial Officer; the registrant’s Principal Financial Officer also serves as the Principal Accounting Officer.
The registrant hereby undertakes to provide any person, without charge, upon request, a copy of the code of ethics. To request a copy of the code of ethics, contact the registrant 800-225-1852, and ask for a copy of the Section 406 Standards for Investment Companies - Ethical Standards for Principal Executive and Financial Officers.
Item 3 – Audit Committee Financial Expert –
The registrant’s Board has determined that Mr. Kevin J. Bannon, member of the Board’s Audit Committee is an “audit committee financial expert,” and that he is “independent,” for purposes of this Item.
Item 4 – Principal Accountant Fees and Services –
(a) Audit Fees
For the fiscal year ended July 31, 2018 and period ended July 31, 2017 KPMG LLP (“KPMG”), the Registrant’s principal accountant, billed the Registrant $188,870 and $157,000, respectively, for professional services rendered for the audit of the Registrant’s annual financial statements or services that are normally provided in connection with statutory and regulatory filings.
(b) Audit-Related Fees
For the fiscal year ended July 31, 2018 and period ended July 31, 2017: none.
(c) Tax Fees
For the fiscal year ended July 31, 2018 and period ended July 31, 2017: none.
(d) All Other Fees
For the fiscal year ended July 31, 2018 and period ended July 31, 2017: none.
(e) (1) Audit Committee Pre-Approval Policies and Procedures
THE PRUDENTIAL MUTUAL FUNDS
AUDIT COMMITTEE POLICY
on
Pre-Approval of Services Provided by the Independent Accountants
The Audit Committee of each Prudential Mutual Fund is charged with the responsibility to monitor the independence of the Fund’s independent accountants. As part of this responsibility, the Audit Committee must pre-approve the independent accounting firm’s engagement to render audit and/or permissible non-audit services, as required by law. In evaluating a proposed engagement of the independent accountants, the Audit Committee will assess the effect that the engagement might reasonably be expected to have on the accountant’s independence. The Committee’s evaluation will be based on:
| | ● | | a review of the nature of the professional services expected to be provided, |
| | ● | | a review of the safeguards put into place by the accounting firm to safeguard independence, and |
| | ● | | periodic meetings with the accounting firm. |
Policy for Audit and Non-Audit Services Provided to the Funds
On an annual basis, the scope of audits for each Fund, audit fees and expenses, and audit-related and non-audit services (and fees proposed in respect thereof) proposed to be performed by the Fund’s independent accountants will be presented by the Treasurer and the independent accountants to the Audit Committee for review and, as appropriate, approval prior to the initiation of such services. Such presentation shall be accompanied by confirmation by both the Treasurer and the independent accountants that the proposed non-audit services will not adversely affect the independence of the independent accountants. Such proposed non-audit services shall be described in sufficient detail to enable the Audit Committee to assess the appropriateness of such services and fees, and the compatibility of the provision of such services with the auditor’s independence. The Committee shall receive periodic reports on the progress of the audit and other services which are approved by the Committee or by the Committee Chair pursuant to authority delegated in this Policy.
The categories of services enumerated under “Audit Services”, “Audit-related Services”, and “Tax Services” are intended to provide guidance to the Treasurer and the independent accountants as to those categories of services which the Committee believes are generally consistent with the independence of the independent accountants and which the Committee (or the Committee Chair) would expect upon the presentation of specific proposals to pre-approve. The enumerated categories are not intended as an exclusive list of audit, audit-related or tax services, which the Committee (or the Committee Chair) would consider for pre-approval.
Audit Services
The following categories of audit services are considered to be consistent with the role of the Fund’s independent accountants:
| | Ø | | Annual Fund financial statement audits |
| | Ø | | Seed audits (related to new product filings, as required) |
| | Ø | | SEC and regulatory filings and consents |
Audit-related Services
The following categories of audit-related services are considered to be consistent with the role of the Fund’s independent accountants:
| | Ø | | Accounting consultations |
| | Ø | | Fund merger support services |
| | Ø | | Agreed Upon Procedure Reports |
| | Ø | | Other Internal Control Reports |
Individual audit-related services that fall within one of these categories (except for fund merger support services) and are not presented to the Audit Committee as part of the annual pre-approval process are subject to an authorized pre-approval by the Audit Committee so long as the estimated fee for those services does not exceed $30,000. Any services provided under such pre-approval will be reported to the Audit Committee at its next regular meeting. Should the amount of such services exceed $30,000 any additional fees will be subject to pre-approval by the Committee Chair (or any other Committee member on whom this responsibility has been delegated). Fees related to fund merger support services are subject to a separate authorized pre-approval by the Audit Committee with fees determined on a per occurrence and merger complexity basis.
Tax Services
The following categories of tax services are considered to be consistent with the role of the Fund’s independent accountants:
| | Ø | | Tax compliance services related to the filing or amendment of the following: |
| | ◾ | Federal, state and local income tax compliance; and, |
| | ◾ | Sales and use tax compliance |
| | Ø | | Timely RIC qualification reviews |
| | Ø | | Tax distribution analysis and planning |
| | Ø | | Tax authority examination services |
| | Ø | | Tax appeals support services |
| | Ø | | Accounting methods studies |
| | Ø | | Fund merger support services |
| | Ø | | Tax consulting services and related projects |
Individual tax services that fall within one of these categories and are not presented to the Audit
Committee as part of the annual pre-approval process are subject to an authorized pre-approval by the Audit Committee so long as the estimated fee for those services does not exceed $30,000. Any services provided under such pre-approval will be reported to the Audit Committee at its next regular meeting. Should the amount of such services exceed $30,000 any additional fees will be subject to pre-approval by the Committee Chair (or any other Committee member on whom this responsibility has been delegated).
Other Non-Audit Services
Certain non-audit services that the independent accountants are legally permitted to render will be subject to pre-approval by the Committee or by one or more Committee members to whom the Committee has delegated this authority and who will report to the full Committee any pre-approval decisions made pursuant to this Policy. Non-audit services presented for pre-approval pursuant to this paragraph will be accompanied by a confirmation from both the Treasurer and the independent accountants that the proposed services will not adversely affect the independence of the independent accountants.
Proscribed Services
The Fund’s independent accountants will not render services in the following categories of non-audit services:
| | Ø | | Bookkeeping or other services related to the accounting records or financial statements of the Fund |
| | Ø | | Financial information systems design and implementation |
| | Ø | | Appraisal or valuation services, fairness opinions, or contribution-in-kind reports |
| | Ø | | Internal audit outsourcing services |
| | Ø | | Management functions or human resources |
| | Ø | | Broker or dealer, investment adviser, or investment banking services |
| | Ø | | Legal services and expert services unrelated to the audit |
| | Ø | | Any other service that the Public Company Accounting Oversight Board determines, by regulation, is impermissible. |
Pre-approval of Non-Audit Services Provided to Other Entities Within the Prudential Fund Complex
Certain non-audit services provided to PGIM Investments LLC or any of its affiliates that also provide ongoing services to the Prudential Mutual Funds will be subject to pre-approval by the Audit Committee. The only non-audit services provided to these entities that will require pre-approval are those related directly to the operations and financial reporting of the Funds. Individual projects that are not presented to the Audit Committee as part of the annual pre-approval process will be subject to pre-approval by the Committee Chair (or any other Committee member on whom this responsibility has been delegated) so long as the estimated fee for those services does not exceed $30,000. Services presented for pre-approval pursuant to this paragraph will be accompanied by a confirmation from both the Treasurer and the independent accountants
that the proposed services will not adversely affect the independence of the independent accountants.
Although the Audit Committee will not pre-approve all services provided to PGIM Investments LLC and its affiliates, the Committee will receive an annual report from the Fund’s independent accounting firm showing the aggregate fees for all services provided to PGIM Investments and its affiliates.
(e) (2) Percentage of services referred to in 4(b) – 4(d) that were approved by the audit committee –
For the fiscal year ended July 31, 2018 and period ended July 31, 2017: none.
(f) Percentage of hours expended attributable to work performed by other than full time employees of principal accountant if greater than 50%.
The percentage of hours expended on the principal accountant’s engagement to audit the registrant’s financial statements for the most recent fiscal period that were attributed to work performed by persons other than the principal accountant’s full-time, permanent employees was 0%.
(g) Non-Audit Fees
The aggregate non-audit fees billed by KPMG for services rendered to the registrant’s investment adviser and any entity controlling, controlled by, or under common control with the investment adviser that provides ongoing services to the registrant for the fiscal year ended July 31, 2018 and period ended July 31, 2017 was $0 and $0, respectively.
(h) Principal Accountant’s Independence
Not applicable as KPMG has not provided non-audit services to the registrant’s investment adviser and any entity controlling, controlled by, or under common control with the investment adviser that provides ongoing services to the registrant that were not pre-approved pursuant to Rule 2-01(c)(7)(ii) of Regulation S-X.
| Item 5 – | Audit Committee of Listed Registrants – Not applicable. |
| Item 6 – | Schedule of Investments – The schedule is included as part of the report to shareholders filed under Item 1 of this Form. |
| Item 7 – | Disclosure of Proxy Voting Policies and Procedures for Closed-End Management Investment Companies – Not applicable. |
Item 8 – Portfolio Managers of Closed-End Management Investment Companies – Not applicable.
| Item 9 – | Purchases of Equity Securities by Closed-End Management Investment Company and Affiliated Purchasers – Not applicable. |
Item 10 – Submission of Matters to a Vote of Security Holders – Not applicable.
Item 11 – Controls and Procedures
| | (a) | It is the conclusion of the registrant’s principal executive officer and principal financial officer that the effectiveness of the registrant’s current disclosure controls and procedures (such disclosure controls and procedures having been evaluated within 90 days of the date of this filing) provide reasonable assurance that the information required to be disclosed by the registrant has been recorded, processed, summarized and reported within the time period specified in the Commission’s rules and forms and that the information required to be disclosed by the registrant has been accumulated and communicated to the registrant’s principal executive officer and principal financial officer in order to allow timely decisions regarding required disclosure. |
| | (b) | There has been no significant change in the registrant’s internal control over financial reporting that occurred during the registrant’s most recent fiscal quarter of the period covered by this report that has materially affected, or is likely to materially affect, the registrant’s internal control over financial reporting. |
Item 12 – Exhibits
| | (a) | (1) Code of Ethics – Attached hereto as Exhibit EX-99.CODE-ETH |
| | (2) | Certifications pursuant to Section 302 of the Sarbanes-Oxley Act – Attached hereto as Exhibit EX-99.CERT. |
| | (3) | Any written solicitation to purchase securities under Rule 23c-1. – Not applicable. |
| | (b) | Certifications pursuant to Section 906 of the Sarbanes-Oxley Act – Attached hereto as Exhibit EX-99.906CERT. |
SIGNATURES
Pursuant to the requirements of the Securities Exchange Act of 1934 and the Investment Company Act of 1940, the registrant has duly caused this report to be signed on its behalf by the undersigned, thereunto duly authorized.
| | |
| Registrant | | Prudential Investment Portfolios 2 |
| |
| By: | | /s/ Deborah A. Docs |
| | Deborah A. Docs |
| | Secretary |
| |
| Date: | | September 24, 2018 |
Pursuant to the requirements of the Securities Exchange Act of 1934 and the Investment Company Act of 1940, this report has been signed below by the following persons on behalf of the registrant and in the capacities and on the dates indicated.
| | |
| By: | | /s/ Stuart S. Parker |
| | | Stuart S. Parker |
| | President and Principal Executive Officer |
| |
| Date: | | September 24, 2018 |
| |
| By: | | /s/ Brian D. Nee |
| | Brian D. Nee |
| | Treasurer and Principal Financial and Accounting Officer |
| |
| Date: | | September 24, 2018 |