UNITED STATES
SECURITIES AND EXCHANGE COMMISSION
Washington, D.C. 20549
FORMN-CSR
CERTIFIED SHAREHOLDER REPORT OF REGISTERED MANAGEMENT INVESTMENT COMPANIES
| | |
| Investment Company Act file number: | | 811-09999 |
| |
| Exact name of registrant as specified in charter: | | Prudential Investment Portfolios 2 |
(This FormN-CSR relates solely to the Registrant’s: PGIM Core Short-Term Bond Fund, PGIM Core Ultra Short Bond Fund and PGIM Institutional Money Market Fund.)
| | |
| Address of principal executive offices: | | 655 Broad Street, 17th Floor |
| | | Newark, New Jersey 07102 |
| |
| Name and address of agent for service: | | Andrew R. French |
| | | 655 Broad Street, 17th Floor |
| | | Newark, New Jersey 07102 |
| |
| Registrant’s telephone number, including area code: | | 800-225-1852 |
| |
| Date of fiscal year end: | | 1/31/2019 |
| |
| Date of reporting period: | | 1/31/2019 |
Item 1 – Reports to Stockholders

PGIM CORE SHORT-TERM BOND FUND
PGIM CORE ULTRA SHORT BOND FUND
PGIM INSTITUTIONAL MONEY MARKET FUND
(Formerly known as Prudential Core Short-Term Bond Fund, Prudential Core Ultra Short Bond Fund and Prudential Institutional Money Market Fund)
ANNUAL REPORT
JANUARY 31, 2019

|
PGIM Core Short-Term Bond Fund—Objective:Income consistent with relative
stability of principal PGIM Core Ultra Short Bond Fund—Objective:Current income consistent with
the preservation of capital and the maintenance of liquidity PGIM Institutional Money Market Fund—Objective:Current income consistent
with the preservation of capital and the maintenance of liquidity |
This report is not authorized for distribution to prospective investors unless preceded or accompanied by a current prospectus.
The information about the Funds’ portfolio holdings is for the period covered by this report and is subject to change thereafter.
Mutual funds are distributed by Prudential Investment Management Services LLC, a Prudential Financial company and member SIPC. PGIM Fixed Income is a unit of PGIM, Inc. (PGIM), a registered investment adviser. PGIM is a Prudential Financial company.© 2019 Prudential Financial, Inc. and its related entities. PGIM and the PGIM logo are service marks of Prudential Financial, Inc. and its related entities, registered in many jurisdictions worldwide.
| | |
| 2 | | Visit our website at pgiminvestments.com |
Table of Contents
| | | | |
| Prudential Investment Portfolios 2 | | | 3 | |
This Page Intentionally Left Blank
PGIM Core Short-Term Bond Fund
Your Fund’s Performance(unaudited)
Performance data quoted represent past performance. Past performance does not guarantee future results. The investment return and principal value of an investment will fluctuate, so that an investor’s shares, when redeemed, may be worth more or less than their original cost. Current performance may be lower or higher than the past performance data quoted. An investor may obtain performance data as of the most recent month-end by visiting our website atpgiminvestments.com or by calling (800) 225-1852.
| | | | | | |
| |
| | | Average Annual Total Returns as of 1/31/19 |
| | | One Year (%) | | Five Years (%) | | Ten Years (%) |
| PGIM Core Short-Term Bond Fund |
| | 2.42 | | 1.77 | | 3.99 |
| Lipper Ultra Short Obligations Funds Average |
| | 1.70 | | 0.98 | | 1.28 |
| 3 Month LIBOR IX |
| | | 2.32 | | 0.97 | | 0.70 |
Source: PGIM Investments LLC and Lipper Inc.
The returns in the table do not reflect the deduction of taxes that a shareholder would pay on Fund distributions or following the redemption of Fund shares.
Growth of a $10,000 Investment
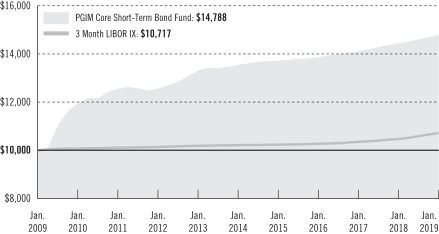
The graph compares a $10,000 investment in the Fund with a similar investment in the 3 Month LIBOR IX by portraying the initial account values at the beginning of the10-year period (January 31, 2009) and the account values at the end of the current fiscal year (January 31, 2019), as measured on a quarterly basis. For purposes of the graph, and unless
| | | | |
| Prudential Investment Portfolios 2 | | | 5 | |
PGIM Core Short-Term Bond Fund
Your Fund’s Performance(continued)
otherwise indicated, it has been assumed that (a) all recurring fees (including management fees) were deducted; and (b) all dividends and distributions were reinvested. Without waiver of fees and/or expense reimbursements, if any, the returns would have been lower.
Past performance does not predict future performance. Total returns and the ending account values in the graph include changes in share price and reinvestment of dividends and capital gains distributions in a hypothetical investment for the periods shown. The Fund’s total returns do not reflect the deduction of income taxes on an individual’s investment. Taxes may reduce your actual investment returns on income or gains paid by the Fund or any gains you may realize if you sell your shares.
Source: PGIM Investments LLC and Bloomberg
Benchmark Definitions
Lipper Ultra Short Obligations Funds Average—The Lipper Ultra Short Obligation Funds Average (Lipper Average) is based on the average return of all funds in the Lipper Ultra Short Obligation Funds universe for the periods noted. Funds in the Lipper Average primarily invest in investment-grade debt issues or better and maintain a portfolio dollar-weighted average maturity between 91 days and 365 days.
3 Month LIBOR IX—The 3 Month London InterBank Offered Rate Index is the average rate at which a panel of leading banks borrowed US dollar funds from one another with a maturity of three months during the periods noted. LIBOR is the most widely used “benchmark” or reference rate for short term interest rates.
Investors cannot invest directly in an index. The returns for the 3 Month LIBOR IX would be lower if they included the effects of sales charges, operating expenses of a mutual fund, or taxes. Returns for the Lipper Average reflect the deduction of operating expenses, but not sales charges or taxes.
| | | | | | |
|
| Distributions and Yields as of 1/31/19 |
| | Total Distributions
Paid for
12 Months ($) | | SEC 30-Day
Subsidized
Yield* (%) | | SEC 30-Day
Unsubsidized
Yield** (%) |
| PGIM Core Short-Term Bond Fund | | 0.28 | | 3.12 | | 3.12 |
*SEC 30-Day Subsidized Yield (%)—A standardized yield calculation created by the Securities and Exchange Commission, it reflects the income earned during a 30-day period, after the deduction of the Fund’s net expenses (net of any expense waivers or reimbursements).
**SEC 30-Day Unsubsidized Yield (%)—A standardized yield calculation created by the Securities and Exchange Commission, it reflects the income earned during a 30-day period, after the deduction of the Fund’s gross expenses. The investor experience is represented by the SEC 30-Day Subsidized Yield.
| | |
| 6 | | Visit our website at pgiminvestments.com |
| | | | |
|
| Credit Quality expressed as a percentage of total investments as of 1/31/19 (%) | |
| AAA | | | 27.9 | |
| AA | | | 18.6 | |
| A | | | 24.9 | |
| BBB | | | 10.2 | |
| BB | | | 1.5 | |
| B | | | 0.2 | |
| CCC | | | 0.3 | |
| Not Rated | | | 0.2 | |
| Cash/Equivalents | | | 16.2 | |
| Total Investments | | | 100.0 | |
Source: PGIM Fixed Income
Credit ratings reflect the highest rating assigned by a nationally recognized statistical rating organization (NRSRO) such as Moody’s Investors Service, Inc. (Moody’s), S&P Global Ratings (S&P), or Fitch, Inc. (Fitch). Credit ratings reflect the common nomenclature used by both S&P and Fitch. Where applicable, ratings are converted to the comparable S&P/Fitch rating tier nomenclature. These rating agencies are independent, and are widely used. The Not Rated category consists of securities that have not been rated by an NRSRO. Credit ratings are subject to change. Values may not sum to 100.0% due to rounding.
| | | | |
| Prudential Investment Portfolios 2 | | | 7 | |
PGIM Core Ultra Short Bond Fund
Your Fund’s Performance(unaudited)
Performance data quoted represent past performance. Past performance does not guarantee future results. The investment return and principal value of an investment will fluctuate, so that an investor’s shares, when redeemed, may be worth more or less than their original cost. Current performance may be lower or higher than the past performance data quoted. An investor may obtain performance data as of the most recent month-end by visiting our website atpgiminvestments.com or by calling (800) 225-1852.
| | | | | | |
| |
| | | Average Annual Total Returns as of 1/31/19 |
| | | One Year (%) | | Five Years (%) | | Ten Years (%) |
| PGIM Core Ultra Short Bond Fund |
| | 2.17 | | 0.87 | | 0.56 |
| iMoneyNet Prime Institutional Funds Average |
| | | 1.89 | | 0.64 | | 0.37 |
Source: PGIM Investments LLC and iMoneyNet Inc.
The returns in the table do not reflect the deduction of taxes that a shareholder would pay on Fund distributions or following the redemption of Fund shares.
Growth of a $10,000 Investment
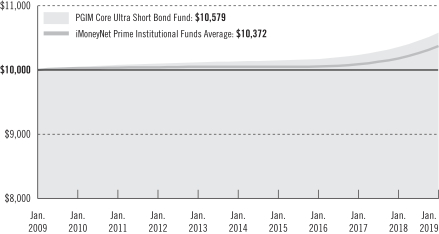
The graph compares a $10,000 investment in the Fund with a similar investment in the iMoneyNet Prime Institutional Funds Average by portraying the initial account values at the beginning of the 10-year period (January 31, 2009) and the account values at the end of the current fiscal year (January 31, 2019), as measured on a quarterly basis. For purposes of the graph, and unless otherwise indicated, it has been assumed that (a) all recurring
| | |
| 8 | | Visit our website at pgiminvestments.com |
fees (including management fees) were deducted; and (b) all dividends and distributions were reinvested. Without waiver of fees and/or expense reimbursements, if any, the returns would have been lower.
Past performance does not predict future performance. Total returns and the ending account values in the graph include changes in share price and reinvestment of dividends and capital gains distributions in a hypothetical investment for the periods shown. The Fund’s total returns do not reflect the deduction of income taxes on an individual’s investment. Taxes may reduce your actual investment returns on income or gains paid by the Fund or any gains you may realize if you sell your shares.
Benchmark Definition
iMoneyNet Prime Institutional Funds Average—The iMoneyNet Prime Institutional Funds Average is based on the average return of all funds in the iMoneyNet Prime Institutional Funds universe for the periods noted. Funds in the iMoneyNet Prime Institutional Funds Average primarily invest in a variety of taxable short-term corporate and bank debt securities.
| | | | | | |
|
| Distributions and Yields as of 1/31/19 |
| | Total Distributions
Paid for
12 Months ($) | | SEC 30-Day
Subsidized
Yield* (%) | | SEC 30-Day
Unsubsidized
Yield** (%) |
| PGIM Core Ultra Short Bond Fund | | 0.02 | | 2.62 | | 2.62 |
*SEC 30-Day Subsidized Yield (%)—A standardized yield calculation created by the Securities and Exchange Commission, it reflects the income earned during a 30-day period, after the deduction of the Fund’s net expenses (net of any expense waivers or reimbursements).
**SEC 30-Day Unsubsidized Yield (%)—A standardized yield calculation created by the Securities and Exchange Commission, it reflects the income earned during a 30-day period, after the deduction of the Fund’s gross expenses. The investor experience is represented by the SEC 30-Day Subsidized Yield.
| | | | |
|
| Credit Quality expressed as a percentage of total investments as of 1/31/19 (%) | |
| A-1+/P-1 | | | 76.2 | |
| A-1/P-1 | | | 23.8 | |
| Total Investments | | | 100.0 | |
Source: PGIM Fixed Income
Credit ratings reflect the highest rating assigned by an NRSRO such as Moody’s, S&P and Fitch. Moody’s Investor Service, Inc. (Moody’s), S&P Global Ratings (S&P), or Fitch, Inc. (Fitch). Credit ratings reflect the common nomenclature used by both S&P and Fitch. Where applicable, ratings are converted to the comparable S&P/Fitch rating tier nomenclature. These rating agencies are independent, and are widely used. Credit ratings are subject to change.
| | | | |
| Prudential Investment Portfolios 2 | | | 9 | |
PGIM Institutional Money Market Fund
Your Fund’s Performance(unaudited)
Performance data quoted represent past performance. Past performance does not guarantee future results. The investment return and principal value of an investment will fluctuate, so that an investor’s shares, when redeemed, may be worth more or less than their original cost. Current performance may be lower or higher than the past performance data quoted. An investor may obtain performance data as of the most recent month-end by visiting our website atpgiminvestments.com or by calling (800) 225-1852.
| | | | |
| |
| | | Average Annual Total Returns as of 1/31/19 |
| | | One Year (%) | | Since Inception (%) |
| PGIM Institutional Money Market Fund |
| | 2.16 | | 1.44 (7/19/16) |
| iMoneyNet Prime Institutional Funds Average |
| | | 1.89 | | 1.20 |
Source: PGIM Investments LLC and iMoneyNet Inc.
The returns in the tables do not reflect the deduction of taxes that a shareholder would pay on Fund distributions or following the redemption of Fund shares. Since Inception returns for the Average are measured from the closest month-end to the Fund’s inception date.
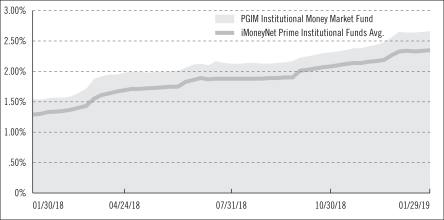
Institutional Money Market Fund Yield Comparison
| | |
| 10 | | Visit our website at pgiminvestments.com |
Weighted Average Maturity* (WAM) Comparison
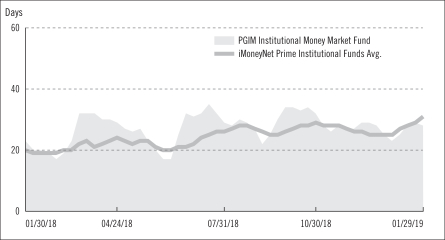
The graphs portray weekly 7-day current yields and weekly WAMs for PGIM Institutional Money Market Fund and the iMoneyNet Prime Institutional Funds Average every Tuesday from January 30, 2018 to January 29, 2019, the closest dates prior to the beginning and end of the Fund’s reporting period. Note: iMoneyNet, Inc. regularly reports a 7-day current yield and WAM on Tuesdays. As a result, the data portrayed for the Fund at the end of the reporting period in the graphs may not match the data portrayed in the Fund’s performance table as of January 31, 2019.
* Weighted Average Maturity is based on the dollar-weighted average length of time until principal payments are expected or until securities reach maturity, taking into account any maturity shortening feature such as a call, refunding, or redemption provision.
Benchmark Definition
iMoneyNet Prime Institutional Funds Average—The iMoneyNet Prime Institutional Funds Average is based on the average return of all funds in the iMoneyNet Prime Institutional Funds universe for the periods noted. Funds in the iMoneyNet Prime Institutional Funds Average primarily invest in a variety of taxable short-term corporate and bank debt securities.
| | | | |
| Prudential Investment Portfolios 2 | | | 11 | |
PGIM Core Short-Term Bond Fund
Strategy and Performance Overview(unaudited)
How did the Fund perform?
During the reporting period that ended January 31, 2019, thePGIM Core Short-Term Bond Fund’s net asset value (NAV) experienced minimal volatility while posting a total return of 2.42%. Over the same period, the 3 Month LIBOR IX (the Index) returned 2.32%, and the Lipper Ultra Short Obligations Funds Average returned 1.70%.
What were market conditions?
In the face of escalating financial market volatility and trade tensions, the global economic expansion moderated during the reporting period from “very strong” to just “solid.” While perhaps disappointing relative to robust expectations from a year ago, the current pace of growth, if sustained, would hardly be distressing for the global economy. Against this backdrop, the Federal Reserve (the Fed) led other central banks in the “punch-bowl snatching” by reducing the size of its balance sheet and increasing interest rates. In 2018, the Fed hiked rates four times, bringing the federal funds target rate to a range of2.25%-2.50%. Meanwhile, the European Central Bank ended its bond purchase program, and the Bank of Japan continued to reduce its bond purchases after widening the target range on the 10-year Japanese government bond yield. Other central banks (e.g., the Bank of Canada and Bank of England) hiked rates as well.
The sharp downward adjustment in financial markets late in 2018 was driven in large measure by concerns of further Fed rate hikes and balance sheet adjustment. But partially in response to the tightening of financial conditions, the Fed has lurched to a more dovish stance. While in December the Fed foresaw “some further gradual” rate hikes, the late January statement removed any bias toward increases, emphasizing only that the Fed would be “patient” in determining what “adjustments” to its policy rate might be “appropriate.” Chairman Jerome Powell went even further during the press conference, indicating that the Federal Open Markets Committee (FOMC) had no “strong prior” mandate regarding the direction of its next move. This was a remarkable assessment, in PGIM Fixed Income’s view, given that the committee’s December “dot plot” had envisioned two rate hikes this year and one more in 2020. The Fed’s dot plot displays projections of the 12 members of the FOMC. Each dot represents a member’s view on where the federal funds rate should be at the end of the various calendar years shown, as well as in the long run.
Turning to the fixed income markets, in early 2018 bonds suffered from a tough starting point: a combination of low government yields and tight credit spreads (yield differentials) that left little room for error. Over the course of the year, the market was buffeted alternately—and at times jointly—by rising government yields and widening spreads. Some of the initial spread widening could easily have been chalked up to normalizing (i.e., spreads may have gotten ahead of fundamentals and were too tight early in 2018). But investor anxiety soon rose, driving spreads wider across virtually all fixed income sectors. As
| | |
| 12 | | Visit our website at pgiminvestments.com |
a result, for all but the most defensive bond market segments, total returns and excess returns relative to US Treasuries were generally low or negative for the period.
Within the short end of the yield curve, a key theme for the reporting period was spread tightening among credit securities versus government securities. Based on Bloomberg Barclays indices, 1-3 year government bonds posted a 2.16% return for the period. Other “spread” sectors fared better. The 1-3 year segment of the Bloomberg Barclays US Aggregate Bond Index, which includes non-government sectors, posted a 2.28% return for the period, while 1-3 year investment-grade corporate debt posted a 2.53% return.
What strategies or holdings affected the Fund’s performance?
The Fund emphasized spread assets, with over 80% of assets allocated to the aforementioned non-Treasury sectors, including short-term investment-grade corporates, commercial mortgage-backed securities, and asset-backed securities (non-agency residential mortgages, credit card receivables, etc.). This positioning helped the Fund outpace its LIBOR (London Inter-Bank Offered Rate) benchmark during the reporting period.
Did the Fund use derivatives and how did they affect performance?
During the reporting period, the Fund used swap agreements for hedging interest rate risk and to add value versus cash securities. The use of these derivatives had a negligible effect on the performance of the Fund.
Current outlook
Looking ahead, PGIM Fixed Income continues to believe that the combination of a more dovish Fed, attenuating headwinds from the trade war, a still strong US labor market, and (particularly) mounting stimulus in China will be sufficient to deliver “lukewarm” global growth and a generally favorable macro backdrop for markets. Nevertheless, the weakening momentum in the global economy is concerning, and PGIM Fixed Income is monitoring the incoming data and policy developments closely. The Fund will continue to emphasize well-researched short-term credit sectors, including short-term corporate debt, commercial mortgage-backed securities, and asset-backed securities as PGIM Fixed Income expects these assets to offer the most value from a total return perspective.
| | | | |
| Prudential Investment Portfolios 2 | | | 13 | |
PGIM Core Ultra Short Bond Fund
Strategy and Performance Overview(unaudited)
What were market conditions?
In the face of escalating financial market volatility and trade tensions, the global economic expansion moderated during the reporting period from “very strong” to just “solid.” While perhaps disappointing relative to robust expectations from a year ago, the current pace of growth, if sustained, would hardly be distressing for the global economy. Against this backdrop, the Federal Reserve (the Fed) led other central banks in the “punch-bowl snatching” by reducing the size of its balance sheet and increasing interest rates. In 2018, the Fed hiked rates four times, bringing the federal funds target rate to a range of2.25%-2.50%. Meanwhile, the European Central Bank ended its bond purchase program, and the Bank of Japan continued to reduce its bond purchases after widening the target range on the 10-year Japanese government bond yield. Other central banks (e.g., the Bank of Canada and Bank of England) hiked rates as well.
The sharp downward adjustment in financial markets late in 2018 was driven in large measure by concerns of further Fed rate hikes and balance sheet adjustment. But partially in response to the tightening of financial conditions, the Fed has lurched to a more dovish stance. While in December the Fed foresaw “some further gradual” rate hikes, the late January statement removed any bias toward increases, emphasizing only that the Fed would be “patient” in determining what “adjustments” to its policy rate might be “appropriate.” Chairman Jerome Powell went even further during the press conference, indicating that the Federal Open Markets Committee (FOMC) had no “strong prior” mandate regarding the direction of its next move. This was a remarkable assessment, in PGIM Fixed Income’s view, given that the committee’s December “dot plot” had envisioned two rate hikes this year and one more in 2020. The Fed’s dot plot displays projections of the 12 members of the FOMC. Each dot represents a member’s view on where the federal funds rate should be at the end of the various calendar years shown, as well as in the long run.
For most of 2018, the money markets and cash alternatives segment of the market was fairly stable. Consistent with increases in the federal funds rate, other measures including 3 Month LIBOR and Treasury bill rates rose to levels last seen in 2008. 3 Month LIBOR rose from 1.8% at the beginning of the period to 2.7% at the end of it. Commercial paper held fairly steady until December when the spread between LIBOR and the overnight index swap widened, making corporates more attractive approaching the last Fed meeting of the year.
What strategies or holdings affected the Fund’s performance?
The Fund continued to emphasize spread assets over Treasury and agency paper to capture additional yield. Throughout the period, with the Fed’s rate hikes generally anticipated and broadcasted, the Fund’s managers shortened the Fund’s weighted average maturity (WAM) and weighted average life (WAL) ahead of the hikes, thus allowing these proceeds to be reinvested post-hike at higher levels in longer maturities.
| | |
| 14 | | Visit our website at pgiminvestments.com |
At different times throughout the year, the managers also took advantage of wider floating rate spreads and increased positions in LIBOR floaters. Additionally, the Fund’s position in agency discount notes versus corporates, repurchase agreements, and Treasuries shifted tactically based on relative value between the sectors throughout the period.
Current outlook
Looking ahead, PGIM Fixed Income continues to believe that the combination of a more dovish Fed, attenuating headwinds from the trade war, a still strong US labor market, and (particularly) mounting stimulus in China will be sufficient to deliver “lukewarm” global growth and a generally favorable macro backdrop for markets. Nevertheless, the weakening momentum in the global economy is concerning, and PGIM Fixed Income is monitoring the incoming data and policy developments closely. The portfolio management team will continue to focus on corporate assets, with an emphasis on financials, over other money market sectors including Treasuries and agencies. As relative value between floating rate and fixed rate assets fluctuates, the team will seek to rotate into more attractively priced holdings. The Fund’s WAM will also be tactically adjusted, in anticipation of Fed policy expectations, to position the Fund to capture the best available yields post-Fed action.
| | | | |
| Prudential Investment Portfolios 2 | | | 15 | |
PGIM Institutional Money Market Fund
Strategy and Performance Overview(unaudited)
What were market conditions?
In the face of escalating financial market volatility and trade tensions, the global economic expansion moderated during the reporting period from “very strong” to just “solid.” While perhaps disappointing relative to robust expectations from a year ago, the current pace of growth, if sustained, would hardly be distressing for the global economy. Against this backdrop, the Federal Reserve (the Fed) led other central banks in the “punch-bowl snatching” by reducing the size of its balance sheet and increasing interest rates. In 2018, the Fed hiked rates four times, bringing the federal funds target rate to a range of2.25%-2.50%. Meanwhile, the European Central Bank ended its bond purchase program, and the Bank of Japan continued to reduce its bond purchases after widening the target range on the 10-year Japanese government bond yield. Other central banks (e.g., the Bank of Canada and Bank of England) hiked rates as well.
The sharp downward adjustment in financial markets late in 2018 was driven in large measure by concerns of further Fed rate hikes and balance sheet adjustment. But partially in response to the tightening of financial conditions, the Fed has lurched to a more dovish stance. While in December the Fed foresaw “some further gradual” rate hikes, the late January statement removed any bias toward increases, emphasizing only that the Fed would be “patient” in determining what “adjustments” to its policy rate might be “appropriate.” Chairman Jerome Powell went even further during the press conference, indicating that the Federal Open Markets Committee (FOMC) had no “strong prior” mandate regarding the direction of its next move. This was a remarkable assessment, in PGIM Fixed Income’s view, given that the committee’s December “dot plot” had envisioned two rate hikes this year and one more in 2020. The Fed’s dot plot displays projections of the 12 members of the FOMC. Each dot represents a member’s view on where the federal funds rate should be at the end of the various calendar years shown, as well as in the long run.
For most of 2018, the money markets and cash alternatives segment of the market was fairly stable. Consistent with increases in the federal funds rate, other measures including 3 Month LIBOR and Treasury bill rates rose to levels last seen in 2008. 3 Month LIBOR rose from 1.8% at the beginning of the period to 2.7% at the end of it. Commercial paper held fairly steady until December when the spread between LIBOR and the overnight index swap widened, making corporates more attractive approaching the last Fed meeting of the year.
What strategies or holdings affected the Fund’s performance?
The Fund continued to emphasize spread assets over Treasury and agency paper to capture additional yield. Throughout the period, with the Fed’s rate hikes generally anticipated and broadcasted, the Fund’s managers shortened the Fund’s weighted average maturity (WAM) and weighted average life (WAL) ahead of the hikes, thus allowing these proceeds to be reinvested post-hike at higher levels in longer maturities.
| | |
| 16 | | Visit our website at pgiminvestments.com |
At different times throughout the year, the managers also took advantage of wider floating rate spreads and increased positions in LIBOR floaters. This allocation consisted mainly of foreign bank positions, as the floating rate paper is attractive for the Fund’s mandate. Additionally, the Fund’s position in agency discount notes versus corporates, repurchase agreements, and Treasuries shifted tactically based on relative value between the sectors throughout the period.
Current outlook
Looking ahead, PGIM Fixed Income continues to believe that the combination of a more dovish Fed, attenuating headwinds from the trade war, a still strong US labor market, and (particularly) mounting stimulus in China will be sufficient to deliver “lukewarm” global growth and a generally favorable macro backdrop for markets. Nevertheless, the weakening momentum in the global economy is concerning, and PGIM Fixed Income is monitoring the incoming data and policy developments closely. The portfolio management team will continue to focus on corporate assets, with an emphasis on financials, over other money market sectors including Treasuries and agencies. As relative value between floating rate and fixed rate assets fluctuates, the team will seek to rotate into more attractively priced holdings. The Fund’s WAM will also be tactically adjusted, in anticipation of Fed policy expectations, to position the Fund to capture the best available yields post-Fed action.
| | | | |
| Prudential Investment Portfolios 2 | | | 17 | |
Fees and Expenses(unaudited)
As a shareholder of a Fund, you incur two types of costs: (1) transaction costs, including sales charges (loads) on purchase payments and redemptions, as applicable, and (2) ongoing costs, including management fees, distribution, and/or service (12b-1) fees, and other Fund expenses, as applicable. This example is intended to help you understand your ongoing costs (in dollars) of investing in the Fund and to compare these costs with the ongoing costs of investing in other mutual funds.
The example is based on an investment of $1,000 held through the six-month period ended January 31, 2019. The example is for illustrative purposes only; you should consult the Prospectus for information on initial and subsequent minimum investment requirements.
Actual Expenses
The first line for each share class in the table on the following page provides information about actual account values and actual expenses. You may use the information on this line, together with the amount you invested, to estimate the expenses that you paid over the period. Simply divide your account value by $1,000 (for example, an $8,600 account value ÷ $1,000 = 8.6), then multiply the result by the number on the first line under the heading “Expenses Paid During the Six-Month Period” to estimate the expenses you paid on your account during this period.
Hypothetical Example for Comparison Purposes
The second line for each share class in the table on the following page provides information about hypothetical account values and hypothetical expenses based on the Fund’s actual expense ratio and an assumed rate of return of 5% per year before expenses, which is not the Fund’s actual return. The hypothetical account values and expenses may not be used to estimate the actual ending account balance or expenses you paid for the period. You may use this information to compare the ongoing costs of investing in the Fund and other funds. To do so, compare this 5% hypothetical example with the 5% hypothetical examples that appear in the shareholder reports of the other funds.
Please note that the expenses shown in the table are meant to highlight your ongoing costs only and do not reflect any transactional costs such as sales charges (loads). Therefore, the second line for each share class in the table is useful in comparing ongoing costs only and will not help you determine the relative total costs of owning different funds. In addition, if these transactional costs were included, your costs would have been higher.
| | |
| 18 | | Visit our website at pgiminvestments.com |
| | | | | | | | | | | | | | | | |
| | | | | |
PGIM Core
Short-Term
Bond Fund | | Beginning Account
Value
August 1, 2018 | | | Ending Account
Value
January 31, 2019 | | | Annualized
Expense Ratio
Based on the
Six-Month Period | | | Expenses Paid
During the
Six-Month Period* | |
| Actual | | $ | 1,000.00 | | | $ | 1,012.40 | | | | 0.03 | % | | $ | 0.15 | |
| Hypothetical | | $ | 1,000.00 | | | $ | 1,025.05 | | | | 0.03 | % | | $ | 0.15 | |
| | | | | | | | | | | | | | | | |
| | | | |
PGIM Core
Ultra Short Bond Fund | | Beginning Account
Value
August 1, 2018 | | | Ending Account
Value
January 31, 2019 | | | Annualized
Expense Ratio
Based on the
Six-Month Period | | | Expenses Paid
During the
Six-Month Period* | |
| Actual | | $ | 1,000.00 | | | $ | 1,012.00 | | | | 0.01 | % | | $ | 0.05 | |
| Hypothetical | | $ | 1,000.00 | | | $ | 1,025.16 | | | | 0.01 | % | | $ | 0.05 | |
| | | | | | | | | | | | | | | | |
| | | | | |
PGIM
Institutional Money
Market Fund | | Beginning Account
Value
August 1, 2018 | | | Ending Account
Value
January 31, 2019 | | | Annualized
Expense Ratio
Based on the
Six-Month Period | | | Expenses Paid
During the
Six-Month Period* | |
| Actual | | $ | 1,000.00 | | | $ | 1,012.00 | | | | 0.07 | % | | $ | 0.35 | |
| Hypothetical | | $ | 1,000.00 | | | $ | 1,024.85 | | | | 0.07 | % | | $ | 0.36 | |
*Fund expenses (net of fee waivers or subsidies, if any) are equal to the annualized expense ratio (provided in the table), multiplied by the average account value over the period, multiplied by the 184 days in the six-month period ended January 31, 2019, and divided by the 365 days in each Fund’s fiscal year ended January 31, 2019 (to reflect the six-month period). Expenses presented in the table include the expenses of any underlying portfolios in which each Fund may invest.
| | | | |
| Prudential Investment Portfolios 2 | | | 19 | |
PGIM Core Short-Term Bond Fund
Schedule of Investments
as of January 31, 2019
| | | | | | | | | | | | | | | | |
| | | | |
| Description | | Interest
Rate | | | Maturity
Date | | | Principal
Amount (000)# | | | Value | |
| | | | |
LONG-TERM INVESTMENTS 83.9% | | | | | | | | | | | | | | | | |
| | | | |
ASSET-BACKED SECURITIES 19.1% | | | | | | | | | | | | | | | | |
| | | | |
Automobiles 8.2% | | | | | | | | | | | | | | | | |
Ally Auto Receivables Trust,
Series 2018-03, Class A3 | | | 3.000 | % | | | 01/17/23 | | | | 15,000 | | | $ | 15,037,464 | |
Ally Master Owner Trust, | | | | | | | | | | | | | | | | |
Series 2017-03, Class A1, 1 Month LIBOR + 0.430% | | | 2.939 | (c) | | | 06/15/22 | | | | 6,600 | | | | 6,612,869 | |
Series 2018-02, Class A | | | 3.290 | | | | 05/15/23 | | | | 9,100 | | | | 9,154,323 | |
Series 2018-04, Class A | | | 3.300 | | | | 07/17/23 | | | | 10,000 | | | | 10,055,170 | |
Bank of The West Auto Trust, | | | | | | | | | | | | | | | | |
Series 2017-01, Class A2, 144A | | | 1.780 | | | | 02/15/21 | | | | 475 | | | | 473,422 | |
Series 2017-01, Class A3, 144A | | | 2.110 | | | | 01/15/23 | | | | 1,000 | | | | 986,381 | |
BMW Floorplan Master Owner Trust,
Series 2018-01, Class A1, 144A | | | 3.150 | | | | 05/15/23 | | | | 5,000 | | | | 5,018,252 | |
CarMax Auto Owner Trust, | | | | | | | | | | | | | | | | |
Series 2017-04, Class A3 | | | 2.110 | | | | 10/17/22 | | | | 2,300 | | | | 2,272,465 | |
Series 2018-01, Class A3 | | | 2.480 | | | | 11/15/22 | | | | 2,900 | | | | 2,880,276 | |
Series 2018-02, Class A3 | | | 2.980 | | | | 01/17/23 | | | | 4,800 | | | | 4,831,276 | |
Series 2018-03, Class A3 | | | 3.130 | | | | 06/15/23 | | | | 9,100 | | | | 9,148,710 | |
Series 2018-04, Class A3 | | | 3.360 | | | | 09/15/23 | | | | 9,500 | | | | 9,595,921 | |
Series 2019-01, Class A2A | | | 3.020 | | | | 07/15/22 | | | | 4,800 | | | | 4,805,368 | |
Ford Credit Auto Lease Trust,
Series 2018-A, Class A2A | | | 2.710 | | | | 12/15/20 | | | | 7,998 | | | | 7,986,117 | |
Ford Credit Auto Owner Trust, | | | | | | | | | | | | | | | | |
Series 2014-02, Class A, 144A | | | 2.310 | | | | 04/15/26 | | | | 7,900 | | | | 7,865,312 | |
Series 2015-02, Class A, 144A | | | 2.440 | | | | 01/15/27 | | | | 3,600 | | | | 3,568,060 | |
Series 2016-01, Class A, 144A | | | 2.310 | | | | 08/15/27 | | | | 3,250 | | | | 3,206,283 | |
Ford Credit Floorplan Master Owner Trust A, | | | | | | | | | | | | | | | | |
Series 2016-05, Class A1 | | | 1.950 | | | | 11/15/21 | | | | 4,500 | | | | 4,462,534 | |
Series 2016-05, Class A2, 1 Month LIBOR + 0.460% | | | 2.969 | (c) | | | 11/15/21 | | | | 3,915 | | | | 3,919,894 | |
Series 2017-02, Class A2, 1 Month LIBOR + 0.350% | | | 2.859 | (c) | | | 09/15/22 | | | | 7,500 | | | | 7,495,522 | |
GM Financial Automobile Leasing Trust, | | | | | | | | | | | | | | | | |
Series 2017-02, Class A2B, 1 Month LIBOR + 0.300% | | | 2.806 | (c) | | | 01/21/20 | | | | 661 | | | | 660,483 | |
Series 2017-03, Class A2B, 1 Month LIBOR + 0.240% | | | 2.746 | (c) | | | 01/21/20 | | | | 1,047 | | | | 1,047,632 | |
Series 2018-02, Class A2A | | | 2.830 | | | | 07/20/20 | | | | 10,308 | | | | 10,304,843 | |
GM Financial Consumer Automobile Receivables Trust, | | | | | | | | | | | | | | | | |
Series 2018-03, Class A3 | | | 3.020 | | | | 05/16/23 | | | | 4,100 | | | | 4,117,988 | |
Series 2018-04, Class A3 | | | 3.210 | | | | 10/16/23 | | | | 5,900 | | | | 5,949,845 | |
See Notes to Financial Statements.
| | | | |
| Prudential Investment Portfolios 2/PGIM Core Short-Term Bond Fund | | | 21 | |
PGIM Core Short-Term Bond Fund
Schedule of Investments (continued)
as of January 31, 2019
| | | | | | | | | | | | | | | | |
| | | | |
| Description | | Interest
Rate | | | Maturity
Date | | | Principal
Amount (000)# | | | Value | |
| | | | |
ASSET-BACKED SECURITIES (Continued) | | | | | | | | | | | | | | | | |
| | | | |
Automobiles (cont’d.) | | | | | | | | | | | | | | | | |
GMF Floorplan Owner Revolving Trust, | | | | | | | | | | | | | | | | |
Series 2017-02, Class A2, 144A, 1 Month LIBOR + 0.430% | | | 2.939 | %(c) | | | 07/15/22 | | | | 9,000 | | | $ | 8,998,636 | |
Series 2018-04, Class A1, 144A | | | 3.500 | | | | 09/15/23 | | | | 13,100 | | | | 13,267,210 | |
Honda Auto Receivables Owner Trust,
Series 2018-02, Class A3 | | | 3.010 | | | | 05/18/22 | | | | 4,800 | | | | 4,810,789 | |
Mercedes-Benz Auto Receivables Trust,
Series 2018-01, Class A3 | | | 3.030 | | | | 01/17/23 | | | | 4,510 | | | | 4,521,787 | |
Nissan Auto Lease Trust, | | | | | | | | | | | | | | | | |
Series 2017-A, Class A2B, 1 Month LIBOR + 0.200% | | | 2.709 | (c) | | | 09/16/19 | | | | 1,201 | | | | 1,201,524 | |
Series 2017-B, Class A2B, 1 Month LIBOR + 0.210% | | | 2.719 | (c) | | | 12/16/19 | | | | 3,013 | | | | 3,012,784 | |
Nissan Auto Receivables Owner Trust,
Series 2018-B, Class A3 | | | 3.060 | | | | 03/15/23 | | | | 4,300 | | | | 4,320,047 | |
Nissan Master Owner Trust Receivables,
Series 2017-B, Class A, 1 Month LIBOR + 0.430% | | | 2.939 | (c) | | | 04/18/22 | | | | 20,000 | | | | 20,024,110 | |
Santander Retail Auto Lease Trust, | | | | | | | | | | | | | | | | |
Series 2017-A, Class A2A, 144A | | | 2.020 | | | | 03/20/20 | | | | 2,482 | | | | 2,476,769 | |
Series 2018-A, Class A2A, 144A | | | 2.710 | | | | 10/20/20 | | | | 7,494 | | | | 7,483,712 | |
Toyota Auto Receivables Owner Trust,
Series 2018-C, Class A3 | | | 3.020 | | | | 12/15/22 | | | | 2,800 | | | | 2,809,726 | |
World Omni Auto Receivables Trust, | | | | | | | | | | | | | | | | |
Series 2018-C, Class A3 | | | 3.130 | | | | 11/15/23 | | | | 8,100 | | | | 8,152,847 | |
Series 2018-D, Class A3 | | | 3.330 | | | | 04/15/24 | | | | 8,400 | | | | 8,503,743 | |
Series 2019-A, Class A3 | | | 3.040 | | | | 05/15/24 | | | | 1,800 | | | | 1,805,954 | |
World Omni Automobile Lease Securitization Trust,
Series 2018-A, Class A2 | | | 2.590 | | | | 11/16/20 | | | | 7,119 | | | | 7,102,877 | |
| | | | | | | | | | | | | | | | |
| | | | | | | | | | | | | | | 239,948,925 | |
| | | | |
Credit Cards 3.6% | | | | | | | | | | | | | | | | |
American Express Credit Account Master Trust, | | | | | | | | | | | | | | | | |
Series 2014-01, Class A, 1 Month LIBOR + 0.370% | | | 2.879 | (c) | | | 12/15/21 | | | | 10,000 | | | | 10,007,999 | |
Series 2018-06, Class A | | | 3.060 | | | | 02/15/24 | | | | 7,700 | | | | 7,762,681 | |
Series 2018-08, Class A | | | 3.180 | | | | 04/15/24 | | | | 7,700 | | | | 7,778,656 | |
BA Credit Card Trust, | | | | | | | | | | | | | | | | |
Series 2016-A01, Class A, 1 Month LIBOR + 0.390% | | | 2.899 | (c) | | | 10/15/21 | | | | 14,400 | | | | 14,407,537 | |
Series 2018-A03, Class A3 | | | 3.100 | | | | 12/15/23 | | | | 4,500 | | | | 4,533,476 | |
Chase Issuance Trust,
Series 2017-A01, Class A, 1 Month LIBOR + 0.300% | | | 2.809 | (c) | | | 01/15/22 | | | | 13,400 | | | | 13,411,955 | |
See Notes to Financial Statements.
| | | | | | | | | | | | | | | | |
| | | | |
| Description | | Interest
Rate | | | Maturity
Date | | | Principal
Amount (000)# | | | Value | |
| | | | |
ASSET-BACKED SECURITIES (Continued) | | | | | | | | | | | | | | | | |
| | | | |
Credit Cards (cont’d.) | | | | | | | | | | | | | | | | |
Discover Card Execution Note Trust, | | | | | | | | | | | | | | | | |
Series 2014-A04, Class A4 | | | 2.120 | % | | | 12/15/21 | | | | 17,400 | | | $ | 17,358,190 | |
Series 2016-A02, Class A2, 1 Month LIBOR + 0.540% | | | 3.049 | (c) | | | 09/15/21 | | | | 1,700 | | | | 1,700,807 | |
Series 2018-A04, Class A4 | | | 3.110 | | | | 01/16/24 | | | | 7,400 | | | | 7,458,547 | |
Series 2018-A05, Class A5 | | | 3.320 | | | | 03/15/24 | | | | 10,100 | | | | 10,236,351 | |
Series 2019-A01, Class A1 | | | 3.040 | | | | 07/15/24 | | | | 1,000 | | | | 1,002,994 | |
MBNA Credit Card Master Note Trust,
Series 2004-A03, Class A3, 1 Month LIBOR + 0.260% | | | 2.769 | (c) | | | 08/16/21 | | | | 9,000 | | | | 9,000,840 | |
| | | | | | | | | | | | | | | | |
| | | | | | | | | | | | | | | 104,660,033 | |
| | | | |
Home Equity Loans 5.1% | | | | | | | | | | | | | | | | |
ABFC Trust, | | | | | | | | | | | | | | | | |
Series 2003-AHL01, Class A1 | | | 4.184 | | | | 03/25/33 | | | | 248 | | | | 246,651 | |
Series 2003-OPT01, Class A3, 1 Month LIBOR + 0.680% | | | 3.190 | (c) | | | 04/25/33 | | | | 766 | | | | 751,896 | |
Series 2004-HE01, Class M1, 1 Month LIBOR + 0.900% | | | 3.410 | (c) | | | 03/25/34 | | | | 710 | | | | 704,571 | |
Series 2004-OPT05, Class A4, 1 Month LIBOR + 1.250% | | | 3.760 | (c) | | | 06/25/34 | | | | 5,124 | | | | 5,109,502 | |
Accredited Mortgage Loan Trust,
Series 2004-04, Class A2D, 1 Month LIBOR + 0.700% | | | 3.210 | (c) | | | 01/25/35 | | | | 1,238 | | | | 1,228,518 | |
ACE Securities Corp. Home Equity Loan Trust, | | | | | | | | | | | | | | | | |
Series 2003-HE01, Class M2, 1 Month LIBOR + 2.550% | | | 5.060 | (c) | | | 11/25/33 | | | | 48 | | | | 51,824 | |
Series 2003-OP01, Class M1, 1 Month LIBOR + 1.050% | | | 3.560 | (c) | | | 12/25/33 | | | | 1,650 | | | | 1,630,476 | |
Series 2004-OP01, Class M1, 1 Month LIBOR + 0.780% | | | 3.290 | (c) | | | 04/25/34 | | | | 3,198 | | | | 3,131,517 | |
Ameriquest Mortgage Securities, Inc., Asset-Backed Pass-Through Certificates, | | | | | | | | | | | | | | | | |
Series 2003-01, Class M1, 1 Month LIBOR + 1.350% | | | 3.860 | (c) | | | 02/25/33 | | | | 5,076 | | | | 5,066,531 | |
Series 2003-08, Class M1, 1 Month LIBOR + 1.050% | | | 3.560 | (c) | | | 10/25/33 | | | | 1,766 | | | | 1,728,502 | |
Series 2003-09, Class AV2, 1 Month LIBOR + 0.680% | | | 3.190 | (c) | | | 09/25/33 | | | | 184 | | | | 181,703 | |
Series 2003-11, Class AV2, 1 Month LIBOR + 0.740% | | | 3.250 | (c) | | | 12/25/33 | | | | 259 | | | | 254,455 | |
Series 2003-12, Class M1, 1 Month LIBOR + 1.125% | | | 3.635 | (c) | | | 01/25/34 | | | | 276 | | | | 274,259 | |
See Notes to Financial Statements.
| | | | |
| Prudential Investment Portfolios 2/PGIM Core Short-Term Bond Fund | | | 23 | |
PGIM Core Short-Term Bond Fund
Schedule of Investments (continued)
as of January 31, 2019
| | | | | | | | | | | | | | | | |
| | | | |
| Description | | Interest
Rate | | | Maturity
Date | | | Principal
Amount (000)# | | | Value | |
| | | | |
ASSET-BACKED SECURITIES (Continued) | | | | | | | | | | | | | | | | |
| | | | |
Home Equity Loans (cont’d.) | | | | | | | | | | | | | | | | |
Argent Securities, Inc., Asset-Backed Pass-Through Certificates, | | | | | | | | | | | | | | | | |
Series 2003-W02, Class M4, 1 Month LIBOR + 5.625% | | | 4.011 | %(c) | | | 09/25/33 | | | | 883 | | | $ | 836,329 | |
Series 2003-W03, Class M2, 1 Month LIBOR + 2.700% | | | 4.433 | (c) | | | 09/25/33 | | | | 8,827 | | | | 8,825,696 | |
Series 2003-W04, Class M1, 1 Month LIBOR + 1.200% | | | 3.710 | (c) | | | 10/25/33 | | | | 2,451 | | | | 2,405,057 | |
Series 2003-W05, Class M1, 1 Month LIBOR + 1.050% | | | 3.560 | (c) | | | 10/25/33 | | | | 22 | | | | 21,584 | |
Series 2004-W05, Class M1, 1 Month LIBOR + 0.900% | | | 3.410 | (c) | | | 04/25/34 | | | | 134 | | | | 132,974 | |
Series 2004-W06, Class AV2, 1 Month LIBOR + 0.900% | | | 3.410 | (c) | | | 05/25/34 | | | | 353 | | | | 349,547 | |
Series 2004-W06, Class M1, 1 Month LIBOR + 0.825% | | | 3.335 | (c) | | | 05/25/34 | | | | 309 | | | | 306,140 | |
Series 2004-W07, Class M1, 1 Month LIBOR + 0.825% | | | 3.335 | (c) | | | 05/25/34 | | | | 12,051 | | | | 11,906,524 | |
Series 2004-W08, Class A2, 1 Month LIBOR + 0.960% | | | 3.470 | (c) | | | 05/25/34 | | | | 50 | | | | 50,004 | |
Asset-Backed Securities Corp. Home Equity Loan Trust, | | | | | | | | | | | | | | | | |
Series 2003-HE06, Class A2, 1 Month LIBOR + 0.680% | | | 3.190 | (c) | | | 11/25/33 | | | | 193 | | | | 187,756 | |
Series 2004-HE03, Class M1, 1 Month LIBOR + 0.810% | | | 3.320 | (c) | | | 06/25/34 | | | | 247 | | | | 242,924 | |
Bear Stearns Asset-Backed Securities Trust, | | | | | | | | | | | | | | | | |
Series 2003-03, Class M1, 1 Month LIBOR + 1.230% | | | 3.740 | (c) | | | 06/25/43 | | | | 622 | | | | 603,259 | |
Series 2004-HE02, Class M1, 1 Month LIBOR + 0.900% | | | 3.410 | (c) | | | 03/25/34 | | | | 3,289 | | | | 3,277,534 | |
Series 2004-HE07, Class M1, 1 Month LIBOR + 0.900% | | | 3.410 | (c) | | | 08/25/34 | | | | 4,012 | | | | 3,992,025 | |
Series 2004-HE10, Class M1, 1 Month LIBOR + 0.975% | | | 3.485 | (c) | | | 12/25/34 | | | | 1,216 | | | | 1,215,528 | |
CDC Mortgage Capital Trust, | | | | | | | | | | | | | | | | |
Series 2003-HE03, Class M1, 1 Month LIBOR + 1.050% | | | 3.560 | (c) | | | 11/25/33 | | | | 1,953 | | | | 1,930,954 | |
Series 2003-HE04, Class M1, 1 Month LIBOR + 0.975% | | | 3.485 | (c) | | | 03/25/34 | | | | 692 | | | | 680,865 | |
Equifirst Mortgage Loan Trust,
Series 2003-01, Class M2, 1 Month LIBOR + 2.850% | | | 5.360 | (c) | | | 12/25/32 | | | | 75 | | | | 75,526 | |
See Notes to Financial Statements.
| | | | | | | | | | | | | | | | |
| | | | |
| Description | | Interest
Rate | | | Maturity
Date | | | Principal
Amount (000)# | | | Value | |
| | | | |
ASSET-BACKED SECURITIES (Continued) | | | | | | | | | | | | | | | | |
| | | | |
Home Equity Loans (cont’d.) | | | | | | | | | | | | | | | | |
Home Equity Asset Trust, | | | | | | | | | | | | | | | | |
Series 2002-03, Class M1, 1 Month LIBOR + 1.350% | | | 3.860 | %(c) | | | 02/25/33 | | | | 583 | | | $ | 577,408 | |
Series 2002-04, Class M1, 1 Month LIBOR + 1.500% | | | 4.010 | (c) | | | 03/25/33 | | | | 417 | | | | 414,854 | |
Series 2003-02, Class M1, 1 Month LIBOR + 1.320% | | | 3.830 | (c) | | | 08/25/33 | | | | 1,013 | | | | 1,003,744 | |
Series 2003-03, Class M1, 1 Month LIBOR + 1.290% | | | 3.800 | (c) | | | 08/25/33 | | | | 1,063 | | | | 1,059,566 | |
Series 2003-04, Class M1, 1 Month LIBOR + 1.200% | | | 3.710 | (c) | | | 10/25/33 | | | | 5,396 | | | | 5,340,352 | |
Series 2003-08, Class M1, 1 Month LIBOR + 1.080% | | | 3.590 | (c) | | | 04/25/34 | | | | 393 | | | | 393,391 | |
MASTR Asset-Backed Securities Trust, | | | | | | | | | | | | | | | | |
Series 2004-OPT02, Class A1, 1 Month LIBOR + 0.700% | | | 3.210 | (c) | | | 09/25/34 | | | | 743 | | | | 719,350 | |
Series 2004-OPT02, Class A2, 1 Month LIBOR + 0.700% | | | 3.210 | (c) | | | 09/25/34 | | | | 166 | | | | 158,411 | |
Series 2004-WMC03, Class M1, 1 Month LIBOR + 0.825% | | | 3.335 | (c) | | | 10/25/34 | | | | 1,588 | | | | 1,587,611 | |
Merrill Lynch Mortgage Investors Trust, | | | | | | | | | | | | | | | | |
Series 2004-HE02, Class A1A, 1 Month LIBOR + 0.800% | | | 3.310 | (c) | | | 08/25/35 | | | | 51 | | | | 48,160 | |
Series 2004-HE02, Class M1, 1 Month LIBOR + 1.200% | | | 3.710 | (c) | | | 08/25/35 | | | | 444 | | | | 445,458 | |
Morgan Stanley ABS Capital I, Inc. Trust, | | | | | | | | | | | | | | | | |
Series 2002-NC06, Class M1, 1 Month LIBOR + 1.500% | | | 4.010 | (c) | | | 11/25/32 | | | | 296 | | | | 293,949 | |
Series 2003-HE01, Class M1, 1 Month LIBOR + 1.200% | | | 3.710 | (c) | | | 05/25/33 | | | | 1,146 | | | | 1,136,309 | |
Series 2003-NC05, Class M1, 1 Month LIBOR + 1.275% | | | 3.785 | (c) | | | 04/25/33 | | | | 1,879 | | | | 1,874,314 | |
Series 2003-NC05, Class M3, 1 Month LIBOR + 3.450% | | | 5.960 | (c) | | | 04/25/33 | | | | 88 | | | | 85,239 | |
Series 2003-NC08, Class M1, 1 Month LIBOR + 1.050% | | | 3.560 | (c) | | | 09/25/33 | | | | 1,168 | | | | 1,158,334 | |
Series 2003-NC08, Class M2, 1 Month LIBOR + 2.625% | | | 5.135 | (c) | | | 09/25/33 | | | | 45 | | | | 42,921 | |
Series 2003-NC10, Class M1, 1 Month LIBOR + 1.020% | | | 3.530 | (c) | | | 10/25/33 | | | | 208 | | | | 205,018 | |
Series 2004-HE01, Class A4, 1 Month LIBOR + 0.740% | | | 3.250 | (c) | | | 01/25/34 | | | | 1,253 | | | | 1,243,382 | |
Series 2004-HE05, Class M1, 1 Month LIBOR + 0.945% | | | 3.455 | (c) | | | 06/25/34 | | | | 747 | | | | 742,875 | |
Series 2004-HE07, Class M1, 1 Month LIBOR + 0.900% | | | 3.410 | (c) | | | 08/25/34 | | | | 3,392 | | | | 3,375,097 | |
See Notes to Financial Statements.
��
| | | | |
| Prudential Investment Portfolios 2/PGIM Core Short-Term Bond Fund | | | 25 | |
PGIM Core Short-Term Bond Fund
Schedule of Investments (continued)
as of January 31, 2019
| | | | | | | | | | | | | | | | |
| | | | |
| Description | | Interest
Rate | | | Maturity
Date | | | Principal
Amount (000)# | | | Value | |
| | | | |
ASSET-BACKED SECURITIES (Continued) | | | | | | | | | | | | | | | | |
| | | | |
Home Equity Loans (cont’d.) | | | | | | | | | | | | | | | | |
Morgan Stanley ABS Capital I, Inc. Trust, (cont’d.) | | | | | | | | | | | | | | | | |
Series 2004-HE08, Class M1, 1 Month LIBOR + 0.960% | | | 3.470 | %(c) | | | 09/25/34 | | | | 17,082 | | | $ | 17,000,445 | |
Morgan Stanley Dean Witter Capital I, Inc.,
Series 2003-NC03, Class M1, 1 Month LIBOR + 1.350% | | | 3.860 | (c) | | | 03/25/33 | | | | 462 | | | | 461,212 | |
Morgan Stanley Dean Witter Capital I, Inc. Trust, | | | | | | | | | | | | | | | | |
Series 2002-NC05, Class M1, 1 Month LIBOR + 1.410% | | | 3.920 | (c) | | | 10/25/32 | | | | 412 | | | | 410,156 | |
Series 2002-NC05, Class M2, 1 Month LIBOR + 2.400% | | | 4.910 | (c) | | | 10/25/32 | | | | 51 | | | | 51,023 | |
New Century Home Equity Loan Trust, | | | | | | | | | | | | | | | | |
Series 2003-04, Class M1, 1 Month LIBOR + 1.125% | | | 3.635 | (c) | | | 10/25/33 | | | | 3,266 | | | | 3,264,134 | |
Series 2003-06, Class M1, 1 Month LIBOR + 1.080% | | | 3.590 | (c) | | | 01/25/34 | | | | 5,303 | | | | 5,294,224 | |
Series 2004-01, Class M1, 1 Month LIBOR + 0.885% | | | 3.395 | (c) | | | 05/25/34 | | | | 3,803 | | | | 3,757,277 | |
Series 2004-03, Class M1, 1 Month LIBOR + 0.930% | | | 3.440 | (c) | | | 11/25/34 | | | | 12,059 | | | | 12,023,992 | |
Series 2004-04, Class M1, 1 Month LIBOR + 0.765% | | | 3.275 | (c) | | | 02/25/35 | | | | 10,687 | | | | 10,560,142 | |
Option One Mortgage Loan Trust,
Series 2004-01, Class M1, 1 Month LIBOR + 0.900% | | | 3.410 | (c) | | | 01/25/34 | | | | 1,274 | | | | 1,258,326 | |
Renaissance Home Equity Loan Trust,
Series 2003-01, Class A, 1 Month LIBOR + 0.860% | | | 3.370 | (c) | | | 06/25/33 | | | | 283 | | | | 275,314 | |
Residential Asset Securities Trust, | | | | | | | | | | | | | | | | |
Series 2004-KS01, Class AI5 | | | 5.721 | (cc) | | | 02/25/34 | | | | 2,130 | | | | 2,163,101 | |
Series 2004-KS05, Class AI5 | | | 4.824 | (cc) | | | 06/25/34 | | | | 7,078 | | | | 7,154,175 | |
Saxon Asset Securities Trust, | | | | | | | | | | | | | | | | |
Series 2001-03, Class M1, 1 Month LIBOR + 1.170% | | | 3.680 | (c) | | | 07/25/31 | | | | 38 | | | | 37,524 | |
Series 2003-03, Class M2, 1 Month LIBOR + 2.400% | | | 4.413 | (c) | | | 12/25/33 | | | | 59 | | | | 53,807 | |
Securitized Asset-Backed Receivables LLC Trust,
Series 2004-NC01, Class M1, 1 Month LIBOR + 0.780% | | | 3.290 | (c) | | | 02/25/34 | | | | 2,961 | | | | 2,956,012 | |
Specialty Underwriting & Residential Finance Trust,
Series 2004-BC01, Class M1, 1 Month LIBOR + 0.765% | | | 3.275 | (c) | | | 02/25/35 | | | | 1,736 | | | | 1,728,806 | |
| | | | | | | | | | | | | | | | |
| | | | | | | | | | | | | | | 147,756,044 | |
See Notes to Financial Statements.
| | | | | | | | | | | | | | | | |
| | | | |
| Description | | Interest
Rate | | | Maturity
Date | | | Principal
Amount (000)# | | | Value | |
| | | | |
ASSET-BACKED SECURITIES (Continued) | | | | | | | | | | | | | | | | |
| | | | |
Residential Mortgage-Backed Securities 1.8% | | | | | | | | | | | | | | | | |
Ameriquest Mortgage Securities, Inc., Asset-Backed Pass-Through Certificates, | | | | | | | | | | | | | | | | |
Series 2004-R05, Class M1, 1 Month LIBOR + 0.870% | | | 3.380 | %(c) | | | 07/25/34 | | | | 565 | | | $ | 564,270 | |
Series 2005-R09, Class AF5 | | | 5.818 | (cc) | | | 11/25/35 | | | | 678 | | | | 680,204 | |
Amortizing Residential Collateral Trust,
Series 2002-BC05, Class M2, 1 Month LIBOR + 1.800% | | | 4.310 | (c) | | | 07/25/32 | | | | 80 | | | | 78,966 | |
Chase Funding Trust, | | | | | | | | | | | | | | | | |
Series 2002-02, Class 2A1, 1 Month LIBOR + 0.500% | | | 3.010 | (c) | | | 05/25/32 | | | | 404 | | | | 393,119 | |
Series 2003-01, Class 2A2, 1 Month LIBOR + 0.660% | | | 3.170 | (c) | | | 11/25/32 | | | | 450 | | | | 445,535 | |
Countrywide Asset-Backed Certificates, | | | | | | | | | | | | | | | | |
Series 2003-BC04, Class M1, 1 Month LIBOR + 1.050% | | | 3.560 | (c) | | | 07/25/33 | | | | 195 | | | | 193,876 | |
Series 2004-ECC01, Class M1, 1 Month LIBOR + 0.945% | | | 3.455 | (c) | | | 11/25/34 | | | | 2,581 | | | | 2,530,529 | |
Credit-Based Asset Servicing & Securitization LLC,
Series 2003-CB05, Class M1, 1 Month LIBOR + 1.020% | | | 3.530 | (c) | | | 11/25/33 | | | | 679 | | | | 661,475 | |
CWABS, Inc., Asset-Backed Certificates,
Series 2004-01, Class M1, 1 Month LIBOR + 0.750% | | | 3.260 | (c) | | | 03/25/34 | | | | 442 | | | | 443,098 | |
Equity One Mortgage Pass-Through Trust,
Series 2003-01, Class M1 | | | 4.860 | (cc) | | | 08/25/33 | | | | 85 | | | | 85,912 | |
Finance America Mortgage Loan Trust,
Series 2004-03, Class M1, 1 Month LIBOR + 0.870% | | | 3.380 | (c) | | | 11/25/34 | | | | 7,524 | | | | 7,473,456 | |
First Franklin Mortgage Loan Trust,
Series 2004-FF05, Class A1, 1 Month LIBOR + 0.720% | | | 3.230 | (c) | | | 08/25/34 | | | | 219 | | | | 213,369 | |
Fremont Home Loan Trust, | | | | | | | | | | | | | | | | |
Series 2003-B, Class M1, 1 Month LIBOR + 1.050% | | | 3.560 | (c) | | | 12/25/33 | | | | 355 | | | | 347,374 | |
Series 2004-01, Class M1, 1 Month LIBOR + 0.675% | | | 3.185 | (c) | | | 02/25/34 | | | | 1,633 | | | | 1,601,210 | |
Series 2004-02, Class M1, 1 Month LIBOR + 0.855% | | | 3.365 | (c) | | | 07/25/34 | | | | 853 | | | | 847,178 | |
Series 2004-B, Class M1, 1 Month LIBOR + 0.870% | | | 3.380 | (c) | | | 05/25/34 | | | | 4,143 | | | | 4,080,436 | |
Series 2004-C, Class M1, 1 Month LIBOR + 0.975% | | | 3.485 | (c) | | | 08/25/34 | | | | 3,769 | | | | 3,742,818 | |
GSAMP Trust, | | | | | | | | | | | | | | | | |
Series 2003-FM01, Class M2, 1 Month LIBOR + 2.775% | | | 5.281 | (c) | | | 03/20/33 | | | | 64 | | | | 64,345 | |
See Notes to Financial Statements.
| | | | |
| Prudential Investment Portfolios 2/PGIM Core Short-Term Bond Fund | | | 27 | |
PGIM Core Short-Term Bond Fund
Schedule of Investments (continued)
as of January 31, 2019
| | | | | | | | | | | | | | | | |
| | | | |
| Description | | Interest
Rate | | | Maturity
Date | | | Principal
Amount (000)# | | | Value | |
| | | | |
ASSET-BACKED SECURITIES (Continued) | | | | | | | | | | | | | | | | |
| | | | |
Residential Mortgage-Backed Securities (cont’d.) | | | | | | | | | | | | | | | | |
GSAMP Trust, (cont’d.) | | | | | | | | | | | | | | | | |
Series 2004-FM01, Class M2, 1 Month LIBOR + 2.100% | | | 4.610 | %(c) | | | 11/25/33 | | | | 3 | | | $ | 2,879 | |
HSI Asset Securitization Corp. Trust,
Series 2006-OPT04, Class 2A4, 1 Month LIBOR + 0.250% | | | 2.760 | (c) | | | 03/25/36 | | | | 1,400 | | | | 1,331,469 | |
Long Beach Mortgage Loan Trust, | | | | | | | | | | | | | | | | |
Series 2003-03, Class M1, 1 Month LIBOR + 1.125% | | | 3.635 | (c) | | | 07/25/33 | | | | 1,019 | | | | 1,018,126 | |
Series 2003-04, Class M1, 1 Month LIBOR + 1.020% | | | 3.530 | (c) | | | 08/25/33 | | | | 730 | | | | 725,068 | |
Series 2004-01, Class M1, 1 Month LIBOR + 0.750% | | | 3.260 | (c) | | | 02/25/34 | | | | 10,694 | | | | 10,571,581 | |
Series 2004-02, Class M1, 1 Month LIBOR + 0.795% | | | 3.305 | (c) | | | 06/25/34 | | | | 2,803 | | | | 2,756,819 | |
Series 2004-03, Class M1, 1 Month LIBOR + 0.855% | | | 3.365 | (c) | | | 07/25/34 | | | | 2,991 | | | | 2,967,526 | |
Merrill Lynch Mortgage Investors Trust, | | | | | | | | | | | | | | | | |
Series 2003-WMC02, Class M2, 1 Month LIBOR + 2.850% | | | 5.360 | (c) | | | 02/25/34 | | | | 227 | | | | 224,316 | |
Series 2004-WMC01, Class M2, 1 Month LIBOR + 1.650% | | | 4.160 | (c) | | | 10/25/34 | | | | 985 | | | | 971,549 | |
Morgan Stanley ABS Capital I, Inc. Trust,
Series 2004-NC05, Class M1, 1 Month LIBOR + 0.900% | | | 3.410 | (c) | | | 05/25/34 | | | | 493 | | | | 486,113 | |
Popular ABS Mortgage Pass-Through Trust,
Series 2004-04, Class M1 | | | 4.313 | (cc) | | | 09/25/34 | | | | 812 | | | | 821,137 | |
Saxon Asset Securities Trust,
Series 2004-02, Class AF3 | | | 4.054 | (cc) | | | 08/25/35 | | | | 740 | | | | 744,100 | |
Specialty Underwriting & Residential Finance Trust, | | | | | | | | | | | | | | | | |
Series 2003-BC01, Class M1, 1 Month LIBOR + 1.200% | | | 3.710 | (c) | | | 01/25/34 | | | | 106 | | | | 105,887 | |
Series 2003-BC03, Class M1, 1 Month LIBOR + 0.975% | | | 3.485 | (c) | | | 08/25/34 | | | | 3,675 | | | | 3,560,499 | |
Series 2004-BC04, Class A1B, 1 Month LIBOR + 0.800% | | | 3.310 | (c) | | | 10/25/35 | | | | 618 | | | | 600,570 | |
Structured Asset Investment Loan Trust,
Series 2003-BC01, Class A2, 1 Month LIBOR + 0.680% | | | 3.190 | (c) | | | 01/25/33 | | | | 122 | | | | 120,255 | |
Structured Asset Securities Corp. Mortgage Loan Trust,
Series 2006-OW01, Class A4, 144A, 1 Month LIBOR + 0.400% | | | 2.910 | (c) | | | 12/25/35 | | | | 34 | | | | 34,045 | |
| | | | | | | | | | | | | | | | |
| | | | | | | | | | | | | | | 51,489,109 | |
See Notes to Financial Statements.
| | | | | | | | | | | | | | | | |
| | | | |
| Description | | Interest
Rate | | | Maturity
Date | | | Principal
Amount (000)# | | | Value | |
| | | | |
ASSET-BACKED SECURITIES (Continued) | | | | | | | | | | | | | | | | |
| | | | |
Student Loans 0.4% | | | | | | | | | | | | | | | | |
Navient Student Loan Trust, | | | | | | | | | | | | | | | | |
Series 2016-06A, Class A1, 144A, 1 Month LIBOR + 0.480% | | | 2.990 | %(c) | | | 03/25/66 | | | | 4 | | | $ | 3,795 | |
Series 2018-03A, Class A1, 144A, 1 Month LIBOR + 0.270% | | | 2.780 | (c) | | | 03/25/67 | | | | 5,177 | | | | 5,173,588 | |
Series 2018-04A, Class A1, 144A, 1 Month LIBOR + 0.250% | | | 2.760 | (c) | | | 06/27/67 | | | | 3,930 | | | | 3,923,784 | |
Series 2019-01A, Class A1, 144A, 1 Month LIBOR + 0.330% | | | 2.838 | (c) | | | 12/27/67 | | | | 4,200 | | | | 4,200,000 | |
| | | | | | | | | | | | | | | | |
| | | | | | | | | | | | | | | 13,301,167 | |
| | | | | | | | | | | | | | | | |
TOTAL ASSET-BACKED SECURITIES
(cost $526,915,071) | | | | | | | | | | | | | | | 557,155,278 | |
| | | | | | | | | | | | | | | | |
| | | | |
CERTIFICATES OF DEPOSIT 0.7% | | | | | | | | | | | | | | | | |
Nordea Bank Abp, 3 Month LIBOR + 0.300% | | | 3.051 | (c) | | | 06/05/20 | | | | 9,500 | | | | 9,509,822 | |
Nordea Bank Abp, 3 Month LIBOR + 0.300% | | | 3.076 | (c) | | | 06/12/20 | | | | 10,000 | | | | 9,999,994 | |
| | | | | | | | | | | | | | | | |
TOTAL CERTIFICATES OF DEPOSIT
(cost $19,500,000) | | | | | | | | | | | | | | | 19,509,816 | |
| | | | | | | | | | | | | | | | |
| | | | |
COMMERCIAL MORTGAGE-BACKED SECURITIES 15.3% | | | | | | | | | | | | | | | | |
BANK,
Series 2017-BNK05, Class A1 | | | 1.909 | | | | 06/15/60 | | | | 1,625 | | | | 1,598,290 | |
BX Commercial Mortgage Trust,
Series 2018-BIOA, Class A, 144A, 1 Month LIBOR + 0.671% | | | 3.180 | (c) | | | 03/15/37 | | | | 35,000 | | | | 34,495,461 | |
CAMB Commercial Mortgage Trust,
Series 2019-LIFE, Class A, 144A, 1 Month LIBOR + 1.070% (Cap N/A, Floor 1.070%) | | | 3.570 | (c) | | | 12/15/37 | | | | 9,500 | | | | 9,503,865 | |
CD Mortgage Trust,
Series 2017-CD06, Class A1 | | | 2.168 | | | | 11/13/50 | | | | 3,485 | | | | 3,441,113 | |
CGDBB Commercial Mortgage Trust,
Series 2017-BIOC, Class A, 144A, 1 Month LIBOR + 0.790% (Cap N/A, Floor 0.750%) | | | 3.299 | (c) | | | 07/15/32 | | | | 5,000 | | | | 4,971,762 | |
Citigroup Commercial Mortgage Trust, | | | | | | | | | | | | | | | | |
Series 2015-GC27, Class A1 | | | 1.353 | | | | 02/10/48 | | | | 577 | | | | 575,357 | |
See Notes to Financial Statements.
| | | | |
| Prudential Investment Portfolios 2/PGIM Core Short-Term Bond Fund | | | 29 | |
PGIM Core Short-Term Bond Fund
Schedule of Investments (continued)
as of January 31, 2019
| | | | | | | | | | | | | | | | |
| | | | |
| Description | | Interest
Rate | | | Maturity
Date | | | Principal
Amount (000)# | | | Value | |
| | | | |
COMMERCIAL MORTGAGE-BACKED SECURITIES (Continued) | | | | | | | | | | | | | | | | |
Citigroup Commercial Mortgage Trust, (cont’d.) | | | | | | | | | | | | | | | | |
Series 2016-P04, Class A2 | | | 2.450 | % | | | 07/10/49 | | | | 20,000 | | | $ | 19,766,648 | |
Cold Storage Trust,
Series 2017-ICE03, Class A, 144A, 1 Month LIBOR + 1.000% | | | 3.509 | (c) | | | 04/15/36 | | | | 45,000 | | | | 44,815,563 | |
Commercial Mortgage Trust, | | | | | | | | | | | | | | | | |
Series 2014-CR15, Class A2 | | | 2.928 | | | | 02/10/47 | | | | 1,735 | | | | 1,733,270 | |
Series 2014-UBS02, Class A2 | | | 2.820 | | | | 03/10/47 | | | | 5,395 | | | | 5,389,888 | |
Series 2014-UBS03, Class A2 | | | 2.844 | | | | 06/10/47 | | | | 2,141 | | | | 2,138,171 | |
Series 2014-UBS05, Class A2 | | | 3.031 | | | | 09/10/47 | | | | 4,891 | | | | 4,887,001 | |
Series 2015-CR25, Class A2 | | | 3.104 | | | | 08/10/48 | | | | 8,561 | | | | 8,567,420 | |
Series 2018-HCLV, Class A, 144A, 1 Month LIBOR + 1.000% (Cap N/A, Floor 1.000%) | | | 3.509 | (c) | | | 09/15/33 | | | | 31,508 | | | | 31,402,518 | |
CSAIL Commercial Mortgage Trust,
Series 2015-C01, Class A1 | | | 1.684 | | | | 04/15/50 | | | | 3,431 | | | | 3,409,845 | |
CSWF,
Series 2018-TOP, Class A, 144A, 1 Month LIBOR + 1.000% (Cap N/A, Floor 1.000%) | | | 3.509 | (c) | | | 08/15/35 | | | | 20,000 | | | | 19,918,384 | |
DBJPM Mortgage Trust, | | | | | | | | | | | | | | | | |
Series 2016-C01, Class A1 | | | 1.676 | | | | 05/10/49 | | | | 1,353 | | | | 1,333,959 | |
Series 2016-C03, Class A1 | | | 1.502 | | | | 08/10/49 | | | | 775 | | | | 760,289 | |
GE Business Loan Trust,
Series 2006-02A, Class A, 144A, 1 Month LIBOR + 0.180% | | | 2.689 | (c) | | | 11/15/34 | | | | 1,676 | | | | 1,646,633 | |
GS Mortgage Securities Trust,
Series 2018-HART, Class A, 144A, 1 Month LIBOR + 1.090% (Cap N/A, Floor 1.090%) | | | 3.599 | (c) | | | 10/15/31 | | | | 23,300 | | | | 23,306,060 | |
JP Morgan Chase Commercial Mortgage Securities Trust, | | | | | | | | | | | | | | | | |
Series 2014-C20, Class A2 | | | 2.872 | | | | 07/15/47 | | | | 8,509 | | | | 8,494,376 | |
Series 2014-C20, Class A3A2, 144A | | | 3.472 | | | | 07/15/47 | | | | 25,000 | | | | 24,976,842 | |
Series 2017-FL11, Class A, 144A, 1 Month LIBOR + 0.850% | | | 3.359 | (c) | | | 10/15/32 | | | | 9,977 | | | | 9,975,636 | |
Series 2018-WPT, Class AFL, 144A, 1 Month LIBOR + 0.950% | | | 3.463 | (c) | | | 07/05/33 | | | | 20,000 | | | | 19,924,460 | |
JPMBB Commercial Mortgage Securities Trust,
Series 2013-C15, Class ASB | | | 3.659 | | | | 11/15/45 | | | | 1,196 | | | | 1,211,011 | |
LSTAR Commercial Mortgage Trust,
Series 2017-05, Class A1, 144A | | | 2.417 | | | | 03/10/50 | | | | 3,875 | | | | 3,836,456 | |
Morgan Stanley Bank of America Merrill Lynch Trust, | | | | | | | | | | | | | | | | |
Series 2013-C07, Class A3 | | | 2.655 | | | | 02/15/46 | | | | 7,044 | | | | 6,919,964 | |
Series 2014-C17, Class A2 | | | 3.119 | | | | 08/15/47 | | | | 5,074 | | | | 5,069,235 | |
See Notes to Financial Statements.
| | | | | | | | | | | | | | | | |
| | | | |
| Description | | Interest
Rate | | | Maturity
Date | | | Principal
Amount (000)# | | | Value | |
| | | | |
COMMERCIAL MORTGAGE-BACKED SECURITIES (Continued) | | | | | | | | | | | | | | | | |
Morgan Stanley Bank of America Merrill Lynch Trust, (cont’d.) | | | | | | | | | | | | | | | | |
Series 2014-C19, Class A1 | | | 1.573 | % | | | 12/15/47 | | | | 1,468 | | | $ | 1,462,257 | |
Series 2014-C19, Class A2 | | | 3.101 | | | | 12/15/47 | | | | 5,000 | | | | 4,998,279 | |
Series 2015-C20, Class A1 | | | 1.405 | | | | 02/15/48 | | | | 814 | | | | 811,294 | |
Series 2015-C24, Class A2 | | | 3.088 | | | | 05/15/48 | | | | 5,000 | | | | 4,999,921 | |
Morgan Stanley Capital I Trust,
Series 2012-C04, Class A4 | | | 3.244 | | | | 03/15/45 | | | | 3,450 | | | | 3,448,351 | |
RETL,
Series 2018-RVP, Class A, 144A, 1 Month LIBOR + 1.100% | | | 3.609 | (c) | | | 03/15/33 | | | | 33,300 | | | | 33,006,693 | |
Starwood Retail Property Trust,
Series 2014-STAR, Class A, 144A, 1 Month LIBOR + 1.220% | | | 3.729 | (c) | | | 11/15/27 | | | | 22,467 | | | | 22,256,673 | |
UBS Commercial Mortgage Trust,
Series 2017-C01, Class A1 | | | 1.887 | | | | 06/15/50 | | | | 2,208 | | | | 2,172,963 | |
UBS-Barclays Commercial Mortgage Trust, | | | | | | | | | | | | | | | | |
Series 2012-C02, Class A4 | | | 3.525 | | | | 05/10/63 | | | | 43,642 | | | | 44,200,682 | |
Series 2012-C03, Class A3 | | | 2.728 | | | | 08/10/49 | | | | 526 | | | | 524,657 | |
Series 2012-C04, Class A3 | | | 2.533 | | | | 12/10/45 | | | | 17,836 | | | | 17,709,558 | |
Wells Fargo Commercial Mortgage Trust,
Series 2017-RC01, Class A1 | | | 2.012 | | | | 01/15/60 | | | | 1,799 | | | | 1,775,423 | |
WFRBS Commercial Mortgage Trust,
Series 2014-LC14, Class A3FL, 144A, 1 Month LIBOR + 0.750% | | | 3.258 | (c) | | | 03/15/47 | | | | 3,000 | | | | 3,004,394 | |
| | | | | | | | | | | | | | | | |
TOTAL COMMERCIAL MORTGAGE-BACKED SECURITIES
(cost $448,369,254) | | | | | | | | 444,440,622 | |
| | | | | | | | | | | | | | | | |
| | | | |
CORPORATE BONDS 48.8% | | | | | | | | | | | | | | | | |
| | | | |
Aerospace & Defense 0.6% | | | | | | | | | | | | | | | | |
General Dynamics Corp.,
Gtd. Notes, 3 Month LIBOR + 0.290% | | | 2.908 | (c) | | | 05/11/20 | | | | 4,000 | | | | 4,007,227 | |
Raytheon Co.,
Sr. Unsec’d. Notes | | | 4.400 | | | | 02/15/20 | | | | 13,640 | | | | 13,866,481 | |
| | | | | | | | | | | | | | | | |
| | | | | | | | | | | | | | | 17,873,708 | |
| | | | |
Agriculture 0.0% | | | | | | | | | | | | | | | | |
Philip Morris International, Inc.,
Sr. Unsec’d. Notes, 3 Month LIBOR + 0.420% | | | 3.066 | (c) | | | 02/21/20 | | | | 356 | | | | 355,998 | |
See Notes to Financial Statements.
| | | | |
| Prudential Investment Portfolios 2/PGIM Core Short-Term Bond Fund | | | 31 | |
PGIM Core Short-Term Bond Fund
Schedule of Investments (continued)
as of January 31, 2019
| | | | | | | | | | | | | | | | |
| | | | |
| Description | | Interest
Rate | | | Maturity
Date | | | Principal
Amount (000)# | | | Value | |
| | | | |
CORPORATE BONDS (Continued) | | | | | | | | | | | | | | | | |
| | | | |
Auto Manufacturers 6.1% | | | | | | | | | | | | | | | | |
American Honda Finance Corp., | | | | | | | | | | | | | | | | |
Sr. Unsec’d. Notes, MTN, 3 Month LIBOR + 0.150% | | | 2.768 | %(c) | | | 11/13/19 | | | | 5,000 | | | $ | 4,999,606 | |
Sr. Unsec’d. Notes, MTN, 3 Month LIBOR + 0.340% | | | 2.954 | (c) | | | 02/14/20 | | | | 26,000 | | | | 26,039,464 | |
BMW US Capital LLC (Germany), | | | | | | | | | | | | | | | | |
Gtd. Notes, 144A | | | 1.500 | | | | 04/11/19 | | | | 24,000 | | | | 23,945,430 | |
Gtd. Notes, 144A, 3 Month LIBOR + 0.370% | | | 2.984 | (c) | | | 08/14/20 | | | | 5,000 | | | | 4,977,958 | |
Daimler Finance North America LLC (Germany), | | | | | | | | | | | | | | | | |
Gtd. Notes, 144A, 3 Month LIBOR + 0.530% | | | 3.112 | (c) | | | 05/05/20 | | | | 15,000 | | | | 14,956,290 | |
Gtd. Notes, 144A, 3 Month LIBOR + 0.630% | | | 3.425 | (c) | | | 01/06/20 | | | | 9,300 | | | | 9,297,864 | |
Ford Motor Credit Co. LLC,
Sr. Unsec’d. Notes, 3 Month LIBOR + 0.830% | | | 3.606 | (c) | | | 03/12/19 | | | | 4,735 | | | | 4,735,805 | |
Harley-Davidson Financial Services, Inc., | | | | | | | | | | | | | | | | |
Gtd. Notes, 144A, 3 Month LIBOR + 0.500% | | | 3.146 | (c) | | | 05/21/20 | | | | 9,750 | | | | 9,750,780 | |
Gtd. Notes, 144A, MTN | | | 2.400 | | | | 09/15/19 | | | | 6,520 | | | | 6,475,267 | |
Nissan Motor Acceptance Corp.,
Sr. Unsec’d. Notes, 144A, MTN, 3 Month LIBOR + 0.390% | | | 3.187 | (c) | | | 07/13/20 | | | | 2,400 | | | | 2,389,671 | |
Toyota Motor Credit Corp., | | | | | | | | | | | | | | | | |
Sr. Unsec’d. Notes, MTN, 3 Month LIBOR + 0.060% | | | 2.676 | (c) | | | 05/15/19 | | | | 10,000 | | | | 9,999,973 | |
Sr. Unsec’d. Notes, MTN, 3 Month LIBOR + 0.280% | | | 3.077 | (c) | | | 04/13/21 | | | | 10,000 | | | | 9,991,872 | |
Sr. Unsec’d. Notes, MTN, 3 Month LIBOR + 0.820% | | | 3.460 | (c) | | | 02/19/19 | | | | 20,000 | | | | 20,007,415 | |
Volkswagen Group of America Finance LLC (Germany),
Gtd. Notes, 144A, 3 Month LIBOR + 0.770% | | | 3.388 | (c) | | | 11/13/20 | | | | 30,000 | | | | 29,989,320 | |
| | | | | | | | | | | | | | | | |
| | | | | | | | | | | | | | | 177,556,715 | |
| | | | |
Banks 15.3% | | | | | | | | | | | | | | | | |
Australia & New Zealand Banking Group Ltd.
(Australia), | | | | | | | | | | | | | | | | |
Sr. Unsec’d. Notes, 144A, MTN, 3 Month LIBOR + 0.320% | | | 2.921 | (c) | | | 11/09/20 | | | | 600 | | | | 599,632 | |
Sr. Unsec’d. Notes, 144A, MTN, 3 Month LIBOR + 0.320% | | | 3.117 | (c) | | | 07/02/20 | | | | 25,000 | | | | 25,053,906 | |
Bank of Montreal (Canada), | | | | | | | | | | | | | | | | |
Sr. Unsec’d. Notes, MTN, 3 Month LIBOR + 0.250% | | | 3.021 | (c) | | | 09/11/19 | | | | 25,000 | | | | 25,013,250 | |
Sr. Unsec’d. Notes, Series D, MTN, 3 Month LIBOR + 0.460% | | | 3.257 | (c) | | | 04/13/21 | | | | 7,500 | | | | 7,511,175 | |
Branch Banking & Trust Co.,
Sr. Unsec’d. Notes | | | 1.450 | | | | 05/10/19 | | | | 26,000 | | | | 25,915,182 | |
See Notes to Financial Statements.
| | | | | | | | | | | | | | | | |
| | | | |
| Description | | Interest
Rate | | | Maturity
Date | | | Principal
Amount (000)# | | | Value | |
| | | | |
CORPORATE BONDS (Continued) | | | | | | | | | | | | | | | | |
| | | | |
Banks (cont’d.) | | | | | | | | | | | | | | | | |
Capital One NA, | | | | | | | | | | | | | | | | |
Sr. Unsec’d. Notes | | | 1.850 | % | | | 09/13/19 | | | | 24,500 | | | $ | 24,347,557 | |
Sr. Unsec’d. Notes | | | 2.350 | | | | 01/31/20 | | | | 5,905 | | | | 5,867,503 | |
Citibank NA, | | | | | | | | | | | | | | | | |
Sr. Unsec’d. Notes, 3 Month LIBOR + 0.320% | | | 3.056 | (c) | | | 05/01/20 | | | | 20,000 | | | | 19,995,113 | |
Sr. Unsec’d. Notes, 3 Month LIBOR + 0.260% | | | 3.061 | (c) | | | 09/18/19 | | | | 699 | | | | 699,934 | |
Citigroup, Inc., | | | | | | | | | | | | | | | | |
Sr. Unsec’d. Notes, 3 Month LIBOR + 0.790% | | | 3.573 | (c) | | | 01/10/20 | | | | 2,259 | | | | 2,270,228 | |
Sr. Unsec’d. Notes, 3 Month LIBOR + 0.930% | | | 3.696 | (c) | | | 06/07/19 | | | | 10,000 | | | | 10,029,108 | |
Commonwealth Bank of Australia (Australia),
Sr. Unsec’d. Notes, 144A, MTN, 3 Month LIBOR + 0.320% | | | 3.142 | (c) | | | 06/25/20 | | | | 16,000 | | | | 16,008,548 | |
Goldman Sachs Group, Inc. (The),
Sr. Unsec’d. Notes, 3 Month LIBOR + 1.040% | | | 3.811 | (c) | | | 04/25/19 | | | | 25,000 | | | | 25,030,313 | |
Morgan Stanley, | | | | | | | | | | | | | | | | |
Sr. Unsec’d. Notes, GMTN | | | 2.375 | | | | 07/23/19 | | | | 10,000 | | | | 9,982,336 | |
Sr. Unsec’d. Notes, MTN, 3 Month LIBOR + 0.740% | | | 3.512 | (c) | | | 07/23/19 | | | | 1,900 | | | | 1,904,610 | |
Sr. Unsec’d. Notes, MTN | | | 5.625 | | | | 09/23/19 | | | | 24,500 | | | | 24,922,952 | |
National Australia Bank Ltd. (Australia),
Sr. Unsec’d. Notes, 144A, MTN, 3 Month LIBOR + 0.510% | | | 3.187 | (c) | | | 05/22/20 | | | | 40,000 | | | | 40,153,600 | |
PNC Bank NA, | | | | | | | | | | | | | | | | |
Sr. Unsec’d. Notes, 3 Month LIBOR + 0.360% | | | 3.000 | (c) | | | 05/19/20 | | | | 25,000 | | | | 25,031,522 | |
Sr. Unsec’d. Notes, 3 Month LIBOR + 0.250% | | | 3.011 | (c) | | | 01/22/21 | | | | 5,540 | | | | 5,513,568 | |
Royal Bank of Canada (Canada), | | | | | | | | | | | | | | | | |
Sr. Unsec’d. Notes, GMTN, 3 Month LIBOR + 0.380% | | | 3.118 | (c) | | | 03/02/20 | | | | 30,000 | | | | 30,063,093 | |
Sr. Unsec’d. Notes, GMTN, 3 Month LIBOR + 0.390% | | | 3.141 | (c) | | | 04/30/21 | | | | 10,000 | | | | 10,003,040 | |
Santander UK PLC (United Kingdom), | | | | | | | | | | | | | | | | |
Sr. Unsec’d. Notes, 3 Month LIBOR + 0.660% | | | 3.276 | (c) | | | 11/15/21 | | | | 29,000 | | | | 28,831,827 | |
Sr. Unsec’d. Notes, 3 Month LIBOR + 1.480% | | | 4.258 | (c) | | | 03/14/19 | | | | 25,000 | | | | 25,032,135 | |
Skandinaviska Enskilda Banken AB (Sweden),
Sr. Unsec’d. Notes | | | 1.500 | | | | 09/13/19 | | | | 10,500 | | | | 10,411,482 | |
Toronto-Dominion Bank (The) (Canada),
Sr. Unsec’d. Notes, MTN, 3 Month LIBOR + 0.280% | | | 3.051 | (c) | | | 06/11/20 | | | | 20,000 | | | | 19,979,873 | |
US Bank NA, | | | | | | | | | | | | | | | | |
Sr. Unsec’d. Notes, 3 Month LIBOR + 0.250% | | | 3.029 | (c) | | | 07/24/20 | | | | 12,000 | | | | 12,005,244 | |
Sr. Unsec’d. Notes, 3 Month LIBOR + 0.320% | | | 3.085 | (c) | | | 04/26/21 | | | | 13,000 | | | | 12,997,387 | |
| | | | | | | | | | | | | | | | |
| | | | | | | | | | | | | | | 445,174,118 | |
See Notes to Financial Statements.
| | | | |
| Prudential Investment Portfolios 2/PGIM Core Short-Term Bond Fund | | | 33 | |
PGIM Core Short-Term Bond Fund
Schedule of Investments (continued)
as of January 31, 2019
| | | | | | | | | | | | | | | | |
| | | | |
| Description | | Interest
Rate | | | Maturity
Date | | | Principal
Amount (000)# | | | Value | |
| | | | |
CORPORATE BONDS (Continued) | | | | | | | | | | | | | | | | |
| | | | |
Beverages 0.4% | | | | | | | | | | | | | | | | |
Anheuser-Busch InBev Finance, Inc. (Belgium),
Gtd. Notes | | | 2.650 | % | | | 02/01/21 | | | | 2,338 | | | $ | 2,328,398 | |
PepsiCo, Inc.,
Sr. Unsec’d. Notes, 3 Month LIBOR + 0.590% | | | 3.267 | (c) | | | 02/22/19 | | | | 10,000 | | | | 10,003,558 | |
| | | | | | | | | | | | | | | | |
| | | | | | | | | | | | | | | 12,331,956 | |
| | | | |
Biotechnology 1.7% | | | | | | | | | | | | | | | | |
Amgen, Inc., | | | | | | | | | | | | | | | | |
Sr. Unsec’d. Notes | | | 1.900 | | | | 05/10/19 | | | | 20,000 | | | | 19,946,294 | |
Sr. Unsec’d. Notes, 3 Month LIBOR + 0.320% | | | 2.935 | (c) | | | 05/10/19 | | | | 30,000 | | | | 30,016,871 | |
| | | | | | | | | | | | | | | | |
| | | | | | | | | | | | | | | 49,963,165 | |
| | | | |
Chemicals 0.3% | | | | | | | | | | | | | | | | |
Chevron Phillips Chemical Co. LLC/Chevron Phillips Chemical Co. LP,
Sr. Unsec’d. Notes, 144A, 3 Month LIBOR + 0.750% | | | 3.486 | (c) | | | 05/01/20 | | | | 700 | | | | 701,437 | |
DowDuPont, Inc.,
Sr. Unsec’d. Notes, 3 Month LIBOR + 0.710% | | | 3.417 | (c) | | | 11/15/20 | | | | 8,500 | | | | 8,544,684 | |
EI du Pont de Nemours & Co.,
Sr. Unsec’d. Notes, 3 Month LIBOR + 0.530% | | | 3.266 | (c) | | | 05/01/20 | | | | 460 | | | | 461,300 | |
| | | | | | | | | | | | | | | | |
| | | | | | | | | | | | | | | 9,707,421 | |
| | | | |
Computers 3.2% | | | | | | | | | | | | | | | | |
Apple, Inc., | | | | | | | | | | | | | | | | |
Sr. Unsec’d. Notes | | | 1.500 | | | | 09/12/19 | | | | 25,000 | | | | 24,834,761 | |
Sr. Unsec’d. Notes, 3 Month LIBOR + 0.820% | | | 3.497 | (c) | | | 02/22/19 | | | | 10,000 | | | | 10,004,898 | |
Sr. Unsec’d. Notes, 3 Month LIBOR + 1.130% | | | 3.807 | (c) | | | 02/23/21 | | | | 6,524 | | | | 6,648,475 | |
Hewlett Packard Enterprise Co.,
Sr. Unsec’d. Notes, 144A | | | 2.100 | | | | 10/04/19 | | | | 28,000 | | | | 27,821,346 | |
IBM Credit LLC,
Sr. Unsec’d. Notes | | | 1.625 | | | | 09/06/19 | | | | 25,000 | | | | 24,848,469 | |
| | | | | | | | | | | | | | | | |
| | | | | | | | | | | | | | | 94,157,949 | |
|
Cosmetics/Personal Care 0.7% | |
Unilever Capital Corp. (United Kingdom),
Gtd. Notes | | | 1.800 | | | | 05/05/20 | | | | 20,000 | | | | 19,755,169 | |
See Notes to Financial Statements.
| | | | | | | | | | | | | | | | |
| | | | |
| Description | | Interest
Rate | | | Maturity
Date | | | Principal
Amount (000)# | | | Value | |
| | | | |
CORPORATE BONDS (Continued) | | | | | | | | | | | | | | | | |
| | | | |
Diversified Financial Services 1.3% | | | | | | | | | | | | | | | | |
American Express Credit Corp.,
Sr. Unsec’d. Notes, MTN, 3 Month LIBOR + 0.730% | | | 3.419 | %(c) | | | 05/26/20 | | | | 1,000 | | | $ | 1,005,600 | |
Charles Schwab Corp. (The),
Sr. Unsec’d. Notes, 3 Month LIBOR + 0.320% | | | 2.966 | (c) | | | 05/21/21 | | | | 10,500 | | | | 10,477,320 | |
Lehman Brothers Holdings, Inc.,
Sr. Unsec’d. Notes, MTN(d) | | | 3.000 | | | | 05/25/10 | | | | 50,000 | | | | 985,000 | |
Western Union Co. (The),
Sr. Unsec’d. Notes, 3 Month LIBOR + 0.800% | | | 3.453 | (c) | | | 05/22/19 | | | | 25,500 | | | | 25,517,284 | |
| | | | | | | | | | | | | | | | |
| | | | | | | | | | | | | | | 37,985,204 | |
| | | | |
Electric 1.9% | | | | | | | | | | | | | | | | |
American Electric Power Co., Inc.,
Sr. Unsec’d. Notes | | | 2.150 | | | | 11/13/20 | | | | 25,000 | | | | 24,598,991 | |
CenterPoint Energy, Inc.,
Sr. Unsec’d. Notes | | | 3.600 | | | | 11/01/21 | | | | 9,250 | | | | 9,326,020 | |
Georgia Power Co.,
Sr. Unsec’d. Notes | | | 2.000 | | | | 03/30/20 | | | | 20,000 | | | | 19,758,477 | |
| | | | | | | | | | | | | | | | |
| | | | | | | | | | | | | | | 53,683,488 | |
| | | | |
Electronics 0.2% | | | | | | | | | | | | | | | | |
Tyco Electronics Group SA (Switzerland),
Gtd. Notes, 3 Month LIBOR + 0.450% | | | 3.201 | (c) | | | 06/05/20 | | | | 6,800 | | | | 6,793,102 | |
| | | | |
Foods 1.0% | | | | | | | | | | | | | | | | |
Campbell Soup Co.,
Sr. Unsec’d. Notes, 3 Month LIBOR + 0.500% | | | 3.288 | (c) | | | 03/16/20 | | | | 9,600 | | | | 9,548,387 | |
General Mills, Inc.,
Sr. Unsec’d. Notes, 3 Month LIBOR + 0.540% | | | 3.319 | (c) | | | 04/16/21 | | | | 4,600 | | | | 4,564,600 | |
Kellogg Co.,
Sr. Unsec’d. Notes | | | 3.250 | | | | 05/14/21 | | | | 9,650 | | | | 9,603,569 | |
Mondelez International Holdings Netherlands BV,
Gtd. Notes, 144A, 3 Month LIBOR + 0.610% | | | 3.375 | (c) | | | 10/28/19 | | | | 3,000 | | | | 3,003,755 | |
Tyson Foods, Inc.,
Sr. Unsec’d. Notes, 3 Month LIBOR + 0.550% | | | 3.288 | (c) | | | 06/02/20 | | | | 1,460 | | | | 1,455,039 | |
| | | | | | | | | | | | | | | | |
| | | | | | | | | | | | | | | 28,175,350 | |
See Notes to Financial Statements.
| | | | |
| Prudential Investment Portfolios 2/PGIM Core Short-Term Bond Fund | | | 35 | |
PGIM Core Short-Term Bond Fund
Schedule of Investments (continued)
as of January 31, 2019
| | | | | | | | | | | | | | | | |
| | | | |
| Description | | Interest
Rate | | | Maturity
Date | | | Principal
Amount (000)# | | | Value | |
| | | | |
CORPORATE BONDS (Continued) | | | | | | | | | | | | | | | | |
| | | | |
Healthcare-Products 0.1% | | | | | | | | | | | | | | | | |
Medtronic, Inc.,
Gtd. Notes, 3 Month LIBOR + 0.800% | | | 3.588 | %(c) | | | 03/15/20 | | | | 1,200 | | | $ | 1,208,727 | |
Stryker Corp.,
Sr. Unsec’d. Notes | | | 2.000 | | | | 03/08/19 | | | | 1,350 | | | | 1,349,392 | |
| | | | | | | | | | | | | | | | |
| | | | | | | | | | | | | | | 2,558,119 | |
| | | | |
Healthcare-Services 0.6% | | | | | | | | | | | | | | | | |
Aetna, Inc.,
Sr. Unsec’d. Notes | | | 2.200 | | | | 03/15/19 | | | | 2,000 | | | | 1,998,989 | |
Anthem, Inc.,
Sr. Unsec’d. Notes | | | 2.500 | | | | 11/21/20 | | | | 15,000 | | | | 14,848,332 | |
| | | | | | | | | | | | | | | | |
| | | | | | | | | | | | | | | 16,847,321 | |
| | | | |
Insurance 4.8% | | | | | | | | | | | | | | | | |
AIA Group Ltd. (Hong Kong),
Sr. Unsec’d. Notes, 144A, 3 Month LIBOR + 0.520% | | | 3.312 | (c) | | | 09/20/21 | | | | 24,400 | | | | 24,304,573 | |
Ambac Assurance Corp.,
Sub. Notes, 144A | | | 5.100 | | | | 06/07/20 | | | | 11 | | | | 14,318 | |
Marsh & McLennan Cos., Inc.,
Sr. Unsec’d. Notes | | | 2.350 | | | | 09/10/19 | | | | 2,184 | | | | 2,175,355 | |
MassMutual Global Funding II,
Sr. Sec’d. Notes, 144A, MTN | | | 2.350 | | | | 04/09/19 | | | | 11,600 | | | | 11,594,162 | |
Metropolitan Life Global Funding I, | | | | | | | | | | | | | | | | |
Sec’d. Notes, 144A | | | 3.450 | | | | 10/09/21 | | | | 19,250 | | | | 19,364,138 | |
Sec’d. Notes, 144A, MTN | | | 3.375 | | | | 01/11/22 | | | | 23,750 | | | | 23,879,144 | |
New York Life Global Funding,
Sec’d. Notes, 144A, 3 Month LIBOR + 0.320% | | | 2.912 | (c) | | | 08/06/21 | | | | 5,500 | | | | 5,491,875 | |
Principal Life Global Funding II, | | | | | | | | | | | | | | | | |
Sec’d. Notes, 144A, 3 Month LIBOR + 0.300% | | | 3.122 | (c) | | | 06/26/20 | | | | 24,600 | | | | 24,500,054 | |
Sr. Sec’d. Notes, 144A | | | 2.625 | | | | 11/19/20 | | | | 500 | | | | 497,009 | |
Protective Life Global Funding, | | | | | | | | | | | | | | | | |
Sec’d. Notes, 144A | | | 2.262 | | | | 04/08/20 | | | | 1,140 | | | | 1,130,656 | |
Sr. Sec’d. Notes, 144A | | | 1.722 | | | | 04/15/19 | | | | 26,600 | | | | 26,543,131 | |
| | | | | | | | | | | | | | | | |
| | | | | | | | | | | | | | | 139,494,415 | |
See Notes to Financial Statements.
| | | | | | | | | | | | | | | | |
| | | | |
| Description | | Interest
Rate | | | Maturity
Date | | | Principal
Amount (000)# | | | Value | |
| | | | |
CORPORATE BONDS (Continued) | | | | | | | | | | | | | | | | |
| | | | |
Lodging 0.3% | | | | | | | | | | | | | | | | |
Marriott International, Inc.,
Sr. Unsec’d. Notes, Series Y, 3 Month LIBOR + 0.600% | | | 3.229 | %(c) | | | 12/01/20 | | | | 8,000 | | | $ | 7,981,654 | |
| | | | |
Machinery-Construction & Mining 0.8% | | | | | | | | | | | | | | | | |
Caterpillar Financial Services Corp., | | | | | | | | | | | | | | | | |
Sr. Unsec’d. Notes, GMTN, 3 Month LIBOR + 0.290% | | | 3.026 | (c) | | | 09/04/20 | | | | 14,000 | | | | 13,987,025 | |
Sr. Unsec’d. Notes, MTN, 3 Month LIBOR + 0.350% | | | 3.116 | (c) | | | 12/07/20 | | | | 9,600 | | | | 9,602,105 | |
| | | | | | | | | | | | | | | | |
| | | | | | | | | | | | | | | 23,589,130 | |
| | | | |
Machinery-Diversified 0.4% | | | | | | | | | | | | | | | | |
John Deere Capital Corp.,
Sr. Unsec’d. Notes, MTN, 3 Month LIBOR + 0.260% | | | 3.027 | (c) | | | 09/10/21 | | | | 10,600 | | | | 10,559,762 | |
| | | | |
Media 2.0% | | | | | | | | | | | | | | | | |
Comcast Corp.,
Gtd. Notes, 3 Month LIBOR + 0.330% | | | 3.127 | (c) | | | 10/01/20 | | | | 35,000 | | | | 35,037,542 | |
Walt Disney Co. (The),
Sr. Unsec’d. Notes, MTN, 3 Month LIBOR + 0.130% | | | 2.866 | (c) | | | 03/04/20 | | | | 23,000 | | | | 22,992,039 | |
| | | | | | | | | | | | | | | | |
| | | | | | | | | | | | | | | 58,029,581 | |
| | | | |
Mining 0.8% | | | | | | | | | | | | | | | | |
Barrick PD Australia Finance Pty Ltd. (Canada),
Gtd. Notes | | | 4.950 | | | | 01/15/20 | | | | 18,967 | | | | 19,304,135 | |
Glencore Funding LLC (Switzerland),
Gtd. Notes, 144A | | | 3.125 | | | | 04/29/19 | | | | 5,275 | | | | 5,260,705 | |
| | | | | | | | | | | | | | | | |
| | | | | | | | | | | | | | | 24,564,840 | |
| | | | |
Miscellaneous Manufacturing 0.9% | | | | | | | | | | | | | | | | |
Siemens Financieringsmaatschappij NV (Germany),
Gtd. Notes, 144A, 3 Month LIBOR + 0.340% | | | 3.128 | (c) | | | 03/16/20 | | | | 25,000 | | | | 25,017,488 | |
| | | | |
Oil & Gas 2.0% | | | | | | | | | | | | | | | | |
Chevron Corp.,
Sr. Unsec’d. Notes, 3 Month LIBOR + 0.210% | | | 2.948 | (c) | | | 03/03/20 | | | | 24,000 | | | | 24,023,431 | |
EOG Resources, Inc., | | | | | | | | | | | | | | | | |
Sr. Unsec’d. Notes | | | 2.450 | | | | 04/01/20 | | | | 725 | | | | 720,909 | |
See Notes to Financial Statements.
| | | | |
| Prudential Investment Portfolios 2/PGIM Core Short-Term Bond Fund | | | 37 | |
PGIM Core Short-Term Bond Fund
Schedule of Investments (continued)
as of January 31, 2019
| | | | | | | | | | | | | | | | |
| | | | |
| Description | | Interest
Rate | | | Maturity
Date | | | Principal
Amount (000)# | | | Value | |
| | | | |
CORPORATE BONDS (Continued) | | | | | | | | | | | | | | | | |
| | | | |
Oil & Gas (cont’d.) | | | | | | | | | | | | | | | | |
EOG Resources, Inc., (cont’d.) | | | | | | | | | | | | | | | | |
Sr. Unsec’d. Notes | | | 5.625 | % | | | 06/01/19 | | | | 8,144 | | | $ | 8,209,326 | |
Shell International Finance BV (Netherlands),
Gtd. Notes | | | 1.375 | | | | 05/10/19 | | | | 25,000 | | | | 24,921,468 | |
| | | | | | | | | | | | | | | | |
| | | | | | | | | | | | | | | 57,875,134 | |
| | | | |
Oil & Gas Services 0.0% | | | | | | | | | | | | | | | | |
Schlumberger Holdings Corp.,
Sr. Unsec’d. Notes, 144A | | | 3.000 | | | | 12/21/20 | | | | 875 | | | | 870,707 | |
| | | | |
Pharmaceuticals 1.2% | | | | | | | | | | | | | | | | |
Bristol-Myers Squibb Co.,
Sr. Unsec’d. Notes | | | 1.600 | | | | 02/27/19 | | | | 16,800 | | | | 16,794,583 | |
CVS Health Corp.,
Sr. Unsec’d. Notes | | | 2.250 | | | | 08/12/19 | | | | 1,650 | | | | 1,644,576 | |
Pfizer, Inc.,
Sr. Unsec’d. Notes | | | 5.200 | | | | 08/12/20 | | | | 7,313 | | | | 7,581,604 | |
Takeda Pharmaceutical Co. Ltd. (Japan),
Sr. Unsec’d. Notes, 144A | | | 3.800 | | | | 11/26/20 | | | | 9,000 | | | | 9,093,981 | |
| | | | | | | | | | | | | | | | |
| | | | | | | | | | | | | | | 35,114,744 | |
| | | | |
Pipelines 1.0% | | | | | | | | | | | | | | | | |
Enterprise Products Operating LLC,
Gtd. Notes | | | 3.500 | | | | 02/01/22 | | | | 29,250 | | | | 29,532,463 | |
| | | | |
Retail 0.5% | | | | | | | | | | | | | | | | |
McDonald’s Corp.,
Sr. Unsec’d. Notes, MTN, 3 Month LIBOR + 0.430% | | | 3.195 | (c) | | | 10/28/21 | | | | 3,100 | | | | 3,083,045 | |
Walmart, Inc.,
Sr. Unsec’d. Notes | | | 3.125 | | | | 06/23/21 | | | | 11,717 | | | | 11,843,262 | |
| | | | | | | | | | | | | | | | |
| | | | | | | | | | | | | | | 14,926,307 | |
See Notes to Financial Statements.
| | | | | | | | | | | | | | | | |
| | | | |
| Description | | Interest
Rate | | | Maturity
Date | | | Principal
Amount (000)# | | | Value | |
| | | | |
CORPORATE BONDS (Continued) | | | | | | | | | | | | | | | | |
| | | | |
Telecommunications 0.0% | | | | | | | | | | | | | | | | |
AT&T, Inc.,
Sr. Unsec’d. Notes | | | 2.300 | % | | | 03/11/19 | | | | 133 | | | $ | 132,963 | |
Verizon Communications, Inc.,
Sr. Unsec’d. Notes, 3 Month LIBOR + 0.550% (Cap N/A, Floor 0.000%) | | | 3.203 | (c) | | | 05/22/20 | | | | 800 | | | | 802,608 | |
| | | | | | | | | | | | | | | | |
| | | | | | | | | | | | | | | 935,571 | |
| | | | |
Transportation 0.0% | | | | | | | | | | | | | | | | |
Ryder System, Inc.,
Sr. Unsec’d. Notes, MTN | | | 2.500 | | | | 05/11/20 | | | | 200 | | | | 198,117 | |
| | | | |
Trucking & Leasing 0.7% | | | | | | | | | | | | | | | | |
Aviation Capital Group LLC,
Sr. Unsec’d. Notes, 144A, 3 Month LIBOR + 0.950% | | | 3.688 | (c) | | | 06/01/21 | | | | 19,000 | | | | 18,897,824 | |
| | | | | | | | | | | | | | | | |
TOTAL CORPORATE BONDS
(cost $1,457,045,212) | | | | | | | | | | | | | | | 1,420,506,520 | |
| | | | | | | | | | | | | | | | |
TOTAL LONG-TERM INVESTMENTS
(cost $2,451,829,537) | | | | | | | | | | | | | | | 2,441,612,236 | |
| | | | | | | | | | | | | | | | |
| | | | |
| | | | | | | | | Shares | | | | |
| | | | |
SHORT-TERM INVESTMENTS 16.2% | | | | | | | | | | | | | | | | |
| | | | |
AFFILIATED MUTUAL FUND 0.9% | | | | | | | | | | | | | | | | |
PGIM Core Ultra Short Bond Fund
(cost $27,086,088)(w) | | | | | | | | | | | 27,086,088 | | | | 27,086,088 | |
| | | | | | | | | | | | | | | | |
| | | | |
| | | | | | | | | Principal
Amount (000)# | | | | |
| | | | |
CERTIFICATES OF DEPOSIT 6.7% | | | | | | | | | | | | | | | | |
American Express National Bank | | | 1.650 | % | | | 09/19/19 | | | | 20,000 | | | | 19,901,220 | |
Bank of Nova Scotia, 1 Month LIBOR + 0.310% | | | 2.816 | (c) | | | 06/20/19 | | | | 25,000 | | | | 25,012,075 | |
Canadian Imperial Bank of Commerce, 3 Month LIBOR + 0.320% | | | 3.124 | (c) | | | 07/08/19 | | | | 24,650 | | | | 24,677,455 | |
Credit Suisse AG, 3 Month LIBOR + 0.170% | | | 2.967 | (c) | | | 10/01/19 | | | | 25,000 | | | | 25,011,185 | |
Mizuho Bank Ltd., 1 Month LIBOR + 0.270% | | | 2.783 | (c) | | | 04/18/19 | | | | 25,000 | | | | 24,999,460 | |
See Notes to Financial Statements.
| | | | |
| Prudential Investment Portfolios 2/PGIM Core Short-Term Bond Fund | | | 39 | |
PGIM Core Short-Term Bond Fund
Schedule of Investments (continued)
as of January 31, 2019
| | | | | | | | | | | | | | | | |
| | | | |
| Description | | Interest
Rate | | | Maturity
Date | | | Principal
Amount (000)# | | | Value | |
| | | | |
CERTIFICATES OF DEPOSIT (Continued) | | | | | | | | | | | | | | | | |
Natixis SA, 1 Month LIBOR + 0.350% | | | 2.863 | %(c) | | | 03/05/19 | | | | 25,000 | | | $ | 25,008,750 | |
Sumitomo Mitsui Banking Corp., 3 Month LIBOR + 0.150% | | | 2.929 | (c) | | | 04/16/19 | | | | 25,000 | | | | 25,000,766 | |
Svenska Handelsbanken, 3 Month LIBOR + 0.400% | | | 3.018 | (c) | | | 02/12/19 | | | | 25,000 | | | | 25,001,999 | |
| | | | | | | | | | | | | | | | |
TOTAL CERTIFICATES OF DEPOSIT
(cost $194,631,377) | | | | | | | | | | | | | | | 194,612,910 | |
| | | | | | | | | | | | | | | | |
| | | | |
COMMERCIAL PAPER 8.6% | | | | | | | | | | | | | | | | |
Cox Enterprises, 144A | | | 2.862 | (n) | | | 02/04/19 | | | | 5,000 | | | | 4,998,470 | |
EI du Pont de Nemours & Co., | | | | | | | | | | | | | | | | |
144A | | | 3.104 | (n) | | | 02/11/19 | | | | 5,000 | | | | 4,995,753 | |
144A | | | 3.166 | (n) | | | 03/12/19 | | | | 7,000 | | | | 6,977,546 | |
Electricite de France SA, 144A | | | 3.173 | (n) | | | 03/15/19 | | | | 5,000 | | | | 4,982,824 | |
ENI Finance USA, Inc., 144A | | | 3.147 | (n) | | | 03/18/19 | | | | 6,400 | | | | 6,377,249 | |
Entergy Corp., | | | | | | | | | | | | | | | | |
144A | | | 3.123 | (n) | | | 03/15/19 | | | | 5,000 | | | | 4,982,806 | |
144A | | | 3.171 | (n) | | | 03/11/19 | | | | 5,000 | | | | 4,984,519 | |
144A | | | 3.171 | (n) | | | 03/12/19 | | | | 5,000 | | | | 4,984,094 | |
FMC Technologies, Inc., | | | | | | | | | | | | | | | | |
144A | | | 3.219 | (n) | | | 03/19/19 | | | | 4,000 | | | | 3,984,903 | |
144A | | | 3.238 | (n) | | | 03/11/19 | | | | 21,000 | | | | 20,934,753 | |
Kansas City Power & Light Co., 144A | | | 2.759 | (n) | | | 02/01/19 | | | | 2,000 | | | | 1,999,850 | |
LyondellBasell Investment LLC, 144A | | | 3.135 | (n) | | | 03/14/19 | | | | 5,000 | | | | 4,983,142 | |
Nissan Motor Acceptance Corp., 144A | | | 3.220 | (n) | | | 03/15/19 | | | | 5,000 | | | | 4,985,069 | |
Parker-Hannifin Corp., 144A | | | 3.010 | (n) | | | 03/08/19 | | | | 10,000 | | | | 9,974,880 | |
PPL Capital Funding, Inc., | | | | | | | | | | | | | | | | |
144A | | | 2.906 | (n) | | | 02/15/19 | | | | 10,000 | | | | 9,988,292 | |
144A | | | 2.947 | (n) | | | 02/11/19 | | | | 5,000 | | | | 4,995,753 | |
144A | | | 3.169 | (n) | | | 03/08/19 | | | | 5,000 | | | | 4,985,690 | |
144A | | | 3.221 | (n) | | | 03/15/19 | | | | 5,000 | | | | 4,982,824 | |
Societe Generale SA,, 144A, 3 Month LIBOR + 0.370% | | | 3.165 | (c) | | | 01/09/20 | | | | 10,000 | | | | 10,019,093 | |
Suncor Energy, Inc., | | | | | | | | | | | | | | | | |
144A | | | 3.169 | (n) | | | 03/14/19 | | | | 8,000 | | | | 7,973,176 | |
144A | | | 3.209 | (n) | | | 03/18/19 | | | | 2,000 | | | | 1,992,627 | |
144A | | | 3.209 | (n) | | | 03/19/19 | | | | 10,000 | | | | 9,962,256 | |
TELUS Corp., 144A | | | 3.168 | (n) | | | 03/20/19 | | | | 10,000 | | | | 9,961,387 | |
TransCanada Pipelines Ltd., 144A | | | 3.071 | (n) | | | 03/14/19 | | | | 9,000 | | | | 8,969,823 | |
Tyco International Holding S.A.R.L., 144A | | | 2.820 | (n) | | | 02/06/19 | | | | 10,000 | | | | 9,995,408 | |
UBS AG,
144A, 1 Month LIBOR + 0.260% | | | 2.763 | (c) | | | 09/03/19 | | | | 20,000 | | | | 20,004,200 | |
See Notes to Financial Statements.
| | | | | | | | | | | | | | | | |
| | | | |
| Description | | Interest
Rate | | | Maturity
Date | | | Principal
Amount (000)# | | | Value | |
| | | | |
COMMERCIAL PAPER (Continued) | | | | | | | | | | | | | | | | |
UBS AG, (cont’d.) | | | | | | | | | | | | | | | | |
144A, 1 Month LIBOR + 0.420% | | | 2.919 | %(c) | | | 05/31/19 | | | | 10,000 | | | $ | 10,008,180 | |
United Technologies Corp., 144A | | | 2.843 | (n) | | | 02/13/19 | | | | 5,000 | | | | 4,994,953 | |
VW Credit, Inc., 144A | | | 3.221 | (n) | | | 03/14/19 | | | | 5,000 | | | | 4,983,235 | |
Walgreens Boots Alliance, Inc., 144A | | | 3.250 | (n) | | | 03/18/19 | | | | 3,100 | | | | 3,088,572 | |
WEC Energy Group, Inc., 144A | | | 2.886 | (n) | | | 02/25/19 | | | | 5,000 | | | | 4,990,149 | |
Westar Energy, Inc., 144A | | | 2.791 | (n) | | | 02/07/19 | | | | 3,000 | | | | 2,998,396 | |
Westpac Banking Corp., 144A, 3 Month LIBOR + 0.120% | | | 2.881 | (c) | | | 01/17/20 | | | | 25,000 | | | | 24,992,951 | |
| | | | | | | | | | | | | | | | |
TOTAL COMMERCIAL PAPER
(cost $249,979,912) | | | | | | | | | | | | | | | 250,032,823 | |
| | | | | | | | | | | | | | | | |
TOTAL SHORT-TERM INVESTMENTS
(cost $471,697,377) | | | | | | | | | | | | | | | 471,731,821 | |
| | | | | | | | | | | | | | | | |
| | | | |
TOTAL INVESTMENTS 100.1%
(cost $2,923,526,914) | | | | | | | | | | | | | | | 2,913,344,057 | |
Liabilities in excess of other assets(z) (0.1)% | | | | | | | | | | | | | | | (2,119,155 | ) |
| | | | | | | | | | | | | | | | |
| | | | |
NET ASSETS 100.0% | | | | | | | | | | | | | | $ | 2,911,224,902 | |
| | | | | | | | | | | | | | | | |
See the Glossary for abbreviations used in the annual report.
| # | Principal or notional amount is shown in U.S. dollars unless otherwise stated. |
| (c) | Variable rate instrument. The interest rate shown reflects the rate in effect at January 31, 2019. |
| (cc) | Variable rate instrument. The rate shown is based on the latest available information as of January 31, 2019. Certain variable rate securities are not based on a published reference rate and spread but are determined by the issuer or agent and are based on current market conditions. These securities do not indicate a reference rate and spread in their description. |
| (d) | Represents issuer in default on interest payments and/or principal repayment. Non-income producing security. Such securities may be post-maturity. |
| (n) | Rate shown reflects yield to maturity at purchased date. |
| (w) | PGIM Investments LLC, the manager of the Fund, also serves as manager of the PGIM Core Ultra Short Bond Fund. |
| (z) | Includes net unrealized appreciation/(depreciation) and/or market value of the below holdings which are excluded from the Schedule of Investments: |
Interest rate swap agreements outstanding at January 31, 2019:
| | | | | | | | | | | | | | | | | | | | | | | | |
Notional
Amount
(000)# | | | Termination
Date | | | Fixed
Rate | | | Floating Rate | | Value at
Trade
Date | | | Value at
January 31,
2019 | | | Unrealized
Appreciation
(Depreciation) | |
| | Centrally Cleared Interest Rate Swap Agreements: | | | | | | | | | |
| | 10,000 | | | | 02/24/19 | | | | 1.560%(S) | | | 3 Month LIBOR(1)(Q) | | $ | 173 | | | $ | (10,654 | ) | | $ | (10,827 | ) |
See Notes to Financial Statements.
| | | | |
| Prudential Investment Portfolios 2/PGIM Core Short-Term Bond Fund | | | 41 | |
PGIM Core Short-Term Bond Fund
Schedule of Investments(continued)
as of January 31, 2019
Interest rate swap agreements outstanding at January 31, 2019 (continued):
| | | | | | | | | | | | | | | | | | | | | | | | |
Notional
Amount
(000)# | | | Termination
Date | | | Fixed
Rate | | | Floating Rate | | Value at
Trade
Date | | | Value at
January 31,
2019 | | | Unrealized
Appreciation
(Depreciation) | |
| | Centrally Cleared Interest Rate Swap Agreements (cont’d.): | | | | | | | | | |
| | 59,000 | | | | 04/05/19 | | | | 1.585%(S) | | | 3 Month LIBOR(1)(Q) | | $ | 273,840 | | | $ | (68,447 | ) | | $ | (342,287 | ) |
| | 81,000 | | | | 05/11/19 | | | | 1.621%(S) | | | 3 Month LIBOR(1)(Q) | | | 231,025 | | | | 423,534 | | | | 192,509 | |
| | 70,000 | | | | 08/21/19 | | | | 1.591%(S) | | | 3 Month LIBOR(1)(Q) | | | 87,829 | | | | 288,006 | | | | 200,177 | |
| | 50,000 | | | | 09/07/19 | | | | 1.514%(S) | | | 3 Month LIBOR(1)(Q) | | | — | | | | 259,873 | | | | 259,873 | |
| | 50,000 | | | | 09/13/19 | | | | 1.546%(S) | | | 3 Month LIBOR(1)(Q) | | | 9,714 | | | | 241,161 | | | | 231,447 | |
| | 22,500 | | | | 12/08/19 | | | | 1.100%(S) | | | 3 Month LIBOR(1)(Q) | | | (3,658 | ) | | | 353,301 | | | | 356,959 | |
| | 37,607 | | | | 02/05/20 | | | | 2.350%(S) | | | 3 Month LIBOR(1)(Q) | | | 223,366 | | | | (71,972 | ) | | | (295,338 | ) |
| | 20,000 | | | | 03/02/20 | | | | 1.803%(S) | | | 3 Month LIBOR(1)(Q) | | | — | | | | 124,583 | | | | 124,583 | |
| | 27,000 | | | | 05/04/20 | | | | 1.713%(S) | | | 3 Month LIBOR(1)(Q) | | | 142,133 | | | | 372,528 | | | | 230,395 | |
| | 60,200 | | | | 06/15/20 | | | | 1.035%(S) | | | 3 Month LIBOR(1)(Q) | | | 1,034,057 | | | | 1,449,547 | | | | 415,490 | |
| | 9,000 | | | | 11/02/20 | | | | 2.806%(S) | | | 3 Month LIBOR(1)(Q) | | | 26,826 | | | | (33,772 | ) | | | (60,598 | ) |
| | 83,000 | | | | 11/10/20 | | | | 1.943%(S) | | | 3 Month LIBOR(1)(Q) | | | 911,044 | | | | 1,083,364 | | | | 172,320 | |
| | 5,000 | | | | 03/11/21 | | | | 2.850%(S) | | | 3 Month LIBOR(1)(Q) | | | 24,006 | | | | (62,888 | ) | | | (86,894 | ) |
| | 101,065 | | | | 05/09/21 | | | | 2.855%(S) | | | 3 Month LIBOR(1)(Q) | | | 186,978 | | | | (678,349 | ) | | | (865,327 | ) |
| | 76,150 | | | | 10/02/21 | | | | 1.898%(S) | | | 3 Month LIBOR(1)(Q) | | | 1,946,941 | | | | 993,267 | | | | (953,674 | ) |
| | 24,750 | | | | 01/11/22 | | | | 2.672%(S) | | | 3 Month LIBOR(1)(Q) | | | 227 | | | | (84,006 | ) | | | (84,233 | ) |
| | 19,000 | | | | 06/15/22 | | | | 1.873%(S) | | | 3 Month LIBOR(1)(Q) | | | 147,675 | | | | 425,707 | | | | 278,032 | |
| | | | | | | | | | | | | | | | | | | | | | | | |
| | | | | | | | | | | | | | $ | 5,242,176 | | | $ | 5,004,783 | | | $ | (237,393 | ) |
| | | | | | | | | | | | | | | | | | | | | | | | |
| (1) | The Fund pays the fixed rate and receives the floating rate. |
| (2) | The Fund pays the floating rate and receives the fixed rate. |
Summary of Collateral for Centrally Cleared/Exchange-traded Derivatives:
Cash and securities segregated as collateral to cover requirements for open centrally cleared/exchange-traded derivatives are listed by broker as follows:
| | | | | | | | |
Broker | | Cash and/or Foreign Currency | | | Securities Market Value | |
Citigroup Global Markets Inc. | | $ | 3,966,000 | | | $ | — | |
| | | | | | | | |
Fair Value Measurements:
Various inputs are used in determining the value of the Fund’s investments. These inputs are summarized in the three broad levels listed below.
Level 1—unadjusted quoted prices generally in active markets for identical securities.
Level 2—quoted prices for similar securities, interest rates and yield curves, prepayment speeds, foreign currency exchange rates and other observable inputs.
Level 3—unobservable inputs for securities valued in accordance with Board approved fair valuation procedures.
See Notes to Financial Statements.
The following is a summary of the inputs used as of January 31, 2019 in valuing such portfolio securities:
| | | | | | | | | | | | |
| | | Level 1 | | | Level 2 | | | Level 3 | |
Investments in Securities | | | | | | | | | | | | |
Asset-Backed Securities | | | | | | | | | | | | |
Automobiles | | $ | — | | | $ | 239,948,925 | | | $ | — | |
Credit Cards | | | — | | | | 104,660,033 | | | | — | |
Home Equity Loans | | | — | | | | 147,756,044 | | | | — | |
Residential Mortgage-Backed Securities | | | — | | | | 51,489,109 | | | | — | |
Student Loans | | | — | | | | 13,301,167 | | | | — | |
Certificates of Deposit | | | — | | | | 214,122,726 | | | | — | |
Commercial Mortgage-Backed Securities | | | — | | | | 444,440,622 | | | | — | |
Corporate Bonds | | | — | | | | 1,420,506,520 | | | | — | |
Affiliated Mutual Fund | | | 27,086,088 | | | | — | | | | — | |
Commercial Paper | | | — | | | | 250,032,823 | | | | — | |
Other Financial Instruments* | | | | | | | | | | | | |
Centrally Cleared Interest Rate Swap Agreements | | | — | | | | (237,393 | ) | | | — | |
| | | | | | | | | | | | |
Total | | $ | 27,086,088 | | | $ | 2,886,020,576 | | | $ | — | |
| | | | | | | | | | | | |
| * | Other financial instruments are derivative instruments not reflected in the Schedule of Investments, such as futures, forwards and centrally cleared swap contracts, which are recorded at the unrealized appreciation (depreciation) on the instrument, and OTC swap contracts which are recorded at fair value. |
Industry Classification:
The industry classification of investments and liabilities in excess of other assets shown as a percentage of net assets as of January 31, 2019 were as follows (unaudited):
| | | | |
Banks | | | 15.3 | % |
Commercial Mortgage-Backed Securities | | | 15.3 | |
Commercial Paper | | | 8.6 | |
Automobiles | | | 8.2 | |
Certificates of Deposit | | | 7.4 | |
Auto Manufacturers | | | 6.1 | |
Home Equity Loans | | | 5.1 | |
Insurance | | | 4.8 | |
Credit Cards | | | 3.6 | |
Computers | | | 3.2 | |
Media | | | 2.0 | |
Oil & Gas | | | 2.0 | |
Electric | | | 1.9 | |
Residential Mortgage-Backed Securities | | | 1.8 | |
Biotechnology | | | 1.7 | |
Diversified Financial Services | | | 1.3 | |
Pharmaceuticals | | | 1.2 | |
Pipelines | | | 1.0 | |
Foods | | | 1.0 | |
Affiliated Mutual Fund | | | 0.9 | |
Miscellaneous Manufacturing | | | 0.9 | % |
Mining | | | 0.8 | |
Machinery-Construction & Mining | | | 0.8 | |
Cosmetics/Personal Care | | | 0.7 | |
Trucking & Leasing | | | 0.7 | |
Aerospace & Defense | | | 0.6 | |
Healthcare-Services | | | 0.6 | |
Retail | | | 0.5 | |
Student Loans | | | 0.4 | |
Beverages | | | 0.4 | |
Machinery-Diversified | | | 0.4 | |
Chemicals | | | 0.3 | |
Lodging | | | 0.3 | |
Electronics | | | 0.2 | |
Healthcare-Products | | | 0.1 | |
Telecommunications | | | 0.0 | * |
Oil & Gas Services | | | 0.0 | * |
Agriculture | | | 0.0 | * |
| | | | |
| | | | |
See Notes to Financial Statements.
| | | | |
| Prudential Investment Portfolios 2/PGIM Core Short-Term Bond Fund | | | 43 | |
PGIM Core Short-Term Bond Fund
Schedule of Investments (continued)
as of January 31, 2019
| | | | |
Industry Classification (continued): | | | |
Transportation | | | 0.0 | *% |
| | | | |
| | | 100.1 | |
Liabilities in excess of other assets | | | (0.1 | ) |
| | | | |
| | | 100.0 | % |
| | | | |
Effects of Derivative Instruments on the Financial Statements and Primary Underlying Risk Exposure:
The Fund invested in derivative instruments during the reporting period. The primary type of risk associated with these derivative instruments is interest rate contracts risk. The effect of such derivative instruments on the Fund’s financial position and financial performance as reflected in the Statement of Assets and Liabilities and Statement of Operations is presented in the summary below.
Fair values of derivative instruments as of January 31, 2019 as presented in the Statement of Assets and Liabilities:
| | | | | | | | | | | | |
Derivatives not accounted for as hedging instruments, carried at fair value | | Asset Derivatives | | | Liability Derivatives | |
| | Statement of
Assets and
Liabilities Location | | Fair
Value | | | Statement of
Assets and
Liabilities Location | | Fair
Value | |
| Interest rate contracts | | Due from/to broker-variation margin swaps | | $ | 2,461,785 | * | | Due from/to broker-variation margin swaps | | $ | 2,699,178 | * |
| | | | | | | | | | | | |
| * | Includes cumulative appreciation (depreciation) as reported in the schedule of open futures and centrally cleared swap contracts. Only unsettled variation margin receivable (payable) is reported within the Statement of Assets and Liabilities. |
The effects of derivative instruments on the Statement of Operations for the year ended January 31, 2019 are as follows:
| | | | |
Amount of Realized Gain (Loss) on Derivatives Recognized in Income | |
Derivatives not accounted for as hedging
instruments, carried at fair value | | Swaps | |
Interest rate contracts | | $ | 3,677,519 | |
| | | | |
| | | | |
Change in Unrealized Appreciation (Depreciation) on Derivatives Recognized in Income | |
Derivatives not accounted for as hedging
instruments, carried at fair value | | Swaps | |
Interest rate contracts | | $ | (4,655,572 | ) |
| | | | |
See Notes to Financial Statements.
For the year ended January 31, 2019, the Fund’s average volume of derivative activities is as follows:
| | |
Interest Rate
Swap
Agreements(1) | |
| $ | 706,963,800 | |
| (1) | Notional Amount in USD. |
See Notes to Financial Statements.
| | | | |
| Prudential Investment Portfolios 2/PGIM Core Short-Term Bond Fund | | | 45 | |
PGIM Core Short-Term Bond Fund
Statement of Assets & Liabilities
as of January 31, 2019
| | | | |
Assets | | | | |
Investments at value: | | | | |
Unaffiliated investments (cost $2,896,440,826) | | $ | 2,886,257,969 | |
Affiliated investments (cost $27,086,088) | | | 27,086,088 | |
Dividends and interest receivable | | | 10,423,207 | |
Deposit with broker for centrally cleared/exchange-traded derivatives | | | 3,966,000 | |
Prepaid expenses | | | 10,455 | |
| | | | |
Total Assets | | | 2,927,743,719 | |
| | | | |
| |
Liabilities | | | | |
Payable for investments purchased | | | 10,499,979 | |
Dividends payable | | | 5,232,727 | |
Due to broker—variation margin swaps | | | 625,905 | |
Accrued expenses and other liabilities | | | 76,336 | |
Management fee payable | | | 58,170 | |
Affiliated transfer agent fee payable | | | 16,667 | |
Payable to custodian | | | 9,033 | |
| | | | |
Total Liabilities | | | 16,518,817 | |
| | | | |
| |
Net Assets | | $ | 2,911,224,902 | |
| | | | |
| | | | | |
Net assets were comprised of: | | | | |
Shares of beneficial interest, at par | | $ | 315,743 | |
Paid-in capital in excess of par | | | 2,936,893,389 | |
Total distributable earnings (loss) | | | (25,984,230 | ) |
| | | | |
Net assets, January 31, 2019 | | $ | 2,911,224,902 | |
| | | | |
Net asset value and redemption price per share ($2,911,224,902 ÷ 315,743,247 shares of beneficial interest issued and outstanding) | | $ | 9.22 | |
| | | | |
See Notes to Financial Statements.
PGIM Core Short-Term Bond Fund
Statement of Operations
Year Ended January 31, 2019
| | | | |
Net Investment Income (Loss) | | | | |
Income | | | | |
Interest income | | $ | 82,550,936 | |
Affiliated dividend income | | | 1,263,282 | |
| | | | |
Total income | | | 83,814,218 | |
| | | | |
| |
Expenses | | | | |
Management fee | | | 702,371 | |
Custodian and accounting fees | | | 112,495 | |
Transfer agent’s fees and expenses (including affiliated expense of $ 100,000) | | | 100,076 | |
Audit fee | | | 38,637 | |
Legal fees and expenses | | | 17,429 | |
Shareholders’ reports | | | 13,003 | |
Trustees’ fees | | | 12,301 | |
Miscellaneous | | | 35,735 | |
| | | | |
Total expenses | | | 1,032,047 | |
| | | | |
Net investment income (loss) | | | 82,782,171 | |
| | | | |
| |
Realized And Unrealized Gain (Loss) On Investments | | | | |
Net realized gain (loss) on: | | | | |
Investment transactions | | | 902,244 | |
Swap agreement transactions | | | 3,677,519 | |
| | | | |
| | | 4,579,763 | |
| | | | |
Net change in unrealized appreciation (depreciation) on: | | | | |
Investments | | | (9,410,122 | ) |
Swap agreements | | | (4,655,572 | ) |
| | | | |
| | | (14,065,694 | ) |
| | | | |
Net gain (loss) on investment transactions | | | (9,485,931 | ) |
| | | | |
Net Increase (Decrease) In Net Assets Resulting From Operations | | $ | 73,296,240 | |
| | | | |
See Notes to Financial Statements.
| | | | |
| Prudential Investment Portfolios 2/PGIM Core Short-Term Bond Fund | | | 47 | |
PGIM Core Short-Term Bond Fund
Statements of Changes in Net Assets
| | | | | | | | |
| |
| | | Year Ended January 31, | |
| | |
| | | 2019 | | | 2018 | |
Increase (Decrease) in Net Assets | |
Operations | |
Net investment income (loss) | | $ | 82,782,171 | | | $ | 62,942,946 | |
Net realized gain (loss) on investment transactions | | | 4,579,763 | | | | 9,353,011 | |
Net change in unrealized appreciation (depreciation) on investments | | | (14,065,694 | ) | | | (3,533,231 | ) |
| | | | | | | | |
Net increase (decrease) in net assets resulting from operations | | | 73,296,240 | | | | 68,762,726 | |
| | | | | | | | |
| | |
Dividends and Distributions | | | | | | | | |
Distributions from distributable earnings* | | | (90,774,156 | ) | | | — | |
| | | | | | | | |
Dividends from net investment income | | | * | | | | (68,735,210 | ) |
| | | | | | | | |
| | |
Fund share transactions | | | | | | | | |
Net proceeds from shares sold | | | 191,892,918 | | | | 35,707,576 | |
Net asset value of shares issued in reinvestment of dividends and distributions | | | 48,423,637 | | | | 68,732,516 | |
Cost of shares reacquired | | | (430,663,918 | ) | | | (35,707,576 | ) |
| | | | | | | | |
Net increase (decrease) in net assets from Fund share transactions | | | (190,347,363 | ) | | | 68,732,516 | |
| | | | | | | | |
Total increase (decrease) | | | (207,825,279 | ) | | | 68,760,032 | |
| | |
Net Assets: | | | | | | | | |
Beginning of year | | | 3,119,050,181 | | | | 3,050,290,149 | |
| | | | | | | | |
End of year(a) | | $ | 2,911,224,902 | | | $ | 3,119,050,181 | |
| | | | | | | | |
(a) Includes undistributed/(distributions in excess of) net investment income of: | | $ | * | | | $ | 5,512,365 | |
| | | | | | | | |
| * | For the year ended January 31, 2019, the disclosures have been revised to reflect revisions to Regulation S-X adopted by the SEC in 2018 (refer to Note 9). |
See Notes to Financial Statements.
PGIM Core Ultra Short Bond Fund
Schedule of Investments
as of January 31, 2019
| | | | | | | | | | | | | | | | |
| | | | |
| Description | | Interest
Rate | | | Maturity
Date | | | Principal
Amount (000)# | | | Value | |
SHORT-TERM INVESTMENTS 105.3% | | | | | | | | | | | | | | | | |
| | | | |
CERTIFICATES OF DEPOSIT 28.5% | | | | | | | | | | | | | | | | |
Bank of America NA, | | | | | | | | | | | | | | | | |
1 Month LIBOR + 0.150% | | | 2.657 | %(c) | | | 02/04/19 | | | | 109,000 | | | $ | 109,003,052 | |
1 Month LIBOR + 0.150% | | | 2.659 | (c) | | | 04/15/19 | | | | 138,000 | | | | 138,002,625 | |
1 Month LIBOR + 0.280% | | | 2.794 | (c) | | | 05/13/19 | | | | 126,000 | | | | 126,044,763 | |
Bank of America NA | | | 2.820 | | | | 07/01/19 | | | | 117,000 | | | | 117,051,076 | |
Bank of Montreal, | | | | | | | | | | | | | | | | |
1 Month LIBOR + 0.260% | | | 2.781 | (c) | | | 02/08/19 | | | | 147,000 | | | | 147,011,613 | |
1 Month LIBOR + 0.330% | | | 2.843 | (c) | | | 08/06/19 | | | | 150,000 | | | | 150,097,776 | |
3 Month LIBOR + 0.180% | | | 2.924 | (c) | | | 01/31/20 | | | | 37,000 | | | | 37,021,480 | |
Bank of Nova Scotia, | | | | | | | | | | | | | | | | |
1 Month LIBOR + 0.310% | | | 2.816 | (c) | | | 06/19/19 | | | | 172,000 | | | | 172,083,420 | |
3 Month LIBOR + 0.200% | | | 2.913 | (c) | | | 09/20/19 | | | | 25,000 | | | | 25,024,225 | |
BNP Paribas SA, | | | | | | | | | | | | | | | | |
1 Month LIBOR + 0.240% | | | 2.746 | (c) | | | 02/19/19 | | | | 120,000 | | | | 120,018,600 | |
1 Month LIBOR + 0.290% | | | 2.796 | (c) | | | 05/20/19 | | | | 10,000 | | | | 10,004,460 | |
1 Month LIBOR + 0.340% | | | 2.854 | (c) | | | 09/03/19 | | | | 142,000 | | | | 142,096,986 | |
3 Month LIBOR + 0.140% | | | 2.964 | (c) | | | 06/24/19 | | | | 228,000 | | | | 228,042,123 | |
Branch Banking & Trust Co. | | | 2.400 | | | | 02/06/19 | | | | 125,000 | | | | 124,999,664 | |
Branch Banking & Trust Co. | | | 2.410 | | | | 02/01/19 | | | | 183,000 | | | | 183,000,031 | |
Branch Banking & Trust Co. | | | 2.410 | | | | 02/04/19 | | | | 200,000 | | | | 199,999,968 | |
Canadian Imperial Bank of Commerce, | | | | | | | | | | | | | | | | |
3 Month LIBOR + 0.130% | | | 2.903 | (c) | | | 07/17/19 | | | | 225,000 | | | | 225,059,256 | |
1 Month LIBOR + 0.400% | | | 2.916 | (c) | | | 12/10/19 | | | | 31,460 | | | | 31,508,763 | |
3 Month LIBOR + 0.200% | | | 2.936 | (c) | | | 05/01/19 | | | | 14,000 | | | | 14,005,293 | |
3 Month LIBOR + 0.220% | | | 3.042 | (c) | | | 12/27/19 | | | | 11,000 | | | | 11,011,511 | |
Citibank NA | | | 2.510 | | | | 03/14/19 | | | | 108,000 | | | | 107,995,930 | |
Cooperatieve Rabobank UA,
1 Month LIBOR + 0.400% | | | 2.910 | (c) | | | 04/16/19 | | | | 50,000 | | | | 50,034,800 | |
Credit Agricole Corporate and Investment Bank, | | | | | | | | | | | | | | | | |
1 Month LIBOR + 0.320% | | | 2.826 | (c) | | | 05/20/19 | | | | 42,000 | | | | 42,022,302 | |
3 Month LIBOR + 0.240% | | | 2.854 | (c) | | | 11/14/19 | | | | 24,200 | | | | 24,225,905 | |
Credit Suisse AG,
3 Month LIBOR + 0.170% | | | 2.967 | (c) | | | 10/01/19 | | | | 219,000 | | | | 219,097,974 | |
Lloyds Bank Corporate Markets PLC,
3 Month LIBOR + 0.220% | | | 3.017 | (c) | | | 10/09/19 | | | | 50,000 | | | | 49,999,729 | |
Mizuho Bank Ltd., | | | | | | | | | | | | | | | | |
1 Month LIBOR + 0.200% | | | 2.702 | (c) | | | 07/30/19 | | | | 25,000 | | | | 24,997,775 | |
1 Month LIBOR + 0.270% | | | 2.783 | (c) | | | 04/18/19 | | | | 84,000 | | | | 83,998,186 | |
MUFG Bank Ltd.,
1 Month LIBOR + 0.300% | | | 2.806 | (c) | | | 05/21/19 | | | | 200,000 | | | | 200,093,800 | |
See Notes to Financial Statements.
| | | | |
| Prudential Investment Portfolios 2/PGIM Core Ultra Short Bond Fund | | | 49 | |
PGIM Core Ultra Short Bond Fund
Schedule of Investments (continued)
as of January 31, 2019
| | | | | | | | | | | | | | | | |
| | | | |
| Description | | Interest
Rate | | | Maturity
Date | | | Principal
Amount (000)# | | | Value | |
| | | | |
CERTIFICATES OF DEPOSIT (Continued) | | | | | | | | | | | | | | | | |
Natixis SA, | | | | | | | | | | | | | | | | |
3 Month LIBOR + 0.180% | | | 2.850 | %(c) | | | 06/10/19 | | | | 38,000 | | | $ | 38,010,815 | |
1 Month LIBOR + 0.350% | | | 2.863 | (c) | | | 03/05/19 | | | | 176,500 | | | | 176,561,775 | |
3 Month LIBOR + 0.120% | | | 2.891 | (c) | | | 06/12/19 | | | | 81,000 | | | | 81,005,131 | |
3 Month LIBOR + 0.080% | | | 2.902 | (c) | | | 06/26/19 | | | | 124,500 | | | | 124,489,639 | |
3 Month LIBOR + 0.230% | | | 3.013 | (c) | | | 01/10/20 | | | | 88,200 | | | | 88,280,236 | |
Royal Bank of Canada, | | | | | | | | | | | | | | | | |
3 Month LIBOR + 0.150% | | | 2.795 | (c) | | | 05/20/19 | | | | 79,500 | | | | 79,522,925 | |
3 Month LIBOR + 0.130% | | | 2.927 | (c) | | | 07/12/19 | | | | 200,000 | | | | 200,068,224 | |
Skandinaviska Enskilda Banken AB,
3 Month LIBOR + 0.060% | | | 2.839 | (c) | | | 01/24/20 | | | | 135,000 | | | | 134,999,648 | |
State Street Bank and Trust Co. | | | 2.690 | | | | 03/15/19 | | | | 284,000 | | | | 284,064,499 | |
State Street Bank and Trust Co.,
1 Month LIBOR + 0.270% | | | 2.779 | (c) | | | 05/15/19 | | | | 23,200 | | | | 23,204,518 | |
Sumitomo Mitsui Banking Corp.,
1 Month LIBOR + 0.190% | | | 2.692 | (c) | | | 03/27/19 | | | | 118,000 | | | | 118,026,314 | |
Svenska Handelsbanken, | | | | | | | | | | | | | | | | |
1 Month LIBOR + 0.190% | | | 2.696 | (c) | | | 02/20/19 | | | | 110,000 | | | | 110,014,740 | |
1 Month LIBOR + 0.300% | | | 2.813 | (c) | | | 08/06/19 | | | | 19,350 | | | | 19,358,730 | |
3 Month LIBOR + 0.050% | | | 2.821 | (c) | | | 01/27/20 | | | | 14,000 | | | | 13,999,951 | |
1 Month LIBOR + 0.370% | | | 2.883 | (c) | | | 12/06/19 | | | | 21,000 | | | | 21,021,840 | |
Svenska Handelsbanken | | | 2.620 | | | | 02/26/19 | | | | 45,000 | | | | 45,004,123 | |
Swedbank AB,
1 Month LIBOR + 0.190% | | | 2.700 | (c) | | | 02/25/19 | | | | 200,000 | | | | 200,034,200 | |
US Bank NA, | | | | | | | | | | | | | | | | |
1 Month LIBOR + 0.230% | | | 2.742 | (c) | | | 05/23/19 | | | | 100,000 | | | | 99,996,913 | |
1 Month LIBOR + 0.240% | | | 2.742 | (c) | | | 06/26/19 | | | | 108,000 | | | | 107,995,726 | |
1 Month LIBOR + 0.350% | | | 2.856 | (c) | | | 09/19/19 | | | | 65,000 | | | | 65,049,140 | |
US Bank NA | | | 2.910 | | | | 07/23/19 | | | | 50,000 | | | | 50,043,969 | |
US Bank NA | | | 2.990 | | | | 08/05/19 | | | | 135,000 | | | | 135,176,669 | |
Wells Fargo Bank NA, | | | | | | | | | | | | | | | | |
3 Month LIBOR + 0.160% | | | 2.957 | (c) | | | 08/13/19 | | | | 207,000 | | | | 207,246,922 | |
3 Month LIBOR + 0.210% | | | 2.983 | (c) | | | 04/16/19 | | | | 60,000 | | | | 60,032,497 | |
3 Month LIBOR + 0.230% | | | 3.009 | (c) | | | 04/16/19 | | | | 140,000 | | | | 140,081,252 | |
Westpac Banking Corp., | | | | | | | | | | | | | | | | |
1 Month LIBOR + 0.270% | | | 2.776 | (c) | | | 05/21/19 | | | | 5,000 | | | | 5,001,890 | |
3 Month LIBOR + 0.090% | | | 2.855 | (c) | | | 04/26/19 | | | | 245,000 | | | | 245,027,247 | |
| | | | | | | | | | | | | | | | |
TOTAL CERTIFICATES OF DEPOSIT
(cost $5,985,040,205) | | | | | | | | | | | | | | | 5,986,872,619 | |
| | | | | | | | | | | | | | | | |
See Notes to Financial Statements.
| | | | | | | | | | | | | | | | |
| | | | |
| Description | | Interest
Rate | | | Maturity
Date | | | Principal
Amount (000)# | | | Value | |
| | | | |
COMMERCIAL PAPER 37.6% | | | | | | | | | | | | | | | | |
Apple, Inc., | | | | | | | | | | | | | | | | |
144A | | | 2.588 | %(n) | | | 03/19/19 | | | | 187,000 | | | $ | 186,390,141 | |
144A | | | 2.588 | (n) | | | 03/20/19 | | | | 215,000 | | | | 214,283,334 | |
144A | | | 2.599 | (n) | | | 04/01/19 | | | | 36,000 | | | | 35,848,800 | |
Australia & New Zealand Banking Group Ltd.,
144A, 3 Month LIBOR + 0.150% | | | 2.917 | (c) | | | 10/10/19 | | | | 24,250 | | | | 24,249,874 | |
BASF SE, | | | | | | | | | | | | | | | | |
144A | | | 2.595 | (n) | | | 03/05/19 | | | | 130,000 | | | | 129,700,295 | |
144A | | | 2.605 | (n) | | | 03/26/19 | | | | 100,000 | | | | 99,611,200 | |
144A | | | 2.735 | (n) | | | 03/25/19 | | | | 69,500 | | | | 69,235,402 | |
144A | | | 2.745 | (n) | | | 04/02/19 | | | | 95,000 | | | | 94,576,321 | |
144A | | | 2.745 | (n) | | | 04/03/19 | | | | 125,000 | | | | 124,433,174 | |
Canadian National Railway Co.,
144A | | | 2.725 | (n) | | | 04/18/19 | | | | 30,000 | | | | 29,833,167 | |
CDP Financial, Inc., | | | | | | | | | | | | | | | | |
144A | | | 2.616 | (n) | | | 02/15/19 | | | | 113,000 | | | | 112,885,116 | |
144A | | | 2.617 | (n) | | | 03/12/19 | | | | 100,000 | | | | 99,722,222 | |
144A | | | 2.617 | (n) | | | 03/14/19 | | | | 100,000 | | | | 99,707,867 | |
144A | | | 2.643 | (n) | | | 04/15/19 | | | | 190,000 | | | | 188,995,101 | |
Commonwealth Bank of Australia, | | | | | | | | | | | | | | | | |
144A, 1 Month LIBOR + 0.330% | | | 2.830 | (c) | | | 02/28/19 | | | | 12,000 | | | | 12,003,384 | |
144A, 3 Month LIBOR + 0.180% | | | 2.886 | (c) | | | 11/22/19 | | | | 34,000 | | | | 34,024,026 | |
DNB Bank ASA, | | | | | | | | | | | | | | | | |
144A, 3 Month LIBOR + 0.050% | | | 2.815 | (c) | | | 01/23/20 | | | | 14,000 | | | | 13,998,663 | |
144A, 3 Month LIBOR + 4.000% | | | 6.752 | (c) | | | 01/19/20 | | | | 10,000 | | | | 9,999,987 | |
Federation Des Caisses Desjardins, | | | | | | | | | | | | | | | | |
144A, 1 Month LIBOR + 0.300% | | | 2.384 | (c) | | | 06/19/19 | | | | 150,000 | | | | 150,067,500 | |
144A | | | 2.564 | (n) | | | 03/07/19 | | | | 50,000 | | | | 49,877,986 | |
144A | | | 2.705 | (n) | | | 04/18/19 | | | | 25,000 | | | | 24,860,972 | |
144A, 1 Month LIBOR + 0.370% | | | 2.779 | (c) | | | 12/10/19 | | | | 64,000 | | | | 64,068,480 | |
144A | | | 2.816 | (n) | | | 03/28/19 | | | | 5,000 | | | | 4,980,151 | |
144A | | | 2.817 | (n) | | | 04/01/19 | | | | 25,000 | | | | 24,893,333 | |
144A, 1 Month LIBOR + 0.370% | | | 2.881 | (c) | | | 12/09/19 | | | | 190,000 | | | | 190,204,060 | |
HSBC Bank PLC, | | | | | | | | | | | | | | | | |
144A, 3 Month LIBOR + 0.190% | | | 2.781 | (c) | | | 08/08/19 | | | | 185,750 | | | | 185,881,309 | |
144A, 3 Month LIBOR + 0.200% | | | 2.818 | (c) | | | 09/25/19 | | | | 94,000 | | | | 94,088,030 | |
HSBC USA, Inc.,
144A, 1 Month LIBOR + 0.290% | | | 2.798 | (c) | | | 05/17/19 | | | | 10,000 | | | | 10,004,520 | |
ING US Funding LLC,
1 Month LIBOR + 0.290% | | | 2.811 | (c) | | | 07/08/19 | | | | 22,500 | | | | 22,509,000 | |
John Deere Capital Corp.,
144A | | | 2.566 | (n) | | | 03/20/19 | | | | 50,000 | | | | 49,834,000 | |
See Notes to Financial Statements.
| | | | |
| Prudential Investment Portfolios 2/PGIM Core Ultra Short Bond Fund | | | 51 | |
PGIM Core Ultra Short Bond Fund
Schedule of Investments (continued)
as of January 31, 2019
| | | | | | | | | | | | | | | | |
| | | | |
| Description | | Interest
Rate | | | Maturity
Date | | | Principal
Amount (000)# | | | Value | |
| | | | |
COMMERCIAL PAPER (Continued) | | | | | | | | | | | | | | | | |
John Deere Capital Corp., (cont’d.) | | | | | | | | | | | | | | | | |
144A | | | 2.617 | %(n) | | | 03/12/19 | | | | 40,000 | | | $ | 39,890,667 | |
144A | | | 2.617 | (n) | | | 03/21/19 | | | | 95,000 | | | | 94,676,994 | |
JPMorgan Securities LLC, | | | | | | | | | | | | | | | | |
144A, 3 Month LIBOR + 0.200% | | | 2.709 | (c) | | | 07/29/19 | | | | 78,000 | | | | 78,014,793 | |
144A, 1 Month LIBOR + 0.230% | | | 2.742 | (c) | | | 04/23/19 | | | | 60,000 | | | | 60,020,400 | |
1 Month LIBOR + 0.300% | | | 2.814 | (c) | | | 06/12/19 | | | | 43,000 | | | | 43,019,350 | |
144A, 3 Month LIBOR + 0.230% | | | 2.819 | (c) | | | 11/06/19 | | | | 90,000 | | | | 90,013,346 | |
144A, 3 Month LIBOR + 0.170% | | | 2.967 | (c) | | | 10/09/19 | | | | 112,000 | | | | 111,999,348 | |
144A, 3 Month LIBOR + 0.240% | | | 3.037 | (c) | | | 01/08/20 | | | | 132,000 | | | | 132,047,916 | |
National Australia Bank Ltd.,
144A, 1 Month LIBOR + 0.220% | | | 2.740 | (c) | | | 08/01/19 | | | | 5,000 | | | | 5,000,075 | |
Nestle Finance International Ltd. | | | 2.745 | (n) | | | 03/14/19 | | | | 95,000 | | | | 94,721,809 | |
Nordea Bank Abp, 144A | | | 2.731 | (n) | | | 03/01/19 | | | | 175,000 | | | | 174,653,489 | |
OMERS Finance Trust, | | | | | | | | | | | | | | | | |
144A | | | 2.702 | (n) | | | 02/19/19 | | | | 25,500 | | | | 25,466,744 | |
144A | | | 2.735 | (n) | | | 04/24/19 | | | | 120,000 | | | | 119,268,493 | |
144A | | | 2.837 | (n) | | | 03/04/19 | | | | 50,000 | | | | 49,888,711 | |
144A | | | 2.837 | (n) | | | 03/06/19 | | | | 50,000 | | | | 49,881,566 | |
144A | | | 2.838 | (n) | | | 03/08/19 | | | | 50,000 | | | | 49,874,400 | |
144A | | | 2.839 | (n) | | | 03/13/19 | | | | 115,000 | | | | 114,669,688 | |
Ontario Teachers’ Finance Trust, | | | | | | | | | | | | | | | | |
144A | | | 2.788 | (n) | | | 03/18/19 | | | | 72,000 | | | | 71,764,296 | |
144A | | | 2.828 | (n) | | | 03/11/19 | | | | 25,000 | | | | 24,930,992 | |
Pfizer, Inc, | | | | | | | | | | | | | | | | |
144A | | | 2.669 | (n) | | | 05/14/19 | | | | 65,000 | | | | 64,509,777 | |
144A | | | 2.685 | (n) | | | 05/15/19 | | | | 21,000 | | | | 20,839,961 | |
Port Authority of New York & New Jersey | | | 2.550 | | | | 02/20/19 | | | | 23,325 | | | | 23,325,730 | |
Port Authority of New York & New Jersey | | | 2.560 | | | | 03/12/19 | | | | 12,235 | | | | 12,234,864 | |
Province of Alberta, | | | | | | | | | | | | | | | | |
144A | | | 2.653 | (n) | | | 04/22/19 | | | | 56,000 | | | | 55,678,070 | |
144A | | | 2.736 | (n) | | | 04/10/19 | | | | 46,000 | | | | 45,776,498 | |
144A | | | 2.767 | (n) | | | 03/11/19 | | | | 171,500 | | | | 171,038,308 | |
144A | | | 2.777 | (n) | | | 03/12/19 | | | | 50,000 | | | | 49,861,834 | |
144A | | | 2.808 | (n) | | | 04/05/19 | | | | 24,000 | | | | 23,892,181 | |
144A | | | 2.828 | (n) | | | 03/21/19 | | | | 50,000 | | | | 49,829,725 | |
Province of Ontario | | | 2.589 | (n) | | | 04/01/19 | | | | 285,000 | | | | 283,803,000 | |
Province of Ontario | | | 2.596 | (n) | | | 03/08/19 | | | | 100,000 | | | | 99,752,000 | |
Province of Quebec, | | | | | | | | | | | | | | | | |
144A | | | 2.568 | (n) | | | 02/04/19 | | | | 270,000 | | | | 269,929,171 | |
144A | | | 2.572 | (n) | | | 02/21/19 | | | | 43,000 | | | | 42,938,646 | |
See Notes to Financial Statements.
| | | | | | | | | | | | | | | | |
| | | | |
| Description | | Interest
Rate | | | Maturity
Date | | | Principal
Amount (000)# | | | Value | |
| | | | |
COMMERCIAL PAPER (Continued) | | | | | | | | | | | | | | | | |
Province of Quebec, (cont’d.) | | | | | | | | | | | | | | | | |
144A | | | 2.596 | %(n) | | | 03/07/19 | | | | 195,000 | | | $ | 194,534,005 | |
PSP Capital, Inc., | | | | | | | | | | | | | | | | |
144A | | | 2.596 | (n) | | | 03/08/19 | | | | 50,000 | | | | 49,877,500 | |
144A | | | 2.598 | (n) | | | 04/02/19 | | | | 50,000 | | | | 49,784,636 | |
144A | | | 2.607 | (n) | | | 03/12/19 | | | | 47,000 | | | | 46,871,377 | |
144A | | | 2.612 | (n) | | | 03/15/19 | | | | 90,000 | | | | 89,734,153 | |
144A | | | 2.617 | (n) | | | 03/14/19 | | | | 119,000 | | | | 118,657,081 | |
144A | | | 2.690 | (n) | | | 03/05/19 | | | | 50,000 | | | | 49,888,166 | |
144A | | | 2.767 | (n) | | | 03/11/19 | | | | 50,000 | | | | 49,866,750 | |
144A | | | 2.775 | (n) | | | 07/22/19 | | | | 75,000 | | | | 74,011,358 | |
Royal Bank of Canada, | | | | | | | | | | | | | | | | |
144A, 1 Month LIBOR + 0.320% | | | 2.627 | (c) | | | 08/15/19 | | | | 53,350 | | | | 53,373,794 | |
144A, 1 Month LIBOR + 0.280% | | | 2.786 | (c) | | | 05/20/19 | | | | 23,000 | | | | 23,009,453 | |
Sanofi SA, | | | | | | | | | | | | | | | | |
144A | | | 2.639 | (n) | | | 03/20/19 | | | | 180,000 | | | | 179,392,801 | |
144A | | | 2.650 | (n) | | | 03/22/19 | | | | 276,440 | | | | 275,467,467 | |
144A | | | 2.661 | (n) | | | 03/26/19 | | | | 13,450 | | | | 13,398,756 | |
Schlumberger Investment SA, 144A | | | 2.744 | (n) | | | 04/01/19 | | | | 96,000 | | | | 95,590,400 | |
Siemens Capital Co. LLC, | | | | | | | | | | | | | | | | |
144A | | | 2.631 | (n) | | | 05/14/19 | | | | 77,000 | | | | 76,415,529 | |
144A | | | 2.679 | (n) | | | 05/15/19 | | | | 58,000 | | | | 57,555,308 | |
144A | | | 2.776 | (n) | | | 03/26/19 | | | | 60,000 | | | | 59,772,480 | |
Toronto-Dominion Bank (The),
144A, 3 Month LIBOR + 0.190% | | | 2.791 | (c) | | | 08/09/19 | | | | 209,000 | | | | 209,158,430 | |
Total Capital Canada Ltd., | | | | | | | | | | | | | | | | |
144A | | | 2.653 | (n) | | | 04/23/19 | | | | 210,000 | | | | 208,768,291 | |
144A | | | 2.704 | (n) | | | 04/04/19 | | | | 150,000 | | | | 149,327,475 | |
Toyota Credit Canada, Inc.,
1 Month LIBOR + 0.250% | | | 2.763 | (c) | | | 03/01/19 | | | | 50,000 | | | | 50,011,600 | |
Toyota Credit Canada, Inc. | | | 2.883 | (n) | | | 04/29/19 | | | | 24,000 | | | | 23,848,816 | |
Toyota Finance Australia Ltd., | | | | | | | | | | | | | | | | |
3 Month LIBOR + 0.110% | | | 2.728 | (c) | | | 08/09/19 | | | | 100,000 | | | | 100,035,345 | |
3 Month LIBOR + 0.150% | | | 2.917 | (c) | | | 09/06/19 | | | | 47,000 | | | | 47,026,875 | |
Toyota Motor Finance (Netherlands) BV, | | | | | | | | | | | | | | | | |
3 Month LIBOR + 0.110% | | | 2.739 | (c) | | | 08/13/19 | | | | 50,000 | | | | 50,018,071 | |
3 Month LIBOR + 0.070% | | | 2.883 | (c) | | | 06/25/19 | | | | 20,000 | | | | 20,004,480 | |
UBS AG, | | | | | | | | | | | | | | | | |
144A, 1 Month LIBOR + 0.260% | | | 2.763 | (c) | | | 09/03/19 | | | | 170,000 | | | | 170,035,700 | |
See Notes to Financial Statements.
| | | | |
| Prudential Investment Portfolios 2/PGIM Core Ultra Short Bond Fund | | | 53 | |
PGIM Core Ultra Short Bond Fund
Schedule of Investments (continued)
as of January 31, 2019
| | | | | | | | | | | | | | | | |
| | | | |
| Description | | Interest
Rate | | | Maturity
Date | | | Principal
Amount (000)# | | | Value | |
| | | | |
COMMERCIAL PAPER (Continued) | | | | | | | | | | | | | | | | |
UBS AG, (cont’d.) | | | | | | | | | | | | | | | | |
144A, 1 Month LIBOR + 0.420% | | | 2.919 | %(c) | | | 05/31/19 | | | | 94,000 | | | $ | 94,076,892 | |
University of Texas System Board of Regents Revenue Financing | | | 2.580 | | | | 03/21/19 | | | | 17,000 | | | | 17,002,210 | |
Westpac Banking Corp.,
144A, 1 Month LIBOR + 0.250% | | | 2.771 | (c) | | | 02/08/19 | | | | 90,000 | | | | 90,006,840 | |
| | | | | | | | | | | | | | | | |
TOTAL COMMERCIAL PAPER
(cost $7,879,188,727) | | | | | | | | | | | | | | | 7,880,502,296 | |
| | | | | | | | | | | | | | | | |
| | | | |
CORPORATE BONDS 1.1% | | | | | | | | | | | | | | | | |
| | | | |
Auto Manufacturers 0.7% | | | | | | | | | | | | | | | | |
Toyota Motor Credit Corp., | | | | | | | | | | | | | | | | |
Sr. Unsec’d. Notes, MTN, 3 Month LIBOR + 0.060%, | | | 2.676 | (c) | | | 05/15/19 | | | | 136,000 | | | | 135,999,626 | |
Sr. Unsec’d. Notes, MTN, 3 Month LIBOR + 0.140%, | | | 2.754 | (c) | | | 11/14/19 | | | | 16,000 | | | | 16,004,864 | |
| | | | | | | | | | | | | | | | |
| | | | | | | | | | | | | | | 152,004,490 | |
| | | | |
Banks 0.4% | | | | | | | | | | | | | | | | |
Citibank NA, | | | | | | | | | | | | | | | | |
Sr. Unsec’d. Notes, 3 Month LIBOR + 0.260%, | | | 3.061 | (c) | | | 09/18/19 | | | | 34,000 | | | | 34,045,441 | |
Sr. Unsec’d. Notes, 3 Month LIBOR + 0.340%, | | | 3.132 | (c) | | | 03/20/19 | | | | 14,000 | | | | 14,004,817 | |
Nordea Bank Abp (Finland), | | | | | | | | | | | | | | | | |
Sr. Unsec’d. Notes, 144A, MTN | | | 2.375 | | | | 04/04/19 | | | | 21,000 | | | | 20,988,870 | |
| | | | | | | | | | | | | | | | |
| | | | | | | | | | | | | | | 69,039,128 | |
| | | | | | | | | | | | | | | | |
TOTAL CORPORATE BONDS
(cost $220,991,304) | | | | | | | | | | | | | | | 221,043,618 | |
| | | | | | | | | | | | | | | | |
| | | | |
MUNICIPAL BOND 0.3% | | | | | | | | | | | | | | | | |
| | | | |
Texas | | | | | | | | | | | | | | | | |
University of Texas System (The), Rev., Subser. G2, Rfdg., FRDD (Mandatory put date 02/07/19)
(cost $60,815,000) | | | 2.400 | (cc) | | | 08/01/45 | | | | 60,815 | | | | 60,815,000 | |
| | | | | | | | | | | | | | | | |
See Notes to Financial Statements.
| | | | | | | | | | | | | | | | |
| Description | | | | | | | | Principal
Amount (000)# | | | Value | |
REPURCHASE AGREEMENTS(m) 27.3% | | | | | | | | | | | | | | | | |
Amherst Pierpont Securities LLC, | | | | | | | | | | | | | | | | |
2.42%, dated 01/30/19, due 02/06/19 in the amount of $130,061,172 | | | | | | | | | | | 130,000 | | | $ | 130,000,000 | |
2.44%, dated 01/31/19, due 02/07/19 in the amount of $130,061,678 | | | | | | | | | | | 130,000 | | | | 130,000,000 | |
2.58%, dated 01/31/19, due 02/01/19 in the amount of $250,017,917 | | | | | | | | | | | 250,000 | | | | 250,000,000 | |
Bank of Montreal, | | | | | | | | | | | | | | | | |
2.53%, dated 01/31/19, due 02/01/19 in the amount of $91,338,419 | | | | | | | | | | | 91,332 | | | | 91,332,000 | |
BNP Paribas SA, | | | | | | | | | | | | | | | | |
2.45%, dated 01/31/19, due 02/01/19 in the amount of $150,010,208 | | | | | | | | | | | 150,000 | | | | 150,000,000 | |
2.58%, dated 01/31/19, due 02/01/19 in the amount of $105,007,525 | | | | | | | | | | | 105,000 | | | | 105,000,000 | |
2.60%, dated 01/31/19, due 02/01/19 in the amount of $300,021,667 | | | | | | | | | | | 300,000 | | | | 300,000,000 | |
CF Secured LLC, | | | | | | | | | | | | | | | | |
2.57%, dated 01/31/19, due 02/01/19 in the amount of $300,021,417 | | | | | | | | | | | 300,000 | | | | 300,000,000 | |
2.58%, dated 01/31/19, due 02/01/19 in the amount of $300,021,500 | | | | | | | | | | | 300,000 | | | | 300,000,000 | |
Credit Agricole Corporate and Investment Bank, | | | | | | | | | | | | | | | | |
2.40%, dated 01/25/19, due 02/01/19 in the amount of $155,072,333 | | | | | | | | | | | 155,000 | | | | 155,000,000 | |
2.41%, dated 01/29/19, due 02/05/19 in the amount of $153,902,086 | | | | | | | | | | | 153,830 | | | | 153,830,000 | |
2.41%, dated 01/30/19, due 02/06/19 in the amount of $140,065,606 | | | | | | | | | | | 140,000 | | | | 140,000,000 | |
2.45%, dated 01/31/19, due 02/07/19 in the amount of $130,061,931 | | | | | | | | | | | 130,000 | | | | 130,000,000 | |
2.57%, dated 01/31/19, due 02/01/19 in the amount of $265,018,918 | | | | | | | | | | | 265,000 | | | | 265,000,000 | |
HSBC Securities (USA) Inc., | | | | | | | | | | | | | | | | |
2.41%, dated 01/30/19, due 02/05/19 in the amount of $240,096,400 | | | | | | | | | | | 240,000 | | | | 240,000,000 | |
2.41%, dated 01/30/19, due 02/06/19 in the amount of $237,111,061 | | | | | | | | | | | 237,000 | | | | 237,000,000 | |
2.44%, dated 01/31/19, due 02/07/19 in the amount of $100,047,444 | | | | | | | | | | | 100,000 | | | | 100,000,000 | |
See Notes to Financial Statements.
| | | | |
| Prudential Investment Portfolios 2/PGIM Core Ultra Short Bond Fund | | | 55 | |
PGIM Core Ultra Short Bond Fund
Schedule of Investments (continued)
as of January 31, 2019
| | | | | | | | | | | | | | | | |
| | | | |
| Description | | | | | | | | Principal
Amount (000)# | | | Value | |
|
REPURCHASE AGREEMENTS (Continued) | |
Merrill Lynch, | | | | | | | | | | | | | | | | |
2.56%, dated 01/31/19, due 02/01/19 in the amount of $150,010,667 | | | | | | | | | | | 150,000 | | | $ | 150,000,000 | |
2.57%, dated 01/31/19, due 02/01/19 in the amount of $288,188,572 | | | | | | | | | | | 288,168 | | | | 288,168,000 | |
MUFG Securities (Canada) Ltd., | | | | | | | | | | | | | | | | |
2.40%, dated 01/30/19, due 02/06/19 in the amount of $150,070,000 | | | | | | | | | | | 150,000 | | | | 150,000,000 | |
2.44%, dated 01/31/19, due 02/07/19 in the amount of $406,763,895 | | | | | | | | | | | 406,571 | | | | 406,571,000 | |
2.55%, dated 01/31/19, due 02/01/19 in the amount of $400,028,333 | | | | | | | | | | | 400,000 | | | | 400,000,000 | |
NatWest Markets Securities Inc., | | | | | | | | | | | | | | | | |
2.39%, dated 01/25/19, due 02/01/19 in the amount of $125,058,090 | | | | | | | | | | | 125,000 | | | | 125,000,000 | |
2.49%, dated 01/31/19, due 02/07/19 in the amount of $255,123,463 | | | | | | | | | | | 255,000 | | | | 255,000,000 | |
Nomura Securities International, Inc., | | | | | | | | | | | | | | | | |
2.58%, dated 01/31/19, due 02/01/19 in the amount of $575,041,208 | | | | | | | | | | | 575,000 | | | | 575,000,000 | |
TD Securities (USA) LLC, | | | | | | | | | | | | | | | | |
2.57%, dated 01/31/19, due 02/01/19 in the amount of $200,014,278 | | | | | | | | | | | 200,000 | | | | 200,000,000 | |
| | | | | | | | | | | | | | | | |
TOTAL REPURCHASE AGREEMENTS
(cost $5,726,901,000) | | | | 5,726,901,000 | |
| | | | | | | | | | | | | | | | |
| | | | |
| | | Interest
Rate | | | Maturity
Date | | | | | | | |
| | | | |
TIME DEPOSITS 2.0% | | | | | | | | | | | | | | | | |
Australia & New Zealand Banking Group | | | 2.830 | % | | | 04/15/19 | | | | 43,000 | | | | 43,000,000 | |
Australia & New Zealand Banking Group | | | 2.820 | | | | 04/23/19 | | | | 177,500 | | | | 177,500,000 | |
Northern Trust Co. (The) | | | 2.340 | | | | 02/01/19 | | | | 205,684 | | | | 205,684,000 | |
| | | | | | | | | | | | | | | | |
TOTAL TIME DEPOSITS
(cost $426,184,000) | | | | 426,184,000 | |
| | | | | | | | | | | | | | | | |
|
U.S. GOVERNMENT AGENCY OBLIGATIONS 2.5% | |
Federal Farm Credit Bank, 1 Month LIBOR + (0.070)% (Cap N/A, Floor 0.000%) | | | 2.432 | (c) | | | 01/28/20 | | | | 67,000 | | | | 66,966,245 | |
Federal Home Loan Bank, 3 Month LIBOR + (0.280)% (Cap N/A, Floor 0.000%) | | | 2.261 | (c) | | | 02/01/19 | | | | 103,000 | | | | 103,000,000 | |
See Notes to Financial Statements.
| | | | | | | | | | | | | | | | |
| | | | |
| Description | | Interest
Rate | | | Maturity
Date | | | Principal
Amount (000)# | | | Value | |
|
U.S. GOVERNMENT AGENCY OBLIGATIONS (Continued) | |
Federal Home Loan Mortgage Corp., MTN, 1 Month LIBOR + (0.100)% (Cap N/A, Floor 0.000%) | | | 2.413 | %(c) | | | 03/18/19 | | | | 156,000 | | | $ | 155,994,091 | |
Federal Home Loan Mortgage Corp., MTN, 3 Month LIBOR + (0.225)% (Cap N/A, Floor 0.000%) | | | 2.466 | (c) | | | 08/27/19 | | | | 205,000 | | | | 204,987,439 | |
| | | | | | | | | | | | | | | | |
TOTAL U.S. GOVERNMENT AGENCY OBLIGATIONS
(cost $531,000,000) | | | | 530,947,775 | |
| | | | | | | | | | | | | | | | |
| | | | |
U.S. TREASURY OBLIGATIONS 6.0% | | | | | | | | | | | | | | | | |
U.S. Treasury Bills | | | 2.410 | (n) | | | 03/26/19 | | | | 208,000 | | | | 207,279,613 | |
U.S. Treasury Bills | | | 2.419 | (n) | | | 03/05/19 | | | | 396,000 | | | | 395,161,573 | |
U.S. Treasury Bills | | | 2.425 | (n) | | | 04/02/19 | | | | 658,000 | | | | 655,548,555 | |
| | | | | | | | | | | | | | | | |
TOTAL U.S. TREASURY OBLIGATIONS
(cost $1,258,101,895) | | | | | | | | | | | | | | | 1,257,989,741 | |
| | | | | | | | | | | | | | | | |
| | | | |
TOTAL INVESTMENTS 105.3%
(cost $22,088,222,131) | | | | | | | | | | | | | | | 22,091,256,049 | |
Liabilities in excess of other assets (5.3)% | | | | | | | | | | | | | | | (1,115,882,950 | ) |
| | | | | | | | | | | | | | | | |
| | | | |
NET ASSETS 100.0% | | | | | | | | | | | | | | $ | 20,975,373,099 | |
| | | | | | | | | | | | | | | | |
See the Glossary for abbreviations used in the annual report:
| # | Principal amount is shown in U.S. dollars unless otherwise stated. |
| (c) | Variable rate instrument. The interest rate shown reflects the rate in effect at January 31, 2019. |
| (cc) | Variable rate instrument. The rate shown is based on the latest available information as of January 31, 2019. Certain variable rate securities are not based on a published reference rate and spread but are determined by the issuer or agent and are based on current market conditions. These securities do not indicate a reference rate and spread in their description. |
| (m) | Repurchase agreements are collateralized by ADBB (coupon rate 2.375%, maturity date 08/10/27), FCSB (coupon rate 3.320%, maturity date 03/14/30), FHLB (coupon rates 1.375%-4.080%, maturity dates 09/28/20-05/25/33), FHLMC (coupon rates 0.000%-8.000%, maturity dates 06/01/19-01/01/49), FNMA (coupon rates 0.000%-7.000%, maturity dates 06/01/19-06/01/51), GNMA (coupon rates 2.500%-6.000%, maturity dates 01/15/37-01/20/66), International Finance Corp. (coupon rate 1.125%, maturity date 07/20/21), TVA (coupon rates 0.000%-5.880%, maturity dates 05/01/19-04/01/56) and U.S. Treasury Securities (coupon rates 0.000%-3.500%, maturity dates 02/07/19-11/15/47), with the aggregate value, including accrued interest, of $5,842,412,209. |
| (n) | Rate shown reflects yield to maturity at purchased date. |
Fair Value Measurements:
Various inputs are used in determining the value of the Fund’s investments. These inputs are summarized in the three broad levels listed below.
See Notes to Financial Statements.
| | | | |
| Prudential Investment Portfolios 2/PGIM Core Ultra Short Bond Fund | | | 57 | |
PGIM Core Ultra Short Bond Fund
Schedule of Investments (continued)
as of January 31, 2019
Level 1—unadjusted quoted prices generally in active markets for identical securities.
Level 2—quoted prices for similar securities, interest rates and yield curves, prepayment speeds, foreign currency exchange rates and other observable inputs.
Level 3—unobservable inputs for securities valued in accordance with Board approved fair valuation procedures.
The following is a summary of the inputs used as of January 31, 2019 in valuing such portfolio securities:
| | | | | | | | | | | | |
| | | Level 1 | | | Level 2 | | | Level 3 | |
Investments in Securities | | | | | | | | | | | | |
Certificates of Deposit | | $ | — | | | $ | 5,986,872,619 | | | $ | — | |
Commercial Paper | | | — | | | | 7,880,502,296 | | | | — | |
Corporate Bonds | | | — | | | | 221,043,618 | | | | — | |
Municipal Bond | | | — | | | | 60,815,000 | | | | — | |
Repurchase Agreements | | | — | | | | 5,726,901,000 | | | | — | |
Time Deposits | | | — | | | | 426,184,000 | | | | — | |
U.S. Government Agency Obligations | | | — | | | | 530,947,775 | | | | — | |
U.S. Treasury Obligations | | | — | | | | 1,257,989,741 | | | | — | |
| | | | | | | | | | | | |
Total | | $ | — | | | $ | 22,091,256,049 | | | $ | — | |
| | | | | | | | | | | | |
Industry Classification:
The industry classification of investments and liabilities in excess of other assets shown as a percentage of net assets as of January 31, 2019 were as follows (unaudited):
| | | | |
Commercial Paper | | | 37.6 | % |
Certificates of Deposit | | | 28.5 | |
Repurchase Agreements | | | 27.3 | |
U.S. Treasury Obligations | | | 6.0 | |
U.S. Government Agency Obligations | | | 2.5 | |
Time Deposits | | | 2.0 | |
Corporate Bonds | | | 1.1 | |
Municipal Bond | | | 0.3 | % |
| | | | |
| | | 105.3 | |
Liabilities in excess of other assets | | | (5.3 | ) |
| | | | |
| | | 100.0 | % |
| | | | |
Financial Instruments/Transactions—Summary of Offsetting and Netting Arrangements:
The Fund entered into financial instruments/transactions during the reporting period that are either offset in accordance with current requirements or are subject to enforceable master netting arrangements or similar agreements that permit offsetting. The information about offsetting and related netting arrangements for financial instruments/transactions, where the legal right to set-off exists, is presented in the summary below.
Offsetting of financial instrument/transaction assets and liabilities:
| | | | | | | | | | | | | | |
Description | | Counterparty | | Gross Market
Value of
Recognized
Assets/(Liabilities) | | | Collateral
Pledged/(Received)(1) | | | Net Amount | |
Repurchase Agreements | | Amherst Pierpont
Securities LLC | | $ | 510,000,000 | | | $ | (510,000,000 | ) | | $ | — | |
See Notes to Financial Statements.
| | | | | | | | | | | | | | | | |
Description | | Counterparty | | | Gross Market
Value of
Recognized
Assets/(Liabilities) | | | Collateral
Pledged/(Received)(1) | | | Net Amount | |
Repurchase Agreements | | | Bank of Montreal | | | $ | 91,332,000 | | | $ | (91,332,000 | ) | | $ | — | |
Repurchase Agreements | | | BNP Paribas SA | | | | 555,000,000 | | | | (555,000,000 | ) | | | — | |
Repurchase Agreements | | | CF Secured LLC | | | | 600,000,000 | | | | (600,000,000 | ) | | | — | |
Repurchase Agreements | |
| Credit Agricole
Corporate and
Investment Bank |
| | | 843,830,000 | | | | (843,830,000 | ) | | | — | |
Repurchase Agreements | |
| HSBC Securities
(USA) Inc. |
| | | 577,000,000 | | | | (577,000,000 | ) | | | — | |
Repurchase Agreements | | | Merrill Lynch | | | | 438,168,000 | | | | (438,168,000 | ) | | | — | |
Repurchase Agreements | |
| MUFG Securities
(Canada) Ltd. |
| | | 956,571,000 | | | | (956,571,000 | ) | | | — | |
Repurchase Agreements | |
| NatWest Markets
Securities Inc. |
| | | 380,000,000 | | | | (380,000,000 | ) | | | — | |
Repurchase Agreements | |
| Nomura
Securities
International,
Inc. |
| | | 575,000,000 | | | | (575,000,000 | ) | | | — | |
Repurchase Agreements | |
| TD Securities
(USA) LLC |
| | | 200,000,000 | | | | (200,000,000 | ) | | | — | |
| | | | | | | | | | | | | | | | |
| | | | | | $ | 5,726,901,000 | | | | | | | | | |
| | | | | | | | | | | | | | | | |
| (1) | Collateral amount disclosed by the Fund is limited to the market value of financial instruments/transactions. |
See Notes to Financial Statements.
| | | | |
| Prudential Investment Portfolios 2/PGIM Core Ultra Short Bond Fund | | | 59 | |
PGIM Core Ultra Short Bond Fund
Statement of Assets & Liabilities
as of January 31, 2019
| | | | |
Assets | | | | |
Investments at value: | | | | |
Unaffiliated investments (cost $16,361,321,131) | | $ | 16,364,355,049 | |
Repurchase Agreements (cost $5,726,901,000) | | | 5,726,901,000 | |
Cash | | | 11,379,006 | |
Interest receivable | | | 23,391,444 | |
Prepaid expenses | | | 23,165 | |
| | | | |
Total Assets | | | 22,126,049,664 | |
| | | | |
| |
Liabilities | | | | |
Payable for investments purchased | | | 1,150,450,437 | |
Management fee payable | | | 119,151 | |
Accrued expenses and other liabilities | | | 64,593 | |
Dividends payable | | | 25,717 | |
Affiliated transfer agent fee payable | | | 16,667 | |
| | | | |
Total Liabilities | | | 1,150,676,565 | |
| | | | |
| |
Net Assets | | $ | 20,975,373,099 | |
| | | | |
| | | | | |
Net assets were comprised of: | | | | |
Shares of beneficial interest, at par | | $ | 20,971,204 | |
Paid-in capital in excess of par | | | 20,951,314,137 | |
Total distributable earnings (loss) | | | 3,087,758 | |
| | | | |
Net assets, January 31, 2019 | | $ | 20,975,373,099 | |
| | | | |
Net asset value and redemption price per share
($20,975,373,099 ÷ 20,971,204,034 shares of beneficial interest issued and outstanding) | | $ | 1.00 | |
| | | | |
See Notes to Financial Statements.
PGIM Core Ultra Short Bond Fund
Statement of Operations
Year Ended January 31, 2019
| | | | |
Net Investment Income (Loss) | | | | |
Interest income | | $ | 462,924,922 | |
| | | | |
| |
Expenses | | | | |
Management fee | | | 1,627,904 | |
Custodian and accounting fees | | | 147,482 | |
Transfer agent’s fees and expenses (including affiliated expense of $ 100,000) | | | 101,755 | |
Audit fee | | | 24,837 | |
Legal fees and expenses | | | 16,562 | |
Shareholders’ reports | | | 14,011 | |
Trustees’ fees | | | 12,300 | |
Miscellaneous | | | 53,450 | |
| | | | |
Total expenses | | | 1,998,301 | |
| | | | |
Net investment income (loss) | | | 460,926,621 | |
| | | | |
| |
Realized And Unrealized Gain (Loss) On Investments | | | | |
Net realized gain (loss) on investment transactions | | | 159,096 | |
Net change in unrealized appreciation (depreciation) on investments | | | 2,102,071 | |
| | | | |
Net gain (loss) on investment transactions | | | 2,261,167 | |
| | | | |
Net Increase (Decrease) In Net Assets Resulting From Operations | | $ | 463,187,788 | |
| | | | |
See Notes to Financial Statements.
| | | | |
| Prudential Investment Portfolios 2/PGIM Core Ultra Short Bond Fund | | | 61 | |
PGIM Core Ultra Short Bond Fund
Statements of Changes in Net Assets
| | | | | | | | |
| |
| | | Year Ended January 31, | |
| | |
| | | 2019 | | | 2018 | |
Increase (Decrease) in Net Assets | | | | | | | | |
Operations | | | | | | | | |
Net investment income (loss) | | $ | 460,926,621 | | | $ | 273,826,896 | |
Net realized gain (loss) on investment transactions | | | 159,096 | | | | 230,206 | |
Net change in unrealized appreciation (depreciation) on investments | | | 2,102,071 | | | | (3,862,277 | ) |
| | | | | | | | |
Net increase (decrease) in net assets resulting from operations | | | 463,187,788 | | | | 270,194,825 | |
| | | | | | | | |
| | |
Dividends and Distributions | | | | | | | | |
Distributions from distributable earnings* | | | (461,081,067 | ) | | | — | |
| | | | | | | | |
Dividends from net investment income | | | * | | | | (274,051,674 | ) |
| | | | | | | | |
| | |
Fund share transactions | | | | | | | | |
Net proceeds from shares sold | | | 163,467,429,404 | | | | 140,971,576,110 | |
Net asset value of shares issued in reinvestment of dividends and distributions | | | 458,861,367 | | | | 273,122,231 | |
Cost of shares reacquired | | | (165,463,731,961 | ) | | | (144,286,929,866 | ) |
| | | | | | | | |
Net increase (decrease) in net assets from Fund share transactions | | | (1,537,441,190 | ) | | | (3,042,231,525 | ) |
| | | | | | | | |
Total increase (decrease) | | | (1,535,334,469 | ) | | | (3,046,088,374 | ) |
| | |
Net Assets: | | | | | | | | |
Beginning of year | | | 22,510,707,568 | | | | 25,556,795,942 | |
| | | | | | | | |
End of year(a) | | $ | 20,975,373,099 | | | $ | 22,510,707,568 | |
| | | | | | | | |
(a) Includes undistributed/(distributions in excess of) net investment income of: | | $ | * | | | $ | 49,190 | |
| | | | | | | | |
| * | For the year ended January 31, 2019, the disclosures have been revised to reflect revisions to Regulation S-X adopted by the SEC in 2018 (refer to Note 9). |
See Notes to Financial Statements.
PGIM Institutional Money Market Fund
Schedule of Investments
as of January 31, 2019
| | | | | | | | | | | | | | | | |
| | | | |
| Description | | Interest
Rate | | | Maturity
Date | | | Principal
Amount (000)# | | | Value | |
| | | | |
SHORT-TERM INVESTMENTS 105.2% | | | | | | | | | | | | | | | | |
| | | | |
CERTIFICATES OF DEPOSIT 43.2% | | | | | | | | | | | | | | | | |
Bank of America NA, | | | | | | | | | | | | | | | | |
1 Month LIBOR + 0.150% | | | 2.657 | %(c) | | | 02/04/19 | | | | 83,000 | | | $ | 83,002,324 | |
1 Month LIBOR + 0.150% | | | 2.659 | (c) | | | 04/15/19 | | | | 96,000 | | | | 96,001,826 | |
1 Month LIBOR + 0.280% | | | 2.794 | (c) | | | 05/13/19 | | | | 135,500 | | | | 135,548,138 | |
Bank of America NA | | | 2.820 | | | | 07/01/19 | | | | 77,000 | | | | 77,033,618 | |
Bank of Montreal, | | | | | | | | | | | | | | | | |
1 Month LIBOR + 0.330% | | | 2.843 | (c) | | | 08/06/19 | | | | 140,000 | | | | 140,091,258 | |
3 Month LIBOR + 0.180% | | | 2.924 | (c) | | | 01/31/20 | | | | 38,000 | | | | 38,022,061 | |
3 Month LIBOR + 0.210% | | | 2.946 | (c) | | | 11/01/19 | | | | 165,000 | | | | 165,144,187 | |
Bank of Montreal | | | 2.740 | | | | 03/04/19 | | | | 45,000 | | | | 45,009,738 | |
Bank of Nova Scotia, | | | | | | | | | | | | | | | | |
1 Month LIBOR + 0.310% | | | 2.816 | (c) | | | 06/19/19 | | | | 114,000 | | | | 114,055,290 | |
3 Month LIBOR + 0.200% | | | 2.913 | (c) | | | 09/20/19 | | | | 70,000 | | | | 70,067,830 | |
BNP Paribas SA, | | | | | | | | | | | | | | | | |
1 Month LIBOR + 0.240% | | | 2.746 | (c) | | | 02/19/19 | | | | 152,000 | | | | 152,023,560 | |
1 Month LIBOR + 0.290% | | | 2.796 | (c) | | | 05/20/19 | | | | 25,000 | | | | 25,011,150 | |
1 Month LIBOR + 0.300% | | | 2.821 | (c) | | | 05/08/19 | | | | 80,000 | | | | 79,995,200 | |
1 Month LIBOR + 0.340% | | | 2.854 | (c) | | | 09/03/19 | | | | 133,000 | | | | 133,090,839 | |
3 Month LIBOR + 0.140% | | | 2.964 | (c) | | | 06/24/19 | | | | 5,000 | | | | 5,000,924 | |
Branch Banking & Trust Co. | | | 2.410 | | | | 02/01/19 | | | | 142,000 | | | | 142,000,028 | |
Branch Banking & Trust Co. | | | 2.410 | | | | 02/04/19 | | | | 145,000 | | | | 144,999,971 | |
Branch Banking & Trust Co. | | | 2.400 | | | | 02/06/19 | | | | 75,000 | | | | 74,999,798 | |
Canadian Imperial Bank of Commerce, | | | | | | | | | | | | | | | | |
3 Month LIBOR + 0.130% | | | 2.903 | (c) | | | 07/17/19 | | | | 81,000 | | | | 81,021,332 | |
1 Month LIBOR + 0.400% | | | 2.914 | (c) | | | 12/12/19 | | | | 51,700 | | | | 51,758,007 | |
1 Month LIBOR + 0.400% | | | 2.916 | (c) | | | 12/10/19 | | | | 133,000 | | | | 133,206,150 | |
3 Month LIBOR + 0.200% | | | 2.936 | (c) | | | 05/01/19 | | | | 40,000 | | | | 40,015,124 | |
3 Month LIBOR + 0.220% | | | 3.042 | (c) | | | 12/27/19 | | | | 29,000 | | | | 29,030,348 | |
Citibank NA | | | 2.510 | | | | 03/14/19 | | | | 78,000 | | | | 77,997,059 | |
Commonwealth Bank of Australia,
1 Month LIBOR + 0.330% | | | 2.839 | (c) | | | 03/01/19 | | | | 20,000 | | | | 20,005,980 | |
Cooperatieve Rabobank UA, | | | | | | | | | | | | | | | | |
1 Month LIBOR + 0.270% | | | 2.783 | (c) | | | 07/08/19 | | | | 186,000 | | | | 186,024,180 | |
1 Month LIBOR + 0.290% | | | 2.799 | (c) | | | 07/01/19 | | | | 100,000 | | | | 100,020,500 | |
Credit Agricole Corporate & Investment Bank, | | | | | | | | | | | | | | | | |
1 Month LIBOR + 0.320% | | | 2.826 | (c) | | | 05/20/19 | | | | 40,000 | | | | 40,021,240 | |
3 Month LIBOR + 0.090% | | | 2.894 | (c) | | | 07/08/19 | | | | 149,000 | | | | 149,049,438 | |
Credit Industriel et Commercial,
1 Month LIBOR + 0.310% | | | 2.824 | (c) | | | 06/04/19 | | | | 160,000 | | | | 160,038,240 | |
Credit Suisse AG,
3 Month LIBOR + 0.170% | | | 2.967 | (c) | | | 10/01/19 | | | | 152,000 | | | | 152,068,000 | |
See Notes to Financial Statements.
| | | | |
| Prudential Investment Portfolios 2/PGIM Institutional Money Market Fund | | | 63 | |
PGIM Institutional Money Market Fund
Schedule of Investments (continued)
as of January 31, 2019
| | | | | | | | | | | | | | | | |
| | | | |
| Description | | Interest
Rate | | | Maturity
Date | | | Principal
Amount (000)# | | | Value | |
| | |
CERTIFICATES OF DEPOSIT (Continued) | | | | | | | | | |
Lloyds Bank Corporate Markets PLC,
3 Month LIBOR + 0.220% | | | 3.017 | %(c) | | | 10/09/19 | | | | 125,000 | | | $ | 124,999,323 | |
Mitsubishi UFJ Trust and Banking Corp. | | | 2.410 | | | | 02/06/19 | | | | 125,000 | | | | 124,999,450 | |
Mizuho Bank Ltd., | | | | | | | | | | | | | | | | |
1 Month LIBOR + 0.200% | | | 2.702 | (c) | | | 07/30/19 | | | | 100,000 | | | | 99,991,100 | |
1 Month LIBOR + 0.200% | | | 2.709 | (c) | | | 04/15/19 | | | | 145,000 | | | | 144,957,950 | |
1 Month LIBOR + 0.270% | | | 2.783 | (c) | | | 04/18/19 | | | | 41,500 | | | | 41,499,104 | |
MUFG Bank Ltd., | | | | | | | | | | | | | | | | |
1 Month LIBOR + 0.300% | | | 2.802 | (c) | | | 04/30/19 | | | | 169,000 | | | | 169,040,009 | |
1 Month LIBOR + 0.300% | | | 2.806 | (c) | | | 05/21/19 | | | | 39,000 | | | | 39,018,291 | |
1 Month LIBOR + 0.300% | | | 2.816 | (c) | | | 05/10/19 | | | | 49,400 | | | | 49,413,536 | |
Natixis SA, | | | | | | | | | | | | | | | | |
3 Month LIBOR + 0.180% | | | 2.850 | (c) | | | 06/10/19 | | | | 110,000 | | | | 110,031,307 | |
1 Month LIBOR + 0.350% | | | 2.863 | (c) | | | 03/05/19 | | | | 143,000 | | | | 143,050,050 | |
3 Month LIBOR + 0.120% | | | 2.891 | (c) | | | 06/12/19 | | | | 152,300 | | | | 152,309,648 | |
3 Month LIBOR + 0.080% | | | 2.902 | (c) | | | 06/26/19 | | | | 23,000 | | | | 22,998,086 | |
3 Month LIBOR + 0.230% | | | 3.013 | (c) | | | 01/10/20 | | | | 37,000 | | | | 37,033,659 | |
Nordea Bank AB, | | | | | | | | | | | | | | | | |
3 Month LIBOR + 0.200% | | | 2.988 | (c) | | | 03/15/19 | | | | 92,000 | | | | 92,011,802 | |
3 Month LIBOR + 0.340% | | | 3.106 | (c) | | | 03/07/19 | | | | 5,000 | | | | 5,001,099 | |
Royal Bank of Canada, | | | | | | | | | | | | | | | | |
3 Month LIBOR + 0.150% | | | 2.795 | (c) | | | 05/20/19 | | | | 55,000 | | | | 55,015,860 | |
3 Month LIBOR + 0.170% | | | 2.815 | (c) | | | 02/20/19 | | | | 48,000 | | | | 48,003,696 | |
3 Month LIBOR + 0.130% | | | 2.927 | (c) | | | 07/12/19 | | | | 145,000 | | | | 145,049,462 | |
Skandinaviska Enskilda Banken AB,
3 Month LIBOR + 0.060% | | | 2.855 | (c) | | | 07/08/19 | | | | 190,000 | | | | 190,085,310 | |
Sumitomo Mitsui Banking Corp., | | | | | | | | | | | | | | | | |
1 Month LIBOR + 0.190% | | | 2.710 | (c) | | | 02/04/19 | | | | 60,000 | | | | 60,001,860 | |
3 Month LIBOR + 0.100% | | | 2.897 | (c) | | | 04/12/19 | | | | 47,000 | | | | 46,997,848 | |
3 Month LIBOR + 0.150% | | | 2.929 | (c) | | | 04/16/19 | | | | 150,000 | | | | 150,004,597 | |
Sumitomo Mitsui Banking Ltd. | | | 2.410 | | | | 02/01/19 | | | | 185,000 | | | | 185,000,037 | |
Sumitomo Mitsui Banking Ltd. | | | 2.410 | | | | 02/04/19 | | | | 60,000 | | | | 60,000,006 | |
Sumitomo Mitsui Banking Ltd. | | | 2.820 | | | | 03/18/19 | | | | 145,000 | | | | 145,055,666 | |
Svenska Handelsbanken AB, | | | | | | | | | | | | | | | | |
1 Month LIBOR + 0.190% | | | 2.696 | (c) | | | 02/20/19 | | | | 87,000 | | | | 87,011,658 | |
1 Month LIBOR + 0.300% | | | 2.813 | (c) | | | 08/06/19 | | | | 50,000 | | | | 50,022,558 | |
3 Month LIBOR + 0.100% | | | 2.861 | (c) | | | 01/22/20 | | | | 100,000 | | | | 100,053,500 | |
1 Month LIBOR + 0.370% | | | 2.883 | (c) | | | 12/06/19 | | | | 29,000 | | | | 29,030,160 | |
Svenska Handelsbanken AB | | | 2.620 | | | | 02/26/19 | | | | 25,000 | | | | 25,002,290 | |
Swedbank AB, | | | | | | | | | | | | | | | | |
1 Month LIBOR + 0.190% | | | 2.700 | (c) | | | 02/25/19 | | | | 170,000 | | | | 170,029,070 | |
See Notes to Financial Statements.
| | | | | | | | | | | | | | | | |
| | | | |
| Description | | Interest
Rate | | | Maturity
Date | | | Principal
Amount (000)# | | | Value | |
| | |
CERTIFICATES OF DEPOSIT (Continued) | | | | | | | | | |
Swedbank AB, (cont’d.) | | | | | | | | | | | | | | | | |
1 Month LIBOR + 0.290% | | | 2.800 | %(c) | | | 07/25/19 | | | | 145,000 | | | $ | 144,993,065 | |
Toronto-Dominion Bank (The),
3 Month LIBOR + 0.080% | | | 2.870 | (c) | | | 03/21/19 | | | | 117,000 | | | | 117,002,941 | |
US Bank NA, | | | | | | | | | | | | | | | | |
1 Month LIBOR + 0.240% | | | 2.742 | (c) | | | 06/26/19 | | | | 129,000 | | | | 128,994,895 | |
1 Month LIBOR + 0.350% | | | 2.856 | (c) | | | 09/19/19 | | | | 65,000 | | | | 65,049,140 | |
US Bank NA | | | 2.910 | | | | 07/23/19 | | | | 40,000 | | | | 40,035,176 | |
US Bank NA | | | 2.990 | | | | 08/05/19 | | | | 100,000 | | | | 100,122,900 | |
Wells Fargo Bank NA, | | | | | | | | | | | | | | | | |
3 Month LIBOR + 0.160% | | | 2.957 | (c) | | | 08/13/19 | | | | 118,000 | | | | 118,140,757 | |
3 Month LIBOR + 0.210% | | | 2.983 | (c) | | | 04/16/19 | | | | 40,000 | | | | 40,021,665 | |
3 Month LIBOR + 0.230% | | | 3.009 | (c) | | | 04/16/19 | | | | 130,000 | | | | 130,075,448 | |
Westpac Banking Corp.,
1 Month LIBOR + 0.400% | | | 2.914 | (c) | | | 03/14/19 | | | | 130,000 | | | | 130,062,270 | |
| | | | | | | | | | | | | | | | |
TOTAL CERTIFICATES OF DEPOSIT
(cost $6,856,575,883) | | | | | | | | | | | | | | | 6,858,569,587 | |
| | | | | | | | | | | | | | | | |
| | | | |
COMMERCIAL PAPER 28.2% | | | | | | | | | | | | | | | | |
ABN AMRO Funding USA LLC, 144A | | | 2.670 | (n) | | | 03/04/19 | | | | 91,000 | | | | 90,793,084 | |
Australia & New Zealand Banking Group Ltd.,
144A,3 Month LIBOR + 0.150% | | | 2.917 | (c) | | | 10/10/19 | | | | 210,000 | | | | 209,998,906 | |
Bank of Nova Scotia,
144A,3 Month LIBOR + 0.080% | | | 2.671 | (c) | | | 08/08/19 | | | | 165,000 | | | | 165,033,201 | |
BASF SE, | | | | | | | | | | | | | | | | |
144A | | | 2.730 | (n) | | | 03/25/19 | | | | 40,000 | | | | 39,847,712 | |
144A | | | 2.730 | (n) | | | 03/26/19 | | | | 48,000 | | | | 47,813,376 | |
Canadian Imperial Bank of Commerce,
144A,1 Month LIBOR + 0.300% | | | 2.820 | (c) | | | 07/29/19 | | | | 60,000 | | | | 60,033,420 | |
CDP Financial, Inc.,
144A | | | 2.640 | (n) | | | 04/15/19 | | | | 85,000 | | | | 84,550,443 | |
Commonwealth Bank of Australia, | | | | | | | | | | | | | | | | |
144A, 1 Month LIBOR + 0.330% | | | 2.830 | (c) | | | 02/28/19 | | | | 137,000 | | | | 137,038,634 | |
144A, 3 Month LIBOR + 0.100% | | | 2.879 | (c) | | | 01/17/20 | | | | 135,500 | | | | 135,499,878 | |
144A, 3 Month LIBOR + 0.180% | | | 2.886 | (c) | | | 11/22/19 | | | | 110,000 | | | | 110,077,733 | |
DNB Bank ASA, | | | | | | | | | | | | | | | | |
144A | | | 2.440 | (n) | | | 02/27/19 | | | | 145,000 | | | | 144,737,477 | |
144A, 3 Month LIBOR + 0.050% | | | 2.815 | (c) | | | 01/23/20 | | | | 25,000 | | | | 24,997,612 | |
Federation Des Caisses Desjardins,
144A, 1 Month LIBOR + 0.300% | | | 2.780 | (c) | | | 06/20/19 | | | | 90,000 | | | | 90,013,500 | |
See Notes to Financial Statements.
| | | | |
| Prudential Investment Portfolios 2/PGIM Institutional Money Market Fund | | | 65 | |
PGIM Institutional Money Market Fund
Schedule of Investments(continued)
as of January 31, 2019
| | | | | | | | | | | | | | | | |
| | | | |
| Description | | Interest Rate | | | Maturity Date | | | Principal Amount (000)# | | | Value | |
| | | | |
COMMERCIAL PAPER (Continued) | | | | | | | | | | | | | | | | |
Federation Des Caisses Desjardins, (cont’d.) | | | | | | | | | | | | | | | | |
144A | | | 2.620 | %(n) | | | 03/28/19 | | | | 50,000 | | | $ | 49,801,510 | |
144A | | | 2.740 | (n) | | | 04/01/19 | | | | 20,000 | | | | 19,914,666 | |
144A, 1 Month LIBOR + 0.370% | | | 2.881 | (c) | | | 12/09/19 | | | | 60,000 | | | | 60,064,440 | |
HSBC Bank PLC, | | | | | | | | | | | | | | | | |
144A, 1 Month LIBOR + 0.270% | | | 2.776 | (c) | | | 05/22/19 | | | | 149,000 | | | | 149,056,173 | |
144A, 3 Month LIBOR + 0.190% | | | 2.781 | (c) | | | 08/08/19 | | | | 105,000 | | | | 105,074,226 | |
144A, 3 Month LIBOR + 0.200% | | | 2.818 | (c) | | | 09/25/19 | | | | 31,000 | | | | 31,029,031 | |
HSBC USA, Inc., | | | | | | | | | | | | | | | | |
144A,3 Month LIBOR + 0.170% | | | 2.953 | (c) | | | 10/10/19 | | | | 80,000 | | | | 79,997,664 | |
ING US Funding LLC, | | | | | | | | | | | | | | | | |
1 Month LIBOR + 0.300% | | | 2.802 | (c) | | | 07/26/19 | | | | 151,000 | | | | 151,062,212 | |
1 Month LIBOR + 0.290% | | | 2.811 | (c) | | | 07/08/19 | | | | 109,000 | | | | 109,043,600 | |
1 Month LIBOR + 0.310% | | | 2.812 | (c) | | | 05/28/19 | | | | 135,000 | | | | 135,064,530 | |
JPMorgan Securities LLC, | | | | | | | | | | | | | | | | |
144A, 3 Month LIBOR + 0.200% | | | 2.709 | (c) | | | 07/29/19 | | | | 17,000 | | | | 17,003,224 | |
144A, 1 Month LIBOR + 0.230% | | | 2.742 | (c) | | | 04/23/19 | | | | 132,000 | | | | 132,044,880 | |
1 Month LIBOR + 0.300% | | | 2.814 | (c) | | | 06/12/19 | | | | 95,000 | | | | 95,042,750 | |
144A, 3 Month LIBOR + 0.230% | | | 2.819 | (c) | | | 11/06/19 | | | | 57,000 | | | | 57,008,453 | |
144A, 3 Month LIBOR + 0.170% | | | 2.967 | (c) | | | 10/09/19 | | | | 68,000 | | | | 67,999,604 | |
144A, 3 Month LIBOR + 0.240% | | | 3.037 | (c) | | | 01/08/20 | | | | 42,000 | | | | 42,015,246 | |
National Australia Bank Ltd., | | | | | | | | | | | | | | | | |
144A, 1 Month LIBOR + 0.220% | | | 2.740 | (c) | | | 08/01/19 | | | | 70,000 | | | | 70,001,050 | |
Nordea Bank AB, | | | | | | | | | | | | | | | | |
144A | | | 2.700 | (n) | | | 03/01/19 | | | | 76,000 | | | | 75,849,512 | |
OMERS Finance Trust, | | | | | | | | | | | | | | | | |
144A | | | 2.620 | (n) | | | 02/19/19 | | | | 31,913 | | | | 31,871,382 | |
144A | | | 2.690 | (n) | | | 03/04/19 | | | | 50,000 | | | | 49,888,710 | |
144A | | | 2.690 | (n) | | | 03/06/19 | | | | 45,000 | | | | 44,893,408 | |
144A | | | 2.700 | (n) | | | 03/08/19 | | | | 25,000 | | | | 24,937,200 | |
144A | | | 2.700 | (n) | | | 03/11/19 | | | | 6,000 | | | | 5,983,633 | |
144A | | | 2.700 | (n) | | | 03/13/19 | | | | 25,000 | | | | 24,928,193 | |
144A | | | 2.750 | (n) | | | 03/21/19 | | | | 26,690 | | | | 26,597,799 | |
Province of Alberta, | | | | | | | | | | | | | | | | |
144A | | | 2.570 | (n) | | | 03/12/19 | | | | 25,000 | | | | 24,930,918 | |
144A | | | 2.620 | (n) | | | 03/28/19 | | | | 7,000 | | | | 6,972,636 | |
PSP Capital, Inc., | | | | | | | | | | | | | | | | |
144A | | | 2.800 | (n) | | | 07/22/19 | | | | 20,000 | | | | 19,736,362 | |
Royal Bank of Canada, | | | | | | | | | | | | | | | | |
144A, 1 Month LIBOR + 0.320% | | | 2.627 | (c) | | | 08/15/19 | | | | 170,000 | | | | 170,075,820 | |
144A, 1 Month LIBOR + 0.280% | | | 2.786 | (c) | | | 05/20/19 | | | | 7,000 | | | | 7,002,877 | |
Santander UK PLC | | | 2.750 | (n) | | | 04/15/19 | | | | 225,000 | | | | 223,785,022 | |
See Notes to Financial Statements.
| | | | | | | | | | | | | | | | |
| | | | |
| Description | | Interest Rate | | | Maturity Date | | | Principal Amount (000)# | | | Value | |
| | | | |
COMMERCIAL PAPER (Continued) | | | | | | | | | | | | | | | | |
Toronto-Dominion Bank (The), | | | | | | | | | | | | | | | | |
144A, 3 Month LIBOR + 0.140% | | | 2.699 | %(c) | | | 05/02/19 | | | | 32,000 | | | $ | 32,009,219 | |
144A, 3 Month LIBOR + 0.190% | | | 2.791 | (c) | | | 08/09/19 | | | | 164,000 | | | | 164,124,319 | |
Total Capital Canada Ltd., 144A | | | 2.700 | (n) | | | 04/04/19 | | | | 223,500 | | | | 222,497,938 | |
Toyota Credit Canada, Inc.,
1 Month LIBOR + 0.250% | | | 2.763 | (c) | | | 03/01/19 | | | | 46,000 | | | | 46,010,672 | |
Toyota Finance Australia Ltd.,
3 Month LIBOR + 0.110% | | | 2.728 | (c) | | | 08/09/19 | | | | 42,000 | | | | 42,014,845 | |
Toyota Motor Finance (Netherlands) BV, | | | | | | | | | | | | | | | | |
3 Month LIBOR + 0.110% | | | 2.739 | (c) | | | 08/13/19 | | | | 40,000 | | | | 40,014,457 | |
3 Month LIBOR + 0.110% | | | 2.755 | (c) | | | 08/16/19 | | | | 64,000 | | | | 64,020,736 | |
3 Month LIBOR + 0.090% | | | 2.880 | (c) | | | 03/18/19 | | | | 4,000 | | | | 4,000,374 | |
UBS AG, | | | | | | | | | | | | | | | | |
144A, 1 Month LIBOR + 0.260% | | | 2.763 | (c) | | | 09/03/19 | | | | 124,000 | | | | 124,026,040 | |
144A, 1 Month LIBOR + 0.420% | | | 2.919 | (c) | | | 05/31/19 | | | | 96,000 | | | | 96,078,528 | |
Westpac Banking Corp., | | | | | | | | | | | | | | | | |
144A, 3 Month LIBOR + 0.120% | | | 2.881 | (c) | | | 01/17/20 | | | | 50,000 | | | | 49,985,902 | |
144A, 3 Month LIBOR + 0.180% | | | 2.886 | (c) | | | 11/22/19 | | | | 145,000 | | | | 145,090,190 | |
| | | | | | | | | | | | | | | | |
TOTAL COMMERCIAL PAPER
(cost $4,477,706,764) | | | | 4,478,984,927 | |
| | | | | | | | | | | | | | | | |
| | | | |
CORPORATE BONDS 2.2% | | | | | | | | | | | | | | | | |
| | | | |
Auto Manufacturers 0.5% | | | | | | | | | | | | | | | | |
Toyota Motor Credit Corp.,
Sr. Unsec’d. Notes, MTN, 3 Month LIBOR + 0.060% | | | 2.676 | (c) | | | 05/15/19 | | | | 70,000 | | | | 69,999,808 | |
| | | | |
Banks 1.7% | | | | | | | | | | | | | | | | |
Australia & New Zealand Banking Group Ltd.
(Australia),
Sr. Unsec’d. Notes, MTN | | | 2.250 | | | | 06/13/19 | | | | 13,904 | | | | 13,880,859 | |
Citibank NA, | | | | | | | | | | | | | | | | |
Sr. Unsec’d. Notes, 3 Month LIBOR + 0.260% | | | 3.061 | (c) | | | 09/18/19 | | | | 39,000 | | | | 39,052,124 | |
Sr. Unsec’d. Notes, 3 Month LIBOR + 0.340% | | | 3.132 | (c) | | | 03/20/19 | | | | 22,180 | | | | 22,187,632 | |
MUFG Bank Ltd. (Japan),
Sr. Unsec’d. Notes, 144A | | | 2.300 | | | | 03/10/19 | | | | 9,780 | | | | 9,776,870 | |
Santander UK PLC (United Kingdom),
Sr. Unsec’d. Notes | | | 2.500 | | | | 03/14/19 | | | | 95,000 | | | | 94,986,140 | |
See Notes to Financial Statements.
| | | | |
| Prudential Investment Portfolios 2/PGIM Institutional Money Market Fund | | | 67 | |
PGIM Institutional Money Market Fund
Schedule of Investments (continued)
as of January 31, 2019
| | | | | | | | | | | | | | | | |
| | | | |
| Description | | Interest
Rate | | | Maturity
Date | | | Principal
Amount (000)# | | | Value | |
| | | | |
CORPORATE BONDS (Continued) | | | | | | | | | | | | | | | | |
| | | | |
Banks (cont’d.) | | | | | | | | | | | | | | | | |
UBS AG (Switzerland), | | | | | | | | | | | | | | | | |
Sr. Unsec’d. Notes, 144A, 3 Month LIBOR + 0.320% | | | 3.027 | %(c) | | | 05/28/19 | | | | 70,000 | | | $ | 70,029,680 | |
US Bank NA, | | | | | | | | | | | | | | | | |
Sr. Unsec’d. Notes, 3 Month LIBOR + 0.150% | | | 2.839 | (c) | | | 05/24/19 | | | | 21,000 | | | | 21,005,050 | |
| | | | | | | | | | | | | | | | |
| | | | | | | | | | | | | | | 270,918,355 | |
| | | | | | | | | | | | | | | | |
TOTAL CORPORATE BONDS
(cost $340,838,253) | | | | | | | | | | | | | | | 340,918,163 | |
| | | | | | | | | | | | | | | | |
| | | | |
MUNICIPAL BOND 0.3% | | | | | | | | | | | | | | | | |
| | | | |
Texas | | | | | | | | | | | | | | | | |
University of Texas System (The), Fund Syst., Rev., Subser. G2, Rfdg., FRDD (Mandatory put date 02/07/19)
(cost $50,000,000) | | | 2.400 | (cc) | | | 08/01/45 | | | | 50,000 | | | | 50,000,000 | |
| | | | | | | | | | | | | | | | |
| | | | |
REPURCHASE AGREEMENTS(m) 21.1% | | | | | | | | | | | | | | | | |
Amherst Pierpont Securities LLC, | | | | | | | | | | | | | | | | |
2.42%, dated 01/30/19, due 02/06/19 in the amount of $105,049,408 | | | | | | | | | | | 105,000 | | | | 105,000,000 | |
2.44%, dated 01/31/19, due 02/07/19 in the amount of $120,056,933 | | | | | | | | | | | 120,000 | | | | 120,000,000 | |
2.58%, dated 01/31/19, due 02/01/19 in the amount of $250,017,917 | | | | | | | | | | | 250,000 | | | | 250,000,000 | |
CF Secured LLC, | | | | | | | | | | | | | | | | |
2.57%, dated 01/31/19, due 02/01/19 in the amount of $200,014,278 | | | | | | | | | | | 200,000 | | | | 200,000,000 | |
2.58%, dated 01/31/19, due 02/01/19 in the amount of $200,014,333 | | | | | | | | | | | 200,000 | | | | 200,000,000 | |
Credit Agricole Corporate & Investment Bank, | | | | | | | | | | | | | | | | |
2.40%, dated 01/25/19, due 02/01/19 in the amount of $130,060,667 | | | | | | | | | | | 130,000 | | | | 130,000,000 | |
2.41%, dated 01/29/19, due 02/05/19 in the amount of $100,046,861 | | | | | | | | | | | 100,000 | | | | 100,000,000 | |
2.41%, dated 01/30/19, due 02/06/19 in the amount of $100,046,861 | | | | | | | | | | | 100,000 | | | | 100,000,000 | |
2.45%, dated 01/31/19, due 02/07/19 in the amount of $125,059,549 | | | | | | | | | | | 125,000 | | | | 125,000,000 | |
2.57%, dated 01/31/19, due 02/01/19 in the amount of $200,014,278 | | | | | | | | | | | 200,000 | | | | 200,000,000 | |
See Notes to Financial Statements.
| | | | | | | | | | | | | | | | |
| | | | |
| Description | | | | | | | | Principal
Amount (000)# | | | Value | |
| | | | |
REPURCHASE AGREEMENTS (Continued) | | | | | | | | | | | | | | | | |
HSBC Securities (USA), Inc., | | | | | | | | | | | | | | | | |
2.41%, dated 01/30/19, due 02/06/19 in the amount of $185,086,693 | | | | | | | | | | | 185,000 | | | $ | 185,000,000 | |
2.41%, dated 01/30/19, due 02/05/19 in the amount of $185,074,308 | | | | | | | | | | | 185,000 | | | | 185,000,000 | |
2.44%, dated 01/31/19, due 02/07/19 in the amount of $100,047,444 | | | | | | | | | | | 100,000 | | | | 100,000,000 | |
MUFG Securities (Canada) Ltd., | | | | | | | | | | | | | | | | |
2.40%, dated 01/30/19, due 02/06/19 in the amount of $135,063,000 | | | | | | | | | | | 135,000 | | | | 135,000,000 | |
2.44%, dated 01/31/19, due 02/07/19 in the amount of $300,142,333 | | | | | | | | | | | 300,000 | | | | 300,000,000 | |
2.55%, dated 01/31/19, due 02/01/19 in the amount of $250,017,708 | | | | | | | | | | | 250,000 | | | | 250,000,000 | |
Nomura Securities International, Inc., | | | | | | | | | | | | | | | | |
2.58%, dated 01/31/19, due 02/01/19 in the amount of $325,023,292 | | | | | | | | | | | 325,000 | | | | 325,000,000 | |
RBS Securities, Inc., | | | | | | | | | | | | | | | | |
2.39%, dated 01/25/19, due 02/01/19 in the amount of $110,051,119 | | | | | | | | | | | 110,000 | | | | 110,000,000 | |
2.49%, dated 01/31/19, due 02/07/19 in the amount of $220,106,517 | | | | | | | | | | | 220,000 | | | | 220,000,000 | |
| | | | | | | | | | | | | | | | |
TOTAL REPURCHASE AGREEMENTS
(cost $3,340,000,000) | | | | | | | | | | | | | | | 3,340,000,000 | |
| | | | | | | | | | | | | | | | |
| | | | |
| | | Interest
Rate | | | Maturity
Date | | | | | | | |
| | | | |
TIME DEPOSITS 2.3% | | | | | | | | | | | | | | | | |
ABN AMRO Bank NV | | | 2.410 | % | | | 02/05/19 | | | | 200,000 | | | | 200,000,000 | |
Northern Trust Co. (The) | | | 2.340 | | | | 02/01/19 | | | | 64,988 | | | | 64,988,000 | |
Toronto-Dominion Bank (The) | | | 2.400 | | | | 02/01/19 | | | | 100,000 | | | | 100,000,000 | |
| | | | | | | | | | | | | | | | |
TOTAL TIME DEPOSITS
(cost $364,988,000) | | | | | | | | | | | | | | | 364,988,000 | |
| | | | | | | | | | | | | | | | |
| | | | |
U.S. TREASURY OBLIGATIONS(n) 7.9% | | | | | | | | | | | | | | | | |
U.S. Treasury Bills | | | 2.376 | | | | 03/26/19 | | | | 308,000 | | | | 306,933,273 | |
U.S. Treasury Bills | | | 2.377 | | | | 02/26/19 | | | | 150,000 | | | | 149,754,427 | |
U.S. Treasury Bills | | | 2.386 | | | | 03/05/19 | | | | 300,000 | | | | 299,364,828 | |
See Notes to Financial Statements.
| | | | |
| Prudential Investment Portfolios 2/PGIM Institutional Money Market Fund | | | 69 | |
PGIM Institutional Money Market Fund
Schedule of Investments (continued)
as of January 31, 2019
| | | | | | | | | | | | | | | | |
| | | | |
| Description | | Interest
Rate | | | Maturity
Date | | | Principal
Amount (000)# | | | Value | |
| | | | |
U.S. TREASURY OBLIGATIONS (Continued) | | | | | | | | | | | | | | | | |
U.S. Treasury Bills | | | 2.392 | % | | | 04/02/19 | | | | 498,000 | | | $ | 496,144,651 | |
| | | | | | | | | | | | | | | | |
TOTAL U.S. TREASURY OBLIGATIONS
(cost $1,252,277,764) | | | | | | | | | | | | | | | 1,252,197,179 | |
| | | | | | | | | | | | | | | | |
| | | | |
TOTAL INVESTMENTS 105.2%
(cost $16,682,386,664) | | | | | | | | | | | | | | | 16,685,657,856 | |
Liabilities in excess of other assets (5.2)% | | | | | | | | | | | | | | | (818,541,541 | ) |
| | | | | | | | | | | | | | | | |
| | | | |
NET ASSETS 100.0% | | | | | | | | | | | | | | $ | 15,867,116,315 | |
| | | | | | | | | | | | | | | | |
See the Glossary for abbreviations used in the annual report.
| # | Principal amount is shown in U.S. dollars unless otherwise stated. |
| (c) | Variable rate instrument. The interest rate shown reflects the rate in effect at January 31, 2019. |
| (cc) | Variable rate instrument. The rate shown is based on the latest available information as of January 31, 2019. Certain variable rate securities are not based on a published reference rate and spread but are determined by the issuer or agent and are based on current market conditions. These securities do not indicate a reference rate and spread in their description. |
| (m) | Repurchase agreements are collateralized by FCSB (coupon rates 2.200%-2.630%, maturity dates 02/24/25-03/08/27), FHLB (coupon rate 0.000%, maturity date 02/13/19), FHLMC (coupon rates 0.000%-7.500%, maturity dates 05/01/23-01/01/49), FNMA (coupon rates 0.000%-6.250%, maturity dates 10/09/19-01/01/57), GNMA (coupon rates 2.950%-5.000%, maturity dates 08/20/33-10/20/68), TVA (coupon rates 0.000%-5.880%, maturity dates 05/01/19-09/15/65) and U.S. Treasury Securities (coupon rates 0.000%-3.625%, maturity dates 02/05/19-05/15/48), with the aggregate value, including accrued interest, of $3,407,581,128. |
| (n) | Rate shown reflects yield to maturity at purchased date. |
Fair Value Measurements:
Various inputs are used in determining the value of the Fund’s investments. These inputs are summarized in the three broad levels listed below.
Level 1—unadjusted quoted prices generally in active markets for identical securities.
Level 2—quoted prices for similar securities, interest rates and yield curves, prepayment speeds, foreign currency exchange rates and other observable inputs.
Level 3—unobservable inputs for securities valued in accordance with Board approved fair valuation procedures.
The following is a summary of the inputs used as of January 31, 2019 in valuing such portfolio securities:
| | | | | | | | | | | | |
| | | Level 1 | | | Level 2 | | | Level 3 | |
Investments in Securities | | | | | | | | | | | | |
Certificates of Deposit | | $ | — | | | $ | 6,858,569,587 | | | $ | — | |
Commercial Paper | | | — | | | | 4,478,984,927 | | | | — | |
See Notes to Financial Statements.
| | | | | | | | | | | | |
| | | Level 1 | | | Level 2 | | | Level 3 | |
Investments in Securities (continued) | | | | | | | | | | | | |
Corporate Bonds | | $ | — | | | $ | 340,918,163 | | | $ | — | |
Municipal Bond | | | — | | | | 50,000,000 | | | | — | |
Repurchase Agreements | | | — | | | | 3,340,000,000 | | | | — | |
Time Deposits | | | — | | | | 364,988,000 | | | | — | |
U.S. Treasury Obligations | | | — | | | | 1,252,197,179 | | | | — | |
| | | | | | | | | | | | |
Total | | $ | — | | | $ | 16,685,657,856 | | | $ | — | |
| | | | | | | | | | | | |
Industry Classification:
The industry classification of investments and liabilities in excess of other assets shown as a percentage of net assets as of January 31, 2019 were as follows (unaudited):
| | | | |
Certificates of Deposit | | | 43.2 | % |
Commercial Paper | | | 28.2 | |
Repurchase Agreements | | | 21.1 | |
U.S. Treasury Obligations | | | 7.9 | |
Time Deposits | | | 2.3 | |
Corporate Bonds | | | 2.2 | |
Municipal Bond | | | 0.3 | % |
| | | | |
| | | 105.2 | |
Liabilities in excess of other assets | | | (5.2 | ) |
| | | | |
| | | 100.0 | % |
| | | | |
Financial Instruments/Transactions—Summary of Offsetting and Netting Arrangements:
The Fund entered into financial instruments/transactions during the reporting period that are either offset in accordance with current requirements or are subject to enforceable master netting arrangements or similar agreements that permit offsetting. The information about offsetting and related netting arrangements for financial instruments/transactions, where the legal right to set-off exists, is presented in the summary below.
Offsetting of financial instrument/transaction assets and liabilities:
| | | | | | | | | | | | | | |
Description | | Counterparty | | Gross Market
Value of
Recognized
Assets/(Liabilities) | | | Collateral
Pledged/(Received)(1) | | | Net Amount | |
Repurchase Agreements | | Amherst Pierpont
Securities LLC | | $ | 475,000,000 | | | $ | (475,000,000 | ) | | $ | — | |
Repurchase Agreements | | CF Secured LLC | | | 400,000,000 | | | | (400,000,000 | ) | | | — | |
Repurchase Agreements | | Credit Agricole
Corporate &
Investment Bank | | | 655,000,000 | | | | (655,000,000 | ) | | | — | |
Repurchase Agreements | | HSBC Securities
(USA), Inc. | | | 470,000,000 | | | | (470,000,000 | ) | | | — | |
Repurchase Agreements | | MUFG Securities
(Canada) Ltd. | | | 685,000,000 | | | | (685,000,000 | ) | | | — | |
Repurchase Agreements | | Nomura Securities
International, Inc. | | | 325,000,000 | | | | (325,000,000 | ) | | | — | |
See Notes to Financial Statements.
| | | | |
| Prudential Investment Portfolios 2/PGIM Institutional Money Market Fund | | | 71 | |
PGIM Institutional Money Market Fund
Schedule of Investments (continued)
as of January 31, 2019
| | | | | | | | | | | | | | | | |
Description | | Counterparty | | | Gross Market
Value of
Recognized
Assets/(Liabilities) | | | Collateral
Pledged/(Received)(1) | | | Net Amount | |
Repurchase Agreements | | | RBS Securities, Inc. | | | $ | 330,000,000 | | | $ | (330,000,000 | ) | | $ | — | |
| | | | | | | | | | | | | | | | |
| | | | | | $ | 3,340,000,000 | | | | | | | | | |
| | | | | | | | | | | | | | | | |
| (1) | Collateral amount disclosed by the Fund is limited to the market value of financial instruments/transactions. |
See Notes to Financial Statements.
PGIM Institutional Money Market Fund
Statement of Assets & Liabilities
as of January 31, 2019
| | | | |
Assets | | | | |
Investments, at amortized cost which approximates fair value: | | | | |
Unaffiliated investments (cost $13,342,386,664) | | $ | 13,345,657,856 | |
Repurchase Agreements (cost $3,340,000,000) | | | 3,340,000,000 | |
Interest receivable | | | 26,231,026 | |
Prepaid expenses | | | 559 | |
| | | | |
Total Assets | | | 16,711,889,441 | |
| | | | |
| |
Liabilities | | | | |
Payable for investments purchased | | | 843,417,289 | |
Management fee payable | | | 860,215 | |
Accrued expenses and other liabilities | | | 251,983 | |
Payable to custodian | | | 226,972 | |
Affiliated transfer agent fee payable | | | 16,667 | |
| | | | |
Total Liabilities | | | 844,773,126 | |
| | | | |
| |
Net Assets | | $ | 15,867,116,315 | |
| | | | |
| | | | | |
Net assets were comprised of: | | | | |
Shares of beneficial interest, at par | | $ | 15,863,933 | |
Paid-in capital in excess of par | | | 15,848,006,221 | |
Total distributable earnings (loss) | | | 3,246,161 | |
| | | | |
Net assets, January 31, 2019 | | $ | 15,867,116,315 | |
| | | | |
| |
Class D | | | | |
Net asset value, offering price and redemption price per share,
($15,867,116,315 ÷ 15,863,933,148 shares of beneficial interest issued and outstanding) | | $ | 1.0002 | |
| | | | |
See Notes to Financial Statements.
| | | | |
| Prudential Investment Portfolios 2/PGIM Institutional Money Market Fund | | | 73 | |
PGIM Institutional Money Market Fund
Statement of Operations
Year Ended January 31, 2019
| | | | |
Net Investment Income (Loss) | | | | |
Interest income | | $ | 339,418,511 | |
| | | | |
| |
Expenses | | | | |
Management fee | | | 22,994,856 | |
Custodian and accounting fees | | | 721,920 | |
Transfer agent’s fees and expenses (including affiliated expense of $ 100,000) | | | 170,788 | |
Audit fee | | | 25,217 | |
Shareholders’ reports | | | 17,619 | |
Legal fees and expenses | | | 17,011 | |
Trustees’ fees | | | 11,628 | |
Miscellaneous | | | 50,862 | |
| | | | |
Total expenses | | | 24,009,901 | |
Less: Fee waiver and/or expense reimbursement | | | (13,278,968 | ) |
| | | | |
Net expenses | | | 10,730,933 | |
| | | | |
Net investment income (loss) | | | 328,687,578 | |
| | | | |
| |
Realized And Unrealized Gain (Loss) On Investments | | | | |
Net realized gain (loss) on investment transactions | | | 169,393 | |
Net change in unrealized appreciation (depreciation) on investments | | | 2,539,841 | |
| | | | |
Net gain (loss) on investment transactions | | | 2,709,234 | |
| | | | |
Net Increase (Decrease) In Net Assets Resulting From Operations | | $ | 331,396,812 | |
| | | | |
See Notes to Financial Statements.
PGIM Institutional Money Market Fund
Statements of Changes in Net Assets
| | | | | | | | |
| |
| | | Year Ended January 31, | |
| | |
| | | 2019 | | | 2018 | |
Increase (Decrease) in Net Assets | | | | | | | | |
Operations | | | | | | | | |
Net investment income (loss) | | $ | 328,687,578 | | | $ | 161,405,843 | |
Net realized gain (loss) on investment transactions | | | 169,393 | | | | 120,526 | |
Net change in unrealized appreciation (depreciation) on investments | | | 2,539,841 | | | | (1,664,890 | ) |
| | | | | | | | |
Net increase (decrease) in net assets resulting from operations | | | 331,396,812 | | | | 159,861,479 | |
| | | | | | | | |
| | |
Dividends and Distributions | | | | | | | | |
Distributions from distributable earnings* | | | (328,883,958 | ) | | | — | |
| | | | | | | | |
Dividends from net investment income | | | * | | | | (161,524,644 | ) |
| | | | | | | | |
| | |
Fund share transactions | | | | | | | | |
Net proceeds from shares sold | | | 81,211,001,798 | | | | 69,720,645,020 | |
Net asset value of shares issued in reinvestment of dividends and distributions | | | 328,741,536 | | | | 161,510,624 | |
Cost of shares reacquired | | | (78,890,660,286 | ) | | | (70,103,039,166 | ) |
| | | | | | | | |
Net increase (decrease) in net assets from Fund share transactions | | | 2,649,083,048 | | | | (220,883,522 | ) |
| | | | | | | | |
Total increase (decrease) | | | 2,651,595,902 | | | | (222,546,687 | ) |
| | |
Net Assets: | | | | | | | | |
Beginning of year | | | 13,215,520,413 | | | | 13,438,067,100 | |
| | | | | | | | |
End of year(a) | | $ | 15,867,116,315 | | | $ | 13,215,520,413 | |
| | | | | | | | |
(a) Includes undistributed/(distributions in excess of) net investment income of: | | $ | * | | | $ | 12,357 | |
| | | | | | | | |
| * | For the year ended January 31, 2019, the disclosures have been revised to reflect revisions to Regulation S-X adopted by the SEC in 2018 (refer to Note 9). |
See Notes to Financial Statements.
| | | | |
| Prudential Investment Portfolios 2/PGIM Institutional Money Market Fund | | | 75 | |
Glossary
The following abbreviations are used in the annual report:
144A—Security was purchased pursuant to Rule 144A under the Securities Act of 1933 and, pursuant to the requirements of Rule 144A, may not be resold except to qualified institutional buyers. Unless otherwise noted, 144A securities are deemed to be illiquid.
ABS—Asset-Backed Security
ADBB—Asian Developent Bank Bonds
AMBAC—American Municipal Bond Assurance Corp.
FCSB—First State Community Bank
FHLB—Federal Home Loan Bank
FHLMC—Federal Home Loan Mortgage Corporation
FNMA—Federal National Mortgage Association
FRDD—Floating Rate Daily Demand Note
GMTN—Global Medium Term Note
GNMA—Government National Mortgage Association
LIBOR—London Interbank Offered Rate
MTN—Medium Term Note
OTC—Over-the-counter
Q—Quarterly payment frequency for swaps
S—Semiannual payment frequency for swaps
TVA—Tennessee Valley Authority
Notes to Financial Statements
Prudential Investment Portfolios 2 (“PIP2”) is registered under the Investment Company Act of 1940, as amended (“1940 Act”), as an open-end management investment company. PIP2 consists of eleven separate series: PGIM Core Conservative Bond Fund, PGIM Core Short-Term Bond Fund, PGIM Core Ultra Short Bond Fund, PGIM Institutional Money Market Fund, PGIM Jennison Small-Cap Core Equity Fund, PGIM QMA Emerging Markets Equity Fund, PGIM QMA International Developed Markets Index Fund, PGIM QMA Mid-Cap Core Equity Fund, PGIM QMA US Broad Market Index Fund and PGIM TIPS Fund, each of which are diversified funds and PGIM QMA Commodity Strategies Fund (formerly known as Prudential Commodity Strategies Fund), which is a non-diversified fund for purposes of the 1940 Act and may invest a greater percentage of its assets in the securities of a single company or other issuer than a diversified portfolio. Investing in a non-diversified fund involves greater risk than investing in a diversified fund because a loss resulting from the decline in value of any one security may represent a greater portion of the total assets of a non-diversified fund.
These financial statements relate only to the PGIM Core Short-Term Bond Fund, the PGIM Core Ultra Short Bond Fund and the PGIM Institutional Money Market Fund (each, a “Fund” and collectively, the “Funds”). Shares of the Funds are not registered under the Securities Act of 1933, as amended. Effective June 11, 2018, the names of each Fund and the other funds which comprise PIP2 were changed by replacing “Prudential” with “PGIM” in each fund’s name.
The investment objective of each of the PGIM Core Ultra Short Bond Fund and PGIM Institutional Money Market Fund is current income consistent with the preservation of capital and the maintenance of liquidity.
The investment objective of the PGIM Core Short-Term Bond Fund is income consistent with relative stability of principal.
1. Accounting Policies
The Funds follow the investment company accounting and reporting guidance of the Financial Accounting Standards Board (“FASB”) Accounting Standard Codification (“ASC”) Topic 946 Financial Services —Investment Companies. The following accounting policies conform to U.S. generally accepted accounting principles. The Funds consistently follow such policies in the preparation of their financial statements.
Securities Valuation:Each Fund holds securities and other assets and liabilities that are fair valued at the close of each day (generally, 4:00 PM Eastern time) the New York Stock Exchange (“NYSE”) is open for trading. Fair value is the price that would be received to sell an asset or paid to transfer a liability in an orderly transaction between market participants on the measurement date. PIP2’s Board of Trustees (the “Board”) has adopted valuation
Notes to Financial Statements(continued)
procedures for security valuation under which fair valuation responsibilities have been delegated to PGIM Investments LLC (“PGIM Investments” or the “Manager”). Pursuant to the Board’s delegation, the Manager has established a Valuation Committee responsible for supervising the fair valuation of portfolio securities and other assets and liabilities. The valuation procedures permit the Funds to utilize independent pricing vendor services, quotations from market makers, and alternative valuation methods when market quotations are either not readily available or not deemed representative of fair value. A record of the Valuation Committee’s actions is subject to the Board’s review, approval, and ratification at its next regularly scheduled quarterly meeting.
For the fiscal reporting year-end, securities and other assets and liabilities were fair valued at the close of the last U.S. business day. Trading in certain foreign securities may occur when the NYSE is closed (including weekends and holidays). Because such foreign securities trade in markets that are open on weekends and U.S. holidays, the values of some of the Funds’ foreign investments may change on days when investors cannot purchase or redeem Fund shares.
Various inputs determine how each Fund’s investments are valued, all of which are categorized according to the three broad levels (Level 1, 2, or 3) detailed in the Schedule of Investments and referred to herein as the “fair value hierarchy” in accordance with FASB ASC Topic 820—Fair Value Measurements and Disclosures.
Investments in open-end, non-exchange-traded mutual funds are valued at their net asset values as of the close of the NYSE on the date of valuation. These securities are classified as Level 1 in the fair value hierarchy since they may be purchased or sold at their net asset values on the date of valuation.
Fixed income securities traded in the OTC market are generally classified as Level 2 in the fair value hierarchy. Such fixed income securities are typically valued using the market approach which generally involves obtaining data from an approved independent third-party vendor source. Each Fund utilizes the market approach as the primary method to value securities when market prices of identical or comparable instruments are available. The third-party vendors’ valuation techniques used to derive the evaluated bid price are based on evaluating observable inputs, including but not limited to, yield curves, yield spreads, credit ratings, deal terms, tranche level attributes, default rates, cash flows, prepayment speeds, broker/dealer quotations and reported trades. Certain Level 3 securities are also valued using the market approach when obtaining a single broker quote or when utilizing transaction prices for identical securities that have been used in excess of five business days. During the reporting period, there were no changes to report with respect to the valuation approach and/or valuation techniques discussed above.
OTC derivative instruments are generally classified as Level 2 in the fair value hierarchy. Such derivative instruments are typically valued using the market approach and/or income approach which generally involves obtaining data from an approved independent third-party vendor source. Each Fund utilizes the market approach when quoted prices in broker-dealer markets are available but also includes consideration of alternative valuation approaches, including the income approach. In the absence of reliable market quotations, the income approach is typically utilized for purposes of valuing OTC derivatives such as interest rate swaps based on a discounted cash flow analysis whereby the value of the instrument is equal to the present value of its future cash inflows or outflows. Such analysis includes projecting future cash flows and determining the discount rate (including the present value factors that affect the discount rate) used to discount the future cash flows. In addition, the third-party vendors’ valuation techniques used to derive the evaluated OTC derivative price is based on evaluating observable inputs, including but not limited to, underlying asset prices, indices, spreads, interest rates and exchange rates. Certain OTC derivatives may be classified as Level 3 when valued using the market approach by obtaining a single broker quote or when utilizing unobservable inputs in the income approach. During the reporting period, there were no changes to report with respect to the valuation approach and/or valuation techniques discussed above.
Centrally cleared swaps listed or traded on a multilateral or trade facility platform, such as a registered exchange, are generally valued at the daily settlement price determined by the respective exchange. These securities are classified as Level 2 in the fair value hierarchy, as the daily settlement price is not public.
Securities and other assets that cannot be priced according to the methods described above are valued based on pricing methodologies approved by the Board. In the event that unobservable inputs are used when determining such valuations, the securities will be classified as Level 3 in the fair value hierarchy.
When determining the fair value of securities, some of the factors influencing the valuation include: the nature of any restrictions on disposition of the securities; assessment of the general liquidity of the securities; the issuer’s financial condition and the markets in which it does business; the cost of the investment; the size of the holding and the capitalization of the issuer; the prices of any recent transactions or bids/offers for such securities or any comparable securities; any available analyst media or other reports or information deemed reliable by the Manager regarding the issuer or the markets or industry in which it operates. Using fair value to price securities may result in a value that is different from a security’s most recent closing price and from the price used by other unaffiliated mutual funds to calculate their net asset values.
Restricted and Illiquid Securities:Subject to guidelines adopted by the Board, the PGIM Core Ultra Short Bond Fund and PGIM Institutional Money Market Fund may invest up to 5% and the PGIM Core Short-Term Bond Fund may invest up to 15% of their respective net assets in illiquid securities, including those which are restricted as to disposition under federal securities law (“restricted securities”). Restricted securities are valued pursuant to
Notes to Financial Statements(continued)
the valuation procedures noted above. Illiquid securities are those that, because of the absence of a readily available market or due to legal or contractual restrictions on resale, may not reasonably be expected to be sold or disposed of in current market conditions in seven calendar days or less without the sale or disposition significantly changing the market value of the investment. Therefore, a Fund may find it difficult to sell illiquid securities at the time considered most advantageous by its Subadviser and may incur transaction costs that would not be incurred in the sale of securities that were freely marketable. Certain securities that would otherwise be considered illiquid because of legal restrictions on resale to the general public may be traded among qualified institutional buyers under Rule 144A of the Securities Act of 1933. These Rule 144A securities, as well as commercial paper that is sold in private placements under Section 4(2) of the Securities Act of 1933, may be deemed liquid by a Fund’s Subadviser under the guidelines adopted by the Trustees. However, the liquidity of a Fund’s investments in Rule 144A securities could be impaired if trading does not develop or declines.
Repurchase Agreements:In connection with transactions in repurchase agreements with United States financial institutions, it is each Fund’s policy that its custodian or designated subcustodians under triparty repurchase agreements, as the case may be, take possession of the underlying collateral securities, the value of which exceeds the principal amount of the repurchase transactions, including accrued interest. To the extent that any repurchase transaction exceeds one business day, the value of the collateral is marked-to-market on a daily basis to ensure the adequacy of the collateral. If the seller defaults and the value of the collateral declines or, if bankruptcy proceedings are commenced with respect to the seller of the security, realization of the collateral by the Fund may be delayed or limited.
Swap Agreements:The PGIM Core Short-Term Bond Fund entered into interest rate swap agreements. A swap agreement is an agreement to exchange the return generated by one instrument for the return generated by another instrument. Swap agreements are negotiated in the OTC market and may be executed either directly with a counterparty (“OTC-traded”) or through a central clearing facility, such as a registered exchange. Swap agreements are valued daily at current market value and any change in value is included in the net unrealized appreciation (depreciation) on swap agreements. Centrally cleared swaps pay or receive an amount known as “variation margin”, based on daily changes in the valuation of the swap contract. Any upfront premiums paid and received are shown as swap premiums paid and swap premiums received in the Statement of Assets and Liabilities. Risk of loss may exceed amounts recognized on the Statement of Assets and Liabilities. Swap agreements outstanding at period end, if any, are listed on the Schedule of Investments.
Interest Rate Swaps:Interest rate swaps represent an agreement between counterparties to exchange cash flows based on the difference between two interest rates, applied to a notional principal amount for a specified period. The PGIM Core Short-Term Bond Fund is
subject to interest rate risk exposure in the normal course of pursuing its investment objective. The Fund used interest rate swaps to maintain its ability to generate steady cash flow by receiving a stream of fixed rate payments or to increase exposure to prevailing market rates by receiving floating rate payments. The Fund’s maximum risk of loss from counterparty credit risk is the discounted net present value of the cash flows to be received from the counterparty over the contract’s remaining life.
Master Netting Arrangements:The Funds are subject to various Master Agreements, or netting arrangements, with select counterparties. These are agreements which a Subadviser may have negotiated and entered into on behalf of the Funds. A master netting arrangement between the Funds and the counterparty permits the Funds to offset amounts payable by the Funds to the same counterparty against amounts to be received; and by the receipt of collateral from the counterparty by the Funds to cover each Fund’s exposure to the counterparty. However, there is no assurance that such mitigating factors are easily enforceable. In addition to master netting arrangements, the right to set-off exists when all the conditions are met such that each of the parties owes the other determinable amounts, the reporting party has the right to set-off the amount owed with the amount owed by the other party, the reporting party intends to set-off and the right of set-off is enforceable by law. During the reporting period, there was no intention to settle on a net basis and all amounts are presented on a gross basis on the Statement of Assets and Liabilities.
PIP 2, on behalf of the PGIM Core Short-Term Bond Fund, is a party to International Swaps and Derivatives Association, Inc. (“ISDA”) Master Agreements with certain counterparties that govern OTC derivative and foreign exchange contracts entered into from time to time. The Master Agreements may contain provisions regarding, among other things, the parties’ general obligations, representations, agreements, collateral requirements, events of default and early termination. With respect to certain counterparties, in accordance with the terms of the Master Agreements, collateral posted to the Fund is held in a segregated account by the Fund’s custodian and with respect to those amounts which can be sold or re-pledged, is presented in the Schedule of Investments. Collateral pledged by the Fund is segregated by the Fund’s custodian and identified in the Schedule of Investments. Collateral can be in the form of cash or debt securities issued by the U.S. Government or related agencies or other securities as agreed to by the Fund and the applicable counterparty. Collateral requirements are determined based on the Fund’s net position with each counterparty. Termination events applicable to the Fund may occur upon a decline in the Fund’s net assets below a specified threshold over a certain period of time. Termination events applicable to counterparties may occur upon a decline in the counterparty’s long-term and short-term credit ratings below a specified level. In each case, upon occurrence, the other party may elect to terminate early and cause settlement of all derivative and foreign exchange contracts outstanding, including the payment of any losses and costs resulting from such early termination, as reasonably determined by the terminating party. Any decision by one or more of the Fund’s counterparties to elect early termination could impact the Fund’s future derivative activity.
In addition to each instrument’s primary underlying risk exposure (e.g. interest rate, credit, equity or foreign exchange, etc.), swap agreements involve, to varying degrees, elements of
Notes to Financial Statements(continued)
credit, market and documentation risk. Such risks involve the possibility that no liquid market for these agreements will exist, the counterparty to the agreement may default on its obligation to perform or disagree on the contractual terms of the agreement, and changes in net interest rates will be unfavorable. In connection with these agreements, securities in the portfolio may be identified or received as collateral from the counterparty in accordance with the terms of the respective swap agreements to provide or receive assets of value and to serve as recourse in the event of default or bankruptcy/insolvency of either party. Such OTC derivative agreements include conditions which, when materialized, give the counterparty the right to cause an early termination of the transactions under those agreements. Any election by the counterparty for early termination of the contract(s) may impact the amounts reported on financial statements.
As of January 31, 2019, the PGIM Core Short-Term Bond Fund has not met conditions under such agreements that give the counterparty the right to call for an early termination.
Securities Transactions and Net Investment Income:Securities transactions are recorded on the trade date. Realized gains (losses) from investment and currency transactions are calculated on the specific identification method. Dividend income is recorded on the ex-date, or for certain foreign securities, when the Fund becomes aware of such dividends. Interest income, including amortization of premium and accretion of discount on debt securities, as required, is recorded on the accrual basis. Expenses are recorded on an accrual basis, which may require the use of certain estimates by management that may differ from actual.
Taxes:It is each Fund’s policy to continue to meet the requirements of the Internal Revenue Code applicable to regulated investment companies and to distribute all of its taxable net investment income and capital gains, if any, to its shareholders. Therefore, no federal income tax provision is required. Withholding taxes on foreign dividends, interest and capital gains, if any, are recorded, net of reclaimable amounts, at the time the related income is earned.
Dividends and Distributions:The PGIM Institutional Money Market Fund and PGIM Core Ultra Short Bond Fund declare all of their net investment income and net realized short-term capital gains, if any, as dividends daily to their shareholders of record at the time of such declaration and pay monthly to their shareholders of record at the time of such declaration. The Short-Term Bond Fund declares all of its net investment income as dividends daily and pays monthly to its shareholders of record at the time of such declaration. Distributions of net realized capital gains, if any, are made annually. Dividends and distributions to shareholders, which are determined in accordance with federal income tax regulations and which may differ from generally accepted accounting principles, are recorded on the
ex-date. Permanent book/tax differences relating to income and gain (loss) are reclassified amongst total distributable earnings (loss) and paid-in capital in excess of par, as appropriate.
Estimates:The preparation of financial statements requires management to make estimates and assumptions that affect the reported amounts and disclosures in the financial statements. Actual results could differ from those estimates.
2. Agreements
Under a management agreement with PIP2, PGIM Investments manages each Fund’s investment operations and administers its business affairs. Pursuant to this agreement, The Manager has responsibility for all investment management services and supervises the Subadviser’s performance of such services. PGIM Investments has entered into a subadvisory agreements with PGIM, Inc., which provides subadvisory services to the Funds through its PGIM Fixed Income unit. The subadvisory agreements provide that PGIM, Inc. will furnish investment advisory services in connection with the management of the Funds. In connection therewith, PGIM, Inc. is obligated to keep certain books and records of each Fund. For its services on the PGIM Core Ultra Short Bond Fund and PGIM Core Short Term Bond Fund, PGIM, Inc. is reimbursed by PGIM Investments for direct costs, excluding profit and overhead, incurred by PGIM, Inc. in furnishing services to PGIM Investments. PGIM Investments pays for the services of PGIM, Inc. on the PGIM Institutional Money Market Fund, the cost of compensation of officers of the Fund, occupancy and certain clerical and administrative expenses of the Fund. The Fund bears all other costs and expenses.
The PGIM Core Ultra Short Bond Fund and PGIM Core Short Term Bond Fund reimburse PGIM Investments for its costs and expenses incurred in managing each Fund’s investment operations and administering its business affairs. The costs are accrued daily and payable monthly. For the year ended January 31, 2019, such costs were at an effective annual rate of 0.008% for the PGIM Core Ultra Short Bond Fund and 0.023% for the PGIM Core Short-Term Bond Fund. The management fee paid to the Manager by the PGIM Institutional Money Market Fund was accrued daily and payable monthly at an annual rate of 0.15% of the average daily net assets of the Fund. All amounts paid or payable by the Portfolio to the Manager, under the agreement, are reflected in the Statement of Operations.
The Manager has contractually agreed through May 31, 2020, to limit the total annual operating expenses after fee waivers and/or expense reimbursements to 0.07% of the PGIM Institutional Money Market Fund’s average daily net assets. This contractual waiver excludes interest, brokerage, taxes (such as income and foreign withholding taxes, stamp duty and deferred tax expenses), acquired fund fees and expenses, extraordinary expenses and certain other Fund expenses such as dividend and interest expense and broker charges on short sales. Expenses waived/reimbursed by the Manager in accordance with this agreement may be recouped by the Manager within the same fiscal year during which such waiver/reimbursement is made if such recoupment can be realized without exceeding the expense limit in effect at the time of the recoupment for that fiscal year.
Notes to Financial Statements(continued)
PGIM Investments and PGIM, Inc. are indirect, wholly-owned subsidiaries of Prudential Financial, Inc. (“Prudential”).
3. Other Transactions with Affiliates
Prudential Mutual Fund Services LLC (“PMFS”), an affiliate of PGIM Investments and an indirect, wholly-owned subsidiary of Prudential, serves as each Fund’s transfer agent. Transfer agent’s fees and expenses in the Statement of Operations include certain out-of-pocket expenses paid to non-affiliates, where applicable.
The Funds may enter into certain securities purchase or sale transactions under Board approved Rule 17a-7 procedures. Rule 17a-7 is an exemptive rule under the 1940 Act, that subject to certain conditions, permits purchase and sale transactions among affiliated investment companies, or between an investment company and a person that is affiliated solely by reason of having a common (or affiliated) investment adviser, common directors, and/or common officers. Pursuant to the Rule 17a-7 procedures and consistent with guidance issued by the SEC, the Fund’s Chief Compliance Officer (“CCO”) prepares a quarterly summary of all such transactions for submission to the Board, together with the CCO’s written representation that all such 17a-7 transactions were effected in accordance with the Fund’s Rule 17a-7 procedures. Any 17a-7 transactions for the reporting period are disclosed in the “Portfolio Securities” notes section.
The PGIM Core Short-Term Bond Fund may invest its overnight sweep cash in the PGIM Core Ultra Short Bond Fund (the “Core Fund”). Through the Portfolios’ investments in the mentioned underlying fund, PGIM Investments and/or its affiliates are paid fees or reimbursed for providing their services. Earnings from the Core Fund are disclosed on the Statement of Operations as “Affiliated dividend income”.
4. Portfolio Securities
The aggregate cost of purchases and proceeds from sales of portfolio securities, other than short-term investments and U.S. Treasury securities for the year ended January 31, 2019, were as follows:
| | | | | | | | |
Fund | | Cost of
Purchases | | | Proceeds
from Sales | |
PGIM Core Short-Term Bond Fund | | $ | 1,286,109,083 | | | $ | 787,919,604 | |
PGIM Core Ultra Short Bond Fund* | | | 2,332,864,820 | | | | 1,644,338,214 | |
| * | Although floating rate daily demand notes are shown as short-term investments in the Schedule of Investments due to frequent reset of coupon rates, they have long-term maturities and are included in these purchase and sale amounts, along with securities which had a maturity beyond one year of acquisition. |
For the year ended January 31, 2019, the Funds’ purchases and sales transactions under Rule 17a-7 and realized gain as a result of 17a-7 sales transactions were as follows:
| | | | | | | | | | | | |
| | | Purchases | | | Sales | | | Realized
Gain | |
PGIM Core Ultra Short Bond Fund | | $ | — | | | $ | 2,702,960 | | | $ | — | |
PGIM Institutional Money Market Fund | | | — | | | | 2,002,171 | | | | — | |
A summary of the cost of purchases and proceeds from sales of shares of affiliated mutual funds for the year ended January 31, 2019, is presented as follows:
PGIM Core Short-Term Bond Fund:
| | | | | | | | | | | | | | | | | | | | | | | | | | | | |
Value,
Beginning
of Year | | Cost of
Purchases | | | Proceeds
from Sales | | | Change in
Unrealized
Gain
(Loss) | | | Realized
Gain
(Loss) | | | Value,
End of Year | | | Shares,
End
of Year | | | Income | |
PGIM Core Ultra Short Bond Fund | |
| $ 43,031,606 | | $ | 1,698,175,482 | | | $ | 1,714,121,000 | | | $ | — | | | $ | — | | | $ | 27,086,088 | | | | 27,086,088 | | | $ | 1,263,282 | |
| | | | | | | | | | | | | | | | | | | | | | | | | | | | |
5. Distributions and Tax Information
Distributions to shareholders, which are determined in accordance with federal income tax regulations and which may differ from generally accepted accounting principles, are recorded on the ex-date. In order to present total distributable earnings (loss) and paid-in capital in excess of par on the Statement of Assets and Liabilities that more closely represent their tax character, certain adjustments have been made to total distributable earnings (loss) and paid-in capital in excess of par.
For the year ended January 31, 2019 the adjustments were as follows:
| | | | | | | | | | | | |
Fund | | Total Distributable
Earnings | | | Total Distributable
Loss | | | Paid-in
Capital in
Excess of Par | |
PGIM Core Short-Term Bond Fund(a) | | $ | — | | | $ | 18,751,109 | | | $ | (18,751,109 | ) |
PGIM Core Ultra Short Bond Fund | | | — | | | | — | | | | — | |
PGIM Institutional Money Market
Fund(b) | | | 1,860 | | | | — | | | | (1,860 | ) |
| (a) | Expiration of capital loss carryforward. |
| (b) | Reclassification of overdistribution. |
Net investment income (loss), net realized gains (losses) and net assets were not affected by these adjustments.
Notes to Financial Statements(continued)
The tax character of distributions paid during the year ended January 31, 2019 were as follows:
| | | | | | | | |
Fund | | Ordinary
Income | | | Long-Term
Capital Gains | |
PGIM Core Short-Term Bond Fund | | $ | 90,774,156 | | | $ | — | |
PGIM Core Ultra Short Bond Fund | | | 461,077,853 | | | | 3,214 | |
PGIM Institutional Money Market Fund | | | 328,868,902 | | | | 15,056 | |
The tax character of distributions paid during the year ended January 31, 2018 were as follows:
| | | | | | | | |
Fund | | Ordinary
Income | | | Long Term
Capital Gains | |
PGIM Core Short-Term Bond Fund | | $ | 68,735,210 | | | $ | — | |
PGIM Core Ultra Short Bond Fund | | | 274,049,382 | | | | 2,292 | |
PGIM Institutional Money Market Fund | | | 161,524,644 | | | | — | |
As of January 31, 2019, the accumulated undistributed earnings on a tax basis were as follows:
| | | | |
Fund | | Accumulated
Ordinary
Income | |
PGIM Core Short-Term Bond Fund | | $ | 6,886,222 | |
PGIM Core Ultra Short Bond Fund | | | 79,557 | |
PGIM Institutional Money Market Fund | | | — | |
The United States federal income tax basis of the Funds’ investments and the net unrealized appreciation (depreciation) as of January 31, 2019 were as follows:
| | | | | | | | | | | | | | | | |
Fund | | Tax Basis | | | Gross
Unrealized
Appreciation | | | Gross
Unrealized
Depreciation | | | Net
Unrealized
Appreciation
(Depreciation) | |
PGIM Core Short-Term Bond Fund | | $ | 2,922,895,841 | | | $ | 33,399,811 | | | $ | (43,188,988 | ) | | $ | (9,789,177 | ) |
PGIM Core Ultra Short Bond Fund | | | 22,088,222,131 | | | | 3,382,677 | | | | (348,759 | ) | | | 3,033,918 | |
PGIM Institutional Money Market Fund | | | 16,682,398,925 | | | | 3,506,996 | | | | (248,065 | ) | | | 3,258,931 | |
The difference between book basis and tax basis was primarily attributable to deferred losses on wash sales.
Under the Regulated Investment Company Modernization Act of 2010 (the “Act”), the Funds are permitted to carryforward capital losses realized on or after February 1, 2011 (“post-enactment losses”) for an unlimited period. Post-enactment losses are required to be utilized before the utilization of losses incurred prior to the effective date of the Act. As a result of this ordering rule, capital loss carryforwards related to taxable years ending before January 31, 2012 (“pre-enactment losses”) may have an increased likelihood to expire unused. Additionally, post-enactment capital losses that are carried forward will retain their character as either short-term or long-term capital losses rather than being considered all short-term as under previous law. For the year ended January 31, 2019, approximately $18,751,000 of pre-enactment losses for the PGIM Core Short-Term Bond Fund were written off unused due to expiration. As of January 31, 2019, the PGIM Core Short-Term Bond Fund has post-enactment losses of approximately $17,849,000 which can be carried forward for an unlimited period. No capital gains distributions are expected to be paid to shareholders until net gains have been realized in excess of such losses.
The Manager has analyzed the Funds’ tax positions taken on federal, state and local income tax returns for all open tax years and has concluded that no provision for income tax is required in the Funds’ financial statements for the current reporting period. The Funds’ federal, state and local income and federal excise tax returns for tax years for which the applicable statutes of limitations have not expired are subject to examination by the Internal Revenue Service and state departments of revenue.
6. Capital and Ownership
Shares of the PGIM Core Short-Term Bond Fund, the PGIM Core Ultra Short Bond Fund and the PGIM Institutional Money Market Fund are available only to investment companies managed by PGIM Investments and, as applicable, certain investment advisory clients of PGIM, Inc. As of January 31, 2019, 100% of the shares outstanding of each Fund were owned by such entities of which four shareholders held 31% of outstanding shares of the PGIM Core Ultra Short Bond Fund, three shareholders held 86% of outstanding shares of the PGIM Core Short-Term Bond Fund and three shareholders held 27% of outstanding shares of the PGIM Institutional Money Market Fund.
PIP 2 has authorized an unlimited number of shares of beneficial interest at $0.001 par value per share.
Notes to Financial Statements(continued)
Transactions in shares of beneficial interest were as follows:
| | | | | | | | | | | | | | | | |
| | | PGIM Core Short-Term
Bond Fund | | | PGIM Core Ultra Short
Bond Fund | |
| | | Shares | | | Amount | | | Shares | | | Amount | |
Year ended January 31, 2019: | | | | | | | | | | | | | | | | |
Shares sold | | | 20,711,402 | | | $ | 191,892,918 | | | | 163,467,439,838 | | | $ | 163,467,429,404 | |
Shares issued in reinvestment of dividends and distributions | | | 5,230,648 | | | | 48,423,637 | | | | 458,861,367 | | | | 458,861,367 | |
Shares reacquired | | | (46,477,878 | ) | | | (430,663,918 | ) | | | (165,463,731,961 | ) | | | (165,463,731,961 | ) |
| | | | | | | | | | | | | | | | |
Net increase (decrease) in shares outstanding | | | (20,535,828 | ) | | $ | (190,347,363 | ) | | | (1,537,430,756 | ) | | $ | (1,537,441,190 | ) |
| | | | | | | | | | | | | | | | |
Year ended January 31, 2018: | | | | | | | | | | | | | | | | |
Shares sold | | | 3,837,382 | | | $ | 35,707,576 | | | | 140,971,576,109 | | | $ | 140,971,576,110 | |
Shares issued in reinvestment of dividends and distributions | | | 7,399,751 | | | | 68,732,516 | | | | 273,122,231 | | | | 273,122,231 | |
Shares reacquired | | | (3,837,382 | ) | | | (35,707,576 | ) | | | (144,286,929,866 | ) | | | (144,286,929,866 | ) |
| | | | | | | | | | | | | | | | |
Net increase (decrease) in shares outstanding | | | 7,399,751 | | | $ | 68,732,516 | | | | (3,042,231,526 | ) | | $ | (3,042,231,525 | ) |
| | | | | | | | | | | | | | | | |
| | | |
| | | | | | | | | PGIM Institutional Money
Market Fund | |
| | | | | | | | | Shares | | | Amount | |
Year ended January 31, 2019: | | | | | | | | | | | | | | | | |
Shares sold | | | | | | | | | | | 81,207,388,588 | | | $ | 81,211,001,798 | |
Shares issued in reinvestment of dividends and distributions | | | | | | | | | | | 328,731,291 | | | | 328,741,536 | |
Shares reacquired | | | | | | | | | | | (78,887,041,634 | ) | | | (78,890,660,286 | ) |
| | | | | | | | | | | | | | | | |
Net increase (decrease) in shares outstanding | | | | | | | | | | | 2,649,078,245 | | | $ | 2,649,083,048 | |
| | | | | | | | | | | | | | | | |
Year ended January 31, 2018: | | | | | | | | | | | | | | | | |
Shares sold | | | | | | | | | | | 69,711,122,719 | | | $ | 69,720,645,020 | |
Shares issued in reinvestment of dividends and distributions | | | | | | | | | | | 161,491,067 | | | | 161,510,624 | |
Shares reacquired | | | | | | | | | | | (70,093,366,208 | ) | | | (70,103,039,166 | ) |
| | | | | | | | | | | | | | | | |
Net increase (decrease) in shares outstanding | | | | | | | | | | | (220,752,422 | ) | | $ | (220,883,522 | ) |
| | | | | | | | | | | | | | | | |
7. Borrowings
PIP 2, on behalf of the PGIM Core Short-Term Bond Fund, along with other affiliated registered investment companies (the “Funds”), is a party to a Syndicated Credit Agreement (“SCA”) with a group of banks. The purpose of the SCA is to provide an alternative source of temporary funding for capital share redemptions. The SCA provides for a commitment of $900 million for the period October 4, 2018 through October 3, 2019. The Funds pay an annualized commitment fee of 0.15% of the unused portion of the SCA. The Fund’s portion of the commitment fee for the unused amount, allocated based upon a method approved by the Board, is accrued daily and paid quarterly. The interest on borrowings under the SCA is
paid monthly and at a per annum interest rate based upon a contractual spread plus the higher of (1) the effective federal funds rate, (2) the 1-month LIBOR rate or (3) zero percent.
Certain affiliated registered investment companies that are parties to the SCA include portfolios that are subject to a predetermined mathematical formula used to manage certain benefit guarantees offered under variable annuity contracts. The formula may result in large scale asset flows into and out of these portfolios. Consequently, these portfolios may be more likely to utilize the SCA for purposes of funding redemptions. It may be possible for those portfolios to fully exhaust the committed amount of the SCA, thereby requiring the Manager to allocate available funding per a Board-approved methodology designed to treat the Funds in the SCA equitably.
The PGIM Core Short-Term Bond Fund did not utilize the SCA during the year ended January 31, 2019.
8. Risks of Investing in the Funds
The Funds’ risks include, but are not limited to, some or all of the risks discussed below:
Bond Obligations Risk:The Fund’s holdings, share price, yield and total return may fluctuate in response to bond market movements. The value of bonds may decline for issuer-related reasons, including management performance, financial leverage and reduced demand for the issuer’s goods and services. Certain types of fixed-income obligations also may be subject to “call and redemption risk,” which is the risk that the issuer may call a bond held by the Fund for redemption before it matures and the Fund may not be able to reinvest at the same level and therefore would earn less income.
Derivatives Risk:Derivatives involve special risks and costs and may result in losses to the Fund. The successful use of derivatives requires sophisticated management, and, to the extent that derivatives are used, the Fund will depend on the Subadviser’s ability to analyze and manage derivative transactions. The prices of derivatives may move in unexpected ways, especially in abnormal market conditions. Some derivatives are “leveraged” and therefore may magnify or otherwise increase investment losses to the Fund. Other risks arise from the potential inability to terminate or sell derivatives positions. A liquid secondary market may not always exist for the Fund’s derivatives positions. In fact, many OTC derivative instruments will not have liquidity beyond the counterparty to the instrument. OTC derivative instruments also involve the risk that the other party will not meet its obligations to the Fund.
Foreign Securities Risk:The Fund’s investments in securities of foreign issuers or issuers with significant exposure to foreign markets involve additional risk. Foreign countries in which the Fund may invest may have markets that are less liquid, less regulated and more volatile than US markets. The value of the Fund’s investments may decline because of factors affecting the particular issuer as well as foreign markets and issuers generally, such as unfavorable government actions, and political or financial instability.
Notes to Financial Statements(continued)
Interest Rate Risk:The value of an investment may go down when interest rates rise. A rise in rates tends to have a greater impact on the prices of longer term or duration securities. When interest rates fall, the issuers of debt obligations may prepay principal more quickly than expected, and the Fund may be required to reinvest the proceeds at a lower interest rate. This is referred to as “prepayment risk.” When interest rates rise, debt obligations may be repaid more slowly than expected, and the value of the Fund’s holdings may fall sharply. This is referred to as “extension risk. The Fund may face a heightened level of interest rate risk as a result of the U.S. Federal Reserve Board’s policies. The Fund’s investments may lose value if short-term or long-term interest rates rise sharply or in a manner not anticipated by the Subadviser.
Liquidity Risk:The Funds may invest in instruments that trade in lower volumes and are less liquid than other investments. Liquidity risk exists when particular investments made by the Fund are difficult to purchase or sell. Liquidity risk includes the risk that the Fund may make investments that may become less liquid in response to market developments or adverse investor perceptions. Investments that are illiquid or that trade in lower volumes may be more difficult to value. If a Fund is forced to sell these investments to pay redemption proceeds or for other reasons, the Fund may lose money. In addition, when there is no willing buyer and investments may not reasonably be expected to be sold or disposed of in current market conditions in seven calendar days or less without the sale or disposition significantly changing the market value of the investment, the Fund may incur higher transaction costs when executing trade orders of a given size. The reduction in dealer market-making capacity in the fixed-income markets that has occurred in recent years also has the potential to reduce liquidity. An inability to sell a portfolio position can adversely affect the Fund’s value or prevent the Fund from being able to take advantage of other investment opportunities.
Market and Credit Risk:Securities markets may be volatile and the market prices of the Fund’s securities may decline. Securities fluctuate in price based on changes in an issuer’s financial condition and overall market and economic conditions. If the market prices of the securities owned by the Fund fall, the value of an investment in the Fund will decline. Additionally, the Fund may also be exposed to credit risk in the event that an issuer or guarantor fails to perform or that an institution or entity with which the Fund has unsettled or open transactions defaults.
9. Recent Accounting Pronouncements and Reporting Updates
In August 2018, the Securities and Exchange Commission (the “SEC”) adopted amendments to Regulation S-X to update and simplify the disclosure requirements for registered investment companies by eliminating requirements that are redundant or duplicative of US GAAP requirements or other SEC disclosure requirements. The new
amendments require the presentation of the total, rather than the components, of distributable earnings on the Statement of Assets and Liabilities and the total, rather than the components, of dividends from net investment income and distributions from net realized gains on the Statements of Changes in Net Assets. The amendments also removed the requirement for the parenthetical disclosure of undistributed net investment income on the Statements of Changes in Net Assets and certain tax adjustments that were reflected in the Notes to Financial Statements. The Manager has adopted the amendments and reflected them in the Fund’s financial statements.
In August 2018, the FASB issued Accounting Standards Update (“ASU”) No. 2018-13, which changes certain fair value measurement disclosure requirements. The new ASU, in addition to other modifications and additions, removes the requirement to disclose the amount and reasons for transfers between Level 1 and Level 2 of the fair value hierarchy, and the Fund’s policy for the timing of transfers between levels. The amendments are effective for financial statements issued for fiscal years beginning after December 15, 2019, and interim periods within those fiscal years. The Manager has evaluated the implications of certain provisions of the ASU and has determined to early adopt aspects related to the removal and modification of certain fair value measurement disclosures under the ASU effective immediately. At this time, the Manager is evaluating the implications of certain other provisions of the ASU related to new disclosure requirements and any impact on the financial statement disclosures has not yet been determined.
PGIM Core Short-Term Bond Fund
Financial Highlights
| | | | | | | | | | | | | | | | | | | | |
| | | | | | Year Ended January 31, | |
| | | 2019(a) | | | 2018(a) | | | 2017(a) | | | 2016(a) | | | 2015 | |
| Per Share Operating Performance: | | | | | | | | | | | | | | | | | | | | |
| Net Asset Value, Beginning of Year | | | $9.28 | | | | $9.27 | | | | $9.28 | | | | $9.33 | | | | $9.33 | |
| Income (loss) from investment operations: | | | | | | | | | | | | | | | | | | | | |
| Net investment income (loss) | | | 0.26 | | | | 0.19 | | | | 0.14 | | | | 0.13 | | | | 0.16 | |
| Net realized and unrealized gain (loss) on investment transactions | | | (0.04 | ) | | | 0.03 | | | | 0.02 | | | | (0.03 | ) | | | (0.04 | ) |
| Total from investment operations | | | 0.22 | | | | 0.22 | | | | 0.16 | | | | 0.10 | | | | 0.12 | |
| Less Dividends and Distributions: | | | | | | | | | | | | | | | | | | | | |
| Dividends from net investment income | | | (0.28 | ) | | | (0.21 | ) | | | (0.17 | ) | | | (0.15 | ) | | | (0.12 | ) |
| Net asset value, end of year | | | $9.22 | | | | $9.28 | | | | $9.27 | | | | $9.28 | | | | $9.33 | |
| Total Return(b): | | | 2.42% | | | | 2.36% | | | | 1.78% | | | | 1.04% | | | | 1.28% | |
| |
| Ratios/Supplemental Data: | |
| Net assets, end of year (000) | | | $2,911,225 | | | | $3,119,050 | | | | $3,050,290 | | | | $2,994,467 | | | | $3,652,005 | |
| Average net assets (000) | | | $2,997,474 | | | | $3,082,883 | | | | $3,021,138 | | | | $3,403,519 | | | | $3,649,937 | |
| Ratios to average net assets(c): | | | | | | | | | | | | | | | | | | | | |
| Expenses after waivers and/or expense reimbursement | | | 0.03% | | | | 0.03% | | | | 0.03% | | | | 0.03% | | | | 0.03% | |
| Expenses before waivers and/or expense reimbursement | | | 0.03% | | | | 0.03% | | | | 0.03% | | | | 0.03% | | | | 0.03% | |
| Net investment income (loss) | | | 2.76% | | | | 2.04% | | | | 1.50% | | | | 1.34% | | | | 1.71% | |
| Portfolio turnover rate(d) | | | 35% | | | | 53% | | | | 29% | | | | 25% | | | | 34% | |
| (a) | Calculated based on average shares outstanding during the year. |
| (b) | Total return is calculated assuming a purchase of a share on the first day and a sale on the last day of each year reported and includes reinvestment of dividends and distributions, if any. Total returns may reflect adjustments to conform to generally accepted accounting principles. |
| (c) | Does not include expenses of the underlying funds in which the Fund invests. |
| (d) | The Fund’s portfolio turnover rate is calculated in accordance with regulatory requirements, without regard to transactions involving short term investments and certain derivatives. If such transactions were included, the Fund’s portfolio turnover rate may be higher. |
See Notes to Financial Statements.
PGIM Core Ultra Short Bond Fund
Financial Highlights
| | | | | | | | | | | | | | | | | | | | |
| | | Year Ended January 31, | |
| | | 2019(a) | | | 2018(a) | | | 2017(a) | | | 2016(a) | | | 2015 | |
| Per Share Operating Performance: | | | | | | | | | | | | | | | | | | | | |
| Net Asset Value, Beginning of Year | | | $1.00 | | | | $1.00 | | | | $1.00 | | | | $1.00 | | | | $1.00 | |
| Income (loss) from investment operations: | | | | | | | | | | | | | | | | | | | | |
| Net investment income (loss) | | | 0.02 | | | | 0.01 | | | | 0.01 | | | | - | (b) | | | - | (b) |
| Net realized and unrealized gain (loss) on investment transactions | | | - | (b) | | | - | (b) | | | - | (b) | | | - | | | | - | |
| Total from investment operations | | | 0.02 | | | | 0.01 | | | | 0.01 | | | | - | | | | - | |
| Less Dividends and Distributions: | | | | | | | | | | | | | | | | | | | | |
| Dividends from net investment income | | | (0.02 | ) | | | (0.01 | ) | | | (0.01 | ) | | | - | (b) | | | - | (b) |
| Net asset value, end of year | | | $1.00 | | | | $1.00 | | | | $1.00 | | | | $1.00 | | | | $1.00 | |
| Total Return(c): | | | 2.17% | | | | 1.18% | | | | 0.63% | | | | 0.21% | | | | 0.15% | |
| |
| Ratios/Supplemental Data: | |
| Net assets, end of year (000) | | | $20,975,373 | | | | $22,510,708 | | | | $25,556,796 | | | | $41,757,809 | | | | $43,585,206 | |
| Average net assets (000) | | | $21,560,540 | | | | $23,440,098 | | | | $30,480,402 | | | | $41,343,564 | | | | $40,003,023 | |
| Ratios to average net assets: | | | | | | | | | | | | | | | | | | | | |
| Expenses after waivers and/or expense reimbursement | | | 0.01% | | | | 0.01% | | | | 0.01% | | | | 0.01% | | | | 0.01% | |
| Expenses before waivers and/or expense reimbursement | | | 0.01% | | | | 0.01% | | | | 0.01% | | | | 0.01% | | | | 0.01% | |
| Net investment income (loss) | | | 2.14% | | | | 1.17% | | | | 0.60% | | | | 0.21% | | | | 0.15% | |
| Portfolio turnover rate(d) | | | 94% | | | | 111% | | | | 46% | | | | - | | | | - | |
| (a) | Calculated based on average shares outstanding during the year. |
| (b) | Less than $0.005 per share. |
| (c) | Total return is calculated assuming a purchase of a share on the first day and a sale on the last day of each year reported and includes reinvestment of dividends and distributions, if any. Total returns may reflect adjustments to conform to generally accepted accounting principles. |
| (d) | The Portfolio turnover rate calculation is for the years ended January 31, 2019 and 2018 and the period March 30, 2016 through January 31, 2017, respectively, and includes floating rate daily demand notes. Prior to March 30, 2016, the Fund was classified as a money market under Rule 2a-7 of the Investment Company Act of 1940 and disclosure of the Fund’s portfolio turnover was not applicable. |
See Notes to Financial Statements.
| | | | |
| Prudential Investment Portfolios 2/PGIM Core Ultra Short Bond Fund | | | 93 | |
PGIM Institutional Money Market Fund
Financial Highlights
| | | | | | | | | | | | | | | | |
| | | Year Ended January 31, | | | | | | July 19,
2016(a)
through
January 31, | |
| | | 2019 | | | 2018 | | | | | | 2017 | |
| Per Share Operating Performance(b): | | | | | | | | | | | | | | | | |
| Net Asset Value, Beginning of Period | | | $1.0001 | | | | $1.0002 | | | | | | | | $1.0000 | |
| Income (loss) from investment operations: | | | | | | | | | | | | | | | | |
| Net investment income (loss) | | | 0.0214 | | | | 0.0114 | | | | | | | | 0.0031 | |
| Net realized and unrealized gain (loss) on investment transactions | | | - | | | | (0.0001 | ) | | | | | | | 0.0002 | |
| Total from investment operations | | | 0.0214 | | | | 0.0113 | | | | | | | | 0.0033 | |
| Less Dividends and Distributions: | | | | | | | | | | | | | | | | |
| Dividends from net investment income | | | (0.0213 | ) | | | (0.0114 | ) | | | | | | | (0.0031 | ) |
| Net asset value, end of period | | | $1.0002 | | | | $1.0001 | | | | | | | | $1.0002 | |
| Total Return(c): | | | 2.16% | | | | 1.14% | | | | | | | | 0.35% | |
| |
| Ratios/Supplemental Data: | |
| Net assets, end of period (000) | | | $15,867,116 | | | | $13,215,520 | | | | | | | | $13,438,067 | |
| Average net assets (000) | | | $15,329,904 | | | | $14,177,712 | | | | | | | | $12,592,981 | |
| Ratios to average net assets: | | | | | | | | | | | | | | | | |
| Expenses after waivers and/or expense reimbursement | | | 0.07% | | | | 0.07% | | | | | | | | 0.07% | (d) |
| Expenses before waivers and/or expense reimbursement | | | 0.16% | | | | 0.16% | | | | | | | | 0.16% | (d) |
| Net investment income (loss) | | | 2.14% | | | | 1.14% | | | | | | | | 0.61% | (d) |
| (a) | Commencement of operations. |
| (b) | Calculated based on average shares outstanding during the period. |
| (c) | Total return is calculated assuming a purchase of a share on the first day and a sale on the last day of each period reported and includes reinvestment of dividends and distributions, if any. Total returns may reflect adjustments to conform to generally accepted accounting principles. Total returns for periods less than one full year are not annualized. |
See Notes to Financial Statements.
Report of Independent Registered Public Accounting Firm
To the Shareholders of the Funds and Board of Trustees
Prudential Investment Portfolios 2:
Opinion on the Financial Statements
We have audited the accompanying statements of assets and liabilities of each of the funds listed in the Appendix (the Funds), each a series of Prudential Investment Portfolios 2, including the schedules of investments, as of January 31, 2019, the related statements of operations for the year then ended, the statements of changes in net assets for each of the years in thetwo-year period then ended, and the related notes (collectively, the financial statements) and the financial highlights for each of the years or periods indicated therein. In our opinion, the financial statements and financial highlights present fairly, in all material respects, the financial position of each of the Funds as of January 31, 2019, the results of its operations for the year then ended, changes in its net assets for each of the years in thetwo-year period then ended, and the financial highlights for each of the years or periods indicated therein, in conformity with U.S. generally accepted accounting principles.
Basis for Opinion
These financial statements and financial highlights are the responsibility of the Funds’ management. Our responsibility is to express an opinion on these financial statements and financial highlights based on our audits. We are a public accounting firm registered with the Public Company Accounting Oversight Board (United States) (PCAOB) and are required to be independent with respect to the Funds in accordance with the U.S. federal securities laws and the applicable rules and regulations of the Securities and Exchange Commission and the PCAOB.
We conducted our audits in accordance with the standards of the PCAOB. Those standards require that we plan and perform the audit to obtain reasonable assurance about whether the financial statements and financial highlights are free of material misstatement, whether due to error or fraud. Our audits included performing procedures to assess the risks of material misstatement of the financial statements and financial highlights, whether due to error or fraud, and performing procedures that respond to those risks. Such procedures included examining, on a test basis, evidence regarding the amounts and disclosures in the financial statements and financial highlights. Such procedures also included confirmation of securities owned as of January 31, 2019, by correspondence with the custodian, transfer agents, or brokers, or by other appropriate auditing procedures when replies were not received. Our audits also included evaluating the accounting principles used and significant estimates made by management, as well as evaluating the overall presentation of the financial statements and financial highlights. We believe that our audits provide a reasonable basis for our opinion.

We have served as the auditor of one or more PGIM and/or Prudential Retail investment companies since 2003.
New York, New York
March 18, 2019
| | | | |
| Prudential Investment Portfolios 2 | | | 95 | |
Appendix
PGIM Core Short-Term Bond Fund (formerly Prudential Core Short-Term Bond Fund)
PGIM Core Ultra Short Bond Fund (formerly Prudential Core Ultra Short Bond Fund)
PGIM Institutional Money Market Fund (formerly Prudential Institutional Money Market Fund)
Tax Information(unaudited)
For the year ended January 31, 2019, the PGIM Core Ultra Short Bond Fund reports 99.80%, the PGIM Institutional Money Market Fund reports 100%, and PGIM Core Short-Term Bond Fund reports 89.36% as interest-related dividends in accordance with Sections 871(k)(1) and 881(e)(1) of the Internal Revenue Code.
In January 2020, you will be advised on IRS Form 1099-DIV or substitute Form 1099, as to the Federal tax status of the distributions received by you in calendar year 2019.
We are required by Massachusetts, Missouri and Oregon to inform you that dividends which have been derived from interest on federal obligations are not taxable to shareholders providing the Mutual Fund meets certain requirements mandated by the respective state’s taxing authorities. We are pleased to report that 4.63% of the dividends paid by the PGIM Core Ultra Short Bond Fund qualifies for such deduction.
Please consult your tax adviser or state/local authorities to properly report this information on your tax return. If you have any questions concerning the amounts listed above, please call your financial adviser.
| | | | |
| Prudential Investment Portfolios 2 | | | 97 | |
INFORMATION ABOUT BOARD MEMBERS AND OFFICERS(unaudited)
Information about Board Members and Officers of the Fund is set forth below. Board Members who are not deemed to be “interested persons” of the Fund, as defined in the 1940 Act, are referred to as “Independent Board Members.” Board Members who are deemed to be “interested persons” of the Fund are referred to as “Interested Board Members.” The Board Members are responsible for the overall supervision of the operations of the Fund and perform the various duties imposed on the directors of investment companies by the 1940 Act. The Board in turn elects the Officers, who are responsible for administering the day-to-day operations of the Fund.
| | | | | | |
| |
| Independent Board Members |
Name, Address, Age
Position(s)
Portfolios Overseen | | Principal Occupation(s)
During Past Five Years | | Other Directorships
Held During
Past Five Years | | Length of
Board Service |
Ellen S. Alberding (60)
Board Member
Portfolios Overseen: 96 | | President and Board Member, The Joyce Foundation (charitable foundation) (since 2002); Vice Chair, City Colleges of Chicago (community college system) (2011-2015); Trustee, National Park Foundation (charitable foundation for national park system) (2009-2018); Trustee, Economic Club of Chicago (since 2009); Trustee, Loyola University (since 2018). | | None. | | Since September 2013 |
Kevin J. Bannon (66)
Board Member
Portfolios Overseen: 96 | | Retired; Managing Director (April 2008-May 2015) and Chief Investment Officer (October 2008-November 2013) of Highmount Capital LLC (registered investment adviser); formerly Executive Vice President and Chief Investment Officer (April 1993-August 2007) of Bank of New York Company; President (May 2003-May 2007) of BNY Hamilton Family of Mutual Funds. | | Director of Urstadt Biddle Properties (equity real estate investment trust) (since September 2008). | | Since July 2008 |
Linda W. Bynoe (66)
Board Member
Portfolios Overseen: 96 | | President and Chief Executive Officer (since March 1995) and formerly Chief Operating Officer (December 1989-February 1995) of Telemat Ltd. (management consulting); formerly Vice President (January 1985-June 1989) at Morgan Stanley & Co. (broker-dealer). | | Director of Anixter International, Inc. (communication products distributor) (since January 2006); Director of Northern Trust Corporation (financial services) (since April 2006); Trustee of Equity Residential (residential real estate) (since December 2009). | | Since March 2005 |
| | |
| Prudential Investment Portfolios 2 |
| | | | | | |
| |
| Independent Board Members |
Name, Address, Age
Position(s)
Portfolios Overseen | | Principal Occupation(s)
During Past Five Years | | Other Directorships
Held During
Past Five Years | | Length of
Board Service |
Barry H. Evans (58)
Board Member
Portfolios Overseen: 95 | | Retired; formerly President (2005 – 2016), Global Chief Operating Officer (2014– 2016), Chief Investment Officer – Global Head of Fixed Income (1998-2014), and various portfolio manager roles (1986-2006), Manulife Asset Management U.S. | | Director, Manulife Trust Company (since 2011); formerly Director, Manulife Asset Management Limited(2015-2017); formerly Chairman of the Board of Directors of Manulife Asset Management U.S. (2005-2016); formerly Chairman of the Board, Declaration Investment Management and Research(2008-2016). | | Since September 2017 |
Keith F. Hartstein (62)
Board Member &
Independent Chair
Portfolios Overseen: 96 | | Retired; Member (since November 2014) of the Governing Council of the Independent Directors Council (organization of independent mutual fund directors); formerly President and Chief Executive Officer(2005-2012), Senior Vice President (2004-2005), Senior Vice President of Sales and Marketing (1997-2004), and various executive management positions (1990-1997), John Hancock Funds, LLC (asset management); Chairman, Investment Company Institute’s Sales Force Marketing Committee(2003-2008). | | None. | | Since September 2013 |
| | |
| Visit our website at pgiminvestments.com | | |
| | | | | | |
| |
| Independent Board Members |
| | | | |
Name, Address, Age
Position(s)
Portfolios Overseen | | Principal Occupation(s)
During Past Five Years | | Other Directorships Held During
Past Five Years | | Length of
Board Service |
| | | | |
Laurie Simon Hodrick (56)
Board Member
Portfolios Overseen: 95 | | A. Barton Hepburn Professor Emerita of Economics in the Faculty of Business, Columbia Business School (since 2018); Visiting Professor of Law, Stanford Law School (since 2015); Visiting Fellow at the Hoover Institution, Stanford University (since 2015); Sole Member, ReidCourt LLC (since 2008) (a consulting firm); formerly A. Barton Hepburn Professor of Economics in the Faculty of Business, Columbia Business School (1996-2017); formerly Managing Director, Global Head of Alternative Investment Strategies, Deutsche Bank (2006-2008). | | Independent Director, Kabbage, Inc. (since July 2018) (financial services); Independent Director, Corporate Capital Trust (2017-2018) (a business development company). | | Since September 2017 |
| | | | |
Michael S. Hyland, CFA (73)
Board Member
Portfolios Overseen: 96 | | Retired (since February 2005); formerly Senior Managing Director (July 2001-February 2005) of Bear Stearns & Co, Inc.; Global Partner, INVESCO (1999-2001); Managing Director and President of Salomon Brothers Asset Management (1989-1999). | | None. | | Since July 2008 |
| | | | |
Brian K. Reid (56)
Board Member
Portfolios Overseen: 95 | | Retired; formerly Chief Economist for the Investment Company Institute (ICI) (2005-2017); formerly Senior Economist and Director of Industry and Financial Analysis at the ICI (1998-2004); formerly Senior Economist, Industry and Financial Analysis at the ICI (1996-1998); formerly Staff Economist at the Federal Reserve Board (1989-1996); Director, ICI Mutual Insurance Company (2012-2017). | | None. | | Since March 2018 |
| | |
| Prudential Investment Portfolios 2 |
| | | | | | |
| |
| Interested Board Members |
| | | | |
Name, Address, Age
Position(s)
Portfolios Overseen | | Principal Occupation(s)
During Past Five Years | | Other Directorships Held During
Past Five Years | | Length of
Board Service |
| | | | |
Stuart S. Parker (56)
Board Member & President
Portfolios Overseen: 96 | | President of PGIM Investments LLC (formerly known as Prudential Investments LLC) (since January 2012); Executive Vice President of Prudential Investment Management Services LLC (since December 2012); formerly Executive Vice President of Jennison Associates LLC and Head of Retail Distribution of PGIM Investments LLC (June 2005-December 2011). | | None. | | Since January 2012 |
| | | | |
Scott E. Benjamin (45)
Board Member & Vice President
Portfolios Overseen: 96 | | Executive Vice President (since June 2009) of PGIM Investments LLC; Executive Vice President (June 2009-June 2012) and Vice President (since June 2012) of Prudential Investment Management Services LLC; Executive Vice President (since September 2009) of AST Investment Services, Inc.; Senior Vice President of Product Development and Marketing, PGIM Investments (since February 2006); formerly Vice President of Product Development and Product Management, PGIM Investments LLC (2003-2006). | | None. | | Since March 2010 |
| | |
| Visit our website at pgiminvestments.com | | |
| | | | | | |
| Interested Board Members |
| | | | |
Name, Address, Age Position(s) Portfolios Overseen | | Principal Occupation(s)
During Past Five Years | | Other Directorships
Held During
Past Five Years | | Length of
Board Service |
| | | | |
Grace C. Torres* (59) Board Member Portfolios Overseen: 95 | | Retired; formerly Treasurer and Principal Financial and Accounting Officer of the PGIM Funds, Target Funds, Advanced Series Trust, Prudential Variable Contract Accounts and The Prudential Series Fund (1998-June 2014); Assistant Treasurer (March 1999-June 2014) and Senior Vice President (September 1999-June 2014) of PGIM Investments LLC; Assistant Treasurer (May 2003-June 2014) and Vice President (June 2005-June 2014) of AST Investment Services, Inc.; Senior Vice President and Assistant Treasurer (May 2003-June 2014) of Prudential Annuities Advisory Services, Inc. | | Formerly Director (July 2015-January 2018) of Sun Bancorp, Inc. N.A. and Sun National Bank; Director (since January 2018) of OceanFirst Financial Corp. and OceanFirst Bank. | | Since November 2014 |
* Note: Prior to her retirement in 2014, Ms. Torres was employed by PGIM Investments LLC. Due to her prior employment, she is considered to be an “interested person” under the 1940 Act. Ms. Torres is a Non-Management Interested Board Member.
| | | | |
| Fund Officers(a) |
| | | |
Name, Address and Age Position with Fund | | Principal Occupation(s) During Past Five Years | | Length of Service as Fund Officer |
| | | |
Raymond A. O’Hara (63) Chief Legal Officer | | Vice President and Corporate Counsel (since July 2010) of Prudential Insurance Company of America (Prudential); Vice President (March 2011-Present) of Pruco Life Insurance Company and Pruco Life Insurance Company of New Jersey; Vice President and Corporate Counsel (March 2011-Present) of Prudential Annuities Life Assurance Corporation; Chief Legal Officer of PGIM Investments LLC (since June 2012); Chief Legal Officer of Prudential Mutual Fund Services LLC (since June 2012) and Corporate Counsel of AST Investment Services, Inc. (since June 2012); formerly Assistant Vice President and Corporate Counsel (September 2008-July 2010) of The Hartford Financial Services Group, Inc.; formerly Associate (September 1980-December 1987) and Partner (January 1988–August 2008) of Blazzard & Hasenauer, P.C. (formerly, Blazzard, Grodd & Hasenauer, P.C.). | | Since June 2012 |
Prudential Investment Portfolios 2
| | | | |
| Fund Officers(a) |
| | | |
Name, Address and Age
Position with Fund | | Principal Occupation(s) During Past Five Years | | Length of
Service as Fund Officer |
| | | |
Chad A. Earnst (43) Chief Compliance Officer | | Chief Compliance Officer (September 2014-Present) of PGIM Investments LLC; Chief Compliance Officer (September 2014-Present) of the PGIM Funds, Target Funds, Advanced Series Trust, The Prudential Series Fund, Prudential’s Gibraltar Fund, Inc., PGIM Global Short Duration High Yield Income Fund, Inc., PGIM Short Duration High Yield Fund, Inc. and PGIM Jennison MLP Income Fund, Inc.; Global Head of Compliance for PGIM, Inc. (July 2018-Present); formerly Assistant Director (March 2010-August 2014) of the Asset Management Unit, Division of Enforcement, US Securities & Exchange Commission; Assistant Regional Director (January 2010-August 2014), Branch Chief (June 2006–December 2009) and Senior Counsel (April 2003-May 2006) of the Miami Regional Office, Division of Enforcement, US Securities & Exchange Commission. | | Since September 2014 |
| | | |
Dino Capasso (44) Deputy Chief Compliance Officer | | Vice President and Deputy Chief Compliance Officer (June 2017-Present) of PGIM Investments LLC; formerly, Senior Vice President and Senior Counsel (January 2016-June 2017), and Vice President and Counsel (February 2012-December 2015) of Pacific Investment Management Company LLC. | | Since March 2018 |
| | | |
Andrew R. French (56) Secretary | | Vice President of PGIM Investments LLC (December 2018-Present); formerly Vice President and Corporate Counsel (February 2010-December 2018) of Prudential; formerly Director and Corporate Counsel (2006-2010) of Prudential; Vice President and Assistant Secretary (since January 2007) of PGIM Investments LLC; Vice President and Assistant Secretary (since January 2007) of Prudential Mutual Fund Services LLC. | | Since October 2006 |
| | | |
Jonathan D. Shain (60) Assistant Secretary | | Vice President and Corporate Counsel (since August 1998) of Prudential; Vice President and Assistant Secretary (since May 2001) of PGIM Investments LLC; Vice President and Assistant Secretary (since February 2001) of Prudential Mutual Fund Services LLC; formerly Vice President and Assistant Secretary (May 2003-June 2005) of AST Investment Services, Inc. | | Since May 2005 |
| | | |
Claudia DiGiacomo (44) Assistant Secretary | | Vice President and Corporate Counsel (since January 2005) of Prudential; Vice President and Assistant Secretary of PGIM Investments LLC (since December 2005); formerly Associate at Sidley Austin Brown & Wood LLP (1999-2004). | | Since December 2005 |
| | | |
Diana N. Huffman (36) Assistant Secretary | | Vice President and Corporate Counsel (since September 2015) of Prudential; formerly Associate at Willkie Farr & Gallagher LLP (2009-2015). | | Since March 2019 |
Visit our website at pgiminvestments.com
| | | | |
| Fund Officers(a) |
| | | |
Name, Address and Age Position with Fund | | Principal Occupation(s) During Past Five Years | | Length of Service as Fund Officer |
| | | |
Christian J. Kelly (43) Treasurer and Principal Financial and Accounting Officer | | Vice President, Head of Fund Administration of PGIM Investments LLC (since November 2018); formerly, Director of Fund Administration of Lord Abbett & Co. LLC (2009-2018), Treasurer and Principal Accounting Officer of the Lord Abbett Family of Funds (2017-2018); Director of Accounting, Avenue Capital Group (2008-2009); Senior Manager, Investment Management Practice of Deloitte & Touche LLP (1998-2007). | | Since January 2019 |
| | | |
Peter Parrella (60) Assistant Treasurer | | Vice President (since 2007) and Director (2004-2007) within PGIM Investments Fund Administration; formerly Tax Manager at SSB Citi Fund Management LLC (1997-2004). | | Since June 2007 |
| | | |
Lana Lomuti (51) Assistant Treasurer | | Vice President (since 2007) and Director (2005-2007), within PGIM Investments Fund Administration; formerly Assistant Treasurer (December 2007-February 2014) of The Greater China Fund, Inc. | | Since April 2014 |
| | | |
Linda McMullin (57) Assistant Treasurer | | Vice President (since 2011) and Director (2008-2011) within PGIM Investments Fund Administration. | | Since April 2014 |
| | | |
Kelly A. Coyne (50) Assistant Treasurer | | Director, Investment Operations of Prudential Mutual Fund Services LLC (since 2010). | | Since March 2015 |
| | | |
Charles H. Smith (46) Anti-Money Laundering Compliance Officer | | Vice President, Corporate Compliance, Anti-Money Laundering Unit (since January 2015) of Prudential; committee member of the American Council of Life Insurers Anti-Money Laundering and Critical Infrastructure Committee (since January 2016); formerly Global Head of Economic Sanctions Compliance at AIG Property Casualty (February 2007-December 2014); Assistant Attorney General at the New York State Attorney General’s Office, Division of Public Advocacy. (August 1998-January 2007). | | Since January 2017 |
(a) Excludes Mr. Parker and Mr. Benjamin, interested Board Members who also serve as President and Vice President, respectively.
Explanatory Notes to Tables:
| ∎ | | Board Members are deemed to be “Interested,” as defined in the 1940 Act, by reason of their affiliation with PGIM Investments LLC and/or an affiliate of PGIM Investments LLC. |
| ∎ | | Unless otherwise noted, the address of all Board Members and Officers is c/o PGIM Investments LLC, 655 Broad Street, Newark, New Jersey 07102-4410. |
| ∎ | | There is no set term of office for Board Members or Officers. The Board Members have adopted a retirement policy, which calls for the retirement of Board Members on December 31 of the year in which they reach the age of 75. |
| ∎ | | “Other Directorships Held” includes only directorships of companies required to register or file reports with the SEC under the 1934 Act (that is, “public companies”) or other investment companies registered under the 1940 Act. |
| ∎ | | “Portfolios Overseen” includes all investment companies managed by PGIM Investments LLC. The investment companies for which PGIM Investments LLC serves as manager include the PGIM Funds, The Prudential Variable Contract Accounts, PGIM ETF Trust, PGIM Short Duration High Yield Fund, Inc., PGIM Global Short Duration High Yield Fund, Inc., The Prudential Series Fund, Prudential’s Gibraltar Fund, Inc. and the Advanced Series Trust. |
Prudential Investment Portfolios 2
| | | | |
| | |
| ∎ MAIL | | ∎ TELEPHONE | | ∎ WEBSITE |
655 Broad Street Newark, NJ 07102 | | (800) 225-1852 | | pgiminvestments.com |
|
| PROXY VOTING |
| The Board of Trustees of the Funds have delegated to the Funds’ subadviser the responsibility for voting any proxies and maintaining proxy recordkeeping with respect to the Funds. A description of these proxy voting policies and procedures is available without charge, upon request, by calling (800) 225-1852 or by visiting the Securities and Exchange Commission’s website atsec.gov. Information regarding how the Funds voted proxies relating to portfolio securities during the most recent 12-month period ended June 30 is available on the Funds’ website and on the Commission’s website. |
|
| TRUSTEES |
| Ellen S. Alberding• Kevin J. Bannon• Scott E. Benjamin• Linda W. Bynoe• Barry H. Evans• Keith F. Hartstein • Laurie Simon Hodrick• Michael S. Hyland• Stuart S. Parker• Brian K. Reid• Grace C. Torres |
|
| OFFICERS |
| Stuart S. Parker,President• Scott E. Benjamin,Vice President• Christian J. Kelly,Treasurer and Principal Financial and Accounting Officer• Raymond A. O’Hara,Chief Legal Officer• Chad A. Earnst,Chief Compliance Officer• Dino Capasso,Deputy Chief Compliance Officer• Charles H. Smith,Anti-Money Laundering Compliance Officer• Andrew R. French,Secretary• Jonathan D. Shain,Assistant Secretary• Claudia DiGiacomo,Assistant Secretary• Diana N. Huffman,Assistant Secretary• Peter Parrella,Assistant Treasurer• Lana Lomuti, Assistant Treasurer• Linda McMullin,Assistant Treasurer• Kelly Coyne,Assistant Treasurer |
| | | | |
| MANAGER | | PGIM Investments LLC | | 655 Broad Street
Newark, NJ 07102 |
|
| SUBADVISER | | PGIM Fixed Income | | 655 Broad Street
Newark, NJ 07102 |
|
| DISTRIBUTOR | | Prudential Investment
Management Services LLC | | 655 Broad Street
Newark, NJ 07102 |
|
| CUSTODIAN | | The Bank of New York Mellon | | 225 Liberty Street
New York, NY 10286 |
|
| TRANSFER AGENT | | Prudential Mutual Fund
Services LLC | | PO Box 9658
Providence, RI 02940 |
|
| INDEPENDENT REGISTERED PUBLIC ACCOUNTING FIRM | | KPMG LLP | | 345 Park Avenue New York, NY 10154 |
|
| FUND COUNSEL | | Willkie Farr & Gallagher LLP | | 787 Seventh Avenue
New York, NY 10019 |
|
|
| An investor should consider the investment objectives, risks, charges, and expenses of the Fund carefully before investing. The prospectus contains this and other information about the Funds. An investor may obtain a prospectus by visiting our website atpgiminvestments.com or by calling(800) 225-1852. The prospectus should be read carefully before investing. |
|
| SHAREHOLDER COMMUNICATIONS WITH TRUSTEES |
| Shareholders can communicate directly with the Board of Trustees by writing to the Chair of the Board, c/o PGIM Investments, Attn: Board of Trustees, 655 Broad Street, Newark, NJ 07102. Shareholders can communicate directly with an individual Trustee by writing to the same address. Communications are not screened before being delivered to the addressee. |
|
| AVAILABILITY OF PORTFOLIO SCHEDULE |
Each Fund files its complete schedule of portfolio holdings with the Securities and Exchange Commission (the Commission) for the first and third quarters of each fiscal year on FormN-Q. The Funds’ FormsN-Q are available on the Commission’s website atsec.gov. Beginning with reporting periods on or after March 31, 2019, Form N-PORT will replace Form N-Q. Form N-PORT will be filed with the Securities and Exchange Commission quarterly, and each Fund’s full portfolio holdings as of its first and third quarters of each fiscal year will be made publicly available 60 days after the end of each quarter. The Fund’s schedule of portfolio holdings is also available on the Funds’ website as of the end of each month no sooner than 15 days after the end of the month. |
|
| Each Fund’s Statement of Additional Information contains additional information about the Funds’ Trustees and is available without charge, upon request, by calling (800) 225-1852. |
Mutual Funds:
| | | | |
ARE NOT INSURED BY THE FDIC OR ANY
FEDERAL GOVERNMENT AGENCY | | MAY LOSE VALUE | | ARE NOT A DEPOSIT OF OR GUARANTEED
BY ANY BANK OR ANY BANK AFFILIATE |
| | |
| | | CUSIP |
| PGIM CORE SHORT-TERM BOND FUND | | 74440E102 |
| PGIM CORE ULTRA SHORT BOND FUND | | 74440E201 |
| PGIM INSTITUTIONAL MONEY MARKET FUND | | 74440E300 |
Item 2 – Code of Ethics ––See Exhibit (a)
As of the end of the period covered by this report, the registrant has adopted a code of ethics (the “Section 406 Standards for Investment Companies – Ethical Standards for Principal Executive and Financial Officers”) that applies to the registrant’s Principal Executive Officer and Principal Financial Officer; the registrant’s Principal Financial Officer also serves as the Principal Accounting Officer.
The registrant hereby undertakes to provide any person, without charge, upon request, a copy of the code of ethics. To request a copy of the code of ethics, contact the registrant800-225-1852, and ask for a copy of the Section 406 Standards for Investment Companies - Ethical Standards for Principal Executive and Financial Officers.
Item 3 – Audit Committee Financial Expert –
The registrant’s Board has determined that Mr. Kevin J. Bannon, member of the Board’s Audit Committee is an “audit committee financial expert,” and that he is “independent,” for purposes of this Item.
Item 4 – Principal Accountant Fees and Services –
(a)Audit Fees
For the fiscal years ended January 31, 2019 and January 31, 2018, KPMG LLP (“KPMG”), the Registrant’s principal accountant, billed the Registrant $88,691 and $87,812 respectively, for professional services rendered for the audit of the Registrant’s annual financial statements or services that are normally provided in connection with statutory and regulatory filings.
(b)Audit-Related Fees
For the fiscal years ended January 31, 2019 and January 31, 2018: none.
(c)Tax Fees
For the fiscal years ended January 31, 2019 and January 31, 2018: none.
(d)All Other Fees
For the fiscal years ended January 31, 2019 and January 31, 2018: none.
(e) (1)Audit CommitteePre-Approval Policies and Procedures
THE PRUDENTIAL MUTUAL FUNDS
AUDIT COMMITTEE POLICY
on
Pre-Approval of Services Provided by the Independent Accountants
The Audit Committee of each Prudential Mutual Fund is charged with the responsibility to monitor the independence of the Fund’s independent accountants. As part of this responsibility, the Audit Committee mustpre-approve the independent accounting firm’s engagement to render audit and/or permissiblenon-audit services, as required by law. In evaluating a proposed engagement of the independent accountants, the Audit Committee will assess the effect that the engagement might reasonably be expected to have on the accountant’s independence. The Committee’s evaluation will be based on:
• a review of the nature of the professional services expected to be provided,
• a review of the safeguards put into place by the accounting firm to safeguard independence, and
• periodic meetings with the accounting firm.
Policy for Audit andNon-Audit Services Provided to the Funds
On an annual basis, the scope of audits for each Fund, audit fees and expenses, and audit-related andnon-audit services (and fees proposed in respect thereof) proposed to be performed by the Fund’s independent accountants will be presented by the Treasurer and the independent accountants to the Audit Committee for review and, as appropriate, approval prior to the initiation of such services. Such presentation shall be accompanied by confirmation by both the Treasurer and the independent accountants that the proposednon-audit services will not adversely affect the independence of the independent accountants. Such proposednon-audit services shall be described in sufficient detail to enable the Audit Committee to assess the appropriateness of such services and fees, and the compatibility of the provision of such services with the auditor’s independence. The Committee shall receive periodic reports on the progress of the audit and other services which are approved by the Committee or by the Committee Chair pursuant to authority delegated in this Policy.
The categories of services enumerated under “Audit Services”, “Audit-related Services”, and “Tax Services” are intended to provide guidance to the Treasurer and the independent accountants as to those categories of services which the Committee believes are generally consistent with the independence of the independent accountants and which the Committee (or the Committee Chair) would expect upon the presentation of specific proposals topre-approve. The enumerated categories are not intended as an exclusive list of audit, audit-related or tax services, which the Committee (or the Committee Chair) would consider forpre-approval.
Audit Services
The following categories of audit services are considered to be consistent with the role of the Fund’s independent accountants:
Ø Annual Fund financial statement audits
Ø Seed audits (related to new product filings, as required)
Ø SEC and regulatory filings and consents
Audit-related Services
The following categories of audit-related services are considered to be consistent with the role of the Fund’s independent accountants:
| | Ø | Accounting consultations |
| | Ø | Fund merger support services |
| | Ø | Agreed Upon Procedure Reports |
| | Ø | Other Internal Control Reports |
Individual audit-related services that fall within one of these categories (except for fund merger support services) and are not presented to the Audit Committee as part of the annualpre-approval process are subject to an authorizedpre-approval by the Audit Committee so long as the estimated fee for those services does not exceed $30,000. Any services provided under suchpre-approval will be reported to the Audit Committee at its next regular meeting. Should the amount of such services exceed $30,000 any additional fees will be subject topre-approval by the Committee Chair (or any other Committee member on whom this responsibility has been delegated). Fees related to fund merger support services are subject to a separate authorizedpre-approval by the Audit Committee with fees determined on a per occurrence and merger complexity basis.
Tax Services
The following categories of tax services are considered to be consistent with the role of the Fund’s independent accountants:
| | Ø | Tax compliance services related to the filing or amendment of the following: |
| | ◾ | Federal, state and local income tax compliance; and, |
| | ◾ | Sales and use tax compliance |
| | Ø | Timely RIC qualification reviews |
| | Ø | Tax distribution analysis and planning |
| | Ø | Tax authority examination services |
| | Ø | Tax appeals support services |
| | Ø | Accounting methods studies |
| | Ø | Fund merger support services |
| | Ø | Tax consulting services and related projects |
Individual tax services that fall within one of these categories and are not presented to the Audit Committee as part of the annualpre-approval process are subject to an authorizedpre-approval by the Audit Committee so long as the estimated fee for those services does not exceed $30,000. Any services provided under suchpre-approval will be reported to the Audit Committee at its next regular meeting. Should the amount of such services exceed $30,000 any additional fees will be subject topre-approval by the Committee Chair (or any other Committee member on whom this responsibility has been delegated).
OtherNon-Audit Services
Certainnon-audit services that the independent accountants are legally permitted to render will be subject topre-approval by the Committee or by one or more Committee members to whom the Committee has delegated this authority and who will report to the full Committee anypre-approval decisions made pursuant to this Policy.Non-audit services presented forpre-approval pursuant to this paragraph will be accompanied by a confirmation from both the Treasurer and the independent accountants that the proposed services will not adversely affect the independence of the independent accountants.
Proscribed Services
The Fund’s independent accountants will not render services in the following categories ofnon-audit services:
| | Ø | Bookkeeping or other services related to the accounting records or financial statements of the Fund |
| | Ø | Financial information systems design and implementation |
| | Ø | Appraisal or valuation services, fairness opinions, orcontribution-in-kind reports |
| | Ø | Internal audit outsourcing services |
| | Ø | Management functions or human resources |
| | Ø | Broker or dealer, investment adviser, or investment banking services |
| | Ø | Legal services and expert services unrelated to the audit |
| | Ø | Any other service that the Public Company Accounting Oversight Board determines, by regulation, is impermissible. |
Pre-approval ofNon-Audit Services Provided to Other Entities Within the Prudential Fund Complex
Certainnon-audit services provided to PGIM Investments LLC or any of its affiliates that also provide ongoing services to the Prudential Mutual Funds will be subject topre-approval by the Audit Committee. The onlynon-audit services provided to these entities that will requirepre-approval are thoserelated directly to the operations and financial reporting of the Funds. Individual projects that are not presented to the Audit Committee as part of the annualpre-approval process will be subject topre-approval by the Committee Chair (or any other Committee member on whom this responsibility has been delegated) so long as the estimated fee for those services does not exceed $30,000. Services presented forpre-approval pursuant to this paragraph will be accompanied by a confirmation from both the Treasurer and the independent accountants that the proposed services will not adversely affect the independence of the independent accountants.
Although the Audit Committee will notpre-approve all services provided to PGIM Investments LLC and its affiliates, the Committee will receive an annual report from the Fund’s independent accounting firm showing the aggregate fees for all services provided to PGIM Investments and its affiliates.
(e) (2)Percentage of services referred to in 4(b) – 4(d) that were approved by the audit committee –
For the fiscal years ended January 31, 2019 and January 31, 2018: none.
| (f) | Percentage of hours expended attributable to work performed by other than full time employees of principal accountant if greater than 50%. |
The percentage of hours expended on the principal accountant’s engagement to audit the registrant’s financial statements for the most recent fiscal year that were attributed to work performed by persons other than the principal accountant’s full-time, permanent employees was 0%.
(g)Non-Audit Fees
The aggregatenon-audit fees billed by KPMG for services rendered to the registrant’s investment adviser and any entity controlling, controlled by, or under common control with the investment adviser that provides ongoing services to the registrant for the fiscal years ended January 31, 2019 and January 31, 2018 was $0 and $0, respectively.
(h)Principal Accountant’s Independence
Not applicable as KPMG has not providednon-audit services to the registrant’s investment adviser and any entity controlling, controlled by, or under common control with the investment adviser that provides ongoing services to the registrant that were notpre-approved pursuant toRule 2-01(c)(7)(ii) ofRegulation S-X.
| Item 5 – | Audit Committee of Listed Registrants – Not applicable. |
| Item 6 – | Schedule of Investments – The schedule is included as part of the report to shareholders filed under Item 1 of this Form. |
| Item 7 – | Disclosure of Proxy Voting Policies and Procedures forClosed-End Management Investment Companies – Not applicable. |
| Item 8 – | Portfolio Managers ofClosed-End Management Investment Companies – Not applicable. |
| Item 9 – | Purchases of Equity Securities byClosed-End Management Investment Company and Affiliated Purchasers – Not applicable. |
| Item 10 – | Submission of Matters to a Vote of Security Holders – Not applicable. |
| Item 11 – | Controls and Procedures |
| | (a) | It is the conclusion of the registrant’s principal executive officer and principal financial officer that the effectiveness of the registrant’s current disclosure controls and procedures (such disclosure controls and procedures having been evaluated within 90 days of the date of this filing) provide reasonable assurance that the information required to be disclosed by the registrant has been recorded, processed, summarized and reported within the time period specified in the Commission’s rules and forms and that the information required to be disclosed by the registrant has been accumulated and communicated to the registrant’s principal executive officer and principal financial officer in order to allow timely decisions regarding required disclosure. |
| | (b) | There has been no significant change in the registrant’s internal control over financial reporting that occurred during the registrant’s most recent fiscal quarter of the period covered by this report that has materially affected, or is likely to materially affect, the registrant’s internal control over financial reporting. |
Item 12 – Exhibits
| | (a) | (1) Code of Ethics – Attached hereto as ExhibitEX-99.CODE-ETH |
| | | (2) Certifications pursuant to Section 302 of the Sarbanes-Oxley Act – Attached hereto as Exhibit |
| | | (3) Any written solicitation to purchase securities under Rule23c-1. – Not applicable. |
| | (b) | Certifications pursuant to Section 906 of the Sarbanes-Oxley Act – Attached hereto as ExhibitEX-99.906CERT. |
SIGNATURES
Pursuant to the requirements of the Securities Exchange Act of 1934 and the Investment Company Act of 1940, the registrant has duly caused this report to be signed on its behalf by the undersigned, thereunto duly authorized.
| | |
Registrant | | Prudential Investment Portfolios 2 |
| |
By: | | /s/ Andrew R. French |
| | Andrew R. French |
| | Secretary |
| |
Date: | | March 18, 2019 |
Pursuant to the requirements of the Securities Exchange Act of 1934 and the Investment Company Act of 1940, this report has been signed below by the following persons on behalf of the registrant and in the capacities and on the dates indicated.
| | |
By: | | /s/ Stuart S. Parker |
| | Stuart S. Parker |
| | President and Principal Executive Officer |
| |
Date: | | March 18, 2019 |
| |
By: | | /s/ Christian J. Kelly |
| | Christian J. Kelly |
| | Treasurer and Principal Financial and Accounting Officer |
| |
Date: | | March 18, 2019 |