UNITED STATES
SECURITIES AND EXCHANGE COMMISSION
Washington, D.C. 20549
FORMN-CSR
CERTIFIED SHAREHOLDER REPORT OF REGISTERED MANAGEMENT INVESTMENT
COMPANIES
| | |
| Investment Company Act file number: | | 811-09999 |
| |
| Exact name of registrant as specified in charter: | | Prudential Investment Portfolios 2 |
|
| (This FormN-CSR relates solely to the Registrant’s: PGIM QMA Emerging Markets Equity Fund and PGIM QMA International Developed Markets Index Fund) |
| |
| Address of principal executive offices: | | 655 Broad Street, 17th Floor |
| | | Newark, New Jersey 07102 |
| |
| Name and address of agent for service: | | Andrew R. French |
| | | 655 Broad Street, 17th Floor |
| | | Newark, New Jersey 07102 |
| |
| Registrant’s telephone number, including area code: | | 800-225-1852 |
| |
| Date of fiscal year end: | | 10/31/2019 |
| |
| Date of reporting period: | | 10/31/2019 |
Item 1 – Reports to Stockholders

PGIM QMA EMERGING MARKETS EQUITY FUND
ANNUAL REPORT
OCTOBER 31, 2019
COMING SOON: PAPERLESS SHAREHOLDER REPORTS
Beginning on January 1, 2021, as permitted by regulations adopted by the Securities and Exchange Commission, paper copies of the Fund’s annual and semiannual shareholder reports will no longer be sent by mail, unless you specifically request paper copies of the reports. Instead, the reports will be made available on the Fund’s website (pgiminvestments.com), and you will be notified by mail each time a report is posted and provided with a website link to access the report.
If you already elected to receive shareholder reports electronically, you will not be affected by this change and you need not take any action. You may elect to receive shareholder reports and other communications from the Fund electronically anytime by contacting your financial intermediary (such as a broker-dealer or bank) or, if you are a direct investor, by calling 1-800-225-1852 or by sending an email request to PGIM Investments at shareholderreports@pgim.com.
You may elect to receive all future reports in paper free of charge. If you invest through a financial intermediary, you can contact your financial intermediary or follow instructions included with this notice to elect to continue to receive paper copies of your shareholder reports. If you invest directly with the Fund, you can call 1-800-225-1852 or send an email request to shareholderreports@pgim.com to let the Fund know you wish to continue receiving paper copies of your shareholder reports. Your election to receive reports in paper will apply to all funds held in your account if you invest through your financial intermediary or all funds held with the fund complex if you invest directly with the Fund.

To enroll in e-delivery, go to pgiminvestments.com/edelivery
|
Objective:To seek to provide returns in excess of the Morgan Stanley Capital
International Emerging Markets Index over full market cycles. |
Highlights(unaudited)
| • | | Quality financial factors were mixed but positive overall during the reporting period. |
| • | | By market, Brazil led gains during the period, driven by an underweight position in the materials sector, particularly in steel companies, which declined 22%. By sector, gains were driven by utilities (Brazil) and real estate, where stock selection was broadly effective. |
| • | | The volatility and overall underperformance of value factors were especially detrimental to the Fund’s performance during the period. |
| • | | By market, India and China performed the worst over the period. In terms of sectors, consumer staples, communication services, and financials struggled the most. |
This report is not authorized for distribution to prospective investors unless preceded or accompanied by a current prospectus.
The views expressed in this report and information about the Fund’s portfolio holdings are for the period covered by this report and are subject to change thereafter.
Mutual funds are distributed by Prudential Investment Management Services LLC, a Prudential Financial company. QMA is the primary business name of QMA LLC, a wholly owned subsidiary of PGIM, Inc. (PGIM), a Prudential Financial company.© 2019 Prudential Financial, Inc. and its related entities. PGIM and the PGIM logo are service marks of Prudential Financial, Inc. and its related entities, registered in many jurisdictions worldwide.
| | |
| 2 | | Visit our website at pgiminvestments.com |
Your Fund’s Performance (unaudited)
Performance data quoted represents past performance. Past performance does not guarantee future results. The investment return and principal value of an investment will fluctuate, so that an investor’s shares, when redeemed, may be worth more or less than their original cost. Current performance may be lower or higher than the past performance data quoted.
| | | | |
| |
| | | Average Annual Total Returns as of 10/31/19 |
| | | One Year (%) | | Since Inception (%) |
| Fund | | 5.82 | | 7.35 (11/29/16) |
| MSCI Emerging Markets Index | | |
| | | 11.86 | | 9.33 |
Growth of a $10,000 Investment
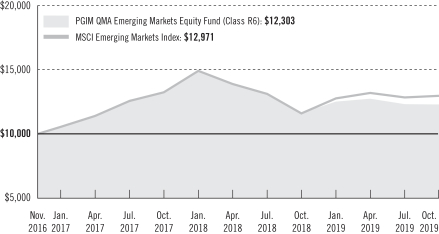
The graph compares a $10,000 investment in the Fund with a similar investment in the MSCI Emerging Markets Index by portraying the initial account values at the commencement of operations of the Fund (November 29, 2016) and the account values at the end of the current fiscal year (October 31, 2019), as measured on a quarterly basis. For purposes of the graph, and unless otherwise indicated, it has been assumed that (a) all recurring fees (including management fees) were deducted; and (b) all dividends and distributions were reinvested. Without waiver of fees and/or expense reimbursments, the returns would have been lower.
Past performance does not predict future performance. Total returns and the ending account values in the graph include changes in share price and reinvestment of dividends and capital gains distributions in a hypothetical investment for the periods shown. The Fund’s total returns do not reflect the deduction of
| | | | |
| PGIM QMA Emerging Markets Equity Fund | | | 3 | |
Your Fund’s Performance(continued)
income taxes on an individual’s investment. Taxes may reduce your actual investment returns on income or gains paid by the Fund or any gains you may realize if you sell your shares.
Source: PGIM Investments LLC and Lipper Inc.
The returns in the tables do not reflect the deduction of taxes that a shareholder would pay on Fund distributions or following the redemption of Fund shares. Since Inception returns for the Index are measured from the closest month-end to the Fund’s inception date.
Benchmark Definitions
MSCI Emerging Markets Index—The MSCI Emerging Markets Index is an unmanaged free float-adjusted market capitalization index that is designed to measure equity market performance of emerging markets. It consists of the following 23 emerging market country indexes: Brazil, Chile, China, Colombia, the Czech Republic, Egypt, Greece, Hungary, India, Indonesia, Korea, Malaysia, Mexico, Pakistan, Peru, the Philippines, Poland, Qatar, Russia, South Africa, Taiwan, Thailand, Turkey, and the United Arab Emirates.
Investors cannot invest directly in an index or average. The returns for the Index would be lower if they included the effects of sales charges, operating expenses of a mutual fund, or taxes.
Presentation of Fund Holdingsas of 10/31/19
| | | | | | |
| | | |
| Ten Largest Holdings | | Line of Business | | Country | | % of Net Assets |
| Alibaba Group Holding Ltd. | | Internet & Direct Marketing Retail | | China | | 4.9% |
| Taiwan Semiconductor Manufacturing Co. Ltd. | | Semiconductors & Semiconductor Equipment | | Taiwan | | 4.3% |
| Samsung Electronics Co. Ltd. | | Technology Hardware, Storage & Peripherals | | South Korea | | 3.8% |
| Tencent Holdings Ltd. | | Interactive Media & Services | | China | | 3.7% |
| iShares MSCI Emerging Markets ETF | | Exchange-Traded Funds | | United States | | 2.5% |
| iShares MSCI Saudi Arabia ETF | | Exchange-Traded Funds | | United States | | 2.4% |
| Ping An Insurance Group Co. of China Ltd. (Class H Stock) | | Insurance | | China | | 1.7% |
| China Construction Bank Corp. (Class H Stock) | | Banks | | China | | 1.3% |
| Petroleo Brasileiro SA (PRFC) | | Oil, Gas & Consumable Fuels | | Brazil | | 1.3% |
| Gazprom PJSC | | Oil, Gas & Consumable Fuels | | Russia | | 1.2% |
For a complete list of holdings, please refer to the Schedule of Investments section of this report. Holdings reflect only long-term Investments.
| | |
| 4 | | Visit our website at pgiminvestments.com |
Strategy and Performance Overview(unaudited)
How did the Fund perform?
ThePGIM QMA Emerging Markets Equity Fund’s Class R6 shares returned 5.82% in the12-month reporting period that ended October 31, 2019, underperforming the 11.86% return of the MSCI Emerging Markets Index (the Index).
What were the market conditions?
| • | | Global economic growth continued to be weak during the period, buffeted by the powerful crosscurrents of theUS-China trade war and global monetary easing. |
| • | | The trade standoff took a toll on business confidence, industrial production, and trade flows. It weighed heavily on global manufacturing, hitting export-oriented economies—including China, Europe, and Japan—the hardest. |
| • | | Fortunately, weakness in manufacturing did not drag down the services sector, which remained resilient. The trade war also has had less of an impact on more domestic-oriented economies like the US. As a result, there has been a pronounced divergence in growth among sectors and regions within the global economy. |
| • | | Given the weak growth backdrop and elevated geopolitical risks, global central banks embarked on a fresh round of monetary easing during the period, aiming to stimulate growth and counter the negative effects of the trade war. |
| • | | However, with interest rates already at, near, or below zero in many countries, the power of monetary policy may have been muted. Thus, the focus shifted to using fiscal policy as a means of stimulating growth, especially in Europe. |
| • | | Powered by a healthy consumer, US economic growth remained resilient while eurozone growth was anemic, with Germany and Italy teetering on the edge of recession. Uncertainty over Brexit—the United Kingdom’s ongoing effort to exit the European Union—finally caught up with the UK economy, which contracted in the second quarter of 2019. Japanese economic growth was decent, but risks were tilted to the downside given weak global growth, yen appreciation, and a pending consumer tax hike. |
| • | | Emerging market growth remained hostage to trade tensions, especially for such export-dependent economies as China, Taiwan, and Korea. Although the economies of emerging market countries such as India and Brazil are less levered to the global export cycle, they also succumbed to a slowdown in growth amid weaker consumer spending and slow progress on much-needed reforms. |
| • | | Uncertainty surrounding a shifting global paradigm and its implications for global growth made for a challenging and volatile environment. The period included one of the best months—May 2019—for relative Fund performances since the Fund’s inception in 2016. It also included three of the worst months in the Fund’s history—November and December of 2018 and July 2019. |
| | | | |
| PGIM QMA Emerging Markets Equity Fund | | | 5 | |
Strategy and Performance Overview(continued)
What worked?
| • | | Quality financial factors were mixed but positive overall during the reporting period. We rank stocks based on relative value, growth and financial health. |
| • | | By market, Brazil led gains during the period, driven by an underweight position in the materials sector, particularly in steel companies, which declined 22%. Selection and an overweight position in utilities helped the sector return 46%. Overweight positions in Russian energy (+38%) and South African materials, most notably an overweight in precious metals & minerals (+135%), also contributed to performance. |
| • | | By sector, gains were driven by utilities (Brazil) and real estate, where stock selection was broadly effective. |
What didn’t work?
| • | | The volatility and overall underperformance of value factors were especially detrimental to the Fund’s performance during the period. In particular, the most expensive stocks—names the Fund tends to avoid—were the best performers on average. A downturn in the effectiveness of growth measures, particularly later in the period, hindered value performance. |
| • | | By market, India and China performed the worst over the period. Losses from favoring Indian metals & mining (materials), which fell 21%, were exacerbated by challenging selections in China. South Korea rounded out the bottom, led by an overweight position in financials, which declined 11%. |
| • | | In terms of sectors, consumer staples, communication services, and financials struggled the most during the period. |
Current outlook
| • | | Escalating geopolitical risks and increased monetary easing have elevated both the upside and downside risks for the global economy. As such, it is currently very difficult to determine which force will gain the upper hand. |
| • | | The greatest threat to the global economy is an escalation of theUS-China trade war, which likely would lead to an even deeper downturn in global manufacturing. In turn, this could progressively weaken the healthier components of the global economy, namely the services sector and US consumer spending. |
| • | | A more constructive scenario for risky assets would involve a tamping down of these geopolitical risks and any sign that monetary stimulus has reaccelerated global growth. |
| • | | Given this backdrop, there is potential for significant market swings between now and year-end. |
| | |
| 6 | | Visit our website at pgiminvestments.com |
Fees and Expenses (unaudited)
As a shareholder of the Fund, you incur two types of costs: (1) transaction costs, including sales charges (loads) on purchase payments and redemptions, as applicable, and (2) ongoing costs, including management fees, distribution, and/or service (12b-1) fees, and other Fund expenses, as applicable. This example is intended to help you understand your ongoing costs (in dollars) of investing in the Fund and to compare these costs with the ongoing costs of investing in other mutual funds.
The example is based on an investment of $1,000 held through the six-month period ended October 31, 2019. The example is for illustrative purposes only; you should consult the Prospectus for information on initial and subsequent minimum investment requirements.
Actual Expenses
The first line for each share class in the table on the following page provides information about actual account values and actual expenses. You may use the information on this line, together with the amount you invested, to estimate the expenses that you paid over the period. Simply divide your account value by $1,000 (for example, an $8,600 account value ÷ $1,000 = 8.6), then multiply the result by the number on the first line under the heading “Expenses Paid During the Six-Month Period” to estimate the expenses you paid on your account during this period.
Hypothetical Example for Comparison Purposes
The second line for each share class in the table on the following page provides information about hypothetical account values and hypothetical expenses based on the Fund’s actual expense ratio and an assumed rate of return of 5% per year before expenses, which is not the Fund’s actual return. The hypothetical account values and expenses may not be used to estimate the actual ending account balance or expenses you paid for the period. You may use this information to compare the ongoing costs of investing in the Fund and other funds. To do so, compare this 5% hypothetical example with the 5% hypothetical examples that appear in the shareholder reports of the other funds.
The Fund’s transfer agent may charge additional fees to holders of certain accounts that are not included in the expenses shown in the table on the following page. These fees apply to individual retirement accounts (IRAs) and Section 403(b) accounts. As of the close of the six-month period covered by the table, IRA fees included an annual maintenance fee of $15 per account (subject to a maximum annual maintenance fee of $25 for all accounts held by the same shareholder). Section 403(b) accounts are charged an annual $25 fiduciary maintenance fee. Some of the fees may vary in amount, or may be waived, based on your total account balance or the number of PGIM funds, including the Fund, that you own. You should consider the additional fees that were charged to your Fund account over the six-month period when you estimate the total ongoing expenses paid over the period
| | | | |
| PGIM QMA Emerging Markets Equity Fund | | | 7 | |
Fees and Expenses (continued)
and the impact of these fees on your ending account value, as these additional expenses are not reflected in the information provided in the expense table. Additional fees have the effect of reducing investment returns.
Please note that the expenses shown in the table are meant to highlight your ongoing costs only and do not reflect any transactional costs such as sales charges (loads). Therefore, the second line for each share class in the table is useful in comparing ongoing costs only and will not help you determine the relative total costs of owning different funds. In addition, if these transactional costs were included, your costs would have been higher.
| | | | | | | | | | | | | | | | |
| | | | |
PGIM QMA
Emerging Markets
Equity Fund | | Beginning Account
Value
May 1, 2019 | | | Ending Account
Value
October 31, 2019 | | | Annualized
Expense Ratio
Based on the
Six-Month Period | | | Expenses Paid
During the
Six-Month Period* | |
| Actual | | | $1,000.00 | | | $ | 964.50 | | | | 1.20 | % | | $ | 5.94 | |
| Hypothetical | | $ | 1,000.00 | | | $ | 1,019.16 | | | | 1.20 | % | | $ | 6.11 | |
*Fund expenses (net of fee waivers or subsidies, if any) for each share class are equal to the annualized expense ratio for each share class (provided in the table), multiplied by the average account value over the period, multiplied by the 184 days in the six-month period ended October 31, 2019, and divided by the 365 days in the Fund’s fiscal year ended October 31, 2019 (to reflect the six-month period). Expenses presented in the table include the expenses of any underlying portfolios in which the Fund may invest.
| | |
| 8 | | Visit our website at pgiminvestments.com |
Schedule of Investments
as of October 31, 2019
| | | | | | | | |
| Description | | Shares | | | Value | |
LONG-TERM INVESTMENTS 100.4% | | | | | | | | |
| | |
COMMON STOCKS 90.3% | | | | | | | | |
| | |
Argentina 0.2% | | | | | | | | |
Globant SA* | | | 700 | | | $ | 65,282 | |
| | |
Brazil 4.2% | | | | | | | | |
B3 SA - Brasil Bolsa Balcao | | | 11,000 | | | | 132,779 | |
Banco Bradesco SA | | | 6,613 | | | | 54,249 | |
Banco BTG Pactual SA, UTS | | | 1,200 | | | | 19,509 | |
Banco do Brasil SA | | | 20,000 | | | | 239,421 | |
Banco Santander Brasil SA, UTS | | | 18,400 | | | | 217,561 | |
BB Seguridade Participacoes SA | | | 8,500 | | | | 71,955 | |
Centrais Eletricas Brasileiras SA | | | 1,200 | | | | 11,879 | |
Cia Siderurgica Nacional SA | | | 3,300 | | | | 9,751 | |
Localiza Rent a Car SA | | | 3,100 | | | | 33,238 | |
Magazine Luiza SA | | | 3,100 | | | | 34,320 | |
Petrobras Distribuidora SA | | | 3,700 | | | | 26,201 | |
Petroleo Brasileiro SA | | | 16,600 | | | | 135,267 | |
Sul America SA, UTS | | | 1,100 | | | | 13,399 | |
TIM Participacoes SA | | | 7,600 | | | | 21,508 | |
Vale SA* | | | 17,532 | | | | 206,511 | |
WEG SA | | | 4,600 | | | | 29,500 | |
| | | | | | | | |
| | | | | | | 1,257,048 | |
| | |
Chile 1.2% | | | | | | | | |
Banco de Chile | | | 166,158 | | | | 21,397 | |
Cia Cervecerias Unidas SA | | | 13,444 | | | | 134,148 | |
Colbun SA | | | 41,695 | | | | 7,194 | |
Enel Americas SA | | | 1,037,031 | | | | 193,674 | |
| | | | | | | | |
| | | | | | | 356,413 | |
| | |
China 31.6% | | | | | | | | |
Alibaba Group Holding Ltd., ADR* | | | 8,200 | | | | 1,448,694 | |
Angang Steel Co. Ltd. (Class H Stock) | | | 166,400 | | | | 55,514 | |
Anhui Conch Cement Co. Ltd. (Class H Stock) | | | 40,500 | | | | 240,564 | |
ANTA Sports Products Ltd. | | | 14,000 | | | | 136,766 | |
Bank of China Ltd. (Class H Stock) | | | 633,000 | | | | 258,133 | |
Bank of Communications Co. Ltd. (Class H Stock) | | | 299,000 | | | | 203,601 | |
Bank of Jiangsu Co. Ltd. (Class A Stock) | | | 13,900 | | | | 13,914 | |
Bank of Nanjing Co. Ltd. (Class A Stock) | | | 13,100 | | | | 16,000 | |
Beijing Enterprises Holdings Ltd. | | | 9,500 | | | | 44,639 | |
China CITIC Bank Corp. Ltd. (Class H Stock) | | | 47,000 | | | | 27,195 | |
China Conch Venture Holdings Ltd. | | | 2,000 | | | | 7,832 | |
China Construction Bank Corp. (Class H Stock) | | | 483,000 | | | | 386,175 | |
See Notes to Financial Statements.
| | | | |
| PGIM QMA Emerging Markets Equity Fund | | | 9 | |
Schedule of Investments(continued)
as of October 31, 2019
| | | | | | | | |
| Description | | Shares | | | Value | |
COMMON STOCKS (Continued) | | | | | | | | |
| | |
China (cont’d.) | | | | | | | | |
China International Travel Service Corp. Ltd. (Class A Stock) | | | 1,489 | | | $ | 19,058 | |
China Medical System Holdings Ltd. | | | 146,000 | | | | 197,772 | |
China Minsheng Banking Corp. Ltd. (Class H Stock) | | | 294,000 | | | | 205,204 | |
China Mobile Ltd. | | | 12,000 | | | | 97,326 | |
China National Building Material Co. Ltd. (Class H Stock) | | | 232,000 | | | | 194,888 | |
China Pacific Insurance Group Co. Ltd. (Class H Stock) | | | 60,000 | | | | 216,686 | |
China Resources Cement Holdings Ltd. | | | 14,000 | | | | 15,296 | |
China Resources Land Ltd. | | | 14,000 | | | | 59,272 | |
China Resources Pharmaceutical Group Ltd., 144A | | | 56,000 | | | | 51,760 | |
China Resources Sanjiu Medical & Pharmaceutical Co. Ltd. (Class A Stock) | | | 3,700 | | | | 15,439 | |
China Telecom Corp. Ltd. (Class H Stock) | | | 78,000 | | | | 33,164 | |
Chinese Universe Publishing & Media Group Co. Ltd. (Class A Stock) | | | 8,286 | | | | 13,947 | |
CITIC Ltd. | | | 166,000 | | | | 217,212 | |
CNOOC Ltd. | | | 104,000 | | | | 154,448 | |
Country Garden Services Holdings Co. Ltd. | | | 28,000 | | | | 94,752 | |
Gemdale Corp. (Class A Stock) | | | 9,800 | | | | 16,502 | |
Greenland Holdings Corp. Ltd. (Class A Stock) | | | 13,100 | | | | 12,651 | |
Guangzhou Baiyunshan Pharmaceutical Holdings Co. Ltd. (Class A Stock) | | | 2,500 | | | | 11,945 | |
Hangzhou Tigermed Consulting Co. Ltd. (Class A Stock) | | | 1,900 | | | | 18,393 | |
Hengan International Group Co. Ltd. | | | 3,500 | | | | 24,386 | |
HLA Corp. Ltd. (Class A Stock) | | | 11,900 | | | | 12,957 | |
Industrial & Commercial Bank of China Ltd. (Class H Stock) | | | 347,000 | | | | 247,741 | |
Industrial Bank Co. Ltd. (Class A Stock) | | | 7,000 | | | | 18,545 | |
JD.com, Inc., ADR* | | | 9,600 | | | | 299,040 | |
Jiangsu Hengrui Medicine Co. Ltd. (Class A Stock) | | | 1,100 | | | | 14,145 | |
Jinke Properties Group Co. Ltd. (Class A Stock) | | | 16,300 | | | | 15,986 | |
Kweichow Moutai Co. Ltd. (Class A Stock) | | | 300 | | | | 50,057 | |
Li Ning Co. Ltd. | | | 24,500 | | | | 83,033 | |
Logan Property Holdings Co. Ltd. | | | 38,000 | | | | 57,923 | |
Longfor Group Holdings Ltd., 144A | | | 9,500 | | | | 39,633 | |
LONGi Green Energy Technology Co. Ltd. (Class A Stock) | | | 4,400 | | | | 14,245 | |
Luxshare Precision Industry Co. Ltd. (Class A Stock) | | | 5,200 | | | | 23,344 | |
Luye Pharma Group Ltd., 144A(a) | | | 173,500 | | | | 128,108 | |
Luzhou Laojiao Co. Ltd. (Class A Stock) | | | 1,500 | | | | 18,506 | |
Metallurgical Corp. of China Ltd. (Class H Stock) | | | 448,000 | | | | 94,591 | |
Momo, Inc., ADR | | | 5,800 | | | | 194,416 | |
NetEase, Inc., ADR | | | 400 | | | | 114,344 | |
New China Life Insurance Co. Ltd. (Class H Stock) | | | 33,700 | | | | 130,598 | |
New Oriental Education & Technology Group, Inc., ADR* | | | 700 | | | | 85,442 | |
PICC Property & Casualty Co. Ltd. (Class H Stock) | | | 98,000 | | | | 123,928 | |
Pinduoduo, Inc., ADR* | | | 1,000 | | | | 40,880 | |
See Notes to Financial Statements.
| | | | | | | | |
| Description | | Shares | | | Value | |
COMMON STOCKS (Continued) | | | | | | | | |
| | |
China (cont’d.) | | | | | | | | |
Ping An Bank Co. Ltd. (Class A Stock) | | | 7,500 | | | $ | 17,230 | |
Ping An Insurance Group Co. of China Ltd. (Class H Stock) | | | 44,500 | | | | 512,628 | |
Poly Developments & Holdings Group Co. Ltd. (Class A Stock) | | | 8,700 | | | | 17,700 | |
Postal Savings Bank of China Co. Ltd. (Class H Stock), 144A | | | 42,000 | | | | 26,879 | |
Sany Heavy Industry Co. Ltd. (Class A Stock) | | | 9,100 | | | | 17,308 | |
Shaanxi Coal Industry Co. Ltd. (Class A Stock) | | | 12,800 | | | | 15,174 | |
Shandong Buchang Pharmaceuticals Co. Ltd. (Class A Stock) | | | 5,200 | | | | 15,070 | |
Shandong Weigao Group Medical Polymer Co. Ltd. (Class H Stock) | | | 72,000 | | | | 82,694 | |
Shanghai Construction Group Co. Ltd. (Class A Stock) | | | 32,100 | | | | 15,508 | |
Shanghai International Airport Co. Ltd. (Class A Stock) | | | 1,400 | | | | 15,106 | |
Shanghai Pudong Development Bank Co. Ltd. (Class A Stock) | | | 11,000 | | | | 19,474 | |
Shanxi Xishan Coal & Electricity Power Co. Ltd. (Class A Stock) | | | 16,900 | | | | 13,544 | |
Shenzhen MindrayBio-Medical Electronics Co. Ltd. (Class A Stock) | | | 700 | | | | 17,645 | |
Shui On Land Ltd. | | | 773,000 | | | | 155,533 | |
Sinotruk Hong Kong Ltd.(a) | | | 82,000 | | | | 123,540 | |
Sunac China Holdings Ltd. | | | 13,000 | | | | 58,758 | |
Tencent Holdings Ltd. | | | 27,000 | | | | 1,097,886 | |
Tingyi Cayman Islands Holding Corp. | | | 10,000 | | | | 13,296 | |
Uni-President China Holdings Ltd. | | | 44,000 | | | | 45,402 | |
Vipshop Holdings Ltd., ADR* | | | 16,500 | | | | 190,410 | |
Weichai Power Co. Ltd. (Class H Stock) | | | 144,000 | | | | 225,166 | |
Wens Foodstuffs Group Co. Ltd. (Class A Stock) | | | 3,300 | | | | 18,805 | |
Wuhu Sanqi Interactive Entertainment Network Technology Group Co. Ltd. (Class A Stock) | | | 5,900 | | | | 15,220 | |
Wuliangye Yibin Co. Ltd. (Class A Stock) | | | 1,300 | | | | 24,279 | |
XCMG Construction Machinery Co. Ltd. (Class A Stock) | | | 23,400 | | | | 14,976 | |
Xiamen C & D Inc. (Class A Stock) | | | 11,700 | | | | 14,084 | |
Yum China Holdings, Inc. | | | 5,900 | | | | 250,750 | |
Yunda Holding Co. Ltd. (Class A Stock) | | | 3,100 | | | | 14,444 | |
YY, Inc., ADR* | | | 300 | | | | 17,052 | |
Zhejiang Dahua Technology Co. Ltd. (Class A Stock) | | | 6,700 | | | | 15,272 | |
Zoomlion Heavy Industry Science & Technology Co. Ltd. (Class A Stock) | | | 22,600 | | | | 18,731 | |
| | | | | | | | |
| | | | | | | 9,416,154 | |
| | |
Colombia 0.1% | | | | | | | | |
Bancolombia SA | | | 1,330 | | | | 16,173 | |
See Notes to Financial Statements.
| | | | |
| PGIM QMA Emerging Markets Equity Fund | | | 11 | |
Schedule of Investments(continued)
as of October 31, 2019
| | | | | | | | |
| Description | | Shares | | | Value | |
COMMON STOCKS (Continued) | | | | | | | | |
| | |
Greece 0.7% | | | | | | | | |
Hellenic Telecommunications Organization SA | | | 12,552 | | | $ | 189,965 | |
JUMBO SA | | | 575 | | | | 11,204 | |
| | | | | | | | |
| | | | | | | 201,169 | |
| | |
Hong Kong 0.2% | | | | | | | | |
Sino Biopharmaceutical Ltd. | | | 36,000 | | | | 53,470 | |
| | |
India 7.4% | | | | | | | | |
Asian Paints Ltd. | | | 8,463 | | | | 216,090 | |
Bajaj Finance Ltd. | | | 4,476 | | | | 254,419 | |
Bandhan Bank Ltd., 144A | | | 2,078 | | | | 17,981 | |
Bharti Infratel Ltd. | | | 48,364 | | | | 129,359 | |
Dr. Reddy’s Laboratories Ltd. | | | 1,322 | | | | 51,887 | |
GAIL India Ltd. | | | 8,168 | | | | 15,829 | |
Hindustan Petroleum Corp. Ltd. | | | 3,475 | | | | 15,942 | |
Housing Development Finance Corp. Ltd. | | | 2,509 | | | | 75,446 | |
ICICI Lombard General Insurance Co. Ltd., 144A | | | 693 | | | | 13,110 | |
Infosys Ltd., ADR | | | 18,600 | | | | 178,374 | |
ITC Ltd. | | | 34,967 | | | | 127,169 | |
Larsen & Toubro Ltd. | | | 2,489 | | | | 51,733 | |
LIC Housing Finance Ltd. | | | 1,518 | | | | 8,829 | |
NTPC Ltd. | | | 122,452 | | | | 211,527 | |
Oil & Natural Gas Corp. Ltd. | | | 108,137 | | | | 216,166 | |
Power Grid Corp. of India Ltd. | | | 74,685 | | | | 209,122 | |
Reliance Industries Ltd., 144A, GDR | | | 2,941 | | | | 120,941 | |
Tata Steel Ltd. | | | 14,846 | | | | 79,688 | |
Wipro Ltd. | | | 55,758 | | | | 204,177 | |
| | | | | | | | |
| | | | | | | 2,197,789 | |
| | |
Indonesia 1.0% | | | | | | | | |
Gudang Garam Tbk PT | | | 20,000 | | | | 79,903 | |
Indofood CBP Sukses Makmur Tbk PT | | | 12,900 | | | | 10,672 | |
Indofood Sukses Makmur Tbk PT | | | 343,400 | | | | 188,013 | |
Kalbe Farma Tbk PT | | | 111,100 | | | | 12,589 | |
| | | | | | | | |
| | | | | | | 291,177 | |
| | |
Luxembourg 0.1% | | | | | | | | |
Reinet Investments SCA | | | 803 | | | | 15,023 | |
| | |
Malaysia 0.9% | | | | | | | | |
AMMB Holdings Bhd | | | 168,400 | | | | 160,582 | |
Genting Malaysia Bhd | | | 44,100 | | | | 33,810 | |
See Notes to Financial Statements.
| | | | | | | | |
| Description | | Shares | | | Value | |
COMMON STOCKS (Continued) | | | | | | | | |
| | |
Malaysia (cont’d.) | | | | | | | | |
Malaysia Airports Holdings Bhd | | | 5,300 | | | $ | 10,013 | |
MISC Bhd | | | 6,000 | | | | 11,913 | |
RHB Bank Bhd | | | 8,500 | | | | 11,707 | |
Westports Holdings Bhd | | | 49,700 | | | | 50,708 | |
| | | | | | | | |
| | | | | | | 278,733 | |
| | |
Mexico 2.3% | | | | | | | | |
America Movil SAB de CV (Class L Stock) | | | 176,200 | | | | 139,502 | |
Grupo Aeroportuario del Pacifico SAB de CV (Class B Stock) | | | 700 | | | | 7,337 | |
Grupo Aeroportuario del Sureste SAB de CV (Class B Stock) | | | 12,985 | | | | 212,631 | |
Kimberly-Clark de Mexico SAB de CV (Class A Stock)* | | | 37,800 | | | | 75,948 | |
Wal-Mart de Mexico SAB de CV | | | 86,900 | | | | 260,431 | |
| | | | | | | | |
| | | | | | | 695,849 | |
| | |
Pakistan 0.1% | | | | | | | | |
Oil & Gas Development Co. Ltd. | | | 33,500 | | | | 27,783 | |
| | |
Peru 0.3% | | | | | | | | |
Credicorp Ltd. | | | 400 | | | | 85,616 | |
| | |
Philippines 1.9% | | | | | | | | |
Globe Telecom, Inc. | | | 4,995 | | | | 179,507 | |
PLDT, Inc. | | | 8,520 | | | | 184,730 | |
SM Investments Corp. | | | 1,320 | | | | 26,747 | |
SM Prime Holdings, Inc. | | | 216,000 | | | | 165,821 | |
| | | | | | | | |
| | | | | | | 556,805 | |
| | |
Poland 1.7% | | | | | | | | |
CD Projekt SA | | | 2,476 | | | | 163,600 | |
Cyfrowy Polsat SA | | | 1,550 | | | | 11,234 | |
Powszechna Kasa Oszczednosci Bank Polski SA | | | 21,355 | | | | 213,195 | |
Powszechny Zaklad Ubezpieczen SA | | | 13,309 | | | | 128,716 | |
| | | | | | | | |
| | | | | | | 516,745 | |
| | |
Qatar 0.0% | | | | | | | | |
Commercial Bank PSQC (The) | | | 10,558 | | | | 12,443 | |
| | |
Russia 4.7% | | | | | | | | |
Gazprom PJSC | | | 89,470 | | | | 361,471 | |
Inter RAO UES PJSC | | | 171,000 | | | | 11,525 | |
LUKOIL PJSC | | | 3,857 | | | | 355,930 | |
See Notes to Financial Statements.
| | | | |
| PGIM QMA Emerging Markets Equity Fund | | | 13 | |
Schedule of Investments(continued)
as of October 31, 2019
| | | | | | | | |
| Description | | Shares | | | Value | |
COMMON STOCKS (Continued) | | | | | | | | |
| | |
Russia (cont’d.) | | | | | | | | |
Magnitogorsk Iron & Steel Works PJSC | | | 12,400 | | | $ | 7,069 | |
MMC Norilsk Nickel PJSC | | | 332 | | | | 92,638 | |
Novatek PJSC, GDR | | | 887 | | | | 188,044 | |
Novolipetsk Steel PJSC | | | 6,090 | | | | 11,879 | |
Sberbank of Russia PJSC, ADR | | | 10,613 | | | | 156,144 | |
Tatneft PJSC | | | 8,924 | | | | 104,271 | |
X5 Retail Group NV, GDR | | | 3,370 | | | | 112,854 | |
| | | | | | | | |
| | | | | | | 1,401,825 | |
| | |
South Africa 4.3% | | | | | | | | |
Anglo American Platinum Ltd. | | | 3,227 | | | | 240,360 | |
AngloGold Ashanti Ltd. | | | 2,290 | | | | 50,528 | |
Aspen Pharmacare Holdings Ltd.* | | | 14,077 | | | | 98,374 | |
Bid Corp. Ltd. | | | 1,457 | | | | 33,940 | |
Exxaro Resources Ltd. | | | 21,477 | | | | 175,521 | |
Gold Fields Ltd. | | | 1,950 | | | | 12,069 | |
Kumba Iron Ore Ltd. | | | 6,828 | | | | 166,177 | |
MultiChoice Group* | | | 7,243 | | | | 60,314 | |
Naspers Ltd. (Class N Stock) | | | 1,166 | | | | 165,111 | |
Netcare Ltd. | | | 6,499 | | | | 7,354 | |
Old Mutual Ltd. | | | 27,166 | | | | 35,314 | |
Standard Bank Group Ltd. | | | 7,185 | | | | 82,514 | |
Telkom SA SOC Ltd. | | | 32,048 | | | | 146,606 | |
Woolworths Holdings Ltd. | | | 5,323 | | | | 20,248 | |
| | | | | | | | |
| | | | | | | 1,294,430 | |
| | |
South Korea 11.5% | | | | | | | | |
BNK Financial Group, Inc. | | | 2,507 | | | | 14,937 | |
Cheil Worldwide, Inc. | | | 812 | | | | 17,272 | |
Daelim Industrial Co. Ltd. | | | 2,260 | | | | 176,511 | |
Fila Korea Ltd. | | | 2,366 | | | | 116,492 | |
GS Holdings Corp. | | | 271 | | | | 11,513 | |
Hana Financial Group, Inc. | | | 7,799 | | | | 225,473 | |
Hyundai Glovis Co. Ltd. | | | 104 | | | | 13,459 | |
Hyundai Mobis Co. Ltd. | | | 1,280 | | | | 259,858 | |
Industrial Bank of Korea | | | 18,217 | | | | 184,364 | |
Kakao Corp. | | | 272 | | | | 33,028 | |
Kangwon Land, Inc. | | | 612 | | | | 16,481 | |
KB Financial Group, Inc. | | | 2,906 | | | | 104,161 | |
Kia Motors Corp. | | | 6,841 | | | | 249,477 | |
Korea Aerospace Industries Ltd. | | | 403 | | | | 13,146 | |
Korea Gas Corp. | | | 177 | | | | 5,972 | |
Korea Investment Holdings Co. Ltd. | | | 220 | | | | 12,734 | |
See Notes to Financial Statements.
| | | | | | | | |
| Description | | Shares | | | Value | |
COMMON STOCKS (Continued) | | | | | | | | |
| | |
South Korea (cont’d.) | | | | | | | | |
Korea Zinc Co. Ltd. | | | 45 | | | $ | 16,783 | |
KT&G Corp. | | | 2,666 | | | | 228,883 | |
Kumho Petrochemical Co. Ltd. | | | 243 | | | | 14,525 | |
Lotte Corp. | | | 679 | | | | 21,212 | |
POSCO | | | 1,333 | | | | 240,991 | |
Posco International Corp. | | | 1,651 | | | | 25,793 | |
Samsung Electronics Co. Ltd. | | | 26,065 | | | | 1,121,865 | |
Samsung Engineering Co. Ltd.* | | | 841 | | | | 12,813 | |
Shinhan Financial Group Co. Ltd. | | | 7,403 | | | | 269,680 | |
Woongjin Coway Co. Ltd. | | | 204 | | | | 16,098 | |
| | | | | | | | |
| | | | | | | 3,423,521 | |
| | |
Taiwan 12.5% | | | | | | | | |
Advantech Co. Ltd. | | | 17,000 | | | | 168,257 | |
Asia Cement Corp. | | | 11,000 | | | | 15,523 | |
Chailease Holding Co. Ltd. | | | 30 | | | | 135 | |
Chicony Electronics Co. Ltd. | | | 60,000 | | | | 186,190 | |
China Life Insurance Co. Ltd.* | | | 14,000 | | | | 11,526 | |
Chunghwa Telecom Co. Ltd. | | | 11,000 | | | | 40,440 | |
Far Eastern New Century Corp. | | | 17,000 | | | | 16,505 | |
Feng TAY Enterprise Co. Ltd. | | | 31,900 | | | | 214,531 | |
Foxconn Technology Co. Ltd. | | | 81,000 | | | | 173,344 | |
Giant Manufacturing Co. Ltd. | | | 2,000 | | | | 14,805 | |
Hua Nan Financial Holdings Co. Ltd. | | | 42,000 | | | | 30,142 | |
Largan Precision Co. Ltd. | | | 1,000 | | | | 145,935 | |
Lite-On Technology Corp. | | | 117,000 | | | | 192,279 | |
MediaTek, Inc. | | | 14,000 | | | | 187,005 | |
Novatek Microelectronics Corp. | | | 32,000 | | | | 205,207 | |
Pou Chen Corp. | | | 12,000 | | | | 16,013 | |
Realtek Semiconductor Corp. | | | 5,000 | | | | 37,039 | |
Shanghai Commercial & Savings Bank Ltd. (The) | | | 4,874 | | | | 8,367 | |
SinoPac Financial Holdings Co. Ltd. | | | 492,000 | | | | 201,480 | |
Taiwan Semiconductor Manufacturing Co. Ltd. | | | 131,000 | | | | 1,274,079 | |
Uni-President Enterprises Corp. | | | 26,000 | | | | 64,055 | |
Win Semiconductors Corp. | | | 2,000 | | | | 20,732 | |
Yuanta Financial Holding Co. Ltd. | | | 407,000 | | | | 254,044 | |
Zhen Ding Technology Holding Ltd. | | | 53,000 | | | | 250,372 | |
| | | | | | | | |
| | | | | | | 3,728,005 | |
| | |
Thailand 1.7% | | | | | | | | |
Advanced Info Service PCL | | | 31,700 | | | | 240,335 | |
BTS Group Holdings PCL | | | 34,100 | | | | 15,126 | |
Charoen Pokphand Foods PCL | | | 14,100 | | | | 11,772 | |
See Notes to Financial Statements.
| | | | |
| PGIM QMA Emerging Markets Equity Fund | | | 15 | |
Schedule of Investments(continued)
as of October 31, 2019
| | | | | | | | |
| Description | | Shares | | | Value | |
COMMON STOCKS (Continued) | | | | | | | | |
| | |
Thailand (cont’d.) | | | | | | | | |
Indorama Ventures PCL | | | 42,754 | | | $ | 39,664 | |
Krung Thai Bank PCL | | | 309,300 | | | | 169,869 | |
PTT Exploration & Production PCL | | | 7,500 | | | | 29,926 | |
Thai Union Group PCL | | | 17,400 | | | | 8,410 | |
| | | | | | | | |
| | | | | | | 515,102 | |
| | |
Turkey 1.2% | | | | | | | | |
BIM Birlesik Magazalar A/S | | | 5,488 | | | | 45,472 | |
Coca-Cola Icecek A/S | | | 13,219 | | | | 72,333 | |
Eregli Demir ve Celik Fabrikalari TAS | | | 23,557 | | | | 26,993 | |
Haci Omer Sabanci Holding A/S | | | 129,089 | | | | 186,793 | |
Turkcell Iletisim Hizmetleri A/S | | | 6,332 | | | | 13,928 | |
| | | | | | | | |
| | | | | | | 345,519 | |
| | |
United Arab Emirates 0.5% | | | | | | | | |
Aldar Properties PJSC | | | 242,401 | | | | 154,855 | |
| | | | | | | | |
TOTAL COMMON STOCKS
(cost $24,106,802) | | | | | | | 26,906,929 | |
| | | | | | | | |
| | |
EXCHANGE-TRADED FUNDS 4.9% | | | | | | | | |
| | |
United States | | | | | | | | |
iShares MSCI Emerging Markets ETF | | | 17,549 | | | | 747,236 | |
iShares MSCI Saudi Arabia ETF(a) | | | 24,600 | | | | 708,972 | |
| | | | | | | | |
TOTAL EXCHANGE-TRADED FUNDS
(cost $1,479,137) | | | | | | | 1,456,208 | |
| | | | | | | | |
| | |
PREFERRED STOCKS 5.2% | | | | | | | | |
| | |
Brazil 4.2% | | | | | | | | |
Banco Bradesco SA (PRFC) | | | 21,400 | | | | 188,201 | |
Centrais Eletricas Brasileiras SA (PRFC B) | | | 15,200 | | | | 155,278 | |
Cia Energetica de Minas Gerais (PRFC) | | | 4,900 | | | | 16,629 | |
Itau Unibanco Holding SA (PRFC) | | | 24,800 | | | | 224,224 | |
Itausa - Investimentos Itau SA (PRFC) | | | 78,800 | | | | 269,183 | |
Petroleo Brasileiro SA (PRFC) | | | 50,900 | | | | 385,573 | |
| | | | | | | | |
| | | | | | | 1,239,088 | |
| | |
Chile 0.5% | | | | | | | | |
Embotelladora Andina SA (PRFC B) | | | 54,556 | | | | 157,430 | |
See Notes to Financial Statements.
| | | | | | | | |
| Description | | Shares | | | Value | |
PREFERRED STOCKS (Continued) | | | | | | | | |
| | |
South Korea 0.5% | | | | | | | | |
Samsung Electronics Co. Ltd. (PRFC) | | | 4,404 | | | $ | 154,388 | |
| | | | | | | | |
TOTAL PREFERRED STOCKS
(cost $1,423,827) | | | | | | | 1,550,906 | |
| | | | | | | | |
TOTAL LONG-TERM INVESTMENTS
(cost $27,009,766) | | | | | | | 29,914,043 | |
| | | | | | | | |
| | |
SHORT-TERM INVESTMENT 2.1% | | | | | | | | |
| | |
AFFILIATED MUTUAL FUND | | | | | | | | |
PGIM Institutional Money Market Fund
(cost $640,859; includes $639,818 of cash collateral for securities on loan)(b)(w) | | | 640,828 | | | | 640,956 | |
| | | | | | | | |
TOTAL INVESTMENTS 102.5%
(cost $27,650,625) | | | | | | | 30,554,999 | |
Liabilities in excess of other assets (2.5)% | | | | | | | (750,789 | ) |
| | | | | | | | |
NET ASSETS 100.0% | | | | | | $ | 29,804,210 | |
| | | | | | | | |
Below is a list of the abbreviation(s) used in the annual report:
144A—Security was purchased pursuant to Rule 144A under the Securities Act of 1933 and, pursuant to the requirements of Rule 144A, may not be resold except to qualified institutional buyers.
ADR—American Depositary Receipt
ETF—Exchange-Traded Fund
GDR—Global Depositary Receipt
LIBOR—London Interbank Offered Rate
MSCI—Morgan Stanley Capital International
PJSC—Public Joint-Stock Company
PRFC—Preference Shares
REITs—Real Estate Investment Trust
UTS—Unit Trust Security
| * | Non-income producing security. |
| (a) | All or a portion of security is on loan. The aggregate market value of such securities, including those sold and pending settlement, is $606,073; cash collateral of $639,818 (included in liabilities) was received with which the Fund purchased highly liquid short-term investments. |
| (b) | Represents security purchased with cash collateral received for securities on loan and includes dividend reinvestment. |
| (w) | PGIM Investments LLC, the manager of the Fund, also serves as manager of the PGIM Core Ultra Short Bond Fund and PGIM Institutional Money Market Fund. |
Fair Value Measurements:
Various inputs are used in determining the value of the Fund’s investments. These inputs are summarized in the three broad levels listed below.
Level 1—unadjusted quoted prices generally in active markets for identical securities.
See Notes to Financial Statements.
| | | | |
| PGIM QMA Emerging Markets Equity Fund | | | 17 | |
Schedule of Investments(continued)
as of October 31, 2019
Level 2—quoted prices for similar securities, interest rates and yield curves, prepayment speeds, foreign currency exchange rates and other observable inputs.
Level 3—unobservable inputs for securities valued in accordance with Board approved fair valuation procedures.
The following is a summary of the inputs used as of October 31, 2019 in valuing such portfolio securities:
| | | | | | | | | | | | |
| | | Level 1 | | | Level 2 | | | Level 3 | |
Investments in Securities | | | | | | | | | | | | |
Assets | | | | | | | | | | | | |
Common Stocks | | | | | | | | | | | | |
Argentina | | $ | 65,282 | | | $ | — | | | $ | — | |
Brazil | | | 1,257,048 | | | | — | | | | — | |
Chile | | | 356,413 | | | | — | | | | — | |
China | | | 2,641,028 | | | | 6,775,126 | | | | — | |
Colombia | | | 16,173 | | | | — | | | | — | |
Greece | | | — | | | | 201,169 | | | | — | |
Hong Kong | | | — | | | | 53,470 | | | | — | |
India | | | 178,374 | | | | 2,019,415 | | | | — | |
Indonesia | | | — | | | | 291,177 | | | | — | |
Luxembourg | | | — | | | | 15,023 | | | | — | |
Malaysia | | | — | | | | 278,733 | | | | — | |
Mexico | | | 695,849 | | | | — | | | | — | |
Pakistan | | | — | | | | 27,783 | | | | — | |
Peru | | | 85,616 | | | | — | | | | — | |
Philippines | | | — | | | | 556,805 | | | | — | |
Poland | | | — | | | | 516,745 | | | | — | |
Qatar | | | — | | | | 12,443 | | | | — | |
Russia | | | 188,044 | | | | 1,213,781 | | | | — | |
South Africa | | | — | | | | 1,294,430 | | | | — | |
South Korea | | | — | | | | 3,423,521 | | | | — | |
Taiwan | | | — | | | | 3,728,005 | | | | — | |
Thailand | | | — | | | | 515,102 | | | | — | |
Turkey | | | — | | | | 345,519 | | | | — | |
United Arab Emirates | | | — | | | | 154,855 | | | | — | |
Exchange-Traded Funds | | | | | | | | | | | | |
United States | | | 1,456,208 | | | | — | | | | — | |
Preferred Stocks | | | | | | | | | | | | |
Brazil | | | 1,239,088 | | | | — | | | | — | |
Chile | | | 157,430 | | | | — | | | | — | |
South Korea | | | — | | | | 154,388 | | | | — | |
Affiliated Mutual Fund | | | 640,956 | | | | — | | | | — | |
| | | | | | | | | | | | |
Total | | $ | 8,977,509 | | | $ | 21,577,490 | | | $ | — | |
| | | | | | | | | | | | |
See Notes to Financial Statements.
Industry Classification:
The industry classification of investments and liabilities in excess of other assets shown as a percentage of net assets as of October 31, 2019 were as follows (unaudited):
| | | | |
Banks | | | 15.7 | % |
Oil, Gas & Consumable Fuels | | | 7.7 | |
Internet & Direct Marketing Retail | | | 7.1 | |
Technology Hardware, Storage & Peripherals | | | 6.1 | |
Semiconductors & Semiconductor Equipment | | | 5.8 | |
Exchange-Traded Funds | | | 4.9 | |
Interactive Media & Services | | | 4.6 | |
Metals & Mining | | | 4.2 | |
Insurance | | | 3.9 | |
Wireless Telecommunication Services | | | 3.0 | |
Real Estate Management & Development | | | 2.6 | |
Pharmaceuticals | | | 2.2 | |
Affiliated Mutual Fund (2.1% represents investments purchased with collateral from securities on loan) | | | 2.1 | |
Electronic Equipment, Instruments & Components | | | 2.0 | |
Textiles, Apparel & Luxury Goods | | | 2.0 | |
Electric Utilities | | | 1.9 | |
Diversified Telecommunication Services | | | 1.7 | |
Construction Materials | | | 1.7 | |
Beverages | | | 1.6 | |
Food & Staples Retailing | | | 1.6 | |
Capital Markets | | | 1.6 | |
Tobacco | | | 1.5 | |
Machinery | | | 1.4 | |
IT Services | | | 1.3 | |
Construction & Engineering | | | 1.2 | |
Food Products | | | 1.1 | |
Hotels, Restaurants & Leisure | | | 1.1 | |
Entertainment | | | 1.0 | |
Industrial Conglomerates | | | 1.0 | |
Transportation Infrastructure | | | 0.9 | |
Auto Components | | | 0.9 | |
Consumer Finance | | | 0.9 | |
| | | | |
Chemicals | | | 0.8 | % |
Automobiles | | | 0.8 | |
Independent Power & Renewable Electricity Producers | | | 0.7 | |
Diversified Financial Services | | | 0.6 | |
Health Care Equipment & Supplies | | | 0.4 | |
Media | | | 0.3 | |
Commercial Services & Supplies | | | 0.3 | |
Diversified Consumer Services | | | 0.3 | |
Thrifts & Mortgage Finance | | | 0.3 | |
Household Products | | | 0.2 | |
Software | | | 0.2 | |
Multiline Retail | | | 0.2 | |
Road & Rail | | | 0.2 | |
Specialty Retail | | | 0.2 | |
Gas Utilities | | | 0.1 | |
Trading Companies & Distributors | | | 0.1 | |
Electrical Equipment | | | 0.1 | |
Personal Products | | | 0.1 | |
Life Sciences Tools & Services | | | 0.1 | |
Household Durables | | | 0.1 | |
Marine | | | 0.1 | |
Air Freight & Logistics | | | 0.0 | * |
Leisure Products | | | 0.0 | * |
Aerospace & Defense | | | 0.0 | * |
Health Care Providers & Services | | | 0.0 | * |
| | | | |
| | | 102.5 | |
Liabilities in excess of other assets | | | (2.5 | ) |
| | | | |
| | | 100.0 | % |
| | | | |
Effects of Derivative Instruments on the Financial Statements and Primary Underlying Risk Exposure:
The Fund invested in derivative instruments during the reporting period. The primary type of risk associated with these derivative instruments is equity contracts risk. See the Notes to Financial Statements for additional detail regarding these derivative instruments and their risks. The effect of such derivative instruments on the Fund’s financial position and financial performance as reflected in the Statement of Assets and Liabilities and Statement of Operations is presented in the summary below.
See Notes to Financial Statements.
| | | | |
| PGIM QMA Emerging Markets Equity Fund | | | 19 | |
Schedule of Investments(continued)
as of October 31, 2019
The Fund did not hold any derivative instruments as of October 31, 2019, accordingly, no derivative positions were presented in the Statement of Assets and Liabilities.
The effects of derivative instruments on the Statement of Operations for the year ended October 31, 2019 are as follows:
| | | | |
Amount of Realized Gain (Loss) on Derivatives Recognized in Income | |
Derivatives not accounted for as hedging instruments, carried at fair value | | Rights(1) | |
Equity contracts | | $ | 6,214 | |
| | | | |
| (1) | Included in net realized gain (loss) on investment transactions in the Statement of Operations. |
For the year ended October 31, 2019, the Fund did not have any net change in unrealized appreciation (depreciation) on derivatives in the Statement of Operations.
Financial Instruments/Transactions—Summary of Offsetting and Netting Arrangements:
The Fund entered into financial instruments/transactions during the reporting period that are either offset in accordance with current requirements or are subject to enforceable master netting arrangements or similar agreements that permit offsetting. The information about offsetting and related netting arrangements for financial instruments/transactions where the legal right toset-off exists is presented in the summary below.
Offsetting of financial instrument/transaction assets and liabilities:
| | | | | | | | | | | | |
Description | | Gross Market
Value of
Recognized
Assets/(Liabilities) | | | Collateral
Pledged/(Received)(1) | | | Net
Amount | |
Securities on Loan | | $ | 606,073 | | | $ | (606,073 | ) | | $ | — | |
| | | | | | | | | | | | |
| (1) | Collateral amount disclosed by the Fund is limited to the market value of financial instruments/transactions. |
See Notes to Financial Statements.
Statement of Assets and Liabilities
as of October 31, 2019
| | | | |
Assets | | | | |
Investments at value, including securities on loan of $606,073: | | | | |
Unaffiliated investments (cost $27,009,766) | | $ | 29,914,043 | |
Affiliated investments (cost $640,859) | | | 640,956 | |
Foreign currency, at value (cost $15,372) | | | 15,385 | |
Dividends receivable | | | 17,848 | |
Due from Manager | | | 9,953 | |
Receivable for Fund shares sold | | | 9,132 | |
Tax reclaim receivable | | | 4,232 | |
Prepaid expenses and other assets | | | 1,174 | |
| | | | |
Total Assets | | | 30,612,723 | |
| | | | |
| |
Liabilities | | | | |
Payable to broker for collateral for securities on loan | | | 639,818 | |
Payable for Fund shares reacquired | | | 89,777 | |
Custodian and accounting fees payable | | | 44,545 | |
Accrued expenses and other liabilities | | | 33,047 | |
Payable to custodian | | | 1,273 | |
Affiliated transfer agent fee payable | | | 45 | |
Payable for investments purchased | | | 8 | |
| | | | |
Total Liabilities | | | 808,513 | |
| | | | |
| |
Net Assets | | $ | 29,804,210 | |
| | | | |
| | | | | |
Net assets were comprised of: | | | | |
Shares of beneficial interest, at par | | $ | 2,676 | |
Paid-in capital in excess of par | | | 28,055,849 | |
Total distributable earnings (loss) | | | 1,745,685 | |
| | | | |
Net assets, October 31, 2019 | | $ | 29,804,210 | |
| | | | |
| |
Class R6 | | | | |
Net asset value, offering price and redemption price per share,
($29,804,210 ÷ 2,676,357 shares of beneficial interest issued and outstanding) | | $ | 11.14 | |
| | | | |
See Notes to Financial Statements.
| | | | |
| PGIM QMA Emerging Markets Equity Fund | | | 21 | |
Statement of Operations
Year Ended October 31, 2019
| | | | |
Net Investment Income (Loss) | | | | |
Income | | | | |
Unaffiliated dividend income (net of $149,696 foreign withholding tax) | | $ | 829,124 | |
Income from securities lending, net (including affiliated income of $1,786) | | | 5,335 | |
Affiliated dividend income | | | 1,360 | |
| | | | |
Total income | | | 835,819 | |
| | | | |
| |
Expenses | | | | |
Management fee | | | 215,207 | |
Custodian and accounting fees | | | 123,563 | |
Audit fee | | | 32,643 | |
Fund data services | | | 32,150 | |
Shareholders’ reports | | | 20,280 | |
Legal fees and expenses | | | 16,904 | |
Trustees’ fees | | | 11,231 | |
Pricing fees | | | 7,845 | |
Transfer agent’s fees and expenses (including affiliated expense of $297) | | | 343 | |
Registration fees | | | 63 | |
Miscellaneous | | | 26,527 | |
| | | | |
Total expenses | | | 486,756 | |
Less: Fee waiver and/or expense reimbursement | | | (142,257 | ) |
| | | | |
Net expenses | | | 344,499 | |
| | | | |
Net investment income (loss) | | | 491,320 | |
| | | | |
| |
Realized And Unrealized Gain (Loss) On Investment And Foreign Currency Transactions | | | | |
Net realized gain (loss) on: | | | | |
Investment transactions (including affiliated of $360) | | | (1,483,291 | ) |
Foreign currency transactions | | | (4,972 | ) |
| | | | |
| | | (1,488,263 | ) |
| | | | |
Net change in unrealized appreciation (depreciation) on: | | | | |
Investments (including affiliated of $103) (net of change in foreign capital gains taxes $(2,233)) | | | 2,575,254 | |
Foreign currencies | | | (323 | ) |
| | | | |
| | | 2,574,931 | |
| | | | |
Net gain (loss) on investment and foreign currency transactions | | | 1,086,668 | |
| | | | |
Net Increase (Decrease) In Net Assets Resulting From Operations | | $ | 1,577,988 | |
| | | | |
See Notes to Financial Statements.
Statements of Changes in Net Assets
| | | | | | | | |
| |
| | | Year Ended
October 31, | |
| | |
| | | 2019 | | | 2018 | |
Increase (Decrease) in Net Assets | | | | | | | | |
Operations | | | | | | | | |
Net investment income (loss) | | $ | 491,320 | | | $ | 464,900 | |
Net realized gain (loss) on investment and foreign currency transactions | | | (1,488,263 | ) | | | 262,144 | |
Net change in unrealized appreciation (depreciation) on investments and foreign currencies | | | 2,574,931 | | | | (4,494,759 | ) |
| | | | | | | | |
Net increase (decrease) in net assets resulting from operations | | | 1,577,988 | | | | (3,767,715 | ) |
| | | | | | | | |
| | |
Dividends and Distributions | | | | | | | | |
Distributions from distributable earnings | | | | | | | | |
Class R6 | | | (787,341 | ) | | | (1,869,012 | ) |
| | | | | | | | |
| | |
Fund share transactions | | | | | | | | |
Net proceeds from shares sold | | | 2,606,831 | | | | 3,217,983 | |
Net asset value of shares issued in reinvestment of dividends and distributions | | | 787,341 | | | | 1,869,012 | |
Cost of shares reacquired | | | (1,525,185 | ) | | | (775,578 | ) |
| | | | | | | | |
Net increase (decrease) in net assets from Fund share transactions | | | 1,868,987 | | | | 4,311,417 | |
| | | | | | | | |
Total increase (decrease) | | | 2,659,634 | | | | (1,325,310 | ) |
| | |
Net Assets: | | | | | | | | |
Beginning of year | | | 27,144,576 | | | | 28,469,886 | |
| | | | | | | | |
End of year | | $ | 29,804,210 | | | $ | 27,144,576 | |
| | | | | | | | |
See Notes to Financial Statements.
| | | | |
| PGIM QMA Emerging Markets Equity Fund | | | 23 | |
Notes to Financial Statements
Prudential Investment Portfolios 2 (“PIP2”) is registered under the Investment Company Act of 1940, as amended (“1940 Act”), as anopen-end management investment company. PIP2 consists of eleven separate series: PGIM Core Conservative Bond Fund, PGIM Core Short-Term Bond Fund, PGIM Core Ultra Short Bond Fund, PGIM Institutional Money Market Fund, PGIM JennisonSmall-Cap Core Equity Fund, PGIM QMA Emerging Markets Equity Fund, PGIM QMA International Developed Markets Index Fund, PGIM QMAMid-Cap Core Equity Fund, PGIM QMA US Broad Market Index Fund and PGIM TIPS Fund, each of which are diversified funds and PGIM QMA Commodity Strategies Fund, which is anon-diversified fund for purposes of the 1940 Act and may invest a greater percentage of their assets in the securities of a single company or other issuer than a diversified fund. Investing in anon-diversified fund involves greater risk than investing in a diversified fund because a loss resulting from the decline in value of any one security may represent a greater portion of the total assets of anon-diversified fund. These financial statements relate only to the PGIM QMA Emerging Markets Equity Fund (the “Fund”).
The investment objective of the Fund is to seek to provide returns in excess of the Morgan Stanley Capital International Emerging Markets Index over full market cycles.
1. Accounting Policies
The Fund follows the investment company accounting and reporting guidance of the Financial Accounting Standards Board (“FASB”) Accounting Standard Codification (“ASC”) Topic 946 Financial Services—Investment Companies. The following accounting policies conform to U.S. generally accepted accounting principles. The Fund consistently follows such policies in the preparation of their financial statements.
Securities Valuation:The Fund holds securities and other assets and liabilities that are fair valued at the close of each day (generally, 4:00 PM Eastern time) the New York Stock Exchange (“NYSE”) is open for trading. Fair value is the price that would be received to sell an asset or paid to transfer a liability in an orderly transaction between market participants on the measurement date. PIP2’s Board of Trustees (the “Board”) has adopted valuation procedures for security valuation under which fair valuation responsibilities have been delegated to PGIM Investments LLC (“PGIM Investments” or the “Manager”). Pursuant to the Board’s delegation, the Manager has established a Valuation Committee responsible for supervising the fair valuation of portfolio securities and other assets and liabilities. The valuation procedures permit the Fund to utilize independent pricing vendor services, quotations from market makers, and alternative valuation methods when market quotations are either not readily available or not deemed representative of fair value. A record of the Valuation Committee’s actions is subject to the Board’s review, approval, and ratification at its next regularly scheduled quarterly meeting.
For the fiscal reportingyear-end, securities and other assets and liabilities were fair valued at the close of the last U.S. business day. Trading in certain foreign securities may occur when the NYSE is closed (including weekends and holidays). Because such foreign securities trade in markets that are open on weekends and U.S. holidays, the values of some of the Fund’s foreign investments may change on days when investors cannot purchase or redeem Fund shares.
Various inputs determine how the Fund’s investments are valued, all of which are categorized according to the three broad levels (Level 1, 2, or 3) detailed in the Schedule of Investments and referred to herein as the “fair value hierarchy” in accordance with FASB ASC Topic 820—Fair Value Measurements and Disclosures.
Common and preferred stocks, exchange-traded funds, and derivative instruments, such as futures or options, that are traded on a national securities exchange are valued at the last sale price as of the close of trading on the applicable exchange where the security principally trades. Securities traded via NASDAQ are valued at the NASDAQ official closing price. To the extent these securities are valued at the last sale price or NASDAQ official closing price, they are classified as Level 1 in the fair value hierarchy. In the event that no sale or official closing price on valuation date exists, these securities are generally valued at the mean between the last reported bid and ask prices, or at the last bid price in the absence of an ask price. These securities are classified as Level 2 in the fair value hierarchy.
Foreign equities traded on foreign securities exchanges are generally valued using pricing vendor services that provide model prices derived using adjustment factors based on information such as local closing price, relevant general and sector indices, currency fluctuations, depositary receipts, and futures, as applicable. Securities valued using such model prices are classified as Level 2 in the fair value hierarchy. The models generate an evaluated adjustment factor for each security, which is applied to the local closing price to adjust it for post closing market movements up to the time the Fund is valued. Utilizing that evaluated adjustment factor, the vendor provides an evaluated price for each security. If the vendor does not provide an evaluated price, securities are valued in accordance with exchange-traded common and preferred stock valuation policies discussed above.
Investments inopen-end,non-exchange-traded mutual funds are valued at their net asset values as of the close of the NYSE on the date of valuation. These securities are classified as Level 1 in the fair value hierarchy since they may be purchased or sold at their net asset values on the date of valuation.
Securities and other assets that cannot be priced according to the methods described above are valued based on pricing methodologies approved by the Board. In the event that unobservable inputs are used when determining such valuations, the securities will be classified as Level 3 in the fair value hierarchy.
When determining the fair value of securities, some of the factors influencing the valuation include: the nature of any restrictions on disposition of the securities; assessment of the
| | | | |
| PGIM QMA Emerging Markets Equity Fund | | | 25 | |
Notes to Financial Statements(continued)
general liquidity of the securities; the issuer’s financial condition and the markets in which it does business; the cost of the investment; the size of the holding and the capitalization of the issuer; the prices of any recent transactions or bids/offers for such securities or any comparable securities; any available analyst media or other reports or information deemed reliable by the Manager regarding the issuer or the markets or industry in which it operates. Using fair value to price securities may result in a value that is different from a security’s most recent closing price and from the price used by other unaffiliated mutual funds to calculate their net asset values.
Foreign Currency Translation:The books and records of the Fund are maintained in U.S. dollars. Foreign currency amounts are translated into U.S. dollars on the following basis:
(i) market value of investment securities, other assets and liabilities—at the current rates of exchange;
(ii) purchases and sales of investment securities, income and expenses—at the rates of exchange prevailing on the respective dates of such transactions.
Although the net assets of the Fund are presented at the foreign exchange rates and market values at the close of the period, the Fund does not generally isolate that portion of the results of operations arising as a result of changes in the foreign exchange rates from the fluctuations arising from changes in the market prices of long-term portfolio securities held at the end of the period. Similarly, the Fund does not isolate the effect of changes in foreign exchange rates from the fluctuations arising from changes in the market prices of long-term portfolio securities sold during the period. Accordingly, holding period realized foreign currency gains (losses) are included in the reported net realized gains (losses) on investment transactions.
Net realized gains (losses) on foreign currency transactions represent net foreign exchange gains (losses) from the disposition of holdings of foreign currencies, currency gains (losses) realized between the trade and settlement dates on forward currency transactions, and the difference between the amounts of interest, dividends and foreign withholding taxes recorded on the Fund’s books and the U.S. dollar equivalent amounts actually received or paid. Net unrealized currency gains (losses) arise from valuing foreign currency denominated assets and liabilities (other than investments) at period end exchange rates.
Master Netting Arrangements:The Fund is subject to various Master Agreements, or netting arrangements, with select counterparties. These are agreements which a subadviser may have negotiated and entered into on behalf of all or a portion of the Fund. A master netting arrangement between the Fund and the counterparty permits the Fund to offset amounts payable by the Fund to the same counterparty against amounts to be received; and by the
receipt of collateral from the counterparty by the Fund to cover the Fund’s exposure to the counterparty. However, there is no assurance that such mitigating factors are easily enforceable. In addition to master netting arrangements, the right toset-off exists when all the conditions are met such that each of the parties owes the other determinable amounts, the reporting party has the right toset-off the amount owed with the amount owed by the other party, the reporting party intends toset-off and the right ofset-off is enforceable by law. During the reporting period, there was no intention to settle on a net basis and all amounts are presented on a gross basis on the Statement of Assets and Liabilities.
Rights:The Fund held rights acquired either through a direct purchase or pursuant to corporate actions. Rights entitle the holder to buy a proportionate amount of common stock, or such other security that the issuer may specify, at a specific price and time through the expiration dates. Such rights are held as long positions by the Fund until exercised, sold or expired. Rights are valued at fair value in accordance with the Board approved fair valuation procedures.
Securities Lending:The Fund lends its portfolio securities to banks and broker-dealers. The loans are secured by collateral at least equal to the market value of the securities loaned. Collateral pledged by each borrower is invested in an affiliated money market fund and is marked to market daily, based on the previous day’s market value, such that the value of the collateral exceeds the value of the loaned securities. In the event of significant appreciation in value of securities on loan on the last business day of the reporting period, the financial statements may reflect a collateral value that is less than the market value of the loaned securities. Such shortfall is remedied as described above. Loans are subject to termination at the option of the borrower or the Fund. Upon termination of the loan, the borrower will return to the Fund securities identical to the loaned securities. Should the borrower of the securities fail financially, the Fund has the right to repurchase the securities in the open market using the collateral.
The Fund recognizes income, net of any rebate and securities lending agent fees, for lending its securities in the form of fees or interest on the investment of any cash received as collateral. The borrower receives all interest and dividends from the securities loaned and such payments are passed back to the lender in amounts equivalent thereto. The Fund also continues to recognize any unrealized gain (loss) in the market price of the securities loaned and on the change in the value of the collateral invested that may occur during the term of the loan. In addition, realized gain (loss) is recognized on changes in the value of the collateral invested upon liquidation of the collateral. Net earnings from securities lending are disclosed on the Statement of Operations as “Income from securities lending, net”.
Securities Transactions and Net Investment Income:Securities transactions are recorded on the trade date. Realized gains (losses) from investment and currency transactions are calculated on the specific identification method. Dividend income is recorded on theex-date, or for certain foreign securities, when the Fund becomes aware of such dividends. Expenses are recorded on an accrual basis, which may require the use of certain estimates by management that may differ from actual.
| | | | |
| PGIM QMA Emerging Markets Equity Fund | | | 27 | |
Notes to Financial Statements(continued)
Taxes:It is the Fund’s policy to continue to meet the requirements of the Internal Revenue Code applicable to regulated investment companies and to distribute all of its taxable net investment income and capital gains, if any, to its shareholders. Therefore, no federal income tax provision is required. Withholding taxes on foreign dividends, interest and capital gains, if any, are recorded, net of reclaimable amounts, at the time the related income is earned.
Dividends and Distributions:The Fund expects to pay dividends from net investment income and distributions from net realized capital gains, if any, annually. Dividends and distributions to shareholders, which are determined in accordance with federal income tax regulations and which may differ from generally accepted accounting principles, are recorded on theex-date. Permanent book/tax differences relating to income and gain (loss) are reclassified between total distributable earnings (loss) andpaid-in capital in excess of par, as appropriate.
Estimates:The preparation of financial statements requires management to make estimates and assumptions that affect the reported amounts and disclosures in the financial statements. Actual results could differ from those estimates.
2. Agreements
The Fund has a management agreement with the Manager. Pursuant to this agreement, the Manager has responsibility for all investment advisory services and supervises the subadviser’s performance of such services. In addition, under the management agreement, the Manager provides all of the administrative functions necessary for the organization, operation and management of the Fund. The Manager administers the corporate affairs of the Fund and, in connection therewith, furnishes the Fund with office facilities, together with those ordinary clerical and bookkeeping services which are not being furnished by the Fund’s custodian and the Fund’s transfer agent. The Manager is also responsible for the staffing and management of dedicated groups of legal, marketing, compliance and related personnel necessary for the operation of the Fund. The legal, marketing, compliance and related personnel are also responsible for the management and oversight of the various service providers to the Fund, including, but not limited to, the custodian, transfer agent, and accounting agent.
The Manager has entered into a subadvisory agreement with QMA LLC (“QMA”) (formerly known as Quantitative Management Associates LLC). The subadvisory agreement provides that QMA will furnish investment advisory services in connection with the management of the Fund. In connection therewith, QMA is obligated to keep certain books and records of the Fund. The Manager pays for the services of QMA, the cost of compensation of officers of
the Fund, occupancy and certain clerical and bookkeeping costs of the Fund. The Fund bears all other costs and expenses.
The management fee paid to the Manager is accrued daily and payable monthly at an annual rate of 0.75% of the Fund’s average daily net assets.
The Manager has contractually agreed, through February 28, 2021, to limit total annual operating expenses after fee waivers and/or expense reimbursements to 1.20% of average daily net assets for Class R6 shares. This contractual waiver excludes interest, brokerage, taxes (such as income and foreign withholding taxes, stamp duty and deferred tax expenses), acquired fund fees and expenses, extraordinary expenses, and certain other Fund expenses such as dividend and interest expense and broker charges on short sales. Fees and/or expenses waived and/or reimbursed by the Manager may be recouped by the Manager within the same fiscal year during which such waiver/reimbursement is made if such recoupment can be realized without exceeding the expense limit in effect at the time of the recoupment for that fiscal year.
PIP2, on behalf of the Fund, has a distribution agreement with Prudential Investment Management Services LLC (“PIMS”), which acts as the distributor of the Class R6 shares of the Fund. No distribution or service fees are paid to PIMS as distributor for Class R6 shares of the Fund.
PGIM Investments, PIMS and QMA are indirect, wholly-owned subsidiaries of Prudential Financial, Inc. (“Prudential”).
3. Other Transactions with Affiliates
Prudential Mutual Fund Services LLC (“PMFS”), an affiliate of PGIM Investments and an indirect, wholly-owned subsidiary of Prudential, serves as the Trust’s transfer agent. Transfer agent’s fees and expenses in the Statement of Operations include certainout-of-pocket expenses paid tonon-affiliates, where applicable.
The Fund may invest its overnight sweep cash in the PGIM Core Ultra Short Bond Fund (the “Core Fund”), and its securities lending cash collateral in the PGIM Institutional Money Market Fund (the “Money Market Fund”), each a series of Prudential Investment Portfolios 2, registered under the 1940 Act and managed by PGIM Investments. Through the Fund’s investments in the mentioned underlying funds, PGIM Investments and/or its affiliates are paid fees or reimbursed for providing their services. In addition to the realized and unrealized gains on investments in the Core Fund and Money Market Fund, earnings from such investments are disclosed on the Statement of Operations as “Affiliated dividend income” and “Income from securities lending, net”, respectively.
The Fund may enter into certain securities purchase or sale transactions under Board approved Rule17a-7 procedures. Rule17a-7 is an exemptive rule under the 1940 Act, that subject to certain conditions, permits purchase and sale transactions among affiliated
| | | | |
| PGIM QMA Emerging Markets Equity Fund | | | 29 | |
Notes to Financial Statements(continued)
investment companies, or between an investment company and a person that is affiliated solely by reason of having a common (or affiliated) investment adviser, common directors, and/or common officers. Pursuant to the Rule17a-7 procedures and consistent with guidance issued by the SEC, the Trust’s Chief Compliance Officer (“CCO”) prepares a quarterly summary of all such transactions for submission to the Board, together with the CCO’s written representation that all such17a-7 transactions were effected in accordance with the Fund’s Rule17a-7 procedures. For the year ended October 31, 2019, no17a-7 transactions were entered into by the Fund.
4. Portfolio Securities
The aggregate cost of purchases and proceeds from sales of portfolio securities (excluding short-term investments and U.S. Government securities) for the year ended October 31, 2019, were $35,297,761 and $33,398,551, respectively.
A summary of the cost of purchases and proceeds from sales of shares of affiliated investments for the year ended October 31, 2019, is presented as follows:
| | | | | | | | | | | | | | | | | | | | | | | | | | | | | | |
Value,
Beginning
of Year | | | Cost of
Purchases | | | Proceeds
from Sales | | | Change in
Unrealized
Gain
(Loss) | | | Realized
Gain
(Loss) | | | Value,
End of Year | | | Shares,
End
of Year | | | Income | |
| | PGIM Core Ultra Short Bond Fund* | |
| $ | 69,757 | | | $ | 8,796,467 | | | $ | 8,866,224 | | | $ | — | | | $ | — | | | $ | — | | | | — | | | $ | 1,360 | |
| | PGIM Institutional Money Market Fund* | |
| | 69,541 | | | | 9,432,015 | | | | 8,861,063 | | | | 103 | | | | 360 | | | | 640,956 | | | | 640,828 | | | | 1,786 | ** |
| | | | | | | | | | | | | | | | | | | | | | | | | | | | | | |
| $ | 139,298 | | | $ | 18,228,482 | | | $ | 17,727,287 | | | $ | 103 | | | $ | 360 | | | $ | 640,956 | | | | | | | $ | 3,146 | |
| | | | | | | | | | | | | | | | | | | | | | | | | | | | | | |
| * | The Fund did not have any capital gain distributions during the reporting period. |
| ** | This amount is included in “Income from securities lending, net” on the Statement of Operations. |
5. Distributions and Tax Information
Distributions to shareholders, which are determined in accordance with federal income tax regulations and which may differ from generally accepted accounting principles, are recorded on theex-date.
For the year ended October 31, 2019, the tax character of dividends paid by the Fund were $527,776 of ordinary income and $259,565 of long-term capital gains. For the year ended October 31, 2018, the tax character of dividends paid by the Fund was $1,869,012 of ordinary income.
As of October 31, 2019, the accumulated undistributed earnings on a tax basis was $557,578 of ordinary income.
The United States federal income tax basis of the Fund’s investments and the net unrealized appreciation as of October 31, 2019 were as follows:
| | | | | | |
Tax Basis | | Gross Unrealized Appreciation | | Gross Unrealized Depreciation | | Net Unrealized Appreciation |
| $27,820,989 | | $4,130,794 | | $(1,396,784) | | $2,734,010 |
The differences between book basis and tax basis were primarily attributable to deferred losses on wash sales, corporatespin-off adjustment and other cost basis differences between financial and tax accounting.
For federal income tax purposes, the Fund had a capital loss carryforward as of October 31, 2019 of approximately $1,546,000 which can be carried forward for an unlimited period. No capital gains distributions are expected to be paid to shareholders until net gains have been realized in excess of such losses.
The Manager has analyzed the Fund’s tax positions taken on federal, state and local income tax returns for all open tax years and has concluded that no provision for income tax is required in the Fund’s financial statements for the current reporting period. Since tax authorities can examine previously filed tax returns, the Fund’s U.S. federal and state tax returns for each of the four fiscal years up to the most recent fiscal year ended October 31, 2019 are subject to such review.
6. Capital and Ownership
The Fund offers Class R6 shares. Class R6 shares are not subject to any sales or redemption charge and are available exclusively for sale to a limited group of investors.
PIP2 has authorized the Fund to issue an unlimited number of shares of beneficial interest of the Fund at $0.001 par value per share.
As of October 31, 2019, Prudential, through its affiliated entities, including affiliated funds (if applicable), owned 2,676,357 Class R6 shares of the Fund. At reporting period end, one shareholder of record Fund, held 83% of the Fund’s outstanding shares, of which all were held by an affiliate of Prudential.
| | | | |
| PGIM QMA Emerging Markets Equity Fund | | | 31 | |
Notes to Financial Statements(continued)
Transactions in shares of beneficial interest were as follows:
| | | | | | | | |
Class R6 | | Shares | | | Amount | |
Year ended October 31, 2019: | | | | | | | | |
Shares sold | | | 237,477 | | | $ | 2,606,831 | |
Shares issued in reinvestment of dividends and distributions | | | 74,138 | | | | 787,341 | |
Shares reacquired | | | (139,441 | ) | | | (1,525,185 | ) |
| | | | | | | | |
Net increase (decrease) in shares outstanding | | | 172,174 | | | $ | 1,868,987 | |
| | | | | | | | |
Year ended October 31, 2018: | | | | | | | | |
Shares sold | | | 260,427 | | | $ | 3,217,983 | |
Shares issued in reinvestment of dividends and distributions | | | 149,044 | | | | 1,869,012 | |
Shares reacquired | | | (61,115 | ) | | | (775,578 | ) |
| | | | | | | | |
Net increase (decrease) in shares outstanding | | | 348,356 | | | $ | 4,311,417 | |
| | | | | | | | |
7. Borrowings
PIP2, on behalf of the Fund, along with other affiliated registered investment companies (the “Funds”), is a party to a Syndicated Credit Agreement (“SCA”) with a group of banks. The purpose of the SCA is to provide an alternative source of temporary funding for capital share redemptions. The table below provides details of the current SCA in effect at the reportingperiod-end as well as the prior SCA.
| | | | |
| | | Current SCA | | Prior SCA |
| Term of Commitment | | 10/3/2019 – 10/1/2020 | | 10/4/2018 – 10/2/2019 |
| Total Commitment | | $ 900 million | | $ 900 million |
| Annualized Commitment Fee on the Unused Portion of the SCA | | 0.15% | | 0.15% |
| Annualized Interest Rate on Borrowings | | 1.20% plus the higher of (1) the effective federal funds rate, (2) theone-month LIBOR rate or (3) zero percent | | 1.25% plus the higher of (1) the effective federal funds rate, (2) theone-month LIBOR rate or (3) zero percent |
Certain affiliated registered investment companies that are parties to the SCA include portfolios that are subject to a predetermined mathematical formula used to manage certain benefit guarantees offered under variable annuity contracts. The formula may result in large scale asset flows into and out of these portfolios. Consequently, these portfolios may be more likely to utilize the SCA for purposes of funding redemptions. It may be possible for those portfolios to fully exhaust the committed amount of the SCA, thereby requiring the Manager to allocate available funding per a Board-approved methodology designed to treat the Funds in the SCA equitably.
The Fund utilized the SCA during the year ended October 31, 2019. The average daily balance for the 15 days that the Fund had loans outstanding during the period was approximately $111,467, borrowed at a weighted average interest rate of 3.65%. The maximum loan outstanding amount during the period was $112,000. At October 31, 2019,
the Fund did not have an outstanding loan amount.
8. Risks of Investing in the Fund
The Fund’s risks include, but are not limited to, some or all of the risks discussed below:
Emerging Markets Risk:The risks of foreign investments are greater for investments in or exposed to emerging markets. Emerging market countries typically have economic and political systems that are less fully developed, and can be expected to be less stable, than those of more developed countries. For example, the economies of such countries can be subject to rapid and unpredictable rates of inflation or deflation. Low trading volumes may result in a lack of liquidity and price volatility.
Equity and Equity-Related Securities Risks:The value of a particular security could go down and you could lose money. In addition to an individual security losing value, the value of the equity markets or a sector in which the Fund invests could go down. The Fund’s holdings can vary significantly from broad market indexes and the performance of the Fund can deviate from the performance of these indexes. Different parts of a market can react differently to adverse issuer, market, regulatory, political and economic developments.
Geographic Concentration Risk:The Fund’s performance may be closely tied to the market, economic, political, regulatory or other conditions in the countries or regions in which the Fund invests. This can result in more pronounced risks based upon conditions that impact one or more countries or regions more or less than other countries or regions.
Market and Credit Risk:Securities markets may be volatile and the market prices of the Fund’s securities may decline. Securities fluctuate in price based on changes in an issuer’s financial condition and overall market and economic conditions. If the market prices of the securities owned by the Fund fall, the value of an investment in the Fund will decline. Additionally, the Fund may also be exposed to credit risk in the event that an issuer or guarantor fails to perform or that an institution or entity with which the Fund has unsettled or open transactions defaults.
9. Recent Accounting Pronouncements and Reporting Updates
In August 2018, the FASB issued Accounting Standards Update (“ASU”)No. 2018-13, which changes certain fair value measurement disclosure requirements. The new ASU, in addition to other modifications and additions, removes the requirement to disclose the amount and reasons for transfers between Level 1 and Level 2 of the fair value hierarchy, and the Fund’s policy for the timing of transfers between levels. The amendments are effective for financial statements issued for fiscal years beginning after December 15, 2019, and interim periods within those fiscal years. The Manager has evaluated the implications of certain provisions of the ASU and has determined to early adopt aspects related to the removal and modification of certain fair value measurement disclosures under the ASU
| | | | |
| PGIM QMA Emerging Markets Equity Fund | | | 33 | |
Notes to Financial Statements(continued)
effective immediately. The Manager continues to evaluate certain other provisions of the ASU and does not expect a material impact to financial statement disclosures.
Financial Highlights
| | | | | | | | | | | | |
| Class R6 Shares | | | | | | | | | |
| | | Year Ended October 31, | | | November 29, 2016(a) through October 31, 2017 | |
| | | 2019 | | | 2018 | |
| Per Share Operating Performance(b): | | | | | | | | | | | | |
| Net Asset Value, Beginning of Period | | | $10.84 | | | | $13.21 | | | | $10.00 | |
| Income (loss) from investment operations: | | | | | | | | | | | | |
| Net investment income (loss) | | | 0.19 | | | | 0.20 | | | | 0.16 | |
| Net realized and unrealized gain (loss) on investment and foreign currency transactions | | | 0.43 | | | | (1.71 | ) | | | 3.09 | |
| Total from investment operations | | | 0.62 | | | | (1.51 | ) | | | 3.25 | |
| Less Dividends and Distributions: | | | | | | | | | | | | |
| Dividends from net investment income | | | (0.21 | ) | | | (0.17 | ) | | | (0.04 | ) |
| Distributions from net realized gains | | | (0.11 | ) | | | (0.69 | ) | | | - | |
| Total dividends and distributions | | | (0.32 | ) | | | (0.86 | ) | | | (0.04 | ) |
| Net asset value, end of period | | | $11.14 | | | | $10.84 | | | | $13.21 | |
| Total Return(c): | | | 5.82% | | | | (12.31)% | | | | 32.58% | |
| |
| Ratios/Supplemental Data: | |
| Net assets, end of period (000) | | | $29,804 | | | | $27,145 | | | | $28,470 | |
| Average net assets (000) | | | $28,694 | | | | $29,759 | | | | $24,017 | |
| Ratios to average net assets(d): | | | | | | | | | | | | |
| Expenses after waivers and/or expense reimbursement | | | 1.20% | | | | 1.20% | | | | 1.20% | (e) |
| Expenses before waivers and/or expense reimbursement | | | 1.70% | | | | 1.54% | | | | 1.74% | (e) |
| Net investment income (loss) | | | 1.71% | | | | 1.56% | | | | 1.49% | (e) |
| Portfolio turnover rate(f) | | | 117% | | | | 118% | | | | 102% | |
| (a) | Commencement of operations. |
| (b) | Calculated based on average shares outstanding during the period. |
| (c) | Total return is calculated assuming a purchase of a share on the first day and a sale on the last day of each period reported and includes reinvestment of dividends and distributions, if any. Total returns may reflect adjustments to conform to generally accepted accounting principles. Total returns for periods less than one full year are not annualized. |
| (d) | Does not include expenses of the underlying funds in which the Fund invests. |
| (f) | The Fund’s portfolio turnover rate is calculated in accordance with regulatory requirements, without regard to transactions involving short-term investments and certain derivatives. If such transactions were included, the Fund’s portfolio turnover rate may be higher. |
See Notes to Financial Statements.
| | | | |
| PGIM QMA Emerging Markets Equity Fund | | | 35 | |
Report of Independent Registered Public Accounting Firm
To the Shareholders of PGIM QMA Emerging Markets Equity Fund and Board of Trustees
Prudential Investment Portfolios 2:
Opinion on the Financial Statements
We have audited the accompanying statement of assets and liabilities of PGIM QMA Emerging Markets Equity Fund, a series of Prudential Investment Portfolios 2, (the Fund), including the schedule of investments, as of October 31, 2019, the related statement of operations for the year then ended, the statements of changes in net assets for each of the years in the two-year period ended October 31, 2019, and the related notes (collectively, the financial statements) and the financial highlights for the years or period indicated therein. In our opinion, the financial statements and financial highlights present fairly, in all material respects, the financial position of the Fund as of October 31, 2019, the results of its operations for the year then ended, the changes in its net assets for each of the years in the two-year period ended October 31, 2019, and the financial highlights for the years or period indicated therein, in conformity with U.S. generally accepted accounting principles.
Basis for Opinion
These financial statements and financial highlights are the responsibility of the Fund’s management. Our responsibility is to express an opinion on these financial statements and financial highlights based on our audits. We are a public accounting firm registered with the Public Company Accounting Oversight Board (United States) (PCAOB) and are required to be independent with respect to the Fund in accordance with the U.S. federal securities laws and the applicable rules and regulations of the Securities and Exchange Commission and the PCAOB.
We conducted our audits in accordance with the standards of the PCAOB. Those standards require that we plan and perform the audit to obtain reasonable assurance about whether the financial statements and financial highlights are free of material misstatement, whether due to error or fraud. Our audits included performing procedures to assess the risks of material misstatement of the financial statements and financial highlights, whether due to error or fraud, and performing procedures that respond to those risks. Such procedures included examining, on a test basis, evidence regarding the amounts and disclosures in the financial statements and financial highlights. Such procedures also included confirmation of securities owned as of October 31, 2019, by correspondence with the custodian, transfer agent, and brokers, or by other appropriate auditing procedures when replies were not received. Our audits also included evaluating the accounting principles used and significant estimates made by management, as well as evaluating the overall presentation of the financial statements and financial highlights. We believe that our audits provide a reasonable basis for our opinion.

We have served as the auditor of one or more PGIM and/or Prudential Retail investment companies since 2003.
New York, New York
December 19, 2019
Federal Income Tax Information(unaudited)
For the year ended October 31, 2019, the Fund reports the maximum amount allowable, but not less than 85.64% of the ordinary income dividends paid during the period as qualified dividend income in accordance with Section 854 of the Internal Revenue Code.
For the year ended October 31, 2019, the Fund made an election to pass through the maximum amount of the portion of the ordinary income dividends paid derived from foreign source income as well as any foreign taxes paid by the Fund in accordance with Section 853 of the Internal Revenue Code of the following amounts: $149,696 foreign tax credit from recognized foreign source income of $979,456.
In January 2020, you will be advised on IRS Form 1099-DIV or substitute 1099-DIV as to the federal tax status of the dividends received by you in calendar year 2019.
| | | | |
| PGIM QMA Emerging Markets Equity Fund | | | 37 | |
INFORMATION ABOUT BOARD MEMBERS AND OFFICERS(unaudited)
Information about Board Members and Officers of the Fund is set forth below. Board Members who are not deemed to be “interested persons” of the Fund, as defined in the 1940 Act, are referred to as “Independent Board Members.” Board Members who are deemed to be “interested persons” of the Fund are referred to as “Interested Board Members.” The Board Members are responsible for the overall supervision of the operations of the Fund and perform the various duties imposed on the directors of investment companies by the 1940 Act. The Board in turn elects the Officers, who are responsible for administering theday-to-day operations of the Fund.
| | | | | | |
| Independent Board Members | | | | |
| | | | |
Name Date of Birth Position(s) Portfolios Overseen | | Principal Occupation(s) During Past Five Years | | Other Directorships
Held During
Past Five Years | | Length of
Board Service |
| | | | |
Ellen S. Alberding 3/11/58 Board Member Portfolios Overseen: 96 | | President and Board Member, The Joyce Foundation (charitable foundation) (since 2002); Vice Chair, City Colleges of Chicago (community college system) (2011-2015); Trustee, National Park Foundation (charitable foundation for national park system) (2009-2018); Trustee, Economic Club of Chicago (since 2009); Trustee, Loyola University (since 2018). | | None. | | Since September 2013 |
| | | | |
Kevin J. Bannon 7/13/52 Board Member Portfolios Overseen: 96 | | Retired; Managing Director (April2008-May 2015) and Chief Investment Officer (October 2008-November 2013) of Highmount Capital LLC (registered investment adviser); formerly Executive Vice President and Chief Investment Officer (April 1993-August 2007) of Bank of New York Company; President (May2003-May 2007) of BNY Hamilton Family of Mutual Funds. | | Director of Urstadt Biddle Properties (equity real estate investment trust) (since September 2008). | | Since July 2008 |
PGIM QMA Emerging Markets Equity Fund
| | | | | | |
| Independent Board Members | | | | |
| | | | |
Name Date of Birth Position(s) Portfolios Overseen | | Principal Occupation(s) During Past Five Years | | Other Directorships
Held During Past Five Years | | Length of Board Service |
| | | | |
Linda W. Bynoe 7/9/52 Board Member Portfolios Overseen: 96 | | President and Chief Executive Officer (since March 1995) and formerly Chief Operating Officer (December 1989-February 1995) of Telemat Ltd. (management consulting); formerly Vice President (January 1985-June 1989) at Morgan Stanley & Co. (broker-dealer). | | Director of Anixter International, Inc. (communication products distributor) (since January 2006); Director of Northern Trust Corporation (financial services) (since April 2006); Trustee of Equity Residential (residential real estate) (since December 2009). | | Since March 2005 |
| | | | |
Barry H. Evans 11/2/60 Board Member Portfolios Overseen: 95 | | Retired; formerly President (2005 – 2016), Global Chief Operating Officer (2014–2016), Chief Investment Officer – Global Head of Fixed Income (1998-2014), and various portfolio manager roles (1986-2006), Manulife Asset Management U.S. | | Formerly Director, Manulife Trust Company (2011-2018); formerly Director, Manulife Asset Management Limited (2015-2017); formerly Chairman of the Board of Directors of Manulife Asset Management U.S. (2005-2016); formerly Chairman of the Board, Declaration Investment Management and Research (2008-2016). | | Since September 2017 |
| | | | |
Keith F. Hartstein 10/13/56 Board Member & Independent Chair Portfolios Overseen: 96 | | Retired; Member (since November 2014) of the Governing Council of the Independent Directors Council (organization of independent mutual fund directors); formerly President and Chief Executive Officer (2005-2012), Senior Vice President (2004-2005), Senior Vice President of Sales and Marketing (1997-2004), and various executive management positions (1990-1997), John Hancock Funds, LLC (asset management); Chairman, Investment Company Institute’s Sales Force Marketing Committee (2003-2008). | | None. | | Since September 2013 |
Visit our website at pgiminvestments.com
| | | | | | |
| Independent Board Members | | | | |
| | | | |
Name Date of Birth Position(s) Portfolios Overseen | | Principal Occupation(s) During Past Five Years | | Other Directorships
Held During Past Five Years | | Length of Board Service |
| | | | |
Laurie Simon Hodrick 9/29/62 Board Member Portfolios Overseen: 95 | | A. Barton Hepburn Professor Emerita of Economics in the Faculty of Business, Columbia Business School (since 2018); Visiting Professor of Law, Stanford Law School (since 2015); Visiting Fellow at the Hoover Institution, Stanford University (since 2015); Sole Member, ReidCourt LLC (since 2008) (a consulting firm); formerly A. Barton Hepburn Professor of Economics in the Faculty of Business, Columbia Business School (1996-2017); formerly Managing Director, Global Head of Alternative Investment Strategies, Deutsche Bank (2006-2008). | | Independent Director, Synnex Corporation (since April 2019) (information technology); Independent Director, Kabbage, Inc. (since July 2018) (financial services); Independent Director, Corporate Capital Trust (2017-2018) (a business development company). | | Since September 2017 |
| | | | |
Michael S. Hyland, CFA 10/4/45 Board Member Portfolios Overseen: 96 | | Retired (since February 2005); formerly Senior Managing Director (July 2001-February 2005) of Bear Stearns & Co, Inc.; Global Partner, INVESCO (1999-2001); Managing Director and President of Salomon Brothers Asset Management (1989-1999). | | None. | | Since July 2008 |
| | | | |
Brian K. Reid 9/22/61 Board Member Portfolios Overseen: 95 | | Retired; formerly Chief Economist for the Investment Company Institute (ICI) (2005-2017); formerly Senior Economist and Director of Industry and Financial Analysis at the ICI (1998-2004); formerly Senior Economist, Industry and Financial Analysis at the ICI (1996-1998); formerly Staff Economist at the Federal Reserve Board (1989-1996); Director, ICI Mutual Insurance Company (2012-2017). | | None. | | Since March 2018 |
PGIM QMA Emerging Markets Equity Fund
| | | | | | |
Independent Board Members | | | | |
| | | | |
Name Date of Birth Position(s) Portfolios Overseen | | Principal Occupation(s) During Past Five Years | | Other Directorships
Held During Past Five Years | | Length of
Board Service |
| | | | |
Grace C. Torres 6/28/59 Board Member Portfolios Overseen: 95 | | Retired; formerly Treasurer and Principal Financial and Accounting Officer of the PGIM Funds, Target Funds, Advanced Series Trust, Prudential Variable Contract Accounts and The Prudential Series Fund (1998-June 2014); Assistant Treasurer (March 1999-June 2014) and Senior Vice President (September 1999-June 2014) of PGIM Investments LLC; Assistant Treasurer (May 2003-June 2014) and Vice President (June 2005-June 2014) of AST Investment Services, Inc.; Senior Vice President and Assistant Treasurer (May 2003-June 2014) of Prudential Annuities Advisory Services, Inc. | | Formerly Director (July 2015-January 2018) of Sun Bancorp, Inc. N.A. and Sun National Bank; Director (since January 2018) of OceanFirst Financial Corp. and OceanFirst Bank. | | Since November 2014 |
| | | | | | |
Interested Board Members | | | | |
| | | | |
Name Date of Birth Position(s) Portfolios Overseen | | Principal Occupation(s) During Past Five Years | | Other Directorships
Held During
Past Five Years | | Length of
Board Service |
| | | | |
Stuart S. Parker 10/5/62 Board Member & President Portfolios Overseen: 96 | | President of PGIM Investments LLC (formerly known as Prudential Investments LLC) (since January 2012); Executive Vice President of Prudential Investment Management Services LLC (since December 2012); formerly Executive Vice President of Jennison Associates LLC and Head of Retail Distribution of PGIM Investments LLC (June 2005-December 2011). | | None. | | Since January 2012 |
Visit our website at pgiminvestments.com
| | | | | | |
Interested Board Members | | | | |
| | | | |
Name Date of Birth Position(s) Portfolios Overseen | | Principal Occupation(s) During Past Five Years | | Other Directorships
Held During Past Five Years | | Length of
Board Service |
| | | | |
Scott E. Benjamin 5/21/73 Board Member & Vice President Portfolios Overseen:96 | | Executive Vice President (since June 2009) of PGIM Investments LLC; Executive Vice President (June 2009-June 2012) and Vice President (since June 2012) of Prudential Investment Management Services LLC; Executive Vice President (since September 2009) of AST Investment Services, Inc.; Senior Vice President of Product Development and Marketing, PGIM Investments (since February 2006); formerly Vice President of Product Development and Product Management, PGIM Investments LLC (2003-2006). | | None. | | Since March 2010 |
| | | | |
| Fund Officers(a) | | | | |
| | | |
Name Date of Birth Fund Position | | Principal Occupation(s) During Past Five Years | | Length of
Service as Fund Officer |
| | | |
Raymond A. O’Hara 9/11/55 Chief Legal Officer | | Vice President and Corporate Counsel (since July 2010) of Prudential Insurance Company of America (Prudential); Vice President (March 2011-Present) of Pruco Life Insurance Company and Pruco Life Insurance Company of New Jersey; Vice President and Corporate Counsel (March 2011-Present) of Prudential Annuities Life Assurance Corporation; Chief Legal Officer of PGIM Investments LLC (since June 2012); Chief Legal Officer of Prudential Mutual Fund Services LLC (since June 2012) and Corporate Counsel of AST Investment Services, Inc. (since June 2012); formerly Assistant Vice President and Corporate Counsel (September 2008-July 2010) of The Hartford Financial Services Group, Inc.; formerly Associate (September 1980-December 1987) and Partner (January 1988–August 2008) of Blazzard & Hasenauer, P.C. (formerly, Blazzard, Grodd & Hasenauer, P.C.). | | Since June 2012 |
PGIM QMA Emerging Markets Equity Fund
| | | | |
| Fund Officers(a) | | | | |
| | | |
Name Date of Birth Fund Position | | Principal Occupation(s) During Past Five Years | | Length of Service as Fund Officer |
| | | |
Dino Capasso 8/19/74 Chief Compliance Officer | | Chief Compliance Officer (July 2019-Present) of PGIM Investments LLC; Chief Compliance Officer (July 2019-Present) of the PGIM Funds, Target Funds, Advanced Series Trust, The Prudential Series Fund, Prudential’s Gibraltar Fund, Inc., PGIM Global High Yield Fund, Inc., and PGIM High Yield Bond Fund, Inc.; Vice President and Deputy Chief Compliance Officer (June 2017-2019) of PGIM Investments LLC; formerly, Senior Vice President and Senior Counsel (January 2016-June 2017), and Vice President and Counsel (February 2012-December 2015) of Pacific Investment Management Company LLC. | | Since March 2018 |
| | | |
Andrew R. French 12/22/62 Secretary | | Vice President of PGIM Investments LLC (December 2018-Present); formerly Vice President and Corporate Counsel (February 2010-December 2018) of Prudential; formerly Director and Corporate Counsel (2006-2010) of Prudential; Vice President and Assistant Secretary (since January 2007) of PGIM Investments LLC; Vice President and Assistant Secretary (since January 2007) of Prudential Mutual Fund Services LLC. | | Since October 2006 |
| | | |
Jonathan D. Shain 8/9/58 Assistant Secretary | | Vice President and Corporate Counsel (since August 1998) of Prudential; Vice President and Assistant Secretary (since May 2001) of PGIM Investments LLC; Vice President and Assistant Secretary (since February 2001) of Prudential Mutual Fund Services LLC; formerly Vice President and Assistant Secretary (May 2003-June 2005) of AST Investment Services, Inc. | | Since May 2005 |
| | | |
Claudia DiGiacomo 10/14/74 Assistant Secretary | | Vice President and Corporate Counsel (since January 2005) of Prudential; Vice President and Assistant Secretary of PGIM Investments LLC (since December 2005); formerly Associate at Sidley Austin Brown & Wood LLP (1999-2004). | | Since December 2005 |
| | | |
Diana N. Huffman 4/14/82 Assistant Secretary | | Vice President and Corporate Counsel (since September 2015) of Prudential; formerly Associate at Willkie Farr & Gallagher LLP (2009-2015). | | Since March 2019 |
| | | |
Kelly A. Coyne 8/8/68 Assistant Secretary | | Director, Investment Operations of Prudential Mutual Fund Services LLC (since 2010). | | Since March 2015 |
| | | |
Christian J. Kelly 5/5/75 Treasurer and Principal Financial and Accounting Officer | | Vice President, Head of Fund Administration of PGIM Investments LLC (since November 2018); formerly, Director of Fund Administration of Lord Abbett & Co. LLC (2009-2018), Treasurer and Principal Accounting Officer of the Lord Abbett Family of Funds (2017-2018); Director of Accounting, Avenue Capital Group (2008-2009); Senior Manager, Investment Management Practice of Deloitte & Touche LLP (1998-2007). | | Since January 2019 |
Visit our website at pgiminvestments.com
| | | | |
| Fund Officers(a) | | | | |
| | | |
Name Date of Birth Fund Position | | Principal Occupation(s) During Past Five Years | | Length of Service as Fund Officer |
| | | |
Lana Lomuti 6/7/67 Assistant Treasurer | | Vice President (since 2007) and Director (2005-2007), within PGIM Investments Fund Administration; formerly Assistant Treasurer (December 2007-February 2014) of The Greater China Fund, Inc. | | Since April 2014 |
| | | |
Russ Shupak 10/08/73 Assistant Treasurer | | Vice President (since 2017) and Director (2013-2017), within PGIM Investments Fund Administration. | | Since October 2019 |
| | | |
Deborah Conway 3/26/69 Assistant Treasurer | | Vice President (since 2017) and Director (2007-2017), within PGIM Investments Fund Administration. | | Since October 2019 |
| | | |
Elyse M. McLaughlin 1/20/74 Assistant Treasurer | | Vice President (since 2017) and Director (2011-2017), within PGIM Investments Fund Administration. | | Since October 2019 |
| | | |
Charles H. Smith 1/11/73 Anti-Money Laundering Compliance Officer | | Vice President, Corporate Compliance, Anti-Money Laundering Unit (since January 2015) of Prudential; committee member of the American Council of Life Insurers Anti-Money Laundering and Critical Infrastructure Committee (since January 2016); formerly Global Head of Economic Sanctions Compliance at AIG Property Casualty (February 2007-December 2014); Assistant Attorney General at the New York State Attorney General’s Office, Division of Public Advocacy. (August 1998-January 2007). | | Since January 2017 |
(a) Excludes Mr. Parker and Mr. Benjamin, interested Board Members who also serve as President and Vice President, respectively.
Explanatory Notes to Tables:
| ∎ | | Board Members are deemed to be “Interested,” as defined in the 1940 Act, by reason of their affiliation with PGIM Investments LLC and/or an affiliate of PGIM Investments LLC. |
| ∎ | | Unless otherwise noted, the address of all Board Members and Officers is c/o PGIM Investments LLC, 655 Broad Street, Newark, New Jersey 07102-4410. |
| ∎ | | There is no set term of office for Board Members or Officers. The Board Members have adopted a retirement policy, which calls for the retirement of Board Members on December 31 of the year in which they reach the age of 75. |
| ∎ | | “Other Directorships Held” includes only directorships of companies required to register or file reports with the SEC under the 1934 Act (that is, “public companies”) or other investment companies registered under the 1940 Act. |
| ∎ | | “Portfolios Overseen” includes all investment companies managed by PGIM Investments LLC. The investment companies for which PGIM Investments LLC serves as manager include the PGIM Funds, The Prudential Variable Contract Accounts, PGIM ETF Trust, PGIM High Yield Bond Fund, Inc., PGIM Global High Yield Fund, Inc., The Prudential Series Fund, Prudential’s Gibraltar Fund, Inc. and the Advanced Series Trust. |
PGIM QMA Emerging Markets Equity Fund
Approval of Advisory Agreements(unaudited)
The Funds’ Boards of Trustees
The Boards of Trustees (the “Board”) of the PGIM Day One Underlying Funds (each, a “Fund, and collectively, the “Funds”)1 consists of eleven individuals, eight of whom are not “interested persons” of the Funds, as defined in the Investment Company Act of 1940, as amended (the “1940 Act”) (the “Independent Trustees”). The Board is responsible for the oversight of each Fund and its operations, and performs the various duties imposed on the directors of investment companies by the 1940 Act. The Independent Trustees have retained independent legal counsel to assist them in connection with their duties. The Chair of the Board is an Independent Trustee. The Board has established four standing committees: the Audit Committee, the Nominating and Governance Committee, and two Investment Committees. Each committee is chaired by, and composed of, Independent Trustees.
Annual Approval of the Funds’ Advisory Agreements
As required under the 1940 Act, the Board determines annually whether to renew each Fund’s management agreement with PGIM Investments LLC (“PGIM Investments”) and each Fund’s subadvisory agreement with QMA LLC (“QMA”). In considering the renewal of the agreements, the Board, including all of the Independent Trustees, met on May 30, 2019 and on June11-13, 2019 and approved the renewal of the agreements through July 31, 2019, after concluding that the renewal of the agreements was in the best interests of each Fund and its shareholders.
In advance of the meetings, the Board requested and received materials relating to the agreements, and had the opportunity to ask questions and request further information in connection with its consideration. Among other things, the Board considered comparative fee information from PGIM Investments and QMA. Also, the Board considered comparisons with other mutual funds in relevant Peer Universes and Peer Groups, as is further discussed below.
In approving the agreements, the Board, including the Independent Trustees advised by independent legal counsel, considered the factors it deemed relevant, including the nature, quality and extent of services provided, the performance of each Fund, the profitability of PGIM Investments and its affiliates, expenses and fees, and the potential for economies of scale that may be shared with each Fund and its shareholders as each Fund’s assets grow. In their deliberations, the Trustees did not identify any single factor which alone was responsible for the Board’s decision to approve the agreements with respect to each Fund.
| 1 | Each of the PGIM Day One Underlying Funds is a series of Prudential Investment Portfolios 2. The PGIM Day One Underlying Funds discussed herein are: PGIM QMA International Developed Markets Index Fund and PGIM QMA Emerging Markets Equity Fund. |
| | |
| PGIM QMA Emerging Markets Equity Fund |
Approval of Advisory Agreements(continued)
In connection with its deliberations, the Board considered information provided by PGIM Investments throughout the year at regular Board meetings, presentations from portfolio managers and other information, as well as information furnished at or in advance of the meetings on May 30, 2019 and on June11-13, 2019.
The Trustees determined that the overall arrangements between each Fund and PGIM Investments, which serves as each Fund’s investment manager pursuant to a management agreement, and between PGIM Investments and QMA, which serves as each Fund’s subadviser pursuant to the terms of subadvisory agreements with PGIM Investments, are in the best interests of each Fund and its shareholders in light of the services performed, fees charged and such other matters as the Trustees considered relevant in the exercise of their business judgment.
The material factors and conclusions that formed the basis for the Trustees’ reaching their determinations to approve the continuance of the agreements are separately discussed below.
Nature, Quality and Extent of Services
The Board received and considered information regarding the nature, quality and extent of services provided to each Fund by PGIM Investments and QMA. The Board noted that QMA is affiliated with PGIM Investments. The Board considered the services provided by PGIM Investments, including but not limited to the oversight of the subadviser for each Fund, as well as the provision of fund recordkeeping, compliance and other services to each Fund, and PGIM Investments’ role as administrator for the Funds’ liquidity risk management program. With respect to PGIM Investments’ oversight of the subadviser, the Board noted that PGIM Investments’ Strategic Investment Research Group (“SIRG”), which is a business unit of PGIM Investments, is responsible for monitoring and reporting to PGIM Investments’ senior management on the performance and operations of the subadviser. The Board also considered that PGIM Investments pays the salaries of all of the officers and interested Trustees of the Funds who are part of Fund management. The Board also considered the investment subadvisory services provided by QMA, including investment research and security selection, as well as adherence to each Fund’s investment restrictions and compliance with applicable Fund policies and procedures. The Board considered PGIM Investments’ evaluation of the subadviser, as well as PGIM Investments’ recommendation, based on its review of the subadviser, to renew the subadvisory agreements.
The Board considered the qualifications, backgrounds and responsibilities of PGIM Investments’ senior management responsible for the oversight of each Fund and, QMA and also considered the qualifications, backgrounds and responsibilities of the QMA portfolio
| | |
| Visit our website at pgiminvestments.com | | |
managers who are responsible for theday-to-day management of each Fund’s portfolio. The Board was provided with information pertaining to PGIM Investments’, and QMA’s organizational structure, senior management, investment operations, and other relevant information pertaining to PGIM Investments and QMA. The Board also noted that it received favorable compliance reports from the Funds’ Chief Compliance Officer (“CCO”) as to each of PGIM Investments and QMA.
The Board concluded that it was satisfied with the nature, extent and quality of the investment management services provided by PGIM Investments and the subadvisory services provided to each Fund by QMA, and that there was a reasonable basis on which to conclude that each Fund benefits from the services provided by PGIM Investments and QMA under the management and subadvisory agreements.
Costs of Services and Profits Realized by PGIM Investments
The Board was provided with information on the profitability of PGIM Investments and its affiliates in serving as each Fund’s investment manager. The Board discussed with PGIM Investments the methodology utilized in assembling the information regarding profitability and considered its reasonableness. The Board recognized that it is difficult to make comparisons of profitability from fund management contracts because comparative information is not generally publicly available and is affected by numerous factors, including the structure of the particular adviser, the types of funds it manages, its business mix, numerous assumptions regarding allocations and the adviser’s capital structure and cost of capital. However, the Board considered that the cost of services provided by PGIM Investments during the year ended December 31, 2018 exceeded the management fees paid by each Fund, resulting in an operating loss to PGIM Investments. Taking these factors into account, the Board concluded that the profitability of PGIM Investments and its affiliates in relation to the services rendered was not unreasonable.
Economies of Scale
The Board received and discussed information concerning economies of scale that PGIM Investments may realize as each Fund’s assets grow beyond current levels. During the course of time, the Board has considered information regarding the launch date of each Fund, the management fees of each Fund compared to those of similarly managed funds and PGIM Investments’ investment in each Fund over time. The Board noted that, while the management fee schedule for each Fund does not have breakpoints in its management fees, economies of scale can be shared with each Fund in other ways, including low management fees from inception, additional technological and personnel investments to enhance shareholder services, and maintaining existing expense structures in the face of a rising cost environment. The Board also considered PGIM Investments’ assertion that it
| | |
| PGIM QMA Emerging Markets Equity Fund |
Approval of Advisory Agreements(continued)
continually evaluates the management fee schedule of each Fund and the potential to share economies of scale through breakpoints or fee waivers as asset levels increase.
The Board recognized the inherent limitations of any analysis of economies of scale, stemming largely from the Board’s understanding that most of PGIM Investments’ costs are not specific to individual funds, but rather are incurred across a variety of products and services.
Other Benefits to PGIM Investments and QMA
The Board considered potential ancillary benefits that might be received by PGIM Investments, QMA and their affiliates as a result of their relationship with each Fund. The Board concluded that potential benefits to be derived by PGIM Investments included transfer agency fees received by each Fund’s transfer agent (which is affiliated with PGIM Investments), and benefits to its reputation as well as other intangible benefits resulting from PGIM Investments’ association with the Funds. The Board concluded that the potential benefits to be derived by QMA included its ability to use soft dollar credits, as well as the potential benefits consistent with those generally resulting from an increase in assets under management, specifically, potential access to additional research resources and benefits to its reputation. The Board concluded that the benefits derived by PGIM Investments and QMA were consistent with the types of benefits generally derived by investment managers and subadvisers to mutual funds.
Performance of the Funds / Fees and Expenses
The Board considered certain additional factors and made related conclusions relating to the historical performance of each Fund for theone-year period ended December 31, 2018. The Board considered that PGIM QMA International Developed Markets Index Fund commenced operations on November 17, 2016 and that PGIM QMA Emerging Markets Equity Fund commenced operations on November 29, 2016 and that longer-term performance was not yet available.
The Board also considered each Fund’s actual management fee, as well as each Fund’s net total expense ratio, for the fiscal year ended October 31, 2018. The Board considered the management fee for each Fund as compared to the management fee charged by PGIM Investments to other funds and the fee charged by other advisers to comparable mutual funds in a Peer Group. The actual management fee represents the fee rate actually paid by Fund shareholders and includes any fee waivers or reimbursements. The net total expense ratio for each Fund represents the actual expense ratio incurred by Fund shareholders.
| | |
| Visit our website at pgiminvestments.com | | |
The mutual funds included in the Peer Universe, which was used to consider performance, and the Peer Group, which was used to consider expenses and fees, for each Fund were objectively determined by Broadridge, an independent provider of mutual fund data. In certain circumstances, PGIM Investments also provided supplemental Peer Universe or Peer Group information, for reasons addressed with the Board. The comparisons placed each Fund in various quartiles over various periods, with the first quartile being the best 25% of the mutual funds (for performance, the best performing mutual funds and, for expenses, the lowest cost mutual funds).
The section below summarizes key factors considered by the Board and the Board’s conclusions regarding each Fund’s performance, fees and overall expenses. For each Fund, the table sets forth net performance comparisons (which reflect the impact on performance of any subsidies, expense caps or waivers that may be applicable) with the Peer Universe, actual management fees with the Peer Group (which reflect the impact of fund expenses, or any subsidies or fee waivers), and net total expenses with the Peer Group, each of which were key factors considered by the Board.
PGIM QMA International Developed Markets Index Fund
| | | | | | | | |
| Net Performance | | 1 Year | | 3 Years | | 5 Years | | 10 Years |
| | | 2nd Quartile | | N/A | | N/A | | N/A |
| Actual Management Fees:1st Quartile |
| Net Total Expenses: 1st Quartile |
| | • | | The Board noted that the Fund outperformed its benchmark index over theone-year period. |
| | • | | The Board noted that the Fund does not yet have a three-year performance record and that, therefore, the subadviser should have more time to develop that record. |
| | • | | The Board and PGIM Investments agreed to retain the existing contractual cap on Fund expenses which (exclusive of certain fees and expenses) caps total annual operating expenses at 0.30% through February 29, 2020. |
| | • | | The Board concluded that in light of the above, it would be in the best interests of the Fund and its shareholders to continue to allow the Fund to create a longer-term performance record, and to renew the agreements. |
| | • | | The Board concluded that the management fees (including subadvisory fees) and total expenses were reasonable in light of the services provided. |
| | |
| PGIM QMA Emerging Markets Equity Fund |
Approval of Advisory Agreements(continued)
PGIM QMA Emerging Markets Equity Fund
| | | | | | | | |
| Net Performance | | 1 Year | | 3 Years | | 5 Years | | 10 Years |
| | | 3rd Quartile | | N/A | | N/A | | N/A |
| Actual Management Fees:1st Quartile |
| Net Total Expenses: 3rd Quartile |
| | • | | The Board noted that the Fund underperformed its benchmark index over theone-year period. |
| | • | | The Board noted that the Fund does not yet have a three-year performance record and that, therefore, the subadviser should have more time to develop that record. |
| | • | | The Board considered information provided by PGIM Investments indicating that the Fund’s net total expense ratio was eight basis points from the median in the Peer Group. |
| | • | | The Board and PGIM Investments agreed to retain the existing contractual cap on Fund expenses which (exclusive of certain fees and expenses) caps total annual operating expenses at 1.20% through February 29, 2020. |
| | • | | The Board concluded that in light of the above, it would be in the best interests of the Fund and its shareholders to continue to allow the Fund to create a longer-term performance record, and to renew the agreements. |
| | • | | The Board concluded that the management fees (including subadvisory fees) and total expenses were reasonable in light of the services provided. |
* * *
After full consideration of these factors, the Board concluded that approval of the agreements was in the best interests of each Fund and its shareholders.
| | |
| Visit our website at pgiminvestments.com | | |
| | | | |
| | |
| ∎ MAIL | | ∎ TELEPHONE | | ∎ WEBSITE |
655 Broad Street Newark, NJ 07102 | | (800) 225-1852 | | pgiminvestments.com |
|
| PROXY VOTING |
| The Board of Trustees of the Fund has delegated to the Fund’s subadviser the responsibility for voting any proxies and maintaining proxy recordkeeping with respect to the Fund. A description of these proxy voting policies and procedures is available without charge, upon request, by calling (800) 225-1852. Information regarding how the Fund voted proxies relating to portfolio securities during the most recent 12-month period ended June 30 will be available on the Fund’s website and on the Securities and Exchange Commission’s website at the end of August. |
|
| TRUSTEES |
| Ellen S. Alberding• Kevin J. Bannon• Scott E. Benjamin• Linda W. Bynoe• Barry H. Evans• Keith F. Hartstein • Laurie Simon Hodrick• Michael S. Hyland• Stuart S. Parker• Brian K. Reid• Grace C. Torres |
|
| OFFICERS |
| Stuart S. Parker,President• Scott E. Benjamin,Vice President• Christian J. Kelly,Treasurer and Principal Financial and Accounting Officer• Raymond A. O’Hara,Chief Legal Officer• Dino Capasso,Chief Compliance Officer• Charles H. Smith,Anti-Money Laundering Compliance Officer• Andrew R. French,Secretary• Jonathan D. Shain,Assistant Secretary• Claudia DiGiacomo,Assistant Secretary• Diana N. Huffman,Assistant Secretary• Kelly A. Coyne,Assistant Secretary• Lana Lomuti,Assistant Treasurer• Russ Shupak,Assistant Treasurer• Elyse McLaughlin,Assistant Treasurer• Deborah Conway,Assistant Treasurer |
| | | | |
| MANAGER | | PGIM Investments LLC | | 655 Broad Street
Newark, NJ 07102 |
|
| SUBADVISER | | QMA LLC | | Gateway Center Two
100 Mulberry Street
Newark, NJ 07102 |
|
| DISTRIBUTOR | | Prudential Investment
Management Services LLC | | 655 Broad Street
Newark, NJ 07102 |
|
| CUSTODIAN | | The Bank of New York Mellon | | 240 Greenwich Street New York, NY 10286 |
|
| TRANSFER AGENT | | Prudential Mutual Fund
Services LLC | | PO Box 9658
Providence, RI 02940 |
|
| INDEPENDENT REGISTERED PUBLIC ACCOUNTING FIRM | | KPMG LLP | | 345 Park Avenue New York, NY 10154 |
|
| FUND COUNSEL | | Willkie Farr & Gallagher LLP | | 787 Seventh Avenue
New York, NY 10019 |
|
|
| An investor should consider the investment objectives, risks, charges, and expenses of the Fund carefully before investing. The prospectus contains this and other information about the Fund. An investor may obtain the prospectus by visiting our website atpgiminvestments.com or by calling(800) 225-1852. The prospectus should be read carefully before investing. |
|
| SHAREHOLDER COMMUNICATIONS WITH TRUSTEES |
| Shareholders can communicate directly with the Board of Trustees by writing to the Chair of the Board, PGIM QMA Emerging Markets Equity Fund, PGIM Investments, Attn: Board of Trustees, 655 Broad Street, Newark, NJ 07102. Shareholders can communicate directly with an individual Trustee by writing to the same address. Communications are not screened before being delivered to the addressee. |
|
| AVAILABILITY OF PORTFOLIO HOLDINGS |
| The Fund files its complete schedule of portfolio holdings with the Securities and Exchange Commission on Form N-PORT. The Fund’s Form N-PORT filings are available on the Commission’s website at sec.gov. Form N-PORT is filed with the Commission quarterly, and each Fund’s full portfolio holdings as of the first and third fiscal quarter-ends (as of the third month of the Fund’s fiscal quarter for reporting periods on or after September 30, 2019) will be made publicly available 60 days after the end of each quarter at sec.gov. |
|
| The Fund’s Statement of Additional Information contains additional information about the Fund’s Trustees and is available without charge, upon request, by calling (800) 225-1852. |
Mutual Funds:
| | | | |
ARE NOT INSURED BY THE FDIC OR ANY
FEDERAL GOVERNMENT AGENCY | | MAY LOSE VALUE | | ARE NOT A DEPOSIT OF OR GUARANTEED
BY ANY BANK OR ANY BANK AFFILIATE |
PGIM QMA EMERGING MARKETS EQUITY FUND
| | |
| NASDAQ | | PQEMX |
| CUSIP | | 74440E706 |

PGIM QMA INTERNATIONAL DEVELOPED MARKETS INDEX FUND
ANNUAL REPORT
OCTOBER 31, 2019
COMING SOON: PAPERLESS SHAREHOLDER REPORTS
Beginning on January 1, 2021, as permitted by regulations adopted by the Securities and Exchange Commission, paper copies of the Fund’s annual and semiannual shareholder reports will no longer be sent by mail, unless you specifically request paper copies of the reports. Instead, the reports will be made available on the Fund’s website (pgiminvestments.com), and you will be notified by mail each time a report is posted and provided with a website link to access the report.
If you already elected to receive shareholder reports electronically, you will not be affected by this change and you need not take any action. You may elect to receive shareholder reports and other communications from the Fund electronically anytime by contacting your financial intermediary (such as a broker-dealer or bank) or, if you are a direct investor, by calling 1-800-225-1852 or by sending an email request to PGIM Investments at shareholderreports@pgim.com.
You may elect to receive all future reports in paper free of charge. If you invest through a financial intermediary, you can contact your financial intermediary or follow instructions included with this notice to elect to continue to receive paper copies of your shareholder reports. If you invest directly with the Fund, you can call 1-800-225-1852 or send an email request to shareholderreports@pgim.com to let the Fund know you wish to continue receiving paper copies of your shareholder reports. Your election to receive reports in paper will apply to all funds held in your account if you invest through your financial intermediary or all funds held with the fund complex if you invest directly with the Fund.

To enroll in e-delivery, go to pgiminvestments.com/edelivery
|
Objective:To provide investment results that approximate the performance of
the FTSE Developed Markets Ex-North America Net Index |
Highlights(unaudited)
| • | | The Fund closely tracked the performance of the FTSE Developed Markets Ex-North America Net Index over the 12-month reporting period that ended October 31, 2019. |
| • | | The Fund holds almost all stocks included in this Index in approximately the same proportions. |
This report is not authorized for distribution to prospective investors unless preceded or accompanied by a current prospectus.
The views expressed in this report and information about the Fund’s portfolio holdings are for the period covered by this report and are subject to change thereafter.
Mutual funds are distributed by Prudential Investment Management Services LLC, a Prudential Financial company, member SIPC. QMA is the primary business name of QMA LLC, a wholly owned subsidiary of PGIM, Inc. (PGIM), a Prudential Financial company.© 2019 Prudential Financial, Inc. and its related entities. PGIM and the PGIM logo are service marks of Prudential Financial, Inc. and its related entities, registered in many jurisdictions worldwide.
| | |
| 2 | | Visit our website at pgiminvestments.com |
Your Fund’s Performance(unaudited)
Performance data quoted represents past performance. Past performance does not guarantee future results. The investment return and principal value of an investment will fluctuate, so that an investor’s shares, when redeemed, may be worth more or less than their original cost. Current performance may be lower or higher than the past performance data quoted.
| | | | |
| |
| | | Average Annual Total Returns as of 10/31/19 |
| | | One Year (%) | | Since Inception (%) |
| Fund | | 9.88 | | 8.73 (11/17/16) |
| FTSE Developed Markets Ex-North America Net Index | | |
| | | 10.54 | | 9.35 |
Growth of a $10,000 Investment
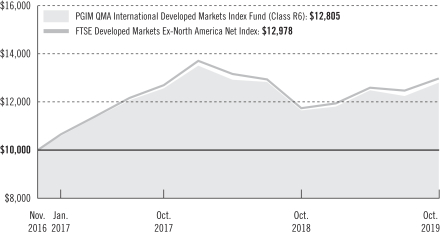
The graph compares a $10,000 investment in the Fund with a similar investment in the FTSE Developed MarketsEx-North America Net Index by portraying the initial account values at the Fund’s commencement of operations (November 17, 2016) and the account values at the end of the current fiscal year (October 31, 2019), as measured on a quarterly basis. For purposes of the graph, and unless otherwise indicated, it has been assumed that (a) all recurring fees (including management fees) were deducted; and (b) all dividends and distributions were reinvested. Without waiver of fees and/or expense reimbursements, the returns would have been lower.
| | | | |
| PGIM QMA International Developed Markets Index Fund | | | 3 | |
Your Fund’s Performance(continued)
Past performance does not predict future performance. Total returns and the ending account values in the graph include changes in share price and reinvestment of dividends and capital gains distributions in a hypothetical investment for the periods shown. The Fund’s total returns do not reflect the deduction of income taxes on an individual’s investment. Taxes may reduce your actual investment returns on income or gains paid by the Fund or any gains you may realize if you sell your shares.
Source: PGIM Investments LLC and Lipper Inc.
The returns in the tables do not reflect the deduction of taxes that a shareholder would pay on Fund distributions or following the redemption of Fund shares. Since Inception returns for the Index are measured from the closest month-end to the Fund’s inception date.
Benchmark Definitions
FTSE Developed Markets Ex-North America Net Index—The FTSE Developed All Cap ex-North America Index is a part of a range of indexes designed to help investors benchmark their international Investments. The index comprises large- and mid-cap stocks providing coverage of developed markets, excluding the US and Canada. The index is derived from the FTSE Global Equity Index Series (GEIS), which covers 98% of the world’s investable market capitalization.
Investors cannot invest directly in an index or average. The returns for the Index would be lower if they included the effects of sales charges, operating expenses of a mutual fund, or taxes.
Presentation of Fund Holdingsas of 10/31/19
| | | | | | |
| | | |
| Ten Largest Holdings | | Line of Business | | Country | | % of Net Assets |
| iShares MSCI EAFE ETF | | Exchange-Traded Funds | | United States | | 2.3% |
| Nestle SA | | Food Products | | Switzerland | | 1.9% |
| Roche Holding AG | | Pharmaceuticals | | Switzerland | | 1.3% |
| Samsung Electronics Co. Ltd. | | Technology Hardware, Storage & Peripherals | | South Korea | | 1.2% |
| Novartis AG | | Pharmaceuticals | | Switzerland | | 1.1% |
| Toyota Motor Corp. | | Automobiles | | Japan | | 1.0% |
| HSBC Holdings PLC | | Banks | | United Kingdom | | 0.9% |
| SAP SE | | Software | | Germany | | 0.8% |
| AstraZeneca PLC | | Pharmaceuticals | | United Kingdom | | 0.8% |
| TOTAL SA | | Oil, Gas & Consumable Fuels | | France | | 0.8% |
For a complete list of holdings, please refer to the Schedule of Investments section of this report. Holdings reflect only long-term Investments.
| | |
| 4 | | Visit our website at pgiminvestments.com |
Strategy and Performance Overview(unaudited)
How did the Fund perform?
ThePGIM QMA International Developed Markets Index Fund’s Class R6 shares returned 9.88% in the 12-month reporting period that ended October 31, 2019, underperforming the 10.54% return of the FTSE Developed Markets Ex-North America Net Index (the Index).
What were the market conditions?
| • | | Global economic growth continued to be weak during the period, buffeted by the powerful crosscurrents of the US-China trade war and global monetary easing. |
| • | | The trade standoff took a toll on business confidence, industrial production, and trade flows. It weighed heavily on global manufacturing, hitting export-oriented economies—including China, Europe, and Japan—the hardest. |
| • | | Fortunately, weakness in manufacturing did not drag down the services sector, which remained resilient. The trade war also has had less of an impact on more domestic-oriented economies like the US. As a result, there has been a pronounced divergence in growth among sectors and regions within the global economy. |
| • | | Given the weak growth backdrop and elevated geopolitical risks, global central banks embarked on a fresh round of monetary easing during the period, aiming to stimulate growth and counter the negative effects of the trade war. |
| • | | However, with interest rates already at, near, or below zero in many countries, the power of monetary policy may have been muted. Thus, the focus shifted to using fiscal policy as a means of stimulating growth, especially in Europe. |
| • | | Powered by a healthy consumer, US economic growth remained resilient while eurozone growth was anemic, with Germany and Italy teetering on the edge of recession. Uncertainty over Brexit—the United Kingdom’s ongoing effort to exit the European Union—finally caught up with the UK economy, which contracted in the second quarter of 2019. Japanese economic growth was decent, but risks were tilted to the downside given weak global growth, yen appreciation, and a pending consumer tax hike. |
| • | | Emerging market growth remained hostage to trade tensions, especially for such export-dependent economies as China, Taiwan, and Korea. Although the economies of emerging market countries such as India and Brazil are less levered to the global export cycle, they also succumbed to a slowdown in growth amid weaker consumer spending and slow progress on much-needed reforms. |
| • | | Uncertainty surrounding a shifting global paradigm and its implications for global growth made for a challenging and volatile environment during the period. |
| | | | |
| PGIM QMA International Developed Markets Index Fund | | | 5 | |
Strategy and Performance Overview(continued)
How was the Fund managed?
| • | | The Fund closely tracked the Index’s performance over the reporting period. |
| • | | The Fund holds almost all stocks included in the Index in approximately the same proportions. |
Did the Fund use derivatives?
| • | | The Fund held several international stock index futures, including Topix Index Futures, DJ Euro Stoxx Futures, FTSE 100 Futures, and MSCI-EAFE Mini Futures. These derivatives were used to maintain exposure to equities and provide portfolio liquidity during the period. |
| • | | Futures had minimal impact on performance during the period. |
Current outlook
| • | | Escalating geopolitical risks and increased monetary easing have elevated both the upside and downside risks for the global economy. As such, it is currently very difficult to determine which force will gain the upper hand. |
| • | | The greatest threat to the global economy is an escalation of the US-China trade war, which likely would lead to an even deeper downturn in global manufacturing. In turn, this could progressively weaken the healthier components of the global economy, namely the services sector and US consumer spending. |
| • | | A more constructive scenario for risky assets would involve a tamping down of these geopolitical risks and any sign that monetary stimulus has reaccelerated global growth. |
| • | | Given this backdrop, there is potential for significant market swings between now and year end. |
| | |
| 6 | | Visit our website at pgiminvestments.com |
Fees and Expenses(unaudited)
As a shareholder of the Fund, you incur two types of costs: (1) transaction costs, and (2) ongoing costs, including management fees, and other Fund expenses, as applicable. This example is intended to help you understand your ongoing costs (in dollars) of investing in the Fund and to compare these costs with the ongoing costs of investing in other mutual funds.
The example is based on an investment of $1,000 held through the six-month period ended October 31, 2019. The example is for illustrative purposes only; you should consult the Prospectus for information on initial and subsequent minimum investment requirements.
Actual Expenses
The first line for each share class in the table on the following page provides information about actual account values and actual expenses. You may use the information on this line, together with the amount you invested, to estimate the expenses that you paid over the period. Simply divide your account value by $1,000 (for example, an $8,600 account value ÷ $1,000 = 8.6), then multiply the result by the number on the first line under the heading “Expenses Paid During the Six-Month Period” to estimate the expenses you paid on your account during this period.
Hypothetical Example for Comparison Purposes
The second line in the table on the following page provides information about hypothetical account values and hypothetical expenses based on the Fund’s actual expense ratio and an assumed rate of return of 5% per year before expenses, which is not the Fund’s actual return. The hypothetical account values and expenses may not be used to estimate the actual ending account balance or expenses you paid for the period. You may use this information to compare the ongoing costs of investing in the Fund and other funds. To do so, compare this 5% hypothetical example with the 5% hypothetical examples that appear in the shareholder reports of the other funds.
Please note that the expenses shown in the table are meant to highlight your ongoing costs only and do not reflect any transactional costs such as sales charges (loads). Therefore, the second line in the table is useful in comparing ongoing costs only and will not help you determine the relative total costs of owning different funds. In addition, if these transactional costs were included, your costs would have been higher.
| | | | |
| PGIM QMA International Developed Markets Index Fund | | | 7 | |
Fees and Expenses(continued)
| | | | | | | | | | | | | | | | |
| | | | |
PGIM QMA
International
Developed Markets
Index Fund | | Beginning Account
Value
May 1, 2019 | | | Ending Account
Value
October 31, 2019 | | | Annualized
Expense Ratio
Based on the
Six-Month Period | | | Expenses Paid
During the
Six-Month Period* | |
| Actual | | $ | 1,000.00 | | | $ | 1,025.30 | | | | 0.30 | % | | $ | 1.53 | |
| Hypothetical | | $ | 1,000.00 | | | $ | 1,023.69 | | | | 0.30 | % | | $ | 1.53 | |
*Fund expenses (net of fee waivers or subsidies, if any) are equal to the annualized expense ratio (provided in the table), multiplied by the average account value over the period, multiplied by the 184 days in the six-month period ended October 31, 2019, and divided by the 365 days in the Fund’s fiscal year ended October 31, 2019 (to reflect the six-month period). Expenses presented in the table include the expenses of any underlying portfolios in which the Fund may invest.
| | |
| 8 | | Visit our website at pgiminvestments.com |
Schedule of Investments
as of October 31, 2019
| | | | | | | | |
| Description | | Shares | | | Value | |
LONG-TERM INVESTMENTS 96.0% | | | | | | | | |
| | |
COMMON STOCKS 93.0% | | | | | | | | |
| | |
Australia 6.9% | | | | | | | | |
Adelaide Brighton Ltd. | | | 1,140 | | | $ | 2,404 | |
Afterpay Touch Group Ltd.* | | | 557 | | | | 11,007 | |
AGL Energy Ltd. | | | 2,001 | | | | 27,233 | |
ALS Ltd. | | | 1,532 | | | | 8,474 | |
Altium Ltd. | | | 279 | | | | 6,154 | |
Alumina Ltd. | | | 7,414 | | | | 11,557 | |
AMP Ltd. | | | 10,918 | | | | 13,713 | |
Ansell Ltd. | | | 426 | | | | 8,105 | |
APA Group | | | 3,480 | | | | 27,886 | |
Aristocrat Leisure Ltd. | | | 1,966 | | | | 42,598 | |
ASX Ltd. | | | 588 | | | | 33,232 | |
Atlas Arteria Ltd. | | | 2,129 | | | | 11,755 | |
Aurizon Holdings Ltd. | | | 5,696 | | | | 23,138 | |
AusNet Services | | | 5,831 | | | | 7,441 | |
Australia & New Zealand Banking Group Ltd. | | | 8,631 | | | | 158,470 | |
Bank of Queensland Ltd. | | | 1,286 | | | | 8,011 | |
Beach Energy Ltd. | | | 5,326 | | | | 8,341 | |
Bendigo & Adelaide Bank Ltd. | | | 1,454 | | | | 10,642 | |
BHP Group Ltd. | | | 8,923 | | | | 219,620 | |
BHP Group PLC | | | 6,313 | | | | 133,808 | |
BlueScope Steel Ltd. | | | 1,694 | | | | 15,422 | |
Boral Ltd. | | | 3,595 | | | | 12,415 | |
Brambles Ltd. | | | 4,888 | | | | 40,293 | |
Caltex Australia Ltd. | | | 731 | | | | 13,695 | |
Challenger Ltd. | | | 1,601 | | | | 8,750 | |
Charter Hall Group, REIT | | | 1,403 | | | | 10,908 | |
CIMIC Group Ltd. | | | 279 | | | | 6,311 | |
Cleanaway Waste Management Ltd. | | | 3,705 | | | | 4,714 | |
Coca-Cola Amatil Ltd. | | | 1,502 | | | | 10,459 | |
Cochlear Ltd. | | | 165 | | | | 24,008 | |
Coles Group Ltd. | | | 3,404 | | | | 35,084 | |
Commonwealth Bank of Australia | | | 5,378 | | | | 290,615 | |
Computershare Ltd. | | | 1,492 | | | | 16,176 | |
Crown Resorts Ltd. | | | 1,096 | | | | 9,379 | |
CSL Ltd. | | | 1,374 | | | | 241,839 | |
CSR Ltd. | | | 1,412 | | | | 4,008 | |
Dexus, REIT | | | 3,390 | | | | 27,919 | |
Domain Holdings Australia Ltd. | | | 604 | | | | 1,312 | |
Domino’s Pizza Enterprises Ltd. | | | 157 | | | | 5,512 | |
Downer EDI Ltd. | | | 1,933 | | | | 10,667 | |
Evolution Mining Ltd. | | | 3,295 | | | | 9,583 | |
Flight Centre Travel Group Ltd. | | | 167 | | | | 4,883 | |
Fortescue Metals Group Ltd. | | | 5,006 | | | | 30,550 | |
See Notes to Financial Statements.
| | | | |
| PGIM QMA International Developed Markets Index Fund | | | 9 | |
Schedule of Investments(continued)
as of October 31, 2019
| | | | | | | | |
| Description | | Shares | | | Value | |
COMMON STOCKS (Continued) | | | | | | | | |
| | |
Australia (cont’d.) | | | | | | | | |
Goodman Group, REIT | | | 5,366 | | | $ | 53,238 | |
GPT Group (The), REIT | | | 6,001 | | | | 24,568 | |
Harvey Norman Holdings Ltd. | | | 1,847 | | | | 5,202 | |
IDP Education Ltd. | | | 287 | | | | 3,513 | |
Iluka Resources Ltd. | | | 1,326 | | | | 8,543 | |
Incitec Pivot Ltd. | | | 4,968 | | | | 11,757 | |
Insurance Australia Group Ltd. | | | 7,117 | | | | 38,844 | |
IOOF Holdings Ltd. | | | 952 | | | | 4,816 | |
Lendlease Group | | | 1,714 | | | | 22,008 | |
Macquarie Group Ltd. | | | 931 | | | | 85,708 | |
Magellan Financial Group Ltd. | | | 414 | | | | 13,653 | |
Medibank Private Ltd. | | | 8,099 | | | | 18,827 | |
Metcash Ltd. | | | 2,437 | | | | 4,723 | |
Mirvac Group, REIT | | | 11,973 | | | | 26,448 | |
National Australia Bank Ltd. | | | 8,802 | | | | 173,027 | |
Newcrest Mining Ltd. | | | 2,318 | | | | 50,408 | |
Northern Star Resources Ltd. | | | 1,877 | | | | 12,858 | |
Nufarm Ltd. | | | 807 | | | | 3,275 | |
Oil Search Ltd. | | | 3,902 | | | | 19,155 | |
Orica Ltd. | | | 1,102 | | | | 17,339 | |
Origin Energy Ltd. | | | 5,385 | | | | 29,010 | |
Orora Ltd. | | | 3,985 | | | | 8,490 | |
OZ Minerals Ltd. | | | 841 | | | | 5,834 | |
Perpetual Ltd. | | | 120 | | | | 2,955 | |
Platinum Asset Management Ltd. | | | 878 | | | | 2,494 | |
Qantas Airways Ltd. | | | 1,932 | | | | 8,526 | |
QBE Insurance Group Ltd. | | | 4,035 | | | | 34,923 | |
Qube Holdings Ltd. | | | 3,391 | | | | 7,578 | |
Ramsay Health Care Ltd. | | | 371 | | | | 17,460 | |
REA Group Ltd. | | | 150 | | | | 11,183 | |
Rio Tinto Ltd. | | | 1,167 | | | | 72,498 | |
Rio Tinto PLC | | | 3,338 | | | | 173,787 | |
Santos Ltd. | | | 5,270 | | | | 29,378 | |
Scentre Group, REIT | | | 15,448 | | | | 40,664 | |
SEEK Ltd. | | | 1,017 | | | | 15,859 | |
Seven Group Holdings Ltd. | | | 355 | | | | 4,556 | |
Shopping Centres Australasia Property Group, REIT | | | 2,347 | | | | 4,346 | |
Sonic Healthcare Ltd. | | | 1,448 | | | | 28,380 | |
South32 Ltd. | | | 15,630 | | | | 27,233 | |
Star Entertainment Group Ltd. (The) | | | 2,715 | | | | 8,763 | |
Stockland, REIT | | | 7,247 | | | | 24,381 | |
Suncorp Group Ltd. | | | 3,801 | | | | 35,155 | |
Sydney Airport | | | 3,522 | | | | 21,293 | |
Tabcorp Holdings Ltd. | | | 5,829 | | | | 19,245 | |
See Notes to Financial Statements.
| | | | | | | | |
| Description | | Shares | | | Value | |
COMMON STOCKS (Continued) | | | | | | | | |
| | |
Australia (cont’d.) | | | | | | | | |
Telstra Corp. Ltd. | | | 12,851 | | | $ | 30,890 | |
TPG Telecom Ltd. | | | 1,090 | | | | 4,888 | |
Transurban Group | | | 8,186 | | | | 83,910 | |
Treasury Wine Estates Ltd. | | | 2,183 | | | | 26,405 | |
Vicinity Centres, REIT | | | 9,836 | | | | 18,076 | |
Vocus Group Ltd.* | | | 1,928 | | | | 4,392 | |
Washington H Soul Pattinson & Co. Ltd. | | | 249 | | | | 3,723 | |
Wesfarmers Ltd. | | | 3,474 | | | | 95,075 | |
Westpac Banking Corp. | | | 10,599 | | | | 205,414 | |
Whitehaven Coal Ltd. | | | 2,201 | | | | 4,977 | |
WiseTech Global Ltd. | | | 286 | | | | 5,111 | |
Woodside Petroleum Ltd. | | | 2,836 | | | | 62,552 | |
Woolworths Group Ltd. | | | 3,796 | | | | 97,531 | |
Worley Ltd. | | | 903 | | | | 8,465 | |
| | | | | | | | |
| | | | | | | 3,491,401 | |
| | |
Austria 0.2% | | | | | | | | |
ANDRITZ AG | | | 247 | | | | 11,129 | |
Erste Group Bank AG | | | 843 | | | | 29,783 | |
OMV AG | | | 432 | | | | 25,241 | |
Raiffeisen Bank International AG | | | 391 | | | | 9,628 | |
Telekom Austria AG* | | | 434 | | | | 3,358 | |
Verbund AG | | | 194 | | | | 10,472 | |
Vienna Insurance Group AG Wiener Versicherung Gruppe | | | 98 | | | | 2,660 | |
voestalpine AG | | | 337 | | | | 8,478 | |
| | | | | | | | |
| | | | | | | 100,749 | |
| | |
Belgium 0.9% | | | | | | | | |
Ackermans & van Haaren NV | | | 67 | | | | 10,264 | |
Ageas | | | 577 | | | | 33,214 | |
Anheuser-Busch InBev SA/NV | | | 2,338 | | | | 187,325 | |
Colruyt SA | | | 152 | | | | 8,449 | |
Galapagos NV* | | | 141 | | | | 25,973 | |
Groupe Bruxelles Lambert SA | | | 219 | | | | 21,974 | |
KBC Group NV | | | 827 | | | | 57,944 | |
Proximus SADP | | | 420 | | | | 12,871 | |
Sofina SA | | | 44 | | | | 9,731 | |
Solvay SA | | | 214 | | | | 23,266 | |
Telenet Group Holding NV* | | | 130 | | | | 6,376 | |
UCB SA | | | 366 | | | | 29,490 | |
Umicore SA | | | 623 | | | | 25,650 | |
| | | | | | | | |
| | | | | | | 452,527 | |
See Notes to Financial Statements.
| | | | |
| PGIM QMA International Developed Markets Index Fund | | | 11 | |
Schedule of Investments(continued)
as of October 31, 2019
| | | | | | | | |
| Description | | Shares | | | Value | |
COMMON STOCKS (Continued) | | | | | | | | |
| | |
Cambodia 0.0% | | | | | | | | |
NagaCorp Ltd. | | | 4,600 | | | $ | 8,337 | |
| | |
Chile 0.0% | | | | | | | | |
Antofagasta PLC | | | 1,053 | | | | 11,863 | |
| | |
China 0.5% | | | | | | | | |
AAC Technologies Holdings, Inc. | | | 2,200 | | | | 14,202 | |
BOC Hong Kong Holdings Ltd. | | | 10,900 | | | | 37,305 | |
Budweiser Brewing Co. APAC Ltd., 144A* | | | 3,000 | | | | 10,912 | |
China Mengniu Dairy Co. Ltd. | | | 8,200 | | | | 32,752 | |
China Travel International Investment Hong Kong Ltd. | | | 8,000 | | | | 1,265 | |
FIH Mobile Ltd. | | | 6,000 | | | | 852 | |
Guotai Junan International Holdings Ltd. | | | 8,000 | | | | 1,341 | |
Kerry Logistics Network Ltd. | | | 1,600 | | | | 2,551 | |
Lenovo Group Ltd. | | | 22,000 | | | | 15,148 | |
Minth Group Ltd. | | | 1,300 | | | | 4,583 | |
MMG Ltd.* | | | 6,000 | | | | 1,245 | |
Nexteer Automotive Group Ltd. | | | 2,000 | | | | 1,868 | |
Prosus NV* | | | 1,195 | | �� | | 82,558 | |
Semiconductor Manufacturing International Corp.* | | | 9,400 | | | | 11,936 | |
Shougang Fushan Resources Group Ltd. | | | 10,000 | | | | 2,056 | |
Shui On Land Ltd. | | | 8,000 | | | | 1,610 | |
Tingyi Cayman Islands Holding Corp. | | | 6,400 | | | | 8,509 | |
Towngas China Co. Ltd.* | | | 4,000 | | | | 3,091 | |
Uni-President China Holdings Ltd. | | | 3,600 | | | | 3,715 | |
Want Want China Holdings Ltd. | | | 16,000 | | | | 13,448 | |
Xinyi Solar Holdings Ltd. | | | 10,000 | | | | 5,670 | |
| | | | | | | | |
| | | | | | | 256,617 | |
| | |
Denmark 1.5% | | | | | | | | |
Ambu A/S (Class B Stock) | | | 489 | | | | 7,675 | |
AP Moller - Maersk A/S (Class A Stock) | | | 14 | | | | 16,788 | |
AP Moller - Maersk A/S (Class B Stock) | | | 20 | | | | 25,470 | |
Carlsberg A/S (Class B Stock) | | | 322 | | | | 45,304 | |
Chr Hansen Holding A/S | | | 318 | | | | 24,393 | |
Coloplast A/S (Class B Stock) | | | 401 | | | | 48,268 | |
Danske Bank A/S | | | 2,011 | | | | 28,728 | |
Demant A/S* | | | 309 | | | | 8,151 | |
Drilling Co. of 1972 A/S (The)* | | | 60 | | | | 3,391 | |
DSV A/S | | | 617 | | | | 59,803 | |
Genmab A/S* | | | 177 | | | | 38,575 | |
GN Store Nord A/S | | | 374 | | | | 16,435 | |
H. Lundbeck A/S | | | 170 | | | | 5,795 | |
See Notes to Financial Statements.
| | | | | | | | |
| Description | | Shares | | | Value | |
COMMON STOCKS (Continued) | | | | | | | | |
| | |
Denmark (cont’d.) | | | | | | | | |
ISS A/S | | | 527 | | | $ | 13,792 | |
Jyske Bank A/S | | | 196 | | | | 6,511 | |
Novo Nordisk A/S (Class B Stock) | | | 5,018 | | | | 274,489 | |
Novozymes A/S (Class B Stock) | | | 651 | | | | 30,620 | |
Orsted A/S, 144A | | | 456 | | | | 40,007 | |
Pandora A/S | | | 284 | | | | 13,963 | |
Rockwool International A/S (Class B Stock) | | | 17 | | | | 3,343 | |
Tryg A/S | | | 344 | | | | 9,604 | |
Vestas Wind Systems A/S | | | 594 | | | | 48,460 | |
| | | | | | | | |
| | | | | | | 769,565 | |
| | |
Finland 1.0% | | | | | | | | |
Elisa OYJ | | | 428 | | | | 23,339 | |
Fortum OYJ | | | 1,351 | | | | 32,974 | |
Huhtamaki OYJ | | | 284 | | | | 13,141 | |
Kesko OYJ (Class B Stock) | | | 196 | | | | 13,030 | |
Kone OYJ (Class B Stock) | | | 1,188 | | | | 75,495 | |
Metso OYJ | | | 330 | | | | 12,471 | |
Neste OYJ | | | 1,256 | | | | 45,398 | |
Nokia OYJ | | | 16,886 | | | | 62,160 | |
Nokian Renkaat OYJ | | | 397 | | | | 11,333 | |
Nordea Bank Abp | | | 9,727 | | | | 71,135 | |
Orion OYJ (Class B Stock) | | | 304 | | | | 13,462 | |
Sampo OYJ (Class A Stock) | | | 1,478 | | | | 60,580 | |
Stora Enso OYJ (Class R Stock) | | | 1,723 | | | | 22,318 | |
UPM-Kymmene OYJ | | | 1,641 | | | | 53,311 | |
Wartsila OYJ Abp | | | 1,592 | | | | 16,804 | |
| | | | | | | | |
| | | | | | | 526,951 | |
| | |
France 9.4% | | | | | | | | |
Accor SA | | | 579 | | | | 24,867 | |
Adevinta ASA (Class B Stock)* | | | 608 | | | | 6,936 | |
Aeroports de Paris | | | 91 | | | | 17,287 | |
AirFrance-KLM* | | | 651 | | | | 7,743 | |
Air Liquide SA | | | 1,406 | | | | 186,889 | |
Airbus SE | | | 1,671 | | | | 239,263 | |
ALD SA, 144A | | | 293 | | | | 4,151 | |
Alstom SA | | | 556 | | | | 24,005 | |
Amundi SA, 144A | | | 172 | | | | 12,275 | |
Arkema SA | | | 222 | | | | 22,680 | |
Atos SE | | | 277 | | | | 21,453 | |
AXA SA | | | 5,801 | | | | 153,097 | |
BioMerieux | | | 124 | | | | 10,146 | |
See Notes to Financial Statements.
| | | | |
| PGIM QMA International Developed Markets Index Fund | | | 13 | |
Schedule of Investments(continued)
as of October 31, 2019
| | | | | | | | |
| Description | | Shares | | | Value | |
COMMON STOCKS (Continued) | | | | | | | | |
| | |
France (cont’d.) | | | | | | | | |
BNP Paribas SA | | | 3,284 | | | $ | 171,654 | |
Bollore SA | | | 2,803 | | | | 12,126 | |
Bouygues SA | | | 620 | | | | 26,275 | |
Bureau Veritas SA | | | 808 | | | | 20,614 | |
Capgemini SE | | | 479 | | | | 53,930 | |
Carrefour SA | | | 1,706 | | | | 28,989 | |
Casino Guichard Perrachon SA | | | 168 | | | | 9,053 | |
Cie de Saint-Gobain | | | 1,494 | | | | 60,773 | |
Cie Generale des Etablissements Michelin SCA | | | 539 | | | | 65,495 | |
Cie Plastic Omnium SA | | | 202 | | | | 5,514 | |
CNP Assurances | | | 467 | | | | 9,264 | |
Covivio, REIT | | | 139 | | | | 15,737 | |
Credit Agricole SA | | | 3,460 | | | | 45,134 | |
Danone SA | | | 1,807 | | | | 149,830 | |
Dassault Aviation SA | | | 7 | | | | 9,744 | |
Dassault Systemes SE | | | 398 | | | | 60,438 | |
Edenred | | | 735 | | | | 38,711 | |
Eiffage SA | | | 221 | | | | 23,724 | |
Electricite de France SA | | | 1,526 | | | | 15,739 | |
Elis SA | | | 578 | | | | 11,057 | |
Engie SA | | | 4,987 | | | | 83,365 | |
EssilorLuxottica SA | | | 898 | | | | 136,903 | |
Eurazeo SE | | | 141 | | | | 9,832 | |
Eutelsat Communications SA | | | 558 | | | | 10,572 | |
Faurecia SE | | | 215 | | | | 10,010 | |
Gecina SA, REIT | | | 158 | | | | 27,097 | |
Getlink SE | | | 1,347 | | | | 22,520 | |
Hermes International | | | 94 | | | | 67,622 | |
ICADE, REIT | | | 101 | | | | 9,891 | |
Iliad SA | | | 67 | | | | 6,934 | |
Imerys SA | | | 100 | | | | 3,865 | |
Ingenico Group SA | | | 186 | | | | 19,838 | |
Ipsen SA | | | 113 | | | | 12,044 | |
JCDecaux SA | | | 217 | | | | 5,920 | |
Kering SA | | | 224 | | | | 127,600 | |
Klepierre SA, REIT | | | 601 | | | | 22,375 | |
Lagardere SCA | | | 365 | | | | 8,147 | |
Legrand SA | | | 810 | | | | 63,207 | |
L’Oreal SA | | | 731 | | | | 213,204 | |
LVMH Moet Hennessy Louis Vuitton SE | | | 755 | | | | 321,987 | |
Natixis SA | | | 2,432 | | | | 11,165 | |
Orange SA | | | 5,780 | | | | 92,998 | |
Orpea | | | 129 | | | | 15,530 | |
Pernod Ricard SA | | | 642 | | | | 118,586 | |
See Notes to Financial Statements.
| | | | | | | | |
| Description | | Shares | | | Value | |
COMMON STOCKS (Continued) | | | | | | | | |
| | |
France (cont’d.) | | | | | | | | |
Peugeot SA | | | 1,675 | | | $ | 42,257 | |
Publicis Groupe SA | | | 650 | | | | 27,930 | |
Remy Cointreau SA | | | 75 | | | | 10,039 | |
Renault SA | | | 554 | | | | 28,251 | |
Rexel SA | | | 922 | | | | 11,429 | |
Rubis SCA | | | 283 | | | | 16,386 | |
Safran SA | | | 999 | | | | 157,924 | |
Sanofi | | | 3,290 | | | | 302,937 | |
Sartorius Stedim Biotech | | | 75 | | | | 11,227 | |
Schneider Electric SE | | | 1,592 | | | | 147,680 | |
SCOR SE | | | 472 | | | | 19,879 | |
SEB SA | | | 87 | | | | 13,206 | |
Societe BIC SA | | | 76 | | | | 5,276 | |
Societe Generale SA | | | 2,322 | | | | 66,003 | |
Sodexo SA | | | 268 | | | | 29,459 | |
Suez | | | 1,183 | | | | 18,423 | |
Teleperformance | | | 175 | | | | 39,663 | |
Thales SA | | | 302 | | | | 29,517 | |
TOTAL SA | | | 7,344 | | | | 386,353 | |
Ubisoft Entertainment SA* | | | 271 | | | | 15,990 | |
Unibail-Rodamco-Westfield, REIT | | | 406 | | | | 62,829 | |
Valeo SA | | | 720 | | | | 26,784 | |
Veolia Environnement SA | | | 1,498 | | | | 39,373 | |
Vinci SA | | | 1,411 | | | | 158,190 | |
Vivendi SA | | | 2,638 | | | | 73,351 | |
Wendel SA | | | 86 | | | | 12,177 | |
Worldline SA, 144A* | | | 240 | | | | 14,574 | |
| | | | | | | | |
| | | | | | | 4,752,912 | |
| | |
Germany 7.2% | | | | | | | | |
1&1 Drillisch AG | | | 128 | | | | 3,424 | |
adidas AG | | | 594 | | | | 183,441 | |
Allianz SE | | | 1,281 | | | | 312,858 | |
Aroundtown SA | | | 2,811 | | | | 23,714 | |
Axel Springer SE* | | | 141 | | | | 9,805 | |
BASF SE | | | 2,779 | | | | 211,390 | |
Bayer AG | | | 2,834 | | | | 220,188 | |
Bayerische Motoren Werke AG | | | 975 | | | | 74,642 | |
Beiersdorf AG | | | 305 | | | | 36,386 | |
Brenntag AG | | | 471 | | | | 23,615 | |
Carl Zeiss Meditec AG | | | 107 | | | | 11,661 | |
Commerzbank AG | | | 3,111 | | | | 18,609 | |
Continental AG | | | 329 | | | | 43,908 | |
Covestro AG, 144A | | | 532 | | | | 25,512 | |
See Notes to Financial Statements.
| | | | |
| PGIM QMA International Developed Markets Index Fund | | | 15 | |
Schedule of Investments(continued)
as of October 31, 2019
| | | | | | | | |
| Description | | Shares | | | Value | |
COMMON STOCKS (Continued) | | | | | | | | |
| | |
Germany (cont’d.) | | | | | | | | |
Daimler AG | | | 2,616 | | | $ | 152,638 | |
Delivery Hero SE, 144A* | | | 349 | | | | 16,379 | |
Deutsche Bank AG | | | 6,223 | | | | 45,003 | |
Deutsche Boerse AG | | | 553 | | | | 85,676 | |
Deutsche Lufthansa AG | | | 682 | | | | 11,819 | |
Deutsche Post AG | | | 2,959 | | | | 104,723 | |
Deutsche Telekom AG | | | 9,862 | | | | 173,392 | |
Deutsche Wohnen SE | | | 1,078 | | | | 40,512 | |
DWS Group GmbH & Co. KGaA, 144A | | | 97 | | | | 3,139 | |
E.ON SE | | | 6,559 | | | | 66,082 | |
Evonik Industries AG | | | 481 | | | | 12,684 | |
Fielmann AG | | | 77 | | | | 5,943 | |
Fraport AG Frankfurt Airport Services Worldwide | | | 104 | | | | 8,688 | |
Fresenius Medical Care AG & Co. KGaA | | | 645 | | | | 46,657 | |
Fresenius SE & Co. KGaA | | | 1,222 | | | | 64,241 | |
FUCHS PETROLUB SE | | | 95 | | | | 3,835 | |
GEA Group AG | | | 484 | | | | 14,764 | |
GRENKE AG | | | 83 | | | | 7,872 | |
Hannover Rueck SE | | | 192 | | | | 34,025 | |
Hapag-Lloyd AG, 144A | | | 78 | | | | 5,671 | |
HeidelbergCement AG | | | 458 | | | | 34,052 | |
Hella GmbH & Co. KGaA | | | 121 | | | | 5,877 | |
Henkel AG & Co. KGaA | | | 308 | | | | 29,646 | |
HOCHTIEF AG | | | 55 | | | | 6,865 | |
Hugo Boss AG | | | 189 | | | | 7,961 | |
Infineon Technologies AG | | | 3,781 | | | | 73,324 | |
K+S AG | | | 585 | | | | 8,320 | |
KION Group AG | | | 211 | | | | 14,009 | |
Knorr-Bremse AG | | | 150 | | | | 15,134 | |
LANXESS AG | | | 283 | | | | 18,374 | |
LEG Immobilien AG | | | 187 | | | | 21,465 | |
Merck KGaA | | | 396 | | | | 47,140 | |
METRO AG | | | 513 | | | | 8,350 | |
MTU Aero Engines AG | | | 158 | | | | 42,207 | |
Muenchener Rueckversicherungs-Gesellschaft AG in Muenchen | | | 435 | | | | 120,740 | |
Nemetschek SE | | | 164 | | | | 8,344 | |
OSRAM Licht AG | | | 283 | | | | 12,617 | |
ProSiebenSat.1 Media SE | | | 627 | | | | 9,261 | |
Puma SE | | | 240 | | | | 18,073 | |
Rational AG | | | 10 | | | | 7,611 | |
Rheinmetall AG | | | 134 | | | | 16,098 | |
Rocket Internet SE, 144A* | | | 176 | | | | 4,678 | |
RWE AG | | | 1,716 | | | | 52,293 | |
SAP SE | | | 2,941 | | | | 389,174 | |
See Notes to Financial Statements.
| | | | | | | | |
| Description | | Shares | | | Value | |
COMMON STOCKS (Continued) | | | | | | | | |
| | |
Germany (cont’d.) | | | | | | | | |
Scout24 AG, 144A | | | 318 | | | $ | 19,687 | |
Siemens AG | | | 2,299 | | | | 265,061 | |
Siemens Healthineers AG, 144A | | | 421 | | | | 17,864 | |
Suedzucker AG | | | 209 | | | | 3,009 | |
Symrise AG | | | 378 | | | | 36,371 | |
Talanx AG | | | 124 | | | | 5,711 | |
Telefonica Deutschland Holding AG | | | 1,782 | | | | 5,664 | |
thyssenkrupp AG | | | 1,357 | | | | 19,388 | |
TUI AG | | | 1,303 | | | | 17,073 | |
Uniper SE | | | 617 | | | | 19,192 | |
United Internet AG | | | 339 | | | | 10,207 | |
Volkswagen AG | | | 102 | | | | 19,283 | |
Vonovia SE | | | 1,640 | | | | 87,293 | |
Wacker Chemie AG | | | 42 | | | | 3,294 | |
Wirecard AG | | | 343 | | | | 43,449 | |
Zalando SE, 144A* | | | 450 | | | | 19,455 | |
| | | | | | | | |
| | | | | | | 3,666,510 | |
| | |
Hong Kong 2.6% | | | | | | | | |
AIA Group Ltd. | | | 36,800 | | | | 365,243 | |
ASM Pacific Technology Ltd. | | | 1,000 | | | | 13,941 | |
Bank of East Asia Ltd. (The) | | | 3,600 | | | | 8,667 | |
Brightoil Petroleum Holdings Ltd.^* | | | 7,000 | | | | — | |
Cafe de Coral Holdings Ltd. | | | 400 | | | | 1,088 | |
Cathay Pacific Airways Ltd. | | | 1,700 | | | | 2,172 | |
Champion REIT | | | 7,000 | | | | 4,634 | |
Chow Tai Fook Jewellery Group Ltd. | | | 3,600 | | | | 3,249 | |
CK Asset Holdings Ltd. | | | 8,000 | | | | 55,334 | |
CK Infrastructure Holdings Ltd. | | | 1,700 | | | | 12,234 | |
CLP Holdings Ltd. | | | 4,900 | | | | 50,718 | |
Dah Sing Banking Group Ltd. | | | 1,200 | | | | 1,549 | |
Dah Sing Financial Holdings Ltd. | | | 500 | | | | 1,860 | |
Dairy Farm International Holdings Ltd. | | | 900 | | | | 5,418 | |
Haitong International Securities Group Ltd. | | | 7,000 | | | | 2,031 | |
Hang Lung Group Ltd. | | | 2,800 | | | | 7,017 | |
Hang Lung Properties Ltd. | | | 6,000 | | | | 13,141 | |
Hang Seng Bank Ltd. | | | 2,200 | | | | 45,805 | |
Henderson Land Development Co. Ltd. | | | 4,004 | | | | 19,974 | |
Hong Kong & China Gas Co. Ltd. | | | 30,338 | | | | 58,905 | |
Hong Kong Exchanges & Clearing Ltd. | | | 3,840 | | | | 119,044 | |
Hongkong Land Holdings Ltd. | | | 3,600 | | | | 19,782 | |
Huabao International Holdings Ltd. | | | 2,000 | | | | 729 | |
Hutchison Port Holdings Trust, UTS | | | 12,000 | | | | 1,856 | |
Hutchison Telecommunications Hong Kong Holdings Ltd. | | | 4,000 | | | | 723 | |
See Notes to Financial Statements.
| | | | |
| PGIM QMA International Developed Markets Index Fund | | | 17 | |
Schedule of Investments(continued)
as of October 31, 2019
| | | | | | | | |
| Description | | Shares | | | Value | |
COMMON STOCKS (Continued) | | | | | | | | |
| | |
Hong Kong (cont’d.) | | | | | | | | |
Hysan Development Co. Ltd. | | | 2,000 | | | $ | 7,852 | |
Jardine Matheson Holdings Ltd. | | | 670 | | | | 38,204 | |
Jardine Strategic Holdings Ltd. | | | 550 | | | | 17,716 | |
Johnson Electric Holdings Ltd. | | | 1,000 | | | | 1,832 | |
Kerry Properties Ltd. | | | 2,400 | | | | 7,752 | |
Li & Fung Ltd. | | | 16,000 | | | | 1,754 | |
Lifestyle International Holdings Ltd. | | | 1,400 | | | | 1,469 | |
Link REIT | | | 6,400 | | | | 69,679 | |
Melco International Development Ltd. | | | 2,600 | | | | 6,872 | |
MTR Corp. Ltd. | | | 4,200 | | | | 24,007 | |
New World Development Co. Ltd. | | | 17,600 | | | | 25,072 | |
NWS Holdings Ltd. | | | 4,000 | | | | 5,951 | |
PCCW Ltd. | | | 13,000 | | | | 7,728 | |
Power Assets Holdings Ltd. | | | 4,100 | | | | 29,202 | |
Sa Sa International Holdings Ltd. | | | 2,000 | | | | 479 | |
Shangri-La Asia Ltd. | | | 3,600 | | | | 3,674 | |
Shun Tak Holdings Ltd. | | | 6,000 | | | | 2,459 | |
Sino Land Co. Ltd. | | | 9,600 | | | | 14,360 | |
Sun Art Retail Group Ltd. | | | 6,500 | | | | 6,657 | |
Sun Hung Kai Properties Ltd. | | | 4,400 | | | | 66,217 | |
Swire Pacific Ltd. (Class A Stock) | | | 1,500 | | | | 14,243 | |
Swire Pacific Ltd. (Class B Stock) | | | 2,900 | | | | 4,280 | |
Swire Properties Ltd. | | | 3,200 | | | | 10,023 | |
Techtronic Industries Co. Ltd. | | | 3,700 | | | | 28,974 | |
Television Broadcasts Ltd. | | | 400 | | | | 659 | |
United Energy Group Ltd.* | | | 21,000 | | | | 4,243 | |
Vitasoy International Holdings Ltd. | | | 2,000 | | | | 8,123 | |
VTech Holdings Ltd. | | | 600 | | | | 5,331 | |
WH Group Ltd., 144A | | | 25,700 | | | | 27,172 | |
Wharf Holdings Ltd. (The) | | | 4,000 | | | | 9,062 | |
Wharf Real Estate Investment Co. Ltd. | | | 3,700 | | | | 21,734 | |
Wheelock & Co. Ltd. | | | 2,400 | | | | 14,854 | |
Xinyi Glass Holdings Ltd. | | | 6,000 | | | | 6,724 | |
Yue Yuen Industrial Holdings Ltd. | | | 2,200 | | | | 6,202 | |
| | | | | | | | |
| | | | | | | 1,315,674 | |
| | |
Indonesia 0.0% | | | | | | | | |
First Pacific Co. Ltd. | | | 7,000 | | | | 2,670 | |
| | |
Ireland 0.5% | | | | | | | | |
AIB Group PLC | | | 2,447 | | | | 7,854 | |
Bank of Ireland Group PLC | | | 2,766 | | | | 13,297 | |
CRH PLC | | | 2,414 | | | | 88,141 | |
See Notes to Financial Statements.
| | | | | | | | |
| Description | | Shares | | | Value | |
COMMON STOCKS (Continued) | | | | | | | | |
| | |
Ireland (cont’d.) | | | | | | | | |
Flutter Entertainment PLC | | | 235 | | | $ | 24,245 | |
Glanbia PLC | | | 579 | | | | 6,455 | |
Kerry Group PLC (Class A Stock) | | | 441 | | | | 53,347 | |
Kingspan Group PLC | | | 479 | | | | 24,807 | |
Smurfit Kappa Group PLC | | | 699 | | | | 23,299 | |
| | | | | | | | |
| | | | | | | 241,445 | |
| | |
Israel 0.5% | | | | | | | | |
Airport City Ltd.* | | | 216 | | | | 4,077 | |
Alony Hetz Properties & Investments Ltd. | | | 283 | | | | 4,089 | |
Amot Investments Ltd. | | | 329 | | | | 2,316 | |
Azrieli Group Ltd. | | | 132 | | | | 10,173 | |
Bank Hapoalim BM | | | 3,251 | | | | 26,018 | |
Bank LeumiLe-Israel BM | | | 4,467 | | | | 32,516 | |
Bezeq The Israeli Telecommunication Corp. Ltd. | | | 6,000 | | | | 3,960 | |
Delek Group Ltd. | | | 10 | | | | 1,306 | |
Elbit Systems Ltd. | | | 79 | | | | 12,946 | |
Fattal Holdings 1998 Ltd. | | | 7 | | | | 1,041 | |
First International Bank of Israel Ltd. | | | 141 | | | | 3,868 | |
Gazit-Globe Ltd. | | | 246 | | | | 2,480 | |
Harel Insurance Investments & Financial Services Ltd. | | | 307 | | | | 2,453 | |
Israel Chemicals Ltd. | | | 2,124 | | | | 9,437 | |
Israel Corp. Ltd. (The)* | | | 10 | | | | 1,907 | |
Israel Discount Bank Ltd. (Class A Stock) | | | 3,604 | | | | 16,460 | |
Melisron Ltd. | | | 44 | | | | 2,664 | |
Migdal Insurance & Financial Holding Ltd. | | | 1,777 | | | | 1,844 | |
Mizrahi Tefahot Bank Ltd. | | | 413 | | | | 10,244 | |
Nice Ltd. | | | 191 | | | | 30,200 | |
Oil Refineries Ltd. | | | 4,345 | | | | 2,228 | |
Paz Oil Co. Ltd. | | | 28 | | | | 4,287 | |
Phoenix Holdings Ltd. (The) | | | 334 | | | | 2,036 | |
Shufersal Ltd. | | | 264 | | | | 1,783 | |
Strauss Group Ltd. | | | 121 | | | | 3,665 | |
Teva Pharmaceutical Industries Ltd.* | | | 3,034 | | | | 24,868 | |
Tower Semiconductor Ltd.* | | | 309 | | | | 6,802 | |
| | | | | | | | |
| | | | | | | 225,668 | |
| | |
Italy 2.0% | | | | | | | | |
A2A SpA | | | 4,682 | | | | 9,397 | |
Amplifon SpA | | | 361 | | | | 9,070 | |
Assicurazioni Generali SpA | | | 3,879 | | | | 78,651 | |
Atlantia SpA | | | 1,635 | | | | 40,375 | |
Banca Mediolanum SpA | | | 798 | | | | 6,841 | |
See Notes to Financial Statements.
| | | | |
| PGIM QMA International Developed Markets Index Fund | | | 19 | |
Schedule of Investments(continued)
as of October 31, 2019
| | | | | | | | |
| Description | | Shares | | | Value | |
COMMON STOCKS (Continued) | | | | | | | | |
| | |
Italy (cont’d.) | | | | | | | | |
Banco BPM SpA* | | | 5,021 | | | $ | 11,423 | |
Buzzi Unicem SpA | | | 227 | | | | 5,485 | |
Buzzi Unicem SpA, RSP | | | 87 | | | | 1,332 | |
Davide Campari-Milano SpA | | | 1,766 | | | | 16,187 | |
DiaSorin SpA | | | 73 | | | | 8,227 | |
Enel SpA | | | 23,606 | | | | 182,953 | |
Eni SpA | | | 7,541 | | | | 114,252 | |
Ferrari NV | | | 378 | | | | 60,586 | |
FinecoBank Banca Fineco SpA | | | 1,773 | | | | 19,993 | |
Hera SpA | | | 2,664 | | | | 11,413 | |
Infrastrutture Wireless Italiane SpA, 144A | | | 724 | | | | 7,442 | |
Intesa Sanpaolo SpA | | | 45,414 | | | | 113,845 | |
Italgas SpA | | | 1,589 | | | | 10,225 | |
Leonardo SpA | | | 1,225 | | | | 14,248 | |
Mediaset SpA* | | | 839 | | | | 2,510 | |
Mediobanca Banca di Credito Finanziario SpA | | | 2,270 | | | | 26,989 | |
Moncler SpA | | | 532 | | | | 20,516 | |
Pirelli & C SpA, 144A | | | 1,458 | | | | 8,428 | |
Poste Italiane SpA, 144A | | | 1,393 | | | | 16,905 | |
PRADA SpA | | | 1,600 | | | | 5,540 | |
Prysmian SpA | | | 756 | | | | 17,447 | |
Recordati SpA | | | 292 | | | | 12,274 | |
Saipem SpA* | | | 1,654 | | | | 7,513 | |
Salvatore Ferragamo SpA | | | 186 | | | | 3,474 | |
Snam SpA | | | 6,891 | | | | 35,360 | |
Telecom Italia SpA* | | | 31,460 | | | | 18,453 | |
Telecom Italia SpA, RSP | | | 18,238 | | | | 10,571 | |
Terna Rete Elettrica Nazionale SpA | | | 4,264 | | | | 28,168 | |
UniCredit SpA | | | 6,737 | | | | 85,491 | |
Unione di Banche Italiane SpA | | | 2,935 | | | | 8,937 | |
UnipolSai Assicurazioni SpA | | | 1,961 | | | | 5,467 | |
| | | | | | | | |
| | | | | | | 1,035,988 | |
| | |
Japan 23.0% | | | | | | | | |
77 Bank Ltd. (The) | | | 200 | | | | 3,153 | |
ABC-Mart, Inc. | | | 100 | | | | 6,838 | |
Acom Co. Ltd. | | | 1,300 | | | | 5,224 | |
Advantest Corp. | | | 620 | | | | 27,818 | |
Aeon Co. Ltd. | | | 2,180 | | | | 43,884 | |
AEON Financial Service Co. Ltd. | | | 410 | | | | 6,248 | |
Aeon Mall Co. Ltd. | | | 330 | | | | 5,276 | |
AGC, Inc. | | | 620 | | | | 21,765 | |
Aica Kogyo Co. Ltd. | | | 180 | | | | 5,706 | |
Ain Holdings, Inc. | | | 60 | | | | 3,430 | |
See Notes to Financial Statements.
| | | | | | | | |
| Description | | Shares | | | Value | |
COMMON STOCKS (Continued) | | | | | | | | |
| | |
Japan (cont’d.) | | | | | | | | |
Air Water, Inc. | | | 480 | | | $ | 8,948 | |
Aisin Seiki Co. Ltd. | | | 600 | | | | 23,943 | |
Ajinomoto Co., Inc. | | | 1,470 | | | | 27,937 | |
Alfresa Holdings Corp. | | | 550 | | | | 12,227 | |
Alps Alpine Co. Ltd. | | | 600 | | | | 12,876 | |
Amada Holdings Co. Ltd. | | | 1,000 | | | | 11,348 | |
Amano Corp. | | | 210 | | | | 6,216 | |
ANA Holdings, Inc. | | | 350 | | | | 12,023 | |
Anritsu Corp. | | | 360 | | | | 6,873 | |
Aozora Bank Ltd. | | | 420 | | | | 10,782 | |
Ariake Japan Co. Ltd. | | | 20 | | | | 1,550 | |
Asahi Group Holdings Ltd. | | | 1,190 | | | | 59,488 | |
Asahi Intecc Co. Ltd. | | | 600 | | | | 16,503 | |
Asahi Kasei Corp. | | | 3,900 | | | | 43,295 | |
Asics Corp. | | | 500 | | | | 8,579 | |
ASKUL Corp. | | | 100 | | | | 2,736 | |
Astellas Pharma, Inc. | | | 5,780 | | | | 98,828 | |
Autobacs Seven Co. Ltd. | | | 200 | | | | 3,305 | |
Azbil Corp. | | | 400 | | | | 11,086 | |
Bandai Namco Holdings, Inc. | | | 620 | | | | 38,011 | |
Bank of Kyoto Ltd. (The) | | | 240 | | | | 9,499 | |
Benefit One, Inc. | | | 200 | | | | 4,047 | |
Benesse Holdings, Inc. | | | 220 | | | | 5,886 | |
Bic Camera, Inc. | | | 400 | | | | 4,373 | |
Bridgestone Corp. | | | 1,820 | | | | 75,515 | |
Brother Industries Ltd. | | | 700 | | | | 13,138 | |
Calbee, Inc. | | | 240 | | | | 8,027 | |
Canon Marketing Japan, Inc. | | | 160 | | | | 3,387 | |
Canon, Inc. | | | 3,080 | | | | 83,750 | |
Capcom Co. Ltd. | | | 300 | | | | 7,064 | |
Casio Computer Co. Ltd. | | | 700 | | | | 11,428 | |
Central Japan Railway Co. | | | 504 | | | | 103,481 | |
Chiba Bank Ltd. (The) | | | 2,000 | | | | 10,877 | |
Chubu Electric Power Co., Inc. | | | 2,100 | | | | 31,506 | |
Chugai Pharmaceutical Co. Ltd. | | | 700 | | | | 59,052 | |
Chugoku Bank Ltd. (The) | | | 650 | | | | 6,340 | |
Chugoku Electric Power Co., Inc. (The) | | | 880 | | | | 11,707 | |
Citizen Watch Co. Ltd. | | | 780 | | | | 4,143 | |
Coca-Cola Bottlers Japan Holdings, Inc. | | | 440 | | | | 9,985 | |
COMSYS Holdings Corp. | | | 400 | | | | 11,805 | |
Concordia Financial Group Ltd. | | | 3,300 | | | | 13,460 | |
Cosmo Energy Holdings Co. Ltd. | | | 200 | | | | 4,271 | |
Credit Saison Co. Ltd. | | | 450 | | | | 6,508 | |
CyberAgent, Inc. | | | 290 | | | | 9,415 | |
See Notes to Financial Statements.
| | | | |
| PGIM QMA International Developed Markets Index Fund | | | 21 | |
Schedule of Investments(continued)
as of October 31, 2019
| | | | | | | | |
| Description | | Shares | | | Value | |
COMMON STOCKS (Continued) | | | | | | | | |
| | |
Japan (cont’d.) | | | | | | | | |
Dai Nippon Printing Co. Ltd. | | | 950 | | | $ | 25,358 | |
Daicel Corp. | | | 880 | | | | 7,842 | |
Daido Steel Co. Ltd. | | | 60 | | | | 2,618 | |
Daifuku Co. Ltd. | | | 300 | | | | 15,859 | |
Dai-ichi Life Holdings, Inc. | | | 3,300 | | | | 53,759 | |
Daiichi Sankyo Co. Ltd. | | | 1,930 | | | | 126,581 | |
Daiichikosho Co. Ltd. | | | 130 | | | | 6,170 | |
Daikin Industries Ltd. | | | 760 | | | | 106,218 | |
Daishi Hokuetsu Financial Group, Inc. | | | 130 | | | | 3,295 | |
Daito Trust Construction Co. Ltd. | | | 156 | | | | 20,624 | |
Daiwa House Industry Co. Ltd. | | | 1,970 | | | | 67,870 | |
Daiwa Securities Group, Inc. | | | 4,800 | | | | 21,529 | |
DeNA Co. Ltd. | | | 310 | | | | 5,280 | |
Denka Co. Ltd. | | | 290 | | | | 8,361 | |
Denso Corp. | | | 1,380 | | | | 64,142 | |
Dentsu, Inc. | | | 730 | | | | 26,047 | |
DIC Corp. | | | 300 | | | | 8,560 | |
Disco Corp. | | | 90 | | | | 19,702 | |
DMG Mori Co. Ltd. | | | 300 | | | | 4,862 | |
Dowa Holdings Co. Ltd. | | | 170 | | | | 5,869 | |
East Japan Railway Co. | | | 1,130 | | | | 102,661 | |
Ebara Corp. | | | 300 | | | | 8,887 | |
Eisai Co. Ltd. | | | 814 | | | | 59,006 | |
Electric Power Development Co. Ltd. | | | 500 | | | | 12,129 | |
Ezaki Glico Co. Ltd. | | | 160 | | | | 7,416 | |
FamilyMart Co. Ltd. | | | 700 | | | | 17,402 | |
Fancl Corp. | | | 200 | | | | 5,641 | |
FANUC Corp. | | | 593 | | | | 117,144 | |
Fast Retailing Co. Ltd. | | | 110 | | | | 67,969 | |
FP Corp. | | | 90 | | | | 5,578 | |
Fuji Electric Co. Ltd. | | | 400 | | | | 12,702 | |
Fuji Media Holdings, Inc. | | | 140 | | | | 1,890 | |
Fuji Oil Holdings, Inc. | | | 160 | | | | 4,802 | |
FUJIFILM Holdings Corp. | | | 1,130 | | | | 49,714 | |
Fujikura Ltd. | | | 700 | | | | 3,248 | |
Fujitsu General Ltd. | | | 200 | | | | 3,619 | |
Fujitsu Ltd. | | | 630 | | | | 55,615 | |
Fukuoka Financial Group, Inc. | | | 560 | | | | 10,819 | |
Fukuyama Transporting Co. Ltd. | | | 100 | | | | 3,591 | |
Furukawa Electric Co. Ltd. | | | 200 | | | | 5,596 | |
Fuyo General Lease Co. Ltd. | | | 100 | | | | 6,503 | |
Glory Ltd. | | | 160 | | | | 4,702 | |
GMO internet, Inc. | | | 200 | | | | 3,366 | |
GMO Payment Gateway, Inc. | | | 140 | | | | 10,319 | |
See Notes to Financial Statements.
| | | | | | | | |
| Description | | Shares | | | Value | |
COMMON STOCKS (Continued) | | | | | | | | |
| | |
Japan (cont’d.) | | | | | | | | |
Goldwin, Inc. | | | 42 | | | $ | 3,214 | |
GS Yuasa Corp. | | | 300 | | | | 5,473 | |
GungHo Online Entertainment, Inc. | | | 120 | | | | 2,593 | |
Gunma Bank Ltd. (The) | | | 1,300 | | | | 4,376 | |
H2O Retailing Corp. | | | 300 | | | | 3,400 | |
Hachijuni Bank Ltd. (The) | | | 1,290 | | | | 5,550 | |
Hakuhodo DY Holdings, Inc. | | | 700 | | | | 10,452 | |
Hamamatsu Photonics KK | | | 350 | | | | 13,576 | |
Hankyu Hanshin Holdings, Inc. | | | 670 | | | | 26,801 | |
Haseko Corp. | | | 970 | | | | 12,492 | |
Heiwa Corp. | | | 200 | | | | 4,111 | |
Hikari Tsushin, Inc. | | | 20 | | | | 4,376 | |
Hino Motors Ltd. | | | 800 | | | | 7,575 | |
Hirose Electric Co. Ltd. | | | 71 | | | | 8,940 | |
Hiroshima Bank Ltd. (The) | | | 900 | | | | 4,591 | |
HIS Co. Ltd. | | | 80 | | | | 2,074 | |
Hisamitsu Pharmaceutical Co., Inc. | | | 210 | | | | 9,770 | |
Hitachi Capital Corp. | | | 130 | | | | 2,902 | |
Hitachi Chemical Co. Ltd. | | | 290 | | | | 9,545 | |
Hitachi Construction Machinery Co. Ltd. | | | 320 | | | | 8,269 | |
Hitachi High-Technologies Corp. | | | 200 | | | | 12,409 | |
Hitachi Ltd. | | | 2,780 | | | | 103,572 | |
Hitachi Metals Ltd. | | | 600 | | | | 7,528 | |
Hitachi Transport System Ltd. | | | 150 | | | | 4,264 | |
Hokkaido Electric Power Co., Inc. | | | 500 | | | | 2,616 | |
Hokuhoku Financial Group, Inc. | | | 400 | | | | 3,911 | |
Hokuriku Electric Power Co. | | | 500 | | | | 3,569 | |
Honda Motor Co. Ltd. | | | 5,240 | | | | 141,703 | |
Horiba Ltd. | | | 150 | | | | 10,118 | |
Hoshizaki Corp. | | | 170 | | | | 14,447 | |
House Foods Group, Inc. | | | 240 | | | | 9,090 | |
Hoya Corp. | | | 1,150 | | | | 101,489 | |
Hulic Co. Ltd. | | | 1,060 | | | | 11,504 | |
Ibiden Co. Ltd. | | | 360 | | | | 8,301 | |
Ichigo, Inc. | | | 900 | | | | 3,567 | |
Idemitsu Kosan Co. Ltd. | | | 747 | | | | 21,871 | |
IHI Corp. | | | 430 | | | | 10,639 | |
Iida Group Holdings Co. Ltd. | | | 430 | | | | 7,169 | |
Inpex Corp. | | | 2,800 | | | | 25,896 | |
Isetan Mitsukoshi Holdings Ltd. | | | 1,100 | | | | 8,775 | |
Isuzu Motors Ltd. | | | 1,500 | | | | 17,435 | |
Ito En Ltd. | | | 170 | | | | 8,275 | |
ITOCHU Corp. | | | 4,200 | | | | 87,761 | |
Itochu Techno-Solutions Corp. | | | 280 | | | | 7,539 | |
See Notes to Financial Statements.
| | | | |
| PGIM QMA International Developed Markets Index Fund | | | 23 | |
Schedule of Investments(continued)
as of October 31, 2019
| | | | | | | | |
| Description | | Shares | | | Value | |
COMMON STOCKS (Continued) | | | | | | | | |
| | |
Japan (cont’d.) | | | | | | | | |
Itoham Yonekyu Holdings, Inc. | | | 400 | | | $ | 2,576 | |
Iyo Bank Ltd. (The) | | | 870 | | | | 4,588 | |
Izumi Co. Ltd. | | | 130 | | | | 4,880 | |
J Front Retailing Co. Ltd. | | | 800 | | | | 10,173 | |
Japan Airlines Co. Ltd. | | | 360 | | | | 11,330 | |
Japan Airport Terminal Co. Ltd. | | | 150 | | | | 7,416 | |
Japan Aviation Electronics Industry Ltd. | | | 120 | | | | 2,237 | |
Japan Exchange Group, Inc. | | | 1,600 | | | | 26,423 | |
Japan Petroleum Exploration Co. Ltd. | | | 100 | | | | 2,548 | |
Japan Post Bank Co. Ltd. | | | 1,200 | | | | 11,930 | |
Japan Post Holdings Co. Ltd. | | | 4,100 | | | | 37,551 | |
Japan Post Insurance Co. Ltd. | | | 600 | | | | 9,458 | |
Japan Steel Works Ltd. (The) | | | 200 | | | | 4,209 | |
Japan Tobacco, Inc. | | | 3,630 | | | | 82,281 | |
JFE Holdings, Inc. | | | 1,580 | | | | 19,779 | |
JGC Holdings Corp. | | | 680 | | | | 9,847 | |
JSR Corp. | | | 600 | | | | 11,267 | |
JTEKT Corp. | | | 700 | | | | 8,925 | |
Justsystems Corp. | | | 60 | | | | 2,470 | |
JXTG Holdings, Inc. | | | 9,610 | | | | 44,971 | |
Kagome Co. Ltd. | | | 300 | | | | 7,545 | |
Kajima Corp. | | | 1,400 | | | | 19,205 | |
Kakaku.com, Inc. | | | 450 | | | | 10,411 | |
Kaken Pharmaceutical Co. Ltd. | | | 100 | | | | 4,890 | |
Kamigumi Co. Ltd. | | | 380 | | | | 8,576 | |
Kandenko Co. Ltd. | | | 300 | | | | 2,833 | |
Kaneka Corp. | | | 130 | | | | 4,321 | |
Kansai Electric Power Co., Inc. (The) | | | 2,170 | | | | 25,268 | |
Kansai Mirai Financial Group, Inc. | | | 500 | | | | 3,252 | |
Kansai Paint Co. Ltd. | | | 580 | | | | 13,965 | |
Kao Corp. | | | 1,470 | | | | 118,136 | |
Kawasaki Heavy Industries Ltd. | | | 490 | | | | 11,730 | |
Kawasaki Kisen Kaisha Ltd.* | | | 300 | | | | 4,480 | |
KDDI Corp. | | | 5,260 | | | | 145,236 | |
Keihan Holdings Co. Ltd. | | | 310 | | | | 14,587 | |
Keikyu Corp. | | | 800 | | | | 15,925 | |
Keio Corp. | | | 360 | | | | 22,255 | |
Keisei Electric Railway Co. Ltd. | | | 450 | | | | 18,418 | |
Kewpie Corp. | | | 360 | | | | 8,169 | |
Keyence Corp. | | | 225 | | | | 142,010 | |
Kikkoman Corp. | | | 610 | | | | 29,334 | |
Kinden Corp. | | | 400 | | | | 6,002 | |
Kintetsu Group Holdings Co. Ltd. | | | 550 | | | | 29,963 | |
Kirin Holdings Co. Ltd. | | | 2,450 | | | | 51,904 | |
See Notes to Financial Statements.
| | | | | | | | |
| Description | | Shares | | | Value | |
COMMON STOCKS (Continued) | | | | | | | | |
| | |
Japan (cont’d.) | | | | | | | | |
Kissei Pharmaceutical Co. Ltd. | | | 100 | | | $ | 2,581 | |
Kobayashi Pharmaceutical Co. Ltd. | | | 190 | | | | 15,176 | |
Kobe Steel Ltd. | | | 900 | | | | 4,833 | |
Koei Tecmo Holdings Co. Ltd. | | | 200 | | | | 4,607 | |
Koito Manufacturing Co. Ltd. | | | 380 | | | | 19,946 | |
Kokuyo Co. Ltd. | | | 300 | | | | 4,407 | |
Komatsu Ltd. | | | 2,810 | | | | 65,849 | |
Konami Holdings Corp. | | | 300 | | | | 13,177 | |
Konica Minolta, Inc. | | | 1,400 | | | | 10,248 | |
Kose Corp. | | | 60 | | | | 10,621 | |
K’s Holdings Corp. | | | 600 | | | | 6,844 | |
Kubota Corp. | | | 3,400 | | | | 53,999 | |
Kuraray Co. Ltd. | | | 1,200 | | | | 14,275 | |
Kurita Water Industries Ltd. | | | 360 | | | | 10,360 | |
Kyocera Corp. | | | 950 | | | | 62,289 | |
Kyoritsu Maintenance Co. Ltd. | | | 100 | | | | 4,420 | |
Kyowa Exeo Corp. | | | 290 | | | | 7,386 | |
Kyowa Kirin Co. Ltd. | | | 820 | | | | 15,057 | |
Kyudenko Corp. | | | 200 | | | | 6,541 | |
Kyushu Electric Power Co., Inc. | | | 1,500 | | | | 14,966 | |
Kyushu Financial Group, Inc. | | | 1,100 | | | | 4,452 | |
Kyushu Railway Co. | | | 470 | | | | 15,489 | |
Lawson, Inc. | | | 170 | | | | 9,368 | |
LINE Corp.* | | | 180 | | | | 6,620 | |
Lintec Corp. | | | 140 | | | | 2,939 | |
Lion Corp. | | | 740 | | | | 15,440 | |
LIXIL Group Corp. | | | 820 | | | | 15,283 | |
M3, Inc. | | | 1,320 | | | | 31,514 | |
Mabuchi Motor Co. Ltd. | | | 160 | | | | 6,488 | |
Maeda Corp. | | | 400 | | | | 3,721 | |
Maeda Road Construction Co. Ltd. | | | 200 | | | | 4,302 | |
Makita Corp. | | | 750 | | | | 25,200 | |
Mani, Inc. | | | 130 | | | | 3,422 | |
Marubeni Corp. | | | 4,800 | | | | 33,702 | |
Maruha Nichiro Corp. | | | 130 | | | | 3,363 | |
Marui Group Co. Ltd. | | | 680 | | | | 15,134 | |
Maruichi Steel Tube Ltd. | | | 200 | | | | 5,461 | |
Matsui Securities Co. Ltd. | | | 300 | | | | 2,472 | |
Matsumotokiyoshi Holdings Co. Ltd. | | | 240 | | | | 8,421 | |
Mazda Motor Corp. | | | 1,800 | | | | 16,542 | |
Mebuki Financial Group, Inc. | | | 3,600 | | | | 9,140 | |
Medipal Holdings Corp. | | | 500 | | | | 11,411 | |
Megmilk Snow Brand Co. Ltd. | | | 130 | | | | 3,121 | |
MEIJI Holdings Co. Ltd. | | | 366 | | | | 26,417 | |
See Notes to Financial Statements.
| | | | |
| PGIM QMA International Developed Markets Index Fund | | | 25 | |
Schedule of Investments(continued)
as of October 31, 2019
| | | | | | | | |
| Description | | Shares | | | Value | |
COMMON STOCKS (Continued) | | | | | | | | |
| | |
Japan (cont’d.) | | | | | | | | |
MINEBEA MITSUMI, Inc. | | | 1,300 | | | $ | 24,783 | |
Miraca Holdings, Inc. | | | 140 | | | | 3,308 | |
MISUMI Group, Inc. | | | 850 | | | | 21,401 | |
Mitsubishi Chemical Holdings Corp. | | | 4,000 | | | | 30,410 | |
Mitsubishi Corp. | | | 3,930 | | | | 99,613 | |
Mitsubishi Electric Corp. | | | 5,980 | | | | 84,981 | |
Mitsubishi Estate Co. Ltd. | | | 3,570 | | | | 69,239 | |
Mitsubishi Gas Chemical Co., Inc. | | | 520 | | | | 7,309 | |
Mitsubishi Heavy Industries Ltd. | | | 910 | | | | 36,839 | |
Mitsubishi Logistics Corp. | | | 190 | | | | 4,831 | |
Mitsubishi Materials Corp. | | | 410 | | | | 11,762 | |
Mitsubishi Motors Corp. | | | 1,800 | | | | 8,190 | |
Mitsubishi Shokuhin Co. Ltd. | | | 120 | | | | 3,044 | |
Mitsubishi Tanabe Pharma Corp. | | | 640 | | | | 7,648 | |
Mitsubishi UFJ Financial Group, Inc. | | | 37,900 | | | | 197,702 | |
Mitsubishi UFJ Lease & Finance Co. Ltd. | | | 1,350 | | | | 8,291 | |
Mitsui & Co. Ltd. | | | 5,100 | | | | 87,452 | |
Mitsui Chemicals, Inc. | | | 540 | | | | 12,813 | |
Mitsui Fudosan Co. Ltd. | | | 2,860 | | | | 73,160 | |
Mitsui Mining & Smelting Co. Ltd. | | | 200 | | | | 5,576 | |
Mitsui OSK Lines Ltd. | | | 370 | | | | 10,088 | |
Miura Co. Ltd. | | | 330 | | | | 9,928 | |
Mizuho Financial Group, Inc. | | | 77,000 | | | | 119,457 | |
Mochida Pharmaceutical Co. Ltd. | | | 30 | | | | 1,198 | |
MonotaRO Co. Ltd. | | | 360 | | | | 10,913 | |
Morinaga & Co. Ltd. | | | 140 | | | | 6,891 | |
Morinaga Milk Industry Co. Ltd. | | | 110 | | | | 4,257 | |
MS&AD Insurance Group Holdings, Inc. | | | 1,530 | | | | 49,274 | |
Murata Manufacturing Co. Ltd. | | | 1,720 | | | | 93,470 | |
Nabtesco Corp. | | | 380 | | | | 12,075 | |
Nagase & Co. Ltd. | | | 300 | | | | 4,538 | |
Nagoya Railroad Co. Ltd. | | | 660 | | | | 20,956 | |
Nankai Electric Railway Co. Ltd. | | | 330 | | | | 8,568 | |
NEC Corp. | | | 750 | | | | 29,698 | |
NET One Systems Co. Ltd. | | | 300 | | | | 8,103 | |
Nexon Co. Ltd.* | | | 1,240 | | | | 14,264 | |
NGK Insulators Ltd. | | | 830 | | | | 12,754 | |
NGK Spark Plug Co. Ltd. | | | 610 | | | | 12,410 | |
NH Foods Ltd. | | | 300 | | | | 12,574 | |
NHK Spring Co. Ltd. | | | 480 | | | | 3,919 | |
Nichirei Corp. | | | 300 | | | | 6,872 | |
Nidec Corp. | | | 680 | | | | 100,127 | |
Nifco, Inc. | | | 250 | | | | 6,608 | |
Nihon Kohden Corp. | | | 300 | | | | 8,966 | |
See Notes to Financial Statements.
| | | | | | | | |
| Description | | Shares | | | Value | |
COMMON STOCKS (Continued) | | | | | | | | |
| | |
Japan (cont’d.) | | | | | | | | |
Nihon M&A Center, Inc. | | | 400 | | | $ | 12,118 | |
Nihon Unisys Ltd. | | | 200 | | | | 6,594 | |
Nikon Corp. | | | 1,050 | | | | 13,379 | |
Nintendo Co. Ltd. | | | 276 | | | | 99,940 | |
Nippo Corp. | | | 160 | | | | 3,286 | |
Nippon Electric Glass Co. Ltd. | | | 230 | | | | 5,181 | |
Nippon Express Co. Ltd. | | | 270 | | | | 15,375 | |
Nippon Kayaku Co. Ltd. | | | 500 | | | | 6,088 | |
Nippon Paint Holdings Co. Ltd. | | | 480 | | | | 26,071 | |
Nippon Paper Industries Co. Ltd. | | | 300 | | | | 5,184 | |
Nippon Shinyaku Co. Ltd. | | | 160 | | | | 14,406 | |
Nippon Shokubai Co. Ltd. | | | 100 | | | | 6,179 | |
Nippon Steel Corp. | | | 2,530 | | | | 36,826 | |
Nippon Telegraph & Telephone Corp. | | | 1,960 | | | | 97,143 | |
Nippon Television Holdings, Inc. | | | 150 | | | | 1,962 | |
Nippon Yusen KK | | | 550 | | | | 9,893 | |
Nipro Corp. | | | 400 | | | | 4,683 | |
Nishi-Nippon Financial Holdings, Inc. | | | 400 | | | | 2,966 | |
Nishi-Nippon Railroad Co. Ltd. | | | 280 | | | | 6,488 | |
Nissan Chemical Corp. | | | 460 | | | | 18,858 | |
Nissan Motor Co. Ltd. | | | 5,900 | | | | 37,412 | |
Nissan Shatai Co. Ltd. | | | 200 | | | | 1,843 | |
Nisshin Seifun Group, Inc. | | | 760 | | | | 15,051 | |
Nisshinbo Holdings, Inc. | | | 400 | | | | 3,340 | |
Nissin Foods Holdings Co. Ltd. | | | 250 | | | | 18,842 | |
Nitori Holdings Co. Ltd. | | | 232 | | | | 35,286 | |
Nitto Denko Corp. | | | 500 | | | | 27,588 | |
NOF Corp. | | | 200 | | | | 6,759 | |
NOK Corp. | | | 350 | | | | 5,474 | |
Nomura Holdings, Inc. | | | 10,000 | | | | 45,355 | |
Nomura Real Estate Holdings, Inc. | | | 330 | | | | 7,818 | |
Nomura Research Institute Ltd. | | | 960 | | | | 20,414 | |
NS Solutions Corp. | | | 130 | | | | 4,411 | |
NSK Ltd. | | | 1,400 | | | | 13,003 | |
NTN Corp. | | | 1,100 | | | | 3,405 | |
NTT Data Corp. | | | 1,900 | | | | 25,030 | |
NTT DOCOMO, Inc. | | | 3,540 | | | | 97,058 | |
Obayashi Corp. | | | 2,000 | | | | 20,563 | |
OBIC Business Consultants Co. Ltd. | | | 40 | | | | 1,603 | |
Obic Co. Ltd. | | | 200 | | | | 25,047 | |
Odakyu Electric Railway Co. Ltd. | | | 940 | | | | 22,861 | |
Oji Holdings Corp. | | | 2,900 | | | | 15,004 | |
OKUMA Corp. | | | 100 | | | | 5,958 | |
Olympus Corp. | | | 3,380 | | | | 45,974 | |
See Notes to Financial Statements.
| | | | |
| PGIM QMA International Developed Markets Index Fund | | | 27 | |
Schedule of Investments(continued)
as of October 31, 2019
| | | | | | | | |
| Description | | Shares | | | Value | |
COMMON STOCKS (Continued) | | | | | | | | |
| | |
Japan (cont’d.) | | | | | | | | |
Omron Corp. | | | 570 | | | $ | 33,288 | |
Ono Pharmaceutical Co. Ltd. | | | 1,330 | | | | 25,010 | |
Open House Co. Ltd. | | | 200 | | | | 5,103 | |
Oracle Corp. | | | 100 | | | | 8,804 | |
Orient Corp. | | | 1,400 | | | | 2,046 | |
Oriental Land Co. Ltd. | | | 540 | | | | 79,101 | |
ORIX Corp. | | | 3,900 | | | | 61,130 | |
Osaka Gas Co. Ltd. | | | 1,240 | | | | 24,263 | |
OSG Corp. | | | 260 | | | | 5,558 | |
Otsuka Corp. | | | 340 | | | | 13,676 | |
Otsuka Holdings Co. Ltd. | | | 1,310 | | | | 54,649 | |
Paltac Corp. | | | 100 | | | | 4,816 | |
Pan Pacific International Holdings Corp. | | | 1,600 | | | | 25,211 | |
Panasonic Corp. | | | 6,500 | | | | 54,627 | |
Park24 Co. Ltd. | | | 320 | | | | 7,546 | |
Penta-Ocean Construction Co. Ltd. | | | 800 | | | | 4,898 | |
PeptiDream, Inc.* | | | 270 | | | | 13,512 | |
Persol Holdings Co. Ltd. | | | 550 | | | | 10,549 | |
Pigeon Corp. | | | 360 | | | | 17,572 | |
Pilot Corp. | | | 100 | | | | 4,059 | |
Pola Orbis Holdings, Inc. | | | 210 | | | | 4,742 | |
Rakuten, Inc. | | | 2,350 | | | | 22,345 | |
Recruit Holdings Co. Ltd. | | | 3,850 | | | | 127,604 | |
Relo Group, Inc. | | | 300 | | | | 7,324 | |
Renesas Electronics Corp.* | | | 2,080 | | | | 14,022 | |
Rengo Co. Ltd. | | | 600 | | | | 4,354 | |
Resona Holdings, Inc. | | | 6,700 | | | | 29,174 | |
Resorttrust, Inc. | | | 220 | | | | 3,500 | |
Ricoh Co. Ltd. | | | 2,100 | | | | 18,690 | |
Rinnai Corp. | | | 160 | | | | 11,749 | |
Rohm Co. Ltd. | | | 260 | | | | 20,497 | |
Rohto Pharmaceutical Co. Ltd. | | | 300 | | | | 9,011 | |
Ryohin Keikaku Co. Ltd. | | | 780 | | | | 17,360 | |
Sankyo Co. Ltd. | | | 160 | | | | 5,583 | |
Sankyu, Inc. | | | 200 | | | | 10,176 | |
Sanrio Co. Ltd. | | | 240 | | | | 4,815 | |
Santen Pharmaceutical Co. Ltd. | | | 1,100 | | | | 19,453 | |
Sanwa Holdings Corp. | | | 560 | | | | 6,571 | |
Sapporo Holdings Ltd. | | | 200 | | | | 5,022 | |
Sawai Pharmaceutical Co. Ltd. | | | 150 | | | | 8,437 | |
SBI Holdings, Inc. | | | 700 | | | | 15,186 | |
SCREEN Holdings Co. Ltd. | | | 80 | | | | 5,517 | |
SCSK Corp. | | | 150 | | | | 7,645 | |
Secom Co. Ltd. | | | 560 | | | | 51,943 | |
See Notes to Financial Statements.
| | | | | | | | |
| Description | | Shares | | | Value | |
COMMON STOCKS (Continued) | | | | | | | | |
| | |
Japan (cont’d.) | | | | | | | | |
Sega Sammy Holdings, Inc. | | | 570 | | | $ | 8,009 | |
Seibu Holdings, Inc. | | | 700 | | | | 12,319 | |
Seiko Epson Corp. | | | 800 | | | | 11,282 | |
Seino Holdings Co. Ltd. | | | 500 | | | | 6,417 | |
Sekisui Chemical Co. Ltd. | | | 1,100 | | | | 19,142 | |
Sekisui House Ltd. | | | 1,780 | | | | 38,417 | |
Seven & i Holdings Co. Ltd. | | | 2,370 | | | | 89,604 | |
Seven Bank Ltd. | | | 2,100 | | | | 6,086 | |
SG Holdings Co. Ltd. | | | 700 | | | | 17,305 | |
Sharp Corp. | | | 440 | | | | 5,054 | |
Shiga Bank Ltd. (The) | | | 150 | | | | 3,616 | |
Shikoku Electric Power Co., Inc. | | | 500 | | | | 4,947 | |
Shimadzu Corp. | | | 880 | | | | 23,507 | |
Shimamura Co. Ltd. | | | 20 | | | | 1,694 | |
Shimano, Inc. | | | 250 | | | | 41,595 | |
Shimizu Corp. | | | 1,800 | | | | 16,759 | |
Shin-Etsu Chemical Co. Ltd. | | | 1,220 | | | | 135,780 | |
Shinsei Bank Ltd. | | | 580 | | | | 9,071 | |
Shionogi & Co. Ltd. | | | 890 | | | | 53,507 | |
Shiseido Co. Ltd. | | | 1,130 | | | | 92,915 | |
Shizuoka Bank Ltd. (The) | | | 1,560 | | | | 11,867 | |
SHO-BOND Holdings Co. Ltd. | | | 32 | | | | 1,239 | |
Showa Denko KK | | | 500 | | | | 14,085 | |
SKY Perfect JSAT Holdings, Inc. | | | 400 | | | | 1,651 | |
Skylark Holdings Co. Ltd. | | | 600 | | | | 10,871 | |
SMC Corp. | | | 130 | | | | 55,886 | |
Softbank Corp. | | | 4,700 | | | | 64,405 | |
SoftBank Group Corp. | | | 5,010 | | | | 192,201 | |
Sohgo Security Services Co. Ltd. | | | 220 | | | | 11,960 | |
Sojitz Corp. | | | 3,700 | | | | 11,624 | |
Sompo Holdings, Inc. | | | 1,060 | | | | 41,574 | |
Sony Corp. | | | 3,830 | | | | 232,682 | |
Sony Financial Holdings, Inc. | | | 580 | | | | 12,439 | |
Sotetsu Holdings, Inc. | | | 260 | | | | 6,902 | |
Square Enix Holdings Co. Ltd. | | | 280 | | | | 13,221 | |
Stanley Electric Co. Ltd. | | | 440 | | | | 12,197 | |
Subaru Corp. | | | 1,870 | | | | 53,626 | |
Sugi Holdings Co. Ltd. | | | 100 | | | | 5,556 | |
SUMCO Corp. | | | 680 | | | | 11,278 | |
Sumitomo Bakelite Co. Ltd. | | | 100 | | | | 4,151 | |
Sumitomo Chemical Co. Ltd. | | | 4,700 | | | | 21,385 | |
Sumitomo Corp. | | | 3,380 | | | | 54,659 | |
Sumitomo Dainippon Pharma Co. Ltd. | | | 500 | | | | 8,720 | |
Sumitomo Electric Industries Ltd. | | | 2,270 | | | | 31,147 | |
See Notes to Financial Statements.
| | | | |
| PGIM QMA International Developed Markets Index Fund | | | 29 | |
Schedule of Investments(continued)
as of October 31, 2019
| | | | | | | | |
| Description | | Shares | | | Value | |
COMMON STOCKS (Continued) | | | | | | | | |
| | |
Japan (cont’d.) | | | | | | | | |
Sumitomo Forestry Co. Ltd. | | | 400 | | | $ | 5,800 | |
Sumitomo Heavy Industries Ltd. | | | 410 | | | | 12,721 | |
Sumitomo Metal Mining Co. Ltd. | | | 790 | | | | 26,390 | |
Sumitomo Mitsui Financial Group, Inc. | | | 3,970 | | | | 140,852 | |
Sumitomo Mitsui Trust Holdings, Inc. | | | 1,180 | | | | 43,007 | |
Sumitomo Osaka Cement Co. Ltd. | | | 100 | | | | 4,368 | |
Sumitomo Realty & Development Co. Ltd. | | | 1,200 | | | | 43,592 | |
Sumitomo Rubber Industries Ltd. | | | 500 | | | | 6,611 | |
Sundrug Co. Ltd. | | | 220 | | | | 7,275 | |
Suntory Beverage & Food Ltd. | | | 370 | | | | 15,779 | |
Suzuken Co. Ltd. | | | 230 | | | | 12,236 | |
Suzuki Motor Corp. | | | 1,320 | | | | 62,348 | |
Sysmex Corp. | | | 620 | | | | 40,418 | |
T&D Holdings, Inc. | | | 1,800 | | | | 19,986 | |
Tadano Ltd. | | | 300 | | | | 2,713 | |
Taiheiyo Cement Corp. | | | 430 | | | | 12,144 | |
Taisei Corp. | | | 650 | | | | 25,657 | |
Taisho Pharmaceutical Holdings Co. Ltd. | | | 130 | | | | 9,248 | |
Taiyo Nippon Sanso Corp. | | | 490 | | | | 11,454 | |
Taiyo Yuden Co. Ltd. | | | 400 | | | | 10,580 | |
Takara Bio, Inc. | | | 130 | | | | 2,647 | |
Takara Holdings, Inc. | | | 500 | | | | 4,963 | |
Takashimaya Co. Ltd. | | | 500 | | | | 5,805 | |
Takeda Pharmaceutical Co. Ltd. | | | 4,583 | | | | 164,782 | |
TDK Corp. | | | 370 | | | | 36,561 | |
TechnoPro Holdings, Inc. | | | 130 | | | | 8,006 | |
Teijin Ltd. | | | 540 | | | | 10,794 | |
Terumo Corp. | | | 1,960 | | | | 64,038 | |
THK Co. Ltd. | | | 370 | | | | 10,629 | |
TIS, Inc. | | | 200 | | | | 12,045 | |
Tobu Railway Co. Ltd. | | | 630 | | | | 21,019 | |
Toda Corp. | | | 800 | | | | 4,997 | |
Toho Co. Ltd. | | | 420 | | | | 16,904 | |
Toho Gas Co. Ltd. | | | 270 | | | | 10,512 | |
Tohoku Electric Power Co., Inc. | | | 1,380 | | | | 14,183 | |
Tokai Carbon Co. Ltd. | | | 600 | | | | 6,034 | |
Tokai Rika Co. Ltd. | | | 140 | | | | 2,701 | |
Tokio Marine Holdings, Inc. | | | 2,020 | | | | 108,898 | |
Tokuyama Corp. | | | 200 | | | | 5,352 | |
Tokyo Broadcasting System Holdings, Inc. | | | 100 | | | | 1,598 | |
Tokyo Century Corp. | | | 160 | | | | 7,369 | |
Tokyo Electric Power Co. Holdings, Inc.* | | | 4,900 | | | | 22,615 | |
Tokyo Electron Ltd. | | | 480 | | | | 96,463 | |
Tokyo Gas Co. Ltd. | | | 1,340 | | | | 32,770 | |
See Notes to Financial Statements.
| | | | | | | | |
| Description | | Shares | | | Value | |
COMMON STOCKS (Continued) | | | | | | | | |
| | |
Japan (cont’d.) | | | | | | | | |
Tokyo Tatemono Co. Ltd. | | | 570 | | | $ | 8,116 | |
Tokyu Corp. | | | 1,500 | | | | 28,363 | |
Tokyu Fudosan Holdings Corp. | | | 2,000 | | | | 13,265 | |
Topcon Corp. | | | 300 | | | | 4,117 | |
Toppan Printing Co. Ltd. | | | 850 | | | | 15,704 | |
Toray Industries, Inc. | | | 4,690 | | | | 33,120 | |
Toshiba Corp. | | | 1,660 | | | | 56,622 | |
Toshiba Plant Systems & Services Corp. | | | 100 | | | | 1,953 | |
Tosoh Corp. | | | 850 | | | | 11,580 | |
TOTO Ltd. | | | 430 | | | | 17,585 | |
Toyo Seikan Group Holdings Ltd. | | | 470 | | | | 7,438 | |
Toyo Suisan Kaisha Ltd. | | | 270 | | | | 11,342 | |
Toyo Tire Corp. | | | 300 | | | | 4,174 | |
Toyobo Co. Ltd. | | | 300 | | | | 4,050 | |
Toyoda Gosei Co. Ltd. | | | 210 | | | | 4,923 | |
Toyota Boshoku Corp. | | | 180 | | | | 2,645 | |
Toyota Industries Corp. | | | 530 | | | | 31,897 | |
Toyota Motor Corp. | | | 7,560 | | | | 524,462 | |
Toyota Tsusho Corp. | | | 660 | | | | 22,834 | |
Trend Micro, Inc. | | | 340 | | | | 17,171 | |
TS Tech Co. Ltd. | | | 180 | | | | 5,764 | |
Tsumura & Co. | | | 180 | | | | 4,959 | |
Tsuruha Holdings, Inc. | | | 70 | | | | 7,866 | |
TV ASAhi Holdings Corp. | | | 100 | | | | 1,577 | |
Ube Industries Ltd. | | | 300 | | | | 6,408 | |
Ulvac, Inc. | | | 100 | | | | 4,361 | |
Unicharm Corp. | | | 1,240 | | | | 41,991 | |
Ushio, Inc. | | | 400 | | | | 5,973 | |
USS Co. Ltd. | | | 700 | | | | 13,555 | |
Wacoal Holdings Corp. | | | 200 | | | | 5,266 | |
Welcia Holdings Co. Ltd. | | | 160 | | | | 9,183 | |
West Japan Railway Co. | | | 560 | | | | 48,624 | |
Yakult Honsha Co. Ltd. | | | 400 | | | | 22,893 | |
Yamada Denki Co. Ltd. | | | 2,600 | | | | 12,536 | |
Yamaguchi Financial Group, Inc. | | | 800 | | | | 5,624 | |
Yamaha Corp. | | | 520 | | | | 24,195 | |
Yamaha Motor Co. Ltd. | | | 900 | | | | 17,612 | |
Yamato Holdings Co. Ltd. | | | 1,130 | | | | 18,914 | �� |
Yamato Kogyo Co. Ltd. | | | 100 | | | | 2,594 | |
Yamazaki Baking Co. Ltd. | | | 400 | | | | 6,830 | |
Yaoko Co. Ltd. | | | 100 | | | | 4,663 | |
Yaskawa Electric Corp. | | | 820 | | | | 31,194 | |
Yokogawa Electric Corp. | | | 800 | | | | 14,658 | |
Yokohama Rubber Co. Ltd. (The) | | | 370 | | | | 8,247 | |
See Notes to Financial Statements.
| | | | |
| PGIM QMA International Developed Markets Index Fund | | | 31 | |
Schedule of Investments(continued)
as of October 31, 2019
| | | | | | | | |
| Description | | Shares | | | Value | |
COMMON STOCKS (Continued) | | | | | | | | |
| | |
Japan (cont’d.) | | | | | | | | |
Z Holdings Corp. | | | 7,800 | | | $ | 23,984 | |
Zenkoku Hosho Co. Ltd. | | | 150 | | | | 6,264 | |
Zensho Holdings Co. Ltd. | | | 300 | | | | 6,338 | |
Zeon Corp. | | | 400 | | | | 4,542 | |
ZOZO, Inc. | | | 590 | | | | 13,728 | |
| | | | | | | | |
| | | | | | | 11,698,268 | |
| | |
Jordan 0.0% | | | | | | | | |
Hikma Pharmaceuticals PLC | | | 449 | | | | 11,703 | |
| | |
Kazakhstan 0.0% | | | | | | | | |
KAZ Minerals PLC | | | 611 | | | | 3,728 | |
| | |
Luxembourg 0.2% | | | | | | | | |
ArcelorMittal | | | 1,856 | | | | 27,426 | |
Eurofins Scientific SE | | | 34 | | | | 17,194 | |
L’Occitane International SA | | | 1,250 | | | | 2,801 | |
RTL Group SA | | | 111 | | | | 5,643 | |
SES SA | | | 1,034 | | | | 19,992 | |
Tenaris SA | | | 1,412 | | | | 14,306 | |
| | | | | | | | |
| | | | | | | 87,362 | |
| | |
Macau 0.2% | | | | | | | | |
Galaxy Entertainment Group Ltd. | | | 6,900 | | | | 47,257 | |
Macau Legend Development Ltd.* | | | 2,000 | | | | 219 | |
MGM China Holdings Ltd. | | | 1,900 | | | | 2,998 | |
Sands China Ltd. | | | 7,200 | | | | 35,300 | |
SJM Holdings Ltd. | | | 5,600 | | | | 5,957 | |
Wynn Macau Ltd. | | | 4,400 | | | | 9,512 | |
| | | | | | | | |
| | | | | | | 101,243 | |
| | |
Malaysia 0.0% | | | | | | | | |
Wing Tai Holdings Ltd. | | | 1,100 | | | | 1,639 | |
| | |
Mexico 0.0% | | | | | | | | |
Fresnillo PLC | | | 493 | | | | 4,552 | |
| | |
Netherlands 3.8% | | | | | | | | |
Aalberts NV | | | 296 | | | | 11,893 | |
ABN AMRO Bank NV, 144A, CVA | | | 1,257 | | | | 23,396 | |
Adyen NV, 144A* | | | 31 | | | | 21,751 | |
See Notes to Financial Statements.
| | | | | | | | |
| Description | | Shares | | | Value | |
COMMON STOCKS (Continued) | | | | | | | | |
| | |
Netherlands (cont’d.) | | | | | | | | |
Aegon NV | | | 5,317 | | | $ | 22,960 | |
Akzo Nobel NV | | | 683 | | | | 62,823 | |
Argenx SE* | | | 105 | | | | 12,796 | |
ASML Holding NV | | | 1,215 | | | | 317,829 | |
ASR Nederland NV | | | 445 | | | | 16,288 | |
Boskalis Westminster | | | 207 | | | | 4,543 | |
Euronext NV, 144A | | | 176 | | | | 14,194 | |
EXOR NV | | | 319 | | | | 24,449 | |
GrandVision NV, 144A | | | 178 | | | | 5,443 | |
Heineken Holding NV | | | 312 | | | | 29,705 | |
Heineken NV | | | 708 | | | | 72,150 | |
ING Groep NV | | | 11,837 | | | | 133,722 | |
Koninklijke Ahold Delhaize NV | | | 3,379 | | | | 84,148 | |
Koninklijke DSM NV | | | 531 | | | | 62,809 | |
Koninklijke KPN NV | | | 10,347 | | | | 32,093 | |
Koninklijke Philips NV | | | 2,758 | | | | 120,749 | |
Koninklijke Vopak NV | | | 193 | | | | 10,590 | |
NN Group NV | | | 1,039 | | | | 39,561 | |
OCI NV* | | | 262 | | | | 5,877 | |
Randstad NV | | | 347 | | | | 19,230 | |
Royal Dutch Shell PLC (Class A Stock) | | | 13,192 | | | | 381,516 | |
Royal Dutch Shell PLC (Class B Stock) | | | 11,380 | | | | 326,901 | |
Signify NV, 144A | | | 354 | | | | 10,347 | |
Takeaway.com NV, 144A* | | | 117 | | | | 9,532 | |
Wolters Kluwer NV | | | 816 | | | | 60,051 | |
| | | | | | | | |
| | | | | | | 1,937,346 | |
| | |
New Zealand 0.3% | | | | | | | | |
a2 Milk Co. Ltd.* | | | 2,287 | | | | 19,029 | |
Air New Zealand Ltd. | | | 1,405 | | | | 2,545 | |
Auckland International Airport Ltd. | | | 2,786 | | | | 16,570 | |
Contact Energy Ltd. | | | 2,071 | | | | 9,795 | |
Fisher & Paykel Healthcare Corp. Ltd. | | | 1,794 | | | | 21,982 | |
Fletcher Building Ltd. | | | 2,568 | | | | 7,530 | |
Kiwi Property Group Ltd. | | | 3,935 | | | | 4,011 | |
Mercury NZ Ltd. | | | 1,871 | | | | 5,941 | |
Meridian Energy Ltd. | | | 3,823 | | | | 11,251 | |
Ryman Healthcare Ltd. | | | 1,288 | | | | 10,649 | |
SKYCITY Entertainment Group Ltd. | | | 1,805 | | | | 4,517 | |
Spark New Zealand Ltd. | | | 5,755 | | | | 16,532 | |
Xero Ltd.* | | | 283 | | | | 13,400 | |
| | | | | | | | |
| | | | | | | 143,752 | |
See Notes to Financial Statements.
| | | | |
| PGIM QMA International Developed Markets Index Fund | | | 33 | |
Schedule of Investments(continued)
as of October 31, 2019
| | | | | | | | |
| Description | | Shares | | | Value | |
COMMON STOCKS (Continued) | | | | | | | | |
| | |
Norway 0.6% | | | | | | | | |
Aker ASA (Class A Stock) | | | 84 | | | $ | 4,464 | |
Aker BP ASA | | | 347 | | | | 9,605 | |
DNB ASA | | | 3,194 | | | | 58,083 | |
Equinor ASA | | | 2,989 | | | | 55,273 | |
Gjensidige Forsikring ASA | | | 517 | | | | 9,654 | |
Leroy Seafood Group ASA | | | 710 | | | | 4,766 | |
Mowi ASA | | | 1,286 | | | | 31,342 | |
Norsk Hydro ASA | | | 4,122 | | | | 14,556 | |
Orkla ASA | | | 2,361 | | | | 22,671 | |
Salmar ASA | | | 143 | | | | 6,665 | |
Schibsted ASA (Class A Stock) | | | 243 | | | | 7,133 | |
Schibsted ASA (Class B Stock) | | | 268 | | | | 7,474 | |
Telenor ASA | | | 2,025 | | | | 37,841 | |
Yara International ASA | | | 513 | | | | 19,936 | |
| | | | | | | | |
| | | | | | | 289,463 | |
| | |
Poland 0.3% | | | | | | | | |
Bank Polska Kasa Opieki SA | | | 475 | | | | 13,403 | |
CD Projekt SA | | | 213 | | | | 14,074 | |
Cyfrowy Polsat SA | | | 718 | | | | 5,204 | |
Dino Polska SA, 144A* | | | 131 | | | | 5,112 | |
Grupa Lotos SA | | | 275 | | | | 6,864 | |
KGHM Polska Miedz SA | | | 428 | | | | 9,380 | |
LPP SA | | | 3 | | | | 6,403 | |
mBank SA* | | | 35 | | | | 3,497 | |
PGE Polska Grupa Energetyczna SA* | | | 1,951 | | | | 4,186 | |
Polski Koncern Naftowy ORLEN SA | | | 971 | | | | 26,545 | |
Polskie Gornictwo Naftowe i Gazownictwo SA | | | 5,784 | | | | 7,131 | |
Powszechna Kasa Oszczednosci Bank Polski SA | | | 2,513 | | | | 25,088 | |
Powszechny Zaklad Ubezpieczen SA | | | 1,648 | | | | 15,939 | |
Santander Bank Polska SA | | | 83 | | | | 6,799 | |
| | | | | | | | |
| | | | | | | 149,625 | |
| | |
Portugal 0.1% | | | | | | | | |
EDP - Energias de Portugal SA | | | 6,847 | | | | 28,173 | |
Galp Energia SGPS SA | | | 1,608 | | | | 25,654 | |
Jeronimo Martins SGPS SA | | | 774 | | | | 12,989 | |
| | | | | | | | |
| | | | | | | 66,816 | |
See Notes to Financial Statements.
| | | | | | | | |
| Description | | Shares | | | Value | |
COMMON STOCKS (Continued) | | | | | | | | |
| | |
Russia 0.0% | | | | | | | | |
Evraz PLC | | | 1,526 | | | $ | 7,283 | |
Polymetal International PLC | | | 899 | | | | 14,738 | |
| | | | | | | | |
| | | | | | | 22,021 | |
| | |
Singapore 1.2% | | | | | | | | |
Ascendas Real Estate Investment Trust, REIT | | | 7,600 | | | | 17,691 | |
BOC Aviation Ltd., 144A | | | 600 | | | | 5,642 | |
CapitaLand Commercial Trust, REIT | | | 7,697 | | | | 11,579 | |
CapitaLand Ltd. | | | 7,800 | | | | 20,610 | |
CapitaLand Mall Trust, REIT | | | 7,300 | | | | 13,610 | |
City Developments Ltd. | | | 1,400 | | | | 11,083 | |
ComfortDelGro Corp. Ltd. | | | 6,400 | | | | 10,799 | |
DBS Group Holdings Ltd. | | | 5,432 | | | | 103,539 | |
Frasers Property Ltd. | | | 900 | | | | 1,218 | |
Genting Singapore Ltd. | | | 16,600 | | | | 11,450 | |
Golden Agri-Resources Ltd. | | | 17,800 | | | | 2,678 | |
Jardine Cycle & Carriage Ltd. | | | 290 | | | | 6,962 | |
Keppel Corp. Ltd. | | | 4,400 | | | | 22,114 | |
Keppel REIT | | | 5,400 | | | | 4,802 | |
Mapletree Commercial Trust, REIT | | | 6,400 | | | | 10,950 | |
Mapletree Industrial Trust, REIT | | | 4,300 | | | | 8,055 | |
Mapletree Logistics Trust, REIT | | | 8,200 | | | | 10,113 | |
Mapletree North Asia Commercial Trust, REIT | | | 5,800 | | | | 5,457 | |
Olam International Ltd. | | | 2,400 | | | | 3,223 | |
Oversea-Chinese Banking Corp. Ltd. | | | 10,273 | | | | 82,635 | |
SATS Ltd. | | | 2,100 | | | | 7,779 | |
Sembcorp Industries Ltd. | | | 2,500 | | | | 4,195 | |
Sembcorp Marine Ltd. | | | 1,800 | | | | 1,808 | |
SIA Engineering Co. Ltd. | | | 600 | | | | 1,177 | |
Singapore Airlines Ltd. | | | 1,500 | | | | 10,366 | |
Singapore Exchange Ltd. | | | 2,600 | | | | 17,075 | |
Singapore Post Ltd. | | | 4,200 | | | | 2,959 | |
Singapore Press Holdings Ltd. | | | 4,300 | | | | 7,005 | |
Singapore Technologies Engineering Ltd. | | | 4,500 | | | | 13,173 | |
Singapore Telecommunications Ltd. | | | 22,300 | | | | 53,982 | |
StarHub Ltd. | | | 1,200 | | | | 1,145 | |
Suntec Real Estate Investment Trust, REIT | | | 6,200 | | | | 8,470 | |
United Overseas Bank Ltd. | | | 3,857 | | | | 75,821 | |
UOL Group Ltd. | | | 1,500 | | | | 8,588 | |
Venture Corp. Ltd. | | | 800 | | | | 9,263 | |
Wilmar International Ltd. | | | 5,700 | | | | 15,666 | |
| | | | | | | | |
| | | | | | | 602,682 | |
See Notes to Financial Statements.
| | | | |
| PGIM QMA International Developed Markets Index Fund | | | 35 | |
Schedule of Investments(continued)
as of October 31, 2019
| | | | | | | | |
| Description | | Shares | | | Value | |
COMMON STOCKS (Continued) | | | | | | | | |
| | |
South Africa 0.2% | | | | | | | | |
Anglo American PLC | | | 3,779 | | | $ | 97,320 | |
Investec PLC | | | 1,927 | | | | 10,936 | |
| | | | | | | | |
| | | | | | | 108,256 | |
| | |
South Korea 3.8% | | | | | | | | |
Amorepacific Corp. | | | 98 | | | | 16,114 | |
AMOREPACIFIC Group | | | 80 | | | | 5,799 | |
BGF Co. Ltd. | | | 232 | | | | 1,142 | |
BGF retail Co. Ltd. | | | 17 | | | | 2,597 | |
BNK Financial Group, Inc. | | | 773 | | | | 4,606 | |
Celltrion Healthcare Co. Ltd.* | | | 202 | | | | 9,516 | |
Celltrion, Inc.* | | | 296 | | | | 50,638 | |
Cheil Worldwide, Inc. | | | 191 | | | | 4,063 | |
CJ CheilJedang Corp. | | | 21 | | | | 4,113 | |
CJ Corp. | | | 34 | | | | 2,403 | |
CJ ENM Co. Ltd. | | | 27 | | | | 3,809 | |
CJ Logistics Corp.* | | | 20 | | | | 2,703 | |
Daelim Industrial Co. Ltd. | | | 74 | | | | 5,780 | |
Daewoo Engineering & Construction Co. Ltd.* | | | 483 | | | | 1,801 | |
Daewoo Shipbuilding & Marine Engineering Co. Ltd. | | | 130 | | | | 3,122 | |
DB Insurance Co. Ltd. | | | 156 | | | | 6,756 | |
DGB Financial Group, Inc. | | | 416 | | | | 2,510 | |
Dongsuh Cos., Inc. | | | 96 | | | | 1,435 | |
Doosan Bobcat, Inc. | | | 66 | | | | 1,778 | |
Doosan Co. Ltd. | | | 18 | | | | 1,202 | |
Doosan Fuel Cell Co. Ltd.* | | | 60 | | | | 398 | |
Doosan Heavy Industries & Construction Co. Ltd. | | | 302 | | | | 1,589 | |
Doosan Infracore Co. Ltd.* | | | 367 | | | | 1,777 | |
Doosan Solus Co. Ltd.* | | | 33 | | | | 505 | |
E-MART, Inc. | | | 62 | | | | 5,917 | |
Fila Korea Ltd. | | | 144 | | | | 7,090 | |
GS Engineering & Construction Corp. | | | 152 | | | | 4,022 | |
GS Holdings Corp. | | | 136 | | | | 5,778 | |
GS Retail Co. Ltd. | | | 72 | | | | 2,365 | |
Hana Financial Group, Inc. | | | 882 | | | | 25,499 | |
Hankook Tire & Technology Co. Ltd. | | | 235 | | | | 6,256 | |
Hanmi Pharm Co. Ltd. | | | 19 | | | | 5,425 | |
Hanmi Science Co. Ltd. | | | 36 | | | | 1,344 | |
Hanon Systems | | | 554 | | | | 5,513 | |
Hanssem Co. Ltd. | | | 27 | | | | 1,464 | |
Hanwha Aerospace Co. Ltd. | | | 98 | | | | 3,180 | |
Hanwha Chemical Corp. | | | 219 | | | | 3,050 | |
Hanwha Corp. | | | 134 | | | | 2,718 | |
Hanwha Life Insurance Co. Ltd. | | | 647 | | | | 1,236 | |
See Notes to Financial Statements.
| | | | | | | | |
| Description | | Shares | | | Value | |
COMMON STOCKS (Continued) | | | | | | | | |
| | |
South Korea (cont’d.) | | | | | | | | |
HDC Holdings Co. Ltd. | | | 168 | | | $ | 1,705 | |
HDC Hyundai DevelopmentCo-Engineering & Construction (Class E Stock) | | | 83 | | | | 2,204 | |
Helixmith Co. Ltd.* | | | 61 | | | | 5,060 | |
Hite Jinro Co. Ltd. | | | 102 | | | | 2,489 | |
HLB, Inc.* | | | 96 | | | | 13,770 | |
Hotel Shilla Co. Ltd. | | | 109 | | | | 7,237 | |
Hyundai Construction Equipment Co. Ltd. | | | 40 | | | | 956 | |
Hyundai Department Store Co. Ltd. | | | 42 | | | | 2,658 | |
Hyundai Engineering & Construction Co. Ltd. | | | 231 | | | | 8,496 | |
Hyundai Glovis Co. Ltd. | | | 63 | | | | 8,153 | |
Hyundai Heavy Industries Holdings Co. Ltd. | | | 33 | | | | 9,655 | |
Hyundai Marine & Fire Insurance Co. Ltd. | | | 164 | | | | 3,552 | |
Hyundai Mipo Dockyard Co. Ltd. | | | 55 | | | | 2,046 | |
Hyundai Mobis Co. Ltd. | | | 197 | | | | 39,994 | |
Hyundai Motor Co. | | | 423 | | | | 44,201 | |
Hyundai Steel Co. | | | 255 | | | | 6,930 | |
Hyundai Wia Corp. | | | 47 | | | | 2,059 | |
Industrial Bank of Korea | | | 840 | | | | 8,501 | |
Kakao Corp. | | | 159 | | | | 19,307 | |
Kangwon Land, Inc. | | | 349 | | | | 9,398 | |
KB Financial Group, Inc. | | | 1,198 | | | | 42,941 | |
KCC Corp. | | | 15 | | | | 2,903 | |
KEPCO Plant Service & Engineering Co. Ltd. | | | 58 | | | | 1,623 | |
Kia Motors Corp. | | | 760 | | | | 27,716 | |
Korea Aerospace Industries Ltd. | | | 209 | | | | 6,818 | |
Korea Electric Power Corp. | | | 819 | | | | 17,871 | |
Korea Gas Corp. | | | 70 | | | | 2,362 | |
Korea Investment Holdings Co. Ltd. | | | 120 | | | | 6,946 | |
Korea Shipbuilding & Offshore Engineering Co. Ltd.* | | | 127 | | | | 13,197 | |
Korea Zinc Co. Ltd. | | | 30 | | | | 11,189 | |
Korean Air Lines Co. Ltd. | | | 128 | | | | 2,729 | |
KT&G Corp. | | | 330 | | | | 28,331 | |
Kumho Petrochemical Co. Ltd. | | | 48 | | | | 2,869 | |
LG Chem Ltd. | | | 137 | | | | 35,952 | |
LG Corp. | | | 278 | | | | 16,542 | |
LG Display Co. Ltd. | | | 683 | | | | 7,997 | |
LG Electronics, Inc. | | | 322 | | | | 18,448 | |
LG Household & Health Care Ltd. | | | 27 | | | | 29,200 | |
LG Uplus Corp. | | | 671 | | | | 7,744 | |
Lotte Chemical Corp. | | | 45 | | | | 8,699 | |
Lotte Chilsung Beverage Co. Ltd. | | | 10 | | | | 1,176 | |
Lotte Corp. | | | 157 | | | | 4,905 | |
LOTTE Fine Chemical Co. Ltd. | | | 48 | | | | 1,818 | |
See Notes to Financial Statements.
| | | | |
| PGIM QMA International Developed Markets Index Fund | | | 37 | |
Schedule of Investments(continued)
as of October 31, 2019
| | | | | | | | |
| Description | | Shares | | | Value | |
COMMON STOCKS (Continued) | | | | | | | | |
| | |
South Korea (cont’d.) | | | | | | | | |
Lotte Shopping Co. Ltd. | | | 30 | | | $ | 3,194 | |
LS Corp. | | | 37 | | | | 1,537 | |
Mando Corp. | | | 90 | | | | 2,759 | |
Medy-Tox, Inc. | | | 11 | | | | 3,110 | |
Mirae Asset Daewoo Co. Ltd. | | | 1,205 | | | | 7,355 | |
NAVER Corp. | | | 399 | | | | 56,087 | |
NCSoft Corp. | | | 51 | | | | 22,587 | |
Netmarble Corp., 144A | | | 47 | | | | 3,623 | |
NH Investment & Securities Co. Ltd. | | | 343 | | | | 3,549 | |
NHN Corp.* | | | 27 | | | | 1,337 | |
NongShim Co. Ltd. | | | 9 | | | | 1,869 | |
OCI Co. Ltd. | | | 48 | | | | 2,581 | |
Orion Corp. | | | 58 | | | | 5,275 | |
Ottogi Corp. | | | 4 | | | | 1,941 | |
Paradise Co. Ltd. | | | 124 | | | | 1,981 | |
POSCO | | | 205 | | | | 37,062 | |
POSCO Chemical Co. Ltd. | | | 57 | | | | 2,347 | |
Posco International Corp. | | | 122 | | | | 1,906 | |
S-1 Corp. | | | 50 | | | | 4,025 | |
Samsung Biologics Co. Ltd., 144A* | | | 43 | | | | 14,667 | |
Samsung C&T Corp. | | | 252 | | | | 21,598 | |
Samsung Card Co. Ltd. | | | 83 | | | | 2,391 | |
Samsung Electro-Mechanics Co. Ltd. | | | 178 | | | | 17,189 | |
Samsung Electronics Co. Ltd. | | | 14,268 | | | | 614,110 | |
Samsung Engineering Co. Ltd.* | | | 458 | | | | 6,978 | |
Samsung Fire & Marine Insurance Co. Ltd. | | | 98 | | | | 18,199 | |
Samsung Heavy Industries Co. Ltd. | | | 1,451 | | | | 8,993 | |
Samsung Life Insurance Co. Ltd. | | | 195 | | | | 11,796 | |
Samsung SDI Co. Ltd. | | | 158 | | | | 30,677 | |
Samsung SDS Co. Ltd. | | | 92 | | | | 15,894 | |
Samsung Securities Co. Ltd. | | | 167 | | | | 4,794 | |
Shinhan Financial Group Co. Ltd. | | | 1,395 | | | | 50,818 | |
Shinsegae, Inc. | | | 18 | | | | 3,643 | |
SillaJen, Inc.* | | | 138 | | | | 2,269 | |
SK Holdings Co. Ltd. | | | 98 | | | | 21,710 | |
SK Hynix, Inc. | | | 1,571 | | | | 109,465 | |
SK Innovation Co. Ltd. | | | 169 | | | | 23,135 | |
SK Networks Co. Ltd. | | | 404 | | | | 2,011 | |
SK Telecom Co. Ltd. | | | 68 | | | | 13,862 | |
SKC Co. Ltd. | | | 52 | | | | 1,974 | |
S-Oil Corp. | | | 121 | | | | 10,312 | |
Ssangyong Cement Industrial Co. Ltd. | | | 296 | | | | 1,486 | |
Woongjin Coway Co. Ltd. | | | 170 | | | | 13,415 | |
See Notes to Financial Statements.
| | | | | | | | |
| Description | | Shares | | | Value | |
COMMON STOCKS (Continued) | | | | | | | | |
| | |
South Korea (cont’d.) | | | | | | | | |
Woori Financial Group, Inc. | | | 1,670 | | | $ | 16,812 | |
Yuhan Corp. | | | 24 | | | | 4,609 | |
| | | | | | | | |
| | | | | | | 1,922,292 | |
| | |
Spain 2.5% | | | | | | | | |
Acciona SA | | | 66 | | | | 6,873 | |
ACS Actividades de Construccion y Servicios SA | | | 758 | | | | 30,781 | |
Aena SME SA, 144A | | | 213 | | | | 39,061 | |
Amadeus IT Group SA | | | 1,241 | | | | 91,802 | |
Banco Bilbao Vizcaya Argentaria SA | | | 20,080 | | | | 105,647 | |
Banco de Sabadell SA | | | 17,420 | | | | 19,091 | |
Banco Santander SA | | | 49,884 | | | | 200,200 | |
Bankia SA | | | 3,609 | | | | 6,869 | |
Bankinter SA | | | 1,967 | | | | 13,598 | |
CaixaBank SA | | | 10,629 | | | | 30,380 | |
Cellnex Telecom SA, 144A* | | | 957 | | | | 41,251 | |
Corp. Financiera Alba SA | | | 52 | | | | 2,593 | |
EDP Renovaveis SA | | | 446 | | | | 5,076 | |
Enagas SA | | | 680 | | | | 16,821 | |
Endesa SA | | | 927 | | | | 25,220 | |
Ferrovial SA | | | 1,432 | | | | 42,223 | |
Fomento de Construcciones y Contratas SA | | | 171 | | | | 2,065 | |
Grifols SA | | | 979 | | | | 31,569 | |
Iberdrola SA | | | 18,499 | | | | 189,904 | |
Industria de Diseno Textil SA | | | 3,190 | | | | 99,387 | |
Inmobiliaria Colonial Socimi SA, REIT | | | 1,032 | | | | 13,319 | |
Mapfre SA | | | 3,145 | | | | 8,762 | |
Merlin Properties Socimi SA, REIT | | | 1,059 | | | | 15,590 | |
Naturgy Energy Group SA | | | 970 | | | | 26,408 | |
Red Electrica Corp. SA | | | 1,270 | | | | 25,569 | |
Repsol SA | | | 4,170 | | | | 68,382 | |
Siemens Gamesa Renewable Energy SA | | | 729 | | | | 10,011 | |
Telefonica SA | | | 13,778 | | | | 105,636 | |
Zardoya Otis SA | | | 529 | | | | 4,004 | |
| | | | | | | | |
| | | | | | | 1,278,092 | |
| | |
Sweden 2.3% | | | | | | | | |
Alfa Laval AB | | | 970 | | | | 22,399 | |
Assa Abloy AB (Class B Stock) | | | 2,764 | | | | 65,528 | |
Atlas Copco AB (Class A Stock) | | | 1,929 | | | | 68,020 | |
Atlas Copco AB (Class B Stock) | | | 1,155 | | | | 35,742 | |
Axis Communications AB^ | | | 40 | | | | 1,497 | |
Boliden AB | | | 888 | | | | 23,867 | |
See Notes to Financial Statements.
| | | | |
| PGIM QMA International Developed Markets Index Fund | | | 39 | |
Schedule of Investments(continued)
as of October 31, 2019
| | | | | | | | |
| Description | | Shares | | | Value | |
COMMON STOCKS (Continued) | | | | | | | | |
| | |
Sweden (cont’d.) | | | | | | | | |
Castellum AB | | | 792 | | | $ | 16,177 | |
Electrolux AB (Class B Stock) | | | 764 | | | | 20,038 | |
Elekta AB (Class B Stock) | | | 1,045 | | | | 14,560 | |
Epiroc AB (Class A Stock) | | | 1,808 | | | | 20,311 | |
Epiroc AB (Class B Stock) | | | 1,160 | | | | 12,590 | |
Essity AB (Class B Stock) | | | 1,827 | | | | 56,966 | |
Fastighets AB Balder (Class B Stock)* | | | 279 | | | | 10,813 | |
Hennes & Mauritz AB (Class B Stock) | | | 2,679 | | | | 55,974 | |
Hexagon AB (Class B Stock) | | | 774 | | | | 39,453 | |
Husqvarna AB (Class B Stock) | | | 1,150 | | | | 8,792 | |
ICA Gruppen AB | | | 235 | | | | 10,380 | |
Industrivarden AB (Class A Stock) | | | 633 | | | | 13,985 | |
Industrivarden AB (Class C Stock) | | | 522 | | | | 11,290 | |
Investment AB Latour (Class B Stock) | | | 312 | | | | 4,217 | |
Investor AB (Class A Stock) | | | 400 | | | | 20,134 | |
Investor AB (Class B Stock) | | | 1,362 | | | | 69,728 | |
Kinnevik AB (Class B Stock) | | | 697 | | | | 19,079 | |
L E Lundbergforetagen AB (Class B Stock) | | | 239 | | | | 8,996 | |
Lundin Petroleum AB | | | 552 | | | | 18,245 | |
Nibe Industrier AB (Class B Stock) | | | 870 | | | | 11,882 | |
Saab AB (Class B Stock) | | | 260 | | | | 8,016 | |
Sandvik AB | | | 3,269 | | | | 57,568 | |
Securitas AB (Class B Stock) | | | 895 | | | | 14,312 | |
Skandinaviska Enskilda Banken AB (Class A Stock) | | | 4,330 | | | | 41,483 | |
Skanska AB (Class B Stock) | | | 1,096 | | | | 23,327 | |
SKF AB (Class B Stock) | | | 1,204 | | | | 21,723 | |
Svenska Cellulosa AB SCA (Class A Stock) | | | 107 | | | | 1,131 | |
Svenska Cellulosa AB SCA (Class B Stock) | | | 1,889 | | | | 19,240 | |
Svenska Handelsbanken AB (Class A Stock) | | | 4,399 | | | | 44,031 | |
Svenska Handelsbanken AB (Class B Stock) | | | 150 | | | | 1,506 | |
Swedbank AB (Class A Stock) | | | 3,034 | | | | 42,405 | |
Swedish Match AB | | | 508 | | | | 23,844 | |
Swedish Orphan Biovitrum AB* | | | 487 | | | | 7,704 | |
Tele2 AB (Class B Stock) | | | 1,585 | | | | 22,651 | |
Telefonaktiebolaget LM Ericsson (Class A Stock) | | | 104 | | | | 905 | |
Telefonaktiebolaget LM Ericsson (Class B Stock) | | | 8,988 | | | | 78,388 | |
Telia Co. AB | | | 8,123 | | | | 35,697 | |
Trelleborg AB (Class B Stock) | | | 800 | | | | 12,926 | |
Volvo AB (Class B Stock) | | | 4,513 | | | | 67,390 | |
| | | | | | | | |
| | | | | | | 1,184,910 | |
| | |
Switzerland 8.3% | | | | | | | | |
ABB Ltd. | | | 5,452 | | | | 114,405 | |
Adecco Group AG | | | 470 | | | | 27,848 | |
See Notes to Financial Statements.
| | | | | | | | |
| Description | | Shares | | | Value | |
COMMON STOCKS (Continued) | | | | | | | | |
| | |
Switzerland (cont’d.) | | | | | | | | |
Alcon, Inc.* | | | 1,417 | | | $ | 83,701 | |
Baloise Holding AG | | | 143 | | | | 26,384 | |
Banque Cantonale Vaudoise | | | 10 | | | | 7,845 | |
Barry Callebaut AG | | | 7 | | | | 14,752 | |
Chocoladefabriken Lindt & Spruengli AG | | | 4 | | | | 29,687 | |
Cie Financiere Richemont SA | | | 1,543 | | | | 121,525 | |
Clariant AG* | | | 685 | | | | 14,018 | |
Coca-Cola HBC AG* | | | 602 | | | | 18,327 | |
Credit Suisse Group AG | | | 7,713 | | | | 95,763 | |
DKSH Holding AG | | | 126 | | | | 5,981 | |
Dufry AG* | | | 92 | | | | 7,977 | |
EMS-Chemie Holding AG | | | 21 | | | | 13,125 | |
Flughafen Zurich AG | | | 59 | | | | 10,635 | |
Geberit AG | | | 109 | | | | 55,255 | |
Georg Fischer AG | | | 14 | | | | 13,347 | |
Givaudan SA | | | 28 | | | | 82,201 | |
Glencore PLC | | | 33,545 | | | | 101,179 | |
Helvetia Holding AG | | | 108 | | | | 15,156 | |
Julius Baer Group Ltd.* | | | 692 | | | | 30,517 | |
Kuehne + Nagel International AG | | | 154 | | | | 24,889 | |
LafargeHolcim Ltd. | | | 1,511 | | | | 77,899 | |
Logitech International SA | | | 471 | | | | 19,277 | |
Lonza Group AG | | | 226 | | | | 81,267 | |
Nestle SA | | | 8,827 | | | | 942,057 | |
Novartis AG | | | 6,576 | | | | 573,262 | |
OC Oerlikon Corp. AG | | | 574 | | | | 5,877 | |
Pargesa Holding SA | | | 117 | | | | 9,231 | |
Partners Group Holding AG | | | 50 | | | | 38,975 | |
PSP Swiss Property AG | | | 129 | | | | 17,068 | |
Roche Holding AG | | | 2,110 | | | | 635,145 | |
Roche Holding AG (XBRN) | | | 85 | | | | 25,302 | |
Schindler Holding AG | | | 62 | | | | 14,649 | |
Schindler Holding AG, (PART CERT) | | | 128 | | | | 31,296 | |
SGS SA | | | 16 | | | | 41,656 | |
Sika AG | | | 427 | | | | 73,338 | |
Sonova Holding AG | | | 167 | | | | 38,207 | |
STMicroelectronics NV | | | 1,960 | | | | 44,537 | |
Straumann Holding AG | | | 30 | | | | 26,787 | |
Sulzer AG | | | 31 | | | | 3,133 | |
Swatch Group AG (The), (SWX) | | | 135 | | | | 7,246 | |
Swatch Group AG (The), (XEQT) | | | 91 | | | | 25,181 | |
Swiss Life Holding AG | | | 105 | | | | 52,503 | |
Swiss Prime Site AG* | | | 234 | | | | 24,102 | |
Swiss Re AG | | | 904 | | | | 94,646 | |
See Notes to Financial Statements.
| | | | |
| PGIM QMA International Developed Markets Index Fund | | | 41 | |
Schedule of Investments(continued)
as of October 31, 2019
| | | | | | | | |
| Description | | Shares | | | Value | |
COMMON STOCKS (Continued) | | | | | | | | |
| | |
Switzerland (cont’d.) | | | | | | | | |
Swisscom AG | | | 79 | | | $ | 40,363 | |
Temenos AG* | | | 182 | | | | 25,983 | |
UBS Group AG | | | 10,452 | | | | 123,071 | |
Vifor Pharma AG | | | 138 | | | | 21,671 | |
Zurich Insurance Group AG | | | 446 | | | | 174,195 | |
| | | | | | | | |
| | | | | | | 4,202,441 | |
| | |
Taiwan 0.0% | | | | | | | | |
FIT Hon Teng Ltd., 144A | | | 3,000 | | | | 1,216 | |
| | |
United Arab Emirates 0.0% | | | | | | | | |
NMC Health PLC | | | 238 | | | | 6,736 | |
| | |
United Kingdom 12.6% | | | | | | | | |
3i Group PLC | | | 2,932 | | | | 42,852 | |
Admiral Group PLC | | | 662 | | | | 17,325 | |
Ashmore Group PLC | | | 1,268 | | | | 7,656 | |
Ashtead Group PLC | | | 1,434 | | | | 43,644 | |
Associated British Foods PLC | | | 1,072 | | | | 30,931 | |
AstraZeneca PLC | | | 3,985 | | | | 387,681 | |
Auto Trader Group PLC, 144A | | | 2,686 | | | | 19,561 | |
AVEVA Group PLC | | | 207 | | | | 11,212 | |
Aviva PLC | | | 11,856 | | | | 63,868 | |
B&M European Value Retail SA | | | 2,496 | | | | 11,989 | |
Babcock International Group PLC | | | 745 | | | | 5,348 | |
BAE Systems PLC | | | 9,648 | | | | 72,058 | |
Barclays PLC | | | 52,182 | | | | 113,412 | |
Barratt Developments PLC | | | 3,086 | | | | 25,268 | |
Bellway PLC | | | 361 | | | | 14,794 | |
Berkeley Group Holdings PLC | | | 377 | | | | 21,509 | |
BP PLC | | | 60,480 | | | | 383,229 | |
British American Tobacco PLC | | | 6,930 | | | | 242,846 | |
British Land Co. PLC (The), REIT | | | 2,885 | | | | 23,220 | |
BT Group PLC | | | 26,388 | | | | 69,965 | |
Bunzl PLC | | | 1,027 | | | | 26,748 | |
Burberry Group PLC | | | 1,209 | | | | 32,047 | |
Centrica PLC | | | 16,974 | | | | 15,942 | |
Cineworld Group PLC | | | 3,160 | | | | 9,130 | |
CK Hutchison Holdings Ltd. | | | 8,100 | | | | 74,472 | |
CNH Industrial NV | | | 2,970 | | | | 32,341 | |
Cobham PLC | | | 7,374 | | | | 15,086 | |
Compass Group PLC | | | 4,776 | | | | 127,290 | |
ConvaTec Group PLC, 144A | | | 4,437 | | | | 11,338 | |
See Notes to Financial Statements.
| | | | | | | | |
| Description | | Shares | | | Value | |
COMMON STOCKS (Continued) | | | | | | | | |
| | |
United Kingdom (cont’d.) | | | | | | | | |
Croda International PLC | | | 393 | | | $ | 24,548 | |
DCC PLC | | | 293 | | | | 27,498 | |
Derwent London PLC, REIT | | | 294 | | | | 13,522 | |
Diageo PLC | | | 7,092 | | | | 289,752 | |
Direct Line Insurance Group PLC | | | 4,249 | | | | 15,000 | |
DS Smith PLC | | | 4,020 | | | | 18,644 | |
easyJet PLC | | | 569 | | | | 9,124 | |
Experian PLC | | | 2,771 | | | | 87,152 | |
Fiat Chrysler Automobiles NV | | | 3,319 | | | | 51,108 | |
G4S PLC | | | 4,699 | | | | 12,606 | |
GlaxoSmithKline PLC | | | 14,880 | | | | 340,221 | |
GVC Holdings PLC | | | 1,745 | | | | 20,160 | |
Halma PLC | | | 1,157 | | | | 28,099 | |
Hargreaves Lansdown PLC | | | 853 | | | | 19,537 | |
Hiscox Ltd. | | | 844 | | | | 16,282 | |
Howden Joinery Group PLC | | | 1,779 | | | | 13,310 | |
HSBC Holdings PLC | | | 61,477 | | | | 464,419 | |
IMI PLC | | | 821 | | | | 10,675 | |
Imperial Brands PLC | | | 2,864 | | | | 62,836 | |
Inchcape PLC | | | 1,239 | | | | 10,360 | |
Informa PLC | | | 3,758 | | | | 37,755 | |
InterContinental Hotels Group PLC | | | 551 | | | | 33,241 | |
International Consolidated Airlines Group SA | | | 2,812 | | | | 19,359 | |
Intertek Group PLC | | | 483 | | | | 33,448 | |
ITV PLC | | | 11,825 | | | | 20,506 | |
J Sainsbury PLC | | | 5,146 | | | | 13,566 | |
JD Sports Fashion PLC | | | 1,209 | | | | 12,057 | |
John Wood Group PLC | | | 1,881 | | | | 8,260 | |
Johnson Matthey PLC | | | 558 | | | | 22,213 | |
Just Eat PLC* | | | 1,662 | | | | 15,841 | |
Kingfisher PLC | | | 6,498 | | | | 17,447 | |
Land Securities Group PLC, REIT | | | 2,173 | | | | 26,475 | |
Legal & General Group PLC | | | 18,122 | | | | 61,963 | |
Lloyds Banking Group PLC | | | 214,436 | | | | 158,206 | |
London Stock Exchange Group PLC | | | 946 | | | | 85,315 | |
M&G PLC* | | | 7,853 | | | | 21,749 | |
Marks & Spencer Group PLC | | | 5,553 | | | | 13,066 | |
Meggitt PLC | | | 2,249 | | | | 18,206 | |
Melrose Industries PLC | | | 14,606 | | | | 40,388 | |
Merlin Entertainments PLC, 144A | | | 2,114 | | | | 12,457 | |
Micro Focus International PLC | | | 968 | | | | 13,284 | |
Mondi PLC | | | 1,618 | | | | 33,507 | |
National Grid PLC | | | 10,495 | | | | 122,409 | |
Next PLC | | | 406 | | | | 34,614 | |
See Notes to Financial Statements.
| | | | |
| PGIM QMA International Developed Markets Index Fund | | | 43 | |
Schedule of Investments(continued)
as of October 31, 2019
| | | | | | | | |
| Description | | Shares | | | Value | |
COMMON STOCKS (Continued) | | | | | | | | |
| | |
United Kingdom (cont’d.) | | | | | | | | |
Ocado Group PLC* | | | 1,358 | | | $ | 23,380 | |
Pearson PLC | | | 2,299 | | | | 20,308 | |
Pennon Group PLC | | | 1,268 | | | | 14,753 | |
Persimmon PLC | | | 957 | | | | 28,241 | |
Phoenix Group Holdings PLC | | | 1,818 | | | | 16,610 | |
Prudential PLC | | | 7,853 | | | | 137,402 | |
Quilter PLC, 144A | | | 6,039 | | | | 10,726 | |
Reckitt Benckiser Group PLC | | | 1,908 | | | | 147,294 | |
RELX PLC | | | 5,706 | | | | 137,148 | |
Renishaw PLC | | | 91 | | | | 4,461 | |
Rentokil Initial PLC | | | 5,528 | | | | 32,592 | |
Rightmove PLC | | | 2,596 | | | | 20,144 | |
Rolls-Royce Holdings PLC | | | 5,185 | | | | 47,593 | |
Rolls-Royce Holdings PLC | | | 238,510 | | | | 309 | |
Royal Bank of Scotland Group PLC | | | 14,032 | | | | 38,671 | |
RSA Insurance Group PLC | | | 3,383 | | | | 22,897 | |
Sage Group PLC (The) | | | 3,211 | | | | 29,956 | |
Schroders PLC | | | 365 | | | | 14,625 | |
Segro PLC, REIT | | | 3,272 | | | | 35,792 | |
Severn Trent PLC | | | 739 | | | | 21,579 | |
Smith & Nephew PLC | | | 2,664 | | | | 57,248 | |
Smiths Group PLC | | | 1,203 | | | | 25,168 | |
Spirax-Sarco Engineering PLC | | | 225 | | | | 23,113 | |
SSE PLC | | | 3,120 | | | | 51,876 | |
St. James’s Place PLC | | | 1,539 | | | | 20,768 | |
Standard Chartered PLC | | | 8,281 | | | | 75,121 | |
Standard Life Aberdeen PLC | | | 7,122 | | | | 28,013 | |
Subsea 7 SA | | | 749 | | | | 7,006 | |
Tate & Lyle PLC | | | 1,380 | | | | 12,025 | |
Taylor Wimpey PLC | | | 9,642 | | | | 20,701 | |
TechnipFMC PLC | | | 1,355 | | | | 26,781 | |
Tesco PLC | | | 29,157 | | | | 88,842 | |
Travis Perkins PLC | | | 820 | | | | 15,223 | |
Unilever NV | | | 4,406 | | | | 260,715 | |
Unilever PLC | | | 3,323 | | | | 199,124 | |
United Utilities Group PLC | | | 2,031 | | | | 22,905 | |
Virgin Money UK PLC | | | 4,178 | | | | 7,466 | |
Vodafone Group PLC | | | 81,498 | | | | 166,109 | |
Weir Group PLC (The) | | | 832 | | | | 14,530 | |
Whitbread PLC | | | 529 | | | | 27,823 | |
Wm Morrison Supermarkets PLC | | | 6,618 | | | | 17,053 | |
WPP PLC | | | 3,714 | | | | 46,436 | |
| | | | | | | | |
| | | | | | | 6,381,474 | |
See Notes to Financial Statements.
| | | | | | | | |
| Description | | Shares | | | Value | |
COMMON STOCKS (Continued) | | | | | | | | |
| | |
United States 0.4% | | | | | | | | |
Amcor PLC | | | 4,915 | | | $ | 47,041 | |
Carnival PLC | | | 472 | | | | 18,861 | |
Ferguson PLC | | | 691 | | | | 59,004 | |
James Hardie Industries PLC | | | 1,374 | | | | 23,482 | |
QIAGEN NV* | | | 640 | | | | 19,179 | |
Samsonite International SA, 144A | | | 3,900 | | | | 8,005 | |
Sims Metal Management Ltd. | | | 452 | | | | 2,902 | |
| | | | | | | | |
| | | | | | | 178,474 | |
| | | | | | | | |
TOTAL COMMON STOCKS
(cost $44,093,806) | | | | | | | 47,242,968 | |
| | | | | | | | |
| | |
EXCHANGE-TRADED FUND 2.3% | | | | | | | | |
| | |
United States | | | | | | | | |
iShares MSCI EAFE ETF
(cost $1,042,878) | | | 17,300 | | | | 1,166,366 | |
| | | | | | | | |
| | |
PREFERRED STOCKS 0.7% | | | | | | | | |
| | |
Germany 0.5% | | | | | | | | |
Bayerische Motoren Werke AG (PRFC) | | | 187 | | | | 11,521 | |
FUCHS PETROLUB SE (PRFC) | | | 200 | | | | 8,531 | |
Henkel AG & Co. KGaA (PRFC) | | | 541 | | | | 56,131 | |
Porsche Automobil Holding SE (PRFC) | | | 477 | | | | 35,058 | |
Sartorius AG (PRFC) | | | 108 | | | | 20,969 | |
Volkswagen AG (PRFC) | | | 556 | | | | 105,615 | |
| | | | | | | | |
| | | | | | | 237,825 | |
| | |
South Korea 0.2% | | | | | | | | |
Amorepacific Corp. (PRFC) | | | 29 | | | | 2,395 | |
CJ CheilJedang Corp. (PRFC) | | | 14 | | | | 1,176 | |
Hanwha Corp. (PRFC) | | | 128 | | | | 1,496 | |
Hyundai Motor Co. (2nd PRFC) | | | 122 | | | | 8,307 | |
Hyundai Motor Co. (PRFC) | | | 62 | | | | 3,879 | |
LG Chem Ltd. (PRFC) | | | 21 | | | | 3,090 | |
LG Electronics, Inc. (PRFC) | | | 64 | | | | 1,497 | |
LG Household & Health Care Ltd. (PRFC) | | | 6 | | | | 3,804 | |
Mirae Asset Daewoo Co. Ltd. (PRFC) | | | 512 | | | | 1,810 | |
See Notes to Financial Statements.
| | | | |
| PGIM QMA International Developed Markets Index Fund | | | 45 | |
Schedule of Investments(continued)
as of October 31, 2019
| | | | | | | | |
| Description | | Shares | | | Value | |
PREFERRED STOCKS (Continued) | | | | | | | | |
| | |
South Korea (cont’d.) | | | | | | | | |
Samsung Electronics Co. Ltd. (PRFC) | | | 2,517 | | | $ | 88,237 | |
Samsung Fire & Marine Insurance Co. Ltd. (PRFC) | | | 9 | | | | 1,248 | |
| | | | | | | | |
| | | | | | | 116,939 | |
| | | | | | | | |
TOTAL PREFERRED STOCKS
(cost $323,569) | | | | | | | 354,764 | |
| | | | | | | | |
| | |
| | | Units | | | | |
| | |
RIGHTS* 0.0% | | | | | | | | |
| | |
France 0.0% | | | | | | | | |
Adevinta ASA, expiring 11/08/2019 | | | 214 | | | | 33 | |
| | | | | | | | |
| | |
Italy 0.0% | | | | | | | | |
Mediaset SpA, expiring 11/06/2019 | | | 839 | | | | — | |
| | | | | | | | |
| | |
Singapore 0.0% | | | | | | | | |
Mapletree Commercial Trust, expiring 11/08/2019 | | | 454 | | | | 29 | |
| | | | | | | | |
TOTAL RIGHTS
(COST $0) | | | | | | | 62 | |
| | | | | | | | |
TOTAL LONG-TERM INVESTMENTS
(cost $45,460,253) | | | | | | | 48,764,160 | |
| | | | | | | | |
| | |
| | | Shares | | | | |
| | |
SHORT-TERM INVESTMENTS 1.6% | | | | | | | | |
| | |
AFFILIATED MUTUAL FUND 1.2% | | | | | | | | |
PGIM Core Ultra Short Bond Fund (cost $634,314)(w) | | | 634,314 | | | | 634,314 | |
| | | | | | | | |
See Notes to Financial Statements.
| | | | | | | | | | | | | | | | |
| | | | |
| Description | | Interest
Rate | | | Maturity
Date | | | Principal
Amount (000)# | | | Value | |
U.S. TREASURY OBLIGATION(k)(n) 0.4% | | | | | | | | | | | | | | | | |
U.S. Treasury Bills
(cost $179,541) | | | 1.919 | % | | | 12/19/19 | | | | 180 | | | $ | 179,656 | |
| | | | | | | | | | | | | | | | |
TOTAL SHORT-TERM INVESTMENTS
(cost $813,855) | | | | | | | | | | | | | | | 813,970 | |
| | | | | | | | | | | | | | | | |
TOTAL INVESTMENTS 97.6%
(cost $46,274,108) | | | | | | | | | | | | | | �� | 49,578,130 | |
Other assets in excess of liabilities(z) 2.4% | | | | | | | | | | | | | | | 1,229,005 | |
| | | | | | | | | | | | | | | | |
NET ASSETS 100.0% | | | | | | | | | | | | | | $ | 50,807,135 | |
| | | | | | | | | | | | | | | | |
Below is a list of the abbreviation(s) used in the annual report:
144A—Security was purchased pursuant to Rule 144A under the Securities Act of 1933 and, pursuant to the requirements of Rule 144A, may not be resold except to qualified institutional buyers.
ASX—Australian Securities Exchange
CAC40—French Stock Market Index
CVA—Certificate Van Aandelen (Bearer)
EAFE—Europe, Australasia, Far East
ETF—Exchange-Traded Fund
FTSE—Financial Times Stock Exchange
LIBOR—London Interbank Offered Rate
MSCI—Morgan Stanley Capital International
PART CERT—Participation Certificates
PRFC—Preference Shares
REITs—Real Estate Investment Trust
RSP—Savings Shares
SPI—Swiss Performance Index
STOXX—Stock Index of the Eurozone
SWX—SIX Swiss Exchange
TOPIX—Tokyo Stock Price Index
UTS—Unit Trust Security
XBRN—Berne Stock Exchange
XEQT—Equiduct Stock Exchange
| * | Non-income producing security. |
| # | Principal amount is shown in U.S. dollars unless otherwise stated. |
| ^ | Indicates a Level 3 security. The aggregate value of Level 3 securities is $1,497 and 0.0% of net assets. |
| (k) | Represents security, or a portion thereof, segregated as collateral for centrally cleared/exchange-traded derivatives. |
| (n) | Rate shown reflects yield to maturity at purchased date. |
| (w) | PGIM Investments LLC, the manager of the Fund, also serves as manager of the PGIM Core Ultra Short Bond Fund. |
| (z) | Includes net unrealized appreciation/(depreciation) and/or market value of the below holdings which are excluded from the Schedule of Investments: |
See Notes to Financial Statements.
| | | | |
| PGIM QMA International Developed Markets Index Fund | |
| 47
|
|
Schedule of Investments(continued)
as of October 31, 2019
Futures contracts outstanding at October 31, 2019:
| | | | | | | | | | | | | | | | |
Number of
Contracts | | | Type | | Expiration
Date | | | Current
Notional
Amount | | | Value /
Unrealized
Appreciation
(Depreciation) | |
| | | | Long Positions: | | | | | | | | | | | | |
| | 1 | | | ASX SPI 200 Index | | | Dec. 2019 | | | $ | 114,415 | | | $ | (776 | ) |
| | 1 | | | Nikkei 225 Index | | | Dec. 2019 | | | | 113,650 | | | | 7,572 | |
| | 2 | | | CAC40 10 Euro | | | Nov. 2019 | | | | 127,746 | | | | 1,168 | |
| | 3 | | | TOPIX Index | | | Dec. 2019 | | | | 463,515 | | | | 35,968 | |
| | 4 | | | FTSE 100 Index | | | Dec. 2019 | | | | 375,444 | | | | (1,378 | ) |
| | 7 | | | Mini MSCI EAFE Index | | | Dec. 2019 | | | | 685,020 | | | | 19,247 | |
| | 15 | | | Euro STOXX 50 Index | | | Dec. 2019 | | | | 603,768 | | | | 17,880 | |
| | | | | | | | | | | | | | | | |
| | | | | | | | | | | | | | $ | 79,681 | |
| | | | | | | | | | | | | | | | |
Summary of Collateral for Centrally Cleared/Exchange-traded Derivatives:
Cash and securities segregated as collateral, including pending settlement for closed positions, to cover requirements for centrally cleared/exchange-traded derivatives are listed by broker as follows:
| | | | | | | | |
Broker | | Cash and/or Foreign Currency | | | Securities Market Value | |
Morgan Stanley & Co. LLC | | $ | — | | | $ | 179,656 | |
| | | | | | | | |
Fair Value Measurements:
Various inputs are used in determining the value of the Fund’s investments. These inputs are summarized in the three broad levels listed below.
Level 1—unadjusted quoted prices generally in active markets for identical securities.
Level 2—quoted prices for similar securities, interest rates and yield curves, prepayment speeds, foreign currency exchange rates and other observable inputs.
Level 3—unobservable inputs for securities valued in accordance with Board approved fair valuation procedures.
The following is a summary of the inputs used as of October 31, 2019 in valuing such portfolio securities:
| | | | | | | | | | | | |
| | | Level 1 | | | Level 2 | | | Level 3 | |
Investments in Securities | | | | | | | | | | | | |
Assets | | | | | | | | | | | | |
Common Stocks | | | | | | | | | | | | |
Australia | | $ | — | | | $ | 3,491,401 | | | $ | — | |
Austria | | | — | | | | 100,749 | | | | — | |
Belgium | | | — | | | | 452,527 | | | | — | |
Cambodia | | | — | | | | 8,337 | | | | — | |
Chile | | | — | | | | 11,863 | | | | — | |
China | | | — | | | | 256,617 | | | | — | |
Denmark | | | — | | | | 769,565 | | | | — | |
See Notes to Financial Statements.
| | | | | | | | | | | | |
| | | Level 1 | | | Level 2 | | | Level 3 | |
Investments in Securities (continued) | | | | | | | | | | | | |
Assets (continued) | | | | | | | | | | | | |
Common Stocks (continued) | | | | | | | | | | | | |
Finland | | $ | — | | | $ | 526,951 | | | $ | — | |
France | | | — | | | | 4,752,912 | | | | — | |
Germany | | | — | | | | 3,666,510 | | | | — | |
Hong Kong | | | — | | | | 1,315,674 | | | | — | |
Indonesia | | | — | | | | 2,670 | | | | — | |
Ireland | | | — | | | | 241,445 | | | | — | |
Israel | | | — | | | | 225,668 | | | | — | |
Italy | | | — | | | | 1,035,988 | | | | — | |
Japan | | | — | | | | 11,698,268 | | | | — | |
Jordan | | | — | | | | 11,703 | | | | — | |
Kazakhstan | | | — | | | | 3,728 | | | | — | |
Luxembourg | | | — | | | | 87,362 | | | | — | |
Macau | | | — | | | | 101,243 | | | | — | |
Malaysia | | | — | | | | 1,639 | | | | — | |
Mexico | | | — | | | | 4,552 | | | | — | |
Netherlands | | | — | | | | 1,937,346 | | | | — | |
New Zealand | | | — | | | | 143,752 | | | | — | |
Norway | | | — | | | | 289,463 | | | | — | |
Poland | | | — | | | | 149,625 | | | | — | |
Portugal | | | — | | | | 66,816 | | | | — | |
Russia | | | — | | | | 22,021 | | | | — | |
Singapore | | | — | | | | 602,682 | | | | — | |
South Africa | | | — | | | | 108,256 | | | | — | |
South Korea | | | 903 | | | | 1,921,389 | | | | — | |
Spain | | | — | | | | 1,278,092 | | | | — | |
Sweden | | | — | | | | 1,183,413 | | | | 1,497 | |
Switzerland | | | 31,296 | | | | 4,171,145 | | | | — | |
Taiwan | | | — | | | | 1,216 | | | | — | |
United Arab Emirates | | | — | | | | 6,736 | | | | — | |
United Kingdom | | | 21,749 | | | | 6,359,725 | | | | — | |
United States | | | — | | | | 178,474 | | | | — | |
Exchange-Traded Fund | | | | | | | | | | | | |
United States | | | 1,166,366 | | | | — | | | | — | |
Preferred Stocks | | | | | | | | | | | | |
Germany | | | — | | | | 237,825 | | | | — | |
South Korea | | | — | | | | 116,939 | | | | — | |
Rights | | | | | | | | | | | | |
France | | | 33 | | | | — | | | | — | |
Italy | | | — | | | | — | | | | — | |
Singapore | | | — | | | | 29 | | | | — | |
Affiliated Mutual Fund | | | 634,314 | | | | — | | | | — | |
U.S. Treasury Obligation | | | — | | | | 179,656 | | | | — | |
| | | | | | | | | | | | |
Total | | $ | 1,854,661 | | | $ | 47,721,972 | | | $ | 1,497 | |
| | | | | | | | | | | | |
See Notes to Financial Statements.
| | | | |
| PGIM QMA International Developed Markets Index Fund | | | 49 | |
Schedule of Investments(continued)
as of October 31, 2019
| | | | | | | | | | | | |
| | | Level 1 | | | Level 2 | | | Level 3 | |
Other Financial Instruments* | | | | | | | | | | | | |
Assets | | | | | | | | | | | | |
Futures Contracts | | $ | 81,835 | | | $ | — | | | $ | — | |
| | | | | | | | | | | | |
Liabilities | | | | | | | | | | | | |
Futures Contracts | | $ | (2,154 | ) | | $ | — | | | $ | — | |
| | | | | | | | | | | | |
| * | Other financial instruments are derivative instruments not reflected in the Schedule of Investments, such as futures, forwards and centrally cleared swap contracts, which are recorded at the unrealized appreciation (depreciation) on the instrument, and OTC swap contracts which are recorded at fair value. |
Industry Classification:
The industry classification of investments and other assets in excess of liabilities shown as a percentage of net assets as of October 31, 2019 were as follows (unaudited):
| | | | |
Banks | | | 9.1 | % |
Pharmaceuticals | | | 7.2 | |
Insurance | | | 5.0 | |
Oil, Gas & Consumable Fuels | | | 4.5 | |
Food Products | | | 3.6 | |
Chemicals | | | 3.3 | |
Automobiles | | | 3.2 | |
Metals & Mining | | | 2.7 | |
Machinery | | | 2.3 | |
Exchange-Traded Fund | | | 2.3 | |
Textiles, Apparel & Luxury Goods | | | 2.2 | |
Capital Markets | | | 2.2 | |
Real Estate Management & Development | | | 2.1 | |
Diversified Telecommunication Services | | | 2.0 | |
Technology Hardware, Storage & Peripherals | | | 2.0 | |
Electric Utilities | | | 2.0 | |
Personal Products | | | 1.9 | |
Beverages | | | 1.8 | |
Health Care Equipment & Supplies | | | 1.6 | |
Electronic Equipment, Instruments & Components | | | 1.6 | |
Semiconductors & Semiconductor Equipment | | | 1.6 | |
Industrial Conglomerates | | | 1.6 | |
Equity Real Estate Investment Trusts (REITs) | | | 1.5 | |
Road & Rail | | | 1.5 | |
Wireless Telecommunication Services | | | 1.4 | |
Professional Services | | | 1.4 | |
Hotels, Restaurants & Leisure | | | 1.3 | |
Software | | | 1.3 | |
Trading Companies & Distributors | | | 1.3 | |
Electrical Equipment | | | 1.2 | |
Aerospace & Defense | | | 1.2 | |
| | | | |
Food & Staples Retailing | | | 1.2 | % |
Affiliated Mutual Fund | | | 1.2 | |
Construction & Engineering | | | 1.2 | |
Household Durables | | | 1.1 | |
Auto Components | | | 1.1 | |
Tobacco | | | 1.0 | |
IT Services | | | 0.9 | |
Biotechnology | | | 0.9 | |
Multi-Utilities | | | 0.8 | |
Building Products | | | 0.8 | |
Household Products | | | 0.8 | |
Specialty Retail | | | 0.6 | |
Entertainment | | | 0.6 | |
Transportation Infrastructure | | | 0.6 | |
Construction Materials | | | 0.6 | |
Gas Utilities | | | 0.6 | |
Media | | | 0.5 | |
Commercial Services & Supplies | | | 0.5 | |
Multiline Retail | | | 0.5 | |
Air Freight & Logistics | | | 0.5 | |
Internet & Direct Marketing Retail | | | 0.5 | |
Diversified Financial Services | | | 0.4 | |
Interactive Media & Services | | | 0.4 | |
U.S. Treasury Obligation | | | 0.4 | |
Health Care Providers & Services | | | 0.3 | |
Paper & Forest Products | | | 0.3 | |
Communications Equipment | | | 0.3 | |
Life Sciences Tools & Services | | | 0.3 | |
Leisure Products | | | 0.3 | |
Containers & Packaging | | | 0.1 | |
Marine | | | 0.1 | |
See Notes to Financial Statements.
| | | | |
Industry Classification (continued): | | | |
Energy Equipment & Services | | | 0.1 | % |
Water Utilities | | | 0.1 | |
Health Care Technology | | | 0.1 | |
Airlines | | | 0.0 | * |
Independent Power & Renewable Electricity Producers | | | 0.0 | * |
Distributors | | | 0.0 | * |
Consumer Finance | | | 0.0 | * |
Diversified Consumer Services | | | 0.0 | * |
| | | | |
| | | 97.6 | |
Other assets in excess of liabilities | | | 2.4 | |
| | | | |
| | | 100.0 | % |
| | | | |
Effects of Derivative Instruments on the Financial Statements and Primary Underlying Risk Exposure:
The Fund invested in derivative instruments during the reporting period. The primary type of risk associated with these derivative instruments is equity contracts risk. See the Notes to Financial Statements for additional detail regarding these derivative instruments and their risks. The effect of such derivative instruments on the Fund’s financial position and financial performance as reflected in the Statement of Assets and Liabilities and Statement of Operations is presented in the summary below.
Fair values of derivative instruments as of October 31, 2019 as presented in the Statement of Assets and Liabilities:
| | | | | | | | | | | | |
| | | Asset Derivatives | | | Liability Derivatives | |
Derivatives not accounted
for as hedging instruments,
carried at fair value | | Statement of
Assets and
Liabilities Location | | Fair
Value | | | Statement of
Assets and
Liabilities Location | | Fair
Value | |
| Equity contracts | | Due from/to
broker—variation
margin futures | | $ | 81,835 | * | | Due from/to
broker—variation
margin futures | | $ | 2,154 | * |
| Equity contracts | | Unaffiliated investments | | | 62 | | | — | | | — | |
| | | | | | | | | | | | |
| | | | $ | 81,897 | | | | | $ | 2,154 | |
| | | | | | | | | | | | |
| * | Includes cumulative appreciation (depreciation) as reported in the schedule of open futures and centrally cleared swap contracts. Only unsettled variation margin receivable (payable) is reported within the Statement of Assets and Liabilities. |
See Notes to Financial Statements.
| | | | |
| PGIM QMA International Developed Markets Index Fund | | | 51 | |
Schedule of Investments(continued)
as of October 31, 2019
The effects of derivative instruments on the Statement of Operations for the year ended October 31, 2019 are as follows:
| | | | | | | | |
Amount of Realized Gain (Loss) on Derivatives Recognized in Income | |
Derivatives not accounted for as hedging
instruments, carried at fair value | | Rights(1) | | | Futures | |
Equity contracts | | $ | (4,076 | ) | | $ | 69,136 | |
| | | | | | | | |
| (1) | Included in net change in unrealized appreciation (depreciation) on investments in the Statement of Operations. |
| | | | | | | | |
Change in Unrealized Appreciation (Depreciation) on Derivatives Recognized in Income | |
Derivatives not accounted for as hedging
instruments, carried at fair value | | Rights(2) | | | Futures | |
Equity contracts | | $ | 125 | | | $ | 170,525 | |
| | | | | | | | |
| (2) | Included in net change in unrealized appreciation (depreciation) on investments in the Statement of Operations. |
For the year ended October 31, 2019, the Fund’s average volume of derivative activities is as follows:
| | | | | | | | | | |
| | | | Futures
Contracts—
Long
Positions(1) | | | | |
| | | | $ | 2,216,514 | | | | | |
| (1) | Notional Amount in USD. |
See Notes to Financial Statements.
Statement of Assets and Liabilities
as of October 31, 2019
| | | | |
Assets | | | | |
Investments at value: | | | | |
Unaffiliated investments (cost $45,639,794) | | $ | 48,943,816 | |
Affiliated investments (cost $634,314) | | | 634,314 | |
Foreign currency, at value (cost $1,461,306) | | | 1,476,660 | |
Dividends and interest receivable | | | 132,513 | |
Receivable for investments sold | | | 127,388 | |
Tax reclaim receivable | | | 75,887 | |
Due from Manager | | | 71,207 | |
Receivable for Fund shares sold | | | 42,415 | |
Prepaid expenses | | | 808 | |
| | | | |
Total Assets | | | 51,505,008 | |
| | | | |
| |
Liabilities | | | | |
Payable for Fund shares reacquired | | | 506,666 | |
Payable for investments purchased | | | 78,288 | |
Custodian and accounting fees payable | | | 73,701 | |
Accrued expenses and other liabilities | | | 38,513 | |
Due to broker—variation margin futures | | | 632 | |
Affiliated transfer agent fee payable | | | 73 | |
| | | | |
Total Liabilities | | | 697,873 | |
| | | | |
| |
Net Assets | | $ | 50,807,135 | |
| | | | |
| | | | | |
Net assets were comprised of: | | | | |
Shares of beneficial interest, at par | | $ | 4,178 | |
Paid-in capital in excess of par | | | 46,760,177 | |
Total distributable earnings (loss) | | | 4,042,780 | |
| | | | |
Net assets, October 31, 2019 | | $ | 50,807,135 | |
| | | | |
| |
Class R6 | | | | |
Net asset value, offering price and redemption price per share,
($50,807,135 ÷ 4,177,637 shares of beneficial interest issued and outstanding) | | $ | 12.16 | |
| | | | |
See Notes to Financial Statements.
| | | | |
| PGIM QMA International Developed Markets Index Fund | | | 53 | |
Statement of Operations
Year Ended October 31, 2019
| | | | |
Net Investment Income (Loss) | | | | |
Income | | | | |
Unaffiliated dividend income (net of $134,120 foreign withholding tax) | | $ | 1,396,405 | |
Affiliated dividend income | | | 16,871 | |
Affiliated income from securities lending, net | | | 703 | |
| | | | |
Total income | | | 1,413,979 | |
| | | | |
| |
Expenses | | | | |
Management fee | | | 113,065 | |
Custodian and accounting fees | | | 176,439 | |
Pricing fees | | | 55,300 | |
Fund data services | | | 51,000 | |
Shareholders’ reports | | | 35,792 | |
Audit fee | | | 32,643 | |
Legal fees and expenses | | | 16,948 | |
Trustees’ fees | | | 11,397 | |
Transfer agent’s fees and expenses (including affiliated expense of $471) | | | 603 | |
Registration fees | | | 63 | |
Miscellaneous | | | 15,132 | |
| | | | |
Total expenses | | | 508,382 | |
Less: Fee waiver and/or expense reimbursement | | | (372,704 | ) |
| | | | |
Net expenses | | | 135,678 | |
| | | | |
Net investment income (loss) | | | 1,278,301 | |
| | | | |
| |
Realized And Unrealized Gain (Loss) On Investment And Foreign Currency Transactions | | | | |
Net realized gain (loss) on: | | | | |
Investment transactions (including affiliated of $(122)) | | | (465,867 | ) |
Futures transactions | | | 69,136 | |
Short sales transactions | | | 95 | |
Foreign currency transactions | | | (11,299 | ) |
| | | | |
| | | (407,935 | ) |
| | | | |
Net change in unrealized appreciation (depreciation) on: | | | | |
Investments | | | 3,359,189 | |
Futures | | | 170,525 | |
Foreign currencies | | | 16,707 | |
| | | | |
| | | 3,546,421 | |
| | | | |
Net gain (loss) on investment and foreign currency transactions | | | 3,138,486 | |
| | | | |
Net Increase (Decrease) In Net Assets Resulting From Operations | | $ | 4,416,787 | |
| | | | |
See Notes to Financial Statements.
Statements of Changes in Net Assets
| | | | | | | | |
| |
| | | Year Ended October 31, | |
| | |
| | | 2019 | | | 2018 | |
Increase (Decrease) in Net Assets | | | | | | | | |
Operations | | | | | | | | |
Net investment income (loss) | | $ | 1,278,301 | | | $ | 932,556 | |
Net realized gain (loss) on investment and foreign currency transactions | | | (407,935 | ) | | | 62,110 | |
Net change in unrealized appreciation (depreciation) on investments and foreign currencies | | | 3,546,421 | | | | (4,139,387 | ) |
| | | | | | | | |
Net increase (decrease) in net assets resulting from operations | | | 4,416,787 | | | | (3,144,721 | ) |
| | | | | | | | |
| | |
Dividends and Distributions | | | | | | | | |
Distributions from distributable earnings | | | | | | | | |
Class R6 | | | (1,020,616 | ) | | | (776,665 | ) |
| | | | | | | | |
| | |
Fund share transactions | | | | | | | | |
Net proceeds from shares sold | | | 12,379,377 | | | | 18,825,405 | |
Net asset value of shares issued in reinvestment of dividends and distributions | | | 1,020,616 | | | | 776,665 | |
Cost of shares reacquired | | | (7,417,650 | ) | | | (4,572,348 | ) |
| | | | | | | | |
Net increase (decrease) in net assets from Fund share transactions | | | 5,982,343 | | | | 15,029,722 | |
| | | | | | | | |
Total increase (decrease) | | | 9,378,514 | | | | 11,108,336 | |
| | |
Net Assets: | | | | | | | | |
Beginning of year | | | 41,428,621 | | | | 30,320,285 | |
| | | | | | | | |
End of year | | $ | 50,807,135 | | | $ | 41,428,621 | |
| | | | | | | | |
See Notes to Financial Statements.
| | | | |
| PGIM QMA International Developed Markets Index Fund | | | 55 | |
Notes to Financial Statements
Prudential Investment Portfolios 2 (“PIP2”) is registered under the Investment Company Act of 1940, as amended (“1940 Act”), as anopen-end management investment company. PIP2 consists of eleven separate series: PGIM Core Conservative Bond Fund, PGIM Core Short-Term Bond Fund, PGIM Core Ultra Short Bond Fund, PGIM Institutional Money Market Fund, PGIM JennisonSmall-Cap Core Equity Fund, PGIM QMA Emerging Markets Equity Fund, PGIM QMA International Developed Markets Index Fund, PGIM QMAMid-Cap Core Equity Fund, PGIM QMA US Broad Market Index Fund and PGIM TIPS Fund, each of which are diversified funds and PGIM QMA Commodity Strategies Fund, which is anon-diversified fund for purposes of the 1940 Act and may invest a greater percentage of its assets in the securities of a single company or other issuer than a diversified fund. Investing in anon-diversified fund involves greater risk than investing in a diversified fund because a loss resulting from the decline in value of any one security may represent a greater portion of the total assets of anon-diversified fund. These financial statements relate only to the PGIM QMA International Developed Markets Index Fund (the “Fund”).
The investment objective of the Fund is to provide investment results that approximate the performance of the FTSE Developed MarketsEx-North America Net Index.
1. Accounting Policies
The Fund follows the investment company accounting and reporting guidance of the Financial Accounting Standards Board (“FASB”) Accounting Standard Codification (“ASC”) Topic 946 Financial Services—Investment Companies.The following accounting policies conform to U.S. generally accepted accounting principles. The Fund consistently follows such policies in the preparation of its financial statements.
Securities Valuation:The Fund holds securities and other assets and liabilities that are fair valued at the close of each day (generally, 4:00 PM Eastern time) the New York Stock Exchange (“NYSE”) is open for trading. Fair value is the price that would be received to sell an asset or paid to transfer a liability in an orderly transaction between market participants on the measurement date. PIP2’s Board of Trustees (the “Board”) has adopted valuation procedures for security valuation under which fair valuation responsibilities have been delegated to PGIM Investments LLC (“PGIM Investments” or the “Manager”). Pursuant to the Board’s delegation, the Manager has established a Valuation Committee responsible for supervising the fair valuation of portfolio securities and other assets and liabilities. The valuation procedures permit the Fund to utilize independent pricing vendor services, quotations from market makers, and alternative valuation methods when market quotations are either not readily available or not deemed representative of fair value. A record of the Valuation Committee’s actions is subject to the Board’s review, approval, and ratification at its next regularly scheduled quarterly meeting.
For the fiscal reportingyear-end, securities and other assets and liabilities were fair valued at the close of the last U.S. business day. Trading in certain foreign securities may occur when the NYSE is closed (including weekends and holidays). Because such foreign securities trade in markets that are open on weekends and U.S. holidays, the values of some of the Fund’s foreign investments may change on days when investors cannot purchase or redeem Fund shares.
Various inputs determine how the Fund’s investments are valued, all of which are categorized according to the three broad levels (Level 1, 2, or 3) detailed in the Schedule of Investments and referred to herein as the “fair value hierarchy” in accordance with FASB ASC Topic 820—Fair Value Measurements and Disclosures.
Common and preferred stocks, exchange-traded funds, and derivative instruments, such as futures or options, that are traded on a national securities exchange are valued at the last sale price as of the close of trading on the applicable exchange where the security principally trades. Securities traded via NASDAQ are valued at the NASDAQ official closing price. To the extent these securities are valued at the last sale price or NASDAQ official closing price, they are classified as Level 1 in the fair value hierarchy. In the event that no sale or official closing price on valuation date exists, these securities are generally valued at the mean between the last reported bid and ask prices, or at the last bid price in the absence of an ask price. These securities are classified as Level 2 in the fair value hierarchy.
Foreign equities traded on foreign securities exchanges are generally valued using pricing vendor services that provide model prices derived using adjustment factors based on information such as local closing price, relevant general and sector indices, currency fluctuations, depositary receipts, and futures, as applicable. Securities valued using such model prices are classified as Level 2 in the fair value hierarchy. The models generate an evaluated adjustment factor for each security, which is applied to the local closing price to adjust it for post closing market movements up to the time the Fund is valued. Utilizing that evaluated adjustment factor, the vendor provides an evaluated price for each security. If the vendor does not provide an evaluated price, securities are valued in accordance with exchange-traded common and preferred stock valuation policies discussed above.
Investments inopen-end,non-exchange-traded mutual funds are valued at their net asset values as of the close of the NYSE on the date of valuation. These securities are classified as Level 1 in the fair value hierarchy since they may be purchased or sold at their net asset values on the date of valuation.
Fixed income securities traded in the OTC market are generally classified as Level 2 in the fair value hierarchy. Such fixed income securities are typically valued using the market approach which generally involves obtaining data from an approved independent third-party vendor source. The Fund utilizes the market approach as the primary method to value securities when market prices of identical or comparable instruments are available. The third-party vendors’ valuation techniques used to derive the evaluated bid price are based on evaluating observable inputs, including but not limited to, yield curves, yield spreads,
| | | | |
| PGIM QMA International Developed Markets Index Fund | | | 57 | |
Notes to Financial Statements(continued)
credit ratings, deal terms, tranche level attributes, default rates, cash flows, prepayment speeds, broker/dealer quotations and reported trades. Certain Level 3 securities are also valued using the market approach when obtaining a single broker quote or when utilizing transaction prices for identical securities that have been used in excess of five business days. During the reporting period, there were no changes to report with respect to the valuation approach and/or valuation techniques discussed above.
Securities and other assets that cannot be priced according to the methods described above are valued based on pricing methodologies approved by the Board. In the event that unobservable inputs are used when determining such valuations, the securities will be classified as Level 3 in the fair value hierarchy.
When determining the fair value of securities, some of the factors influencing the valuation include: the nature of any restrictions on disposition of the securities; assessment of the general liquidity of the securities; the issuer’s financial condition and the markets in which it does business; the cost of the investment; the size of the holding and the capitalization of the issuer; the prices of any recent transactions or bids/offers for such securities or any comparable securities; any available analyst media or other reports or information deemed reliable by the Manager regarding the issuer or the markets or industry in which it operates. Using fair value to price securities may result in a value that is different from a security’s most recent closing price and from the price used by other unaffiliated mutual funds to calculate their net asset values.
Illiquid Securities:Pursuant to Rule22e-4 under the 1940 Act, the Fund has adopted a Board approved Liquidity Risk Management Program (“LRMP”) that requires, among other things, that the Fund limit its illiquid investments that are assets to no more than 15% of net assets. Illiquid securities are those that, because of the absence of a readily available market or due to legal or contractual restrictions on resale, may not reasonably be expected to be sold or disposed of in current market conditions in seven calendar days or less without the sale or disposition significantly changing the market value of the investment. The Fund may find it difficult to sell illiquid securities at the time considered most advantageous by its subadviser and may incur transaction costs that would not be incurred in the sale of securities that were freely marketable.
Restricted Securities:Securities acquired in unregistered, private sales from the issuing company or from an affiliate of the issuer are considered restricted as to disposition under federal securities law (“restricted securities”). Such restricted securities are valued pursuant to the valuation procedures noted above. Restricted securities that would otherwise be considered illiquid investments pursuant to the Fund’s LRMP because of legal restrictions on resale to the general public may be traded among qualified institutional buyers under Rule 144A of the Securities Act of 1933. Therefore, these Rule 144A securities, as well as
commercial paper that is sold in private placements under Section 4(2) of the Securities Act of 1933, may be classified higher than “illiquid” under the LRMP (i.e. “moderately liquid” or “less liquid” investments). However, the liquidity of the Fund’s investments in restricted securities could be impaired if trading does not develop or declines.
Foreign Currency Translation:The books and records of the Fund are maintained in U.S. dollars. Foreign currency amounts are translated into U.S. dollars on the following basis:
(i) market value of investment securities, other assets and liabilities—at the current rates of exchange;
(ii) purchases and sales of investment securities, income and expenses—at the rates of exchange prevailing on the respective dates of such transactions.
Although the net assets of the Fund are presented at the foreign exchange rates and market values at the close of the period, the Fund does not generally isolate that portion of the results of operations arising as a result of changes in the foreign exchange rates from the fluctuations arising from changes in the market prices of long-term portfolio securities held at the end of the period. Similarly, the Fund does not isolate the effect of changes in foreign exchange rates from the fluctuations arising from changes in the market prices of long-term portfolio securities sold during the period. Accordingly, holding period realized foreign currency gains (losses) are included in the reported net realized gains (losses) on investment transactions.
Net realized gains (losses) on foreign currency transactions represent net foreign exchange gains (losses) from the disposition of holdings of foreign currencies, currency gains (losses) realized between the trade and settlement dates on forward currency transactions, and the difference between the amounts of interest, dividends and foreign withholding taxes recorded on the Fund’s books and the U.S. dollar equivalent amounts actually received or paid. Net unrealized currency gains (losses) arise from valuing foreign currency denominated assets and liabilities (other than investments) at period end exchange rates.
Financial Futures Contracts:A financial futures contract is an agreement to purchase (long) or sell (short) an agreed amount of securities at a set price for delivery on a future date. Upon entering into a financial futures contract, the Fund is required to pledge to the broker an amount of cash and/or other assets equal to a certain percentage of the contract amount. This amount is known as the “initial margin.” Subsequent payments, known as “variation margin,” are made or received by the Fund each day, depending on the daily fluctuations in the value of the underlying security. Such variation margin is recorded for financial statement purposes on a daily basis as unrealized gain (loss). When the contract expires or is closed, the gain (loss) is realized and is presented in the Statement of Operations as net realized gain (loss) on futures transactions.
The Fund invested in financial futures contracts in order to hedge its existing portfolio securities, or securities the Fund intends to purchase, against fluctuations in value caused
| | | | |
| PGIM QMA International Developed Markets Index Fund | | | 59 | |
Notes to Financial Statements(continued)
by changes in prevailing interest rates. Should interest rates move unexpectedly, the Fund may not achieve the anticipated benefits of the financial futures contracts and may realize a loss. The use of futures transactions involves the risk of imperfect correlation in movements in the price of futures contracts, interest rates and the underlying hedged assets. Since futures contracts are exchange-traded, there is minimal counterparty credit risk to the Fund since the exchanges’ clearinghouse acts as counterparty to all exchange-traded futures and guarantees the futures contracts against default.
Master Netting Arrangements:The Fund is subject to various Master Agreements, or netting arrangements, with select counterparties. These are agreements which a subadviser may have negotiated and entered into on behalf of all or a portion of the Fund. A master netting arrangement between the Fund and the counterparty permits the Fund to offset amounts payable by the Fund to the same counterparty against amounts to be received; and by the receipt of collateral from the counterparty by the Fund to cover the Fund’s exposure to the counterparty. However, there is no assurance that such mitigating factors are easily enforceable. In addition to master netting arrangements, the right toset-off exists when all the conditions are met such that each of the parties owes the other determinable amounts, the reporting party has the right toset-off the amount owed with the amount owed by the other party, the reporting party intends toset-off and the right ofset-off is enforceable by law. During the reporting period, there was no intention to settle on a net basis and all amounts are presented on a gross basis on the Statement of Assets and Liabilities.
Rights:The Fund held rights acquired either through a direct purchase or pursuant to corporate actions. Rights entitle the holder to buy a proportionate amount of common stock, or such other security that the issuer may specify, at a specific price and time through the expiration dates. Such rights are held as long positions by the Fund until exercised, sold or expired. Rights are valued at fair value in accordance with the Board approved fair valuation procedures.
Securities Lending:The Fund lends its portfolio securities to banks and broker-dealers. The loans are secured by collateral at least equal to the market value of the securities loaned. Collateral pledged by each borrower is invested in an affiliated money market fund and is marked to market daily, based on the previous day’s market value, such that the value of the collateral exceeds the value of the loaned securities. In the event of significant appreciation in value of securities on loan on the last business day of the reporting period, the financial statements may reflect a collateral value that is less than the market value of the loaned securities. Such shortfall is remedied as described above. Loans are subject to termination at the option of the borrower or the Fund. Upon termination of the loan, the borrower will return to the Fund securities identical to the loaned securities. Should the borrower of the securities fail financially, the Fund has the right to repurchase the securities in the open market using the collateral.
The Fund recognizes income, net of any rebate and securities lending agent fees, for lending its securities in the form of fees or interest on the investment of any cash received as collateral. The borrower receives all interest and dividends from the securities loaned and such payments are passed back to the lender in amounts equivalent thereto. The Fund also continues to recognize any unrealized gain (loss) in the market price of the securities loaned and on the change in the value of the collateral invested that may occur during the term of the loan. In addition, realized gain (loss) is recognized on changes in the value of the collateral invested upon liquidation of the collateral. Net earnings from securities lending are disclosed on the Statement of Operations as “Income from securities lending, net”.
Securities Transactions and Net Investment Income:Securities transactions are recorded on the trade date. Realized gains (losses) from investment and currency transactions are calculated on the specific identification method. Dividend income is recorded on theex-date, or for certain foreign securities, when the Fund becomes aware of such dividends. Interest income, including amortization of premium and accretion of discount on debt securities, as required, is recorded on the accrual basis. Expenses are recorded on an accrual basis, which may require the use of certain estimates by management that may differ from actual.
Taxes:It is the Fund’s policy to continue to meet the requirements of the Internal Revenue Code applicable to regulated investment companies and to distribute all of its taxable net investment income and capital gains, if any, to its shareholders. Therefore, no federal income tax provision is required. Withholding taxes on foreign dividends, interest and capital gains, if any, are recorded, net of reclaimable amounts, at the time the related income is earned.
Dividends and Distributions:The Fund expects to pay dividends from net investment income and distributions from net realized capital gains, if any, annually. Dividends and distributions to shareholders, which are determined in accordance with federal income tax regulations and which may differ from generally accepted accounting principles, are recorded on theex-date. Permanent book/tax differences relating to income and gain (loss) are reclassified between total distributable earnings (loss) andpaid-in capital in excess of par, as appropriate.
Estimates:The preparation of financial statements requires management to make estimates and assumptions that affect the reported amounts and disclosures in the financial statements. Actual results could differ from those estimates.
2. Agreements
The Fund has a management agreement with the Manager. Pursuant to this agreement, the Manager has responsibility for all investment advisory services and supervises the subadviser’s performance of such services. In addition, under the management agreement, the Manager provides all of the administrative functions necessary for the organization, operation and management of the Fund. The Manager administers the corporate affairs of
| | | | |
| PGIM QMA International Developed Markets Index Fund | | | 61 | |
Notes to Financial Statements(continued)
the Fund and, in connection therewith, furnishes the Fund with office facilities, together with those ordinary clerical and bookkeeping services which are not being furnished by the Fund’s custodian and the Fund’s transfer agent. The Manager is also responsible for the staffing and management of dedicated groups of legal, marketing, compliance and related personnel necessary for the operation of the Fund. The legal, marketing, compliance and related personnel are also responsible for the management and oversight of the various service providers to the Fund, including, but not limited to, the custodian, transfer agent, and accounting agent.
The Manager has entered into a subadvisory agreement with QMA LLC (“QMA”) (formerly known as Quantitative Management Associates, LLC). The subadvisory agreement provides that QMA will furnish investment advisory services in connection with the management of the Fund. In connection therewith, QMA is obligated to keep certain books and records of the Fund. The Manager pays for the services of QMA, the cost of compensation of officers of the Fund, occupancy and certain clerical and bookkeeping costs of the Fund. The Fund bears all other costs and expenses.
The management fee paid to the Manager is accrued daily and payable monthly at an annual rate of 0.25% of the Fund’s average daily net assets.
The Manager has contractually agreed, through February 28, 2021, to limit total annual operating expenses after fee waivers and/or expense reimbursements to 0.30% of average daily net assets for Class R6 shares. This contractual waiver excludes interest, brokerage, taxes (such as income and foreign withholding taxes, stamp duty and deferred tax expenses), acquired fund fees and expenses, extraordinary expenses, and certain other Fund expenses such as dividend and interest expense and broker charges on short sales. Fees and/or expenses waived and/or reimbursed by the Manager may be recouped by the Manager within the same fiscal year during which such waiver and/or reimbursement is made if such recoupment can be realized without exceeding the expense limit in effect at the time of the recoupment for that fiscal year.
PIP2, on behalf of the Fund, has a distribution agreement with Prudential Investment Management Services LLC (“PIMS”), which acts as the distributor of the Class R6 shares of the Fund. No distribution or service fees are paid to PIMS as distributor for Class R6 shares of the Fund.
PGIM, Inc., PGIM Investments, PIMS and QMA are indirect, wholly-owned subsidiaries of Prudential Financial, Inc. (“Prudential”).
3. Other Transactions with Affiliates
Prudential Mutual Fund Services LLC (“PMFS”), an affiliate of PGIM Investments and an indirect, wholly-owned subsidiary of Prudential, serves as the Trust’s transfer agent. Transfer agent’s fees and expenses in the Statement of Operations include certainout-of-pocket expenses paid tonon-affiliates, where applicable.
The Fund may invest its overnight sweep cash in the PGIM Core Ultra Short Bond Fund (the “Core Fund”), and its securities lending cash collateral in the PGIM Institutional Money Market Fund (the “Money Market Fund”), each a series of Prudential Investment Portfolios 2, registered under the 1940 Act and managed by PGIM Investments. Through the Fund’s investments in the mentioned underlying funds, PGIM Investments and/or its affiliates are paid fees or reimbursed for providing their services. In addition to the realized and unrealized gains on investments in the Core Fund and Money Market Fund, earnings from such investments are disclosed on the Statement of Operations as “Affiliated dividend income” and “Income from securities lending, net”, respectively.
The Fund may enter into certain securities purchase or sale transactions under Board approved Rule17a-7 procedures. Rule17a-7 is an exemptive rule under the 1940 Act, that subject to certain conditions, permits purchase and sale transactions among affiliated investment companies, or between an investment company and a person that is affiliated solely by reason of having a common (or affiliated) investment adviser, common directors, and/or common officers. Pursuant to the Rule17a-7 procedures and consistent with guidance issued by the SEC, the Trust’s Chief Compliance Officer (“CCO”) prepares a quarterly summary of all such transactions for submission to the Board, together with the CCO’s written representation that all such17a-7 transactions were effected in accordance with the Fund’s Rule17a-7 procedures. For the year ended October 31, 2019, no17a-7 transactions were entered into by the Fund.
4. Portfolio Securities
The aggregate cost of purchases and proceeds from sales of portfolio securities (excluding short-term investments and U.S. Government securities) for the year ended October 31, 2019, were $12,333,449 and $5,505,320, respectively.
A summary of the cost of purchases and proceeds from sales of shares of affiliated investments for the year ended October 31, 2019, is presented as follows:
| | | | |
| PGIM QMA International Developed Markets Index Fund | | | 63 | |
Notes to Financial Statements(continued)
| | | | | | | | | | | | | | | | | | | | | | | | | | | | |
Value,
Beginning
of Year | | Cost of
Purchases | | | Proceeds
from Sales | | | Change in
Unrealized
Gain (Loss) | | | Realized
Gain (Loss) | | | Value,
End of Year | | | Shares,
End of Year | | | Income | |
PGIM Core Ultra Short Bond Fund* | |
$1,006,402 | | $ | 9,080,743 | | | $ | 9,452,831 | | | $ | — | | | $ | — | | | $ | 634,314 | | | | 634,314 | | | $ | 16,871 | |
PGIM Institutional Money Market Fund* | |
731 | | | 5,229,872 | | | | 5,230,481 | | | | — | | | | (122 | ) | | | — | | | | — | | | | 703 | ** |
| | | | | | | | | | | | | | | | | | | | | | | | | | | | �� |
$1,007,133 | | $ | 14,310,615 | | | $ | 14,683,312 | | | $ | — | | | $ | (122 | ) | | $ | 634,314 | | | | | | | $ | 17,574 | |
| | | | | | | | | | | | | | | | | | | | | | | | | | | | |
| * | The Fund did not have any capital gain distributions during the reporting period. |
| ** | This amount is included in “Income from securities lending, net” on the Statement of Operations. |
5. Distributions and Tax Information
Distributions to shareholders, which are determined in accordance with federal income tax regulations and which may differ from generally accepted accounting principles, are recorded on theex-date.
For the year ended October 31, 2019, the tax character of dividends paid by the Fund were $999,055 of ordinary income and $21,561 of long-term capital gains. For the year ended October 31, 2018, the tax character of dividends paid by the Fund were $693,523 of ordinary income and $83,142 of long-term capital gains.
As of October 31, 2019, the accumulated undistributed earnings on a tax basis was $1,212,016 of ordinary income.
The United States federal income tax basis of the Fund’s investments and the net unrealized appreciation as of October 31, 2019 were as follows:
| | | | | | |
Tax Basis | | Gross
Unrealized
Appreciation | | Gross
Unrealized
Depreciation | | Net
Unrealized
Appreciation |
| $46,561,831 | | $7,552,732 | | $(4,456,752) | | $3,095,980 |
The differences between book basis and tax basis was primarily attributable to deferred losses on wash sales, investments in passive foreign investment companies and other cost basis differences between financial and tax accounting.
For federal income tax purposes, the Fund had a capital loss carryforward as of October 31, 2019 of approximately $265,000 which can be carried forward for an unlimited period. No
capital gains distributions are expected to be paid to shareholders until net gains have been realized in excess of such losses.
The Manager has analyzed the Fund’s tax positions taken on federal, state and local income tax returns for all open tax years and has concluded that no provision for income tax is required in the Fund’s financial statements for the current reporting period. Since tax authorities can examine previously filed tax returns, the Fund’s U.S. federal and state tax returns for each of the three fiscal years up to the most recent fiscal year ended October 31, 2019 are subject to such review.
6. Capital and Ownership
The Fund offers Class R6 shares. Class R6 shares are not subject to any sales or redemption charge and are available exclusively for sale to a limited group of investors.
PIP2 has authorized the Fund to issue an unlimited number of shares of beneficial interest of the Fund at $0.001 par value per share.
As of October 31, 2019, Prudential, through its affiliated entities, including affiliated funds (if applicable), owned 4,177,637 Class R6 shares of the Fund. At reporting period end, seven shareholders of record, each holding greater than 5% of the Fund, held 88% of the Fund’s outstanding shares, of which all were held by an affiliate of Prudential.
Transactions in shares of beneficial interest were as follows:
| | | | | | | | |
Class R6 | | Shares | | | Amount | |
Year ended October 31, 2019: | | | | | | | | |
Shares sold | | | 1,085,029 | | | $ | 12,379,377 | |
Shares issued in reinvestment of dividends and distributions | | | 96,741 | | | | 1,020,616 | |
Shares reacquired | | | (649,798 | ) | | | (7,417,650 | ) |
| | | | | | | | |
Net increase (decrease) in shares outstanding | | | 531,972 | | | $ | 5,982,343 | |
| | | | | | | | |
Year ended October 31, 2018: | | | | | | | | |
Shares sold | | | 1,534,018 | | | $ | 18,825,405 | |
Shares issued in reinvestment of dividends and distributions | | | 63,092 | | | | 776,665 | |
Shares reacquired | | | (366,560 | ) | | | (4,572,348 | ) |
| | | | | | | | |
Net increase (decrease) in shares outstanding | | | 1,230,550 | | | $ | 15,029,722 | |
| | | | | | | | |
7. Borrowings
PIP2, on behalf of the Fund, along with other affiliated registered investment companies (the “Funds”), is a party to a Syndicated Credit Agreement (“SCA”) with a group of banks. The purpose of the SCA is to provide an alternative source of temporary funding for capital share redemptions. The table below provides details of the current SCA in effect at the reportingperiod-end as well as the prior SCA.
| | | | |
| | | Current SCA | | Prior SCA |
Term of Commitment | | 10/3/2019 – 10/1/2020 | | 10/4/2018 – 10/2/2019 |
Total Commitment | | $ 900 million | | $ 900 million |
| | | | |
| PGIM QMA International Developed Markets Index Fund | | | 65 | |
Notes to Financial Statements(continued)
| | | | |
| | | Current SCA | | Prior SCA |
Annualized Commitment Fee on the Unused Portion of the SCA | | 0.15% | | 0.15% |
Annualized Interest Rate on Borrowings | | 1.20% plus the higher of (1) the effective federal funds rate, (2) theone-month LIBOR rate or (3) zero percent | | 1.25% plus the higher of (1) the effective federal funds rate, (2) theone-month LIBOR rate or (3) zero percent |
Certain affiliated registered investment companies that are parties to the SCA include portfolios that are subject to a predetermined mathematical formula used to manage certain benefit guarantees offered under variable annuity contracts. The formula may result in large scale asset flows into and out of these portfolios. Consequently, these portfolios may be more likely to utilize the SCA for purposes of funding redemptions. It may be possible for those portfolios to fully exhaust the committed amount of the SCA, thereby requiring the Manager to allocate available funding per a Board-approved methodology designed to treat the Funds in the SCA equitably.
The Fund did not utilize the SCA during the year ended October 31, 2019.
8. Risks of Investing in the Fund
The Fund’s risks include, but are not limited to, some or all of the risks discussed below:
Derivatives Risk:Derivatives involve special risks and costs and may result in losses to the Fund. The successful use of derivatives requires sophisticated management, and, to the extent that derivatives are used, the Fund will depend on the subadviser’s ability to analyze and manage derivative transactions. The prices of derivatives may move in unexpected ways, especially in abnormal market conditions. Some derivatives are “leveraged” and therefore may magnify or otherwise increase investment losses to the Fund. Other risks arise from the potential inability to terminate or sell derivatives positions. A liquid secondary market may not always exist for the Fund’s derivatives positions. In fact, many OTC derivative instruments will not have liquidity beyond the counterparty to the instrument. OTC derivative instruments also involve the risk that the other party will not meet its obligations to the Fund.
Equity and Equity-Related Securities Risks:The value of a particular security could go down and you could lose money. In addition to an individual security losing value, the value of the equity markets or a sector in which the Fund invests could go down. The Fund’s holdings can vary significantly from broad market indexes and the performance of the Fund can deviate from the performance of these indexes. Different parts of a market can react differently to adverse issuer, market, regulatory, political and economic developments.
Foreign Securities Risk: The Fund’s investments in securities of foreign issuers or issuers with significant exposure to foreign markets involve additional risk. Foreign countries in which the Fund may invest may have markets that are less liquid, less regulated and more volatile than US markets. The value of the Fund’s investments may decline because of factors affecting the particular issuer as well as foreign markets and issuers generally, such as unfavorable government actions, and political or financial instability.
Geographic Concentration Risk: The Fund’s performance may be closely tied to the market, economic, political, regulatory or other conditions in the countries or regions in which the Fund invests. This can result in more pronounced risks based upon conditions that impact one or more countries or regions more or less than other countries or regions.
Market and Credit Risk:Securities markets may be volatile and the market prices of the Fund’s securities may decline. Securities fluctuate in price based on changes in an issuer’s financial condition and overall market and economic conditions. If the market prices of the securities owned by the Fund fall, the value of an investment in the Fund will decline. Additionally, the Fund may also be exposed to credit risk in the event that an issuer or guarantor fails to perform or that an institution or entity with which the Fund has unsettled or open transactions defaults.
9. Recent Accounting Pronouncements and Reporting Updates
In August 2018, the FASB issued Accounting Standards Update (“ASU”)No. 2018-13, which changes certain fair value measurement disclosure requirements. The new ASU, in addition to other modifications and additions, removes the requirement to disclose the amount and reasons for transfers between Level 1 and Level 2 of the fair value hierarchy, and the Fund’s policy for the timing of transfers between levels. The amendments are effective for financial statements issued for fiscal years beginning after December 15, 2019, and interim periods within those fiscal years. The Manager has evaluated the implications of certain provisions of the ASU and has determined to early adopt aspects related to the removal and modification of certain fair value measurement disclosures under the ASU effective immediately. The Manager continues to evaluate certain other provisions of the ASU and does not expect a material impact to financial statement disclosures.
| | | | |
| PGIM QMA International Developed Markets Index Fund | | | 67 | |
Financial Highlights
| | | | | | | | | | | | | | | | |
| | | | | | | | | | | | | |
| | | Year Ended
October 31, | | | | | | November 17, 2016(a) through October 31, 2017 | |
| | | 2019 | | | 2018 | | | | |
| Per Share Operating Performance(b): | | | | | | | | | | | | | | | | |
| Net Asset Value, Beginning of Period | | | $11.36 | | | | $12.55 | | | | | | | | $10.00 | |
| Income (loss) from investment operations: | | | | | | | | | | | | | | | | |
| Net investment income (loss) | | | 0.32 | | | | 0.32 | | | | | | | | 0.26 | |
| Net realized and unrealized gain (loss) on investment and foreign currency transactions | | | 0.76 | | | | (1.20 | ) | | | | | | | 2.30 | |
| Total from investment operations | | | 1.08 | | | | (0.88 | ) | | | | | | | 2.56 | |
| Less Dividends and Distributions: | | | | | | | | | | | | | | | | |
| Dividends from net investment income | | | (0.27 | ) | | | (0.23 | ) | | | | | | | (0.01 | ) |
| Distributions from net realized gains | | | (0.01 | ) | | | (0.08 | ) | | | | | | | - | |
| Total dividends and distributions | | | (0.28 | ) | | | (0.31 | ) | | | | | | | (0.01 | ) |
| Net asset value, end of period | | | $12.16 | | | | $11.36 | | | | | | | | $12.55 | |
| Total Return(c): | | | 9.88% | | | | (7.22)% | | | | | | | | 25.61% | |
| |
| Ratios/Supplemental Data: | | | | | | | | | | | | |
| Net assets, end of period (000) | | | $50,807 | | | | $41,429 | | | | | | | | $30,320 | |
| Average net assets (000) | | | $45,226 | | | | $36,379 | | | | | | | | $20,731 | |
| Ratios to average net assets(d): | | | | | | | | | | | | | | | | |
| Expenses after waivers and/or expense reimbursement | | | 0.30% | | | | 0.30% | | | | | | | | 0.33% | (e) |
| Expenses before waivers and/or expense reimbursement | | | 1.12% | | | | 1.49% | | | | | | | | 2.61% | (e) |
| Net investment income (loss) | | | 2.83% | | | | 2.56% | | | | | | | | 2.39% | (e) |
| Portfolio turnover rate(f) | | | 13% | | | | 9% | | | | | | | | 7% | |
| (a) | Commencement of operations. |
| (b) | Calculated based on average shares outstanding during the period. |
| (c) | Total return is calculated assuming a purchase of a share on the first day and a sale on the last day of each period reported and includes reinvestment of dividends and distributions, if any. Total returns may reflect adjustments to conform to generally accepted accounting principles. Total returns for periods less than one full year are not annualized. |
| (d) | Does not include expenses of the underlying funds in which the Fund invests. |
| (f) | The Fund’s portfolio turnover rate is calculated in accordance with regulatory requirements, without regard to transactions involving short-term investments and certain derivatives. If such transactions were included, the Fund’s portfolio turnover rate may be higher. |
See Notes to Financial Statements.
Report of Independent Registered Public Accounting Firm
To the Shareholders of PGIM QMA International Developed Markets Index Fund and
Board of Trustees Prudential Investment Portfolios 2:
Opinion on the Financial Statements
We have audited the accompanying statement of assets and liabilities of PGIM QMA International Developed Markets Index Fund, a series of Prudential Investment Portfolios 2, (the Fund), including the schedule of investments, as of October 31, 2019, the related statement of operations for the year then ended, the statements of changes in net assets for each of the years in thetwo-year period ended October 31, 2019, and the related notes (collectively, the financial statements) and the financial highlights for the years or period indicated therein. In our opinion, the financial statements and financial highlights present fairly, in all material respects, the financial position of the Fund as of October 31, 2019, the results of its operations for the year then ended, the changes in its net assets for each of the years in thetwo-year period ended October 31, 2019, and the financial highlights for the years or period indicated therein, in conformity with U.S. generally accepted accounting principles.
Basis for Opinion
These financial statements and financial highlights are the responsibility of the Fund’s management. Our responsibility is to express an opinion on these financial statements and financial highlights based on our audits. We are a public accounting firm registered with the Public Company Accounting Oversight Board (United States) (PCAOB) and are required to be independent with respect to the Fund in accordance with the U.S. federal securities laws and the applicable rules and regulations of the Securities and Exchange Commission and the PCAOB.
We conducted our audits in accordance with the standards of the PCAOB. Those standards require that we plan and perform the audit to obtain reasonable assurance about whether the financial statements and financial highlights are free of material misstatement, whether due to error or fraud. Our audits included performing procedures to assess the risks of material misstatement of the financial statements and financial highlights, whether due to error or fraud, and performing procedures that respond to those risks. Such procedures included examining, on a test basis, evidence regarding the amounts and disclosures in the financial statements and financial highlights. Such procedures also included confirmation of securities owned as of October 31, 2019, by correspondence with the custodian, transfer agent, and brokers, or by other appropriate auditing procedures when replies were not received. Our audits also included evaluating the accounting principles used and significant estimates made by management, as well as evaluating the overall presentation of the financial statements and financial highlights. We believe that our audits provide a reasonable basis for our opinion.

We have served as the auditor of one or more PGIM and/or Prudential Retail investment companies since 2003.
New York, New York
December 16, 2019
| | | | |
| PGIM QMA International Developed Markets Index Fund | | | 69 | |
Federal Income Tax Information(unaudited)
We are advising you that during the fiscal year ended October 31, 2019, the Fund reports the maximum amount allowed per share but not less than $0.006 for Class R6 shares as a capital gain distribution in accordance with Section 852(b)(3)(C) of the Internal Revenue Code.
For the year ended October 31, 2019, the Fund reports the maximum amount allowable under Section 854 of the Internal Revenue Code, but not less than, the following percentages of the ordinary income dividends paid as 1) qualified dividend income (QDI):
| | | | |
| | | QDI | |
PGIM QMA International Developed Markets Index Fund | | | 100.00 | % |
For the year ended October 31, 2019, the Fund made an election to pass through the maximum amount of the portion of the ordinary income dividends paid derived from foreign source income as well as any foreign taxes paid by the Fund in accordance with Section 853 of the Internal Revenue Code of the following amounts: $109,649 foreign tax credit from recognized foreign source income of $1,530,247.
In January 2020, you will be advised on IRS Form 1099-DIV or substitute 1099-DIV, as to the federal tax status of dividends received by you in calendar year 2019.
INFORMATION ABOUT BOARD MEMBERS AND OFFICERS(unaudited)
Information about Board Members and Officers of the Fund is set forth below. Board Members who are not deemed to be “interested persons” of the Fund, as defined in the 1940 Act, are referred to as “Independent Board Members.” Board Members who are deemed to be “interested persons” of the Fund are referred to as “Interested Board Members.” The Board Members are responsible for the overall supervision of the operations of the Fund and perform the various duties imposed on the directors of investment companies by the 1940 Act. The Board in turn elects the Officers, who are responsible for administering theday-to-day operations of the Fund.
| | | | | | |
| Independent Board Members | | | | |
| | | | |
Name Date of Birth Position(s) Portfolios Overseen | | Principal Occupation(s)
During Past Five Years | | Other Directorships
Held During Past Five Years | | Length of
Board Service |
| | | | |
Ellen S. Alberding 3/11/58 Board Member Portfolios Overseen: 96 | | President and Board Member, The Joyce Foundation (charitable foundation) (since 2002); Vice Chair, City Colleges of Chicago (community college system) (2011-2015); Trustee, National Park Foundation (charitable foundation for national park system) (2009-2018); Trustee, Economic Club of Chicago (since 2009); Trustee, Loyola University (since 2018). | | None. | | Since September 2013 |
| | | | |
Kevin J. Bannon 7/13/52 Board Member Portfolios Overseen: 96 | | Retired; Managing Director (April2008-May 2015) and Chief Investment Officer (October 2008-November 2013) of Highmount Capital LLC (registered investment adviser); formerly Executive Vice President and Chief Investment Officer (April 1993-August 2007) of Bank of New York Company; President (May2003-May 2007) of BNY Hamilton Family of Mutual Funds. | | Director of Urstadt Biddle Properties (equity real estate investment trust) (since September 2008). | | Since July 2008 |
PGIM QMA International Developed Markets Index Fund
| | | | | | |
| Independent Board Members | | | | |
| | | | |
Name Date of Birth Position(s) Portfolios Overseen | | Principal Occupation(s) During Past Five Years | | Other Directorships Held During Past Five Years | | Length of
Board Service |
| | | | |
Linda W. Bynoe 7/9/52 Board Member Portfolios Overseen: 96 | | President and Chief Executive Officer (since March 1995) and formerly Chief Operating Officer (December 1989-February 1995) of Telemat Ltd. (management consulting); formerly Vice President (January 1985-June 1989) at Morgan Stanley & Co. (broker-dealer). | | Director of Anixter International, Inc. (communication products distributor) (since January 2006); Director of Northern Trust Corporation (financial services) (since April 2006); Trustee of Equity Residential (residential real estate) (since December 2009). | | Since March 2005 |
| | | | |
Barry H. Evans 11/2/60 Board Member Portfolios Overseen: 95 | | Retired; formerly President (2005 – 2016), Global Chief Operating Officer (2014–2016), Chief Investment Officer – Global Head of Fixed Income (1998-2014), and various portfolio manager roles (1986-2006), Manulife Asset Management U.S. | | Formerly Director, Manulife Trust Company (2011-2018); formerly Director, Manulife Asset Management Limited (2015-2017); formerly Chairman of the Board of Directors of Manulife Asset Management U.S. (2005-2016); formerly Chairman of the Board, Declaration Investment Management and Research (2008-2016). | | Since September 2017 |
| | | | |
Keith F. Hartstein 10/13/56 Board Member & Independent Chair Portfolios Overseen: 96 | | Retired; Member (since November 2014) of the Governing Council of the Independent Directors Council (organization of independent mutual fund directors); formerly President and Chief Executive Officer (2005-2012), Senior Vice President (2004-2005), Senior Vice President of Sales and Marketing (1997-2004), and various executive management positions (1990-1997), John Hancock Funds, LLC (asset management); Chairman, Investment Company Institute’s Sales Force Marketing Committee (2003-2008). | | None. | | Since September 2013 |
Visit our website at pgiminvestments.com
| | | | | | |
| Independent Board Members | | | | |
| | | | |
Name Date of Birth Position(s) Portfolios Overseen | | Principal Occupation(s) During Past Five Years | | Other Directorships Held During Past Five Years | | Length of
Board Service |
| | | | |
Laurie Simon Hodrick 9/29/62 Board Member Portfolios Overseen: 95 | | A. Barton Hepburn Professor Emerita of Economics in the Faculty of Business, Columbia Business School (since 2018); Visiting Professor of Law, Stanford Law School (since 2015); Visiting Fellow at the Hoover Institution, Stanford University (since 2015); Sole Member, ReidCourt LLC (since 2008) (a consulting firm); formerly A. Barton Hepburn Professor of Economics in the Faculty of Business, Columbia Business School (1996-2017); formerly Managing Director, Global Head of Alternative Investment Strategies, Deutsche Bank (2006-2008). | | Independent Director, Synnex Corporation (since April 2019) (information technology); Independent Director, Kabbage, Inc. (since July 2018) (financial services); Independent Director, Corporate Capital Trust (2017-2018) (a business development company). | | Since September 2017 |
| | | | |
Michael S. Hyland, CFA 10/4/45 Board Member Portfolios Overseen: 96 | | Retired (since February 2005); formerly Senior Managing Director (July 2001-February 2005) of Bear Stearns & Co, Inc.; Global Partner, INVESCO (1999-2001); Managing Director and President of Salomon Brothers Asset Management (1989-1999). | | None. | | Since July 2008 |
| | | | |
Brian K. Reid 9/22/61 Board Member Portfolios Overseen: 95 | | Retired; formerly Chief Economist for the Investment Company Institute (ICI) (2005-2017); formerly Senior Economist and Director of Industry and Financial Analysis at the ICI (1998-2004); formerly Senior Economist, Industry and Financial Analysis at the ICI (1996-1998); formerly Staff Economist at the Federal Reserve Board (1989-1996); Director, ICI Mutual Insurance Company (2012-2017). | | None. | | Since March 2018 |
PGIM QMA International Developed Markets Index Fund
| | | | | | |
Independent Board Members | | | | |
| | | | |
Name Date of Birth Position(s) Portfolios Overseen | | Principal Occupation(s) During Past Five Years | | Other Directorships Held During Past Five Years | | Length of
Board Service |
| | | | |
Grace C. Torres 6/28/59 Board Member Portfolios Overseen: 95 | | Retired; formerly Treasurer and Principal Financial and Accounting Officer of the PGIM Funds, Target Funds, Advanced Series Trust, Prudential Variable Contract Accounts and The Prudential Series Fund (1998-June 2014); Assistant Treasurer (March 1999-June 2014) and Senior Vice President (September 1999-June 2014) of PGIM Investments LLC; Assistant Treasurer (May 2003-June 2014) and Vice President (June 2005-June 2014) of AST Investment Services, Inc.; Senior Vice President and Assistant Treasurer (May 2003-June 2014) of Prudential Annuities Advisory Services, Inc. | | Formerly Director (July 2015-January 2018) of Sun Bancorp, Inc. N.A. and Sun National Bank; Director (since January 2018) of OceanFirst Financial Corp. and OceanFirst Bank. | | Since November 2014 |
| | | | | | |
Interested Board Members | | | | |
| | | | |
Name Date of Birth Position(s) Portfolios Overseen | | Principal Occupation(s) During Past Five Years | | Other Directorships Held During Past Five Years | | Length of
Board Service |
| | | | |
Stuart S. Parker 10/5/62 Board Member & President Portfolios Overseen: 96 | | President of PGIM Investments LLC (formerly known as Prudential Investments LLC) (since January 2012); Executive Vice President of Prudential Investment Management Services LLC (since December 2012); formerly Executive Vice President of Jennison Associates LLC and Head of Retail Distribution of PGIM Investments LLC (June 2005-December 2011). | | None. | | Since January 2012 |
Visit our website at pgiminvestments.com
| | | | | | |
Interested Board Members | | | | |
| | | | |
Name Date of Birth Position(s) Portfolios Overseen | | Principal Occupation(s) During Past Five Years | | Other Directorships Held During Past Five Years | | Length of
Board Service |
| | | | |
Scott E. Benjamin 5/21/73 Board Member & Vice President Portfolios Overseen:96 | | Executive Vice President (since June 2009) of PGIM Investments LLC; Executive Vice President (June 2009-June 2012) and Vice President (since June 2012) of Prudential Investment Management Services LLC; Executive Vice President (since September 2009) of AST Investment Services, Inc.; Senior Vice President of Product Development and Marketing, PGIM Investments (since February 2006); formerly Vice President of Product Development and Product Management, PGIM Investments LLC (2003-2006). | | None. | | Since March 2010 |
| | | | |
| Fund Officers(a) | | | | |
| | | |
Name Date of Birth Fund Position | | Principal Occupation(s) During Past Five Years | | Length of
Service as Fund
Officer |
| | | |
Raymond A. O’Hara 9/11/55 Chief Legal Officer | | Vice President and Corporate Counsel (since July 2010) of Prudential Insurance Company of America (Prudential); Vice President (March 2011-Present) of Pruco Life Insurance Company and Pruco Life Insurance Company of New Jersey; Vice President and Corporate Counsel (March 2011-Present) of Prudential Annuities Life Assurance Corporation; Chief Legal Officer of PGIM Investments LLC (since June 2012); Chief Legal Officer of Prudential Mutual Fund Services LLC (since June 2012) and Corporate Counsel of AST Investment Services, Inc. (since June 2012); formerly Assistant Vice President and Corporate Counsel (September 2008-July 2010) of The Hartford Financial Services Group, Inc.; formerly Associate (September 1980-December 1987) and Partner (January 1988–August 2008) of Blazzard & Hasenauer, P.C. (formerly, Blazzard, Grodd & Hasenauer, P.C.). | | Since June 2012 |
PGIM QMA International Developed Markets Index Fund
| | | | |
| Fund Officers(a) | | | | |
| | | |
Name Date of Birth Fund Position | | Principal Occupation(s) During Past Five Years | �� | Length of Service as Fund Officer |
| | | |
Dino Capasso 8/19/74 Chief Compliance Officer | | Chief Compliance Officer (July 2019-Present) of PGIM Investments LLC; Chief Compliance Officer (July 2019-Present) of the PGIM Funds, Target Funds, Advanced Series Trust, The Prudential Series Fund, Prudential’s Gibraltar Fund, Inc., PGIM Global High Yield Fund, Inc., and PGIM High Yield Bond Fund, Inc.; Vice President and Deputy Chief Compliance Officer (June 2017-2019) of PGIM Investments LLC; formerly, Senior Vice President and Senior Counsel (January 2016-June 2017), and Vice President and Counsel (February 2012-December 2015) of Pacific Investment Management Company LLC. | | Since March 2018 |
| | | |
Andrew R. French 12/22/62 Secretary | | Vice President of PGIM Investments LLC (December 2018-Present); formerly Vice President and Corporate Counsel (February 2010-December 2018) of Prudential; formerly Director and Corporate Counsel (2006-2010) of Prudential; Vice President and Assistant Secretary (since January 2007) of PGIM Investments LLC; Vice President and Assistant Secretary (since January 2007) of Prudential Mutual Fund Services LLC. | | Since October 2006 |
| | | |
Jonathan D. Shain 8/9/58 Assistant Secretary | | Vice President and Corporate Counsel (since August 1998) of Prudential; Vice President and Assistant Secretary (since May 2001) of PGIM Investments LLC; Vice President and Assistant Secretary (since February 2001) of Prudential Mutual Fund Services LLC; formerly Vice President and Assistant Secretary (May 2003-June 2005) of AST Investment Services, Inc. | | Since May 2005 |
| | | |
Claudia DiGiacomo 10/14/74 Assistant Secretary | | Vice President and Corporate Counsel (since January 2005) of Prudential; Vice President and Assistant Secretary of PGIM Investments LLC (since December 2005); formerly Associate at Sidley Austin Brown & Wood LLP (1999-2004). | | Since December 2005 |
| | | |
Diana N. Huffman 4/14/82 Assistant Secretary | | Vice President and Corporate Counsel (since September 2015) of Prudential; formerly Associate at Willkie Farr & Gallagher LLP (2009-2015). | | Since March 2019 |
| | | |
Kelly A. Coyne 8/8/68 Assistant Secretary | | Director, Investment Operations of Prudential Mutual Fund Services LLC (since 2010). | | Since March 2015 |
| | | |
Christian J. Kelly 5/5/75 Treasurer and Principal Financial and Accounting Officer | | Vice President, Head of Fund Administration of PGIM Investments LLC (since November 2018); formerly, Director of Fund Administration of Lord Abbett & Co. LLC (2009-2018), Treasurer and Principal Accounting Officer of the Lord Abbett Family of Funds (2017-2018); Director of Accounting, Avenue Capital Group (2008-2009); Senior Manager, Investment Management Practice of Deloitte & Touche LLP (1998-2007). | | Since January 2019 |
Visit our website at pgiminvestments.com
| | | | |
| Fund Officers(a) | | | | |
| | | |
Name Date of Birth Fund Position | | Principal Occupation(s) During Past Five Years | | Length of Service as Fund Officer |
| | | |
Lana Lomuti 6/7/67 Assistant Treasurer | | Vice President (since 2007) and Director (2005-2007), within PGIM Investments Fund Administration; formerly Assistant Treasurer (December 2007-February 2014) of The Greater China Fund, Inc. | | Since April 2014 |
| | | |
Russ Shupak 10/08/73 Assistant Treasurer | | Vice President (since 2017) and Director (2013-2017), within PGIM Investments Fund Administration. | | Since October 2019 |
| | | |
Deborah Conway 3/26/69 Assistant Treasurer | | Vice President (since 2017) and Director (2007-2017), within PGIM Investments Fund Administration. | | Since October 2019 |
| | | |
Elyse M. McLaughlin 1/20/74 Assistant Treasurer | | Vice President (since 2017) and Director (2011-2017), within PGIM Investments Fund Administration. | | Since October 2019 |
| | | |
Charles H. Smith 1/11/73 Anti-Money Laundering Compliance Officer | | Vice President, Corporate Compliance, Anti-Money Laundering Unit (since January 2015) of Prudential; committee member of the American Council of Life Insurers Anti-Money Laundering and Critical Infrastructure Committee (since January 2016); formerly Global Head of Economic Sanctions Compliance at AIG Property Casualty (February 2007-December 2014); Assistant Attorney General at the New York State Attorney General’s Office, Division of Public Advocacy. (August 1998-January 2007). | | Since January 2017 |
(a) Excludes Mr. Parker and Mr. Benjamin, interested Board Members who also serve as President and Vice President, respectively.
Explanatory Notes to Tables:
| ∎ | | Board Members are deemed to be “Interested,” as defined in the 1940 Act, by reason of their affiliation with PGIM Investments LLC and/or an affiliate of PGIM Investments LLC. |
| ∎ | | Unless otherwise noted, the address of all Board Members and Officers is c/o PGIM Investments LLC, 655 Broad Street, Newark, New Jersey 07102-4410. |
| ∎ | | There is no set term of office for Board Members or Officers. The Board Members have adopted a retirement policy, which calls for the retirement of Board Members on December 31 of the year in which they reach the age of 75. |
| ∎ | | “Other Directorships Held” includes only directorships of companies required to register or file reports with the SEC under the 1934 Act (that is, “public companies”) or other investment companies registered under the 1940 Act. |
| ∎ | | “Portfolios Overseen” includes all investment companies managed by PGIM Investments LLC. The investment companies for which PGIM Investments LLC serves as manager include the PGIM Funds, The Prudential Variable Contract Accounts, PGIM ETF Trust, PGIM High Yield Bond Fund, Inc., PGIM Global High Yield Fund, Inc., The Prudential Series Fund, Prudential’s Gibraltar Fund, Inc. and the Advanced Series Trust. |
PGIM QMA International Developed Markets Index Fund
Approval of Advisory Agreements(unaudited)
The Funds’ Boards of Trustees
The Boards of Trustees (the “Board”) of the PGIM Day One Underlying Funds (each, a “Fund, and collectively, the “Funds”)1 consists of eleven individuals, eight of whom are not “interested persons” of the Funds, as defined in the Investment Company Act of 1940, as amended (the “1940 Act”) (the “Independent Trustees”). The Board is responsible for the oversight of each Fund and its operations, and performs the various duties imposed on the directors of investment companies by the 1940 Act. The Independent Trustees have retained independent legal counsel to assist them in connection with their duties. The Chair of the Board is an Independent Trustee. The Board has established four standing committees: the Audit Committee, the Nominating and Governance Committee, and two Investment Committees. Each committee is chaired by, and composed of, Independent Trustees.
Annual Approval of the Funds’ Advisory Agreements
As required under the 1940 Act, the Board determines annually whether to renew each Fund’s management agreement with PGIM Investments LLC (“PGIM Investments”) and each Fund’s subadvisory agreement with QMA LLC (“QMA”). In considering the renewal of the agreements, the Board, including all of the Independent Trustees, met on May 30, 2019 and on June11-13, 2019 and approved the renewal of the agreements through July 31, 2019, after concluding that the renewal of the agreements was in the best interests of each Fund and its shareholders.
In advance of the meetings, the Board requested and received materials relating to the agreements, and had the opportunity to ask questions and request further information in connection with its consideration. Among other things, the Board considered comparative fee information from PGIM Investments and QMA. Also, the Board considered comparisons with other mutual funds in relevant Peer Universes and Peer Groups, as is further discussed below.
In approving the agreements, the Board, including the Independent Trustees advised by independent legal counsel, considered the factors it deemed relevant, including the nature, quality and extent of services provided, the performance of each Fund, the profitability of PGIM Investments and its affiliates, expenses and fees, and the potential for economies of scale that may be shared with each Fund and its shareholders as each Fund’s assets grow. In their deliberations, the Trustees did not identify any single factor which alone was responsible for the Board’s decision to approve the agreements with respect to each Fund.
| 1 | Each of the PGIM Day One Underlying Funds is a series of Prudential Investment Portfolios 2. The PGIM Day One Underlying Funds discussed herein are: PGIM QMA International Developed Markets Index Fund and PGIM QMA Emerging Markets Equity Fund. |
| | |
| PGIM QMA International Developed Markets Index Fund |
Approval of Advisory Agreements(continued)
In connection with its deliberations, the Board considered information provided by PGIM Investments throughout the year at regular Board meetings, presentations from portfolio managers and other information, as well as information furnished at or in advance of the meetings on May 30, 2019 and on June11-13, 2019.
The Trustees determined that the overall arrangements between each Fund and PGIM Investments, which serves as each Fund’s investment manager pursuant to a management agreement, and between PGIM Investments and QMA, which serves as each Fund’s subadviser pursuant to the terms of subadvisory agreements with PGIM Investments, are in the best interests of each Fund and its shareholders in light of the services performed, fees charged and such other matters as the Trustees considered relevant in the exercise of their business judgment.
The material factors and conclusions that formed the basis for the Trustees’ reaching their determinations to approve the continuance of the agreements are separately discussed below.
Nature, Quality and Extent of Services
The Board received and considered information regarding the nature, quality and extent of services provided to each Fund by PGIM Investments and QMA. The Board noted that QMA is affiliated with PGIM Investments. The Board considered the services provided by PGIM Investments, including but not limited to the oversight of the subadviser for each Fund, as well as the provision of fund recordkeeping, compliance and other services to each Fund, and PGIM Investments’ role as administrator for the Funds’ liquidity risk management program. With respect to PGIM Investments’ oversight of the subadviser, the Board noted that PGIM Investments’ Strategic Investment Research Group (“SIRG”), which is a business unit of PGIM Investments, is responsible for monitoring and reporting to PGIM Investments’ senior management on the performance and operations of the subadviser. The Board also considered that PGIM Investments pays the salaries of all of the officers and interested Trustees of the Funds who are part of Fund management. The Board also considered the investment subadvisory services provided by QMA, including investment research and security selection, as well as adherence to each Fund’s investment restrictions and compliance with applicable Fund policies and procedures. The Board considered PGIM Investments’ evaluation of the subadviser, as well as PGIM Investments’ recommendation, based on its review of the subadviser, to renew the subadvisory agreements.
The Board considered the qualifications, backgrounds and responsibilities of PGIM Investments’ senior management responsible for the oversight of each Fund and, QMA and also considered the qualifications, backgrounds and responsibilities of the QMA portfolio
| | |
| Visit our website at pgiminvestments.com | | |
managers who are responsible for theday-to-day management of each Fund’s portfolio. The Board was provided with information pertaining to PGIM Investments’, and QMA’s organizational structure, senior management, investment operations, and other relevant information pertaining to PGIM Investments and QMA. The Board also noted that it received favorable compliance reports from the Funds’ Chief Compliance Officer (“CCO”) as to each of PGIM Investments and QMA.
The Board concluded that it was satisfied with the nature, extent and quality of the investment management services provided by PGIM Investments and the subadvisory services provided to each Fund by QMA, and that there was a reasonable basis on which to conclude that each Fund benefits from the services provided by PGIM Investments and QMA under the management and subadvisory agreements.
Costs of Services and Profits Realized by PGIM Investments
The Board was provided with information on the profitability of PGIM Investments and its affiliates in serving as each Fund’s investment manager. The Board discussed with PGIM Investments the methodology utilized in assembling the information regarding profitability and considered its reasonableness. The Board recognized that it is difficult to make comparisons of profitability from fund management contracts because comparative information is not generally publicly available and is affected by numerous factors, including the structure of the particular adviser, the types of funds it manages, its business mix, numerous assumptions regarding allocations and the adviser’s capital structure and cost of capital. However, the Board considered that the cost of services provided by PGIM Investments during the year ended December 31, 2018 exceeded the management fees paid by each Fund, resulting in an operating loss to PGIM Investments. Taking these factors into account, the Board concluded that the profitability of PGIM Investments and its affiliates in relation to the services rendered was not unreasonable.
Economies of Scale
The Board received and discussed information concerning economies of scale that PGIM Investments may realize as each Fund’s assets grow beyond current levels. During the course of time, the Board has considered information regarding the launch date of each Fund, the management fees of each Fund compared to those of similarly managed funds and PGIM Investments’ investment in each Fund over time. The Board noted that, while the management fee schedule for each Fund does not have breakpoints in its management fees, economies of scale can be shared with each Fund in other ways, including low management fees from inception, additional technological and personnel investments to enhance shareholder services, and maintaining existing expense structures in the face of a rising cost environment. The Board also considered PGIM Investments’ assertion that it
| | |
| PGIM QMA International Developed Markets Index Fund |
Approval of Advisory Agreements(continued)
continually evaluates the management fee schedule of each Fund and the potential to share economies of scale through breakpoints or fee waivers as asset levels increase.
The Board recognized the inherent limitations of any analysis of economies of scale, stemming largely from the Board’s understanding that most of PGIM Investments’ costs are not specific to individual funds, but rather are incurred across a variety of products and services.
Other Benefits to PGIM Investments and QMA
The Board considered potential ancillary benefits that might be received by PGIM Investments, QMA and their affiliates as a result of their relationship with each Fund. The Board concluded that potential benefits to be derived by PGIM Investments included transfer agency fees received by each Fund’s transfer agent (which is affiliated with PGIM Investments), and benefits to its reputation as well as other intangible benefits resulting from PGIM Investments’ association with the Funds. The Board concluded that the potential benefits to be derived by QMA included its ability to use soft dollar credits, as well as the potential benefits consistent with those generally resulting from an increase in assets under management, specifically, potential access to additional research resources and benefits to its reputation. The Board concluded that the benefits derived by PGIM Investments and QMA were consistent with the types of benefits generally derived by investment managers and subadvisers to mutual funds.
Performance of the Funds / Fees and Expenses
The Board considered certain additional factors and made related conclusions relating to the historical performance of each Fund for theone-year period ended December 31, 2018. The Board considered that PGIM QMA International Developed Markets Index Fund commenced operations on November 17, 2016 and that PGIM QMA Emerging Markets Equity Fund commenced operations on November 29, 2016 and that longer-term performance was not yet available.
The Board also considered each Fund’s actual management fee, as well as each Fund’s net total expense ratio, for the fiscal year ended October 31, 2018. The Board considered the management fee for each Fund as compared to the management fee charged by PGIM Investments to other funds and the fee charged by other advisers to comparable mutual funds in a Peer Group. The actual management fee represents the fee rate actually paid by Fund shareholders and includes any fee waivers or reimbursements. The net total expense ratio for each Fund represents the actual expense ratio incurred by Fund shareholders.
| | |
| Visit our website at pgiminvestments.com | | |
The mutual funds included in the Peer Universe, which was used to consider performance, and the Peer Group, which was used to consider expenses and fees, for each Fund were objectively determined by Broadridge, an independent provider of mutual fund data. In certain circumstances, PGIM Investments also provided supplemental Peer Universe or Peer Group information, for reasons addressed with the Board. The comparisons placed each Fund in various quartiles over various periods, with the first quartile being the best 25% of the mutual funds (for performance, the best performing mutual funds and, for expenses, the lowest cost mutual funds).
The section below summarizes key factors considered by the Board and the Board’s conclusions regarding each Fund’s performance, fees and overall expenses. For each Fund, the table sets forth net performance comparisons (which reflect the impact on performance of any subsidies, expense caps or waivers that may be applicable) with the Peer Universe, actual management fees with the Peer Group (which reflect the impact of fund expenses, or any subsidies or fee waivers), and net total expenses with the Peer Group, each of which were key factors considered by the Board.
PGIM QMA International Developed Markets Index Fund
| | | | | | | | |
| Net Performance | | 1 Year | | 3 Years | | 5 Years | | 10 Years |
| | 2nd Quartile | | N/A | | N/A | | N/A |
| Actual Management Fees:1st Quartile |
| Net Total Expenses: 1st Quartile |
| | • | | The Board noted that the Fund outperformed its benchmark index over theone-year period. |
| | • | | The Board noted that the Fund does not yet have a three-year performance record and that, therefore, the subadviser should have more time to develop that record. |
| | • | | The Board and PGIM Investments agreed to retain the existing contractual cap on Fund expenses which (exclusive of certain fees and expenses) caps total annual operating expenses at 0.30% through February 29, 2020. |
| | • | | The Board concluded that in light of the above, it would be in the best interests of the Fund and its shareholders to continue to allow the Fund to create a longer-term performance record, and to renew the agreements. |
| | • | | The Board concluded that the management fees (including subadvisory fees) and total expenses were reasonable in light of the services provided. |
| | |
| PGIM QMA International Developed Markets Index Fund |
Approval of Advisory Agreements(continued)
PGIM QMA Emerging Markets Equity Fund
| | | | | | | | |
| Net Performance | | 1 Year | | 3 Years | | 5 Years | | 10 Years |
| | | 3rd Quartile | | N/A | | N/A | | N/A |
| Actual Management Fees:1st Quartile |
| Net Total Expenses: 3rd Quartile |
| | • | | The Board noted that the Fund underperformed its benchmark index over theone-year period. |
| | • | | The Board noted that the Fund does not yet have a three-year performance record and that, therefore, the subadviser should have more time to develop that record. |
| | • | | The Board considered information provided by PGIM Investments indicating that the Fund’s net total expense ratio was eight basis points from the median in the Peer Group. |
| | • | | The Board and PGIM Investments agreed to retain the existing contractual cap on Fund expenses which (exclusive of certain fees and expenses) caps total annual operating expenses at 1.20% through February 29, 2020. |
| | • | | The Board concluded that in light of the above, it would be in the best interests of the Fund and its shareholders to continue to allow the Fund to create a longer-term performance record, and to renew the agreements. |
| | • | | The Board concluded that the management fees (including subadvisory fees) and total expenses were reasonable in light of the services provided. |
* * *
After full consideration of these factors, the Board concluded that approval of the agreements was in the best interests of each Fund and its shareholders.
| | |
| Visit our website at pgiminvestments.com | | |
| | | | |
| | |
| ∎ MAIL | | ∎ TELEPHONE | | ∎ WEBSITE |
655 Broad Street Newark, NJ 07102 | | (800) 225-1852 | | pgiminvestments.com |
|
| PROXY VOTING |
| The Board of Trustees of the Fund has delegated to the Fund’s subadviser the responsibility for voting any proxies and maintaining proxy recordkeeping with respect to the Fund. A description of these proxy voting policies and procedures is available without charge, upon request, by calling (800) 225-1852. Information regarding how the Fund voted proxies relating to portfolio securities during the most recent 12-month period ended June 30 will be available on the Fund’s website and on the Securities and Exchange Commission’s website at the end of August. |
|
| TRUSTEES |
| Ellen S. Alberding• Kevin J. Bannon• Scott E. Benjamin• Linda W. Bynoe• Barry H. Evans• Keith F. Hartstein • Laurie Simon Hodrick• Michael S. Hyland• Stuart S. Parker• Brian K. Reid• Grace C. Torres |
|
| OFFICERS |
Stuart S. Parker,President• Scott E. Benjamin,Vice President• Christian J. Kelly,Treasurer and Principal Financial and Accounting Officer• Raymond A. O’Hara,Chief Legal Officer• Dino Capasso,Chief Compliance Officer• Charles H. Smith,Anti-Money Laundering Compliance Officer• Andrew R. French,Secretary• Jonathan D. Shain,Assistant Secretary• Claudia DiGiacomo,Assistant Secretary• Diana N. Huffman,Assistant Secretary• Kelly A. Coyne,Assistant Secretary• Lana Lomuti,Assistant Treasurer• Russ Shupak,Assistant Treasurer• Elyse McLaughlin,Assistant Treasurer• Deborah Conway,Assistant Treasurer |
| | | | |
| MANAGER | | PGIM Investments LLC | | 655 Broad Street
Newark, NJ 07102 |
|
| SUBADVISER | | QMA LLC | | Gateway Center Two
100 Mulberry Street
Newark, NJ 07102 |
|
| DISTRIBUTOR | | Prudential Investment
Management Services LLC | | 655 Broad Street
Newark, NJ 07102 |
|
| CUSTODIAN | | The Bank of New York Mellon | | 240 Greenwich Street
New York, NY 10286 |
|
| TRANSFER AGENT | | Prudential Mutual Fund
Services LLC | | PO Box 9658
Providence, RI 02940 |
|
| INDEPENDENT REGISTERED PUBLIC ACCOUNTING FIRM | | KPMG LLP | | 345 Park Avenue New York, NY 10154 |
|
| FUND COUNSEL | | Willkie Farr & Gallagher LLP | | 787 Seventh Avenue
New York, NY 10019 |
|
|
| An investor should consider the investment objectives, risks, charges, and expenses of the Fund carefully before investing. The prospectus contains this and other information about the Fund. An investor may obtain the prospectus by visiting our website atpgiminvestments.com or by calling(800) 225-1852. The prospectus should be read carefully before investing. |
|
| SHAREHOLDER COMMUNICATIONS WITH TRUSTEES |
| Shareholders can communicate directly with the Board of Trustees by writing to the Chair of the Board, PGIM QMA International Developed Markets Index Fund, PGIM Investments, Attn: Board of Trustees, 655 Broad Street, Newark, NJ 07102. Shareholders can communicate directly with an individual Trustee by writing to the same address. Communications are not screened before being delivered to the addressee. |
|
| AVAILABILITY OF PORTFOLIO HOLDINGS |
| The Fund files its complete schedule of portfolio holdings with the Securities and Exchange Commission on Form N-PORT. The Fund’s Form N-PORT filings are available on the Commission’s website at sec.gov. Form N-PORT is filed with the Commission quarterly, and each Fund’s full portfolio holdings as of the first and third fiscal quarter-ends (as of the third month of the Fund’s fiscal quarter for reporting periods on or after September 30, 2019) will be made publicly available 60 days after the end of each quarter at sec.gov. |
|
| The Fund’s Statement of Additional Information contains additional information about the Fund’s Trustees and is available without charge, upon request, by calling (800) 225-1852. |
Mutual Funds:
| | | | |
ARE NOT INSURED BY THE FDIC OR ANY
FEDERAL GOVERNMENT AGENCY | | MAY LOSE VALUE | | ARE NOT A DEPOSIT OF OR GUARANTEED
BY ANY BANK OR ANY BANK AFFILIATE |
PGIM QMA INTERNATIONAL DEVELOPED MARKETS INDEX FUND
| | |
| NASDAQ | | PQDMX |
| CUSIP | | 74440E607 |
Item 2 – Code of Ethics — See Exhibit (a)
As of the end of the period covered by this report, the registrant has adopted a code of ethics (the “Section 406 Standards for Investment Companies – Ethical Standards for Principal Executive and Financial Officers”) that applies to the registrant’s Principal Executive Officer and Principal Financial Officer; the registrant’s Principal Financial Officer also serves as the Principal Accounting Officer.
The registrant hereby undertakes to provide any person, without charge, upon request, a copy of the code of ethics. To request a copy of the code of ethics, contact the registrant800-225-1852, and ask for a copy of the Section 406 Standards for Investment Companies - Ethical Standards for Principal Executive and Financial Officers.
Item 3 – Audit Committee Financial Expert –
The registrant’s Board has determined that Mr. Kevin J. Bannon, member of the Board’s Audit Committee is an “audit committee financial expert,” and that he is “independent,” for purposes of this Item.
Item 4 – Principal Accountant Fees and Services – (a) Audit Fees
For the fiscal years ended October 31, 2019 and October 31, 2018, KPMG LLP (“KPMG”), the Registrant’s principal accountant, billed the Registrant $65,286 and $64,640 respectively, for professional services rendered for the audit of the Registrant’s annual financial statements or services that are normally provided in connection with statutory and regulatory filings.
(b) Audit-Related Fees
For the fiscal year ended October 31, 2019, fees of $2,836 were billed to the Registrant for services rendered by KPMG in connection with an accounting system conversion and were paid by The Bank of New York Mellon. For the fiscal year ended October 31, 2018, there are no fees to report.
(c)Tax Fees
For the fiscal years ended October 31, 2019 and October 31, 2018: none.
(d)All Other Fees
For the fiscal years ended October 31, 2019 and October 31, 2018: none.
(e) (1)Audit CommitteePre-Approval Policies and Procedures
THE PGIM MUTUAL FUNDS
AUDIT COMMITTEE POLICY
on
Pre-Approval of Services Provided by the Independent
Accountants
The Audit Committee of each PGIM Mutual Fund is charged with the responsibility to monitor the independence of the Fund’s independent accountants. As part of this responsibility, the Audit Committee mustpre-approve the independent accounting firm’s engagement to render audit and/or permissiblenon-audit services, as required by law. In evaluating a proposed engagement of the independent accountants, the Audit Committee will assess the effect that the engagement might reasonably be expected to have on the accountant’s independence. The Committee’s evaluation will be based on:
| | • | | a review of the nature of the professional services expected to be provided, |
| | • | | a review of the safeguards put into place by the accounting firm to safeguard independence, and |
| | • | | periodic meetings with the accounting firm. |
Policy for Audit andNon-Audit Services Provided to the Funds
On an annual basis, the scope of audits for each Fund, audit fees and expenses, and audit-related andnon-audit services (and fees proposed in respect thereof) proposed to be performed by the Fund’s independent accountants will be presented by the Treasurer and the independent accountants to the Audit Committee for review and, as appropriate, approval prior to the initiation of such services.
Such presentation shall be accompanied by confirmation by both the Treasurer and the independent accountants that the proposed
non-audit services will not adversely affect the independence of the independent accountants. Such proposednon-audit services shall be described in sufficient detail to enable the Audit Committee to assess the appropriateness of such services and fees, and the compatibility of the provision of such services with the auditor’s independence. The Committee shall receive periodic reports on the progress of the audit and other services which are approved by the Committee or by the Committee Chair pursuant to authority delegated in this Policy.
The categories of services enumerated under “Audit Services”, “Audit-related Services”, and “Tax Services” are intended to provide guidance to the Treasurer and the independent accountants as to those categories of services which the Committee believes are generally consistent with the independence of the independent accountants and which the Committee (or the Committee Chair) would expect upon the presentation of specific proposals topre-approve. The enumerated categories are not intended as an exclusive list of audit, audit-related or tax services, which the Committee (or the Committee Chair) would consider forpre-approval.
Audit Services
The following categories of audit services are considered to be consistent with the role of the Fund’s independent accountants:
| | • | | Annual Fund financial statement audits |
| | • | | Seed audits (related to new product filings, as required) |
| | • | | SEC and regulatory filings and consents |
Audit-related Services
The following categories of audit-related services are considered to be consistent with the role of the Fund’s independent accountants:
| | • | | Accounting consultations |
| | • | | Fund merger support services |
| | • | | Agreed Upon Procedure Reports |
| | • | | Other Internal Control Reports |
Individual audit-related services that fall within one of these categories (except for fund merger support services) and are not presented to the Audit Committee as part of the annualpre-approval process are subject to an authorizedpre-approval by the Audit Committee so long as the estimated fee for those services does not exceed $30,000. Any services provided under suchpre-approval will be reported to the Audit Committee at its next regular meeting. Should the amount of such services exceed $30,000 any additional fees will be subject topre-approval by the Committee Chair (or any other Committee member on whom this responsibility has been delegated). Fees related to fund merger support services are subject to a separate authorizedpre-approval by the Audit Committee with fees determined on a per occurrence and merger complexity basis.
Tax Services
The following categories of tax services are considered to be consistent with the role of the Fund’s independent accountants:
| | • | | Tax compliance services related to the filing or amendment of the following: |
| | • | | Federal, state and local income tax compliance; and, |
| | • | | Sales and use tax compliance |
| | • | | Timely RIC qualification reviews |
| | • | | Tax distribution analysis and planning |
| | • | | Tax authority examination services |
| | • | | Tax appeals support services |
| | • | | Accounting methods studies |
| | • | | Fund merger support services |
| | • | | Tax consulting services and related projects |
Individual tax services that fall within one of these categories and are not presented to the Audit Committee as part of the annualpre-approval process are subject to an authorizedpre-approval by the Audit Committee so long as the estimated fee for those services does not exceed $30,000. Any services provided under suchpre-approval will be reported to the Audit Committee at its next regular meeting. Should the amount of such services exceed $30,000 any additional fees will be subject topre-approval by the Committee Chair (or any other Committee member on whom this responsibility has been delegated).
OtherNon-Audit Services
Certainnon-audit services that the independent accountants are legally permitted to render will be subject topre-approval by the Committee or by one or more Committee members to whom the Committee has delegated this authority and who will report to the full Committee anypre-approval decisions made pursuant to this Policy.Non-audit services presented forpre-approval pursuant to this paragraph will be accompanied by a confirmation from both the Treasurer and the independent accountants that the proposed services will not adversely affect the independence of the independent accountants.
Proscribed Services
The Fund’s independent accountants will not render services in the following categories ofnon-audit services:
| | • | | Bookkeeping or other services related to the accounting records or financial statements of the Fund |
| | • | | Financial information systems design and implementation |
| | • | | Appraisal or valuation services, fairness opinions, orcontribution-in-kind reports |
| | • | | Internal audit outsourcing services |
| | • | | Management functions or human resources |
| | • | | Broker or dealer, investment adviser, or investment banking services |
| | • | | Legal services and expert services unrelated to the audit |
| | • | | Any other service that the Public Company Accounting Oversight Board determines, by regulation, is impermissible. |
Pre-approval ofNon-Audit Services Provided to Other Entities Within the PGIM Fund Complex
Certainnon-audit services provided to PGIM Investments LLC or any of its affiliates that also provide ongoing services to the PGIM Mutual Funds will be subject topre-approval by the Audit Committee. The onlynon-audit services provided to these entities that will requirepre-approval are thoserelated directly to the operations and financial reporting of the Funds. Individual projects that are not presented to the Audit Committee as part of the annualpre-approval process will be subject
topre-approval by the Committee Chair (or any other Committee member on whom this responsibility has been delegated) so long as the estimated fee for those services does not exceed $30,000. Services presented forpre-approval pursuant to this paragraph will be accompanied by a confirmation from both the Treasurer and the independent accountants that the proposed services will not adversely affect the independence of the independent accountants.
Although the Audit Committee will notpre-approve all services provided to PGIM Investments LLC and its affiliates, the Committee will receive an annual report from the Fund’s independent accounting firm showing the aggregate fees for all services provided to PGIM Investments and its affiliates.
(e) (2) Percentage of services referred to in 4(b) – 4(d) that were approved by the audit committee–
For the fiscal year ended October 31, 2019, 100% of the services referred to in Item 4(b) was approved by the audit committee. For the fiscal year ended October 31, 2018: none.
(f)Percentage of hours expended attributable to work performed by other than full time employees of principal accountant if greaterthan 50%.
The percentage of hours expended on the principal accountant’s engagement to audit the registrant’s financial statements for the most recent fiscal year that were attributed to work performed by persons other than the principal accountant’s full-time, permanent employees was 0%.
(g)Non-Audit Fees
The aggregatenon-audit fees billed by KPMG for services rendered to the registrant’s investment adviser and any entity controlling, controlled by, or under common control with the investment adviser that provides ongoing services to the registrant for the fiscal years ended October 31, 2019 and October 31, 2018 was $0 and $0, respectively.
(h)Principal Accountant’s Independence
Not applicable as KPMG has not providednon-audit services to the registrant’s investment adviser and any entity controlling, controlled by, or under common control with the investment adviser that provides ongoing services to the registrant that were notpre-approved pursuant to Rule2-01(c)(7)(ii) of RegulationS-X.
Item 5 – Audit Committee of Listed Registrants –
The registrant has a separately designated standing audit committee (the “Audit Committee”) established in accordance with Section 3(a)(58)(A) of the Securities Exchange Act of 1934. The members of the Audit Committee are Kevin J. Bannon (chair), Laurie Simon Hodrick, Michael S. Hyland, CFA, Brian K. Reid, and Keith F. Hartstein(ex-officio).
Item 6 – Schedule of Investments – The schedule is included as part of the report to shareholders filed under Item 1 of this Form.
Item 7 – Disclosure of Proxy Voting Policies and Procedures forClosed-End Management Investment Companies – Not applicable.
Item 8 – Portfolio Managers ofClosed-End Management Investment Companies – Not applicable.
Item 9 – Purchases of Equity Securities byClosed-End Management Investment Company and Affiliated Purchasers – Not applicable.
Item 10 – Submission of Matters to a Vote of Security Holders – There have been no material changes to these procedures.
Item 11 – Controls and Procedures
| | (a) | It is the conclusion of the registrant’s principal executive officer and principal financial officer that the effectiveness of the registrant’s current disclosure controls and procedures (such disclosure controls and procedures having been evaluated within 90 days of the date of this filing) provide reasonable assurance that the information required to be disclosed by the registrant has been recorded, processed, summarized and |
| | reported within the time period specified in the Commission’s rules and forms and that the information required to be disclosed by the registrant has been accumulated and communicated to the registrant’s principal executive officer and principal financial officer in order to allow timely decisions regarding required disclosure. |
| | (b) | There has been no significant change in the registrant’s internal control over financial reporting that occurred during the registrant’s most recent fiscal quarter of the period covered by this report that has materially affected, or is likely to materially affect, the registrant’s internal control over financial reporting. |
Item 12 – Controls and Procedures - Disclosure of Securities Lending Activities forClosed-End Management Investment Companies – Not applicable.
Item 13 – Exhibits
| | (a) | (1) Code of Ethics – Attached hereto as ExhibitEX-99.CODE-ETH |
(2) Certifications pursuant to Section 302 of the Sarbanes-Oxley Act – Attached hereto as ExhibitEX-99.CERT.
(3) Any written solicitation to purchase securities under Rule23c-1. – Not applicable.
| | (b) | Certifications pursuant to Section 906 of the Sarbanes-Oxley Act – Attached hereto as ExhibitEX-99.906CERT. |
SIGNATURES
Pursuant to the requirements of the Securities Exchange Act of 1934 and the Investment Company Act of 1940, the registrant has duly caused this report to be signed on its behalf by the undersigned, thereunto duly authorized.
| | |
| Registrant | | Prudential Investment Portfolios 2 |
| |
| By: | | /s/ Andrew R. French |
| | Andrew R. French |
| | Secretary |
| |
| Date: | | December 19, 2019 |
Pursuant to the requirements of the Securities Exchange Act of 1934 and the Investment Company Act of 1940, this report has been signed below by the following persons on behalf of the registrant and in the capacities and on the dates indicated.
| | |
| By: | | /s/ Stuart S. Parker |
| | Stuart S. Parker |
| | President and Principal Executive Officer |
| |
| Date: | | December 19, 2019 |
| |
| By: | | /s/ Christian J. Kelly |
| | Christian J. Kelly |
| | Treasurer and Principal Financial and Accounting Officer |
| |
| Date: | | December 19, 2019 |