UNITED STATES
SECURITIES AND EXCHANGE COMMISSION
Washington, D.C. 20549
FORM N-CSR
CERTIFIED SHAREHOLDER REPORT OF REGISTERED MANAGEMENT INVESTMENT
COMPANIES
| | |
| |
| Investment Company Act file number: | | 811-09999 |
| |
| Exact name of registrant as specified in charter: | | Prudential Investment Portfolios 2 |
|
| (This Form N-CSR relates solely to the Registrant’s: PGIM Jennison Small-Cap Core Equity Fund, PGIM Core Conservative Bond Fund, PGIM TIPS Fund, PGIM QMA Commodity Strategies Fund, PGIM QMA Mid-Cap Core Equity Fund and PGIM QMA US Broad Market Index Fund.) |
| |
| Address of principal executive offices: | | 655 Broad Street, 17th Floor Newark, New Jersey 07102 |
| |
| Name and address of agent for service: | | Andrew R. French 655 Broad Street, 17th Floor Newark, New Jersey 07102 |
| |
| Registrant’s telephone number, including area code: | | 800-225-1852 |
| |
| Date of fiscal year end: | | 7/31/2020 |
| |
| Date of reporting period: | | 7/31/2020 |
Item 1 – Reports to Stockholders

PGIM Jennison Small-Cap Core Equity Fund
PGIM Core Conservative Bond Fund
PGIM TIPS Fund
PGIM QMA Commodity Strategies Fund
PGIM QMA Mid-Cap Core Equity Fund
PGIM QMA US Broad Market Index Fund
ANNUAL REPORT
JULY 31, 2020

PGIM Day One Underlying Funds
TABLE OF CONTENTS
This report is not authorized for distribution to prospective investors unless preceded or accompanied by a current prospectus.
The views expressed in this report and information about the Funds’ portfolio holdings are for the period covered by this report and are subject to change thereafter.
Mutual funds are distributed by Prudential Investment Management Services LLC, a Prudential Financial company and member SIPC. Jennison Associates LLC is a registered investment adviser. PGIM Fixed Income is a unit of PGIM, Inc. (PGIM), a registered investment adviser. QMA is the primary business name of QMA LLC, a wholly owned subsidiary of PGIM, Inc. (PGIM), a Prudential Financial company. © 2020 Prudential Financial, Inc. and its related entities. PGIM and the PGIM logo are service marks of Prudential Financial, Inc. and its related entities, registered in many jurisdictions worldwide.
| | |
| 2 | | Visit our website at pgim.com/investments |
PGIM Jennison Small-Cap Core Equity Fund
Your Fund’s Performance (unaudited)
Performance data quoted represent past performance. Past performance does not guarantee future results. The investment return and principal value of an investment will fluctuate, so that an investor’s shares, when redeemed, may be worth more or less than their original cost. Current performance may be lower or higher than the past performance data quoted.
| | | | |
| |
| | | Average Annual Total Returns as of 7/31/20 |
| | | One Year (%) | | Since Inception (%) |
| Fund | | 5.50 | | 8.57 (11/15/16) |
| Russell 2000 Index | | | | |
| | | –4.59 | | 4.55 |
The returns in the table do not reflect the deduction of taxes that a shareholder would pay on Fund distributions or following the redemption of Fund shares. Since Inception returns are provided since the Fund has less than 10 fiscal years of returns. Since Inception return for the Index is measured from the closest month-end to the Fund’s inception date.
Growth of a $10,000 Investment
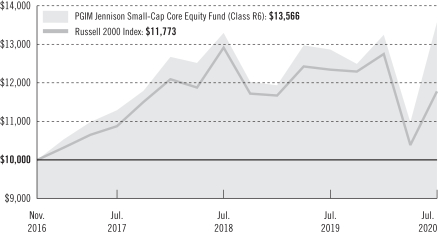
The graph compares a $10,000 investment in the Fund’s Class R6 shares with a similar investment in the Russell 2000 Index (the Index) by portraying the initial account values at the commencement of operations of Class R6 shares and the account values at the end of the current fiscal year (July 31, 2020), as measured on a quarterly basis. The R6 share class assumes an initial investment on November 15, 2016, while the Index assumes that the initial investment occurred on November 30, 2016. For purposes of the graph, and
| | | | |
| PGIM Day One Underlying Funds | | | 3 | |
PGIM Jennison Small-Cap Core Equity Fund
Your Fund’s Performance (continued)
unless otherwise indicated, it has been assumed that (a) all recurring fees (including management fees) were deducted; and (b) all dividends and distributions were reinvested. Without waiver of fees and/or expense reimbursements, the returns would have been lower.
Past performance does not predict future performance. Total returns and the ending account values in the graph include changes in share price and reinvestment of dividends and capital gains distributions in a hypothetical investment for the periods shown. The Fund’s total returns do not reflect the deduction of income taxes on an individual’s investment. Taxes may reduce your actual investment returns on income or gains paid by the Fund or any gains you may realize if you sell your shares.
Benchmark Definitions
Russell 2000 Index—The Russell 2000 Index is an unmanaged index of the 2,000 smallest US companies included in the Russell 3000 Index. It gives an indication of how stock prices of smaller companies have performed.
Investors cannot invest directly in an index. The returns for the Index would be lower if they included the effects of sales charges, operating expenses of a mutual fund, or taxes.
Presentation of Fund Holdings as of 7/31/2020
| | | | |
| PGIM Jennison Small-Cap Core Equity Fund |
| Ten Largest Holdings | | Line of Business | | % of Net Assets |
| Bandwidth, Inc. (Class A Stock) | | Diversified Telecommunication Services | | 2.8% |
| Livongo Health, Inc. | | Health Care Technology | | 2.2% |
| Inphi Corp. | | Semiconductors & Semiconductor Equipment | | 2.2% |
| Saia, Inc. | | Road & Rail | | 2.0% |
| QTS Realty Trust, Inc. (Class A Stock) | | Equity Real Estate Investment Trusts (REITs) | | 1.8% |
| NextEra Energy Partners LP | | Independent Power & Renewable Electricity Producers | | 1.8% |
| Wingstop, Inc. | | Hotels, Restaurants & Leisure | | 1.7% |
| Q2 Holdings, Inc. | | Software | | 1.7% |
| Varonis Systems, Inc. | | Software | | 1.7% |
| Goosehead Insurance, Inc. (Class A Stock) | | Insurance | | 1.7% |
Holdings reflect only long-term investments and are subject to change.
| | |
| 4 | | Visit our website at pgim.com/investments |
PGIM Core Conservative Bond Fund
Your Fund’s Performance (unaudited)
Performance data quoted represent past performance. Past performance does not guarantee future results. The investment return and principal value of an investment will fluctuate, so that an investor’s shares, when redeemed, may be worth more or less than their original cost. Current performance may be lower or higher than the past performance data quoted.
| | | | |
| |
| | | Average Annual Total Returns as of 7/31/20 |
| | | One Year (%) | | Since Inception (%) |
| Fund | | 9.50 | | 4.67 (11/15/16) |
| Bloomberg Barclays US Aggregate Bond Index |
| | | 10.12 | | 5.44 |
The returns in the table do not reflect the deduction of taxes that a shareholder would pay on Fund distributions or following the redemption of Fund shares. Since Inception returns are provided since the Fund has less than 10 fiscal years of returns. Since Inception return for the Index is measured from the closest month-end to the Fund’s inception date.
Growth of a $10,000 Investment
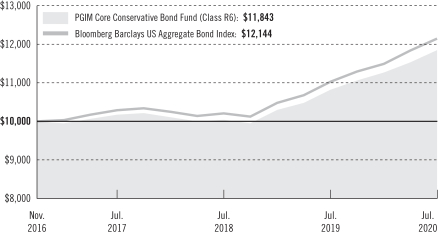
The graph compares a $10,000 investment in the Fund’s Class R6 shares with a similar investment in the Bloomberg Barclays US Aggregate Bond Index (the Index) by portraying the initial account values at the commencement of operations of Class R6 shares and the account values at the end of the current fiscal year (July 31, 2020), as measured on a quarterly basis. The R6 share class assumes an initial investment on November 15, 2016, while the Index assumes that the initial investment occurred on November 30, 2016. For purposes of the graph, and unless otherwise indicated, it has been assumed that (a) all
| | | | |
| PGIM Day One Underlying Funds | | | 5 | |
PGIM Core Conservative Bond Fund
Your Fund’s Performance (continued)
recurring fees (including management fees) were deducted; and (b) all dividends and distributions were reinvested. Without waiver of fees and/or expense reimbursements, the returns would have been lower.
Past performance does not predict future performance. Total returns and the ending account values in the graph include changes in share price and reinvestment of dividends and capital gains distributions in a hypothetical investment for the periods shown. The Fund’s total returns do not reflect the deduction of income taxes on an individual’s investment. Taxes may reduce your actual investment returns on income or gains paid by the Fund or any gains you may realize if you sell your shares.
Benchmark Definitions
Bloomberg Barclays US Aggregate Bond Index—The Bloomberg Barclays US Aggregate Bond Index is unmanaged and represents securities that are SEC registered, taxable, and dollar denominated. It covers the US investment grade fixed rate bond market, with index components for government and corporate securities, mortgage pass-through securities, and asset-backed securities.
Investors cannot invest directly in an index. The returns for the Index would be lower if they included the effects of sales charges, operating expenses of a mutual fund, or taxes.
| | | | |
|
| Credit Quality expressed as a percentage of total investments as of 7/31/20 (%) | |
| AAA | | | 68.1 | |
| AA | | | 5.4 | |
| A | | | 13.6 | |
| BBB | | | 11.0 | |
| BB | | | 0.1 | |
| Cash/Cash Equivalents | | | 1.8 | |
| Total Investments | | | 100.0 | |
Credit ratings reflect the highest rating assigned by a nationally recognized statistical rating organization (NRSRO) such as Moody’s Investors Service, Inc. (Moody’s), S&P Global Ratings (S&P), or Fitch, Inc. (Fitch). Credit ratings reflect the common nomenclature used by both S&P and Fitch. Where applicable, ratings are converted to the comparable S&P/Fitch rating tier nomenclature. These rating agencies are independent and are widely used. Credit ratings are subject to change.
| | |
| 6 | | Visit our website at pgim.com/investments |
PGIM TIPS Fund
Your Fund’s Performance (unaudited)
Performance data quoted represent past performance. Past performance does not guarantee future results. The investment return and principal value of an investment will fluctuate, so that an investor’s shares, when redeemed, may be worth more or less than their original cost. Current performance may be lower or higher than the past performance data quoted.
| | | | |
| |
| | | Average Annual Total Returns as of 7/31/20 |
| | | One Year (%) | | Since Inception (%) |
| Fund | | 9.83 | | 4.37 (11/15/16) |
| Bloomberg Barclays US Treasury Inflation-Protected Securities (TIPS) Index |
| | | 10.38 | | 4.97 |
The returns in the table do not reflect the deduction of taxes that a shareholder would pay on Fund distributions or following the redemption of Fund shares. Since Inception returns are provided since the Fund has less than 10 fiscal years of returns. Since Inception return for the Index is measured from the closest month-end to the Fund’s inception date.
Growth of a $10,000 Investment
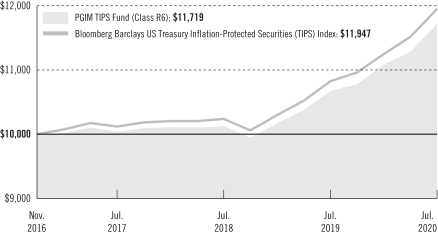
The graph compares a $10,000 investment in the Fund’s Class R6 shares with a similar investment in the Bloomberg Barclays US Treasury Inflation-Protected Securities (TIPS) Index (the Index) by portraying the initial account values at the commencement of operations of Class R6 shares and the account values at the end of the current fiscal year (July 31, 2020), as measured on a quarterly basis. The R6 share class assumes an initial investment on November 15, 2016, while the Index assumes that the initial investment occurred on November 30, 2016. For purposes of the graph, and unless otherwise
| | | | |
| PGIM Day One Underlying Funds | | | 7 | |
PGIM TIPS Fund
Your Fund’s Performance (continued)
indicated, it has been assumed that (a) all recurring fees (including management fees) were deducted; and (b) all dividends and distributions were reinvested. Without waiver of fees and/or expense reimbursements, the returns would have been lower.
Past performance does not predict future performance. Total returns and the ending account values in the graph include changes in share price and reinvestment of dividends and capital gains distributions in a hypothetical investment for the periods shown. The Fund’s total returns do not reflect the deduction of income taxes on an individual’s investment. Taxes may reduce your actual investment returns on income or gains paid by the Fund or any gains you may realize if you sell your shares.
Benchmark Definitions
Bloomberg Barclays US Treasury Inflation-Protected Securities (TIPS) Index—The Bloomberg Barclays US Treasury Inflation-Protected Securities (TIPS) Index is an unmanaged index that consists of inflation-protected securities issued by the US Treasury.
Investors cannot invest directly in an index. The returns for the Index would be lower if they included the effects of sales charges, operating expenses of a mutual fund, or taxes.
| | | | |
|
| Credit Quality expressed as a percentage of total investments as of 7/31/20 (%) | |
| AAA | | | 99.9 | |
| Cash/Cash Equivalents | | | 0.1 | |
| Total Investments | | | 100.0 | |
Credit ratings reflect the highest rating assigned by a nationally recognized statistical rating organization (NRSRO) such as Moody’s Investors Service, Inc. (Moody’s), S&P Global Ratings (S&P), or Fitch, Inc. (Fitch). Credit ratings reflect the common nomenclature used by both S&P and Fitch. Where applicable, ratings are converted to the comparable S&P/Fitch rating tier nomenclature. These rating agencies are independent and are widely used. Credit ratings are subject to change.
| | |
| 8 | | Visit our website at pgim.com/investments |
PGIM QMA Commodity Strategies Fund
Your Fund’s Performance (unaudited)
Performance data quoted represent past performance. Past performance does not guarantee future results. The investment return and principal value of an investment will fluctuate, so that an investor’s shares, when redeemed, may be worth more or less than their original cost. Current performance may be lower or higher than the past performance data quoted.
| | | | |
| |
| | | Average Annual Total Returns as of 7/31/20 |
| | | One Year (%) | | Since Inception (%) |
| Fund | | –10.74 | | –3.39 (11/15/16) |
| Bloomberg Commodity Index |
| | | –12.07 | | –4.55 |
The returns in the table do not reflect the deduction of taxes that a shareholder would pay on Fund distributions or following the redemption of Fund shares. Since Inception returns are provided since the Fund has less than 10 fiscal years of returns. Since Inception return for the Index is measured from the closest month-end to the Fund’s inception date.
Growth of a $10,000 Investment
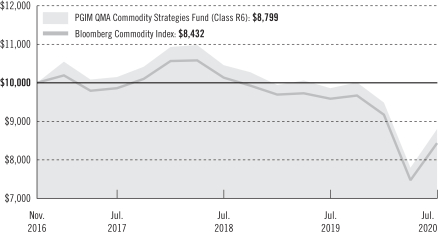
The graph compares a $10,000 investment in the Fund’s Class R6 shares with a similar investment in the Bloomberg Commodity Index (the Index) by portraying the initial account values at the commencement of operations of Class R6 shares and the account values at the end of the current fiscal year (July 31, 2020), as measured on a quarterly basis. The R6 share class assumes an initial investment on November 15, 2016, while the Index assumes that the initial investment occurred on November 30, 2016. For purposes of the graph, and unless otherwise indicated, it has been assumed that (a) all recurring fees
| | | | |
| PGIM Day One Underlying Funds | | | 9 | |
PGIM QMA Commodity Strategies Fund
Your Fund’s Performance (continued)
(including management fees) were deducted; and (b) all dividends and distributions were reinvested. Without waiver of fees and/or expense reimbursements, the returns would have been lower.
Past performance does not predict future performance. Total returns and the ending account values in the graph include changes in share price and reinvestment of dividends and capital gains distributions in a hypothetical investment for the periods shown. The Fund’s total returns do not reflect the deduction of income taxes on an individual’s investment. Taxes may reduce your actual investment returns on income or gains paid by the Fund or any gains you may realize if you sell your shares.
Benchmark Definitions
Bloomberg Commodity Index—The Bloomberg Commodity Index is a diversified benchmark for the commodity futures market. It is composed of futures contracts on 19 physical commodities traded on US exchanges, with the exception of aluminum, nickel, and zinc, which trade on the London Metal Exchange (LME).
Investors cannot invest directly in an index. The returns for the Index would be lower if they included the effects of sales charges, operating expenses of a mutual fund, or taxes.
Presentation of Fund Holdings as of 7/31/2020
| | |
| PGIM QMA Commodity Strategies Fund |
| Ten Largest Commodities Future Exposure Holdings | | % of Net Assets |
| Gold 100 OZ | | 16.5% |
| Copper | | 8.0% |
| Soybean | | 7.4% |
| Silver | | 6.6% |
| Natural Gas | | 5.9% |
| WTI Crude | | 5.0% |
| LME Zinc | | 5.0% |
| Brent Crude | | 4.9% |
| Live Cattle | | 4.3% |
| Sugar #11 (World) | | 4.0% |
Holdings reflect only long-term investments and are subject to change.
| | |
| 10 | | Visit our website at pgim.com/investments |
PGIM QMA Mid-Cap Core Equity Fund
Your Fund’s Performance (unaudited)
Performance data quoted represent past performance. Past performance does not guarantee future results. The investment return and principal value of an investment will fluctuate, so that an investor’s shares, when redeemed, may be worth more or less than their original cost. Current performance may be lower or higher than the past performance data quoted.
| | | | |
| |
| | | Average Annual Total Returns as of 7/31/20 |
| | | One Year (%) | | Since Inception (%) |
| Fund | | –9.42 | | 2.12 (11/17/16) |
| S&P MidCap 400 Index |
| | | –3.54 | | 5.48 |
The returns in the table do not reflect the deduction of taxes that a shareholder would pay on Fund distributions or following the redemption of Fund shares. Since Inception returns are provided since the Fund has less than 10 fiscal years of returns. Since Inception return for the Index is measured from the closest month-end to the Fund’s inception date.
Growth of a $10,000 Investment
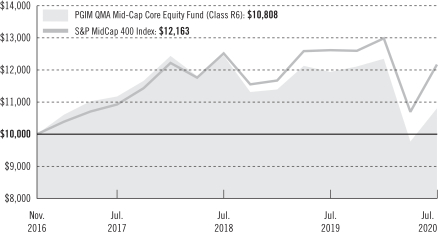
The graph compares a $10,000 investment in the Fund’s Class R6 shares with a similar investment in the S&P MidCap 400 Index (the Index) by portraying the initial account values at the commencement of operations of Class R6 shares and the account values at the end of the current fiscal year (July 31, 2020), as measured on a quarterly basis. The R6 share class assumes an initial investment on November 17, 2016, while the Index assumes that the initial investment occurred on November 30, 2016. For purposes of the graph, and unless otherwise indicated, it has been assumed that (a) all recurring fees
| | | | |
| PGIM Day One Underlying Funds | | | 11 | |
PGIM QMA Mid-Cap Core Equity Fund
Your Fund’s Performance (continued)
(including management fees) were deducted; and (b) all dividends and distributions were reinvested. Without waiver of fees and/or expense reimbursements, the returns would have been lower.
Past performance does not predict future performance. Total returns and the ending account values in the graph include changes in share price and reinvestment of dividends and capital gains distributions in a hypothetical investment for the periods shown. The Fund’s total returns do not reflect the deduction of income taxes on an individual’s investment. Taxes may reduce your actual investment returns on income or gains paid by the Fund or any gains you may realize if you sell your shares.
Benchmark Definitions
S&P MidCap 400 Index—The S&P MidCap 400 Index is designed to measure the performance of 400 mid-sized companies in the US.
Investors cannot invest directly in an index. The returns for the Index would be lower if they included the effects of sales charges, operating expenses of a mutual fund, or taxes.
Presentation of Fund Holdings as of 7/31/2020
| | | | |
| PGIM QMA Mid-Cap Core Equity Fund |
| Ten Largest Holdings | | Line of Business | | % of Net Assets |
| iShares Core S&P Mid-Cap ETF | | Exchange-Traded Fund | | 2.1% |
| Etsy, Inc. | | Internet & Direct Marketing Retail | | 1.4% |
| Quidel Corp. | | Health Care Supplies | | 1.2% |
| Molina Healthcare, Inc. | | Managed Health Care | | 1.2% |
| Bio-Techne Corp. | | Life Sciences Tools & Services | | 1.1% |
| Ciena Corp. | | Communications Equipment | | 1.1% |
| Royal Gold, Inc. | | Gold | | 1.1% |
| Monolithic Power Systems, Inc. | | Semiconductors | | 1.1% |
| PTC, Inc. | | Application Software | | 1.0% |
| Manhattan Associates, Inc. | | Application Software | | 1.0% |
Holdings reflect only long-term investments and are subject to change.
| | |
| 12 | | Visit our website at pgim.com/investments |
PGIM QMA US Broad Market Index Fund
Your Fund’s Performance (unaudited)
Performance data quoted represent past performance. Past performance does not guarantee future results. The investment return and principal value of an investment will fluctuate, so that an investor’s shares, when redeemed, may be worth more or less than their original cost. Current performance may be lower or higher than the past performance data quoted.
| | | | |
| |
| | | Average Annual Total Returns as of 7/31/20 |
| | | One Year (%) | | Since Inception (%) |
| Fund | | 10.71 | | 12.84 (11/17/16) |
| S&P Composite 1500 Index |
| | | 10.40 | | 12.83 |
The returns in the table do not reflect the deduction of taxes that a shareholder would pay on Fund distributions or following the redemption of Fund shares. Since Inception returns are provided since the Fund has less than 10 fiscal years of returns. Since Inception return for the Index is measured from the closest month-end to the Fund’s inception date.
Growth of a $10,000 Investment
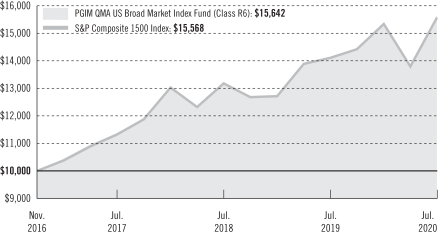
The graph compares a $10,000 investment in the Fund’s Class R6 shares with a similar investment in the S&P Composite 1500 Index (the Index) by portraying the initial account values at the commencement of operations of Class R6 shares and the account values at the end of the current fiscal year (July 31, 2020), as measured on a quarterly basis. The R6 share class assumes an initial investment on November 17, 2016, while the Index assumes that the initial investment occurred on November 30, 2016. For purposes of the graph, and unless otherwise indicated, it has been assumed that (a) all recurring fees (including management fees) were deducted; and (b) all dividends and distributions were reinvested. Without waiver of fees and/or expense reimbursements, the returns would have been lower.
| | | | |
| PGIM Day One Underlying Funds | | | 13 | |
PGIM QMA US Broad Market Index Fund
Your Fund’s Performance (continued)
Past performance does not predict future performance. Total returns and the ending account values in the graph include changes in share price and reinvestment of dividends and capital gains distributions in a hypothetical investment for the periods shown. The Fund’s total returns do not reflect the deduction of income taxes on an individual’s investment. Taxes may reduce your actual investment returns on income or gains paid by the Fund or any gains you may realize if you sell your shares.
Benchmark Definitions
S&P Composite 1500 Index—The S&P Composite 1500® Index is an unmanaged index of stocks of 1,500 US companies, with market capitalizations ranging from small to large. The S&P Composite 1500 Index is a combination of three leading US stock indices: The S&P 500 Index (which measures the performance of US Large Cap stocks), the S&P MidCap 400 Index (which measures the performance of Mid Cap stocks) and the S&P 600 Index (which measures the performance of US Small Cap stocks) and gives an indication of how the broad US stock market has performed. Index returns do not include the effect of any sales charges, mutual fund operating expenses or taxes. These returns would be lower if they included the effect of these expenses.
Investors cannot invest directly in an index. The returns for the Index would be lower if they included the effects of sales charges, operating expenses of a mutual fund, or taxes.
Presentation of Fund Holdings as of 7/31/2020
| | | | |
| PGIM QMA US Broad Market Index Fund |
| Ten Largest Holdings | | Line of Business | | % of Net Assets |
| Apple, Inc. | | Technology Hardware, Storage & Peripherals | | 5.5% |
| Microsoft Corp. | | Software | | 4.9% |
| Amazon.com, Inc. | | Internet & Direct Marketing Retail | | 4.2% |
| iShares Core S&P 500 ETF | | Exchange-Traded Funds | | 3.5% |
| Facebook, Inc. (Class A Stock) | | Interactive Media & Services | | 1.9% |
| Alphabet, Inc. (Class A Stock) | | Interactive Media & Services | | 1.4% |
| Alphabet, Inc. (Class C Stock) | | Interactive Media & Services | | 1.4% |
| Johnson & Johnson | | Pharmaceuticals | | 1.2% |
| Berkshire Hathaway, Inc. (Class B Stock) | | Diversified Financial Services | | 1.2% |
| Procter & Gamble Co. (The) | | Household Products | | 1.0% |
Holdings reflect only long-term investments and are subject to change.
| | |
| 14 | | Visit our website at pgim.com/investments |
PGIM Jennison Small-Cap Core Equity Fund
Strategy and Performance Overview
How did the Fund perform?
The PGIM Jennison Small-Cap Core Equity Fund’s Class R6 shares returned 5.50% in the 12-month reporting period that ended July 31, 2020, outperforming the -4.59% return of the Russell 2000 Index (the Index).
What was the market environment?
| | • | | US equity markets were highly volatile during the reporting period, unsettled by US-China trade discord; softening economic growth in the US, Europe, and China; geopolitical uncertainties; and the global spread of COVID-19, the disease caused by the coronavirus. |
| | • | | The US political landscape likewise was unsettled as investigations of interference in the 2016 presidential election unfolded, impeachment hearings against President Trump proceeded, the 2020 election cycle ramped up, and leaders politicized the pandemic. |
| | • | | The Federal Reserve lowered the federal funds rate four times during the period, ending it in a target range of 0.00%-0.25%. Stocks peaked at new highs on February 19, 2020, then dropped more than 30% in only 25 trading days as the COVID-19 outbreak spread rapidly around the globe, disrupting markets and life virtually everywhere. Policymakers responded to these events with historic monetary and fiscal stimulus. |
| | • | | Equity markets rebounded strongly during the period’s final quarter, but the pandemic’s economic damage continued to accumulate. US gross domestic product plummeted 32.9% during the second quarter of 2020, the largest decline in post-World War II history. |
| | • | | During the period, small-cap stocks, as measured by the Russell 2000 Index, significantly underperformed their large-cap counterparts, as measured by the Russell 1000 Index. |
What worked?
| | • | | Health care holdings were strong contributors to the Fund’s performance: |
| | • | | Livongo Health Inc., which develops applied health signals for treating chronic health conditions, reported first-quarter 2020 earnings that exceeded its pre-announced estimate. In Jennison’s view, healthcare delivery is at an inflection point where virtual or remote care is no longer the last option but, instead, is becoming the first line or standard of care. Furthermore, Jennison believes Livongo’s first-in-market advantage, brand-name recognition and strong return on investment bode well for future growth. |
| | • | | Horizon Therapeutics Plc has transitioned from a specialized pharmaceutical firm to a successful developer of drugs for people with rare diseases. The company’s primary growth drivers over the next two to three years are Krystexxa (for uncontrollable gout) and Tepezza (for thyroid eye disease). Its first-quarter 2020 sales of $356 million were well |
| | | | |
| PGIM Day One Underlying Funds | | | 15 | |
PGIM Jennison Small-Cap Core Equity Fund
Strategy and Performance Overview (continued)
| | above consensus estimates. With its very attractive balance sheet and the two products that could drive substantial revenue growth, Jennison believes that Horizon has further upside potential from merger-and-acquisition activity as a buyer and a seller. |
| | • | | Teladoc Health, Inc., the world’s largest telemedicine company, uses web, mobile apps, video, and phone platforms to connect patients with physicians. While telemedicine has been growing rapidly for several years with many large employers and health plans offering it to members, utilization rates have remained relatively low. However, the COVID-19 outbreak has given rise to what Jennison believes is a sea change that could permanently modify healthcare benefits, treatment, and consumer behavior. In the current environment, employees are now seeking out telemedicine services, and insurance plans are waiving co-pays and co-insurance for users. Jennison eliminated its Teladoc position in June 2020 as the company’s market capitalization increased beyond the Fund strategy’s investable range. |
| | • | | Inphi Corp. was a standout performer in the information technology sector. The company produces high-speed analog and mixed-signal semiconductor components and optical subsystems to networking original equipment manufacturers, optical module, cloud, and telecom service providers. Revenue in the first quarter of 2020 reached a record due to higher demand for the company’s cloud and telecommunications products. Jennison believes paradigm shifts brought on by work-from-home, electronic commerce, distance-learning, streaming, and other remote-usage activities could lead to a continued acceleration of bandwidth upgrades that could support the company’s growth. |
| | • | | Bandwidth Inc., a diversified telecommunications company that sells software application programming interfaces for voice and messaging, drove outperformance in the communication services sector. The company’s shares rallied as it reported robust first-quarter 2020 revenue growth and year-over-year customer growth that exceeded expectations. Jennison believes the pandemic’s push to remote work is advantageous for Bandwidth. |
What didn’t work?
| | • | | Many of the Fund’s largest detractors were in the financials sector. Overall, the sector fell sharply in response to the pandemic, the resulting collapse of the global economy, and expectations that interest rates would be “lower for longer,” which could crimp profit margins in several groups. The largest detractors included MFA Financial Inc. (real estate investment trust); BankUnited Inc. and Ameris Bancorp (regional banks); and Pinnacle Financial Partners Inc. (community bank). Jennison eliminated its position in MFA but retains long-term convictions in the other holdings, believing they are well-run banks in attractive markets. |
| | |
| 16 | | Visit our website at pgim.com/investments |
| | • | | In industrials, CIRCOR International Inc.—a global manufacturer of flow and motion control products serving industrial, energy, and marine markets—underperformed during the period. Jennison eliminated its position in May 2020, concerned that the company may experience a prolonged downturn in its business. |
Current outlook
| | • | | A troubling new surge in COVID-19 infection rates in several states near the end of the period has led to second thoughts about moving forward with scheduled, phased-in reopenings. |
| | • | | Given the high degree of uncertainty, Jennison believes companies are taking a more cautious approach to near-term business planning. Likewise, many companies are suspending financial guidance for now with the hope of providing greater clarity later this year. |
| | • | | Jennison has spent the past several months attempting to assess the impact of COVID-19 on Fund holdings by speaking with management teams from each company held in the portfolio. Jennison believes such conversations have helped provide a better understanding of the pandemic’s immediate effects on these businesses, but precise estimates of the impact over the balance of 2020 and longer term are not yet possible given the substantially greater-than-normal uncertainty. |
| | • | | As economic and market uncertainty rise, Jennison continues to identify companies that have strong fundamentals and might outperform market averages. Jennison believes this strategy favors the Fund’s disciplined and bottom-up investment approach that focuses on identifying above-average growers with reasonable valuations. |
| | • | | While Jennison has taken some profits in stocks with share prices that have rebounded significantly, the Fund’s overall exposure has increased in communication services, consumer discretionary, healthcare, and information technology to reflect where Jennison sees the best potential opportunities in the new environment due to COVID-19. |
| | | | |
| PGIM Day One Underlying Funds | | | 17 | |
PGIM Core Conservative Bond Fund
Strategy and Performance Overview
How did the Fund perform?
The PGIM Core Conservative Bond Fund’s Class R6 shares returned 9.50% in the 12-month reporting period that ended July 31, 2020, underperforming the 10.12% return of the Bloomberg Barclays US Aggregate Bond Index (the Index).
What were the market conditions?
| | • | | Following several stable months, the last part of the reporting period was dominated by the global outbreak of COVID-19, its economic impact, and the resulting decline in risk sentiment around the globe. After generating sizable returns throughout the latter part of 2019, credit spreads widened sharply during the first quarter of 2020 as the coronavirus and an oil price shock led to acute declines across most spread sectors. (Credit spreads are yield differentials between corporate bonds and US Treasuries of comparable maturity.) In response to unprecedented monetary and fiscal stimulus programs aimed at stabilizing the economy and financial markets, spreads subsequently tightened sharply but remained wider than their pre-COVID-19 levels. |
| | • | | Through the first part of the period, spread sectors benefited from accommodative central banks, low and range-bound interest rates, and an extended (albeit slow) economic expansion. The signing of a phase-one US-China trade deal further boosted sentiment toward the end of 2019 and through most of January 2020. However, this optimism proved short-lived as markets came under heavy pressure in February and March when growing concerns around the coronavirus and a decline in oil prices sparked a sharp sell-off across most asset classes. |
| | • | | US investment-grade bond spreads rose to a high of approximately 375 basis points (bps) in mid-March before narrowing into quarter-end following aggressive actions by the Federal Reserve (the Fed). (One basis point equals 0.01%.) Collateralized loan obligation (CLO) spreads widened across the board, with AAA-rated tranches widening 117 bps during the first quarter to 250 bps. Commercial mortgage-backed securities (CMBS) spreads also widened across the capital stack, with those of high-quality tranches of conduit CMBS widening by 98 bps during the quarter. |
| | • | | Following a difficult March, spread markets rebounded sharply as the Fed’s aggressive stimulus actions—including a near-zero federal funds rate, purchases of mortgage-backed securities (MBS) and CMBS, primary and secondary corporate credit facilities, and a term asset-backed loan facility (TALF)—significantly improved market liquidity. Risk-on sentiment saw spreads decline sharply over the last four months of the period. |
| | • | | US Treasury yields fell sharply across the curve during the period, with the yield on the 2-year Treasury note declining from 1.89% to 0.11%. The yield on the 10-year Treasury note declined from 2.02% at the beginning of the period to 0.55% at the end of July. |
| | |
| 18 | | Visit our website at pgim.com/investments |
| | • | | One of the more notable developments within the US Treasuries complex during the second quarter of 2020 was a sharp steepening of the yield curve on some initial signs of a solid economic rebound. The 2- to 10-year segment of the curve began the quarter at 43 bps and subsequently bear-steepened to 69 bps following a stronger-than-expected May payrolls report. (Bear steepening is a change in the yield curve wherein longer-term yields rise faster than short-term yields.) This set the stage for subsequent curve flattening amid renewed expectations for a gradual economic recovery and years of broad monetary accommodation. |
What worked?
| | • | | Strong security selection was highlighted by positioning in investment-grade corporates, MBS, Treasuries, and CMBS, which all contributed to the Fund’s performance during the period. |
| | • | | Within credit, positioning in the upstream energy, healthcare & pharmaceuticals, banking, and technology industries contributed to results. |
| | • | | In individual security selection, the Fund benefited from its positioning in Occidental Petroleum Corp. and Continental Resources (upstream energy), Abbvie, Mylan, and Amgen (healthcare & pharmaceuticals), Barclays, Goldman Sachs, and Wells Fargo (banking), and Oracle and Microsoft (technology). |
| | • | | The Fund’s duration and curve positioning were modest contributors to performance during the period. (Duration measures the sensitivity of the price (the value of principal) of a bond to a change in interest rates.) |
What didn’t work?
| | • | | Overall sector allocation was negative, a spread-duration contribution overweight in CMBS, investment-grade corporates, and municipal bonds limited results. (Spread duration is the change in a bond’s price for a 100-bps change in that bond’s spread versus a US Treasury security of similar maturity.) |
| | • | | The Fund’s positioning in the midstream energy, telecom, and foreign non-corporate sectors detracted from performance. |
| | • | | In individual security selection, the Fund’s positioning in ONEOK, Inc. and Energy Transfer Partners (midstream energy), AT&T, Inc. (telecom), and Petroleos Mexicanos (foreign non-corporate) detracted from performance. |
Current outlook
| | • | | Although spread sectors rebounded significantly in the second quarter of 2020, spreads remained wider than their pre-COVID-19 levels. PGIM Fixed Income continues to find value within sectors such as investment-grade corporate bonds and asset-backed |
| | | | |
| PGIM Day One Underlying Funds | | | 19 | |
PGIM Core Conservative Bond Fund
Strategy and Performance Overview (continued)
| | securities (ABS) which represent attractive value in relation to Treasuries and agency mortgage-backed securities. |
| | • | | The Fund was overweight in structured products (CMBS and ABS), investment-grade corporate bonds, and municipal bonds when the period ended. The Fund was underweight US Treasury securities and agency mortgage-backed securities. |
| | • | | Within structured products, PGIM Fixed Income maintains the Fund’s bias toward the top of the capital structure, based on the belief that these securities may revisit their post-crisis tights. PGIM Fixed Income generally holds a negative view on lower-quality structured products that are subordinate in the capital structure. |
| | • | | Within investment-grade corporate bonds, PGIM Fixed Income favors shorter-term maturities that should benefit from the Fed’s bond-buying program. PGIM Fixed Income is looking to take advantage of spread compression in select higher-yielding BBB-rated bonds, distressed survivors, cyclical sectors such as autos and chemicals, and “off-the-run” bonds (i.e., older issues). In addition, PGIM Fixed Income still favors electric utilities and money center banks. |
| | |
| 20 | | Visit our website at pgim.com/investments |
PGIM TIPS Fund
Strategy and Performance Overview
How did the Fund perform?
The PGIM TIPS Fund’s Class R6 shares returned 9.83% in the 12-month reporting period that ended July 31, 2020, underperforming the 10.38% return of the Bloomberg Barclays US Treasury Inflation-Protected Securities (TIPS) Index (the Index).
What were the market conditions?
| | • | | Following several stable months, the last part of the reporting period was dominated by the global outbreak of COVID-19, its economic impact, and the resulting decline in risk sentiment around the globe. After generating sizable returns throughout the latter part of 2019, credit markets declined sharply during the first quarter of 2020 as the coronavirus and an oil price shock led to steep economic losses. In response, the Federal Reserve (the Fed) and the US government introduced unprecedented monetary and fiscal stimulus programs aimed at stabilizing the economy and financial markets. |
| | • | | Through much of the period, spread sectors benefited from accommodative central banks, low and range-bound interest rates, and an extended (albeit slow) economic expansion. The signing of a phase-one US-China trade deal further boosted sentiment toward the end of 2019 and through most of January 2020. However, this optimism proved short-lived, as markets came under heavy pressure in February and March when growing concerns around the coronavirus and a decline in oil prices sparked a sharp sell-off across most asset classes. |
| | • | | After a difficult March, markets rebounded sharply, as the Fed’s aggressive stimulus actions, including a near-zero federal funds rate, significantly improved market liquidity. Unprecedented monetary stimulus was paired with powerful fiscal interventions as the US Congress approved over $2.5 trillion in spending and tax breaks, with further stimulus measures expected to be announced later this year. |
| | • | | While US economic growth was solid in 2019, the economy sustained an historic contraction through the first half of 2020, with gross domestic product declining at an annualized rate of 5% and 31.7%, respectively, in the first and second quarters. Reflecting the devastating economic downturn, inflation expectations sagged before rebounding in the last few months of the period, as high levels of central bank liquidity and government debt triggered inflation expectations over the longer run. The 10-year break-even inflation rate declined to a low of 0.50% in mid-March before ending the period at 1.55%. |
| | • | | US Treasury yields declined sharply during the period. The yield on the 2-year Treasury note began the period at 1.89% and ended it at 0.11%. The yield on the 10-year Treasury note began the period at 2.02% and closed at 0.55%. Inflation declined during the period as the virus-related shutdown depressed aggregate demand. For the 12 months that ended June 30, 2020 (the latest period for which data was published), |
| | | | |
| PGIM Day One Underlying Funds | | | 21 | |
PGIM TIPS Fund
Strategy and Performance Overview (continued)
| | core personal consumption expenditures (PCE) inflation was 0.9%, well below the Fed’s 2% target. |
What worked?
Yield curve flattener positioning added modestly to the Fund’s performance for the reporting period.
What didn’t work?
| | • | | Security selection detracted from the Fund’s performance during the reporting period. |
| | • | | The duration of the Fund was tactically managed versus the Index during the period. Overall, duration positioning hurt performance. The Fund ended the period with a nearly flat duration position versus the Index. (Duration measures the sensitivity of the price—the value of principal—of a bond to a change in interest rates.) |
| | • | | Trading costs associated with flow activity in the Fund, as the market experienced turmoil late in the first quarter and throughout the second quarter of 2020, were a detractor from performance. |
Current outlook
| | • | | Financial markets continued to post solid gains in July 2020 on the back of a flood of monetary and fiscal stimulus. The outcome of the Fed’s meeting on July 29 was largely as expected. While financial market functioning has largely been restored by the Fed’s aggressive actions, the economy is still operating at a level well below its pre-virus pace. The Fed thus reiterated its intent to provide monetary support for as long as needed for what is expected to be a long, drawn-out recovery. |
| | • | | Fed Chairman Jerome Powell emphasized this is first and foremost a health crisis, and the path of the economy will depend on the path of the virus going forward. The Fed is watching for any potential slowdown in economic activity in the aftermath of the pickup in virus cases in June and for potential additional virus flare-ups. While news that a vaccine might possibly become available around year-end is a hopeful development, Powell emphasized the Fed’s job right now is not to plan for upside surprises but to focus on supplying the support that is currently needed. |
| | • | | The Fed has already given guidance that the federal funds rate is expected to remain at its current near-zero level until the economy is well on its way to achieving the Fed’s inflation and employment mandates. While the Fed’s much-anticipated Policy Framework Review, previously expected to be released around June 2020, was sidelined by the crisis, Powell provided a preview in his press conference, noting it would likely simply codify much of what the Fed has already been doing. |
| | |
| 22 | | Visit our website at pgim.com/investments |
| | • | | Both the massive monetary and fiscal support have undoubtedly contributed to the rebound in activity that began in May. Household spending has recovered about half of its previous decline, and employment has regained about one-third of its losses, although June unemployment remained at a still-elevated 11.1%. Auto sales and housing activity have picked up strongly, but business fixed investment has yet to show any recovery. |
| | • | | The aftermath effects on the economy of the COVID-19 crisis are expected to be fundamentally disinflationary, with the federal funds rate expected to stay at its current level for at least the next several years. |
| | | | |
| PGIM Day One Underlying Funds | | | 23 | |
PGIM QMA Commodity Strategies Fund
Strategy and Performance Overview
How did the Fund perform?
The PGIM QMA Commodity Strategies Fund’s Class R6 shares returned -10.74% in the 12-month reporting period that ended July 31, 2020, outperforming the -12.07% return of the Bloomberg Commodity Index (the Index).
What were the market conditions?
For the reporting period, the energy sector experienced a sell-off amid global economic slowdown fears, which drove the negative results generated by the Index. Most other sectors in the Index posted negative results as well, led by declines in the livestock sector. Precious metals was the one exception, as the sector generated strong results over the period as the US dollar weakened.
What worked?
| | • | | The Fund’s gains for the period were driven by performance in the second quarter of 2020, where the Fund benefited from positioning in the energy, livestock, and precious metals sectors. |
| | • | | Over the full period, the Fund’s positioning in gasoline was the largest contributor to excess returns. |
What didn’t work?
| | • | | An underweight position in soft commodities detracted from the Fund’s return in the fourth quarter of 2019. |
| | • | | The Fund’s positioning in crude oil and coffee detracted most from performance for the period overall. |
Did the Fund hold derivatives?
The Fund primarily trades in listed exchange-traded commodities futures contracts. These futures are a form of derivatives based on the underlying price of a specific commodity. Since the Fund is invested primarily in these derivatives, its performance during the reporting period (see above) is explained by the derivatives.
Current outlook
As of the end of the reporting period, the Fund was positioned with overweights in the industrial metals and livestock sectors and held underweight positions in the soft commodities, energy, and precious metals sectors. Within grains, the Fund was overweight soybeans and soybean oil while underweight corn and wheat.
| | |
| 24 | | Visit our website at pgim.com/investments |
PGIM QMA Mid-Cap Core Equity Fund
Strategy and Performance Overview
How did the Fund perform?
The PGIM QMA Mid-Cap Core Equity Fund’s Class R6 Shares returned -9.42 % in the 12-month reporting period that ended July 31, 2020, underperforming the -3.54% return of the S&P MidCap 400 Index (the Index).
What were the market conditions?
| | • | | While US equities reached record highs in February 2020, the gains soon came to a screeching halt as the COVID-19 pandemic that originated in China spread to the US, pushing global economies into recession. This resulted in a very volatile and negative first quarter of 2020 for equities across the globe. |
| | • | | Aided by unprecedented fiscal and monetary stimulus, US equities overall performed quite well since the first quarter of 2020 through the end of the reporting period. |
| | • | | Equities received an additional boost from positive news surrounding COVID-19 vaccine and treatment developments. |
What worked?
| | • | | The Fund is comprised of a diversified portfolio of stocks that QMA identifies as attractive using a proprietary quantitative model. The model evaluates stocks based on quality, earnings expectations, and relative value metrics. The emphasis on these factors varies based on the growth rate of the company under evaluation. |
| | • | | Overweighting companies with improving growth prospects, while underweighting those with deteriorating growth prospects, was a valuable contributor over the reporting period. |
| | • | | The Fund’s sector weights are established using bottom-up stock selection, and limits are placed on how much these weights can differ from the Index. Modestly overweighting the healthcare sector, which was the top-performing sector in the Index over the period, benefited the Fund. |
What didn’t work?
| | • | | For slower-growing firms, QMA favors stocks that are inexpensive relative to their industry peers. Over the reporting period, value factors produced negative excess return. While value started to perform well toward the end of 2019, the pandemic was a major drag on value’s performance. |
| | • | | Stock selection in the industrials and consumer discretionary sectors lagged the Index. The aforementioned challenges that QMA’s value factors faced were most evident in these two sectors. |
| | | | |
| PGIM Day One Underlying Funds | | | 25 | |
PGIM QMA Mid-Cap Core Equity Fund
Strategy and Performance Overview (continued)
Did the Fund hold derivatives?
The Fund did not hold derivatives over the reporting period. It did, however, hold exchange-traded funds that track the Index. QMA uses these instruments primarily to manage daily cash flows and provide liquidity, not as a means of adding to performance. Subsequently, the effect on performance was minimal.
Current outlook
QMA continues to emphasize the deep discounts present in this market. While heightened volatility may return as the pandemic works itself out, QMA feels the worst of the market drawdown is over. QMA continues to closely monitor the portfolios it manages during these uncertain times and is constantly looking for ways to improve its process. QMA still believes its portfolios are well positioned to capitalize on robust opportunities ahead as the market rewards reasonably priced stocks with strong fundamentals.
| | |
| 26 | | Visit our website at pgim.com/investments |
PGIM QMA US Broad Market Index Fund
Strategy and Performance Overview
How did the Fund perform?
The PGIM QMA US Broad Market Index Fund’s Class R6 shares returned 10.71% in the 12-month reporting period that ended July 31, 2020, outperforming the 10.40% return of the S&P 1500 Composite Index (the Index).
What were the market conditions?
| | • | | While US equities reached record highs in February 2020, the gains soon came to a screeching halt as the COVID-19 pandemic that originated in China spread to the US, pushing global economies into recession. This resulted in a very volatile and negative first quarter of 2020 for equities across the globe. |
| | • | | Aided by unprecedented fiscal and monetary stimulus, US equities overall performed quite well since the first quarter of 2020 through the end of the reporting period. |
| | • | | Equities received an additional boost from positive news surrounding COVID-19 vaccine and treatment developments. |
What worked?
| | • | | The Fund’s performance closely tracked the Index’s performance over the reporting period. |
| | • | | The Fund held all stocks included in the Index in approximately the same proportions. |
Did the Fund hold derivatives?
| | • | | The Fund held S&P 500, S&P 400, and Russell 2000 E-Mini stock index futures, a form of derivatives, to maintain exposure to equities and provide portfolio liquidity. Futures had minimal impact on performance over the reporting period. |
| | | | |
| PGIM Day One Underlying Funds | | | 27 | |
Fees and Expenses (unaudited)
As a shareholder of a Fund, you incur two types of costs: (1) transaction costs, including sales charges (loads) on purchase payments and redemptions, as applicable, and (2) ongoing costs, including management fees, distribution, and other Fund expenses, as applicable. This example is intended to help you understand your ongoing costs (in dollars) of investing in the Fund and to compare these costs with the ongoing costs of investing in other mutual funds.
The example is based on an investment of $1,000 held through the six-month period ended July 31, 2020. The example is for illustrative purposes only; you should consult the Funds’ Prospectus for information on initial and subsequent minimum investment requirements.
Actual Expenses
The first line in the tables below provide information about actual account values and actual expenses. You may use the information on this line, together with the amount you invested, to estimate the expenses that you paid over the period. Simply divide your account value by $1,000 (for example, an $8,600 account value ÷ $1,000 = 8.6), then multiply the result by the number on the first line under the heading “Expenses Paid During the Six-Month Period” to estimate the expenses you paid on your account during this period.
Hypothetical Example for Comparison Purposes
The second line in the tables below provide information about hypothetical account values and hypothetical expenses based on a Fund’s actual expense ratio and an assumed rate of return of 5% per year before expenses, which is not a Fund’s actual return. The hypothetical account values and expenses may not be used to estimate the actual ending account balance or expenses you paid for the period. You may use this information to compare the ongoing costs of investing in a Fund and other funds. To do so, compare this 5% hypothetical example with the 5% hypothetical examples that appear in the shareholder reports of the other funds.
Please note that the expenses shown in the table are meant to highlight your ongoing costs only and do not reflect any transactional costs such as sales charges (loads). Therefore, the second line in each table is useful in comparing ongoing costs only and will not help you determine the relative total costs of owning different funds. In addition, if these transactional costs were included, your costs would have been higher.
| | | | | | | | | | | | | | | | | | |
| | | | |
PGIM Jennison
Small-Cap Core
Equity Fund | | Beginning Account
Value
February 1, 2020 | | | Ending Account
Value
July 31, 2020 | | | Annualized
Expense Ratio
Based on the
Six-Month Period | | | Expenses Paid
During the
Six-Month Period* | |
| Class R6 | | Actual | | $ | 1,000.00 | | | $ | 1,024.70 | | | | 0.95 | % | | $ | 4.78 | |
| | | Hypothetical | | $ | 1,000.00 | | | $ | 1,020.14 | | | | 0.95 | % | | $ | 4.77 | |
| | |
| 28 | | Visit our website at pgim.com/investments |
| | | | | | | | | | | | | | | | | | |
| | | | |
PGIM Core
Conservative Bond Fund | | Beginning Account
Value
February 1, 2020 | | | Ending Account
Value
July 31, 2020 | | | Annualized
Expense Ratio
Based on the
Six-Month Period | | | Expenses Paid
During the
Six-Month Period* | |
| Class R6 | | Actual | | $ | 1,000.00 | | | $ | 1,051.70 | | | | 0.50 | % | | $ | 2.55 | |
| | | Hypothetical | | $ | 1,000.00 | | | $ | 1,022.38 | | | | 0.50 | % | | $ | 2.51 | |
| | | | | | | | | | | | | | | | | | |
| | | | |
PGIM
TIPS Fund | | Beginning Account
Value
February 1, 2020 | | | Ending Account
Value
July 31, 2020 | | | Annualized
Expense Ratio
Based on the
Six-Month Period | | | Expenses Paid
During the
Six-Month Period* | |
| Class R6 | | Actual | | $ | 1,000.00 | | | $ | 1,057.40 | | | | 0.40 | % | | $ | 2.05 | |
| | | Hypothetical | | $ | 1,000.00 | | | $ | 1,022.87 | | | | 0.40 | % | | $ | 2.01 | |
| | | | | | | | | | | | | | | | | | |
| | | | |
PGIM QMA Commodity
Strategies Fund | | Beginning Account
Value
February 1, 2020 | | | Ending Account
Value
July 31, 2020 | | | Annualized
Expense Ratio
Based on the
Six-Month Period | | | Expenses Paid
During the
Six-Month Period* | |
| Class R6 | | Actual | | $ | 1,000.00 | | | $ | 927.70 | | | | 0.87 | % | | $ | 4.17 | |
| | | Hypothetical | | $ | 1,000.00 | | | $ | 1,020.54 | | | | 0.87 | % | | $ | 4.37 | |
| | | | | | | | | | | | | | | | | | |
| | | | |
PGIM QMA
Mid-Cap Core Equity Fund | | Beginning Account
Value
February 1, 2020 | | | Ending Account
Value
July 31, 2020 | | | Annualized
Expense Ratio
Based on the
Six-Month Period | | | Expenses Paid
During the
Six-Month Period* | |
| Class R6 | | Actual | | $ | 1,000.00 | | | $ | 875.70 | | | | 0.85 | % | | $ | 3.96 | |
| | | Hypothetical | | $ | 1,000.00 | | | $ | 1,020.64 | | | | 0.85 | % | | $ | 4.27 | |
| | | | | | | | | | | | | | | | | | |
| | | | |
PGIM QMA
US Broad Market
Index Fund | | Beginning Account
Value
February 1, 2020 | | | Ending Account
Value
July 31, 2020 | | | Annualized
Expense Ratio
Based on the
Six-Month Period | | | Expenses Paid
During the
Six-Month Period* | |
| Class R6 | | Actual | | $ | 1,000.00 | | | $ | 1,018.60 | | | | 0.20 | % | | $ | 1.00 | |
| | | Hypothetical | | $ | 1,000.00 | | | $ | 1,023.87 | | | | 0.20 | % | | $ | 1.01 | |
*Fund expenses (net of fee waivers or subsidies, if any) are equal to the annualized expense ratio (provided in the table), multiplied by the average account value over the period, multiplied by the 182 days in the six-month period ended July 31, 2020, and divided by 366 days in the Fund’s fiscal year ended July 31, 2020 (to reflect the six-month period). Expenses presented in the table include the expenses of any underlying portfolios in which the Fund may invest.
| | | | |
| PGIM Day One Underlying Funds | | | 29 | |
Glossary
The following abbreviations are used in the Funds’ descriptions:
144A—Security was purchased pursuant to Rule 144A under the Securities Act of 1933 and, pursuant to the requirements of Rule 144A, may not be resold except to qualified institutional buyers.
Aces—Alternative Credit Enhancements Securities
ADR—American Depositary Receipt
BABs—Build America Bonds
ETF—Exchange-Traded Fund
FHLMC—Federal Home Loan Mortgage Corporation
GMTN—Global Medium Term Note
LIBOR—London Interbank Offered Rate
LME—London Metal Exchange
LP—Limited Partnership
MTN—Medium Term Note
OTC—Over-the-counter
PRI—Primary Rate Interface
RBOB—Reformulated Gasoline Blendstock for Oxygen Blending
REITs—Real Estate Investment Trust
S&P—Standard & Poor’s
Strips—Separate Trading of Registered Interest and Principal of Securities
TBA—To Be Announced
TIPS—Treasury Inflation-Protected Securities
ULSD—Ultra-Low Sulfur Diesel
WTI—West Texas Intermediate
PGIM Jennison Small-Cap Core Equity Fund
Schedule of Investments
as of July 31, 2020
| | | | | | | | |
| | |
| Description | | Shares | | | Value | |
| | |
LONG-TERM INVESTMENTS 98.8% | | | | | | | | |
| | |
COMMON STOCKS | | | | | | | | |
| | |
Aerospace & Defense 0.8% | | | | | | | | |
Curtiss-Wright Corp. | | | 948 | | | $ | 84,486 | |
Kaman Corp. | | | 2,189 | | | | 86,443 | |
| | | | | | | | |
| | |
| | | | | | | 170,929 | |
| | |
Banks 7.7% | | | | | | | | |
Ameris Bancorp | | | 7,339 | | | | 169,347 | |
Atlantic Union Bankshares Corp. | | | 1,971 | | | | 44,486 | |
BankUnited, Inc. | | | 9,494 | | | | 191,209 | |
Brookline Bancorp, Inc. | | | 6,478 | | | | 62,156 | |
Byline Bancorp, Inc. | | | 7,148 | | | | 92,638 | |
East West Bancorp, Inc. | | | 5,817 | | | | 201,617 | |
Enterprise Financial Services Corp. | | | 2,850 | | | | 82,821 | |
First Bancorp/Southern Pines NC | | | 6,116 | | | | 126,357 | |
First Foundation, Inc. | | | 8,148 | | | | 125,235 | |
Pinnacle Financial Partners, Inc. | | | 5,770 | | | | 228,607 | |
Renasant Corp. | | | 4,443 | | | | 103,211 | |
Seacoast Banking Corp. of Florida* | | | 3,138 | | | | 59,246 | |
Wintrust Financial Corp. | | | 3,607 | | | | 154,380 | |
| | | | | | | | |
| | |
| | | | | | | 1,641,310 | |
| | |
Biotechnology 7.1% | | | | | | | | |
Agios Pharmaceuticals, Inc.* | | | 1,705 | | | | 77,271 | |
Amicus Therapeutics, Inc.* | | | 13,358 | | | | 193,023 | |
Apellis Pharmaceuticals, Inc.* | | | 3,061 | | | | 79,249 | |
Constellation Pharmaceuticals, Inc.* | | | 2,805 | | | | 75,427 | |
Emergent BioSolutions, Inc.* | | | 2,185 | | | | 243,059 | |
Immunomedics, Inc.* | | | 5,399 | | | | 228,000 | |
Ligand Pharmaceuticals, Inc.* | | | 630 | | | | 73,823 | |
Madrigal Pharmaceuticals, Inc.* | | | 500 | | | | 51,305 | |
Mirati Therapeutics, Inc.* | | | 1,012 | | | | 122,766 | |
Natera, Inc.* | | | 5,279 | | | | 253,498 | |
Turning Point Therapeutics, Inc.* | | | 1,049 | | | | 62,132 | |
Twist Bioscience Corp.* | | | 1,096 | | | | 61,420 | |
| | | | | | | | |
| | |
| | | | | | | 1,520,973 | |
See Notes to Financial Statements.
PGIM Jennison Small-Cap Core Equity Fund
Schedule of Investments (continued)
as of July 31, 2020
| | | | | | | | |
| | |
| Description | | Shares | | | Value | |
| | |
COMMON STOCKS (Continued) | | | | | | | | |
| | |
Building Products 1.2% | | | | | | | | |
JELD-WEN Holding, Inc.* | | | 3,568 | | | $ | 69,933 | |
Trex Co., Inc.* | | | 1,412 | | | | 196,734 | |
| | | | | | | | |
| | |
| | | | | | | 266,667 | |
| | |
Capital Markets 3.6% | | | | | | | | |
Assetmark Financial Holdings, Inc.* | | | 3,703 | | | | 103,129 | |
Brightsphere Investment Group, Inc. | | | 16,597 | | | | 223,064 | |
Focus Financial Partners, Inc. (Class A Stock)* | | | 2,246 | | | | 82,990 | |
Hamilton Lane, Inc. (Class A Stock) | | | 906 | | | | 65,449 | |
Houlihan Lokey, Inc. | | | 3,449 | | | | 189,005 | |
Moelis & Co. (Class A Stock) | | | 3,495 | | | | 104,116 | |
| | | | | | | | |
| | |
| | | | | | | 767,753 | |
| | |
Chemicals 1.0% | | | | | | | | |
Avient Corp. | | | 9,159 | | | | 218,900 | |
| | |
Commercial Services & Supplies 1.1% | | | | | | | | |
Harsco Corp.* | | | 10,412 | | | | 166,176 | |
Healthcare Services Group, Inc. | | | 2,754 | | | | 72,127 | |
| | | | | | | | |
| | |
| | | | | | | 238,303 | |
| | |
Construction & Engineering 2.6% | | | | | | | | |
Construction Partners, Inc. (Class A Stock)* | | | 3,589 | | | | 59,398 | |
Great Lakes Dredge & Dock Corp.* | | | 21,672 | | | | 181,178 | |
WillScot Mobile Mini Holdings Corp.* | | | 20,813 | | | | 313,444 | |
| | | | | | | | |
| | |
| | | | | | | 554,020 | |
| | |
Construction Materials 1.2% | | | | | | | | |
Summit Materials, Inc. (Class A Stock)* | | | 17,954 | | | | 264,283 | |
| | |
Diversified Telecommunication Services 2.8% | | | | | | | | |
Bandwidth, Inc. (Class A Stock)* | | | 4,167 | | | | 603,298 | |
| | |
Electric Utilities 0.7% | | | | | | | | |
PNM Resources, Inc. | | | 3,318 | | | | 140,119 | |
| | |
Electrical Equipment 0.2% | | | | | | | | |
Thermon Group Holdings, Inc.* | | | 2,491 | | | | 33,753 | |
See Notes to Financial Statements.
| | | | |
| PGIM Day One Underlying Funds | | | 33 | |
PGIM Jennison Small-Cap Core Equity Fund
Schedule of Investments (continued)
as of July 31, 2020
| | | | | | | | |
| | |
| Description | | Shares | | | Value | |
| | |
COMMON STOCKS (Continued) | | | | | | | | |
| | |
Electronic Equipment, Instruments & Components 1.7% | | | | | | | | |
Littelfuse, Inc. | | | 1,096 | | | $ | 194,704 | |
nLight, Inc.* | | | 7,380 | | | | 170,995 | |
| | | | | | | | |
| | |
| | | | | | | 365,699 | |
| | |
Equity Real Estate Investment Trusts (REITs) 5.6% | | | | | | | | |
Columbia Property Trust, Inc. | | | 2,204 | | | | 26,360 | |
Cousins Properties, Inc. | | | 6,537 | | | | 200,817 | |
Independence Realty Trust, Inc. | | | 17,410 | | | | 200,215 | |
National Storage Affiliates Trust | | | 6,501 | | | | 200,361 | |
Physicians Realty Trust | | | 5,645 | | | | 101,836 | |
QTS Realty Trust, Inc. (Class A Stock) | | | 5,374 | | | | 386,659 | |
Retail Opportunity Investments Corp. | | | 8,807 | | | | 95,732 | |
| | | | | | | | |
| | |
| | | | | | | 1,211,980 | |
| | |
Food & Staples Retailing 2.8% | | | | | | | | |
BJ’s Wholesale Club Holdings, Inc.* | | | 4,985 | | | | 199,649 | |
Performance Food Group Co.* | | | 9,744 | | | | 273,027 | |
Sprouts Farmers Market, Inc.* | | | 4,937 | | | | 130,238 | |
| | | | | | | | |
| | |
| | | | | | | 602,914 | |
| | |
Food Products 3.3% | | | | | | | | |
Adecoagro SA (Brazil)* | | | 15,385 | | | | 64,309 | |
Darling Ingredients, Inc.* | | | 11,948 | | | | 333,708 | |
Freshpet, Inc.* | | | 2,309 | | | | 221,779 | |
Vital Farms, Inc.* | | | 2,688 | | | | 94,779 | |
| | | | | | | | |
| | |
| | | | | | | 714,575 | |
| | |
Health Care Equipment & Supplies 3.6% | | | | | | | | |
Glaukos Corp.* | | | 1,067 | | | | 46,628 | |
Integra LifeSciences Holdings Corp.* | | | 2,055 | | | | 98,126 | |
Nevro Corp.* | | | 1,566 | | | | 208,215 | |
Silk Road Medical, Inc.* | | | 4,408 | | | | 204,796 | |
Tandem Diabetes Care, Inc.* | | | 2,089 | | | | 218,217 | |
| | | | | | | | |
| | |
| | | | | | | 775,982 | |
| | |
Health Care Providers & Services 1.6% | | | | | | | | |
Acadia Healthcare Co., Inc.* | | | 5,780 | | | | 172,302 | |
See Notes to Financial Statements.
PGIM Jennison Small-Cap Core Equity Fund
Schedule of Investments (continued)
as of July 31, 2020
| | | | | | | | |
| | |
| Description | | Shares | | | Value | |
| | |
COMMON STOCKS (Continued) | | | | | | | | |
| | |
Health Care Providers & Services (cont’d.) | | | | | | | | |
Guardant Health, Inc.* | | | 803 | | | $ | 68,399 | |
HealthEquity, Inc.* | | | 2,198 | | | | 113,329 | |
| | | | | | | | |
| | |
| | | | | | | 354,030 | |
| | |
Health Care Technology 4.1% | | | | | | | | |
Accolade, Inc.* | | | 583 | | | | 18,913 | |
Inspire Medical Systems, Inc.* | | | 1,829 | | | | 181,729 | |
Livongo Health, Inc.* | | | 3,772 | | | | 479,987 | |
Phreesia, Inc.* | | | 6,487 | | | | 194,999 | |
| | | | | | | | |
| | |
| | | | | | | 875,628 | |
| | |
Hotels, Restaurants & Leisure 4.3% | | | | | | | | |
Jack in the Box, Inc. | | | 3,751 | | | | 307,994 | |
Penn National Gaming, Inc.* | | | 6,980 | | | | 236,273 | |
Wingstop, Inc. | | | 2,355 | | | | 367,969 | |
| | | | | | | | |
| | |
| | | | | | | 912,236 | |
| | |
Independent Power & Renewable Electricity Producers 1.8% | | | | | | | | |
NextEra Energy Partners LP | | | 6,066 | | | | 377,305 | |
| | |
Insurance 2.5% | | | | | | | | |
Axis Capital Holdings Ltd. | | | 2,706 | | | | 108,565 | |
Goosehead Insurance, Inc. (Class A Stock)*(a) | | | 3,511 | | | | 362,792 | |
Lemonade, Inc.* | | | 935 | | | | 54,398 | |
ProSight Global, Inc.* | | | 2,442 | | | | 19,194 | |
| | | | | | | | |
| | |
| | | | | | | 544,949 | |
| | |
IT Services 2.2% | | | | | | | | |
Evo Payments, Inc. (Class A Stock)* | | | 6,799 | | | | 154,269 | |
LiveRamp Holdings, Inc.* | | | 3,768 | | | | 171,708 | |
Shift4 Payments, Inc. (Class A Stock)* | | | 3,564 | | | | 136,501 | |
| | | | | | | | |
| | |
| | | | | | | 462,478 | |
| | |
Leisure Products 1.0% | | | | | | | | |
Brunswick Corp. | | | 3,136 | | | | 210,049 | |
See Notes to Financial Statements.
| | | | |
| PGIM Day One Underlying Funds | | | 35 | |
PGIM Jennison Small-Cap Core Equity Fund
Schedule of Investments (continued)
as of July 31, 2020
| | | | | | | | |
| | |
| Description | | Shares | | | Value | |
| | |
COMMON STOCKS (Continued) | | | | | | | | |
| | |
Life Sciences Tools & Services 1.5% | | | | | | | | |
Berkeley Lights, Inc.* | | | 333 | | | $ | 19,970 | |
NeoGenomics, Inc.* | | | 3,323 | | | | 127,039 | |
Syneos Health, Inc.* | | | 2,690 | | | | 167,829 | |
| | | | | | | | |
| | |
| | | | | | | 314,838 | |
| | |
Machinery 3.8% | | | | | | | | |
Enerpac Tool Group Corp. | | | 6,558 | | | | 123,946 | |
Kennametal, Inc. | | | 4,670 | | | | 125,903 | |
Mayville Engineering Co., Inc.* | | | 6,833 | | | | 51,862 | |
Mueller Water Products, Inc. (Class A Stock) | | | 8,976 | | | | 90,837 | |
Rexnord Corp. | | | 9,873 | | | | 286,021 | |
Trinity Industries, Inc. | | | 7,403 | | | | 144,581 | |
| | | | | | | | |
| | |
| | | | | | | 823,150 | |
| | |
Media 0.7% | | | | | | | | |
Cardlytics, Inc.* | | | 2,135 | | | | 141,807 | |
| | |
Metals & Mining 0.5% | | | | | | | | |
Sandstorm Gold Ltd. (Canada)* | | | 11,265 | | | | 108,369 | |
| | |
Oil, Gas & Consumable Fuels 0.6% | | | | | | | | |
WPX Energy, Inc.* | | | 22,791 | | | | 136,062 | |
| | |
Pharmaceuticals 3.3% | | | | | | | | |
GW Pharmaceuticals PLC (United Kingdom), ADR* | | | 686 | | | | 87,554 | |
Horizon Therapeutics PLC* | | | 2,927 | | | | 179,103 | |
Intersect ENT, Inc.* | | | 5,027 | | | | 86,414 | |
Prestige Consumer Healthcare, Inc.* | | | 4,213 | | | | 156,682 | |
Revance Therapeutics, Inc.* | | | 8,088 | | | | 189,906 | |
| | | | | | | | |
| | |
| | | | | | | 699,659 | |
| | |
Professional Services 1.0% | | | | | | | | |
Huron Consulting Group, Inc.* | | | 3,236 | | | | 154,422 | |
Korn Ferry | | | 2,231 | | | | 62,691 | |
| | | | | | | | |
| | |
| | | | | | | 217,113 | |
See Notes to Financial Statements.
PGIM Jennison Small-Cap Core Equity Fund
Schedule of Investments (continued)
as of July 31, 2020
| | | | | | | | |
| | |
| Description | | Shares | | | Value | |
| | |
COMMON STOCKS (Continued) | | | | | | | | |
| | |
Road & Rail 2.5% | | | | | | | | |
Saia, Inc.* | | | 3,538 | | | $ | 422,614 | |
TFI International, Inc. (Canada) | | | 2,541 | | | | 110,254 | |
| | | | | | | | |
| | |
| | | | | | | 532,868 | |
| | |
Semiconductors & Semiconductor Equipment 6.3% | | | | | | | | |
Brooks Automation, Inc. | | | 4,627 | | | | 251,940 | |
Inphi Corp.* | | | 3,619 | | | | 472,859 | |
Lattice Semiconductor Corp.* | | | 5,916 | | | | 183,928 | |
MaxLinear, Inc.* | | | 8,781 | | | | 222,598 | |
Tower Semiconductor Ltd. (Israel)* | | | 10,485 | | | | 225,428 | |
| | | | | | | | |
| | |
| | | | | | | 1,356,753 | |
| | |
Software 8.9% | | | | | | | | |
Appfolio, Inc. (Class A Stock)* | | | 828 | | | | 115,274 | |
Blackline, Inc.* | | | 1,445 | | | | 128,475 | |
CyberArk Software Ltd.* | | | 1,570 | | | | 185,009 | |
Everbridge, Inc.* | | | 1,746 | | | | 249,329 | |
Globant SA (Argentina)* | | | 804 | | | | 139,044 | |
PagerDuty, Inc.* | | | 3,287 | | | | 100,188 | |
Pluralsight, Inc. (Class A Stock)* | | | 3,067 | | | | 64,928 | |
Proofpoint, Inc.* | | | 1,441 | | | | 166,680 | |
Q2 Holdings, Inc.* | | | 3,888 | | | | 365,666 | |
Varonis Systems, Inc.* | | | 3,359 | | | | 363,948 | |
Vertex, Inc. (Class A Stock)* | | | 1,735 | | | | 40,877 | |
| | | | | | | | |
| | |
| | | | | | | 1,919,418 | |
| | |
Specialty Retail 3.9% | | | | | | | | |
Boot Barn Holdings, Inc.* | | | 2,697 | | | | 52,214 | |
Five Below, Inc.* | | | 2,199 | | | | 239,493 | |
Monro, Inc. | | | 1,921 | | | | 108,152 | |
National Vision Holdings, Inc.* | | | 7,688 | | | | 245,939 | |
Vroom, Inc.* | | | 3,067 | | | | 181,536 | |
| | | | | | | | |
| | | | | | | 827,334 | |
| | |
Textiles, Apparel & Luxury Goods 0.8% | | | | | | | | |
Kontoor Brands, Inc. | | | 9,412 | | | | 180,334 | |
See Notes to Financial Statements.
| | | | |
| PGIM Day One Underlying Funds | | | 37 | |
PGIM Jennison Small-Cap Core Equity Fund
Schedule of Investments (continued)
as of July 31, 2020
| | | | | | | | |
| | |
| Description | | Shares | | | Value | |
| | |
COMMON STOCKS (Continued) | | | | | | | | |
| | |
Thrifts & Mortgage Finance 0.2% | | | | | | | | |
WSFS Financial Corp. | | | 1,311 | | | $ | 37,403 | |
| | |
Trading Companies & Distributors 0.3% | | | | | | | | |
Rush Enterprises, Inc. (Class A Stock) | | | 1,343 | | | | 63,900 | |
| | | | | | | | |
| | |
TOTAL LONG-TERM INVESTMENTS
(cost $17,170,284) | | | | | | | 21,187,141 | |
| | | | | | | | |
| | |
SHORT-TERM INVESTMENTS 4.4% | | | | | | | | |
| | |
AFFILIATED MUTUAL FUNDS | | | | | | | | |
PGIM Core Ultra Short Bond Fund(w) | | | 675,577 | | | | 675,577 | |
PGIM Institutional Money Market Fund
(cost $265,096; includes $265,003 of cash collateral for securities on loan)(b)(w) | | | 265,561 | | | | 265,534 | |
| | | | | | | | |
| | |
TOTAL SHORT-TERM INVESTMENTS
(cost $940,673) | | | | | | | 941,111 | |
| | | | | | | | |
TOTAL INVESTMENTS 103.2%
(cost $18,110,957) | | | | | | | 22,128,252 | |
Liabilities in excess of other assets (3.2)% | | | | | | | (689,403 | ) |
| | | | | | | | |
| | |
NET ASSETS 100.0% | | | | | | $ | 21,438,849 | |
| | | | | | | | |
See the Glossary for a list of the abbreviation(s) used in the annual report.
| * | Non-income producing security. |
| (a) | All or a portion of security is on loan. The aggregate market value of such securities, including those sold and pending settlement, is $320,323; cash collateral of $265,003 (included in liabilities) was received with which the Fund purchased highly liquid short-term investments. In the event of significant appreciation in value of securities on loan on the last business day of the reporting period, the Fund may reflect a collateral value that is less than the market value of the loaned securities and such shortfall is remedied the following business day. |
| (b) | Represents security, or portion thereof, purchased with cash collateral received for securities on loan and includes dividend reinvestment. |
| (w) | PGIM Investments LLC, the manager of the Fund, also serves as manager of the PGIM Core Ultra Short Bond Fund and PGIM Institutional Money Market Fund. |
Fair Value Measurements:
Various inputs are used in determining the value of the Fund’s investments. These inputs are summarized in the three broad levels listed below.
Level 1—unadjusted quoted prices generally in active markets for identical securities.
See Notes to Financial Statements.
PGIM Jennison Small-Cap Core Equity Fund
Schedule of Investments (continued)
as of July 31, 2020
Level 2—quoted prices for similar securities, interest rates and yield curves, prepayment speeds, foreign currency exchange rates and other observable inputs.
Level 3—unobservable inputs for securities valued in accordance with Board approved fair valuation procedures.
The following is a summary of the inputs used as of July 31, 2020 in valuing such portfolio securities:
| | | | | | | | | | | | |
| | | Level 1 | | | Level 2 | | | Level 3 | |
Investments in Securities | | | | | | | | | | | | |
Assets | | | | | | | | | | | | |
Common Stocks | | | | | | | | | | | | |
Aerospace & Defense | | $ | 170,929 | | | | $— | | | | $— | |
Banks | | | 1,641,310 | | | | — | | | | — | |
Biotechnology | | | 1,520,973 | | | | — | | | | — | |
Building Products | | | 266,667 | | | | — | | | | — | |
Capital Markets | | | 767,753 | | | | — | | | | — | |
Chemicals | | | 218,900 | | | | — | | | | — | |
Commercial Services & Supplies | | | 238,303 | | | | — | | | | — | |
Construction & Engineering | | | 554,020 | | | | — | | | | — | |
Construction Materials | | | 264,283 | | | | — | | | | — | |
Diversified Telecommunication Services | | | 603,298 | | | | — | | | | — | |
Electric Utilities | | | 140,119 | | | | — | | | | — | |
Electrical Equipment | | | 33,753 | | | | — | | | | — | |
Electronic Equipment, Instruments & Components | | | 365,699 | | | | — | | | | — | |
Equity Real Estate Investment Trusts (REITs) | | | 1,211,980 | | | | — | | | | — | |
Food & Staples Retailing | | | 602,914 | | | | — | | | | — | |
Food Products | | | 714,575 | | | | — | | | | — | |
Health Care Equipment & Supplies | | | 775,982 | | | | — | | | | — | |
Health Care Providers & Services | | | 354,030 | | | | — | | | | — | |
Health Care Technology | | | 875,628 | | | | — | | | | — | |
Hotels, Restaurants & Leisure | | | 912,236 | | | | — | | | | — | |
Independent Power & Renewable Electricity Producers | | | 377,305 | | | | — | | | | — | |
Insurance | | | 544,949 | | | | — | | | | — | |
IT Services | | | 462,478 | | | | — | | | | — | |
Leisure Products | | | 210,049 | | | | — | | | | — | |
Life Sciences Tools & Services | | | 314,838 | | | | — | | | | — | |
Machinery | | | 823,150 | | | | — | | | | — | |
Media | | | 141,807 | | | | — | | | | — | |
Metals & Mining | | | 108,369 | | | | — | | | | — | |
Oil, Gas & Consumable Fuels | | | 136,062 | | | | — | | | | — | |
Pharmaceuticals | | | 699,659 | | | | — | | | | — | |
Professional Services | | | 217,113 | | | | — | | | | — | |
Road & Rail | | | 532,868 | | | | — | | | | — | |
Semiconductors & Semiconductor Equipment | | | 1,356,753 | | | | — | | | | — | |
Software | | | 1,919,418 | | | | — | | | | — | |
Specialty Retail | | | 827,334 | | | | — | | | | — | |
Textiles, Apparel & Luxury Goods | | | 180,334 | | | | — | | | | — | |
Thrifts & Mortgage Finance | | | 37,403 | | | | — | | | | — | |
See Notes to Financial Statements.
| | | | |
| PGIM Day One Underlying Funds | | | 39 | |
PGIM Jennison Small-Cap Core Equity Fund
Schedule of Investments (continued)
as of July 31, 2020
| | | | | | | | | | | | |
| | | Level 1 | | | Level 2 | | Level 3 | |
Investments in Securities (continued) | | | | | | | | | | | | |
Assets (continued) | | | | | | | | | | | | |
Common Stocks (continued) | | | | | | | | | | | | |
Trading Companies & Distributors | | $ | 63,900 | | | | $— | | | | $— | |
Affiliated Mutual Funds | | | 941,111 | | | | — | | | | — | |
| | | | | | | | | | | | |
Total | | $ | 22,128,252 | | | | $— | | | | $— | |
| | | | | | | | | | | | |
Industry Classification:
The industry classification of investments and liabilities in excess of other assets shown as a percentage of net assets as of July 31, 2020 were as follows (unaudited):
| | | | |
Software | | | 8.9 | % |
Banks | | | 7.7 | |
Biotechnology | | | 7.1 | |
Semiconductors & Semiconductor Equipment | | | 6.3 | |
Equity Real Estate Investment Trusts (REITs) | | | 5.6 | |
Affiliated Mutual Funds (1.2% represents investments purchased with collateral from securities on loan) | | | 4.4 | |
Hotels, Restaurants & Leisure | | | 4.3 | |
Health Care Technology | | | 4.1 | |
Specialty Retail | | | 3.9 | |
Machinery | | | 3.8 | |
Health Care Equipment & Supplies | | | 3.6 | |
Capital Markets | | | 3.6 | |
Food Products | | | 3.3 | |
Pharmaceuticals | | | 3.3 | |
Diversified Telecommunication Services | | | 2.8 | |
Food & Staples Retailing | | | 2.8 | |
Construction & Engineering | | | 2.6 | |
Insurance | | | 2.5 | |
Road & Rail | | | 2.5 | |
IT Services | | | 2.2 | |
Independent Power & Renewable Electricity Producers | | | 1.8 | |
| | | | |
Electronic Equipment, Instruments & Components | | | 1.7 | % |
Health Care Providers & Services | | | 1.6 | |
Life Sciences Tools & Services | | | 1.5 | |
Building Products | | | 1.2 | |
Construction Materials | | | 1.2 | |
Commercial Services & Supplies | | | 1.1 | |
Chemicals | | | 1.0 | |
Professional Services | | | 1.0 | |
Leisure Products | | | 1.0 | |
Textiles, Apparel & Luxury Goods | | | 0.8 | |
Aerospace & Defense | | | 0.8 | |
Media | | | 0.7 | |
Electric Utilities | | | 0.7 | |
Oil, Gas & Consumable Fuels | | | 0.6 | |
Metals & Mining | | | 0.5 | |
Trading Companies & Distributors | | | 0.3 | |
Thrifts & Mortgage Finance | | | 0.2 | |
Electrical Equipment | | | 0.2 | |
| | | | |
| | | 103.2 | |
Liabilities in excess of other assets | | | (3.2 | ) |
| | | | |
| | | 100.0 | % |
| | | | |
Financial Instruments/Transactions—Summary of Offsetting and Netting Arrangements:
The Fund entered into financial instruments/transactions during the reporting period that are either offset in accordance with current requirements or are subject to enforceable master netting arrangements or similar agreements that permit offsetting. The information about offsetting and related netting arrangements for financial instruments/transactions where the legal right to set-off exists is presented in the summary below.
See Notes to Financial Statements.
PGIM Jennison Small-Cap Core Equity Fund
Schedule of Investments (continued)
as of July 31, 2020
Offsetting of financial instrument/transaction assets and liabilities:
| | | | | | | | | | | | | | | |
Description | | Gross Market
Value of
Recognized
Assets/(Liabilities) | | Collateral
Pledged/(Received)(1) | | Net
Amount |
Securities on Loan | | | $ | 320,323 | | | | $ | (265,003 | ) | | | $ | 55,320 | |
| | | | | | | | | | | | | | | |
| (1) | Collateral amount disclosed by the Fund is limited to the market value of financial instruments/transactions. |
See Notes to Financial Statements.
| | | | |
| PGIM Day One Underlying Funds | | | 41 | |
PGIM Jennison Small-Cap Core Equity Fund
Statement of Assets & Liabilities
as of July 31, 2020
| | | | |
Assets | | | | |
Investments at value, including securities on loan of $320,323: | | | | |
Unaffiliated investments (cost $17,170,284) | | $ | 21,187,141 | |
Affiliated investments (cost $940,673) | | | 941,111 | |
Receivable for investments sold | | | 140,008 | |
Receivable for Fund shares sold | | | 16,166 | |
Dividends receivable | | | 7,633 | |
Due from Manager | | | 722 | |
| | | | |
Total Assets | | | 22,292,781 | |
| | | | |
Liabilities | | | | |
Payable for investments purchased | | | 353,954 | |
Payable to broker for collateral for securities on loan | | | 265,003 | |
Payable for Fund shares reacquired | | | 175,628 | |
Accrued expenses and other liabilities | | | 58,379 | |
Trustees’ fees payable | | | 900 | |
Affiliated transfer agent fee payable | | | 68 | |
| | | | |
Total Liabilities | | | 853,932 | |
| | | | |
| |
Net Assets | | $ | 21,438,849 | |
| | | | |
| |
| | | | | |
Net assets were comprised of: | | | | |
Shares of beneficial interest, at par | | $ | 1,718 | |
Paid-in capital in excess of par | | | 18,038,717 | |
Total distributable earnings (loss) | | | 3,398,414 | |
| | | | |
Net assets, July 31, 2020 | | $ | 21,438,849 | |
| | | | |
Class R6 | | | | |
Net asset value, offering price and redemption price per share, ($21,438,849 ÷ 1,718,077 shares of beneficial interest issued and outstanding) | | $ | 12.48 | |
| | | | |
See Notes to Financial Statements.
PGIM Jennison Small-Cap Core Equity Fund
Statement of Operations
Year Ended July 31, 2020
| | | | |
Net Investment Income (Loss) | | | | |
Income | | | | |
Unaffiliated dividend income (net of $121 foreign withholding tax) | | $ | 148,052 | |
Affiliated dividend income | | | 10,983 | |
Income from securities lending, net (including affiliated income of $2,173) | | | 5,228 | |
| | | | |
Total income | | | 164,263 | |
| | | | |
| |
Expenses | | | | |
Management fee | | | 133,734 | |
Custodian and accounting fees | | | 58,349 | |
Audit fee | | | 24,482 | |
Legal fees and expenses | | | 18,531 | |
Trustees’ fees | | | 10,890 | |
Shareholders’ reports | | | 8,708 | |
Transfer agent’s fees and expenses (including affiliated expense of $453) | | | 553 | |
SEC registration fees | | | 329 | |
Registration fees | | | 285 | |
Miscellaneous | | | 15,740 | |
| | | | |
Total expenses | | | 271,601 | |
Less: Fee waiver and/or expense reimbursement | | | (102,177 | ) |
| | | | |
Net expenses | | | 169,424 | |
| | | | |
Net investment income (loss) | | | (5,161 | ) |
| | | | |
Realized And Unrealized Gain (Loss) On Investments | | | | |
Net realized gain (loss) on investment transactions (including affiliated of $(361)) | | | (351,664 | ) |
Net change in unrealized appreciation (depreciation) on investments (including affiliated of $433) | | | 1,646,389 | |
| | | | |
Net gain (loss) on investment transactions | | | 1,294,725 | |
| | | | |
Net Increase (Decrease) In Net Assets Resulting From Operations | | $ | 1,289,564 | |
| | | | |
See Notes to Financial Statements.
| | | | |
| PGIM Day One Underlying Funds | | | 43 | |
PGIM Jennison Small-Cap Core Equity Fund
Statements of Changes in Net Assets
| | | | | | | | |
| |
| | | Year Ended
July 31, | |
| | |
| | | 2020 | | | 2019 | |
Increase (Decrease) in Net Assets | | | | | | | | |
Operations | | | | | | | | |
Net investment income (loss) | | $ | (5,161 | ) | | $ | 11,700 | |
Net realized gain (loss) on investment transactions | | | (351,664 | ) | | | 19,881 | |
Net change in unrealized appreciation (depreciation) on investments | | | 1,646,389 | | | | (421,266 | ) |
| | | | | | | | |
Net increase (decrease) in net assets resulting from operations | | | 1,289,564 | | | | (389,685 | ) |
| | | | | | | | |
Dividends and Distributions | | | | | | | | |
Distributions from distributable earnings | | | | | | | | |
Class R6 | | | — | | | | (902,583 | ) |
| | | | | | | | |
Tax return of capital distributions | | | | | | | | |
Class R6 | | | — | | | | (7,281 | ) |
| | | | | | | | |
Fund share transactions | | | | | | | | |
Net proceeds from shares sold | | | 6,847,970 | | | | 2,868,025 | |
Net asset value of shares issued in reinvestment of dividends and distributions | | | — | | | | 909,864 | |
Cost of shares reacquired | | | (4,069,959 | ) | | | (1,265,404 | ) |
| | | | | | | | |
Net increase (decrease) in net assets from Fund share transactions | | | 2,778,011 | | | | 2,512,485 | |
| | | | | | | | |
Total increase (decrease) | | | 4,067,575 | | | | 1,212,936 | |
| | |
Net Assets: | | | | | | | | |
Beginning of year | | | 17,371,274 | | | | 16,158,338 | |
| | | | | | | | |
End of year | | $ | 21,438,849 | | | $ | 17,371,274 | |
| | | | | | | | |
See Notes to Financial Statements.
PGIM Core Conservative Bond Fund
Schedule of Investments
as of July 31, 2020
| | | | | | | | | | | | | | | | |
| | | | |
| Description | | Interest
Rate | | | Maturity
Date | | | Principal
Amount
(000)# | | | Value | |
| | | | |
LONG-TERM INVESTMENTS 97.3% | | | | | | | | | | | | | | | | |
| | | | |
ASSET-BACKED SECURITIES 0.4% | | | | | | | | | | | | | | | | |
| | | | |
Credit Cards | | | | | | | | | | | | | | | | |
Chase Issuance Trust, | | | | | | | | | | | | | | | | |
Series 2012-A07, Class A7 | | | 2.160% | | | | 09/15/24 | | | | 100 | | | $ | 103,906 | |
Citibank Credit Card Issuance Trust, | | | | | | | | | | | | | | | | |
Series 2018-A03, Class A3 | | | 3.290 | | | | 05/23/25 | | | | 100 | | | | 108,338 | |
| | | | | | | | | | | | | | | | |
| | | | |
TOTAL ASSET-BACKED SECURITIES
(cost $199,042) | | | | | | | | | | | | | | | 212,244 | |
| | | | | | | | | | | | | | | | |
| | | |
COMMERCIAL MORTGAGE-BACKED SECURITIES 5.0% | | | | | | | | | | | | | |
Barclays Commercial Mortgage Trust, | | | | | | | | | | | | | | | | |
Series 2019-C04, Class A4 | | | 2.661 | | | | 08/15/52 | | | | 100 | | | | 108,434 | |
Benchmark Mortgage Trust, | | | | | | | | | | | | | | | | |
Series 2018-B03, Class A3 | | | 3.746 | | | | 04/10/51 | | | | 30 | | | | 33,167 | |
CCUBS Commercial Mortgage Trust, | | | | | | | | | | | | | | | | |
Series 2017-C01, Class A3 | | | 3.283(cc) | | | | 11/15/50 | | | | 90 | | | | 100,433 | |
CD Mortgage Trust, | | | | | | | | | | | | | | | | |
Series 2017-CD06, Class A3 | | | 3.104 | | | | 11/13/50 | | | | 40 | | | | 42,836 | |
Citigroup Commercial Mortgage Trust, | | | | | | | | | | | | | | | | |
Series 2016-P06, Class A4 | | | 3.458 | | | | 12/10/49 | | | | 125 | | | | 138,999 | |
Series 2017-P08, Class A3 | | | 3.203 | | | | 09/15/50 | | | | 75 | | | | 81,764 | |
Commercial Mortgage Trust, | | | | | | | | | | | | | | | | |
Series 2015-CR26, Class A4 | | | 3.630 | | | | 10/10/48 | | | | 55 | | | | 60,949 | |
Series 2015-PC01, Class A4 | | | 3.620 | | | | 07/10/50 | | | | 200 | | | | 214,807 | |
Series 2016-DC02, Class A5 | | | 3.765 | | | | 02/10/49 | | | | 25 | | | | 28,066 | |
CSAIL Commercial Mortgage Trust, | | | | | | | | | | | | | | | | |
Series 2016-C07, Class A4 | | | 3.210 | | | | 11/15/49 | | | | 45 | | | | 48,427 | |
Fannie Mae-Aces, | | | | | | | | | | | | | | | | |
Series 2016-M11, Class A2 | | | 2.369(cc) | | | | 07/25/26 | | | | 75 | | | | 81,000 | |
Series 2017-M01, Class A2 | | | 2.416(cc) | | | | 10/25/26 | | | | 40 | | | | 43,295 | |
FHLMC Multifamily Structured Pass-Through Certificates, | | | | | | | | | | | | | | | | |
Series K064, Class A2 | | | 3.224 | | | | 03/25/27 | | | | 100 | | | | 114,371 | |
Series K069, Class AM | | | 3.248(cc) | | | | 09/25/27 | | | | 50 | | | | 57,181 | |
Series K070, Class AM | | | 3.364 | | | | 12/25/27 | | | | 25 | | | | 29,013 | |
Series K076, Class A2 | | | 3.900 | | | | 04/25/28 | | | | 90 | | | | 108,487 | |
Series K076, Class AM | | | 3.900 | | | | 04/25/28 | | | | 50 | | | | 60,009 | |
Series K077, Class AM | | | 3.850(cc) | | | | 05/25/28 | | | | 10 | | | | 12,032 | |
Series K083, Class AM | | | 4.030(cc) | | | | 10/25/28 | | | | 25 | | | | 30,420 | |
GS Mortgage Securities Trust, | | | | | | | | | | | | | | | | |
Series 2020-GC47, Class A4 | | | 2.125 | | | | 05/12/53 | | | | 100 | | | | 104,526 | |
See Notes to Financial Statements.
| | | | |
| PGIM Day One Underlying Funds | | | 45 | |
PGIM Core Conservative Bond Fund
Schedule of Investments (continued)
as of July 31, 2020
| | | | | | | | | | | | | | | | |
| | | | |
| Description | | Interest
Rate | | | Maturity
Date | | | Principal
Amount
(000)# | | | Value | |
| | | |
COMMERCIAL MORTGAGE-BACKED SECURITIES (Continued) | | | | | | | | | | | | | |
JPMCC Commercial Mortgage Securities Trust, | | | | | | | | | | | | | | | | |
Series 2019-COR04, Class A3 | | | 3.763% | | | | 03/10/52 | | | | 125 | | | $ | 143,336 | |
JPMorgan Chase Commercial Mortgage Securities Trust, | | | | | | | | | | | | | | | | |
Series 2016-JP02, Class A3 | | | 2.559 | | | | 08/15/49 | | | | 20 | | | | 21,227 | |
Series 2016-JP04, Class A3 | | | 3.393 | | | | 12/15/49 | | | | 125 | | | | 139,556 | |
Morgan Stanley Bank of America Merrill Lynch Trust, | | | | | | | | | | | | | | | | |
Series 2015-C21, Class A3 | | | 3.077 | | | | 03/15/48 | | | | 67 | | | | 70,700 | |
Series 2016-C32, Class A3 | | | 3.459 | | | | 12/15/49 | | | | 125 | | | | 138,927 | |
Morgan Stanley Capital I Trust, | | | | | | | | | | | | | | | | |
Series 2016-UB12, Class A3 | | | 3.337 | | | | 12/15/49 | | | | 125 | | | | 137,944 | |
UBS Commercial Mortgage Trust, | | | | | | | | | | | | | | | | |
Series 2018-C09, Class ASB | | | 4.090 | | | | 03/15/51 | | | | 60 | | | | 68,253 | |
Series 2018-C11, Class A3 | | | 4.312 | | | | 06/15/51 | | | | 75 | | | | 84,323 | |
Series 2018-C13, Class A3 | | | 4.069 | | | | 10/15/51 | | | | 200 | | | | 231,465 | |
Wells Fargo Commercial Mortgage Trust, | | | | | | | | | | | | | | | | |
Series 2016-LC25, Class A3 | | | 3.374 | | | | 12/15/59 | | | | 125 | | | | 138,571 | |
Series 2017-C39, Class A3 | | | 2.878 | | | | 09/15/50 | | | | 100 | | | | 105,813 | |
Series 2020-C55, Class A4 | | | 2.474 | | | | 02/15/53 | | | | 125 | | | | 135,146 | |
| | | | | | | | | | | | | | | | |
| | | | |
TOTAL COMMERCIAL MORTGAGE-BACKED SECURITIES
(cost $2,635,183) | | | | | | | | | | | | | | | 2,913,477 | |
| | | | | | | | | | | | | | | | |
| | | | |
CORPORATE BONDS 27.8% | | | | | | | | | | | | | | | | |
| | | | |
Aerospace & Defense 0.8% | | | | | | | | | | | | | | | | |
Boeing Co. (The), | | | | | | | | | | | | | | | | |
Sr. Unsec’d. Notes | | | 2.250 | | | | 06/15/26 | | | | 35 | | | | 33,850 | |
Sr. Unsec’d. Notes | | | 3.100 | | | | 05/01/26 | | | | 10 | | | | 10,020 | |
Sr. Unsec’d. Notes | | | 3.600 | | | | 05/01/34 | | | | 30 | | | | 28,949 | |
Sr. Unsec’d. Notes | | | 3.900 | | | | 05/01/49 | | | | 10 | | | | 9,137 | |
Sr. Unsec’d. Notes | | | 5.805 | | | | 05/01/50 | | | | 20 | | | | 23,461 | |
General Dynamics Corp., | | | | | | | | | | | | | | | | |
Gtd. Notes | | | 3.500 | | | | 05/15/25 | | | | 115 | | | | 129,894 | |
Lockheed Martin Corp., | | | | | | | | | | | | | | | | |
Sr. Unsec’d. Notes | | | 2.900 | | | | 03/01/25 | | | | 35 | | | | 38,497 | |
Sr. Unsec’d. Notes | | | 3.800 | | | | 03/01/45 | �� | | | 15 | | | | 19,521 | |
Northrop Grumman Corp., | | | | | | | | | | | | | | | | |
Sr. Unsec’d. Notes | | | 4.750 | | | | 06/01/43 | | | | 25 | | | | 34,260 | |
See Notes to Financial Statements.
PGIM Core Conservative Bond Fund
Schedule of Investments (continued)
as of July 31, 2020
| | | | | | | | | | | | | | | | |
| | | | |
Description | | Interest Rate | | | Maturity Date | | | Principal Amount (000)# | | | Value | |
| | | | |
CORPORATE BONDS (Continued) | | | | | | | | | | | | | | | | |
| | | | |
Aerospace & Defense (cont’d.) | | | | | | | | | | | | | | | | |
Raytheon Technologies Corp., | | | | | | | | | | | | | | | | |
Sr. Unsec’d. Notes | | | 4.125% | | | | 11/16/28 | | | | 30 | | | $ | 36,019 | |
Sr. Unsec’d. Notes, 144A | | | 3.500 | | | | 03/15/27 | | | | 75 | | | | 85,458 | |
| | | | | | | | | | | | | | | | |
| | | | |
| | | | | | | | | | | | | | | 449,066 | |
| | | | |
Agriculture 0.4% | | | | | | | | | | | | | | | | |
Altria Group, Inc., | | | | | | | | | | | | | | | | |
Gtd. Notes | | | 2.850 | | | | 08/09/22 | | | | 65 | | | | 67,899 | |
Gtd. Notes | | | 4.800 | | | | 02/14/29 | | | | 25 | | | | 30,123 | |
BAT Capital Corp. (United Kingdom), | | | | | | | | | | | | | | | | |
Gtd. Notes | | | 3.215 | | | | 09/06/26 | | | | 25 | | | | 27,236 | |
Gtd. Notes | | | 3.222 | | | | 08/15/24 | | | | 20 | | | | 21,594 | |
Gtd. Notes | | | 3.557 | | | | 08/15/27 | | | | 20 | | | | 21,971 | |
Philip Morris International, Inc., | | | | | | | | | | | | | | | | |
Sr. Unsec’d. Notes | | | 1.125 | | | | 05/01/23 | | | | 10 | | | | 10,176 | |
Sr. Unsec’d. Notes | | | 2.625 | | | | 03/06/23 | | | | 50 | | | | 52,884 | |
| | | | | | | | | | | | | | | | |
| | | | |
| | | | | | | | | | | | | | | 231,883 | |
| | | | |
Airlines 0.2% | | | | | | | | | | | | | | | | |
Continental Airlines 2012-1 Class A Pass-Through Trust, | | | | | | | | | | | | | | | | |
Pass-Through Certificates | | | 4.150 | | | | 10/11/25 | | | | 23 | | | | 21,535 | |
Delta Air Lines, Inc., | | | | | | | | | | | | | | | | |
Sr. Unsec’d. Notes | | | 3.400 | | | | 04/19/21 | | | | 20 | | | | 19,935 | |
Sr. Unsec’d. Notes | | | 3.625 | | | | 03/15/22 | | | | 20 | | | | 19,744 | |
Southwest Airlines Co., | | | | | | | | | | | | | | | | |
Sr. Unsec’d. Notes | | | 2.625 | | | | 02/10/30 | | | | 20 | | | | 18,184 | |
Sr. Unsec’d. Notes | | | 5.125 | | | | 06/15/27 | | | | 30 | | | | 31,478 | |
| | | | | | | | | | | | | | | | |
| | | | |
| | | | | | | | | | | | | | | 110,876 | |
| | | | |
Auto Manufacturers 0.2% | | | | | | | | | | | | | | | | |
Ford Motor Co., | | | | | | | | | | | | | | | | |
Sr. Unsec’d. Notes | | | 6.375 | | | | 02/01/29 | | | | 10 | | | | 10,421 | |
Ford Motor Credit Co. LLC, | | | | | | | | | | | | | | | | |
Sr. Unsec’d. Notes | | | 3.664 | | | | 09/08/24 | | | | 10 | | | | 10,075 | |
Sr. Unsec’d. Notes | | | 3.810 | | | | 01/09/24 | | | | 10 | | | | 10,081 | |
Sr. Unsec’d. Notes | | | 4.134 | | | | 08/04/25 | | | | 45 | | | | 46,097 | |
See Notes to Financial Statements.
| | | | |
| PGIM Day One Underlying Funds | | | 47 | |
PGIM Core Conservative Bond Fund
Schedule of Investments (continued)
as of July 31, 2020
| | | | | | | | | | | | | | | | |
| | | | |
Description | | Interest Rate | | | Maturity Date | | | Principal Amount (000)# | | | Value | |
| | | | |
CORPORATE BONDS (Continued) | | | | | | | | | | | | | | | | |
| | | | |
Auto Manufacturers (cont’d.) | | | | | | | | | | | | | | | | |
General Motors Co., | | | | | | | | | | | | | | | | |
Sr. Unsec’d. Notes | | | 6.250% | | | | 10/02/43 | | | | 5 | | | $ | 5,936 | |
General Motors Financial Co., Inc., | | | | | | | | | | | | | | | | |
Gtd. Notes | | | 4.000 | | | | 01/15/25 | | | | 50 | | | | 53,436 | |
| | | | | | | | | | | | | | | | |
| | | | |
| | | | | | | | | | | | | | | 136,046 | |
| | | | |
Banks 5.9% | | | | | | | | | | | | | | | | |
Bank of America Corp., | | | | | | | | | | | | | | | | |
Sr. Unsec’d. Notes, GMTN | | | 3.593(ff) | | | | 07/21/28 | | | | 35 | | | | 39,824 | |
Sr. Unsec’d. Notes, MTN | | | 3.970(ff) | | | | 03/05/29 | | | | 255 | | | | 296,810 | |
Sr. Unsec’d. Notes, MTN | | | 4.083(ff) | | | | 03/20/51 | | | | 75 | | | | 98,003 | |
Sub. Notes, MTN | | | 4.000 | | | | 01/22/25 | | | | 20 | | | | 22,336 | |
Sub. Notes, Series L, MTN | | | 3.950 | | | | 04/21/25 | | | | 45 | | | | 50,442 | |
Barclays PLC (United Kingdom), | | | | | | | | | | | | | | | | |
Sr. Unsec’d. Notes | | | 3.650 | | | | 03/16/25 | | | | 200 | | | | 220,102 | |
Citigroup, Inc., | | | | | | | | | | | | | | | | |
Sr. Unsec’d. Notes | | | 2.572(ff) | | | | 06/03/31 | | | | 70 | | | | 74,387 | |
Sr. Unsec’d. Notes | | | 2.666(ff) | | | | 01/29/31 | | | | 35 | | | | 37,423 | |
Sr. Unsec’d. Notes | | | 2.976(ff) | | | | 11/05/30 | | | | 50 | | | | 54,723 | |
Sr. Unsec’d. Notes | | | 3.400 | | | | 05/01/26 | | | | 45 | | | | 50,383 | |
Sr. Unsec’d. Notes | | | 3.520(ff) | | | | 10/27/28 | | | | 25 | | | | 28,171 | |
Sr. Unsec’d. Notes | | | 3.668(ff) | | | | 07/24/28 | | | | 165 | | | | 187,443 | |
Sr. Unsec’d. Notes | | | 4.650 | | | | 07/30/45 | | | | 50 | | | | 68,508 | |
Credit Suisse Group Funding Guernsey Ltd. (Switzerland), | | | | | | | | | | | | | | | | |
Gtd. Notes | | | 4.550 | | | | 04/17/26 | | | | 200 | | | | 233,406 | |
Deutsche Bank AG (Germany), | | | | | | | | | | | | | | | | |
Sr. Unsec’d. Notes, Series D | | | 5.000 | | | | 02/14/22 | | | | 50 | | | | 52,457 | |
Goldman Sachs Group, Inc. (The), | | | | | | | | | | | | | | | | |
Sr. Unsec’d. Notes | | | 3.691(ff) | | | | 06/05/28 | | | | 200 | | | | 227,787 | |
Sr. Unsec’d. Notes | | | 3.814(ff) | | | | 04/23/29 | | | | 55 | | | | 63,502 | |
HSBC Holdings PLC (United Kingdom), | | | | | | | | | | | | | | | | |
Sr. Unsec’d. Notes | | | 4.000 | | | | 03/30/22 | | | | 100 | | | | 105,656 | |
JPMorgan Chase & Co., | | | | | | | | | | | | | | | | |
Sr. Unsec’d. Notes | | | 2.522(ff) | | | | 04/22/31 | | | | 50 | | | | 53,923 | |
Sr. Unsec’d. Notes | | | 2.739(ff) | | | | 10/15/30 | | | | 5 | | | | 5,466 | |
Sr. Unsec’d. Notes | | | 3.509(ff) | | | | 01/23/29 | | | | 185 | | | | 210,511 | |
Sr. Unsec’d. Notes | | | 3.882(ff) | | | | 07/24/38 | | | | 95 | | | | 117,441 | |
Sr. Unsec’d. Notes | | | 4.452(ff) | | | | 12/05/29 | | | | 50 | | | | 60,570 | |
See Notes to Financial Statements.
PGIM Core Conservative Bond Fund
Schedule of Investments (continued)
as of July 31, 2020
| | | | | | | | | | | | | | | | |
| | | | |
Description | | Interest Rate | | | Maturity Date | | | Principal Amount (000)# | | | Value | |
| | | | |
CORPORATE BONDS (Continued) | | | | | | | | | | | | | | | | |
| | | | |
Banks (cont’d.) | | | | | | | | | | | | | | | | |
JPMorgan Chase & Co., (cont’d.) | | | | | | | | | | | | | | | | |
Sub. Notes | | | 3.875% | | | | 09/10/24 | | | | 120 | | | $ | 134,130 | |
KeyBank NA, | | | | | | | | | | | | | | | | |
Sub. Notes | | | 3.900 | | | | 04/13/29 | | | | 50 | | | | 57,355 | |
Morgan Stanley, | | | | | | | | | | | | | | | | |
Sr. Unsec’d. Notes | | | 4.375 | | | | 01/22/47 | | | | 55 | | | | 77,133 | |
Sr. Unsec’d. Notes, GMTN | | | 3.772(ff) | | | | 01/24/29 | | | | 100 | | | | 115,969 | |
Sr. Unsec’d. Notes, GMTN | | | 3.875 | | | | 01/27/26 | | | | 25 | | | | 28,712 | |
Sr. Unsec’d. Notes, GMTN | | | 4.431(ff) | | | | 01/23/30 | | | | 55 | | | | 66,747 | |
Sub. Notes, GMTN | | | 4.350 | | | | 09/08/26 | | | | 30 | | | | 35,079 | |
Natwest Group PLC (United Kingdom), | | | | | | | | | | | | | | | | |
Sr. Unsec’d. Notes | | | 4.269(ff) | | | | 03/22/25 | | | | 30 | | | | 32,991 | |
PNC Financial Services Group, Inc. (The), | | | | | | | | | | | | | | | | |
Sub. Notes | | | 3.900 | | | | 04/29/24 | | | | 50 | | | | 55,576 | |
Truist Bank, | | | | | | | | | | | | | | | | |
Sr. Unsec’d. Notes | | | 2.750 | | | | 05/01/23 | | | | 20 | | | | 21,121 | |
Truist Financial Corp., | | | | | | | | | | | | | | | | |
Sr. Unsec’d. Notes | | | 2.700 | | | | 01/27/22 | | | | 20 | | | | 20,645 | |
Wells Fargo & Co., | | | | | | | | | | | | | | | | |
Sr. Unsec’d. Notes | | | 3.000 | | | | 10/23/26 | | | | 55 | | | | 60,360 | |
Sr. Unsec’d. Notes, MTN | | | 2.572(ff) | | | | 02/11/31 | | | | 70 | | | | 74,303 | |
Sr. Unsec’d. Notes, MTN | | | 2.879(ff) | | | | 10/30/30 | | | | 150 | | | | 163,026 | |
Sr. Unsec’d. Notes, MTN | | | 3.000 | | | | 02/19/25 | | | | 90 | | | | 97,876 | |
| | | | | | | | | | | | | | | | |
| | | | |
| | | | | | | | | | | | | | | 3,400,297 | |
| | | | |
Beverages 0.6% | | | | | | | | | | | | | | | | |
Anheuser-Busch Cos. LLC/Anheuser-Busch InBev | | | | | | | | | | | | | | | | |
Worldwide, Inc. (Belgium), | | | | | | | | | | | | | | | | |
Gtd. Notes | | | 3.650 | | | | 02/01/26 | | | | 80 | | | | 90,892 | |
Gtd. Notes | | | 4.700 | | | | 02/01/36 | | | | 20 | | | | 24,571 | |
Gtd. Notes | | | 4.900 | | | | 02/01/46 | | | | 60 | | | | 76,929 | |
Anheuser-Busch InBev Finance, Inc. (Belgium), | | | | | | | | | | | | | | | | |
Gtd. Notes | | | 3.300 | | | | 02/01/23 | | | | 4 | | | | 4,255 | |
Constellation Brands, Inc., | | | | | | | | | | | | | | | | |
Gtd. Notes | | | 3.700 | | | | 12/06/26 | | | | 20 | | | | 22,971 | |
Gtd. Notes | | | 4.400 | | | | 11/15/25 | | | | 10 | | | | 11,756 | |
See Notes to Financial Statements.
| | | | |
| PGIM Day One Underlying Funds | | | 49 | |
PGIM Core Conservative Bond Fund
Schedule of Investments (continued)
as of July 31, 2020
| | | | | | | | | | | | | | | | |
| | | | |
Description | | Interest Rate | | | Maturity Date | | | Principal Amount (000)# | | | Value | |
| | | | |
CORPORATE BONDS (Continued) | | | | | | | | | | | | | | | | |
| | | | |
Beverages (cont’d.) | | | | | | | | | | | | | | | | |
PepsiCo, Inc., | | | | | | | | | | | | | | | | |
Sr. Unsec’d. Notes | | | 2.750% | | | | 03/05/22 | | | | 75 | | | $ | 78,057 | |
Sr. Unsec’d. Notes | | | 3.600 | | | | 03/01/24 | | | | 10 | | | | 11,042 | |
| | | | | | | | | | | | | | | | |
| | | | |
| | | | | | | | | | | | | | | 320,473 | |
| | | | |
Biotechnology 0.4% | | | | | | | | | | | | | | | | |
Amgen, Inc., | | | | | | | | | | | | | | | | |
Sr. Unsec’d. Notes | | | 2.600 | | | | 08/19/26 | | | | 180 | | | | 197,886 | |
Gilead Sciences, Inc., | | | | | | | | | | | | | | | | |
Sr. Unsec’d. Notes | | | 3.650 | | | | 03/01/26 | | | | 15 | | | | 17,281 | |
Sr. Unsec’d. Notes | | | 4.400 | | | | 12/01/21 | | | | 20 | | | | 20,885 | |
| | | | | | | | | | | | | | | | |
| | | | |
| | | | | | | | | | | | | | | 236,052 | |
| | | | |
Building Materials 0.1% | | | | | | | | | | | | | | | | |
Johnson Controls International PLC, | | | | | | | | | | | | | | | | |
Sr. Unsec’d. Notes | | | 4.950 | | | | 07/02/64 | | | | 4 | | | | 5,138 | |
Martin Marietta Materials, Inc., | | | | | | | | | | | | | | | | |
Sr. Unsec’d. Notes, Series CB | | | 2.500 | | | | 03/15/30 | | | | 10 | | | | 10,495 | |
Owens Corning, | | | | | | | | | | | | | | | | |
Sr. Unsec’d. Notes | | | 4.300 | | | | 07/15/47 | | | | 15 | | | | 16,279 | |
Vulcan Materials Co., | | | | | | | | | | | | | | | | |
Sr. Unsec’d. Notes | | | 4.500 | | | | 06/15/47 | | | | 30 | | | | 36,244 | |
| | | | | | | | | | | | | | | | |
| | | | |
| | | | | | | | | | | | | | | 68,156 | |
| | | | |
Chemicals 0.9% | | | | | | | | | | | | | | | | |
Dow Chemical Co. (The), | | | | | | | | | | | | | | | | |
Sr. Unsec’d. Notes | | | 3.625 | | | | 05/15/26 | | | | 55 | | | | 61,355 | |
Sr. Unsec’d. Notes | | | 4.625 | | | | 10/01/44 | | | | 20 | | | | 24,259 | |
Sr. Unsec’d. Notes | | | 5.550 | | | | 11/30/48 | | | | 10 | | | | 13,778 | |
DuPont de Nemours, Inc., | | | | | | | | | | | | | | | | |
Sr. Unsec’d. Notes | | | 4.493 | | | | 11/15/25 | | | | 65 | | | | 75,821 | |
Eastman Chemical Co., | | | | | | | | | | | | | | | | |
Sr. Unsec’d. Notes | | | 4.650 | | | | 10/15/44 | | | | 45 | | | | 56,277 | |
FMC Corp., | | | | | | | | | | | | | | | | |
Sr. Unsec’d. Notes | | | 4.500 | | | | 10/01/49 | | | | 20 | | | | 25,599 | |
LYB International Finance II BV, | | | | | | | | | | | | | | | | |
Gtd. Notes | | | 3.500 | | | | 03/02/27 | | | | 85 | | | | 95,284 | |
See Notes to Financial Statements.
PGIM Core Conservative Bond Fund
Schedule of Investments (continued)
as of July 31, 2020
| | | | | | | | | | | | | | | | |
| | | | |
Description | | Interest Rate | | | Maturity Date | | | Principal Amount (000)# | | | Value | |
| | | | |
CORPORATE BONDS (Continued) | | | | | | | | | | | | | | | | |
| | | | |
Chemicals (cont’d.) | | | | | | | | | | | | | | | | |
LyondellBasell Industries NV, | | | | | | | | | | | | | | | | |
Sr. Unsec’d. Notes | | | 5.750% | | | | 04/15/24 | | | | 15 | | | $ | 17,441 | |
Sr. Unsec’d. Notes | | | 6.000 | | | | 11/15/21 | | | | 30 | | | | 31,662 | |
Nutrien Ltd. (Canada), | | | | | | | | | | | | | | | | |
Sr. Unsec’d. Notes | | | 3.500 | | | | 06/01/23 | | | | 50 | | | | 53,420 | |
Sr. Unsec’d. Notes | | | 5.250 | | | | 01/15/45 | | | | 35 | | | | 45,874 | |
Sherwin-Williams Co. (The), | | | | | | | | | | | | | | | | |
Sr. Unsec’d. Notes | | | 4.500 | | | | 06/01/47 | | | | 10 | | | | 13,363 | |
| | | | | | | | | | | | | | | | |
| | | | |
| | | | | | | | | | | | | | | 514,133 | |
| | | | |
Commercial Services 0.3% | | | | | | | | | | | | | | | | |
California Institute of Technology, | | | | | | | | | | | | | | | | |
Sr. Unsec’d. Notes | | | 3.650 | | | | 09/01/2119 | | | | 15 | | | | 17,766 | |
Cintas Corp. No. 2, | | | | | | | | | | | | | | | | |
Gtd. Notes | | | 3.700 | | | | 04/01/27 | | | | 20 | | | | 23,058 | |
Equifax, Inc., | | | | | | | | | | | | | | | | |
Sr. Unsec’d. Notes | | | 2.600 | | | | 12/01/24 | | | | 30 | | | | 32,016 | |
Global Payments, Inc., | | | | | | | | | | | | | | | | |
Sr. Unsec’d. Notes | | | 2.650 | | | | 02/15/25 | | | | 10 | | | | 10,720 | |
IHS Markit Ltd., | | | | | | | | | | | | | | | | |
Sr. Unsec’d. Notes | | | 4.125 | | | | 08/01/23 | | | | 5 | | | | 5,476 | |
President & Fellows of Harvard College, | | | | | | | | | | | | | | | | |
Unsec’d. Notes | | | 3.150 | | | | 07/15/46 | | | | 9 | | | | 10,599 | |
Trustees of the University of Pennsylvania (The), | | | | | | | | | | | | | | | | |
Sr. Unsec’d. Notes | | | 3.610 | | | | 02/15/2119 | | | | 5 | | | | 6,119 | |
Unsec’d. Notes, Series 2020 | | | 2.396 | | | | 10/01/50 | | | | 15 | | | | 15,799 | |
University of Southern California, | | | | | | | | | | | | | | | | |
Unsec’d. Notes, Series 2017 | | | 3.841 | | | | 10/01/47 | | | | 10 | | | | 13,122 | |
Yale University, | | | | | | | | | | | | | | | | |
Unsec’d. Notes, Series 2020 | | | 2.402 | | | | 04/15/50 | | | | 45 | | | | 49,112 | |
| | | | | | | | | | | | | | | | |
| | | | |
| | | | | | | | | | | | | | | 183,787 | |
| | | | |
Computers 0.7% | | | | | | | | | | | | | | | | |
Apple, Inc., | | | | | | | | | | | | | | | | |
Sr. Unsec’d. Notes | | | 3.250 | | | | 02/23/26 | | | | 155 | | | | 175,702 | |
Sr. Unsec’d. Notes | | | 3.850 | | | | 08/04/46 | | | | 50 | | | | 65,039 | |
See Notes to Financial Statements.
| | | | |
| PGIM Day One Underlying Funds | | | 51 | |
PGIM Core Conservative Bond Fund
Schedule of Investments (continued)
as of July 31, 2020
| | | | | | | | | | | | | | | | |
| | | | |
Description | | Interest Rate | | | Maturity Date | | | Principal Amount (000)# | | | Value | |
| | | | |
CORPORATE BONDS (Continued) | | | | | | | | | | | | | | | | |
| | | | |
Computers (cont’d.) | | | | | | | | | | | | | | | | |
International Business Machines Corp., | | | | | | | | | | | | | | | | |
Sr. Unsec’d. Notes | | | 3.625% | | | | 02/12/24 | | | | 160 | | | $ | 176,978 | |
| | | | | | | | | | | | | | | | |
| | | | |
| | | | | | | | | | | | | | | 417,719 | |
| | | | |
Diversified Financial Services 0.5% | | | | | | | | | | | | | | | | |
Capital One Bank USA NA, | | | | | | | | | | | | | | | | |
Sub. Notes | | | 3.375 | | | | 02/15/23 | | | | 20 | | | | 21,148 | |
Discover Financial Services, | | | | | | | | | | | | | | | | |
Sr. Unsec’d. Notes | | | 4.100 | | | | 02/09/27 | | | | 20 | | | | 22,156 | |
Mastercard, Inc., | | | | | | | | | | | | | | | | |
Sr. Unsec’d. Notes | | | 3.375 | | | | 04/01/24 | | | | 20 | | | | 22,149 | |
Nomura Holdings, Inc. (Japan), | | | | | | | | | | | | | | | | |
Sr. Unsec’d. Notes | | | 2.648 | | | | 01/16/25 | | | | 200 | | | | 210,009 | |
Private Export Funding Corp., | | | | | | | | | | | | | | | | |
U.S. Gov’t. Gtd. Notes, Series KK | | | 3.550 | | | | 01/15/24 | | | | 25 | | | | 27,632 | |
Visa, Inc., | | | | | | | | | | | | | | | | |
Sr. Unsec’d. Notes | | | 2.700 | | | | 04/15/40 | | | | 5 | | | | 5,701 | |
| | | | | | | | | | | | | | | | |
| | | | |
| | | | | | | | | | | | | | | 308,795 | |
| | | | |
Electric 2.9% | | | | | | | | | | | | | | | | |
AEP Texas, Inc., | | | | | | | | | | | | | | | | |
Sr. Unsec’d. Notes, Series I | | | 2.100 | | | | 07/01/30 | | | | 20 | | | | 20,814 | |
Alabama Power Co., | | | | | | | | | | | | | | | | |
Sr. Unsec’d. Notes | | | 3.850 | | | | 12/01/42 | | | | 15 | | | | 18,620 | |
Ameren Illinois Co., | | | | | | | | | | | | | | | | |
First Mortgage | | | 3.250 | | | | 03/15/50 | | | | 15 | | | | 18,045 | |
First Mortgage | | | 4.500 | | | | 03/15/49 | | | | 15 | | | | 21,487 | |
Sr. Sec’d. Notes | | | 4.150 | | | | 03/15/46 | | | | 15 | | | | 20,014 | |
Appalachian Power Co., | | | | | | | | | | | | | | | | |
Sr. Unsec’d. Notes, Series X | | | 3.300 | | | | 06/01/27 | | | | 10 | | | | 11,089 | |
CenterPoint Energy Houston Electric LLC, | | | | | | | | | | | | | | | | |
General Ref. Mortgage | | | 3.950 | | | | 03/01/48 | | | | 25 | | | | 32,904 | |
CenterPoint Energy, Inc., | | | | | | | | | | | | | | | | |
Sr. Unsec’d. Notes | | | 2.950 | | | | 03/01/30 | | | | 25 | | | | 27,572 | |
Commonwealth Edison Co., | | | | | | | | | | | | | | | | |
First Mortgage | | | 4.350 | | | | 11/15/45 | | | | 15 | | | | 20,483 | |
First Mortgage | | | 4.600 | | | | 08/15/43 | | | | 35 | | | | 48,232 | |
First Mortgage, Series 122 | | | 2.950 | | | | 08/15/27 | | | | 30 | | | | 33,786 | |
See Notes to Financial Statements.
PGIM Core Conservative Bond Fund
Schedule of Investments (continued)
as of July 31, 2020
| | | | | | | | | | | | | | | | |
| | | | |
Description | | Interest Rate | | | Maturity Date | | | Principal Amount (000)# | | | Value | |
| | | | |
CORPORATE BONDS (Continued) | | | | | | | | | | | | | | | | |
| | | | |
Electric (cont’d.) | | | | | | | | | | | | | | | | |
Commonwealth Edison Co., (cont’d.) | | | | | | | | | | | | | | | | |
First Mortgage, Series 123 | | | 3.750% | | | | 08/15/47 | | | | 5 | | | $ | 6,386 | |
First Mortgage, Series 127 | | | 3.200 | | | | 11/15/49 | | | | 5 | | | | 5,929 | |
Dominion Energy South Carolina, Inc., | | | | | | | | | | | | | | | | |
First Mortgage | | | 5.100 | | | | 06/01/65 | | | | 15 | | | | 24,052 | |
First Mortgage | | | 5.450 | | | | 02/01/41 | | | | 20 | | | | 28,933 | |
DTE Electric Co., | | | | | | | | | | | | | | | | |
General Ref. Mortgage | | | 3.750 | | | | 08/15/47 | | | | 20 | | | | 25,377 | |
DTE Energy Co., | | | | | | | | | | | | | | | | |
Sr. Unsec’d. Notes | | | 3.800 | | | | 03/15/27 | | | | 50 | | | | 56,354 | |
Duke Energy Carolinas LLC, | | | | | | | | | | | | | | | | |
First Mortgage | | | 4.250 | | | | 12/15/41 | | | | 5 | | | | 6,727 | |
First Ref. Mortgage | | | 4.000 | | | | 09/30/42 | | | | 40 | | | | 51,808 | |
Duke Energy Corp., | | | | | | | | | | | | | | | | |
Sr. Unsec’d. Notes | | | 2.650 | | | | 09/01/26 | | | | 75 | | | | 82,686 | |
Duke Energy Indiana LLC, | | | | | | | | | | | | | | | | |
First Mortgage, Series YYY | | | 3.250 | | | | 10/01/49 | | | | 40 | | | | 47,971 | |
Emera US Finance LP (Canada), | | | | | | | | | | | | | | | | |
Gtd. Notes | | | 4.750 | | | | 06/15/46 | | | | 15 | | | | 19,498 | |
Entergy Louisiana LLC, | | | | | | | | | | | | | | | | |
Collateral Trust | | | 4.200 | | | | 04/01/50 | | | | 10 | | | | 13,893 | |
Evergy Kansas Central, Inc., | | | | | | | | | | | | | | | | |
First Mortgage | | | 4.125 | | | | 03/01/42 | | | | 15 | | | | 18,878 | |
Exelon Corp., | | | | | | | | | | | | | | | | |
Sr. Unsec’d. Notes | | | 5.625 | | | | 06/15/35 | | | | 5 | | | | 6,861 | |
Exelon Generation Co. LLC, | | | | | | | | | | | | | | | | |
Sr. Unsec’d. Notes | | | 5.600 | | | | 06/15/42 | | | | 5 | | | | 6,080 | |
FirstEnergy Corp., | | | | | | | | | | | | | | | | |
Sr. Unsec’d. Notes, Series C | | | 4.850 | | | | 07/15/47 | | | | 15 | | | | 18,556 | |
Florida Power & Light Co., | | | | | | | | | | | | | | | | |
First Mortgage | | | 3.950 | | | | 03/01/48 | | | | 45 | | | | 61,396 | |
First Mortgage | | | 5.250 | | | | 02/01/41 | | | | 25 | | | | 37,134 | |
Fortis, Inc. (Canada), | | | | | | | | | | | | | | | | |
Sr. Unsec’d. Notes | | | 3.055 | | | | 10/04/26 | | | | 7 | | | | 7,666 | |
Georgia Power Co., | | | | | | | | | | | | | | | | |
Sr. Unsec’d. Notes, Series B | | | 2.650 | | | | 09/15/29 | | | | 45 | | | | 48,989 | |
Hydro-Quebec (Canada), | | | | | | | | | | | | | | | | |
Local Gov’t. Gtd. Notes, Series IO | | | 8.050 | | | | 07/07/24 | | | | 10 | | | | 12,791 | |
Indiana Michigan Power Co., | | | | | | | | | | | | | | | | |
Sr. Unsec’d. Notes, Series K | | | 4.550 | | | | 03/15/46 | | | | 20 | | | | 27,213 | |
See Notes to Financial Statements.
| | | | |
| PGIM Day One Underlying Funds | | | 53 | |
PGIM Core Conservative Bond Fund
Schedule of Investments (continued)
as of July 31, 2020
| | | | | | | | | | | | | | | | |
| | | | |
Description | | Interest Rate | | | Maturity Date | | | Principal Amount (000)# | | | Value | |
| | | | |
CORPORATE BONDS (Continued) | | | | | | | | | | | | | | | | |
| | | | |
Electric (cont’d.) | | | | | | | | | | | | | | | | |
Louisville Gas & Electric Co., | | | | | | | | | | | | | | | | |
First Mortgage | | | 5.125% | | | | 11/15/40 | | | | 5 | | | $ | 6,614 | |
NextEra Energy Capital Holdings, Inc., | | | | | | | | | | | | | | | | |
Gtd. Notes | | | 2.250 | | | | 06/01/30 | | | | 10 | | | | 10,771 | |
Gtd. Notes | | | 3.150 | | | | 04/01/24 | | | | 25 | | | | 27,198 | |
Northern States Power Co., | | | | | | | | | | | | | | | | |
First Mortgage | | | 3.600 | | | | 09/15/47 | | | | 15 | | | | 19,074 | |
Ohio Power Co., | | | | | | | | | | | | | | | | |
Sr. Unsec’d. Notes | | | 4.000 | | | | 06/01/49 | | | | 20 | | | | 25,876 | |
Pacific Gas & Electric Co., | | | | | | | | | | | | | | | | |
First Mortgage | | | 4.500 | | | | 07/01/40 | | | | 15 | | | | 17,236 | |
PacifiCorp, | | | | | | | | | | | | | | | | |
First Mortgage | | | 3.300 | | | | 03/15/51 | | | | 40 | | | | 48,625 | |
First Mortgage | | | 5.250 | | | | 06/15/35 | | | | 45 | | | | 64,518 | |
PECO Energy Co., | | | | | | | | | | | | | | | | |
First Mortgage | | | 2.800 | | | | 06/15/50 | | | | 15 | | | | 17,149 | |
First Mortgage | | | 3.900 | | | | 03/01/48 | | | | 40 | | | | 53,048 | |
PPL Capital Funding, Inc., | | | | | | | | | | | | | | | | |
Gtd. Notes | | | 4.700 | | | | 06/01/43 | | | | 35 | | | | 43,760 | |
PPL Electric Utilities Corp., | | | | | | | | | | | | | | | | |
First Mortgage | | | 4.125 | | | | 06/15/44 | | | | 15 | | | | 19,558 | |
First Mortgage | | | 4.150 | | | | 10/01/45 | | | | 20 | | | | 26,348 | |
First Mortgage | | | 6.250 | | | | 05/15/39 | | | | 10 | | | | 15,340 | |
Public Service Electric & Gas Co., | | | | | | | | | | | | | | | | |
First Mortgage, MTN | | | 3.600 | | | | 12/01/47 | | | | 5 | | | | 6,333 | |
First Mortgage, MTN | | | 3.650 | | | | 09/01/28 | | | | 35 | | | | 41,488 | |
First Mortgage, MTN | | | 3.850 | | | | 05/01/49 | | | | 10 | | | | 13,303 | |
First Ref. Mortgage, MTN | | | 3.950 | | | | 05/01/42 | | | | 10 | | | | 13,000 | |
Puget Energy, Inc., | | | | | | | | | | | | | | | | |
Sr. Sec’d. Notes | | | 3.650 | | | | 05/15/25 | | | | 20 | | | | 21,349 | |
Sr. Sec’d. Notes, 144A | | | 4.100 | | | | 06/15/30 | | | | 35 | | | | 39,266 | |
San Diego Gas & Electric Co., | | | | | | | | | | | | | | | | |
First Mortgage, Series RRR | | | 3.750 | | | | 06/01/47 | | | | 5 | | | | 6,208 | |
First Mortgage, Series UUU | | | 3.320 | | | | 04/15/50 | | | | 25 | | | | 29,957 | |
Sempra Energy, | | | | | | | | | | | | | | | | |
Sr. Unsec’d. Notes | | | 4.000 | | | | 02/01/48 | | | | 25 | | | | 30,483 | |
Southern California Edison Co., | | | | | | | | | | | | | | | | |
First Ref. Mortgage | | | 4.000 | | | | 04/01/47 | | | | 25 | | | | 29,655 | |
First Ref. Mortgage | | | 4.650 | | | | 10/01/43 | | | | 40 | | | | 50,830 | |
See Notes to Financial Statements.
PGIM Core Conservative Bond Fund
Schedule of Investments (continued)
as of July 31, 2020
| | | | | | | | | | | | | | | | |
| | | | |
Description | | Interest Rate | | | Maturity Date | | | Principal Amount (000)# | | | Value | |
| | | | |
CORPORATE BONDS (Continued) | | | | | | | | | | | | | | | | |
| | | | |
Electric (cont’d.) | | | | | | | | | | | | | | | | |
Virginia Electric & Power Co., | | | | | | | | | | | | | | | | |
Sr. Unsec’d. Notes, Series A | | | 6.000% | | | | 05/15/37 | | | | 20 | | | $ | 30,008 | |
Sr. Unsec’d. Notes, Series B | | | 6.000 | | | | 01/15/36 | | | | 10 | | | | 14,628 | |
Xcel Energy, Inc., | | | | | | | | | | | | | | | | |
Sr. Unsec’d. Notes | | | 3.500 | | | | 12/01/49 | | | | 35 | | | | 42,547 | |
| | | | | | | | | | | | | | | | |
| | | | |
| | | | | | | | | | | | | | | 1,652,394 | |
| | | | |
Electronics 0.1% | | | | | | | | | | | | | | | | |
FLIR Systems, Inc., | | | | | | | | | | | | | | | | |
Sr. Unsec’d. Notes | | | 2.500 | | | | 08/01/30 | | | | 5 | | | | 5,155 | |
Honeywell International, Inc., | | | | | | | | | | | | | | | | |
Sr. Unsec’d. Notes | | | 1.350 | | | | 06/01/25 | | | | 25 | | | | 25,859 | |
| | | | | | | | | | | | | | | | |
| | | | |
| | | | | | | | | | | | | | | 31,014 | |
| | | | |
Environmental Control 0.0% | | | | | | | | | | | | | | | | |
Waste Connections, Inc., | | | | | | | | | | | | | | | | |
Sr. Unsec’d. Notes | | | 3.050 | | | | 04/01/50 | | | | 5 | | | | 5,550 | |
| | | | |
Foods 0.4% | | | | | | | | | | | | | | | | |
General Mills, Inc., | | | | | | | | | | | | | | | | |
Sr. Unsec’d. Notes | | | 2.875 | | | | 04/15/30 | | | | 35 | | | | 39,232 | |
Hormel Foods Corp., | | | | | | | | | | | | | | | | |
Sr. Unsec’d. Notes | | | 1.800 | | | | 06/11/30 | | | | 85 | | | | 89,199 | |
Kroger Co. (The), | | | | | | | | | | | | | | | | |
Sr. Unsec’d. Notes | | | 2.650 | | | | 10/15/26 | | | | 15 | | | | 16,576 | |
Mondelez International, Inc., | | | | | | | | | | | | | | | | |
Sr. Unsec’d. Notes | | | 2.750 | | | | 04/13/30 | | | | 25 | | | | 27,729 | |
Tyson Foods, Inc., | | | | | | | | | | | | | | | | |
Sr. Unsec’d. Notes | | | 4.000 | | | | 03/01/26 | | | | 60 | | | | 69,255 | |
| | | | | | | | | | | | | | | | |
| | | | |
| | | | | | | | | | | | | | | 241,991 | |
| | | | |
Forest Products & Paper 0.2% | | | | | | | | | | | | | | | | |
International Paper Co., | | | | | | | | | | | | | | | | |
Sr. Unsec’d. Notes | | | 3.000 | | | | 02/15/27 | | | | 100 | | | | 110,377 | |
See Notes to Financial Statements.
| | | | |
| PGIM Day One Underlying Funds | | | 55 | |
PGIM Core Conservative Bond Fund
Schedule of Investments (continued)
as of July 31, 2020
| | | | | | | | | | | | | | | | |
| | | | |
| Description | | Interest Rate | | | Maturity Date | | | Principal Amount (000)# | | | Value | |
| | | | |
CORPORATE BONDS (Continued) | | | | | | | | | | | | | | | | |
| | | | |
Gas 0.2% | | | | | | | | | | | | | | | | |
Atmos Energy Corp., | | | | | | | | | | | | | | | | |
Sr. Unsec’d. Notes | | | 3.375% | | | | 09/15/49 | | | | 35 | | | $ | 42,390 | |
NiSource, Inc., | | | | | | | | | | | | | | | | |
Sr. Unsec’d. Notes | | | 4.800 | | | | 02/15/44 | | | | 25 | | | | 33,409 | |
Southern Co. Gas Capital Corp., | | | | | | | | | | | | | | | | |
Gtd. Notes | | | 4.400 | | | | 06/01/43 | | | | 25 | | | | 30,403 | |
Southwest Gas Corp., | | | | | | | | | | | | | | | | |
Sr. Unsec’d. Notes | | | 2.200 | | | | 06/15/30 | | | | 10 | | | | 10,748 | |
| | | | | | | | | | | | | | | | |
| | | | |
| | | | | | | | | | | | | | | 116,950 | |
| | | | |
Healthcare-Products 0.3% | | | | | | | | | | | | | | | | |
Abbott Laboratories, | | | | | | | | | | | | | | | | |
Sr. Unsec’d. Notes | | | 3.750 | | | | 11/30/26 | | | | 9 | | | | 10,575 | |
Sr. Unsec’d. Notes | | | 4.900 | | | | 11/30/46 | | | | 40 | | | | 60,569 | |
Covidien International Finance SA, | | | | | | | | | | | | | | | | |
Gtd. Notes | | | 2.950 | | | | 06/15/23 | | | | 75 | | | | 79,833 | |
Stryker Corp., | | | | | | | | | | | | | | | | |
Sr. Unsec’d. Notes | | | 3.375 | | | | 05/15/24 | | | | 10 | | | | 10,952 | |
Sr. Unsec’d. Notes | | | 3.375 | | | | 11/01/25 | | | | 10 | | | | 11,285 | |
Thermo Fisher Scientific, Inc., | | | | | | | | | | | | | | | | |
Sr. Unsec’d. Notes | | | 4.133 | | | | 03/25/25 | | | | 10 | | | | 11,512 | |
Sr. Unsec’d. Notes | | | 4.150 | | | | 02/01/24 | | | | 10 | | | | 11,145 | |
| | | | | | | | | | | | | | | | |
| | | | |
| | | | | | | | | | | | | | | 195,871 | |
| | | | |
Healthcare-Services 1.4% | | | | | | | | | | | | | | | | |
Advocate Health & Hospitals Corp., | | | | | | | | | | | | | | | | |
Sr. Unsec’d. Notes | | | 3.387 | | | | 10/15/49 | | | | 15 | | | | 17,320 | |
Aetna, Inc., | | | | | | | | | | | | | | | | |
Sr. Unsec’d. Notes | | | 2.750 | | | | 11/15/22 | | | | 50 | | | | 52,125 | |
Anthem, Inc., | | | | | | | | | | | | | | | | |
Sr. Unsec’d. Notes | | | 3.650 | | | | 12/01/27 | | | | 90 | | | | 103,600 | |
Ascension Health, | | | | | | | | | | | | | | | | |
Sr. Unsec’d. Notes, Series B | | | 2.532 | | | | 11/15/29 | | | | 15 | | | | 16,355 | |
Sr. Unsec’d. Notes, Series B | | | 3.106 | | | | 11/15/39 | | | | 5 | | | | 5,623 | |
Unsec’d. Notes | | | 4.847 | | | | 11/15/53 | | | | 30 | | | | 46,287 | |
BayCare Health System, Inc., | | | | | | | | | | | | | | | | |
Sr. Unsec’d. Notes, Series 2020 | | | 3.831 | | | | 11/15/50 | | | | 5 | | | | 6,424 | |
See Notes to Financial Statements.
PGIM Core Conservative Bond Fund
Schedule of Investments (continued)
as of July 31, 2020
| | | | | | | | | | | | | | | | |
| | | | |
| Description | | Interest Rate | | | Maturity Date | | | Principal Amount (000)# | | | Value | |
| | | | |
CORPORATE BONDS (Continued) | | | | | | | | | | | | | | | | |
| | | | |
Healthcare-Services (cont’d.) | | | | | | | | | | | | | | | | |
Children’s Health System of Texas, | | | | | | | | | | | | | | | | |
Unsec’d. Notes | | | 2.511% | | | | 08/15/50 | | | | 10 | | | $ | 10,298 | |
Children’s Hospital Corp. (The), | | | | | | | | | | | | | | | | |
Gtd. Notes, Series 2017 | | | 4.115 | | | | 01/01/47 | | | | 15 | | | | 19,369 | |
CommonSpirit Health, | | | | | | | | | | | | | | | | |
Sr. Sec’d. Notes | | | 2.760 | | | | 10/01/24 | | | | 20 | | | | 20,935 | |
Hackensack Meridian Health, Inc., | | | | | | | | | | | | | | | | |
Sr. Unsec’d. Notes | | | 4.500 | | | | 07/01/57 | | | | 5 | | | | 6,524 | |
Kaiser Foundation Hospitals, | | | | | | | | | | | | | | | | |
Gtd. Notes | | | 4.150 | | | | 05/01/47 | | | | 20 | | | | 26,693 | |
Laboratory Corp. of America Holdings, | | | | | | | | | | | | | | | | |
Sr. Unsec’d. Notes | | | 4.700 | | | | 02/01/45 | | | | 25 | | | | 33,193 | |
Memorial Sloan-Kettering Cancer Center, | | | | | | | | | | | | | | | | |
Sr. Unsec’d. Notes | | | 5.000 | | | | 07/01/42 | | | | 30 | | | | 42,390 | |
Unsec’d. Notes, Series 2020 | | | 2.955 | | | | 01/01/50 | | | | 5 | | | | 5,589 | |
Mount Sinai Hospitals Group, Inc., | | | | | | | | | | | | | | | | |
Sec’d. Notes, Series 2019 | | | 3.737 | | | | 07/01/49 | | | | 10 | | | | 11,335 | |
New York & Presbyterian Hospital (The), | | | | | | | | | | | | | | | | |
Unsec’d. Notes | | | 4.024 | | | | 08/01/45 | | | | 50 | | | | 65,095 | |
NYU Langone Hospitals, | | | | | | | | | | | | | | | | |
Sec’d. Notes | | | 4.368 | | | | 07/01/47 | | | | 15 | | | | 18,036 | |
Providence St. Joseph Health Obligated Group, | | | | | | | | | | | | | | | | |
Unsec’d. Notes, Series 19A | | | 2.532 | | | | 10/01/29 | | | | 10 | | | | 10,805 | |
Unsec’d. Notes, Series H | | | 2.746 | | | | 10/01/26 | | | | 50 | | | | 54,634 | |
Stanford Health Care, | | | | | | | | | | | | | | | | |
Unsec’d. Notes, Series 2018 | | | 3.795 | | | | 11/15/48 | | | | 15 | | | | 18,831 | |
Sutter Health, | | | | | | | | | | | | | | | | |
Unsec’d. Notes, Series 2018 | | | 4.091 | | | | 08/15/48 | | | | 55 | | | | 66,458 | |
UnitedHealth Group, Inc., | | | | | | | | | | | | | | | | |
Sr. Unsec’d. Notes | | | 3.750 | | | | 07/15/25 | | | | 90 | | | | 103,427 | |
Sr. Unsec’d. Notes | | | 3.875 | | | | 08/15/59 | | | | 5 | | | | 6,617 | |
Sr. Unsec’d. Notes | | | 4.250 | | | | 06/15/48 | | | | 25 | | | | 34,072 | |
| | | | | | | | | | | | | | | | |
| | | | |
| | | | | | | | | | | | | | | 802,035 | |
| | | | |
Insurance 0.7% | | | | | | | | | | | | | | | | |
American International Group, Inc., | | | | | | | | | | | | | | | | |
Sr. Unsec’d. Notes | | | 4.500 | | | | 07/16/44 | | | | 100 | | | | 123,419 | |
Arch Capital Finance LLC, | | | | | | | | | | | | | | | | |
Gtd. Notes | | | 4.011 | | | | 12/15/26 | | | | 45 | | | | 51,904 | |
See Notes to Financial Statements.
| | | | |
| PGIM Day One Underlying Funds | | | 57 | |
PGIM Core Conservative Bond Fund
Schedule of Investments (continued)
as of July 31, 2020
| | | | | | | | | | | | | | | | |
| | | | |
| Description | | Interest Rate | | | Maturity Date | | | Principal Amount (000)# | | | Value | |
| | | | |
CORPORATE BONDS (Continued) | | | | | | | | | | | | | | | | |
| | | | |
Insurance (cont’d.) | | | | | | | | | | | | | | | | |
Berkshire Hathaway, Inc., | | | | | | | | | | | | | | | | |
Sr. Unsec’d. Notes | | | 3.125% | | | | 03/15/26 | | | | 50 | | | $ | 56,428 | |
Chubb Corp. (The), | | | | | | | | | | | | | | | | |
Gtd. Notes | | | 6.000 | | | | 05/11/37 | | | | 30 | | | | 46,077 | |
CNA Financial Corp., | | | | | | | | | | | | | | | | |
Sr. Unsec’d. Notes | | | 3.900 | | | | 05/01/29 | | | | 25 | | | | 28,520 | |
Sr. Unsec’d. Notes | | | 3.950 | | | | 05/15/24 | | | | 35 | | | | 38,579 | |
Lincoln National Corp., | | | | | | | | | | | | | | | | |
Sr. Unsec’d. Notes | | | 3.050 | | | | 01/15/30 | | | | 5 | | | | 5,492 | |
Sr. Unsec’d. Notes | | | 4.350 | | | | 03/01/48 | | | | 5 | | | | 5,992 | |
Loews Corp., | | | | | | | | | | | | | | | | |
Sr. Unsec’d. Notes | | | 3.200 | | | | 05/15/30 | | | | 15 | | | | 16,886 | |
Markel Corp., | | | | | | | | | | | | | | | | |
Sr. Unsec’d. Notes | | | 4.150 | | | | 09/17/50 | | | | 30 | | | | 36,543 | |
Sr. Unsec’d. Notes | | | 4.300 | | | | 11/01/47 | | | | 15 | | | | 18,364 | |
| | | | | | | | | | | | | | | | |
| | | | |
| | | | | | | | | | | | | | | 428,204 | |
| | | | |
Internet 0.0% | | | | | | | | | | | | | | | | |
Amazon.com, Inc., | | | | | | | | | | | | | | | | |
Sr. Unsec’d. Notes | | | 2.800 | | | | 08/22/24 | | | | 15 | | | | 16,371 | |
| | | | |
Iron/Steel 0.0% | | | | | | | | | | | | | | | | |
Steel Dynamics, Inc., | | | | | | | | | | | | | | | | |
Sr. Unsec’d. Notes | | | 2.400 | | | | 06/15/25 | | | | 10 | | | | 10,500 | |
| | | | |
Lodging 0.1% | | | | | | | | | | | | | | | | |
Marriott International, Inc., | | | | | | | | | | | | | | | | |
Sr. Unsec’d. Notes | | | 3.600 | | | | 04/15/24 | | | | 5 | | | | 5,099 | |
Sr. Unsec’d. Notes, Series R | | | 3.125 | | | | 06/15/26 | | | | 45 | | | | 44,513 | |
| | | | | | | | | | | | | | | | |
| | | | |
| | | | | | | | | | | | | | | 49,612 | |
| | | | |
Machinery-Diversified 0.3% | | | | | | | | | | | | | | | | |
John Deere Capital Corp., | | | | | | | | | | | | | | | | |
Sr. Unsec’d. Notes | | | 2.800 | | | | 01/27/23 | | | | 10 | | | | 10,602 | |
Sr. Unsec’d. Notes, MTN | | | 2.650 | | | | 06/24/24 | | | | 10 | | | | 10,809 | |
Sr. Unsec’d. Notes, MTN | | | 2.800 | | | | 03/06/23 | | | | 30 | | | | 31,867 | |
Westinghouse Air Brake Technologies Corp., | | | | | | | | | | | | | | | | |
Gtd. Notes | | | 3.450 | | | | 11/15/26 | | | | 55 | | | | 58,105 | |
See Notes to Financial Statements.
PGIM Core Conservative Bond Fund
Schedule of Investments (continued)
as of July 31, 2020
| | | | | | | | | | | | | | | | |
| | | | |
| Description | | Interest Rate | | | Maturity Date | | | Principal Amount (000)# | | | Value | |
| | | | |
CORPORATE BONDS (Continued) | | | | | | | | | | | | | | | | |
| | | | |
Machinery-Diversified (cont’d.) | | | | | | | | | | | | | | | | |
Westinghouse Air Brake Technologies Corp., (cont’d.) | | | | | |
Gtd. Notes | | | 4.950% | | | | 09/15/28 | | | | 10 | | | $ | 11,477 | |
Xylem, Inc., | | | | | | | | | | | | | | | | |
Sr. Unsec’d. Notes | | | 3.250 | | | | 11/01/26 | | | | 35 | | | | 39,330 | |
| | | | | | | | | | | | | | | | |
| | | | |
| | | | | | | | | | | | | | | 162,190 | |
| | | | |
Media 1.4% | | | | | | | | | | | | | | | | |
Charter Communications Operating LLC/Charter Communications Operating Capital, | | | | | | | | | | | | | | | | |
Sr. Sec’d. Notes | | | 3.700 | | | | 04/01/51 | | | | 30 | | | | 31,683 | |
Sr. Sec’d. Notes | | | 4.800 | | | | 03/01/50 | | | | 15 | | | | 18,122 | |
Sr. Sec’d. Notes | | | 5.375 | | | | 04/01/38 | | | | 45 | | | | 56,680 | |
Sr. Sec’d. Notes | | | 6.484 | | | | 10/23/45 | | | | 50 | | | | 70,545 | |
Comcast Corp., | | | | | | | | | | | | | | | | |
Gtd. Notes | | | 3.000 | | | | 02/01/24 | | | | 10 | | | | 10,835 | |
Gtd. Notes | | | 3.450 | | | | 02/01/50 | | | | 30 | | | | 36,225 | |
Gtd. Notes | | | 3.750 | | | | 04/01/40 | | | | 10 | | | | 12,472 | |
Gtd. Notes | | | 4.150 | | | | 10/15/28 | | | | 50 | | | | 61,094 | |
Gtd. Notes | | | 4.600 | | | | 08/15/45 | | | | 55 | | | | 76,016 | |
Gtd. Notes | | | 4.650 | | | | 07/15/42 | | | | 10 | | | | 13,606 | |
Gtd. Notes | | | 4.700 | | | | 10/15/48 | | | | 30 | | | | 42,961 | |
Discovery Communications LLC, | | | | | | | | | | | | | | | | |
Gtd. Notes | | | 5.000 | | | | 09/20/37 | | | | 55 | | | | 67,139 | |
Gtd. Notes | | | 5.300 | | | | 05/15/49 | | | | 25 | | | | 32,101 | |
TWDC Enterprises 18 Corp., | | | | | | | | | | | | | | | | |
Gtd. Notes | | | 2.750 | | | | 08/16/21 | | | | 50 | | | | 51,215 | |
ViacomCBS, Inc., | | | | | | | | | | | | | | | | |
Sr. Unsec’d. Notes | | | 3.875 | | | | 04/01/24 | | | | 20 | | | | 21,852 | |
Sr. Unsec’d. Notes | | | 5.850 | | | | 09/01/43 | | | | 10 | | | | 12,728 | |
Walt Disney Co. (The), | | | | | | | | | | | | | | | | |
Gtd. Notes | | | 5.400 | | | | 10/01/43 | | | | 60 | | | | 85,363 | |
Gtd. Notes | | | 7.300 | | | | 04/30/28 | | | | 95 | | | | 131,658 | |
| | | | | | | | | | | | | | | | |
| | | | |
| | | | | | | | | | | | | | | 832,295 | |
| | | | |
Mining 0.1% | | | | | | | | | | | | | | | | |
Barrick North America Finance LLC (Canada), | | | | | | | | | | | | | | | | |
Gtd. Notes | | | 5.750 | | | | 05/01/43 | | | | 5 | | | | 7,476 | |
See Notes to Financial Statements.
| | | | |
| PGIM Day One Underlying Funds | | | 59 | |
PGIM Core Conservative Bond Fund
Schedule of Investments (continued)
as of July 31, 2020
| | | | | | | | | | | | | | | | |
| | | | |
| Description | | Interest Rate | | | Maturity Date | | | Principal Amount (000)# | | | Value | |
| | | | |
CORPORATE BONDS (Continued) | | | | | | | | | | | | | | | | |
| | | | |
Mining (cont’d.) | | | | | | | | | | | | | | | | |
Barrick PD Australia Finance Pty Ltd. (Canada), | | | | | | | | | | | | | | | | |
Gtd. Notes | | | 5.950% | | | | 10/15/39 | | | | 20 | | | $ | 28,955 | |
Newmont Corp., | | | | | | | | | | | | | | | | |
Gtd. Notes | | | 2.250 | | | | 10/01/30 | | | | 20 | | | | 21,092 | |
Gtd. Notes | | | 2.800 | | | | 10/01/29 | | | | 10 | | | | 11,029 | |
| | | | | | | | | | | | | | | | |
| | | | |
| | | | | | | | | | | | | | | 68,552 | |
| | | | |
Miscellaneous Manufacturing 0.2% | | | | | | | | | | | | | | | | |
General Electric Co., | | | | | | | | | | | | | | | | |
Sr. Unsec’d. Notes, GMTN | | | 3.150 | | | | 09/07/22 | | | | 95 | | | | 99,431 | |
Pentair Finance Sarl, | | | | | | | | | | | | | | | | |
Gtd. Notes | | | 4.500 | | | | 07/01/29 | | | | 15 | | | | 16,874 | |
| | | | | | | | | | | | | | | | |
| | | | |
| | | | | | | | | | | | | | | 116,305 | |
| | | | |
Oil & Gas 1.1% | | | | | | | | | | | | | | | | |
BP Capital Markets America, Inc., | | | | | | | | | | | | | | | | |
Gtd. Notes | | | 3.245 | | | | 05/06/22 | | | | 60 | | | | 62,881 | |
Chevron Corp., | | | | | | | | | | | | | | | | |
Sr. Unsec’d. Notes | | | 3.078 | | | | 05/11/50 | | | | 20 | | | | 23,164 | |
Concho Resources, Inc., | | | | | | | | | | | | | | | | |
Gtd. Notes | | | 3.750 | | | | 10/01/27 | | | | 40 | | | | 43,776 | |
Gtd. Notes | | | 4.300 | | | | 08/15/28 | | | | 70 | | | | 79,326 | |
Gtd. Notes | | | 4.875 | | | | 10/01/47 | | | | 5 | | | | 6,010 | |
ConocoPhillips Co., | | | | | | | | | | | | | | | | |
Gtd. Notes | | | 4.950 | | | | 03/15/26 | | | | 30 | | | | 36,434 | |
Devon Energy Corp., | | | | | | | | | | | | | | | | |
Sr. Unsec’d. Notes | | | 5.600 | | | | 07/15/41 | | | | 20 | | | | 20,044 | |
Ecopetrol SA (Colombia), | | | | | | | | | | | | | | | | |
Sr. Unsec’d. Notes | | | 5.375 | | | | 06/26/26 | | | | 30 | | | | 33,152 | |
Sr. Unsec’d. Notes | | | 5.875 | | | | 09/18/23 | | | | 70 | | | | 77,178 | |
EOG Resources, Inc., | | | | | | | | | | | | | | | | |
Sr. Unsec’d. Notes | | | 3.900 | | | | 04/01/35 | | | | 25 | | | | 29,980 | |
Equinor ASA (Norway), | | | | | | | | | | | | | | | | |
Gtd. Notes | | | 3.700 | | | | 04/06/50 | | | | 20 | | | | 24,804 | |
Exxon Mobil Corp., | | | | | | | | | | | | | | | | |
Sr. Unsec’d. Notes | | | 4.114 | | | | 03/01/46 | | | | 20 | | | | 25,575 | |
Noble Energy, Inc., | | | | | | | | | | | | | | | | |
Sr. Unsec’d. Notes | | | 6.000 | | | | 03/01/41 | | | | 20 | | | | 28,711 | |
See Notes to Financial Statements.
PGIM Core Conservative Bond Fund
Schedule of Investments (continued)
as of July 31, 2020
| | | | | | | | | | | | | | | | |
| | | | |
| Description | | Interest Rate | | | Maturity Date | | | Principal Amount (000)# | | | Value | |
| | | | |
CORPORATE BONDS (Continued) | | | | | | | | | | | | | | | | |
| | | | |
Oil & Gas (cont’d.) | | | | | | | | | | | | | | | | |
Ovintiv, Inc., | | | | | | | | | | | | | | | | |
Gtd. Notes | | | 6.500% | | | | 08/15/34 | | | | 20 | | | $ | 18,603 | |
Petroleos Mexicanos (Mexico), | | | | | | | | | | | | | | | | |
Gtd. Notes | | | 6.500 | | | | 03/13/27 | | | | 45 | | | | 42,934 | |
Total Capital International SA (France), | | | | | | | | | | | | | | | | |
Gtd. Notes | | | 2.829 | | | | 01/10/30 | | | | 25 | | | | 28,102 | |
Valero Energy Corp., | | | | | | | | | | | | | | | | |
Sr. Unsec’d. Notes | | | 4.000 | | | | 04/01/29 | | | | 20 | | | | 22,807 | |
| | | | | | | | | | | | | | | | |
| | | | |
| | | | | | | | | | | | | | | 603,481 | |
| | | | |
Oil & Gas Services 0.1% | | | | | | | | | | | | | | | | |
Halliburton Co., | | | | | | | | | | | | | | | | |
Sr. Unsec’d. Notes | | | 4.750 | | | | 08/01/43 | | | | 25 | | | | 26,130 | |
| | | | |
Pharmaceuticals 2.4% | | | | | | | | | | | | | | | | |
AbbVie, Inc., | | | | | | | | | | | | | | | | |
Sr. Unsec’d. Notes | | | 4.700 | | | | 05/14/45 | | | | 45 | | | | 59,079 | |
Sr. Unsec’d. Notes, 144A | | | 3.850 | | | | 06/15/24 | | | | 5 | | | | 5,533 | |
Sr. Unsec’d. Notes, 144A | | | 4.250 | | | | 11/21/49 | | | | 135 | | | | 172,642 | |
Sr. Unsec’d. Notes, 144A | | | 4.550 | | | | 03/15/35 | | | | 40 | | | | 50,961 | |
Becton, Dickinson & Co., | | | | | | | | | | | | | | | | |
Sr. Unsec’d. Notes | | | 3.734 | | | | 12/15/24 | | | | 32 | | | | 35,595 | |
Bristol-Myers Squibb Co., | | | | | | | | | | | | | | | | |
Sr. Unsec’d. Notes | | | 4.250 | | | | 10/26/49 | | | | 70 | | | | 99,780 | |
Cigna Corp., | | | | | | | | | | | | | | | | |
Gtd. Notes | | | 4.500 | | | | 02/25/26 | | | | 120 | | | | 141,547 | |
Gtd. Notes | | | 4.900 | | | | 12/15/48 | | | | 15 | | | | 21,107 | |
Sr. Unsec’d. Notes | | | 3.400 | | | | 03/15/50 | | | | 15 | | | | 17,226 | |
CVS Health Corp., | | | | | | | | | | | | | | | | |
Sr. Unsec’d. Notes | | | 4.300 | | | | 03/25/28 | | | | 55 | | | | 65,169 | |
Sr. Unsec’d. Notes | | | 4.780 | | | | 03/25/38 | | | | 35 | | | | 44,967 | |
Sr. Unsec’d. Notes | | | 5.050 | | | | 03/25/48 | | | | 35 | | | | 48,189 | |
Sr. Unsec’d. Notes | | | 5.125 | | | | 07/20/45 | | | | 40 | | | | 54,357 | |
GlaxoSmithKline Capital PLC (United Kingdom), | | | | | | | | | | | | | | | | |
Gtd. Notes | | | 2.850 | | | | 05/08/22 | | | | 45 | | | | 46,958 | |
Johnson & Johnson, | | | | | | | | | | | | | | | | |
Sr. Unsec’d. Notes | | | 3.625 | | | | 03/03/37 | | | | 45 | | | | 56,993 | |
Merck & Co., Inc., | | | | | | | | | | | | | | | | |
Sr. Unsec’d. Notes | | | 2.400 | | | | 09/15/22 | | | | 100 | | | | 104,002 | |
See Notes to Financial Statements.
| | | | |
| PGIM Day One Underlying Funds | | | 61 | |
PGIM Core Conservative Bond Fund
Schedule of Investments (continued)
as of July 31, 2020
| | | | | | | | | | | | | | | | |
| | | | |
| Description | | Interest Rate | | | Maturity Date | | | Principal Amount (000)# | | | Value | |
| | | | |
CORPORATE BONDS (Continued) | | | | | | | | | | | | | | | | |
| | | | |
Pharmaceuticals (cont’d.) | | | | | | | | | | | | | | | | |
Merck & Co., Inc., (cont’d.) | | | | | | | | | | | | | | | | |
Sr. Unsec’d. Notes | | | 3.400% | | | | 03/07/29 | | | | 15 | | | $ | 17,718 | |
Mylan, Inc., | | | | | | | | | | | | | | | | |
Gtd. Notes | | | 5.200 | | | | 04/15/48 | | | | 70 | | | | 92,074 | |
Novartis Capital Corp. (Switzerland), | | | | | | | | | | | | | | | | |
Gtd. Notes | | | 4.000 | | | | 11/20/45 | | | | 45 | | | | 60,760 | |
Pfizer, Inc., | | | | | | | | | | | | | | | | |
Sr. Unsec’d. Notes | | | 2.550 | | | | 05/28/40 | | | | 35 | | | | 38,824 | |
Shire Acquisitions Investments Ireland DAC, | | | | | | | | | | | | | | | | |
Gtd. Notes | | | 3.200 | | | | 09/23/26 | | | | 45 | | | | 50,566 | |
Upjohn, Inc., | | | | | | | | | | | | | | | | |
Gtd. Notes, 144A | | | 3.850 | | | | 06/22/40 | | | | 10 | | | | 11,431 | |
Gtd. Notes, 144A | | | 4.000 | | | | 06/22/50 | | | | 15 | | | | 17,215 | |
Wyeth LLC, | | | | | | | | | | | | | | | | |
Gtd. Notes | | | 6.450 | | | | 02/01/24 | | | | 50 | | | | 60,196 | |
| | | | | | | | | | | | | | | | |
| | | | |
| | | | | | | | | | | | | | | 1,372,889 | |
| | | | |
Pipelines 1.3% | | | | | | | | | | | | | | | | |
Energy Transfer Operating LP, | | | | | | | | | | | | | | | | |
Gtd. Notes | | | 4.750 | | | | 01/15/26 | | | | 50 | | | | 54,173 | |
Gtd. Notes | | | 4.900 | | | | 03/15/35 | | | | 30 | | | | 30,324 | |
Gtd. Notes | | | 5.300 | | | | 04/15/47 | | | | 15 | | | | 14,762 | |
Gtd. Notes | | | 6.250 | | | | 04/15/49 | | | | 5 | | | | 5,386 | |
Gtd. Notes | | | 6.625 | | | | 10/15/36 | | | | 10 | | | | 10,745 | |
Enterprise Products Operating LLC, | | | | | | | | | | | | | | | | |
Gtd. Notes | | | 3.200 | | | | 02/15/52 | | | | 20 | | | | 19,883 | |
Gtd. Notes | | | 4.850 | | | | 03/15/44 | | | | 95 | | | | 114,903 | |
Kinder Morgan, Inc., | | | | | | | | | | | | | | | | |
Gtd. Notes | | | 3.250 | | | | 08/01/50 | | | | 5 | | | | 4,918 | |
Magellan Midstream Partners LP, | | | | | | | | | | | | | | | | |
Sr. Unsec’d. Notes | | | 3.950 | | | | 03/01/50 | | | | 40 | | | | 44,247 | |
Sr. Unsec’d. Notes | | | 4.200 | | | | 10/03/47 | | | | 10 | | | | 11,214 | |
MPLX LP, | | | | | | | | | | | | | | | | |
Sr. Unsec’d. Notes | | | 4.125 | | | | 03/01/27 | | | | 10 | | | | 10,919 | |
Sr. Unsec’d. Notes | | | 4.500 | | | | 07/15/23 | | | | 20 | | | | 21,609 | |
Sr. Unsec’d. Notes | | | 4.500 | | | | 04/15/38 | | | | 20 | | | | 21,302 | |
Sr. Unsec’d. Notes | | | 4.700 | | | | 04/15/48 | | | | 55 | | | | 59,489 | |
Sr. Unsec’d. Notes | | | 4.800 | | | | 02/15/29 | | | | 40 | | | | 45,946 | |
See Notes to Financial Statements.
PGIM Core Conservative Bond Fund
Schedule of Investments (continued)
as of July 31, 2020
| | | | | | | | | | | | | | | | |
| | | | |
| Description | | Interest Rate | | | Maturity Date | | | Principal Amount (000)# | | | Value | |
| | | | |
CORPORATE BONDS (Continued) | | | | | | | | | | | | | | | | |
| | | | |
Pipelines (cont’d.) | | | | | | | | | | | | | | | | |
ONEOK Partners LP, | | | | | | | | | | | | | | | | |
Gtd. Notes | | | 3.375% | | | | 10/01/22 | | | | 35 | | | $ | 36,300 | |
ONEOK, Inc., | | | | | | | | | | | | | | | | |
Gtd. Notes | | | 3.100 | | | | 03/15/30 | | | | 90 | | | | 84,925 | |
Gtd. Notes | | | 4.450 | | | | 09/01/49 | | | | 25 | | | | 22,579 | |
Gtd. Notes | | | 4.950 | | | | 07/13/47 | | | | 10 | | | | 9,742 | |
Phillips 66 Partners LP, | | | | | | | | | | | | | | | | |
Sr. Unsec’d. Notes | | | 3.750 | | | | 03/01/28 | | | | 10 | | | | 10,584 | |
Sr. Unsec’d. Notes | | | 4.900 | | | | 10/01/46 | | | | 25 | | | | 28,214 | |
Plains All American Pipeline LP/PAA Finance Corp., | | | | | | | | | | | | | | | | |
Sr. Unsec’d. Notes | | | 3.550 | | | | 12/15/29 | | | | 25 | | | | 24,630 | |
Sr. Unsec’d. Notes | | | 3.800 | | | | 09/15/30 | | | | 5 | | | | 5,002 | |
Transcontinental Gas Pipe Line Co. LLC, | | | | | | | | | | | | | | | | |
Sr. Unsec’d. Notes, 144A | | | 3.250 | | | | 05/15/30 | | | | 35 | | | | 38,261 | |
Williams Cos., Inc. (The), | | | | | | | | | | | | | | | | |
Sr. Unsec’d. Notes | | | 3.750 | | | | 06/15/27 | | | | 30 | | | | 32,872 | |
Sr. Unsec’d. Notes | | | 4.850 | | | | 03/01/48 | | | | 5 | | | | 5,945 | |
| | | | | | | | | | | | | | | | |
| | | | |
| | | | | | | | | | | | | | | 768,874 | |
| | | | |
Real Estate Investment Trusts (REITs) 0.3% | | | | | | | | | | | | | | | | |
Boston Properties LP, | | | | | | | | | | | | | | | | |
Sr. Unsec’d. Notes | | | 3.850 | | | | 02/01/23 | | | | 20 | | | | 21,438 | |
Healthpeak Properties, Inc., | | | | | | | | | | | | | | | | |
Sr. Unsec’d. Notes | | | 3.000 | | | | 01/15/30 | | | | 20 | | | | 21,624 | |
Realty Income Corp., | | | | | | | | | | | | | | | | |
Sr. Unsec’d. Notes | | | 3.000 | | | | 01/15/27 | | | | 10 | | | | 10,935 | |
Simon Property Group LP, | | | | | | | | | | | | | | | | |
Sr. Unsec’d. Notes | | | 2.450 | | | | 09/13/29 | | | | 20 | | | | 20,299 | |
Sr. Unsec’d. Notes | | | 3.375 | | | | 10/01/24 | | | | 70 | | | | 76,002 | |
Sr. Unsec’d. Notes | | | 3.500 | | | | 09/01/25 | | | | 5 | | | | 5,509 | |
Sr. Unsec’d. Notes | | | 3.750 | | | | 02/01/24 | | | | 10 | | | | 10,832 | |
Ventas Realty LP, | | | | | | | | | | | | | | | | |
Gtd. Notes | | | 3.850 | | | | 04/01/27 | | | | 15 | | | | 16,058 | |
Welltower, Inc., | | | | | | | | | | | | | | | | |
Sr. Unsec’d. Notes | | | 2.700 | | | | 02/15/27 | | | | 10 | | | | 10,616 | |
| | | | | | | | | | | | | | | | |
| | | | |
| | | | | | | | | | | | | | | 193,313 | |
See Notes to Financial Statements.
| | | | |
| PGIM Day One Underlying Funds | | | 63 | |
PGIM Core Conservative Bond Fund
Schedule of Investments (continued)
as of July 31, 2020
| | | | | | | | | | | | | | | | |
| | | | |
| Description | | Interest Rate | | | Maturity Date | | | Principal Amount (000)# | | | Value | |
| | | | |
CORPORATE BONDS (Continued) | | | | | | | | | | | | | | | | |
| | | | |
Retail 0.5% | | | | | | | | | | | | | | | | |
AutoZone, Inc., | | | | | | | | | | | | | | | | |
Sr. Unsec’d. Notes | | | 3.750% | | | | 04/18/29 | | | | 30 | | | $ | 34,951 | |
Costco Wholesale Corp., | | | | | | | | | | | | | | | | |
Sr. Unsec’d. Notes | | | 1.600 | | | | 04/20/30 | | | | 15 | | | | 15,542 | |
Dollar Tree, Inc., | | | | | | | | | | | | | | | | |
Sr. Unsec’d. Notes | | | 4.200 | | | | 05/15/28 | | | | 30 | | | | 35,707 | |
Home Depot, Inc. (The), | | | | | | | | | | | | | | | | |
Sr. Unsec’d. Notes | | | 3.750 | | | | 02/15/24 | | | | 125 | | | | 138,698 | |
Lowe’s Cos., Inc., | | | | | | | | | | | | | | | | |
Sr. Unsec’d. Notes | | | 3.100 | | | | 05/03/27 | | | | 20 | | | | 22,590 | |
McDonald’s Corp., | | | | | | | | | | | | | | | | |
Sr. Unsec’d. Notes, MTN | | | 3.700 | | | | 01/30/26 | | | | 10 | | | | 11,454 | |
Sr. Unsec’d. Notes, MTN | | | 4.700 | | | | 12/09/35 | | | | 25 | | | | 32,757 | |
| | | | | | | | | | | | | | | | |
| | | | |
| | | | | | | | | | | | | | | 291,699 | |
| | | | |
Semiconductors 0.0% | | | | | | | | | | | | | | | | |
Broadcom Corp./Broadcom Cayman Finance Ltd., | | | | | | | | | | | | | | | | |
Gtd. Notes | | | 3.125 | | | | 01/15/25 | | | | 20 | | | | 21,456 | |
| | | | |
Software 1.1% | | | | | | | | | | | | | | | | |
Fidelity National Information Services, Inc., | | | | | | | | | | | | | | | | |
Gtd. Notes | | | 3.875 | | | | 06/05/24 | | | | 10 | | | | 11,106 | |
Fiserv, Inc., | | | | | | | | | | | | | | | | |
Sr. Unsec’d. Notes | | | 2.750 | | | | 07/01/24 | | | | 5 | | | | 5,397 | |
Sr. Unsec’d. Notes | | | 3.850 | | | | 06/01/25 | | | | 30 | | | | 34,282 | |
Intuit, Inc., | | | | | | | | | | | | | | | | |
Sr. Unsec’d. Notes | | | 1.350 | | | | 07/15/27 | | | | 25 | | | | 25,605 | |
Microsoft Corp., | | | | | | | | | | | | | | | | |
Sr. Unsec’d. Notes | | | 2.400 | | | | 08/08/26 | | | | 80 | | | | 88,029 | |
Sr. Unsec’d. Notes | | | 2.525 | | | | 06/01/50 | | | | 23 | | | | 25,447 | |
Sr. Unsec’d. Notes | | | 2.875 | | | | 02/06/24 | | | | 85 | | | | 91,985 | |
Sr. Unsec’d. Notes | | | 3.700 | | | | 08/08/46 | | | | 60 | | | | 78,173 | |
Sr. Unsec’d. Notes | | | 4.100 | | | | 02/06/37 | | | | 7 | | | | 9,370 | |
Oracle Corp., | | | | | | | | | | | | | | | | |
Sr. Unsec’d. Notes | | | 2.650 | | | | 07/15/26 | | | | 130 | | | | 143,275 | |
Sr. Unsec’d. Notes | | | 2.950 | | | | 05/15/25 | | | | 85 | | | | 93,738 | |
| | | | | | | | | | | | | | | | |
| | | | |
| | | | | | | | | | | | | | | 606,407 | |
See Notes to Financial Statements.
PGIM Core Conservative Bond Fund
Schedule of Investments (continued)
as of July 31, 2020
| | | | | | | | | | | | | | | | |
| | | | |
| Description | | Interest Rate | | | Maturity Date | | | Principal Amount (000)# | | | Value | |
| | | | |
CORPORATE BONDS (Continued) | | | | | | | | | | | | | | | | |
| | | | |
Telecommunications 1.3% | | | | | | | | | | | | | | | | |
AT&T, Inc., | | | | | | | | | | | | | | | | |
Sr. Unsec’d. Notes | | | 3.500% | | | | 06/01/41 | | | | 85 | | | $ | 92,695 | |
Sr. Unsec’d. Notes | | | 3.800 | | | | 02/15/27 | | | | 15 | | | | 17,147 | |
Sr. Unsec’d. Notes | | | 4.100 | | | | 02/15/28 | | | | 45 | | | | 52,754 | |
Sr. Unsec’d. Notes | | | 4.500 | | | | 03/09/48 | | | | 95 | | | | 116,082 | |
Sr. Unsec’d. Notes | | | 4.750 | | | | 05/15/46 | | | | 100 | | | | 123,945 | |
British Telecommunications PLC (United Kingdom), | | | | | | | | | | | | | | | | |
Sr. Unsec’d. Notes | | | 9.625 | | | | 12/15/30 | | | | 25 | | | | 41,467 | |
Cisco Systems, Inc., | | | | | | | | | | | | | | | | |
Sr. Unsec’d. Notes | | | 2.900 | | | | 03/04/21 | | | | 60 | | | | 60,919 | |
Verizon Communications, Inc., | | | | | | | | | | | | | | | | |
Sr. Unsec’d. Notes | | | 4.016 | | | | 12/03/29 | | | | 50 | | | | 61,145 | |
Sr. Unsec’d. Notes | | | 4.500 | | | | 08/10/33 | | | | 10 | | | | 13,087 | |
Sr. Unsec’d. Notes | | | 4.522 | | | | 09/15/48 | | | | 123 | | | | 170,635 | |
Sr. Unsec’d. Notes | | | 4.862 | | | | 08/21/46 | | | | 5 | | | | 7,149 | |
| | | | | | | | | | | | | | | | |
| | | | |
| | | | | | | | | | | | | | | 757,025 | |
| | | | |
Transportation 0.4% | | | | | | | | | | | | | | | | |
Burlington Northern Santa Fe LLC, | | | | | | | | | | | | | | | | |
Sr. Unsec’d. Notes | | | 3.750 | | | | 04/01/24 | | | | 75 | | | | 83,037 | |
CSX Corp., | | | | | | | | | | | | | | | | |
Sr. Unsec’d. Notes | | | 3.800 | | | | 03/01/28 | | | | 40 | | | | 47,397 | |
Sr. Unsec’d. Notes | | | 3.800 | | | | 04/15/50 | | | | 15 | | | | 18,972 | |
Union Pacific Corp., | | | | | | | | | | | | | | | | |
Sr. Unsec’d. Notes | | | 3.000 | | | | 04/15/27 | | | | 20 | | | | 22,533 | |
Sr. Unsec’d. Notes | | | 3.250 | | | | 02/05/50 | | | | 40 | | | | 47,236 | |
Sr. Unsec’d. Notes | | | 3.600 | | | | 09/15/37 | | | | 10 | | | | 11,789 | |
Sr. Unsec’d. Notes | | | 3.750 | | | | 02/05/70 | | | | 5 | | | | 6,098 | |
| | | | | | | | | | | | | | | | |
| | | | |
| | | | | | | | | | | | | | | 237,062 | |
| | | | |
Water 0.0% | | | | | | | | | | | | | | | | |
American Water Capital Corp., | | | | | | | | | | | | | | | | |
Sr. Unsec’d. Notes | | | 3.450 | | | | 05/01/50 | | | | 5 | | | | 6,195 | |
| | | | | | | | | | | | | | | | |
| | | | |
TOTAL CORPORATE BONDS | | | | | | | | | | | | | | | | |
(cost $14,496,077) | | | | | | | | | | | | | | | 16,102,025 | |
| | | | | | | | | | | | | | | | |
See Notes to Financial Statements.
| | | | |
| PGIM Day One Underlying Funds | | | 65 | |
PGIM Core Conservative Bond Fund
Schedule of Investments (continued)
as of July 31, 2020
| | | | | | | | | | | | | | | | |
| | | | |
Description | | Interest Rate | | | Maturity Date | | | Principal Amount (000)# | | | Value | |
| | | | |
MUNICIPAL BONDS 1.3% | | | | | | | | | | | | | | | | |
| | | | |
Arizona 0.0% | | | | | | | | | | | | | | | | |
Salt River Project Agricultural Improvement & Power District, | | | | | | | | | | | | | | | | |
Revenue Bonds, BABs | | | 4.839% | | | | 01/01/41 | | | | 20 | | | $ | 28,559 | |
| | | | |
California 0.6% | | | | | | | | | | | | | | | | |
Bay Area Toll Authority, | | | | | | | | | | | | | | | | |
Revenue Bonds, BABs, Series F2 | | | 6.263 | | | | 04/01/49 | | | | 85 | | | | 153,126 | |
Taxable, Revenue Bonds | | | 2.574 | | | | 04/01/31 | | | | 40 | | | | 43,390 | |
Los Angeles Department of Water & Power, Power System Revenue, | | | | | | | | | | | | | | | | |
Revenue Bonds, BABs | | | 5.716 | | | | 07/01/39 | | | | 20 | | | | 31,035 | |
State of California, | | | | | | | | | | | | | | | | |
General Obligation Unlimited, Taxable, BABs | | | 7.550 | | | | 04/01/39 | | | | 65 | | | | 117,745 | |
| | | | | | | | | | | | | | | | |
| | | | | | | | | | | | | | | 345,296 | |
| | | | |
Illinois 0.1% | | | | | | | | | | | | | | | | |
Chicago O’Hare International Airport, | | | | | | | | | | | | | | | | |
Taxable, Revenue Bonds, Series C | | | 4.472 | | | | 01/01/49 | | | | 20 | | | | 26,406 | |
State of Illinois, | | | | | | | | | | | | | | | | |
General Obligation Unlimited, Taxable, Pension | | | 5.100 | | | | 06/01/33 | | | | 55 | | | | 57,745 | |
| | | | | | | | | | | | | | | | |
| | | | | | | | | | | | | | | 84,151 | |
| | | | |
Maryland 0.1% | | | | | | | | | | | | | | | | |
Maryland State Transportation Authority, | | | | | | | | | | | | | | | | |
Revenue Bonds, BABs | | | 5.888 | | | | 07/01/43 | | | | 40 | | | | 59,566 | |
| | | | |
Michigan 0.1% | | | | | | | | | | | | | | | | |
Michigan Finance Authority, | | | | | | | | | | | | | | | | |
Taxable, Revenue Bonds | | | 3.384 | | | | 12/01/40 | | | | 15 | | | | 17,005 | |
University of Michigan, | | | | | | | | | | | | | | | | |
Revenue Bonds, Series B | | | 2.437 | | | | 04/01/40 | | | | 25 | | | | 26,787 | |
| | | | | | | | | | | | | | | | |
| | | | | | | | | | | | | | | 43,792 | |
| | | | |
New Jersey 0.2% | | | | | | | | | | | | | | | | |
New Jersey Turnpike Authority, | | | | | | | | | | | | | | | | |
Taxable, Revenue Bonds, BABs, Series F | | | 7.414 | | | | 01/01/40 | | | | 55 | | | | 96,926 | |
See Notes to Financial Statements.
PGIM Core Conservative Bond Fund
Schedule of Investments (continued)
as of July 31, 2020
| | | | | | | | | | | | |
| | | | |
| Description | | Interest Rate | | Maturity Date | | Principal Amount (000)# | | | Value | |
| | | | |
MUNICIPAL BONDS (Continued) | | | | | | | | | | | | |
| | | | |
New York 0.1% | | | | | | | | | | | | |
New York City Water & Sewer System, | | | | | | | | | | | | |
Taxable, Revenue Bonds, BABs | | 5.882% | | 06/15/44 | | | 20 | | | $ | 33,299 | |
| | | | |
Ohio 0.1% | | | | | | | | | | | | |
JobsOhio Beverage System, | | | | | | | | | | | | |
Taxable, Revenue Bonds, Series A | | 2.833 | | 01/01/38 | | | 5 | | | | 5,463 | |
Ohio State University (The), | | | | | | | | | | | | |
Taxable, Revenue Bonds, Series A | | 4.048 | | 12/01/56 | | | 12 | | | | 17,115 | |
Taxable, Revenue Bonds, Series A | | 4.800 | | 06/01/2111 | | | 25 | | | | 40,245 | |
Taxable, Revenue Bonds, BABs, Series C | | 4.910 | | 06/01/40 | | | 10 | | | | 14,544 | |
| | | | | | | | | | | | |
| | | | | | | | | | | 77,367 | |
| | | | |
Texas 0.0% | | | | | | | | | | | | |
Texas Private Activity Bond Surface Transportation Corp., | | | | | | | | | | | | |
Taxable, Revenue Bonds, Series B | | 3.922 | | 12/31/49 | | | 15 | | | | 16,546 | |
| | | | | | | | | | | | |
| | | | |
TOTAL MUNICIPAL BONDS | | | | | | | | | | | | |
(cost $652,160) | | | | | | | | | | | 785,502 | |
| | | | | | | | | | | | |
| | | | |
SOVEREIGN BONDS 1.4% | | | | | | | | | | | | |
Hungary Government International Bond (Hungary), | | | | | | | | | | | | |
Sr. Unsec’d. Notes | | 7.625 | | 03/29/41 | | | 16 | | | | 28,069 | |
Indonesia Government International Bond (Indonesia), | | | | | | | | | | | | |
Sr. Unsec’d. Notes | | 3.500 | | 01/11/28 | | | 200 | | | | 219,848 | |
Mexico Government International Bond (Mexico), | | | | | | | | | | | | |
Sr. Unsec’d. Notes, MTN | | 4.750 | | 03/08/44 | | | 66 | | | | 75,143 | |
Panama Government International Bond (Panama), | | | | | | | | | | | | |
Sr. Unsec’d. Notes | | 3.160 | | 01/23/30 | | | 200 | | | | 223,832 | |
Philippine Government International Bond (Philippines), | | | | | | | | | | | | |
Sr. Unsec’d. Notes | | 7.750 | | 01/14/31 | | | 100 | | | | 155,728 | |
Province of Quebec (Canada), | | | | | | | | | | | | |
Debentures, Series NN | | 7.125 | | 02/09/24 | | | 40 | | | | 49,020 | |
Uruguay Government International Bond (Uruguay), | | | | | | | | | | | | |
Sr. Unsec’d. Notes | | 4.975 | | 04/20/55 | | | 10 | | | | 13,899 | |
Sr. Unsec’d. Notes | | 5.100 | | 06/18/50 | | | 30 | | | | 41,962 | |
| | | | | | | | | | | | |
| | | | |
TOTAL SOVEREIGN BONDS | | | | | | | | | | | | |
(cost $748,881) | | | | | | | | | | | 807,501 | |
| | | | | | | | | | | | |
See Notes to Financial Statements.
| | | | |
| PGIM Day One Underlying Funds | | | 67 | |
PGIM Core Conservative Bond Fund
Schedule of Investments (continued)
as of July 31, 2020
| | | | | | | | | | | | |
| | | | |
| Description | | Interest Rate | | Maturity Date | | Principal Amount (000)# | | | Value | |
| | |
U.S. GOVERNMENT AGENCY OBLIGATIONS 25.6% | | | | | | | | |
Federal Home Loan Bank | | 3.250% | | 11/16/28 | | | 70 | | | $ | 83,980 | |
Federal Home Loan Mortgage Corp. | | 0.375 | | 05/05/23 | | | 105 | | | | 105,434 | |
Federal Home Loan Mortgage Corp. | | 2.000 | | 01/01/32 | | | 60 | | | | 62,742 | |
Federal Home Loan Mortgage Corp. | | 2.500 | | 07/01/31 | | | 144 | | | | 153,152 | |
Federal Home Loan Mortgage Corp. | | 3.000 | | 02/01/32 | | | 43 | | | | 45,953 | |
Federal Home Loan Mortgage Corp. | | 3.000 | | 02/01/32 | | | 43 | | | | 46,454 | |
Federal Home Loan Mortgage Corp. | | 3.000 | | 01/01/37 | | | 20 | | | | 21,136 | |
Federal Home Loan Mortgage Corp. | | 3.000 | | 12/01/37 | | | 33 | | | | 34,723 | |
Federal Home Loan Mortgage Corp. | | 3.000 | | 12/01/42 | | | 153 | | | | 164,151 | |
Federal Home Loan Mortgage Corp. | | 3.000 | | 11/01/46 | | | 63 | | | | 67,241 | |
Federal Home Loan Mortgage Corp. | | 3.000 | | 01/01/47 | | | 163 | | | | 172,761 | |
Federal Home Loan Mortgage Corp. | | 3.000 | | 03/01/47 | | | 245 | | | | 259,721 | |
Federal Home Loan Mortgage Corp. | | 3.500 | | 11/01/37 | | | 35 | | | | 36,832 | |
Federal Home Loan Mortgage Corp. | | 3.500 | | 06/01/42 | | | 52 | | | | 55,846 | |
Federal Home Loan Mortgage Corp. | | 3.500 | | 04/01/46 | | | 81 | | | | 87,073 | |
Federal Home Loan Mortgage Corp. | | 3.500 | | 11/01/47 | | | 105 | | | | 111,390 | |
Federal Home Loan Mortgage Corp. | | 3.500 | | 11/01/47 | | | 157 | | | | 166,486 | |
Federal Home Loan Mortgage Corp. | | 4.000 | | 10/01/45 | | | 67 | | | | 72,456 | |
Federal Home Loan Mortgage Corp. | | 4.000 | | 05/01/46 | | | 138 | | | | 149,505 | |
Federal Home Loan Mortgage Corp. | | 4.000 | | 03/01/47 | | | 109 | | | | 116,543 | |
Federal Home Loan Mortgage Corp. | | 4.000 | | 01/01/48 | | | 178 | | | | 190,166 | |
Federal Home Loan Mortgage Corp. | | 4.500 | | 07/01/47 | | | 145 | | | | 156,254 | |
Federal Home Loan Mortgage Corp. | | 4.500 | | 12/01/48 | | | 49 | | | | 53,108 | |
Federal Home Loan Mortgage Corp. | | 6.250 | | 07/15/32 | | | 30 | | | | 47,449 | |
Federal National Mortgage Assoc. | | 0.500 | | 06/17/25 | | | 50 | | | | 50,239 | |
Federal National Mortgage Assoc. | | 0.625 | | 04/22/25 | | | 45 | | | | 45,476 | |
Federal National Mortgage Assoc. | | 1.625 | | 10/15/24 | | | 45 | | | | 47,421 | |
Federal National Mortgage Assoc. | | 2.000 | | TBA | | | 500 | | | | 517,051 | |
Federal National Mortgage Assoc. | | 2.000 | | 10/01/34 | | | 173 | | | | 179,952 | |
Federal National Mortgage Assoc. | | 2.500 | | TBA | | | 750 | | | | 786,679 | |
Federal National Mortgage Assoc. | | 2.500 | | 02/05/24 | | | 95 | | | | 102,383 | |
Federal National Mortgage Assoc. | | 2.500 | | 01/01/32 | | | 133 | | | | 142,128 | |
Federal National Mortgage Assoc. | | 2.500 | | 09/01/46 | | | 68 | | | | 71,856 | |
Federal National Mortgage Assoc. | | 2.500 | | 11/01/49 | | | 288 | | | | 302,041 | |
Federal National Mortgage Assoc. | | 3.000 | | TBA | | | 1,000 | | | | 1,055,588 | |
Federal National Mortgage Assoc. | | 3.000 | | 11/01/28 | | | 77 | | | | 81,401 | |
Federal National Mortgage Assoc. | | 3.000 | | 01/01/30 | | | 167 | | | | 175,477 | |
Federal National Mortgage Assoc. | | 3.000 | | 12/01/36 | | | 64 | | | | 67,574 | |
Federal National Mortgage Assoc. | | 3.000 | | 10/01/42 | | | 25 | | | | 27,594 | |
Federal National Mortgage Assoc. | | 3.000 | | 02/01/43 | | | 335 | | | | 360,834 | |
Federal National Mortgage Assoc. | | 3.000 | | 04/01/43 | | | 102 | | | | 110,037 | |
Federal National Mortgage Assoc. | | 3.000 | | 01/01/47 | | | 372 | | | | 394,639 | |
See Notes to Financial Statements.
PGIM Core Conservative Bond Fund
Schedule of Investments (continued)
as of July 31, 2020
| | | | | | | | | | | | |
| | | | |
| Description | | Interest Rate | | Maturity Date | | Principal Amount (000)# | | | Value | |
| | |
U.S. GOVERNMENT AGENCY OBLIGATIONS (Continued) | | | | | | | | |
Federal National Mortgage Assoc. | | 3.500% | | 08/01/31 | | | 54 | | | $ | 57,453 | |
Federal National Mortgage Assoc. | | 3.500 | | 10/01/32 | | | 34 | | | | 36,034 | |
Federal National Mortgage Assoc. | | 3.500 | | 06/01/33 | | | 58 | | | | 60,399 | |
Federal National Mortgage Assoc. | | 3.500 | | 01/01/42 | | | 159 | | | | 171,717 | |
Federal National Mortgage Assoc. | | 3.500 | | 03/01/42 | | | 139 | | | | 150,242 | |
Federal National Mortgage Assoc. | | 3.500 | | 11/01/42 | | | 92 | | | | 99,639 | |
Federal National Mortgage Assoc. | | 3.500 | | 08/01/43 | | | 117 | | | | 126,993 | |
Federal National Mortgage Assoc. | | 3.500 | | 03/01/45 | | | 244 | | | | 259,803 | |
Federal National Mortgage Assoc. | | 3.500 | | 01/01/46 | | | 55 | | | | 59,182 | |
Federal National Mortgage Assoc. | | 3.500 | | 12/01/46 | | | 427 | | | | 455,322 | |
Federal National Mortgage Assoc. | | 3.500 | | 01/01/47 | | | 116 | | | | 122,931 | |
Federal National Mortgage Assoc. | | 3.500 | | 09/01/47 | | | 179 | | | | 194,117 | |
Federal National Mortgage Assoc. | | 4.000 | | 01/01/41 | | | 233 | | | | 255,709 | |
Federal National Mortgage Assoc. | | 4.000 | | 04/01/41 | | | 134 | | | | 147,832 | |
Federal National Mortgage Assoc. | | 4.000 | | 02/01/47 | | | 279 | | | | 297,616 | |
Federal National Mortgage Assoc. | | 4.000 | | 04/01/48 | | | 414 | | | | 440,261 | |
Federal National Mortgage Assoc. | | 4.500 | | 03/01/41 | | | 132 | | | | 146,502 | |
Federal National Mortgage Assoc. | | 4.500 | | 02/01/44 | | | 124 | | | | 138,301 | |
Federal National Mortgage Assoc. | | 4.500 | | 01/01/45 | | | 128 | | | | 142,478 | |
Federal National Mortgage Assoc. | | 4.500 | | 08/01/48 | | | 51 | | | | 55,181 | |
Federal National Mortgage Assoc. | | 4.500 | | 02/01/49 | | | 46 | | | | 49,512 | |
Federal National Mortgage Assoc. | | 5.000 | | 11/01/35 | | | 145 | | | | 166,573 | |
Federal National Mortgage Assoc. | | 5.000 | | 06/01/40 | | | 37 | | | | 42,166 | |
Federal National Mortgage Assoc. | | 5.000 | | 03/01/42 | | | 69 | | | | 78,598 | |
Federal National Mortgage Assoc. | | 6.625 | | 11/15/30 | | | 15 | | | | 23,322 | |
Government National Mortgage Assoc. | | 2.500 | | TBA | | | 500 | | | | 526,915 | |
Government National Mortgage Assoc. | | 2.500 | | 03/20/43 | | | 14 | | | | 14,849 | |
Government National Mortgage Assoc. | | 2.500 | | 12/20/46 | | | 32 | | | | 34,486 | |
Government National Mortgage Assoc. | | 3.000 | | 01/20/43 | | | 138 | | | | 147,365 | |
Government National Mortgage Assoc. | | 3.000 | | 04/20/45 | | | 75 | | | | 80,184 | |
Government National Mortgage Assoc. | | 3.000 | | 07/20/46 | | | 139 | | | | 147,762 | |
Government National Mortgage Assoc. | | 3.000 | | 09/20/46 | | | 141 | | | | 149,274 | |
Government National Mortgage Assoc. | | 3.000 | | 11/20/46 | | | 98 | | | | 103,692 | |
Government National Mortgage Assoc. | | 3.000 | | 03/20/49 | | | 198 | | | | 209,222 | |
Government National Mortgage Assoc. | | 3.500 | | 12/20/42 | | | 272 | | | | 294,760 | |
Government National Mortgage Assoc. | | 3.500 | | 01/20/44 | | | 86 | | | | 91,891 | |
Government National Mortgage Assoc. | | 3.500 | | 04/20/45 | | | 54 | | | | 57,185 | |
Government National Mortgage Assoc. | | 3.500 | | 07/20/46 | | | 248 | | | | 264,552 | |
Government National Mortgage Assoc. | | 3.500 | | 08/20/46 | | | 370 | | | | 395,486 | |
Government National Mortgage Assoc. | | 3.500 | | 09/20/46 | | | 56 | | | | 60,105 | |
Government National Mortgage Assoc. | | 3.500 | | 06/20/47 | | | 160 | | | | 170,364 | |
Government National Mortgage Assoc. | | 3.500 | | 07/20/47 | | | 180 | | | | 191,195 | |
See Notes to Financial Statements.
| | | | |
| PGIM Day One Underlying Funds | | | 69 | |
PGIM Core Conservative Bond Fund
Schedule of Investments (continued)
as of July 31, 2020
| | | | | | | | | | | | |
| | | | |
| Description | | Interest Rate | | Maturity Date | | Principal Amount (000)# | | | Value | |
| | |
U.S. GOVERNMENT AGENCY OBLIGATIONS (Continued) | | | | | | | | |
Government National Mortgage Assoc. | | 3.500% | | 11/20/47 | | | 120 | | | $ | 127,769 | |
Government National Mortgage Assoc. | | 4.000 | | 12/20/45 | | | 147 | | | | 158,472 | |
Government National Mortgage Assoc. | | 4.000 | | 10/20/46 | | | 9 | | | | 9,550 | |
Government National Mortgage Assoc. | | 4.000 | | 03/20/47 | | | 90 | | | | 97,197 | |
Government National Mortgage Assoc. | | 4.000 | | 07/20/47 | | | 119 | | | | 128,462 | |
Government National Mortgage Assoc. | | 4.000 | | 09/20/47 | | | 301 | | | | 323,530 | |
Government National Mortgage Assoc. | | 4.500 | | 04/20/41 | | | 26 | | | | 28,310 | |
Government National Mortgage Assoc. | | 4.500 | | 03/20/44 | | | 65 | | | | 71,413 | |
Government National Mortgage Assoc. | | 4.500 | | 12/20/44 | | | 60 | | | | 66,594 | |
Government National Mortgage Assoc. | | 4.500 | | 11/20/46 | | | 37 | | | | 40,647 | |
Government National Mortgage Assoc. | | 4.500 | | 01/20/47 | | | 12 | | | | 12,801 | |
Government National Mortgage Assoc. | | 5.000 | | 04/20/45 | | | 42 | | | | 47,492 | |
Government National Mortgage Assoc. | | 5.500 | | 12/15/33 | | | 17 | | | | 19,306 | |
Tennessee Valley Authority, Sr. Unsec’d. Notes | | 0.750 | | 05/15/25 | | | 25 | | | | 25,373 | |
| | | | | | | | | | | | |
| | | | |
TOTAL U.S. GOVERNMENT AGENCY OBLIGATIONS | | | | | | | | | | | | |
(cost $14,215,794) | | | | | | | | | | | 14,853,012 | |
| | | | | | | | | | | | |
| | | | |
U.S. TREASURY OBLIGATIONS 35.8% | | | | | | | | | | | | |
U.S. Treasury Bonds | | 2.000 | | 02/15/50 | | | 40 | | | | 48,044 | |
U.S. Treasury Bonds | | 2.875 | | 08/15/45 | | | 110 | | | | 151,027 | |
U.S. Treasury Bonds | | 3.000 | | 11/15/44 | | | 90 | | | | 125,466 | |
U.S. Treasury Bonds | | 3.125 | | 02/15/43 | | | 875 | | | | 1,231,699 | |
U.S. Treasury Bonds | | 3.625 | | 08/15/43 | | | 1,265 | | | | 1,916,673 | |
U.S. Treasury Bonds | | 3.750 | | 11/15/43 | | | 560 | | | | 864,500 | |
U.S. Treasury Bonds | | 6.250 | | 08/15/23 | | | 130 | | | | 153,979 | |
U.S. Treasury Notes | | 0.125 | | 06/30/22 | | | 325 | | | | 325,051 | |
U.S. Treasury Notes | | 0.125 | | 07/15/23 | | | 115 | | | | 115,009 | |
U.S. Treasury Notes | | 0.250 | | 06/30/25 | | | 115 | | | | 115,207 | |
U.S. Treasury Notes | | 0.250 | | 07/31/25 | | | 150 | | | | 150,246 | |
U.S. Treasury Notes | | 0.375 | | 04/30/25 | | | 660 | | | | 665,311 | |
U.S. Treasury Notes | | 0.500 | | 03/15/23 | | | 1,959 | | | | 1,978,590 | |
U.S. Treasury Notes | | 0.500 | | 06/30/27 | | | 35 | | | | 35,262 | |
U.S. Treasury Notes | | 0.625 | | 05/15/30 | | | 70 | | | | 70,569 | |
U.S. Treasury Notes | | 1.125 | | 02/28/22 | | | 595 | | | | 604,436 | |
U.S. Treasury Notes | | 1.375 | | 02/15/23 | | | 535 | | | | 552,011 | |
U.S. Treasury Notes | | 1.625 | | 11/15/22 | | | 665 | | | | 687,859 | |
U.S. Treasury Notes | | 1.625 | | 04/30/23 | | | 990 | | | | 1,030,760 | |
U.S. Treasury Notes | | 1.750 | | 09/30/22 | | | 215 | | | | 222,559 | |
U.S. Treasury Notes | | 1.875 | | 04/30/22 | | | 1,625 | | | | 1,674,448 | |
U.S. Treasury Notes | | 2.000 | | 10/31/22 | | | 660 | | | | 687,792 | |
U.S. Treasury Notes | | 2.000 | | 02/15/25 | | | 470 | | | | 508,187 | |
See Notes to Financial Statements.
PGIM Core Conservative Bond Fund
Schedule of Investments (continued)
as of July 31, 2020
| | | | | | | | | | | | | | | | |
| | | | |
| Description | | Interest Rate | | | Maturity Date | | | Principal Amount (000)# | | | Value | |
| | |
U.S. TREASURY OBLIGATIONS (Continued) | | | | | | | | | |
U.S. Treasury Notes | | | 2.000% | | | | 08/15/25 | | | | 825 | | | $ | 898,154 | |
U.S. Treasury Notes | | | 2.125 | | | | 06/30/22 | | | | 630 | | | | 654,019 | |
U.S. Treasury Notes | | | 2.125 | | | | 07/31/24 | | | | 1,880 | | | | 2,026,287 | |
U.S. Treasury Notes | | | 2.875 | | | | 11/15/21 | | | | 1,025 | | | | 1,061,075 | |
U.S. Treasury Notes | | | 2.875 | | | | 05/15/28 | | | | 1,470 | | | | 1,744,247 | |
U.S. Treasury Strips Coupon | | | 1.225(s) | | | | 02/15/41 | | | | 15 | | | | 11,838 | |
U.S. Treasury Strips Coupon | | | 1.371(s) | | | | 05/15/42 | | | | 55 | | | | 42,367 | |
U.S. Treasury Strips Coupon | | | 1.394(s) | | | | 11/15/41 | | | | 20 | | | | 15,589 | |
U.S. Treasury Strips Coupon | | | 1.450(s) | | | | 08/15/42 | | | | 15 | | | | 11,510 | |
U.S. Treasury Strips Coupon | | | 1.463(s) | | | | 11/15/42 | | | | 35 | | | | 26,700 | |
U.S. Treasury Strips Coupon | | | 1.920(s) | | | | 02/15/29 | | | | 60 | | | | 56,977 | |
U.S. Treasury Strips Coupon | | | 2.045(s) | | | | 11/15/36 | | | | 45 | | | | 38,317 | |
U.S. Treasury Strips Coupon | | | 2.222(s) | | | | 05/15/39 | | | | 115 | | | | 93,797 | |
U.S. Treasury Strips Coupon | | | 2.271(s) | | | | 08/15/39 | | | | 185 | | | | 150,088 | |
| | | | | | | | | | | | | | | | |
| | | | |
TOTAL U.S. TREASURY OBLIGATIONS | | | | | | | | | | | | | | | | |
(cost $19,357,343) | | | | | | | | | | | | | | | 20,745,650 | |
| | | | | | | | | | | | | | | | |
| | | | |
TOTAL LONG-TERM INVESTMENTS | | | | | | | | | | | | | | | | |
(cost $52,304,480) | | | | | | | | | | | | | | | 56,419,411 | |
| | | | | | | | | | | | | | | | |
| | | | |
| | | | | | | | | Shares | | | | |
| | | | |
SHORT-TERM INVESTMENT 8.7% | | | | | | | | | | | | | | | | |
| | | | |
AFFILIATED MUTUAL FUND | | | | | | | | | | | | | | | | |
PGIM Core Ultra Short Bond Fund | | | | | | | | | | | | | | | | |
(cost $5,017,604)(w) | | | | | | | | | | | 5,017,604 | | | | 5,017,604 | |
| | | | | | | | | | | | | | | | |
| | | | |
TOTAL INVESTMENTS 106.0% | | | | | | | | | | | | | | | | |
(cost $57,322,084) | | | | | | | | | | | | | | | 61,437,015 | |
Liabilities in excess of other assets (6.0)% | | | | | | | | | | | | | | | (3,474,439 | ) |
| | | | | | | | | | | | | | | | |
| | | | |
NET ASSETS 100.0% | | | | | | | | | | | | | | $ | 57,962,576 | |
| | | | | | | | | | | | | | | | |
See the Glossary for a list of the abbreviation(s) used in the annual report.
| # | Principal amount is shown in U.S. dollars unless otherwise stated. |
| (cc) | Variable rate instrument. The rate shown is based on the latest available information as of July 31, 2020. Certain variable rate securities are not based on a published reference rate and spread but are determined by the issuer or agent and are based on current market conditions. These securities do not indicate a reference rate and spread in their description. |
| (ff) | Variable rate security. Security may be issued at a fixed coupon rate, which converts to a variable rate at a specified date. Rate shown is the rate in effect as of period end. |
See Notes to Financial Statements.
| | | | |
| PGIM Day One Underlying Funds | | | 71 | |
PGIM Core Conservative Bond Fund
Schedule of Investments (continued)
as of July 31, 2020
| (s) | Represents zero coupon bond or principal only security. Rate represents yield to maturity at purchase date. |
| (w) | PGIM Investments LLC, the manager of the Fund, also serves as manager of the PGIM Core Ultra Short Bond Fund. |
Fair Value Measurements:
Various inputs are used in determining the value of the Fund’s investments. These inputs are summarized in the three broad levels listed below.
Level 1—unadjusted quoted prices generally in active markets for identical securities.
Level 2—quoted prices for similar securities, interest rates and yield curves, prepayment speeds, foreign currency exchange rates and other observable inputs.
Level 3—unobservable inputs for securities valued in accordance with Board approved fair valuation procedures.
The following is a summary of the inputs used as of July 31, 2020 in valuing such portfolio securities:
| | | | | | | | | | | | |
| | | Level 1 | | | Level 2 | | | Level 3 | |
Investments in Securities | | | | | | | | | | | | |
Assets | | | | | | | | | | | | |
Asset-Backed Securities | | | | | | | | | | | | |
Credit Cards. | | $ | — | | | $ | 212,244 | | | | $— | |
Commercial Mortgage-Backed Securities | | | — | | | | 2,913,477 | | | | — | |
Corporate Bonds | | | — | | | | 16,102,025 | | | | — | |
Municipal Bonds | | | — | | | | 785,502 | | | | — | |
Sovereign Bonds | | | — | | | | 807,501 | | | | — | |
U.S. Government Agency Obligations | | | — | | | | 14,853,012 | | | | — | |
U.S. Treasury Obligations | | | — | | | | 20,745,650 | | | | — | |
Affiliated Mutual Fund | | | 5,017,604 | | | | — | | | | — | |
| | | | | | | | | | | | |
Total | | $ | 5,017,604 | | | $ | 56,419,411 | | | | $— | |
| | | | | | | | | | | | |
Industry Classification:
The industry classification of investments and liabilities in excess of other assets shown as a percentage of net assets as of July 31, 2020 were as follows (unaudited):
| | | | |
U.S. Treasury Obligations | | | 35.8 | % |
U.S. Government Agency Obligations | | | 25.6 | |
Affiliated Mutual Fund | | | 8.7 | |
Banks | | | 5.9 | |
Commercial Mortgage-Backed Securities | | | 5.0 | |
Electric | | | 2.9 | |
Pharmaceuticals | | | 2.4 | |
Media | | | 1.4 | |
Sovereign Bonds | | | 1.4 | |
Healthcare-Services | | | 1.4 | |
Municipal Bonds | | | 1.3 | |
| | | | |
Pipelines | | | 1.3 | % |
Telecommunications | | | 1.3 | |
Software | | | 1.1 | |
Oil & Gas | | | 1.1 | |
Chemicals | | | 0.9 | |
Aerospace & Defense | | | 0.8 | |
Insurance | | | 0.7 | |
Computers | | | 0.7 | |
Beverages | | | 0.6 | |
Diversified Financial Services | | | 0.5 | |
Retail | | | 0.5 | |
See Notes to Financial Statements.
PGIM Core Conservative Bond Fund
Schedule of Investments (continued)
as of July 31, 2020
Industry Classification (continued):
| | | | |
Foods | | | 0.4 | % |
Transportation | | | 0.4 | |
Biotechnology | | | 0.4 | |
Agriculture | | | 0.4 | |
Credit Cards | | | 0.4 | |
Healthcare-Products | | | 0.3 | |
Real Estate Investment Trusts (REITs) | | | 0.3 | |
Commercial Services | | | 0.3 | |
Machinery-Diversified | | | 0.3 | |
Auto Manufacturers | | | 0.2 | |
Gas | | | 0.2 | |
Miscellaneous Manufacturing | | | 0.2 | |
Airlines | | | 0.2 | |
Forest Products & Paper | | | 0.2 | |
Mining | | | 0.1 | |
Building Materials | | | 0.1 | |
| | | | |
Lodging | | | 0.1 | % |
Electronics | | | 0.1 | |
Oil & Gas Services | | | 0.1 | |
Semiconductors | | | 0.0 | * |
Internet | | | 0.0 | * |
Iron/Steel | | | 0.0 | * |
Water | | | 0.0 | * |
Environmental Control | | | 0.0 | * |
| | | | |
| | | 106.0 | |
Liabilities in excess of other assets | | | (6.0 | ) |
| | | | |
| |
| | | 100.0 | % |
| | | | |
See Notes to Financial Statements.
| | | | |
| PGIM Day One Underlying Funds | | | 73 | |
PGIM Core Conservative Bond Fund
Statement of Assets & Liabilities
as of July 31, 2020
| | | | |
Assets | | | | |
Investments at value: | | | | |
Unaffiliated investments (cost $52,304,480) | | $ | 56,419,411 | |
Affiliated investments (cost $5,017,604) | | | 5,017,604 | |
Receivable for investments sold | | | 4,696,858 | |
Dividends and interest receivable | | | 312,936 | |
Receivable for Fund shares sold | | | 190,465 | |
Prepaid expenses and other assets | | | 97 | |
| | | | |
Total Assets | | | 66,637,371 | |
| | | | |
| |
Liabilities | | | | |
Payable for investments purchased | | | 8,485,509 | |
Accrued expenses and other liabilities | | | 100,486 | |
Payable for Fund shares reacquired | | | 68,807 | |
Management fee payable | | | 12,647 | |
Dividends payable | | | 6,381 | |
Trustees’ fees payable | | | 910 | |
Affiliated transfer agent fee payable | | | 55 | |
| | | | |
Total Liabilities | | | 8,674,795 | |
| | | | |
| |
Net Assets | | $ | 57,962,576 | |
| | | | |
| | | | |
Net assets were comprised of: | | | | |
Shares of beneficial interest, at par | | $ | 5,362 | |
Paid-in capital in excess of par | | | 53,673,689 | |
Total distributable earnings (loss) | | | 4,283,525 | |
| | | | |
| |
Net assets, July 31, 2020 | | $ | 57,962,576 | |
| | | | |
| |
Class R6 | | | | |
Net asset value, offering price and redemption price per share,
($57,962,576 ÷ 5,362,279 shares of beneficial interest issued and outstanding) | | $ | 10.81 | |
| | | | |
See Notes to Financial Statements.
PGIM Core Conservative Bond Fund
Statement of Operations
Year Ended July 31, 2020
| | | | |
Net Investment Income (Loss) | | | | |
Income | | | | |
Interest income | | $ | 1,267,941 | |
Affiliated dividend income | | | 23,815 | |
Affiliated income from securities lending, net | | | 4 | |
| | | | |
Total income | | | 1,291,760 | |
| | | | |
| |
Expenses | | | | |
Management fee | | | 135,519 | |
Custodian and accounting fees | | | 83,864 | |
Audit fee | | | 56,106 | |
Legal fees and expenses | | | 20,864 | |
Shareholders’ reports | | | 12,840 | |
Trustees’ fees | | | 11,150 | |
SEC registration fees | | | 655 | |
Transfer agent’s fees and expenses (including affiliated expense of $369) | | | 446 | |
Registration fees | | | 250 | |
Miscellaneous | | | 14,689 | |
| | | | |
Total expenses | | | 336,383 | |
Less: Fee waiver and/or expense reimbursement | | | (85,240 | ) |
| | | | |
Net expenses | | | 251,143 | |
| | | | |
Net investment income (loss) | | | 1,040,617 | |
| | | | |
| |
Realized And Unrealized Gain (Loss) On Investments | | | | |
Net realized gain (loss) on investment transactions | | | 895,916 | |
Net change in unrealized appreciation (depreciation) on investments | | | 2,688,469 | |
| | | | |
Net gain (loss) on investment transactions | | | 3,584,385 | |
| | | | |
Net Increase (Decrease) In Net Assets Resulting From Operations | | $ | 4,625,002 | |
| | | | |
See Notes to Financial Statements.
| | | | |
| PGIM Day One Underlying Funds | | | 75 | |
PGIM Core Conservative Bond Fund
Statements of Changes in Net Assets
| | | | | | | | |
| |
| | | Year Ended
July 31, | |
| | |
| | | 2020 | | | 2019 | |
Increase (Decrease) in Net Assets | | | | | | | | |
Operations | | | | | | | | |
Net investment income (loss) | | $ | 1,040,617 | | | $ | 1,090,153 | |
Net realized gain (loss) on investment transactions | | | 895,916 | | | | 8,601 | |
Net change in unrealized appreciation (depreciation) on investments | | | 2,688,469 | | | | 2,207,157 | |
| | | | | | | | |
Net increase (decrease) in net assets resulting from operations | | | 4,625,002 | | | | 3,305,911 | |
| | | | | | | | |
Dividends and Distributions | | | | | | | | |
Distributions from distributable earnings | | | | | | | | |
Class R6 | | | (1,252,954 | ) | | | (1,203,449 | ) |
| | | | | | | | |
| | |
Fund share transactions | | | | | | | | |
Net proceeds from shares sold | | | 20,298,716 | | | | 10,866,757 | |
Net asset value of shares issued in reinvestment of dividends and distributions | | | 1,246,574 | | | | 1,203,448 | |
Cost of shares reacquired | | | (13,859,437 | ) | | | (5,859,806 | ) |
| | | | | | | | |
Net increase (decrease) in net assets from Fund share transactions | | | 7,685,853 | | | | 6,210,399 | |
| | | | | | | | |
Total increase (decrease) | | | 11,057,901 | | | | 8,312,861 | |
| | |
Net Assets: | | | | | | | | |
Beginning of year | | | 46,904,675 | | | | 38,591,814 | |
| | | | | | | | |
End of year | | $ | 57,962,576 | | | $ | 46,904,675 | |
| | | | | | | | |
See Notes to Financial Statements.
PGIM TIPS Fund
Schedule of Investments
as of July 31, 2020
| | | | | | | | | | | | | | | | |
| | | | |
| Description | | Interest Rate | | | Maturity Date | | | Principal Amount (000)# | | | Value | |
| | | | |
LONG-TERM INVESTMENTS 99.6% | | | | | | | | | | | | | | | | |
| | | | |
U.S. TREASURY OBLIGATIONS | | | | | | | | | | | | | | | | |
U.S. Treasury Inflation Indexed Bonds, TIPS | | | 0.125% | | | | 04/15/21 | | | | 806 | | | $ | 811,195 | |
U.S. Treasury Inflation Indexed Bonds, TIPS | | | 0.125 | | | | 01/15/22 | | | | 476 | | | | 484,002 | |
U.S. Treasury Inflation Indexed Bonds, TIPS | | | 0.125 | | | | 04/15/22 | | | | 543 | | | | 553,279 | |
U.S. Treasury Inflation Indexed Bonds, TIPS | | | 0.125 | | | | 01/15/23 | | | | 6,898 | | | | 7,112,939 | |
U.S. Treasury Inflation Indexed Bonds, TIPS | | | 0.125 | | | | 10/15/24 | | | | 1,999 | | | | 2,121,118 | |
U.S. Treasury Inflation Indexed Bonds, TIPS | | | 0.125 | | | | 07/15/26 | | | | 21 | | | | 23,174 | |
U.S. Treasury Inflation Indexed Bonds, TIPS | | | 0.125 | | | | 01/15/30 | | | | 1,804 | | | | 2,001,476 | |
U.S. Treasury Inflation Indexed Bonds, TIPS | | | 0.250 | | | | 01/15/25 | | | | 5,992 | | | | 6,391,192 | |
U.S. Treasury Inflation Indexed Bonds, TIPS | | | 0.250 | | | | 07/15/29 | | | | 5 | | | | 5,617 | |
U.S. Treasury Inflation Indexed Bonds, TIPS | | | 0.375 | | | | 01/15/27 | | | | 2,754 | | | | 3,029,510 | |
U.S. Treasury Inflation Indexed Bonds, TIPS | | | 0.375 | | | | 07/15/27 | | | | 424 | | | | 471,492 | |
U.S. Treasury Inflation Indexed Bonds, TIPS | | | 0.500 | | | | 01/15/28 | | | | 2,089 | | | | 2,341,287 | |
U.S. Treasury Inflation Indexed Bonds, TIPS | | | 0.625 | | | | 04/15/23 | | | | 1,486 | | | | 1,557,186 | |
U.S. Treasury Inflation Indexed Bonds, TIPS | | | 0.625 | | | | 01/15/24 | | | | 2,038 | | | | 2,167,112 | |
U.S. Treasury Inflation Indexed Bonds, TIPS | | | 0.625 | | | | 01/15/26 | | | | 3,707 | | | | 4,081,835 | |
U.S. Treasury Inflation Indexed Bonds, TIPS | | | 0.625 | | | | 02/15/43 | | | | 786 | | | | 985,868 | |
U.S. Treasury Inflation Indexed Bonds, TIPS | | | 0.750 | | | | 02/15/42 | | | | 386 | | | | 492,569 | |
U.S. Treasury Inflation Indexed Bonds, TIPS | | | 0.750 | | | | 02/15/45 | | | | 425 | | | | 554,245 | |
U.S. Treasury Inflation Indexed Bonds, TIPS | | | 0.875 | | | | 01/15/29 | | | | 5,696 | | | | 6,645,377 | |
U.S. Treasury Inflation Indexed Bonds, TIPS | | | 0.875 | | | | 02/15/47 | | | | 1,545 | | | | 2,113,640 | |
U.S. Treasury Inflation Indexed Bonds, TIPS | | | 1.000 | | | | 02/15/46 | | | | 633 | | | | 877,226 | |
U.S. Treasury Inflation Indexed Bonds, TIPS | | | 1.000 | | | | 02/15/48 | | | | 1,102 | | | | 1,564,376 | |
U.S. Treasury Inflation Indexed Bonds, TIPS | | | 1.000 | | | | 02/15/49 | | | | 25 | | | | 36,611 | |
U.S. Treasury Inflation Indexed Bonds, TIPS | | | 1.125 | | | | 01/15/21 | | | | 298 | | | | 301,291 | |
U.S. Treasury Inflation Indexed Bonds, TIPS | | | 2.125 | | | | 02/15/40 | | | | 658 | | | | 1,021,818 | |
U.S. Treasury Inflation Indexed Bonds, TIPS | | | 2.125 | | | | 02/15/41 | | | | 316 | | | | 498,048 | |
U.S. Treasury Inflation Indexed Bonds, TIPS | | | 3.375 | | | | 04/15/32 | | | | 188 | | | | 286,807 | |
| | | | | | | | | | | | | | | | |
| | | | |
TOTAL LONG-TERM INVESTMENTS | | | | | | | | | | | | | | | | |
(cost $45,164,713) | | | | | | | | | | | | | | | 48,530,290 | |
| | | | | | | | | | | | | | | | |
See Notes to Financial Statements.
| | | | |
| PGIM Day One Underlying Funds | | | 77 | |
PGIM TIPS Fund
Schedule of Investments (continued)
as of July 31, 2020
| | | | | | | | | | | | |
| | | | |
| Description | | | | | | Shares | | | Value | |
| | | | |
SHORT-TERM INVESTMENT 1.6% | | | | | | | | | | | | |
| | | | |
AFFILIATED MUTUAL FUND | | | | | | | | | | | | |
PGIM Core Ultra Short Bond Fund | | | | | | | | | | | | |
(cost $776,742)(w) | | | | | | | 776,742 | | | $ | 776,742 | |
| | | | | | | | | | | | |
| | | | |
TOTAL INVESTMENTS 101.2% | | | | | | | | | | | | |
(cost $45,941,455) | | | | | | | | | | | 49,307,032 | |
Liabilities in excess of other assets (1.2)% | | | | | | | | | | | (571,467 | ) |
| | | | | | | | | | | | |
| | | | |
NET ASSETS 100.0% | | | | | | | | | | $ | 48,735,565 | |
| | | | | | | | | | | | |
See the Glossary for a list of the abbreviation(s) used in the annual report.
| # | Principal amount is shown in U.S. dollars unless otherwise stated. |
| (w) | PGIM Investments LLC, the manager of the Fund, also serves as manager of the PGIM Core Ultra Short Bond Fund. |
Fair Value Measurements:
Various inputs are used in determining the value of the Fund’s investments. These inputs are summarized in the three broad levels listed below.
Level 1—unadjusted quoted prices generally in active markets for identical securities.
Level 2—quoted prices for similar securities, interest rates and yield curves, prepayment speeds, foreign currency exchange rates and other observable inputs.
Level 3—unobservable inputs for securities valued in accordance with Board approved fair valuation procedures.
The following is a summary of the inputs used as of July 31, 2020 in valuing such portfolio securities:
| | | | | | | | | | | | |
| | | Level 1 | | | Level 2 | | | Level 3 | |
Investments in Securities | | | | | | | | | | | | |
Assets | | | | | | | | | | | | |
U.S. Treasury Obligations | | $ | — | | | $ | 48,530,290 | | | | $— | |
Affiliated Mutual Fund | | | 776,742 | | | | — | | | | — | |
| | | | | | | | | | | | |
Total | | $ | 776,742 | | | $ | 48,530,290 | | | | $— | |
| | | | | | | | | | | | |
See Notes to Financial Statements.
PGIM TIPS Fund
Schedule of Investments (continued)
as of July 31, 2020
Sector Allocations:
The sector allocations of portfolio holdings and liabilities in excess of other assets shown as a percentage of net assets as of July 31, 2020 were as follows (unaudited):
| | | | |
U.S. Treasury Obligations | | | 99.6 | % |
Affiliated Mutual Fund | | | 1.6 | |
| | | | |
| | | 101.2 | |
Liabilities in excess of other assets | | | (1.2 | ) |
| | | | |
| |
| | | 100.0 | % |
| | | | |
See Notes to Financial Statements.
| | | | |
| PGIM Day One Underlying Funds | | | 79 | |
PGIM TIPS Fund
Statement of Assets & Liabilities
as of July 31, 2020
| | | | |
Assets | | | | |
Investments at value: | | | | |
Unaffiliated investments (cost $45,164,713) | | $ | 48,530,290 | |
Affiliated investments (cost $776,742) | | | 776,742 | |
Receivable for investments sold | | | 1,221,832 | |
Receivable for Fund shares sold | | | 205,246 | |
Interest receivable | | | 41,747 | |
Prepaid expenses and other assets | | | 14 | |
| | | | |
Total Assets | | | 50,775,871 | |
| | | | |
| |
Liabilities | | | | |
Payable for investments purchased | | | 1,875,274 | |
Payable for Fund shares reacquired | | | 102,932 | |
Accrued expenses and other liabilities | | | 60,372 | |
Trustees’ fees payable | | | 904 | |
Management fee payable | | | 776 | |
Affiliated transfer agent fee payable | | | 48 | |
| | | | |
Total Liabilities | | | 2,040,306 | |
| | | | |
| |
Net Assets | | $ | 48,735,565 | |
| | | | |
| | | | |
| |
Net assets were comprised of: | | | | |
Shares of beneficial interest, at par | | $ | 4,566 | |
Paid-in capital in excess of par | | | 45,241,007 | |
Total distributable earnings (loss) | | | 3,489,992 | |
| | | | |
| |
Net assets, July 31, 2020 | | $ | 48,735,565 | |
| | | | |
| |
Class R6 | | | | |
Net asset value, offering price and redemption price per share, ($48,735,565 ÷ 4,566,413 shares of beneficial interest issued and outstanding) | | $ | 10.67 | |
| | | | |
See Notes to Financial Statements.
PGIM TIPS Fund
Statement of Operations
Year Ended July 31, 2020
| | | | | | |
Net Investment Income (Loss) | | | | | | |
Income | | | | | | |
Interest income | | $ | 200,091 | | | |
Affiliated dividend income | | | 3,140 | | | |
| | | | | | |
Total income | | | 203,231 | | | |
| | | | | | |
| | |
Expenses | | | | | | |
Management fee | | | 89,241 | | | |
Custodian and accounting fees | | | 53,053 | | | |
Audit fee | | | 32,643 | | | |
Legal fees and expenses | | | 20,328 | | | |
Trustees’ fees | | | 11,010 | | | |
Shareholders’ reports | | | 5,360 | | | |
Transfer agent’s fees and expenses (including affiliated expense of $344) | | | 432 | | | |
SEC registration fees | | | 300 | | | |
Registration fees | | | 249 | | | |
Miscellaneous | | | 14,657 | | | |
| | | | | | |
Total expenses | | | 227,273 | | | |
Less: Fee waiver and/or expense reimbursement | | | (71,099 | ) | | |
| | | | | | |
Net expenses | | | 156,174 | | | |
| | | | | | |
Net investment income (loss) | | | 47,057 | | | |
| | | | | | |
Realized And Unrealized Gain (Loss) On Investment And Foreign Currency Transactions | | | | | | |
Net realized gain (loss) on investment transactions | | | 1,120,200 | | | |
| | | | | | |
Net change in unrealized appreciation (depreciation) on: | | | | | | |
Investments | | | 2,502,437 | | | |
Foreign currencies | | | (546 | ) | | |
| | | | | | |
| | | 2,501,891 | | | |
| | | | | | |
Net gain (loss) on investment and foreign currency transactions | | | 3,622,091 | | | |
| | | | | | |
Net Increase (Decrease) In Net Assets Resulting From Operations | | $ | 3,669,148 | | | |
| | | | | | |
See Notes to Financial Statements.
| | | | |
| PGIM Day One Underlying Funds | | | 81 | |
PGIM TIPS Fund
Statements of Changes in Net Assets
| | | | | | | | |
| |
| | | Year Ended July 31, | |
| | |
| | | 2020 | | | 2019 | |
Increase (Decrease) in Net Assets | | | | | | | | |
Operations | | | | | | | | |
Net investment income (loss) | | $ | 47,057 | | | $ | 659,127 | |
Net realized gain (loss) on investment transactions | | | 1,120,200 | | | | (60,741 | ) |
Net change in unrealized appreciation (depreciation) on investments and foreign currencies | | | 2,501,891 | | | | 1,221,106 | |
| | | | | | | | |
Net increase (decrease) in net assets resulting from operations | | | 3,669,148 | | | | 1,819,492 | |
| | | | | | | | |
| | |
Dividends and Distributions | | | | | | | | |
Distributions from distributable earnings | | | | | | | | |
Class R6 | | | (550,849 | ) | | | (827,770 | ) |
| | | | | | | | |
| | |
Fund share transactions | | | | | | | | |
Net proceeds from shares sold | | | 34,833,583 | | | | 19,881,418 | |
Net asset value of shares issued in reinvestment of dividends and distributions | | | 550,849 | | | | 827,771 | |
Cost of shares reacquired | | | (25,704,948 | ) | | | (9,455,747 | ) |
| | | | | | | | |
Net increase (decrease) in net assets from Fund share transactions | | | 9,679,484 | | | | 11,253,442 | |
| | | | | | | | |
Total increase (decrease) | | | 12,797,783 | | | | 12,245,164 | |
| | |
Net Assets: | | | | | | | | |
Beginning of year | | | 35,937,782 | | | | 23,692,618 | |
| | | | | | | | |
End of year | | $ | 48,735,565 | | | $ | 35,937,782 | |
| | | | | | | | |
See Notes to Financial Statements.
PGIM QMA Commodity Strategies Fund
Consolidated Schedule of Investments
as of July 31, 2020
| | | | | | | | | | | | |
| Description | | | | | | Shares | | | Value | |
SHORT-TERM INVESTMENTS 98.4% | | | | | | | | |
| | |
UNAFFILIATED FUND 25.8% | | | | | | | | |
Dreyfus Treasury Securities Cash Management(bb)
(cost $9,937,055) | | | 9,937,055 | | | $ | 9,937,055 | |
| | | | | | | | | | | | |
| | | | |
| | Interest Rate | | Maturity Date | |
| Principal
Amount (000)# |
| | | | |
U.S. TREASURY OBLIGATIONS(n) 72.6% | | | | | | | | |
U.S. Treasury Bills | | 0.036% | | 09/17/20 | | | 11,400 | | | | 11,398,735 | |
U.S. Treasury Bills | | 0.131 | | 03/25/21 | | | 9,000 | | | | 8,993,931 | |
U.S. Treasury Bills | | 0.151 | | 09/17/20 | | | 3,600 | | | | 3,599,601 | |
U.S. Treasury Bills | | 0.172(bb)(k) | | 03/25/21 | | | 4,000 | | | | 3,997,303 | |
| | | | | | | | | | | | |
| | |
TOTAL U.S. TREASURY OBLIGATIONS
(cost $27,986,556) | | | | | | | 27,989,570 | |
| | | | | | | | | | | | |
| | |
TOTAL INVESTMENTS 98.4%
(cost $37,923,611) | | | | | | | 37,926,625 | |
Other assets in excess of liabilities(z) 1.6% | | | | | | | 626,092 | |
| | | | | | | | | | | | |
| | |
NET ASSETS 100.0% | | | | | | $ | 38,552,717 | |
| | | | | | | | | | | | |
See the Glossary for a list of the abbreviation(s) used in the annual report.
| # | Principal amount is shown in U.S. dollars unless otherwise stated. |
| (bb) | Represents security held in the Cayman Subsidiary. |
| (k) | Represents security, or a portion thereof, segregated as collateral for centrally cleared/exchange-traded derivatives. |
| (n) | Rate shown reflects yield to maturity at purchased date. |
| (z) | Includes net unrealized appreciation/(depreciation) and/or market value of the below holdings which are excluded from the Consolidated Schedule of Investments: |
Commodity Futures contracts outstanding at July 31, 2020(1):
| | | | | | | | | | | | | | |
Number of Contracts | | Type | | Expiration
Date | | | Current
Notional
Amount | | | Value/
Unrealized
Appreciation
(Depreciation) | |
Long Positions: | | | | | | | | | | | | |
43 | | Brent Crude | | | Nov. 2020 | | | $ | 1,885,550 | | | $ | 34,570 | |
7 | | Coffee ’C’ | | | Sep. 2020 | | | | 312,244 | | | | 53,605 | |
43 | | Copper | | | Sep. 2020 | | | | 3,083,100 | | | | 247,345 | |
86 | | Corn | | | Sep. 2020 | | | | 1,358,800 | | | | (106,793 | ) |
13 | | Cotton No. 2 | | | Dec. 2020 | | | | 407,290 | | | | 17,289 | |
See Notes to Financial Statements.
| | | | |
| PGIM Day One Underlying Funds | | | 83 | |
PGIM QMA Commodity Strategies Fund
Consolidated Schedule of Investments (continued)
as of July 31, 2020
Commodity Futures contracts outstanding at July 31, 2020(1) (continued):
| | | | | | | | | | | | | | |
Number of Contracts | | Type | | Expiration
Date | | | Current
Notional
Amount | | | Value/
Unrealized
Appreciation
(Depreciation) | |
Long Positions (cont’d): | | | | | | | | | | | | |
28 | | Gasoline RBOB | | | Sep. 2020 | | | $ | 1,377,214 | | | $ | (39,735 | ) |
32 | | Gold 100 OZ | | | Dec. 2020 | | | | 6,354,880 | | | | 498,003 | |
26 | | Hard Red Winter Wheat | | | Sep. 2020 | | | | 575,250 | | | | (33,188 | ) |
23 | | Lean Hogs | | | Oct. 2020 | | | | 456,550 | | | | (3,808 | ) |
38 | | Live Cattle | | | Oct. 2020 | | | | 1,639,700 | | | | 60,838 | |
15 | | LME Nickel | | | Sep. 2020 | | | | 1,238,715 | | | | 74,403 | |
53 | | LME PRI Aluminum | | | Sep. 2020 | | | | 2,248,194 | | | | 98,621 | |
33 | | LME Zinc | | | Sep. 2020 | | | | 1,909,875 | | | | 236,541 | |
17 | | Low Sulphur Gas Oil | | | Sep. 2020 | | | | 624,750 | | | | 21,969 | |
127 | | Natural Gas | | | Sep. 2020 | | | | 2,284,730 | | | | (117,854 | ) |
30 | | No. 2 Soft Red Winter Wheat | | | Sep. 2020 | | | | 796,875 | | | | 13,620 | |
4 | | NY Harbor ULSD | | | Sep. 2020 | | | | 205,632 | | | | 2,714 | |
21 | | Silver | | | Sep. 2020 | | | | 2,542,680 | | | | 616,313 | |
64 | | Soybean | | | Nov. 2020 | | | | 2,856,000 | | | | 38,822 | |
46 | | Soybean Meal | | | Dec. 2020 | | | | 1,367,580 | | | | (3,463 | ) |
84 | | Soybean Oil | | | Dec. 2020 | | | | 1,550,304 | | | | 88,408 | |
110 | | Sugar #11 (World) | | | Oct. 2020 | | | | 1,557,248 | | | | 57,579 | |
48 | | WTI Crude | | | Sep. 2020 | | | | 1,932,960 | | | | 330,603 | |
| | | | | | | | | | | | | | |
| | | | | | | | | | | | | 2,186,402 | |
| | | | | | | | | | | | | | |
| | |
Short Position: | | | | | | | | | |
13 | | LME PRI Aluminum | | | Sep. 2020 | | | | 551,444 | | | | (8,756 | ) |
| | | | | | | | | | | | | | |
| | | | | | | | | | | | $ | 2,177,646 | |
| | | | | | | | | | | | | | |
| (1) | Represents positions held in the Cayman Subsidiary. |
Summary of Collateral for Centrally Cleared/Exchange-traded Derivatives:
Cash and securities segregated as collateral, including pending settlement for closed positions, to cover requirements for centrally cleared/exchange-traded derivatives are listed by broker as follows:
| | | | | | | | | | |
Broker | | Cash and/or Foreign Currency | | Securities Market Value |
Morgan Stanley & Co. LLC | | | $ | 400,808 | | | | $ | 3,997,303 | |
| | | | | | | | | | |
See Notes to Financial Statements.
PGIM QMA Commodity Strategies Fund
Consolidated Schedule of Investments (continued)
as of July 31, 2020
Fair Value Measurements:
Various inputs are used in determining the value of the Fund’s investments. These inputs are summarized in the three broad levels listed below.
Level 1—unadjusted quoted prices generally in active markets for identical securities.
Level 2—quoted prices for similar securities, interest rates and yield curves, prepayment speeds, foreign currency exchange rates and other observable inputs.
Level 3—unobservable inputs for securities valued in accordance with Board approved fair valuation procedures.
The following is a summary of the inputs used as of July 31, 2020 in valuing such portfolio securities:
| | | | | | | | | | | | |
| | | Level 1 | | | Level 2 | | | Level 3 | |
Investments in Securities | | | | | | | | | | | | |
Assets | | | | | | | | | | | | |
Unaffiliated Fund | | $ | 9,937,055 | | | $ | — | | | | $— | |
U.S. Treasury Obligations | | | — | | | | 27,989,570 | | | | — | |
| | | | | | | | | | | | |
Total | | $ | 9,937,055 | | | | $27,989,570 | | | | $— | |
| | | | | | | | | | | | |
| | | |
Other Financial Instruments* | | | | | | | | | | | | |
Assets | | | | | | | | | | | | |
Commodity Futures Contracts. | | $ | 2,491,243 | | | $ | — | | | | $— | |
| | | | | | | | | | | | |
Liabilities | | | | | | | | | | | | |
Commodity Futures Contracts. | | $ | (313,597 | ) | | $ | — | | | | $— | |
| | | | | | | | | | | | |
| * | Other financial instruments are derivative instruments not reflected in the Consolidated Schedule of Investments, such as futures, forwards and centrally cleared swap contracts, which are recorded at the unrealized appreciation (depreciation) on the instrument, and OTC swap contracts which are recorded at fair value. |
Sector Allocation:
The sector allocation of portfolio holdings and other assets in excess of liabilities shown as a percentage of net assets as of July 31, 2020 were as follows (unaudited):
| | | | |
U.S. Treasury Obligations | | | 72.6 | % |
Unaffiliated Fund | | | 25.8 | |
| | | | |
| | | 98.4 | |
Other assets in excess of liabilities | | | 1.6 | |
| | | | |
| | | 100.0 | % |
| | | | |
See Notes to Financial Statements.
| | | | |
| PGIM Day One Underlying Funds | | | 85 | |
PGIM QMA Commodity Strategies Fund
Consolidated Schedule of Investments (continued)
as of July 31, 2020
Effects of Derivative Instruments on the Financial Statements and Primary Underlying Risk Exposure:
The Fund invested in derivative instruments during the reporting period. The primary type of risk associated with these derivative instruments is commodity contracts risk. See the Notes to Consolidated Financial Statements for additional detail regarding these derivative instruments and their risks. The effect of such derivative instruments on the Fund’s financial position and financial performance as reflected in the Consolidated Statement of Assets and Liabilities and Consolidated Statement of Operations is presented in the summary below.
Fair values of derivative instruments as of July 31, 2020 as presented in the Consolidated Statement of Assets and Liabilities:
| | | | | | | | | | | | |
| | | Asset Derivatives | | | Liability Derivatives | |
Derivatives not accounted for as hedging instruments, carried at fair value | | Consolidated
Statement of
Assets and
Liabilities Location | | Fair
Value | | | Consolidated
Statement of
Assets and
Liabilities Location | | Fair
Value | |
Commodity contracts | | Due from/to broker-variation margin futures | | $ | 2,491,243 | * | | Due from/to broker-variation margin futures | | $ | 313,597 | * |
| | | | | | | | | | | | |
| * | Includes cumulative appreciation (depreciation) as reported in the schedule of open futures and centrally cleared swap contracts. Only unsettled variation margin receivable (payable) is reported within the Consolidated Statement of Assets and Liabilities. |
The effects of derivative instruments on the Consolidated Statement of Operations for the year ended July 31, 2020 are as follows:
| | | | |
Amount of Realized Gain (Loss) on Derivatives Recognized in Income | |
Derivatives not accounted for as hedging instruments, carried at fair value | | Futures | |
Commodity contracts | | $ | (5,607,441 | ) |
| | | | |
|
Change in Unrealized Appreciation (Depreciation) on Derivatives Recognized in Income | |
Derivatives not accounted for as hedging instruments, carried at fair value | | Futures | |
Commodity contracts | | $ | 2,327,900 | |
| | | | |
See Notes to Financial Statements.
PGIM QMA Commodity Strategies Fund
Consolidated Schedule of Investments (continued)
as of July 31, 2020
For the year ended July 31, 2020, the Fund’s average volume of derivative activities is as follows:
| | |
Futures Contracts— Long Positions(1) | | Futures Contracts— Short Positions(1) |
$28,154,020 | | $866,614 |
| (1) | Notional Amount in USD. |
See Notes to Financial Statements.
| | | | |
| PGIM Day One Underlying Funds | | | 87 | |
PGIM QMA Commodity Strategies Fund
Consolidated Statement of Assets & Liabilities
as of July 31, 2020
| | | | |
Assets | | | | |
Unaffiliated investments (cost $37,923,611) | | $ | 37,926,625 | |
Deposit with broker for centrally cleared/exchange-traded derivatives | | | 400,808 | |
Due from broker—variation margin futures | | | 224,745 | |
Receivable for Fund shares sold | | | 94,707 | |
Dividends and interest receivable | | | 490 | |
| | | | |
Total Assets | | | 38,647,375 | |
| | | | |
Liabilities | | | | |
Audit fee payable | | | 28,563 | |
Payable for Fund shares reacquired | | | 21,678 | |
Custodian and accounting fees payable | | | 16,463 | |
Management fee payable | | | 12,471 | |
Accrued expenses and other liabilities | | | 9,722 | |
Shareholders’ reports payable | | | 4,784 | |
Trustees’ fees payable | | | 904 | |
Affiliated transfer agent fee payable | | | 73 | |
| | | | |
Total Liabilities | | | 94,658 | |
| | | | |
| |
Net Assets | | $ | 38,552,717 | |
| | | | |
| | | | | |
Net assets were comprised of: | | | | |
Shares of beneficial interest, at par | | $ | 4,621 | |
Paid-in capital in excess of par | | | 43,316,461 | |
Total distributable earnings (loss) | | | (4,768,365 | ) |
| | | | |
| |
Net assets, July 31, 2020 | | $ | 38,552,717 | |
| | | | |
Class R6 | | | | |
Net asset value, offering price and redemption price per share,
($38,552,717 ÷ 4,620,654 shares of beneficial interest issued and outstanding) | | $ | 8.34 | |
| | | | |
See Notes to Financial Statements.
PGIM QMA Commodity Strategies Fund
Consolidated Statement of Operations
Year Ended July 31, 2020
| | | | |
Net Investment Income (Loss) | | | | |
Income | | | | |
Interest income | | $ | 146,590 | |
Unaffiliated dividend income | | | 127,397 | |
| | | | |
Total income | | | 273,987 | |
| | | | |
| |
Expenses | | | | |
Management fee | | | 130,565 | |
Custodian and accounting fees | | | 48,549 | |
Audit fee | | | 28,563 | |
Legal fees and expenses | | | 23,331 | |
Trustees’ fees | | | 10,920 | |
Shareholders’ reports | | | 6,430 | |
SEC registration fees | | | 2,500 | |
Transfer agent’s fees and expenses (including affiliated expense of $473) | | | 582 | |
Registration fees | | | 250 | |
Miscellaneous | | | 13,171 | |
| | | | |
Total expenses | | | 264,861 | |
Less: Fee waiver and/or expense reimbursement | | | (38,395 | ) |
| | | | |
Net expenses | | | 226,466 | |
| | | | |
Net investment income (loss) | | | 47,521 | |
| | | | |
Realized And Unrealized Gain (Loss) On Investments | | | | |
Net realized gain (loss) on: | | | | |
Investment transactions | | | (3,601 | ) |
Futures transactions | | | (5,607,441 | ) |
| | | | |
| | | (5,611,042 | ) |
| | | | |
Net change in unrealized appreciation (depreciation) on: | | | | |
Investments | | | 921 | |
Futures | | | 2,327,900 | |
| | | | |
| | | 2,328,821 | |
| | | | |
Net gain (loss) on investment transactions | | | (3,282,221 | ) |
| | | | |
Net Increase (Decrease) In Net Assets Resulting From Operations | | $ | (3,234,700 | ) |
| | | | |
See Notes to Financial Statements.
| | | | |
| PGIM Day One Underlying Funds | | | 89 | |
PGIM QMA Commodity Strategies Fund
Consolidated Statements of Changes in Net Assets
| | | | | | | | |
| | | Year Ended
July 31, | |
| | | 2020 | | | 2019 | |
Increase (Decrease) in Net Assets | | | | | | | | |
Operations | | | | | | | | |
Net investment income (loss) | | $ | 47,521 | | | $ | 278,497 | |
Net realized gain (loss) on investment transactions | | | (5,611,042 | ) | | | (1,398,891 | ) |
Net change in unrealized appreciation (depreciation) on investments | | | 2,328,821 | | | | (60,806 | ) |
| | | | | | | | |
Net increase (decrease) in net assets resulting from operations | | | (3,234,700 | ) | | | (1,181,200 | ) |
| | | | | | | | |
Dividends and Distributions | | | | | | | | |
Distributions from distributable earnings | | | | | | | | |
Class R6 | | | (227,598 | ) | | | (530,351 | ) |
| | | | | | | | |
Tax return of capital distributions | | | | | | | | |
Class R6 | | | (6,154 | ) | | | — | |
| | | | | | | | |
Fund share transactions | | | | | | | | |
Net proceeds from shares sold | | | 30,076,283 | | | | 6,829,897 | |
Net asset value of shares issued in reinvestment of dividends and distributions | | | 233,752 | | | | 530,351 | |
Cost of shares reacquired | | | (9,411,703 | ) | | | (2,712,985 | ) |
| | | | | | | | |
Net increase (decrease) in net assets from Fund share transactions | | | 20,898,332 | | | | 4,647,263 | |
| | | | | | | | |
Total increase (decrease) | | | 17,429,880 | | | | 2,935,712 | |
| | |
Net Assets: | | | | | | | | |
Beginning of year | | | 21,122,837 | | | | 18,187,125 | |
| | | | | | | | |
End of year | | $ | 38,552,717 | | | $ | 21,122,837 | |
| | | | | | | | |
See Notes to Financial Statements.
PGIM QMA Mid-Cap Core Equity Fund
Schedule of Investments
as of July 31, 2020
| | | | | | | | |
| | |
| Description | | Shares | | | Value | |
| | |
LONG-TERM INVESTMENTS 102.0% | | | | | | | | |
| | |
COMMON STOCKS 99.9% | | | | | | | | |
| | |
Aerospace & Defense 1.1% | | | | | | | | |
Curtiss-Wright Corp. | | | 1,550 | | | $ | 138,136 | |
Huntington Ingalls Industries, Inc. | | | 580 | | | | 100,752 | |
| | | | | | | | |
| | |
| | | | | | | 238,888 | |
| | |
Auto Components 2.0% | | | | | | | | |
Adient PLC* | | | 7,310 | | | | 121,638 | |
Gentex Corp. | | | 7,000 | | | | 188,930 | |
Lear Corp. | | | 1,010 | | | | 111,484 | |
| | | | | | | | |
| | |
| | | | | | | 422,052 | |
| | |
Banks 5.0% | | | | | | | | |
Associated Banc-Corp. | | | 9,370 | | | | 120,311 | |
CIT Group, Inc. | | | 3,240 | | | | 61,463 | |
Customers Bancorp, Inc.* | | | 1,300 | | | | 15,405 | |
FNB Corp. | | | 18,020 | | | | 133,528 | |
Hancock Whitney Corp. | | | 4,590 | | | | 87,485 | |
PacWest Bancorp | | | 6,500 | | | | 118,788 | |
Prosperity Bancshares, Inc. | | | 1,200 | | | | 66,672 | |
Signature Bank | | | 1,600 | | | | 164,048 | |
Synovus Financial Corp. | | | 7,000 | | | | 141,050 | |
Umpqua Holdings Corp. | | | 4,700 | | | | 50,995 | |
Valley National Bancorp | | | 7,900 | | | | 59,013 | |
Wintrust Financial Corp. | | | 300 | | | | 12,840 | |
| | | | | | | | |
| | |
| | | | | | | 1,031,598 | |
| | |
Biotechnology 1.7% | | | | | | | | |
Exelixis, Inc.* | | | 8,130 | | | | 187,722 | |
United Therapeutics Corp.* | | | 1,470 | | | | 163,861 | |
| | | | | | | | |
| | |
| | | | | | | 351,583 | |
| | |
Building Products 0.9% | | | | | | | | |
Owens Corning | | | 390 | | | | 23,583 | |
Trex Co., Inc.* | | | 540 | | | | 75,238 | |
UFP Industries, Inc. | | | 1,470 | | | | 85,584 | |
| | | | | | | | |
| | |
| | | | | | | 184,405 | |
See Notes to Financial Statements.
| | | | |
| PGIM Day One Underlying Funds | | | 91 | |
PGIM QMA Mid-Cap Core Equity Fund
Schedule of Investments (continued)
as of July 31, 2020
| | | | | | | | |
| | |
| Description | | Shares | | | Value | |
| | |
COMMON STOCKS (Continued) | | | | | | | | |
| | |
Capital Markets 3.6% | | | | | | | | |
Affiliated Managers Group, Inc. | | | 1,480 | | | $ | 101,809 | |
Evercore, Inc. (Class A Stock) | | | 1,000 | | | | 55,300 | |
Federated Hermes, Inc. | | | 4,600 | | | | 121,256 | |
Janus Henderson Group PLC (United Kingdom) | | | 6,760 | | | | 141,217 | |
SEI Investments Co. | | | 3,400 | | | | 177,922 | |
Stifel Financial Corp. | | | 3,000 | | | | 145,440 | |
| | | | | | | | |
| | |
| | | | | | | 742,944 | |
| | |
Chemicals 3.3% | | | | | | | | |
Avient Corp. | | | 5,230 | | | | 124,997 | |
Cabot Corp. | | | 1,930 | | | | 70,406 | |
Minerals Technologies, Inc. | | | 2,100 | | | | 98,448 | |
NewMarket Corp. | | | 270 | | | | 101,199 | |
RPM International, Inc. | | | 400 | | | | 32,636 | |
Scotts Miracle-Gro Co. (The) | | | 760 | | | | 120,513 | |
Sensient Technologies Corp. | | | 2,500 | | | | 130,525 | |
| | | | | | | | |
| | |
| | | | | | | 678,724 | |
| | |
Commercial Services & Supplies 1.1% | | | | | | | | |
Deluxe Corp. | | | 5,560 | | | | 156,959 | |
Herman Miller, Inc. | | | 900 | | | | 21,087 | |
HNI Corp. | | | 510 | | | | 15,147 | |
Matthews International Corp. (Class A Stock) | | | 800 | | | | 17,280 | |
Tetra Tech, Inc. | | | 140 | | | | 12,411 | |
| | | | | | | | |
| | |
| | | | | | | 222,884 | |
| | |
Communications Equipment 2.1% | | | | | | | | |
Ciena Corp.* | | | 3,890 | | | | 231,494 | |
Lumentum Holdings, Inc.* | | | 1,200 | | | | 111,396 | |
NetScout Systems, Inc.* | | | 4,030 | | | | 102,604 | |
| | | | | | | | |
| | |
| | | | | | | 445,494 | |
| | |
Construction & Engineering 1.9% | | | | | | | | |
AECOM* | | | 4,210 | | | | 152,360 | |
EMCOR Group, Inc. | | | 2,350 | | | | 160,975 | |
MasTec, Inc.* | | | 330 | | | | 13,127 | |
See Notes to Financial Statements.
PGIM QMA Mid-Cap Core Equity Fund
Schedule of Investments (continued)
as of July 31, 2020
| | | | | | | | |
| | |
| Description | | Shares | | | Value | |
| | |
COMMON STOCKS (Continued) | | | | | | | | |
| | |
Construction & Engineering (cont’d.) | | | | | | | | |
Quanta Services, Inc. | | | 200 | | | $ | 7,994 | |
Valmont Industries, Inc. | | | 470 | | | | 56,964 | |
| | | | | | | | |
| | |
| | | | | | | 391,420 | |
| | |
Consumer Finance 0.7% | | | | | | | | |
Navient Corp. | | | 3,360 | | | | 26,745 | |
SLM Corp. | | | 19,040 | | | | 128,901 | |
| | | | | | | | |
| | |
| | | | | | | 155,646 | |
| | |
Containers & Packaging 0.9% | | | | | | | | |
Greif, Inc. (Class A Stock) | | | 2,060 | | | | 71,667 | |
Silgan Holdings, Inc. | | | 3,000 | | | | 114,750 | |
| | | | | | | | |
| | |
| | | | | | | 186,417 | |
| | |
Distributors 0.5% | | | | | | | | |
Pool Corp. | | | 310 | | | | 98,177 | |
| | |
Diversified Consumer Services 1.7% | | | | | | | | |
Adtalem Global Education, Inc.* | | | 3,790 | | | | 130,149 | |
Grand Canyon Education, Inc.* | | | 1,710 | | | | 151,745 | |
Service Corp. International | | | 600 | | | | 26,016 | |
Strategic Education, Inc. | | | 440 | | | | 55,532 | |
| | | | | | | | |
| | |
| | | | | | | 363,442 | |
| | |
Electric Utilities 1.2% | | | | | | | | |
NRG Energy, Inc. | | | 2,800 | | | | 94,668 | |
OGE Energy Corp. | | | 4,860 | | | | 159,894 | |
| | | | | | | | |
| | |
| | | | | | | 254,562 | |
| | |
Electrical Equipment 2.1% | | | | | | | | |
Acuity Brands, Inc. | | | 1,610 | | | | 159,551 | |
Hubbell, Inc. | | | 1,070 | | | | 144,418 | |
nVent Electric PLC | | | 7,500 | | | | 136,200 | |
| | | | | | | | |
| | |
| | | | | | | 440,169 | |
| | |
Electronic Equipment, Instruments & Components 2.9% | | | | | | | | |
Arrow Electronics, Inc.* | | | 2,510 | | | | 179,766 | |
See Notes to Financial Statements.
| | | | |
| PGIM Day One Underlying Funds | | | 93 | |
PGIM QMA Mid-Cap Core Equity Fund
Schedule of Investments (continued)
as of July 31, 2020
| | | | | | | | |
| | |
| Description | | Shares | | | Value | |
| | |
COMMON STOCKS (Continued) | | | | | | | | |
| | |
Electronic Equipment, Instruments & Components (cont’d.) | | | | | | | | |
Belden, Inc. | | | 870 | | | $ | 27,492 | |
Cognex Corp. | | | 500 | | | | 33,435 | |
Jabil, Inc. | | | 4,950 | | | | 172,557 | |
National Instruments Corp. | | | 800 | | | | 28,400 | |
SYNNEX Corp. | | | 1,370 | | | | 170,894 | |
| | | | | | | | |
| | |
| | | | | | | 612,544 | |
| | |
Energy Equipment & Services 0.4% | | | | | | | | |
TechnipFMC PLC (United Kingdom) | | | 10,100 | | | | 81,103 | |
| | |
Entertainment 0.4% | | | | | | | | |
Cinemark Holdings, Inc. | | | 640 | | | | 7,571 | |
World Wrestling Entertainment, Inc. (Class A Stock) | | | 1,800 | | | | 83,898 | |
| | | | | | | | |
| | |
| | | | | | | 91,469 | |
| | |
Equity Real Estate Investment Trusts (REITs) 8.4% | | | | | | | | |
Brixmor Property Group, Inc. | | | 11,900 | | | | 136,969 | |
Camden Property Trust | | | 2,000 | | | | 181,620 | |
CoreCivic, Inc. | | | 12,970 | | | | 115,563 | |
Corporate Office Properties Trust | | | 2,840 | | | | 75,203 | |
Cousins Properties, Inc. | | | 1,500 | | | | 46,080 | |
Douglas Emmett, Inc. | | | 5,740 | | | | 167,264 | |
Gaming & Leisure Properties, Inc. | | | 2,955 | | | | 107,000 | |
GEO Group, Inc. (The) | | | 10,900 | | | | 115,867 | |
Highwoods Properties, Inc. | | | 4,190 | | | | 160,645 | |
Lamar Advertising Co. (Class A Stock) | | | 1,700 | | | | 111,741 | |
Life Storage, Inc. | | | 330 | | | | 32,383 | |
Medical Properties Trust, Inc. | | | 3,440 | | | | 69,247 | |
Omega Healthcare Investors, Inc. | | | 3,140 | | | | 101,673 | |
Sabra Health Care REIT, Inc. | | | 5,130 | | | | 75,616 | |
Service Properties Trust | | | 12,480 | | | | 83,616 | |
Spirit Realty Capital, Inc. | | | 4,000 | | | | 137,840 | |
Weingarten Realty Investors | | | 1,830 | | | | 31,220 | |
| | | | | | | | |
| | |
| | | | | | | 1,749,547 | |
| | |
Food & Staples Retailing 1.5% | | | | | | | | |
BJ’s Wholesale Club Holdings, Inc.* | | | 4,100 | | | | 164,205 | |
Sprouts Farmers Market, Inc.* | | | 5,200 | | | | 137,176 | |
| | | | | | | | |
| | |
| | | | | | | 301,381 | |
See Notes to Financial Statements.
PGIM QMA Mid-Cap Core Equity Fund
Schedule of Investments (continued)
as of July 31, 2020
| | | | | | | | |
| | |
| Description | | Shares | | | Value | |
| | |
COMMON STOCKS (Continued) | | | | | | | | |
| | |
Food Products 2.2% | | | | | | | | |
Darling Ingredients, Inc.* | | | 5,390 | | | $ | 150,543 | |
Ingredion, Inc. | | | 2,090 | | | | 180,785 | |
John B. Sanfilippo & Son, Inc. | | | 100 | | | | 8,817 | |
Pilgrim’s Pride Corp.* | | | 7,200 | | | | 110,520 | |
| | | | | | | | |
| | |
| | | | | | | 450,665 | |
| | |
Gas Utilities 1.6% | | | | | | | | |
National Fuel Gas Co. | | | 2,900 | | | | 117,653 | |
ONE Gas, Inc. | | | 360 | | | | 27,252 | |
UGI Corp. | | | 5,820 | | | | 194,039 | |
| | | | | | | | |
| | |
| | | | | | | 338,944 | |
| | |
Health Care Equipment & Supplies 4.3% | | | | | | | | |
Hill-Rom Holdings, Inc. | | | 1,540 | | | | 149,719 | |
ICU Medical, Inc.* | | | 760 | | | | 139,635 | |
Masimo Corp.* | | | 880 | | | | 193,706 | |
Quidel Corp.* | | | 930 | | | | 262,697 | |
West Pharmaceutical Services, Inc. | | | 590 | | | | 158,633 | |
| | | | | | | | |
| | |
| | | | | | | 904,390 | |
| | |
Health Care Providers & Services 2.4% | | | | | | | | |
Chemed Corp. | | | 270 | | | | 132,891 | |
Encompass Health Corp. | | | 200 | | | | 13,616 | |
Molina Healthcare, Inc.* | | | 1,330 | | | | 245,651 | |
Universal Health Services, Inc. (Class B Stock) | | | 990 | | | | 108,801 | |
| | | | | | | | |
| | |
| | | | | | | 500,959 | |
| | |
Hotels, Restaurants & Leisure 2.6% | | | | | | | | |
Cracker Barrel Old Country Store, Inc. | | | 400 | | | | 44,188 | |
Darden Restaurants, Inc. | | | 200 | | | | 15,180 | |
Domino’s Pizza, Inc. | | | 300 | | | | 115,983 | |
Dunkin’ Brands Group, Inc. | | | 1,500 | | | | 103,095 | |
Papa John’s International, Inc. | | | 800 | | | | 75,736 | |
Texas Roadhouse, Inc. | | | 200 | | | | 11,238 | |
Wyndham Destinations, Inc. | | | 3,190 | | | | 84,854 | |
Wyndham Hotels & Resorts, Inc. | | | 2,060 | | | | 90,970 | |
| | | | | | | | |
| | |
| | | | | | | 541,244 | |
See Notes to Financial Statements.
| | | | |
| PGIM Day One Underlying Funds | | | 95 | |
PGIM QMA Mid-Cap Core Equity Fund
Schedule of Investments (continued)
as of July 31, 2020
| | | | | | | | |
| | |
| Description | | Shares | | | Value | |
| | |
COMMON STOCKS (Continued) | | | | | | | | |
| | |
Household Durables 0.8% | | | | | | | | |
PulteGroup, Inc. | | | 2,100 | | | $ | 91,560 | |
Taylor Morrison Home Corp.* | | | 2,340 | | | | 54,873 | |
Tempur Sealy International, Inc.* | | | 200 | | | | 16,190 | |
| | | | | | | | |
| | |
| | | | | | | 162,623 | |
| | |
Independent Power & Renewable Electricity Producers 0.8% | | | | | | | | |
AES Corp. (The) | | | 6,500 | | | | 98,995 | |
Vistra Corp. | | | 3,100 | | | | 57,846 | |
| | | | | | | | |
| | |
| | | | | | | 156,841 | |
| | |
Insurance 3.9% | | | | | | | | |
Alleghany Corp. | | | 270 | | | | 141,027 | |
American Financial Group, Inc. | | | 2,670 | | | | 162,256 | |
Brighthouse Financial, Inc.* | | | 3,100 | | | | 87,854 | |
CNO Financial Group, Inc. | | | 1,400 | | | | 21,140 | |
Hanover Insurance Group, Inc. (The) | | | 1,590 | | | | 161,989 | |
Lincoln National Corp. | | | 300 | | | | 11,181 | |
Mercury General Corp. | | | 600 | | | | 25,746 | |
Old Republic International Corp. | | | 9,790 | | | | 157,325 | |
Reinsurance Group of America, Inc. | | | 440 | | | | 37,510 | |
| | | | | | | | |
| | |
| | | | | | | 806,028 | |
| | |
Internet & Direct Marketing Retail 2.0% | | | | | | | | |
Etsy, Inc.* | | | 2,360 | | | | 279,377 | |
Stamps.com, Inc.* | | | 500 | | | | 130,140 | |
| | | | | | | | |
| | |
| | | | | | | 409,517 | |
| | |
IT Services 2.6% | | | | | | | | |
CACI International, Inc. (Class A Stock)* | | | 820 | | | | 170,413 | |
KBR, Inc. | | | 3,310 | | | | 73,614 | |
MAXIMUS, Inc. | | | 700 | | | | 51,947 | |
Perspecta, Inc. | | | 6,420 | | | | 137,388 | |
Science Applications International Corp. | | | 1,430 | | | | 114,371 | |
| | | | | | | | |
| | |
| | | | | | | 547,733 | |
See Notes to Financial Statements.
PGIM QMA Mid-Cap Core Equity Fund
Schedule of Investments (continued)
as of July 31, 2020
| | | | | | | | |
| | |
| Description | | Shares | | | Value | |
| | |
COMMON STOCKS (Continued) | | | | | | | | |
| | |
Leisure Products 1.0% | | | | | | | | |
Brunswick Corp. | | | 2,940 | | | $ | 196,921 | |
Smith & Wesson Brands, Inc.* | | | 600 | | | | 14,334 | |
| | | | | | | | |
| | |
| | | | | | | 211,255 | |
| | |
Life Sciences Tools & Services 2.8% | | | | | | | | |
Bio-Techne Corp. | | | 850 | | | | 233,886 | |
Charles River Laboratories International, Inc.* | | | 750 | | | | 149,243 | |
PRA Health Sciences, Inc.* | | | 1,890 | | | | 201,398 | |
| | | | | | | | |
| | |
| | | | | | | 584,527 | |
| | |
Machinery 5.0% | | | | | | | | |
AGCO Corp. | | | 2,580 | | | | 169,325 | |
Allison Transmission Holdings, Inc. | | | 2,800 | | | | 104,608 | |
Crane Co. | | | 1,980 | | | | 112,009 | |
Donaldson Co., Inc. | | | 3,800 | | | | 183,692 | |
Gates Industrial Corp. PLC* | | | 1,490 | | | | 15,705 | |
Graco, Inc. | | | 310 | | | | 16,504 | |
ITT, Inc. | | | 1,340 | | | | 77,358 | |
Lincoln Electric Holdings, Inc. | | | 500 | | | | 45,195 | |
Nordson Corp. | | | 460 | | | | 89,070 | |
Oshkosh Corp. | | | 2,310 | | | | 181,843 | |
Timken Co. (The) | | | 1,200 | | | | 54,792 | |
| | | | | | | | |
| | |
| | | | | | | 1,050,101 | |
| | |
Media 0.6% | | | | | | | | |
AMC Networks, Inc. (Class A Stock)* | | | 700 | | | | 16,170 | |
Nexstar Media Group, Inc. (Class A Stock) | | | 500 | | | | 43,825 | |
TEGNA, Inc. | | | 4,900 | | | | 57,722 | |
| | | | | | | | |
| | |
| | | | | | | 117,717 | |
| | |
Metals & Mining 2.7% | | | | | | | | |
Reliance Steel & Aluminum Co. | | | 1,330 | | | | 130,686 | |
Royal Gold, Inc. | | | 1,620 | | | | 226,686 | |
Steel Dynamics, Inc. | | | 6,480 | | | | 177,617 | |
Worthington Industries, Inc. | | | 500 | | | | 18,710 | |
| | | | | | | | |
| | |
| | | | | | | 553,699 | |
See Notes to Financial Statements.
| | | | |
| PGIM Day One Underlying Funds | | | 97 | |
PGIM QMA Mid-Cap Core Equity Fund
Schedule of Investments (continued)
as of July 31, 2020
| | | | | | | | |
| | |
| Description | | Shares | | | Value | |
| | |
COMMON STOCKS (Continued) | | | | | | | | |
| | |
Mortgage Real Estate Investment Trusts (REITs) 0.7% | | | | | | | | |
Annaly Capital Management, Inc. | | | 8,300 | | | $ | 61,503 | |
Ladder Capital Corp. | | | 17 | | | | 132 | |
Starwood Property Trust, Inc. | | | 5,400 | | | | 80,730 | |
| | | | | | | | |
| | |
| | | | | | | 142,365 | |
| | |
Multiline Retail 0.0% | | | | | | | | |
Ollie’s Bargain Outlet Holdings, Inc.* | | | 80 | | | | 8,408 | |
| | |
Multi-Utilities 0.7% | | | | | | | | |
MDU Resources Group, Inc. | | | 7,360 | | | | 154,413 | |
| | |
Oil, Gas & Consumable Fuels 0.9% | | | | | | | | |
Cimarex Energy Co. | | | 3,600 | | | | 88,056 | |
World Fuel Services Corp. | | | 4,020 | | | | 94,591 | |
| | | | | | | | |
| | |
| | | | | | | 182,647 | |
| | |
Personal Products 0.8% | | | | | | | | |
Edgewell Personal Care Co.* | | | 1,890 | | | | 56,492 | |
Nu Skin Enterprises, Inc. (Class A Stock) | | | 2,530 | | | | 113,471 | |
| | | | | | | | |
| | |
| | | | | | | 169,963 | |
| | |
Pharmaceuticals 0.9% | | | | | | | | |
Jazz Pharmaceuticals PLC* | | | 520 | | | | 56,290 | |
Prestige Consumer Healthcare, Inc.* | | | 3,400 | | | | 126,446 | |
| | | | | | | | |
| | |
| | | | | | | 182,736 | |
| | |
Professional Services 1.3% | | | | | | | | |
ASGN, Inc.* | | | 2,200 | | | | 150,612 | |
CoreLogic, Inc. | | | 800 | | | | 54,528 | |
Kforce, Inc. | | | 220 | | | | 6,345 | |
ManpowerGroup, Inc. | | | 900 | | | | 61,911 | |
| | | | | | | | |
| | |
| | | | | | | 273,396 | |
| | |
Real Estate Management & Development 0.6% | | | | | | | | |
Jones Lang LaSalle, Inc. | | | 1,320 | | | | 130,561 | |
See Notes to Financial Statements.
PGIM QMA Mid-Cap Core Equity Fund
Schedule of Investments (continued)
as of July 31, 2020
| | | | | | | | |
| | |
| Description | | Shares | | | Value | |
| | |
COMMON STOCKS (Continued) | | | | | | | | |
| | |
Road & Rail 1.3% | | | | | | | | |
Landstar System, Inc. | | | 1,050 | | | $ | 127,869 | |
Werner Enterprises, Inc. | | | 3,000 | | | | 131,955 | |
| | | | | | | | |
| | |
| | | | | | | 259,824 | |
| | |
Semiconductors & Semiconductor Equipment 5.2% | | | | | | | | |
Cabot Microelectronics Corp. | | | 370 | | | | 55,766 | |
Cirrus Logic, Inc.* | | | 2,300 | | | | 157,619 | |
MKS Instruments, Inc. | | | 280 | | | | 35,683 | |
Monolithic Power Systems, Inc. | | | 840 | | | | 222,608 | |
Semtech Corp.* | | | 2,800 | | | | 156,044 | |
SolarEdge Technologies, Inc.* | | | 370 | | | | 64,787 | |
Synaptics, Inc.* | | | 2,080 | | | | 166,442 | |
Teradyne, Inc. | | | 1,690 | | | | 150,342 | |
Universal Display Corp. | | | 430 | | | | 75,014 | |
| | | | | | | | |
| | |
| | | | | | | 1,084,305 | |
| | |
Software 4.3% | | | | | | | | |
CDK Global, Inc. | | | 3,570 | | | | 162,292 | |
J2 Global, Inc.* | | | 2,380 | | | | 134,993 | |
Manhattan Associates, Inc.* | | | 2,110 | | | | 202,117 | |
PTC, Inc.* | | | 2,530 | | | | 216,467 | |
Qualys, Inc.* | | | 750 | | | | 92,610 | |
Teradata Corp.* | | | 3,790 | | | | 79,590 | |
| | | | | | | | |
| | |
| | | | | | | 888,069 | |
| | |
Specialty Retail 2.6% | | | | | | | | |
AutoNation, Inc.* | | | 3,040 | | | | 156,074 | |
Foot Locker, Inc. | | | 350 | | | | 10,286 | |
Murphy USA, Inc.* | | | 1,220 | | | | 161,540 | |
Sally Beauty Holdings, Inc.* | | | 2,600 | | | | 30,186 | |
Williams-Sonoma, Inc. | | | 2,180 | | | | 189,922 | |
| | | | | | | | |
| | |
| | | | | | | 548,008 | |
| | |
Technology Hardware, Storage & Peripherals 0.2% | | | | | | | | |
NCR Corp.* | | | 2,140 | | | | 39,440 | |
| | |
Textiles, Apparel & Luxury Goods 1.0% | | | | | | | | |
Deckers Outdoor Corp.* | | | 960 | | | | 200,880 | |
See Notes to Financial Statements.
| | | | |
| PGIM Day One Underlying Funds | | | 99 | |
PGIM QMA Mid-Cap Core Equity Fund
Schedule of Investments (continued)
as of July 31, 2020
| | | | | | | | |
| | |
| Description | | Shares | | | Value | |
| | |
COMMON STOCKS (Continued) | | | | | | | | |
| | |
Trading Companies & Distributors 0.6% | | | | | | | | |
GMS, Inc.* | | | 870 | | | $ | 20,384 | |
MSC Industrial Direct Co., Inc. (Class A Stock) | | | 1,400 | | | | 92,414 | |
Univar Solutions, Inc.* | | | 800 | | | | 14,136 | |
| | | | | | | | |
| | |
| | | | | | | 126,934 | |
| | |
Wireless Telecommunication Services 0.1% | | | | | | | | |
Telephone & Data Systems, Inc. | | | 1,110 | | | | 21,556 | |
| | | | | | | | |
| | |
TOTAL COMMON STOCKS
(cost $19,635,313) | | | | | | | 20,794,197 | |
| | | | | | | | |
| | |
EXCHANGE-TRADED FUND 2.1% | | | | | | | | |
iShares Core S&P Mid-Cap ETF
(cost $417,762) | | | 2,380 | | | | 442,514 | |
| | | | | | | | |
| | |
TOTAL LONG-TERM INVESTMENTS
(cost $20,053,075) | | | | | | | 21,236,711 | |
| | | | | | | | |
| | |
SHORT-TERM INVESTMENT 0.2% | | | | | | | | |
| | |
AFFILIATED MUTUAL FUND | | | | | | | | |
PGIM Core Ultra Short Bond Fund
(cost $43,980)(w) | | | 43,980 | | | | 43,980 | |
| | | | | | | | |
TOTAL INVESTMENTS 102.2%
(cost $20,097,055) | | | | | | | 21,280,691 | |
Liabilities in excess of other assets (2.2)% | | | | | | | (466,503 | ) |
| | | | | | | | |
| | |
NET ASSETS 100.0% | | | | | | $ | 20,814,188 | |
| | | | | | | | |
See the Glossary for a list of the abbreviation(s) used in the annual report.
| * | Non-income producing security. |
| (w) | PGIM Investments LLC, the manager of the Fund, also serves as manager of the PGIM Core Ultra Short Bond Fund. |
Fair Value Measurements:
Various inputs are used in determining the value of the Fund’s investments. These inputs are summarized in the three broad levels listed below.
Level 1—unadjusted quoted prices generally in active markets for identical securities.
See Notes to Financial Statements.
PGIM QMA Mid-Cap Core Equity Fund
Schedule of Investments (continued)
as of July 31, 2020
Level 2—quoted prices for similar securities, interest rates and yield curves, prepayment speeds, foreign currency exchange rates and other observable inputs.
Level 3—unobservable inputs for securities valued in accordance with Board approved fair valuation procedures.
The following is a summary of the inputs used as of July 31, 2020 in valuing such portfolio securities:
| | | | | | | | | | | | |
| | | Level 1 | | | Level 2 | | | Level 3 | |
Investments in Securities | | | | | | | | | | | | |
Assets | | | | | | | | | | | | |
Common Stocks | | | | | | | | | | | | |
Aerospace & Defense | | $ | 238,888 | | | | $— | | | | $— | |
Auto Components | | | 422,052 | | | | — | | | | — | |
Banks | | | 1,031,598 | | | | — | | | | — | |
Biotechnology | | | 351,583 | | | | — | | | | — | |
Building Products | | | 184,405 | | | | — | | | | — | |
Capital Markets | | | 742,944 | | | | — | | | | — | |
Chemicals | | | 678,724 | | | | — | | | | — | |
Commercial Services & Supplies | | | 222,884 | | | | — | | | | — | |
Communications Equipment | | | 445,494 | | | | — | | | | — | |
Construction & Engineering | | | 391,420 | | | | — | | | | — | |
Consumer Finance | | | 155,646 | | | | — | | | | — | |
Containers & Packaging | | | 186,417 | | | | — | | | | — | |
Distributors | | | 98,177 | | | | — | | | | — | |
Diversified Consumer Services | | | 363,442 | | | | — | | | | — | |
Electric Utilities | | | 254,562 | | | | — | | | | — | |
Electrical Equipment | | | 440,169 | | | | — | | | | — | |
Electronic Equipment, Instruments & Components | | | 612,544 | | | | — | | | | — | |
Energy Equipment & Services | | | 81,103 | | | | — | | | | — | |
Entertainment | | | 91,469 | | | | — | | | | — | |
Equity Real Estate Investment Trusts (REITs) | | | 1,749,547 | | | | — | | | | — | |
Food & Staples Retailing | | | 301,381 | | | | — | | | | — | |
Food Products | | | 450,665 | | | | — | | | | — | |
Gas Utilities | | | 338,944 | | | | — | | | | — | |
Health Care Equipment & Supplies | | | 904,390 | | | | — | | | | — | |
Health Care Providers & Services | | | 500,959 | | | | — | | | | — | |
Hotels, Restaurants & Leisure | | | 541,244 | | | | — | | | | — | |
Household Durables | | | 162,623 | | | | — | | | | — | |
Independent Power & Renewable Electricity Producers | | | 156,841 | | | | — | | | | — | |
Insurance | | | 806,028 | | | | — | | | | — | |
Internet & Direct Marketing Retail | | | 409,517 | | | | — | | | | — | |
IT Services | | | 547,733 | | | | — | | | | — | |
Leisure Products | | | 211,255 | | | | — | | | | — | |
Life Sciences Tools & Services | | | 584,527 | | | | — | | | | — | |
Machinery | | | 1,050,101 | | | | — | | | | — | |
Media | | | 117,717 | | | | — | | | | — | |
Metals & Mining | | | 553,699 | | | | — | | | | — | |
Mortgage Real Estate Investment Trusts (REITs) | | | 142,365 | | | | — | | | | — | |
Multiline Retail | | | 8,408 | | | | — | | | | — | |
See Notes to Financial Statements.
| | | | |
| PGIM Day One Underlying Funds | | | 101 | |
PGIM QMA Mid-Cap Core Equity Fund
Schedule of Investments (continued)
as of July 31, 2020
| | | | | | | | | | | | |
| | | Level 1 | | | Level 2 | | | Level 3 | |
Investments in Securities (continued) | | | | | | | | | | | | |
Assets (continued) | | | | | | | | | | | | |
Common Stocks (continued) | | | | | | | | | | | | |
Multi-Utilities | | $ | 154,413 | | | | $— | | | | $— | |
Oil, Gas & Consumable Fuels | | | 182,647 | | | | — | | | | — | |
Personal Products | | | 169,963 | | | | — | | | | — | |
Pharmaceuticals | | | 182,736 | | | | — | | | | — | |
Professional Services | | | 273,396 | | | | — | | | | — | |
Real Estate Management & Development | | | 130,561 | | | | — | | | | — | |
Road & Rail | | | 259,824 | | | | — | | | | — | |
Semiconductors & Semiconductor Equipment | | | 1,084,305 | | | | — | | | | — | |
Software | | | 888,069 | | | | — | | | | — | |
Specialty Retail | | | 548,008 | | | | — | | | | — | |
Technology Hardware, Storage & Peripherals | | | 39,440 | | | | — | | | | — | |
Textiles, Apparel & Luxury Goods | | | 200,880 | | | | — | | | | — | |
Trading Companies & Distributors | | | 126,934 | | | | — | | | | — | |
Wireless Telecommunication Services | | | 21,556 | | | | — | | | | — | |
Exchange-Traded Fund | | | 442,514 | | | | — | | | | — | |
Affiliated Mutual Fund | | | 43,980 | | | | — | | | | — | |
| | | | | | | | | | | | |
Total | | $ | 21,280,691 | | | | $— | | | | $— | |
| | | | | | | | | | | | |
Industry Classification:
The industry classification of investments and liabilities in excess of other assets shown as a percentage of net assets as of July 31, 2020 were as follows (unaudited):
| | | | |
Equity Real Estate Investment Trusts (REITs) | | | 8.4 | % |
Semiconductors & Semiconductor Equipment | | | 5.2 | |
Machinery | | | 5.0 | |
Banks | | | 5.0 | |
Health Care Equipment & Supplies | | | 4.3 | |
Software | | | 4.3 | |
Insurance | | | 3.9 | |
Capital Markets | | | 3.6 | |
Chemicals | | | 3.3 | |
Electronic Equipment, Instruments & Components | | | 2.9 | |
Life Sciences Tools & Services | | | 2.8 | |
Metals & Mining | | | 2.7 | |
Specialty Retail | | | 2.6 | |
IT Services | | | 2.6 | |
Hotels, Restaurants & Leisure | | | 2.6 | |
Health Care Providers & Services | | | 2.4 | |
Food Products | | | 2.2 | |
Communications Equipment | | | 2.1 | |
| | | | |
Exchange-Traded Fund | | | 2.1 | % |
Electrical Equipment | | | 2.1 | |
Auto Components | | | 2.0 | |
Internet & Direct Marketing Retail | | | 2.0 | |
Construction & Engineering | | | 1.9 | |
Diversified Consumer Services | | | 1.7 | |
Biotechnology | | | 1.7 | |
Gas Utilities | | | 1.6 | |
Food & Staples Retailing | | | 1.5 | |
Professional Services | | | 1.3 | |
Road & Rail | | | 1.3 | |
Electric Utilities | | | 1.2 | |
Aerospace & Defense | | | 1.1 | |
Commercial Services & Supplies | | | 1.1 | |
Leisure Products | | | 1.0 | |
Textiles, Apparel & Luxury Goods | | | 1.0 | |
Containers & Packaging | | | 0.9 | |
Building Products | | | 0.9 | |
See Notes to Financial Statements.
PGIM QMA Mid-Cap Core Equity Fund
Schedule of Investments (continued)
as of July 31, 2020
Industry Classification (continued):
| | | | |
Pharmaceuticals | | | 0.9 | % |
Oil, Gas & Consumable Fuels | | | 0.9 | |
Personal Products | | | 0.8 | |
Household Durables | | | 0.8 | |
Independent Power & Renewable Electricity Producers | | | 0.8 | |
Consumer Finance | | | 0.7 | |
Multi-Utilities | | | 0.7 | |
Mortgage Real Estate Investment Trusts (REITs) | | | 0.7 | |
Real Estate Management & Development | | | 0.6 | |
Trading Companies & Distributors | | | 0.6 | |
Media | | | 0.6 | |
Distributors | | | 0.5 | |
Entertainment | | | 0.4 | |
| | | | |
Energy Equipment & Services | | | 0.4 | % |
Affiliated Mutual Fund | | | 0.2 | |
Technology Hardware, Storage & Peripherals | | | 0.2 | |
Wireless Telecommunication Services | | | 0.1 | |
Multiline Retail | | | 0.0 | * |
| | | | |
| | | 102.2 | |
Liabilities in excess of other assets | | | (2.2 | ) |
| | | | |
| | | 100.0 | % |
| | | | |
See Notes to Financial Statements.
| | | | |
| PGIM Day One Underlying Funds | | | 103 | |
PGIM QMA Mid-Cap Core Equity Fund
Statement of Assets & Liabilities
as of July 31, 2020
| | | | |
Assets | | | | |
Investments at value: | | | | |
Unaffiliated investments (cost $20,053,075) | | $ | 21,236,711 | |
Affiliated investments (cost $43,980) | | | 43,980 | |
Receivable for Fund shares sold | | | 47,591 | |
Dividends receivable | | | 9,022 | |
Due from Manager | | | 988 | |
| | | | |
Total Assets | | | 21,338,292 | |
| | | | |
Liabilities | | | | |
Payable for Fund shares reacquired | | | 467,285 | |
Accrued expenses and other liabilities | | | 55,851 | |
Trustees’ fees payable | | | 900 | |
Affiliated transfer agent fee payable | | | 68 | |
| | | | |
Total Liabilities | | | 524,104 | |
| | | | |
| |
Net Assets | | $ | 20,814,188 | |
| | | | |
| |
| | | | | |
Net assets were comprised of: | | | | |
Shares of beneficial interest, at par | | $ | 2,141 | |
Paid-in capital in excess of par | | | 21,881,886 | |
Total distributable earnings (loss) | | | (1,069,839 | ) |
| | | | |
Net assets, July 31, 2020 | | $ | 20,814,188 | |
| | | | |
Class R6 | | | | |
Net asset value, offering price and redemption price per share, ($20,814,188 ÷ 2,141,007 shares of beneficial interest issued and outstanding) | | $ | 9.72 | |
| | | | |
See Notes to Financial Statements.
PGIM QMA Mid-Cap Core Equity Fund
Statement of Operations
Year Ended July 31, 2020
| | | | |
Net Investment Income (Loss) | | | | |
Income | | | | |
Unaffiliated dividend income (net of $4 foreign withholding tax) | | $ | 312,579 | |
Affiliated dividend income | | | 1,978 | |
Affiliated income from securities lending, net | | | 31 | |
| | | | |
Total income | | | 314,588 | |
| | | | |
| |
Expenses | | | | |
Management fee | | | 84,137 | |
Custodian and accounting fees | | | 56,144 | |
Audit fee | | | 24,482 | |
Legal fees and expenses | | | 18,515 | |
Trustees’ fees | | | 10,890 | |
Shareholders’ reports | | | 10,209 | |
Fund data services | | | 5,713 | |
Transfer agent’s fees and expenses (including affiliated expense of $456) | | | 589 | |
SEC registration fees | | | 542 | |
Registration fees | | | 250 | |
Miscellaneous | | | 10,483 | |
| | | | |
Total expenses | | | 221,954 | |
Less: Fee waiver and/or expense reimbursement | | | (78,547 | ) |
| | | | |
Net expenses | | | 143,407 | |
| | | | |
Net investment income (loss) | | | 171,181 | |
| | | | |
Realized And Unrealized Gain (Loss) On Investments | | | | |
Net realized gain (loss) on investment transactions (including affiliated of $(5)) | | | (1,792,623 | ) |
Net change in unrealized appreciation (depreciation) on investments | | | 353,492 | |
| | | | |
Net gain (loss) on investment transactions | | | (1,439,131 | ) |
| | | | |
Net Increase (Decrease) In Net Assets Resulting From Operations | | $ | (1,267,950 | ) |
| | | | |
See Notes to Financial Statements.
| | | | |
| PGIM Day One Underlying Funds | | | 105 | |
PGIM QMA Mid-Cap Core Equity Fund
Statements of Changes in Net Assets
| | | | | | | | |
| | | Year Ended July 31, | |
| | | 2020 | | | 2019 | |
Increase (Decrease) in Net Assets | | | | | | | | |
Operations | | | | | | | | |
Net investment income (loss) | | $ | 171,181 | | | $ | 139,006 | |
Net realized gain (loss) on investment transactions | | | (1,792,623 | ) | | | (295,271 | ) |
Net change in unrealized appreciation (depreciation) on investments | | | 353,492 | | | | (115,107 | ) |
| | | | | | | | |
Net increase (decrease) in net assets resulting from operations | | | (1,267,950 | ) | | | (271,372 | ) |
| | | | | | | | |
Dividends and Distributions | | | | | | | | |
Distributions from distributable earnings | | | | | | | | |
Class R6 | | | (170,308 | ) | | | (771,564 | ) |
| | | | | | | | |
Fund share transactions | | | | | | | | |
Net proceeds from shares sold | | | 14,514,549 | | | | 5,930,832 | |
Net asset value of shares issued in reinvestment of dividends and distributions | | | 170,308 | | | | 771,564 | |
Cost of shares reacquired | | | (7,792,793 | ) | | | (2,480,643 | ) |
| | | | | | | | |
Net increase (decrease) in net assets from Fund share transactions | | | 6,892,064 | | | | 4,221,753 | |
| | | | | | | | |
Total increase (decrease) | | | 5,453,806 | | | | 3,178,817 | |
| | |
Net Assets: | | | | | | | | |
Beginning of year | | | 15,360,382 | | | | 12,181,565 | |
| | | | | | | | |
End of year | | $ | 20,814,188 | | | $ | 15,360,382 | |
| | | | | | | | |
See Notes to Financial Statements.
PGIM QMA US Broad Market Index Fund
Schedule of Investments
as of July 31, 2020
| | | | | | | | |
| | |
| Description | | Shares | | | Value | |
| | |
LONG-TERM INVESTMENTS 96.2% | | | | | | | | |
| | |
COMMON STOCKS 92.5% | | | | | | | | |
| | |
Aerospace & Defense 1.5% | | | | | | | | |
AAR Corp. | | | 43 | | | $ | 740 | |
Aerojet Rocketdyne Holdings, Inc.* | | | 130 | | | | 5,363 | |
AeroVironment, Inc.* | | | 54 | | | | 4,134 | |
Axon Enterprise, Inc.* | | | 130 | | | | 10,807 | |
Boeing Co. (The) | | | 1,047 | | | | 165,426 | |
Cubic Corp. | | | 50 | | | | 2,100 | |
Curtiss-Wright Corp. | | | 78 | | | | 6,951 | |
General Dynamics Corp. | | | 453 | | | | 66,473 | |
Hexcel Corp. | | | 150 | | | | 5,595 | |
Howmet Aerospace, Inc. | | | 740 | | | | 10,937 | |
Huntington Ingalls Industries, Inc. | | | 80 | | | | 13,897 | |
Kaman Corp. | | | 46 | | | | 1,817 | |
L3Harris Technologies, Inc. | | | 423 | | | | 71,204 | |
Lockheed Martin Corp. | | | 487 | | | | 184,558 | |
Mercury Systems, Inc.* | | | 110 | | | | 8,517 | |
Moog, Inc. (Class A Stock) | | | 58 | | | | 3,116 | |
National Presto Industries, Inc. | | | 8 | | | | 683 | |
Northrop Grumman Corp. | | | 303 | | | | 98,478 | |
Park Aerospace Corp. | | | 23 | | | | 248 | |
Raytheon Technologies Corp. | | | 2,889 | | | | 163,749 | |
Teledyne Technologies, Inc.* | | | 74 | | | | 22,696 | |
Textron, Inc. | | | 450 | | | | 15,723 | |
TransDigm Group, Inc. | | | 102 | | | | 44,021 | |
Triumph Group, Inc. | | | 40 | | | | 271 | |
| | | | | | | | |
| | |
| | | | | | | 907,504 | |
| | |
Air Freight & Logistics 0.6% | | | | | | | | |
Atlas Air Worldwide Holdings, Inc.* | | | 70 | | | | 3,646 | |
C.H. Robinson Worldwide, Inc. | | | 266 | | | | 24,930 | |
Echo Global Logistics, Inc.* | | | 20 | | | | 501 | |
Expeditors International of Washington, Inc. | | | 330 | | | | 27,888 | |
FedEx Corp. | | | 475 | | | | 79,990 | |
Forward Air Corp. | | | 70 | | | | 3,639 | |
Hub Group, Inc. (Class A Stock)* | | | 60 | | | | 3,174 | |
United Parcel Service, Inc. (Class B Stock) | | | 1,390 | | | | 198,436 | |
XPO Logistics, Inc.* | | | 180 | | | | 13,504 | |
| | | | | | | | |
| | |
| | | | | | | 355,708 | |
| | |
Airlines 0.2% | | | | | | | | |
Alaska Air Group, Inc. | | | 253 | | | | 8,713 | |
See Notes to Financial Statements.
| | | | |
| PGIM Day One Underlying Funds | | | 107 | |
PGIM QMA US Broad Market Index Fund
Schedule of Investments (continued)
as of July 31, 2020
| | | | | | | | |
| | |
| Description | | Shares | | | Value | |
| | |
COMMON STOCKS (Continued) | | | | | | | | |
| | |
Airlines (cont’d.) | | | | | | | | |
Allegiant Travel Co. | | | 23 | | | $ | 2,577 | |
American Airlines Group, Inc. | | | 956 | | | | 10,631 | |
Delta Air Lines, Inc. | | | 1,100 | | | | 27,467 | |
Hawaiian Holdings, Inc. | | | 70 | | | | 832 | |
JetBlue Airways Corp.* | | | 470 | | | | 4,860 | |
SkyWest, Inc. | | | 80 | | | | 2,105 | |
Southwest Airlines Co. | | | 1,040 | | | | 32,125 | |
United Airlines Holdings, Inc.* | | | 490 | | | | 15,376 | |
| | | | | | | | |
| | |
| | | | | | | 104,686 | |
| | |
Auto Components 0.2% | | | | | | | | |
Adient PLC* | | | 120 | | | | 1,997 | |
American Axle & Manufacturing Holdings, Inc.* | | | 120 | | | | 847 | |
Aptiv PLC | | | 520 | | | | 40,430 | |
BorgWarner, Inc. | | | 400 | | | | 14,640 | |
Cooper Tire & Rubber Co. | | | 113 | | | | 3,510 | |
Cooper-Standard Holdings, Inc.* | | | 28 | | | | 300 | |
Dana, Inc. | | | 210 | | | | 2,400 | |
Delphi Technologies PLC* | | | 113 | | | | 1,694 | |
Dorman Products, Inc.* | | | 70 | | | | 5,722 | |
Fox Factory Holding Corp.* | | | 80 | | | | 7,120 | |
Garrett Motion, Inc. (Switzerland)* | | | 99 | | | | 582 | |
Gentex Corp. | | | 490 | | | | 13,225 | |
Gentherm, Inc.* | | | 80 | | | | 3,102 | |
Goodyear Tire & Rubber Co. (The) | | | 340 | | | | 3,063 | |
LCI Industries | | | 47 | | | | 5,913 | |
Lear Corp. | | | 120 | | | | 13,246 | |
Motorcar Parts of America, Inc.* | | | 20 | | | | 333 | |
Standard Motor Products, Inc. | | | 28 | | | | 1,273 | |
Visteon Corp.* | | | 60 | | | | 4,357 | |
| | | | | | | | |
| | |
| | | | | | | 123,754 | |
| | |
Automobiles 0.2% | | | | | | | | |
Ford Motor Co. | | | 7,580 | | | | 50,104 | |
General Motors Co. | | | 2,440 | | | | 60,731 | |
Harley-Davidson, Inc. | | | 310 | | | | 8,069 | |
Thor Industries, Inc. | | | 114 | | | | 12,995 | |
Winnebago Industries, Inc. | | | 80 | | | | 4,833 | |
| | | | | | | | |
| | |
| | | | | | | 136,732 | |
See Notes to Financial Statements.
PGIM QMA US Broad Market Index Fund
Schedule of Investments (continued)
as of July 31, 2020
| | | | | | | | |
| | |
| Description | | Shares | | | Value | |
| | |
COMMON STOCKS (Continued) | | | | | | | | |
| | |
Banks 3.4% | | | | | | | | |
Allegiance Bancshares, Inc. | | | 30 | | | $ | 732 | |
Ameris Bancorp | | | 106 | | | | 2,446 | |
Associated Banc-Corp. | | | 221 | | | | 2,838 | |
Banc of California, Inc. | | | 30 | | | | 322 | |
BancFirst Corp. | | | 30 | | | | 1,307 | |
BancorpSouth Bank | | | 160 | | | | 3,349 | |
Bank of America Corp. | | | 15,256 | | | | 379,569 | |
Bank of Hawaii Corp. | | | 80 | | | | 4,530 | |
Bank OZK | | | 200 | | | | 4,810 | |
Banner Corp. | | | 50 | | | | 1,771 | |
Berkshire Hills Bancorp, Inc. | | | 55 | | | | 548 | |
Boston Private Financial Holdings, Inc. | | | 70 | | | | 412 | |
Brookline Bancorp, Inc. | | | 63 | | | | 604 | |
Cadence BanCorp | | | 200 | | | | 1,562 | |
Cathay General Bancorp | | | 120 | | | | 2,902 | |
Central Pacific Financial Corp. | | | 20 | | | | 311 | |
CIT Group, Inc. | | | 155 | | | | 2,940 | |
Citigroup, Inc. | | | 4,080 | | | | 204,041 | |
Citizens Financial Group, Inc. | | | 826 | | | | 20,493 | |
City Holding Co. | | | 40 | | | | 2,498 | |
Columbia Banking System, Inc. | | | 115 | | | | 3,327 | |
Comerica, Inc. | | | 287 | | | | 11,055 | |
Commerce Bancshares, Inc. | | | 207 | | | | 11,853 | |
Community Bank System, Inc. | | | 94 | | | | 5,286 | |
Cullen/Frost Bankers, Inc. | | | 130 | | | | 9,368 | |
Customers Bancorp, Inc.* | | | 20 | | | | 237 | |
CVB Financial Corp. | | | 170 | | | | 3,072 | |
Dime Community Bancshares, Inc. | | | 30 | | | | 352 | |
Eagle Bancorp, Inc. | | | 50 | | | | 1,504 | |
East West Bancorp, Inc. | | | 250 | | | | 8,665 | |
Fifth Third Bancorp | | | 1,378 | | | | 27,367 | |
First BanCorp. (Puerto Rico) | | | 300 | | | | 1,632 | |
First Commonwealth Financial Corp. | | | 100 | | | | 787 | |
First Financial Bancorp | | | 165 | | | | 2,296 | |
First Financial Bankshares, Inc. | | | 280 | | | | 8,377 | |
First Hawaiian, Inc. | | | 250 | | | | 4,345 | |
First Horizon National Corp. | | | 1,070 | | | | 9,919 | |
First Midwest Bancorp, Inc. | | | 130 | | | | 1,577 | |
First Republic Bank | | | 338 | | | | 38,018 | |
FNB Corp. | | | 470 | | | | 3,483 | |
Franklin Financial Network, Inc. | | | 30 | | | | 792 | |
Fulton Financial Corp. | | | 250 | | | | 2,425 | |
See Notes to Financial Statements.
| | | | |
| PGIM Day One Underlying Funds | | | 109 | |
PGIM QMA US Broad Market Index Fund
Schedule of Investments (continued)
as of July 31, 2020
| | | | | | | | |
| | |
| Description | | Shares | | | Value | |
| | |
COMMON STOCKS (Continued) | | | | | | | | |
| | |
Banks (cont’d.) | | | | | | | | |
Glacier Bancorp, Inc. | | | 183 | | | $ | 6,462 | |
Great Western Bancorp, Inc. | | | 86 | | | | 1,118 | |
Hancock Whitney Corp. | | | 142 | | | | 2,706 | |
Hanmi Financial Corp. | | | 20 | | | | 185 | |
Heritage Financial Corp. | | | 35 | | | | 662 | |
Home BancShares, Inc. | | | 220 | | | | 3,593 | |
Hope Bancorp, Inc. | | | 170 | | | | 1,433 | |
Huntington Bancshares, Inc. | | | 1,970 | | | | 18,262 | |
Independent Bank Corp. | | | 55 | | | | 3,549 | |
Independent Bank Group, Inc. | | | 60 | | | | 2,636 | |
International Bancshares Corp. | | | 80 | | | | 2,434 | |
JPMorgan Chase & Co. | | | 5,963 | | | | 576,264 | |
KeyCorp | | | 1,890 | | | | 22,699 | |
M&T Bank Corp. | | | 257 | | | | 27,229 | |
National Bank Holdings Corp. (Class A Stock) | | | 53 | | | | 1,472 | |
NBT Bancorp, Inc. | | | 83 | | | | 2,472 | |
OFG Bancorp (Puerto Rico) | | | 40 | | | | 523 | |
Old National Bancorp | | | 230 | | | | 3,218 | |
Pacific Premier Bancorp, Inc. | | | 88 | | | | 1,849 | |
PacWest Bancorp | | | 190 | | | | 3,472 | |
Park National Corp. | | | 30 | | | | 2,573 | |
People’s United Financial, Inc. | | | 830 | | | | 8,956 | |
Pinnacle Financial Partners, Inc. | | | 120 | | | | 4,754 | |
PNC Financial Services Group, Inc. (The) | | | 829 | | | | 88,429 | |
Preferred Bank | | | 20 | | | | 745 | |
Prosperity Bancshares, Inc. | | | 196 | | | | 10,890 | |
Regions Financial Corp. | | | 1,850 | | | | 20,091 | |
S&T Bancorp, Inc. | | | 56 | | | | 1,204 | |
Seacoast Banking Corp. of Florida* | | | 60 | | | | 1,133 | |
ServisFirst Bancshares, Inc. | | | 80 | | | | 2,927 | |
Signature Bank | | | 110 | | | | 11,278 | |
Simmons First National Corp. (Class A Stock) | | | 150 | | | | 2,488 | |
Southside Bancshares, Inc. | | | 61 | | | | 1,690 | |
Sterling Bancorp | | | 315 | | | | 3,544 | |
SVB Financial Group* | | | 104 | | | | 23,324 | |
Synovus Financial Corp. | | | 240 | | | | 4,836 | |
TCF Financial Corp. | | | 261 | | | | 7,175 | |
Texas Capital Bancshares, Inc.* | | | 80 | | | | 2,658 | |
Tompkins Financial Corp. | | | 20 | | | | 1,291 | |
Triumph Bancorp, Inc.* | | | 30 | | | | 786 | |
Truist Financial Corp. | | | 2,615 | | | | 97,958 | |
Trustmark Corp. | | | 90 | | | | 2,027 | |
See Notes to Financial Statements.
PGIM QMA US Broad Market Index Fund
Schedule of Investments (continued)
as of July 31, 2020
| | | | | | | | |
| | |
| Description | | Shares | | | Value | |
| | |
COMMON STOCKS (Continued) | | | | | | | | |
| | |
Banks (cont’d.) | | | | | | | | |
U.S. Bancorp | | | 2,664 | | | $ | 98,142 | |
UMB Financial Corp. | | | 86 | | | | 4,283 | |
Umpqua Holdings Corp. | | | 310 | | | | 3,363 | |
United Bankshares, Inc. | | | 212 | | | | 5,580 | |
United Community Banks, Inc. | | | 100 | | | | 1,793 | |
Valley National Bancorp | | | 578 | | | | 4,318 | |
Veritex Holdings, Inc. | | | 49 | | | | 819 | |
Webster Financial Corp. | | | 140 | | | | 3,818 | |
Wells Fargo & Co. | | | 7,251 | | | | 175,909 | |
Westamerica BanCorp | | | 70 | | | | 4,225 | |
Wintrust Financial Corp. | | | 130 | | | | 5,564 | |
Zions Bancorp NA | | | 294 | | | | 9,546 | |
| | | | | | | | |
| | |
| | | | | | | 2,094,077 | |
| | |
Beverages 1.5% | | | | | | | | |
Boston Beer Co., Inc. (The) (Class A Stock)* | | | 20 | | | | 16,209 | |
Brown-Forman Corp. (Class B Stock) | | | 367 | | | | 25,448 | |
Coca-Cola Co. (The) | | | 7,550 | | | | 356,662 | |
Coca-Cola Consolidated, Inc. | | | 12 | | | | 2,755 | |
Constellation Brands, Inc. (Class A Stock) | | | 328 | | | | 58,449 | |
MGP Ingredients, Inc. | | | 17 | | | | 616 | |
Molson Coors Beverage Co. (Class B Stock) | | | 380 | | | | 14,258 | |
Monster Beverage Corp.* | | | 728 | | | | 57,133 | |
National Beverage Corp.* | | | 20 | | | | 1,283 | |
PepsiCo, Inc. | | | 2,721 | | | | 374,573 | |
| | | | | | | | |
| | |
| | | | | | | 907,386 | |
| | |
Biotechnology 2.1% | | | | | | | | |
AbbVie, Inc. | | | 3,444 | | | | 326,870 | |
Alexion Pharmaceuticals, Inc.* | | | 434 | | | | 44,481 | |
Amgen, Inc. | | | 1,152 | | | | 281,860 | |
Anika Therapeutics, Inc.* | | | 22 | | | | 801 | |
Arrowhead Pharmaceuticals, Inc.* | | | 210 | | | | 9,045 | |
Biogen, Inc.* | | | 322 | | | | 88,450 | |
Coherus Biosciences, Inc.* | | | 100 | | | | 1,759 | |
Cytokinetics, Inc.* | | | 120 | | | | 2,594 | |
Eagle Pharmaceuticals, Inc.* | | | 18 | | | | 835 | |
Emergent BioSolutions, Inc.* | | | 100 | | | | 11,124 | |
Enanta Pharmaceuticals, Inc.* | | | 26 | | | | 1,192 | |
Exelixis, Inc.* | | | 590 | | | | 13,623 | |
See Notes to Financial Statements.
| | | | |
| PGIM Day One Underlying Funds | | | 111 | |
PGIM QMA US Broad Market Index Fund
Schedule of Investments (continued)
as of July 31, 2020
| | | | | | | | |
| | |
| Description | | Shares | | | Value | |
| | |
COMMON STOCKS (Continued) | | | | | | | | |
| | |
Biotechnology (cont’d.) | | | | | | | | |
Gilead Sciences, Inc. | | | 2,454 | | | $ | 170,627 | |
Incyte Corp.* | | | 360 | | | | 35,554 | |
Ligand Pharmaceuticals, Inc.* | | | 31 | | | | 3,632 | |
Momenta Pharmaceuticals, Inc.* | | | 240 | | | | 7,078 | |
Myriad Genetics, Inc.* | | | 90 | | | | 1,086 | |
Regeneron Pharmaceuticals, Inc.* | | | 201 | | | | 127,046 | |
REGENXBIO, Inc.* | | | 50 | | | | 1,655 | |
Spectrum Pharmaceuticals, Inc.* | | | 95 | | | | 284 | |
United Therapeutics Corp.* | | | 100 | | | | 11,147 | |
Vanda Pharmaceuticals, Inc.* | | | 70 | | | | 706 | |
Vertex Pharmaceuticals, Inc.* | | | 510 | | | | 138,720 | |
Xencor, Inc.* | | | 70 | | | | 2,106 | |
| | | | | | | | |
| | |
| | | | | | | 1,282,275 | |
| | |
Building Products 0.5% | | | | | | | | |
A.O. Smith Corp. | | | 260 | | | | 12,516 | |
AAON, Inc. | | | 83 | | | | 4,918 | |
Allegion PLC | | | 196 | | | | 19,494 | |
American Woodmark Corp.* | | | 40 | | | | 3,225 | |
Apogee Enterprises, Inc. | | | 36 | | | | 777 | |
Carrier Global Corp. | | | 1,580 | | | | 43,039 | |
Fortune Brands Home & Security, Inc. | | | 280 | | | | 21,420 | |
Gibraltar Industries, Inc.* | | | 59 | | | | 3,051 | |
Griffon Corp. | | | 25 | | | | 572 | |
Insteel Industries, Inc. | | | 10 | | | | 186 | |
Johnson Controls International PLC | | | 1,440 | | | | 55,411 | |
Lennox International, Inc. | | | 77 | | | | 20,647 | |
Masco Corp. | | | 510 | | | | 29,152 | |
Owens Corning | | | 210 | | | | 12,699 | |
Patrick Industries, Inc. | | | 60 | | | | 3,837 | |
PGT Innovations, Inc.* | | | 50 | | | | 854 | |
Quanex Building Products Corp. | | | 30 | | | | 422 | |
Resideo Technologies, Inc.* | | | 182 | | | | 2,417 | |
Simpson Manufacturing Co., Inc. | | | 80 | | | | 7,725 | |
Trane Technologies PLC | | | 466 | | | | 52,131 | |
Trex Co., Inc.* | | | 114 | | | | 15,884 | |
UFP Industries, Inc. | | | 120 | | | | 6,986 | |
| | | | | | | | |
| | |
| | | | | | | 317,363 | |
See Notes to Financial Statements.
PGIM QMA US Broad Market Index Fund
Schedule of Investments (continued)
as of July 31, 2020
| | | | | | | | |
| | |
| Description | | Shares | | | Value | |
| | |
COMMON STOCKS (Continued) | | | | | | | | |
| | |
Capital Markets 2.4% | | | | | | | | |
Affiliated Managers Group, Inc. | | | 113 | | | $ | 7,773 | |
Ameriprise Financial, Inc. | | | 246 | | | | 37,793 | |
Bank of New York Mellon Corp. (The) | | | 1,568 | | | | 56,213 | |
BlackRock, Inc. | | | 303 | | | | 174,228 | |
Blucora, Inc.* | | | 60 | | | | 707 | |
Brightsphere Investment Group, Inc. | | | 80 | | | | 1,075 | |
Calamos Asset Management, Inc. (Class A Stock)*^ | | | 60 | | | | — | |
Cboe Global Markets, Inc. | | | 226 | | | | 19,820 | |
Charles Schwab Corp. (The) | | | 2,228 | | | | 73,858 | |
CME Group, Inc. | | | 703 | | | | 116,825 | |
Donnelley Financial Solutions, Inc.* | | | 20 | | | | 173 | |
E*TRADE Financial Corp. | | | 435 | | | | 22,085 | |
Eaton Vance Corp. | | | 240 | | | | 8,674 | |
Evercore, Inc. (Class A Stock) | | | 90 | | | | 4,977 | |
FactSet Research Systems, Inc. | | | 77 | | | | 26,665 | |
Federated Hermes, Inc. | | | 140 | | | | 3,690 | |
Franklin Resources, Inc. | | | 530 | | | | 11,156 | |
Goldman Sachs Group, Inc. (The) | | | 613 | | | | 121,349 | |
Greenhill & Co., Inc. | | | 20 | | | | 240 | |
Interactive Brokers Group, Inc. (Class A Stock) | | | 145 | | | | 7,192 | |
Intercontinental Exchange, Inc. | | | 1,084 | | | | 104,910 | |
Invesco Ltd. | | | 600 | | | | 6,024 | |
Janus Henderson Group PLC (United Kingdom) | | | 248 | | | | 5,181 | |
Legg Mason, Inc. | | | 180 | | | | 8,998 | |
MarketAxess Holdings, Inc. | | | 76 | | | | 39,269 | |
Moody’s Corp. | | | 317 | | | | 89,172 | |
Morgan Stanley | | | 2,330 | | | | 113,890 | |
MSCI, Inc. | | | 169 | | | | 63,541 | |
Nasdaq, Inc. | | | 238 | | | | 31,252 | |
Northern Trust Corp. | | | 405 | | | | 31,732 | |
Piper Sandler Cos. | | | 26 | | | | 1,610 | |
Raymond James Financial, Inc. | | | 246 | | | | 17,092 | |
S&P Global, Inc. | | | 471 | | | | 164,968 | |
SEI Investments Co. | | | 240 | | | | 12,559 | |
State Street Corp. | | | 690 | | | | 44,015 | |
Stifel Financial Corp. | | | 150 | | | | 7,272 | |
StoneX Group, Inc.* | | | 50 | | | | 2,624 | |
T. Rowe Price Group, Inc. | | | 450 | | | | 62,145 | |
Virtus Investment Partners, Inc. | | | 14 | | | | 1,903 | |
See Notes to Financial Statements.
| | | | |
| PGIM Day One Underlying Funds | | | 113 | |
PGIM QMA US Broad Market Index Fund
Schedule of Investments (continued)
as of July 31, 2020
| | | | | | | | |
| | |
| Description | | Shares | | | Value | |
| | |
COMMON STOCKS (Continued) | | | | | | | | |
| | |
Capital Markets (cont’d.) | | | | | | | | |
Waddell & Reed Financial, Inc. (Class A Stock) | | | 80 | | | $ | 1,167 | |
WisdomTree Investments, Inc. | | | 90 | | | | 324 | |
| | | | | | | | |
| | |
| | | | | | | 1,504,141 | |
| | |
Chemicals 1.7% | | | | | | | | |
AdvanSix, Inc.* | | | 24 | | | | 299 | |
Air Products & Chemicals, Inc. | | | 440 | | | | 126,117 | |
Albemarle Corp. | | | 211 | | | | 17,399 | |
American Vanguard Corp. | | | 30 | | | | 404 | |
Ashland Global Holdings, Inc. | | | 132 | | | | 9,963 | |
Avient Corp. | | | 137 | | | | 3,274 | |
Balchem Corp. | | | 70 | | | | 7,018 | |
Cabot Corp. | | | 90 | | | | 3,283 | |
Celanese Corp. | | | 230 | | | | 22,356 | |
CF Industries Holdings, Inc. | | | 420 | | | | 13,159 | |
Chemours Co. (The) | | | 258 | | | | 4,781 | |
Corteva, Inc. | | | 1,451 | | | | 41,441 | |
Dow, Inc. | | | 1,441 | | | | 59,167 | |
DuPont de Nemours, Inc. | | | 1,431 | | | | 76,530 | |
Eastman Chemical Co. | | | 270 | | | | 20,150 | |
Ecolab, Inc. | | | 488 | | | | 91,295 | |
Ferro Corp.* | | | 100 | | | | 1,169 | |
FMC Corp. | | | 255 | | | | 27,043 | |
FutureFuel Corp. | | | 30 | | | | 395 | |
GCP Applied Technologies, Inc.* | | | 80 | | | | 1,826 | |
Hawkins, Inc. | | | 10 | | | | 515 | |
HB Fuller Co. | | | 110 | | | | 4,987 | |
Ingevity Corp.* | | | 92 | | | | 5,380 | |
Innospec, Inc. | | | 56 | | | | 4,209 | |
International Flavors & Fragrances, Inc. | | | 213 | | | | 26,827 | |
Koppers Holdings, Inc.* | | | 20 | | | | 503 | |
Kraton Corp.* | | | 52 | | | | 684 | |
Linde PLC (United Kingdom) | | | 1,028 | | | | 251,973 | |
Livent Corp.* | | | 191 | | | | 1,198 | |
LyondellBasell Industries NV (Class A Stock) | | | 500 | | | | 31,260 | |
Minerals Technologies, Inc. | | | 54 | | | | 2,532 | |
Mosaic Co. (The) | | | 670 | | | | 9,025 | |
NewMarket Corp. | | | 15 | | | | 5,622 | |
Olin Corp. | | | 240 | | | | 2,698 | |
PPG Industries, Inc. | | | 463 | | | | 49,842 | |
Quaker Chemical Corp. | | | 30 | | | | 5,820 | |
See Notes to Financial Statements.
PGIM QMA US Broad Market Index Fund
Schedule of Investments (continued)
as of July 31, 2020
| | | | | | | | |
| | |
| Description | | Shares | | | Value | |
| | |
COMMON STOCKS (Continued) | | | | | | | | |
| | |
Chemicals (cont’d.) | | | | | | | | |
Rayonier Advanced Materials, Inc.* | | | 60 | | | $ | 175 | |
RPM International, Inc. | | | 260 | | | | 21,213 | |
Scotts Miracle-Gro Co. (The) | | | 90 | | | | 14,271 | |
Sensient Technologies Corp. | | | 100 | | | | 5,221 | |
Sherwin-Williams Co. (The) | | | 159 | | | | 103,019 | |
Stepan Co. | | | 48 | | | | 5,242 | |
Tredegar Corp. | | | 20 | | | | 318 | |
Trinseo SA | | | 60 | | | | 1,302 | |
Valvoline, Inc. | | | 292 | | | | 5,992 | |
| | | | | | | | |
| | |
| | | | | | | 1,086,897 | |
| | |
Commercial Services & Supplies 0.5% | | | | | | | | |
ABM Industries, Inc. | | | 150 | | | | 5,385 | |
Brady Corp. (Class A Stock) | | | 80 | | | | 3,678 | |
Brink’s Co. (The) | | | 100 | | | | 4,435 | |
Cintas Corp. | | | 166 | | | | 50,111 | |
Clean Harbors, Inc.* | | | 115 | | | | 6,854 | |
Copart, Inc.* | | | 400 | | | | 37,300 | |
Deluxe Corp. | | | 70 | | | | 1,976 | |
Harsco Corp.* | | | 90 | | | | 1,436 | |
Healthcare Services Group, Inc. | | | 100 | | | | 2,619 | |
Herman Miller, Inc. | | | 96 | | | | 2,249 | |
HNI Corp. | | | 50 | | | | 1,485 | |
IAA, Inc.* | | | 250 | | | | 10,838 | |
Interface, Inc. | | | 60 | | | | 479 | |
KAR Auction Services, Inc. | | | 210 | | | | 3,177 | |
Matthews International Corp. (Class A Stock) | | | 40 | | | | 864 | |
MSA Safety, Inc. | | | 83 | | | | 9,838 | |
Pitney Bowes, Inc. | | | 210 | | | | 701 | |
Republic Services, Inc. | | | 410 | | | | 35,773 | |
Rollins, Inc. | | | 290 | | | | 15,196 | |
RR Donnelley & Sons Co. | | | 30 | | | | 34 | |
Stericycle, Inc.* | | | 196 | | | | 11,845 | |
Team, Inc.* | | | 20 | | | | 79 | |
Tetra Tech, Inc. | | | 120 | | | | 10,638 | |
UniFirst Corp. | | | 30 | | | | 5,594 | |
US Ecology, Inc. | | | 30 | | | | 1,040 | |
Viad Corp. | | | 30 | | | | 434 | |
Waste Management, Inc. | | | 757 | | | | 82,967 | |
| | | | | | | | |
| | |
| | | | | | | 307,025 | |
See Notes to Financial Statements.
| | | | |
| PGIM Day One Underlying Funds | | | 115 | |
PGIM QMA US Broad Market Index Fund
Schedule of Investments (continued)
as of July 31, 2020
| | | | | | | | |
| | |
| Description | | Shares | | | Value | |
| | |
COMMON STOCKS (Continued) | | | | | | | | |
| | |
Communications Equipment 0.9% | | | | | | | | |
ADTRAN, Inc. | | | 20 | | | $ | 248 | |
Applied Optoelectronics, Inc.* | | | 20 | | | | 284 | |
Arista Networks, Inc.* | | | 106 | | | | 27,536 | |
CalAmp Corp.* | | | 30 | | | | 236 | |
Ciena Corp.* | | | 316 | | | | 18,805 | |
Cisco Systems, Inc. | | | 8,276 | | | | 389,800 | |
Comtech Telecommunications Corp. | | | 32 | | | | 525 | |
Digi International, Inc.* | | | 30 | | | | 364 | |
Extreme Networks, Inc.* | | | 120 | | | | 546 | |
F5 Networks, Inc.* | | | 128 | | | | 17,395 | |
Harmonic, Inc.* | | | 50 | | | | 279 | |
InterDigital, Inc. | | | 60 | | | | 3,601 | |
Juniper Networks, Inc. | | | 640 | | | | 16,243 | |
Lumentum Holdings, Inc.* | | | 150 | | | | 13,925 | |
Motorola Solutions, Inc. | | | 333 | | | | 46,553 | |
NETGEAR, Inc.* | | | 50 | | | | 1,538 | |
NetScout Systems, Inc.* | | | 100 | | | | 2,546 | |
Plantronics, Inc. | | | 52 | | | | 1,040 | |
ViaSat, Inc.* | | | 95 | | | | 3,606 | |
Viavi Solutions, Inc.* | | | 360 | | | | 4,979 | |
| | | | | | | | |
| | |
| | | | | | | 550,049 | |
| | |
Construction & Engineering 0.1% | | | | | | | | |
AECOM* | | | 324 | | | | 11,726 | |
Aegion Corp.* | | | 20 | | | | 308 | |
Arcosa, Inc. | | | 113 | | | | 4,771 | |
Comfort Systems USA, Inc. | | | 57 | | | | 2,833 | |
Dycom Industries, Inc.* | | | 48 | | | | 2,056 | |
EMCOR Group, Inc. | | | 100 | | | | 6,850 | |
Fluor Corp. | | | 200 | | | | 2,038 | |
Granite Construction, Inc. | | | 60 | | | | 1,018 | |
Jacobs Engineering Group, Inc. | | | 260 | | | | 22,191 | |
MasTec, Inc.* | | | 110 | | | | 4,376 | |
MYR Group, Inc.* | | | 20 | | | | 733 | |
Quanta Services, Inc. | | | 250 | | | | 9,992 | |
Valmont Industries, Inc. | | | 55 | | | | 6,666 | |
| | | | | | | | |
| | |
| | | | | | | 75,558 | |
| | |
Construction Materials 0.1% | | | | | | | | |
Eagle Materials, Inc. | | | 93 | | | | 7,461 | |
See Notes to Financial Statements.
PGIM QMA US Broad Market Index Fund
Schedule of Investments (continued)
as of July 31, 2020
| | | | | | | | |
| | |
| �� Description | | Shares | | | Value | |
| | |
COMMON STOCKS (Continued) | | | | | | | | |
| | |
Construction Materials (cont’d.) | | | | | | | | |
Martin Marietta Materials, Inc. | | | 125 | | | $ | 25,898 | |
U.S. Concrete, Inc.* | | | 20 | | | | 496 | |
Vulcan Materials Co. | | | 266 | | | | 31,234 | |
| | | | | | | | |
| | |
| | | | | | | 65,089 | |
| | |
Consumer Finance 0.4% | | | | | | | | |
American Express Co. | | | 1,286 | | | | 120,010 | |
Capital One Financial Corp. | | | 885 | | | | 56,463 | |
Discover Financial Services | | | 594 | | | | 29,361 | |
Encore Capital Group, Inc.* | | | 50 | | | | 1,827 | |
Enova International, Inc.* | | | 40 | | | | 644 | |
EZCORP, Inc. (Class A Stock)* | | | 40 | | | | 229 | |
FirstCash, Inc. | | | 82 | | | | 4,726 | |
Green Dot Corp. (Class A Stock)* | | | 110 | | | | 5,576 | |
LendingTree, Inc.* | | | 19 | | | | 6,580 | |
Navient Corp. | | | 270 | | | | 2,149 | |
PRA Group, Inc.* | | | 100 | | | | 3,956 | |
SLM Corp. | | | 620 | | | | 4,197 | |
Synchrony Financial | | | 1,040 | | | | 23,015 | |
World Acceptance Corp.* | | | 10 | | | | 743 | |
| | | | | | | | |
| | |
| | | | | | | 259,476 | |
| | |
Containers & Packaging 0.3% | | | | | | | | |
Amcor PLC | | | 3,055 | | | | 31,467 | |
AptarGroup, Inc. | | | 130 | | | | 14,976 | |
Avery Dennison Corp. | | | 160 | | | | 18,134 | |
Ball Corp. | | | 640 | | | | 47,123 | |
Greif, Inc. (Class A Stock) | | | 40 | | | | 1,392 | |
International Paper Co. | | | 760 | | | | 26,440 | |
Myers Industries, Inc. | | | 35 | | | | 527 | |
O-I Glass, Inc. | | | 230 | | | | 2,401 | |
Packaging Corp. of America | | | 198 | | | | 19,032 | |
Sealed Air Corp. | | | 310 | | | | 11,061 | |
Silgan Holdings, Inc. | | | 160 | | | | 6,120 | |
Sonoco Products Co. | | | 200 | | | | 10,348 | |
Westrock Co. | | | 500 | | | | 13,430 | |
| | | | | | | | |
| | |
| | | | | | | 202,451 | |
See Notes to Financial Statements.
| | | | |
| PGIM Day One Underlying Funds | | | 117 | |
PGIM QMA US Broad Market Index Fund
Schedule of Investments (continued)
as of July 31, 2020
| | | | | | | | |
| | |
| Description | | Shares | | | Value | |
| | |
COMMON STOCKS (Continued) | | | | | | | | |
| | |
Distributors 0.1% | | | | | | | | |
Core-Mark Holding Co., Inc. | | | 60 | | | $ | 1,591 | |
Genuine Parts Co. | | | 282 | | | | 25,423 | |
LKQ Corp.* | | | 590 | | | | 16,632 | |
Pool Corp. | | | 87 | | | | 27,553 | |
| | | | | | | | |
| | |
| | | | | | | 71,199 | |
| | |
Diversified Consumer Services 0.1% | | | | | | | | |
Adtalem Global Education, Inc.* | | | 90 | | | | 3,091 | |
American Public Education, Inc.* | | | 20 | | | | 582 | |
Graham Holdings Co. (Class B Stock) | | | 12 | | | | 4,780 | |
Grand Canyon Education, Inc.* | | | 100 | | | | 8,874 | |
H&R Block, Inc. | | | 310 | | | | 4,495 | |
Perdoceo Education Corp.* | | | 90 | | | | 1,296 | |
Regis Corp.* | | | 30 | | | | 230 | |
Service Corp. International | | | 360 | | | | 15,610 | |
Strategic Education, Inc. | | | 49 | | | | 6,184 | |
WW International, Inc.* | | | 70 | | | | 1,805 | |
| | | | | | | | |
| | |
| | | | | | | 46,947 | |
| | |
Diversified Financial Services 1.2% | | | | | | | | |
Berkshire Hathaway, Inc. (Class B Stock)* | | | 3,805 | | | | 744,943 | |
Jefferies Financial Group, Inc. | | | 366 | | | | 5,929 | |
| | | | | | | | |
| | |
| | | | | | | 750,872 | |
| | |
Diversified Telecommunication Services 1.5% | | | | | | | | |
AT&T, Inc. | | | 13,892 | | | | 410,925 | |
ATN International, Inc. | | | 20 | | | | 1,153 | |
CenturyLink, Inc. | | | 1,918 | | | | 18,509 | |
Cincinnati Bell, Inc.* | | | 40 | | | | 600 | |
Cogent Communications Holdings, Inc. | | | 90 | | | | 8,110 | |
Consolidated Communications Holdings, Inc.* | | | 60 | | | | 438 | |
Iridium Communications, Inc.* | | | 190 | | | | 5,204 | |
Verizon Communications, Inc. | | | 8,104 | | | | 465,818 | |
Vonage Holdings Corp.* | | | 340 | | | | 4,063 | |
| | | | | | | | |
| | |
| | | | | | | 914,820 | |
| | |
Electric Utilities 1.7% | | | | | | | | |
ALLETE, Inc. | | | 100 | | | | 5,930 | |
Alliant Energy Corp. | | | 490 | | | | 26,386 | |
See Notes to Financial Statements.
PGIM QMA US Broad Market Index Fund
Schedule of Investments (continued)
as of July 31, 2020
| | | | | | | | |
| | |
| Description | | Shares | | | Value | |
| | |
COMMON STOCKS (Continued) | | | | | | | | |
| | |
Electric Utilities (cont’d.) | | | | | | | | |
American Electric Power Co., Inc. | | | 966 | | | $ | 83,926 | |
Duke Energy Corp. | | | 1,448 | | | | 122,704 | |
Edison International | | | 740 | | | | 41,196 | |
Entergy Corp. | | | 390 | | | | 41,001 | |
Evergy, Inc. | | | 441 | | | | 28,590 | |
Eversource Energy | | | 658 | | | | 59,266 | |
Exelon Corp. | | | 1,892 | | | | 73,050 | |
FirstEnergy Corp. | | | 1,050 | | | | 30,450 | |
Hawaiian Electric Industries, Inc. | | | 190 | | | | 6,889 | |
IDACORP, Inc. | | | 100 | | | | 9,325 | |
NextEra Energy, Inc. | | | 957 | | | | 268,630 | |
NRG Energy, Inc. | | | 470 | | | | 15,891 | |
OGE Energy Corp. | | | 403 | | | | 13,259 | |
Pinnacle West Capital Corp. | | | 222 | | | | 18,444 | |
PNM Resources, Inc. | | | 140 | | | | 5,912 | |
PPL Corp. | | | 1,494 | | | | 39,770 | |
Southern Co. (The) | | | 2,056 | | | | 112,278 | |
Xcel Energy, Inc. | | | 1,020 | | | | 70,421 | |
| | | | | | | | |
| | |
| | | | | | | 1,073,318 | |
| | |
Electrical Equipment 0.5% | | | | | | | | |
Acuity Brands, Inc. | | | 93 | | | | 9,216 | |
AMETEK, Inc. | | | 450 | | | | 41,962 | |
AZZ, Inc. | | | 30 | | | | 947 | |
Eaton Corp. PLC | | | 778 | | | | 72,455 | |
Emerson Electric Co. | | | 1,160 | | | | 71,932 | |
Encore Wire Corp. | | | 42 | | | | 2,108 | |
EnerSys | | | 95 | | | | 6,390 | |
Generac Holdings, Inc.* | | | 120 | | | | 18,910 | |
Hubbell, Inc. | | | 116 | | | | 15,657 | |
nVent Electric PLC | | | 240 | | | | 4,358 | |
Powell Industries, Inc. | | | 10 | | | | 266 | |
Regal Beloit Corp. | | | 90 | | | | 8,277 | |
Rockwell Automation, Inc. | | | 230 | | | | 50,172 | |
Sunrun, Inc.* | | | 160 | | | | 5,870 | |
Vicor Corp.* | | | 50 | | | | 4,074 | |
| | | | | | | | |
| | |
| | | | | | | 312,594 | |
| | |
Electronic Equipment, Instruments & Components 0.7% | | | | | | | | |
Amphenol Corp. (Class A Stock) | | | 582 | | | | 61,552 | |
See Notes to Financial Statements.
| | | | |
| PGIM Day One Underlying Funds | | | 119 | |
PGIM QMA US Broad Market Index Fund
Schedule of Investments (continued)
as of July 31, 2020
| | | | | | | | |
| | |
| Description | | Shares | | | Value | |
| | |
COMMON STOCKS (Continued) | | | | | | | | |
| | |
Electronic Equipment, Instruments & Components (cont’d.) | | | | | | | | |
Arlo Technologies, Inc.* | | | 99 | | | $ | 418 | |
Arrow Electronics, Inc.* | | | 150 | | | | 10,743 | |
Avnet, Inc. | | | 180 | | | | 4,810 | |
Badger Meter, Inc. | | | 60 | | | | 3,756 | |
Bel Fuse, Inc. (Class B Stock) | | | 20 | | | | 244 | |
Belden, Inc. | | | 60 | | | | 1,896 | |
Benchmark Electronics, Inc. | | | 50 | | | | 1,018 | |
CDW Corp. | | | 280 | | | | 32,550 | |
Cognex Corp. | | | 340 | | | | 22,736 | |
Coherent, Inc.* | | | 60 | | | | 8,330 | |
Corning, Inc. | | | 1,470 | | | | 45,570 | |
CTS Corp. | | | 40 | | | | 794 | |
Daktronics, Inc. | | | 50 | | | | 208 | |
ePlus, Inc.* | | | 36 | | | | 2,683 | |
Fabrinet (Thailand)* | | | 90 | | | | 6,537 | |
FARO Technologies, Inc.* | | | 40 | | | | 2,393 | |
FLIR Systems, Inc. | | | 260 | | | | 10,832 | |
II-VI, Inc.* | | | 187 | | | | 9,485 | |
Insight Enterprises, Inc.* | | | 60 | | | | 2,990 | |
IPG Photonics Corp.* | | | 72 | | | | 12,889 | |
Itron, Inc.* | | | 70 | | | | 4,869 | |
Jabil, Inc. | | | 250 | | | | 8,715 | |
Keysight Technologies, Inc.* | | | 365 | | | | 36,460 | |
Knowles Corp.* | | | 130 | | | | 1,984 | |
Littelfuse, Inc. | | | 51 | | | | 9,060 | |
Methode Electronics, Inc. | | | 66 | | | | 1,861 | |
MTS Systems Corp. | | | 40 | | | | 742 | |
National Instruments Corp. | | | 230 | | | | 8,165 | |
OSI Systems, Inc.* | | | 26 | | | | 1,845 | |
PC Connection, Inc. | | | 20 | | | | 874 | |
Plexus Corp.* | | | 57 | | | | 4,235 | |
Rogers Corp.* | | | 52 | | | | 6,198 | |
Sanmina Corp.* | | | 110 | | | | 3,265 | |
ScanSource, Inc.* | | | 40 | | | | 918 | |
SYNNEX Corp. | | | 91 | | | | 11,351 | |
TE Connectivity Ltd. | | | 644 | | | | 57,361 | |
Trimble, Inc.* | | | 490 | | | | 21,810 | |
TTM Technologies, Inc.* | | | 150 | | | | 1,846 | |
Vishay Intertechnology, Inc. | | | 220 | | | | 3,452 | |
Zebra Technologies Corp. (Class A Stock)* | | | 108 | | | | 30,321 | |
| | | | | | | | |
| | |
| | | | | | | 457,766 | |
See Notes to Financial Statements.
PGIM QMA US Broad Market Index Fund
Schedule of Investments (continued)
as of July 31, 2020
| | | | | | | | |
| | |
| Description | | Shares | | | Value | |
| | |
COMMON STOCKS (Continued) | | | | | | | | |
| | |
Energy Equipment & Services 0.2% | | | | | | | | |
Archrock, Inc. | | | 110 | | | $ | 733 | |
Baker Hughes Co. | | | 1,270 | | | | 19,672 | |
Bristow Group, Inc.* | | | 10 | | | | 160 | |
ChampionX Corp.* | | | 306 | | | | 2,910 | |
Core Laboratories NV | | | 65 | | | | 1,386 | |
DMC Global, Inc. | | | 20 | | | | 588 | |
Dril-Quip, Inc.* | | | 50 | | | | 1,665 | |
Exterran Corp.* | | | 18 | | | | 90 | |
Geospace Technologies Corp.* | | | 20 | | | | 151 | |
Halliburton Co. | | | 1,704 | | | | 24,418 | |
Helix Energy Solutions Group, Inc.* | | | 140 | | | | 587 | |
Helmerich & Payne, Inc. | | | 180 | | | | 3,209 | |
Matrix Service Co.* | | | 40 | | | | 350 | |
Nabors Industries Ltd. | | | 8 | | | | 339 | |
National Oilwell Varco, Inc. | | | 750 | | | | 8,633 | |
Newpark Resources, Inc.* | | | 60 | | | | 113 | |
Oceaneering International, Inc.* | | | 120 | | | | 674 | |
Oil States International, Inc.* | | | 70 | | | | 314 | |
Patterson-UTI Energy, Inc. | | | 260 | | | | 1,008 | |
ProPetro Holding Corp.* | | | 85 | | | | 456 | |
RPC, Inc.* | | | 90 | | | | 267 | |
Schlumberger Ltd. | | | 2,693 | | | | 48,851 | |
SEACOR Holdings, Inc.* | | | 25 | | | | 727 | |
TechnipFMC PLC (United Kingdom) | | | 660 | | | | 5,300 | |
Transocean Ltd.* | | | 830 | | | | 1,693 | |
US Silica Holdings, Inc. | | | 80 | | | | 282 | |
Valaris PLC (Saudi Arabia)*(a) | | | 257 | | | | 101 | |
| | | | | | | | |
| | |
| | | | | | | 124,677 | |
| | |
Entertainment 1.8% | | | | | | | | |
Activision Blizzard, Inc. | | | 1,502 | | | | 124,110 | |
Cinemark Holdings, Inc. | | | 165 | | | | 1,952 | |
Electronic Arts, Inc.* | | | 569 | | | | 80,582 | |
Glu Mobile, Inc.* | | | 190 | | | | 1,794 | |
Live Nation Entertainment, Inc.* | | | 280 | | | | 13,107 | |
Marcus Corp. (The) | | | 20 | | | | 276 | |
Netflix, Inc.* | | | 863 | | | | 421,903 | |
Take-Two Interactive Software, Inc.* | | | 230 | | | | 37,724 | |
See Notes to Financial Statements.
| | | | |
| PGIM Day One Underlying Funds | | | 121 | |
PGIM QMA US Broad Market Index Fund
Schedule of Investments (continued)
as of July 31, 2020
| | | | | | | | |
| | |
| Description | | Shares | | | Value | |
| | |
COMMON STOCKS (Continued) | | | | | | | | |
| | |
Entertainment (cont’d.) | | | | | | | | |
Walt Disney Co. (The) | | | 3,533 | | | $ | 413,149 | |
World Wrestling Entertainment, Inc. (Class A Stock) | | | 80 | | | | 3,729 | |
| | | | | | | | |
| | |
| | | | | | | 1,098,326 | |
| | |
Equity Real Estate Investment Trusts (REITs) 3.0% | | | | | | | | |
Acadia Realty Trust | | | 110 | | | | 1,324 | |
Agree Realty Corp. | | | 110 | | | | 7,367 | |
Alexander & Baldwin, Inc. | | | 82 | | | | 969 | |
Alexandria Real Estate Equities, Inc. | | | 248 | | | | 44,032 | |
American Assets Trust, Inc. | | | 70 | | | | 1,890 | |
American Campus Communities, Inc. | | | 280 | | | | 9,979 | |
American Tower Corp. | | | 873 | | | | 228,193 | |
Apartment Investment & Management Co. (Class A Stock) | | | 289 | | | | 11,219 | |
Armada Hoffler Properties, Inc. | | | 35 | | | | 337 | |
AvalonBay Communities, Inc. | | | 279 | | | | 42,720 | |
Boston Properties, Inc. | | | 284 | | | | 25,302 | |
Brandywine Realty Trust | | | 300 | | | | 3,249 | |
Brixmor Property Group, Inc. | | | 480 | | | | 5,525 | |
Camden Property Trust | | | 196 | | | | 17,799 | |
CareTrust REIT, Inc. | | | 130 | | | | 2,343 | |
Chatham Lodging Trust | | | 25 | | | | 130 | |
Community Healthcare Trust, Inc. | | | 60 | | | | 2,744 | |
CoreCivic, Inc. | | | 140 | | | | 1,247 | |
CoreSite Realty Corp. | | | 91 | | | | 11,744 | |
Corporate Office Properties Trust | | | 180 | | | | 4,766 | |
Cousins Properties, Inc. | | | 295 | | | | 9,062 | |
Crown Castle International Corp. | | | 816 | | | | 136,027 | |
CyrusOne, Inc. | | | 230 | | | | 19,187 | |
DiamondRock Hospitality Co. | | | 250 | | | | 1,155 | |
Digital Realty Trust, Inc. | | | 530 | | | | 85,086 | |
Diversified Healthcare Trust | | | 310 | | | | 1,207 | |
Douglas Emmett, Inc. | | | 330 | | | | 9,616 | |
Duke Realty Corp. | | | 710 | | | | 28,535 | |
Easterly Government Properties, Inc. | | | 155 | | | | 3,790 | |
EastGroup Properties, Inc. | | | 92 | | | | 12,205 | |
EPR Properties | | | 130 | | | | 3,722 | |
Equinix, Inc. | | | 173 | | | | 135,888 | |
Equity Residential | | | 684 | | | | 36,683 | |
Essential Properties Realty Trust, Inc. | | | 140 | | | | 2,254 | |
Essex Property Trust, Inc. | | | 132 | | | | 29,138 | |
Extra Space Storage, Inc. | | | 249 | | | | 25,732 | |
See Notes to Financial Statements.
PGIM QMA US Broad Market Index Fund
Schedule of Investments (continued)
as of July 31, 2020
| | | | | | | | |
| | |
| Description | | Shares | | | Value | |
| | |
COMMON STOCKS (Continued) | | | | | | | | |
| | |
Equity Real Estate Investment Trusts (REITs) (cont’d.) | | | | | | | | |
Federal Realty Investment Trust | | | 143 | | | $ | 10,911 | |
First Industrial Realty Trust, Inc. | | | 230 | | | | 10,102 | |
Four Corners Property Trust, Inc. | | | 90 | | | | 2,268 | |
Franklin Street Properties Corp. | | | 170 | | | | 893 | |
GEO Group, Inc. (The) | | | 155 | | | | 1,648 | |
Getty Realty Corp. | | | 55 | | | | 1,630 | |
Global Net Lease, Inc. | | | 110 | | | | 1,832 | |
Healthcare Realty Trust, Inc. | | | 275 | | | | 8,057 | |
Healthpeak Properties, Inc. | | | 1,040 | | | | 28,382 | |
Hersha Hospitality Trust | | | 20 | | | | 95 | |
Highwoods Properties, Inc. | | | 220 | | | | 8,435 | |
Host Hotels & Resorts, Inc. | | | 1,360 | | | | 14,661 | |
Hudson Pacific Properties, Inc. | | | 240 | | | | 5,657 | |
Independence Realty Trust, Inc. | | | 140 | | | | 1,610 | |
Industrial Logistics Properties Trust | | | 100 | | | | 2,111 | |
Innovative Industrial Properties, Inc. | | | 53 | | | | 5,524 | |
Investors Real Estate Trust | | | 20 | | | | 1,446 | |
Iron Mountain, Inc. | | | 560 | | | | 15,786 | |
iStar, Inc. | | | 120 | | | | 1,393 | |
JBG SMITH Properties | | | 200 | | | | 5,802 | |
Kilroy Realty Corp. | | | 220 | | | | 12,819 | |
Kimco Realty Corp. | | | 840 | | | | 9,366 | |
Kite Realty Group Trust | | | 80 | | | | 790 | |
Lamar Advertising Co. (Class A Stock) | | | 180 | | | | 11,831 | |
Lexington Realty Trust | | | 540 | | | | 6,264 | |
Life Storage, Inc. | | | 105 | | | | 10,304 | |
LTC Properties, Inc. | | | 60 | | | | 2,229 | |
Macerich Co. (The) | | | 174 | | | | 1,328 | |
Mack-Cali Realty Corp. | | | 130 | | | | 1,875 | |
Medical Properties Trust, Inc. | | | 1,020 | | | | 20,533 | |
Mid-America Apartment Communities, Inc. | | | 234 | | | | 27,890 | |
National Retail Properties, Inc. | | | 334 | | | | 11,840 | |
National Storage Affiliates Trust | | | 90 | | | | 2,774 | |
NexPoint Residential Trust, Inc. | | | 40 | | | | 1,529 | |
Office Properties Income Trust | | | 63 | | | | 1,584 | |
Omega Healthcare Investors, Inc. | | | 440 | | | | 14,247 | |
Park Hotels & Resorts, Inc. | | | 350 | | | | 2,894 | |
Pebblebrook Hotel Trust | | | 190 | | | | 2,014 | |
Pennsylvania Real Estate Investment Trust | | | 20 | | | | 24 | |
Physicians Realty Trust | | | 320 | | | | 5,773 | |
PotlatchDeltic Corp. | | | 123 | | | | 5,266 | |
Prologis, Inc. | | | 1,440 | | | | 151,805 | |
See Notes to Financial Statements.
| | | | |
| PGIM Day One Underlying Funds | | | 123 | |
PGIM QMA US Broad Market Index Fund
Schedule of Investments (continued)
as of July 31, 2020
| | | | | | | | |
| | |
| Description | | Shares | | | Value | |
| | |
COMMON STOCKS (Continued) | | | | | | | | |
| | |
Equity Real Estate Investment Trusts (REITs) (cont’d.) | | | | | | | | |
PS Business Parks, Inc. | | | 56 | | | $ | 7,725 | |
Public Storage | | | 297 | | | | 59,364 | |
Rayonier, Inc. | | | 270 | | | | 7,501 | |
Realty Income Corp. | | | 666 | | | | 39,993 | |
Regency Centers Corp. | | | 351 | | | | 14,402 | |
Retail Opportunity Investments Corp. | | | 150 | | | | 1,631 | |
Retail Properties of America, Inc. (Class A Stock) | | | 350 | | | | 2,226 | |
Rexford Industrial Realty, Inc. | | | 200 | | | | 9,386 | |
RPT Realty | | | 80 | | | | 498 | |
Sabra Health Care REIT, Inc. | | | 343 | | | | 5,056 | |
Safehold, Inc. | | | 20 | | | | 1,009 | |
Saul Centers, Inc. | | | 10 | | | | 307 | |
SBA Communications Corp. | | | 221 | | | | 68,850 | |
Service Properties Trust | | | 240 | | | | 1,608 | |
Simon Property Group, Inc. | | | 594 | | | | 37,036 | |
SITE Centers Corp. | | | 200 | | | | 1,466 | |
SL Green Realty Corp. | | | 137 | | | | 6,370 | |
Spirit Realty Capital, Inc. | | | 220 | | | | 7,581 | |
STORE Capital Corp. | | | 430 | | | | 10,187 | |
Summit Hotel Properties, Inc. | | | 95 | | | | 492 | |
Tanger Factory Outlet Centers, Inc. | | | 130 | | | | 836 | |
Taubman Centers, Inc. | | | 100 | | | | 3,872 | |
UDR, Inc. | | | 575 | | | | 20,815 | |
Uniti Group, Inc. | | | 250 | | | | 2,475 | |
Universal Health Realty Income Trust | | | 26 | | | | 1,809 | |
Urban Edge Properties | | | 150 | | | | 1,572 | |
Urstadt Biddle Properties, Inc. (Class A Stock) | | | 20 | | | | 196 | |
Ventas, Inc. | | | 726 | | | | 27,849 | |
Vornado Realty Trust | | | 310 | | | | 10,701 | |
Washington Prime Group, Inc. | | | 130 | | | | 95 | |
Washington Real Estate Investment Trust | | | 130 | | | | 2,907 | |
Weingarten Realty Investors | | | 180 | | | | 3,071 | |
Welltower, Inc. | | | 808 | | | | 43,276 | |
Weyerhaeuser Co. | | | 1,450 | | | | 40,324 | |
Whitestone REIT | | | 30 | | | | 198 | |
Xenia Hotels & Resorts, Inc. | | | 160 | | | | 1,274 | |
| | | | | | | | |
| | |
| | | | | | | 1,839,346 | |
| | |
Food & Staples Retailing 1.4% | | | | | | | | |
Andersons, Inc. (The) | | | 33 | | | | 469 | |
BJ’s Wholesale Club Holdings, Inc.* | | | 240 | | | | 9,612 | |
See Notes to Financial Statements.
PGIM QMA US Broad Market Index Fund
Schedule of Investments (continued)
as of July 31, 2020
| | | | | | | | |
| | |
| Description | | Shares | | | Value | |
| | |
COMMON STOCKS (Continued) | | | | | | | | |
| | |
Food & Staples Retailing (cont’d.) | | | | | | | | |
Casey’s General Stores, Inc. | | | 80 | | | $ | 12,735 | |
Chefs’ Warehouse, Inc. (The)* | | | 30 | | | | 346 | |
Costco Wholesale Corp. | | | 864 | | | | 281,258 | |
Grocery Outlet Holding Corp.* | | | 140 | | | | 6,159 | |
Kroger Co. (The) | | | 1,522 | | | | 52,950 | |
PriceSmart, Inc. | | | 60 | | | | 3,922 | |
SpartanNash Co. | | | 20 | | | | 421 | |
Sprouts Farmers Market, Inc.* | | | 240 | | | | 6,331 | |
Sysco Corp. | | | 992 | | | | 52,427 | |
United Natural Foods, Inc.* | | | 50 | | | | 993 | |
Walgreens Boots Alliance, Inc. | | | 1,434 | | | | 58,378 | |
Walmart, Inc. | | | 2,771 | | | | 358,567 | |
| | | | | | | | |
| | |
| | | | | | | 844,568 | |
| | |
Food Products 1.1% | | | | | | | | |
Archer-Daniels-Midland Co. | | | 1,080 | | | | 46,256 | |
B&G Foods, Inc. | | | 96 | | | | 2,775 | |
Calavo Growers, Inc. | | | 30 | | | | 1,733 | |
Cal-Maine Foods, Inc.* | | | 43 | | | | 1,890 | |
Campbell Soup Co. | | | 330 | | | | 16,358 | |
Conagra Brands, Inc. | | | 946 | | | | 35,428 | |
Darling Ingredients, Inc.* | | | 310 | | | | 8,658 | |
Flowers Foods, Inc. | | | 380 | | | | 8,645 | |
Fresh Del Monte Produce, Inc. | | | 50 | | | | 1,129 | |
General Mills, Inc. | | | 1,180 | | | | 74,659 | |
Hain Celestial Group, Inc. (The)* | | | 160 | | | | 5,437 | |
Hershey Co. (The) | | | 295 | | | | 42,896 | |
Hormel Foods Corp. | | | 550 | | | | 27,973 | |
Ingredion, Inc. | | | 128 | | | | 11,072 | |
J & J Snack Foods Corp. | | | 34 | | | | 4,187 | |
J.M. Smucker Co. (The) | | | 232 | | | | 25,369 | |
John B. Sanfilippo & Son, Inc. | | | 30 | | | | 2,645 | |
Kellogg Co. | | | 490 | | | | 33,805 | |
Kraft Heinz Co. (The) | | | 1,208 | | | | 41,531 | |
Lamb Weston Holdings, Inc. | | | 290 | | | | 17,423 | |
Lancaster Colony Corp. | | | 45 | | | | 7,137 | |
McCormick & Co., Inc. | | | 250 | | | | 48,725 | |
Mondelez International, Inc. (Class A Stock) | | | 2,806 | | | | 155,705 | |
Pilgrim’s Pride Corp.* | | | 80 | | | | 1,228 | |
Post Holdings, Inc.* | | | 140 | | | | 12,424 | |
Sanderson Farms, Inc. | | | 55 | | | | 6,132 | |
See Notes to Financial Statements.
| | | | |
| PGIM Day One Underlying Funds | | | 125 | |
PGIM QMA US Broad Market Index Fund
Schedule of Investments (continued)
as of July 31, 2020
| | | | | | | | |
| | |
| Description | | Shares | | | Value | |
| | |
COMMON STOCKS (Continued) | | | | | | | | |
| | |
Food Products (cont’d.) | | | | | | | | |
Seneca Foods Corp. (Class A Stock)* | | | 16 | | | $ | 627 | |
Tootsie Roll Industries, Inc. | | | 20 | | | | 634 | |
TreeHouse Foods, Inc.* | | | 98 | | | | 4,294 | |
Tyson Foods, Inc. (Class A Stock) | | | 572 | | | | 35,149 | |
| | | | | | | | |
| | |
| | | | | | | 681,924 | |
| | |
Gas Utilities 0.1% | | | | | | | | |
Atmos Energy Corp. | | | 236 | | | | 25,014 | |
National Fuel Gas Co. | | | 180 | | | | 7,303 | |
New Jersey Resources Corp. | | | 170 | | | | 5,280 | |
Northwest Natural Holding Co. | | | 56 | | | | 2,995 | |
ONE Gas, Inc. | | | 106 | | | | 8,024 | |
South Jersey Industries, Inc. | | | 130 | | | | 3,033 | |
Southwest Gas Holdings, Inc. | | | 126 | | | | 8,775 | |
Spire, Inc. | | | 116 | | | | 7,152 | |
UGI Corp. | | | 400 | | | | 13,336 | |
| | | | | | | | |
| | |
| | | | | | | 80,912 | |
| | |
Health Care Equipment & Supplies 3.7% | | | | | | | | |
Abbott Laboratories | | | 3,458 | | | | 348,013 | |
ABIOMED, Inc.* | | | 92 | | | | 27,594 | |
Align Technology, Inc.* | | | 143 | | | | 42,016 | |
AngioDynamics, Inc.* | | | 30 | | | | 248 | |
Avanos Medical, Inc.* | | | 70 | | | | 2,147 | |
Baxter International, Inc. | | | 1,010 | | | | 87,244 | |
Becton, Dickinson & Co. | | | 582 | | | | 163,740 | |
Boston Scientific Corp.* | | | 2,780 | | | | 107,225 | |
Cantel Medical Corp. | | | 60 | | | | 2,835 | |
Cardiovascular Systems, Inc.* | | | 50 | | | | 1,524 | |
CONMED Corp. | | | 70 | | | | 5,778 | |
Cooper Cos., Inc. (The) | | | 100 | | | | 28,293 | |
CryoLife, Inc.* | | | 30 | | | | 582 | |
Cutera, Inc.* | | | 10 | | | | 142 | |
Danaher Corp. | | | 1,237 | | | | 252,101 | |
Dentsply Sirona, Inc. | | | 430 | | | | 19,178 | |
DexCom, Inc.* | | | 185 | | | | 80,575 | |
Edwards Lifesciences Corp.* | | | 1,224 | | | | 95,974 | |
Glaukos Corp.* | | | 70 | | | | 3,059 | |
Globus Medical, Inc. (Class A Stock)* | | | 162 | | | | 7,805 | |
Haemonetics Corp.* | | | 110 | | | | 9,643 | |
See Notes to Financial Statements.
PGIM QMA US Broad Market Index Fund
Schedule of Investments (continued)
as of July 31, 2020
| | | | | | | | |
| | |
| Description | | Shares | | | Value | |
| | |
COMMON STOCKS (Continued) | | | | | | | | |
| | |
Health Care Equipment & Supplies (cont’d.) | | | | | | | | |
Heska Corp.* | | | 27 | | | $ | 2,598 | |
Hill-Rom Holdings, Inc. | | | 130 | | | | 12,639 | |
Hologic, Inc.* | | | 500 | | | | 34,890 | |
ICU Medical, Inc.* | | | 40 | | | | 7,349 | |
IDEXX Laboratories, Inc.* | | | 168 | | | | 66,822 | |
Inogen, Inc.* | | | 26 | | | | 798 | |
Integer Holdings Corp.* | | | 60 | | | | 3,946 | |
Integra LifeSciences Holdings Corp.* | | | 155 | | | | 7,401 | |
Intuitive Surgical, Inc.* | | | 228 | | | | 156,280 | |
Invacare Corp. | | | 40 | | | | 282 | |
Lantheus Holdings, Inc.* | | | 40 | | | | 539 | |
LeMaitre Vascular, Inc. | | | 17 | | | | 499 | |
LivaNova PLC* | | | 95 | | | | 4,421 | |
Masimo Corp.* | | | 97 | | | | 21,352 | |
Medtronic PLC | | | 2,626 | | | | 253,356 | |
Meridian Bioscience, Inc.* | | | 44 | | | | 1,078 | |
Merit Medical Systems, Inc.* | | | 126 | | | | 5,635 | |
Mesa Laboratories, Inc. | | | 10 | | | | 2,369 | |
Natus Medical, Inc.* | | | 40 | | | | 743 | |
Neogen Corp.* | | | 113 | | | | 8,675 | |
NuVasive, Inc.* | | | 115 | | | | 6,571 | |
OraSure Technologies, Inc.* | | | 135 | | | | 2,450 | |
Orthofix Medical, Inc.* | | | 30 | | | | 921 | |
Penumbra, Inc.* | | | 65 | | | | 14,424 | |
Quidel Corp.* | | | 80 | | | | 22,598 | |
ResMed, Inc. | | | 286 | | | | 57,918 | |
STERIS PLC | | | 173 | | | | 27,616 | |
Stryker Corp. | | | 632 | | | | 122,166 | |
Surmodics, Inc.* | | | 20 | | | | 946 | |
Tactile Systems Technology, Inc.* | | | 41 | | | | 1,680 | |
Teleflex, Inc. | | | 92 | | | | 34,325 | |
Varex Imaging Corp.* | | | 39 | | | | 611 | |
Varian Medical Systems, Inc.* | | | 180 | | | | 25,690 | |
West Pharmaceutical Services, Inc. | | | 150 | | | | 40,330 | |
Zimmer Biomet Holdings, Inc. | | | 410 | | | | 55,293 | |
Zynex, Inc.* | | | 20 | | | | 382 | |
| | | | | | | | |
| | |
| | | | | | | 2,291,309 | |
| | |
Health Care Providers & Services 2.6% | | | | | | | | |
Acadia Healthcare Co., Inc.* | | | 185 | | | | 5,515 | |
Addus HomeCare Corp.* | | | 38 | | | | 3,664 | |
See Notes to Financial Statements.
| | | | |
| PGIM Day One Underlying Funds | | | 127 | |
PGIM QMA US Broad Market Index Fund
Schedule of Investments (continued)
as of July 31, 2020
| | | | | | | | |
| | |
| Description | | Shares | | | Value | |
| | |
COMMON STOCKS (Continued) | | | | | | | | |
| | |
Health Care Providers & Services (cont’d.) | | | | | | | | |
Amedisys, Inc.* | | | 66 | | | $ | 15,455 | |
AmerisourceBergen Corp. | | | 296 | | | | 29,656 | |
AMN Healthcare Services, Inc.* | | | 110 | | | | 6,043 | |
Anthem, Inc. | | | 499 | | | | 136,626 | |
BioTelemetry, Inc.* | | | 59 | | | | 2,511 | |
Cardinal Health, Inc. | | | 570 | | | | 31,133 | |
Centene Corp.* | | | 1,124 | | | | 73,341 | |
Chemed Corp. | | | 31 | | | | 15,258 | |
Cigna Corp. | | | 724 | | | | 125,028 | |
Community Health Systems, Inc.* | | | 60 | | | | 299 | |
CorVel Corp.* | | | 14 | | | | 1,113 | |
Covetrus, Inc.* | | | 142 | | | | 3,147 | |
Cross Country Healthcare, Inc.* | | | 30 | | | | 195 | |
CVS Health Corp. | | | 2,573 | | | | 161,945 | |
DaVita, Inc.* | | | 170 | | | | 14,856 | |
Encompass Health Corp. | | | 200 | | | | 13,616 | |
Ensign Group, Inc. (The) | | | 120 | | | | 5,519 | |
Hanger, Inc.* | | | 60 | | | | 1,048 | |
HCA Healthcare, Inc. | | | 519 | | | | 65,726 | |
HealthEquity, Inc.* | | | 160 | | | | 8,250 | |
Henry Schein, Inc.* | | | 278 | | | | 19,107 | |
Humana, Inc. | | | 260 | | | | 102,037 | |
Laboratory Corp. of America Holdings* | | | 195 | | | | 37,619 | |
LHC Group, Inc.* | | | 59 | | | | 11,512 | |
Magellan Health, Inc.* | | | 64 | | | | 4,747 | |
McKesson Corp. | | | 321 | | | | 48,201 | |
MEDNAX, Inc.* | | | 130 | | | | 2,597 | |
Molina Healthcare, Inc.* | | | 120 | | | | 22,164 | |
Owens & Minor, Inc. | | | 30 | | | | 482 | |
Patterson Cos., Inc. | | | 144 | | | | 3,825 | |
Pennant Group, Inc. (The)* | | | 40 | | | | 1,002 | |
Providence Service Corp. (The)* | | | 36 | | | | 2,916 | |
Quest Diagnostics, Inc. | | | 264 | | | | 33,547 | |
RadNet, Inc.* | | | 60 | | | | 953 | |
Select Medical Holdings Corp.* | | | 160 | | | | 3,046 | |
Tenet Healthcare Corp.* | | | 160 | | | | 4,230 | |
Tivity Health, Inc.* | | | 56 | | | | 735 | |
UnitedHealth Group, Inc. | | | 1,857 | | | | 562,262 | |
Universal Health Services, Inc. (Class B Stock) | | | 160 | | | | 17,584 | |
US Physical Therapy, Inc. | | | 40 | | | | 3,322 | |
| | | | | | | | |
| | |
| | | | | | | 1,601,832 | |
See Notes to Financial Statements.
PGIM QMA US Broad Market Index Fund
Schedule of Investments (continued)
as of July 31, 2020
| | | | | | | | |
| | |
| Description | | Shares | | | Value | |
| | |
COMMON STOCKS (Continued) | | | | | | | | |
| | |
Health Care Technology 0.1% | | | | | | | | |
Allscripts Healthcare Solutions, Inc.* | | | 230 | | | $ | 2,070 | |
Cerner Corp. | | | 590 | | | | 40,975 | |
Computer Programs & Systems, Inc. | | | 20 | | | | 494 | |
HealthStream, Inc.* | | | 20 | | | | 439 | |
HMS Holdings Corp.* | | | 190 | | | | 6,175 | |
NextGen Healthcare, Inc.* | | | 30 | | | | 439 | |
Omnicell, Inc.* | | | 86 | | | | 6,045 | |
Simulations Plus, Inc. | | | 20 | | | | 1,408 | |
Tabula Rasa HealthCare, Inc.* | | | 40 | | | | 2,248 | |
| | | | | | | | |
| | |
| | | | | | | 60,293 | |
| | |
Hotels, Restaurants & Leisure 1.5% | | | | | | | | |
BJ’s Restaurants, Inc. | | | 30 | | | | 602 | |
Bloomin’ Brands, Inc. | | | 130 | | | | 1,498 | |
Boyd Gaming Corp. | | | 102 | | | | 2,414 | |
Brinker International, Inc. | | | 70 | | | | 1,882 | |
Caesars Entertainment, Inc.* | | | 300 | | | | 9,315 | |
Carnival Corp. | | | 920 | | | | 12,770 | |
Cheesecake Factory, Inc. (The) | | | 70 | | | | 1,680 | |
Chipotle Mexican Grill, Inc.* | | | 52 | | | | 60,068 | |
Choice Hotels International, Inc. | | | 70 | | | | 5,883 | |
Churchill Downs, Inc. | | | 67 | | | | 9,281 | |
Chuy’s Holdings, Inc.* | | | 20 | | | | 318 | |
Cracker Barrel Old Country Store, Inc. | | | 62 | | | | 6,849 | |
Darden Restaurants, Inc. | | | 250 | | | | 18,975 | |
Dave & Buster’s Entertainment, Inc. | | | 50 | | | | 617 | |
Dine Brands Global, Inc. | | | 30 | | | | 1,363 | |
Domino’s Pizza, Inc. | | | 78 | | | | 30,156 | |
Dunkin’ Brands Group, Inc. | | | 152 | | | | 10,447 | |
El Pollo Loco Holdings, Inc.* | | | 31 | | | | 613 | |
Fiesta Restaurant Group, Inc.* | | | 30 | | | | 194 | |
Hilton Worldwide Holdings, Inc. | | | 543 | | | | 40,752 | |
Jack in the Box, Inc. | | | 50 | | | | 4,105 | |
Las Vegas Sands Corp. | | | 650 | | | | 28,366 | |
Marriott International, Inc. (Class A Stock) | | | 525 | | | | 44,008 | |
Marriott Vacations Worldwide Corp. | | | 86 | | | | 7,281 | |
McDonald’s Corp. | | | 1,458 | | | | 283,260 | |
MGM Resorts International | | | 952 | | | | 15,318 | |
Monarch Casino & Resort, Inc.* | | | 20 | | | | 724 | |
Norwegian Cruise Line Holdings Ltd.* | | | 446 | | | | 6,083 | |
Papa John’s International, Inc. | | | 56 | | | | 5,302 | |
See Notes to Financial Statements.
| | | | |
| PGIM Day One Underlying Funds | | | 129 | |
PGIM QMA US Broad Market Index Fund
Schedule of Investments (continued)
as of July 31, 2020
| | | | | | | | |
| | |
| Description | | Shares | | | Value | |
| | |
COMMON STOCKS (Continued) | | | | | | | | |
| | |
Hotels, Restaurants & Leisure (cont’d.) | | | | | | | | |
Penn National Gaming, Inc.* | | | 260 | | | $ | 8,801 | |
Red Robin Gourmet Burgers, Inc.* | | | 10 | | | | 87 | |
Royal Caribbean Cruises Ltd. | | | 330 | | | | 16,074 | |
Ruth’s Hospitality Group, Inc. | | | 30 | | | | 201 | |
Scientific Games Corp.* | | | 80 | | | | 1,406 | |
Shake Shack, Inc. (Class A Stock)* | | | 78 | | | | 3,787 | |
Six Flags Entertainment Corp. | | | 130 | | | | 2,261 | |
Starbucks Corp. | | | 2,289 | | | | 175,177 | |
Texas Roadhouse, Inc. | | | 120 | | | | 6,743 | |
Wendy’s Co. (The) | | | 340 | | | | 7,881 | |
Wingstop, Inc. | | | 68 | | | | 10,625 | |
Wyndham Destinations, Inc. | | | 140 | | | | 3,724 | |
Wyndham Hotels & Resorts, Inc. | | | 170 | | | | 7,507 | |
Wynn Resorts Ltd. | | | 208 | | | | 15,065 | |
Yum! Brands, Inc. | | | 587 | | | | 53,446 | |
| | | | | | | | |
| | |
| | | | | | | 922,909 | |
| | |
Household Durables 0.5% | | | | | | | | |
Cavco Industries, Inc.* | | | 24 | | | | 4,808 | |
Century Communities, Inc.* | | | 40 | | | | 1,425 | |
D.R. Horton, Inc. | | | 640 | | | | 42,342 | |
Ethan Allen Interiors, Inc. | | | 20 | | | | 237 | |
Garmin Ltd. | | | 286 | | | | 28,197 | |
Helen of Troy Ltd.* | | | 50 | | | | 9,413 | |
Installed Building Products, Inc.* | | | 48 | | | | 3,797 | |
iRobot Corp.* | | | 65 | | | | 4,725 | |
KB Home | | | 150 | | | | 5,046 | |
La-Z-Boy, Inc. | | | 80 | | | | 2,277 | |
Leggett & Platt, Inc. | | | 260 | | | | 10,423 | |
Lennar Corp. (Class A Stock) | | | 532 | | | | 38,490 | |
LGI Homes, Inc.* | | | 52 | | | | 5,934 | |
M/I Homes, Inc.* | | | 46 | | | | 1,915 | |
MDC Holdings, Inc. | | | 87 | | | | 3,900 | |
Meritage Homes Corp.* | | | 70 | | | | 6,943 | |
Mohawk Industries, Inc.* | | | 127 | | | | 10,141 | |
Newell Brands, Inc. | | | 736 | | | | 12,070 | |
NVR, Inc.* | | | 7 | | | | 27,511 | |
PulteGroup, Inc. | | | 490 | | | | 21,364 | |
Taylor Morrison Home Corp.* | | | 200 | | | | 4,690 | |
Tempur Sealy International, Inc.* | | | 90 | | | | 7,286 | |
Toll Brothers, Inc. | | | 240 | | | | 9,168 | |
See Notes to Financial Statements.
PGIM QMA US Broad Market Index Fund
Schedule of Investments (continued)
as of July 31, 2020
| | | | | | | | |
| | |
| Description | | Shares | | | Value | |
| | |
COMMON STOCKS (Continued) | | | | | | | | |
| | |
Household Durables (cont’d.) | | | | | | | | |
TopBuild Corp.* | | | 72 | | | $ | 9,498 | |
TRI Pointe Group, Inc.* | | | 185 | | | | 3,093 | |
Tupperware Brands Corp. | | | 80 | | | | 1,234 | |
Universal Electronics, Inc.* | | | 30 | | | | 1,382 | |
Whirlpool Corp. | | | 126 | | | | 20,553 | |
| | | | | | | | |
| | |
| | | | | | | 297,862 | |
| | |
Household Products 1.6% | | | | | | | | |
Central Garden & Pet Co.* | | | 20 | | | | 757 | |
Central Garden & Pet Co. (Class A Stock)* | | | 48 | | | | 1,663 | |
Church & Dwight Co., Inc. | | | 477 | | | | 45,950 | |
Clorox Co. (The) | | | 252 | | | | 59,601 | |
Colgate-Palmolive Co. | | | 1,670 | | | | 128,924 | |
Energizer Holdings, Inc. | | | 146 | | | | 7,319 | |
Kimberly-Clark Corp. | | | 672 | | | | 102,171 | |
Procter & Gamble Co. (The) | | | 4,836 | | | | 634,096 | |
WD-40 Co. | | | 33 | | | | 6,486 | |
| | | | | | | | |
| | |
| | | | | | | 986,967 | |
| | |
Independent Power & Renewable Electricity Producers 0.0% | | | | | | | | |
AES Corp. (The) | | | 1,290 | | | | 19,647 | |
| | |
Industrial Conglomerates 0.9% | | | | | | | | |
3M Co. | | | 1,132 | | | | 170,332 | |
Carlisle Cos., Inc. | | | 115 | | | | 13,694 | |
General Electric Co. | | | 16,990 | | | | 103,129 | |
Honeywell International, Inc. | | | 1,376 | | | | 205,533 | |
Raven Industries, Inc. | | | 40 | | | | 865 | |
Roper Technologies, Inc. | | | 206 | | | | 89,085 | |
| | | | | | | | |
| | |
| | | | | | | 582,638 | |
| | |
Insurance 1.9% | | | | | | | | |
Aflac, Inc. | | | 1,398 | | | | 49,727 | |
Alleghany Corp. | | | 32 | | | | 16,714 | |
Allstate Corp. (The) | | | 610 | | | | 57,578 | |
Ambac Financial Group, Inc.* | | | 55 | | | | 704 | |
American Equity Investment Life Holding Co. | | | 190 | | | | 4,836 | |
American Financial Group, Inc. | | | 158 | | | | 9,602 | |
American International Group, Inc. | | | 1,670 | | | | 53,674 | |
See Notes to Financial Statements.
| | | | |
| PGIM Day One Underlying Funds | | | 131 | |
PGIM QMA US Broad Market Index Fund
Schedule of Investments (continued)
as of July 31, 2020
| | | | | | | | |
| | |
| Description | | Shares | | | Value | |
| | |
COMMON STOCKS (Continued) | | | | | | | | |
| | |
Insurance (cont’d.) | | | | | | | | |
AMERISAFE, Inc. | | | 34 | | | $ | 2,158 | |
Aon PLC (Class A Stock) | | | 452 | | | | 92,759 | |
Arthur J Gallagher & Co. | | | 370 | | | | 39,771 | |
Assurant, Inc. | | | 130 | | | | 13,971 | |
Brighthouse Financial, Inc.* | | | 180 | | | | 5,101 | |
Brown & Brown, Inc. | | | 460 | | | | 20,916 | |
Chubb Ltd. | | | 899 | | | | 114,389 | |
Cincinnati Financial Corp. | | | 294 | | | | 22,911 | |
CNO Financial Group, Inc. | | | 220 | | | | 3,322 | |
eHealth, Inc.* | | | 60 | | | | 4,148 | |
Employers Holdings, Inc. | | | 36 | | | | 1,171 | |
Everest Re Group Ltd. | | | 86 | | | | 18,816 | |
First American Financial Corp. | | | 210 | | | | 10,712 | |
Genworth Financial, Inc. (Class A Stock)* | | | 800 | | | | 1,632 | |
Globe Life, Inc. | | | 187 | | | | 14,885 | |
Hanover Insurance Group, Inc. (The) | | | 88 | | | | 8,965 | |
Hartford Financial Services Group, Inc. (The) | | | 700 | | | | 29,624 | |
HCI Group, Inc. | | | 14 | | | | 625 | |
Horace Mann Educators Corp. | | | 60 | | | | 2,255 | |
James River Group Holdings Ltd. | | | 45 | | | | 2,084 | |
Kemper Corp. | | | 131 | | | | 10,286 | |
Kinsale Capital Group, Inc. | | | 40 | | | | 7,796 | |
Lincoln National Corp. | | | 380 | | | | 14,163 | |
Loews Corp. | | | 466 | | | | 16,967 | |
Marsh & McLennan Cos., Inc. | | | 998 | | | | 116,367 | |
Mercury General Corp. | | | 40 | | | | 1,716 | |
MetLife, Inc. | | | 1,500 | | | | 56,775 | |
Old Republic International Corp. | | | 550 | | | | 8,838 | |
Palomar Holdings, Inc.* | | | 30 | | | | 2,740 | |
Primerica, Inc. | | | 90 | | | | 10,769 | |
Principal Financial Group, Inc. | | | 490 | | | | 20,791 | |
ProAssurance Corp. | | | 90 | | | | 1,323 | |
Progressive Corp. (The) | | | 1,158 | | | | 104,614 | |
Prudential Financial, Inc.(g) | | | 770 | | | | 48,795 | |
Reinsurance Group of America, Inc. | | | 142 | | | | 12,105 | |
RenaissanceRe Holdings Ltd. (Bermuda) | | | 99 | | | | 17,858 | |
RLI Corp. | | | 80 | | | | 7,050 | |
Safety Insurance Group, Inc. | | | 28 | | | | 2,119 | |
Selective Insurance Group, Inc. | | | 130 | | | | 7,064 | |
Stewart Information Services Corp. | | | 63 | | | | 2,643 | |
Third Point Reinsurance Ltd. (Bermuda)* | | | 80 | | | | 623 | |
Travelers Cos., Inc. (The) | | | 498 | | | | 56,981 | |
See Notes to Financial Statements.
PGIM QMA US Broad Market Index Fund
Schedule of Investments (continued)
as of July 31, 2020
| | | | | | | | |
| | |
| Description | | Shares | | | Value | |
| | |
COMMON STOCKS (Continued) | | | | | | | | |
| | |
Insurance (cont’d.) | | | | | | | | |
United Fire Group, Inc. | | | 35 | | | $ | 888 | |
United Insurance Holdings Corp. | | | 30 | | | | 222 | |
Universal Insurance Holdings, Inc. | | | 50 | | | | 876 | |
Unum Group | | | 325 | | | | 5,600 | |
W.R. Berkley Corp. | | | 293 | | | | 18,093 | |
Willis Towers Watson PLC | | | 256 | | | | 53,763 | |
| | | | | | | | |
| | |
| | | | | | | 1,210,875 | |
| | |
Interactive Media & Services 4.8% | | | | | | | | |
Alphabet, Inc. (Class A Stock)* | | | 587 | | | | 873,427 | |
Alphabet, Inc. (Class C Stock)* | | | 573 | | | | 849,736 | |
Facebook, Inc. (Class A Stock)* | | | 4,709 | | | | 1,194,532 | |
QuinStreet, Inc.* | | | 70 | | | | 817 | |
TripAdvisor, Inc. | | | 150 | | | | 3,034 | |
Twitter, Inc.* | | | 1,520 | | | | 55,328 | |
Yelp, Inc.* | | | 110 | | | | 2,748 | |
| | | | | | | | |
| | |
| | | | | | | 2,979,622 | |
| | |
Internet & Direct Marketing Retail 4.6% | | | | | | | | |
Amazon.com, Inc.* | | | 819 | | | | 2,591,873 | |
Booking Holdings, Inc.* | | | 80 | | | | 132,971 | |
eBay, Inc. | | | 1,280 | | | | 70,758 | |
Etsy, Inc.* | | | 240 | | | | 28,411 | |
Expedia Group, Inc. | | | 271 | | | | 21,954 | |
Grubhub, Inc.* | | | 180 | | | | 13,003 | |
Liquidity Services, Inc.* | | | 50 | | | | 258 | |
PetMed Express, Inc. | | | 20 | | | | 624 | |
Shutterstock, Inc. | | | 50 | | | | 2,717 | �� |
Stamps.com, Inc.* | | | 33 | | | | 8,589 | |
| | | | | | | | |
| | |
| | | | | | | 2,871,158 | |
| | |
IT Services 4.9% | | | | | | | | |
Accenture PLC (Class A Stock) | | | 1,248 | | | | 280,526 | |
Akamai Technologies, Inc.* | | | 320 | | | | 35,981 | |
Alliance Data Systems Corp. | | | 75 | | | | 3,327 | |
Automatic Data Processing, Inc. | | | 842 | | | | 111,910 | |
Broadridge Financial Solutions, Inc. | | | 228 | | | | 30,630 | |
CACI International, Inc. (Class A Stock)* | | | 56 | | | | 11,638 | |
Cardtronics PLC (Class A Stock)* | | | 44 | | | | 983 | |
See Notes to Financial Statements.
| | | | |
| PGIM Day One Underlying Funds | | | 133 | |
PGIM QMA US Broad Market Index Fund
Schedule of Investments (continued)
as of July 31, 2020
| | | | | | | | |
| | |
| Description | | Shares | | | Value | |
| | |
COMMON STOCKS (Continued) | | | | | | | | |
| | |
IT Services (cont’d.) | | | | | | | | |
Cognizant Technology Solutions Corp. (Class A Stock) | | | 1,050 | | | $ | 71,736 | |
CSG Systems International, Inc. | | | 50 | | | | 2,107 | |
DXC Technology Co. | | | 423 | | | | 7,576 | |
EVERTEC, Inc. (Puerto Rico) | | | 100 | | | | 3,105 | |
ExlService Holdings, Inc.* | | | 84 | | | | 5,381 | |
Fidelity National Information Services, Inc. | | | 1,205 | | | | 176,304 | |
Fiserv, Inc.* | | | 1,100 | | | | 109,769 | |
FleetCor Technologies, Inc.* | | | 169 | | | | 43,698 | |
Gartner, Inc.* | | | 190 | | | | 23,682 | |
Global Payments, Inc. | | | 586 | | | | 104,320 | |
International Business Machines Corp. | | | 1,745 | | | | 214,530 | |
Jack Henry & Associates, Inc. | | | 150 | | | | 26,745 | |
KBR, Inc. | | | 220 | | | | 4,893 | |
Leidos Holdings, Inc. | | | 270 | | | | 25,693 | |
LiveRamp Holdings, Inc.* | | | 110 | | | | 5,013 | |
ManTech International Corp. (Class A Stock) | | | 56 | | | | 3,897 | |
Mastercard, Inc. (Class A Stock) | | | 1,731 | | | | 534,065 | |
MAXIMUS, Inc. | | | 140 | | | | 10,389 | |
NIC, Inc. | | | 70 | | | | 1,534 | |
Paychex, Inc. | | | 624 | | | | 44,878 | |
PayPal Holdings, Inc.* | | | 2,302 | | | | 451,353 | |
Perficient, Inc.* | | | 60 | | | | 2,353 | |
Perspecta, Inc. | | | 221 | | | | 4,729 | |
Sabre Corp. | | | 395 | | | | 2,986 | |
Science Applications International Corp. | | | 99 | | | | 7,918 | |
Sykes Enterprises, Inc.* | | | 40 | | | | 1,098 | |
TTEC Holdings, Inc. | | | 20 | | | | 949 | |
Unisys Corp.* | | | 60 | | | | 713 | |
VeriSign, Inc.* | | | 201 | | | | 42,548 | |
Virtusa Corp.* | | | 40 | | | | 1,624 | |
Visa, Inc. (Class A Stock) | | | 3,303 | | | | 628,891 | |
Western Union Co. (The) | | | 790 | | | | 19,181 | |
WEX, Inc.* | | | 93 | | | | 14,728 | |
| | | | | | | | |
| | |
| | | | | | | 3,073,381 | |
| | |
Leisure Products 0.1% | | | | | | | | |
Brunswick Corp. | | | 170 | | | | 11,387 | |
Callaway Golf Co. | | | 110 | | | | 2,095 | |
Hasbro, Inc. | | | 250 | | | | 18,190 | |
Mattel, Inc.* | | | 580 | | | | 6,444 | |
Polaris, Inc. | | | 112 | | | | 11,607 | |
See Notes to Financial Statements.
PGIM QMA US Broad Market Index Fund
Schedule of Investments (continued)
as of July 31, 2020
| | | | | | | | |
| | |
| Description | | Shares | | | Value | |
| | |
COMMON STOCKS (Continued) | | | | | | | | |
| | |
Leisure Products (cont’d.) | | | | | | | | |
Sturm Ruger & Co., Inc. | | | 34 | | | $ | 2,767 | |
Vista Outdoor, Inc.* | | | 90 | | | | 1,543 | |
YETI Holdings, Inc.* | | | 150 | | | | 7,333 | |
| | | | | | | | |
| | |
| | | | | | | 61,366 | |
| | |
Life Sciences Tools & Services 1.2% | | | | | | | | |
Agilent Technologies, Inc. | | | 600 | | | | 57,798 | |
Bio-Rad Laboratories, Inc. (Class A Stock)* | | | 45 | | | | 23,620 | |
Bio-Techne Corp. | | | 77 | | | | 21,187 | |
Charles River Laboratories International, Inc.* | | | 100 | | | | 19,899 | |
Illumina, Inc.* | | | 292 | | | | 111,591 | |
IQVIA Holdings, Inc.* | | | 355 | | | | 56,229 | |
Luminex Corp. | | | 93 | | | | 3,385 | |
Medpace Holdings, Inc.* | | | 60 | | | | 7,161 | |
Mettler-Toledo International, Inc.* | | | 48 | | | | 44,880 | |
NeoGenomics, Inc.* | | | 230 | | | | 8,793 | |
PerkinElmer, Inc. | | | 228 | | | | 27,112 | |
PRA Health Sciences, Inc.* | | | 122 | | | | 13,000 | |
Repligen Corp.* | | | 90 | | | | 13,582 | |
Syneos Health, Inc.* | | | 140 | | | | 8,735 | |
Thermo Fisher Scientific, Inc. | | | 772 | | | | 319,569 | |
Waters Corp.* | | | 123 | | | | 26,217 | |
| | | | | | | | |
| | |
| | | | | | | 762,758 | |
| | |
Machinery 1.7% | | | | | | | | |
AGCO Corp. | | | 140 | | | | 9,188 | |
Alamo Group, Inc. | | | 24 | | | | 2,475 | |
Albany International Corp. (Class A Stock) | | | 50 | | | | 2,404 | |
Astec Industries, Inc. | | | 30 | | | | 1,335 | |
Barnes Group, Inc. | | | 90 | | | | 3,318 | |
Caterpillar, Inc. | | | 1,070 | | | | 142,182 | |
Chart Industries, Inc.* | | | 68 | | | | 4,660 | |
CIRCOR International, Inc.* | | | 46 | | | | 1,206 | |
Colfax Corp.* | | | 140 | | | | 4,071 | |
Crane Co. | | | 114 | | | | 6,449 | |
Cummins, Inc. | | | 296 | | | | 57,205 | |
Deere & Co. | | | 614 | | | | 108,254 | |
Donaldson Co., Inc. | | | 250 | | | | 12,085 | |
Dover Corp. | | | 282 | | | | 29,026 | |
Enerpac Tool Group Corp. | | | 70 | | | | 1,323 | |
See Notes to Financial Statements.
| | | | |
| PGIM Day One Underlying Funds | | | 135 | |
PGIM QMA US Broad Market Index Fund
Schedule of Investments (continued)
as of July 31, 2020
| | | | | | | | |
| | |
| Description | | Shares | | | Value | |
| | |
COMMON STOCKS (Continued) | | | | | | | | |
| | |
Machinery (cont’d.) | | | | | | | | |
EnPro Industries, Inc. | | | 30 | | | $ | 1,432 | |
ESCO Technologies, Inc. | | | 60 | | | | 5,156 | |
Federal Signal Corp. | | | 100 | | | | 3,091 | |
Flowserve Corp. | | | 270 | | | | 7,525 | |
Fortive Corp. | | | 578 | | | | 40,570 | |
Franklin Electric Co., Inc. | | | 93 | | | | 5,027 | |
Graco, Inc. | | | 326 | | | | 17,356 | |
Greenbrier Cos., Inc. (The) | | | 40 | | | | 1,029 | |
Hillenbrand, Inc. | | | 114 | | | | 3,332 | |
IDEX Corp. | | | 156 | | | | 25,712 | |
Illinois Tool Works, Inc. | | | 565 | | | | 104,519 | |
Ingersoll Rand, Inc.* | | | 667 | | | | 21,071 | |
ITT, Inc. | | | 160 | | | | 9,237 | |
John Bean Technologies Corp. | | | 70 | | | | 6,563 | |
Kennametal, Inc. | | | 120 | | | | 3,235 | |
Lincoln Electric Holdings, Inc. | | | 114 | | | | 10,305 | |
Lindsay Corp. | | | 25 | | | | 2,424 | |
Lydall, Inc.* | | | 10 | | | | 162 | |
Meritor, Inc.* | | | 110 | | | | 2,503 | |
Middleby Corp. (The)* | | | 120 | | | | 9,967 | |
Mueller Industries, Inc. | | | 90 | | | | 2,516 | |
Nordson Corp. | | | 100 | | | | 19,363 | |
Oshkosh Corp. | | | 148 | | | | 11,651 | |
Otis Worldwide Corp. | | | 795 | | | | 49,878 | |
PACCAR, Inc. | | | 690 | | | | 58,705 | |
Parker-Hannifin Corp. | | | 254 | | | | 45,446 | |
Pentair PLC | | | 340 | | | | 14,569 | |
Proto Labs, Inc.* | | | 67 | | | | 8,048 | |
Snap-on, Inc. | | | 115 | | | | 16,775 | |
SPX Corp.* | | | 70 | | | | 2,940 | |
SPX FLOW, Inc.* | | | 100 | | | | 4,008 | |
Standex International Corp. | | | 24 | | | | 1,285 | |
Stanley Black & Decker, Inc. | | | 304 | | | | 46,609 | |
Tennant Co. | | | 30 | | | | 1,999 | |
Terex Corp. | | | 90 | | | | 1,697 | |
Timken Co. (The) | | | 130 | | | | 5,936 | |
Titan International, Inc. | | | 42 | | | | 63 | |
Toro Co. (The) | | | 220 | | | | 15,697 | |
Trinity Industries, Inc. | | | 140 | | | | 2,734 | |
Wabash National Corp. | | | 30 | | | | 342 | |
Watts Water Technologies, Inc. (Class A Stock) | | | 65 | | | | 5,453 | |
Westinghouse Air Brake Technologies Corp. | | | 364 | | | | 22,637 | |
See Notes to Financial Statements.
PGIM QMA US Broad Market Index Fund
Schedule of Investments (continued)
as of July 31, 2020
| | | | | | | | |
| | |
| Description | | Shares | | | Value | |
| | |
COMMON STOCKS (Continued) | | | | | | | | |
| | |
Machinery (cont’d.) | | | | | | | | |
Woodward, Inc. | | | 110 | | | $ | 8,243 | |
Xylem, Inc. | | | 354 | | | | 25,835 | |
| | | | | | | | |
| | |
| | | | | | | 1,037,826 | |
| | |
Marine 0.0% | | | | | | | | |
Kirby Corp.* | | | 112 | | | | 5,179 | |
Matson, Inc. | | | 70 | | | | 2,549 | |
| | | | | | | �� | |
| | |
| | | | | | | 7,728 | |
| | |
Media 1.2% | | | | | | | | |
AMC Networks, Inc. (Class A Stock)* | | | 70 | | | | 1,617 | |
Cable One, Inc. | | | 12 | | | | 21,871 | |
Charter Communications, Inc. (Class A Stock)* | | | 299 | | | | 173,420 | |
Comcast Corp. (Class A Stock) | | | 8,886 | | | | 380,321 | |
Discovery, Inc. (Class A Stock)* | | | 310 | | | | 6,541 | |
Discovery, Inc. (Class C Stock)* | | | 550 | | | | 10,422 | |
DISH Network Corp. (Class A Stock)* | | | 500 | | | | 16,055 | |
EW Scripps Co. (The) (Class A Stock) | | | 50 | | | | 569 | |
Fox Corp. (Class A Stock) | | | 670 | | | | 17,266 | |
Fox Corp. (Class B Stock) | | | 270 | | | | 6,958 | |
Gannett Co., Inc. | | | 105 | | | | 155 | |
Interpublic Group of Cos., Inc. (The) | | | 750 | | | | 13,537 | |
John Wiley & Sons, Inc. (Class A Stock) | | | 100 | | | | 3,383 | |
Meredith Corp. | | | 60 | | | | 862 | |
New York Times Co. (The) (Class A Stock) | | | 270 | | | | 12,458 | |
News Corp. (Class A Stock) | | | 750 | | | | 9,540 | |
News Corp. (Class B Stock) | | | 150 | | | | 1,914 | |
Omnicom Group, Inc. | | | 420 | | | | 22,567 | |
Scholastic Corp. | | | 30 | | | | 718 | |
TechTarget, Inc.* | | | 30 | | | | 1,089 | |
TEGNA, Inc. | | | 310 | | | | 3,652 | |
ViacomCBS, Inc. (Class B Stock) | | | 1,051 | | | | 27,399 | |
| | | | | | | | |
| | |
| | | | | | | 732,314 | |
| | |
Metals & Mining 0.4% | | | | | | | | |
Allegheny Technologies, Inc.* | | | 185 | | | | 1,608 | |
Arconic Corp.* | | | 157 | | | | 2,558 | |
Carpenter Technology Corp. | | | 80 | | | | 1,789 | |
Century Aluminum Co.* | | | 40 | | | | 348 | |
See Notes to Financial Statements.
| | | | |
| PGIM Day One Underlying Funds | | | 137 | |
PGIM QMA US Broad Market Index Fund
Schedule of Investments (continued)
as of July 31, 2020
| | | | | | | | |
| | |
| Description | | Shares | | | Value | |
| | |
COMMON STOCKS (Continued) | | | | | | | | |
| | |
Metals & Mining (cont’d.) | | | | | | | | |
Cleveland-Cliffs, Inc. | | | 776 | | | $ | 4,020 | |
Commercial Metals Co. | | | 230 | | | | 4,756 | |
Compass Minerals International, Inc. | | | 60 | | | | 3,056 | |
Freeport-McMoRan, Inc. | | | 2,820 | | | | 36,434 | |
Haynes International, Inc. | | | 16 | | | | 294 | |
Kaiser Aluminum Corp. | | | 26 | | | | 1,611 | |
Materion Corp. | | | 36 | | | | 2,067 | |
Newmont Corp. | | | 1,560 | | | | 107,952 | |
Nucor Corp. | | | 586 | | | | 24,583 | |
Olympic Steel, Inc. | | | 20 | | | | 212 | |
Reliance Steel & Aluminum Co. | | | 140 | | | | 13,756 | |
Royal Gold, Inc. | | | 138 | | | | 19,310 | |
Steel Dynamics, Inc. | | | 410 | | | | 11,238 | |
SunCoke Energy, Inc. | | | 40 | | | | 128 | |
TimkenSteel Corp.* | | | 30 | | | | 110 | |
United States Steel Corp. | | | 340 | | | | 2,264 | |
Warrior Met Coal, Inc. | | | 80 | | | | 1,274 | |
Worthington Industries, Inc. | | | 50 | | | | 1,871 | |
| | | | | | | | |
| | |
| | | | | | | 241,239 | |
| | |
Mortgage Real Estate Investment Trusts (REITs) 0.0% | | | | | | | | |
Apollo Commercial Real Estate Finance, Inc. | | | 230 | | | | 2,139 | |
ARMOUR Residential REIT, Inc. | | | 50 | | | | 467 | |
Capstead Mortgage Corp. | | | 40 | | | | 246 | |
Granite Point Mortgage Trust, Inc. | | | 60 | | | | 407 | |
Invesco Mortgage Capital, Inc. | | | 271 | | | | 832 | |
KKR Real Estate Finance Trust, Inc. | | | 40 | | | | 666 | |
New York Mortgage Trust, Inc. | | | 445 | | | | 1,166 | |
PennyMac Mortgage Investment Trust | | | 140 | | | | 2,639 | |
Ready Capital Corp. | | | 52 | | | | 417 | |
Redwood Trust, Inc. | | | 130 | | | | 927 | |
| | | | | | | | |
| | |
| | | | | | | 9,906 | |
| | |
Multiline Retail 0.5% | | | | | | | | |
Big Lots, Inc. | | | 90 | | | | 3,541 | |
Dollar General Corp. | | | 500 | | | | 95,200 | |
Dollar Tree, Inc.* | | | 479 | | | | 44,715 | |
Kohl’s Corp. | | | 250 | | | | 4,760 | |
Macy’s, Inc. | | | 450 | | | | 2,727 | |
Nordstrom, Inc. | | | 166 | | | | 2,272 | |
See Notes to Financial Statements.
PGIM QMA US Broad Market Index Fund
Schedule of Investments (continued)
as of July 31, 2020
| | | | | | | | |
| | |
| Description | | Shares | | | Value | |
| | |
COMMON STOCKS (Continued) | | | | | | | | |
| | |
Multiline Retail (cont’d.) | | | | | | | | |
Ollie’s Bargain Outlet Holdings, Inc.* | | | 110 | | | $ | 11,561 | |
Target Corp. | | | 994 | | | | 125,125 | |
| | | | | | | | |
| | |
| | | | | | | 289,901 | |
| | |
Multi-Utilities 0.9% | | | | | | | | |
Ameren Corp. | | | 480 | | | | 38,515 | |
Avista Corp. | | | 120 | | | | 4,456 | |
Black Hills Corp. | | | 120 | | | | 6,943 | |
CenterPoint Energy, Inc. | | | 1,054 | | | | 20,037 | |
CMS Energy Corp. | | | 560 | | | | 35,941 | |
Consolidated Edison, Inc. | | | 652 | | | | 50,093 | |
Dominion Energy, Inc. | | | 1,653 | | | | 133,943 | |
DTE Energy Co. | | | 381 | | | | 44,055 | |
MDU Resources Group, Inc. | | | 390 | | | | 8,182 | |
NiSource, Inc. | | | 740 | | | | 18,093 | |
NorthWestern Corp. | | | 90 | | | | 5,063 | |
Public Service Enterprise Group, Inc. | | | 980 | | | | 54,821 | |
Sempra Energy | | | 570 | | | | 70,942 | |
WEC Energy Group, Inc. | | | 620 | | | | 59,061 | |
| | | | | | | | |
| | |
| | | | | | | 550,145 | |
| | |
Oil, Gas & Consumable Fuels 2.0% | | | | | | | | |
Antero Midstream Corp. | | | 470 | | | | 2,665 | |
Apache Corp. | | | 730 | | | | 11,205 | |
Bonanza Creek Energy, Inc.* | | | 30 | | | | 546 | |
Cabot Oil & Gas Corp. | | | 690 | | | | 12,903 | |
Callon Petroleum Co.* | | | 635 | | | | 724 | |
Chevron Corp. | | | 3,654 | | | | 306,717 | |
Cimarex Energy Co. | | | 166 | | | | 4,060 | |
CNX Resources Corp.* | | | 280 | | | | 2,702 | |
Concho Resources, Inc. | | | 398 | | | | 20,911 | |
ConocoPhillips | | | 2,082 | | | | 77,846 | |
CONSOL Energy, Inc.* | | | 55 | | | | 323 | |
Devon Energy Corp. | | | 620 | | | | 6,504 | |
Diamondback Energy, Inc. | | | 323 | | | | 12,875 | |
Dorian LPG Ltd.* | | | 50 | | | | 427 | |
EOG Resources, Inc. | | | 1,129 | | | | 52,894 | |
EQT Corp. | | | 490 | | | | 7,115 | |
Equitrans Midstream Corp. | | | 714 | | | | 6,890 | |
Exxon Mobil Corp. | | | 8,252 | | | | 347,244 | |
See Notes to Financial Statements.
| | | | |
| PGIM Day One Underlying Funds | | | 139 | |
PGIM QMA US Broad Market Index Fund
Schedule of Investments (continued)
as of July 31, 2020
| | | | | | | | |
| | |
| Description | | Shares | | | Value | |
| | |
COMMON STOCKS (Continued) | | | | | | | | |
| | |
Oil, Gas & Consumable Fuels (cont’d.) | | | | | | | | |
Green Plains, Inc.* | | | 20 | | | $ | 259 | |
Gulfport Energy Corp.* | | | 220 | | | | 222 | |
Hess Corp. | | | 510 | | | | 25,097 | |
HollyFrontier Corp. | | | 260 | | | | 7,150 | |
Kinder Morgan, Inc. | | | 3,770 | | | | 53,157 | |
Laredo Petroleum, Inc.* | | | 8 | | | | 121 | |
Marathon Oil Corp. | | | 1,530 | | | | 8,400 | |
Marathon Petroleum Corp. | | | 1,263 | | | | 48,247 | |
Matador Resources Co.* | | | 145 | | | | 1,259 | |
Murphy Oil Corp. | | | 210 | | | | 2,774 | |
Noble Energy, Inc. | | | 810 | | | | 8,092 | |
Oasis Petroleum, Inc.* | | | 380 | | | | 243 | |
Occidental Petroleum Corp. | | | 1,740 | | | | 27,388 | |
ONEOK, Inc. | | | 850 | | | | 23,723 | |
Par Pacific Holdings, Inc.* | | | 20 | | | | 148 | |
PBF Energy, Inc. (Class A Stock) | | | 145 | | | | 1,259 | |
PDC Energy, Inc.* | | | 137 | | | | 1,954 | |
Penn Virginia Corp.* | | | 20 | | | | 198 | |
Phillips 66 | | | 847 | | | | 52,531 | |
Pioneer Natural Resources Co. | | | 321 | | | | 31,111 | |
QEP Resources, Inc. | | | 300 | | | | 441 | |
Range Resources Corp. | | | 280 | | | | 1,809 | |
Renewable Energy Group, Inc.* | | | 40 | | | | 1,103 | |
REX American Resources Corp.* | | | 6 | | | | 409 | |
Ring Energy, Inc.* | | | 50 | | | | 55 | |
SM Energy Co. | | | 135 | | | | 398 | |
Southwestern Energy Co.* | | | 810 | | | | 1,968 | |
Talos Energy, Inc.* | | | 30 | | | | 204 | |
Valero Energy Corp. | | | 798 | | | | 44,871 | |
Williams Cos., Inc. (The) | | | 2,354 | | | | 45,032 | |
World Fuel Services Corp. | | | 90 | | | | 2,118 | |
WPX Energy, Inc.* | | | 600 | | | | 3,582 | |
| | | | | | | | |
| | |
| | | | | | | 1,269,874 | |
| | |
Paper & Forest Products 0.0% | | | | | | | | |
Boise Cascade Co. | | | 70 | | | | 3,261 | |
Clearwater Paper Corp.* | | | 50 | | | | 1,846 | |
Domtar Corp. | | | 90 | | | | 1,889 | |
Louisiana-Pacific Corp. | | | 190 | | | | 6,017 | |
Mercer International, Inc. (Germany) | | | 60 | | | | 447 | |
Neenah, Inc. | | | 40 | | | | 1,785 | |
See Notes to Financial Statements.
PGIM QMA US Broad Market Index Fund
Schedule of Investments (continued)
as of July 31, 2020
| | | | | | | | |
| | |
| Description | | Shares | | | Value | |
| | |
COMMON STOCKS (Continued) | | | | | | | | |
| | |
Paper & Forest Products (cont’d.) | | | | | | | | |
P.H. Glatfelter Co. | | | 20 | | | $ | 319 | |
Schweitzer-Mauduit International, Inc. | | | 60 | | | | 1,952 | |
| | | | | | | | |
| | |
| | | | | | | 17,516 | |
| | |
Personal Products 0.2% | | | | | | | | |
Coty, Inc. (Class A Stock) | | | 420 | | | | 1,558 | |
Edgewell Personal Care Co.* | | | 80 | | | | 2,391 | |
Estee Lauder Cos., Inc. (The) (Class A Stock) | | | 444 | | | | 87,708 | |
Inter Parfums, Inc. | | | 30 | | | | 1,227 | |
Medifast, Inc. | | | 38 | | | | 6,351 | |
Nu Skin Enterprises, Inc. (Class A Stock) | | | 97 | | | | 4,350 | |
USANA Health Sciences, Inc.* | | | 20 | | | | 1,624 | |
| | | | | | | | |
| | |
| | | | | | | 105,209 | |
| | |
Pharmaceuticals 3.7% | | | | | | | | |
AMAG Pharmaceuticals, Inc.* | | | 20 | | | | 191 | |
Amphastar Pharmaceuticals, Inc.* | | | 20 | | | | 400 | |
ANI Pharmaceuticals, Inc.* | | | 10 | | | | 296 | |
Bristol-Myers Squibb Co. | | | 4,426 | | | | 259,629 | |
Catalent, Inc.* | | | 315 | | | | 27,512 | |
Corcept Therapeutics, Inc.* | | | 150 | | | | 2,243 | |
Eli Lilly & Co. | | | 1,648 | | | | 247,678 | |
Endo International PLC* | | | 260 | | | | 905 | |
Innoviva, Inc.* | | | 70 | | | | 948 | |
Johnson & Johnson | | | 5,167 | | | | 753,142 | |
Lannett Co., Inc.* | | | 20 | | | | 119 | |
Merck & Co., Inc. | | | 4,931 | | | | 395,664 | |
Mylan NV* | | | 996 | | | | 16,046 | |
Nektar Therapeutics* | | | 340 | | | | 7,534 | |
Pacira BioSciences, Inc.* | | | 90 | | | | 4,735 | |
Perrigo Co. PLC | | | 270 | | | | 14,315 | |
Pfizer, Inc. | | | 10,838 | | | | 417,046 | |
Phibro Animal Health Corp. (Class A Stock) | | | 20 | | | | 464 | |
Prestige Consumer Healthcare, Inc.* | | | 80 | | | | 2,975 | |
Supernus Pharmaceuticals, Inc.* | | | 70 | | | | 1,559 | |
Zoetis, Inc. | | | 933 | | | | 141,517 | |
| | | | | | | | |
| | |
| | | | | | | 2,294,918 | |
See Notes to Financial Statements.
| | | | |
| PGIM Day One Underlying Funds | | | 141 | |
PGIM QMA US Broad Market Index Fund
Schedule of Investments (continued)
as of July 31, 2020
| | | | | | | | |
| | |
| Description | | Shares | | | Value | |
| | |
COMMON STOCKS (Continued) | | | | | | | | |
| | |
Professional Services 0.4% | | | | | | | | |
ASGN, Inc.* | | | 120 | | | $ | 8,215 | |
CoreLogic, Inc. | | | 170 | | | | 11,587 | |
Equifax, Inc. | | | 238 | | | | 38,689 | |
Exponent, Inc. | | | 100 | | | | 8,406 | |
Forrester Research, Inc.* | | | 16 | | | | 562 | |
FTI Consulting, Inc.* | | | 70 | | | | 8,361 | |
Heidrick & Struggles International, Inc. | | | 20 | | | | 405 | |
IHS Markit Ltd. | | | 780 | | | | 62,969 | |
Insperity, Inc. | | | 70 | | | | 4,680 | |
Kelly Services, Inc. (Class A Stock) | | | 20 | | | | 296 | |
Korn Ferry | | | 100 | | | | 2,810 | |
ManpowerGroup, Inc. | | | 133 | | | | 9,149 | |
Nielsen Holdings PLC | | | 690 | | | | 9,957 | |
Resources Connection, Inc. | | | 30 | | | | 339 | |
Robert Half International, Inc. | | | 230 | | | | 11,700 | |
TrueBlue, Inc.* | | | 25 | | | | 386 | |
Verisk Analytics, Inc. | | | 317 | | | | 59,821 | |
| | | | | | | | |
| | |
| | | | | | | 238,332 | |
| | |
Real Estate Management & Development 0.1% | | | | | | | | |
CBRE Group, Inc. (Class A Stock)* | | | 650 | | | | 28,476 | |
Jones Lang LaSalle, Inc. | | | 115 | | | | 11,375 | |
Marcus & Millichap, Inc.* | | | 30 | | | | 817 | |
RE/MAX Holdings, Inc. (Class A Stock) | | | 20 | | | | 647 | |
Realogy Holdings Corp. | | | 160 | | | | 1,450 | |
St. Joe Co. (The)* | | | 50 | | | | 1,031 | |
| | | | | | | | |
| | |
| | | | | | | 43,796 | |
| | |
Road & Rail 0.9% | | | | | | | | |
ArcBest Corp. | | | 33 | | | | 1,003 | |
Avis Budget Group, Inc.* | | | 90 | | | | 2,331 | |
CSX Corp. | | | 1,517 | | | | 108,223 | |
Heartland Express, Inc. | | | 40 | | | | 811 | |
J.B. Hunt Transport Services, Inc. | | | 180 | | | | 23,292 | |
Kansas City Southern | | | 190 | | | | 32,652 | |
Knight-Swift Transportation Holdings, Inc. | | | 225 | | | | 9,785 | |
Landstar System, Inc. | | | 90 | | | | 10,960 | |
Marten Transport Ltd. | | | 93 | | | | 2,476 | |
Norfolk Southern Corp. | | | 500 | | | | 96,105 | |
Old Dominion Freight Line, Inc. | | | 190 | | | | 34,736 | |
See Notes to Financial Statements.
PGIM QMA US Broad Market Index Fund
Schedule of Investments (continued)
as of July 31, 2020
| | | | | | | | |
| | |
| Description | | Shares | | | Value | |
| | |
COMMON STOCKS (Continued) | | | | | | | | |
| | |
Road & Rail (cont’d.) | | | | | | | | |
Ryder System, Inc. | | | 120 | | | $ | 4,396 | |
Saia, Inc.* | | | 60 | | | | 7,167 | |
Union Pacific Corp. | | | 1,335 | | | | 231,422 | |
Werner Enterprises, Inc. | | | 103 | | | | 4,530 | |
| | | | | | | | |
| | |
| | | | | | | 569,889 | |
| | |
Semiconductors & Semiconductor Equipment 4.4% | | | | | | | | |
Advanced Energy Industries, Inc.* | | | 66 | | | | 4,856 | |
Advanced Micro Devices, Inc.* | | | 2,300 | | | | 178,089 | |
Analog Devices, Inc. | | | 718 | | | | 82,462 | |
Applied Materials, Inc. | | | 1,786 | | | | 114,893 | |
Axcelis Technologies, Inc.* | | | 30 | | | | 883 | |
Broadcom, Inc. | | | 784 | | | | 248,332 | |
Brooks Automation, Inc. | | | 130 | | | | 7,078 | |
Cabot Microelectronics Corp. | | | 72 | | | | 10,852 | |
CEVA, Inc.* | | | 56 | | | | 2,251 | |
Cirrus Logic, Inc.* | | | 130 | | | | 8,909 | |
Cohu, Inc. | | | 55 | | | | 1,036 | |
Cree, Inc.* | | | 223 | | | | 15,369 | |
Diodes, Inc.* | | | 80 | | | | 4,116 | |
DSP Group, Inc.* | | | 40 | | | | 594 | |
Enphase Energy, Inc.* | | | 170 | | | | 10,261 | |
First Solar, Inc.* | | | 140 | | | | 8,337 | |
FormFactor, Inc.* | | | 125 | | | | 3,605 | |
Ichor Holdings Ltd.* | | | 30 | | | | 985 | |
Intel Corp. | | | 8,261 | | | | 394,298 | |
KLA Corp. | | | 307 | | | | 61,348 | |
Kulicke & Soffa Industries, Inc. (Singapore) | | | 130 | | | | 3,081 | |
Lam Research Corp. | | | 288 | | | | 108,622 | |
Maxim Integrated Products, Inc. | | | 520 | | | | 35,407 | |
MaxLinear, Inc.* | | | 140 | | | | 3,549 | |
Microchip Technology, Inc. | | | 483 | | | | 49,136 | |
Micron Technology, Inc.* | | | 2,188 | | | | 109,520 | |
MKS Instruments, Inc. | | | 115 | | | | 14,656 | |
Monolithic Power Systems, Inc. | | | 85 | | | | 22,526 | |
NVIDIA Corp. | | | 1,207 | | | | 512,480 | |
Onto Innovation, Inc.* | | | 84 | | | | 3,177 | |
PDF Solutions, Inc.* | | | 30 | | | | 737 | |
Photronics, Inc.* | | | 60 | | | | 713 | |
Power Integrations, Inc. | | | 63 | | | | 7,688 | |
Qorvo, Inc.* | | | 224 | | | | 28,706 | |
See Notes to Financial Statements.
| | | | |
| PGIM Day One Underlying Funds | | | 143 | |
PGIM QMA US Broad Market Index Fund
Schedule of Investments (continued)
as of July 31, 2020
| | | | | | | | |
| | |
| Description | | Shares | | | Value | |
| | |
COMMON STOCKS (Continued) | | | | | | | | |
| | |
Semiconductors & Semiconductor Equipment (cont’d.) | | | | | | | | |
QUALCOMM, Inc. | | | 2,212 | | | $ | 233,609 | |
Rambus, Inc.* | | | 150 | | | | 2,214 | |
Semtech Corp.* | | | 140 | | | | 7,802 | |
Silicon Laboratories, Inc.* | | | 90 | | | | 9,046 | |
Skyworks Solutions, Inc. | | | 330 | | | | 48,041 | |
SMART Global Holdings, Inc.* | | | 20 | | | | 558 | |
SolarEdge Technologies, Inc.* | | | 110 | | | | 19,261 | |
Synaptics, Inc.* | | | 70 | | | | 5,601 | |
Teradyne, Inc. | | | 324 | | | | 28,823 | |
Texas Instruments, Inc. | | | 1,791 | | | | 228,442 | |
Ultra Clean Holdings, Inc.* | | | 35 | | | | 1,053 | |
Universal Display Corp. | | | 90 | | | | 15,700 | |
Veeco Instruments, Inc.* | | | 25 | | | | 338 | |
Xilinx, Inc. | | | 474 | | | | 50,884 | |
| | | | | | | | |
| | |
| | | | | | | 2,709,924 | |
| | |
Software 8.0% | | | | | | | | |
8x8, Inc.* | | | 140 | | | | 2,226 | |
ACI Worldwide, Inc.* | | | 230 | | | | 6,162 | |
Adobe, Inc.* | | | 946 | | | | 420,327 | |
Agilysys, Inc.* | | | 40 | | | | 838 | |
Alarm.com Holdings, Inc.* | | | 90 | | | | 6,304 | |
ANSYS, Inc.* | | | 172 | | | | 53,423 | |
Autodesk, Inc.* | | | 432 | | | | 102,138 | |
Blackbaud, Inc. | | | 112 | | | | 7,004 | |
Bottomline Technologies DE, Inc.* | | | 90 | | | | 4,343 | |
Cadence Design Systems, Inc.* | | | 550 | | | | 60,087 | |
CDK Global, Inc. | | | 240 | | | | 10,910 | |
Ceridian HCM Holding, Inc.* | | | 200 | | | | 15,658 | |
Citrix Systems, Inc. | | | 230 | | | | 32,835 | |
CommVault Systems, Inc.* | | | 68 | | | | 2,997 | |
Ebix, Inc. | | | 28 | | | | 618 | |
Fair Isaac Corp.* | | | 58 | | | | 25,473 | |
Fortinet, Inc.* | | | 270 | | | | 37,341 | |
Intuit, Inc. | | | 514 | | | | 157,474 | |
J2 Global, Inc.* | | | 81 | | | | 4,594 | |
LivePerson, Inc.* | | | 140 | | | | 6,017 | |
LogMeIn, Inc. | | | 107 | | | | 9,182 | |
Manhattan Associates, Inc.* | | | 120 | | | | 11,495 | |
Microsoft Corp. | | | 14,828 | | | | 3,039,888 | |
MicroStrategy, Inc. (Class A Stock)* | | | 16 | | | | 1,983 | |
See Notes to Financial Statements.
PGIM QMA US Broad Market Index Fund
Schedule of Investments (continued)
as of July 31, 2020
| | | | | | | | |
| | |
| Description | | Shares | | | Value | |
| | |
COMMON STOCKS (Continued) | | | | | | | | |
| | |
Software (cont’d.) | | | | | | | | |
NortonLifeLock, Inc. | | | 1,050 | | | $ | 22,523 | |
OneSpan, Inc.* | | | 30 | | | | 934 | |
Oracle Corp. | | | 4,080 | | | | 226,236 | |
Paycom Software, Inc.* | | | 95 | | | | 27,015 | |
Paylocity Holding Corp.* | | | 80 | | | | 10,656 | |
Progress Software Corp. | | | 78 | | | | 2,719 | |
PTC, Inc.* | | | 210 | | | | 17,968 | |
Qualys, Inc.* | | | 78 | | | | 9,631 | |
salesforce.com, Inc.* | | | 1,765 | | | | 343,910 | |
ServiceNow, Inc.* | | | 375 | | | | 164,700 | |
SPS Commerce, Inc.* | | | 76 | | | | 5,713 | |
Synopsys, Inc.* | | | 300 | | | | 59,766 | |
Teradata Corp.* | | | 170 | | | | 3,570 | |
Tyler Technologies, Inc.* | | | 82 | | | | 29,295 | |
Xperi Holding Corp. | | | 215 | | | | 3,965 | |
| | | | | | | | |
| | |
| | | | | | | 4,947,918 | |
| | |
Specialty Retail 2.3% | | | | | | | | |
Aaron’s, Inc. | | | 150 | | | | 7,827 | |
Abercrombie & Fitch Co. (Class A Stock) | | | 100 | | | | 963 | |
Advance Auto Parts, Inc. | | | 138 | | | | 20,719 | |
American Eagle Outfitters, Inc. | | | 240 | | | | 2,400 | |
America’s Car-Mart, Inc.* | | | 10 | | | | 952 | |
Asbury Automotive Group, Inc.* | | | 38 | | | | 3,806 | |
AutoNation, Inc.* | | | 109 | | | | 5,596 | |
AutoZone, Inc.* | | | 46 | | | | 55,541 | |
Barnes & Noble Education, Inc.* | | | 40 | | | | 85 | |
Bed Bath & Beyond, Inc. | | | 190 | | | | 2,056 | |
Best Buy Co., Inc. | | | 446 | | | | 44,417 | |
Boot Barn Holdings, Inc.* | | | 40 | | | | 774 | |
Buckle, Inc. (The) | | | 20 | | | | 321 | |
Caleres, Inc. | | | 53 | | | | 334 | |
CarMax, Inc.* | | | 315 | | | | 30,546 | |
Cato Corp. (The) (Class A Stock) | | | 20 | | | | 144 | |
Chico’s FAS, Inc. | | | 110 | | | | 140 | |
Children’s Place, Inc. (The) | | | 24 | | | | 586 | |
Conn’s, Inc.* | | | 30 | | | | 299 | |
Designer Brands, Inc. (Class A Stock) | | | 90 | | | | 532 | |
Dick’s Sporting Goods, Inc. | | | 110 | | | | 5,018 | |
Express, Inc.* | | | 30 | | | | 30 | |
Five Below, Inc.* | | | 120 | | | | 13,069 | |
See Notes to Financial Statements.
| | | | |
| PGIM Day One Underlying Funds | | | 145 | |
PGIM QMA US Broad Market Index Fund
Schedule of Investments (continued)
as of July 31, 2020
| | | | | | | | |
| | |
| Description | | Shares | | | Value | |
| | |
COMMON STOCKS (Continued) | | | | | | | | |
| | |
Specialty Retail (cont’d.) | | | | | | | | |
Foot Locker, Inc. | | | 180 | | | $ | 5,290 | |
GameStop Corp. (Class A Stock)* | | | 30 | | | | 120 | |
Gap, Inc. (The) | | | 320 | | | | 4,278 | |
Genesco, Inc.* | | | 30 | | | | 467 | |
Group 1 Automotive, Inc. | | | 36 | | | | 3,025 | |
Guess?, Inc. | | | 40 | | | | 414 | |
Haverty Furniture Cos., Inc. | | | 20 | | | | 284 | |
Hibbett Sports, Inc.* | | | 10 | | | | 232 | |
Home Depot, Inc. (The) | | | 2,105 | | | | 558,856 | |
L Brands, Inc. | | | 450 | | | | 10,984 | |
Lithia Motors, Inc. (Class A Stock) | | | 50 | | | | 11,457 | |
Lowe’s Cos., Inc. | | | 1,474 | | | | 219,493 | |
Lumber Liquidators Holdings, Inc.* | | | 30 | | | | 670 | |
MarineMax, Inc.* | | | 26 | | | | 721 | |
Michaels Cos., Inc. (The)* | | | 110 | | | | 790 | |
Monro, Inc. | | | 83 | | | | 4,673 | |
Murphy USA, Inc.* | | | 54 | | | | 7,150 | |
ODP Corp. (The) | | | 69 | | | | 1,523 | |
O’Reilly Automotive, Inc.* | | | 145 | | | | 69,220 | |
Rent-A-Center, Inc. | | | 80 | | | | 2,314 | |
RH* | | | 40 | | | | 11,497 | |
Ross Stores, Inc. | | | 698 | | | | 62,590 | |
Sally Beauty Holdings, Inc.* | | | 172 | | | | 1,997 | |
Shoe Carnival, Inc. | | | 20 | | | | 491 | |
Signet Jewelers Ltd. | | | 80 | | | | 859 | |
Sleep Number Corp.* | | | 40 | | | | 1,860 | |
Sonic Automotive, Inc. (Class A Stock) | | | 60 | | | | 2,287 | |
Tiffany & Co. | | | 212 | | | | 26,576 | |
TJX Cos., Inc. (The) | | | 2,330 | | | | 121,137 | |
Tractor Supply Co. | | | 240 | | | | 34,258 | |
Ulta Beauty, Inc.* | | | 112 | | | | 21,615 | |
Urban Outfitters, Inc.* | | | 100 | | | | 1,654 | |
Williams-Sonoma, Inc. | | | 160 | | | | 13,939 | |
Zumiez, Inc.* | | | 20 | | | | 462 | |
| | | | | | | | |
| | |
| | | | | | | 1,399,338 | |
| | |
Technology Hardware, Storage & Peripherals 5.7% | | | | | | | | |
3D Systems Corp.* | | | 140 | | | | 923 | |
Apple, Inc. | | | 7,965 | | | | 3,385,443 | |
Diebold Nixdorf, Inc.* | | | 60 | | | | 418 | |
Hewlett Packard Enterprise Co. | | | 2,494 | | | | 24,616 | |
See Notes to Financial Statements.
PGIM QMA US Broad Market Index Fund
Schedule of Investments (continued)
as of July 31, 2020
| | | | | | | | |
| | |
| Description | | Shares | | | Value | |
| | |
COMMON STOCKS (Continued) | | | | | | | | |
| | |
Technology Hardware, Storage & Peripherals (cont’d.) | | | | | | | | |
HP, Inc. | | | 2,770 | | | $ | 48,697 | |
NCR Corp.* | | | 184 | | | | 3,391 | |
NetApp, Inc. | | | 430 | | | | 19,049 | |
Seagate Technology PLC | | | 460 | | | | 20,801 | |
Western Digital Corp. | | | 582 | | | | 25,084 | |
Xerox Holdings Corp. | | | 297 | | | | 4,945 | |
| | | | | | | | |
| | |
| | | | | | | 3,533,367 | |
| | |
Textiles, Apparel & Luxury Goods 0.6% | | | | | | | | |
Capri Holdings Ltd.* | | | 230 | | | | 3,446 | |
Carter’s, Inc. | | | 90 | | | | 7,085 | |
Columbia Sportswear Co. | | | 70 | | | | 5,309 | |
Crocs, Inc.* | | | 110 | | | | 3,954 | |
Deckers Outdoor Corp.* | | | 61 | | | | 12,764 | |
Fossil Group, Inc.* | | | 40 | | | | 132 | |
G-III Apparel Group Ltd.* | | | 60 | | | | 593 | |
Hanesbrands, Inc. | | | 673 | | | | 9,510 | |
Kontoor Brands, Inc. | | | 71 | | | | 1,360 | |
Movado Group, Inc. | | | 20 | | | | 193 | |
NIKE, Inc. (Class B Stock) | | | 2,428 | | | | 236,997 | |
Oxford Industries, Inc. | | | 30 | | | | 1,288 | |
PVH Corp. | | | 138 | | | | 6,715 | |
Ralph Lauren Corp. | | | 90 | | | | 6,417 | |
Skechers U.S.A., Inc. (Class A Stock)* | | | 270 | | | | 7,906 | |
Steven Madden Ltd. | | | 120 | | | | 2,542 | |
Tapestry, Inc. | | | 448 | | | | 5,985 | |
Under Armour, Inc. (Class A Stock)* | | | 270 | | | | 2,840 | |
Under Armour, Inc. (Class C Stock)* | | | 280 | | | | 2,657 | |
Unifi, Inc.* | | | 20 | | | | 239 | |
Vera Bradley, Inc.* | | | 30 | | | | 132 | |
VF Corp. | | | 623 | | | | 37,604 | |
Wolverine World Wide, Inc. | | | 130 | | | | 3,125 | |
| | | | | | | | |
| | |
| | | | | | | 358,793 | |
| | |
Thrifts & Mortgage Finance 0.0% | | | | | | | | |
Axos Financial, Inc.* | | | 64 | | | | 1,434 | |
Essent Group Ltd. | | | 220 | | | | 7,883 | |
Flagstar Bancorp, Inc. | | | 40 | | | | 1,255 | |
HomeStreet, Inc. | | | 30 | | | | 793 | |
Meta Financial Group, Inc. | | | 42 | | | | 784 | |
See Notes to Financial Statements.
| | | | |
| PGIM Day One Underlying Funds | | | 147 | |
PGIM QMA US Broad Market Index Fund
Schedule of Investments (continued)
as of July 31, 2020
| | | | | | | | |
| | |
| Description | | Shares | | | Value | |
| | |
COMMON STOCKS (Continued) | | | | | | | | |
| | |
Thrifts & Mortgage Finance (cont’d.) | | | | | | | | |
New York Community Bancorp, Inc. | | | 900 | | | $ | 9,477 | |
NMI Holdings, Inc. (Class A Stock)* | | | 135 | | | | 2,095 | |
Northfield Bancorp, Inc. | | | 30 | | | | 288 | |
Northwest Bancshares, Inc. | | | 170 | | | | 1,675 | |
Provident Financial Services, Inc. | | | 90 | | | | 1,229 | |
TrustCo Bank Corp. | | | 50 | | | | 290 | |
Walker & Dunlop, Inc. | | | 52 | | | | 2,621 | |
Washington Federal, Inc. | | | 110 | | | | 2,567 | |
| | | | | | | | |
| | |
| | | | | | | 32,391 | |
| | |
Tobacco 0.6% | | | | | | | | |
Altria Group, Inc. | | | 3,646 | | | | 150,033 | |
Philip Morris International, Inc. | | | 3,048 | | | | 234,117 | |
Universal Corp. | | | 38 | | | | 1,602 | |
Vector Group Ltd. | | | 178 | | | | 1,570 | |
| | | | | | | | |
| | |
| | | | | | | 387,322 | |
| | |
Trading Companies & Distributors 0.2% | | | | | | | | |
Applied Industrial Technologies, Inc. | | | 90 | | | | 5,681 | |
DXP Enterprises, Inc.* | | | 20 | | | | 337 | |
Fastenal Co. | | | 1,110 | | | | 52,214 | |
Foundation Building Materials, Inc.* | | | 30 | | | | 412 | |
GATX Corp. | | | 60 | | | | 3,659 | |
GMS, Inc.* | | | 60 | | | | 1,406 | |
MSC Industrial Direct Co., Inc. (Class A Stock) | | | 100 | | | | 6,601 | |
NOW, Inc.* | | | 150 | | | | 1,182 | |
United Rentals, Inc.* | | | 156 | | | | 24,238 | |
Univar Solutions, Inc.* | | | 240 | | | | 4,241 | |
Veritiv Corp.* | | | 6 | | | | 92 | |
W.W. Grainger, Inc. | | | 88 | | | | 30,055 | |
Watsco, Inc. | | | 65 | | | | 15,344 | |
| | | | | | | | |
| | |
| | | | | | | 145,462 | |
| | |
Water Utilities 0.1% | | | | | | | | |
American States Water Co. | | | 70 | | | | 5,381 | |
American Water Works Co., Inc. | | | 358 | | | | 52,723 | |
California Water Service Group | | | 80 | | | | 3,750 | |
Essential Utilities, Inc. | | | 430 | | | | 19,500 | |
| | | | | | | | |
| | |
| | | | | | | 81,354 | |
See Notes to Financial Statements.
PGIM QMA US Broad Market Index Fund
Schedule of Investments (continued)
as of July 31, 2020
| | | | | | | | |
| | |
| Description | | Shares | | | Value | |
| | |
COMMON STOCKS (Continued) | | | | | | | | |
| | |
Wireless Telecommunication Services 0.2% | | | | | | | | |
Shenandoah Telecommunications Co. | | | 100 | | | $ | 5,027 | |
Spok Holdings, Inc. | | | 30 | | | | 301 | |
Telephone & Data Systems, Inc. | | | 120 | | | | 2,330 | |
T-Mobile US, Inc.* | | | 1,150 | | | | 123,487 | |
| | | | | | | | |
| | |
| | | | | | | 131,145 | |
| | | | | | | | |
| | |
TOTAL COMMON STOCKS
(cost $44,921,753) | | | | | | | 57,435,664 | |
| | | | | | | | |
| | |
EXCHANGE-TRADED FUNDS 3.7% | | | | | | | | |
iShares Core S&P 500 ETF | | | 6,550 | | | | 2,147,221 | |
iShares Core S&P Mid-Cap ETF | | | 500 | | | | 92,965 | |
iShares Core S&P Small-Cap ETF | | | 1,000 | | | | 71,210 | |
| | | | | | | | |
| | |
TOTAL EXCHANGE-TRADED FUNDS
(cost $2,016,409) | | | | | | | 2,311,396 | |
| | | | | | | | |
| | |
| | | Units | | | | |
| | |
WARRANTS* 0.0% | | | | | | | | |
| | |
Oil, Gas & Consumable Fuels | | | | | | | | |
Occidental Petroleum Corp. expiring 08/03/27
(cost $0) | | | 191 | | | | 1,070 | |
| | | | | | | | |
| | |
TOTAL LONG-TERM INVESTMENTS
(cost $46,938,162) | | | | | | | 59,748,130 | |
| | | | | | | | |
| | |
| | | Shares | | | | |
| | |
SHORT-TERM INVESTMENTS 4.0% | | | | | | | | |
| | |
AFFILIATED MUTUAL FUNDS 3.6% | | | | | | | | |
PGIM Core Ultra Short Bond Fund(w) | | | 2,241,935 | | | | 2,241,935 | |
PGIM Institutional Money Market Fund
(cost $200; includes $200 of cash collateral for securities on loan)(b)(w) | | | 200 | | | | 200 | |
| | | | | | | | |
| | |
TOTAL AFFILIATED MUTUAL FUNDS
(cost $2,242,135) | | | | | | | 2,242,135 | |
| | | | | | | | |
See Notes to Financial Statements.
| | | | |
| PGIM Day One Underlying Funds | | | 149 | |
PGIM QMA US Broad Market Index Fund
Schedule of Investments (continued)
as of July 31, 2020
| | | | | | | | | | | | | | | | |
| | | | |
| Description | | Interest
Rate | | | Maturity
Date | | | Principal
Amount (000)# | | | Value | |
| | | |
U.S. TREASURY OBLIGATIONS(k)(n) 0.4% | | | | | | | | | | | | | |
U.S. Treasury Bills | | | 0.090% | | | | 02/25/21 | | | | 50 | | | $ | 49,970 | |
U.S. Treasury Bills | | | 0.150 | | | | 09/17/20 | | | | 200 | | | | 199,978 | |
| | | | | | | | | | | | | | | | |
| | | | |
TOTAL U.S. TREASURY OBLIGATIONS
(cost $249,935) | | | | | | | | | | | | | | | 249,948 | |
| | | | | | | | | | | | | | | | |
| | | | |
TOTAL SHORT-TERM INVESTMENTS
(cost $2,492,070) | | | | | | | | | | | | | | | 2,492,083 | |
| | | | | | | | | | | | | | | | |
| | | | |
TOTAL INVESTMENTS 100.2%
(cost $49,430,232) | | | | | | | | | | | | | | | 62,240,213 | |
Liabilities in excess of other assets(z) (0.2)% | | | | | | | | (131,928 | ) |
| | | | | | | | | | | | | | | | |
| | | | |
NET ASSETS 100.0% | | | | | | | | | | | | | | $ | 62,108,285 | |
| | | | | | | | | | | | | | | | |
See the Glossary for a list of the abbreviation(s) used in the annual report.
| * | Non-income producing security. |
| # | Principal amount is shown in U.S. dollars unless otherwise stated. |
| ^ | Indicates a Level 3 instrument. The aggregate value of Level 3 instruments is $0 and 0.0% of net assets. |
| (a) | All or a portion of security is on loan. The aggregate market value of such securities, including those sold and pending settlement, is $78; cash collateral of $200 (included in liabilities) was received with which the Fund purchased highly liquid short-term investments. In the event of significant appreciation in value of securities on loan on the last business day of the reporting period, the Fund may reflect a collateral value that is less than the market value of the loaned securities and such shortfall is remedied the following business day. |
| (b) | Represents security, or portion thereof, purchased with cash collateral received for securities on loan and includes dividend reinvestment. |
| (g) | An affiliated security. |
| (k) | Represents security, or a portion thereof, segregated as collateral for centrally cleared/exchange-traded derivatives. |
| (n) | Rate shown reflects yield to maturity at purchased date. |
| (w) | PGIM Investments LLC, the manager of the Fund, also serves as manager of the PGIM Core Ultra Short Bond Fund and PGIM Institutional Money Market Fund. |
| (z) | Includes net unrealized appreciation/(depreciation) and/or market value of the below holdings which are excluded from the Schedule of Investments: |
Futures contracts outstanding at July 31, 2020:
| | | | | | | | | | | | | | |
Number
of
Contracts | | Type | | Expiration
Date | | | Current
Notional
Amount | | | Value /
Unrealized
Appreciation
(Depreciation) | |
Long Positions: | | | | | | | | | | | | |
1 | | Russell 2000 E-Mini Index | | | Sep. 2020 | | | $ | 73,890 | | | | $ 2,098 | |
See Notes to Financial Statements.
PGIM QMA US Broad Market Index Fund
Schedule of Investments (continued)
as of July 31, 2020
Futures contracts outstanding at July 31, 2020 (continued):
| | | | | | | | | | | | | | | | | |
Number
of
Contracts | | Type | | Expiration
Date | | Current
Notional
Amount | | Value /
Unrealized
Appreciation
(Depreciation) |
Long Positions (cont’d): | | | | | | | | | | | | | | | |
13 | | S&P 500 E-Mini Index | | | | Sep. 2020 | | | | $ | 2,121,275 | | | | $ | 89,628 | |
1 | | S&P Mid Cap 400 E-Mini Index | | | | Sep. 2020 | | | | | 186,050 | | | | | 7,888 | |
| | | | | | | | | | | | | | | | | |
| | | | | | | | | | | | | | | $ | 99,614 | |
| | | | | | | | | | | | | | | | | |
Summary of Collateral for Centrally Cleared/Exchange-traded Derivatives:
Cash and securities segregated as collateral, including pending settlement for closed positions, to cover requirements for centrally cleared/exchange-traded derivatives are listed by broker as follows:
| | | | | | | | | | |
Broker | | Cash and/or Foreign Currency | | Securities Market Value |
Morgan Stanley & Co. LLC | | | $ | — | | | | $ | 249,948 | |
| | | | | | | | | | |
Fair Value Measurements:
Various inputs are used in determining the value of the Fund’s investments. These inputs are summarized in the three broad levels listed below.
Level 1—unadjusted quoted prices generally in active markets for identical securities.
Level 2—quoted prices for similar securities, interest rates and yield curves, prepayment speeds, foreign currency exchange rates and other observable inputs.
Level 3—unobservable inputs for securities valued in accordance with Board approved fair valuation procedures.
The following is a summary of the inputs used as of July 31, 2020 in valuing such portfolio securities:
| | | | | | | | | | | | |
| | | Level 1 | | | Level 2 | | | Level 3 | |
Investments in Securities | | | | | | | | | | | | |
Assets | | | | | | | | | | | | |
Common Stocks | | | | | | | | | | | | |
Aerospace & Defense | | $ | 907,504 | | | | $ — | | | | $— | |
Air Freight & Logistics | | | 355,708 | | | | — | | | | — | |
Airlines | | | 104,686 | | | | — | | | | — | |
Auto Components | | | 123,754 | | | | — | | | | — | |
Automobiles | | | 136,732 | | | | — | | | | — | |
Banks | | | 2,094,077 | | | | — | | | | — | |
Beverages | | | 907,386 | | | | — | | | | — | |
Biotechnology | | | 1,282,275 | | | | — | | | | — | |
Building Products | | | 317,363 | | | | — | | | | — | |
Capital Markets | | | 1,504,141 | | | | — | | | | — | |
See Notes to Financial Statements.
| | | | |
| PGIM Day One Underlying Funds | | | 151 | |
PGIM QMA US Broad Market Index Fund
Schedule of Investments (continued)
as of July 31, 2020
| | | | | | | | | | | | |
| | | Level 1 | | | Level 2 | | | Level 3 | |
Investments in Securities (continued) | | | | | | | | | | | | |
Assets (continued) | | | | | | | | | | | | |
Common Stocks (continued) | | | | | | | | | | | | |
Chemicals | | $ | 1,086,897 | | | | $ — | | | | $— | |
Commercial Services & Supplies | | | 307,025 | | | | — | | | | — | |
Communications Equipment | | | 550,049 | | | | — | | | | — | |
Construction & Engineering | | | 75,558 | | | | — | | | | — | |
Construction Materials | | | 65,089 | | | | — | | | | — | |
Consumer Finance | | | 259,476 | | | | — | | | | — | |
Containers & Packaging | | | 202,451 | | | | — | | | | — | |
Distributors | | | 71,199 | | | | — | | | | — | |
Diversified Consumer Services | | | 46,947 | | | | — | | | | — | |
Diversified Financial Services | | | 750,872 | | | | — | | | | — | |
Diversified Telecommunication Services | | | 914,820 | | | | — | | | | — | |
Electric Utilities | | | 1,073,318 | | | | — | | | | — | |
Electrical Equipment | | | 312,594 | | | | — | | | | — | |
Electronic Equipment, Instruments & Components | | | 457,766 | | | | — | | | | — | |
Energy Equipment & Services | | | 124,677 | | | | — | | | | — | |
Entertainment | | | 1,098,326 | | | | — | | | | — | |
Equity Real Estate Investment Trusts (REITs) | | | 1,839,346 | | | | — | | | | — | |
Food & Staples Retailing | | | 844,568 | | | | — | | | | — | |
Food Products | | | 681,924 | | | | — | | | | — | |
Gas Utilities | | | 80,912 | | | | — | | | | — | |
Health Care Equipment & Supplies | | | 2,291,309 | | | | — | | | | — | |
Health Care Providers & Services | | | 1,601,832 | | | | — | | | | — | |
Health Care Technology | | | 60,293 | | | | — | | | | — | |
Hotels, Restaurants & Leisure | | | 922,909 | | | | — | | | | — | |
Household Durables | | | 297,862 | | | | — | | | | — | |
Household Products | | | 986,967 | | | | — | | | | — | |
Independent Power & Renewable Electricity Producers | | | 19,647 | | | | — | | | | — | |
Industrial Conglomerates | | | 582,638 | | | | — | | | | — | |
Insurance | | | 1,210,875 | | | | — | | | | — | |
Interactive Media & Services | | | 2,979,622 | | | | — | | | | — | |
Internet & Direct Marketing Retail | | | 2,871,158 | | | | — | | | | — | |
IT Services | | | 3,073,381 | | | | — | | | | — | |
Leisure Products | | | 61,366 | | | | — | | | | — | |
Life Sciences Tools & Services | | | 762,758 | | | | — | | | | — | |
Machinery | | | 1,037,826 | | | | — | | | | — | |
Marine | | | 7,728 | | | | — | | | | — | |
Media | | | 732,314 | | | | — | | | | — | |
Metals & Mining | | | 241,239 | | | | — | | | | — | |
Mortgage Real Estate Investment Trusts (REITs) | | | 9,906 | | | | — | | | | — | |
Multiline Retail | | | 289,901 | | | | — | | | | — | |
Multi-Utilities | | | 550,145 | | | | — | | | | — | |
Oil, Gas & Consumable Fuels | | | 1,269,874 | | | | — | | | | — | |
Paper & Forest Products | | | 17,516 | | | | — | | | | — | |
See Notes to Financial Statements.
PGIM QMA US Broad Market Index Fund
Schedule of Investments (continued)
as of July 31, 2020
| | | | | | | | | | | | |
| | | Level 1 | | | Level 2 | | | Level 3 | |
Investments in Securities (continued) | | | | | | | | | | | | |
Assets (continued) | | | | | | | | | | | | |
Common Stocks (continued) | | | | | | | | | | | | |
Personal Products | | $ | 105,209 | | | | $ — | | | | $— | |
Pharmaceuticals | | | 2,294,918 | | | | — | | | | — | |
Professional Services | | | 238,332 | | | | — | | | | — | |
Real Estate Management & Development | | | 43,796 | | | | — | | | | — | |
Road & Rail | | | 569,889 | | | | — | | | | — | |
Semiconductors & Semiconductor Equipment | | | 2,709,924 | | | | — | | | | — | |
Software | | | 4,947,918 | | | | — | | | | — | |
Specialty Retail | | | 1,399,338 | | | | — | | | | — | |
Technology Hardware, Storage & Peripherals | | | 3,533,367 | | | | — | | | | — | |
Textiles, Apparel & Luxury Goods | | | 358,793 | | | | — | | | | — | |
Thrifts & Mortgage Finance | | | 32,391 | | | | — | | | | — | |
Tobacco | | | 387,322 | | | | — | | | | — | |
Trading Companies & Distributors | | | 145,462 | | | | — | | | | — | |
Water Utilities | | | 81,354 | | | | — | | | | — | |
Wireless Telecommunication Services | | | 131,145 | | | | — | | | | — | |
Exchange-Traded Funds | | | 2,311,396 | | | | — | | | | — | |
Warrants | | | 1,070 | | | | — | | | | — | |
Affiliated Mutual Funds | | | 2,242,135 | | | | — | | | | — | |
U.S. Treasury Obligations | | | — | | | | 249,948 | | | | — | |
| | | | | | | | | | | | |
Total | | $ | 61,990,265 | | | $ | 249,948 | | | | $— | |
| | | | | | | | | | | | |
| | | |
Other Financial Instruments* | | | | | | | | | | | | |
Assets | | | | | | | | | | | | |
Futures Contracts | | $ | 99,614 | | | $ | — | | | | $— | |
| | | | | | | | | | | | |
| * | Other financial instruments are derivative instruments not reflected in the Schedule of Investments, such as futures, forwards and centrally cleared swap contracts, which are recorded at the unrealized appreciation (depreciation) on the instrument, and OTC swap contracts which are recorded at fair value. |
Industry Classification:
The industry classification of investments and liabilities in excess of other assets shown as a percentage of net assets as of July 31, 2020 were as follows (unaudited):
| | | | |
Software | | | 8.0 | % |
Technology Hardware, Storage & Peripherals | | | 5.7 | |
IT Services | | | 4.9 | |
Interactive Media & Services | | | 4.8 | |
Internet & Direct Marketing Retail | | | 4.6 | |
Semiconductors & Semiconductor Equipment | | | 4.4 | |
Exchange-Traded Funds | | | 3.7 | |
| | | | |
Pharmaceuticals | | | 3.7 | % |
Health Care Equipment & Supplies | | | 3.7 | |
Affiliated Mutual Funds (0.0% represents investments purchased with collateral from securities on loan) | | | 3.6 | |
Banks | | | 3.4 | |
Equity Real Estate Investment Trusts (REITs) | | | 3.0 | |
Health Care Providers & Services | | | 2.6 | |
See Notes to Financial Statements.
| | | | |
| PGIM Day One Underlying Funds | | | 153 | |
PGIM QMA US Broad Market Index Fund
Schedule of Investments (continued)
as of July 31, 2020
Industry Classification (continued):
| | | | |
Capital Markets | | | 2.4 | % |
Specialty Retail | | | 2.3 | |
Biotechnology | | | 2.1 | |
Oil, Gas & Consumable Fuels | | | 2.0 | |
Insurance | | | 1.9 | |
Entertainment | | | 1.8 | |
Chemicals | | | 1.7 | |
Electric Utilities | | | 1.7 | |
Machinery | | | 1.7 | |
Household Products | | | 1.6 | |
Hotels, Restaurants & Leisure | | | 1.5 | |
Diversified Telecommunication Services | | | 1.5 | |
Aerospace & Defense | | | 1.5 | |
Beverages | | | 1.5 | |
Food & Staples Retailing | | | 1.4 | |
Life Sciences Tools & Services | | | 1.2 | |
Diversified Financial Services | | | 1.2 | |
Media | | | 1.2 | |
Food Products | | | 1.1 | |
Industrial Conglomerates | | | 0.9 | |
Road & Rail | | | 0.9 | |
Multi-Utilities | | | 0.9 | |
Communications Equipment | | | 0.9 | |
Electronic Equipment, Instruments & Components | | | 0.7 | |
Tobacco | | | 0.6 | |
Textiles, Apparel & Luxury Goods | | | 0.6 | |
Air Freight & Logistics | | | 0.6 | |
Building Products | | | 0.5 | |
Electrical Equipment | | | 0.5 | |
Commercial Services & Supplies | | | 0.5 | |
Household Durables | | | 0.5 | |
Multiline Retail | | | 0.5 | |
Consumer Finance | | | 0.4 | |
U.S. Treasury Obligations | | | 0.4 | |
| | | | |
Metals & Mining | | | 0.4 | % |
Professional Services | | | 0.4 | |
Containers & Packaging | | | 0.3 | |
Trading Companies & Distributors | | | 0.2 | |
Automobiles | | | 0.2 | |
Wireless Telecommunication Services | | | 0.2 | |
Energy Equipment & Services | | | 0.2 | |
Auto Components | | | 0.2 | |
Personal Products | | | 0.2 | |
Airlines | | | 0.2 | |
Water Utilities | | | 0.1 | |
Gas Utilities | | | 0.1 | |
Construction & Engineering | | | 0.1 | |
Distributors | | | 0.1 | |
Construction Materials | | | 0.1 | |
Leisure Products | | | 0.1 | |
Health Care Technology | | | 0.1 | |
Diversified Consumer Services | | | 0.1 | |
Real Estate Management & Development | | | 0.1 | |
Thrifts & Mortgage Finance | | | 0.0 | * |
Independent Power & Renewable Electricity Producers | | | 0.0 | * |
Paper & Forest Products | | | 0.0 | * |
Mortgage Real Estate Investment Trusts (REITs) | | | 0.0 | * |
Marine | | | 0.0 | * |
| | | | |
| | | 100.2 | |
Liabilities in excess of other assets | | | (0.2 | ) |
| | | | |
| |
| | | 100.0 | % |
| | | | |
Effects of Derivative Instruments on the Financial Statements and Primary Underlying Risk Exposure:
The Fund invested in derivative instruments during the reporting period. The primary type of risk associated with these derivative instruments is equity contracts risk. See the Notes to Financial Statements for additional detail regarding these derivative instruments and their risks. The effect of such derivative instruments on the Fund’s financial position and financial performance as reflected in the Statement of Assets and Liabilities and Statement of Operations is presented in the summary below.
See Notes to Financial Statements.
PGIM QMA US Broad Market Index Fund
Schedule of Investments (continued)
as of July 31, 2020
Fair values of derivative instruments as of July 31, 2020 as presented in the Statement of Assets and Liabilities:
| | | | | | | | | | | | |
| | | Asset Derivatives | | | Liability Derivatives | |
Derivatives not accounted for as
hedging instruments, carried at
fair value | | Statement of
Assets and
Liabilities Location | | Fair
Value | | | Statement of
Assets and
Liabilities Location | | Fair
Value | |
| Equity contracts | | Due from/to
broker-variation margin futures | | $ | 99,614 | * | | — | | $ | — | |
| Equity contracts | | Unaffiliated investments | | | 1,070 | | | — | | | — | |
| | | | | | | | | | | | |
| | | | $ | 100,684 | | | | | $ | — | |
| | | | | | | | | | | | |
| * | Includes cumulative appreciation (depreciation) as reported in the schedule of open futures and centrally cleared swap contracts. Only unsettled variation margin receivable (payable) is reported within the Statement of Assets and Liabilities. |
The effects of derivative instruments on the Statement of Operations for the year ended July 31, 2020 are as follows:
| | | | | | | | | | |
Amount of Realized Gain (Loss) on Derivatives Recognized in Income |
Derivatives not accounted for as hedging instruments, carried at fair value | | Rights(1) | | Futures |
Equity contracts | | | $ | 146 | | | | $ | 261,110 | |
| | | | | | | | | | |
| (1) | Included in net realized gain (loss) on investment transactions in the Statement of Operations. |
| | | | | | | | | | | | | | | |
Change in Unrealized Appreciation (Depreciation) on Derivatives Recognized in Income |
Derivatives not accounted for
as hedging instruments, carried at fair value | | Rights(2) | | Warrants(2) | | Futures |
Equity contracts | | | $ | 17 | | | | $ | 1,070 | | | | $ | 63,230 | |
| | | | | | | | | | | | | | | |
| (2) | Included in net change in unrealized appreciation (depreciation) on investments in the Statement of Operations. |
For the year ended July 31, 2020, the Fund’s average volume of derivative activities is as follows:
|
Futures
Contracts—
Long
Positions(1) |
| $1,865,398 |
| (1) | Notional Amount in USD. |
See Notes to Financial Statements.
| | | | |
| PGIM Day One Underlying Funds | | | 155 | |
PGIM QMA US Broad Market Index Fund
Schedule of Investments (continued)
as of July 31, 2020
Financial Instruments/Transactions—Summary of Offsetting and Netting Arrangements:
The Fund entered into financial instruments/transactions during the reporting period that are either offset in accordance with current requirements or are subject to enforceable master netting arrangements or similar agreements that permit offsetting. The information about offsetting and related netting arrangements for financial instruments/transactions where the legal right to set-off exists is presented in the summary below.
Offsetting of financial instrument/transaction assets and liabilities:
| | | | | | | | | | | | | | | |
Description | | Gross Market
Value of
Recognized
Assets/(Liabilities) | | Collateral
Pledged/(Received)(1) | | Net
Amount |
Securities on Loan | | | $ | 78 | | | | $ | (78 | ) | | | $ | — | |
| | | | | | | | | | | | | | | |
| (1) | Collateral amount disclosed by the Fund is limited to the market value of financial instruments/transactions. |
See Notes to Financial Statements.
PGIM QMA US Broad Market Index Fund
Statement of Assets & Liabilities
as of July 31, 2020
| | | | |
Assets | | | | |
Investments at value, including securities on loan of $78: | | | | |
Unaffiliated investments (cost $47,116,689) | | $ | 59,949,283 | |
Affiliated investments (cost $2,313,543) | | | 2,290,930 | |
Cash | | | 104 | |
Receivable for Fund shares sold | | | 117,599 | |
Receivable for investments sold | | | 80,153 | |
Dividends and interest receivable | | | 53,714 | |
Due from Manager | | | 11,683 | |
Due from broker—variation margin futures | | | 7,390 | |
| | | | |
| |
Total Assets | | | 62,510,856 | |
| | | | |
Liabilities | | | | |
Payable for investments purchased | | | 225,799 | |
Payable for Fund shares reacquired | | | 111,557 | |
Audit fee payable | | | 24,482 | |
Custodian and accounting fees payable | | | 22,844 | |
Accrued expenses and other liabilities | | | 16,708 | |
Trustees’ fees payable | | | 911 | |
Payable to broker for collateral for securities on loan | | | 200 | |
Affiliated transfer agent fee payable | | | 70 | |
| | | | |
Total Liabilities | | | 402,571 | |
| | | | |
| |
Net Assets | | $ | 62,108,285 | |
| | | | |
| | | | |
Net assets were comprised of: | | | | |
Shares of beneficial interest, at par | | $ | 4,197 | |
Paid-in capital in excess of par | | | 49,968,927 | |
Total distributable earnings (loss) | | | 12,135,161 | |
| | | | |
| |
Net assets, July 31, 2020 | | $ | 62,108,285 | |
| | | | |
Class R6 | | | | |
Net asset value, offering price and redemption price per share, ($62,108,285 ÷ 4,197,410 shares of beneficial interest issued and outstanding) | | $ | 14.80 | |
| | | | |
See Notes to Financial Statements.
| | | | |
| PGIM Day One Underlying Funds | | | 157 | |
PGIM QMA US Broad Market Index Fund
Statement of Operations
Year Ended July 31, 2020
| | | | |
Net Investment Income (Loss) | | | | |
Income | | | | |
Unaffiliated dividend income (net of $18 foreign withholding tax) | | $ | 915,594 | |
Affiliated dividend income | | | 28,693 | |
Interest income | | | 1,709 | |
Income from securities lending, net (including affiliated income of $20) | | | 107 | |
| | | | |
| |
Total income | | | 946,103 | |
| | | | |
| |
Expenses | | | | |
Management fee | | | 89,260 | |
Custodian and accounting fees | | | 71,812 | |
Audit fee | | | 24,482 | |
Shareholders’ reports | | | 23,136 | |
Legal fees and expenses | | | 18,109 | |
Trustees’ fees | | | 11,148 | |
Commitment fee on syndicated credit agreement | | | 2,424 | |
Insurance expense | | | 1,000 | |
SEC registration fees | | | 700 | |
Transfer agent’s fees and expenses (including affiliated expense of $461) | | | 573 | |
Registration fees | | | 249 | |
Miscellaneous | | | 12,510 | |
| | | | |
| |
Total expenses | | | 255,403 | |
Less: Fee waiver and/or expense reimbursement | | | (156,227 | ) |
| | | | |
| |
Net expenses | | | 99,176 | |
| | | | |
Net investment income (loss) | | | 846,927 | |
| | | | |
Realized And Unrealized Gain (Loss) On Investments | | | | |
Net realized gain (loss) on: | | | | |
Investment transactions (including affiliated of $(4,480)) | | | (1,250,951 | ) |
Futures transactions | | | 261,110 | |
| | | | |
| | | (989,841 | ) |
| | | | |
Net change in unrealized appreciation (depreciation) on: | | | | |
Investments (including affiliated of $(21,331)) | | | 5,471,057 | |
Futures | | | 63,230 | |
| | | | |
| | | 5,534,287 | |
| | | | |
Net gain (loss) on investment transactions | | | 4,544,446 | |
| | | | |
| |
Net Increase (Decrease) In Net Assets Resulting From Operations | | $ | 5,391,373 | |
| | | | |
See Notes to Financial Statements.
PGIM QMA US Broad Market Index Fund
Statements of Changes in Net Assets
| | | | | | | | |
| |
| | | Year Ended
July 31, | |
| | | 2020 | | | 2019 | |
Increase (Decrease) in Net Assets | | | | | | | | |
Operations | | | | | | | | |
Net investment income (loss) | | $ | 846,927 | | | $ | 724,657 | |
Net realized gain (loss) on investment transactions | | | (989,841 | ) | | | (137,799 | ) |
Net change in unrealized appreciation (depreciation) on investments | | | 5,534,287 | | | | 2,247,372 | |
| | | | | | | | |
Net increase (decrease) in net assets resulting from operations | | | 5,391,373 | | | | 2,834,230 | |
| | | | | | | | |
Dividends and Distributions | | | | | | | | |
Distributions from distributable earnings | | | | | | | | |
Class R6 | | | (851,368 | ) | | | (830,039 | ) |
| | | | | | | | |
Fund share transactions | | | | | | | | |
Net proceeds from shares sold | | | 29,074,039 | | | | 16,428,009 | |
Net asset value of shares issued in reinvestment of dividends and distributions | | | 851,368 | | | | 830,039 | |
Cost of shares reacquired | | | (17,490,670 | ) | | | (11,148,657 | ) |
| | | | | | | | |
Net increase (decrease) in net assets from Fund share transactions | | | 12,434,737 | | | | 6,109,391 | |
| | | | | | | | |
Total increase (decrease) | | | 16,974,742 | | | | 8,113,582 | |
| | |
Net Assets: | | | | | | | | |
Beginning of year | | | 45,133,543 | | | | 37,019,961 | |
| | | | | | | | |
End of year | | $ | 62,108,285 | | | $ | 45,133,543 | |
| | | | | | | | |
See Notes to Financial Statements.
| | | | |
| PGIM Day One Underlying Funds | | | 159 | |
Notes to Financial Statements/Consolidated Financial Statements
1. Organization
Prudential Investment Portfolios 2 (“PIP2”) is registered under the Investment Company Act of 1940, as amended (“1940 Act”), as an open-end management investment company. PIP2 consists of eleven separate series: PGIM Core Conservative Bond Fund, PGIM Core Short-Term Bond Fund, PGIM Core Ultra Short Bond Fund, PGIM Institutional Money Market Fund, PGIM Jennison Small-Cap Core Equity Fund, PGIM QMA Emerging Markets Equity Fund, PGIM QMA International Developed Markets Index Fund, PGIM QMA Mid-Cap Core Equity Fund, PGIM QMA US Broad Market Index Fund and PGIM TIPS Fund, each of which are diversified funds for purposes of the 1940 Act and PGIM QMA Commodity Strategies Fund (the “Commodity Strategies Fund”), which is a non-diversified fund for purposes of the 1940 Act and may invest a greater percentage of its assets in the securities of a single company or other issuer than a diversified fund. These financial statements (consolidated financial statements for Commodity Strategies Fund) relate only to the PGIM Jennison Small-Cap Core Equity Fund, PGIM Core Conservative Bond Fund, PGIM TIPS Fund, Commodity Strategies Fund, PGIM QMA Mid-Cap Core Equity Fund and PGIM QMA US Broad Market Index Fund (each, a “Fund” and collectively, the “Funds”).
The Commodity Strategies Fund wholly owns and controls the PGIM QMA Commodity Strategies Subsidiary, Ltd. (the “Cayman Subsidiary”), a company organized under the laws of the Cayman Islands. The Cayman Subsidiary is not registered as an investment company under the 1940 Act. PIP2’s Board of Trustees has oversight responsibility for the investment activities of the Commodity Strategies Fund, including its investment in the Cayman Subsidiary, and the Commodity Strategies Fund’s role as sole shareholder of the Cayman Subsidiary. Except as otherwise described herein, the Cayman Subsidiary is subject to the same investment restrictions and limitations, and follows the same compliance policies and procedures, as the Commodity Strategies Fund. The consolidated financial statements of the Commodity Strategies Fund include the financial results of its wholly-owned subsidiary.
In accordance with the accounting rules relating to reporting of a wholly-owned subsidiary, the Consolidated Schedule of Investments includes positions of the Commodity Strategies Fund and the Cayman Subsidiary. These consolidated financial statements include the accounts of the Commodity Strategies Fund and the Cayman Subsidiary. All significant inter-company balances and transactions between the Commodity Strategies Fund and the Cayman Subsidiary have been eliminated in consolidation. The Commodity Strategies Fund will seek to gain exposure to commodities, commodities-related instruments, derivatives and other investments by directly investing in those instruments or through investments in the Cayman Subsidiary. The Cayman Subsidiary participates in the same investment objective as the Commodity Strategies Fund. The Cayman Subsidiary pursues its investment objective by investing in commodities, commodities-related instruments, derivatives and other investments. The Cayman Subsidiary (unlike the Commodity Strategies Fund) may invest without limitation in these instruments. However, the Cayman Subsidiary is otherwise
subject to the same fundamental, non-fundamental and certain other investment restrictions as the Commodity Strategies Fund. The portion of the Commodity Strategies Fund’s or Cayman Subsidiary’s assets exposed to any particular commodity, derivative or other investment will vary based on market conditions, but from time to time some exposures could be substantial.
To the extent of the Commodity Strategies Fund’s investment through the Cayman Subsidiary, it will be subject to the risks associated with the commodities, derivatives and other instruments in which the Cayman Subsidiary invests. By investing in the Cayman Subsidiary, the Commodity Strategies Fund is indirectly exposed to the risks associated with the Cayman Subsidiary’s investments. The derivatives and other investments held by the Cayman Subsidiary are generally similar to those that are permitted to be held by the Commodity Strategies Fund’s commodity and gold/defensive asset classes and are subject to the same risks that apply to similar investments if held directly by the Commodity Strategies Fund.
The Commodity Strategies Fund’s disclosures and operations are subject to compliance with applicable regulations governing commodity pools in accordance with Commodity Futures Trading Commission rule amendments.
As of July 31, 2020, the Cayman Subsidiary had net assets of $7,308,921 representing 19.0% of the Commodity Strategies Fund’s net assets.
The Funds have the following investment objective(s) and Subadviser(s):
| | | | |
Fund | | Objective(s) | | Subadviser(s) |
| PGIM Jennison Small-Cap Core Equity Fund | | Outperform the Russell 2000 Index. | | Jennison Associates, LLC (“Jennison”)(a wholly-owned subsidiary of PGIM, Inc) |
| PGIM Core Conservative Bond Fund | | Outperform the Bloomberg Barclays U.S. Aggregate Bond Index over full market cycles. | | PGIM Limited and PGIM Fixed Income, a business unit of PGIM, Inc. |
| PGIM TIPS Fund | | Outperform the Bloomberg Barclays US Treasury Inflation-Protected Index. | | PGIM Fixed Income |
| PGIM QMA Commodity Strategies Fund | | Generate returns over time in excess of the Bloomberg Commodity Index. | | QMA LLC (“QMA”)(a wholly-owned subsidiary of PGIM, Inc.) |
| PGIM QMA Mid-Cap Core Equity Fund | | Outperform the S&P Mid-Cap 400 Index. | | QMA |
| PGIM QMA US Broad Market Index Fund | | Seek to provide investment results that approximate the performance of the S&P Composite 1500 Index. | | QMA |
2. Accounting Policies
The Funds follow the investment company accounting and reporting guidance of the Financial Accounting Standards Board (“FASB”) Accounting Standard Codification (“ASC”) Topic 946 Financial Services — Investment Companies. The following accounting policies conform to U.S. generally accepted accounting principles. The Funds consistently follow
| | | | |
| PGIM Day One Underlying Funds | | | 161 | |
Notes to Financial Statements/Consolidated Financial Statements
such policies in the preparation of their financial statements (consolidated financial statements for Commodity Strategies).
Securities Valuation: The Funds hold securities and other assets and liabilities that are fair valued at the close of each day (generally, 4:00 PM Eastern time) the New York Stock Exchange (“NYSE”) is open for trading. Fair value is the price that would be received to sell an asset or paid to transfer a liability in an orderly transaction between market participants on the measurement date. PIP2’s Board of Trustees (the “Board”) has adopted valuation procedures for security valuation under which fair valuation responsibilities have been delegated to PGIM Investments LLC (“PGIM Investments” or the “Manager”). Pursuant to the Board’s delegation, the Manager has established a Valuation Committee responsible for supervising the fair valuation of portfolio securities and other assets and liabilities. The valuation procedures permit the Funds to utilize independent pricing vendor services, quotations from market makers, and alternative valuation methods when market quotations are either not readily available or not deemed representative of fair value. A record of the Valuation Committee’s actions is subject to the Board’s review, approval, and ratification at its next regularly scheduled quarterly meeting.
For the fiscal reporting year-end, securities and other assets and liabilities were fair valued at the close of the last U.S. business day. Trading in certain foreign securities may occur when the NYSE is closed (including weekends and holidays). Because such foreign securities trade in markets that are open on weekends and U.S. holidays, the values of some of the Funds’ foreign investments may change on days when investors cannot purchase or redeem Fund shares.
Various inputs determine how the Funds’ investments are valued, all of which are categorized according to the three broad levels (Level 1, 2, or 3) detailed in the Schedule of Investments and referred to herein as the “fair value hierarchy” in accordance with FASB ASC Topic 820 - Fair Value Measurements and Disclosures (Consolidated Schedule of Investments for Commodity Strategies).
Common and preferred stocks, exchange-traded funds, and derivative instruments, such as futures or options, that are traded on a national securities exchange are valued at the last sale price as of the close of trading on the applicable exchange where the security principally trades. Securities traded via NASDAQ are valued at the NASDAQ official closing price. To the extent these securities are valued at the last sale price or NASDAQ official closing price, they are classified as Level 1 in the fair value hierarchy. In the event that no sale or official closing price on valuation date exists, these securities are generally valued at the mean between the last reported bid and ask prices, or at the last bid price in the absence of an ask price. These securities are classified as Level 2 in the fair value hierarchy.
Foreign equities traded on foreign securities exchanges are generally valued using pricing vendor services that provide model prices derived using adjustment factors based on information such as local closing price, relevant general and sector indices, currency fluctuations, depositary receipts, and futures, as applicable. Securities valued using such model prices are classified as Level 2 in the fair value hierarchy. The models generate an evaluated adjustment factor for each security, which is applied to the local closing price to adjust it for post closing market movements up to the time the Funds are valued. Utilizing that evaluated adjustment factor, the vendor provides an evaluated price for each security. If the vendor does not provide an evaluated price, securities are valued in accordance with exchange-traded common and preferred stock valuation policies discussed above.
Investments in open-end (other than exchange-traded mutual funds) funds are valued at their net asset values as of the close of the NYSE on the date of valuation. These securities are classified as Level 1 in the fair value hierarchy since they may be purchased or sold at their net asset values on the date of valuation.
Fixed income securities traded in the OTC market are generally classified as Level 2 in the fair value hierarchy. Such fixed income securities are typically valued using the market approach which generally involves obtaining data from an approved independent third-party vendor source. The Funds utilize the market approach as the primary method to value securities when market prices of identical or comparable instruments are available. The third-party vendors’ valuation techniques used to derive the evaluated bid price are based on evaluating observable inputs, including but not limited to, yield curves, yield spreads, credit ratings, deal terms, tranche level attributes, default rates, cash flows, prepayment speeds, broker/dealer quotations and reported trades. Certain Level 3 securities are also valued using the market approach when obtaining a single broker quote or when utilizing transaction prices for identical securities that have been used in excess of five business days. During the reporting period, there were no changes to report with respect to the valuation approach and/or valuation techniques discussed above.
Securities and other assets that cannot be priced according to the methods described above are valued based on pricing methodologies approved by the Board. In the event that unobservable inputs are used when determining such valuations, the securities will be classified as Level 3 in the fair value hierarchy.
When determining the fair value of securities, some of the factors influencing the valuation include: the nature of any restrictions on disposition of the securities; assessment of the general liquidity of the securities; the issuer’s financial condition and the markets in which it does business; the cost of the investment; the size of the holding and the capitalization of the issuer; the prices of any recent transactions or bids/offers for such securities or any comparable securities; any available analyst media or other reports or information deemed reliable by the Manager regarding the issuer or the markets or industry in which it operates. Using fair value to price securities may result in a value that is different from a security’s most recent closing price and from the price used by other unaffiliated mutual funds to calculate their net asset values.
| | | | |
| PGIM Day One Underlying Funds | | | 163 | |
Notes to Financial Statements/Consolidated Financial Statements
Illiquid Securities: Pursuant to Rule 22e-4 under the 1940 Act, the Funds have adopted a Board approved Liquidity Risk Management Program (“LRMP”) that requires, among other things, that the Funds limit their illiquid investments that are assets to no more than 15% of net assets. Illiquid securities are those that, because of the absence of a readily available market or due to legal or contractual restrictions on resale, may not reasonably be expected to be sold or disposed of in current market conditions in seven calendar days or less without the sale or disposition significantly changing the market value of the investment. The Funds may find it difficult to sell illiquid securities at the time considered most advantageous by its subadviser(s) and may incur transaction costs that would not be incurred in the sale of securities that were freely marketable.
Restricted Securities: Securities acquired in unregistered, private sales from the issuing company or from an affiliate of the issuer are considered restricted as to disposition under federal securities law (“restricted securities”). Such restricted securities are valued pursuant to the valuation procedures noted above. Restricted securities that would otherwise be considered illiquid investments pursuant to the Funds’ LRMP because of legal restrictions on resale to the general public may be traded among qualified institutional buyers under Rule 144A of the Securities Act of 1933. Therefore, these Rule 144A securities, as well as commercial paper that is sold in private placements under Section 4(2) of the Securities Act of 1933, may be classified higher than “illiquid” under the LRMP (i.e. “moderately liquid” or “less liquid” investments). However, the liquidity of the Funds’ investments in restricted securities could be impaired if trading does not develop or declines.
Foreign Currency Translation: The books and records of the Funds are maintained in U.S. dollars. Foreign currency amounts are translated into U.S. dollars on the following basis:
(i) market value of investment securities, other assets and liabilities — at the current rates of exchange;
(ii) purchases and sales of investment securities, income and expenses — at the rates of exchange prevailing on the respective dates of such transactions.
Although the net assets of the Funds are presented at the foreign exchange rates and market values at the close of the period, the Funds do not generally isolate that portion of the results of operations arising as a result of changes in the foreign exchange rates from the fluctuations arising from changes in the market prices of long-term portfolio securities held at the end of the period. Similarly, the Funds do not isolate the effect of changes in foreign exchange rates from the fluctuations arising from changes in the market prices of long-term portfolio securities sold during the period. Accordingly, holding period realized foreign currency gains (losses) are included in the reported net realized gains (losses) on investment transactions. Notwithstanding the above, the Funds do isolate the effect of
fluctuations in foreign currency exchange rates when determining the gain (loss) upon the sale or maturity of foreign currency denominated debt obligations; such amounts are included in net realized gains (losses) on foreign currency transactions.
Additionally, net realized gains (losses) on foreign currency transactions represent net foreign exchange gains (losses) from the disposition of holdings of foreign currencies, currency gains (losses) realized between the trade and settlement dates on investment transactions, and the difference between the amounts of interest, dividends and foreign withholding taxes recorded on the Funds’ books and the U.S. dollar equivalent amounts actually received or paid. Net unrealized currency gains (losses) arise from valuing foreign currency denominated assets and liabilities (other than investments) at period end exchange rates.
Commodities: The Commodity Strategies Fund gains exposure to commodity markets through direct investment of the Commodity Strategies Fund’s assets or through the Cayman Subsidiary. The Commodity Strategies Fund gains exposure to the commodity markets primarily through exchange-traded futures on commodities held by the Cayman Subsidiary. The Commodity Strategies Fund may invest up to 25% of its total assets in the Cayman Subsidiary. The Cayman Subsidiary may invest in commodity investments without limit. The Commodity Strategies Fund invests in the Cayman Subsidiary in order to gain exposure to commodities within the limitations of the federal tax law requirements applicable to regulated investment companies such as the Commodity Strategies Fund. The Commodity Strategies Fund may invest directly in commodity-linked structured notes (CLNs). The Commodity Strategies Fund may also gain direct exposure to commodities through direct investment in certain exchange-traded funds (ETFs) whose returns are linked to commodities or commodity indices within the limit of applicable tax law. Commodities are assets that have tangible properties, such as oil, agriculture products and precious metals. The value of commodities may be affected by, among other things, changes in overall market movements, commodity index volatility, changes in interest rates, or factors affecting a particular industry or commodity, such as drought, floods, weather, livestock disease, embargos, tariffs and international economic, political and regulatory developments. These factors may have a larger impact on commodity prices and commodity linked instruments than on traditional securities. Certain commodities are also subject to limited pricing flexibility because of supply and demand factors. Others are subject to broad price fluctuations as a result of the volatility of the prices for certain raw materials and the instability of supplies of other materials. These additional variables may create additional risks which subject the Commodity Strategies Fund’s investments to greater volatility than investments in traditional securities.
Financial/Commodity Futures Contracts: A futures contract is an agreement to purchase (long) or sell (short) an agreed amount of securities at a set price for delivery on a future date. Upon entering into a futures contract, the Funds are required to pledge to the broker an amount of cash and/or other assets equal to a certain percentage of the contract amount. This amount is known as the “initial margin.” Subsequent payments, known as “variation margin,” are made or received by the Funds each day, depending on the daily fluctuations
| | | | |
| PGIM Day One Underlying Funds | | | 165 | |
Notes to Financial Statements/Consolidated Financial Statements
in the value of the underlying security. Such variation margin is recorded for financial statement purposes on a daily basis as unrealized gain (loss). When the contract expires or is closed, the gain (loss) is realized and is presented in the Statement of Operations (Consolidated Statement of Operations for Commodity Strategies) as net realized gain (loss) on futures transactions.
The Funds invested in financial and/or commodity futures contracts in order to hedge their existing portfolio securities, or securities the Funds intend to purchase, against fluctuations in value caused by changes in prevailing interest rates. Should interest rates move unexpectedly, the Funds may not achieve the anticipated benefits of the futures contracts and may realize a loss. The Commodity Strategies Fund invested in commodity futures contracts in order to hedge or gain exposure to commodity markets. The use of futures transactions involves the risk of imperfect correlation in movements in the price of futures contracts, interest rates and the underlying hedged assets. Since futures contracts are exchange-traded, there is minimal counterparty credit risk to the Funds since the exchanges’ clearinghouse acts as counterparty to all exchange-traded futures and guarantees the futures contracts against default.
Master Netting Arrangements: PIP2, on behalf of the Funds, is subject to various Master Agreements, or netting arrangements, with select counterparties. These are agreements which a subadviser may have negotiated and entered into on behalf of all or a portion of a Fund. A master netting arrangement between the Fund and the counterparty permits the Fund to offset amounts payable by the Fund to the same counterparty against amounts to be received; and by the receipt of collateral from the counterparty by the Funds to cover the Funds’ exposure to the counterparty. However, there is no assurance that such mitigating factors are easily enforceable. In addition to master netting arrangements, the right to set-off exists when all the conditions are met such that each of the parties owes the other determinable amounts, the reporting party has the right to set-off the amount owed with the amount owed by the other party, the reporting party intends to set-off and the right of set-off is enforceable by law. During the reporting period, there was no intention to settle on a net basis and all amounts are presented on a gross basis on the Statement of Assets and Liabilities (Consolidated Statement of Assets and Liabilities for Commodity Strategies).
Warrants and Rights: Certain Fund held warrants and rights acquired either through a direct purchase or pursuant to corporate actions. Warrants and rights entitle the holder to buy a proportionate amount of common stock, or such other security that the issuer may specify, at a specific price and time through the expiration dates. Such warrants and rights are held as long positions by the Funds until exercised, sold or expired. Warrants and rights are valued at fair value in accordance with the Board approved fair valuation procedures.
Delayed-Delivery Transactions: Certain Funds purchased or sold securities on a when-issued or delayed-delivery and forward commitment basis. These transactions involve a commitment by the Funds to purchase or sell securities for a predetermined price or yield, with payment and delivery taking place beyond the customary settlement period. When delayed-delivery purchases are outstanding, the Funds will set aside and maintain an amount of liquid assets sufficient to meet the purchase price in a segregated account until the settlement date. When purchasing a security on a delayed-delivery basis, the Funds assumes the rights and risks of ownership of the security, including the risk of price and yield fluctuations, and takes such fluctuations into account when determining its net asset value. The Funds may dispose of or renegotiate a delayed-delivery transaction subsequent to establishment, and may sell when-issued securities before they are delivered, which may result in a realized gain (loss). When selling a security on a delayed-delivery basis, the Funds forfeits its eligibility to realize future gains (losses) with respect to the security.
Securities Lending: The Funds lend their portfolio securities to banks and broker-dealers. The loans are secured by collateral at least equal to the market value of the securities loaned. Collateral pledged by each borrower is invested in an affiliated money market fund and is marked to market daily, based on the previous day’s market value, such that the value of the collateral exceeds the value of the loaned securities. In the event of significant appreciation in value of securities on loan on the last business day of the reporting period, the financial statements may reflect a collateral value that is less than the market value of the loaned securities. Such shortfall is remedied as described above. Loans are subject to termination at the option of the borrower or the Fund. Upon termination of the loan, the borrower will return to the Fund securities identical to the loaned securities. Should the borrower of the securities fail financially, the Fund has the right to repurchase the securities in the open market using the collateral.
The Fund recognizes income, net of any rebate and securities lending agent fees, for lending its securities in the form of fees or interest on the investment of any cash received as collateral. The borrower receives all interest and dividends from the securities loaned and such payments are passed back to the lender in amounts equivalent thereto. The Fund also continues to recognize any unrealized gain (loss) in the market price of the securities loaned and on the change in the value of the collateral invested that may occur during the term of the loan. In addition, realized gain (loss) is recognized on changes in the value of the collateral invested upon liquidation of the collateral. Net earnings from securities lending are disclosed in the Statement of Operations.
Mortgage Dollar Rolls: Certain Funds entered into mortgage dollar rolls in which the Funds sell mortgage securities for delivery in the current month, realizing a gain (loss), and simultaneously enter into contracts to repurchase somewhat similar (same type, coupon and maturity) securities on a specified future date. During the roll period, the Funds forgo principal and interest paid on the securities. The Funds are compensated by the interest earned on the cash proceeds of the initial sale and by the lower repurchase price at the future date. The difference between the sale proceeds and the lower repurchase price is recorded as a realized gain on investment transactions. The Funds maintain a segregated
| | | | |
| PGIM Day One Underlying Funds | | | 167 | |
Notes to Financial Statements/Consolidated Financial Statements
account, the dollar value of which is at least equal to its obligations, with respect to dollar rolls. The Funds are subject to the risk that the market value of the securities the Funds are obligated to repurchase under the agreement may decline below the repurchase price.
Equity and Mortgage Real Estate Investment Trusts (collectively equity REITs): Certain Funds invested in equity REITs, which report information on the source of their distributions annually. Based on current and historical information, a portion of distributions received from equity REITs during the period is estimated to be dividend income, capital gain or return of capital and recorded accordingly. When material, these estimates are adjusted periodically when the actual source of distributions is disclosed by the equity REITs.
Securities Transactions and Net Investment Income: Securities transactions are recorded on the trade date. Realized gains (losses) from investment and currency transactions are calculated on the specific identification method. Dividend income is recorded on the ex-date, or for certain foreign securities, when the Funds become aware of such dividends. Interest income, including amortization of premium and accretion of discount on debt securities, as required, is recorded on the accrual basis. Expenses are recorded on an accrual basis, which may require the use of certain estimates by management that may differ from actual.
Taxes: It is each Fund’s policy to continue to meet the requirements of the Internal Revenue Code applicable to regulated investment companies and to distribute all of its taxable net investment income and capital gains, if any, to its shareholders. Therefore, no federal income tax provision is required. Withholding taxes on foreign dividends, interest and capital gains, if any, are recorded, net of reclaimable amounts, at the time the related income is earned.
Dividends and Distributions: PGIM Core Conservative Bond Fund and PGIM TIPS Fund declare daily dividends from net investment income and payment is made monthly. Distributions of net realized capital and currency gains, if any, are made annually. PGIM Jennison Small-Cap Core Equity Fund, PGIM QMA Commodity Strategies Fund, PGIM QMA Mid-Cap Core Equity Fund and PGIM QMA US Broad Market Index Fund expect to pay dividends from net investment income and distributions from net realized capital gains, if any, annually. Dividends and distributions to shareholders, which are determined in accordance with federal income tax regulations and which may differ from generally accepted accounting principles, are recorded on the ex-date. Permanent book/tax differences relating to income and gain (loss) are reclassified between total distributable earnings (loss) and paid-in capital in excess of par, as appropriate.
Estimates: The preparation of financial statements (consolidated financial statements for Commodity Strategies) requires management to make estimates and assumptions that affect the reported amounts and disclosures in the financial statements. Actual results could differ from those estimates.
3. Agreements
PIP2, on behalf of the Funds, has a management agreement with PGIM Investments. Pursuant to this agreement, PGIM Investments has responsibility for all investment advisory services and supervises the Subadviser’s performance of such services. At July 31, 2020, PGIM Investments has engaged the firms referenced in Note 1 as Subadvisers for their respective Funds. In addition, under the management agreement, PGIM Investments provides all of the administrative functions necessary for the organization, operation and management of the Funds. PGIM Investments administers the corporate affairs of the Funds and, in connection therewith, furnishes the Funds with office facilities, together with those ordinary clerical and bookkeeping services which are not being furnished by the Funds’ custodian and the Funds’ transfer agent. PGIM Investments is also responsible for the staffing and management of dedicated groups of legal, marketing, compliance and related personnel necessary for the operation of the Funds. The legal, marketing, compliance and related personnel are also responsible for the management and oversight of the various service providers to the Funds, including, but not limited to, the custodian, transfer agent, and accounting agent.
The management fee payable to the Manager is accrued daily and payable monthly at an annual rate of the Funds’ average daily net assets specified below and PGIM Investments, in turn, pays each subadviser a fee for its services.
| | | | | | |
Fund | | Management Fee | | Effective
Management Fee | | Fee Waivers and/or
Expense Limitations
through November 30, 2021 |
PGIM Jennison Small-Cap Core Equity Fund | | 0.75% | | 0.18% | | contractually limit expenses to 0.95% |
PGIM Core Conservative Bond Fund | | 0.27 | | 0.10 | | contractually limit expenses to 0.50% |
PGIM TIPS Fund | | 0.23 | | 0.05 | | contractually limit expenses to 0.40% |
PGIM QMA Commodity Strategies Fund | | 0.46 | | 0.33 | | contractually limit expenses to 0.80%* |
PGIM QMA Mid-Cap Core Equity Fund | | 0.50 | | 0.03 | | contractually limit expenses to 0.85% |
PGIM QMA US Broad Market Index Fund | | 0.18 | | —# | | contractually limit expenses to 0.20% |
# The management fee amount waived and/or expense reimbursement exceeds the management fee for the current period due to expense limitations described above.
* The Manager has contractually agreed to waive any management fees it receives for the Fund in an amount equal to the management fees paid by the Cayman Subsidiary. This waiver will remain in effect for as long as the Fund remains invested or intends to invest in
| | | | |
| PGIM Day One Underlying Funds | | | 169 | |
Notes to Financial Statements/Consolidated Financial Statements
the Cayman Subsidiary.
PIP2, on behalf of the Funds, has a distribution agreement with Prudential Investment Management Services LLC (“PIMS”), which acts as the distributor of the Class R6 shares of the Funds. No distribution or service fees are paid to PIMS as distributor of the Class R6 shares of the Funds.
PGIM Investments, PIMS, PGIM, Inc., PGIM Limited, Jennison and QMA are indirect, wholly-owned subsidiaries of Prudential Financial, Inc. (“Prudential”).
4. Other Transactions with Affiliates
Prudential Mutual Fund Services LLC (“PMFS”), an affiliate of PGIM Investments and an indirect, wholly-owned subsidiary of Prudential, serves as the Funds’ transfer agent. Transfer agent’s fees and expenses in the Statement of Operations (Consolidated Statement of Operations for Commodity Strategies) include certain out-of-pocket expenses paid to non-affiliates, where applicable.
The Funds may invest their overnight sweep cash in the PGIM Core Ultra Short Bond Fund (the “Core Fund”), and their securities lending cash collateral in the PGIM Institutional Money Market Fund (the “Money Market Fund”). Through the Fund’s investments in the mentioned underlying funds, PGIM Investments and/or its affiliates are paid fees or reimbursed for providing their services. In addition to the realized and unrealized gains on investments in the Core Fund and Money Market Fund, earnings from such investments are disclosed on the Statement of Operations (Consolidated Statement of Operations for Commodity Strategies) as “Affiliated dividend income” and “Income from securities lending, net”, respectively.
The Funds may enter into certain securities purchase or sale transactions under Board approved Rule 17a-7 procedures. Rule 17a-7 is an exemptive rule under the 1940 Act, that subject to certain conditions, permits purchase and sale transactions among affiliated investment companies, or between an investment company and a person that is affiliated solely by reason of having a common (or affiliated) investment adviser, common directors, and/or common officers. Pursuant to the Rule 17a-7 procedures and consistent with guidance issued by the Securities and Exchange Commission (“SEC”), the Funds’ Chief Compliance Officer (“CCO”) prepares a quarterly summary of all such transactions for submission to the Board, together with the CCO’s written representation that all such 17a-7 transactions were effected in accordance with the Funds’ Rule 17a-7 procedures. For the year ended July 31, 2020, no 17a-7 transactions were entered into by the Funds.
5. Portfolio Securities
The aggregate cost of purchases and proceeds from sales of portfolio securities (excluding short-term investments and U.S. Government securities) for the year ended July 31, 2020, were as follows:
| | | | | | | | |
| Fund | | Cost of
Purchases | | | Proceeds
from Sales | |
PGIM Jennison Small-Cap Core Equity Fund | | $ | 12,394,773 | | | $ | 9,370,770 | |
PGIM Core Conservative Bond Fund | | | 53,828,280 | | | | 44,372,142 | |
PGIM TIPS Fund | | | 47,818,480 | | | | 39,232,029 | |
PGIM QMA Commodity Strategies Fund | | | — | | | | — | |
PGIM QMA Mid-Cap Core Equity Fund | | | 30,820,604 | | | | 23,614,898 | |
PGIM QMA US Broad Market Index Fund | | | 22,379,191 | | | | 10,798,180 | |
A summary of the cost of purchases and proceeds from sales of shares of affiliated investments for the year ended July 31, 2020, is presented as follows:
PGIM Jennison Small-Cap Core Equity Fund:
| | | | | | | | | | | | | | | | | | | | | | | | | | | | | | |
Value,
Beginning
of Year | | | Cost of
Purchases | | | Proceeds
from Sales | | | Change in
Unrealized
Gain
(Loss) | | | Realized
Gain
(Loss) | | | Value,
End of Year | | | Shares,
End
of Year | | | Income | |
|
| PGIM Core Ultra Short Bond Fund* | |
| $ | 615,758 | | | $ | 9,192,931 | | | $ | 9,133,112 | | | $ | — | | | $ | — | | | $ | 675,577 | | | | 675,577 | | | $ | 10,983 | |
|
| PGIM Institutional Money Market Fund* | |
| | 154,484 | | | | 3,821,217 | | | | 3,710,239 | | | | 433 | | | | (361 | ) | | | 265,534 | | | | 265,561 | | | | 2,173 | ** |
| | | | | | | | | | | | | | | | | | | | | | | | | | | | | | |
| $ | 770,242 | | | $ | 13,014,148 | | | $ | 12,843,351 | | | $ | 433 | | | $ | (361 | ) | | $ | 941,111 | | | | | | | $ | 13,156 | |
| | | | | | | | | | | | | | | | | | | | | | | | | | | | | | |
PGIM Core Conservative Bond Fund:
| | | | | | | | | | | | | | | | | | | | | | | | | | | | | | |
Value,
Beginning
of Year | | | Cost of
Purchases | | | Proceeds
from Sales | | | Change in
Unrealized
Gain
(Loss) | | | Realized
Gain
(Loss) | | | Value,
End of Year | | | Shares,
End
of Year | | | Income | |
|
| PGIM Core Ultra Short Bond Fund* | |
| $ | 1,058,262 | | | $ | 31,461,446 | | | $ | 27,502,104 | | | $ | — | | | $ | — | | | $ | 5,017,604 | | | | 5,017,604 | | | $ | 23,815 | |
|
| PGIM Institutional Money Market Fund* | |
| | — | | | | 102,332 | | | | 102,332 | | | | — | | | | — | | | | — | | | | — | | | | 4 | ** |
| | | | | | | | | | | | | | | | | | | | | | | | | | | | | | |
| $ | 1,058,262 | | | $ | 31,563,778 | | | $ | 27,604,436 | | | $ | — | | | $ | — | | | $ | 5,017,604 | | | | | | | $ | 23,819 | |
| | | | | | | | | | | | | | | | | | | | | | | | | | | | | | |
PGIM TIPS Fund:
| | | | | | | | | | | | | | | | | | | | | | | | | | | | | | |
Value,
Beginning
of Year | | | Cost of
Purchases | | | Proceeds
from Sales | | | Change in
Unrealized
Gain
(Loss) | | | Realized
Gain
(Loss) | | | Value,
End of Year | | | Shares,
End
of Year | | | Income | |
|
| PGIM Core Ultra Short Bond Fund* | |
| $ | 263,675 | | | $ | 28,915,672 | | | $ | 28,402,605 | | | $ | — | | | $ | — | | | $ | 776,742 | | | | 776,742 | | | $ | 3,140 | |
| | | | | | | | | | | | | | | | | | | | | | | | | | | | | | |
| | | | |
| PGIM Day One Underlying Funds | | | 171 | |
Notes to Financial Statements/Consolidated Financial Statements
PGIM QMA Mid-Cap Core Equity Fund:
| | | | | | | | | | | | | | | | | | | | | | | | | | | | | | |
Value,
Beginning
of Year | | | Cost of
Purchases | | | Proceeds
from Sales | | | Change in
Unrealized
Gain
(Loss) | | | Realized
Gain
(Loss) | | | Value,
End of Year | | | Shares,
End of
Year | | | Income | |
|
| PGIM Core Ultra Short Bond Fund* | |
| $ | 53,552 | | | $ | 11,375,120 | | | $ | 11,384,692 | | | $ | — | | | $ | — | | | $ | 43,980 | | | | 43,980 | | | $ | 1,978 | |
|
| PGIM Institutional Money Market Fund* | |
| | — | | | | 81,841 | | | | 81,836 | | | | — | | | | (5 | ) | | | — | | | | — | | | | 31 | ** |
| | | | | | | | | | | | | | | | | | | | | | | | | | | | | | |
| $ | 53,552 | | | $ | 11,456,961 | | | $ | 11,466,528 | | | $ | — | | | $ | (5 | ) | | $ | 43,980 | | | | | | | $ | 2,009 | |
| | | | | | | | | | | | | | | | | | | | | | | | | | | | | | |
PGIM QMA US Broad Market Index Fund:
| | | | | | | | | | | | | | | | | | | | | | | | | | | | | | |
Value,
Beginning
of Year | | | Cost of
Purchases | | | Proceeds
from Sales | | | Change in
Unrealized
Gain
(Loss) | | | Realized
Gain
(Loss) | | | Value,
End of Year | | | Shares,
End of
Year | | | Income | |
|
| PGIM Core Ultra Short Bond Fund* | |
| $ | 1,696,386 | | | $ | 28,126,708 | | | $ | 27,581,159 | | | $ | — | | | $ | — | | | $ | 2,241,935 | | | | 2,241,935 | | | $ | 25,897 | |
|
| PGIM Institutional Money Market Fund* | |
| | — | | | | 27,644 | | | | 27,437 | | | | — | | | | (7 | ) | | | 200 | | | | 200 | | | | 20 | ** |
|
| Prudential Financial Inc. | |
| | 65,852 | | | | 12,157 | | | | 3,410 | | | | (21,331 | ) | | | (4,473 | ) | | | 48,795 | | | | 770 | | | | 2,796 | |
| | | | | | | | | | | | | | | | | | | | | | | | | | | | | | |
| $ | 1,762,238 | | | $ | 28,166,509 | | | $ | 27,612,006 | | | $ | (21,331 | ) | | $ | (4,480 | ) | | $ | 2,290,930 | | | | | | | $ | 28,713 | |
| | | | | | | | | | | | | | | | | | | | | | | | | | | | | | |
| * | The Fund did not have any capital gain distributions during the reporting period. |
| ** | The amount, or a portion thereof, represents the affiliated securities lending income shown on the Statement of Operations. |
6. Distributions and Tax Information
Distributions to shareholders, which are determined in accordance with federal income tax regulations and which may differ from generally accepted accounting principles, are recorded on the ex-date. In order to present total distributable earnings (loss) and paid-in capital in excess of par on the Statement of Assets and Liabilities that more closely represent their tax character, certain adjustments have been made to total distributable earnings (loss) and paid-in capital in excess of par.
For the year ended July 31, 2020, the adjustments were as follows:
| | | | |
Fund | | Total Distributable
Earnings | | Paid-in
Capital in
Excess of Par |
PGIM Jennison Small-Cap Core Equity Fund (a) | | $9,021 | | $(9,021) |
(a) Write-off of Net Operating Loss
No other fund had any adjustments made.
Net investment income or loss, net realized gains or losses on investment transactions and net assets were not affected by these adjustments.
For the year ended July 31, 2020, the tax character of dividends paid as reflected in the Statement of Changes in Net Assets were as follows:
| | | | | | | | | | | | | | | | |
Fund | | Ordinary
Income | | | Long-Term
Capital Gains | | | Tax Return
of Capital | | | Total Dividends
and Distributions | |
PGIM Jennison Small-Cap Core Equity Fund | | $ | — | | | | $ — | | | | $ — | | | | $ — | |
PGIM Core Conservative Bond Fund | | | 1,252,954 | | | | — | | | | — | | | | 1,252,954 | |
PGIM TIPS Fund | | | 452,976 | | | | 97,873 | | | | — | | | | 550,849 | |
PGIM QMA Commodity Strategies Fund | | | 227,598 | | | | — | | | | 6,154 | | | | 233,752 | |
PGIM QMA Mid-Cap Core Equity Fund | | | 170,308 | | | | — | | | | — | | | | 170,308 | |
PGIM QMA US Broad Market Index Fund | | | 822,301 | | | | 29,067 | | | | — | | | | 851,368 | |
For the year ended July 31, 2019, the tax character of dividends paid as reflected in the Statement of Changes in Net Assets were as follows:
| | | | | | | | | | | | | | | | |
Fund | | Ordinary
Income | | | Long-Term
Capital Gains | | | Tax Return
of Capital | | | Total Dividends
and Distributions | |
PGIM Jennison Small-Cap Core Equity Fund | | $ | 320,529 | | | | $582,054 | | | | $7,281 | | | | $ 909,864 | |
PGIM Core Conservative Bond Fund | | | 1,203,449 | | | | — | | | | — | | | | 1,203,449 | |
PGIM TIPS Fund | | | 827,770 | | | | — | | | | — | | | | 827,770 | |
PGIM QMA Commodity Strategies Fund | | | 530,351 | | | | — | | | | — | | | | 530,351 | |
PGIM QMA Mid-Cap Core Equity Fund | | | 420,188 | | | | 351,376 | | | | — | | | | 771,564 | |
PGIM QMA US Broad Market Index Fund | | | 715,900 | | | | 114,139 | | | | — | | | | 830,039 | |
For the year ended July 31, 2020, the Funds had the following amounts of accumulated undistributed earnings on a tax basis:
| | | | | | | | |
Fund | | Undistributed
Ordinary
Income | | | Undistributed
Long-Term
Capital Gains | |
PGIM Jennison Small-Cap Core Equity Fund | | | $ — | | | | $ — | |
PGIM Core Conservative Bond Fund | | | 98,349 | | | | 278,570 | |
PGIM TIPS Fund | | | — | | | | 615,015 | |
PGIM QMA Commodity Strategies Fund | | | — | | | | — | |
PGIM QMA Mid-Cap Core Equity Fund | | | 70,005 | | | | — | |
PGIM QMA US Broad Market Index Fund | | | 622,936 | | | | 246,035 | |
| | | | |
| PGIM Day One Underlying Funds | | | 173 | |
Notes to Financial Statements/Consolidated Financial Statements
The United States federal income tax basis of the Funds’ investments and the net unrealized appreciation/(depreciation) as of July 31, 2020 were as follows:
| | | | | | | | | | | | | | | | |
Fund | | Tax Basis | | | Gross
Unrealized
Appreciation | | | Gross
Unrealized
Depreciation | | | Net
Unrealized
Appreciation
(Depreciation) | |
PGIM Jennison Small-Cap Core Equity Fund | | | $18,257,603 | | | | $ 5,663,622 | | | | $(1,792,973) | | | | $ 3,870,649 | |
PGIM Core Conservative Bond Fund | | | 57,523,669 | | | | 3,981,146 | | | | (67,800) | | | | 3,913,346 | |
PGIM TIPS Fund | | | 46,432,055 | | | | 2,952,871 | | | | (77,894) | | | | 2,874,977 | |
PGIM QMA Commodity Strategies Fund | | | 44,794,084 | | | | 1,631 | | | | (4,691,444) | | | | (4,689,813) | |
PGIM QMA Mid-Cap Core Equity Fund | | | 20,436,570 | | | | 2,395,174 | | | | (1,551,053) | | | | 844,121 | |
PGIM QMA US Broad Market Index Fund | | | 51,073,637 | | | | 16,370,579 | | | | (5,104,389) | | | | 11,266,190 | |
The difference between book basis and tax basis was primarily attributable to deferred losses on wash sales, amortization of premiums, tax treatment of the investment in the Subsidiary and other book to tax differences.
For federal income tax purposes, the following Funds had a capital loss carryforward as of July 31, 2020 which can be carried forward for an unlimited period. The PGIM Core Conservative Bond Fund and PGIM TIPS Fund utilized approximately $385,000 and $263,000, respectively, of its capital loss carryforward to offset net taxable gains realized in the fiscal year ended July 31, 2020. No capital gains distributions are expected to be paid to shareholders until net gains have been realized in excess of such losses.
| | | | |
| | | Capital Loss
Carryforward | |
PGIM Jennison Small-Cap Core Equity Fund | | | $ 427,000 | |
PGIM QMA Commodity Strategies Fund | | | 1,000 | |
PGIM QMA Mid-Cap Core Equity Fund | | | 1,984,000 | |
The PGIM Jennison Small-Cap Core Equity Fund elected to treat late year ordinary losses of approximately $45,000 as having been incurred the following fiscal year (July 31, 2021). The PGIM QMA Commodity Strategies Fund elected to treat late year ordinary losses of approximately $48,000 as having been incurred the following fiscal year (July 31, 2021).
The Manager has analyzed the Funds’ tax positions taken on federal, state and local income tax returns for all open tax years and has concluded that no provision for income tax is required in the Funds’ financial statements (consolidated financial statements for
Commodity Strategies) for the current reporting period. The Funds’ federal, state and local income and federal excise tax returns for tax years for which the applicable statutes of limitations have not expired are subject to examination by the Internal Revenue Service and state departments of revenue.
7. Capital and Ownership
The Funds offer Class R6 shares. Class R6 shares are not subject to any sales or redemption charge and are available exclusively for sale to a limited group of investors.
PIP2 has authorized an unlimited number of shares of beneficial interest at $0.001 par value per share.
As of July 31, 2020, Prudential, through its affiliated entities, including affiliated funds (if applicable), owned shares of the Funds as follows:
| | | | |
| Fund | | Number of Shares | | Percentage of
Outstanding Shares |
PGIM Jennison Small-Cap Core Equity Fund–Class R6 | | 1,718,077 | | 100.0% |
PGIM Core Conservative Bond Fund–Class R6 | | 5,362,279 | | 100.0 |
PGIM TIPS Fund–Class R6 | | 4,566,413 | | 100.0 |
PGIM QMA Commodity Strategies Fund–Class R6 | | 4,620,654 | | 100.0 |
PGIM QMA Mid-Cap Core Equity Fund–Class R6 | | 2,141,007 | | 100.0 |
PGIM QMA US Broad Market Index Fund–Class R6 | | 4,197,410 | | 100.0 |
At the reporting period end, the number of shareholders holding greater than 5% of the Funds are as follows:
| | | | | | | | |
| | | Affiliated | | Unaffiliated |
| Fund | | Number of
Shareholders | | Percentage of
Outstanding Shares | | Number of
Shareholders | | Percentage of
Outstanding Shares |
PGIM Jennison
Small-Cap Core
Equity Fund | | 4 | | 80.7% | | — | | —% |
PGIM Core Conservative
Bond Fund | | 5 | | 87.5 | | — | | — |
PGIM TIPS Fund | | 7 | | 98.4 | | — | | — |
PGIM QMA Commodity
Strategies Fund | | 6 | | 86.1 | | — | | — |
PGIM QMA Mid-Cap Core
Equity Fund | | 9 | | 95.9 | | — | | — |
PGIM QMA US Broad
Market Index Fund | | 8 | | 92.7 | | — | | — |
| | | | |
| PGIM Day One Underlying Funds | | | 175 | |
Notes to Financial Statements/Consolidated Financial Statements
Transactions in shares of beneficial interest were as follows:
PGIM Jennison Small-Cap Core Equity Fund:
| | | | | | | | |
Class R6 | | Shares | | | Amount | |
Year ended July 31, 2020: | | | | | | | | |
Shares sold | | | 650,650 | | | $ | 6,847,970 | |
Shares reacquired | | | (402,830 | ) | | | (4,069,959 | ) |
| | | | | | | | |
Net increase (decrease) in shares outstanding | | | 247,820 | | | $ | 2,778,011 | |
| | | | | | | | |
Year ended July 31, 2019: | | | | | | | | |
Shares sold | | | 252,340 | | | $ | 2,868,025 | |
Shares issued in reinvestment of dividends and distributions | | | 88,681 | | | | 909,864 | |
Shares reacquired | | | (109,630 | ) | | | (1,265,404 | ) |
| | | | | | | | |
Net increase (decrease) in shares outstanding | | | 231,391 | | | $ | 2,512,485 | |
| | | | | | | | |
| | |
| PGIM Core Conservative Bond Fund: | | | | | | | | |
| | |
Class R6 | | Shares | | | Amount | |
Year ended July 31, 2020: | | | | | | | | |
Shares sold | | | 1,939,352 | | | $ | 20,298,716 | |
Shares issued in reinvestment of dividends and distributions | | | 119,325 | | | | 1,246,574 | |
Shares reacquired | | | (1,329,477 | ) | | | (13,859,437 | ) |
| | | | | | | | |
Net increase (decrease) in shares outstanding | | | 729,200 | | | $ | 7,685,853 | |
| | | | | | | | |
Year ended July 31, 2019: | | | | | | | | |
Shares sold | | | 1,118,649 | | | $ | 10,866,757 | |
Shares issued in reinvestment of dividends and distributions | | | 122,720 | | | | 1,203,448 | |
Shares reacquired | | | (601,254 | ) | | | (5,859,806 | ) |
| | | | | | | | |
Net increase (decrease) in shares outstanding | | | 640,115 | | | $ | 6,210,399 | |
| | | | | | | | |
| | |
| PGIM TIPS Fund: | | | | | | | | |
| | |
Class R6 | | Shares | | | Amount | |
Year ended July 31, 2020: | | | | | | | | |
Shares sold | | | 3,419,169 | | | $ | 34,833,583 | |
Shares issued in reinvestment of dividends and distributions | | | 54,785 | | | | 550,849 | |
Shares reacquired | | | (2,550,112 | ) | | | (25,704,948 | ) |
| | | | | | | | |
Net increase (decrease) in shares outstanding | | | 923,842 | | | $ | 9,679,484 | |
| | | | | | | | |
Year ended July 31, 2019: | | | | | | | | |
Shares sold | | | 2,079,245 | | | $ | 19,881,418 | |
Shares issued in reinvestment of dividends and distributions | | | 84,998 | | | | 827,771 | |
Shares reacquired | | | (986,534 | ) | | | (9,455,747 | ) |
| | | | | | | | |
Net increase (decrease) in shares outstanding | | | 1,177,709 | | | $ | 11,253,442 | |
| | | | | | | | |
| | | | | | | | |
| PGIM QMA Commodity Strategies Fund: | | | | | | | | |
| | |
Class R6 | | Shares | | | Amount | |
Year ended July 31, 2020: | | | | | | | | |
Shares sold | | | 3,540,207 | | | $ | 30,076,283 | |
Shares issued in reinvestment of dividends and distributions | | | 24,299 | | | | 233,752 | |
Shares reacquired | | | (1,180,963 | ) | | | (9,411,703 | ) |
| | | | | | | | |
Net increase (decrease) in shares outstanding | | | 2,383,543 | | | $ | 20,898,332 | |
| | | | | | | | |
Year ended July 31, 2019: | | | | | | | | |
Shares sold | | | 693,151 | | | $ | 6,829,897 | |
Shares issued in reinvestment of dividends and distributions | | | 56,420 | | | | 530,351 | |
Shares reacquired | | | (276,668 | ) | | | (2,712,985 | ) |
| | | | | | | | |
Net increase (decrease) in shares outstanding | | | 472,903 | | | $ | 4,647,263 | |
| | | | | | | | |
| | |
| PGIM QMA Mid-Cap Core Equity Fund: | | | | | | | | |
| | |
Class R6 | | Shares | | | Amount | |
Year ended July 31, 2020: | | | | | | | | |
Shares sold | | | 1,594,642 | | | $ | 14,514,549 | |
Shares issued in reinvestment of dividends and distributions | | | 15,032 | | | | 170,308 | |
Shares reacquired | | | (886,100 | ) | | | (7,792,793 | ) |
| | | | | | | | |
Net increase (decrease) in shares outstanding | | | 723,574 | | | $ | 6,892,064 | |
| | | | | | | | |
Year ended July 31, 2019: | | | | | | | | |
Shares sold | | | 562,114 | | | $ | 5,930,832 | |
Shares issued in reinvestment of dividends and distributions | | | 77,700 | | | | 771,564 | |
Shares reacquired | | | (231,077 | ) | | | (2,480,643 | ) |
| | | | | | | | |
Net increase (decrease) in shares outstanding | | | 408,737 | | | $ | 4,221,753 | |
| | | | | | | | |
| | |
| PGIM QMA US Broad Market Index Fund: | | | | | | | | |
| | |
Class R6 | | Shares | | | Amount | |
Year ended July 31, 2020: | | | | | | | | |
Shares sold | | | 2,180,023 | | | $ | 29,074,039 | |
Shares issued in reinvestment of dividends and distributions | | | 59,620 | | | | 851,368 | |
Shares reacquired | | | (1,360,639 | ) | | | (17,490,670 | ) |
| | | | | | | | |
Net increase (decrease) in shares outstanding | | | 879,004 | | | $ | 12,434,737 | |
| | | | | | | | |
Year ended July 31, 2019: | | | | | | | | |
Shares sold | | | 1,293,913 | | | $ | 16,428,009 | |
Shares issued in reinvestment of dividends and distributions | | | 69,285 | | | | 830,039 | |
Shares reacquired | | | (895,043 | ) | | | (11,148,657 | ) |
| | | | | | | | |
Net increase (decrease) in shares outstanding | | | 468,155 | | | $ | 6,109,391 | |
| | | | | | | | |
PIP2, on behalf of the Funds, along with other affiliated registered investment companies (the “RICs”), is a party to a Syndicated Credit Agreement (“SCA”) with a group of banks. The purpose of the SCA is to provide an alternative source of temporary funding for capital share redemptions. The table below provides details of the current SCA in effect at the reporting period-end as well as the prior SCA.
| | | | |
| | | Current SCA | | Prior SCA |
Term of Commitment | | 10/3/2019 – 10/1/2020 | | 10/4/2018 – 10/2/2019 |
| | | | |
| PGIM Day One Underlying Funds | | | 177 | |
Notes to Financial Statements/Consolidated Financial Statements
| | | | |
| | | Current SCA | | Prior SCA |
| Total Commitment | | $ 1,222,500,000* | | $ 900,000,000 |
| Annualized Commitment Fee on the Unused Portion of the SCA | | 0.15% | | 0.15% |
| Annualized Interest Rate on Borrowings | | 1.20% plus the higher of (1) the effective federal funds rate, (2) the one-month LIBOR rate or (3) zero percent | | 1.25% plus the higher of (1) the effective federal funds rate, (2) the one-month LIBOR rate or (3) zero percent |
| * Effective March 31, 2020, the SCA’s total commitment was increased from $900,000,000 to $1,162,500,000 and subsequently, effective April 7, 2020 was increased to $1,222,500,000. |
Certain affiliated registered investment companies that are parties to the SCA include portfolios that are subject to a predetermined mathematical formula used to manage certain benefit guarantees offered under variable annuity contracts. The formula may result in large scale asset flows into and out of these portfolios. Consequently, these portfolios may be more likely to utilize the SCA for purposes of funding redemptions. It may be possible for those portfolios to fully exhaust the committed amount of the SCA, thereby requiring the Manager to allocate available funding per a Board-approved methodology designed to treat the RICs in the SCA equitably.
The following Funds utilized the SCA during the year ended July 31, 2020. The average balance outstanding is for the number of days the Funds utilized the credit facility.
| | | | | | | | | | | | | | |
Fund | | Average
Balance
Outstanding | | Weighted
Average
Interest Rates | | Number
of Days
Outstanding | | | Maximum
Balance
Outstanding | | | Balance
Outstanding at
July 31, 2020 |
| PGIM Jennison Small-Cap Core Equity Fund | | $163,000 | | 1.50% | | | 4 | | | | $ 163,000 | | | $— |
| PGIM Core Conservative Bond Fund | | 478,000 | | 2.29 | | | 6 | | | | 478,000 | | | — |
| PGIM TIPS Fund | | 583,538 | | 2.31 | | | 26 | | | | 1,832,000 | | | — |
| PGIM QMA Mid-Cap Core Equity Fund | | 237,000 | | 1.83 | | | 31 | | | | 528,000 | | | — |
| 9. Risks | of Investing in the Funds |
The Funds’ risks include, but are not limited to, some or all of the risks discussed below. For further information on the Funds’ risks, please refer to the Funds’ Prospectus and Statement of Additional Information.
Bond Obligations Risk: The Funds’ holdings, share price, yield and total return may fluctuate in response to bond market movements. The value of bonds may decline for issuer-related reasons, including management performance, financial leverage and reduced
demand for the issuer’s goods and services. Certain types of fixed-income obligations also may be subject to “call and redemption risk,” which is the risk that the issuer may call a bond held by the Funds for redemption before it matures and the Funds may not be able to reinvest at the same level and therefore would earn less income.
Subsidiary Risk: By investing in the Subsidiary, the Commodity Strategies Fund is indirectly exposed to the risks associated with the Cayman Subsidiary’s investments. The Cayman Subsidiary is not registered as an investment company under the 1940 Act, and, unless otherwise noted in the Commodity Strategies Fund’s Prospectus, is not subject to all the investor protections of the 1940 Act. The IRS has proposed regulations that if finalized in current form would require the Cayman Subsidiary to distribute its income on an annual basis in order for such income to be considered qualifying Regulated Investment Company (“RIC”) income for tax purposes. Changes in the laws of the Cayman Islands, under which the Cayman Subsidiary is incorporated, could result in the inability of the Commodity Strategies Fund to effect its desired commodity investment strategy.
Derivatives Risk: Derivatives involve special risks and costs and may result in losses to the Funds. The successful use of derivatives requires sophisticated management, and, to the extent that derivatives are used, the Funds will depend on the subadviser’s ability to analyze and manage derivative transactions. The prices of derivatives may move in unexpected ways, especially in abnormal market conditions. Some derivatives are “leveraged” and therefore may magnify or otherwise increase investment losses to the Funds. Other risks arise from the potential inability to terminate or sell derivatives positions. A liquid secondary market may not always exist for the Funds’ derivatives positions. In fact, many OTC derivative instruments will not have liquidity beyond the counterparty to the instrument. OTC derivative instruments also involve the risk that the other party will not meet its obligations to the Funds.
Equity and Equity-Related Securities Risks: The value of a particular security could go down and you could lose money. In addition to an individual security losing value, the value of the equity markets or a sector in which the Funds invest could go down. The Funds’ holdings can vary significantly from broad market indexes and the performance of the Funds can deviate from the performance of these indexes. Different parts of a market can react differently to adverse issuer, market, regulatory, political and economic developments.
Foreign Securities Risk: The Funds’ investments in securities of foreign issuers or issuers with significant exposure to foreign markets involve additional risk. Foreign countries in which the Funds may invest may have markets that are less liquid, less regulated and more volatile than US markets. The value of the Funds’ investments may decline because of factors affecting the particular issuer as well as foreign markets and issuers generally, such as unfavorable government actions, and political or financial instability.
Interest Rate Risk: The value of an investment may go down when interest rates rise. A rise in rates tends to have a greater impact on the prices of longer term or duration securities. When interest rates fall, the issuers of debt obligations may prepay principal more quickly
| | | | |
| PGIM Day One Underlying Funds | | | 179 | |
Notes to Financial Statements/Consolidated Financial Statements
than expected, and the Funds may be required to reinvest the proceeds at a lower interest rate. This is referred to as “prepayment risk.” When interest rates rise, debt obligations may be repaid more slowly than expected, and the value of the Funds’ holdings may fall sharply. This is referred to as “extension risk”. The Funds may face a heightened level of interest rate risk as a result of the U.S. Federal Reserve Board’s policies. The Funds’ investments may lose value if short-term or long-term interest rates rise sharply or in a manner not anticipated by the subadviser.
Large Shareholder and Large Scale Redemption Risk: Certain individuals, accounts, funds (including funds affiliated with the Manager) or institutions, including the Manager and its affiliates, may from time to time own or control a substantial amount of the Funds’ shares. There is no requirement that these entities maintain their investment in the Funds. There is a risk that such large shareholders or that the Funds’ shareholders generally may redeem all or a substantial portion of their investments in the Funds in a short period of time, which could have a significant negative impact on the Funds’ NAV, liquidity, and brokerage costs. Large redemptions could also result in tax consequences to shareholders and impact the Funds’ ability to implement its investment strategy. The Funds’ ability to pursue its investment objective after one or more large scale redemptions may be impaired and, as a result, the Funds may invest a larger portion of its assets in cash or cash equivalents.
LIBOR Risk: Many financial instruments use or may use a floating rate based on the London Interbank Offered Rate, or “LIBOR,” which is the offered rate for short-term Eurodollar deposits between major international banks. On July 27, 2017, the Financial Conduct Authority announced a desire to phase out the use of LIBOR by the end of 2021. There remains uncertainty regarding the future utilization of LIBOR and the nature of any replacement rate. As such, the potential impact of a transition away from LIBOR on the Funds or the financial instruments in which the Funds invest cannot yet be determined. The elimination of LIBOR or changes to other reference rates or any other changes or reforms to the determination or supervision of reference rates could have an adverse impact on the market for, or value of, any securities or payments linked to those reference rates, which may adversely affect the Funds’ performance and/or net asset value. Furthermore, the risks associated with the expected discontinuation of LIBOR and transition may be exacerbated if the work necessary to effect an orderly transition to an alternative reference rate is not completed in a timely manner. Because the usefulness of LIBOR as a benchmark could deteriorate during the transition period, these effects could occur prior to the end of 2021.
Liquidity Risk: The Funds may invest in instruments that trade in lower volumes and are less liquid than other investments. Liquidity risk exists when particular investments made by the Funds are difficult to purchase or sell. Liquidity risk includes the risk that the Funds may make investments that may become less liquid in response to market developments or adverse investor perceptions. Investments that are illiquid or that trade in lower volumes
may be more difficult to value. If the Funds are forced to sell these investments to pay redemption proceeds or for other reasons, the Funds may lose money. In addition, when there is no willing buyer and investments may not reasonably be expected to be sold or disposed of in current market conditions in seven calendar days or less without the sale or disposition significantly changing the market value of the investment, the Funds may incur higher transaction costs when executing trade orders of a given size. The reduction in dealer market-making capacity in the fixed-income markets that has occurred in recent years also has the potential to reduce liquidity. An inability to sell a portfolio position can adversely affect the Funds’ value or prevent the Funds from being able to take advantage of other investment opportunities.
Market and Credit Risk: Securities markets may be volatile and the market prices of the Funds’ securities may decline. Securities fluctuate in price based on changes in an issuer’s financial condition and overall market and economic conditions. If the market prices of the securities owned by the Funds fall, the value of an investment in the Funds will decline. Additionally, the Funds may also be exposed to credit risk in the event that an issuer or guarantor fails to perform or that an institution or entity with which the Funds have unsettled or open transactions defaults.
Market Disruption and Geopolitical Risks: International wars or conflicts and geopolitical developments in foreign countries, along with instability in regions such as Asia, Eastern Europe, and the Middle East, possible terrorist attacks in the United States or around the world, public health epidemics such as the outbreak of infectious diseases like the recent outbreak of coronavirus globally or the 2014–2016 outbreak in West Africa of the Ebola virus, and other similar events could adversely affect the U.S. and foreign financial markets, including increases in market volatility, reduced liquidity in the securities markets and government intervention, and may cause further long-term economic uncertainties in the United States and worldwide generally.
Non-diversification Risk: A non-diversified Fund may invest a greater percentage of its assets in the securities of a single company or industry than a diversified fund. Investing in a non-diversified fund involves greater risk than investing in a diversified fund because a loss resulting from the decline in value of any one security may represent a greater portion of the total assets of a non-diversified fund.
Risks of Investing in equity REITs: Real estate securities are subject to similar risks as direct investments in real estate and mortgages, and their value will depend on the value of the underlying properties or the underlying loans or interests. The underlying loans may be subject to the risks of default or of payments that occur earlier or later than expected, and such loans may also include so-called “subprime” mortgages. The value of these securities will rise and fall in response to many factors, including economic conditions, the demand for rental property and interest rates. In particular, the value of these securities may decline when interest rates rise and will also be affected by the real estate market and by the management of the underlying properties.
| | | | |
| PGIM Day One Underlying Funds | | | 181 | |
Notes to Financial Statements/Consolidated Financial Statements
In addition, investing in equity REITs involves certain unique risks in addition to those risks associated with investing in the real estate industry in general. Equity REITs may be affected by changes in the value of the underlying property owned by the equity REITs, while mortgage REITs may be affected by the quality of any credit extended. Equity REITs are dependent upon management skills, may not be diversified geographically or by property/mortgage asset type, and are subject to heavy cash flow dependency, default by borrowers and self-liquidation. Since equity REITs are relatively smaller in size when compared to the broader market, and smaller companies tend to be more volatile than larger companies, they may be more volatile and/or more illiquid than other types of equity securities. Equity REITs are subject to interest rate risks. Equity REITs may incur significant amounts of leverage. The Funds will indirectly bear a portion of the expenses, including management fees, paid by each equity REIT in which they invest, in addition to the expenses of the Funds.
Risks of Investing in Treasury Inflation Protected Securities (TIPS): The value of TIPS generally fluctuates in response to inflationary concerns. As inflationary expectations increase, TIPS will become more attractive, because they protect future interest payments against inflation. Conversely, as inflationary concerns decrease, TIPS will become less attractive and less valuable. Although the principal value of TIPS declines in periods of deflation, holders at maturity receive no less than the par value of the bond. However, if the Funds purchase TIPS in the secondary market, where principal values have been adjusted upward due to inflation since issuance, they may experience a loss if there is a subsequent period of deflation. If inflation is lower than expected during the period the Funds hold TIPS, the Funds may earn less on the security than on a conventional bond.
U.S. Government and Agency Securities Risk: U.S. Government and agency securities are subject to market risk, interest rate risk and credit risk. Not all U.S. Government securities are insured or guaranteed by the full faith and credit of the U.S. Government; some are only insured or guaranteed by the issuing agency, which must rely on its own resources to repay the debt. In addition, the value of U.S. Government securities may be affected by changes in the credit rating of the U.S. Government.
PGIM Jennison Small-Cap Core Equity Fund
Financial Highlights
| | | | | | | | | | | | | | | | |
| Class R6 Shares | | | | | | | | | | | | |
| | | Year Ended July 31, | | | November 15, 2016(a)
through July 31,
2017 | |
| | | 2020 | | | 2019 | | | 2018 | |
Per Share Operating Performance(b): | | | | | | | | | | | | | | | | |
Net Asset Value, Beginning of Period | | | $11.82 | | | | $13.04 | | | | $11.27 | | | | $10.00 | |
Income (loss) from investment operations: | | | | | | | | | | | | | | | | |
Net investment income (loss) | | | - | (c) | | | 0.01 | | | | - | (d) | | | 0.02 | |
Net realized and unrealized gain (loss) on investment transactions | | | 0.66 | | | | (0.53 | ) | | | 1.97 | | | | 1.27 | |
Total from investment operations | | | 0.66 | | | | (0.52 | ) | | | 1.97 | | | | 1.29 | |
Less Dividends and Distributions: | | | | | | | | | | | | | | | | |
Dividends from net investment income | | | - | | | | (0.04 | ) | | | - | (d) | | | (0.02) | |
Tax return of capital distributions | | | - | | | | (0.01 | ) | | | - | | | | - | |
Distributions from net realized gains | | | - | | | | (0.65 | ) | | | (0.20 | ) | | | - | |
Total dividends and distributions | | | - | | | | (0.70 | ) | | | (0.20 | ) | | | (0.02) | |
Net asset value, end of period | | | $12.48 | | | | $11.82 | | | | $13.04 | | | | $11.27 | |
Total Return(e): | | | 5.50 | % | | | (3.26 | )% | | | 17.75 | % | | | 12.89% | |
| | | | | | | | | | | | | | | | | |
| Ratios/Supplemental Data: | | | | | | | | | | | | |
Net assets, end of period (000) | | | $21,439 | | | | $17,371 | | | | $16,158 | | | | $12,584 | |
Average net assets (000) | | | $17,831 | | | | $16,167 | | | | $14,370 | | | | $10,943 | |
Ratios to average net assets(f): | | | | | | | | | | | | | | | | |
Expenses after waivers and/or expense reimbursement | | | 0.95 | % | | | 0.95 | % | | | 0.95 | % | | | 1.02%(g) | |
Expenses before waivers and/or expense reimbursement | | | 1.52 | % | | | 1.64 | % | | | 1.68 | % | | | 2.04%(g) | |
Net investment income (loss) | | | (0.03 | )% | | | 0.07 | % | | | - | %(h) | | | 0.22%(g) | |
Portfolio turnover rate(i) | | | 54 | % | | | 36 | % | | | 39 | % | | | 28% | |
| (a) | Commencement of operations. |
| (b) | Calculated based on average shares outstanding during the period. |
| (c) | Less than $(0.005) per share. |
| (d) | Less than $0.005 per share. |
| (e) | Total return is calculated assuming a purchase of a share on the first day and a sale on the last day of each period reported and includes reinvestment of dividends and distributions, if any. Total returns may reflect adjustments to conform to generally accepted accounting principles. Total returns for periods less than one full year are not annualized. |
| (f) | Does not include expenses of the underlying funds in which the Fund invests. |
| (i) | The Fund’s portfolio turnover rate is calculated in accordance with regulatory requirements, without regard to transactions involving short-term investments and certain derivatives. If such transactions were included, the Fund’s portfolio turnover rate may be higher. |
See Notes to Financial Statements.
| | | | |
| PGIM Day One Underlying Funds | | | 183 | |
PGIM Core Conservative Bond Fund
Financial Highlights
| | | | | | | | | | | | | | | | |
| Class R6 Shares | | | | | | | | | | | | |
| | | Year Ended July 31, | | | November 15, 2016(a)
through July 31,
2017 | |
| | | 2020 | | | 2019 | | | 2018 | |
Per Share Operating Performance(b): | | | | | | | | | | | | | | | | |
Net Asset Value, Beginning of Period | | | $10.12 | | | | $9.66 | | | | $10.03 | | | | $10.00 | |
Income (loss) from investment operations: | | | | | | | | | | | | | | | | |
Net investment income (loss) | | | 0.22 | | | | 0.25 | | | | 0.21 | | | | 0.12 | |
Net realized and unrealized gain (loss) on investment transactions | | | 0.73 | | | | 0.49 | | | | (0.34 | ) | | | 0.05 | |
Total from investment operations | | | 0.95 | | | | 0.74 | | | | (0.13 | ) | | | 0.17 | |
Less Dividends and Distributions: | | | | | | | | | | | | | | | | |
Dividends from net investment income | | | (0.26 | ) | | | (0.28 | ) | | | (0.24 | ) | | | (0.14) | |
Net asset value, end of period | | | $10.81 | | | | $10.12 | | | | $9.66 | | | | $10.03 | |
Total Return(c): | | | 9.50 | % | | | 7.74 | % | | | (1.31 | )% | | | 1.72% | |
| | | | | | | | | | | | | | | | | |
| Ratios/Supplemental Data: | | | | | | | | | | | | |
Net assets, end of period (000) | | | $57,963 | | | | $46,905 | | | | $38,592 | | | | $31,357 | |
Average net assets (000) | | | $50,192 | | | | $42,668 | | | | $34,737 | | | | $25,827 | |
Ratios to average net assets(d): | | | | | | | | | | | | | | | | |
Expenses after waivers and/or expense reimbursement | | | 0.50 | % | | | 0.50 | % | | | 0.50 | % | | | 0.53%(e) | |
Expenses before waivers and/or expense reimbursement | | | 0.67 | % | | | 0.77 | % | | | 0.78 | % | | | 0.95%(e) | |
Net investment income (loss) | | | 2.07 | % | | | 2.55 | % | | | 2.11 | % | | | 1.72%(e) | |
Portfolio turnover rate(f)(g) | | | 174 | % | | | 107 | % | | | 171 | % | | | 348% | |
| (a) | Commencement of operations. |
| (b) | Calculated based on average shares outstanding during the period. |
| (c) | Total return is calculated assuming a purchase of a share on the first day and a sale on the last day of each period reported and includes reinvestment of dividends and distributions, if any. Total returns may reflect adjustments to conform to generally accepted accounting principles. Total returns for periods less than one full year are not annualized. |
| (d) | Does not include expenses of the underlying funds in which the Fund invests. |
| (f) | The Fund accounts for mortgage dollar roll transactions, when applicable, as purchases and sales which, as a result, can increase its portfolio turnover rate. |
| (g) | The Fund’s portfolio turnover rate is calculated in accordance with regulatory requirements, without regard to transactions involving short-term investments and certain derivatives. If such transactions were included, the Fund’s portfolio turnover rate may be higher. |
See Notes to Financial Statements.
PGIM TIPS Fund
Financial Highlights
| | | | | | | | | | | | | | | | |
| Class R6 Shares | | | | | | | | | | | | |
| | | Year Ended July 31, | | | November 15, 2016(a)
through July 31,
2017 | |
| | | 2020 | | | 2019 | | | 2018 | |
Per Share Operating Performance(b): | | | | | | | | | | | | | | | | |
Net Asset Value, Beginning of Period | | | $9.87 | | | | $9.61 | | | | $9.86 | | | | $10.00 | |
Income (loss) from investment operations: | | | | | | | | | | | | | | | | |
Net investment income (loss) | | | 0.01 | | | | 0.21 | | | | 0.28 | | | | 0.13 | |
Net realized and unrealized gain (loss) on investment and foreign currency transactions | | | 0.94 | | | | 0.30 | | | | (0.19 | ) | | | (0.09) | |
Total from investment operations | | | 0.95 | | | | 0.51 | | | | 0.09 | | | | 0.04 | |
Less Dividends and Distributions: | | | | | | | | | | | | | | | | |
Dividends from net investment income | | | (0.15 | ) | | | (0.25 | ) | | �� | (0.34 | ) | | | (0.18) | |
Net asset value, end of period | | | $10.67 | | | | $9.87 | | | | $9.61 | | | | $9.86 | |
Total Return(c): | | | 9.83 | % | | | 5.38 | % | | | 0.87 | % | | | 0.38% | |
| | | | | | | | | | | | | | | | | |
| Ratios/Supplemental Data: | | | | | | | | | | | | |
Net assets, end of period (000) | | | $48,736 | | | | $35,938 | | | | $23,693 | | | | $16,011 | |
Average net assets (000) | | | $38,800 | | | | $30,412 | | | | $19,916 | | | | $6,479 | |
Ratios to average net assets(d): | | | | | | | | | | | | | | | | |
Expenses after waivers and/or expense reimbursement | | | 0.40 | % | | | 0.40 | % | | | 0.40 | % | | | 0.55%(e) | |
Expenses before waivers and/or expense reimbursement | | | 0.58 | % | | | 0.72 | % | | | 0.94 | % | | | 2.41%(e) | |
Net investment income (loss) | | | 0.12 | % | | | 2.17 | % | | | 2.83 | % | | | 1.79%(e) | |
Portfolio turnover rate(f) | | | 102 | % | | | 40 | % | | | 54 | % | | | 41% | |
| (a) | Commencement of operations. |
| (b) | Calculated based on average shares outstanding during the period. |
| (c) | Total return is calculated assuming a purchase of a share on the first day and a sale on the last day of each period reported and includes reinvestment of dividends and distributions, if any. Total returns may reflect adjustments to conform to generally accepted accounting principles. Total returns for periods less than one full year are not annualized. |
| (d) | Does not include expenses of the underlying funds in which the Fund invests. |
| (f) | The Fund’s portfolio turnover rate is calculated in accordance with regulatory requirements, without regard to transactions involving short-term investments and certain derivatives. If such transactions were included, the Fund’s portfolio turnover rate may be higher. |
See Notes to Financial Statements.
| | | | |
| PGIM Day One Underlying Funds | | | 185 | |
PGIM QMA Commodity Strategies Fund
Consolidated Financial Highlights
| | | | | | | | | | | | | | | | |
| Class R6 Shares | | | | | | | | | | | | |
| | | Year Ended July 31, | | | November 15, 2016(a)
through July 31,
2017 | |
| | | 2020 | | | 2019 | | | 2018 | |
Per Share Operating Performance(b): | | | | | | | | | | | | | | | | |
Net Asset Value, Beginning of Period | | | $9.44 | | | | $10.31 | | | | $10.15 | | | | $10.00 | |
Income (loss) from investment operations: | | | | | | | | | | | | | | | | |
Net investment income (loss) | | | 0.01 | | | | 0.14 | | | | 0.04 | | | | (0.05) | |
Net realized and unrealized gain (loss) on investment transactions | | | (1.01 | ) | | | (0.74 | ) | | | 0.27 | | | | 0.20 | |
Total from investment operations | | | (1.00 | ) | | | (0.60 | ) | | | 0.31 | | | | 0.15 | |
Less Dividends and Distributions: | | | | | | | | | | | | | | | | |
Dividends from net investment income | | | (0.10 | ) | | | (0.27 | ) | | | (0.15 | ) | | | - | |
Tax return of capital distributions | | | - | (c) | | | - | | | | - | | | | - | |
Total dividends and distributions | | | (0.10 | ) | | | (0.27 | ) | | | (0.15 | ) | | | - | |
Net asset value, end of period | | | $8.34 | | | | $9.44 | | | | $10.31 | | | | $10.15 | |
Total Return(d): | | | (10.74 | )% | | | (5.69 | )% | | | 3.09 | % | | | 1.50% | |
| | | | | | | | | | | | | | | | | |
| Ratios/Supplemental Data: | | | | | | | | | | | | |
Net assets, end of period (000) | | | $38,553 | | | | $21,123 | | | | $18,187 | | | | $13,811 | |
Average net assets (000) | | | $28,308 | | | | $19,634 | | | | $16,136 | | | | $10,738 | |
Ratios to average net assets(e): | | | | | | | | | | | | | | | | |
Expenses after waivers and/or expense reimbursement | | | 0.80 | % | | | 0.80 | % | | | 0.92 | % | | | 1.30%(f) | |
Expenses before waivers and/or expense reimbursement | | | 0.94 | % | | | 1.10 | % | | | 1.88 | % | | | 2.64%(f) | |
Net investment income (loss) | | | 0.17 | % | | | 1.42 | % | | | 0.41 | % | | | (0.67)%(f) | |
Portfolio turnover rate(g) | | | 0 | % | | | 0 | % | | | 0 | % | | | 0% | |
| (a) | Commencement of operations. |
| (b) | Calculated based on average shares outstanding during the period. |
| (c) | Less than $(0.005) per share. |
| (d) | Total return is calculated assuming a purchase of a share on the first day and a sale on the last day of each period reported and includes reinvestment of dividends and distributions, if any. Total returns may reflect adjustments to conform to generally accepted accounting principles. Total returns for periods less than one full year are not annualized. |
| (e) | Does not include expenses of the underlying funds in which the Fund invests. |
| (g) | The Fund’s portfolio turnover rate is calculated in accordance with regulatory requirements, without regard to transactions involving short-term investments and certain derivatives. If such transactions were included, the Fund’s portfolio turnover rate may be higher. |
See Notes to Financial Statements.
PGIM QMA Mid-Cap Core Equity Fund
Financial Highlights
| | | | | | | | | | | | | | | | |
| Class R6 Shares | | | | | | | | | | | | |
| | | Year Ended July 31, | | | November 17, 2016(a)
through July 31,
2017 | |
| | | 2020 | | | 2019 | | | 2018 | |
Per Share Operating Performance(b): | | | | | | | | | | | | | | | | |
Net Asset Value, Beginning of Period | | | $10.84 | | | | $12.08 | | | | $11.16 | | | | $10.00 | |
Income (loss) from investment operations: | | | | | | | | | | | | | | | | |
Net investment income (loss) | | | 0.10 | | | | 0.11 | | | | 0.09 | | | | 0.05 | |
Net realized and unrealized gain (loss) on investment transactions | | | (1.10 | ) | | | (0.67 | ) | | | 1.16 | | | | 1.12 | |
Total from investment operations | | | (1.00 | ) | | | (0.56 | ) | | | 1.25 | | | | 1.17 | |
Less Dividends and Distributions: | | | | | | | | | | | | | | | | |
Dividends from net investment income | | | (0.12 | ) | | | (0.09 | ) | | | (0.07 | ) | | | (0.01) | |
Distributions from net realized gains | | | - | | | | (0.59 | ) | | | (0.26 | ) | | | - | |
Total dividends and distributions | | | (0.12 | ) | | | (0.68 | ) | | | (0.33 | ) | | | (0.01) | |
Net asset value, end of period | | | $9.72 | | | | $10.84 | | | | $12.08 | | | | $11.16 | |
Total Return(c): | | | (9.42 | )% | | | (4.08 | )% | | | 11.36 | % | | | 11.72% | |
| | | | | | | | | | | | | | | | | |
| Ratios/Supplemental Data: | | | | | | | | | | | | |
Net assets, end of period (000) | | | $20,814 | | | | $15,360 | | | | $12,182 | | | | $8,426 | |
Average net assets (000) | | | $16,827 | | | | $13,541 | | | | $10,251 | | | | $5,794 | |
Ratios to average net assets(d): | | | | | | | | | | | | | | | | |
Expenses after waivers and/or expense reimbursement | | | 0.85 | % | | | 0.85 | % | | | 0.85 | % | | | 0.97%(e) | |
Expenses before waivers and/or expense reimbursement | | | 1.32 | % | | | 1.54 | % | | | 1.80 | % | | | 2.91%(e) | |
Net investment income (loss) | | | 1.02 | % | | | 1.03 | % | | | 0.78 | % | | | 0.62%(e) | |
Portfolio turnover rate(f) | | | 140 | % | | | 120 | % | | | 113 | % | | | 64% | |
| (a) | Commencement of operations. |
| (b) | Calculated based on average shares outstanding during the period. |
| (c) | Total return is calculated assuming a purchase of a share on the first day and a sale on the last day of each period reported and includes reinvestment of dividends and distributions, if any. Total returns may reflect adjustments to conform to generally accepted accounting principles. Total returns for periods less than one full year are not annualized. |
| (d) | Does not include expenses of the underlying funds in which the Fund invests. |
| (f) | The Fund’s portfolio turnover rate is calculated in accordance with regulatory requirements, without regard to transactions involving short-term investments and certain derivatives. If such transactions were included, the Fund’s portfolio turnover rate may be higher. |
See Notes to Financial Statements.
| | | | |
| PGIM Day One Underlying Funds | | | 187 | |
PGIM QMA US Broad Market Index Fund
Financial Highlights
| | | | | | | | | | | | | | | | |
| Class R6 Shares | | | | | | | | | | | | |
| | | Year Ended July 31, | | | November 17, 2016(a)
through July 31,
2017 | |
| | | 2020 | | | 2019 | | | 2018 | |
Per Share Operating Performance(b): | | | | | | | | | | | | | | | | |
Net Asset Value, Beginning of Period | | | $13.60 | | | | $12.99 | | | | $11.36 | | | | $10.00 | |
Income (loss) from investment operations: | | | | | | | | | | | | | | | | |
Net investment income (loss) | | | 0.23 | | | | 0.23 | | | | 0.20 | | | | 0.12 | |
Net realized and unrealized gain (loss) on investment transactions | | | 1.22 | | | | 0.64 | | | | 1.61 | | | | 1.26 | |
Total from investment operations | | | 1.45 | | | | 0.87 | | | | 1.81 | | | | 1.38 | |
Less Dividends and Distributions: | | | | | | | | | | | | | | | | |
Dividends from net investment income | | | (0.23 | ) | | | (0.19 | ) | | | (0.14 | ) | | | (0.02) | |
Distributions from net realized gains | | | (0.02 | ) | | | (0.07 | ) | | | (0.04 | ) | | | - | |
Total dividends and distributions | | | (0.25 | ) | | | (0.26 | ) | | | (0.18 | ) | | | (0.02) | |
Net asset value, end of period | | | $14.80 | | | | $13.60 | | | | $12.99 | | | | $11.36 | |
Total Return(c): | | | 10.71 | % | | | 6.95 | % | | | 16.05 | % | | | 13.84% | |
| | | | | | | | | | | | | | | | | |
| Ratios/Supplemental Data: | | | | | | | | | | | | |
Net assets, end of period (000) | | | $62,108 | | | | $45,134 | | | | $37,020 | | | | $22,374 | |
Average net assets (000) | | | $49,589 | | | | $40,825 | | | | $29,409 | | | | $12,357 | |
Ratios to average net assets(d): | | | | | | | | | | | | | | | | |
Expenses after waivers and/or expense reimbursement | | | 0.20 | % | | | 0.20 | % | | | 0.20 | % | | | 0.26%(e) | |
Expenses before waivers and/or expense reimbursement | | | 0.52 | % | | | 0.59 | % | | | 0.65 | % | | | 1.86%(e) | |
Net investment income (loss) | | | 1.71 | % | | | 1.78 | % | | | 1.64 | % | | | 1.63%(e) | |
Portfolio turnover rate(f) | | | 23 | % | | | 15 | % | | | 15 | % | | | 5% | |
| (a) | Commencement of operations. |
| (b) | Calculated based on average shares outstanding during the period. |
| (c) | Total return is calculated assuming a purchase of a share on the first day and a sale on the last day of each period reported and includes reinvestment of dividends and distributions, if any. Total returns may reflect adjustments to conform to generally accepted accounting principles. Total returns for periods less than one full year are not annualized. |
| (d) | Does not include expenses of the underlying funds in which the Fund invests. |
| (f) | The Fund’s portfolio turnover rate is calculated in accordance with regulatory requirements, without regard to transactions involving short-term investments and certain derivatives. If such transactions were included, the Fund’s portfolio turnover rate may be higher. |
See Notes to Financial Statements.
Report of Independent Registered Public Accounting Firm
To the Shareholders of the Funds and Board of Trustees
Prudential Investment Portfolios 2:
Opinion on the Financial Statements
We have audited the accompanying statement of assets and liabilities or consolidated statement of assets and liabilities of the funds listed in Appendix A (each, a Fund and collectively, the Funds), each a series of Prudential Investment Portfolios 2, including the schedule of investments or consolidated schedule of investments, as of July 31, 2020, the related statement of operations or consolidated statement of operations for the year then ended, the statements of changes in net assets or consolidated statements of changes in net assets for each of the years in the two-year period then ended, and the related notes (collectively, the financial statements or consolidated financial statements) and the financial highlights or consolidated financial highlights for each of the years or periods indicated therein. In our opinion, the financial statements or consolidated financial statements and financial highlights or consolidated financial highlights present fairly, in all material respects, the financial position of each Fund as of July 31, 2020, the results of its operations for the year then ended, the changes in its net assets for each of the years in the two-year period then ended, and the financial highlights or consolidated financial highlights for each of the years or periods indicated therein, in conformity with U.S. generally accepted accounting principles.
Basis for Opinion
These financial statements and consolidated financial statements and financial highlights and consolidated financial highlights are the responsibility of the Funds’ management. Our responsibility is to express an opinion on these financial statements and consolidated financial statements and financial highlights and consolidated financial highlights based on our audits. We are a public accounting firm registered with the Public Company Accounting Oversight Board (United States) (PCAOB) and are required to be independent with respect to the Funds in accordance with the U.S. federal securities laws and the applicable rules and regulations of the Securities and Exchange Commission and the PCAOB.
We conducted our audits in accordance with the standards of the PCAOB. Those standards require that we plan and perform the audit to obtain reasonable assurance about whether the financial statements and consolidated financial statements and financial highlights and consolidated financial highlights are free of material misstatement, whether due to error or fraud. Our audits included performing procedures to assess the risks of material misstatement of the financial statements and consolidated financial statements and financial highlights and consolidated financial highlights, whether due to error or fraud, and performing procedures that respond to those risks. Such procedures included examining, on a test basis, evidence regarding the amounts and disclosures in the financial statements and consolidated financial statements and financial highlights and consolidated financial highlights. Such procedures also included confirmation of securities owned as of July 31, 2020, by correspondence with the custodian, transfer agents, and brokers, or by other appropriate auditing procedures when replies were not received. Our audits also included evaluating the accounting principles used and significant estimates made by management, as well as evaluating the overall presentation of the financial statements and consolidated financial statements and financial highlights and consolidated financial highlights. We believe that our audits provide a reasonable basis for our opinion.

We have served as the auditor of one or more PGIM and/or Prudential Retail investment companies since 2003.
New York, New York
September 18, 2020
| | | | |
| PGIM Day One Underlying Funds | | | 189 | |
Appendix A
PGIM Jennison Small-Cap Core Equity Fund
PGIM Core Conservative Bond Fund
PGIM TIPS Fund
PGIM QMA Commodity Strategies Fund*
PGIM QMA Mid-Cap Core Equity Fund
PGIM QMA US Broad Market Index Fund
| * | Consolidated financial statements and consolidated financial highlights |
Fund Liquidity Risk Management Program (unaudited)
Consistent with Rule 22e-4 under the 1940 Act (the “Liquidity Rule”), each Fund has adopted and implemented a liquidity risk management program (the “LRMP”). Each Fund’s LRMP seeks to assess and manage each Fund’s liquidity risk, which is defined as the risk that each Fund is unable to meet investor redemption requests without significantly diluting the remaining investors’ interests in each Fund. The Trust’s Board of Trustees (the “Board”) has approved PGIM Investments LLC (“PGIM Investments”), each Fund’s investment manager, to serve as the administrator of each Fund’s LRMP. As part of its responsibilities as administrator, PGIM Investments has retained a third party to perform certain functions, including providing market data and liquidity classification model information.
Each Fund’s LRMP includes a number of processes designed to support the assessment and management of its liquidity risk. In particular, each Fund’s LRMP includes no less than annual assessments of factors that influence each Fund’s liquidity risk; no less than monthly classifications of each Fund’s investments into one of four liquidity classifications provided for in the Liquidity Rule; a 15% of net assets limit on the acquisition of “illiquid investments” (as defined under the Liquidity Rule); establishment of a minimum percentage of each Fund’s assets to be invested in investments classified as “highly liquid” (as defined under the Liquidity Rule) if each Fund does not invest primarily in highly liquid investments; and regular reporting to each Fund’s Board.
At a meeting of the Board on March 3-5, 2020, PGIM Investments provided a written report (“LRMP Report”) to the Board addressing the operation, adequacy, and effectiveness of each Fund’s LRMP, including any material changes to the LRMP for the period from the inception of each Fund’s LRMP on December 1, 2018 through December 31, 2019 (“Reporting Period”). The LRMP Report concluded that each Fund’s LRMP was reasonably designed to assess and manage each Fund’s liquidity risk and was adequately and effectively implemented during the Reporting Period. There were no material changes to the LRMP during the Reporting Period. The LRMP Report further concluded that each Fund’s investment strategies continue to be appropriate given each Fund’s status as an open-end fund.
There can be no assurance that the LRMP will achieve its objectives in the future. Additional information regarding risks of investing in each Fund, including liquidity risks presented by each Fund’s investment portfolio, is found in each Fund’s Prospectus and Statement of Additional Information.
| | | | |
| PGIM Day One Underlying Funds | | | 191 | |
Tax Information (unaudited)
We are advising you that during the fiscal year ended July 31, 2020, the PGIM QMA US Broad Market Index Fund reported the maximum amount allowed per share but not less than $0.01 per share for Class R6 shares as a capital gain distribution in accordance with Section 852(b)(3)(C) of the Internal Revenue Code.
For the year ended July 31, 2020, the following Funds reports the maximum amount allowable but not less than the following percentages of ordinary income dividends paid as: 1) qualified dividend income in accordance with Section 854 of the Internal Revenue Code (QDI); 2) eligible for the corporate dividends received deduction in accordance with Section 854 of the Internal Revenue Code (DRD); and 3) interest-related dividends in accordance with Section 871(k)(1) and 881(e)(1) of the Internal Revenue Code (IRD):
| | | | | | | | | | | | |
| | | QDI | | | DRD | | | IRD | |
PGIM Core Conservative Bond Fund | | | — | | | | — | | | | 94.01% | |
PGIM TIPS Fund | | | — | | | | — | | | | 66.61% | |
PGIM QMA Commodity Strategies Fund | | | — | | | | — | | | | 28.17% | |
PGIM QMA Mid-Cap Core Equity Fund | | | 100.00% | | | | 100.00% | | | | — | |
PGIM QMA US Broad Market Index Fund | | | 100.00% | | | | 100.00% | | | | — | |
In January 2021, you will be advised on IRS Form 1099-DIV or substitute 1099-DIV as to the federal tax status of the distributions received by you in calendar year 2020.
We are required by Massachusetts, Missouri and Oregon to inform you that dividends which have been derived from interest on federal obligations are not taxable to shareholders provided the Fund meets certain requirements mandated by the respective state’s taxing authorities. We are pleased to report that the dividends paid by the following funds qualify for such deduction.
| | | | |
PGIM Core Conservative Bond Fund | | | 26.95% | |
PGIM TIPS Fund | | | 66.05% | |
PGIM QMA Commodity Strategies Fund | | | 15.13% | |
For more detailed information regarding your state and local taxes, you should contact your tax adviser or the state/local taxing authorities.
INFORMATION ABOUT BOARD MEMBERS AND OFFICERS (unaudited)
Information about Board Members and Officers of the Fund is set forth below. Board Members who are not deemed to be “interested persons” of the Fund, as defined in the 1940 Act, are referred to as “Independent Board Members.” Board Members who are deemed to be “interested persons” of the Fund are referred to as “Interested Board Members.” The Board Members are responsible for the overall supervision of the operations of the Fund and perform the various duties imposed on the directors of investment companies by the 1940 Act. The Board in turn elects the Officers, who are responsible for administering the day-to-day operations of the Fund.
| | | | | | |
| Independent Board Members | | | | |
| | | | |
Name Year of Birth Position(s) Portfolios Overseen | | Principal Occupation(s) During Past Five Years | | Other Directorships Held During Past Five Years | | Length of Board Service |
| | | | |
Ellen S. Alberding 1958 Board Member Portfolios Overseen: 95 | | President and Board Member, The Joyce Foundation (charitable foundation) (since 2002); Vice Chair, City Colleges of Chicago (community college system) (2011-2015); Trustee, National Park Foundation (charitable foundation for national park system) (2009-2018); Trustee, Economic Club of Chicago (2009-2016); Trustee, Loyola University (since 2018). | | None. | | Since September 2013 |
| | | | |
Kevin J. Bannon 1952 Board Member Portfolios Overseen: 95 | | Retired; Managing Director (April 2008-May 2015) and Chief Investment Officer (October 2008-November 2013) of Highmount Capital LLC (registered investment adviser); formerly Executive Vice President and Chief Investment Officer (April 1993-August 2007) of Bank of New York Company; President (May 2003-May 2007) of BNY Hamilton Family of Mutual Funds. | | Director of Urstadt Biddle Properties (equity real estate investment trust) (since September 2008). | | Since July 2008 |
PGIM Day One Underlying Funds
| | | | | | |
| Independent Board Members | | | | |
| | | | |
Name Year of Birth Position(s) Portfolios Overseen | | Principal Occupation(s) During Past Five Years | | Other Directorships Held During Past Five Years | | Length of Board Service |
| | | | |
Linda W. Bynoe 1952 Board Member Portfolios Overseen: 95 | | President and Chief Executive Officer (since March 1995) and formerly Chief Operating Officer (December 1989-February 1995) of Telemat Limited LLC (formerly, Telemat Ltd). (management consulting); formerly Vice President (January 1985-June 1989) at Morgan Stanley & Co. (broker-dealer). | | Director of Anixter International, Inc. (communication products distributor) (since January 2006–June 2020); Director of Northern Trust Corporation (financial services) (since April 2006); Trustee of Equity Residential (residential real estate) (since December 2009). | | Since March 2005 |
| | | | |
Barry H. Evans 1960 Board Member Portfolios Overseen: 94 | | Retired; formerly President (2005 – 2016), Global Chief Operating Officer (2014–2016), Chief Investment Officer – Global Head of Fixed Income (1998-2014), and various portfolio manager roles (1986-2006), Manulife Asset Management U.S. | | Formerly Director, Manulife Trust Company (2011-2018); formerly Director, Manulife Asset Management Limited (2015-2017); formerly Chairman of the Board of Directors of Manulife Asset Management U.S. (2005-2016); formerly Chairman of the Board, Declaration Investment Management and Research (2008-2016). | | Since September 2017 |
| | | | |
Keith F. Hartstein 1956 Board Member & Independent Chair Portfolios Overseen: 95 | | Executive Committee of the IDC Board of Governors (since October 2019); Retired; Member (since November 2014) of the Governing Council of the Independent Directors Council (IDC) (organization of independent mutual fund directors); formerly President and Chief Executive Officer (2005-2012), Senior Vice President (2004-2005), Senior Vice President of Sales and Marketing (1997-2004), and various executive management positions (1990-1997), John Hancock Funds, LLC (asset management); Chairman, Investment Company Institute’s Sales Force Marketing Committee (2003-2008). | | None. | | Since September 2013 |
Visit our website at pgim.com/investments
| | | | | | |
| Independent Board Members | | | | |
| | | | |
Name Year of Birth Position(s) Portfolios Overseen | | Principal Occupation(s) During Past Five Years | | Other Directorships Held During Past Five Years | | Length of Board Service |
| | | | |
Laurie Simon Hodrick 1962 Board Member Portfolios Overseen: 94 | | A. Barton Hepburn Professor Emerita of Economics in the Faculty of Business, Columbia Business School (since 2018); Visiting Professor of Law, Stanford Law School (since 2015); Visiting Fellow at the Hoover Institution, Stanford University (since 2015); Sole Member, ReidCourt LLC (since 2008) (a consulting firm); formerly A. Barton Hepburn Professor of Economics in the Faculty of Business, Columbia Business School (1996-2017); formerly Managing Director, Global Head of Alternative Investment Strategies, Deutsche Bank (2006-2008). | | Independent Director, Synnex Corporation (since April 2019) (information technology); Independent Director, Kabbage, Inc. (since July 2018) (financial services); Independent Director, Corporate Capital Trust (2017-2018) (a business development company). | | Since September 2017 |
| | | | |
Michael S. Hyland, CFA 1945 Board Member Portfolios Overseen: 95 | | Retired (since February 2005); formerly Senior Managing Director (July 2001-February 2005) of Bear Stearns & Co, Inc.; Global Partner, INVESCO (1999-2001); Managing Director and President of Salomon Brothers Asset Management (1989-1999). | | None. | | Since July 2008 |
| | | | |
Brian K. Reid 1961 Board Member Portfolios Overseen: 94 | | Retired; formerly Chief Economist for the Investment Company Institute (ICI) (2005-2017); formerly Senior Economist and Director of Industry and Financial Analysis at the ICI (1998-2004); formerly Senior Economist, Industry and Financial Analysis at the ICI (1996-1998); formerly Staff Economist at the Federal Reserve Board (1989-1996); Director, ICI Mutual Insurance Company (2012-2017). | | None. | | Since March 2018 |
PGIM Day One Underlying Funds
| | | | | | |
| Independent Board Members | | | | |
| | | | |
Name Year of Birth Position(s) Portfolios Overseen | | Principal Occupation(s) During Past Five Years | | Other Directorships Held During Past Five Years | | Length of Board Service |
| | | | |
Grace C. Torres 1959 Board Member Portfolios Overseen: 94 | | Retired; formerly Treasurer and Principal Financial and Accounting Officer of the PGIM Funds, Target Funds, Advanced Series Trust, Prudential Variable Contract Accounts and The Prudential Series Fund (1998-June 2014); Assistant Treasurer (March 1999-June 2014) and Senior Vice President (September 1999-June 2014) of PGIM Investments LLC; Assistant Treasurer (May 2003-June 2014) and Vice President (June 2005-June 2014) of AST Investment Services, Inc.; Senior Vice President and Assistant Treasurer (May 2003-June 2014) of Prudential Annuities Advisory Services, Inc. | | Formerly Director (July 2015-January 2018) of Sun Bancorp, Inc. N.A. and Sun National Bank; Director (since January 2018) of OceanFirst Financial Corp. and OceanFirst Bank. | | Since November 2014 |
| | | | | | |
| Interested Board Members | | | | |
| | | | |
Name Year of Birth Position(s) Portfolios Overseen | | Principal Occupation(s) During Past Five Years | | Other Directorships Held During Past Five Years | | Length of Board Service |
| | | | |
Stuart S. Parker 1962 Board Member & President Portfolios Overseen: 96 | | President of PGIM Investments LLC (formerly known as Prudential Investments LLC) (since January 2012); Executive Vice President of Prudential Investment Management Services LLC (since December 2012); formerly Executive Vice President of Jennison Associates LLC and Head of Retail Distribution of PGIM Investments LLC (June 2005-December 2011). | | None. | | Since January 2012 |
Visit our website at pgim.com/investments
| | | | | | |
| Interested Board Members | | | | |
| | | | |
Name Year of Birth Position(s) Portfolios Overseen | | Principal Occupation(s) During Past Five Years | | Other Directorships Held During Past Five Years | | Length of Board Service |
| | | | |
Scott E. Benjamin 1973 Board Member & Vice President Portfolios Overseen: 96 | | Executive Vice President (since June 2009) of PGIM Investments LLC; Vice President (since June 2012) of Prudential Investment Management Services LLC; Executive Vice President (since September 2009) of AST Investment Services, Inc.; Senior Vice President of Product Development and Marketing, PGIM Investments (since February 2006); formerly Vice President of Product Development and Product Management, PGIM Investments LLC (2003-2006). | | None. | | Since March 2010 |
| | | | |
| Fund Officers(a) |
| | | |
Name Year of Birth Fund Position | | Principal Occupation(s) During Past Five Years | | Length of Service as Fund Officer |
| | | |
Claudia DiGiacomo 1974 Chief Legal Officer | | Vice President and Corporate Counsel (since January 2005) of Prudential; Chief Legal Officer of PGIM Investments LLC (since August 2020); Chief Legal Officer of Prudential Mutual Fund Services LLC (since August 2020); Chief Legal Officer of PIFM Holdco, LLC (since August 2020); and Corporate Counsel of AST Investment Services, Inc. (since August 2020); formerly Associate at Sidley Austin Brown & Wood LLP (1999-2004). | | Since December 2005 |
| | | |
Dino Capasso 1974 Chief Compliance Officer | | Chief Compliance Officer (July 2019-Present) of PGIM Investments LLC; Chief Compliance Officer (July 2019-Present) of the PGIM Funds, Target Funds, Advanced Series Trust, The Prudential Series Fund, Prudential’s Gibraltar Fund, Inc., PGIM Global High Yield Fund, Inc., and PGIM High Yield Bond Fund, Inc.; Vice President and Deputy Chief Compliance Officer (June 2017-2019) of PGIM Investments LLC; formerly, Senior Vice President and Senior Counsel (January 2016-June 2017), and Vice President and Counsel (February 2012-December 2015) of Pacific Investment Management Company LLC. | | Since March 2018 |
PGIM Day One Underlying Funds
| | | | |
| Fund Officers(a) |
| | | |
Name Year of Birth Fund Position | | Principal Occupation(s) During Past Five Years | | Length of Service as Fund Officer |
| | | |
Andrew R. French 1962 Secretary | | Vice President (since December 2018 - present) of PGIM Investments LLC; Formerly, Vice President and Corporate Counsel (2010-2018) of Prudential; formerly Director and Corporate Counsel (2006-2010) of Prudential; Vice President and Assistant Secretary (since January 2007) of PGIM Investments LLC; Vice President and Assistant Secretary (since January 2007) of Prudential Mutual Fund Services LLC. | | Since October 2006 |
| | | |
Jonathan D. Shain 1958 Assistant Secretary | | Vice President and Corporate Counsel (since August 1998) of Prudential; Vice President and Assistant Secretary (since May 2001) of PGIM Investments LLC; Vice President and Assistant Secretary (since February 2001) of Prudential Mutual Fund Services LLC; formerly Vice President and Assistant Secretary (May 2003-June 2005) of AST Investment Services, Inc. | | Since May 2005 |
| | | |
Diana N. Huffman 1982 Assistant Secretary | | Vice President and Corporate Counsel (since September 2015) of Prudential; Vice President and Assistant Secretary (since August 2020) of PGIM Investments LLC; formerly Associate at Willkie Farr & Gallagher LLP (2009-2015). | | Since March 2019 |
| | | |
Melissa Gonzalez 1980 Assistant Secretary | | Vice President and Corporate Counsel (since September 2018) of Prudential; Vice President and Assistant Secretary (since August 2020) of PGIM Investments LLC; formerly Director and Corporate Counsel (March 2014-September 2018) of Prudential. | | Since March 2020 |
| | | |
Patrick E. McGuinness 1986 Assistant Secretary | | Vice President and Assistant Secretary (since August 2020) of PGIM Investments LLC; Director and Corporate Counsel (since February 2017) of Prudential; and Corporate Counsel (2012 – 2017) of IIL, Inc. | | Since June 2020 |
| | | |
Kelly A. Coyne 1968 Assistant Secretary | | Director, Investment Operations of Prudential Mutual Fund Services LLC (since 2010). | | Since March 2015 |
| | | |
Christian J. Kelly 1975 Treasurer and Principal Financial and Accounting Officer | | Vice President, Head of Fund Administration of PGIM Investments LLC (since November 2018); formerly, Director of Fund Administration of Lord Abbett & Co. LLC (2009-2018), Treasurer and Principal Accounting Officer of the Lord Abbett Family of Funds (2017-2018); Director of Accounting, Avenue Capital Group (2008-2009); Senior Manager, Investment Management Practice of Deloitte & Touche LLP (1998-2007). | | Since January 2019 |
| | | |
Lana Lomuti 1967 Assistant Treasurer | | Vice President (since 2007) and Director (2005-2007), within PGIM Investments Fund Administration; formerly Assistant Treasurer (December 2007-February 2014) of The Greater China Fund, Inc. | | Since April 2014 |
| | | |
Russ Shupak 1973 Assistant Treasurer | | Vice President (since 2017) and Director (2013-2017), within PGIM Investments Fund Administration. | | Since October 2019 |
Visit our website at pgim.com/investments
| | | | |
| Fund Officers(a) |
| | | |
Name Year of Birth Fund Position | | Principal Occupation(s) During Past Five Years | | Length of Service as Fund Officer |
| | | |
Deborah Conway 1969 Assistant Treasurer | | Vice President (since 2017) and Director (2007-2017), within PGIM Investments Fund Administration. | | Since October 2019 |
| | | |
Elyse M. McLaughlin 1974 Assistant Treasurer | | Vice President (since 2017) and Director (2011-2017), within PGIM Investments Fund Administration. | | Since October 2019 |
| | | |
Charles H. Smith 1973 Anti-Money Laundering Compliance Officer | | Vice President, Corporate Compliance, Anti-Money Laundering Unit (since January 2015) of Prudential; committee member of the American Council of Life Insurers Anti-Money Laundering and Critical Infrastructure Committee (since January 2016); formerly Global Head of Economic Sanctions Compliance at AIG Property Casualty (February 2007-December 2014); Assistant Attorney General at the New York State Attorney General’s Office, Division of Public Advocacy. (August 1998-January 2007). | | Since January 2017 |
(a) Excludes Mr. Parker and Mr. Benjamin, interested Board Members who also serve as President and Vice President, respectively.
Explanatory Notes to Tables:
| ∎ | | Board Members are deemed to be “Interested,” as defined in the 1940 Act, by reason of their affiliation with PGIM Investments LLC and/or an affiliate of PGIM Investments LLC. |
| ∎ | | Unless otherwise noted, the address of all Board Members and Officers is c/o PGIM Investments LLC, 655 Broad Street, Newark, New Jersey 07102-4410. |
| ∎ | | There is no set term of office for Board Members or Officers. The Board Members have adopted a retirement policy, which calls for the retirement of Board Members on December 31 of the year in which they reach the age of 75. |
| ∎ | | “Other Directorships Held” includes all directorships of companies required to register or file reports with the SEC under the 1934 Act (that is, “public companies”) or other investment companies registered under the 1940 Act. |
| ∎ | | “Portfolios Overseen” includes all investment companies managed by PGIM Investments LLC. The investment companies for which PGIM Investments LLC serves as manager include the PGIM Funds, The Prudential Variable Contract Accounts, PGIM ETF Trust, PGIM High Yield Bond Fund, Inc., PGIM Global High Yield Fund, Inc., The Prudential Series Fund, Prudential’s Gibraltar Fund, Inc. and the Advanced Series Trust. |
| ∎ | | As used in the Fund Officers table “Prudential” means The Prudential Insurance Company of America. |
PGIM Day One Underlying Funds
Approval of Advisory Agreements
The Funds’ Boards of Trustees
The Boards of Trustees (the “Board”) of the PGIM Day One Underlying Funds (each, a “Fund,” and collectively, the “Funds”)1 consists of eleven individuals, nine of whom are not “interested persons” of the Funds, as defined in the Investment Company Act of 1940, as amended (the “1940 Act”) (the “Independent Trustees”). The Board is responsible for the oversight of each Fund and its operations, and performs the various duties imposed on the directors of investment companies by the 1940 Act. The Independent Trustees have retained independent legal counsel to assist them in connection with their duties. The Chair of the Board is an Independent Trustee. The Board has established four standing committees: the Audit Committee, the Nominating and Governance Committee, and two Investment Committees. Each committee is chaired by, and composed of, Independent Trustees.
Annual Approval of the Funds’ Advisory Agreements
As required under the 1940 Act, the Board determines annually whether to renew each Fund’s management agreement with PGIM Investments LLC (“PGIM Investments”) and each Fund’s subadvisory agreement with QMA LLC (“QMA”), Jennison Associates LLC (“Jennison”), PGIM Limited (“PGIML”) and PGIM, Inc., on behalf of its PGIM Fixed Income unit (“PGIM Fixed Income”), as applicable. In considering the renewal of the agreements, the Board, including all of the Independent Trustees, met on May 27, 2020 and on June 9-11, 2020 and approved the renewal of the agreements through July 31, 2021, after concluding that the renewal of the agreements was in the best interests of each Fund and its shareholders.
In advance of the meetings, the Board requested and received materials relating to the agreements, and had the opportunity to ask questions and request further information in connection with its consideration. Among other things, the Board considered comparative fee information from PGIM Investments, QMA and Jennison. Also, the Board considered comparisons with other mutual funds in relevant Peer Universes and Peer Groups, as is further discussed below.
In approving the agreements, the Board, including the Independent Trustees advised by independent legal counsel, considered the factors it deemed relevant, including the nature, quality and extent of services provided, the performance of each Fund, the profitability of PGIM Investments and its affiliates, expenses and fees, and the potential for economies of
| 1 | Each of the PGIM Day One Underlying Funds is a series of Prudential Investment Portfolios 2. The PGIM Day One Underlying Funds discussed herein are: PGIM Jennison Small-Cap Core Equity Fund, PGIM Core Conservative Bond Fund, PGIM TIPS Fund, PGIM QMA Commodity Strategies Fund, PGIM QMA US Broad Market Index Fund and PGIM QMA Mid-Cap Core Equity Fund. |
| | |
| PGIM Day One Underlying Funds |
Approval of Advisory Agreements (continued)
scale that may be shared with each Fund and its shareholders as each Fund’s assets grow. In their deliberations, the Trustees did not identify any single factor which alone was responsible for the Board’s decision to approve the agreements with respect to each Fund. In connection with its deliberations, the Board considered information provided by PGIM Investments throughout the year at regular Board meetings, presentations from portfolio managers and other information, as well as information furnished at or in advance of the meetings on May 27, 2020 and on June 9-11, 2020.
The Trustees determined that the overall arrangements between each Fund and PGIM Investments, which serves as each Fund’s investment manager pursuant to a management agreement, and between PGIM Investments and each of QMA, Jennison, PGIML and PGIM Fixed Income as applicable, each of which serves as each Fund’s subadviser pursuant to the terms of subadvisory agreements with PGIM Investments, are in the best interests of each Fund and its shareholders in light of the services performed, fees charged and such other matters as the Trustees considered relevant in the exercise of their business judgment.
The material factors and conclusions that formed the basis for the Trustees’ reaching their determinations to approve the continuance of the agreements are separately discussed below.
Nature, Quality and Extent of Services
The Board received and considered information regarding the nature, quality and extent of services provided to each Fund by PGIM Investments, QMA, Jennison, PGIML and PGIM Fixed Income. The Board noted that QMA, Jennison, PGIML and PGIM Fixed Income are affiliated with PGIM Investments. The Board considered the services provided by PGIM Investments, including but not limited to the oversight of the subadviser for each Fund, as well as the provision of fund recordkeeping, compliance and other services to each Fund , and PGIM Investments’ role as administrator of the Funds’ liquidity risk management program. With respect to PGIM Investments’ oversight of the subadvisers, the Board noted that PGIM Investments’ Strategic Investment Research Group (“SIRG”), which is a business unit of PGIM Investments, is responsible for monitoring and reporting to PGIM Investments’ senior management on the performance and operations of the subadvisers. The Board also considered that PGIM Investments pays the salaries of all of the officers and interested Trustees of the Funds who are part of Fund management. The Board also considered the investment subadvisory services provided by QMA, Jennison, PGIML and PGIM Fixed Income, including investment research and security selection, as well as adherence to each Fund’s investment restrictions and compliance with applicable Fund policies and procedures. The Board considered PGIM Investments’ evaluation of the subadvisers, as well as PGIM Investments’ recommendation, based on its review of the subadvisers, to renew the subadvisory agreements.
| | |
| Visit our website at pgim.com/investments | | |
The Board considered the qualifications, backgrounds and responsibilities of PGIM Investments’ senior management responsible for the oversight of each Fund, QMA, Jennison, PGIML and PGIM Fixed Income and also considered the qualifications, backgrounds and responsibilities of the QMA, Jennison, PGIML and PGIM Fixed Income portfolio managers who are responsible for the day-to-day management of each Fund’s portfolio. The Board was provided with information pertaining to PGIM Investments’, QMA’s, Jennison’s, PGIML’s and PGIM Fixed Income’s organizational structure, senior management, investment operations, and other relevant information pertaining to PGIM Investments, Jennison, QMA, PGIML and PGIM Fixed Income. The Board also noted that it received favorable compliance reports from the Funds’ Chief Compliance Officer (“CCO”) as to each of PGIM Investments, QMA, Jennison, PGIML and PGIM Fixed Income.
The Board concluded that it was satisfied with the nature, extent and quality of the investment management services provided by PGIM Investments and the subadvisory services provided to each Fund by QMA, Jennison, PGIML and PGIM Fixed Income and that there was a reasonable basis on which to conclude that each Fund benefits from the services provided by PGIM Investments, QMA and Jennison, PGIML under the management and subadvisory agreements.
Costs of Services and Profits Realized by PGIM Investments
The Board was provided with information on the profitability of PGIM Investments and its affiliates in serving as each Fund’s investment manager. The Board discussed with PGIM Investments the methodology utilized in assembling the information regarding profitability and considered its reasonableness. The Board recognized that it is difficult to make comparisons of profitability from fund management contracts because comparative information is not generally publicly available and is affected by numerous factors, including the structure of the particular adviser, the types of funds it manages, its business mix, numerous assumptions regarding allocations and the adviser’s capital structure and cost of capital. However, the Board considered that the cost of services provided by PGIM Investments during the year ended December 31, 2019 exceeded the management fees paid by each Fund, resulting in an operating loss to PGIM Investments. Taking these factors into account, the Board concluded that the profitability of PGIM Investments and its affiliates in relation to the services rendered was not unreasonable.
Economies of Scale
The Board received and discussed information concerning economies of scale that PGIM Investments may realize as each Fund’s assets grow beyond current levels. During the course of time, the Board has considered information regarding the launch date of each Fund, the management fees of each Fund compared to those of similarly managed funds and PGIM Investments’ investment in each Fund over time. The Board noted that, while
| | |
| PGIM Day One Underlying Funds |
Approval of Advisory Agreements (continued)
the management fee schedule for each Fund does not have breakpoints in its management fees, economies of scale can be shared with each Fund in other ways, including low management fees from inception, additional technological and personnel investments to enhance shareholder services, and maintaining existing expense structures in the face of a rising cost environment. The Board also considered PGIM Investments’ assertion that it continually evaluates the management fee schedule of each Fund and the potential to share economies of scale through breakpoints or fee waivers as asset levels increase.
The Board recognized the inherent limitations of any analysis of economies of scale, stemming largely from the Board’s understanding that most of PGIM Investments’ costs are not specific to individual funds, but rather are incurred across a variety of products and services.
Other Benefits to PGIM Investments, QMA, Jennison, PGIML and PGIM Fixed Income
The Board considered potential ancillary benefits that might be received by PGIM Investments, QMA, Jennison PGIML, PGIM Fixed Income and their affiliates as a result of their relationship with each Fund. The Board concluded that potential benefits to be derived by PGIM Investments included transfer agency fees received by each Fund’s transfer agent (which is affiliated with PGIM Investments), and benefits to its reputation as well as other intangible benefits resulting from PGIM Investments’ association with the Funds. The Board concluded that the potential benefits to be derived by QMA and Jennison included their ability to use soft dollar credits, as well as the potential benefits consistent with those generally resulting from an increase in assets under management, specifically, potential access to additional research resources and benefits to their reputations. The Board concluded that the benefits derived by PGIM Investments, QMA and Jennison were consistent with the types of benefits generally derived by investment managers and subadvisers to mutual funds.
Performance of the Funds / Fees and Expenses
The Board considered certain additional factors and made related conclusions relating to the historical performance of each Fund for the one-year and the three-year periods ended December 31, 2019. The Board considered that PGIM QMA US Broad Market Index Fund and PGIM QMA Mid-Cap Core Equity Fund each commenced operations on November 17, 2016 and that all of the other Funds commenced operations on November 15, 2016 and that longer-term performance was not yet available.
The Board also considered each Fund’s actual management fee, as well as each Fund’s net total expense ratio, for the fiscal year ended July 31, 2019. The Board considered the management fee for each Fund as compared to the management fee charged by PGIM
| | |
| Visit our website at pgim.com/investments | | |
Investments to other funds and the fee charged by other advisers to comparable mutual funds in a Peer Group. The actual management fee represents the fee rate actually paid by Fund shareholders and includes any fee waivers or reimbursements. The net total expense ratio for each Fund represents the actual expense ratio incurred by Fund shareholders.
The mutual funds included in the Peer Universe, which was used to consider performance, and the Peer Group, which was used to consider expenses and fees, for each Fund were objectively determined by Broadridge, an independent provider of mutual fund data. In certain circumstances, PGIM Investments also provided supplemental Peer Universe or Peer Group information, for reasons addressed with the Board. The comparisons placed each Fund in various quartiles over various periods, with the first quartile being the best 25% of the mutual funds (for performance, the best performing mutual funds and, for expenses, the lowest cost mutual funds).
The section below summarizes key factors considered by the Board and the Board’s conclusions regarding each Fund’s performance, fees and overall expenses. For each Fund, the table sets forth net performance comparisons (which reflect the impact on performance of any subsidies, expense caps or waivers that may be applicable) with the Peer Universe, actual management fees with the Peer Group (which reflect the impact of fund expenses, or any subsidies or fee waivers), and net total expenses with the Peer Group, each of which were key factors considered by the Board.
PGIM QMA US Broad Market Index Fund
| | | | | | | | |
| Net Performance | | 1 Year | | 3 Years | | 5 Years | | 10 Years |
| | | 2nd Quartile | | 1st Quartile | | N/A | | N/A |
| Actual Management Fees: 1st Quartile |
| Net Total Expenses: 3rd Quartile |
| | • | | The Board noted that the Fund underperformed its benchmark index over the one-year and the three-year periods. |
| | • | | The Board considered that the Fund commenced operations on November 17, 2016 and that longer-term performance was not yet available. |
| | • | | The Board and PGIM Investments agreed to retain the existing contractual cap on Fund expenses, which (exclusive of certain fees and expenses) caps total annual operating expenses at 0.20% for Class R6 shares through November 30, 2020. |
| | • | | The Board concluded that, in light of the above, it would be in the best interests of the Fund and its shareholders to continue to allow the Fund to create a longer-term performance record, and to renew the agreements. |
| | • | | The Board concluded that the management fees (including subadvisory fees) and total expenses were reasonable in light of the services provided. |
| | |
| PGIM Day One Underlying Funds |
Approval of Advisory Agreements (continued)
PGIM QMA Mid-Cap Core Equity Fund
| | | | | | | | |
| Net Performance | | 1 Year | | 3 Years | | 5 Years | | 10 Years |
| | | 4th Quartile | | 3rd Quartile | | N/A | | N/A |
| Actual Management Fees: 1st Quartile |
| Net Total Expenses: 3rd Quartile |
| | • | | The Board noted that the Fund underperformed its benchmark index over the one-year and the three-year periods. |
| | • | | The Board considered that the Fund only commenced investment operations on November 17, 2016 and that longer-term performance was not yet available. |
| | • | | The Board noted PGIM Investments’ assertions that underperformance was driven by the Fund’s value and small-cap style factor exposures, which trailed the broader market in 2019 as the growth style factor outperformed. |
| | • | | The Board considered that the Fund ranked in the second quartile of its re-classified Peer Group for the fourth quarter of 2019. |
| | • | | The Board and PGIM Investments agreed to retain the existing contractual cap on Fund expenses , which (exclusive of certain fees and expenses) caps total annual operating expenses at 0.85% for Class R6 shares through November 30, 2020. |
| | • | | The Board noted information provided by PGIM Investments indicating that the Fund’s net total expense ratio was two basis points from the median of all funds in the Peer Group. |
| | • | | The Board concluded that, in light of the above, it would be in the best interests of the Fund and its shareholders to continue to allow the Fund to create a longer-term performance record, and to renew the agreements. |
| | • | | The Board concluded that the management fees (including subadvisory fees) and total expenses were reasonable in light of the services provided. |
PGIM Jennison Small-Cap Core Equity Fund
| | | | | | | | |
| Net Performance | | 1 Year | | 3 Years | | 5 Years | | 10 Years |
| | | 2nd Quartile | | 1st Quartile | | N/A | | N/A |
| | | Actual Management Fees: 1st Quartile |
| | | Net Total Expenses: 4th Quartile |
| | • | | The Board noted that the Fund outperformed its benchmark index over the one-year and the three-year periods. |
| | • | | The Board considered that the Fund commenced operations on November 15, 2016 and that longer-term performance was not yet available. |
| | • | | The Board and PGIM Investments agreed to retain the existing contractual cap on Fund expenses , which (exclusive of certain fees and expenses) caps total annual operating expenses at 0.95% for Class R6 shares through November 30, 2020. |
| | |
| Visit our website at pgim.com/investments | | |
| | • | | The Board concluded that, in light of the above, it would be in the best interests of the Fund and its shareholders to continue to allow the Fund to create a longer-term performance record, and to renew the agreements. |
| | • | | The Board concluded that the management fees (including subadvisory fees) and total expenses were reasonable in light of the services provided. |
PGIM Core Conservative Bond Fund
| | | | | | | | |
| Net Performance | | 1 Year | | 3 Years | | 5 Years | | 10 Years |
| | | 3rd Quartile | | 3rd Quartile | | N/A | | N/A |
| Actual Management Fees: 1st Quartile |
| Net Total Expenses: 3rd Quartile |
| | • | | The Board noted that the Fund underperformed its benchmark index over the one-year and the three-year periods. |
| | • | | The Board considered PGIM Investments’ assertion that, relative to its Peer Group, which has the flexibility to invest in emerging markets and below investment grade debt, the Fund’s more conservative investment approach limits exposure to these sectors, which drove peer relative underperformance. |
| | • | | The Board noted that, as of March 31, 2020, Fund outperformed its Peer Group for the year-to-date and one-year periods. |
| | • | | The Board considered that the Fund commenced operations on December 13, 2016 and that longer-term performance was not yet available. |
| | • | | The Board and PGIM Investments agreed to retain the existing contractual cap on Fund expenses, which (exclusive of certain fees and expenses) caps total annual operating expenses at 0.50% for Class R6 shares through November 30, 2020. |
| | • | | The Board concluded that, in light of the above, it would be in the best interests of the Fund and its shareholders to continue to allow the Fund to create a longer-term performance record, and to renew the agreements. |
| | • | | The Board concluded that the management fees (including subadvisory fees) and total expenses were reasonable in light of the services provided. |
PGIM TIPS Fund
| | | | | | | | |
| Net Performance | | 1 Year | | 3 Years | | 5 Years | | 10 Years |
| | | 2nd Quartile | | 2nd Quartile | | N/A | | N/A |
| Actual Management Fees: 1st Quartile |
| Net Total Expenses: 3rd Quartile |
| | • | | The Board noted that the Fund underperformed its benchmark index over the one-year and the three-year periods. |
| | |
| PGIM Day One Underlying Funds |
Approval of Advisory Agreements (continued)
| | • | | The Board considered that the Fund commenced operations on November 15, 2016 and that longer-term performance was not yet available. |
| | • | | The Board and PGIM Investments agreed to retain the existing contractual cap on Fund expenses, which (exclusive of certain fees and expenses) caps total annual operating expenses at 0.40% for Class R6 shares through November 30, 2020. |
| | • | | The Board concluded that, in light of the above, it would be in the best interests of the Fund and its shareholders to continue to allow the Fund to create a longer-term performance record, and to renew the agreements. |
| | • | | The Board concluded that the management fees (including subadvisory fees) and total expenses were reasonable in light of the services provided. |
PGIM QMA Commodity Strategies Fund
| | | | | | | | |
| Net Performance | | 1 Year | | 3 Years | | 5 Years | | 10 Years |
| | | 2nd Quartile | | 3rd Quartile | | N/A | | N/A |
| Actual Management Fees: 1st Quartile |
| Net Total Expenses: 3rd Quartile |
| | • | | The Board noted that the Fund outperformed its benchmark index over the one-year period and underperformed its benchmark index over the three-year period. |
| | • | | The Board considered that the Fund commenced operations on November 15, 2016 and that longer-term performance was not yet available. |
| | • | | The Board and PGIM Investments agreed to retain the existing contractual cap on Fund expenses, which (exclusive of certain fees and expenses) caps total annual operating expenses at 0.80% for Class R6 shares through November 30, 2020. |
| | • | | The Board concluded that, in light of the above, it would be in the best interests of the Fund and its shareholders to continue to allow the Fund to create a longer-term performance record, and to renew the agreements. |
| | • | | The Board concluded that the management fees (including subadvisory fees) and total expenses were reasonable in light of the services provided. |
* * *
After full consideration of these factors, the Board concluded that approval of the agreements was in the best interests of each Fund and its shareholders.
| | |
| Visit our website at pgim.com/investments | | |
| | | | |
| | |
| ∎ MAIL | | ∎ TELEPHONE | | ∎ WEBSITE |
655 Broad Street Newark, NJ 07102 | | (800) 225-1852 | | pgim.com/investments |
|
| PROXY VOTING |
| The Board of Trustees of the Funds have delegated to the Funds’ subadvisers the responsibility for voting any proxies and maintaining proxy recordkeeping with respect to the Funds. A description of these proxy voting policies and procedures is available without charge, upon request, by calling (800) 225-1852 or by visiting the Securities and Exchange Commission’s website at sec.gov. Information regarding how the Funds voted proxies relating to portfolio securities during the most recent 12-month period ended June 30 are available on the Funds’ website and on the Commission’s website at sec.gov. |
|
| TRUSTEES |
| Ellen S. Alberding • Kevin J. Bannon • Scott E. Benjamin • Linda W. Bynoe • Barry H. Evans • Keith F. Hartstein • Laurie Simon Hodrick • Michael S. Hyland • Stuart S. Parker • Brian K. Reid • Grace C. Torres |
|
| OFFICERS |
Stuart S. Parker, President • Scott E. Benjamin, Vice President • Christian J. Kelly, Treasurer and Principal Financial and Accounting Officer • Claudia DiGiacomo, Chief Legal Officer • Dino Capasso, Chief Compliance Officer • Charles H. Smith, Anti-Money Laundering Compliance Officer • Andrew R. French, Secretary • Jonathan D. Shain, Assistant Secretary • Melissa Gonzalez, Assistant Secretary • Diana N. Huffman, Assistant Secretary • Kelly A. Coyne, Assistant Secretary • Patrick McGuinness, Assistant Secretary • Lana Lomuti, Assistant Treasurer • Russ Shupak, Assistant Treasurer • Elyse McLaughlin, Assistant Treasurer • Deborah Conway, Assistant Treasurer |
| | | | |
| MANAGER | | PGIM Investments LLC | | 655 Broad Street
Newark, NJ 07102 |
|
| SUBADVISERS | | QMA LLC | | Gateway Center Two
100 Mulberry Street
Newark, NJ 07102 |
| | |
| | Jennison Associates LLC | | 466 Lexington Avenue
New York, NY 10017 |
| | |
| | PGIM Fixed Income | | 655 Broad Street
Newark, NJ 07102 |
| | |
| | PGIM Limited | | Grand Buildings, 1-3 Strand Trafalgar Square London, WC2N 5HR United Kingdom |
|
| DISTRIBUTOR | | Prudential Investment
Management Services LLC | | 655 Broad Street
Newark, NJ 07102 |
|
| CUSTODIAN | | The Bank of New York Mellon | | 240 Greenwich Street
New York, NY 10286 |
|
| TRANSFER AGENT | | Prudential Mutual Fund
Services LLC | | PO Box 9658
Providence, RI 02940 |
|
| INDEPENDENT REGISTERED PUBLIC ACCOUNTING FIRM | | KPMG LLP | | 345 Park Avenue New York, NY 10154 |
|
| FUND COUNSEL | | Willkie Farr & Gallagher LLP | | 787 Seventh Avenue
New York, NY 10019 |
|
|
| An investor should consider the investment objectives, risks, charges, and expenses of each Fund carefully before investing. The prospectus contains this and other information about the Funds. An investor may obtain a prospectus by visiting our website at pgim.com/investments or by calling (800) 225-1852. The prospectus should be read carefully before investing. |
|
| SHAREHOLDER COMMUNICATIONS WITH TRUSTEES |
| Shareholders can communicate directly with the Board of Trustees by writing to the Chair of the Board, PGIM Day One Underlying Funds c/o PGIM Investments, Attn: Board of Trustees, 655 Broad Street, Newark, NJ 07102. Shareholders can communicate directly with an individual Trustee by writing to that Trustee at the same address. Communications to the Board or individual Trustees are not screened before being delivered to the addressee. |
|
| AVAILABILITY OF PORTFOLIO SCHEDULE |
| The Fund files its complete schedule of portfolio holdings with the Securities and Exchange Commission for the first and third quarters of each fiscal year as an exhibit to its reports on Form N-PORT. The Fund’s Form N-PORT filings are available on the Commission’s website at sec.gov. |
|
The Fund’s Statement of Additional Information contains additional information about the Fund’s Trustees and is available without charge, upon request, by calling (800) 225-1852. |
Mutual Funds:
| | | | |
ARE NOT INSURED BY THE FDIC OR ANY
FEDERAL GOVERNMENT AGENCY | | MAY LOSE VALUE | | ARE NOT A DEPOSIT OF OR GUARANTEED
BY ANY BANK OR ANY BANK AFFILIATE |
| | | | | | | | | | |
| | | NASDAQ | | CUSIP | | | | NASDAQ | | CUSIP |
| PGIM JENNISON SMALL-CAP CORE EQUITY FUND | | PQJCX | | 74440E805 | | PGIM QMA COMMODITY STRATEGIES FUND | | PQCMX | | 74440E862 |
| PGIM CORE CONSERVATIVE BOND FUND | | PQCNX | | 74440E888 | | PGIM QMA MID-CAP CORE EQUITY FUND | | PQCCX | | 74440E508 |
| PGIM TIPS FUND | | PQTSX | | 74440E870 | | PGIM QMA US BROAD MARKET INDEX FUND | | PQBMX | | 74440E409 |
Item 2 – Code of Ethics — See Exhibit (a)
As of the end of the period covered by this report, the registrant has adopted a code of ethics (the “Section 406 Standards for Investment Companies – Ethical Standards for Principal Executive and Financial Officers”) that applies to the registrant’s Principal Executive Officer and Principal Financial Officer; the registrant’s Principal Financial Officer also serves as the Principal Accounting Officer.
The registrant hereby undertakes to provide any person, without charge, upon request, a copy of the code of ethics. To request a copy of the code of ethics, contact the registrant 800-225-1852, and ask for a copy of the Section 406 Standards for Investment Companies - Ethical Standards for Principal Executive and Financial Officers.
Item 3 – Audit Committee Financial Expert –
The registrant’s Board has determined that Ms. Grace C. Torres, member of the Board’s Audit Committee is an “audit committee financial expert,” and that she is “independent,” for purposes of this item.
Item 4 – Principal Accountant Fees and Services –
(a) Audit Fees
For the fiscal years ended July 31, 2020 and July 31, 2019, KPMG LLP (“KPMG”), the Registrant’s principal accountant, billed the Registrant $190,758 and $190,758 respectively, for professional services rendered for the audit of the Registrant’s annual financial statements or services that are normally provided in connection with statutory and regulatory filings.
(b) Audit-Related Fees
For the fiscal year ended July 31, 2020, fees of $8,508 were billed to the Registrant for services rendered by KPMG in connection with an accounting system conversion and were paid by The Bank of New York Mellon. For the fiscal year ended July 31, 2019, there are no fees to report.
(c) Tax Fees
For the fiscal years ended July 31, 2020 and July 31, 2019: none.
(d) All Other Fees
For the fiscal years ended July 31, 2020 and July 31, 2019: none.
(e) (1) Audit Committee Pre-Approval Policies and Procedures
THE PGIM MUTUAL FUNDS
AUDIT COMMITTEE POLICY
on
Pre-Approval of Services Provided by the Independent
Accountants
The Audit Committee of each PGIM Mutual Fund is charged with the responsibility to monitor the independence of the Fund’s independent accountants. As part of this responsibility, the Audit Committee must pre-approve the independent accounting firm’s engagement to render audit and/or permissible non-audit services, as required by law. In evaluating a proposed engagement of the independent accountants, the Audit Committee will assess the effect that the engagement might reasonably be expected to have on the accountant’s independence. The Committee’s evaluation will be based on:
| | • | | a review of the nature of the professional services expected to be provided, |
| | • | | a review of the safeguards put into place by the accounting firm to safeguard independence, and |
| | • | | periodic meetings with the accounting firm. |
Policy for Audit and Non-Audit Services Provided to the Funds
On an annual basis, the scope of audits for each Fund, audit fees and expenses, and audit-related and non-audit services (and fees proposed in respect thereof) proposed to be performed by the Fund’s independent accountants will be presented by the Treasurer and the independent accountants to the Audit Committee for review and, as appropriate, approval prior to the initiation of such services.
Such presentation shall be accompanied by confirmation by both the Treasurer and the independent accountants that the proposed non-audit services will not adversely affect the independence of the independent accountants. Such proposed non-audit services shall be described in sufficient detail to enable the Audit Committee to assess the appropriateness of such services and fees, and the compatibility of the provision of such services with the auditor’s independence. The Committee shall receive periodic reports on the progress of the audit and other services which are approved by the Committee or by the Committee Chair pursuant to authority delegated in this Policy.
The categories of services enumerated under “Audit Services”, “Audit-related Services”, and “Tax Services” are intended to provide guidance to the Treasurer and the independent accountants as to those categories of services which the Committee believes are generally consistent with the independence of the independent accountants and which the Committee (or the Committee Chair) would expect upon the presentation of specific proposals to pre-approve. The enumerated categories are not intended as an exclusive list of audit, audit-related or tax services, which the Committee (or the Committee Chair) would consider for pre-approval.
Audit Services
The following categories of audit services are considered to be consistent with the role of the Fund’s independent accountants:
| | • | | Annual Fund financial statement audits |
| | • | | Seed audits (related to new product filings, as required) |
| | • | | SEC and regulatory filings and consents |
Audit-related Services
The following categories of audit-related services are considered to be consistent with the role of the Fund’s independent accountants:
| | • | | Accounting consultations |
| | • | | Fund merger support services |
| | • | | Agreed Upon Procedure Reports |
| | • | | Other Internal Control Reports |
Individual audit-related services that fall within one of these categories (except for fund merger support services) and are not presented to the Audit Committee as part of the annual pre-approval process are subject to an authorized pre-approval by the Audit Committee so long as the estimated fee for those services does not exceed $30,000. Any services provided under such pre-approval will be reported to the Audit Committee at its next regular meeting. Should the amount of such services exceed $30,000 any additional fees will be subject to pre-approval by the Committee Chair (or any other Committee member on whom this responsibility has been delegated). Fees related to fund merger support services are subject to a separate authorized pre-approval by the Audit Committee with fees determined on a per occurrence and merger complexity basis.
Tax Services
The following categories of tax services are considered to be consistent with the role of the Fund’s independent accountants:
| | • | | Tax compliance services related to the filing or amendment of the following: |
| | • | | Federal, state and local income tax compliance; and, |
| | • | | Sales and use tax compliance |
| | • | | Timely RIC qualification reviews |
| | • | | Tax distribution analysis and planning |
| | • | | Tax authority examination services |
| | • | | Tax appeals support services |
| | • | | Accounting methods studies |
| | • | | Fund merger support services |
| | • | | Tax consulting services and related projects |
Individual tax services that fall within one of these categories and are not presented to the Audit Committee as part of the annual pre-approval process are subject to an authorized pre-approval by the Audit Committee so long as the estimated fee for those services does not exceed $30,000. Any services provided under such pre-approval will be reported to the Audit Committee at its next regular meeting. Should the amount of such services exceed $30,000 any additional fees will be subject to pre-approval by the Committee Chair (or any other Committee member on whom this responsibility has been delegated).
Other Non-Audit Services
Certain non-audit services that the independent accountants are legally permitted to render will be subject to pre-approval by the Committee or by one or more Committee members to whom the Committee has delegated this authority and who will report to the full Committee any pre-approval decisions made pursuant to this Policy. Non-audit services presented for pre-approval pursuant to this paragraph will be accompanied by a confirmation from both the Treasurer and the independent accountants that the proposed services will not adversely affect the independence of the independent accountants.
Proscribed Services
The Fund’s independent accountants will not render services in the following categories of non-audit services:
| | • | | Bookkeeping or other services related to the accounting records or financial statements of the Fund |
| | • | | Financial information systems design and implementation |
| | • | | Appraisal or valuation services, fairness opinions, or contribution-in-kind reports |
| | • | | Internal audit outsourcing services |
| | • | | Management functions or human resources |
| | • | | Broker or dealer, investment adviser, or investment banking services |
| | • | | Legal services and expert services unrelated to the audit |
| | • | | Any other service that the Public Company Accounting Oversight Board determines, by regulation, is impermissible. |
Pre-approval of Non-Audit Services Provided to Other Entities Within the PGIM Fund Complex
Certain non-audit services provided to PGIM Investments LLC or any of its affiliates that also provide ongoing services to the PGIM Mutual Funds will be subject to pre-approval by the Audit Committee. The only non-audit services provided to these entities that will require pre-approval are those related directly to the operations and financial reporting of the Funds. Individual projects that are not presented to the Audit Committee as part of the annual pre-approval process will be subject to pre-approval by the Committee Chair (or any other Committee member on whom this responsibility has been delegated) so long as the estimated fee for those services does not exceed $30,000. Services presented for pre-approval pursuant to this paragraph will be accompanied by a confirmation from both the Treasurer and the independent accountants that the proposed services will not adversely affect the independence of the independent accountants.
Although the Audit Committee will not pre-approve all services provided to PGIM Investments LLC and its affiliates, the Committee will receive an annual report from the Fund’s independent accounting firm showing the aggregate fees for all services provided to PGIM Investments and its affiliates.
(e) (2) Percentage of services referred to in 4(b) – 4(d) that were approved by the audit committee –
For the fiscal year ended July 31, 2020, 100% of the services referred to in Item 4(b) was approved by the audit committee. For the fiscal year ended July 31, 2019: none.
(f) Percentage of hours expended attributable to work performed by other than full time employees of principal accountant if greater than 50%.
The percentage of hours expended on the principal accountant’s engagement to audit the registrant’s financial statements for the most recent fiscal year that were attributed to work performed by persons other than the principal accountant’s full-time, permanent employees was 0%.
(g) Non-Audit Fees
The aggregate non-audit fees billed by KPMG for services rendered to the registrant’s investment adviser and any entity controlling, controlled by, or under common control with the investment adviser that provides ongoing services to the registrant for the fiscal years ended July 31, 2020 and July 31, 2019 was $0 and $0, respectively.
(h) Principal Accountant’s Independence
Not applicable as KPMG has not provided non-audit services to the registrant’s investment adviser and any entity controlling, controlled by, or under common control with the investment adviser that provides ongoing services to the registrant that were not pre-approved pursuant to Rule 2-01(c)(7)(ii) of Regulation S-X.
Item 5 – Audit Committee of Listed Registrants – Not applicable
Item 6 – Schedule of Investments – The schedule is included as part of the report to shareholders filed under Item 1 of this Form.
Item 7 – Disclosure of Proxy Voting Policies and Procedures for Closed-End Management Investment Companies – Not applicable
Item 8 – Portfolio Managers of Closed-End Management Investment Companies – Not applicable.
Item 9 – Purchases of Equity Securities by Closed-End Management Investment Company and Affiliated Purchasers – Not applicable.
Item 10 – Submission of Matters to a Vote of Security Holders – There have been no material changes to these procedures.
Item 11 – Controls and Procedures
| | (a) | It is the conclusion of the registrant’s principal executive officer and principal financial officer that the effectiveness of the registrant’s current disclosure controls and procedures (such disclosure controls and procedures having been evaluated within 90 days of the date of this filing) provide reasonable assurance that the information required to be disclosed by the registrant has been recorded, processed, summarized and reported within the time period specified in the Commission’s rules and forms and that the information required to be disclosed by the registrant has been accumulated and communicated to the registrant’s principal executive officer and principal financial officer in order to allow timely decisions regarding required disclosure. |
| | (b) | There has been no significant change in the registrant’s internal control over financial reporting that occurred during the registrant’s most recent fiscal quarter of the period covered by this report that has materially affected, or is likely to materially affect, the registrant’s internal control over financial reporting. |
Item 12 – Controls and Procedures – Disclosure of Securities Lending Activities for Closed-End Management Investment Companies – Not applicable.
Item 13 – Exhibits
SIGNATURES
Pursuant to the requirements of the Securities Exchange Act of 1934 and the Investment Company Act of 1940, the registrant has duly caused this report to be signed on its behalf by the undersigned, thereunto duly authorized.
| | |
Registrant | | Prudential Investment Portfolios 2 |
| |
By: | | /s/ Andrew R. French |
| | Andrew R. French |
| | Secretary |
| |
Date: | | September 18, 2020 |
Pursuant to the requirements of the Securities Exchange Act of 1934 and the Investment Company Act of 1940, this report has been signed below by the following persons on behalf of the registrant and in the capacities and on the dates indicated.
| | |
By: | | /s/ Stuart S. Parker |
| | Stuart S. Parker |
| | President and Principal Executive Officer |
| |
Date: | | September 18, 2020 |
| | |
By: | | /s/ Christian J. Kelly |
| | Christian J. Kelly |
| | Treasurer and Principal Financial and Accounting Officer |
| |
Date: | | September 18, 2020 |