UNITED STATES
SECURITIES AND EXCHANGE COMMISSION
Washington, D.C. 20549
FORM N-CSR
CERTIFIED SHAREHOLDER REPORT OF REGISTERED MANAGEMENT INVESTMENT
COMPANIES
| Investment Company Act file number: | 811-09999 | |
| Exact name of registrant as specified in charter: | Prudential Investment Portfolios 2 | |
| (This Form N-CSR relates solely to the Registrant’s: PGIM Core Short-Term Bond Fund, PGIM Core Ultra Short Bond Fund and PGIM Institutional Money Market Fund) | ||
| Address of principal executive offices: | 655 Broad Street, 17th Floor Newark, New Jersey 07102 | |
| Name and address of agent for service: | Andrew R. French 655 Broad Street, 17th Floor Newark, New Jersey 07102 | |
| Registrant’s telephone number, including area code: | 800-225-1852 | |
| Date of fiscal year end: | 1/31/2022 | |
| Date of reporting period: | 1/31/2022 | |
Item 1 – Reports to Stockholders

PGIM CORE SHORT-TERM BOND FUND
PGIM CORE ULTRA SHORT BOND FUND
PGIM INSTITUTIONAL MONEY
MARKET FUND
ANNUAL REPORT
JANUARY 31, 2022

To enroll in e-delivery, go to pgim.com/investments/resource/edelivery
PGIM Core Short-Term Bond Fund
|
| 3
|
| |
PGIM Core Ultra Short Bond Fund
|
| 7
|
| |
PGIM Institutional Money Market Fund
|
| 11
|
| |
Strategy and Performance Overview
|
| 14
|
| |
|
| 20
|
| |
Holdings and Financial Statements
|
| 23
|
| |
This report is not authorized for distribution to prospective investors unless preceded or accompanied by a current prospectus.
The views expressed in this report and information about the Funds’ portfolio holdings are for the period covered by this report and are subject to change thereafter.
Mutual funds are distributed by Prudential Investment Management Services LLC, a Prudential Financial company and member SIPC. PGIM Fixed Income is a unit of PGIM, Inc. (PGIM), a registered investment adviser. PGIM is a Prudential Financial company. © 2022 Prudential Financial, Inc. and its related entities. PGIM and the PGIM logo are service marks of Prudential Financial, Inc. and its related entities, registered in many jurisdictions worldwide.
| 2 | Visit our website at pgim.com/investments |
PGIM Core Short-Term Bond Fund
Your Fund’s Performance (unaudited)
Performance data quoted represent past performance. Past performance does not guarantee future results. The investment return and principal value of an investment will fluctuate so that an investor’s shares, when redeemed, may be worth more or less than their original cost. Current performance may be lower or higher than the past performance data quoted.
| Average Annual Total Returns as of 1/31/22 | ||||||
| One Year (%) | Five Years (%) | Ten Years (%) | ||||
| Fund | 0.24 | 1.96 | 2.15 | |||
| ICE US 1-Month Treasury Bill Index * | ||||||
| 0.04 | 1.02 | 0.55 | ||||
| ICE BofA US Dollar 1-Month Deposit Offered Rate Constant Maturity Index | ||||||
| 0.10 | 1.22 | 0.74 | ||||
| ICE BofA USD 3-Month Deposit Offered Rate Constant Maturity Index | ||||||
| 0.14 | 1.39 | 0.89 | ||||
| Bloomberg US Short Treasury Index | ||||||
| -0.04 | 1.20 | 0.71 | ||||
* The ICE US 1-Month Treasury Bill Index was adopted as the Fund’s primary benchmark in March 2022 due to the pending discontinuation of LIBOR.
The returns in the tables do not reflect the deduction of taxes that a shareholder would pay on Fund distributions or following the redemption of Fund shares.
Prudential Investment Portfolios 2 | 3 |
PGIM Core Short-Term Bond Fund
Your Fund’s Performance (continued)
Growth of a $10,000 Investment
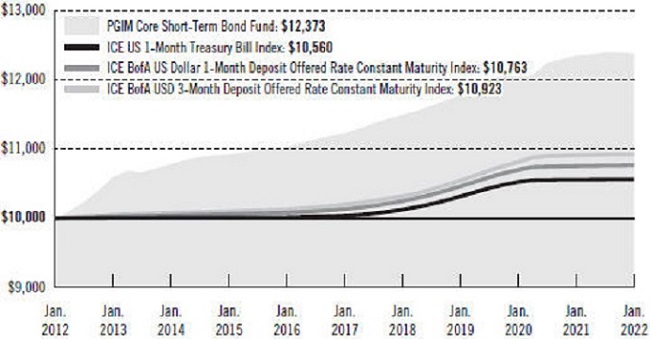
The graph compares a $10,000 investment in the Fund with a similar investment in the ICE US 1-Month Treasury Bill Index, the ICE BofA US Dollar 1-Month Deposit Offered Rate Constant Maturity Index and the ICE BofA USD 3-Month Deposit Offered Rate Constant Maturity Index by portraying the initial account values at the beginning of the 10-year period (January 31, 2012) and the account values at the end of the current fiscal year (January 31, 2022), as measured on a quarterly basis. For purposes of the graph, and unless otherwise indicated, it has been assumed that (a) all recurring fees (including management fees) were deducted and (b) all dividends and distributions were reinvested. Without waiver of fees and/or expense reimbursements, if any, the returns would have been lower.
Past performance does not predict future performance. Total returns and the ending account values in the graph include changes in share price and reinvestment of dividends and capital gains distributions in a hypothetical investment for the periods shown. The Fund’s total returns do not reflect the deduction of income taxes on an individual’s investment. Taxes may reduce your actual investment returns on income or gains paid by the Fund or any gains you may realize if you sell your shares.
| 4 | Visit our website at pgim.com/investments |
Benchmark Definitions
ICE US 1-Month Treasury Bill Index—an unmanaged index that is comprised of a single issue purchased at the beginning of the month and held for a full month. At the end of the month that issue is sold and rolled into a newly selected issue. The issue selected at each month-end rebalancing is the outstanding Treasury Bill that matures closest to, but not less than, one month from the rebalancing date. To qualify for selection, an issue must have settled on or before the month-end rebalancing date.
ICE BofA US Dollar 1-Month Deposit Offered Rate Constant Maturity Index—an unmanaged index which tracks the performance of a synthetic asset paying LIBOR to a stated maturity. The 1 Month Current Index is based on the assumed purchase at par of a synthetic instrument having exactly its stated maturity and with a coupon equal to that day’s fixing rate. That issue is assumed to be sold the following business day (priced at a yield equal to the current day fixing rate) and rolled into a new instrument.
ICE BofA US Dollar 3-Month Deposit Offered Rate Constant Maturity Index—tracks the performance of a basket of synthetic assets paying LIBID to a stated maturity. The index purchases a new instrument each day, priced at par, having exactly its stated maturity and with a coupon equal to that day’s fixing rate. All issues are held to maturity. Therefore, each day the index is comprised of a basket of securities. The index is not marked to market. The returns of the index represent the accrued income generated by the equally weighted average of all the coupons in the basket for a given day.
Bloomberg US Short Treasury Index—The Bloomberg US Short Treasury Index includes aged U.S. Treasury bills, notes and bonds with a remaining maturity from 1 up to (but not including) 12 months. It excludes zero coupon strips.
Investors cannot invest directly in an index. The returns for the Indexes would be lower if they included the effects of sales charges, operating expenses of a mutual fund, or taxes that may be paid by an investor.
| Distributions and Yields as of 1/31/22 | ||||||
| Total Distributions Paid for | SEC 30-Day Subsidized Yield* (%) | SEC 30-Day Unsubsidized Yield** (%) | ||||
| PGIM Core Short-Term Bond Fund | 0.08 | 0.94 | 0.94 | |||
*SEC 30-Day Subsidized Yield (%)—A standardized yield calculation created by the Securities and Exchange Commission, it reflects the income earned during a 30-day period, after the deduction of the Fund’s net expenses (net of any expense waivers or reimbursements). The investor experience is represented by the SEC 30-Day Subsidized Yield.
**SEC 30-Day Unsubsidized Yield (%)—A standardized yield calculation created by the Securities and Exchange Commission, it reflects the income earned during a 30-day period, after the deduction of the Fund’s gross expenses. The investor experience is represented by the SEC 30-Day Subsidized Yield.
Prudential Investment Portfolios 2 | 5 |
PGIM Core Short-Term Bond Fund
Your Fund’s Performance (continued)
| Credit Quality expressed as a percentage of total investments as of 1/31/22 (%) | ||||
| AAA | 20.2 | |||
| AA | 12.7 | |||
| A | 35.8 | |||
| BBB | 9.6 | |||
| BB | 0.1 | |||
| B | 0.1 | |||
| CCC | 0.2 | |||
| Not Rated | 21.3 | |||
Total | 100.0 | |||
Credit ratings reflect the highest rating assigned by a nationally recognized statistical rating organization (NRSRO) such as Moody’s Investors Service, Inc. (Moody’s), S&P Global Ratings (S&P), or Fitch, Inc. (Fitch). Credit ratings reflect the common nomenclature used by both S&P and Fitch. Where applicable, ratings are converted to the comparable S&P/Fitch rating tier nomenclature. These rating agencies are independent and are widely used. The Not Rated category consists of securities that have not been rated by an NRSRO. Credit ratings are subject to change.
| 6 | Visit our website at pgim.com/investments |
PGIM Core Ultra Short Bond Fund
Your Fund’s Performance (unaudited)
Performance data quoted represent past performance. Past performance does not guarantee future results. The investment return and principal value of an investment will fluctuate so that an investor’s shares, when redeemed, may be worth more or less than their original cost. Current performance may be lower or higher than the past performance data quoted.
| Average Annual Total Returns as of 1/31/22 | ||||||
| One Year (%) | Five Years (%) | Ten Years (%) | ||||
| Fund | 0.13 | 1.30 | 0.78 | |||
| ICE US 1-Month Treasury Bill Index * | ||||||
| 0.04 | 1.02 | 0.55 | ||||
| ICE BofA US Dollar 1-Month Deposit Offered Rate Constant Maturity Index | ||||||
| 0.10 | 1.22 | 0.74 | ||||
| Bloomberg 1-3 Month US Treasury Bill | ||||||
| 0.03 | 1.08 | 0.58 | ||||
| iMoneyNet Prime Institutional Funds Average | ||||||
| 0.01 | 1.04 | 0.56 | ||||
* The ICE US 1-Month Treasury Bill Index was adopted as the Fund’s primary benchmark in March 2022 due to the pending discontinuation of LIBOR.
The returns in the tables do not reflect the deduction of taxes that a shareholder would pay on Fund distributions or following the redemption of Fund shares.
Prudential Investment Portfolios 2 | 7 |
PGIM Core Ultra Short Bond Fund
Your Fund’s Performance (continued)
Growth of a $10,000 Investment
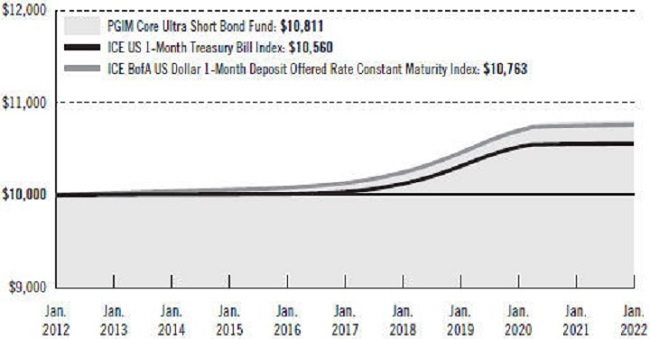
The graph compares a $10,000 investment in the Fund with a similar investment in the ICE US 1-Month Treasury Bill Index and the ICE BofA US Dollar 1-Month Deposit Offered Rate Constant Maturity Index as its current Index by portraying the initial account values at the beginning of the 10-year period (January 31, 2012) and the account values at the end of the current fiscal year (January 31, 2022), as measured on a quarterly basis. For purposes of the graph, and unless otherwise indicated, it has been assumed that (a) all recurring fees (including management fees) were deducted and (b) all dividends and distributions were reinvested. Without waiver of fees and/or expense reimbursements, if any, the returns would have been lower.
Past performance does not predict future performance. Total returns and the ending account values in the graph include changes in share price and reinvestment of dividends and capital gains distributions in a hypothetical investment for the periods shown. The Fund’s total returns do not reflect the deduction of income taxes on an individual’s investment. Taxes may reduce your actual investment returns on income or gains paid by the Fund or any gains you may realize if you sell your shares.
Benchmark Definitions
ICE US 1-Month Treasury Bill Index— an unmanaged index that is comprised of a single issue purchased at the beginning of the month and held for a full month. At the end of the month that issue is sold and rolled into a newly selected issue. The issue selected at each month-end rebalancing is the outstanding
| 8 | Visit our website at pgim.com/investments |
Treasury Bill that matures closest to, but not less than, one month from the rebalancing date. To qualify for selection, an issue must have settled on or before the month-end rebalancing date.
ICE BofA US Dollar 1-Month Deposit Offered Rate Constant Maturity Index—an unmanaged index which tracks the performance of a synthetic asset paying LIBOR to a stated maturity. The 1 Month Current Index is based on the assumed purchase at par of a synthetic instrument having exactly its stated maturity and with a coupon equal to that day’s fixing rate. That issue is assumed to be sold the following business day (priced at a yield equal to the current day fixing rate) and rolled into a new instrument.
Bloomberg 1–3 Month US Treasury Bill Index—The Bloomberg 1–3 Month US Treasury Bill Index includes all publicly issued zero-coupon US Treasury Bills that have a remaining maturity of less than 3 months and more than 1 month, are rated investment grade, and have $250 million or more of outstanding face value.
iMoneyNet Prime Institutional Funds Average—The iMoneyNet Prime Institutional Funds Average is based on the average return of all funds in the iMoneyNet Prime Institutional Funds universe for the periods noted. Funds in the iMoneyNet Prime Institutional Funds Average primarily invest in a variety of taxable short-term corporate and bank debt securities.
| Distributions and Yields as of 1/31/22 | ||||||
| Total Distributions Paid for 12 Months ($) | SEC 30-Day Subsidized Yield* (%) | SEC 30-Day Unsubsidized Yield** (%) | ||||
| PGIM Core Ultra Short Bond Fund | 0.00 | 0.15 | 0.15 | |||
*SEC 30-Day Subsidized Yield (%)—A standardized yield calculation created by the Securities and Exchange Commission, it reflects the income earned during a 30-day period, after the deduction of the Fund’s net expenses (net of any expense waivers or reimbursements). The investor experience is represented by the SEC 30-Day Subsidized Yield.
**SEC 30-Day Unsubsidized Yield (%)—A standardized yield calculation created by the Securities and Exchange Commission, it reflects the income earned during a 30-day period, after the deduction of the Fund’s gross expenses. The investor experience is represented by the SEC 30-Day Subsidized Yield.
| Credit Quality expressed as a percentage of total investments as of 1/31/22 (%) | ||||
| A-1+/P-1 | 71.7 | |||
| A-1/P-1 | 28.3 | |||
Total | 100.0 | |||
Credit ratings reflect the highest rating assigned by a nationally recognized statistical rating organization (NRSRO) such as Moody’s Investors Service, Inc. (Moody’s), S&P Global Ratings (S&P), or Fitch, Inc. (Fitch). Credit ratings reflect the common nomenclature used by both S&P and Fitch. Where applicable, ratings are converted to the comparable S&P/Fitch
Prudential Investment Portfolios 2 | 9 |
PGIM Core Ultra Short Bond Fund
Your Fund’s Performance (continued)
rating tier nomenclature. These rating agencies are independent and are widely used. The Not Rated category consists of securities that have not been rated by an NRSRO. Credit ratings are subject to change.
| 10 | Visit our website at pgim.com/investments |
PGIM Institutional Money Market Fund
Your Fund’s Performance (unaudited)
Performance data quoted represent past performance. Past performance does not guarantee future results. The investment return and principal value of an investment will fluctuate so that an investor’s shares, when redeemed, may be worth more or less than their original cost. Current performance may be lower or higher than the past performance data quoted.
| Average Annual Total Returns as of 1/31/22 | ||||||
| One Year (%) | Five Years (%) | Since Inception (%) | ||||
Fund | 0.06 | 1.24 | 1.18 (07/19/2016) | |||
ICE US 1-Month Treasury Bill Index * | ||||||
| 0.04 | 1.02 | 0.55 | ||||
ICE BofA US Dollar 1-Month Deposit Offered Rate Constant Maturity Index | ||||||
| 0.10 | 1.22 | 0.74 | ||||
iMoneyNet Prime Institutional Funds Average | ||||||
| 0.01 | 1.04 | 5.36 | ||||
* The ICE US 1-Month Treasury Bill Index was adopted as the Fund’s primary benchmark in March 2022 due to the pending discontinuation of LIBOR.
The returns in the tables do not reflect the deduction of taxes that a shareholder would pay on Fund distributions or following the redemption of Fund shares.
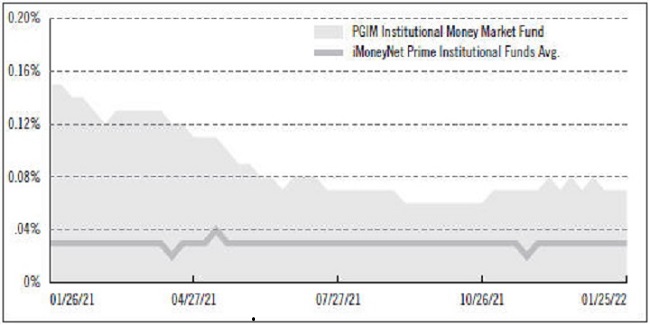
Institutional Money Market Fund Yield Comparison
Prudential Investment Portfolios 2 | 11 |
PGIM Institutional Money Market Fund
Your Fund’s Performance (continued)
Weighted Average Maturity* (WAM) Comparison
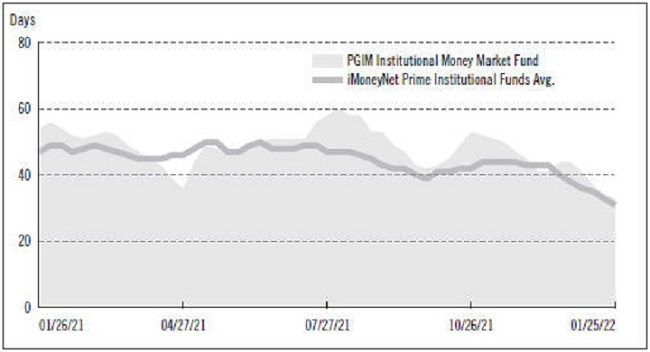
The graphs portray weekly 7-day current yields and weekly WAMs for PGIM Institutional Money Market Fund and the iMoneyNet Prime Institutional Funds Average every Tuesday from January 26, 2021 to January 25, 2022, the closest dates prior to the beginning and end of the Fund’s reporting period. Note: iMoneyNet, Inc. regularly reports a 7-day current yield and WAM on Tuesdays. As a result, the data portrayed for the Fund at the end of the reporting period in the graphs may not match the data portrayed in the Fund’s performance table as of January 31, 2022.
* Weighted Average Maturity is based on the dollar-weighted average length of time until principal payments are expected or until securities reach maturity, taking into account any maturity shortening feature such as a call, refunding, or redemption provision.
Benchmark Definitions
ICE BofA US Dollar 1-Month Deposit Offered Rate Constant Maturity Index—an unmanaged index which tracks the performance of a synthetic asset paying LIBOR to a stated maturity. The 1 Month Current Index is based on the assumed purchase at par of a synthetic instrument having exactly its stated maturity and with a coupon equal to that day’s fixing rate. That issue is assumed to be sold the following business day (priced at a yield equal to the current day fixing rate) and rolled into a new instrument.
ICE US 1-Month Treasury Bill Index—an unmanaged index that is comprised of a single issue purchased at the beginning of the month and held for a full month. At the end of the month that issue is sold and rolled into a newly selected issue. The issue selected at each month-end rebalancing is the outstanding
| 12 | Visit our website at pgim.com/investments |
Treasury Bill that matures closest to, but not less than, one month from the rebalancing date. To qualify for selection, an issue must have settled on or before the month-end rebalancing date.
iMoneyNet Prime Institutional Funds Average—The iMoneyNet Prime Institutional Funds Average is based on the average return of all funds in the iMoneyNet Prime Institutional Funds universe for the periods noted. Funds in the iMoneyNet Prime Institutional Funds Average primarily invest in a variety of taxable short-term corporate and bank debt securities.
Prudential Investment Portfolios 2 | 13 |
PGIM Core Short-Term Bond Fund
Strategy and Performance Overview* (unaudited)
How did the Fund perform?
The PGIM Core Short-Term Bond Fund returned 0.24% in the 12-month reporting period that ended January 31, 2022, outperforming the 0.10% return of the ICE BofA US Dollar 1-Month Deposit Offered Rate Constant Maturity Index (the Index).
What were the market conditions?
| ● | The strong global rebound from the depths of the COVID-19 pandemic continued throughout much of the reporting period, as economies continued to respond to monetary and fiscal stimulus. The rollout of COVID-19 vaccines, along with the potential for further stimulus, shifted the prospects for growth and inflation in the first half of the period, kicking off a robust “reflation trade” in bond markets. This caused the US Treasury yield curve to steepen sharply over the first half of the period before flattening again in the second half of the period, as the market pulled forward its expectation for interest rate hikes. (A yield curve is a line graph that illustrates the relationship between the yields and maturities of fixed income securities. It is created by plotting the yields of different maturities for the same type of bonds.) |
| ● | While the yield on the 2-year Treasury note began rising sharply in the fourth quarter of 2021 as markets began pricing in more interest rate hikes in 2022, long-end Treasury yields declined amid uncertainty around the Omicron variant of COVID-19 and the prospect of slower economic growth. Despite steepening in the beginning of the period, the US Treasury yield curve flattened over the full period, with the 10-year/2-year Treasury spread declining from 0.98% to 0.61% as of January 31, 2022. Meanwhile, the yield on the 3-month Treasury bill rose from 0.06% to 0.23%, while the 3-month LIBOR (London Interbank Offered Rate) rose from 0.20% to 0.31%. In the short-term credit markets, investment-grade credit spreads widened during the period. The Bloomberg 1-3 Year Credit Index, a proxy for the short-term spread market, outperformed similar short-duration Treasuries by 0.11% during the period. (Duration is a measure of a bond’s price sensitivity to interest rate changes over time.) |
What strategies or holdings affected the Fund’s performance?
The Fund emphasizes spread assets, including short-term investment-grade corporates, commercial mortgage-backed securities, and asset-backed securities such as non-agency residential mortgages and credit card receivables. This positioning helped the Fund outperform its benchmark during the period.
Did the Fund use derivatives?
During the period, the Fund used swap agreements for hedging interest rate risk and to add value versus cash securities. The use of these derivatives had a positive impact on performance of the Fund for the period.
| 14 | Visit our website at pgim.com/investments |
Current outlook
PGIM Fixed Income continues to find value within investment-grade corporates and structured products, which represent attractive value in relation to Treasuries and agency mortgage-backed securities. PGIM Fixed Income adopted a more defensive posture versus all front-end spread markets over the last half of the period, with caution growing toward the end of the period as it believed spreads were too tight in light of the anticipated higher-rate environment.
* This strategy and performance overview, which discusses what strategies or holdings (including derivatives, if applicable) affected the Fund’s performance, is compiled based on how the Fund performed relative to the Fund’s assigned index and is viewed for performance attribution purposes at the aggregate Fund level, which in most instances will not directly correlate to the amounts disclosed in the Statement of Operations which conform to U.S. generally accepted accounting principles.
Prudential Investment Portfolios 2 | 15 |
PGIM Core Ultra Short Bond Fund
Strategy and Performance Overview*
How did the Fund perform?
The PGIM Core Ultra Short Bond Fund returned 0.13% in the 12-month reporting period that ended January 31, 2022, outperforming the 0.10% return of the ICE BofA US Dollar 1-Month Deposit Offered Rate Constant Maturity Index (the Index).
What were the market conditions?
| ● | The strong global rebound from the depths of the COVID-19 pandemic continued throughout much of the reporting period, as economies continued to respond to monetary and fiscal stimulus. The rollout of COVID-19 vaccines, along with the potential for further stimulus, shifted the prospects for growth and inflation in the first half of the period, kicking off a robust “reflation trade” in bond markets. This caused the US Treasury yield curve to steepen sharply over the first half of the period before flattening again in the second half of the period, as the market pulled forward its expectation for interest rate hikes. (A yield curve is a line graph that illustrates the relationship between the yields and maturities of fixed income securities. It is created by plotting the yields of different maturities for the same type of bonds.) |
| ● | While the yield on the 2-year Treasury note began rising sharply in the fourth quarter of 2021 as markets began pricing in more interest rate hikes in 2022, long-end Treasury yields declined amid uncertainty around the Omicron variant of COVID-19 and the prospect of slower economic growth. Despite steepening in the beginning of the period, the US Treasury yield curve flattened over the full period, with the 10-year/2-year Treasury spread declining from 0.98% to 0.61% as of January 31, 2022. Meanwhile, the yield on the 3-month Treasury bill rose from 0.06% to 0.23%, while the 3-month LIBOR (London Interbank Offered Rate) rose from 0.20% to 0.31%. In the short-term credit markets, investment-grade credit spreads widened during the period. The Bloomberg 1-3 Year Credit Index, a proxy for the short-term spread market, outperformed similar short-duration Treasuries by 0.11% during the period. (Duration is a measure of a bond’s price sensitivity to interest rate changes over time.) |
What strategies or holdings affected the Fund’s performance?
| ● | The Fund’s weighted average maturity (WAM) remained shorter than peers or near neutral for the entirety of the period. The Fund’s weighted average life (WAL) remained extended through floating rate securities through the first quarter of 2021, shortened toward the middle of the period, and then remained extended for the entirety of the fourth quarter of 2021. |
| ● | At different times throughout the period, the Fund’s managers also tactically adjusted the portfolio to take advantage of wider floating rate spreads and moderated those positions in the LIBOR floaters accordingly as spreads tightened. This allocation consisted primarily of foreign bank positions, as the floating rate paper is attractive for the Fund’s mandate. The issuance of LIBOR based floating rate securities declined substantially over the period leading to less ownership of LIBOR based Floating Rate |
| 16 | Visit our website at pgim.com/investments |
Securities and the addition of Federal Funds (Fed Funds) and Secured Overnight Financing Rate (SOFR) to replace the LIBOR based securities. Additionally, the Fund’s position in agency discount notes versus corporates, repurchase agreements, and Treasuries shifted tactically based on relative value between the sectors throughout the period. |
| ● | The Fund’s managers became more defensive toward the end of the period, increasing cash in anticipation of higher interest rates and the potential for widening spreads. |
Current outlook
The Fund continues to emphasize well-researched, short-term credit sectors as PGIM Fixed Income expects these assets to offer the most value from a total return perspective. As relative value between floating rate and fixed rate assets fluctuates, PGIM Fixed Income will seek to rotate into more attractively priced holdings.
* This strategy and performance overview, which discusses what strategies or holdings (including derivatives, if applicable) affected the Fund’s performance, is compiled based on how the Fund performed relative to the Fund’s assigned index and is viewed for performance attribution purposes at the aggregate Fund level, which in most instances will not directly correlate to the amounts disclosed in the Statement of Operations which conform to U.S. generally accepted accounting principles.
Prudential Investment Portfolios 2 | 17 |
PGIM Institutional Money Market Fund
Strategy and Performance Overview*
How did the Fund perform?
The PGIM Institutional Money Market Fund returned 0.06% in the 12-month reporting period that ended January 31, 2022.
What were the market conditions?
| ● | The strong global rebound from the depths of the COVID-19 pandemic continued throughout much of the reporting period, as economies continued to respond to monetary and fiscal stimulus. The rollout of COVID-19 vaccines, along with the potential for further stimulus, shifted the prospects for growth and inflation in the first half of the period, kicking off a robust “reflation trade” in bond markets. This caused the US Treasury yield curve to steepen sharply over the first half of the period before flattening again in the second half of the period, as the market pulled forward its expectation for interest rate hikes. (A yield curve is a line graph that illustrates the relationship between the yields and maturities of fixed income securities. It is created by plotting the yields of different maturities for the same type of bonds.) |
| ● | While the yield on the 2-year Treasury note began rising sharply in the fourth quarter of 2021 as markets began pricing in more interest rate hikes in 2022, long-end Treasury yields declined amid uncertainty around the Omicron variant of COVID-19 and the prospect of slower economic growth. Despite steepening in the beginning of the period, the US Treasury yield curve flattened over the full period, with the 10-year/2-year Treasury spread declining from 0.98% to 0.61% as of January 31, 2022. Meanwhile, the yield on the 3-month Treasury bill rose from 0.06% to 0.23%, while the 3-month LIBOR (London Interbank Offered Rate) rose from 0.20% to 0.31%. In the short-term credit markets, investment-grade credit spreads widened during the period. The Bloomberg 1-3 Year Credit Index, a proxy for the short-term spread market, outperformed similar short-duration Treasuries by 0.11% during the period. (Duration is a measure of a bond’s price sensitivity to interest rate changes over time.) |
What strategies or holdings affected the Fund’s performance?
| ● | The Fund’s weighted average maturity (WAM) remained longer than that of peers for most of the first quarter of 2021, shortening to near neutral into quarter end, and it remained shorter than that of peers for most of the second quarter of 2021. The Fund’s WAM extended to a near-neutral position into the end of the second quarter and then remained longer than that of peers for the majority of the third and fourth quarters. The Fund’s weighted average life (WAL) remained extended through floating-rate securities throughout the period in light of anticipated short-term (overnight) rates hovering around zero for the foreseeable future. |
| ● | At different times throughout the period, the Fund’s managers also tactically adjusted the Fund to take advantage of wider floating-rate spreads and moderated those positions in the LIBOR floaters accordingly as spreads tightened. This allocation consisted primarily of foreign bank positions, as the floating-rate paper is attractive for |
| 18 | Visit our website at pgim.com/investments |
the Fund’s mandate. The issuance of LIBOR based floating rate securities declined substantially over the period leading to less ownership of LIBOR based Floating Rate Securities and the addition of Federal Funds (Fed Funds) and Secured Overnight Financing Rate (SOFR) to replace the LIBOR based securities. Additionally, the Fund’s position in agency discount notes versus corporates, repurchase agreements, and Treasuries shifted tactically based on relative value between the sectors throughout the period. |
| ● | The Fund’s managers became more defensive toward the end of the period, increasing cash in anticipation of higher interest rates and the potential for widening spreads. |
Current outlook
PGIM Fixed Income continues to emphasize well-researched, short-term credit sectors and expects these assets to offer the most value from a total return perspective. As relative value between floating rate and fixed rate assets fluctuates, PGIM Fixed Income will seek to rotate into more attractively priced holdings.
* This strategy and performance overview, which discusses what strategies or holdings (including derivatives, if applicable) affected the Fund’s performance, is compiled based on how the Fund performed relative to the Fund’s assigned index and is viewed for performance attribution purposes at the aggregate Fund level, which in most instances will not directly correlate to the amounts disclosed in the Statement of Operations which conform to U.S. generally accepted accounting principles.
Prudential Investment Portfolios 2 | 19 |
As a shareholder of the Fund, you incur two types of costs: (1) transaction costs, including sales charges (loads) on purchase payments and redemptions, as applicable, and (2) ongoing costs, including management fees, distribution and/or service (12b-1) fees, and other Fund expenses, as applicable. This example is intended to help you understand your ongoing costs (in dollars) of investing in the Fund and to compare these costs with the ongoing costs of investing in other mutual funds.
The example is based on an investment of $1,000 held through the six-month period ended January 31, 2022. The example is for illustrative purposes only; you should consult the Prospectus for information on initial and subsequent minimum investment requirements.
Actual Expenses
The first line in the table on the following page provides information about actual account values and actual expenses. You may use the information on this line, together with the amount you invested, to estimate the expenses that you paid over the period. Simply divide your account value by $1,000 (for example, an $8,600 account value ÷ $1,000 = 8.6), then multiply the result by the number on the first line under the heading “Expenses Paid During the Six-Month Period” to estimate the expenses you paid on your account during this period.
Hypothetical Example for Comparison Purposes
The second line in the table on the following page provides information about hypothetical account values and hypothetical expenses based on the Fund’s actual expense ratio and an assumed rate of return of 5% per year before expenses, which is not the Fund’s actual return. The hypothetical account values and expenses may not be used to estimate the actual ending account balance or expenses you paid for the period. You may use this information to compare the ongoing costs of investing in the Fund and other funds. To do so, compare this 5% hypothetical example with the 5% hypothetical examples that appear in the shareholder reports of the other funds.
Please note that the expenses shown in the table are meant to highlight your ongoing costs only and do not reflect any transactional costs such as sales charges (loads). Therefore, the second line in the table is useful in comparing ongoing costs only and will not help you determine the relative total costs of owning different funds. In addition, if these transactional costs were included, your costs would have been higher.
PGIM Core Short-Term Bond Fund | Beginning Account Value August 1, 2021 | Ending Account Value January 31, 2022 | Annualized Expense Ratio Based on the Six-Month Period | Expenses Paid During the Six-Month Period* | ||||
Actual | $1,000.00 | $ 998.60 | 0.04% | $0.20 | ||||
Hypothetical | $1,000.00 | $1,025.00 | 0.04% | $0.20 | ||||
| 20 | Visit our website at pgim.com/investments |
PGIM Core Ultra Short Bond Fund | Beginning Account Value August 1, 2021 | Ending Account Value January 31, 2022 | Annualized Expense Ratio Based on the Six-Month Period | Expenses Paid During the Six-Month Period* | ||||
Actual | $1,000.00 | $1,000.60 | 0.00%** | $0.02 | ||||
Hypothetical | $1,000.00 | $1,025.18 | 0.00%** | $0.02 | ||||
PGIM Institutional Money Market Fund | Beginning Account Value August 1, 2021 | Ending Account Value January 31, 2022 | Annualized Expense Ratio Based on the Six-Month Period | Expenses Paid During the Six-Month Period* | ||||
Actual | $1,000.00 | $1,000.20 | 0.07% | $0.35 | ||||
Hypothetical | $1,000.00 | $1,024.85 | 0.07% | $0.36 | ||||
*Fund expenses (net of fee waivers or subsidies, if any) are equal to the annualized expense ratio (provided in the table), multiplied by the average account value over the period, multiplied by the 184 days in the six-month period ended January 31, 2022, and divided by the 365 days in the Fund’s fiscal year ended January 31, 2022 (to reflect the six-month period). Expenses presented in the table include the expenses of any underlying portfolios in which each Fund may invest.
**Less than 0.005%
Prudential Investment Portfolios 2 | 21 |
Glossary
The following abbreviations are used in the Funds’ descriptions:
USD—US Dollar
144A—Security was purchased pursuant to Rule 144A under the Securities Act of 1933 and, pursuant to the requirements of Rule 144A, may not be resold except to qualified institutional buyers.
A—Annual payment frequency for swaps
ABS—Asset-Backed Security
ADBB—Asian Development Bank Bonds
BSBY—Bloomberg Short-Term Bank Yield Index
EMTN—Euro Medium Term Note
FFCSB—Federal Farm Credit System Bank
FHLB—Federal Home Loan Bank
FHLMC—Federal Home Loan Mortgage Corporation
FNMA—Federal National Mortgage Association
GMTN—Global Medium Term Note
GNMA—Government National Mortgage Association
LIBOR—London Interbank Offered Rate
MASTR—Morgan Stanley Structured Asset Security
MTN—Medium Term Note
OTC—Over-the-counter
Q—Quarterly payment frequency for swaps
REITs—Real Estate Investment Trust
S—Semiannual payment frequency for swaps
SOFR—Secured Overnight Financing Rate
TVA—Tennessee Valley Authority
USOIS—United States Overnight Index Swap
| 23 |
PGIM Core Short-Term Bond Fund
as of January 31, 2022
| Description | Interest Rate | Maturity Date | Principal Amount (000)# | Value | ||||||||||
LONG-TERM INVESTMENTS 81.5% | ||||||||||||||
ASSET-BACKED SECURITIES 5.5% | ||||||||||||||
Automobiles 2.0% | ||||||||||||||
Ally Auto Receivables Trust, | ||||||||||||||
Series 2019-02, Class A3 | 2.230% | 01/16/24 | 1,211 | $ | 1,217,710 | |||||||||
CarMax Auto Owner Trust, | ||||||||||||||
Series 2018-03, Class A3 | 3.130 | 06/15/23 | 521 | 521,615 | ||||||||||
Series 2018-04, Class A3 | 3.360 | 09/15/23 | 1,873 | 1,884,264 | ||||||||||
Series 2019-02, Class A3 | 2.680 | 03/15/24 | 1,395 | 1,405,542 | ||||||||||
Series 2020-04, Class A3 | 0.500 | 08/15/25 | 2,400 | 2,385,063 | ||||||||||
Fifth Third Auto Trust, | ||||||||||||||
Series 2019-01, Class A3 | 2.640 | 12/15/23 | 608 | 610,758 | ||||||||||
Ford Credit Auto Owner Trust, | ||||||||||||||
Series 2017-01, Class A, 144A | 2.620 | 08/15/28 | 4,600 | 4,603,373 | ||||||||||
Ford Credit Floorplan Master Owner Trust, | ||||||||||||||
Series 2019-01, Class A | 2.840 | 03/15/24 | 8,400 | 8,424,808 | ||||||||||
Series 2019-03, Class A1 | 2.230 | 09/15/24 | 3,800 | 3,835,085 | ||||||||||
GM Financial Consumer Automobile Receivables Trust, | ||||||||||||||
Series 2018-03, Class A3 | 3.020 | 05/16/23 | 153 | 152,705 | ||||||||||
Series 2018-04, Class A3 | 3.210 | 10/16/23 | 757 | 760,830 | ||||||||||
GMF Floorplan Owner Revolving Trust, | ||||||||||||||
Series 2019-01, Class A, 144A | 2.700 | 04/15/24 | 10,500 | 10,548,289 | ||||||||||
Honda Auto Receivables Owner Trust, | ||||||||||||||
Series 2019-02, Class A3 | 2.520 | 06/21/23 | 621 | 624,552 | ||||||||||
Hyundai Auto Lease Securitization Trust, | ||||||||||||||
Series 2020-B, Class A2, 144A | 0.360 | 01/17/23 | 439 | 438,552 | ||||||||||
Nissan Auto Receivables Owner Trust, | ||||||||||||||
Series 2018-B, Class A3 | 3.060 | 03/15/23 | 197 | 197,323 | ||||||||||
Santander Retail Auto Lease Trust, | ||||||||||||||
Series 2020-B, Class A2, 144A | 0.420 | 11/20/23 | 5,312 | 5,305,416 | ||||||||||
Toyota Auto Receivables Owner Trust, | ||||||||||||||
Series 2018-C, Class A3 | 3.020 | 12/15/22 | 26 | 25,622 | ||||||||||
World Omni Auto Receivables Trust, | ||||||||||||||
Series 2018-C, Class A3 | 3.130 | 11/15/23 | 1,088 | 1,092,231 | ||||||||||
Series 2018-D, Class A3 | 3.330 | 04/15/24 | 1,992 | 2,007,553 | ||||||||||
Series 2019-A, Class A3 | 3.040 | 05/15/24 | 502 | 505,666 | ||||||||||
|
| |||||||||||||
| 46,546,957 | ||||||||||||||
Credit Cards 2.3% | ||||||||||||||
American Express Credit Account Master Trust, | ||||||||||||||
Series 2019-01, Class A | 2.870 | 10/15/24 | 15,000 | 15,044,626 | ||||||||||
Series 2019-02, Class A | 2.670 | 11/15/24 | 6,900 | 6,933,755 | ||||||||||
See Notes to Financial Statements.
24
PGIM Core Short-Term Bond Fund
Schedule of Investments (continued)
as of January 31, 2022
| Description | Interest Rate | Maturity Date | Principal Amount (000)# | Value | ||||||||||
ASSET-BACKED SECURITIES (Continued) | ||||||||||||||
Credit Cards (cont’d.) | ||||||||||||||
American Express Credit Account Master Trust, (cont’d.) | ||||||||||||||
Series 2019-03, Class A | 2.000% | 04/15/25 | 14,800 | $ | 14,921,992 | |||||||||
BA Credit Card Trust, | ||||||||||||||
Series 2019-A01, Class A1 | 1.740 | 01/15/25 | 16,600 | 16,702,661 | ||||||||||
|
| |||||||||||||
| 53,603,034 | ||||||||||||||
Home Equity Loans 0.9% | ||||||||||||||
Accredited Mortgage Loan Trust, | ||||||||||||||
Series 2004-04, Class A2D, 1 Month LIBOR + | 0.808(c) | 01/25/35 | 827 | 819,933 | ||||||||||
Ameriquest Mortgage Securities, Inc., Asset-Backed Pass-Through Certificates, | ||||||||||||||
Series 2003-11, Class AV2, 1 Month LIBOR + 0.740% | 0.848(c) | 12/25/33 | 180 | 178,647 | ||||||||||
Argent Securities, Inc., Asset-Backed Pass-Through Certificates, | ||||||||||||||
Series 2003-W03, Class M2, 1 Month LIBOR + | 2.802(c) | 09/25/33 | 5,093 | 5,140,885 | ||||||||||
Asset-Backed Funding Certificate Trust, | ||||||||||||||
Series 2003-AHL01, Class A1 | 4.184 | 03/25/33 | 169 | 169,708 | ||||||||||
Series 2003-OPT01, Class A3, 1 Month LIBOR + | 0.788(c) | 04/25/33 | 586 | 570,238 | ||||||||||
Series 2004-HE01, Class M1, 1 Month LIBOR + | 1.008(c) | 03/25/34 | 369 | 366,345 | ||||||||||
Asset-Backed Securities Corp. Home Equity Loan Trust, | ||||||||||||||
Series 2003-HE06, Class A2, 1 Month LIBOR + | 0.788(c) | 11/25/33 | 180 | 178,507 | ||||||||||
Bear Stearns Asset-Backed Securities Trust, | ||||||||||||||
Series 2003-03, Class M1, 1 Month LIBOR + 1.230% | 1.338(c) | 06/25/43 | 220 | 223,463 | ||||||||||
CDC Mortgage Capital Trust, | ||||||||||||||
Series 2003-HE03, Class M1, 1 Month LIBOR + | 1.158(c) | 11/25/33 | 954 | 946,912 | ||||||||||
Equifirst Mortgage Loan Trust, | ||||||||||||||
Series 2003-01, Class M2, 1 Month LIBOR + 2.850% | 2.958(c) | 12/25/32 | 23 | 22,848 | ||||||||||
Home Equity Asset Trust, | ||||||||||||||
Series 2002-03, Class M1, 1 Month LIBOR + 1.350% | 1.458(c) | 02/25/33 | 294 | 295,905 | ||||||||||
See Notes to Financial Statements.
Prudential Investment Portfolios 2/PGIM Core Short-Term Bond Fund 25
PGIM Core Short-Term Bond Fund
Schedule of Investments (continued)
as of January 31, 2022
| Description | Interest Rate | Maturity Date | Principal Amount (000)# | Value | ||||||||||
ASSET-BACKED SECURITIES (Continued) | ||||||||||||||
Home Equity Loans (cont’d.) | ||||||||||||||
Home Equity Asset Trust, (cont’d.) | ||||||||||||||
Series 2003-02, Class M1, 1 Month LIBOR + 1.320% | 1.428%(c) | 08/25/33 | 633 | $ | 636,695 | |||||||||
Series 2003-03, Class M1, 1 Month LIBOR + 1.290% | 1.398(c) | 08/25/33 | 549 | 549,856 | ||||||||||
Series 2003-08, Class M1, 1 Month LIBOR + 1.080% | 1.188(c) | 04/25/34 | 223 | 223,244 | ||||||||||
MASTR Asset-Backed Securities Trust, | ||||||||||||||
Series 2004-OPT02, Class A2, 1 Month LIBOR + | 0.808(c) | 09/25/34 | 130 | 125,569 | ||||||||||
Merrill Lynch Mortgage Investors Trust, | ||||||||||||||
Series 2004-HE02, Class A1A, 1 Month LIBOR + | 0.908(c) | 08/25/35 | 45 | 44,356 | ||||||||||
Series 2004-HE02, Class M1, 1 Month LIBOR + | 1.308(c) | 08/25/35 | 171 | 169,723 | ||||||||||
Morgan Stanley ABS Capital I, Inc. Trust, | ||||||||||||||
Series 2003-NC05, Class M1, 1 Month LIBOR + | 1.383(c) | 04/25/33 | 633 | 632,993 | ||||||||||
Series 2003-NC05, Class M3, 1 Month LIBOR + | 3.558(c) | 04/25/33 | 82 | 83,101 | ||||||||||
Series 2003-NC08, Class M1, 1 Month LIBOR + | 1.158(c) | 09/25/33 | 621 | 621,073 | ||||||||||
Series 2003-NC08, Class M2, 1 Month LIBOR + | 2.733(c) | 09/25/33 | 4 | 4,474 | ||||||||||
Series 2003-NC10, Class M1, 1 Month LIBOR + | 1.128(c) | 10/25/33 | 107 | 107,074 | ||||||||||
Series 2004-HE07, Class M1, 1 Month LIBOR + | 1.008(c) | 08/25/34 | 2,202 | 2,189,750 | ||||||||||
New Century Home Equity Loan Trust, | ||||||||||||||
Series 2004-01, Class M1, 1 Month LIBOR + 0.885% | 0.993(c) | 05/25/34 | 2,433 | 2,422,135 | ||||||||||
Renaissance Home Equity Loan Trust, | ||||||||||||||
Series 2003-01, Class A, 1 Month LIBOR + 0.860% | 0.968(c) | 06/25/33 | 238 | 229,720 | ||||||||||
See Notes to Financial Statements.
26
PGIM Core Short-Term Bond Fund
Schedule of Investments (continued)
as of January 31, 2022
| Description | Interest Rate | Maturity Date | Principal Amount (000)# | Value | ||||||||||
ASSET-BACKED SECURITIES (Continued) | ||||||||||||||
Home Equity Loans (cont’d.) | ||||||||||||||
Residential Asset Securities Trust, | ||||||||||||||
Series 2004-KS05, Class AI5 | 4.513%(cc) | 06/25/34 | 3,160 | $ | 3,207,330 | |||||||||
Saxon Asset Securities Trust, | ||||||||||||||
Series 2003-03, Class M2, 1 Month LIBOR + 2.400% | 2.508(c) | 12/25/33 | 26 | 26,173 | ||||||||||
|
| |||||||||||||
| 20,186,657 | ||||||||||||||
Residential Mortgage-Backed Securities 0.3% | ||||||||||||||
Ameriquest Mortgage Securities, Inc., Asset-Backed Pass-Through Certificates, | ||||||||||||||
Series 2004-R05, Class M1, 1 Month LIBOR + | 0.978(c) | 07/25/34 | 235 | 235,623 | ||||||||||
Amortizing Residential Collateral Trust, | ||||||||||||||
Series 2002-BC05, Class M2, 1 Month LIBOR + | 1.908(c) | 07/25/32 | 70 | 70,388 | ||||||||||
Chase Funding Trust, | ||||||||||||||
Series 2002-02, Class 2A1, 1 Month LIBOR + 0.500% | 0.608(c) | 05/25/32 | 264 | 262,284 | ||||||||||
Series 2003-01, Class 2A2, 1 Month LIBOR + 0.660% | 0.768(c) | 11/25/32 | 187 | 185,818 | ||||||||||
Countrywide Asset-Backed Certificates, | ||||||||||||||
Series 2003-BC04, Class M1, 1 Month LIBOR + | 1.158(c) | 07/25/33 | 107 | 107,093 | ||||||||||
Series 2004-01, Class M1, 1 Month LIBOR + 0.750% | 0.858(c) | 03/25/34 | 77 | 77,185 | ||||||||||
Equity One Mortgage Pass-Through Trust, | ||||||||||||||
Series 2003-01, Class M1 | 4.860(cc) | 08/25/33 | 37 | 36,855 | ||||||||||
First Franklin Mortgage Loan Trust, | ||||||||||||||
Series 2004-FF05, Class A1, 1 Month LIBOR + | 0.828(c) | 08/25/34 | 138 | 137,430 | ||||||||||
HSI Asset Securitization Corp. Trust, | ||||||||||||||
Series 2006-OPT04, Class 2A4, 1 Month LIBOR + | 0.608(c) | 03/25/36 | 127 | 126,852 | ||||||||||
Long Beach Mortgage Loan Trust, | ||||||||||||||
Series 2003-03, Class M1, 1 Month LIBOR + 1.125% | 1.233(c) | 07/25/33 | 610 | 610,018 | ||||||||||
Series 2003-04, Class M1, 1 Month LIBOR + 1.020% | 1.128(c) | 08/25/33 | 216 | 215,209 | ||||||||||
See Notes to Financial Statements.
Prudential Investment Portfolios 2/PGIM Core Short-Term Bond Fund 27
PGIM Core Short-Term Bond Fund
Schedule of Investments (continued)
as of January 31, 2022
| Description | Interest Rate | Maturity Date | Principal Amount (000)# | Value | ||||||||||
ASSET-BACKED SECURITIES (Continued) | ||||||||||||||
Residential Mortgage-Backed Securities (cont’d.) | ||||||||||||||
Long Beach Mortgage Loan Trust, (cont’d.) | ||||||||||||||
Series 2004-02, Class M1, 1 Month LIBOR + 0.795% | 0.903%(c) | 06/25/34 | 1,571 | $ | 1,555,858 | |||||||||
Series 2004-03, Class M1, 1 Month LIBOR + 0.855% | 0.963(c) | 07/25/34 | 2,151 | 2,138,176 | ||||||||||
Merrill Lynch Mortgage Investors Trust, | ||||||||||||||
Series 2003-WMC02, Class M2, 1 Month LIBOR + 2.850% | 2.958(c) | 02/25/34 | 146 | 148,721 | ||||||||||
Series 2004-WMC01, Class M2, 1 Month LIBOR + 1.650% | 1.758(c) | 10/25/34 | 538 | 537,569 | ||||||||||
Morgan Stanley ABS Capital I, Inc. Trust, | ||||||||||||||
Series 2004-NC05, Class M1, 1 Month LIBOR + | 1.008(c) | 05/25/34 | 366 | 359,108 | ||||||||||
Structured Asset Investment Loan Trust, | ||||||||||||||
Series 2003-BC01, Class A2, 1 Month LIBOR + | 0.788(c) | 01/25/33 | 80 | 79,567 | ||||||||||
|
| |||||||||||||
| 6,883,754 | ||||||||||||||
|
| |||||||||||||
TOTAL ASSET-BACKED SECURITIES | 127,220,402 | |||||||||||||
|
| |||||||||||||
CERTIFICATES OF DEPOSIT 3.1% | ||||||||||||||
Lloyds Bank Corporate Markets PLC (United Kingdom), | 0.580(c) | 01/31/24 | 17,000 | 17,047,195 | ||||||||||
Nordea Bank Abp (Finland), 3 Month LIBOR + 0.200% | 0.356(c) | 02/14/22 | 20,000 | 19,997,131 | ||||||||||
Standard Chartered Bank (United Kingdom), SOFR + | 0.040(c) | 07/28/23 | 16,000 | 15,997,628 | ||||||||||
Svenska Handelsbanken (Sweden), 3 Month LIBOR + | 0.360(c) | 02/18/22 | 20,000 | 19,994,475 | ||||||||||
|
| |||||||||||||
TOTAL CERTIFICATES OF DEPOSIT | 73,036,429 | |||||||||||||
|
| |||||||||||||
COMMERCIAL MORTGAGE-BACKED SECURITIES 14.1% | ||||||||||||||
Barclays Commercial Mortgage Securities Trust, | ||||||||||||||
Series 2018-TALL, Class A, 144A, 1 Month LIBOR + | 0.828(c) | 03/15/37 | 22,479 | 22,254,401 | ||||||||||
Benchmark Mortgage Trust, | ||||||||||||||
Series 2018-B03, Class A2 | 3.848 | 04/10/51 | 1,587 | 1,614,415 | ||||||||||
Series 2018-B05, Class A2 | 4.077 | 07/15/51 | 1,800 | 1,845,867 | ||||||||||
See Notes to Financial Statements.
28
PGIM Core Short-Term Bond Fund
Schedule of Investments (continued)
as of January 31, 2022
| Description | Interest Rate | Maturity Date | Principal Amount (000)# | Value | ||||||||||
COMMERCIAL MORTGAGE-BACKED SECURITIES (Continued) | ||||||||||||||
BX Commercial Mortgage Trust, | ||||||||||||||
Series 2018-BIOA, Class A, 144A, 1 Month LIBOR + | 0.777%(c) | 03/15/37 | 33,876 | $ | 33,876,681 | |||||||||
Series 2020-BXLP, Class A, 144A, 1 Month LIBOR + | 0.906(c) | 12/15/36 | 4,933 | 4,929,872 | ||||||||||
BX Trust, | ||||||||||||||
Series 2018-EXCL, Class A, 144A, 1 Month LIBOR + | 1.194(c) | 09/15/37 | 8,507 | 8,453,888 | ||||||||||
CAMB Commercial Mortgage Trust, | ||||||||||||||
Series 2019-LIFE, Class A, 144A, 1 Month LIBOR + | 1.176(c) | 12/15/37 | 9,500 | 9,499,885 | ||||||||||
Citigroup Commercial Mortgage Trust, | ||||||||||||||
Series 2014-GC25, Class A3 | 3.372 | 10/10/47 | 13,416 | 13,777,726 | ||||||||||
Series 2016-P04, Class A2 | 2.450 | 07/10/49 | 8,843 | 8,864,970 | ||||||||||
Commercial Mortgage Trust, | ||||||||||||||
Series 2014-UBS05, Class A2 | 3.031 | 09/10/47 | 347 | 351,028 | ||||||||||
Series 2018-HCLV, Class A, 144A, 1 Month LIBOR + | 1.106(c) | 09/15/33 | 11,508 | 11,421,723 | ||||||||||
Credit Suisse Mortgage Capital Certificates, | ||||||||||||||
Series 2019-ICE04, Class A, 144A, 1 Month LIBOR + | 1.086(c) | 05/15/36 | 35,000 | 35,011,228 | ||||||||||
CSAIL Commercial Mortgage Trust, | ||||||||||||||
Series 2015-C03, Class A4 | 3.718 | 08/15/48 | 12,000 | 12,569,700 | ||||||||||
GS Mortgage Securities Corp. Trust, | ||||||||||||||
Series 2021-RENT, Class A, 144A, 1 Month LIBOR + | 0.809(c) | 11/21/35 | 5,359 | 5,322,319 | ||||||||||
GS Mortgage Securities Trust, | ||||||||||||||
Series 2018-HART, Class A, 144A, 1 Month LIBOR + | 1.200(c) | 10/15/31 | 11,300 | 11,250,031 | ||||||||||
JPMBB Commercial Mortgage Securities Trust, | ||||||||||||||
Series 2013-C15, Class ASB | 3.659 | 11/15/45 | 432 | 439,914 | ||||||||||
Series 2014-C18, Class A4A2, 144A | 3.794 | 02/15/47 | 6,803 | 6,970,655 | ||||||||||
Series 2014-C24, Class A3 | 3.098 | 11/15/47 | 19,500 | 19,633,850 | ||||||||||
Series 2014-C24, Class A4A2, 144A | 3.373 | 11/15/47 | 25,000 | 25,551,980 | ||||||||||
JPMDB Commercial Mortgage Securities Trust, | ||||||||||||||
Series 2020-COR07, Class A2 | 2.215 | 05/13/53 | 25,000 | 25,043,828 | ||||||||||
JPMorgan Chase Commercial Mortgage Securities Trust, | ||||||||||||||
Series 2018-WPT, Class AFL, 144A, 1 Month LIBOR + | 1.450(c) | 07/05/33 | 19,358 | 19,362,425 | ||||||||||
Series 2019-BKWD, Class A, 144A, 1 Month LIBOR + | 1.106(c) | 09/15/29 | 3,959 | 3,943,700 | ||||||||||
See Notes to Financial Statements.
Prudential Investment Portfolios 2/PGIM Core Short-Term Bond Fund 29
PGIM Core Short-Term Bond Fund
Schedule of Investments (continued)
as of January 31, 2022
| Description | Interest Rate | Maturity Date | Principal Amount (000)# | Value | ||||||||||
COMMERCIAL MORTGAGE-BACKED SECURITIES (Continued) | ||||||||||||||
LSTAR Commercial Mortgage Trust, | ||||||||||||||
Series 2017-05, Class A2, 144A | 2.776% | 03/10/50 | 839 | $ | 838,886 | |||||||||
Morgan Stanley Bank of America Merrill Lynch Trust, | ||||||||||||||
Series 2012-C06, Class A4 | 2.858 | 11/15/45 | 3,211 | 3,223,395 | ||||||||||
Series 2013-C07, Class A3 | 2.655 | 02/15/46 | 3,885 | 3,893,233 | ||||||||||
Morgan Stanley Capital I Trust, | ||||||||||||||
Series 2018-H03, Class A2 | 3.997 | 07/15/51 | 1,294 | 1,327,222 | ||||||||||
One New York Plaza Trust, | ||||||||||||||
Series 2020-01NYP, Class A, 144A, 1 Month LIBOR + | 1.056(c) | 01/15/36 | 11,900 | 11,892,885 | ||||||||||
UBS Commercial Mortgage Trust, | ||||||||||||||
Series 2018-C08, Class A2 | 3.713 | 02/15/51 | 2,400 | 2,437,914 | ||||||||||
UBS-Barclays Commercial Mortgage Trust, | ||||||||||||||
Series 2012-C03, Class A4 | 3.091 | 08/10/49 | 7,345 | 7,379,617 | ||||||||||
Series 2012-C04, Class A3 | 2.533 | 12/10/45 | 11,714 | 11,754,205 | ||||||||||
Series 2012-C04, Class A5 | 2.850 | 12/10/45 | 4,512 | 4,537,256 | ||||||||||
|
| |||||||||||||
TOTAL COMMERCIAL MORTGAGE-BACKED SECURITIES | 329,274,699 | |||||||||||||
|
| |||||||||||||
CORPORATE BONDS 58.8% | ||||||||||||||
Agriculture 0.1% | ||||||||||||||
Cargill, Inc., | ||||||||||||||
Sr. Unsec’d. Notes, 144A | 1.375 | 07/23/23 | 3,000 | 3,005,104 | ||||||||||
Airlines 0.8% | ||||||||||||||
Southwest Airlines Co., | ||||||||||||||
Sr. Unsec’d. Notes | 4.750 | 05/04/23 | 17,500 | 18,175,579 | ||||||||||
Apparel 0.3% | ||||||||||||||
VF Corp., | ||||||||||||||
Sr. Unsec’d. Notes | 2.050 | 04/23/22 | 7,500 | 7,524,484 | ||||||||||
Auto Manufacturers 3.3% | ||||||||||||||
American Honda Finance Corp., | ||||||||||||||
Sr. Unsec’d. Notes, MTN | 0.750 | 08/09/24 | 7,500 | 7,334,306 | ||||||||||
BMW US Capital LLC (Germany), | ||||||||||||||
Gtd. Notes, 144A, SOFR + 0.530% | 0.580(c) | 04/01/24 | 8,500 | 8,543,231 | ||||||||||
Gtd. Notes, 144A | 3.800 | 04/06/23 | 10,000 | 10,293,036 | ||||||||||
Daimler Finance North America LLC (Germany), | ||||||||||||||
Gtd. Notes, 144A | 0.750 | 03/01/24 | 31,500 | 30,917,893 | ||||||||||
See Notes to Financial Statements.
30
PGIM Core Short-Term Bond Fund
Schedule of Investments (continued)
as of January 31, 2022
| Description | Interest Rate | Maturity Date | Principal Amount (000)# | Value | ||||||||||
CORPORATE BONDS (Continued) | ||||||||||||||
Auto Manufacturers (cont’d.) | ||||||||||||||
Toyota Motor Credit Corp., | ||||||||||||||
Sr. Unsec’d. Notes, MTN, SOFR + 0.300% | 0.350%(c) | 06/13/22 | 10,000 | $ | 10,002,156 | |||||||||
Volkswagen Group of America Finance LLC (Germany), | ||||||||||||||
Gtd. Notes, 144A | 2.900 | 05/13/22 | 10,000 | 10,063,654 | ||||||||||
|
| |||||||||||||
| 77,154,276 | ||||||||||||||
Banks 17.1% | ||||||||||||||
Banco Santander SA (Spain), | ||||||||||||||
Sr. Unsec’d. Notes, 3 Month LIBOR + 1.560% | 1.796(c) | 04/11/22 | 12,200 | 12,231,082 | ||||||||||
Sr. Unsec’d. Notes | 3.500 | 04/11/22 | 4,000 | 4,022,140 | ||||||||||
Bank of America Corp., | ||||||||||||||
Sr. Unsec’d. Notes, MTN, 3 Month BSBY + 0.430% | 0.593(c) | 05/28/24 | 33,500 | 33,523,514 | ||||||||||
Bank of New York Mellon Corp. (The), | ||||||||||||||
Sr. Unsec’d. Notes, MTN, 3 Month LIBOR + 1.050% | 1.349(c) | 10/30/23 | 1,927 | 1,939,946 | ||||||||||
Sr. Unsec’d. Notes, MTN | 1.950 | 08/23/22 | 6,700 | 6,749,097 | ||||||||||
Bank of Nova Scotia (The) (Canada), | ||||||||||||||
Sr. Unsec’d. Notes, 3 Month LIBOR + 0.620% | 0.834(c) | 09/19/22 | 1,750 | 1,755,181 | ||||||||||
Sr. Unsec’d. Notes | 1.625 | 05/01/23 | 14,000 | 14,059,064 | ||||||||||
Banque Federative du Credit Mutuel SA (France), | ||||||||||||||
Sr. Unsec’d. Notes, 144A | 0.650 | 02/27/24 | 17,750 | 17,357,906 | ||||||||||
Sr. Unsec’d. Notes, 144A, MTN, 3 Month LIBOR + 0.730% | 0.984(c) | 07/20/22 | 960 | 962,565 | ||||||||||
Barclays Bank PLC (United Kingdom), | ||||||||||||||
Sr. Unsec’d. Notes | 1.700 | 05/12/22 | 26,000 | 26,059,514 | ||||||||||
Canadian Imperial Bank of Commerce (Canada), | ||||||||||||||
Sr. Unsec’d. Notes, SOFR + 0.800% | 0.849(c) | 03/17/23 | 21,000 | 21,105,048 | ||||||||||
Sr. Unsec’d. Notes, 3 Month LIBOR + 0.720% | 0.931(c) | 06/16/22 | 2,260 | 2,265,201 | ||||||||||
Commonwealth Bank of Australia (Australia), | ||||||||||||||
Sr. Unsec’d. Notes, 144A, 3 Month LIBOR + 0.700% | 0.901(c) | 03/10/22 | 5,000 | 5,003,312 | ||||||||||
Sr. Unsec’d. Notes, 144A, MTN, 3 Month LIBOR + 0.680% | 0.894(c) | 09/18/22 | 250 | 250,897 | ||||||||||
Cooperatieve Rabobank UA (Netherlands), | ||||||||||||||
Sr. Unsec’d. Notes, SOFR + 0.300% | 0.350(c) | 01/12/24 | 14,000 | 14,002,432 | ||||||||||
Credit Agricole Corporate & Investment Bank SA (France), | ||||||||||||||
Bank Gtd. Notes, MTN | 0.400 | 01/15/23 | 8,200 | 8,153,345 | ||||||||||
Credit Suisse AG (Switzerland), | ||||||||||||||
Sr. Unsec’d. Notes, SOFR + 0.390% | 0.440(c) | 02/02/24 | 7,500 | 7,497,168 | ||||||||||
Sr. Unsec’d. Notes, SOFR + 0.450% | 0.499(c) | 02/04/22 | 18,000 | 18,000,181 | ||||||||||
See Notes to Financial Statements.
Prudential Investment Portfolios 2/PGIM Core Short-Term Bond Fund 31
PGIM Core Short-Term Bond Fund
Schedule of Investments (continued)
as of January 31, 2022
| Description | Interest Rate | Maturity Date | Principal Amount (000)# | Value | ||||||||||
CORPORATE BONDS (Continued) | ||||||||||||||
Banks (cont’d.) | ||||||||||||||
Fifth Third Bank NA, | ||||||||||||||
Sr. Unsec’d. Notes, MTN | 1.800% | 01/30/23 | 7,000 | $ | 7,053,166 | |||||||||
Goldman Sachs Group, Inc. (The), | ||||||||||||||
Sr. Unsec’d. Notes | 0.627(ff) | 11/17/23 | 20,000 | 19,881,010 | ||||||||||
Huntington National Bank (The), | ||||||||||||||
Sr. Unsec’d. Notes | 1.800 | 02/03/23 | 8,000 | 8,054,747 | ||||||||||
JPMorgan Chase & Co., | ||||||||||||||
Sr. Unsec’d. Notes | 0.768(ff) | 08/09/25 | 25,000 | 24,296,052 | ||||||||||
KeyBank NA, | ||||||||||||||
Sr. Unsec’d. Notes | 1.250 | 03/10/23 | 12,500 | 12,500,601 | ||||||||||
Mitsubishi UFJ Financial Group, Inc. (Japan), | ||||||||||||||
Sr. Unsec’d. Notes | 2.623 | 07/18/22 | 20,000 | 20,171,544 | ||||||||||
Morgan Stanley, | ||||||||||||||
Sr. Unsec’d. Notes, MTN, 3 Month LIBOR + 1.400% | 1.659(c) | 10/24/23 | 11,551 | 11,643,312 | ||||||||||
National Securities Clearing Corp., | ||||||||||||||
Sr. Unsec’d. Notes, 144A | 0.400 | 12/07/23 | 12,750 | 12,522,510 | ||||||||||
Sr. Unsec’d. Notes, 144A | 1.200 | 04/23/23 | 5,000 | 5,007,985 | ||||||||||
PNC Bank NA, | ||||||||||||||
Sr. Unsec’d. Notes, 3 Month LIBOR + 0.325% | 0.495(c) | 02/24/23 | 14,000 | 13,974,485 | ||||||||||
Sr. Unsec’d. Notes, 3 Month LIBOR + 0.500% | 0.768(c) | 07/27/22 | 350 | 350,553 | ||||||||||
Skandinaviska Enskilda Banken AB (Sweden), | ||||||||||||||
Sr. Unsec’d. Notes, 144A | 0.650 | 09/09/24 | 9,750 | 9,494,454 | ||||||||||
Toronto-Dominion Bank (The) (Canada), | ||||||||||||||
Sr. Unsec’d. Notes, MTN, SOFR + 0.350% | 0.399(c) | 09/10/24 | 20,000 | 19,979,459 | ||||||||||
Sr. Unsec’d. Notes, MTN, SOFR + 0.480% | 0.530(c) | 01/27/23 | 2,750 | 2,756,202 | ||||||||||
Truist Bank, | ||||||||||||||
Sr. Unsec’d. Notes, 3 Month LIBOR + 0.590% | 0.748(c) | 05/17/22 | 15,000 | 15,016,524 | ||||||||||
Sr. Unsec’d. Notes, SOFR + 0.730% (Cap N/A, Floor 0.000%) | 0.779(c) | 03/09/23 | 2,750 | 2,762,767 | ||||||||||
UBS AG (Switzerland), | ||||||||||||||
Sr. Unsec’d. Notes, 144A, MTN, SOFR + 0.360% | 0.409(c) | 02/09/24 | 7,500 | 7,486,254 | ||||||||||
Sr. Unsec’d. Notes, 144A, MTN | 0.450 | 02/09/24 | 5,000 | 4,885,099 | ||||||||||
US Bank NA, | ||||||||||||||
Sr. Unsec’d. Notes, 3 Month LIBOR + 0.440% | 0.604(c) | 05/23/22 | 6,300 | 6,304,023 | ||||||||||
Westpac Banking Corp. (Australia), | ||||||||||||||
Sr. Unsec’d. Notes, 3 Month LIBOR + 0.720% | 0.876(c) | 05/15/23 | 175 | 176,301 | ||||||||||
|
| |||||||||||||
| 399,254,641 | ||||||||||||||
See Notes to Financial Statements.
32
PGIM Core Short-Term Bond Fund
Schedule of Investments (continued)
as of January 31, 2022
| Description | Interest Rate | Maturity Date | Principal Amount | Value | ||||||||||||
CORPORATE BONDS (Continued) | ||||||||||||||||
Beverages 1.1% | ||||||||||||||||
Coca-Cola Europacific Partners PLC (United Kingdom), | ||||||||||||||||
Sr. Unsec’d. Notes, 144A | 0.500% | 05/05/23 | 8,000 | $ | 7,901,829 | |||||||||||
Sr. Unsec’d. Notes, 144A | 0.800 | 05/03/24 | 3,000 | 2,931,934 | ||||||||||||
PepsiCo, Inc., | ||||||||||||||||
Sr. Unsec’d. Notes | 0.400 | 10/07/23 | 14,500 | 14,305,311 | ||||||||||||
|
| |||||||||||||||
| 25,139,074 | ||||||||||||||||
Biotechnology 0.2% | ||||||||||||||||
Gilead Sciences, Inc., | ||||||||||||||||
Sr. Unsec’d. Notes | 0.750 | 09/29/23 | 4,500 | 4,447,905 | ||||||||||||
Building Materials 0.2% | ||||||||||||||||
Martin Marietta Materials, Inc., | ||||||||||||||||
Sr. Unsec’d. Notes | 0.650 | 07/15/23 | 3,750 | 3,709,184 | ||||||||||||
Chemicals 0.5% | ||||||||||||||||
Air Liquide Finance SA (France), | ||||||||||||||||
Gtd. Notes, 144A | 2.250 | 09/27/23 | 2,780 | 2,815,543 | ||||||||||||
Nutrien Ltd. (Canada), | ||||||||||||||||
Sr. Unsec’d. Notes | 1.900 | 05/13/23 | 5,000 | 5,029,705 | ||||||||||||
Westlake Chemical Corp., | ||||||||||||||||
Sr. Unsec’d. Notes | 0.875 | 08/15/24 | 4,000 | 3,899,248 | ||||||||||||
|
| |||||||||||||||
| 11,744,496 | ||||||||||||||||
Commercial Services 0.4% | ||||||||||||||||
PayPal Holdings, Inc., | ||||||||||||||||
Sr. Unsec’d. Notes | 1.350 | 06/01/23 | 9,000 | 9,015,868 | ||||||||||||
Computers 0.2% | ||||||||||||||||
Apple, Inc., | ||||||||||||||||
Sr. Unsec’d. Notes | 1.700 | 09/11/22 | 5,000 | 5,035,965 | ||||||||||||
See Notes to Financial Statements.
Prudential Investment Portfolios 2/PGIM Core Short-Term Bond Fund 33
PGIM Core Short-Term Bond Fund
Schedule of Investments (continued)
as of January 31, 2022
| Description | Interest Rate | Maturity Date | Principal Amount (000)# | Value | ||||||||||||
CORPORATE BONDS (Continued) | ||||||||||||||||
Cosmetics/Personal Care 0.7% | ||||||||||||||||
Procter & Gamble Co. (The), | ||||||||||||||||
Sr. Unsec’d. Notes | 2.150% | 08/11/22 | 6,499 | $ | 6,550,547 | |||||||||||
Unilever Capital Corp. (United Kingdom), | ||||||||||||||||
Gtd. Notes | 0.375 | 09/14/23 | 10,000 | 9,851,405 | ||||||||||||
|
| |||||||||||||||
| 16,401,952 | ||||||||||||||||
Diversified Financial Services 2.2% | ||||||||||||||||
AIG Global Funding, | ||||||||||||||||
Sr. Sec’d. Notes, 144A | 0.650 | 06/17/24 | 21,000 | �� | 20,427,721 | |||||||||||
Air Lease Corp., | ||||||||||||||||
Sr. Unsec’d. Notes, MTN, 3 Month LIBOR + 0.350% | 0.553(c) | 12/15/22 | 25,000 | 24,973,137 | ||||||||||||
Capital One Bank USA NA, | ||||||||||||||||
Sub. Notes | 3.375 | 02/15/23 | 6,000 | 6,140,211 | ||||||||||||
|
| |||||||||||||||
| 51,541,069 | ||||||||||||||||
Electric 4.8% | ||||||||||||||||
American Electric Power Co., Inc., | ||||||||||||||||
Sr. Unsec’d. Notes, Series A, 3 Month LIBOR + 0.480% | 0.797(c) | 11/01/23 | 12,000 | 12,002,004 | ||||||||||||
CenterPoint Energy, Inc., | ||||||||||||||||
Sr. Unsec’d. Notes, SOFR + 0.650% | 0.699(c) | 05/13/24 | 13,500 | 13,500,154 | ||||||||||||
DTE Energy Co., | ||||||||||||||||
Sr. Unsec’d. Notes | 2.250 | 11/01/22 | 27,000 | 27,250,866 | ||||||||||||
Entergy Louisiana LLC, | ||||||||||||||||
First Mortgage | 0.620 | 11/17/23 | 10,750 | 10,611,244 | ||||||||||||
Florida Power & Light Co., | ||||||||||||||||
Sr. Unsec’d. Notes, SOFR + 0.250% | 0.299(c) | 05/10/23 | 11,250 | 11,245,153 | ||||||||||||
OGE Energy Corp., | ||||||||||||||||
Sr. Unsec’d. Notes | 0.703 | 05/26/23 | 6,750 | 6,668,120 | ||||||||||||
PPL Electric Utilities Corp., | ||||||||||||||||
First Mortgage, SOFR + 0.330% | 0.380(c) | 06/24/24 | 4,750 | 4,742,124 | ||||||||||||
First Mortgage | 2.500 | 09/01/22 | 9,000 | 9,052,311 | ||||||||||||
WEC Energy Group, Inc., | ||||||||||||||||
Sr. Unsec’d. Notes | 0.800 | 03/15/24 | 17,000 | 16,670,027 | ||||||||||||
|
| |||||||||||||||
| 111,742,003 | ||||||||||||||||
See Notes to Financial Statements.
34
PGIM Core Short-Term Bond Fund
Schedule of Investments (continued)
as of January 31, 2022
| Description | Interest Rate | Maturity Date | Principal Amount (000)# | Value | ||||||||||||
CORPORATE BONDS (Continued) | ||||||||||||||||
Foods 1.6% | ||||||||||||||||
Hormel Foods Corp., | ||||||||||||||||
Sr. Unsec’d. Notes | 0.650% | 06/03/24 | 6,000 | $ | 5,881,144 | |||||||||||
Mondelez International, Inc., | ||||||||||||||||
Sr. Unsec’d. Notes | 0.625 | 07/01/22 | 21,900 | 21,894,282 | ||||||||||||
Nestle Holdings, Inc., | ||||||||||||||||
Gtd. Notes, 144A | 0.375 | 01/15/24 | 10,000 | 9,784,510 | ||||||||||||
|
| |||||||||||||||
| 37,559,936 | ||||||||||||||||
Forest Products & Paper 0.6% | ||||||||||||||||
Georgia-Pacific LLC, | ||||||||||||||||
Sr. Unsec’d. Notes, 144A | 3.734 | 07/15/23 | 14,126 | 14,528,456 | ||||||||||||
Gas 0.5% | ||||||||||||||||
Atmos Energy Corp., | ||||||||||||||||
Sr. Unsec’d. Notes, 3 Month LIBOR + 0.380% | 0.578(c) | 03/09/23 | 12,000 | 12,000,456 | ||||||||||||
Healthcare-Products 0.4% | ||||||||||||||||
Stryker Corp., | ||||||||||||||||
Sr. Unsec’d. Notes | 0.600 | 12/01/23 | 4,750 | 4,673,090 | ||||||||||||
Thermo Fisher Scientific, Inc., | ||||||||||||||||
Sr. Unsec’d. Notes, SOFR + 0.530% | 0.580(c) | 10/18/24 | 5,000 | 5,005,015 | ||||||||||||
|
| |||||||||||||||
| 9,678,105 | ||||||||||||||||
Healthcare-Services 0.5% | ||||||||||||||||
UnitedHealth Group, Inc., | ||||||||||||||||
Sr. Unsec’d. Notes | 0.550 | 05/15/24 | 12,000 | 11,753,696 | ||||||||||||
Household Products/Wares 0.8% | ||||||||||||||||
Reckitt Benckiser Treasury Services PLC (United Kingdom), | ||||||||||||||||
Gtd. Notes, 144A, 3 Month LIBOR + 0.560% | 0.780(c) | 06/24/22 | 18,050 | 18,077,679 | ||||||||||||
Insurance 5.0% | ||||||||||||||||
Berkshire Hathaway, Inc., | ||||||||||||||||
Sr. Unsec’d. Notes | 2.750 | 03/15/23 | 13,000 | 13,207,836 | ||||||||||||
Equitable Financial Life Global Funding, | ||||||||||||||||
Sec’d. Notes, 144A, SOFR + 0.390% | 0.439(c) | 04/06/23 | 25,000 | 24,998,101 | ||||||||||||
Sec’d. Notes, 144A | 0.800 | 08/12/24 | 3,000 | 2,918,336 | ||||||||||||
See Notes to Financial Statements.
Prudential Investment Portfolios 2/PGIM Core Short-Term Bond Fund 35
PGIM Core Short-Term Bond Fund
Schedule of Investments (continued)
as of January 31, 2022
| Description | Interest Rate | Maturity Date | Principal Amount (000)# | Value | ||||||||||||
CORPORATE BONDS (Continued) | ||||||||||||||||
Insurance (cont’d.) | ||||||||||||||||
New York Life Global Funding, | ||||||||||||||||
Sec’d. Notes, 144A | 2.900% | 01/17/24 | 2,000 | $ | 2,054,544 | |||||||||||
Sr. Sec’d. Notes, 144A, 3 Month LIBOR + 0.440% | 0.678(c) | 07/12/22 | 16,760 | 16,783,397 | ||||||||||||
Pacific Life Global Funding II, | ||||||||||||||||
Sr. Sec’d. Notes, 144A | 0.500 | 09/23/23 | 12,000 | 11,817,931 | ||||||||||||
Principal Life Global Funding II, | ||||||||||||||||
Sec’d. Notes, 144A | 0.500 | 01/08/24 | 17,750 | 17,394,113 | ||||||||||||
Sec’d. Notes, 144A, SOFR + 0.450% | 0.500(c) | 04/12/24 | 2,750 | 2,758,144 | ||||||||||||
Protective Life Global Funding, | ||||||||||||||||
Sec’d. Notes, 144A | 0.631 | 10/13/23 | 10,750 | 10,609,003 | ||||||||||||
Sr. Sec’d. Notes, 144A | 0.473 | 01/12/24 | 15,000 | 14,682,691 | ||||||||||||
|
| |||||||||||||||
| 117,224,096 | ||||||||||||||||
Machinery-Construction & Mining 0.6% | ||||||||||||||||
Caterpillar Financial Services Corp., | ||||||||||||||||
Sr. Unsec’d. Notes, MTN | 0.450 | 09/14/23 | 15,000 | 14,815,644 | ||||||||||||
Media 0.5% | ||||||||||||||||
TWDC Enterprises 18 Corp., | ||||||||||||||||
Gtd. Notes, MTN, 3 Month LIBOR + 0.390% | 0.570(c) | 03/04/22 | 3,750 | 3,751,172 | ||||||||||||
Walt Disney Co. (The), | ||||||||||||||||
Gtd. Notes, 3 Month LIBOR + 0.390% | 0.561(c) | 09/01/22 | 8,000 | 8,013,418 | ||||||||||||
|
| |||||||||||||||
| 11,764,590 | ||||||||||||||||
Oil & Gas 3.0% | ||||||||||||||||
Exxon Mobil Corp., | ||||||||||||||||
Sr. Unsec’d. Notes, 3 Month LIBOR + 0.370% | 0.550(c) | 03/06/22 | 1,362 | 1,362,440 | ||||||||||||
Sr. Unsec’d. Notes | 1.571 | 04/15/23 | 21,000 | 21,117,727 | ||||||||||||
Phillips 66, | ||||||||||||||||
Gtd. Notes | 0.900 | 02/15/24 | 16,000 | 15,801,150 | ||||||||||||
Gtd. Notes | 4.300 | 04/01/22 | 2,000 | 2,012,437 | ||||||||||||
Pioneer Natural Resources Co., | ||||||||||||||||
Sr. Unsec’d. Notes | 0.550 | 05/15/23 | 6,750 | 6,685,398 | ||||||||||||
Sr. Unsec’d. Notes | 0.750 | 01/15/24 | 10,750 | 10,530,560 | ||||||||||||
Saudi Arabian Oil Co. (Saudi Arabia), | ||||||||||||||||
Sr. Unsec’d. Notes, 144A, MTN | 2.750 | 04/16/22 | 13,020 | 13,076,145 | ||||||||||||
|
| |||||||||||||||
| 70,585,857 | ||||||||||||||||
See Notes to Financial Statements.
36
PGIM Core Short-Term Bond Fund
Schedule of Investments (continued)
as of January 31, 2022
| Description | Interest Rate | Maturity Date | Principal Amount (000)# | Value | ||||||||||||
CORPORATE BONDS (Continued) | ||||||||||||||||
Pharmaceuticals 3.8% | ||||||||||||||||
AbbVie, Inc., | ||||||||||||||||
Sr. Unsec’d. Notes, 3 Month LIBOR + 0.650% | 0.810%(c) | 11/21/22 | 4,000 | $ | 4,016,596 | |||||||||||
AmerisourceBergen Corp., | ||||||||||||||||
Sr. Unsec’d. Notes | 0.737 | 03/15/23 | 26,500 | 26,328,844 | ||||||||||||
Astrazeneca Finance LLC (United Kingdom), | ||||||||||||||||
Gtd. Notes | 0.700 | 05/28/24 | 21,500 | 21,077,346 | ||||||||||||
Bristol-Myers Squibb Co., | ||||||||||||||||
Sr. Unsec’d. Notes, 3 Month LIBOR + 0.380% | 0.535(c) | 05/16/22 | 4,000 | 4,002,813 | ||||||||||||
Sr. Unsec’d. Notes | 0.537 | 11/13/23 | 20,000 | 19,754,804 | ||||||||||||
GlaxoSmithKline Capital PLC (United Kingdom), | ||||||||||||||||
Gtd. Notes | 0.534 | 10/01/23 | 13,500 | 13,329,302 | ||||||||||||
|
| |||||||||||||||
| 88,509,705 | ||||||||||||||||
Pipelines 1.9% | ||||||||||||||||
Enterprise Products Operating LLC, | ||||||||||||||||
Gtd. Notes | 3.500 | 02/01/22 | 21,259 | 21,259,000 | ||||||||||||
Gtd. Notes | 3.900 | 02/15/24 | 4,376 | 4,554,632 | ||||||||||||
Southern Natural Gas Co. LLC, | ||||||||||||||||
Sr. Unsec’d. Notes, 144A | 0.625 | 04/28/23 | 4,250 | 4,205,420 | ||||||||||||
TransCanada PipeLines Ltd. (Canada), | ||||||||||||||||
Sr. Unsec’d. Notes | 1.000 | 10/12/24 | 8,000 | 7,826,197 | ||||||||||||
Sr. Unsec’d. Notes | 2.500 | 08/01/22 | 7,000 | 7,053,486 | ||||||||||||
|
| |||||||||||||||
| 44,898,735 | ||||||||||||||||
Real Estate Investment Trusts (REITs) 0.9% | ||||||||||||||||
Public Storage, | ||||||||||||||||
Sr. Unsec’d. Notes, SOFR + 0.470% | 0.520(c) | 04/23/24 | 20,000 | 19,999,537 | ||||||||||||
Retail 1.0% | ||||||||||||||||
7-Eleven, Inc., | ||||||||||||||||
Sr. Unsec’d. Notes, 144A | 0.625 | 02/10/23 | 5,000 | 4,973,610 | ||||||||||||
Sr. Unsec’d. Notes, 144A | 0.800 | 02/10/24 | 7,000 | 6,865,420 | ||||||||||||
Home Depot, Inc. (The), | ||||||||||||||||
Sr. Unsec’d. Notes, 3 Month LIBOR + 0.310% | 0.481(c) | 03/01/22 | 2,419 | 2,419,428 | ||||||||||||
Sr. Unsec’d. Notes | 2.625 | 06/01/22 | 6,000 | 6,032,605 | ||||||||||||
See Notes to Financial Statements.
Prudential Investment Portfolios 2/PGIM Core Short-Term Bond Fund 37
PGIM Core Short-Term Bond Fund
Schedule of Investments (continued)
as of January 31, 2022
| Description | Interest Rate | Maturity Date | Principal Amount (000)# | Value | ||||||||||||
CORPORATE BONDS (Continued) | ||||||||||||||||
Retail (cont’d.) | ||||||||||||||||
Starbucks Corp., | ||||||||||||||||
Sr. Unsec’d. Notes | 1.300% | 05/07/22 | 2,000 | $ | 2,004,498 | |||||||||||
|
| |||||||||||||||
| 22,295,561 | ||||||||||||||||
Savings & Loans 1.0% | ||||||||||||||||
Nationwide Building Society (United Kingdom), | ||||||||||||||||
Sr. Unsec’d. Notes, 144A | 0.550 | 01/22/24 | 25,000 | 24,437,152 | ||||||||||||
Semiconductors 0.4% | ||||||||||||||||
Intel Corp., | ||||||||||||||||
Sr. Unsec’d. Notes, 3 Month LIBOR + 0.350% | 0.504(c) | 05/11/22 | 10,000 | 10,006,038 | ||||||||||||
Software 0.7% | ||||||||||||||||
Fidelity National Information Services, Inc., | ||||||||||||||||
Sr. Unsec’d. Notes | 0.600 | 03/01/24 | 14,250 | 13,906,443 | ||||||||||||
Infor, Inc., | ||||||||||||||||
Sr. Unsec’d. Notes, 144A | 1.450 | 07/15/23 | 1,800 | 1,792,141 | ||||||||||||
|
| |||||||||||||||
| 15,698,584 | ||||||||||||||||
Telecommunications 2.7% | ||||||||||||||||
NTT Finance Corp. (Japan), | ||||||||||||||||
Gtd. Notes, 144A | 0.583 | 03/01/24 | 15,250 | 14,925,470 | ||||||||||||
Rogers Communications, Inc. (Canada), | ||||||||||||||||
Gtd. Notes, 3 Month LIBOR + 0.600% | 0.814(c) | 03/22/22 | 10,400 | 10,406,713 | ||||||||||||
Verizon Communications, Inc., | ||||||||||||||||
Sr. Unsec’d. Notes, SOFR + 0.500% | 0.549(c) | 03/22/24 | 23,000 | 23,061,437 | ||||||||||||
Sr. Unsec’d. Notes | 0.750 | 03/22/24 | 12,000 | 11,812,414 | ||||||||||||
Vodafone Group PLC (United Kingdom), | ||||||||||||||||
Sr. Unsec’d. Notes | 2.500 | 09/26/22 | 3,600 | 3,637,241 | ||||||||||||
|
| |||||||||||||||
| 63,843,275 | ||||||||||||||||
Transportation 1.0% | ||||||||||||||||
Ryder System, Inc., | ||||||||||||||||
Sr. Unsec’d. Notes, MTN | 2.875 | 06/01/22 | 6,000 | 6,033,566 | ||||||||||||
See Notes to Financial Statements.
38
PGIM Core Short-Term Bond Fund
Schedule of Investments (continued)
as of January 31, 2022
| Description | Interest Rate | Maturity Date | Principal Amount (000)# | Value | ||||||||||||
CORPORATE BONDS (Continued) | ||||||||||||||||
Transportation (cont’d.) | ||||||||||||||||
United Parcel Service, Inc., | ||||||||||||||||
Sr. Unsec’d. Notes, 3 Month LIBOR + 0.380% | 0.535%(c) | 05/16/22 | 11,800 | $ | 11,807,930 | |||||||||||
Sr. Unsec’d. Notes, 3 Month LIBOR + 0.450% | 0.664(c) | 04/01/23 | 5,144 | 5,157,618 | ||||||||||||
|
| |||||||||||||||
| 22,999,114 | ||||||||||||||||
|
| |||||||||||||||
TOTAL CORPORATE BONDS | 1,374,567,816 | |||||||||||||||
|
| |||||||||||||||
TOTAL LONG-TERM INVESTMENTS | 1,904,099,346 | |||||||||||||||
|
| |||||||||||||||
SHORT-TERM INVESTMENTS 18.2% | ||||||||||||||||
CERTIFICATE OF DEPOSIT 0.2% | ||||||||||||||||
Bank of Nova Scotia (The) | 0.230 | 05/10/22 | 5,000 | 4,999,527 | ||||||||||||
|
| |||||||||||||||
COMMERCIAL PAPER(n) 13.0% | ||||||||||||||||
Alexandria Real Estate Equities, Inc., | ||||||||||||||||
144A | 0.260 | 02/16/22 | 9,000 | 8,999,288 | ||||||||||||
BAT International Finance PLC, | ||||||||||||||||
144A | 0.300 | 02/10/22 | 10,000 | 9,999,503 | ||||||||||||
144A | 0.300 | 02/25/22 | 10,000 | 9,998,354 | ||||||||||||
Danaher Corp., | ||||||||||||||||
144A | 0.180 | 02/04/22 | 10,000 | 9,999,849 | ||||||||||||
Enbridge, Inc., | ||||||||||||||||
144A | 0.451 | 03/15/22 | 10,000 | 9,995,234 | ||||||||||||
Enel Finance America LLC, | ||||||||||||||||
144A | 0.392 | 07/14/22 | 6,750 | 6,732,257 | ||||||||||||
144A | 0.392 | 07/15/22 | 6,750 | 6,732,056 | ||||||||||||
Evergy Kansas Central, Inc., | ||||||||||||||||
144A | 0.200 | 02/02/22 | 19,000 | 18,999,839 | ||||||||||||
144A | 0.200 | 02/03/22 | 11,000 | 10,999,859 | ||||||||||||
HCP, Inc., | ||||||||||||||||
144A | 0.320 | 03/08/22 | 20,000 | 19,994,120 | ||||||||||||
Hitachi America Capital Ltd., | ||||||||||||||||
144A | 0.160 | 02/02/22 | 20,000 | 19,999,830 | ||||||||||||
Hyundai Capital America, | ||||||||||||||||
144A | 0.390 | 03/18/22 | 10,000 | 9,996,333 | ||||||||||||
See Notes to Financial Statements.
Prudential Investment Portfolios 2/PGIM Core Short-Term Bond Fund 39
PGIM Core Short-Term Bond Fund
Schedule of Investments (continued)
as of January 31, 2022
| Description | Interest Rate | Maturity Date | Principal Amount (000)# | Value | ||||||||||||
COMMERCIAL PAPER (Continued) | ||||||||||||||||
Ingredion, Inc., | ||||||||||||||||
144A | 0.270% | 03/09/22 | 10,000 | $ | 9,997,307 | |||||||||||
Intercontinental Exchange, Inc., | ||||||||||||||||
144A | 0.240 | 02/15/22 | 16,815 | 16,813,223 | ||||||||||||
Nutrien Ltd., | ||||||||||||||||
144A | 0.400 | 03/21/22 | 15,000 | 14,993,324 | ||||||||||||
PPG Industries, Inc. | 0.250 | 02/22/22 | 7,000 | 6,999,021 | ||||||||||||
Public Service Enterprise Group, Inc., | ||||||||||||||||
144A | 0.340 | 03/18/22 | 14,000 | 13,994,866 | ||||||||||||
Sempra Energy, | ||||||||||||||||
144A | 0.270 | 02/14/22 | 6,000 | 5,999,505 | ||||||||||||
144A | 0.270 | 02/23/22 | 14,335 | 14,332,793 | ||||||||||||
144A | 0.280 | 02/22/22 | 5,900 | 5,899,138 | ||||||||||||
TELUS Corp., | ||||||||||||||||
144A | 0.370 | 03/24/22 | 10,000 | 9,995,652 | ||||||||||||
TransCanada PipeLines Ltd., | ||||||||||||||||
144A | 0.390 | 03/14/22 | 5,000 | 4,998,378 | ||||||||||||
Walt Disney Co. (The), | ||||||||||||||||
144A | 0.271 | 03/31/22 | 5,500 | 5,497,593 | ||||||||||||
Waste Management, Inc., | ||||||||||||||||
144A | 0.321 | 07/11/22 | 12,500 | 12,471,154 | ||||||||||||
Welltower, Inc., | ||||||||||||||||
144A | 0.230 | 02/09/22 | 21,000 | 20,999,092 | ||||||||||||
Western Union Co. (The), | ||||||||||||||||
144A | 0.210 | 02/04/22 | 19,617 | 19,616,623 | ||||||||||||
|
| |||||||||||||||
TOTAL COMMERCIAL PAPER | 305,054,191 | |||||||||||||||
|
| |||||||||||||||
CORPORATE BOND 0.2% | ||||||||||||||||
Banks | ||||||||||||||||
ING Groep NV (Netherlands), | ||||||||||||||||
Sr. Unsec’d. Notes, 3 Month LIBOR + 1.150% | 1.370%(c) | 03/29/22 | 4,000 | 4,006,318 | ||||||||||||
|
| |||||||||||||||
See Notes to Financial Statements.
40
PGIM Core Short-Term Bond Fund
Schedule of Investments (continued)
as of January 31, 2022
| Description | Shares | Value | ||||||
UNAFFILIATED FUND 4.8% | ||||||||
Dreyfus Government Cash Management (Institutional Shares) | 111,125,793 | $ | 111,125,793 | |||||
|
| |||||||
TOTAL SHORT-TERM INVESTMENTS | 425,185,829 | |||||||
|
| |||||||
TOTAL INVESTMENTS 99.7% | 2,329,285,175 | |||||||
Other assets in excess of liabilities(z) 0.3% | 7,917,861 | |||||||
|
| |||||||
NET ASSETS 100.0% | $ | 2,337,203,036 | ||||||
|
| |||||||
|
| |||||||
See the Glossary for a list of the abbreviation(s) used in the annual report.
| # | Principal or notional amount is shown in U.S. dollars unless otherwise stated. |
| (c) | Variable rate instrument. The interest rate shown reflects the rate in effect at January 31, 2022. |
| (cc) | Variable rate instrument. The rate shown is based on the latest available information as of January 31, 2022. Certain variable rate securities are not based on a published reference rate and spread but are determined by the issuer or agent and are based on current market conditions. These securities do not indicate a reference rate and spread in their description. |
| (ff) | Variable rate security. Security may be issued at a fixed coupon rate, which converts to a variable rate at a specified date. Rate shown is the rate in effect as of period end. |
| (n) | Rate shown reflects yield to maturity at purchased date. |
| (z) | Includes net unrealized appreciation/(depreciation) and/or market value of the below holdings which are excluded from the Schedule of Investments: |
Interest rate swap agreements outstanding at January 31, 2022
Notional Amount (000)# |
| Termination | Fixed Rate | Floating Rate | Value at Trade Date | Value at January 31, 2022 | Unrealized Appreciation (Depreciation) | |||||||||||||||||||||||||||||||||||||||||
Centrally Cleared Interest Rate Swap Agreements: | ||||||||||||||||||||||||||||||||||||||||||||||||
| 24,550 | 04/01/22 | 2.265%(S) | 3 Month LIBOR(1)(Q) | $ 11,634 | $ | (267,216 | ) | $ | (278,850 | ) | ||||||||||||||||||||||||||||||||||||||
| 49,030 | 04/12/22 | 2.357%(S) | 3 Month LIBOR(1)(Q) | (286,839 | ) | (553,678 | ) | (266,839 | ) | |||||||||||||||||||||||||||||||||||||||
| 74,000 | 06/15/22 | 1.873%(S) | 3 Month LIBOR(1)(Q) | (116,415 | ) | (565,084 | ) | (448,669 | ) | |||||||||||||||||||||||||||||||||||||||
| 21,900 | 07/02/22 | (0.001)%(A) | 1 Day USOIS(1)(A) | — | 47,690 | 47,690 | ||||||||||||||||||||||||||||||||||||||||||
| 18,500 | 08/22/22 | 1.421%(S) | 3 Month LIBOR(1)(Q) | (17,603 | ) | (198,061 | ) | (180,458 | ) | |||||||||||||||||||||||||||||||||||||||
| 59,800 | 09/03/22 | 1.919%(S) | 3 Month LIBOR(1)(Q) | (586,731 | ) | (927,276 | ) | (340,545 | ) | |||||||||||||||||||||||||||||||||||||||
| 15,000 | 01/30/23 | 1.467%(S) | 3 Month LIBOR(1)(Q) | — | (90,325 | ) | (90,325 | ) | ||||||||||||||||||||||||||||||||||||||||
| 65,700 | 05/11/23 | 2.250%(A) | 1 Day USOIS(1)(A) | (3,959,253 | ) | (2,171,510 | ) | 1,787,743 | ||||||||||||||||||||||||||||||||||||||||
| 100,000 | 07/26/23 | 0.192%(A) | 1 Day USOIS(1)(A) | — | 1,154,480 | 1,154,480 | ||||||||||||||||||||||||||||||||||||||||||
| 19,250 | 02/04/24 | 0.133%(A) | 1 Day USOIS(1)(A) | 24,122 | 391,536 | 367,414 | ||||||||||||||||||||||||||||||||||||||||||
| 47,000 | 03/01/24 | 0.230%(A) | 1 Day USOIS(1)(A) | 58,857 | 870,315 | 811,458 | ||||||||||||||||||||||||||||||||||||||||||
| 12,000 | 03/15/24 | 0.276%(A) | 1 Day USOIS(1)(A) | — | 212,716 | 212,716 | ||||||||||||||||||||||||||||||||||||||||||
| 17,000 | 03/18/24 | 0.278%(A) | 1 Day USOIS(1)(A) | — | 302,545 | 302,545 | ||||||||||||||||||||||||||||||||||||||||||
| 3,000 | 04/26/24 | 0.305%(A) | 1 Day USOIS(1)(A) | — | 56,040 | 56,040 | ||||||||||||||||||||||||||||||||||||||||||
See Notes to Financial Statements.
Prudential Investment Portfolios 2/PGIM Core Short-Term Bond Fund 41
PGIM Core Short-Term Bond Fund
Schedule of Investments (continued)
as of January 31, 2022
Interest rate swap agreements outstanding at January 31, 2022 (continued)
Notional Amount (000)# | Termination | Fixed Rate | Floating Rate | Value at Trade Date | Value at January 31, 2022 | Unrealized Appreciation (Depreciation) | ||||||||||||||||||||||||||||||||||||||||
Centrally Cleared Interest Rate Swap Agreements (cont’d.): | ||||||||||||||||||||||||||||||||||||||||||||||
| 9,750 | 05/11/24 | 0.300%(A) | 1 Day SOFR(1)(A) | $ (2,320 | ) | $ | 182,213 | $ | 184,533 | |||||||||||||||||||||||||||||||||||||
| 12,000 | 05/20/24 | 0.296%(A) | 1 Day USOIS(1)(A) | — | 239,956 | 239,956 | ||||||||||||||||||||||||||||||||||||||||
| 21,000 | 06/16/24 | 0.304%(A) | 1 Day USOIS(1)(A) | — | 440,317 | 440,317 | ||||||||||||||||||||||||||||||||||||||||
| 25,000 | 08/05/24 | 0.261%(A) | 1 Day SOFR(1)(A) | — | 587,355 | 587,355 | ||||||||||||||||||||||||||||||||||||||||
| 3,000 | 08/13/24 | 0.368%(A) | 1 Day SOFR(1)(A) | — | 61,888 | 61,888 | ||||||||||||||||||||||||||||||||||||||||
| 15,000 | 08/31/24 | 0.399%(A) | 1 Day USOIS(1)(A) | — | 319,114 | 319,114 | ||||||||||||||||||||||||||||||||||||||||
| 7,500 | 09/09/24 | 0.368%(A) | 1 Day SOFR(1)(A) | (293 | ) | 163,313 | 163,606 | |||||||||||||||||||||||||||||||||||||||
| 8,000 | 10/12/24 | 0.511%(A) | 1 Day SOFR(1)(A) | — | 151,898 | 151,898 | ||||||||||||||||||||||||||||||||||||||||
| 25,000 | 11/29/24 | 0.090%(A) | 1 Day USOIS(1)(A) | (2,470 | ) | 859,572 | 862,042 | |||||||||||||||||||||||||||||||||||||||
| 12,000 | 05/11/25 | 0.450%(A) | 1 Day SOFR(1)(A) | 105,148 | 212,809 | 107,661 | ||||||||||||||||||||||||||||||||||||||||
|
|
|
|
|
| |||||||||||||||||||||||||||||||||||||||||
| $(4,772,163 | ) | $ | 1,480,607 | $ | 6,252,770 | |||||||||||||||||||||||||||||||||||||||||
|
|
|
|
|
| |||||||||||||||||||||||||||||||||||||||||
| (1) | The Fund pays the fixed rate and receives the floating rate. |
| (2) | The Fund pays the floating rate and receives the fixed rate. |
Summary of Collateral for Centrally Cleared/Exchange-traded Derivatives:
Cash and securities segregated as collateral, including pending settlement for closed positions, to cover requirements for centrally cleared/exchange-traded derivatives are listed by broker as follows:
Broker | Cash and/or Foreign Currency | Securities Market Value | ||||||||
Citigroup Global Markets, Inc. | $ | 4,940,000 | $ | — | ||||||
|
|
|
| |||||||
| Fair Value Measurements: |
Various inputs are used in determining the value of the Fund’s investments. These inputs are summarized in the three broad levels listed below.
Level 1—unadjusted quoted prices generally in active markets for identical securities.
Level 2—quoted prices for similar securities, interest rates and yield curves, prepayment speeds, foreign currency exchange rates and other observable inputs.
Level 3—unobservable inputs for securities valued in accordance with Board approved fair valuation procedures.
See Notes to Financial Statements.
42
PGIM Core Short-Term Bond Fund
Schedule of Investments (continued)
as of January 31, 2022
The following is a summary of the inputs used as of January 31, 2022 in valuing such portfolio securities:
| Level 1 | Level 2 | Level 3 | ||||||||||||||||||
Investments in Securities | ||||||||||||||||||||
Assets | ||||||||||||||||||||
Long-Term Investments | ||||||||||||||||||||
Asset-Backed Securities | ||||||||||||||||||||
Automobiles | $ | — | $ | 46,546,957 | $ | — | ||||||||||||||
Credit Cards | — | 53,603,034 | — | |||||||||||||||||
Home Equity Loans | — | 20,186,657 | — | |||||||||||||||||
Residential Mortgage-Backed Securities | — | 6,883,754 | — | |||||||||||||||||
Certificates of Deposit | — | 73,036,429 | — | |||||||||||||||||
Commercial Mortgage-Backed Securities | — | 329,274,699 | — | |||||||||||||||||
Corporate Bonds | — | 1,374,567,816 | — | |||||||||||||||||
Short-Term Investments | ||||||||||||||||||||
Certificate of Deposit | — | 4,999,527 | — | |||||||||||||||||
Commercial Paper | — | 305,054,191 | — | |||||||||||||||||
Corporate Bond | — | 4,006,318 | — | |||||||||||||||||
Unaffiliated Fund | 111,125,793 | — | — | |||||||||||||||||
|
|
|
|
|
| |||||||||||||||
Total | $ | 111,125,793 | $ | 2,218,159,382 | $ | — | ||||||||||||||
|
|
|
|
|
| |||||||||||||||
Other Financial Instruments* | ||||||||||||||||||||
Assets | ||||||||||||||||||||
Centrally Cleared Interest Rate Swap Agreements | $ | — | $ | 7,858,456 | $ | — | ||||||||||||||
|
|
|
|
|
| |||||||||||||||
Liabilities | ||||||||||||||||||||
Centrally Cleared Interest Rate Swap Agreements | $ | — | $ | (1,605,686 | ) | $ | — | |||||||||||||
|
|
|
|
|
| |||||||||||||||
| * | Other financial instruments are derivative instruments not reflected in the Schedule of Investments, such as futures, forwards and centrally cleared swap contracts, which are recorded at the unrealized appreciation (depreciation) on the instrument, and OTC swap contracts which are recorded at fair value. |
Industry Classification:
The industry classification of investments and other assets in excess of liabilities shown as a percentage of net assets as of January 31, 2022 were as follows (unaudited):
Banks | 17.3 | % | ||
Commercial Mortgage-Backed Securities | 14.1 | |||
Commercial Paper | 13.0 | |||
Insurance | 5.0 | |||
Electric | 4.8 | |||
Unaffiliated Fund | 4.8 | |||
Pharmaceuticals | 3.8 | |||
Certificates of Deposit | 3.3 | |||
Auto Manufacturers | 3.3 | |||
Oil & Gas | 3.0 |
Telecommunications | 2.7 | % | ||
Credit Cards | 2.3 | |||
Diversified Financial Services | 2.2 | |||
Automobiles | 2.0 | |||
Pipelines | 1.9 | |||
Foods | 1.6 | |||
Beverages | 1.1 | |||
Savings & Loans | 1.0 | |||
Transportation | 1.0 | |||
Retail | 1.0 |
See Notes to Financial Statements.
Prudential Investment Portfolios 2/PGIM Core Short-Term Bond Fund 43
PGIM Core Short-Term Bond Fund
Schedule of Investments (continued)
as of January 31, 2022
Industry Classification (continued):
Home Equity Loans | 0.9 | % | ||
Real Estate Investment Trusts (REITs) | 0.9 | |||
Airlines | 0.8 | |||
Household Products/Wares | 0.8 | |||
Cosmetics/Personal Care | 0.7 | |||
Software | 0.7 | |||
Machinery-Construction & Mining | 0.6 | |||
Forest Products & Paper | 0.6 | |||
Gas | 0.5 | |||
Media | 0.5 | |||
Healthcare-Services | 0.5 | |||
Chemicals | 0.5 | |||
Semiconductors | 0.4 |
Healthcare-Products | 0.4 | % | ||
Commercial Services | 0.4 | |||
Apparel | 0.3 | |||
Residential Mortgage-Backed Securities | 0.3 | |||
Computers | 0.2 | |||
Biotechnology | 0.2 | |||
Building Materials | 0.2 | |||
Agriculture | 0.1 | |||
|
| |||
| 99.7 | ||||
Other assets in excess of liabilities | 0.3 | |||
|
| |||
| 100.0 | % | |||
|
| |||
Effects of Derivative Instruments on the Financial Statements and Primary Underlying Risk Exposure:
The Fund invested in derivative instruments during the reporting period. The primary type of risk associated with these derivative instruments is interest rate contracts risk. See the Notes to Financial Statements for additional detail regarding these derivative instruments and their risks. The effect of such derivative instruments on the Fund’s financial position and financial performance as reflected in the Statement of Assets and Liabilities and Statement of Operations is presented in the summary below.
Fair values of derivative instruments as of January 31, 2022 as presented in the Statement of Assets and Liabilities:
Asset Derivatives | Liability Derivatives | |||||||||||||
Derivatives not accounted for as hedging instruments, carried at fair value |
| Statement of Assets and Liabilities Location | Fair Value | Statement of Assets and Liabilities Location | Fair Value | |||||||||
Interest rate contracts | Due from/to broker-variation margin swaps | $ | 7,858,456 | * | Due from/to broker-variation margin swaps | $ | 1,605,686 | * | ||||||
|
|
|
| |||||||||||
| * | Includes cumulative appreciation (depreciation) as reported in the schedule of open futures and centrally cleared swap contracts. Only unsettled variation margin receivable (payable) is reported within the Statement of Assets and Liabilities. |
The effects of derivative instruments on the Statement of Operations for the year ended January 31, 2022 are as follows:
| Amount of Realized Gain (Loss) on Derivatives Recognized in Income | ||||
Derivatives not accounted for as hedging instruments, carried at fair value | Swaps | |||
Interest rate contracts | $ | (11,984,058 | ) | |
|
| |||
See Notes to Financial Statements.
44
PGIM Core Short-Term Bond Fund
Schedule of Investments (continued)
as of January 31, 2022
| Change in Unrealized Appreciation (Depreciation) on Derivatives Recognized in Income | ||||
Derivatives not accounted for as hedging instruments, carried at fair value | Swaps | |||
Interest rate contracts | $ | 19,181,303 | ||
|
| |||
For the year ended January 31, 2022, the Fund’s average volume of derivative activities is as follows:
Interest Rate Swap Agreements(1) |
$713,947,600 |
| (1) | Notional Amount in USD. |
Average volume is based on average quarter end balances as noted for the year ended January 31, 2022.
See Notes to Financial Statements.
Prudential Investment Portfolios 2/PGIM Core Short-Term Bond Fund 45
PGIM Core Short-Term Bond Fund
Statement of Assets & Liabilities
as of January 31, 2022
Assets
| ||||
Unaffiliated investments (cost $2,336,526,040) | $ | 2,329,285,175 | ||
Deposit with broker for centrally cleared/exchange-traded derivatives | 4,940,000 | |||
Interest receivable | 4,470,348 | |||
Prepaid expenses | 8,205 | |||
|
| |||
Total Assets | 2,338,703,728 | |||
|
| |||
Liabilities
| ||||
Dividends payable | 1,197,934 | |||
Due to broker—variation margin swaps | 153,821 | |||
Accrued expenses and other liabilities | 70,430 | |||
Management fee payable | 61,040 | |||
Affiliated transfer agent fee payable | 16,667 | |||
Trustees’ fees payable | 800 | |||
|
| |||
Total Liabilities | 1,500,692 | |||
|
| |||
Net Assets | $ | 2,337,203,036 | ||
|
| |||
Net assets were comprised of: | ||||
Paid-in capital | $ | 2,373,078,114 | ||
Total distributable earnings (loss) | (35,875,078 | ) | ||
|
| |||
Net assets, January 31, 2022 | $ | 2,337,203,036 | ||
|
| |||
Net asset value and redemption price per share ($2,337,203,036 ÷ 254,866,922 shares of beneficial interest issued and outstanding) | $ | 9.17 | ||
|
| |||
See Notes to Financial Statements.
46
PGIM Core Short-Term Bond Fund
Statement of Operations
Year Ended January 31, 2022
Net Investment Income (Loss)
|
| |||
Income | ||||
Interest income | $ | 33,195,699 | ||
Affiliated dividend income | 133,395 | |||
Unaffiliated dividend income | 4,092 | |||
|
| |||
Total income | 33,333,186 | |||
|
| |||
Expenses | ||||
Management fee | 710,661 | |||
Transfer agent’s fees and expenses (including affiliated expense of $ 100,000) | 100,046 | |||
Custodian and accounting fees | 59,715 | |||
Audit fee | 40,557 | |||
Legal fees and expenses | 20,998 | |||
Trustees’ fees | 9,501 | |||
Shareholders’ reports | 8,464 | |||
Miscellaneous | 40,113 | |||
|
| |||
Total expenses | 990,055 | |||
|
| |||
Net investment income (loss) | 32,343,131 | |||
|
| |||
Realized And Unrealized Gain (Loss) On Investments
|
| |||
Net realized gain (loss) on: | ||||
Investment transactions | 1,627,120 | |||
Swap agreement transactions | (11,984,058 | ) | ||
|
| |||
| (10,356,938 | ) | |||
|
| |||
Net change in unrealized appreciation (depreciation) on: | ||||
Investments | (33,808,021 | ) | ||
Swap agreements | 19,181,303 | |||
|
| |||
| (14,626,718 | ) | |||
|
| |||
Net gain (loss) on investment transactions | (24,983,656 | ) | ||
|
| |||
Net Increase (Decrease) In Net Assets Resulting From Operations | $ | 7,359,475 | ||
|
| |||
See Notes to Financial Statements.
Prudential Investment Portfolios 2/PGIM Core Short-Term Bond Fund 47
PGIM Core Short-Term Bond Fund
Statements of Changes in Net Assets
Year Ended January 31, | ||||||||
|
| |||||||
| 2022 | 2021 | |||||||
Increase (Decrease) in Net Assets
| ||||||||
Operations | ||||||||
Net investment income (loss) | $ | 32,343,131 | $ | 52,584,946 | ||||
Net realized gain (loss) on investment transactions | (10,356,938 | ) | (47,266,571 | ) | ||||
Net change in unrealized appreciation (depreciation) on investments | (14,626,718 | ) | 40,679,704 | |||||
|
|
|
| |||||
Net increase (decrease) in net assets resulting from operations | 7,359,475 | 45,998,079 | ||||||
|
|
|
| |||||
Dividends and Distributions | ||||||||
Distributions from distributable earnings | (23,901,687 | ) | (37,768,493 | ) | ||||
Tax return of capital distributions | (291,540 | ) | (1,515,195 | ) | ||||
|
|
|
| |||||
Total dividends and distributions | (24,193,227 | ) | (39,283,688 | ) | ||||
|
|
|
| |||||
Fund share transactions | ||||||||
Net proceeds from shares sold | 277,486,085 | 1,738,879,927 | ||||||
Net asset value of shares issued in reinvestment of dividends and distributions | 7,137,574 | 11,638,591 | ||||||
Cost of shares purchased | (680,113,269 | ) | (1,719,601,850 | ) | ||||
|
|
|
| |||||
Net increase (decrease) in net assets from Fund share transactions | (395,489,610 | ) | 30,916,668 | |||||
|
|
|
| |||||
Total increase (decrease) | (412,323,362 | ) | 37,631,059 | |||||
Net Assets:
| ||||||||
Beginning of year | 2,749,526,398 | 2,711,895,339 | ||||||
|
|
|
| |||||
End of year | $ | 2,337,203,036 | $ | 2,749,526,398 | ||||
|
|
|
| |||||
See Notes to Financial Statements.
48
PGIM Core Short-Term Bond Fund
Financial Highlights
| Year Ended January 31, | ||||||||||||||||||||
| 2022 | 2021 | 2020 | 2019 | 2018 | ||||||||||||||||
Per Share Operating Performance(a): | ||||||||||||||||||||
Net Asset Value, Beginning of Year | $9.23 | $9.21 | $9.22 | $9.28 | $9.27 | |||||||||||||||
Income (loss) from investment operations: | ||||||||||||||||||||
Net investment income (loss) | 0.11 | 0.18 | 0.27 | 0.26 | 0.19 | |||||||||||||||
Net realized and unrealized gain (loss) on investment transactions | (0.09 | ) | (0.03 | ) | 0.02 | (0.04 | ) | 0.03 | ||||||||||||
Total from investment operations | 0.02 | 0.15 | 0.29 | 0.22 | 0.22 | |||||||||||||||
Less Dividends and Distributions: | ||||||||||||||||||||
Dividends from net investment income | (0.08 | ) | (0.12 | ) | (0.29 | ) | (0.28 | ) | (0.21 | ) | ||||||||||
Tax return of capital distributions | - | (b) | (0.01 | ) | - | - | - | |||||||||||||
Distributions from net realized gains | - | - | (0.01 | ) | - | - | ||||||||||||||
Total dividends and distributions | (0.08 | ) | (0.13 | ) | (0.30 | ) | (0.28 | ) | (0.21 | ) | ||||||||||
Net asset value, end of year | $9.17 | $9.23 | $9.21 | $9.22 | $9.28 | |||||||||||||||
Total Return(c): | 0.24 | % | 1.67 | % | 3.16 | % | 2.42 | % | 2.36 | % | ||||||||||
Ratios/Supplemental Data: | ||||||||||||||||||||
Net assets, end of year (000) | $2,337,203 | $2,749,526 | $2,711,895 | $2,911,225 | $3,119,050 | |||||||||||||||
Average net assets (000) | $2,704,291 | $2,734,881 | $2,860,307 | $2,997,474 | $3,082,883 | |||||||||||||||
Ratios to average net assets(d): | ||||||||||||||||||||
Expenses after waivers and/or expense reimbursement | 0.04 | % | 0.04 | % | 0.04 | % | 0.03 | % | 0.03 | % | ||||||||||
Expenses before waivers and/or expense reimbursement | 0.04 | % | 0.04 | % | 0.04 | % | 0.03 | % | 0.03 | % | ||||||||||
Net investment income (loss) | 1.20 | % | 1.92 | % | 2.91 | % | 2.76 | % | 2.04 | % | ||||||||||
Portfolio turnover rate(e) | 26 | % | 54 | % | 43 | % | 35 | % | 53 | % | ||||||||||
| (a) | Calculated based on average shares outstanding during the year. |
| (b) | Amount rounds to zero. |
| (c) | Total return is calculated assuming a purchase of a share on the first day and a sale on the last day of each year reported and includes reinvestment of dividends and distributions, if any. Total returns may reflect adjustments to conform to GAAP. |
| (d) | Does not include expenses of the underlying funds in which the Fund invests. |
| (e) | The Fund’s portfolio turnover rate is calculated in accordance with regulatory requirements, without regard to transactions involving short-term investments, certain derivatives and in-kind transactions (if any). If such transactions were included, the Fund’s portfolio turnover rate may be higher. |
See Notes to Financial Statements.
Prudential Investment Portfolios 2/PGIM Core Short-Term Bond Fund 49
PGIM Core Ultra Short Bond Fund
Schedule of Investments
as of January 31, 2022
| Description | Interest Rate | Maturity Date | Principal Amount (000)# | Value | ||||||||||||
LONG-TERM INVESTMENTS 7.7% | ||||||||||||||||
CERTIFICATES OF DEPOSIT 6.1% | ||||||||||||||||
Bank of America NA, SOFR + 0.150% | 0.200%(c) | 10/11/22 | 55,000 | $ | 54,980,851 | |||||||||||
Bank of Montreal | 0.200 | 07/20/22 | 135,000 | 134,849,206 | ||||||||||||
Bank of Montreal, 3 Month LIBOR + 0.040% | 0.220(c) | 02/25/22 | 32,000 | 32,003,225 | ||||||||||||
Bank of Nova Scotia (Canada), | ||||||||||||||||
SOFR + 0.150% | 0.200(c) | 08/19/22 | 98,000 | 97,985,310 | ||||||||||||
SOFR + 0.150% | 0.200(c) | 10/17/22 | 70,000 | 69,971,826 | ||||||||||||
SOFR + 0.150% | 0.200(c) | 10/20/22 | 80,000 | 79,966,847 | ||||||||||||
SOFR + 0.160% | 0.210(c) | 07/08/22 | 100,000 | 100,014,031 | ||||||||||||
Canadian Imperial Bank of Commerce (Canada), | ||||||||||||||||
SOFR + 0.150% | 0.200(c) | 10/13/22 | 150,000 | 149,939,918 | ||||||||||||
US Federal Funds Effective Rate + 0.110% | 0.190(c) | 08/15/22 | 75,000 | 74,975,564 | ||||||||||||
MUFG Bank Ltd. | 0.300 | 10/25/22 | 30,000 | 29,895,424 | ||||||||||||
Skandinaviska Enskilda Banken AB | 0.230 | 05/03/22 | 21,000 | 20,996,344 | ||||||||||||
Toronto-Dominion Bank (The) | 0.200 | 07/28/22 | 115,000 | 114,787,023 | ||||||||||||
Toronto-Dominion Bank (The) | 0.210 | 07/18/22 | 250,000 | 249,601,227 | ||||||||||||
Westpac Banking Corp. (Australia), | ||||||||||||||||
SOFR + 0.130% | 0.180(c) | 09/02/22 | 55,000 | 54,986,605 | ||||||||||||
SOFR + 0.140% | 0.190(c) | 10/07/22 | 150,000 | 149,955,426 | ||||||||||||
|
| |||||||||||||||
TOTAL CERTIFICATES OF DEPOSIT | 1,414,908,827 | |||||||||||||||
|
| |||||||||||||||
COMMERCIAL PAPER 0.6% | ||||||||||||||||
HSBC Bank PLC, | ||||||||||||||||
144A | 0.271(n) | 02/03/22 | 50,000 | 49,999,542 | ||||||||||||
Royal Bank of Canada, | ||||||||||||||||
144A, 3 Month LIBOR + 0.050% | 0.182(c) | 08/01/22 | 100,000 | 100,034,228 | ||||||||||||
|
| |||||||||||||||
TOTAL COMMERCIAL PAPER | 150,033,770 | |||||||||||||||
|
| |||||||||||||||
CORPORATE BONDS 0.8% | ||||||||||||||||
Auto Manufacturers | ||||||||||||||||
Toyota Motor Credit Corp., | ||||||||||||||||
Sr. Unsec’d. Notes, GMTN, SOFR + 0.220% (Cap N/A, Floor 0.000%) | 0.260(c) | 03/28/22 | 100,000 | 99,995,582 | ||||||||||||
Sr. Unsec’d. Notes, MTN, SOFR + 0.280% | 0.320(c) | 12/14/22 | 87,000 | 87,016,393 | ||||||||||||
|
| |||||||||||||||
TOTAL CORPORATE BONDS | 187,011,975 | |||||||||||||||
|
| |||||||||||||||
See Notes to Financial Statements.
50
PGIM Core Ultra Short Bond Fund
Schedule of Investments (continued)
as of January 31, 2022
| Description | Interest Rate | Maturity Date | Principal Amount (000)# | Value | ||||||||||||
MUNICIPAL BONDS 0.2% | ||||||||||||||||
Arizona 0.1% | ||||||||||||||||
Maricopa County Industrial Development Authority, | ||||||||||||||||
Taxable, Revenue Bonds, Series 2021 B-2 | 0.070%(cc) | 01/01/61 | 16,500 | $ | 16,500,000 | |||||||||||
Texas 0.1% | ||||||||||||||||
Board of Regents of the University of Texas System, | ||||||||||||||||
Taxable, Revenue Bonds, Sub-Series G-2 | 0.070(cc) | 08/01/45 | 32,090 | 32,090,000 | ||||||||||||
|
| |||||||||||||||
TOTAL MUNICIPAL BONDS | 48,590,000 | |||||||||||||||
|
| |||||||||||||||
TOTAL LONG-TERM INVESTMENTS | 1,800,544,572 | |||||||||||||||
|
| |||||||||||||||
SHORT-TERM INVESTMENTS 92.9% | ||||||||||||||||
CERTIFICATES OF DEPOSIT 13.1% | ||||||||||||||||
Bank of America NA | 0.210 | 05/16/22 | 60,000 | 59,957,765 | ||||||||||||
Bank of Montreal (Canada), | ||||||||||||||||
3 Month LIBOR + 0.050% | 0.214(c) | 02/23/22 | 94,000 | 93,977,419 | ||||||||||||
SOFR + 0.150% | 0.200(c) | 09/28/22 | 72,500 | 72,475,855 | ||||||||||||
US Federal Funds Effective Rate + 0.120% | 0.200(c) | 09/22/22 | 50,000 | 49,983,997 | ||||||||||||
BNP Paribas SA (France), | ||||||||||||||||
SOFR + 0.130% | 0.180(c) | 05/05/22 | 65,000 | 65,009,501 | ||||||||||||
SOFR + 0.130% | 0.180(c) | 06/10/22 | 31,000 | 31,002,238 | ||||||||||||
Canadian Imperial Bank of Commerce, US Federal Funds Effective Rate + 0.100% | 0.180(c) | 06/08/22 | 150,000 | 149,984,037 | ||||||||||||
Citibank NA | 0.160 | 06/06/22 | 175,000 | 174,886,164 | ||||||||||||
Citibank NA | 0.180 | 02/03/22 | 29,000 | 29,000,314 | ||||||||||||
Credit Agricole Corporate & Investment Bank, | ||||||||||||||||
SOFR + 0.120% | 0.170(c) | 05/27/22 | 90,000 | 90,006,958 | ||||||||||||
US Federal Funds Effective Rate + 0.080% | 0.160(c) | 05/17/22 | 100,000 | 99,889,944 | ||||||||||||
US Federal Funds Effective Rate + 0.080% | 0.160(c) | 05/20/22 | 90,000 | 89,991,804 | ||||||||||||
Credit Agricole Corporate & Investment Bank | 0.230 | 03/09/22 | 35,000 | 35,004,459 | ||||||||||||
Credit Industriel et Commercial (France), | ||||||||||||||||
3 Month LIBOR + 0.010% | 0.211(c) | 03/11/22 | 245,000 | 245,028,476 | ||||||||||||
US Federal Funds Effective Rate + 0.090% | 0.170(c) | 05/03/22 | 190,000 | 189,990,259 | ||||||||||||
Mizuho Bank Ltd. | 0.220 | 02/09/22 | 97,000 | 97,003,562 | ||||||||||||
Mizuho Bank Ltd. | 0.250 | 03/18/22 | 35,000 | 35,005,274 | ||||||||||||
MUFG Bank Ltd. | 0.250 | 05/23/22 | 150,000 | 149,955,155 | ||||||||||||
Natixis SA, SOFR + 0.120% | 0.170(c) | 06/17/22 | 50,000 | 50,000,569 | ||||||||||||
See Notes to Financial Statements.
Prudential Investment Portfolios 2/PGIM Core Ultra Short Bond Fund 51
PGIM Core Ultra Short Bond Fund
Schedule of Investments (continued)
as of January 31, 2022
| Description | Interest Rate | Maturity Date | Principal Amount (000)# | Value | ||||||||
CERTIFICATES OF DEPOSIT (Continued) | ||||||||||||
Norinchukin Bank | 0.180% | 02/17/22 | 165,000 | $ | 165,007,243 | |||||||
Sumitomo Mitsui Banking Corp. | 0.170 | 02/01/22 | 17,000 | 17,000,047 | ||||||||
Sumitomo Mitsui Banking Corp. | 0.180 | 02/14/22 | 110,000 | 110,004,191 | ||||||||
Sumitomo Mitsui Banking Corp. | 0.200 | 04/25/22 | 35,000 | 34,997,051 | ||||||||
Sumitomo Mitsui Banking Corp. | 0.200 | 05/04/22 | 50,000 | 49,991,332 | ||||||||
Sumitomo Mitsui Banking Corp. | 0.210 | 03/18/22 | 74,000 | 74,007,935 | ||||||||
Sumitomo Mitsui Banking Corp. | 0.220 | 03/16/22 | 150,000 | 150,017,585 | ||||||||
Sumitomo Mitsui Trust Bank Ltd. | 0.150 | 02/01/22 | 42,000 | 42,000,093 | ||||||||
Sumitomo Mitsui Trust Bank Ltd. | 0.180 | 02/09/22 | 80,000 | 80,002,119 | ||||||||
Sumitomo Mitsui Trust Bank Ltd. | 0.200 | 03/16/22 | 60,000 | 60,005,567 | ||||||||
Svenska Handelsbanken AB (Sweden), | 0.205(c) | 05/31/22 | 145,000 | 145,003,758 | ||||||||
SOFR + 0.150% (Cap N/A, Floor 0.000%) | 0.200(c) | 05/09/22 | 4,000 | 4,000,784 | ||||||||
Toronto-Dominion Bank (The), SOFR + 0.140% | 0.190(c) | 08/02/22 | 193,000 | 192,968,630 | ||||||||
Westpac Banking Corp. (Australia), | ||||||||||||
SOFR + 0.130% | 0.180(c) | 09/01/22 | 39,500 | 39,490,425 | ||||||||
SOFR + 0.130% | 0.180(c) | 09/09/22 | 80,000 | 79,978,406 | ||||||||
|
| |||||||||||
TOTAL CERTIFICATES OF DEPOSIT | 3,052,628,916 | |||||||||||
|
| |||||||||||
COMMERCIAL PAPER 41.5% | ||||||||||||
Bank of America Securities, Inc., | 0.140(n) | 02/07/22 | 48,000 | 47,999,160 | ||||||||
144A | 0.160(n) | 03/21/22 | 73,600 | 73,585,875 | ||||||||
144A | 0.210(n) | 05/20/22 | 142,000 | 141,870,587 | ||||||||
144A, USOIS + 0.120% | 0.200(c) | 10/14/22 | 25,000 | 24,994,720 | ||||||||
144A, USOIS + 0.140% | 0.220(c) | 10/26/22 | 27,000 | 26,994,029 | ||||||||
Banner Health | 0.130(n) | 02/09/22 | 25,000 | 24,999,375 | ||||||||
Banner Health | 0.170(n) | 04/06/22 | 25,000 | 24,988,399 | ||||||||
Baptist Health South Florida, Inc. | 0.150(n) | 02/04/22 | 25,000 | 24,999,361 | ||||||||
Baptist Health South Florida, Inc. | 0.150(n) | 03/07/22 | 15,000 | 14,996,252 | ||||||||
BNP Paribas SA, | 0.160(n) | 03/07/22 | 25,000 | 24,998,347 | ||||||||
144A, 3 Month LIBOR + 0.030% | 0.162(c) | 02/02/22 | 135,000 | 135,000,000 | ||||||||
Caisse des Depots et Consignations, | 0.135(n) | 02/22/22 | 122,000 | 121,994,706 | ||||||||
144A | 0.140(n) | 02/28/22 | 100,000 | 99,993,933 | ||||||||
144A | 0.150(n) | 03/01/22 | 50,000 | 49,996,818 | ||||||||
CDP Financial, Inc., | 0.100(n) | 02/03/22 | 5,000 | 4,999,971 | ||||||||
See Notes to Financial Statements.
52
PGIM Core Ultra Short Bond Fund
Schedule of Investments (continued)
as of January 31, 2022
| Description | Interest Rate | Maturity Date | Principal Amount (000)# | Value | ||||||||
COMMERCIAL PAPER (Continued) | ||||||||||||
CDP Financial, Inc., (cont’d.) | 0.100%(n) | 02/04/22 | 35,000 | $ | 34,999,728 | |||||||
144A | 0.130(n) | 02/01/22 | 134,000 | 133,999,740 | ||||||||
144A | 0.145(n) | 03/21/22 | 93,000 | 92,984,684 | ||||||||
144A | 0.150(n) | 03/01/22 | 20,000 | 19,998,566 | ||||||||
144A | 0.150(n) | 03/22/22 | 88,000 | 87,984,967 | ||||||||
144A | 0.170(n) | 03/17/22 | 100,000 | 99,986,250 | ||||||||
144A | 0.200(n) | 03/10/22 | 49,000 | 48,994,776 | ||||||||
144A | 0.210(n) | 05/11/22 | 75,000 | 74,947,291 | ||||||||
Citigroup Global Markets Inc., | 0.180(n) | 04/01/22 | 8,000 | 7,997,867 | ||||||||
144A | 0.190(n) | 09/23/22 | 45,000 | 44,813,469 | ||||||||
144A | 0.210(n) | 07/12/22 | 97,000 | 96,802,702 | ||||||||
144A | 0.341(n) | 08/02/22 | 56,000 | 55,848,272 | ||||||||
144A | 0.351(n) | 07/07/22 | 100,000 | 99,812,472 | ||||||||
European Investment Bank | 0.200(n) | 05/23/22 | 273,000 | 272,834,379 | ||||||||
Federation Des Caisses Desjardins, | 0.135(n) | 02/08/22 | 178,000 | 177,997,586 | ||||||||
144A | 0.140(n) | 03/15/22 | 15,000 | 14,997,904 | ||||||||
144A | 0.145(n) | 02/22/22 | 100,000 | 99,995,111 | ||||||||
144A | 0.190(n) | 03/29/22 | 6,000 | 5,998,556 | ||||||||
144A | 0.200(n) | 03/08/22 | 100,000 | 99,989,200 | ||||||||
144A | 0.200(n) | 03/21/22 | 58,525 | 58,514,564 | ||||||||
144A | 0.210(n) | 03/18/22 | 138,000 | 137,978,311 | ||||||||
FMS Wertmanagement, | 0.135(n) | 02/02/22 | 10,250 | 10,249,954 | ||||||||
144A | 0.135(n) | 02/03/22 | 100,000 | 99,999,333 | ||||||||
144A | 0.145(n) | 02/09/22 | 120,000 | 119,997,540 | ||||||||
144A | 0.145(n) | 02/10/22 | 100,000 | 99,997,667 | ||||||||
144A | 0.145(n) | 02/15/22 | 98,200 | 98,196,317 | ||||||||
Goldman Sachs International, | 0.150(n) | 02/01/22 | 130,000 | 129,999,711 | ||||||||
144A | 0.230(n) | 03/01/22 | 250,000 | 249,976,640 | ||||||||
144A | 0.230(n) | 03/07/22 | 50,000 | 49,993,827 | ||||||||
144A | 0.233(n) | 03/03/22 | 99,500 | 99,489,633 | ||||||||
144A | 0.250(n) | 04/01/22 | 99,000 | 98,970,300 | ||||||||
144A | 0.251(n) | 09/23/22 | 45,000 | 44,804,656 | ||||||||
144A | 0.251(n) | 09/26/22 | 65,000 | 64,710,367 | ||||||||
HSBC Bank PLC, | 0.180(n) | 02/02/22 | 30,000 | 29,999,817 | ||||||||
Hydro-Quebec, | 0.110(n) | 03/15/22 | 21,000 | 20,997,567 | ||||||||
See Notes to Financial Statements.
Prudential Investment Portfolios 2/PGIM Core Ultra Short Bond Fund 53
PGIM Core Ultra Short Bond Fund
Schedule of Investments (continued)
as of January 31, 2022
| Description | Interest Rate | Maturity Date | Principal Amount (000)# | Value | ||||||||
COMMERCIAL PAPER (Continued) | ||||||||||||
Hydro-Quebec, (cont’d.) | 0.120%(n) | 03/16/22 | 50,000 | $ | 49,993,950 | |||||||
144A | 0.120(n) | 03/17/22 | 83,000 | 82,989,625 | ||||||||
144A | 0.120(n) | 03/18/22 | 57,000 | 56,992,498 | ||||||||
Indiana University Health, Inc. Obligated Group | 0.120 | 02/17/22 | 10,000 | 9,999,907 | ||||||||
John Deere Ltd., | 0.130(n) | 02/10/22 | 50,000 | 49,999,167 | ||||||||
JPMorgan Securities LLC, | 0.150(n) | 03/04/22 | 20,000 | 19,997,280 | ||||||||
144A | 0.170(n) | 04/12/22 | 75,000 | 74,964,648 | ||||||||
144A | 0.200(n) | 07/14/22 | 62,000 | 61,859,907 | ||||||||
144A | 0.200(n) | 07/27/22 | 5,000 | 4,986,353 | ||||||||
144A | 0.220 | 10/04/22 | 50,000 | 49,842,664 | ||||||||
144A | 0.231(n) | 04/05/22 | 91,000 | 90,964,247 | ||||||||
144A, SOFR + 0.120% | 0.160(c) | 06/15/22 | 95,000 | 94,998,219 | ||||||||
144A, SOFR + 0.140% | 0.180(c) | 09/01/22 | 30,000 | 29,987,408 | ||||||||
144A, SOFR + 0.140% | 0.190(c) | 08/08/22 | 75,000 | 74,981,900 | ||||||||
144A, SOFR + 0.140% | 0.190(c) | 08/11/22 | 76,500 | 76,480,430 | ||||||||
144A, SOFR Index + 0.120% | 0.170(c) | 05/17/22 | 200,000 | 200,011,184 | ||||||||
JPMorgan Securities LLC | 0.170(n) | 03/28/22 | 60,000 | 59,981,426 | ||||||||
KFW, | 0.110(n) | 03/17/22 | 135,000 | 134,984,812 | ||||||||
144A | 0.120(n) | 02/10/22 | 16,000 | 15,999,733 | ||||||||
LVMH Moet Hennessy Louis Vuitton SE, | 0.120(n) | 02/02/22 | 50,000 | 49,999,834 | ||||||||
144A | 0.130(n) | 03/17/22 | 35,000 | 34,994,313 | ||||||||
Michigan State University Board of Trustee | 0.140 | 03/11/22 | 13,470 | 13,469,693 | ||||||||
Mitsubishi International Corp., | 0.120(n) | 02/04/22 | 38,000 | 37,999,704 | ||||||||
144A | 0.120(n) | 02/08/22 | 40,000 | 39,999,378 | ||||||||
144A | 0.150(n) | 02/22/22 | 106,000 | 105,995,077 | ||||||||
144A | 0.150(n) | 02/23/22 | 55,000 | 54,997,295 | ||||||||
144A | 0.160(n) | 02/01/22 | 150,000 | 149,999,709 | ||||||||
Mitsubishi UFJ Trust & Banking Corp., | 0.160(n) | 02/15/22 | 63,000 | 62,997,979 | ||||||||
144A | 0.160(n) | 02/22/22 | 75,000 | 74,996,196 | ||||||||
National Australia Bank Ltd., | 0.175(c) | 02/11/22 | 30,000 | 30,000,764 | ||||||||
144A, USOIS + 0.060% | 0.140(c) | 03/23/22 | 144,000 | 143,998,037 | ||||||||
National Securities Clearing Corp., | 0.100(n) | 02/08/22 | 67,000 | 66,998,957 | ||||||||
144A | 0.110(n) | 02/09/22 | 114,000 | 113,998,005 | ||||||||
See Notes to Financial Statements.
54
PGIM Core Ultra Short Bond Fund
Schedule of Investments (continued)
as of January 31, 2022
| Description | Interest Rate | Maturity Date | Principal Amount (000)# | Value | ||||||||||||
COMMERCIAL PAPER (Continued) | ||||||||||||||||
National Securities Clearing Corp., (cont’d.) | 0.110%(n) | 02/14/22 | 150,000 | $ | 149,995,917 | |||||||||||
144A | 0.120(n) | 02/11/22 | 145,000 | 144,996,898 | ||||||||||||
144A | 0.120(n) | 02/16/22 | 90,000 | 89,997,160 | ||||||||||||
144A | 0.120(n) | 02/17/22 | 39,000 | 38,998,656 | ||||||||||||
Nordea Bank Abp, | 0.150(n) | 02/18/22 | 85,000 | 84,996,812 | ||||||||||||
OMERS Finance Trust, | 0.200(n) | 03/29/22 | 30,000 | 29,992,780 | ||||||||||||
Ontario Teachers’ Finance Trust, | 0.200(n) | 04/27/22 | 75,000 | 74,968,645 | ||||||||||||
144A | 0.210(n) | 05/05/22 | 74,000 | 73,964,641 | ||||||||||||
Port Authority of New York & New Jersey | 0.220 | 02/10/22 | 10,000 | 10,000,082 | ||||||||||||
Port Authority of New York & New Jersey | 0.230 | 03/08/22 | 5,325 | 5,324,842 | ||||||||||||
Province of Alberta, | 0.130(n) | 02/09/22 | 55,000 | 54,999,313 | ||||||||||||
144A | 0.130(n) | 02/10/22 | 24,000 | 23,999,667 | ||||||||||||
144A | 0.140(n) | 02/02/22 | 105,000 | 104,999,708 | ||||||||||||
144A | 0.145(n) | 03/01/22 | 50,000 | 49,996,859 | ||||||||||||
144A | 0.150(n) | 02/07/22 | 50,000 | 49,999,514 | ||||||||||||
144A | 0.180(n) | 02/16/22 | 22,500 | 22,499,480 | ||||||||||||
144A | 0.190(n) | 04/13/22 | 50,000 | 49,984,400 | ||||||||||||
144A | 0.200(n) | 04/19/22 | 99,000 | 98,964,822 | ||||||||||||
144A | 0.240(n) | 05/16/22 | 100,000 | 99,944,583 | ||||||||||||
Province of British Columbia | 0.100(n) | 02/09/22 | 45,000 | 44,999,438 | ||||||||||||
Province of British Columbia | 0.120(n) | 02/17/22 | 15,600 | 15,599,602 | ||||||||||||
Province of British Columbia | 0.130(n) | 02/18/22 | 16,000 | 15,999,552 | ||||||||||||
Province of British Columbia | 0.130(n) | 02/23/22 | 62,000 | 61,997,385 | ||||||||||||
Province of British Columbia | 0.140(n) | 02/28/22 | 31,500 | 31,498,138 | ||||||||||||
Province of British Columbia | 0.140(n) | 03/24/22 | 5,000 | 4,999,076 | ||||||||||||
Province of British Columbia | 0.160(n) | 03/22/22 | 76,700 | 76,687,216 | ||||||||||||
PSP Capital, Inc., | 0.120(n) | 02/01/22 | 70,000 | 69,999,864 | ||||||||||||
144A | 0.120(n) | 02/03/22 | 100,000 | 99,999,417 | ||||||||||||
144A | 0.120(n) | 02/10/22 | 100,000 | 99,998,056 | ||||||||||||
144A | 0.120(n) | 03/16/22 | 37,000 | 36,995,071 | ||||||||||||
144A | 0.120(n) | 03/17/22 | 20,000 | 19,997,250 | ||||||||||||
144A | 0.150(n) | 02/24/22 | 75,000 | 74,995,900 | ||||||||||||
144A | 0.190(n) | 05/04/22 | 100,000 | 99,938,517 | ||||||||||||
144A | 0.200(n) | 05/09/22 | 65,000 | 64,955,587 | ||||||||||||
Queensland Treasury Corp. | 0.150(n) | 03/18/22 | 94,000 | 93,987,629 | ||||||||||||
See Notes to Financial Statements.
Prudential Investment Portfolios 2/PGIM Core Ultra Short Bond Fund 55
PGIM Core Ultra Short Bond Fund
Schedule of Investments (continued)
as of January 31, 2022
| Description | Interest Rate | Maturity Date | Principal Amount (000)# | Value | ||||||||
COMMERCIAL PAPER (Continued) | ||||||||||||
Royal Bank of Canada, | 0.260%(c) | 03/25/22 | 47,500 | $ | 47,506,786 | |||||||
144A, USOIS + 0.110% | 0.190(c) | 07/13/22 | 125,000 | 124,977,606 | ||||||||
Sumitomo Mitsui Trust Bank Ltd., | 0.160(n) | 02/09/22 | 42,000 | 41,999,234 | ||||||||
TotalEnergies Capital Canada Ltd., | 0.125(n) | 02/22/22 | 157,900 | 157,891,412 | ||||||||
144A | 0.147(n) | 02/28/22 | 420,000 | 419,968,315 | ||||||||
Toyota Finance Australia Ltd. | 0.240(n) | 05/17/22 | 51,000 | 50,942,636 | ||||||||
Toyota Industries Commercial Finance, Inc., | 0.140(n) | 02/04/22 | 45,000 | 44,999,600 | ||||||||
Toyota Motor Finance Netherlands BV | 0.160(n) | 02/10/22 | 100,000 | 99,997,222 | ||||||||
UBS AG, | 0.251(n) | 07/12/22 | 178,000 | 177,649,162 | ||||||||
144A, SOFR + 0.170% | 0.210(c) | 08/18/22 | 25,000 | 25,000,004 | ||||||||
144A, SOFR + 0.170% | 0.220(c) | 09/21/22 | 32,000 | 31,992,136 | ||||||||
144A, SOFR + 0.190% | 0.240(c) | 06/15/22 | 50,000 | 50,003,503 | ||||||||
Unilever Finance Netherlands BV, | 0.150(n) | 03/07/22 | 15,000 | 14,998,585 | ||||||||
144A | 0.150(n) | 03/08/22 | 25,000 | 24,997,550 | ||||||||
144A | 0.150(n) | 03/09/22 | 25,000 | 24,997,456 | ||||||||
144A | 0.240(n) | 04/11/22 | 60,000 | 59,979,817 | ||||||||
144A | 0.240(n) | 04/12/22 | 40,000 | 39,986,194 | ||||||||
University of Texas System (The) | 0.110 | 02/11/22 | 6,500 | 6,500,040 | ||||||||
University of Texas System (The) | 0.110 | 02/24/22 | 15,000 | 14,999,801 | ||||||||
University of Texas System (The) | 0.150 | 02/14/22 | 12,500 | 12,500,340 | ||||||||
Yale University | 0.120(n) | 03/16/22 | 10,000 | 9,998,497 | ||||||||
|
| |||||||||||
TOTAL COMMERCIAL PAPER | 9,700,889,929 | |||||||||||
|
| |||||||||||
CORPORATE BONDS 0.7% | ||||||||||||
Auto Manufacturers 0.3% | ||||||||||||
Toyota Motor Credit Corp., | ||||||||||||
Sr. Unsec’d. Notes, MTN, SOFR + 0.150% | 0.190(c) | 08/15/22 | 18,000 | 17,991,121 | ||||||||
Sr. Unsec’d. Notes, MTN, 3 Month LIBOR + 0.150% | 0.306(c) | 02/14/22 | 57,000 | 57,001,260 | ||||||||
|
| |||||||||||
| 74,992,381 | ||||||||||||
See Notes to Financial Statements.
56
PGIM Core Ultra Short Bond Fund
Schedule of Investments (continued)
as of January 31, 2022
| Description | Interest Rate | Maturity Date | Principal Amount (000)# | Value | ||||||||||||
CORPORATE BONDS (Continued) | ||||||||||||||||
Banks 0.3% | ||||||||||||||||
BPCE SA (France), | ||||||||||||||||
Sr. Unsec’d. Notes, 144A, SOFR + 0.440% | 0.489%(c) | 02/17/22 | 65,000 | $ | 65,009,750 | |||||||||||
Oil & Gas 0.1% | ||||||||||||||||
Chevron Corp., | ||||||||||||||||
Sr. Unsec’d. Notes, 3 Month LIBOR + 0.480% | 0.655%(c) | 03/03/22 | 23,000 | 23,007,115 | ||||||||||||
|
| |||||||||||||||
TOTAL CORPORATE BONDS | 163,009,246 | |||||||||||||||
|
| |||||||||||||||
REPURCHASE AGREEMENTS 20.5% | ||||||||||||||||
Amherst Pierpont Securities LLC, | ||||||||||||||||
0.055%, dated 01/25/22, due 02/01/22 in the amount of $125,001,337 collateralized by FHLMC (coupon rates 2.000%-3.500%, maturity dates 01/01/37-02/01/52) and FNMA (coupon rates 3.000%-4.500%, maturity dates 09/01/29-08/01/50), with the aggregate value, including accrued interest, of $127,501,364 | 125,000 | 125,000,000 | ||||||||||||||
0.055%, dated 01/26/22, due 02/02/22 in the amount of $125,001,337 collateralized by FFCSB (coupon rates 1.550%-1.940%, maturity dates 03/30/27-05/22/29), FHLMC (coupon rates 3.000%-4.500%, maturity dates 01/01/27-07/01/51), FNMA (coupon rates 2.000%- 7.250%, maturity dates 10/01/27-01/01/52) and GNMA (coupon rate 2.940%, maturity date 03/15/60), with the aggregate value, including accrued interest, of $127,501,364 | 125,000 | 125,000,000 | ||||||||||||||
See Notes to Financial Statements.
Prudential Investment Portfolios 2/PGIM Core Ultra Short Bond Fund 57
PGIM Core Ultra Short Bond Fund
Schedule of Investments (continued)
as of January 31, 2022
| Description | Principal Amount (000)# | Value | ||||||
REPURCHASE AGREEMENTS (Continued) | ||||||||
Amherst Pierpont Securities LLC, (cont’d.) | ||||||||
0.050%, dated 01/31/22, due 02/01/22 in the amount of $500,000,694 collateralized by FHLB (coupon rate 2.400%, maturity date 01/28/30), FHLMC (coupon rates 1.855%-4.500%, maturity dates 02/01/34-02/01/52), FNMA (coupon rates 1.568%-7.250%, maturity dates 05/15/30-02/01/52), GNMA (coupon rates 1.868%-3.000%, maturity dates 01/20/52-08/20/71) and TVA (coupon rate 5.250%, maturity date 09/15/39), with the aggregate value, including accrued interest, of $510,000,708 | 500,000 | $ | 500,000,000 | |||||
Canadian Imperial Bank of Commerce, | ||||||||
0.055%, dated 11/04/21, due 02/02/22 in the amount of $212,029,150 collateralized by U.S. Treasury Securities (coupon rates 0.000%-4.625%, maturity dates 07/14/22-11/15/50), with the aggregate value, including accrued interest, of $216,269,443 | 212,000 | 212,000,000 | ||||||
0.055%, dated 12/23/21, due 02/23/22 in the amount of $285,026,996 collateralized by FHLMC (coupon rates 2.050%-2.700%, maturity dates 08/01/23-10/01/38), FNMA (coupon rates 2.000%-4.500%, maturity dates 09/01/24-02/01/52) and GNMA (coupon rates 2.000%-3.000%, maturity dates 10/20/50-05/20/51), with the aggregate value, including accrued interest, of $290,717,765 | 285,000 | 285,000,000 | ||||||
0.060%, dated 01/24/22, due 03/17/22 in the amount of $125,010,833 collateralized by FHLMC (coupon rate 2.050%, maturity date 10/01/38) and FNMA (coupon rates 2.000%-6.000%, maturity dates 10/01/27-01/01/52), with the aggregate value, including accrued interest, of $127,501,700 | 125,000 | 125,000,000 | ||||||
See Notes to Financial Statements.
58
PGIM Core Ultra Short Bond Fund
Schedule of Investments (continued)
as of January 31, 2022
| Description | Principal Amount (000)# | Value | ||||||
REPURCHASE AGREEMENTS (Continued) | ||||||||
Cantor Fitzgerald & Co., | ||||||||
0.050%, dated 01/31/22, due 02/01/22 in the amount of $500,000,694 collateralized by FFCSB (coupon rate 3.000%, maturity date 07/15/23), FHLMC (coupon rates 2.000%-5.875%, maturity dates 12/01/29-02/01/52), FNMA (coupon rates 1.500%-8.500%, maturity dates 10/01/22-02/01/57), GNMA (coupon rates 1.500%-4.930%, maturity dates 01/20/37-08/15/63), TVA (coupon rates 0.000%-5.250%, maturity dates 03/15/22-09/15/65) and U.S. Treasury Securities (coupon rates 0.000%-2.375%, maturity dates 07/07/22-02/15/28), with the aggregate value, including accrued interest, of $510,000,708 | 500,000 | $ | 500,000,000 | |||||
Credit Agricole Corporate & Investment Bank, | ||||||||
0.050%, dated 01/31/22, due 02/01/22 in the amount of $193,654,269 collateralized by FHLMC (coupon rate 3.000%, maturity date 10/01/49) and FNMA (coupon rates 2.000%-6.000%, maturity dates 02/01/34-01/01/52), with the aggregate value, including accrued interest, of $197,527,080 | 193,654 | 193,654,000 | ||||||
Goldman Sachs & Co., | ||||||||
0.055%, dated 01/25/22, due 02/01/22 in the amount of $100,001,069 collateralized by GNMA (coupon rates 3.500%-4.000%, maturity dates 03/20/34-09/20/47), with the aggregate value, including accrued interest, of $102,000,935 | 100,000 | 100,000,000 | ||||||
ING Financial Markets LLC, | ||||||||
0.065%, dated 11/24/21, due 02/17/22 in the amount of $150,023,021 collateralized by FHLMC (coupon rates 1.500%-5.000%, maturity dates 11/01/29-10/01/51), FNMA (coupon rates 1.500%-5.500%, maturity dates 07/01/28-05/01/58) and GNMA (coupon rate 3.000%, maturity date 12/20/51), with the aggregate value, including accrued interest, of $153,000,001 | 150,000 | 150,000,000 | ||||||
See Notes to Financial Statements.
Prudential Investment Portfolios 2/PGIM Core Ultra Short Bond Fund 59
PGIM Core Ultra Short Bond Fund
Schedule of Investments (continued)
as of January 31, 2022
| Description | Principal Amount (000)# | Value | ||||||
REPURCHASE AGREEMENTS (Continued) | ||||||||
ING Financial Markets LLC, (cont’d.) | ||||||||
0.070%, dated 12/08/21, due 02/16/22 in the amount of $300,040,833 collateralized by FHLMC (coupon rates 1.385%-5.500%, maturity dates 09/01/29-11/01/51), FNMA (coupon rates 1.500%-4.500%, maturity dates 07/01/28-02/01/57) and GNMA (coupon rate 2.500%, maturity date 06/20/51), with the aggregate value, including accrued interest, of $306,000,000 | 300,000 | $ | 300,000,000 | |||||
0.060%, dated 01/14/22, due 02/15/22 in the amount of $120,006,400 collateralized by FHLMC (coupon rates 1.902%-5.000%, maturity dates 11/01/29-05/01/51), FNMA (coupon rates 1.500%-4.000%, maturity dates 07/01/28-01/01/57) and GNMA (coupon rate 3.000%, maturity date 12/20/51), with the aggregate value, including accrued interest, of $122,400,001 | 120,000 | 120,000,000 | ||||||
Nomura Securities International, Inc., | ||||||||
0.050%, dated 01/31/22, due 02/01/22 in the amount of $925,001,285 collateralized by FFCSB (coupon rate 0.125%, maturity date 04/13/23), FHLMC (coupon rates 1.500%-5.000%, maturity dates 08/01/35-01/01/52), FNMA (coupon rates 1.500%-4.500%, maturity dates 04/01/35-01/01/52), GNMA (coupon rates 2.100%-5.000%, maturity dates 10/15/41-04/20/68), TVA (coupon rate 0.000%, maturity date 03/15/35) and U.S. Treasury Securities (coupon rates 0.000%-2.625%, maturity dates 04/30/22-11/15/47), with the aggregate value, including accrued interest, of $943,501,421 | 925,000 | 925,000,000 | ||||||
See Notes to Financial Statements.
60
PGIM Core Ultra Short Bond Fund
Schedule of Investments (continued)
as of January 31, 2022
| Description | Interest Rate | Maturity Date | Principal Amount (000)# | Value | ||||||||||||
REPURCHASE AGREEMENTS (Continued) | ||||||||||||||||
RBC Dominion Securities, Inc., | ||||||||||||||||
0.055%, dated 01/05/22, due 02/07/22 in the amount of $285,014,369 collateralized by FHLMC (coupon rate 3.000%, maturity date 12/01/50), FNMA (coupon rates 3.000%-3.500%, maturity dates 02/01/48-01/01/50), GNMA (coupon rates 2.000%-4.500%, maturity dates 10/15/40-12/20/51) and U.S. Treasury Securities (coupon rates 0.000%-6.000%, maturity dates 03/31/22-02/15/50), with the aggregate value, including accrued interest, of $290,700,000 | 285,000 | $ | 285,000,000 | |||||||||||||
0.050%, dated 01/31/22, due 02/01/22 in the amount of $265,000,368 collateralized by FHLMC (coupon rate 3.000%, maturity date 01/01/50), GNMA (coupon rates 2.000%-5.000%, maturity dates 06/15/39-06/20/51) and U.S. Treasury Securities (coupon rates 0.000%-6.000%, maturity dates 04/05/22-08/15/49), with the aggregate value, including accrued interest, of $270,300,011 | 265,000 | 265,000,000 | ||||||||||||||
Santander Bank NA, | ||||||||||||||||
0.055%, dated 01/31/22, due 02/01/22 in the amount of $570,000,871 collateralized by FNMA (coupon rates 2.000%-4.500%, maturity dates 12/01/40-12/01/51), with the aggregate value, including accrued interest, of $581,400,889 | 570,000 | 570,000,000 | ||||||||||||||
|
| |||||||||||||||
TOTAL REPURCHASE AGREEMENTS | 4,780,654,000 | |||||||||||||||
|
| |||||||||||||||
SOVEREIGN BOND 0.1% | ||||||||||||||||
Export Development Canada (Canada), | ||||||||||||||||
Gov’t. Gtd. Notes, 144A, EMTN | 0.295% | 06/29/22 | 25,000 | 24,966,778 | ||||||||||||
|
| |||||||||||||||
U.S. GOVERNMENT AGENCY OBLIGATION 0.5% | ||||||||||||||||
Federal Home Loan Bank | 0.060 | 03/29/22 | 124,000 | 123,946,983 | ||||||||||||
|
| |||||||||||||||
U.S. TREASURY OBLIGATIONS(n) 16.5% | ||||||||||||||||
U.S. Cash Management Bills | 0.090 | 04/19/22 | 105,000 | 104,964,516 | ||||||||||||
U.S. Treasury Bills | 0.056 | 03/17/22 | 271,000 | 270,989,482 | ||||||||||||
See Notes to Financial Statements.
Prudential Investment Portfolios 2/PGIM Core Ultra Short Bond Fund 61
PGIM Core Ultra Short Bond Fund
Schedule of Investments (continued)
as of January 31, 2022
| Description | Interest Rate | Maturity Date | Principal Amount (000)# | Value | ||||||||
U.S. TREASURY OBLIGATIONS(n) (Continued) | ||||||||||||
U.S. Treasury Bills | 0.063% | 03/24/22 | 1,788,000 | $ | 1,787,803,695 | |||||||
U.S. Treasury Bills | 0.070 | 03/22/22 | 1,008,000 | 1,007,900,531 | ||||||||
U.S. Treasury Bills | 0.082 | 03/31/22 | 318,000 | 317,946,204 | ||||||||
U.S. Treasury Bills | 0.084 | 05/26/22 | 214,000 | 213,820,418 | ||||||||
U.S. Treasury Bills | 0.086 | 04/07/22 | 145,000 | 144,963,675 | ||||||||
|
| |||||||||||
TOTAL U.S. TREASURY OBLIGATIONS | 3,848,388,521 | |||||||||||
|
| |||||||||||
TOTAL SHORT-TERM INVESTMENTS | 21,694,484,373 | |||||||||||
|
| |||||||||||
TOTAL INVESTMENTS 100.6% | 23,495,028,945 | |||||||||||
Liabilities in excess of other assets (0.6)% | (132,484,766 | ) | ||||||||||
|
| |||||||||||
NET ASSETS 100.0% | $ | 23,362,544,179 | ||||||||||
|
| |||||||||||
See the Glossary for a list of the abbreviation(s) used in the annual report.
| # | Principal amount is shown in U.S. dollars unless otherwise stated. |
| (c) | Variable rate instrument. The interest rate shown reflects the rate in effect at January 31, 2022. |
| (cc) | Variable rate instrument. The rate shown is based on the latest available information as of January 31, 2022. Certain variable rate securities are not based on a published reference rate and spread but are determined by the issuer or agent and are based on current market conditions. These securities do not indicate a reference rate and spread in their description. |
| (n) | Rate shown reflects yield to maturity at purchased date. |
Fair Value Measurements:
Various inputs are used in determining the value of the Fund’s investments. These inputs are summarized in the three broad levels listed below.
Level 1—unadjusted quoted prices generally in active markets for identical securities.
Level 2—quoted prices for similar securities, interest rates and yield curves, prepayment speeds, foreign currency exchange rates and other observable inputs.
Level 3—unobservable inputs for securities valued in accordance with Board approved fair valuation procedures.
See Notes to Financial Statements.
62
PGIM Core Ultra Short Bond Fund
Schedule of Investments (continued)
as of January 31, 2022
The following is a summary of the inputs used as of January 31, 2022 in valuing such portfolio securities:
Level 1 | Level 2 | Level 3 | |||||||||||||
Investments in Securities | |||||||||||||||
Assets | |||||||||||||||
Long-Term Investments | |||||||||||||||
Certificates of Deposit | $— | $ 1,414,908,827 | $— | ||||||||||||
Commercial Paper | — | 150,033,770 | — | ||||||||||||
Corporate Bonds | — | 187,011,975 | — | ||||||||||||
Municipal Bonds | — | 48,590,000 | — | ||||||||||||
Short-Term Investments | |||||||||||||||
Certificates of Deposit | — | 3,052,628,916 | — | ||||||||||||
Commercial Paper | — | 9,700,889,929 | — | ||||||||||||
Corporate Bonds | — | 163,009,246 | — | ||||||||||||
Repurchase Agreements | — | 4,780,654,000 | — | ||||||||||||
Sovereign Bond | — | 24,966,778 | — | ||||||||||||
U.S. Government Agency Obligation | — | 123,946,983 | — | ||||||||||||
U.S. Treasury Obligations | — | 3,848,388,521 | — | ||||||||||||
|
| ||||||||||||||
Total | $— | $23,495,028,945 | $— | ||||||||||||
|
|
|
|
|
|
|
| ||||||||
Industry Classification:
The industry classification of investments and liabilities in excess of other assets shown as a percentage of net assets as of January 31, 2022 were as follows (unaudited):
Commercial Paper | 42.1 | % | ||
Repurchase Agreements | 20.5 | |||
Certificates of Deposit | 19.2 | |||
U.S. Treasury Obligations | 16.5 | |||
Corporate Bonds | 1.5 | |||
U.S. Government Agency Obligation | 0.5 | |||
Municipal Bonds | 0.2 |
Sovereign Bond | 0.1 | % | ||
|
| |||
| 100.6 | ||||
Liabilities in excess of other assets | (0.6 | ) | ||
|
| |||
| 100.0 | % | |||
|
| |||
Financial Instruments/Transactions—Summary of Offsetting and Netting Arrangements:
The Fund entered into financial instruments/transactions during the reporting period that are either offset in accordance with current requirements or are subject to enforceable master netting arrangements or similar agreements that permit offsetting. The information about offsetting and related netting arrangements for financial instruments/transactions where the legal right to set-off exists is presented in the summary below.
See Notes to Financial Statements.
Prudential Investment Portfolios 2/PGIM Core Ultra Short Bond Fund 63
PGIM Core Ultra Short Bond Fund
Schedule of Investments (continued)
as of January 31, 2022
Offsetting of financial instrument/transaction assets and liabilities:
| Gross Market Value of | |||||||||||||||||
| Recognized | Collateral | Net | |||||||||||||||
Description | Counterparty | Assets/(Liabilities) | Pledged/(Received)(1) | Amount | |||||||||||||
Repurchase Agreements | Amherst Pierpont Securities LLC | $ 750,000,000 | $(750,000,000) | $— | |||||||||||||
Repurchase Agreements | Canadian Imperial Bank of Commerce | 622,000,000 | (622,000,000 | ) | — | ||||||||||||
Repurchase Agreements | Cantor Fitzgerald & Co. Credit Agricole | 500,000,000 | (500,000,000 | ) | — | ||||||||||||
Repurchase Agreements | Corporate & Investment Bank | 193,654,000 | (193,654,000 | ) | — | ||||||||||||
Repurchase Agreements | Goldman Sachs & Co. | 100,000,000 | (100,000,000 | ) | — | ||||||||||||
Repurchase Agreements | ING Financial Markets LLC | 570,000,000 | (570,000,000 | ) | — | ||||||||||||
Repurchase Agreements | Nomura Securities International, Inc. | 925,000,000 | (925,000,000 | ) | — | ||||||||||||
Repurchase Agreements | RBC Dominion Securities, Inc. | 550,000,000 | (550,000,000 | ) | — | ||||||||||||
Repurchase Agreements | Santander Bank NA | 570,000,000 | (570,000,000 | ) | — | ||||||||||||
|
| ||||||||||||||||
| $ 4,780,654,000 | |||||||||||||||||
|
| ||||||||||||||||
| (1) | Collateral amount disclosed by the Fund is limited to the market value of financial instruments/transactions. |
See Notes to Financial Statements.
64
PGIM Core Ultra Short Bond Fund
Statement of Assets & Liabilities
as of January 31, 2022
Assets | ||||
Investments at value: | ||||
Unaffiliated investments (cost $18,717,070,737) | $ | 18,714,374,945 | ||
Repurchase Agreements (cost $4,780,654,000) | 4,780,654,000 | |||
Cash | 12,377 | |||
Interest receivable | 2,645,362 | |||
Prepaid expenses | 26,750 | |||
|
| |||
Total Assets | 23,497,713,434 | |||
|
| |||
Liabilities | ||||
Payable for investments purchased | 134,981,850 | |||
Management fee payable | 87,455 | |||
Accrued expenses and other liabilities | 82,483 | |||
Affiliated transfer agent fee payable | 16,667 | |||
Trustees’ fees payable | 800 | |||
|
| |||
Total Liabilities | 135,169,255 | |||
|
| |||
Net Assets | $ | 23,362,544,179 | ||
|
| |||
Net assets were comprised of: | ||||
Paid-in capital | $ | 23,365,239,971 | ||
Total distributable earnings (loss) | (2,695,792 | ) | ||
|
| |||
Net assets, January 31, 2022 | $ | 23,362,544,179 | ||
|
| |||
Net asset value and redemption price per share ($23,362,544,179 ÷ 23,364,175,912 shares of beneficial interest issued and outstanding) | $ | 1.00 | ||
|
| |||
See Notes to Financial Statements.
Prudential Investment Portfolios 2/PGIM Core Ultra Short Bond Fund 65
PGIM Core Ultra Short Bond Fund
Statement of Operations
Year Ended January 31, 2022
Net Investment Income (Loss) | |||||
Interest income | $ | 39,851,305 | |||
|
| ||||
Expenses | |||||
Management fee | 1,090,704 | ||||
Custodian and accounting fees | 135,630 | ||||
Transfer agent’s fees and expenses (including affiliated expense of $100,000) | 101,581 | ||||
Audit fee | 26,908 | ||||
Legal fees and expenses | 20,891 | ||||
Trustees’ fees | 9,501 | ||||
Shareholders’ reports | 7,098 | ||||
Miscellaneous | 69,614 | ||||
|
| ||||
Total expenses | 1,461,927 | ||||
|
| ||||
Net investment income (loss) | 38,389,378 | ||||
|
| ||||
Realized And Unrealized Gain (Loss) On Investments | |||||
Net realized gain (loss) on investment transactions | 241,320 | ||||
Net change in unrealized appreciation (depreciation) on investments | (6,026,082 | ) | |||
|
| ||||
Net gain (loss) on investment transactions | (5,784,762 | ) | |||
|
| ||||
Net Increase (Decrease) In Net Assets Resulting From Operations | $ | 32,604,616 | |||
|
| ||||
See Notes to Financial Statements.
66
PGIM Core Ultra Short Bond Fund
Statements of Changes in Net Assets
| Year Ended January 31, | ||||||||
| 2022 | 2021 | |||||||
Increase (Decrease) in Net Assets | ||||||||
Operations | ||||||||
Net investment income (loss) | $ | 38,389,378 | $ | 168,869,892 | ||||
Net realized gain (loss) on investment transactions | 241,320 | 3,628,289 | ||||||
Net change in unrealized appreciation (depreciation) on investments | (6,026,082 | ) | (1,017,386 | ) | ||||
|
|
|
| |||||
Net increase (decrease) in net assets resulting from operations | 32,604,616 | 171,480,795 | ||||||
|
|
|
| |||||
Dividends and Distributions | ||||||||
Distributions from distributable earnings | (39,976,773 | ) | (172,499,588 | ) | ||||
|
|
|
| |||||
Fund share transactions | ||||||||
Net proceeds from shares sold | 185,299,447,230 | 272,436,300,863 | ||||||
Net asset value of shares issued in reinvestment of dividends and distributions | 39,660,742 | 169,729,470 | ||||||
Cost of shares purchased | (192,934,824,533 | ) | (261,854,715,517 | ) | ||||
|
|
|
| |||||
Net increase (decrease) in net assets from Fund share transactions | (7,595,716,561 | ) | 10,751,314,816 | |||||
|
|
|
| |||||
Total increase (decrease) | (7,603,088,718 | ) | 10,750,296,023 | |||||
Net Assets: | ||||||||
Beginning of year | 30,965,632,897 | 20,215,336,874 | ||||||
|
|
|
| |||||
End of year | $ | 23,362,544,179 | $ | 30,965,632,897 | ||||
|
|
|
| |||||
See Notes to Financial Statements.
Prudential Investment Portfolios 2/PGIM Core Ultra Short Bond Fund 67
PGIM Core Ultra Short Bond Fund
Financial Highlights
| ||||||||||||||||||||
Year Ended January 31, | ||||||||||||||||||||
| 2022 | 2021 | 2020 | 2019 | 2018 | ||||||||||||||||
| Per Share Operating Performance(a): | ||||||||||||||||||||
| Net Asset Value, Beginning of Year | $1.00 | $1.00 | $1.00 | $1.00 | $1.00 | |||||||||||||||
| Income (loss) from investment operations: | ||||||||||||||||||||
| Net investment income (loss) | - | (b) | 0.01 | 0.02 | 0.02 | 0.01 | ||||||||||||||
| Net realized and unrealized gain (loss) on investment transactions | - | (b) | - | (b) | - | (b) | - | (b) | - | (b) | ||||||||||
| Total from investment operations | - | (b) | 0.01 | 0.02 | 0.02 | 0.01 | ||||||||||||||
| Less Dividends and Distributions: | ||||||||||||||||||||
| Dividends from net investment income | - | (b) | (0.01 | ) | (0.02 | ) | (0.02 | ) | (0.01 | ) | ||||||||||
| Net asset value, end of year | $1.00 | $1.00 | $1.00 | $1.00 | $1.00 | |||||||||||||||
| Total Return(c): | 0.13 | % | 0.65 | % | 2.38 | % | 2.17 | % | 1.18 | % | ||||||||||
| Ratios/Supplemental Data: | ||||||||||||||||||||
| Net assets, end of year (000) | $23,362,544 | $30,965,633 | $20,215,337 | $20,975,373 | $22,510,708 | |||||||||||||||
| Average net assets (000) | $31,545,754 | $28,757,423 | $20,937,015 | $21,560,540 | $23,440,098 | |||||||||||||||
| Ratios to average net assets: | ||||||||||||||||||||
| Expenses after waivers and/or expense reimbursement | - | %(b) | 0.01 | % | 0.01 | % | 0.01 | % | 0.01 | % | ||||||||||
| Expenses before waivers and/or expense reimbursement | - | %(b) | 0.01 | % | 0.01 | % | 0.01 | % | 0.01 | % | ||||||||||
| Net investment income (loss) | 0.12 | % | 0.59 | % | 2.35 | % | 2.14 | % | 1.17 | % | ||||||||||
| Portfolio turnover rate(d) | 72 | % | 114 | % | 61 | % | 94 | % | 111 | % | ||||||||||
| (a) | Calculated based on average shares outstanding during the year. |
| (b) | Amount rounds to zero. |
| (c) | Total return is calculated assuming a purchase of a share on the first day and a sale on the last day of each year reported and includes reinvestment of dividends and distributions, if any. Total returns may reflect adjustments to conform to GAAP. |
| (d) | The Portfolio turnover rate calculation, if any includes floating rate daily demand notes. |
See Notes to Financial Statements.
68
PGIM Institutional Money Market Fund
Schedule of Investments
as of January 31, 2022
| Description | Interest Rate | Maturity Date | Principal Amount (000)# | Value | ||||||||
SHORT-TERM INVESTMENTS 100.7% | ||||||||||||
CERTIFICATES OF DEPOSIT 27.3% | ||||||||||||
Bank of America NA | 0.210% | 05/16/22 | 50,000 | $ | 49,964,804 | |||||||
Bank of America NA, | ||||||||||||
SOFR + 0.150% | 0.200(c) | 10/11/22 | 35,000 | 34,987,814 | ||||||||
Bank of Montreal, | 0.220(c) | 02/25/22 | 118,000 | 118,011,891 | ||||||||
US Federal Funds Effective Rate + 0.120% | 0.200(c) | 09/22/22 | 75,000 | 74,975,995 | ||||||||
Bank of Montreal | 0.200 | 07/20/22 | 60,000 | 59,932,981 | ||||||||
Bank of Montreal | 0.230 | 05/05/22 | 50,000 | 50,000,732 | ||||||||
Bank of Nova Scotia (Canada), | ||||||||||||
SOFR + 0.140% | 0.190(c) | 06/24/22 | 10,000 | 10,000,959 | ||||||||
SOFR + 0.150% | 0.200(c) | 08/19/22 | 50,000 | 49,992,505 | ||||||||
SOFR + 0.150% | 0.200(c) | 10/17/22 | 50,000 | 49,979,876 | ||||||||
SOFR + 0.150% | 0.200(c) | 10/20/22 | 20,000 | 19,991,712 | ||||||||
SOFR + 0.150% | 0.200(c) | 10/28/22 | 45,000 | 44,979,772 | ||||||||
SOFR + 0.160% | 0.210(c) | 07/08/22 | 25,000 | 25,003,508 | ||||||||
Bank of Nova Scotia (The) | 0.230 | 05/10/22 | 50,000 | 49,995,266 | ||||||||
BNP Paribas Fortis SA | 0.150 | 02/22/22 | 90,000 | 90,004,399 | ||||||||
BNP Paribas SA (France), | ||||||||||||
SOFR + 0.130% | 0.180(c) | 05/05/22 | 145,000 | 145,021,195 | ||||||||
SOFR + 0.130% | 0.180(c) | 06/10/22 | 17,000 | 17,001,227 | ||||||||
Canadian Imperial Bank of Commerce (Canada), | 0.205(c) | 03/03/22 | 75,000 | 75,003,378 | ||||||||
3 Month LIBOR + 0.040% | 0.194(c) | 05/12/22 | 100,000 | 100,010,522 | ||||||||
US Federal Funds Effective Rate + 0.100% | 0.180(c) | 06/08/22 | 45,000 | 44,995,211 | ||||||||
US Federal Funds Effective Rate + 0.110% | 0.190(c) | 08/15/22 | 75,000 | 74,975,563 | ||||||||
Citibank NA | 0.160 | 06/06/22 | 115,000 | 114,925,194 | ||||||||
Citibank NA | 0.180 | 02/03/22 | 70,000 | 70,000,758 | ||||||||
Cooperatieve Rabobank UA (Netherlands), | 0.246(c) | 07/06/22 | 25,000 | 25,006,901 | ||||||||
SOFR + 0.120% | 0.170(c) | 05/26/22 | 130,000 | 130,010,379 | ||||||||
SOFR + 0.120% | 0.170(c) | 07/27/22 | 170,000 | 169,976,610 | ||||||||
Credit Agricole Corporate & Investment Bank, | ||||||||||||
SOFR + 0.120% | 0.170(c) | 05/18/22 | 70,000 | 70,006,863 | ||||||||
SOFR + 0.120% | 0.170(c) | 05/27/22 | 56,000 | 56,004,329 | ||||||||
US Federal Funds Effective Rate + 0.080% | 0.160(c) | 05/20/22 | 56,000 | 55,994,900 | ||||||||
Credit Agricole Corporate & Investment Bank | 0.080 | 02/01/22 | 100,000 | 100,000,028 | ||||||||
Credit Agricole Corporate & Investment Bank | 0.230 | 03/09/22 | 50,000 | 50,006,369 | ||||||||
Credit Industriel et Commercial (France), | 0.211(c) | 03/11/22 | 149,000 | 149,017,318 | ||||||||
SOFR + 0.120% | 0.170(c) | 05/16/22 | 78,500 | 78,508,011 | ||||||||
US Federal Funds Effective Rate + 0.090% | 0.170(c) | 05/03/22 | 86,000 | 85,995,591 | ||||||||
See Notes to Financial Statements.
Prudential Investment Portfolios 2/PGIM Institutional Money Market Fund 69
PGIM Institutional Money Market Fund
Schedule of Investments (continued)
as of January 31, 2022
| Description | Interest Rate | Maturity Date | Principal Amount (000)# | Value | ||||||||
CERTIFICATES OF DEPOSIT (Continued) | ||||||||||||
Credit Suisse AG | 0.240% | 02/15/22 | 27,000 | $ | 27,001,268 | |||||||
Goldman Sachs Bank USA, | ||||||||||||
SOFR + 0.230% | 0.279(c) | 10/19/22 | 97,000 | 97,002,102 | ||||||||
Mitsubishi UFJ Trust & Banking Corp. | 0.160 | 02/18/22 | 75,000 | 75,002,098 | ||||||||
Mizuho Bank Ltd. | 0.220 | 02/09/22 | 44,000 | 44,001,616 | ||||||||
Mizuho Bank Ltd. | 0.250 | 03/18/22 | 47,500 | 47,507,158 | ||||||||
MUFG Bank Ltd. | 0.170 | 03/17/22 | 14,000 | 14,000,700 | ||||||||
MUFG Bank Ltd. | 0.300 | 10/25/22 | 50,000 | 49,825,707 | ||||||||
Norinchukin Bank | 0.140 | 02/10/22 | 7,000 | 7,000,126 | ||||||||
Norinchukin Bank | 0.150 | 03/14/22 | 68,000 | 68,002,220 | ||||||||
Royal Bank of Canada (Canada), | 0.174(c) | 02/11/22 | 20,000 | 20,000,150 | ||||||||
Skandinaviska Enskilda Banken AB | 0.230 | 05/03/22 | 25,000 | 24,995,648 | ||||||||
Sumitomo Mitsui Banking Corp. | 0.180 | 02/14/22 | 50,000 | 50,001,905 | ||||||||
Sumitomo Mitsui Banking Corp. | 0.200 | 05/04/22 | 30,000 | 29,994,799 | ||||||||
Sumitomo Mitsui Banking Corp. | 0.210 | 03/18/22 | 50,000 | 50,005,361 | ||||||||
Sumitomo Mitsui Banking Corp. | 0.220 | 03/16/22 | 50,000 | 50,005,861 | ||||||||
Sumitomo Mitsui Trust Bank Ltd. | 0.070 | 02/07/22 | 100,000 | 100,000,000 | ||||||||
Sumitomo Mitsui Trust Bank Ltd. | 0.080 | 02/02/22 | 27,000 | 27,000,015 | ||||||||
Sumitomo Mitsui Trust Bank Ltd. | 0.180 | 02/09/22 | 10,000 | 10,000,265 | ||||||||
Svenska Handelsbanken AB (Sweden), | 0.205(c) | 05/31/22 | 50,000 | 50,001,296 | ||||||||
SOFR + 0.150% (Cap N/A, Floor 0.000%) | 0.200(c) | 05/09/22 | 140,000 | 140,027,429 | ||||||||
Toronto-Dominion Bank (The), | ||||||||||||
SOFR + 0.140% | 0.190(c) | 08/02/22 | 82,000 | 81,986,672 | ||||||||
USOIS + 0.100% | 0.180(c) | 06/23/22 | 120,000 | 119,985,971 | ||||||||
Toronto-Dominion Bank (The) | 0.250 | 04/20/22 | 63,000 | 63,008,101 | ||||||||
Toronto-Dominion Bank (The) | 0.250 | 05/31/22 | 50,000 | 49,963,243 | ||||||||
Westpac Banking Corp. (Australia), | ||||||||||||
SOFR + 0.130% | 0.180(c) | 05/09/22 | 19,000 | 19,002,689 | ||||||||
SOFR + 0.130% | 0.180(c) | 09/01/22 | 25,000 | 24,993,940 | ||||||||
SOFR + 0.130% | 0.180(c) | 09/02/22 | 45,000 | 44,989,040 | ||||||||
SOFR + 0.130% | 0.180(c) | 09/06/22 | 75,000 | 74,980,485 | ||||||||
SOFR + 0.130% | 0.180(c) | 09/21/22 | 15,000 | 14,995,344 | ||||||||
SOFR + 0.130% | 0.180(c) | 09/22/22 | 15,000 | 14,995,324 | ||||||||
|
| |||||||||||
TOTAL CERTIFICATES OF DEPOSIT | 3,830,559,094 | |||||||||||
|
| |||||||||||
See Notes to Financial Statements.
70
PGIM Institutional Money Market Fund
Schedule of Investments (continued)
as of January 31, 2022
| Description | Interest Rate | Maturity Date | Principal Amount (000)# | Value | ||||||||
COMMERCIAL PAPER 35.9% | ||||||||||||
Bank of America Securities, Inc., | 0.190%(n) | 03/21/22 | 18,000 | $ | 17,996,545 | |||||||
144A | 0.330(n) | 05/20/22 | 87,000 | 86,920,712 | ||||||||
144A, USOIS + 0.120% | 0.200(c) | 10/14/22 | 70,000 | 69,985,217 | ||||||||
144A, USOIS + 0.140% | 0.220(c) | 10/26/22 | 60,000 | 59,986,732 | ||||||||
Bank of Montreal, | 0.220(n) | 04/13/22 | 45,450 | 45,433,274 | ||||||||
Bank of Nova Scotia, | 0.160(n) | 03/02/22 | 37,000 | 36,997,842 | ||||||||
Baptist Health South Florida, Inc. | 0.170(n) | 03/07/22 | 10,000 | 9,997,501 | ||||||||
BNG Bank NV, | 0.080(n) | 02/07/22 | 50,000 | 49,999,319 | ||||||||
BNP Paribas SA, | 0.070(n) | 02/04/22 | 17,500 | 17,499,883 | ||||||||
Caisse des Depots et Consignations, | 0.160(n) | 02/22/22 | 75,000 | 74,996,746 | ||||||||
144A | 0.170(n) | 03/01/22 | 35,000 | 34,997,773 | ||||||||
CDP Financial, Inc., | 0.110(n) | 02/01/22 | 15,000 | 14,999,971 | ||||||||
144A | 0.120(n) | 02/03/22 | 150,000 | 149,999,125 | ||||||||
144A | 0.120(n) | 02/04/22 | 30,000 | 29,999,767 | ||||||||
144A | 0.170(n) | 03/21/22 | 90,000 | 89,985,178 | ||||||||
144A | 0.180(n) | 03/17/22 | 30,000 | 29,995,875 | ||||||||
144A | 0.180(n) | 03/22/22 | 19,000 | 18,996,754 | ||||||||
144A | 0.260(n) | 05/11/22 | 25,000 | 24,982,431 | ||||||||
Citigroup Global Markets Inc., | 0.430(n) | 07/07/22 | 59,000 | 58,889,358 | ||||||||
144A | 0.430(n) | 07/12/22 | 60,000 | 59,877,960 | ||||||||
144A | 0.560(n) | 09/23/22 | 10,000 | 9,958,549 | ||||||||
Commonwealth Bank of Australia, | 0.160(c) | 07/12/22 | 145,000 | 144,976,522 | ||||||||
Credit Agricole Corporate & Investment Bank | 0.090(n) | 02/08/22 | 100,000 | 99,998,422 | ||||||||
European Investment Bank | 0.270(n) | 05/23/22 | 4,000 | 3,997,573 | ||||||||
Federation Des Caisses Desjardins, | 0.120(n) | 02/22/22 | 38,000 | 37,998,142 | ||||||||
144A | 0.160(n) | 03/15/22 | 68,000 | 67,990,497 | ||||||||
144A | 0.200(n) | 03/29/22 | 153,000 | 152,963,177 | ||||||||
FMS Wertmanagement, | 0.140(n) | 02/02/22 | 76,000 | 75,999,663 | ||||||||
144A | 0.150(n) | 02/10/22 | 41,000 | 40,999,043 | ||||||||
144A | 0.150(n) | 02/08/22 | 40,089 | 40,088,278 | ||||||||
144A | 0.160(n) | 02/15/22 | 100,000 | 99,996,250 | ||||||||
See Notes to Financial Statements.
Prudential Investment Portfolios 2/PGIM Institutional Money Market Fund 71
PGIM Institutional Money Market Fund
Schedule of Investments (continued)
as of January 31, 2022
| Description | Interest Rate | Maturity Date | Principal Amount (000)# | Value | ||||||||||||
COMMERCIAL PAPER (Continued) | ||||||||||||||||
Goldman Sachs International, | 0.110%(n) | 02/01/22 | 9,000 | $ | 8,999,980 | |||||||||||
144A | 0.160(n) | 03/03/22 | 50,000 | 49,994,790 | ||||||||||||
144A | 0.510(n) | 09/26/22 | 50,000 | 49,777,205 | ||||||||||||
HSBC Bank PLC, | 0.180(n) | 02/02/22 | 10,000 | 9,999,939 | ||||||||||||
Hydro-Quebec, | 0.110(n) | 03/15/22 | 20,000 | 19,997,683 | ||||||||||||
144A | 0.120(n) | 03/17/22 | 73,000 | 72,990,875 | ||||||||||||
144A | 0.130(n) | 03/16/22 | 35,000 | 34,995,765 | ||||||||||||
144A | 0.130(n) | 03/18/22 | 109,000 | 108,985,655 | ||||||||||||
Indiana University Health, Inc. Obligated Group | 0.120 | 02/17/22 | 5,000 | 4,999,954 | ||||||||||||
JPMorgan Securities LLC, | 0.190 | 07/05/22 | 45,000 | 44,951,643 | ||||||||||||
144A | 0.220 | 10/04/22 | 45,000 | 44,858,398 | ||||||||||||
144A | 0.250(n) | 04/12/22 | 40,000 | 39,981,146 | ||||||||||||
144A | 0.370(n) | 07/14/22 | 30,000 | 29,932,213 | ||||||||||||
144A | 0.380(n) | 07/27/22 | 5,000 | 4,986,353 | ||||||||||||
144A, SOFR + 0.140% | 0.180(c) | 09/01/22 | 20,000 | 19,991,605 | ||||||||||||
144A, SOFR + 0.140% | 0.190(c) | 08/08/22 | 25,000 | 24,993,967 | ||||||||||||
144A, SOFR + 0.140% | 0.190(c) | 08/11/22 | 23,000 | 22,994,116 | ||||||||||||
JPMorgan Securities LLC | 0.240(n) | 03/28/22 | 33,000 | 32,989,785 | ||||||||||||
KFW, | ||||||||||||||||
144A | 0.110(n) | 03/17/22 | 103,000 | 102,988,412 | ||||||||||||
LVMH Moet Hennessy Louis Vuitton SE, | 0.130(n) | 03/17/22 | 20,000 | 19,996,750 | ||||||||||||
Michigan State University Board of Trustee | 0.140 | 03/11/22 | 8,000 | 7,999,818 | ||||||||||||
Mitsubishi International Corp., | 0.150(n) | 02/22/22 | 25,000 | 24,998,839 | ||||||||||||
Mitsubishi UFJ Trust & Banking Corp., | 0.180(n) | 02/09/22 | 97,000 | 96,998,254 | ||||||||||||
144A | 0.190(n) | 02/22/22 | 60,000 | 59,996,957 | ||||||||||||
MUFG Bank Ltd. | 0.170(n) | 03/07/22 | 97,000 | 96,989,909 | ||||||||||||
National Australia Bank Ltd., 144A | 0.110(n) | 03/04/22 | 70,000 | 69,994,213 | ||||||||||||
144A, 1 Month LIBOR + 0.070% | 0.175(c) | 02/11/22 | 115,000 | 115,002,927 | ||||||||||||
144A, USOIS + 0.060% | 0.140(c) | 03/23/22 | 93,000 | 92,998,732 | ||||||||||||
National Securities Clearing Corp., | 0.140(n) | 02/08/22 | 75,000 | 74,998,833 | ||||||||||||
144A | 0.140(n) | 02/16/22 | 22,000 | 21,999,306 | ||||||||||||
144A | 0.140(n) | 02/17/22 | 30,000 | 29,998,966 | ||||||||||||
144A | 0.150(n) | 03/01/22 | 20,000 | 19,998,566 | ||||||||||||
See Notes to Financial Statements.
72
PGIM Institutional Money Market Fund
Schedule of Investments (continued)
as of January 31, 2022
| Description | Interest Rate | Maturity Date | Principal Amount (000)# | Value | ||||||||
COMMERCIAL PAPER (Continued) | ||||||||||||
National Securities Clearing Corp., (cont’d.) | 0.150%(n) | 03/02/22 | 110,000 | $ | 109,991,750 | |||||||
OMERS Finance Trust, | 0.180(n) | 03/29/22 | 20,000 | 19,995,187 | ||||||||
Ontario Teachers’ Finance Trust, | 0.240(n) | 04/27/22 | 19,000 | 18,992,057 | ||||||||
Port Authority of New York & New Jersey | 0.220 | 02/10/22 | 4,710 | 4,710,039 | ||||||||
Port Authority of New York & New Jersey | 0.230 | 03/08/22 | 10,000 | 9,999,703 | ||||||||
Province of Alberta, | 0.180(n) | 02/02/22 | 35,000 | 34,999,903 | ||||||||
144A | 0.200(n) | 02/07/22 | 43,000 | 42,999,582 | ||||||||
144A | 0.220(n) | 03/01/22 | 20,000 | 19,998,743 | ||||||||
144A | 0.280(n) | 04/13/22 | 30,000 | 29,990,640 | ||||||||
144A | 0.310(n) | 05/05/22 | 20,000 | 19,990,443 | ||||||||
144A | 0.320(n) | 05/18/22 | 39,000 | 38,977,860 | ||||||||
PSP Capital, Inc., | 0.070(n) | 02/01/22 | 30,000 | 29,999,942 | ||||||||
144A | 0.130(n) | 03/08/22 | 100,000 | 99,990,200 | ||||||||
144A | 0.140(n) | 03/16/22 | 61,000 | 60,991,874 | ||||||||
144A | 0.140(n) | 03/17/22 | 80,000 | 79,989,000 | ||||||||
144A | 0.160(n) | 03/22/22 | 100,000 | 99,982,917 | ||||||||
Royal Bank of Canada, | 0.182(c) | 08/01/22 | 50,000 | 50,017,114 | ||||||||
144A, SOFR + 0.150% | 0.190(c) | 10/06/22 | 100,000 | 99,965,589 | ||||||||
Skandinaviska Enskilda Banken AB, | 0.120(n) | 02/11/22 | 117,000 | 116,997,426 | ||||||||
Sumitomo Mitsui Trust Bank Ltd., | 0.170(n) | 02/03/22 | 50,000 | 49,999,708 | ||||||||
144A | 0.180(n) | 02/09/22 | 21,000 | 20,999,617 | ||||||||
Swedbank AB | 0.120(n) | 03/03/22 | 10,000 | 9,999,130 | ||||||||
Swedbank AB | 0.130(n) | 03/07/22 | 35,000 | 34,996,427 | ||||||||
TotalEnergies Capital Canada Ltd., | 0.150(n) | 02/22/22 | 127,000 | 126,993,092 | ||||||||
Toyota Credit Canada, Inc. | 0.160(n) | 03/21/22 | 50,000 | 49,981,557 | ||||||||
Toyota Motor Finance Netherlands BV | 0.100(n) | 02/10/22 | 60,000 | 59,998,333 | ||||||||
UBS AG, | 0.340(n) | 05/24/22 | 144,000 | 143,850,388 | ||||||||
144A, SOFR + 0.170% | 0.220(c) | 09/21/22 | 53,000 | 52,986,975 | ||||||||
144A, SOFR + 0.190% | 0.240(c) | 06/15/22 | 30,000 | 30,002,102 | ||||||||
144A, SOFR + 0.190% | 0.240(c) | 06/16/22 | 25,000 | 25,001,494 | ||||||||
See Notes to Financial Statements.
Prudential Investment Portfolios 2/PGIM Institutional Money Market Fund 73
PGIM Institutional Money Market Fund
Schedule of Investments (continued)
as of January 31, 2022
| Description | Interest Rate | Maturity Date | Principal Amount (000)# | Value | ||||||||||||
COMMERCIAL PAPER (Continued) | ||||||||||||||||
Unilever Finance Netherlands BV, | 0.270%(n) | 04/12/22 | 60,000 | $ | 59,979,292 | |||||||||||
University of Texas System (The) | 0.110 | 02/11/22 | 6,000 | 6,000,037 | ||||||||||||
University of Texas System (The) | 0.110 | 02/24/22 | 10,000 | 9,999,867 | ||||||||||||
Westpac Banking Corp., | ||||||||||||||||
144A, 3 Month LIBOR + 0.010% | 0.154(c) | 02/07/22 | 98,000 | 98,000,203 | ||||||||||||
144A, 3 Month LIBOR + 0.020% | 0.178(c) | 02/17/22 | 34,000 | 34,000,686 | ||||||||||||
Yale University | 0.120(n) | 03/16/22 | 6,605 | 6,604,007 | ||||||||||||
|
| |||||||||||||||
TOTAL COMMERCIAL PAPER | 5,026,858,517 | |||||||||||||||
|
| |||||||||||||||
CORPORATE BONDS 1.2% | ||||||||||||||||
Auto Manufacturers 0.6% | ||||||||||||||||
Toyota Motor Credit Corp., | ||||||||||||||||
Sr. Unsec’d. Notes, GMTN, SOFR + 0.220% (Cap N/A, Floor 0.000%) | 0.260(c) | 03/28/22 | 73,600 | 73,596,749 | ||||||||||||
|
| |||||||||||||||
Banks 0.5% | ||||||||||||||||
BPCE SA (France), | ||||||||||||||||
Sr. Unsec’d. Notes, 144A, SOFR + 0.440% | 0.489(c) | 02/17/22 | 70,235 | 70,245,535 | ||||||||||||
Swedbank AB (Sweden), | ||||||||||||||||
Sr. Unsec’d. Notes, 144A, 3 Month LIBOR + 0.700% | 0.898(c) | 03/14/22 | 2,200 | 2,201,606 | ||||||||||||
|
| |||||||||||||||
| 72,447,141 | ||||||||||||||||
Oil & Gas 0.1% | ||||||||||||||||
Chevron Corp., | ||||||||||||||||
Sr. Unsec’d. Notes, 3 Month LIBOR + 0.480% | 0.655(c) | 03/03/22 | 17,000 | 17,005,259 | ||||||||||||
|
| |||||||||||||||
TOTAL CORPORATE BONDS | 163,049,149 | |||||||||||||||
|
| |||||||||||||||
MUNICIPAL BONDS 0.3% | ||||||||||||||||
Arizona 0.1% | ||||||||||||||||
Maricopa County Industrial Development Authority, | ||||||||||||||||
Taxable, Revenue Bonds, Series 2021 B-2 | 0.070(cc) | 01/01/61 | 16,000 | 16,000,000 | ||||||||||||
|
| |||||||||||||||
Texas 0.2% | ||||||||||||||||
Board of Regents of the University of Texas System, | ||||||||||||||||
Taxable, Revenue Bonds, Sub-Series G-2 | 0.070(cc) | 08/01/45 | 26,500 | 26,500,000 | ||||||||||||
|
| |||||||||||||||
TOTAL MUNICIPAL BONDS | 42,500,000 | |||||||||||||||
|
| |||||||||||||||
See Notes to Financial Statements.
74
PGIM Institutional Money Market Fund
Schedule of Investments (continued)
as of January 31, 2022
| Description | Principal Amount (000)# | Value | ||||||||||||||
REPURCHASE AGREEMENTS 8.6% | ||||||||||||||||
Amherst Pierpont Securities LLC, | ||||||||||||||||
0.055%, dated 01/25/22, due 02/01/22 in the amount of $75,000,802 collateralized by FFCSB (coupon rates 1.120%-2.120%, maturity dates 03/15/29-02/05/30), FHLMC (coupon rates 2.500%-4.000%, maturity dates 02/01/31-07/01/47), FNMA (coupon rates 0.000%-7.125%, maturity dates 01/15/30-12/01/51) and GNMA (coupon rate 3.500%, maturity date 01/20/52), with the aggregate value, including accrued interest, of $76,500,818 | 75,000 | $ | 75,000,000 | |||||||||||||
0.055%, dated 01/26/22, due 02/02/22 in the amount of $75,000,802 collateralized by FFCSB (coupon rates 0.940%-2.040%, maturity dates 05/11/29-08/11/31), FHLMC (coupon rates 0.000%-4.000%, maturity dates 07/15/32-02/01/52), FNMA (coupon rates 0.000%-7.250 %, maturity dates 02/01/29-03/01/51), GNMA (coupon rates 2.040%-3.080%, maturity dates 06/15/42-11/15/59) and TVA (coupon rate 4.700%, maturity date 07/15/33), with the aggregate value, including accrued interest, of $76,500,818 | 75,000 | 75,000,000 | ||||||||||||||
CF Secured LLC, | ||||||||||||||||
0.050%, dated 01/31/22, due 02/01/22 in the amount of $900,001,250 collateralized by FHLMC (coupon rates 0.000%-6.000%, maturity dates 07/15/28-01/01/52), FNMA (coupon rates 2.000%-5.500%, maturity dates 09/01/28-02/01/52), GNMA (coupon rates 1.934%-4.690%, maturity dates 10/20/42-01/20/69) and U.S. Treasury Securities (coupon rates 0.000%-2.875%, maturity dates 02/22/22-08/15/51), with the aggregate value, including accrued interest, of $918,001,295 | 900,000 | 900,000,000 | ||||||||||||||
Credit Agricole Corporate & Investment Bank, | ||||||||||||||||
0.050%, dated 01/31/22, due 02/01/22 in the amount of $6,124,009 collateralized by ADBB (coupon rate 2.375%, maturity date 08/10/27), with the aggregate value, including accrued interest, of $6,246,696 | 6,124 | 6,124,000 | ||||||||||||||
Goldman Sachs & Co., | ||||||||||||||||
0.055%, dated 01/25/22, due 02/01/22 in the amount of $75,000,802 collateralized by and GNMA (coupon rates 2.500%-3.500%, maturity dates 09/15/42-01/20/52), with the aggregate value, including accrued interest, of $76,500,000 | 75,000 | 75,000,000 | ||||||||||||||
See Notes to Financial Statements.
Prudential Investment Portfolios 2/PGIM Institutional Money Market Fund 75
PGIM Institutional Money Market Fund
Schedule of Investments (continued)
as of January 31, 2022
| Description | Principal Amount (000)# | Value | ||||||||||||||
REPURCHASE AGREEMENTS (Continued) | ||||||||||||||||
ING Financial Markets LLC, | ||||||||||||||||
0.060%, dated 01/14/22, due 02/15/22 in the amount of $80,004,267 collateralized by FHLMC (coupon rates 1.902%-4.000%, maturity dates 07/01/36-10/01/51) and FNMA (coupon rates 1.500%-4.500%, maturity dates 06/01/27-01/01/57), with the aggregate value, including accrued interest, of $81,600,001 | 80,000 | $ | 80,000,000 | |||||||||||||
|
| |||||||||||||||
TOTAL REPURCHASE AGREEMENTS | 1,211,124,000 | |||||||||||||||
|
| |||||||||||||||
| Interest Rate | Maturity Date | |||||||||||||
TIME DEPOSITS 13.8% | ||||||||||||||
ABN AMRO Bank NV | 0.080% | 02/01/22 | 275,000 | 275,000,000 | ||||||||||
ABN AMRO Bank NV | 0.080 | 02/03/22 | 110,000 | 110,000,000 | ||||||||||
ABN AMRO Bank NV | 0.080 | 02/07/22 | 120,000 | 120,000,000 | ||||||||||
Australia & New Zealand Banking Group Ltd. | 0.070 | 02/01/22 | 250,000 | 250,000,000 | ||||||||||
Cooperatieve Rabobank UA | 0.060 | 02/01/22 | 240,000 | 240,000,000 | ||||||||||
Credit Agricole Corporate & Investment Bank | 0.070 | 02/01/22 | 140,000 | 140,000,000 | ||||||||||
Mizuho Bank Ltd. | 0.070 | 02/01/22 | 468,922 | 468,922,000 | ||||||||||
Toronto-Dominion Bank (The) | 0.060 | 02/01/22 | 160,000 | 160,000,000 | ||||||||||
Toronto-Dominion Bank (The) | 0.070 | 02/04/22 | 90,000 | 90,000,000 | ||||||||||
U.S. Bank NA | 0.050 | 02/01/22 | 75,875 | 75,875,000 | ||||||||||
|
| |||||||||||||
TOTAL TIME DEPOSITS | ||||||||||||||
(cost $1,929,797,000) | 1,929,797,000 | |||||||||||||
|
| |||||||||||||
U.S. GOVERNMENT AGENCY OBLIGATIONS 0.3% | ||||||||||||||
Federal Farm Credit Bank, SOFR + 0.070% (Cap N/A, Floor 0.000%) | 0.120(c) | 02/17/22 | 23,000 | 23,000,683 | ||||||||||
Federal Home Loan Bank, SOFR + 0.060% (Cap N/A, Floor 0.000%) | 0.110(c) | 02/11/22 | 22,000 | 22,000,342 | ||||||||||
|
| |||||||||||||
TOTAL U.S. GOVERNMENT AGENCY OBLIGATIONS | ||||||||||||||
(cost $45,000,000) | 45,001,025 | |||||||||||||
|
| |||||||||||||
U.S. TREASURY OBLIGATIONS(n) 13.3% | ||||||||||||||
U.S. Cash Management Bills | 0.090 | 04/19/22 | 50,000 | 49,983,103 | ||||||||||
U.S. Treasury Bills | 0.057 | 03/17/22 | 174,000 | 173,993,247 | ||||||||||
U.S. Treasury Bills | 0.063 | 03/24/22 | 913,000 | 912,899,762 | ||||||||||
U.S. Treasury Bills | 0.074 | 03/22/22 | 493,000 | 492,951,351 | ||||||||||
See Notes to Financial Statements.
76
PGIM Institutional Money Market Fund
Schedule of Investments (continued)
as of January 31, 2022
| Description | Interest Rate | Maturity Date | Principal Amount (000)# | Value | ||||||||
U.S. TREASURY OBLIGATIONS(n) (Continued) | ||||||||||||
U.S. Treasury Bills | 0.082% | 03/31/22 | 152,000 | $ | 151,974,286 | |||||||
U.S. Treasury Bills | 0.086 | 04/07/22 | 85,000 | 84,978,706 | ||||||||
|
| |||||||||||
TOTAL U.S. TREASURY OBLIGATIONS | ||||||||||||
(cost $1,866,814,303) | 1,866,780,455 | |||||||||||
|
| |||||||||||
TOTAL INVESTMENTS 100.7% | ||||||||||||
(cost $14,116,735,938) | 14,115,669,240 | |||||||||||
Liabilities in excess of other assets (0.7)% | (101,905,330 | ) | ||||||||||
|
| |||||||||||
NET ASSETS 100.0% | $ | 14,013,763,910 | ||||||||||
|
| |||||||||||
|
| |||||||||||
See the Glossary for a list of the abbreviation(s) used in the annual report.
| # | Principal amount is shown in U.S. dollars unless otherwise stated. |
| (c) | Variable rate instrument. The interest rate shown reflects the rate in effect at January 31, 2022. |
| (cc) | Variable rate instrument. The rate shown is based on the latest available information as of January 31, 2022. Certain variable rate securities are not based on a published reference rate and spread but are determined by the issuer or agent and are based on current market conditions. These securities do not indicate a reference rate and spread in their description. |
| (n) | Rate shown reflects yield to maturity at purchased date. |
Fair Value Measurements:
Various inputs are used in determining the value of the Fund’s investments. These inputs are summarized in the three broad levels listed below.
Level 1—unadjusted quoted prices generally in active markets for identical securities.
Level 2—quoted prices for similar securities, interest rates and yield curves, prepayment speeds, foreign currency exchange rates and other observable inputs.
Level 3—unobservable inputs for securities valued in accordance with Board approved fair valuation procedures.
The following is a summary of the inputs used as of January 31, 2022 in valuing such portfolio securities:
Level 1 | Level 2 | Level 3 | |||||||||||||
Investments in Securities | |||||||||||||||
Assets | |||||||||||||||
Short-Term Investments | |||||||||||||||
Certificates of Deposit | $— | $ 3,830,559,094 | $— | ||||||||||||
Commercial Paper | — | 5,026,858,517 | — | ||||||||||||
Corporate Bonds | — | 163,049,149 | — | ||||||||||||
Municipal Bonds | — | 42,500,000 | — | ||||||||||||
Repurchase Agreements | — | 1,211,124,000 | — | ||||||||||||
See Notes to Financial Statements.
Prudential Investment Portfolios 2/PGIM Institutional Money Market Fund 77
PGIM Institutional Money Market Fund
Schedule of Investments (continued)
as of January 31, 2022
Level 1 | Level 2 | Level 3 | |||||||||||||
Investments in Securities (continued) | |||||||||||||||
Assets (continued) | |||||||||||||||
Short-Term Investments (continued) | |||||||||||||||
Time Deposits | $— | $ | 1,929,797,000 | $ | — | ||||||||||
U.S. Government Agency Obligations | — | 45,001,025 | — | ||||||||||||
U.S. Treasury Obligations | — | 1,866,780,455 | — | ||||||||||||
|
|
|
| ||||||||||||
Total | $— | $ | 14,115,669,240 | $ | — | ||||||||||
|
|
|
|
|
| ||||||||||
Industry Classification:
The industry classification of investments and liabilities in excess of other assets shown as a percentage of net assets as of January 31, 2022 were as follows (unaudited):
Commercial Paper | 35.9 | % | ||
Certificates of Deposit | 27.3 | |||
Time Deposits | 13.8 | |||
U.S. Treasury Obligations | 13.3 | |||
Repurchase Agreements | 8.6 | |||
Corporate Bonds | 1.2 | |||
U.S. Government Agency Obligations | 0.3 |
Municipal Bonds | 0.3 | % | ||
|
| |||
| 100.7 | ||||
Liabilities in excess of other assets | (0.7 | ) | ||
|
| |||
| 100.0 | % | |||
|
| |||
Financial Instruments/Transactions—Summary of Offsetting and Netting Arrangements:
The Fund entered into financial instruments/transactions during the reporting period that are either offset in accordance with current requirements or are subject to enforceable master netting arrangements or similar agreements that permit offsetting. The information about offsetting and related netting arrangements for financial instruments/transactions where the legal right to set-off exists is presented in the summary below.
Offsetting of financial instrument/transaction assets and liabilities:
Description | Counterparty | Gross Market Value of Recognized Assets/(Liabilities) | Collateral Pledged/(Received)(1) | Net Amount | |||||||||||||
Repurchase Agreements | Amherst Pierpont Securities LLC | $ | 150,000,000 | $ | (150,000,000 | ) | $ | — | |||||||||
Repurchase Agreements | CF Secured LLC Credit Agricole | 900,000,000 | (900,000,000 | ) | — | ||||||||||||
Repurchase Agreements | Corporate & Investment Bank | 6,124,000 | (6,124,000 | ) | — | ||||||||||||
Repurchase Agreements | Goldman Sachs & Co. | 75,000,000 | (75,000,000 | ) | — | ||||||||||||
See Notes to Financial Statements.
78
PGIM Institutional Money Market Fund
Schedule of Investments (continued)
as of January 31, 2022
Description | Counterparty | Gross Market Value of Recognized Assets/(Liabilities) | Collateral Pledged/(Received)(1) | Net Amount | |||||||||||||
Repurchase Agreements | ING Financial Markets LLC | $ | 80,000,000 | $ (80,000,000 | ) | $ | — | ||||||||||
|
| ||||||||||||||||
| $ | 1,211,124,000 | ||||||||||||||||
|
| ||||||||||||||||
| (1) | Collateral amount disclosed by the Fund is limited to the market value of financial instruments/transactions. |
See Notes to Financial Statements.
Prudential Investment Portfolios 2/PGIM Institutional Money Market Fund 79
PGIM Institutional Money Market Fund
Statement of Assets & Liabilities
as of January 31, 2022
Assets |
| |||
Investments at value: | ||||
Unaffiliated investments (cost $14,116,735,938) | $ | 14,115,669,240 | ||
Cash | 143 | |||
Interest receivable | 1,957,069 | |||
Prepaid expenses | 11,370 | |||
|
| |||
Total Assets | 14,117,637,822 | |||
|
| |||
Liabilities | ||||
Payable for investments purchased | 102,986,152 | |||
Management fee payable | 779,785 | |||
Accrued expenses and other liabilities | 90,508 | |||
Affiliated transfer agent fee payable | 16,667 | |||
Trustees’ fees payable | 800 | |||
|
| |||
Total Liabilities | 103,873,912 | |||
|
| |||
Net Assets | $ | 14,013,763,910 | ||
|
| |||
| ||||
Net assets were comprised of: | ||||
Paid-in capital | $ | 14,014,840,294 | ||
Total distributable earnings (loss) | (1,076,384 | ) | ||
|
| |||
Net assets, January 31, 2022 | $ | 14,013,763,910 | ||
|
| |||
Net asset value, offering price and redemption price per share ($14,013,763,910 ÷ 14,023,698,065 shares of beneficial interest issued and outstanding) | $ | 0.9993 | ||
|
| |||
See Notes to Financial Statements.
80
PGIM Institutional Money Market Fund
Statement of Operations
Year Ended January 31, 2022
Net Investment Income (Loss) |
| |||
Interest income | $ | 25,953,058 | ||
|
| |||
Expenses | ||||
Management fee | 24,793,447 | |||
Custodian and accounting fees | 177,515 | |||
Transfer agent’s fees and expenses (including affiliated expense of $100,000) | 175,468 | |||
Audit fee | 27,108 | |||
Legal fees and expenses | 20,814 | |||
Trustees’ fees | 9,501 | |||
Shareholders’ reports | 5,964 | |||
Miscellaneous | 36,012 | |||
|
| |||
Total expenses | 25,245,829 | |||
Less: Fee waiver and/or expense reimbursement | (13,675,552 | ) | ||
|
| |||
Net expenses | 11,570,277 | |||
|
| |||
Net investment income (loss) | 14,382,781 | |||
|
| |||
Realized And Unrealized Gain (Loss) On Investments | ||||
Net realized gain (loss) on investment transactions | 136,324 | |||
Net change in unrealized appreciation (depreciation) on investments | (4,737,945 | ) | ||
|
| |||
Net gain (loss) on investment transactions | (4,601,621 | ) | ||
|
| |||
Net Increase (Decrease) In Net Assets Resulting From Operations | $ | 9,781,160 | ||
|
| |||
See Notes to Financial Statements.
Prudential Investment Portfolios 2/PGIM Institutional Money Market Fund 81
PGIM Institutional Money Market Fund
Statements of Changes in Net Assets
Year Ended January 31, | ||||||||
| 2022 | 2021 | |||||||
Increase (Decrease) in Net Assets | ||||||||
Operations | ||||||||
Net investment income (loss) | $ | 14,382,781 | $ | 122,553,581 | ||||
Net realized gain (loss) on investment transactions | 136,324 | 587,861 | ||||||
Net change in unrealized appreciation (depreciation) on investments | (4,737,945 | ) | 15,973 | |||||
|
|
|
| |||||
Net increase (decrease) in net assets resulting from operations | 9,781,160 | 123,157,415 | ||||||
|
|
|
| |||||
Dividends and Distributions | ||||||||
Distributions from distributable earnings | (14,519,107 | ) | (121,546,781 | ) | ||||
|
|
|
| |||||
Fund share transactions | ||||||||
Net proceeds from shares sold | 124,119,430,412 | 164,488,986,884 | ||||||
Net asset value of shares issued in reinvestment of dividends and distributions | 14,508,120 | 121,488,485 | ||||||
Cost of shares purchased | (130,236,780,094 | ) | (160,983,076,991 | ) | ||||
|
|
|
| |||||
Net increase (decrease) in net assets from Fund share transactions | (6,102,841,562 | ) | 3,627,398,378 | |||||
|
|
|
| |||||
Total increase (decrease) | (6,107,579,509 | ) | 3,629,009,012 | |||||
Net Assets: | ||||||||
Beginning of year | 20,121,343,419 | 16,492,334,407 | ||||||
|
|
|
| |||||
End of year | $ | 14,013,763,910 | $ | 20,121,343,419 | ||||
|
|
|
| |||||
See Notes to Financial Statements.
82
PGIM Institutional Money Market Fund
Financial Highlights
| Year Ended January 31, | ||||||||||||||||||||
| 2022 | 2021 | 2020 | 2019 | 2018 | |||||||||||||||
Per Share Operating Performance(a): | ||||||||||||||||||||
Net Asset Value, Beginning of Year | $0.9996 | $1.0001 | $1.0002 | $1.0001 | $1.0002 | |||||||||||||||
Income (loss) from investment operations: | ||||||||||||||||||||
Net investment income (loss) | 0.0009 | 0.0054 | 0.0230 | 0.0214 | 0.0114 | |||||||||||||||
Net realized and unrealized gain (loss) on investment transactions | (0.0003 | ) | -(b | ) | (0.0001 | ) | - | (0.0001 | ) | |||||||||||
Total from investment operations | 0.0006 | 0.0054 | 0.0229 | 0.0214 | 0.0113 | |||||||||||||||
Less Dividends and Distributions: | ||||||||||||||||||||
Dividends from net investment income | (0.0009 | ) | (0.0059 | ) | (0.0230 | ) | (0.0213 | ) | (0.0114 | ) | ||||||||||
Net asset value, end of year | $0.9993 | $0.9996 | $1.0001 | $1.0002 | $1.0001 | |||||||||||||||
Total Return(c): | 0.06 | % | 0.54 | % | 2.33 | % | 2.16 | % | 1.14 | % | ||||||||||
| ||||||||||||||||||||
Ratios/Supplemental Data: | ||||||||||||||||||||
Net assets, end of year (000) | $14,013,764 | $20,121,343 | $16,492,334 | $15,867,116 | $13,215,520 | |||||||||||||||
Average net assets (000) | $16,528,965 | $22,809,258 | $18,124,501 | $15,329,904 | $14,177,712 | |||||||||||||||
Ratios to average net assets: | ||||||||||||||||||||
Expenses after waivers and/or expense reimbursement | 0.07 | % | 0.07 | % | 0.07 | % | 0.07 | % | 0.07 | % | ||||||||||
Expenses before waivers and/or expense reimbursement | 0.15 | % | 0.15 | % | 0.16 | % | 0.16 | % | 0.16 | % | ||||||||||
Net investment income (loss) | 0.09 | % | 0.54 | % | 2.30 | % | 2.14 | % | 1.14 | % | ||||||||||
| (a) | Calculated based on average shares outstanding during the year. |
| (b) | Amount rounds to zero. |
| (c) | Total return is calculated assuming a purchase of a share on the first day and a sale on the last day of each year reported and includes reinvestment of dividends and distributions, if any. Total returns may reflect adjustments to conform to GAAP. |
See Notes to Financial Statements.
Prudential Investment Portfolios 2/PGIM Institutional Money Market Fund 83
Notes to Financial Statements
| 1. | Organization |
Prudential Investment Portfolios 2 (the “Registered Investment Company” or “RIC”) is registered under the Investment Company Act of 1940, as amended (“1940 Act”), as an open-end management investment company. The RIC is organized as a Delaware Statutory Trust.
These financial statements relate only to the following series of the RIC: the PGIM Core Short-Term Bond Fund, the PGIM Core Ultra Short Bond Fund and the PGIM Institutional Money Market Fund (each, a “Fund” and collectively, the “Funds”). Shares of the Funds are not registered under the Securities Act of 1933, as amended. The Funds are classified as diversified funds for purposes of the 1940 Act.
The investment objective of each of the PGIM Core Ultra Short Bond Fund and PGIM Institutional Money Market Fund is current income consistent with the preservation of capital and the maintenance of liquidity.
The investment objective of the PGIM Core Short-Term Bond Fund is income consistent with relative stability of principal.
| 2. | Accounting Policies |
The Funds follow the investment company accounting and reporting guidance of the Financial Accounting Standards Board (“FASB”) Accounting Standard Codification (“ASC”) Topic 946 Financial Services — Investment Companies. The following is a summary of significant accounting policies followed by the Funds in the preparation of its financial statements. The policies conform to U.S. generally accepted accounting principles (“GAAP”). The Funds consistently follow such policies in the preparation of their financial statements.
Securities Valuation: Each Fund holds securities and other assets and liabilities that are fair valued as of the close of each day (generally, 4:00 PM Eastern time) the New York Stock Exchange (“NYSE”) is open for trading. As described in further detail below, the Funds’ investments are valued daily based on a number of factors, including the type of investment and whether market quotations are readily available. The RIC’s Board of Trustees (the “Board”) has adopted valuation procedures for security valuation under which fair valuation responsibilities have been delegated to PGIM Investment’s LLC (“PGIM Investments” or the “Manager”). Pursuant to the Board’s delegation, the Manager has established a Valuation Committee responsible for supervising the fair valuation of portfolio securities and other assets and liabilities. The valuation procedures permit a Fund to utilize independent pricing vendor services, quotations from market makers, and alternative valuation methods when market quotations are either not readily available or not deemed representative of fair value.
84
Fair value is the price that would be received to sell an asset or paid to transfer a liability in an orderly transaction between market participants on the measurement date. A record of the Valuation Committee’s actions is subject to the Board’s review at its first quarterly meeting following the quarter in which such actions take place.
For the fiscal reporting year-end, securities and other assets and liabilities were fair valued at the close of the last U.S. business day. Trading in certain foreign securities may occur when the NYSE is closed (including weekends and holidays). Because such foreign securities trade in markets that are open on weekends and U.S. holidays, the values of some of the Funds’ foreign investments may change on days when investors cannot purchase or redeem Fund shares.
Various inputs determine how the Funds’ investments are valued, all of which are categorized according to the three broad levels (Level 1, 2, or 3) detailed in the Schedule of Investments and referred to herein as the “fair value hierarchy” in accordance with FASB ASC Topic 820 - Fair Value Measurement.
Investments in open-end funds (other than exchange-traded funds) are valued at their net asset values as of the close of the NYSE on the date of valuation. These securities are classified as Level 1 in the fair value hierarchy since they may be purchased or sold at their net asset values on the date of valuation.
Fixed income securities traded in the OTC market are generally classified as Level 2 in the fair value hierarchy. Such fixed income securities are typically valued using the market approach which generally involves obtaining data from an approved independent third-party vendor source. The Funds utilize the market approach as the primary method to value securities when market prices of identical or comparable instruments are available. The third-party vendors’ valuation techniques used to derive the evaluated bid price are based on evaluating observable inputs, including but not limited to, yield curves, yield spreads, credit ratings, deal terms, tranche level attributes, default rates, cash flows, prepayment speeds, broker/dealer quotations and reported trades. Certain Level 3 securities are also valued using the market approach when obtaining a single broker quote or when utilizing transaction prices for identical securities that have been used in excess of five business days. During the reporting period, there were no changes to report with respect to the valuation approach and/or valuation techniques discussed above.
OTC and centrally cleared derivative instruments are generally classified as Level 2 in the fair value hierarchy. Such derivative instruments are typically valued using the market approach and/or income approach which generally involves obtaining data from an approved independent third-party vendor source. The Funds utilize the market approach when quoted prices in broker-dealer markets are available but also includes consideration of alternative valuation approaches, including the income approach. In the absence of reliable market quotations, the income approach is typically utilized for purposes of valuing derivatives such as interest rate swaps based on a discounted cash flow analysis whereby the value of the instrument is equal to the present value of its future cash inflows or outflows.
85
Notes to Financial Statements (continued)
Such analysis includes projecting future cash flows and determining the discount rate (including the present value factors that affect the discount rate) used to discount the future cash flows. In addition, the third-party vendors’ valuation techniques used to derive the evaluated derivative price is based on evaluating observable inputs, including but not limited to, underlying asset prices, indices, spreads, interest rates and exchange rates. Certain derivatives may be classified as Level 3 when valued using the market approach by obtaining a single broker quote or when utilizing unobservable inputs in the income approach. During the reporting period, there were no changes to report with respect to the valuation approach and/or valuation techniques discussed above.
Securities and other assets that cannot be priced according to the methods described above are valued based on pricing methodologies approved by the Board. In the event that unobservable inputs are used when determining such valuations, the securities will be classified as Level 3 in the fair value hierarchy. Altering one or more unobservable inputs may result in a significant change to a Level 3 security’s fair value measurement.
When determining the fair value of securities, some of the factors influencing the valuation include: the nature of any restrictions on disposition of the securities; assessment of the general liquidity of the securities; the issuer’s financial condition and the markets in which it does business; the cost of the investment; the size of the holding and the capitalization of the issuer; the prices of any recent transactions or bids/offers for such securities or any comparable securities; any available analyst media or other reports or information deemed reliable by the Manager regarding the issuer or the markets or industry in which it operates. Using fair value to price securities may result in a value that is different from a security’s most recent closing price and from the price used by other unaffiliated mutual funds to calculate their net asset values.
Swap Agreements: The PGIM Core Short-Term Bond Fund entered into certain types of swap agreements detailed in the disclosures below. A swap agreement is an agreement to exchange the return generated by one instrument for the return generated by another instrument. Swap agreements are negotiated in the OTC market and may be executed either directly with a counterparty (“OTC-traded”) or through a central clearing facility, such as a registered exchange. Swap agreements are valued daily at current market value and any change in value is included in the net unrealized appreciation or depreciation on swap agreements. Centrally cleared swaps pay or receive an amount known as “variation margin”, based on daily changes in the valuation of the swap contract. For OTC-traded, upfront premiums paid and received are shown as swap premiums paid and swap premiums received in the Statement of Assets and Liabilities. Risk of loss may exceed amounts recognized on the Statement of Assets and Liabilities. Swap agreements outstanding at period end, if any, are listed on the Schedule of Investments.
86
Interest Rate Swaps: Interest rate swaps represent an agreement between counterparties to exchange cash flows based on the difference between two interest rates, applied to a notional principal amount for a specified period. The PGIM Core Short-Term Bond Fund is subject to interest rate risk exposure in the normal course of pursuing its investment objective. The Funds used interest rate swaps to maintain its ability to generate steady cash flow by receiving a stream of fixed rate payments or to increase exposure to prevailing market rates by receiving floating rate payments. The Funds’ maximum risk of loss from counterparty credit risk is the discounted net present value of the cash flows to be received from the counterparty over the contract’s remaining life.
Repurchase Agreements: Certain Funds entered into repurchase agreements. In connection with transactions in repurchase agreements with United States financial institutions, it is each Fund’s policy that its custodian or designated subcustodians under triparty repurchase agreements, as the case may be, take possession of the underlying collateral securities, the value of which exceeds the principal amount of the repurchase transactions, including accrued interest. To the extent that any repurchase transaction exceeds one business day, the value of the collateral is marked-to-market on a daily basis to ensure the adequacy of the collateral. If the seller defaults and the value of the collateral declines or, if bankruptcy proceedings are commenced with respect to the seller of the security, realization of the collateral by the Fund may be delayed or limited.
Mortgage-Backed and Asset-Backed Securities: Mortgage-backed securities are pass-through securities, meaning that principal and interest payments made by the borrower on the underlying mortgages are passed through to the Fund. Asset-backed securities directly or indirectly represent a participation interest in, or are secured by and payable from, a stream of payments generated by particular assets such as motor vehicle or credit card receivables. Asset-backed securities may be classified as pass-through certificates or collateralized obligations, such as collateralized bond obligations, collateralized loan obligations and other similarly structured securities. The value of mortgage-backed and asset-backed securities varies with changes in interest rates and may be affected by changes in credit quality or value of the mortgage loans or other assets that support the securities.
Stripped mortgage-backed securities are usually structured with two classes that receive different proportions of the interest (“IO”) and principal (“PO”) distributions on a pool of mortgage assets. Payments received for IOs are included in interest income on the Statements of Operations. Because no principal will be received at the maturity of an IO, adjustments are made to the cost of the security on a monthly basis until maturity. These adjustments are included in interest income on the Statements of Operations. Payments received for POs are treated as reductions to the cost and par value of the securities.
Master Netting Arrangements: The Funds are subject to various Master Agreements, or netting arrangements, with select counterparties. These are agreements which a subadviser may have negotiated and entered into on behalf of all or a portion of a Fund. A master netting arrangement between the Fund and the counterparty permits the Fund to offset
87
Notes to Financial Statements (continued)
amounts payable by the Funds to the same counterparty against amounts to be received; and by the receipt of collateral from the counterparty by the Fund to cover the Funds’ exposure to the counterparty. However, there is no assurance that such mitigating factors are easily enforceable. In addition to master netting arrangements, the right to set-off exists when all the conditions are met such that each of the parties owes the other determinable amounts, the reporting party has the right to set-off the amount owed with the amount owed by the other party, the reporting party intends to set-off and the right of set-off is enforceable by law.
In addition to each instrument’s primary underlying risk exposure (e.g. interest rate, credit, equity or foreign exchange, etc.), swap agreements involve, to varying degrees, elements of credit, market and documentation risk. Such risks involve the possibility that no liquid market for these agreements will exist, the counterparty to the agreement may default on its obligation to perform or disagree on the contractual terms of the agreement, and changes in net interest rates will be unfavorable. In connection with these agreements, securities in the portfolio may be identified or received as collateral from the counterparty in accordance with the terms of the respective swap agreements to provide or receive assets of value and to serve as recourse in the event of default or bankruptcy/insolvency of either party. Such OTC derivative agreements include conditions which, when materialized, give the counterparty the right to cause an early termination of the transactions under those agreements. Any election by the counterparty for early termination of the contract(s) may impact the amounts reported on financial statements.
Securities Transactions and Net Investment Income: Securities transactions are recorded on the trade date. Realized gains (losses) from investment and currency transactions are calculated on the specific identification method. Dividend income is recorded on the ex-date, or for certain foreign securities, when the Fund become aware of such dividends. Interest income, including amortization of premium and accretion of discount on debt securities, as required, is recorded on the accrual basis. Expenses are recorded on an accrual basis, which may require the use of certain estimates by management that may differ from actual.
Liquidity Fees and Gates: The PGIM Institutional Money Market Fund has adopted policies and procedures to impose liquidity fees on redemptions and/or temporary redemption gates if the Fund’s weekly liquid assets fall below a designated threshold, subject to the discretion of the Board. If the Fund’s weekly liquid assets fall below 30% of its total assets, the Board, in its discretion, may impose liquidity fees of up to 2% of the value of the shares redeemed and/or impose temporary gates on redemptions. In addition, if the Fund’s weekly liquid assets fall below 10% of its total assets at the end of any business day, the Fund must impose a liquidity fee in the default amount of 1% of the value of shares redeemed unless the Board determines that not doing so is in the best interests of the Fund.
88
Taxes: It is each Fund’s policy to continue to meet the requirements of the Internal Revenue Code applicable to regulated investment companies and to distribute all of its taxable net investment income and capital gains, if any, to its shareholders. Therefore, no federal income tax provision is required. Withholding taxes on foreign dividends, interest and capital gains, if any, are recorded, net of reclaimable amounts, at the time the related income is earned.
Dividends and Distributions: The PGIM Institutional Money Market Fund and PGIM Core Ultra Short Bond Fund declare all of their net investment income and net realized short-term capital gains, if any, as dividends daily to their shareholders of record at the time of such declaration and pay monthly to their shareholders of record at the time of such declaration. The PGIM Core Short-Term Bond Fund declares all of its net investment income as dividends daily and pays monthly to its shareholders of record at the time of such declaration. Distributions of net realized capital gains, if any, are made annually. Dividends and distributions to shareholders, which are determined in accordance with federal income tax regulations and which may differ from GAAP, are recorded on the ex-date. Permanent book/tax differences relating to income and gain (loss) are reclassified between total distributable earnings (loss) and paid-in capital, as appropriate.
Estimates: The preparation of financial statements requires management to make estimates and assumptions that affect the reported amounts and disclosures in the financial statements. Actual results could differ from those estimates.
| 3. | Agreements |
Under a management agreement with the RIC, PGIM Investments manages each Fund’s investment operations and administers its business affairs. Pursuant to this agreement, the Manager has responsibility for all investment management services and supervises the subadviser’s performance of such services.
PGIM Investments has entered into subadvisory agreements with PGIM Limited and PGIM, Inc., which provides subadvisory services to the Funds through its PGIM Fixed Income unit (each a “subadviser”and collectively the “subadvisers”). For their services on the PGIM Core Ultra Short Bond Fund and PGIM Core Short-Term Bond Fund, the subadvisers are reimbursed by PGIM Investments for direct costs, excluding profit and overhead, incurred by the subadvisers in furnishing services to PGIM Investments. PGIM Investments pays for the services of the subadvisers on the PGIM Institutional Money Market Fund.
The PGIM Core Ultra Short Bond Fund and PGIM Core Short-Term Bond Fund reimburse PGIM Investments for its costs and expenses incurred in managing each Fund’s investment operations and administering its business affairs. The costs are accrued daily and payable monthly. For the year ended January 31, 2022, such costs were at an effective annual rate of 0.026% for the PGIM Core Short-Term Bond Fund and 0.003% for the PGIM Core Ultra Short Bond Fund. The management fee paid to the Manager by the PGIM Institutional Money Market Fund was accrued daily and payable monthly at an annual rate of 0.15% of
89
Notes to Financial Statements (continued)
the average daily net assets of the Fund. All amounts paid or payable by the Fund to the Manager, under the agreement, are reflected in the Statement of Operations.
The Manager has contractually agreed through May 31, 2023, to limit the total annual operating expenses after fee waivers and/or expense reimbursements to 0.07% of the PGIM Institutional Money Market Fund’s average daily net assets. This contractual waiver excludes interest, brokerage, taxes (such as income and foreign withholding taxes, stamp duty and deferred tax expenses), acquired fund fees and expenses, extraordinary expenses and certain other Fund expenses such as dividend and interest expense and broker charges on short sales. Fees and/or expenses waived and/or reimbursed by the Manager may be recouped by the Manager within the same fiscal year during which such waiver and/or reimbursement is made if such recoupment can be realized without exceeding the expense limit in effect at the time of the recoupment for that fiscal year.
PGIM Investments, PGIM Limited, and PGIM, Inc. are indirect, wholly-owned subsidiaries of Prudential Financial, Inc. (“Prudential”).
| 4. | Other Transactions with Affiliates |
Prudential Mutual Fund Services LLC (“PMFS”), an affiliate of PGIM Investments and an indirect, wholly-owned subsidiary of Prudential, serves as the Fund’s transfer agent. Transfer agent’s fees and expenses in the Statement of Operations include certain out-of-pocket expenses paid to non-affiliates, where applicable.
The PGIM Core Short-Term Bond Fund may invest its overnight sweep cash in the PGIM Core Ultra Short Bond Fund (the “Core Fund”), a fund of the RIC, registered under the 1940 Act and managed by PGIM Investments. PGIM Investments and/or its affiliates are paid fees or reimbursed for providing their services, to the Core Fund. In addition to the realized and unrealized gains on investments in the Core Fund, earnings from such investments are disclosed on the Statement of Operations as “Affiliated dividend income”. Effective January 2022, the PGIM Core Short-Term Bond Fund changed its overnight cash sweep vehicle from the Core Fund to an unaffiliated money market fund.
The Funds may enter into certain securities purchase or sale transactions under Board approved Rule 17a-7 procedures. Rule 17a-7 is an exemptive rule under the 1940 Act, that subject to certain conditions, permits purchase and sale transactions among affiliated investment companies, or between an investment company and a person that is affiliated solely by reason of having a common (or affiliated) investment adviser, common directors/trustees, and/or common officers.
90
For the year ended January 31, 2022, the Funds’ purchase and sales transactions under Rule 17a-7 and realized gain (loss) as a result of 17a-7 sales transactions were as follows:
| Purchases | Sales | Realized Gain | ||||||||
PGIM Core Ultra Short Bond Fund | $ | 5,450,188 | $ | 5,450,214 | $— | |||||
| 5. | Portfolio Securities |
The aggregate cost of purchases and proceeds from sales of portfolio securities (excluding short-term investments and U.S. Government securities) for the year ended January 31, 2022, were as follows:
Fund | Cost of Purchases | Proceeds from Sales | ||||||||
PGIM Core Short-Term Bond Fund | $ | 593,923,625 | $ | 1,048,200,471 | ||||||
PGIM Core Ultra Short Bond Fund | 1,943,388,125 | 3,257,629,566 | ||||||||
A summary of the cost of purchases and proceeds from sales of shares of affiliated mutual funds for the reporting period ended January 31, 2022, is presented as follows:
PGIM Core Short-Term Bond Fund:
Value, Beginning of Year | Cost of | Proceeds from Sales | Change in Unrealized Gain (Loss) | Realized Gain (Loss) | Value, End of Year | Shares, End of Year | Income | |||||||||||||||||||||||||||||||||||||||||||||||||||
Short-Term Investments - Affiliated Mutual Fund: |
| |||||||||||||||||||||||||||||||||||||||||||||||||||||||||
PGIM Core Ultra Short Bond Fund(1)(wb) |
| |||||||||||||||||||||||||||||||||||||||||||||||||||||||||
$559,900 |
|
| $ | 1,458,816,939 | $ | 1,459,376,839 | $— | $— | $— | — | $ | 133,395 | ||||||||||||||||||||||||||||||||||||||||||||||
|
|
|
|
|
|
|
|
|
| |||||||||||||||||||||||||||||||||||||||||||||||||
(1) The Fund did not have any capital gain distributions during the reporting period.
(wb) PGIM Investments LLC, the manager of the Fund, also serves as manager of the PGIM Core Ultra Short Bond Fund.
| 6. | Distributions and Tax Information |
Distributions to shareholders, which are determined in accordance with federal income tax regulations and which may differ from GAAP, are recorded on the ex-date.
In order to present total distributable earnings (loss) and paid-in capital on the Statement of Assets and Liabilities that more closely represent their tax character, certain adjustments have been made to total distributable earnings (loss) and paid-in capital for the funds indicated below.
91
Notes to Financial Statements (continued)
For the year ended January 31, 2022, the adjustments were as follows:
Fund | Total Distributable Earnings (Loss) | Paid-in Capital | ||||||||
PGIM Core Ultra Short Bond Fund (a) | $ | 15,753 | $ | (15,753 | ) | |||||
PGIM Institutional Money Market Fund (a) | 1,012 | (1,012 | ) | |||||||
| (a) | Due to taxable over-distribution |
Net investment income, net realized gain (loss) on investments and foreign currency transactions and net assets were not affected by this change.
The tax character of distributions paid during the year ended January 31, 2022 were as follows:
Fund | Ordinary Income | Long Term Capital Gains | Tax Return of Capital | Total Dividends and Distributions | ||||||||||||
PGIM Core Short-Term Bond Fund | $23,901,687 | $ — | $291,540 | $24,193,227 | ||||||||||||
PGIM Core Ultra Short Bond Fund | 39,972,207 | 4,566 | — | 39,976,773 | ||||||||||||
PGIM Institutional Money Market Fund | 14,514,243 | 4,864 | — | 14,519,107 | ||||||||||||
The tax character of distributions paid during the year ended January 31, 2021 were as follows:
Fund | Ordinary Income | Long-Term Capital Gains | Tax Return of Capital | Total Dividends and Distributions | ||||||||||||
PGIM Core Short-Term Bond Fund | $ 37,768,493 | $ — | $1,515,195 | $ 39,283,688 | ||||||||||||
PGIM Core Ultra Short Bond Fund | 172,499,588 | — | — | 172,499,588 | ||||||||||||
PGIM Institutional Money Market Fund | 121,546,781 | — | — | 121,546,781 | ||||||||||||
As of January 31, 2022, PGIM Core Short-Term Bond Fund, PGIM Core Ultra Short Bond Fund and PGIM Institutional Money Market Fund had no accumulated undistributed earnings on a tax basis.
The United States federal income tax basis of the Funds’ investments and the net unrealized appreciation (depreciation) as of January 31, 2022 were as follows:
Fund | Tax Basis | Gross Unrealized Appreciation | Gross Unrealized Depreciation | Net Unrealized Appreciation (Depreciation) | ||||||||||||||||
| PGIM Core Short-Term Bond Fund | $ 2,333,752,245 | $19,182,142 | $(17,396,442) | $ 1,785,700 | ||||||||||||||||
92
Fund | Tax Basis | Gross Unrealized Appreciation | Gross Unrealized Depreciation | Net Unrealized Appreciation (Depreciation) | ||||
| PGIM Core Ultra Short Bond Fund | $23,497,724,737 | $ 456,986 | $ (3,152,778) | $(2,695,792) | ||||
| PGIM Institutional Money Market Fund | 14,116,735,958 | 318,534 | (1,385,232) | (1,066,698) |
The difference between GAAP basis and tax basis was primarily attributable to deferred losses on wash sales and swaps.
For federal income tax purposes, the PGIM Core Short-Term Bond Fund had a capital loss carryforward as of January 31, 2022 of approximately $36,463,000 which can be carried forward for an unlimited period. No capital gains distributions are expected to be paid to shareholders until net gains have been realized in excess of such losses.
The Manager has analyzed the Funds’ tax positions taken on federal, state and local income tax returns for all open tax years and has concluded that no provision for income tax is required in the Funds’ financial statements for the current reporting period. Since tax authorities can examine previously filed tax returns, the Funds’ U.S. federal and state tax returns for each of the four fiscal years up to the most recent fiscal year ended January 31, 2022 are subject to such review.
| 7. | Capital and Ownership |
Shares of the PGIM Core Short-Term Bond Fund, the PGIM Core Ultra Short Bond Fund and the PGIM Institutional Money Market Fund are available only to investment companies managed by PGIM Investments and, as applicable, certain investment advisory clients of PGIM, Inc.
The RIC is authorized to issue an unlimited number of shares of beneficial interest, which may be divided into an unlimited number of series of such shares.
As of January 31, 2022, Prudential, through its affiliated entities, including affiliated funds (if applicable), owned all shares of the Funds.
At the reporting period end, the number of shareholders holding greater than 5% of the Fund are as follows:
| Affiliated | Unaffiliated | |||||||
| Fund | Number of Shareholders | Percentage of Outstanding Shares | Number of Shareholders | Percentage of Outstanding Shares | ||||
PGIM Core Short-Term Bond Fund | 2 | 97.0% | — | —% | ||||
PGIM Core Ultra Short Bond Fund | 6 | 66.7 | — | — | ||||
93
Notes to Financial Statements (continued)
| Affiliated | Unaffiliated | |||||||
| Fund | Number of Shareholders | Percentage of Outstanding Shares | Number of Shareholders | Percentage of Outstanding Shares | ||||
PGIM Institutional Money Market Fund | 3 | 33.7% | — | —% | ||||
Transactions in shares of beneficial interest were as follows:
PGIM Core Short-Term Bond Fund | PGIM Core Ultra Short Bond Fund | |||||||||||||||||||||||||||||||||
Shares | Amount | Shares | Amount | |||||||||||||||||||||||||||||||
| Year ended January 31, 2022: | ||||||||||||||||||||||||||||||||||
| Shares sold | 30,186,091 | $ | 277,486,085 | 185,299,449,087 | $ | 185,299,447,230 | ||||||||||||||||||||||||||||
| Shares issued in reinvestment of dividends and distributions |
| 774,728 | 7,137,574 | 39,660,742 | 39,660,742 | |||||||||||||||||||||||||||||
| Shares purchased | (73,997,536 | ) | (680,113,269 | ) | (192,934,824,532 | ) | (192,934,824,533 | ) | ||||||||||||||||||||||||||
|
|
|
|
|
|
|
| |||||||||||||||||||||||||||
| Net increase (decrease) in shares outstanding | (43,036,717 | ) | $ | (395,489,610 | ) | (7,595,714,703 | ) | $ | (7,595,716,561 | ) | ||||||||||||||||||||||||
|
|
|
|
|
|
|
| |||||||||||||||||||||||||||
| Year ended January 31, 2021: | ||||||||||||||||||||||||||||||||||
| Shares sold | 190,793,878 | $ | 1,738,879,927 | 272,436,300,500 | $ | 272,436,300,863 | ||||||||||||||||||||||||||||
| Shares issued in reinvestment of dividends and distributions | 1,269,656 | 11,638,591 | 169,729,470 | 169,729,470 | ||||||||||||||||||||||||||||||
| Shares purchased | (188,479,560 | ) | (1,719,601,850 | ) | (261,854,715,517 | ) | (261,854,715,517 | ) | ||||||||||||||||||||||||||
|
|
|
|
|
|
|
| |||||||||||||||||||||||||||
| Net increase (decrease) in shares outstanding | 3,583,974 | $ | 30,916,668 | 10,751,314,453 | $ | 10,751,314,816 | ||||||||||||||||||||||||||||
|
|
|
|
|
|
|
| |||||||||||||||||||||||||||
| PGIM Institutional Money Market Fund | |||||||||||||||
| Shares | Amount | ||||||||||||||
Year ended January 31, 2022: | |||||||||||||||
Shares sold | 124,192,205,521 | $ | 124,119,430,412 | ||||||||||||
Shares issued in reinvestment of dividends and distributions | 14,516,509 | 14,508,120 | |||||||||||||
Shares purchased | (130,313,200,308 | ) | (130,236,780,094 | ) | |||||||||||
|
|
|
| ||||||||||||
Net increase (decrease) in shares outstanding | (6,106,478,278 | ) | $ | (6,102,841,562 | ) | ||||||||||
|
|
|
| ||||||||||||
Year ended January 31, 2021: | |||||||||||||||
Shares sold | 164,566,353,559 | $ | 164,488,986,884 | ||||||||||||
Shares issued in reinvestment of dividends and distributions | 121,530,035 | 121,488,485 | |||||||||||||
Shares purchased | (161,047,901,868 | ) | (160,983,076,991 | ) | |||||||||||
|
|
|
| ||||||||||||
Net increase (decrease) in shares outstanding | 3,639,981,726 | $ | 3,627,398,378 | ||||||||||||
|
|
|
| ||||||||||||
| 8. | Borrowings |
The RIC, on behalf of the PGIM Core Short-Term Bond Fund, along with other affiliated registered investment companies (the “Participating Funds”), is a party to a Syndicated Credit Agreement (“SCA”) with a group of banks. The purpose of the SCA is to provide an alternative source of temporary funding for capital share redemptions. The table below
94
provides details of the current SCA in effect at the reporting period-end as well as the prior SCA.
| Current SCA | Prior SCA | |||
Term of Commitment | 10/1/2021 – 9/29/2022 | 10/2/2020 – 9/30/2021 | ||
Total Commitment | $ 1,200,000,000 | $ 1,200,000,000 | ||
Annualized Commitment Fee on the Unused Portion of the SCA | 0.15% | 0.15% | ||
Annualized Interest Rate on Borrowings | 1.20% plus the higher of (1) the effective federal funds rate, (2) the one-month LIBOR rate or (3) zero percent
| 1.30% plus the higher of (1) the effective federal funds rate, (2) the one-month LIBOR rate or (3) zero percent
| ||
Certain affiliated registered investment companies that are parties to the SCA include portfolios that are subject to a predetermined mathematical formula used to manage certain benefit guarantees offered under variable annuity contracts. The formula may result in large scale asset flows into and out of these portfolios. Consequently, these portfolios may be more likely to utilize the SCA for purposes of funding redemptions. It may be possible for those portfolios to fully exhaust the committed amount of the SCA, thereby requiring the Manager to allocate available funding per a Board-approved methodology designed to treat the Participating Funds in the SCA equitably.
The PGIM Core Short-Term Bond Fund did not utilize the SCA during the year ended January 31, 2022.
| 9. | Risks of Investing in the Funds |
Each Fund’s risks include, but are not limited to, some or all of the risks discussed below. For further information on the risks applicable to any given Fund, please refer to the Prospectus and Statement of Additional Information of that Fund.
| Risks | PGIM Core Short Term Bond Fund | PGIM Core Ultra Short Bond Fund | PGIM Institutional Money Market Fund | |||
Adjustable and Floating Rate Securities | X | X | X | |||
Credit | X | X | X | |||
Cyber Security | X | X | X | |||
Debt Obligations | X | X | X | |||
Derivatives | X | — | — | |||
Economic and Market Events | X | X | X | |||
Equity and Equity-Related Securities | X | X | — | |||
Fees and Gates | — | — | X | |||
Floating Net Asset Value | — | — | X | |||
Foreign Securities | X | X | X | |||
Forward Commitments | X | X | X | |||
Illiquid Securities | X | X | X | |||
Increase in Exepnses | X | X | X | |||
Interest Rate | X | X | X | |||
Large Shareholder and Large Scale Redemption | X | X | X | |||
95
Notes to Financial Statements (continued)
| Risks | PGIM Core Short Term Bond Fund | PGIM Core Ultra Short Bond Fund | PGIM Institutional Money Market Fund | |||
Liquidity | X | X | X | |||
Management | X | X | X | |||
Market Disruption and Geopolitical | X | X | X | |||
Market | X | X | X | |||
Mortgage-Backed and Asset-Backed Securities | X | X | X | |||
Municipal Bonds | X | X | X | |||
Repurchase Agreeements | X | X | X | |||
Reverse Repurchase Agreements | X | X | X | |||
U.S. Government and Agency Securities | X | X | X | |||
Variable and Floating Rate Bonds | X | X | X | |||
When-Issued and Delayed-Delivery Transactions | X | X | X | |||
Yield | — | X | X | |||
Adjustable and Floating Rate Securities Risk: The value of adjustable and floating rate securities may lag behind the value of fixed rate securities when interest rates change. Such securities may be subject to extended settlement periods (longer than seven days) and in unusual market conditions, with a high volume of shareholder redemptions, may present a risk of loss to the Fund or may impair the Fund’s ability satisfy shareholder redemption requests.
Credit Risk: The debt obligations in which the Fund invests are generally subject to the risk that the issuer may be unable to repay principal and make interest payments when they are due. There is also the risk that the securities could lose value because of a loss of confidence in the ability of the borrower to pay back debt. All securities purchased by the Fund must present minimal credit risk in the opinion of the subadviser. The Fund is subject to the risk that the subadviser’s credit risk determinations may be incorrect. In addition, the credit quality of the securities held by the Fund may change rapidly in certain market conditions, which could result in significant net asset value deterioration.
Cyber Security Risk: Failures or breaches of the electronic systems of the Fund, the Fund’s manager, subadviser, distributor, and other service providers, or the issuers of securities in which the Fund invests have the ability to cause disruptions and negatively impact the Fund’s business operations, potentially resulting in financial losses to the Fund and its shareholders. While the Fund has established business continuity plans and risk management systems seeking to address system breaches or failures, there are inherent limitations in such plans and systems. Furthermore, the Fund cannot control the cyber security plans and systems of the Fund’s service providers or issuers of securities in which the Fund invests.
96
Debt Obligations Risk: Debt obligations are subject to credit risk, market risk and interest rate risk. The Fund’s holdings, share price, yield and total return may also fluctuate in response to bond market movements. The value of bonds may decline for issuer-related reasons, including management performance, financial leverage and reduced demand for the issuer’s goods and services. Certain types of fixed income obligations also may be subject to “call and redemption risk,” which is the risk that the issuer may call a bond held by the Fund for redemption before it matures and the Fund may lose income.
Derivatives Risk: Derivatives involve special risks and costs and may result in losses to the Fund. The successful use of derivatives requires sophisticated management, and, to the extent that derivatives are used, the Fund will depend on the subadviser’s ability to analyze and manage derivative transactions. The prices of derivatives may move in unexpected ways, especially in abnormal market conditions. Some derivatives are “leveraged” and therefore may magnify or otherwise increase investment losses to the Fund. The Fund’s use of derivatives may also increase the amount of taxes payable by shareholders. Other risks arise from the potential inability to terminate or sell derivatives positions. A liquid secondary market may not always exist for the Fund’s derivatives positions. In fact, many OTC derivative instruments will not have liquidity beyond the counterparty to the instrument. OTC derivative instruments also involve the risk that the other party will not meet its obligations to the Fund.
The U.S. Government and foreign governments have adopted (and may adopt further) regulations governing derivatives markets, including mandatory clearing of certain derivatives, margin and reporting requirements and risk exposure limitations. The ultimate impact of the regulations remains unclear. Additional regulation of derivatives may make derivatives more costly, limit their availability or utility, or otherwise adversely affect their performance or disrupt markets.
Economic and Market Events Risk: Events in the U.S. and global financial markets, including actions taken by the U.S. Federal Reserve or foreign central banks to stimulate or stabilize economic growth or the functioning of the securities markets, may at times result in unusually high market volatility, which could negatively impact performance. Relatively reduced liquidity in credit and fixed income markets could adversely affect issuers worldwide.
Equity and Equity-Related Securities Risk: Equity and equity-related securities may be subject to changes in value, and their values may be more volatile than those of other asset classes. In addition to an individual security losing value, the value of the equity markets or a sector in which the Fund invests could go down. Different parts of a market can react differently to adverse issuer, market, regulatory, political and economic developments.
Fees and Gates Risk: The Fund has adopted policies and procedures to impose liquidity fees on redemptions and/or temporary redemption gates in the event that the Fund’s weekly liquid assets fall below a designated threshold, subject to the discretion of the Fund’s Board. If the Fund’s weekly liquid assets fall below 30% of its total assets, the Board, in its
97
Notes to Financial Statements (continued)
discretion, may impose liquidity fees of up to 2% of the value of the shares redeemed and/or impose temporary gates on redemptions. In addition, if the Fund’s weekly liquid assets fall below 10% of its total assets at the end of any business day, the Fund must impose a liquidity fee in the default amount of 1% of the value of shares redeemed unless the Board determines that not doing so is in the best interests of the Fund.
Floating Net Asset Value Risk: The Fund’s NAV floats. The value of the Fund’s shares is calculated to four decimal places and will vary, reflecting the value of the portfolio of investments held by the Fund. It is possible to lose money by investing in the Fund. The Fund’s shareholders should not rely on or expect the Fund’s manager to purchase distressed assets from the Fund, enter into capital support agreements with the Fund, or make capital infusions into the Fund.
Foreign Securities Risk: Investments in securities of non-U.S. issuers (including those denominated in U.S. dollars) may involve more risk than investing in securities of U.S. issuers. Foreign political, economic and legal systems, especially those in developing and emerging market countries, may be less stable and more volatile than in the United States. Foreign legal systems generally have fewer regulatory requirements than the U.S. legal system, particularly those of emerging markets. In general, less information is publicly available with respect to non-U.S. companies than U.S. companies. Non-U.S. companies generally are not subject to the same accounting, auditing, and financial reporting standards as are U.S. companies. Additionally, the changing value of foreign currencies and changes in exchange rates could also affect the value of the assets the Fund holds and the Fund’s performance. Certain foreign countries may impose restrictions on the ability of issuers of foreign securities to make payment of principal and interest or dividends to investors located outside the country, due to blockage of foreign currency exchanges or otherwise. Investments in emerging markets are subject to greater volatility and price declines.
In addition, the Fund’s investments in non-U.S. securities may be subject to the risks of nationalization or expropriation of assets, imposition of currency exchange controls or restrictions on the repatriation of non-U.S. currency, confiscatory taxation and adverse diplomatic developments. Special U.S. tax considerations may apply.
Forward Commitments Risk: Forward commitments are subject to the risk that the counterparty to the forward commitment may fail to make payment or delivery in a timely manner or at all. Forward commitments are also subject to the risk that the value of the security to be purchased may decline prior to the settlement date.
Illiquid Securities Risk: The Fund may invest in instruments that trade in lower volumes and may make investments that may be less liquid than other investments. Liquidity risk exists when particular investments made by the Fund are difficult to purchase or sell. The Fund
98
may make investments that may become less liquid in response to market developments or adverse investor perceptions. If the Fund is forced to sell these investments to pay redemption proceeds or for other reasons, the Fund may lose money. In addition, when there is no willing buyer and investments cannot be readily sold at the desired time or price, the Fund may have to accept a lower price or may not be able to sell the instrument at all. An inability to sell a portfolio position can adversely affect the Fund’s value or prevent the Fund from being able to take advantage of other investment opportunities.
Increase in Expenses Risk: Your actual cost of investing in the Fund may be higher than the expenses shown in the expense table of the Fund’s prospectus for a variety of reasons. For example, expense ratios may be higher than those shown if average net assets decrease. Net assets are more likely to decrease and Fund expense ratios are more likely to increase when markets are volatile. Active and frequent trading of Fund securities can increase expenses.
Interest Rate Risk: The value of your investment may go down when interest rates rise. A rise in rates tends to have a greater impact on the prices of longer term or duration debt securities. For example, a fixed income security with a duration of three years is expected to decrease in value by approximately 3% if interest rates increase by 1%. This is referred to as “duration risk." When interest rates fall, the issuers of debt obligations may prepay principal more quickly than expected, and the Fund may be required to reinvest the proceeds at a lower interest rate. This is referred to as “prepayment risk.” When interest rates rise, debt obligations may be repaid more slowly than expected, and the value of the Fund’s holdings may fall sharply. This is referred to as “extension risk.” The Fund may lose money if short-term or long-term interest rates rise sharply or in a manner not anticipated by the subadviser.
This is the risk that the securities in which the Fund invests could lose value because of interest rate changes. For example, bonds tend to decrease in value if interest rates rise. Debt obligations with longer maturities generally are more sensitive to interest rate changes. In addition, short-term and long-term interest rates do not necessarily move in the same direction or by the same amount. An instrument’s reaction to interest rate changes depends on the timing of its interest and principal payments and the current interest rate for each of those time periods. Instruments with floating interest rates can be less sensitive to interest rate changes.
Large Shareholder and Large Scale Redemption Risk: Certain individuals, accounts, funds (including funds affiliated with the Manager) or institutions, including the Manager and its affiliates, may from time to time own or control a substantial amount of the Fund’s shares. There is no requirement that these entities maintain their investment in the Fund. There is a risk that such large shareholders or that the Fund’s shareholders generally may redeem all or a substantial portion of their investments in the Fund in a short period of time, which could have a significant negative impact on the Fund’s NAV, liquidity, and brokerage costs. Large redemptions could also result in tax consequences to shareholders and impact the Fund’s ability to implement its investment strategy. The Fund’s ability to pursue its
99
Notes to Financial Statements (continued)
investment objective after one or more large scale redemptions may be impaired and, as a result, the Fund may invest a larger portion of its assets in cash or cash equivalents.
Liquidity Risk: Liquidity risk is the risk that the Fund could not meet requests to redeem shares issued by the Fund without significant dilution of remaining investors’ interests in the Fund. The Fund may invest in instruments that trade in lower volumes and are more illiquid than other investments. If the Fund is forced to sell these investments to pay redemption proceeds or for other reasons, the Fund may lose money. In addition, when there is no willing buyer and investments cannot be readily sold at the desired time or price, the Fund may have to accept a lower price or may not be able to sell the instrument at all. An inability to sell a portfolio position can adversely affect the Fund’s value or prevent the Fund from being able to take advantage of other investment opportunities.
Management Risk: The value of your investment may decrease if judgments by the subadviser about the attractiveness, value or market trends affecting a particular security, industry or sector or about market movements are incorrect.
Market Disruption and Geopolitical Risks: Market disruption can be caused by economic, financial or political events and factors, including but not limited to, international wars or conflicts (including Russia’s military invasion of Ukraine), geopolitical developments (including trading and tariff arrangements, sanctions and cybersecurity attacks), instability in regions such as Asia, Eastern Europe and the Middle East, terrorism, natural disasters and public health epidemics (including the outbreak of COVID-19 globally).
The extent and duration of such events and resulting market disruptions cannot be predicted, but could be substantial and could magnify the impact of other risks to the Fund. These and other similar events could adversely affect the U.S. and foreign financial markets and lead to increased market volatility, reduced liquidity in the securities markets, significant negative impacts on issuers and the markets for certain securities and commodities and/or government intervention. They may also cause short- or long-term economic uncertainties in the United States and worldwide. As a result, whether or not the Fund invests in securities of issuers located in or with significant exposure to the countries directly affected, the value and liquidity of the Fund’s investments may be negatively impacted. Further, due to closures of certain markets and restrictions on trading certain securities, the value of certain securities held by the Fund could be significantly impacted, which could lead to such securities being valued at zero.
COVID-19 and the related governmental and public responses have had and may continue to have an impact on the Fund’s investments and net asset value and have led and may continue to lead to increased market volatility and the potential for illiquidity in certain classes of securities and sectors of the market. They have also had and may continue to
100
result in periods of business disruption, business closures, inability to obtain raw materials, supplies and component parts, and reduced or disrupted operations for the issuers in which the Fund invests. The occurrence, reoccurrence and pendency of public health epidemics could adversely affect the economies and financial markets either in specific countries or worldwide.
Market Risk: Securities markets may be volatile and the market prices of the Fund’s securities may decline. Securities fluctuate in price based on changes in an issuer’s financial condition and overall market and economic conditions.
Mortgage-Backed and Asset-Backed Securities Risk: Mortgage-backed and asset-backed securities tend to increase in value less than other debt securities when interest rates decline, but are subject to similar risk of decline in market value during periods of rising interest rates. The values of mortgage-backed and asset-backed securities become more volatile as interest rates rise. In a period of declining interest rates, the Fund may be required to reinvest more frequent prepayments on mortgage-backed and asset-backed securities in lower-yielding investments.
Municipal Bonds Risk: Municipal bonds are subject to credit risk, market risk and interest rate risk. The Fund’s holdings, share price, yield and total return may also fluctuate in response to municipal bond market movements. Municipal bonds are also subject to the risk that potential future legislative changes could affect the market for and value of municipal bonds, which may adversely affect the Fund’s yield or the value of the Fund’s investments in municipal bonds. Certain municipal bonds with principal and interest payments that are made from the revenues of a specific project or facility, and not general tax revenues, may have increased risks. Factors affecting the project or facility, such as local business or economic conditions, could have a significant effect on the project’s ability to make payments of principal and interest on these securities. If the Fund invests a substantial amount of its assets in issuers located in a single region, state or city, there is an increased risk that environmental, economic, political and social conditions in those regions will have a significant impact on the Fund’s investment performance. For example, municipal securities of a particular state are vulnerable to events adversely affecting that state, including economic, political and regulatory occurrences, court decisions, terrorism, public health epidemics, social unrest and catastrophic natural disasters, such as hurricanes or earthquakes. Many municipal bonds are also subject to prepayment risk, which is the risk that when interest rates fall, issuers may redeem a security by repaying it early, which may reduce the Fund’s income if the proceeds are reinvested at a lower interest rate. In addition, income from municipal bonds could be declared taxable because of non-compliant conduct of a bond issuer.
Repurchase Agreements Risk: Repurchase agreements could involve certain risks in the event of default or insolvency of the seller, including losses and possible delays or restrictions upon the Fund’s ability to dispose of the underlying securities. To the extent that, in the meantime, the value of the securities that the Fund has purchased has decreased, the Fund could experience a loss.
101
Notes to Financial Statements (continued)
Reverse Repurchase Agreements Risk: Reverse repurchase agreements involve the risk that the other party may fail to return the securities in a timely manner or at all. The Fund could lose money if it is unable to recover the securities and the value of the collateral held by the Fund, including the value of investments made with cash collateral, is less than the value of the securities. These events could also trigger adverse tax consequences to the Fund. Reverse repurchase agreements also involve leverage, which may exaggerate the increase or decrease of the value of the Fund’s assets during the term of the agreement.
U.S. Government and Agency Securities Risk: U.S. Government and agency securities are subject to market risk, interest rate risk and credit risk. Not all U.S. Government securities are insured or guaranteed by the full faith and credit of the U.S. Government; some are only insured or guaranteed by the issuing agency, which must rely on its own resources to repay the debt. Some agency securities carry no guarantee whatsoever and the risk of default associated with these securities would be borne by the Fund. The maximum potential liability of the issuers of some U.S. Government securities held by the Fund may greatly exceed their current resources, including their legal right to support from the U.S. Treasury. No assurance can be given that the U.S. government would provide financial support to any such issuers if it is not obligated to do so by law. It is possible that these issuers will not have the funds to meet their payment obligations in the future. In addition, the value of U.S. Government securities may be affected by changes in the credit rating of the U.S. Government.
Variable and Floating Rate Bonds Risk: Variable and floating rate bonds are subject to credit risk, market risk and interest rate risk. In addition, the absence of an active market for these securities could make it difficult for the Fund to dispose of them if the issuer defaults.
When-Issued and Delayed-Delivery Transactions Risk: When-issued and delayed-delivery securities involve the risk that the security the Fund buys will lose value prior to its delivery. There also is the risk that the security will not be issued or that the other party to the transaction will not meet its obligation. If this occurs, the Fund may lose both the investment opportunity for the assets it set aside to pay for the security and any gain in the security’s price.
Yield Risk: The amount of income received by the Fund will go up or down depending on day-to-day variations in short-term interest rates, and when interest rates are very low the Fund’s expenses could absorb all or a significant portion of the Fund’s income. If interest rates increase, the Fund’s yield may not increase proportionately. For example, the Fund’s investment manager may discontinue any temporary voluntary fee limitation.
102
| 10. | Recent Accounting Pronouncement and Regulatory Developments |
In March 2020, the FASB issued Accounting Standard Update (“ASU”) No. 2020-04, which provides optional guidance for applying GAAP to contract modifications, hedging relationships and other transactions affected by the reference rate reform if certain criteria are met. ASU 2020-04 is elective and is effective on March 12, 2020 through December 31, 2022. Management does not expect ASU 2020-04 to have a material impact on the financial statements.
On December 3, 2020, the SEC announced that it voted to adopt a new rule that establishes an updated regulatory framework for fund valuation practices (the “Rule”). The Rule, in part, provides (i) a framework for determining fair value in good faith and (ii) provides for a fund Board’s assignment of its responsibility for the execution of valuation-related activities to a fund’s investment adviser. Further, the SEC is rescinding previously issued guidance on related issues. The Rule took effect on March 8, 2021, with a compliance date of September 8, 2022. Management is currently evaluating the Rule and its impact to the Funds.
103
Report of Independent Registered Public Accounting Firm
To the Board of Trustees of Prudential Investment Portfolios 2 and Shareholders of PGIM Core Short-Term Bond Fund, PGIM Core Ultra Short Bond Fund and PGIM Institutional Money Market Fund
Opinions on the Financial Statements
We have audited the accompanying statements of assets and liabilities, including the schedules of investments, of PGIM Core Short-Term Bond Fund, PGIM Core Ultra Short Bond Fund and PGIM Institutional Money Market Fund (three of the funds constituting Prudential Investment Portfolios 2, hereafter collectively referred to as the “Funds”) as of January 31, 2022, the related statements of operations for the year ended January 31, 2022, the statements of changes in net assets for each of the two years in the period ended January 31, 2022, including the related notes, and the financial highlights for each of the two years in the period ended January 31, 2022 (collectively referred to as the “financial statements”). In our opinion, the financial statements present fairly, in all material respects, the financial position of each of the Funds as of January 31, 2022, the results of each of their operations for the year then ended, and the changes in each of their net assets and each of the financial highlights for each of the two years in the period ended January 31, 2022 in conformity with accounting principles generally accepted in the United States of America.
The financial statements of the Funds as of and for the year ended January 31, 2020 and the financial highlights for each of the periods ended on or prior to January 31, 2020 (not presented herein, other than the financial highlights) were audited by other auditors whose report dated March 18, 2020 expressed an unqualified opinion on those financial statements and financial highlights.
Basis for Opinions
These financial statements are the responsibility of the Funds’ management. Our responsibility is to express an opinion on the Funds’ financial statements based on our audits. We are a public accounting firm registered with the Public Company Accounting Oversight Board (United States) (PCAOB) and are required to be independent with respect to the Funds in accordance with the U.S. federal securities laws and the applicable rules and regulations of the Securities and Exchange Commission and the PCAOB.
We conducted our audits of these financial statements in accordance with the standards of the PCAOB. Those standards require that we plan and perform the audit to obtain reasonable assurance about whether the financial statements are free of material misstatement, whether due to error or fraud.
Our audits included performing procedures to assess the risks of material misstatement of the financial statements, whether due to error or fraud, and performing procedures that
104
Report of Independent Registered Public Accounting Firm (continued)
respond to those risks. Such procedures included examining, on a test basis, evidence regarding the amounts and disclosures in the financial statements. Our audits also included evaluating the accounting principles used and significant estimates made by management, as well as evaluating the overall presentation of the financial statements. Our procedures included confirmation of securities owned as of January 31, 2022 by correspondence with the custodian, transfer agent and brokers; when replies were not received from brokers, we performed other auditing procedures. We believe that our audits provide a reasonable basis for our opinions.
/s/PricewaterhouseCoopers LLP
New York, New York
March 22, 2022
We have served as the auditor of one or more investment companies in the PGIM Retail Funds complex since 2020.
Prudential Investment Portfolios 2 105
Tax Information (unaudited)
For the year ended January 31, 2022, the PGIM Core Ultra Short Bond Fund reports 76.79%, the PGIM Institutional Money Market Fund reports 99.50%, and PGIM Core Short-Term Bond Fund reports 100.00% as interest-related dividends in accordance with Sections 871(k)(1) and 881(e)(1) of the Internal Revenue Code.
In January 2023, you will be advised on IRS Form 1099-DIV or substitute Form 1099, as to the Federal tax status of the distributions received by you in calendar year 2022.
We are required by Massachusetts, Missouri and Oregon to inform you that dividends which have been derived from interest on federal obligations are not taxable to shareholders providing the Mutual Fund meets certain requirements mandated by the respective state’s taxing authorities. We are pleased to report that 1.59% of the dividends paid by the PGIM Core Ultra Short Bond Fund and 3.82% of the dividends paid by the PGIM Institutional Money Market Fund qualifies for such deduction.
Please consult your tax adviser or state/local authorities to properly report this information on your tax return. If you have any questions concerning the amounts listed above, please call your financial adviser.
106
INFORMATION ABOUT BOARD MEMBERS AND OFFICERS (unaudited)
Information about Board Members and Officers of the Fund is set forth below. Board Members who are not deemed to be “interested persons” of the Fund, as defined in the 1940 Act, are referred to as “Independent Board Members.” Board Members who are deemed to be “interested persons” of the Fund are referred to as “Interested Board Members.” The Board Members are responsible for the overall supervision of the operations of the Fund and perform the various duties imposed on the directors of investment companies by the 1940 Act. The Board in turn elects the Officers, who are responsible for administering the day-to-day operations of the Fund.
Independent Board Members | ||||||
Name Year of Birth Position(s) Portfolios Overseen | Principal Occupation(s) During Past Five Years | Other Directorships Held During Past Five Years | Length of Board Service | |||
Ellen S. Alberding 1958 Board Member Portfolios Overseen: 95 | President and Board Member, The Joyce Foundation (charitable foundation) (since 2002); formerly Vice Chair, City Colleges of Chicago (community college system) (2011-2015); Trustee, National Park Foundation (charitable foundation for national park system) (2009-2018); Trustee, Economic Club of Chicago (2009-2016); Trustee, Loyola University (since 2018). | None. | Since September 2013 | |||
Kevin J. Bannon 1952 Board Member Portfolios Overseen: 95 | Retired; formerly Managing Director (April 2008-May 2015) and Chief Investment Officer (October 2008-November 2013) of Highmount Capital LLC (registered investment adviser); formerly Executive Vice President and Chief Investment Officer (April 1993-August 2007) of Bank of New York Company; President (May 2003-May 2007) of BNY Hamilton Family of Mutual Funds. | Director of Urstadt Biddle Properties (equity real estate investment trust) (since September 2008). | Since July 2008 | |||
Prudential Investment Portfolios 2
Independent Board Members | ||||||
Name Year of Birth Position(s) Portfolios Overseen | Principal Occupation(s) During Past Five Years | Other Directorships Held During Past Five Years | Length of Board Service | |||
Linda W. Bynoe 1952 Board Member Portfolios Overseen: 92 | President and Chief Executive Officer (since March 1995) and formerly Chief Operating Officer (December 1989-February 1995) of Telemat Limited LLC (formerly Telemat Ltd) (management consulting); formerly Vice President (January 1985-June 1989) at Morgan Stanley & Co. (broker-dealer). | Trustee of Equity Residential (residential real estate) (since December 2009); Director of Northern Trust Corporation (financial services) (since April 2006); formerly Director of Anixter International, Inc. (communication products distributor) (January 2006-June 2020). | Since March 2005 | |||
Barry H. Evans 1960 Board Member Portfolios Overseen: 94 | Retired; formerly President (2005-2016), Global Chief Operating Officer (2014-2016), Chief Investment Officer - Global Head of Fixed Income (1998-2014), and various portfolio manager roles (1986-2006), Manulife Asset Management (asset management). | Formerly Director, Manulife Trust Company (2011-2018); formerly Director, Manulife Asset Management Limited (2015-2017); formerly Chairman of the Board of Directors of Manulife Asset Management U.S. (2005-2016); formerly Chairman of the Board, Declaration Investment Management and Research (2008-2016). | Since September 2017 | |||
Keith F. Hartstein 1956 Board Member & Independent Chair Portfolios Overseen: 95 | Retired; Member (since November 2014) of the Governing Council of the Independent Directors Council (IDC) (organization of independent mutual fund directors); formerly Executive Committee of the IDC Board of Governors (October 2019-December 2021); formerly President and Chief Executive Officer (2005-2012), Senior Vice President (2004-2005), Senior Vice President of Sales and Marketing (1997-2004), and various executive management positions (1990-1997), John Hancock Funds, LLC (asset management); Chairman, Investment Company Institute’s Sales Force Marketing Committee (2003-2008). | None. | Since September 2013 | |||
Visit our website at pgim.com/investments
Independent Board Members | ||||||
Name Year of Birth Position(s) Portfolios Overseen | Principal Occupation(s) During Past Five Years | Other Directorships Held During Past Five Years | Length of Board Service | |||
Laurie Simon Hodrick 1962 Board Member Portfolios Overseen: 91 | A. Barton Hepburn Professor Emerita of Economics in the Faculty of Business, Columbia Business School (since 2018); Visiting Fellow at the Hoover Institution, Stanford University (since 2015); Sole Member, ReidCourt LLC (since 2008) (a consulting firm); formerly Visiting Professor of Law, Stanford Law School (2015-2021); formerly A. Barton Hepburn Professor of Economics in the Faculty of Business, Columbia Business School (1996-2017); formerly Managing Director, Global Head of Alternative Investment Strategies, Deutsche Bank (2006-2008). | Independent Director, Andela (since January 2022) (global talent network); Independent Director, Roku (since December 2020) (communication services); formerly Independent Director, Synnex Corporation (2019-2021) (information technology); formerly Independent Director, Kabbage, Inc. (2018-2020) (financial services); formerly Independent Director, Corporate Capital Trust (2017-2018) (a business development company). | Since September 2017 | |||
Brian K. Reid 1961 Board Member Portfolios Overseen: 94 | Retired; formerly Chief Economist for the Investment Company Institute (ICI) (2005-2017); formerly Senior Economist and Director of Industry and Financial Analysis at the ICI (1998-2004); formerly Senior Economist, Industry and Financial Analysis at the ICI (1996-1998); formerly Staff Economist at the Federal Reserve Board (1989-1996); Director, ICI Mutual Insurance Company (2012-2017). | None. | Since March 2018 | |||
Prudential Investment Portfolios 2
Independent Board Members | ||||||
Name Year of Birth Position(s) Portfolios Overseen | Principal Occupation(s) During Past Five Years | Other Directorships Held During Past Five Years | Length of Board Service | |||
Grace C. Torres 1959 Board Member Portfolios Overseen: 94 | Retired; formerly Treasurer and Principal Financial and Accounting Officer of the PGIM Funds, Target Funds, Advanced Series Trust, Prudential Variable Contract Accounts and The Prudential Series Fund (1998-June 2014); Assistant Treasurer (March 1999-June 2014) and Senior Vice President (September 1999-June 2014) of PGIM Investments LLC; Assistant Treasurer (May 2003-June 2014) and Vice President (June 2005-June 2014) of AST Investment Services, Inc.; Senior Vice President and Assistant Treasurer (May 2003-June 2014) of Prudential Annuities Advisory Services, Inc. | Director (since January 2018) of OceanFirst Financial Corp. and OceanFirst Bank; formerly Director (July 2015-January 2018) of Sun Bancorp, Inc. N.A. and Sun National Bank. | Since November 2014 | |||
| ||||||
Interested Board Members | ||||||
Name Year of Birth Position(s) Portfolios Overseen | Principal Occupation(s) During Past Five Years | Other Directorships Held During Past Five Years | Length of Board Service | |||
Stuart S. Parker 1962 Board Member & President Portfolios Overseen: 94 | President, Chief Executive Officer, Chief Operating Officer and Officer in Charge of PGIM Investments LLC (formerly known as Prudential Investments LLC) (since January 2012); formerly Executive Vice President of Jennison Associates LLC and Head of Retail Distribution of PGIM Investments LLC (June 2005-December 2011); Investment Company Institute - Board of Governors (since May 2012). | None. | Since January 2012 | |||
Visit our website at pgim.com/investments
Interested Board Members | ||||||
Name Year of Birth Position(s) Portfolios Overseen | Principal Occupation(s) During Past Five Years | Other Directorships Held During Past Five Years | Length of Board Service | |||
Scott E. Benjamin 1973 Board Member & Vice President Portfolios Overseen: 95 | Executive Vice President (since May 2009) of PGIM Investments LLC; Vice President (since June 2012) of Prudential Investment Management Services LLC; Executive Vice President (since September 2009) of AST Investment Services, Inc.; Senior Vice President of Product Development and Marketing, PGIM Investments (since February 2006); formerly Vice President of Product Development and Product Management, PGIM Investments LLC (2003-2006). | None. | Since March 2010 | |||
Fund Officers(a) | ||||
Name Year of Birth Fund Position | Principal Occupation(s) During Past Five Years | Length of Service as Fund Officer | ||
Claudia DiGiacomo 1974 Chief Legal Officer | Chief Legal Officer, Executive Vice President and Secretary of PGIM Investments LLC (since August 2020); Chief Legal Officer of Prudential Mutual Fund Services LLC (since August 2020); Chief Legal Officer of PIFM Holdco, LLC (since August 2020); Vice President and Corporate Counsel (since January 2005) of Prudential; and Corporate Counsel of AST Investment Services, Inc. (since August 2020); formerly Vice President and Assistant Secretary of PGIM Investments LLC (2005-2020); formerly Associate at Sidley Austin Brown & Wood LLP (1999-2004). | Since December 2005 | ||
Dino Capasso 1974 Chief Compliance Officer | Chief Compliance Officer (since July 2019) of PGIM Investments LLC; Chief Compliance Officer (since July 2019) of the PGIM Funds, Target Funds, Advanced Series Trust, The Prudential Series Fund, Prudential’s Gibraltar Fund, Inc., PGIM Global High Yield Fund, Inc., PGIM High Yield Bond Fund, Inc., and PGIM Short Duration High Yield Opportunities Fund; Vice President and Deputy Chief Compliance Officer (June 2017-2019) of PGIM Investments LLC; formerly Senior Vice President and Senior Counsel (January 2016-June 2017), and Vice President and Counsel (February 2012-December 2015) of Pacific Investment Management Company LLC. | Since March 2018 | ||
Prudential Investment Portfolios 2
Fund Officers(a) | ||||
Name Year of Birth Fund Position | Principal Occupation(s) During Past Five Years | Length of Service as Fund Officer | ||
Andrew R. French 1962 Secretary | Vice President (since December 2018) of PGIM Investments LLC; formerly Vice President and Corporate Counsel (2010-2018) of Prudential; formerly Director and Corporate Counsel (2006-2010) of Prudential; Vice President and Assistant Secretary (since January 2007) of PGIM Investments LLC; Vice President and Assistant Secretary (since January 2007) of Prudential Mutual Fund Services LLC. | Since October 2006 | ||
Diana N. Huffman 1982 Assistant Secretary | Vice President and Corporate Counsel (since September 2015) of Prudential; Vice President and Assistant Secretary (since August 2020) of PGIM Investments LLC; formerly Associate at Willkie Farr & Gallagher LLP (2009-2015). | Since March 2019 | ||
Melissa Gonzalez 1980 Assistant Secretary | Vice President and Corporate Counsel (since September 2018) of Prudential; Vice President and Assistant Secretary (since August 2020) of PGIM Investments LLC; formerly Director and Corporate Counsel (March 2014-September 2018) of Prudential. | Since March 2020 | ||
Patrick E. McGuinness 1986 Assistant Secretary | Vice President and Assistant Secretary (since August 2020) of PGIM Investments LLC; Director and Corporate Counsel (since February 2017) of Prudential; and Corporate Counsel (2012-2017) of IIL, Inc. | Since June 2020 | ||
Debra Rubano 1975 Assistant Secretary | Vice President and Corporate Counsel (since November 2020) of Prudential; formerly Director and Senior Counsel of Allianz Global Investors U.S. Holdings LLC (2010-2020) and Assistant Secretary of numerous funds in the Allianz fund complex (2015-2020). | Since December 2020 | ||
Kelly A. Coyne 1968 Assistant Secretary | Director, Investment Operations of Prudential Mutual Fund Services LLC (since 2010). | Since March 2015 | ||
Christian J. Kelly 1975 Treasurer and Principal Financial and Accounting Officer | Vice President, Head of Fund Administration of PGIM Investments LLC (since November 2018); formerly Director of Fund Administration of Lord Abbett & Co. LLC (2009-2018), Treasurer and Principal Accounting Officer of the Lord Abbett Family of Funds (2017-2018); Director of Accounting, Avenue Capital Group (2008-2009); Senior Manager, Investment Management Practice of Deloitte & Touche LLP (1998-2007). | Since January 2019 | ||
Lana Lomuti 1967 Assistant Treasurer | Vice President (since 2007) and Director (2005-2007), within PGIM Investments Fund Administration; formerly Assistant Treasurer (December 2007-February 2014) of The Greater China Fund, Inc. | Since April 2014 | ||
Russ Shupak 1973 Assistant Treasurer | Vice President (since 2017) and Director (2013-2017), within PGIM Investments Fund Administration. | Since October 2019 | ||
Visit our website at pgim.com/investments
Fund Officers(a) | ||||
Name Year of Birth Fund Position | Principal Occupation(s) During Past Five Years | Length of Service as Fund Officer | ||
Deborah Conway 1969 Assistant Treasurer | Vice President (since 2017) and Director (2007-2017), within PGIM Investments Fund Administration. | Since October 2019 | ||
Elyse M. McLaughlin 1974 Assistant Treasurer | Vice President (since 2017) and Director (2011-2017), within PGIM Investments Fund Administration. | Since October 2019 | ||
Jonathan Corbett 1983 Anti-Money Laundering Compliance Officer | Vice President, Corporate Compliance, Global Compliance Programs and Compliance Risk Management (since August 2019) of Prudential; formerly Vice President and Head of Key Risk Areas Compliance (March 2016 to July 2019), Chief Privacy Officer (March 2016 to July 2019) and Head of Global Financial Crimes Unit (April 2014 to March 2016) at MetLife. | Since October 2021 | ||
| (a) | Excludes Mr. Parker and Mr. Benjamin, interested Board Members who also serve as President and Vice President, respectively. |
Explanatory Notes to Tables:
| ∎ | Board Members are deemed to be “Interested,” as defined in the 1940 Act, by reason of their affiliation with PGIM Investments LLC and/or an affiliate of PGIM Investments LLC. |
| ∎ | Unless otherwise noted, the address of all Board Members and Officers is c/o PGIM Investments LLC, 655 Broad Street, Newark, New Jersey 07102-4410. |
| ∎ | There is no set term of office for Board Members or Officers. The Board Members have adopted a retirement policy, which calls for the retirement of Board Members on December 31 of the year in which they reach the age of 75. |
| ∎ | “Other Directorships Held” includes all directorships of companies required to register or file reports with the SEC under the 1934 Act (that is, “public companies”) or other investment companies registered under the 1940 Act. |
| ∎ | “Portfolios Overseen” includes all investment companies managed by PGIM Investments LLC. The investment companies for which PGIM Investments LLC serves as manager include the PGIM Funds, Target Funds, The Prudential Variable Contract Accounts, PGIM ETF Trust, PGIM High Yield Bond Fund, Inc., PGIM Global High Yield Fund, Inc., PGIM Short Duration High Yield Opportunities Fund, The Prudential Series Fund, Prudential’s Gibraltar Fund, Inc. and the Advanced Series Trust. |
| ∎ | As used in the Fund Officers table “Prudential” means The Prudential Insurance Company of America. |
Prudential Investment Portfolios 2
| ∎ TELEPHONE | ∎ WEBSITE | |||
| 655 Broad Street | (800) 225-1852 | pgim.com/investments | ||
| Newark, NJ 07102 |
PROXY VOTING
The Board of Trustees of the Funds has delegated to the Fund’s subadvisers the responsibility for voting any proxies and maintaining proxy recordkeeping with respect to the Fund. A description of these proxy voting policies and procedures is available without charge, upon request, by calling (800) 225-1852 or by visiting the Securities and Exchange Commission’s website at sec.gov. Information regarding how the Fund voted proxies relating to portfolio securities during the most recent 12-month period ended June 30 is available on the Fund’s website and on the Securities and Exchange Commission’s website.
TRUSTEES
Ellen S. Alberding · Kevin J. Bannon · Scott E. Benjamin · Linda W. Bynoe · Barry H. Evans · Keith F. Hartstein · Laurie Simon Hodrick
· Stuart S. Parker · Brian K. Reid · Grace C. Torres
OFFICERS
Stuart S. Parker, President · Scott E. Benjamin, Vice President · Christian J. Kelly, Treasurer and Principal Financial and Accounting Officer
· Claudia DiGiacomo, Chief Legal Officer · Dino Capasso, Chief Compliance Officer · Jonathan Corbett, Anti-Money Laundering Compliance Officer
· Andrew R. French, Secretary · Melissa Gonzalez, Assistant Secretary · Diana N. Huffman, Assistant Secretary · Kelly A. Coyne, Assistant Secretary · Patrick E. McGuinness, Assistant Secretary · Debra Rubano, Assistant Secretary · Lana Lomuti, Assistant Treasurer · Russ Shupak, Assistant Treasurer · Elyse McLaughlin, Assistant Treasurer · Deborah Conway, Assistant Treasurer
MANAGER | PGIM Investments LLC | 655 Broad Street | ||
| Newark, NJ 07102 | ||||
SUBADVISERS | PGIM Fixed Income | 655 Broad Street | ||
| Newark, NJ 07102 | ||||
| PGIM Limited | Grand Buildings, 1-3 Strand | |||
| Trafalgar Square | ||||
| London, WC2N 5HR | ||||
| United Kingdom | ||||
DISTRIBUTOR | Prudential Investment | 655 Broad Street | ||
| Management Services LLC | Newark, NJ 07102 | |||
CUSTODIAN | The Bank of New York Mellon | 240 Greenwich Street New York, NY 10286 | ||
TRANSFER AGENT | Prudential Mutual Fund Services LLC | PO Box 9658 Providence, RI 02940 | ||
| INDEPENDENT REGISTERED PUBLIC ACCOUNTING FIRM | PricewaterhouseCoopers LLP | 300 Madison Avenue New York, NY 10017 | ||
FUND COUNSEL | Willkie Farr & Gallagher LLP | 787 Seventh Avenue | ||
| New York, NY 10019 | ||||
An investor should consider the investment objectives, risks, charges, and expenses of the Fund carefully before investing. The prospectus contain this and other information about the Funds. An investor may obtain a prospectus by visiting our website at pgim.com/investments or by calling (800) 225-1852. Each prospectus should be read carefully before investing.
SHAREHOLDER COMMUNICATIONS WITH TRUSTEES
Shareholders can communicate directly with the Board of Trustees by writing to the Chair of the Board, c/o PGIM Investments, Attn: Board of Trustees, 655 Broad Street, Newark, NJ 07102. Shareholders can communicate directly with an individual Trustee by writing to that Trustee at the same address. Communications are not screened before being delivered to the addressee.
AVAILABILITY OF PORTFOLIO HOLDINGS
PGIM Core Short-Term Bond Fund and PGIM Core Ultra-Short Bond Fund: The Funds’ file their complete schedules of portfolio holdings with the Securities and Exchange Commission for the first and third quarters of each fiscal year on Form N-PORT. The Funds’ Form N-PORT filings are available on the Commission’s website at sec.gov. Form N-PORT is filed with the Commission quarterly, and each Fund’s full portfolio holdings as of the first and third fiscal quarter-ends will be made publicly available 60 days after the end of each quarter.
PGIM Institutional Money Market Fund: The Fund files a complete schedule of portfolio holdings with the Commission monthly on Form N-MFP. The Commission delays the public availability of the information filed on Form N-MFP for 60 days after the end of the reporting period included in the filing. The Form N-MFP filings (along with the Fund’s annual report filed on Form N-CSR and semi-annual report filed on Form N-CSRS) are available on the Commission’s website at sec.gov. The Fund’s complete holdings are also available on pgiminvestments.com.
Mutual Funds:
ARE NOT INSURED BY THE FDIC OR ANY FEDERAL GOVERNMENT AGENCY
| MAY LOSE VALUE |
ARE NOT A DEPOSIT OF OR GUARANTEED BY ANY BANK OR ANY BANK AFFILIATE
| ||

| CUSIP | ||
PGIM CORE SHORT-TERM BOND FUND | 74440E102 | |
PGIM CORE ULTRA SHORT BOND FUND | 74440E201 | |
PGIM INSTITUTIONAL MONEY MARKET FUND | 74440E300 | |
| Item 2 – | Code of Ethics — See Exhibit (a) |
As of the end of the period covered by this report, the registrant has adopted a code of ethics (the “Section 406 Standards for Investment Companies – Ethical Standards for Principal Executive and Financial Officers”) that applies to the registrant’s Principal Executive Officer and Principal Financial Officer; the registrant’s Principal Financial Officer also serves as the Principal Accounting Officer.
The registrant hereby undertakes to provide any person, without charge, upon request, a copy of the code of ethics. To request a copy of the code of ethics, contact the registrant 800-225-1852, and ask for a copy of the Section 406 Standards for Investment Companies - Ethical Standards for Principal Executive and Financial Officers.
| Item 3 – | Audit Committee Financial Expert – |
The registrant’s Board has determined that Ms. Grace C. Torres, member of the Board’s Audit Committee is an “audit committee financial expert,” and that she is “independent,” for purposes of this item.
| Item 4 – | Principal Accountant Fees and Services – |
(a) Audit Fees
For the fiscal years ended January 31, 2022 and January 31, 2021, PricewaterhouseCoopers LLP (“PwC”), the Registrant’s principal accountant, billed the Registrant $88,850 and $88,850 respectively, for professional services rendered for the audit of the Registrant’s annual financial statements or services that are normally provided in connection with statutory and regulatory filings.
(b) Audit-Related Fees
For the fiscal years ended January 31, 2022 and January 31, 2021, PwC did not bill the Registrant for audit-related services.
For the fiscal year ended January 31, 2022 and January 31, 2021, fees of $620 and $6,105 were billed to the Registrant for services rendered by KPMG LLP (the Registrant’s prior principal accountant) in connection with the auditor transition.
(c) Tax Fees
For the fiscal years ended January 31, 2022 and January 31, 2021: none.
(d) All Other Fees
For the fiscal years ended January 31, 2022 and January 31, 2021: none.
(e) (1) Audit Committee Pre-Approval Policies and Procedures
THE PGIM MUTUAL FUNDS
AUDIT COMMITTEE POLICY
on
Pre-Approval of Services Provided by the Independent
Accountants
The Audit Committee of each PGIM Mutual Fund is charged with the responsibility to monitor the independence of the Fund’s independent accountants. As part of this responsibility, the Audit Committee must pre-approve the independent accounting firm’s engagement to render audit and/or permissible non-audit services, as required by law. In evaluating a proposed engagement of the independent accountants, the Audit Committee will assess the effect that the engagement might reasonably be expected to have on the accountant’s independence. The Committee’s evaluation will be based on:
| • | a review of the nature of the professional services expected to be provided, |
| • | a review of the safeguards put into place by the accounting firm to safeguard independence, and |
| • | periodic meetings with the accounting firm. |
Policy for Audit and Non-Audit Services Provided to the Funds
On an annual basis, the scope of audits for each Fund, audit fees and expenses, and audit-related and non-audit services (and fees proposed in respect thereof) proposed to be performed by the Fund’s independent accountants will be presented by the Treasurer and the independent accountants to the Audit Committee for review and, as appropriate, approval prior to the initiation of such services.
Such presentation shall be accompanied by confirmation by both the Treasurer and the independent accountants that the proposed
non-audit services will not adversely affect the independence of the independent accountants. Such proposed non-audit services shall be described in sufficient detail to enable the Audit Committee to assess the appropriateness of such services and fees, and the compatibility of the provision of such services with the auditor’s independence. The Committee shall receive periodic reports on the progress of the audit and other services which are approved by the Committee or by the Committee Chair pursuant to authority delegated in this Policy.
The categories of services enumerated under “Audit Services”, “Audit-related Services”, and “Tax Services” are intended to provide guidance to the Treasurer and the independent accountants as to those categories of services which the Committee believes are generally consistent with the independence of the independent accountants and which the Committee (or the Committee Chair) would expect upon the presentation of specific proposals to pre-approve. The enumerated categories are not intended as an exclusive list of audit, audit-related or tax services, which the Committee (or the Committee Chair) would consider for pre-approval.
Audit Services
The following categories of audit services are considered to be consistent with the role of the Fund’s independent accountants:
| • | Annual Fund financial statement audits |
| • | Seed audits (related to new product filings, as required) |
| • | SEC and regulatory filings and consents |
Audit-related Services
The following categories of audit-related services are considered to be consistent with the role of the Fund’s independent accountants:
| • | Accounting consultations |
| • | Fund merger support services |
| • | Agreed Upon Procedure Reports |
| • | Attestation Reports |
| • | Other Internal Control Reports |
Individual audit-related services that fall within one of these categories (except for fund merger support services) and are not presented to the Audit Committee as part of the annual pre-approval process are subject to an authorized pre-approval by the Audit Committee so long as the estimated fee for those services does not exceed $30,000. Any services provided under such
pre-approval will be reported to the Audit Committee at its next regular meeting. Should the amount of such services exceed $30,000 any additional fees will be subject to pre-approval by the Committee Chair (or any other Committee member on whom this responsibility has been delegated). Fees related to fund merger support services are subject to a separate authorized pre-approval by the Audit Committee with fees determined on a per occurrence and merger complexity basis.
Tax Services
The following categories of tax services are considered to be consistent with the role of the Fund’s independent accountants:
| • | Tax compliance services related to the filing or amendment of the following: |
| • | Federal, state and local income tax compliance; and, |
| • | Sales and use tax compliance |
| • | Timely RIC qualification reviews |
| • | Tax distribution analysis and planning |
| • | Tax authority examination services |
| • | Tax appeals support services |
| • | Accounting methods studies |
| • | Fund merger support services |
| • | Tax consulting services and related projects |
Individual tax services that fall within one of these categories and are not presented to the Audit Committee as part of the annual pre-approval process are subject to an authorized pre-approval by the Audit Committee so long as the estimated fee for those services does not exceed $30,000. Any services provided under such pre-approval will be reported to the Audit Committee at its next regular meeting. Should the amount of such services exceed $30,000 any additional fees will be subject to pre-approval by the Committee Chair (or any other Committee member on whom this responsibility has been delegated).
Other Non-Audit Services
Certain non-audit services that the independent accountants are legally permitted to render will be subject to pre-approval by the Committee or by one or more Committee members to whom the Committee has delegated this authority and who will report to the full Committee any pre-approval decisions made pursuant to this Policy. Non-audit services presented for pre-approval pursuant to this paragraph will be accompanied by a confirmation from both the Treasurer and the independent accountants that the proposed services will not adversely affect the independence of the independent accountants.
Proscribed Services
The Fund’s independent accountants will not render services in the following categories of non-audit services:
| • | Bookkeeping or other services related to the accounting records or financial statements of the Fund |
| • | Financial information systems design and implementation |
| • | Appraisal or valuation services, fairness opinions, or contribution-in-kind reports |
| • | Actuarial services |
| • | Internal audit outsourcing services |
| • | Management functions or human resources |
| • | Broker or dealer, investment adviser, or investment banking services |
| • | Legal services and expert services unrelated to the audit |
| • | Any other service that the Public Company Accounting Oversight Board determines, by regulation, is impermissible. |
Pre-approval of Non-Audit Services Provided to Other Entities Within the PGIM Fund Complex
Certain non-audit services provided to PGIM Investments LLC or any of its affiliates that also provide ongoing services to the PGIM Mutual Funds will be subject to pre-approval by the Audit Committee. The only non-audit services provided to these entities that will require pre-approval are those related directly to the operations and financial reporting of the Funds. Individual projects that are not presented to the Audit Committee as part of the annual pre-approval process will be subject to pre-approval by the Committee Chair (or any other Committee member on whom this responsibility has been delegated) so long as the estimated fee for those services does not exceed $30,000. Services presented for pre-approval pursuant to this paragraph will be accompanied by a confirmation from both the Treasurer and the independent accountants that the proposed services will not adversely affect the independence of the independent accountants.
Although the Audit Committee will not pre-approve all services provided to PGIM Investments LLC and its affiliates, the Committee will receive an annual report from the Fund’s independent accounting firm showing the aggregate fees for all services provided to PGIM Investments and its affiliates.
(e) (2) Percentage of services referred to in 4(b) – 4(d) that were approved by the audit committee –
For the fiscal years ended January 31, 2022 and January 31, 2021, 100% of the services referred to in Item 4(b) was approved by the audit committee.
(f) Percentage of hours expended attributable to work performed by other than full time employees of principal accountant if greater than 50%.
The percentage of hours expended on the principal accountant’s engagement to audit the registrant’s financial statements for the most recent fiscal year that were attributed to work performed by persons other than the principal accountant’s full-time, permanent employees was 0%.
(g) Non-Audit Fees
The aggregate non-audit fees billed by the Registrant’s principal accountant for services rendered to the registrant’s investment adviser and any entity controlling, controlled by, or under common control with the investment adviser that provides ongoing services to the registrant for the fiscal years ended January 31, 2022 and January 31, 2021 was $0 and $0, respectively.
(h) Principal Accountant’s Independence
Not applicable as the Registrant’s principal accountant has not provided non-audit services to the registrant’s investment adviser and any entity controlling, controlled by, or under common control with the investment adviser that provides ongoing services to the registrant that were not pre-approved pursuant to Rule 2-01(c)(7)(ii) of Regulation S-X.
| Item 5 – | Audit Committee of Listed Registrants – Not applicable. |
| Item 6 – | Schedule of Investments – The schedule is included as part of the report to shareholders filed under Item 1 of this Form. |
| Item 7 – | Disclosure of Proxy Voting Policies and Procedures for Closed-End Management Investment Companies – Not applicable. |
| Item 8 – | Portfolio Managers of Closed-End Management Investment Companies – Not applicable. |
| Item 9 – | Purchases of Equity Securities by Closed-End Management Investment Company and Affiliated Purchasers – Not applicable. |
| Item 10 – | Submission of Matters to a Vote of Security Holders – There have been no material changes to these procedures. |
| Item 11 – | Controls and Procedures |
| (a) | It is the conclusion of the registrant’s principal executive officer and principal financial officer that the |
| effectiveness of the registrant’s current disclosure controls and procedures (such disclosure controls and procedures having been evaluated within 90 days of the date of this filing) provide reasonable assurance that the information required to be disclosed by the registrant has been recorded, processed, summarized and reported within the time period specified in the Commission’s rules and forms and that the information required to be disclosed by the registrant has been accumulated and communicated to the registrant’s principal executive officer and principal financial officer in order to allow timely decisions regarding required disclosure. |
| (b) | There has been no significant change in the registrant’s internal control over financial reporting that occurred during the registrant’s most recent fiscal quarter of the period covered by this report that has materially affected, or is likely to materially affect, the registrant’s internal control over financial reporting. |
| Item 12 – | Controls and Procedures - Disclosure of Securities Lending Activities for Closed-End Management Investment Companies – Not applicable. |
| Item 13 – | Exhibits |
| (3) | Any written solicitation to purchase securities under Rule 23c-1 – Not applicable. |
SIGNATURES
Pursuant to the requirements of the Securities Exchange Act of 1934 and the Investment Company Act of 1940, the registrant has duly caused this report to be signed on its behalf by the undersigned, thereunto duly authorized.
| Registrant | Prudential Investment Portfolios 2 | |
| By: | /s/ Andrew R. French | |
| Andrew R. French | ||
| Secretary | ||
| Date: | March 22, 2022 | |
Pursuant to the requirements of the Securities Exchange Act of 1934 and the Investment Company Act of 1940, this report has been signed below by the following persons on behalf of the registrant and in the capacities and on the dates indicated.
| By: | /s/ Stuart S. Parker | |
| Stuart S. Parker | ||
| President and Principal Executive Officer | ||
| Date: | March 22, 2022 | |
| By: | /s/ Christian J. Kelly | |
| Christian J. Kelly | ||
| Treasurer and Principal Financial and Accounting Officer | ||
| Date: | March 22, 2022 | |