UNITED STATES
SECURITIES AND EXCHANGE COMMISSION
Washington, D.C. 20549
FORM N-CSR
CERTIFIED SHAREHOLDER REPORT OF REGISTERED MANAGEMENT INVESTMENT COMPANIES
| | |
| Investment Company Act file number: | | 811-09999 |
| |
| Exact name of registrant as specified in charter: | | Prudential Investment Portfolios 2 |
|
| (This Form N-CSR relates solely to the Registrant’s PGIM Quant Solutions Emerging Markets Equity Fund and PGIM Quant Solutions International Developed Markets Index Fund (each a “Fund” and collectively the “Funds”)) |
| |
| Address of principal executive offices: | | 655 Broad Street, 6th Floor |
| | Newark, New Jersey 07102 |
| |
| Name and address of agent for service: | | Andrew R. French |
| | 655 Broad Street, 6th Floor |
| | Newark, New Jersey 07102 |
| |
| Registrant’s telephone number, including area code: | | 800-225-1852 |
| |
| Date of fiscal year end: | | 10/31/2023 |
| |
| Date of reporting period: | | 10/31/2023 |
Item 1 – Reports to Stockholders

PGIM QUANT SOLUTIONS EMERGING MARKETS EQUITY FUND
ANNUAL REPORT
OCTOBER 31, 2023

To enroll in e-delivery, go to pgim.com/investments/resource/edelivery
Table of Contents
This report is not authorized for distribution to prospective investors unless preceded or accompanied by a current prospectus.
The views expressed in this report and information about the Fund’s portfolio holdings are for the period covered by this report and are subject to change thereafter.
Mutual funds are distributed by Prudential Investment Management Services LLC, a Prudential Financial company, member SIPC. PGIM Quantitative Solutions LLC, a wholly owned subsidiary of PGIM, Inc. (PGIM), is a registered investment adviser. © 2023 Prudential Financial, Inc. and its related entities. PGIM and the PGIM logo are service marks of Prudential Financial, Inc. and its related entities, registered in many jurisdictions worldwide.
2 Visit our website at pgim.com/investments
Letter from the President
| | |
 | | Dear Shareholder: |
| | We hope you find the annual report for the PGIM Quant Solutions Emerging Markets Equity Fund informative and useful. The report covers performance for the 12-month period that ended October 31, 2023. Although central banks raised interest rates aggressively to tame surging inflation during the period, the global economy and financial markets demonstrated resilience. Employers continued hiring, consumers continued spending, home prices rose, and recession fears receded. |
Early in the period, stocks began a rally that eventually ended a bear market and continued to rise globally for much of 2023 as inflation cooled and the Federal Reserve (the Fed) slowed the pace of its rate hikes. However, stocks declined late in the period when the Fed signaled that rates may remain elevated longer than investors had expected. For the entire period, large-cap US stocks and equities in international markets posted gains, while small-cap US stocks declined.
Bond markets benefited during the period as the Fed moderated its rate-hiking cycle, and the higher level of interest rates offered investors an additional cushion from fixed income volatility. US and global investment-grade bonds, along with US high yield corporate bonds and emerging market debt, all posted gains.
Regarding your investments with PGIM, we believe it is important to maintain a diversified portfolio of funds consistent with your tolerance for risk, time horizon, and financial goals. Your financial advisor can help you create a diversified investment plan that may include funds covering all the basic asset classes and that reflects your personal investor profile and risk tolerance. However, diversification and asset allocation strategies do not assure a profit or protect against loss in declining markets.
At PGIM Investments, we provide access to active investment strategies across the global markets in the pursuit of consistent outperformance for investors. PGIM is the world’s 14th-largest investment manager with more than $1.3 trillion in assets under management. Our scale and investment expertise allow us to deliver a diversified suite of actively managed solutions across a broad spectrum of asset classes and investment styles.
Thank you for choosing our family of funds.
Sincerely,

Stuart S. Parker, President
PGIM Quant Solutions Emerging Markets Equity Fund
December 15, 2023
PGIM Quant Solutions Emerging Markets Equity Fund 3
Your Fund’s Performance (unaudited)
Performance data quoted represent past performance. Past performance does not guarantee future results. The investment return and principal value of an investment will fluctuate so that an investor’s shares, when redeemed, may be worth more or less than their original cost. Current performance may be lower or higher than the past performance data quoted. An investor may obtain performance data as of the most recent month-end by visiting our website at pgim.com/investments or by calling (800) 225-1852.
| | | | | | |
| |
| | | Average Annual Total Returns as of 10/31/23 |
| | | One Year (%) | | Five Years (%) | | Since Inception (%) |
| | | |
Fund | | 13.37 | | 1.50 | | 3.31 (11/29/2016) |
| | | |
MSCI Emerging Markets Index | | | | | | |
| | | |
| | | 10.80 | | 1.59 | | 3.34 |
The returns in the tables do not reflect the deduction of taxes that a shareholder would pay on Fund distributions or following the redemption of Fund shares. Since Inception returns are provided for less than 10 fiscal years of returns. Since Inception returns for the Index are measured from the closest month-end to the Fund’s inception date.
Growth of a $10,000 Investment (unaudited)
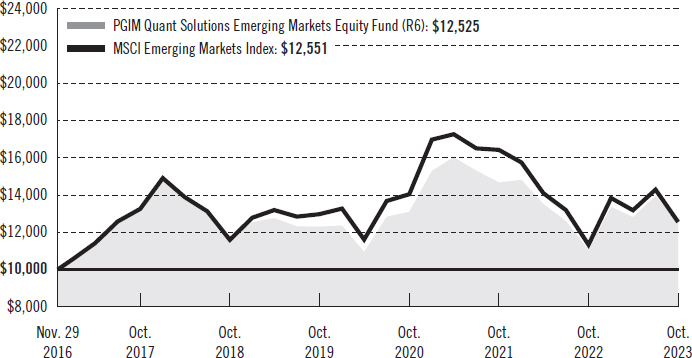
The graph compares a $10,000 investment in the Fund with a similar investment in the MSCI Emerging Markets Index by portraying the initial account values at the commencement of operations of the Fund (November 29, 2016) and the account values at the end of the current fiscal year (October 31, 2023) as measured on a quarterly basis. For purposes of the graph, and unless otherwise indicated, it has been assumed that (a) all recurring fees (including management fees) were deducted and (b) all dividends and distributions were reinvested. Without waiver of fees and/or expense reimbursements, if any, the returns would have been lower.
4 Visit our website at pgim.com/investments
Past performance does not predict future performance. Total returns and the ending account values in the graphs include changes in share price and reinvestment of dividends and capital gains distributions in a hypothetical investment for the periods shown. The Fund’s total returns do not reflect the deduction of income taxes on an individual’s investment. Taxes may reduce your actual investment returns on income or gains paid by the Fund or any gains you may realize if you sell your shares.
Benchmark Definition
MSCI Emerging Markets Index—The MSCI Emerging Markets Index is an unmanaged free float-adjusted market capitalization-weighted index that is designed to measure equity market performance of emerging markets. It consists of the following 24 emerging market country indexes: Brazil, Chile, China, Colombia, the Czech Republic, Egypt, Greece, Hungary, India, Indonesia, Korea, Kuwait, Malaysia, Mexico, Peru, Philippines, Poland, Qatar, Saudi Arabia, South Africa, Taiwan, Thailand, Turkey, and the United Arab Emirates.
Investors cannot invest directly in an index. The returns for the Index would be lower if they included the effects of sales charges, operating expenses of a mutual fund, or taxes that may be paid by an investor.
PGIM Quant Solutions Emerging Markets Equity Fund 5
Your Fund’s Performance (continued)
Presentation of Fund Holdings as of 10/31/23
| | | | | | |
| | | |
| Ten Largest Holdings | | Line of Business | | Country | | % of Net Assets |
| | | |
Taiwan Semiconductor Manufacturing Co. Ltd. | | Semiconductors & Semiconductor Equipment | | Taiwan | | 6.5% |
| | | |
Tencent Holdings Ltd. | | Interactive Media & Services | | China | | 3.9% |
| | | |
Alibaba Group Holding Ltd. | | Broadline Retail | | China | | 3.3% |
| | | |
Samsung Electronics Co. Ltd. | | Technology Hardware, Storage & Peripherals | | South Korea | | 3.1% |
| | | |
PDD Holdings, Inc., ADR | | Broadline Retail | | China | | 1.6% |
| | | |
China Construction Bank Corp. (Class H Stock) | | Banks | | China | | 1.5% |
| | | |
NetEase, Inc., ADR | | Entertainment | | China | | 1.3% |
| | | |
Meituan (Class B Stock), 144A | | Hotels, Restaurants & Leisure | | China | | 1.2% |
| | | |
Petroleo Brasileiro SA (PRFC) | | Oil, Gas & Consumable Fuels | | Brazil | | 1.2% |
| | | |
BYD Co. Ltd. (Class H Stock) | | Automobiles | | China | | 1.0% |
Holdings reflect only long-term investments and are subject to change.
6 Visit our website at pgim.com/investments
Strategy and Performance Overview* (unaudited)
How did the Fund perform?
The PGIM Quant Solutions Emerging Markets Equity Fund’s Class R6 shares returned 13.37% in the 12-month reporting period that ended October 31, 2023, outperforming the 10.80% return of the MSCI Emerging Markets Index (the Index).
What were the market conditions?
| ● | Investors remained cautious during the reporting period despite generally decreasing inflationary pressures and moderating fears of a global economic recession. Persistent geopolitical pressures, particularly the Russia-Ukraine war and its corollaries, softening Chinese economic data, and the potential paradigm shift as Russia and China forge economic alliances, did little to quell investor concerns. |
| ● | PGIM Quantitative Solutions’ model performed relatively well throughout this period of heightened volatility. For the year-over-year period, value was the predominant driver of outperformance, with top-down measures also providing a strong, positive contribution to returns relative to the Index. |
What worked?
Several positions bolstered the Fund’s returns relative to the Index during the reporting period, including:
| ● | A tilt toward information technology in Taiwan. |
| ● | A tilt toward financials in South Korea, the United Arab Emirates, and Turkey. |
| ● | Favoring reasonable priced financials across Korea, China, Turkey, and Brazil. |
| ● | A tilt away from expensive material names in South Korea. |
| ● | A broad tilt away from utilities. |
| ● | A tilt toward high-quality information technology names in Taiwan. |
What didn’t work?
Positions detracting materially from the Fund’s relative returns included:
| ● | Issue selection in Chinese real estate. |
| ● | A tilt towards communication services. |
| ● | A tilt towards information technology names. |
| ● | A tilt away from consumer discretionary names in India. |
| ● | Slight detractors included: |
| | ● | Favoring fast-growth materials and communication services names. |
| | ● | A tilt toward inexpensive material names. |
Did the Fund use derivatives?
The Fund held fully collateralized index futures during the reporting period that were used for cash management purposes. They had a negligible impact on performance.
PGIM Quant Solutions Emerging Markets Equity Fund 7
Strategy and Performance Overview* (continued)
Current outlook
| ● | Global economic activity remained resilient through the third quarter of 2023 despite considerable monetary tightening by global central banks over the past 18 months and the consequent speculation earlier this year that a US recession could be imminent. |
| ● | Global equity markets delivered mixed performance for much of the third quarter of 2023, with US stocks pulling back modestly despite better-than-expected corporate quarterly results. |
| ● | While sector composition often explains much of the difference in valuation between the US and the rest of the world, the subadviser believes US stocks appear relatively expensive, even after accounting for composition effects. |
| ● | Strong labor demand in the US has provided a buffer to household incomes and supported private consumption, while fiscal stimulus continues to boost the economy. The most likely economic scenario is one of modest US growth in late 2023 and into 2024, with a lower risk of recession in the near term. |
| ● | Europe’s post-pandemic recovery has already faded, with second-quarter GDP growth just barely positive in the Eurozone, UK, and Switzerland. The risks of a European recession are significant. Available hard data for the third quarter of 2023 are mixed, while soft data appear bleak. |
| ● | In contrast to Europe and China, the subadviser believes Japan is a relative bright spot, helped by a more supportive central bank. The Japanese economy remains underpinned by solid consumption and business spending. |
| ● | Growth is likely to remain weak in China, barring significant measures by the government to jump-start the economy. Consumption spending and industrial activity remain anemic, while the real estate sector continues to struggle. |
| ● | Central banks are making progress in their fight against inflation. US headline inflation remains driven by geopolitics and supply cuts implemented by the OPEC+ group of petroleum producing nations, but core inflation has declined from its peak. Eurozone core inflation has moderated slightly from recent highs. |
| ● | Although their hiking cycles appear to be ending, the US Federal Reserve and European Central Bank are likely to keep monetary policy tight until they have more confidence that they can reach their inflation goals. |
| ● | While other central banks have raised interest rates, the Bank of Japan has kept rates low and is just beginning to allow more flexibility in its yield curve control program. |
| ● | While the People’s Bank of China continued to cut interest rates marginally in the third quarter of 2023, it is still holding back from a “bazooka” stimulus to restart the economy. |
*This strategy and performance overview, which discusses what strategies or holdings (including derivatives, if applicable) affected the Fund’s performance, is compiled based on how the Fund performed relative to the Index and is viewed for performance attribution purposes at the aggregate Fund level, which in most instances will not directly correlate to the amounts disclosed in the Statement of Operations which conform to US generally accepted accounting principles.
8 Visit our website at pgim.com/investments
Fees and Expenses (unaudited)
As a shareholder of the Fund, you incur two types of costs: (1) transaction costs, including sales charges (loads) on purchase payments and redemptions, as applicable, and (2) ongoing costs, including management fees, distribution and/or service (12b-1) fees, and other Fund expenses, as applicable. This example is intended to help you understand your ongoing costs (in dollars) of investing in the Fund and to compare these costs with the ongoing costs of investing in other mutual funds.
The example is based on an investment of $1,000 held through the six-month period ended October 31, 2023. The example is for illustrative purposes only; you should consult the Prospectus for information on initial and subsequent minimum investment requirements.
Actual Expenses
The first line in the table on the following page provides information about actual account values and actual expenses. You may use the information on this line, together with the amount you invested, to estimate the expenses that you paid over the period. Simply divide your account value by $1,000 (for example, an $8,600 account value ÷ $1,000 = 8.6), then multiply the result by the number on the first line under the heading “Expenses Paid During the Six-Month Period” to estimate the expenses you paid on your account during this period.
Hypothetical Example for Comparison Purposes
The second line in the table on the following page provides information about hypothetical account values and hypothetical expenses based on the Fund’s actual expense ratio and an assumed rate of return of 5% per year before expenses, which is not the Fund’s actual return. The hypothetical account values and expenses may not be used to estimate the actual ending account balance or expenses you paid for the period. You may use this information to compare the ongoing costs of investing in the Fund and other funds. To do so, compare this 5% hypothetical example with the 5% hypothetical examples that appear in the shareholder reports of the other funds.
The Fund’s transfer agent may charge additional fees to holders of certain accounts that are not included in the expenses shown in the table on the following page. These fees apply to individual retirement accounts (IRAs) and Section 403(b) accounts. As of the close of the six-month period covered by the table, IRA fees included an annual maintenance fee of $15 per account (subject to a maximum annual maintenance fee of $25 for all accounts held by the same shareholder). Section 403(b) accounts are charged an annual $25 fiduciary maintenance fee. Some of the fees may vary in amount, or may be waived, based on your total account balance or the number of PGIM funds, including the Fund, that you own. You should consider the additional fees that were charged to your Fund account over the six-month period when you estimate the total ongoing expenses paid over the period and the impact of these fees on your ending account value, as these additional expenses are not reflected in the information provided in the expense table. Additional fees have the effect of reducing investment returns.
PGIM Quant Solutions Emerging Markets Equity Fund 9
Fees and Expenses (continued)
Please note that the expenses shown in the table are meant to highlight your ongoing costs only and do not reflect any transactional costs such as sales charges (loads). Therefore, the second line in the table is useful in comparing ongoing costs only and will not help you determine the relative total costs of owning different funds. In addition, if these transactional costs were included, your costs would have been higher.
| | | | | | | | | | |
| | | | |
PGIM Quant Solutions Emerging Markets Equity Fund | | Beginning
Account Value
May 1, 2023 | | Ending
Account Value
October 31, 2023 | | Annualized Expense
Ratio Based on the
Six-Month Period | | Expenses Paid During the
Six-Month Period* |
| | | | | |
Class R6 | | Actual | | $1,000.00 | | $ 977.90 | | 1.22% | | $6.08 |
| | | | | |
| | | Hypothetical | | $1,000.00 | | $1,019.06 | | 1.22% | | $6.21 |
*Fund expenses (net of fee waivers or subsidies, if any) are equal to the annualized expense ratio (provided in the table), multiplied by the average account value over the period, multiplied by the 184 days in the six-month period ended October 31, 2023, and divided by the 365 days in the Fund’s fiscal year ended October 31, 2023 (to reflect the six-month period). Expenses presented in the table include the expenses of any underlying portfolios in which the Fund may invest.
10 Visit our website at pgim.com/investments
Schedule of Investments
as of October 31, 2023
| | | | | | | | |
| | |
| Description | | Shares | | | Value | |
| | |
LONG-TERM INVESTMENTS 98.1% | | | | | | | | |
| | |
COMMON STOCKS 94.6% | | | | | | | | |
| | |
Brazil 4.3% | | | | | | | | |
| | |
B3 SA - Brasil Bolsa Balcao | | | 127,500 | | | $ | 281,970 | |
Banco Bradesco SA | | | 8,801 | | | | 21,384 | |
Banco do Brasil SA | | | 31,300 | | | | 300,289 | |
BB Seguridade Participacoes SA | | | 4,600 | | | | 27,992 | |
Centrais Eletricas Brasileiras SA | | | 6,800 | | | | 46,801 | |
Cia Siderurgica Nacional SA | | | 3,600 | | | | 8,418 | |
CPFL Energia SA | | | 31,000 | | | | 206,042 | |
Engie Brasil Energia SA | | | 1,100 | | | | 8,607 | |
Petroleo Brasileiro SA | | | 20,700 | | | | 155,196 | |
Suzano SA | | | 4,300 | | | | 44,043 | |
Telefonica Brasil SA | | | 2,900 | | | | 25,976 | |
TIM SA | | | 4,000 | | | | 12,051 | |
Vale SA | | | 26,232 | | | | 359,160 | |
Vibra Energia SA | | | 6,500 | | | | 25,553 | |
| | | | | | | | |
| | |
| | | | | | | 1,523,482 | |
| | |
Chile 0.3% | | | | | | | | |
| | |
Cia Sud Americana de Vapores SA | | | 89,544 | | | | 4,972 | |
Empresas CMPC SA | | | 6,270 | | | | 11,213 | |
Enel Chile SA | | | 1,474,956 | | | | 87,300 | |
| | | | | | | | |
| | |
| | | | | | | 103,485 | |
| | |
China 30.4% | | | | | | | | |
| | |
3SBio, Inc., 144A* | | | 246,000 | | | | 218,852 | |
Agricultural Bank of China Ltd. (Class H Stock) | | | 161,000 | | | | 59,466 | |
Alibaba Group Holding Ltd.* | | | 113,300 | | | | 1,166,432 | |
Aluminum Corp. of China Ltd. (Class H Stock) | | | 24,000 | | | | 12,838 | |
ANTA Sports Products Ltd. | | | 11,000 | | | | 124,404 | |
AviChina Industry & Technology Co. Ltd. (Class H Stock) | | | 16,000 | | | | 7,251 | |
Baidu, Inc., ADR* | | | 3,400 | | | | 357,000 | |
Baidu, Inc. (Class A Stock)* | | | 1,300 | | | | 17,067 | |
Bank of Beijing Co. Ltd. (Class A Stock) | | | 89,000 | | | | 55,308 | |
Bank of Changsha Co. Ltd. (Class A Stock) | | | 51,000 | | | | 51,060 | |
Bank of Communications Co. Ltd. (Class H Stock) | | | 182,000 | | | | 107,654 | |
Bank of Hangzhou Co. Ltd. (Class A Stock) | | | 4,500 | | | | 6,560 | |
Bank of Jiangsu Co. Ltd. (Class A Stock) | | | 8,000 | | | | 7,522 | |
Bank of Shanghai Co. Ltd. (Class A Stock) | | | 66,800 | | | | 55,247 | |
Beijing Enterprises Holdings Ltd. | | | 66,500 | | | | 221,569 | |
BYD Co. Ltd. (Class H Stock) | | | 12,000 | | | | 364,922 | |
BYD Electronic International Co. Ltd. | | | 4,000 | | | | 16,698 | |
By-health Co. Ltd. (Class A Stock) | | | 22,200 | | | | 55,398 | |
See Notes to Financial Statements.
PGIM Quant Solutions Emerging Markets Equity Fund 11
Schedule of Investments (continued)
as of October 31, 2023
| | | | | | | | |
| | |
| Description | | Shares | | | Value | |
| | |
COMMON STOCKS (Continued) | | | | | | | | |
| | |
China (cont’d.) | | | | | | | | |
| | |
China CITIC Bank Corp. Ltd. (Class H Stock) | | | 467,000 | | | $ | 208,333 | |
China Coal Energy Co. Ltd. (Class H Stock) | | | 12,000 | | | | 9,426 | |
China Communications Services Corp. Ltd. (Class H Stock) | | | 14,000 | | | | 5,726 | |
China Construction Bank Corp. (Class H Stock) | | | 954,000 | | | | 539,542 | |
China Everbright Bank Co. Ltd. (Class H Stock) | | | 24,000 | | | | 6,846 | |
China Feihe Ltd., 144A | | | 20,000 | | | | 12,427 | |
China Medical System Holdings Ltd. | | | 82,000 | | | | 131,126 | |
China Minsheng Banking Corp. Ltd. (Class H Stock) | | | 608,000 | | | | 202,136 | |
China National Medicines Corp. Ltd. (Class A Stock) | | | 11,000 | | | | 43,141 | |
China Overseas Property Holdings Ltd. | | | 10,000 | | | | 8,685 | |
China Pacific Insurance Group Co. Ltd. (Class H Stock) | | | 42,400 | | | | 104,447 | |
China Railway Signal & Communication Corp. Ltd. (Class A Stock) | | | 44,279 | | | | 28,331 | |
China Resources Land Ltd. | | | 18,000 | | | | 67,376 | |
China Resources Power Holdings Co. Ltd. | | | 12,000 | | | | 23,255 | |
China Tower Corp. Ltd. (Class H Stock), 144A | | | 1,638,000 | | | | 152,745 | |
Chongqing Rural Commercial Bank Co. Ltd. (Class A Stock) | | | 106,400 | | | | 61,607 | |
Chongqing Zhifei Biological Products Co. Ltd. (Class A Stock) | | | 800 | | | | 6,834 | |
CMOC Group Ltd. (Class H Stock) | | | 21,000 | | | | 12,525 | |
CSPC Pharmaceutical Group Ltd. | | | 53,200 | | | | 46,469 | |
Dong-E-E-Jiao Co. Ltd. (Class A Stock) | | | 1,100 | | | | 6,955 | |
ENN Natural Gas Co. Ltd. (Class A Stock) | | | 3,000 | | | | 7,057 | |
Focus Media Information Technology Co. Ltd. (Class A Stock) | | | 59,500 | | | | 56,057 | |
Foxconn Industrial Internet Co. Ltd. (Class A Stock) | | | 24,400 | | | | 48,999 | |
Gongniu Group Co. Ltd. (Class A Stock) | | | 1,900 | | | | 27,368 | |
Gree Electric Appliances, Inc. of Zhuhai (Class A Stock) | | | 11,200 | | | | 51,775 | |
Greentown China Holdings Ltd. | | | 79,500 | | | | 77,126 | |
H World Group Ltd., ADR* | | | 1,000 | | | | 37,660 | |
Haidilao International Holding Ltd., 144A | | | 10,000 | | | | 25,038 | |
Henan Shenhuo Coal & Power Co. Ltd. (Class A Stock) | | | 24,900 | | | | 55,787 | |
Henan Shuanghui Investment & Development Co. Ltd. (Class A Stock) | | | 15,800 | | | | 56,364 | |
Hengan International Group Co. Ltd. | | | 3,500 | | | | 11,723 | |
Hengdian Group DMEGC Magnetics Co. Ltd. (Class A Stock) | | | 24,900 | | | | 49,413 | |
Huaibei Mining Holdings Co. Ltd. (Class A Stock) | | | 5,400 | | | | 10,788 | |
Huaxia Bank Co. Ltd. (Class A Stock) | | | 74,000 | | | | 56,463 | |
Hubei Jumpcan Pharmaceutical Co. Ltd. (Class A Stock) | | | 15,527 | | | | 57,333 | |
Industrial & Commercial Bank of China Ltd. (Class H Stock) | | | 307,000 | | | | 147,128 | |
Industrial Bank Co. Ltd. (Class A Stock) | | | 6,800 | | | | 13,975 | |
iQIYI, Inc., ADR* | | | 2,400 | | | | 11,184 | |
JA Solar Technology Co. Ltd. (Class A Stock) | | | 15,900 | | | | 48,546 | |
JD.com, Inc., ADR | | | 3,100 | | | | 78,802 | |
Jiangsu Phoenix Publishing & Media Corp. Ltd. (Class A Stock) | | | 37,200 | | | | 48,699 | |
See Notes to Financial Statements.
12
| | | | | | | | |
| | |
| Description | | Shares | | | Value | |
| | |
COMMON STOCKS (Continued) | | | | | | | | |
| | |
China (cont’d.) | | | | | | | | |
| | |
Jiangsu Yuyue Medical Equipment & Supply Co. Ltd. (Class A Stock) | | | 11,900 | | | $ | 54,540 | |
Jiangxi Copper Co. Ltd. (Class H Stock) | | | 6,000 | | | | 8,484 | |
Jointown Pharmaceutical Group Co. Ltd. (Class A Stock) | | | 55,920 | | | | 54,237 | |
JOYY, Inc., ADR | | | 300 | | | | 11,676 | |
KE Holdings, Inc., ADR | | | 3,400 | | | | 50,014 | |
Kingsoft Corp. Ltd. | | | 5,200 | | | | 18,145 | |
Kuaishou Technology, 144A* | | | 12,700 | | | | 81,786 | |
Kunlun Energy Co. Ltd. | | | 86,000 | | | | 71,647 | |
Kweichow Moutai Co. Ltd. (Class A Stock) | | | 200 | | | | 45,908 | |
Li Auto, Inc. (Class A Stock)* | | | 1,900 | | | | 32,136 | |
Lingyi iTech Guangdong Co. (Class A Stock) | | | 9,000 | | | | 7,456 | |
LONGi Green Energy Technology Co. Ltd. (Class A Stock) | | | 2,500 | | | | 8,224 | |
Meituan (Class B Stock), 144A* | | | 30,460 | | | | 431,771 | |
Metallurgical Corp. of China Ltd. (Class A Stock) | | | 13,000 | | | | 5,863 | |
MINISO Group Holding Ltd., ADR | | | 600 | | | | 15,186 | |
Muyuan Foods Co. Ltd. (Class A Stock) | | | 2,000 | | | | 10,279 | |
NARI Technology Co. Ltd. (Class A Stock) | | | 2,600 | | | | 8,001 | |
NetEase, Inc. | | | 1,700 | | | | 36,383 | |
NetEase, Inc., ADR | | | 4,300 | | | | 459,756 | |
New China Life Insurance Co. Ltd. (Class H Stock) | | | 4,900 | | | | 10,749 | |
New Oriental Education & Technology Group, Inc.* | | | 8,100 | | | | 52,812 | |
PDD Holdings, Inc., ADR* | | | 5,600 | | | | 567,952 | |
People’s Insurance Co. Group of China Ltd. (The) (Class H Stock) | | | 94,000 | | | | 31,016 | |
PetroChina Co. Ltd. (Class H Stock) | | | 434,000 | | | | 283,279 | |
PICC Property & Casualty Co. Ltd. (Class H Stock) | | | 146,000 | | | | 166,725 | |
Ping An Insurance Group Co. of China Ltd. (Class H Stock) | | | 37,000 | | | | 187,682 | |
Poly Developments & Holdings Group Co. Ltd. (Class A Stock) | | | 4,400 | | | | 6,600 | |
Pop Mart International Group Ltd., 144A | | | 2,600 | | | | 7,177 | |
Qinghai Salt Lake Industry Co. Ltd. (Class A Stock)* | | | 2,800 | | | | 6,461 | |
Sany Heavy Equipment International Holdings Co. Ltd. | | | 6,000 | | | | 7,882 | |
Shandong Himile Mechanical Science & Technology Co. Ltd. (Class A Stock) | | | 11,900 | | | | 52,140 | |
Shanghai Pudong Development Bank Co. Ltd. (Class A Stock) | | | 10,000 | | | | 9,293 | |
Shanghai Rural Commercial Bank Co. Ltd. (Class A Stock) | | | 72,000 | | | | 58,462 | |
Shanxi Lu’an Environmental Energy Development Co. Ltd. (Class A Stock) | | | 21,500 | | | | 55,747 | |
Shenzhen Mindray Bio-Medical Electronics Co. Ltd. (Class A Stock) | | | 400 | | | | 15,582 | |
Shenzhen Transsion Holdings Co. Ltd. (Class A Stock) | | | 410 | | | | 7,509 | |
Shijiazhuang Yiling Pharmaceutical Co. Ltd. (Class A Stock) | | | 2,000 | | | | 6,056 | |
Sichuan Kelun Pharmaceutical Co. Ltd. (Class A Stock) | | | 14,200 | | | | 53,159 | |
Sinopharm Group Co. Ltd. (Class H Stock) | | | 7,600 | | | | 18,174 | |
See Notes to Financial Statements.
PGIM Quant Solutions Emerging Markets Equity Fund 13
Schedule of Investments (continued)
as of October 31, 2023
| | | | | | | | |
| | |
| Description | | Shares | | | Value | |
| | |
COMMON STOCKS (Continued) | | | | | | | | |
| | |
China (cont’d.) | | | | | | | | |
| | |
Sungrow Power Supply Co. Ltd. (Class A Stock) | | | 4,900 | | | $ | 56,279 | |
Tencent Holdings Ltd. | | | 37,200 | | | | 1,376,726 | |
Tianqi Lithium Corp. (Class A Stock) | | | 6,300 | | | | 47,244 | |
Tongcheng Travel Holdings Ltd.* | | | 6,800 | | | | 12,991 | |
TravelSky Technology Ltd. (Class H Stock) | | | 5,000 | | | | 7,899 | |
Trip.com Group Ltd.* | | | 3,000 | | | | 102,245 | |
Vipshop Holdings Ltd., ADR* | | | 16,400 | | | | 233,864 | |
Xiaomi Corp. (Class B Stock), 144A* | | | 84,400 | | | | 151,331 | |
Yum China Holdings, Inc. | | | 2,300 | | | | 120,888 | |
Yunnan Baiyao Group Co. Ltd. (Class A Stock) | | | 1,000 | | | | 6,925 | |
Yunnan Yuntianhua Co. Ltd. (Class A Stock) | | | 4,500 | | | | 10,213 | |
Yutong Bus Co. Ltd. (Class A Stock) | | | 31,600 | | | | 58,720 | |
ZTE Corp. (Class H Stock) | | | 4,200 | | | | 9,333 | |
| | | | | | | | |
| | |
| | | | | | | 10,771,072 | |
| | |
Colombia 0.0% | | | | | | | | |
| | |
Bancolombia SA | | | 1,330 | | | | 9,484 | |
| | |
Czech Republic 0.1% | | | | | | | | |
CEZ A/S | | | 910 | | | | 38,954 | |
| | |
Greece 0.9% | | | | | | | | |
| | |
Eurobank Ergasias Services & Holdings SA* | | | 71,446 | | | | 116,780 | |
JUMBO SA | | | 3,074 | | | | 80,879 | |
National Bank of Greece SA* | | | 19,787 | | | | 113,327 | |
OPAP SA | | | 984 | | | | 16,667 | |
| | | | | | | | |
| | |
| | | | | | | 327,653 | |
| | |
India 14.1% | | | | | | | | |
| | |
ABB India Ltd. | | | 668 | | | | 32,946 | |
Ashok Leyland Ltd. | | | 8,040 | | | | 16,210 | |
Aurobindo Pharma Ltd. | | | 13,791 | | | | 140,727 | |
Bajaj Auto Ltd. | | | 324 | | | | 20,668 | |
Bajaj Finance Ltd. | | | 1,495 | | | | 134,579 | |
Bank of Baroda | | | 2,860 | | | | 6,744 | |
Berger Paints India Ltd. | | | 1,632 | | | | 10,950 | |
Bharat Electronics Ltd. | | | 20,202 | | | | 32,365 | |
Bharat Petroleum Corp. Ltd. | | | 45,603 | | | | 191,175 | |
CG Power & Industrial Solutions Ltd. | | | 3,372 | | | | 15,791 | |
Cipla Ltd. | | | 4,010 | | | | 57,805 | |
Coal India Ltd. | | | 8,599 | | | | 32,459 | |
Colgate-Palmolive India Ltd. | | | 10,944 | | | | 277,860 | |
See Notes to Financial Statements.
14
| | | | | | | | |
| | |
| Description | | Shares | | | Value | |
| | |
COMMON STOCKS (Continued) | | | | | | | | |
| | |
India (cont’d.) | | | | | | | | |
| | |
Cummins India Ltd. | | | 5,018 | | | $ | 101,075 | |
Dabur India Ltd. | | | 3,441 | | | | 21,859 | |
Dr. Reddy’s Laboratories Ltd. | | | 4,504 | | | | 290,709 | |
GAIL India Ltd. | | | 12,867 | | | | 18,475 | |
HCL Technologies Ltd. | | | 19,098 | | | | 292,933 | |
HDFC Asset Management Co. Ltd., 144A | | | 3,020 | | | | 99,199 | |
HDFC Bank Ltd. | | | 2,691 | | | | 47,751 | |
Hindalco Industries Ltd. | | | 51,524 | | | | 284,400 | |
Hindustan Aeronautics Ltd. | | | 950 | | | | 20,790 | |
Hindustan Petroleum Corp. Ltd.* | | | 3,048 | | | | 9,068 | |
ICICI Bank Ltd. | | | 6,361 | | | | 69,982 | |
Indian Oil Corp. Ltd. | | | 15,875 | | | | 17,101 | |
Indian Railway Catering & Tourism Corp. Ltd. | | | 1,344 | | | | 10,743 | |
Indraprastha Gas Ltd. | | | 1,764 | | | | 8,103 | |
Infosys Ltd. | | | 1,595 | | | | 26,231 | |
Infosys Ltd., ADR | | | 2,700 | | | | 44,334 | |
ITC Ltd. | | | 64,020 | | | | 329,545 | |
JSW Steel Ltd. | | | 17,004 | | | | 150,453 | |
Larsen & Toubro Ltd. | | | 3,822 | | | | 134,500 | |
Lupin Ltd. | | | 1,155 | | | | 15,651 | |
Muthoot Finance Ltd. | | | 676 | | | | 10,548 | |
Nestle India Ltd. | | | 184 | | | | 53,579 | |
NTPC Ltd. | | | 21,991 | | | | 62,304 | |
Oil & Natural Gas Corp. Ltd. | | | 134,264 | | | | 300,427 | |
PI Industries Ltd. | | | 5,194 | | | | 212,131 | |
Pidilite Industries Ltd. | | | 840 | | | | 24,801 | |
Power Finance Corp. Ltd. | | | 80,698 | | | | 238,987 | |
Power Grid Corp. of India Ltd. | | | 65,761 | | | | 159,716 | |
Reliance Industries Ltd. | | | 8,949 | | | | 246,078 | |
Samvardhana Motherson International Ltd. | | | 13,260 | | | | 14,645 | |
Shriram Finance Ltd. | | | 569 | | | | 12,840 | |
Sun Pharmaceutical Industries Ltd. | | | 5,274 | | | | 68,953 | |
Supreme Industries Ltd. | | | 351 | | | | 18,251 | |
Tata Motors Ltd. | | | 25,574 | | | | 193,161 | |
Tata Steel Ltd. | | | 40,406 | | | | 57,659 | |
Torrent Pharmaceuticals Ltd. | | | 595 | | | | 13,754 | |
Trent Ltd. | | | 296 | | | | 7,662 | |
UltraTech Cement Ltd. | | | 2,898 | | | | 293,289 | |
United Spirits Ltd.* | | | 1,525 | | | | 18,912 | |
Vedanta Ltd. | | | 4,128 | | | | 10,742 | |
| | | | | | | | |
| | |
| | | | | | | 4,981,620 | |
| | |
Indonesia 2.7% | | | | | | | | |
| | |
Adaro Energy Indonesia Tbk PT | | | 686,000 | | | | 110,686 | |
See Notes to Financial Statements.
PGIM Quant Solutions Emerging Markets Equity Fund 15
Schedule of Investments (continued)
as of October 31, 2023
| | | | | | | | |
| | |
| Description | | Shares | | | Value | |
| | |
COMMON STOCKS (Continued) | | | | | | | | |
| | |
Indonesia (cont’d.) | | | | | | | | |
| | |
Astra International Tbk PT | | | 113,100 | | | $ | 41,143 | |
Bank Central Asia Tbk PT | | | 313,300 | | | | 172,603 | |
Bank Mandiri Persero Tbk PT | | | 903,600 | | | | 322,813 | |
Bank Rakyat Indonesia Persero Tbk PT | | | 384,000 | | | | 120,071 | |
Indofood CBP Sukses Makmur Tbk PT | | | 13,200 | | | | 8,603 | |
Indofood Sukses Makmur Tbk PT | | | 413,300 | | | | 173,030 | |
United Tractors Tbk PT | | | 9,600 | | | | 15,192 | |
| | | | | | | | |
| | |
| | | | | | | 964,141 | |
| | |
Kuwait 0.7% | | | | | | | | |
Mobile Telecommunications Co. KSCP | | | 10,488 | | | | 16,316 | |
National Bank of Kuwait SAKP | | | 80,658 | | | | 228,646 | |
| | | | | | | | |
| | |
| | | | | | | 244,962 | |
| | |
Malaysia 0.3% | | | | | | | | |
CIMB Group Holdings Bhd | | | 35,400 | | | | 42,413 | |
Gamuda Bhd | | | 11,200 | | | | 10,912 | |
Inari Amertron Bhd | | | 14,300 | | | | 8,574 | |
IOI Corp. Bhd | | | 12,800 | | | | 10,561 | |
Kuala Lumpur Kepong Bhd | | | 2,700 | | | | 12,463 | |
MISC Bhd | | | 7,600 | | | | 11,570 | |
PPB Group Bhd | | | 3,500 | | | | 11,152 | |
Sime Darby Bhd | | | 16,000 | | | | 7,690 | |
| | | | | | | | |
| | |
| | | | | | | 115,335 | |
| | |
Mexico 2.2% | | | | | | | | |
Arca Continental SAB de CV | | | 2,900 | | | | 26,023 | |
Banco del Bajio SA, 144A | | | 78,400 | | | | 238,692 | |
Cemex SAB de CV, UTS* | | | 82,100 | | | | 49,135 | |
Coca-Cola Femsa SAB de CV, UTS | | | 2,080 | | | | 15,813 | |
Fibra Uno Administracion SA de CV, REIT | | | 28,200 | | | | 42,873 | |
Fomento Economico Mexicano SAB de CV, UTS | | | 10,900 | | | | 123,238 | |
Gruma SAB de CV (Class B Stock) | | | 1,050 | | | | 18,288 | |
Grupo Mexico SAB de CV (Class B Stock) | | | 49,600 | | | | 205,977 | |
Kimberly-Clark de Mexico SAB de CV (Class A Stock) | | | 33,100 | | | | 60,659 | |
| | | | | | | | |
| | |
| | | | | | | 780,698 | |
| | |
Philippines 0.0% | | | | | | | | |
Metropolitan Bank & Trust Co. | | | 10,500 | | | | 9,682 | |
See Notes to Financial Statements.
16
| | | | | | | | |
| | |
| Description | | Shares | | | Value | |
| | |
COMMON STOCKS (Continued) | | | | | | | | |
| | |
Poland 0.3% | | | | | | | | |
| | |
Bank Polska Kasa Opieki SA | | | 1,039 | | | $ | 31,572 | |
Powszechny Zaklad Ubezpieczen SA | | | 3,354 | | | | 37,954 | |
Santander Bank Polska SA* | | | 198 | | | | 21,504 | |
| | | | | | | | |
| | |
| | | | | | | 91,030 | |
| | |
Qatar 0.9% | | | | | | | | |
Dukhan Bank | | | 10,832 | | | | 10,795 | |
Ooredoo QPSC | | | 90,082 | | | | 244,591 | |
Qatar Electricity & Water Co. QSC | | | 2,502 | | | | 11,368 | |
Qatar International Islamic Bank QSC | | | 4,997 | | | | 12,704 | |
Qatar Islamic Bank SAQ | | | 11,234 | | | | 53,734 | |
| | | | | | | | |
| | |
| | | | | | | 333,192 | |
| | |
Russia 0.0% | | | | | | | | |
Inter RAO UES PJSC^ | | | 202,400 | | | | — | |
LUKOIL PJSC^ | | | 2,762 | | | | — | |
Magnit PJSC^ | | | 1,716 | | | | — | |
PhosAgro PJSC^ | | | 232 | | | | — | |
PhosAgro PJSC, GDR XSTU*^ | | | 4 | | | | — | |
PhosAgro PJSC, GDR OOTC*^ | | | 2 | | | | — | |
Rosneft Oil Co. PJSC^ | | | 5,856 | | | | — | |
Sberbank of Russia PJSC^ | | | 55,364 | | | | — | |
Surgutneftegas PJSC^ | | | 38,400 | | | | — | |
| | | | | | | | |
| | |
| | | | | | | — | |
| | |
Saudi Arabia 2.4% | | | | | | | | |
Almarai Co. JSC | | | 966 | | | | 14,394 | |
Arabian Internet & Communications Services Co. | | | 395 | | | | 32,970 | |
Dr. Sulaiman Al Habib Medical Services Group Co. | | | 483 | | | | 32,442 | |
Elm Co. | | | 598 | | | | 111,809 | |
Etihad Etisalat Co. | | | 21,517 | | | | 264,497 | |
Nahdi Medical Co. | | | 448 | | | | 16,939 | |
National Industrialization Co.* | | | 2,200 | | | | 6,818 | |
SABIC Agri-Nutrients Co. | | | 1,672 | | | | 59,696 | |
Sahara International Petrochemical Co. | | | 1,975 | | | | 17,011 | |
Saudi Arabian Mining Co.* | | | 7,261 | | | | 69,569 | |
Saudi Aramco Base Oil Co. | | | 3,340 | | | | 115,014 | |
Saudi Telecom Co. | | | 11,272 | | | | 115,472 | |
| | | | | | | | |
| | |
| | | | | | | 856,631 | |
See Notes to Financial Statements.
PGIM Quant Solutions Emerging Markets Equity Fund 17
Schedule of Investments (continued)
as of October 31, 2023
| | | | | | | | |
| | |
| Description | | Shares | | | Value | |
| | |
COMMON STOCKS (Continued) | | | | | | | | |
| | |
South Africa 1.1% | | | | | | | | |
| | |
Kumba Iron Ore Ltd. | | | 351 | | | $ | 9,298 | |
Nedbank Group Ltd. | | | 2,442 | | | | 26,304 | |
Old Mutual Ltd. | | | 27,166 | | | | 17,277 | |
Sanlam Ltd. | | | 79,514 | | | | 278,960 | |
Standard Bank Group Ltd. | | | 7,590 | | | | 74,493 | |
| | | | | | | | |
| | |
| | | | | | | 406,332 | |
| | |
South Korea 13.0% | | | | | | | | |
| | |
BGF retail Co. Ltd. | | | 48 | | | | 4,909 | |
DB Insurance Co. Ltd. | | | 1,930 | | | | 125,564 | |
Doosan Bobcat, Inc. | | | 309 | | | | 8,878 | |
GS Holdings Corp. | | | 267 | | | | 7,797 | |
Hana Financial Group, Inc. | | | 2,630 | | | | 76,472 | |
Hankook Tire & Technology Co. Ltd. | | | 419 | | | | 11,888 | |
Hanwha Aerospace Co. Ltd. | | | 1,208 | | | | 90,819 | |
HMM Co. Ltd. | | | 1,180 | | | | 12,781 | |
Hyundai Glovis Co. Ltd. | | | 1,769 | | | | 224,505 | |
Hyundai Mobis Co. Ltd. | | | 1,722 | | | | 266,677 | |
Hyundai Motor Co. | | | 2,265 | | | | 285,354 | |
Hyundai Steel Co. | | | 3,293 | | | | 80,080 | |
Industrial Bank of Korea | | | 24,053 | | | | 199,062 | |
KB Financial Group, Inc. | | | 7,659 | | | | 291,948 | |
Kia Corp. | | | 5,574 | | | | 318,451 | |
Korea Investment Holdings Co. Ltd. | | | 240 | | | | 8,972 | |
KT Corp. | | | 377 | | | | 9,120 | |
KT&G Corp. | | | 2,727 | | | | 172,028 | |
LG Corp. | | | 297 | | | | 17,000 | |
LG Electronics, Inc. | | | 585 | | | | 43,397 | |
Meritz Financial Group, Inc.* | | | 345 | | | | 12,840 | |
Orion Corp. | | | 135 | | | | 11,948 | |
Samsung C&T Corp. | | | 3,296 | | | | 260,601 | |
Samsung Electronics Co. Ltd. | | | 22,205 | | | | 1,105,251 | |
Samsung Engineering Co. Ltd.* | | | 9,166 | | | | 161,547 | |
Samsung Fire & Marine Insurance Co. Ltd. | | | 201 | | | | 38,436 | |
Samsung Life Insurance Co. Ltd. | | | 3,293 | | | | 176,305 | |
Samsung SDS Co. Ltd. | | | 2,356 | | | | 241,502 | |
Samsung Securities Co. Ltd. | | | 8,597 | | | | 225,210 | |
Shinhan Financial Group Co. Ltd. | | | 2,347 | | | | 60,328 | |
SK Hynix, Inc. | | | 536 | | | | 46,547 | |
| | | | | | | | |
| | |
| | | | | | | 4,596,217 | |
| | |
Taiwan 14.9% | | | | | | | | |
| | |
Accton Technology Corp. | | | 19,000 | | | | 294,391 | |
See Notes to Financial Statements.
18
| | | | | | | | |
| | |
| Description | | Shares | | | Value | |
| | |
COMMON STOCKS (Continued) | | | | | | | | |
| | |
Taiwan (cont’d.) | | | | | | | | |
| | |
Acer, Inc. | | | 178,000 | | | $ | 188,126 | |
Advantech Co. Ltd. | | | 4,198 | | | | 43,112 | |
Asustek Computer, Inc. | | | 4,000 | | | | 41,940 | |
Catcher Technology Co. Ltd. | | | 4,000 | | | | 22,440 | |
Chunghwa Telecom Co. Ltd. | | | 21,000 | | | | 75,107 | |
Compal Electronics, Inc. | | | 195,000 | | | | 169,618 | |
Delta Electronics, Inc. | | | 12,000 | | | | 108,143 | |
Eva Airways Corp. | | | 38,000 | | | | 32,224 | |
Evergreen Marine Corp. Taiwan Ltd. | | | 24,000 | | | | 79,867 | |
Far EasTone Telecommunications Co. Ltd. | | | 5,000 | | | | 11,712 | |
Hon Hai Precision Industry Co. Ltd. | | | 54,000 | | | | 161,175 | |
Largan Precision Co. Ltd. | | | 1,000 | | | | 64,047 | |
Lite-On Technology Corp. | | | 11,000 | | | | 34,249 | |
MediaTek, Inc. | | | 9,000 | | | | 234,894 | |
Novatek Microelectronics Corp. | | | 22,000 | | | | 309,828 | |
President Chain Store Corp. | | | 17,000 | | | | 135,224 | |
Quanta Computer, Inc. | | | 48,000 | | | | 283,407 | |
Realtek Semiconductor Corp. | | | 3,000 | | | | 37,389 | |
Taiwan High Speed Rail Corp. | | | 11,000 | | | | 9,987 | |
Taiwan Semiconductor Manufacturing Co. Ltd. | | | 141,000 | | | | 2,302,885 | |
Uni-President Enterprises Corp. | | | 27,000 | | | | 56,645 | |
United Microelectronics Corp. | | | 62,000 | | | | 89,163 | |
Wan Hai Lines Ltd. | | | 5,060 | | | | 7,232 | |
Wistron Corp. | | | 17,000 | | | | 47,404 | |
Wiwynn Corp. | | | 5,000 | | | | 236,916 | |
Yang Ming Marine Transport Corp. | | | 156,000 | | | | 203,327 | |
| | | | | | | | |
| | |
| | | | | | | 5,280,452 | |
| | |
Thailand 1.8% | | | | | | | | |
| | |
Advanced Info Service PCL | | | 6,800 | | | | 41,650 | |
Bangkok Dusit Medical Services PCL | | | 58,400 | | | | 43,051 | |
Berli Jucker PCL | | | 7,200 | | | | 5,664 | |
Bumrungrad Hospital PCL | | | 30,500 | | | | 220,439 | |
Central Pattana PCL | | | 11,100 | | | | 19,310 | |
Delta Electronics Thailand PCL | | | 2,600 | | | | 5,715 | |
Krung Thai Bank PCL | | | 406,000 | | | | 212,283 | |
PTT PCL | | | 56,000 | | | | 51,833 | |
SCB X PCL | | | 4,800 | | | | 13,160 | |
Srisawad Corp. PCL | | | 4,800 | | | | 5,543 | |
TMBThanachart Bank PCL | | | 159,000 | | | | 7,386 | |
| | | | | | | | |
| | |
| | | | | | | 626,034 | |
See Notes to Financial Statements.
PGIM Quant Solutions Emerging Markets Equity Fund 19
Schedule of Investments (continued)
as of October 31, 2023
| | | | | | | | |
| | |
| Description | | Shares | | | Value | |
| | |
COMMON STOCKS (Continued) | | | | | | | | |
| | |
Turkey 1.7% | | | | | | | | |
| | |
BIM Birlesik Magazalar A/S | | | 2,575 | | | $ | 24,764 | |
Ford Otomotiv Sanayi A/S | | | 396 | | | | 11,004 | |
Haci Omer Sabanci Holding A/S | | | 5,824 | | | | 11,015 | |
KOC Holding A/S | | | 52,148 | | | | 252,244 | |
Tofas Turk Otomobil Fabrikasi A/S | | | 9,780 | | | | 83,152 | |
Turkcell Iletisim Hizmetleri A/S* | | | 6,817 | | | | 11,560 | |
Turkiye Is Bankasi A/S (Class C Stock) | | | 168,453 | | | | 125,213 | |
Yapi ve Kredi Bankasi A/S | | | 108,054 | | | | 65,947 | |
| | | | | | | | |
| | |
| | | | | | | 584,899 | |
| | |
United Arab Emirates 2.4% | | | | | | | | |
| | |
Abu Dhabi Islamic Bank PJSC | | | 82,848 | | | | 232,152 | |
Aldar Properties PJSC | | | 16,576 | | | | 23,481 | |
Dubai Islamic Bank PJSC | | | 5,832 | | | | 8,574 | |
Emaar Properties PJSC | | | 157,368 | | | | 286,690 | |
Emirates NBD Bank PJSC | | | 64,938 | | | | 299,772 | |
| | | | | | | | |
| | |
| | | | | | | 850,669 | |
| | |
United States 0.1% | | | | | | | | |
| | |
JBS SA | | | 4,400 | | | | 17,515 | |
| | | | | | | | |
| | |
TOTAL COMMON STOCKS (cost $31,356,316) | | | | | | | 33,513,539 | |
| | | | | | | | |
| | |
PREFERRED STOCKS 3.5% | | | | | | | | |
| | |
Brazil 2.9% | | | | | | | | |
| | |
Cia Energetica de Minas Gerais (PRFC) | | | 84,698 | | | | 196,720 | |
Gerdau SA (PRFC) | | | 52,045 | | | | 225,863 | |
Itau Unibanco Holding SA (PRFC) | | | 19,700 | | | | 104,796 | |
Itausa SA (PRFC) | | | 43,800 | | | | 75,147 | |
Petroleo Brasileiro SA (PRFC) | | | 61,000 | | | | 420,197 | |
| | | | | | | | |
| | |
| | | | | | | 1,022,723 | |
| | |
Russia 0.0% | | | | | | | | |
| | |
Surgutneftegas PJSC (PRFC)^ | | | 38,200 | | | | — | |
| | |
South Korea 0.6% | | | | | | | | |
| | |
Hyundai Motor Co. (2nd PRFC) | | | 200 | | | | 14,858 | |
Hyundai Motor Co. (PRFC) | | | 128 | | | | 9,452 | |
See Notes to Financial Statements.
20
| | | | | | | | | | | | | | | | |
| | |
| Description | | | Shares | | | Value | |
| |
| PREFERRED STOCKS (Continued) | | | | | |
| |
| South Korea (cont’d.) | | | | | |
| | | | |
LG Chem Ltd. (PRFC) | | | | | | | | | | | 42 | | | $ | 8,772 | |
Samsung Electronics Co. Ltd. (PRFC) | | | | | | | | | | | 4,494 | | | | 179,422 | |
| | | | | | | | | | | | | | | | |
| | | | |
| | | | | | | | | | | | | | | 212,504 | |
| | | | | | | | | | | | | | | | |
| | | | |
| TOTAL PREFERRED STOCKS | | | | | | | | | | | | | | | | |
(cost $1,030,620) | | | | | | | | | | | | | | | 1,235,227 | |
| | | | | | | | | | | | | | | | |
| | | | |
| TOTAL LONG-TERM INVESTMENTS | | | | | | | | | | | | | | | | |
(cost $32,386,936) | | | | | | | | | | | | | | | 34,748,766 | |
| | | | | | | | | | | | | | | | |
| | | | |
| SHORT-TERM INVESTMENTS 1.6% | | | | | | | | | | | | | | | | |
| | | | |
| AFFILIATED MUTUAL FUND 1.3% | | | | | | | | | | | | | | | | |
PGIM Core Government Money Market Fund
(cost $466,140)(wb) | | | | | | | | | | | 466,140 | | | | 466,140 | |
| | | | | | | | | | | | | | | | |
| | | | |
| | | Interest Rate | | | Maturity Date | | | Principal Amount (000)# | | | | |
| | | | |
| U.S. TREASURY OBLIGATION(k)(n) 0.3% | | | | | | | | | | | | | | | | |
U.S. Treasury Bills
(cost $99,373) | | | 5.330% | | | | 12/14/23 | | | | 100 | | | | 99,368 | |
| | | | | | | | | | | | | | | | |
| | | | |
| TOTAL SHORT-TERM INVESTMENTS | | | | | | | | | | | | | | | | |
(cost $565,513) | | | | | | | | | | | | | | | 565,508 | |
| | | | | | | | | | | | | | | | |
| | | | |
| TOTAL INVESTMENTS 99.7% | | | | | | | | | | | | | | | | |
(cost $32,952,449) | | | | | | | | | | | | | | | 35,314,274 | |
Other assets in excess of liabilities(z) 0.3% | | | | | | | | | | | | | | | 121,327 | |
| | | | | | | | | | | | | | | | |
| | | | |
| NET ASSETS 100.0% | | | | | | | | | | | | | | $ | 35,435,601 | |
| | | | | | | | | | | | | | | | |
Below is a list of the abbreviation(s) used in the annual report:
USD—US Dollar
144A—Security was purchased pursuant to Rule 144A under the Securities Act of 1933 and, pursuant to the requirements of Rule 144A, may not be resold except to qualified institutional buyers.
ADR—American Depositary Receipt
GDR—Global Depositary Receipt
MSC—Morgan Stanley & Co. LLC
MSCI—Morgan Stanley Capital International
OOTC—OTC Bulletin Board – Other OTC
PJSC—Public Joint-Stock Company
PRFC—Preference Shares
REITs—Real Estate Investment Trust
See Notes to Financial Statements.
PGIM Quant Solutions Emerging Markets Equity Fund 21
Schedule of Investments (continued)
as of October 31, 2023
SOFR—Secured Overnight Financing Rate
UTS—Unit Trust Security
XSTU—Stuttgart Stock Exchange
| * | Non-income producing security. |
| # | Principal amount is shown in U.S. dollars unless otherwise stated. |
| ^ | Indicates a Level 3 instrument. The aggregate value of Level 3 instruments is $0 and 0.0% of net assets. |
| (k) | Represents security, or a portion thereof, segregated as collateral for centrally cleared/exchange-traded derivatives. |
| (n) | Rate shown reflects yield to maturity at purchased date. |
| (wb) | Represents an investment in a Fund affiliated with the Manager. |
| (z) | Includes net unrealized appreciation/(depreciation) and/or market value of the below holdings which are excluded from the Schedule of Investments: |
Futures contracts outstanding at October 31, 2023:
| | | | | | | | | | | | | | | | |
Number of Contracts | | Type | | Expiration Date | | Current
Notional
Amount | | | Value / Unrealized Appreciation (Depreciation) |
| | | | | |
Long Position: | | | | | | | | | | | | | | |
18 | | Mini MSCI Emerging Markets Index | | Dec. 2023 | | $ | 827,280 | | | | | $ | (62,944 | ) | | |
| | | | | | | | | | | | | | | | |
Summary of Collateral for Centrally Cleared/Exchange-traded Derivatives:
Cash and securities segregated as collateral, including pending settlement for closed positions, to cover requirements for centrally cleared/exchange-traded derivatives are listed by broker as follows:
| | | | | | | | | | |
Broker | | Cash and/or Foreign Currency | | Securities Market Value |
| | |
MSC | | | $ | — | | | | $ | 99,368 | |
| | | | | | | | | | |
Fair Value Measurements:
Various inputs are used in determining the value of the Fund’s investments. These inputs are summarized in the three broad levels listed below.
Level 1—unadjusted quoted prices generally in active markets for identical securities.
Level 2—quoted prices for similar securities, interest rates and yield curves, prepayment speeds, foreign currency exchange rates and other observable inputs.
Level 3—unobservable inputs for securities valued in accordance with Board approved fair valuation procedures.
The following is a summary of the inputs used as of October 31, 2023 in valuing such portfolio securities:
| | | | | | | | | | | | | | | |
| | | Level 1 | | Level 2 | | Level 3 |
Investments in Securities | | | | | | | | | | | | | | | |
Assets | | | | | | | | | | | | | | | |
Long-Term Investments | | | | | | | | | | | | | | | |
| Common Stocks | | | | | | | | | | | | | | | |
Brazil | | | $ | 1,523,482 | | | | $ | — | | | | $ | — | |
Chile | | | | — | | | | | 103,485 | | | | | — | |
China | | | | 1,943,982 | | | | | 8,827,090 | | | | | — | |
See Notes to Financial Statements.
22
| | | | | | | | | | | | | | | |
| | | Level 1 | | Level 2 | | Level 3 |
Investments in Securities (continued) | | | | | | | | | | | | | | | |
Assets (continued) | | | | | | | | | | | | | | | |
Long-Term Investments (continued) | | | | | | | | | | | | | | | |
Common Stocks (continued) | | | | | | | | | | | | | | | |
Colombia | | | $ | 9,484 | | | | $ | — | | | | $ | — | |
Czech Republic | | | | — | | | | | 38,954 | | | | | — | |
Greece | | | | — | | | | | 327,653 | | | | | — | |
India | | | | 44,334 | | | | | 4,937,286 | | | | | — | |
Indonesia | | | | — | | | | | 964,141 | | | | | — | |
Kuwait | | | | — | | | | | 244,962 | | | | | — | |
Malaysia | | | | — | | | | | 115,335 | | | | | — | |
Mexico | | | | 780,698 | | | | | — | | | | | — | |
Philippines | | | | — | | | | | 9,682 | | | | | — | |
Poland | | | | — | | | | | 91,030 | | | | | — | |
Qatar | | | | — | | | | | 333,192 | | | | | — | |
Russia | | | | — | | | | | — | | | | | — | ** |
Saudi Arabia | | | | — | | | | | 856,631 | | | | | — | |
South Africa | | | | — | | | | | 406,332 | | | | | — | |
South Korea | | | | — | | | | | 4,596,217 | | | | | — | |
Taiwan | | | | — | | | | | 5,280,452 | | | | | — | |
Thailand | | | | — | | | | | 626,034 | | | | | — | |
Turkey. | | | | — | | | | | 584,899 | | | | | — | |
United Arab Emirates | | | | — | | | | | 850,669 | | | | | — | |
United States | | | | 17,515 | | | | | — | | | | | — | |
Preferred Stocks | | | | | | | | | | | | | | | |
Brazil | | | | 1,022,723 | | | | | — | | | | | — | |
Russia | | | | — | | | | | — | | | | | — | ** |
South Korea | | | | — | | | | | 212,504 | | | | | — | |
Short-Term Investments | | | | | | | | | | | | | | | |
Affiliated Mutual Fund | | | | 466,140 | | | | | — | | | | | — | |
U.S. Treasury Obligation | | | | — | | | | | 99,368 | | | | | — | |
| | | | | | | | | | | | | | | |
| | | |
Total | | | $ | 5,808,358 | | | | $ | 29,505,916 | | | | $ | — | |
| | | | | | | | | | | | | | | |
| | | |
Other Financial Instruments* | | | | | | | | | | | | | | | |
Liabilities | | | | | | | | | | | | | | | |
Futures Contracts | | | $ | (62,944 | ) | | | $ | — | | | | $ | — | |
| | | | | | | | | | | | | | | |
| * | Other financial instruments are derivative instruments not reflected in the Schedule of Investments, such as futures, forwards and centrally cleared swap contracts, which are recorded at the unrealized appreciation (depreciation) on the instrument, and OTC swap contracts which are recorded at fair value. |
| ** | Includes Level 3 investments with an aggregate value of $0. |
See Notes to Financial Statements.
PGIM Quant Solutions Emerging Markets Equity Fund 23
Schedule of Investments (continued)
as of October 31, 2023
Industry Classification:
The industry classification of investments and other assets in excess of liabilities shown as a percentage of net assets as of October 31, 2023 were as follows:
| | | | |
Banks | | | 15.5 | % |
Semiconductors & Semiconductor Equipment | | | 8.7 | |
Technology Hardware, Storage & Peripherals | | | 7.1 | |
Broadline Retail | | | 5.8 | |
Oil, Gas & Consumable Fuels | | | 5.4 | |
Interactive Media & Services | | | 5.2 | |
Metals & Mining | | | 4.4 | |
Automobiles | | | 3.8 | |
Insurance | | | 3.4 | |
Pharmaceuticals | | | 2.5 | |
Hotels, Restaurants & Leisure | | | 2.1 | |
IT Services | | | 2.1 | |
Electric Utilities | | | 2.1 | |
Diversified Telecommunication Services | | | 1.8 | |
Capital Markets | | | 1.7 | |
Industrial Conglomerates | | | 1.7 | |
Real Estate Management & Development | | | 1.5 | |
Chemicals | | | 1.5 | |
Entertainment | | | 1.5 | |
Tobacco | | | 1.4 | |
Electronic Equipment, Instruments & Components | | | 1.3 | |
Food Products | | | 1.3 | |
Affiliated Mutual Fund | | | 1.3 | |
Health Care Providers & Services | | | 1.2 | |
Personal Care Products | | | 1.0 | |
Wireless Telecommunication Services | | | 1.0 | |
Construction Materials | | | 1.0 | |
Gas Utilities | | | 0.9 | |
Communications Equipment | | | 0.9 | |
Marine Transportation | | | 0.9 | |
Construction & Engineering | | | 0.9 | |
Automobile Components | | | 0.8 | |
Financial Services | | | 0.7 | |
Machinery | | | 0.7 | |
Beverages | | | 0.7 | |
Biotechnology | | | 0.6 | |
Air Freight & Logistics | | | 0.6 | |
Consumer Staples Distribution & Retail | | | 0.5 | |
Consumer Finance | | | 0.5 | |
Aerospace & Defense | | | 0.4 | |
Electrical Equipment | | | 0.4 | |
Textiles, Apparel & Luxury Goods | | | 0.4 | |
Specialty Retail | | | 0.3 | |
| | | | |
Media | | | 0.3 | % |
U.S. Treasury Obligation | | | 0.3 | |
Household Durables | | | 0.3 | |
Independent Power & Renewable Electricity Producers | | | 0.3 | |
Health Care Equipment & Supplies | | | 0.2 | |
Household Products | | | 0.2 | |
Paper & Forest Products | | | 0.2 | |
Diversified Consumer Services | | | 0.2 | |
Diversified REITs | | | 0.1 | |
Passenger Airlines | | | 0.1 | |
Multi-Utilities | | | 0.0 | * |
Commercial Services & Supplies | | | 0.0 | * |
Transportation Infrastructure | | | 0.0 | * |
| | | | |
| |
| | | 99.7 | |
| Other assets in excess of liabilities | | | 0.3 | |
| | | | |
| |
| | | 100.0 | % |
| | | | |
See Notes to Financial Statements.
24
Effects of Derivative Instruments on the Financial Statements and Primary Underlying Risk Exposure:
The Fund invested in derivative instruments during the reporting period. The primary type of risk associated with these derivative instruments is equity risk. See the Notes to Financial Statements for additional detail regarding these derivative instruments and their risks. The effect of such derivative instruments on the Fund’s financial position and financial performance as reflected in the Statement of Assets and Liabilities and Statement of Operations is presented in the summary below.
Fair values of derivative instruments as of October 31, 2023 as presented in the Statement of Assets and Liabilities:
| | | | | | | | | | | | |
| | | Asset Derivatives | | | Liability Derivatives | |
| | | | |
Derivatives not accounted for as hedging instruments, carried at fair value | | Statement of
Assets and
Liabilities Location | | Fair
Value | | | Statement of
Assets and
Liabilities Location | | Fair
Value | |
Equity contracts | | — | | | $— | | | Due from/to
broker-variation margin
futures | | $ | 62,944 | * |
| | | | | | | | | | | | |
| * | Includes cumulative appreciation (depreciation) as reported in the schedule of open futures and centrally cleared swap contracts. Only unsettled variation margin receivable (payable) is reported within the Statement of Assets and Liabilities. |
The effects of derivative instruments on the Statement of Operations for the year ended October 31, 2023 are as follows:
| | | | |
| Amount of Realized Gain (Loss) on Derivatives Recognized in Income | |
| |
| |
Derivatives not accounted for as hedging instruments, carried at fair value | | Futures | |
| |
Equity contracts | | $ | 35,276 | |
| | | | |
| | | | |
| Change in Unrealized Appreciation (Depreciation) on Derivatives Recognized in Income | |
| |
| |
Derivatives not accounted for as hedging instruments, carried at fair value | | Futures | |
| |
Equity contracts | | $ | 92,765 | |
| | | | |
For the year ended October 31, 2023, the Fund’s average volume of derivative activities is as follows:
| | |
| Derivative Contract Type | | Average Volume of Derivative Activities* |
Futures Contracts - Long Positions (1) | | $1,107,145 |
| * | Average volume is based on average quarter end balances as noted for the year ended October 31, 2023. |
| (1) | Notional Amount in USD. |
See Notes to Financial Statements.
PGIM Quant Solutions Emerging Markets Equity Fund 25
Statement of Assets and Liabilities
as of October 31, 2023
| | | | |
Assets | | | | |
| |
Investments at value: | | | | |
Unaffiliated investments (cost $32,486,309) | | $ | 34,848,134 | |
Affiliated investments (cost $466,140) | | | 466,140 | |
Foreign currency, at value (cost $312,824) | | | 312,471 | |
Receivable for investments sold | | | 444,602 | |
Dividends receivable | | | 65,046 | |
Due from Manager | | | 27,716 | |
Receivable for Fund shares sold | | | 9,317 | |
Tax reclaim receivable | | | 4,385 | |
Prepaid expenses and other assets | | | 2,160 | |
| | | | |
| |
Total Assets | | | 36,179,971 | |
| | | | |
| |
Liabilities | | | | |
| |
Payable for investments purchased | | | 532,750 | |
Foreign capital gains tax liability accrued | | | 70,078 | |
Payable for Fund shares purchased | | | 35,983 | |
Accrued expenses and other liabilities | | | 34,004 | |
Audit fees payable | | | 29,682 | |
Custodian and accounting fee payable | | | 28,241 | |
Professional fees payable | | | 7,233 | |
Due to broker—variation margin futures | | | 5,490 | |
Trustees’ fees payable | | | 829 | |
Affiliated transfer agent fee payable | | | 80 | |
| | | | |
| |
Total Liabilities | | | 744,370 | |
| | | | |
| |
Net Assets | | $ | 35,435,601 | |
| | | | |
| |
| | | | | |
| |
Net assets were comprised of: | | | | |
Paid-in capital | | $ | 36,930,501 | |
Total distributable earnings (loss) | | | (1,494,900 | ) |
| | | | |
| |
Net assets, October 31, 2023 | | $ | 35,435,601 | |
| | | | |
| |
Class R6 | | | | |
| |
Net asset value, offering price and redemption price per share, ($35,435,601 ÷ 3,482,245 shares of beneficial interest issued and outstanding) | | $ | 10.18 | |
| | | | |
See Notes to Financial Statements.
26
Statement of Operations
Year Ended October 31, 2023
| | | | |
Net Investment Income (Loss) | | | | |
| |
Income | | | | |
Unaffiliated dividend income (net of $206,366 foreign withholding tax) | | $ | 1,360,959 | |
Affiliated dividend income | | | 26,913 | |
Income from securities lending, net (including affiliated income of $5,610) | | | 6,053 | |
Interest income | | | 4,839 | |
| | | | |
| |
Total income | | | 1,398,764 | |
| | | | |
| |
Expenses | | | | |
Management fee | | | 279,467 | |
Custodian and accounting fees | | | 135,717 | |
Professional fees | | | 78,999 | |
Audit fee | | | 29,680 | |
Shareholders’ reports | | | 16,835 | |
Pricing fees | | | 11,801 | |
Fund data services | | | 10,562 | |
Trustees’ fees | | | 10,005 | |
Transfer agent’s fees and expenses (including affiliated expense of $510) | | | 706 | |
Registration fees | | | 222 | |
Miscellaneous | | | 27,693 | |
| | | | |
| |
Total expenses | | | 601,687 | |
Less: Fee waiver and/or expense reimbursement | | | (150,314 | ) |
| | | | |
| |
Net expenses | | | 451,373 | |
| | | | |
| |
Net investment income (loss) | | | 947,391 | |
| | | | |
| |
Realized And Unrealized Gain (Loss) On Investment And Foreign Currency Transactions | | | | |
| |
Net realized gain (loss) on: | | | | |
Investment transactions (net of foreign capital gains taxes $(617)) | | | (1,171,005 | ) |
Futures transactions | | | 35,276 | |
Foreign currency transactions | | | (27,250 | ) |
| | | | |
| |
| | | (1,162,979 | ) |
| | | | |
Net change in unrealized appreciation (depreciation) on: | | | | |
Investments (net of change in foreign capital gains taxes $(33,088)) | | | 4,486,119 | |
Futures | | | 92,765 | |
Foreign currencies | | | (2,477 | ) |
| | | | |
| |
| | | 4,576,407 | |
| | | | |
| |
Net gain (loss) on investment and foreign currency transactions | | | 3,413,428 | |
| | | | |
| |
Net Increase (Decrease) In Net Assets Resulting From Operations | | $ | 4,360,819 | |
| | | | |
See Notes to Financial Statements.
PGIM Quant Solutions Emerging Markets Equity Fund 27
Statements of Changes in Net Assets
| | | | | | | | |
| |
| | | Year Ended October 31, | |
| | | | |
| | |
| | | 2023 | | | 2022 | |
| | |
Increase (Decrease) in Net Assets | | | | | | | | |
| | |
Operations | | | | | | | | |
Net investment income (loss) | | $ | 947,391 | | | $ | 1,275,369 | |
Net realized gain (loss) on investment and foreign currency transactions | | | (1,162,979 | ) | | | (3,146,395 | ) |
Net change in unrealized appreciation (depreciation) on investments and foreign currencies | | | 4,576,407 | | | | (8,411,138 | ) |
| | | | | | | | |
| | |
Net increase (decrease) in net assets resulting from operations | | | 4,360,819 | | | | (10,282,164 | ) |
| | | | | | | | |
| | |
Dividends and Distributions | | | | | | | | |
Distributions from distributable earnings | | | | | | | | |
Class R6 | | | (1,391,984 | ) | | | (1,396,789 | ) |
| | | | | | | | |
| | |
Fund share transactions | | | | | | | | |
Net proceeds from shares sold (337,480 and 615,309 shares, respectively) | | | 3,482,394 | | | | 6,975,346 | |
Net asset value of shares issued in reinvestment of dividends and distributions (136,737 and 113,009 shares, respectively) | | | 1,391,984 | | | | 1,396,789 | |
Cost of shares purchased (437,103 and 547,267 shares, respectively) | | | (4,588,650 | ) | | | (6,404,812 | ) |
| | | | | | | | |
| | |
Net increase (decrease) in net assets from Fund share transactions | | | 285,728 | | | | 1,967,323 | |
| | | | | | | | |
Total increase (decrease) | | | 3,254,563 | | | | (9,711,630 | ) |
| | |
Net Assets: | | | | | | | | |
| | |
Beginning of year | | | 32,181,038 | | | | 41,892,668 | |
| | | | | | | | |
| | |
End of year | | $ | 35,435,601 | | | $ | 32,181,038 | |
| | | | | | | | |
See Notes to Financial Statements.
28
Financial Highlights
| | | | | | | | | | | | | | | | | | | | |
| | | | | | |
Class R6 Shares | | | | | | | | | | | | | | | | | | | | |
| | | Year Ended October 31, | |
| | | | | | |
| | | 2023 | | | 2022 | | | 2021 | | | 2020 | | | 2019 | |
| | | | | | |
Per Share Operating Performance(a): | | | | | | | | | | | | | | | | | | | | |
Net Asset Value, Beginning of Year | | | $9.34 | | | | $12.83 | | | | $11.61 | | | | $11.14 | | | | $10.84 | |
Income (loss) from investment operations: | | | | | | | | | | | | | | | | | | | | |
Net investment income (loss) | | | 0.27 | | | | 0.38 | | | | 0.29 | | | | 0.18 | | | | 0.19 | |
| Net realized and unrealized gain (loss) on investment and foreign currency transactions | | | 0.98 | | | | (3.45 | ) | | | 1.11 | | | | 0.53 | | | | 0.43 | |
Total from investment operations | | | 1.25 | | | | (3.07 | ) | | | 1.40 | | | | 0.71 | | | | 0.62 | |
Less Dividends and Distributions: | | | | | | | | | | | | | | | | | | | | |
Dividends from net investment income | | | (0.41 | ) | | | (0.35 | ) | | | (0.18 | ) | | | (0.24 | ) | | | (0.21 | ) |
Distributions from net realized gains | | | - | | | | (0.07 | ) | | | - | | | | - | | | | (0.11 | ) |
Total dividends and distributions | | | (0.41 | ) | | | (0.42 | ) | | | (0.18 | ) | | | (0.24 | ) | | | (0.32 | ) |
Net asset value, end of year | | | $10.18 | | | | $9.34 | | | | $12.83 | | | | $11.61 | | | | $11.14 | |
Total Return(b): | | | 13.37 | % | | | (24.71 | )% | | | 12.08 | % | | | 6.42 | % | | | 5.82 | % |
| | | | | | | | | | | | | | | | | | | | | |
| | | | | | |
Ratios/Supplemental Data: | | | | | | | | | | | | | | | | | | | | |
Net assets, end of year (000) | | $ | 35,436 | | | $ | 32,181 | | | $ | 41,893 | | | $ | 36,054 | | | $ | 29,804 | |
Average net assets (000) | | $ | 37,262 | | | $ | 38,004 | | | $ | 45,007 | | | $ | 32,007 | | | $ | 28,694 | |
Ratios to average net assets(c): | | | | | | | | | | | | | | | | | | | | |
Expenses after waivers and/or expense reimbursement | | | 1.21 | %(d) | | | 1.20 | % | | | 1.20 | % | | | 1.20 | % | | | 1.20 | % |
Expenses before waivers and/or expense reimbursement | | | 1.61 | % | | | 1.54 | % | | | 1.42 | % | | | 1.53 | % | | | 1.70 | % |
Net investment income (loss) | | | 2.54 | % | | | 3.36 | % | | | 2.15 | % | | | 1.66 | % | | | 1.71 | % |
Portfolio turnover rate(e) | | | 101 | % | | | 101 | % | | | 108 | % | | | 106 | % | | | 117 | % |
| (a) | Calculated based on average shares outstanding during the year. |
| (b) | Total return is calculated assuming a purchase of a share on the first day and a sale on the last day of each year reported and includes reinvestment of dividends and distributions, if any. Total returns may reflect adjustments to conform to GAAP. |
| (c) | Does not include expenses of the underlying funds in which the Fund invests. |
| (d) | Includes certain non-recurring expenses of 0.01% which are being excluded from the Fund’s contractual waiver for the year ended October 31, 2023. |
| (e) | The Fund’s portfolio turnover rate is calculated in accordance with regulatory requirements, without regard to transactions involving short-term investments, certain derivatives and in-kind transactions (if any). If such transactions were included, the Fund’s portfolio turnover rate may be higher. |
See Notes to Financial Statements.
PGIM Quant Solutions Emerging Markets Equity Fund 29
Notes to Financial Statements
Prudential Investment Portfolios 2 (the “Registered Investment Company” or “RIC”) is registered under the Investment Company Act of 1940, as amended (“1940 Act”), as an open-end management investment company. The RIC is organized as a Delaware Statutory Trust. These financial statements relate only to the PGIM Quant Solutions Emerging Markets Equity Fund (the “Fund”), a series of the RIC. The Fund is classified as a diversified fund for purposes of the 1940 Act.
The investment objective of the Fund is to seek to provide returns in excess of the Morgan Stanley Capital International Emerging Markets Index over full market cycles.
The Fund follows the investment company accounting and reporting guidance of the Financial Accounting Standards Board (“FASB”) Accounting Standard Codification (“ASC”) Topic 946 Financial Services — Investment Companies. The following is a summary of significant accounting policies followed by the Fund in the preparation of its financial statements. The policies conform to U.S. generally accepted accounting principles (“GAAP”). The Fund consistently follows such policies in the preparation of their financial statements.
Securities Valuation: The Fund holds securities and other assets and liabilities that are fair valued as of the close of each day (generally, 4:00 PM Eastern time) the New York Stock Exchange (“NYSE”) is open for trading. As described in further detail below, the Fund’s investments are valued daily based on a number of factors, including the type of investment and whether market quotations are readily available. The RIC’s Board of Trustees (the “Board”) has approved the Fund’s valuation policies and procedures for security valuation and designated PGIM Investments LLC (“PGIM Investments” or the “Manager”) as the “Valuation Designee,” as defined by Rule 2a-5(b) under the 1940 Act, to perform the fair value determination relating to all Fund investments. Pursuant to the Board’s oversight, the Valuation Designee has established a Valuation Committee to perform the duties and responsibilities as Valuation Designee under Rule 2a-5. The valuation procedures permit the Fund to utilize independent pricing vendor services, quotations from market makers, and alternative valuation methods when market quotations are either not readily available or not deemed representative of fair value. Fair value is the estimated price that would be received to sell an asset or paid to transfer a liability in an orderly transaction between market participants on the measurement date.
For the fiscal reporting year-end, securities and other assets and liabilities were fair valued at the close of the last U.S. business day. Trading in certain foreign securities may occur when the NYSE is closed (including weekends and holidays). Because such foreign securities
30
trade in markets that are open on weekends and U.S. holidays, the values of some of the Fund’s foreign investments may change on days when investors cannot purchase or redeem Fund shares.
Various inputs determine how the Fund’s investments are valued, all of which are categorized according to the three broad levels (Level 1, 2, or 3) detailed in the Schedule of Investments and referred to herein as the “fair value hierarchy” in accordance with FASB ASC Topic 820 — Fair Value Measurement.
Common or preferred stocks, exchange-traded funds (ETFs) and derivative instruments, if applicable, that are traded on a national securities exchange are valued at the last sale price as of the close of trading on the applicable exchange where the security principally trades. Securities traded via NASDAQ are valued at the NASDAQ official closing price. To the extent these securities are valued at the last sale price or NASDAQ official closing price, they are classified as Level 1 in the fair value hierarchy. In the event that no sale or official closing price on a valuation date exists, these securities are generally valued at the mean between the last reported bid and ask prices, or at the last bid price in the absence of an ask price. These securities are classified as Level 2 in the fair value hierarchy.
Foreign equities traded on foreign securities exchanges are generally valued using pricing vendor services that provide model prices derived using adjustment factors based on information such as local closing price, relevant general and sector indices, currency fluctuations, depositary receipts, and futures, as applicable. Securities valued using such model prices are classified as Level 2 in the fair value hierarchy. The models generate an evaluated adjustment factor for each security, which is applied to the local closing price to adjust it for post closing market movements up to the time the Fund is valued. Utilizing that evaluated adjustment factor, the vendor provides an evaluated price for each security. If the vendor does not provide an evaluated price, securities are valued in accordance with exchange-traded common and preferred stock valuation policies discussed above.
Investments in open-end funds (other than ETFs) are valued at their net asset values as of the close of the NYSE on the date of valuation. These securities are classified as Level 1 in the fair value hierarchy since they may be purchased or sold at their net asset values on the date of valuation.
Fixed income securities traded in the OTC market are generally classified as Level 2 in the fair value hierarchy. Such fixed income securities are typically valued using the market approach which generally involves obtaining data from an approved independent third-party vendor source. The Fund utilizes the market approach as the primary method to value securities when market prices of identical or comparable instruments are available. The third-party vendors’ valuation techniques used to derive the evaluated bid price are based on evaluating observable inputs, including but not limited to, yield curves, yield spreads, credit ratings, deal terms, tranche level attributes, default rates, cash flows, prepayment speeds, broker/dealer quotations and reported trades. Certain Level 3 securities are also valued using the market approach when obtaining a single broker quote or when utilizing
PGIM Quant Solutions Emerging Markets Equity Fund 31
Notes to Financial Statements (continued)
transaction prices for identical securities that have been used in excess of five business days. During the reporting period, there were no changes to report with respect to the valuation approach and/or valuation techniques discussed above.
Securities and other assets that cannot be priced according to the methods described above are valued based on policies and procedures approved by the Board. In the event that unobservable inputs are used when determining such valuations, the securities will be classified as Level 3 in the fair value hierarchy. Altering one or more unobservable inputs may result in a significant change to a Level 3 security’s fair value measurement.
When determining the fair value of securities, some of the factors influencing the valuation include: the nature of any restrictions on disposition of the securities; assessment of the general liquidity of the securities; the issuer’s financial condition and the markets in which it does business; the cost of the investment; the size of the holding and the capitalization of the issuer; the prices of any recent transactions or bids/offers for such securities or any comparable securities; and any available analyst media or other reports or information deemed reliable by the Valuation Designee regarding the issuer or the markets or industry in which it operates. Using fair value to price securities may result in a value that is different from a security’s most recent closing price and from the price used by other unaffiliated mutual funds to calculate their net asset values.
Foreign Currency Translation: The books and records of the Fund are maintained in U.S. dollars. Foreign currency amounts are translated into U.S. dollars on the following basis:
(i) market value of investment securities, other assets and liabilities — at the exchange rate as of the valuation date;
(ii) purchases and sales of investment securities, income and expenses — at the rates of exchange prevailing on the respective dates of such transactions.
Although the net assets of the Fund are presented at the foreign exchange rates and market values at the close of the period, the Fund does not generally isolate that portion of the results of operations arising as a result of changes in the foreign exchange rates from the fluctuations arising from changes in the market prices of long-term portfolio securities held at the end of the period. Similarly, the Fund does not isolate the effect of changes in foreign exchange rates from the fluctuations arising from changes in the market prices of long-term portfolio securities sold during the period. Accordingly, holding period unrealized and realized foreign currency gains (losses) are included in the reported net change in unrealized appreciation (depreciation) on investments and net realized gains (losses) on investment transactions on the Statements of Operations.
32
Net realized gains (losses) on foreign currency transactions represent net foreign exchange gains (losses) from the disposition of holdings of foreign currencies, currency gains (losses) realized between the trade and settlement dates on investment transactions, and the difference between the amounts of interest, dividends and foreign withholding taxes recorded on the Fund’s books and the U.S. dollar equivalent amounts actually received or paid. Net unrealized currency gains (losses) arise from valuing foreign currency denominated assets and liabilities (other than investments) at period end exchange rates.
Financial Futures Contracts: A financial futures contract is an agreement to purchase (long) or sell (short) an agreed amount of securities at a set price for delivery on a future date. Upon entering into a financial futures contract, the Fund is required to pledge to the broker an amount of cash and/or other assets equal to a certain percentage of the contract amount. This amount is known as the “initial margin.” Subsequent payments, known as “variation margin,” are made or received by the Fund each day, depending on the daily fluctuations in the value of the underlying security. Such variation margin is recorded for financial statement purposes on a daily basis as unrealized gain (loss). When the contract expires or is closed, the gain (loss) is realized and is presented in the Statement of Operations as net realized gain (loss) on futures transactions.
The Fund invested in financial futures contracts in order to hedge its existing portfolio securities, or securities the Fund intends to purchase, against fluctuations in value caused by changes in prevailing interest rates. Should interest rates move unexpectedly, the Fund may not achieve the anticipated benefits of the financial futures contracts and may realize a loss. The use of futures transactions involves the risk of imperfect correlation in movements in the price of futures contracts, interest rates and the underlying hedged assets. Since futures contracts are exchange-traded, there is minimal counterparty credit risk to the Fund since the exchanges’ clearinghouse acts as counterparty to all exchange-traded futures and guarantees the futures contracts against default.
Master Netting Arrangements: The Fund is subject to various Master Agreements, or netting arrangements, with select counterparties. These are agreements which a subadviser may have negotiated and entered into on behalf of all or a portion of the Fund. A master netting arrangement between the Fund and the counterparty permits the Fund to offset amounts payable by the Fund to the same counterparty against amounts to be received and by the receipt of collateral from the counterparty by the Fund to cover the Fund’s exposure to the counterparty. However, there is no assurance that such mitigating factors are easily enforceable. In addition to master netting arrangements, the right to set-off exists when all the conditions are met such that each of the parties owes the other determinable amounts, the reporting party has the right to set-off the amount owed with the amount owed by the other party, the reporting party intends to set-off and the right of set-off is enforceable by law.
Securities Lending: The Fund lends its portfolio securities to banks and broker-dealers. The loans are secured by collateral at least equal to the market value of the securities loaned. Collateral pledged by each borrower is invested in an affiliated money market fund and is
PGIM Quant Solutions Emerging Markets Equity Fund 33
Notes to Financial Statements (continued)
marked to market daily, based on the previous day’s market value, such that the value of the collateral exceeds the value of the loaned securities. In the event of significant appreciation in value of the securities on loan on the last business day of the reporting period, the financial statements may reflect a collateral value that is less than the market value of the loaned securities. Such shortfall is remedied as described above. Loans are subject to termination at the option of the borrower or the Fund. Upon termination of the loan, the borrower will return to the Fund securities identical to the loaned securities. The remaining open loans of the securities lending transactions are considered overnight and continuous. Should the borrower of the securities fail financially, the Fund has the right to repurchase the securities in the open market using the collateral.
The Fund recognizes income, net of any rebate and securities lending agent fees, for lending its securities in the form of fees or interest on the investment of any cash received as collateral. The borrower receives all interest and dividends from the securities loaned and such payments are passed back to the lender in amounts equivalent thereto, which are reflected in interest income or unaffiliated dividend income based on the nature of the payment on the Statement of Operations. The Fund also continues to recognize any unrealized gain (loss) in the market price of the securities loaned and on the change in the value of the collateral invested that may occur during the term of the loan. In addition, realized gain (loss) is recognized on changes in the value of the collateral invested upon liquidation of the collateral. Net earnings from securities lending are disclosed in the Statement of Operations.
Securities Transactions and Net Investment Income: Securities transactions are recorded on the trade date. Realized gains (losses) from investment and currency transactions are calculated on the specific identification method. Dividend income is recorded on the ex-date, or for certain foreign securities, when the Fund becomes aware of such dividends. Expenses are recorded on an accrual basis, which may require the use of certain estimates by management that may differ from actual expense amounts.
Taxes: It is the Fund’s policy to continue to meet the requirements of the Internal Revenue Code applicable to regulated investment companies and to distribute all of its taxable net investment income and capital gains, if any, to its shareholders. Therefore, no federal income tax provision is required. Withholding taxes on foreign dividends, interest and capital gains, if any, are recorded, net of reclaimable amounts, at the time the related income is earned.
The Fund is subject to foreign income taxes imposed by certain countries in which it invests. Additionally, capital gains realized upon disposition of securities issued in or by certain foreign countries are subject to capital gains tax imposed by those countries. All taxes are computed in accordance with the applicable foreign tax law, and, to the extent permitted,
34
capital losses are used to offset capital gains. Taxes attributable to income are accrued by the Fund as a reduction of income. Current and deferred tax expense attributable to capital gains is reflected as a component of realized or change in unrealized gain/loss on securities in the accompanying financial statements. To the extent that the Fund has country specific capital loss carryforwards, such carryforwards are applied against net unrealized gains when determining the deferred tax liability. Any deferred tax liability incurred by the Fund is included in either Other liabilities or Deferred tax liability on the accompanying Statement of Assets and Liabilities.
Dividends and Distributions: Dividends and distributions to shareholders, which are determined in accordance with federal income tax regulations and which may differ from GAAP, are recorded on the ex-date. Permanent book/tax differences relating to income and gain (loss) are reclassified between total distributable earnings (loss) and paid-in capital, as appropriate. The chart below sets forth the expected frequency of dividend and capital gains distributions to shareholders. Various factors may impact the frequency of dividend distributions to shareholders, including but not limited to adverse market conditions or portfolio holding-specific events.
| | | | |
| Expected Distribution Schedule to Shareholders* | | Frequency | |
Net Investment Income | | | Annually | |
Short-Term Capital Gains | | | Annually | |
Long-Term Capital Gains | | | Annually | |
| * | Under certain circumstances, the Fund may make more than one distribution of short-term and/or long-term capital gains during a fiscal year. |
Estimates: The preparation of financial statements requires management to make estimates and assumptions that affect the reported amounts and disclosures in the financial statements. Actual results could differ from those estimates.
The Fund has a management agreement with the Manager pursuant to which it has responsibility for all investment advisory services, including supervision of the subadviser’s performance of such services, and for rendering administrative services.
The Manager has entered into a subadvisory agreement with PGIM Quantitative Solutions LLC (“PGIM Quantitative Solutions” or the “subadviser”). The Manager pays for the services of PGIM Quantitative Solutions.
Fees payable under the management agreement are computed daily and paid monthly. For the reporting period ended October 31, 2023, the contractual and effective management fee rates were as follows:
| | |
| Contractual Management Rate | | Effective Management Fee, before any waivers and/or expense reimbursements |
0.75% of average daily net assets. | | 0.75% |
PGIM Quant Solutions Emerging Markets Equity Fund 35
Notes to Financial Statements (continued)
The Manager has contractually agreed, through February 28, 2025, to limit total annual operating expenses after fee waivers and/or expense reimbursements. This contractual waiver excludes interest, brokerage, taxes (such as income and foreign withholding taxes, stamp duty and deferred tax expenses), acquired fund fees and expenses, extraordinary expenses, and certain other Fund expenses such as dividend and interest expense and broker charges on short sales. Fees and/or expenses waived and/or reimbursed by the Manager for the purpose of preventing the expenses from exceeding a certain expense ratio limit may be recouped by the Manager within the same fiscal year during which such waiver and/or reimbursement is made if such recoupment can be realized without exceeding the expense limit in effect at the time of the recoupment for that fiscal year. The expense limitation attributable to the below class is:
| | |
| Class | | Expense Limitations |
R6 | | 1.20% |
The RIC, on behalf of the Fund, has a distribution agreement with Prudential Investment Management Services LLC (“PIMS”), which acts as the distributor of the Class R6 shares of the Fund. No distribution or service fees are paid to PIMS as distributor for Class R6 shares of the Fund.
PGIM Investments, PIMS and PGIM Quantitative Solutions are indirect, wholly-owned subsidiaries of Prudential Financial, Inc. (“Prudential”).
| 4. | Other Transactions with Affiliates |
Prudential Mutual Fund Services LLC (“PMFS”), an affiliate of PGIM Investments and an indirect, wholly-owned subsidiary of Prudential, serves as the Fund’s transfer agent and shareholder servicing agent. Transfer agent’s fees and expenses in the Statement of Operations include certain out-of-pocket expenses paid to non-affiliates, where applicable.
The Fund may invest its overnight sweep cash in the PGIM Core Government Money Market Fund (the “Core Government Fund”), a series of the Prudential Government Money Market Fund, Inc., and its securities lending cash collateral in the PGIM Institutional Money Market Fund (the “Money Market Fund”), a series of Prudential Investment Portfolios 2, each registered under the 1940 Act and managed by PGIM Investments. PGIM Investments and/or its affiliates are paid fees or reimbursed for providing their services to the Core Government Fund and the Money Market Fund. In addition to the realized and unrealized gains on investments in the Core Government Fund and the Money Market Fund, earnings from such investments are disclosed on the Statement of Operations as “Affiliated dividend income” and “Income from securities lending, net”, respectively.
36
The Fund may enter into certain securities purchase or sale transactions under Board approved Rule 17a-7 procedures. Rule 17a-7 is an exemptive rule under the 1940 Act that, subject to certain conditions, permits purchase and sale transactions among affiliated investment companies, or between an investment company and a person that is affiliated solely by reason of having a common (or affiliated) investment adviser, common directors/trustees, and/or common officers. For the year ended October 31, 2023, no Rule 17a-7 transactions were entered into by the Fund.
The aggregate cost of purchases and proceeds from sales of portfolio securities (excluding short-term investments and U.S. Government securities) for the reporting period ended October 31, 2023, were as follows:
| | |
| Cost of Purchases | | Proceeds from Sales |
$36,814,757 | | $36,298,308 |
A summary of the cost of purchases and proceeds from sales of shares of affiliated mutual funds for the year ended October 31, 2023, is presented as follows:
| | | | | | | | | | | | | | | | | | | | | | | | |
Value, Beginning of Year | | Cost of Purchases | | Proceeds from Sales | | | Change in Unrealized Gain (Loss) | | | Realized Gain (Loss) | | | Value, End of Year | | Shares, End of Year | | Income |
|
Short-Term Investments - Affiliated Mutual Funds: |
|
PGIM Core Government Money Market Fund(1)(wb) |
| | | | | | | |
$ — | | $11,865,182 | | | $11,399,042 | | | | $— | | | | $— | | | | $466,140 | | | | 466,140 | | | $26,913 |
|
PGIM Institutional Money Market Fund(1)(b)(wb) |
| | | | | | | |
238,749 | | 336,754 | | | 575,503 | | | | — | | | | — | | | | — | | | | — | | | 5,610(2) |
$238,749 | | $12,201,936 | | | $11,974,545 | | | | $— | | | | $— | | | | $466,140 | | | | | | | $32,523 |
| (1) | The Fund did not have any capital gain distributions during the reporting period. |
| (2) | The amount, or a portion thereof, represents the affiliated securities lending income shown on the Statement of Operations. |
| (b) | Represents security, or portion thereof, purchased with cash collateral received for securities on loan and includes dividend reinvestment. |
| (wb) | Represents an investment in a Fund affiliated with the Manager. |
| 6. | Distributions and Tax Information |
Distributions to shareholders, which are determined in accordance with federal income tax regulations and which may differ from GAAP, are recorded on the ex-date.
PGIM Quant Solutions Emerging Markets Equity Fund 37
Notes to Financial Statements (continued)
For the year ended October 31, 2023, the tax character of dividends paid as reflected in the Statement of Changes in Net Assets were as follows:
| | | | | | |
| | | | |
Ordinary Income | | Long-Term Capital Gains | | Tax Return of Capital | | Total Dividends and Distributions |
$1,391,984 | | $— | | $— | | $1,391,984 |
For the year ended October 31, 2022, the tax character of dividends paid as reflected in the Statement of Changes in Net Assets were as follows:
| | | | | | |
| | | | |
Ordinary Income | | Long-Term Capital Gains | | Tax Return of Capital | | Total Dividends and Distributions |
$1,184,765 | | $212,024 | | $— | | $1,396,789 |
For the year ended October 31, 2023, the Fund had the following amounts of accumulated undistributed earnings on a tax basis:
| | |
| | |
Undistributed Ordinary Income | | Undistributed Long-Term Capital Gains |
| $1,048,912 | | $— |
The United States federal income tax basis of the Fund’s investments and the net unrealized appreciation as of October 31, 2023 were as follows:
| | | | | | |
| | | | |
| Tax Basis | | Gross Unrealized Appreciation | | Gross Unrealized Depreciation | | Net Unrealized Appreciation |
$33,689,026 | | $5,406,973 | | $(3,844,669) | | $1,562,304 |
The differences between GAAP and tax basis were primarily attributable to deferred losses on wash sales, investments in passive foreign investment companies, corporate spin-off adjustment, mark-to-market of futures contracts and other GAAP to tax differences.
For federal income tax purposes, the Fund had an approximated capital loss carryforward as of October 31, 2023 which can be carried forward for an unlimited period. No capital gains distributions are expected to be paid to shareholders until net gains have been realized in excess of such losses.
| | |
| | |
Capital Loss Carryforward | | Capital Loss Carryforward Utilized |
| $4,159,000 | | $— |
The Manager has analyzed the Fund’s tax positions taken on federal, state and local income tax returns for all open tax years and has concluded that no provision for income tax is required in the Fund’s financial statements for the current reporting period. Since tax
38
authorities can examine previously filed tax returns, the Fund’s U.S. federal and state tax returns for each of the four fiscal years up to the most recent fiscal year ended October 31, 2023 are subject to such review.
The Fund offers Class R6 shares. Class R6 shares are not subject to any sales or redemption charge and are available exclusively for sale to a limited group of investors.
The RIC is authorized to issue an unlimited number of shares of beneficial interest, which may be divided into an unlimited number of series of such shares.
As of October 31, 2023, Prudential, through its affiliated entities, including affiliated funds (if applicable), owned shares of the Fund as follows:
| | | | |
| | | |
| Class | | Number of Shares | | Percentage of Outstanding Shares |
R6 | | 3,482,245 | | 100.0% |
At the reporting period end, the number of shareholders holding greater than 5% of the Fund are as follows:
| | | | |
| | | |
| | | Number of Shareholders | | Percentage of Outstanding Shares |
Affiliated | | 3 | | 82.1% |
Unaffiliated | | — | | — |
The RIC, on behalf of the Fund, along with other affiliated registered investment companies (the “Participating Funds”), is a party to a Syndicated Credit Agreement (“SCA”) with a group of banks. The purpose of the SCA is to provide an alternative source of temporary funding for capital share redemptions. The table below provides details of the current SCA in effect at the reporting period-end as well as the prior SCA.
| | | | |
| | | |
| | | Current SCA | | Prior SCA |
Term of Commitment | | 9/29/2023 - 9/26/2024 | | 9/30/2022 – 9/28/2023 |
Total Commitment | | $ 1,200,000,000 | | $ 1,200,000,000 |
Annualized Commitment Fee on the Unused Portion of the SCA | | 0.15% | | 0.15% |
Annualized Interest Rate on Borrowings | | 1.00% plus the higher of (1) the effective federal funds rate, (2) the daily SOFR rate plus 0.10% or (3) zero percent | | 1.00% plus the higher of (1) the effective federal funds rate, (2) the daily SOFR rate plus 0.10% or (3) zero percent |
Certain affiliated registered investment companies that are parties to the SCA include portfolios that are subject to a predetermined mathematical formula used to manage certain benefit guarantees offered under variable annuity contracts. The formula may result in large scale asset flows into and out of these portfolios. Consequently, these portfolios may be more
PGIM Quant Solutions Emerging Markets Equity Fund 39
Notes to Financial Statements (continued)
likely to utilize the SCA for purposes of funding redemptions. It may be possible for those portfolios to fully exhaust the committed amount of the SCA, thereby requiring the Manager to allocate available funding per a Board-approved methodology designed to treat the Participating Funds in the SCA equitably.
The Fund did not utilize the SCA during the year ended October 31, 2023.
| 9. | Risks of Investing in the Fund |
The Fund’s risks include, but are not limited to, some or all of the risks discussed below. For further information on the Fund’s risks, please refer to the Fund’s Prospectus and Statement of Additional Information.
Concentration Risk: To the extent that the Fund is concentrated in the securities of companies, a particular market, industry, group of industries, sector or asset class, country, region or group of countries, the Fund may be adversely affected by the performance of those securities, may be subject to increased price volatility and may be more susceptible to adverse economic, market, political or regulatory occurrences affecting that market, industry, group of industries, sector or asset class, country, region or group of countries.
Country Risk: Changes in the business environment may adversely affect operating profits or the value of assets in a specific country. For example, financial factors such as currency controls, devaluation or regulatory changes or stability factors such as mass riots, civil war and other potential events may contribute to companies’ operational risks.
Currency Risk: The Fund’s net asset value could decline as a result of changes in exchange rates, which could adversely affect the Fund’s investments in currencies, or in securities that trade in, and receive revenues related to, currencies, or in derivatives that provide exposure to currencies. Certain foreign countries may impose restrictions on the ability of issuers of foreign securities to make payment of principal and interest or dividends to investors located outside the country, due to blockage of foreign currency exchanges or otherwise.
Economic and Market Events Risk: Events in the U.S. and global financial markets, including actions taken by the U.S. Federal Reserve or foreign central banks to stimulate or stabilize economic growth or the functioning of the securities markets, or otherwise reduce inflation, may at times result in unusually high market volatility, which could negatively impact performance. Governmental efforts to curb inflation often have negative effects on the level of economic activity. Relatively reduced liquidity in credit and fixed income markets could adversely affect issuers worldwide.
40
Emerging Markets Risk: The risks of foreign investments are greater for investments in or exposed to emerging markets. Emerging market countries typically have economic and political systems that are less fully developed, and can be expected to be less stable, than those of more developed countries. For example, the economies of such countries can be subject to rapid and unpredictable rates of inflation or deflation. Low trading volumes may result in a lack of liquidity and price volatility. Emerging market countries may have policies that restrict investment by non-U.S. investors, or that prevent non-U.S. investors from withdrawing their money at will.
The Fund may invest in some emerging markets that subject it to risks such as those associated with illiquidity, custody of assets, different settlement and clearance procedures and asserting legal title under a developing legal and regulatory regime to a greater degree than in developed markets or even in other emerging markets.
Equity and Equity-Related Securities Risk: Equity and equity-related securities may be subject to changes in value, and their values may be more volatile than those of other asset classes. In addition to an individual security losing value, the value of the equity markets or a sector in which the Fund invests could go down. Different parts of a market can react differently to adverse issuer, market, regulatory, political and economic developments.
Foreign Securities Risk: Investments in securities of non-U.S. issuers (including those denominated in U.S. dollars) may involve more risk than investing in securities of U.S. issuers. Foreign political, economic and legal systems, especially those in developing and emerging market countries, may be less stable and more volatile than in the United States. Foreign legal systems generally have fewer regulatory requirements than the U.S. legal system, particularly those of emerging markets. In general, less information is publicly available with respect to non-U.S. companies than U.S. companies. Non-U.S. companies generally are not subject to the same accounting, auditing, and financial reporting standards as are U.S. companies. Additionally, the changing value of foreign currencies and changes in exchange rates could also affect the value of the assets the Fund holds and the Fund’s performance. Certain foreign countries may impose restrictions on the ability of issuers of foreign securities to make payment of principal and interest or dividends to investors located outside the country, due to blockage of foreign currency exchanges or otherwise. Investments in emerging markets are subject to greater volatility and price declines.
In addition, the Fund’s investments in non-U.S. securities may be subject to the risks of nationalization or expropriation of assets, imposition of currency exchange controls or restrictions on the repatriation of non-U.S. currency, confiscatory taxation and adverse diplomatic developments. Special U.S. tax considerations may apply.
Fund of Funds Risk: The Fund is an investment option for other PGIM Investments-advised mutual funds that are managed as “funds of funds.” As a result, from time to time, the Fund may experience relatively large redemptions and could be required to liquidate its assets at inopportune times or at a loss or depressed value, which could cause the value of your investment to decline.
PGIM Quant Solutions Emerging Markets Equity Fund 41
Notes to Financial Statements (continued)
Increase in Expenses Risk: Your actual cost of investing in the Fund may be higher than the expenses shown in the expense table in the Fund’s prospectus for a variety of reasons. For example, expense ratios may be higher than those shown if average net assets decrease. Net assets are more likely to decrease and Fund expense ratios are more likely to increase when markets are volatile. Active and frequent trading of Fund securities can increase expenses.
Investments in China Risk: Investments in China subject the Fund to risks specific to China and may make it more volatile than other funds. Over the last few decades, the Chinese government has undertaken reform of economic and market practices and has expanded the sphere of private ownership of property in China. However, Chinese markets generally continue to experience inefficiency, volatility and pricing anomalies resulting from governmental influence, a lack of publicly available information and/or political and social instability. Internal social unrest or confrontations with other neighboring countries, including military conflicts in response to such events, may also disrupt economic development in China and result in a greater risk of currency fluctuations, currency non-convertibility, interest rate fluctuations and higher rates of inflation.
China has experienced security concerns, such as terrorism and strained international relations. Incidents involving China’s or the region’s security may cause uncertainty in Chinese markets and may adversely affect the Chinese economy and the Fund’s investments. Export growth continues to be a major driver of China’s rapid economic growth. Reduction in spending on Chinese products and services, institution of additional tariffs or other trade barriers, including as a result of heightened trade tensions between China and the U.S., or a downturn in any of the economies of China’s key trading partners may have an adverse impact on the Chinese economy or the Fund. For example, a series of executive orders issued between November 2020 and June 2021 prohibit the Fund from investing in certain companies identified by the U.S. government as “Chinese Military Industrial Complex Companies.” The restrictions in these executive orders may force the subadviser to sell certain positions and may restrict the Fund from future investments the subadviser deems otherwise attractive.
Chinese companies, including Chinese companies that are listed on U.S. exchanges, are not subject to the same degree of regulatory requirements, accounting standards or auditor oversight as companies in more developed countries, and as a result, information about the Chinese securities in which the Fund invests may be less reliable or complete. There may be significant obstacles to obtaining information necessary for investigations into or litigation against Chinese companies and shareholders may have limited legal remedies.
Large Capitalization Company Risk: Companies with large market capitalizations go in and out of favor based on market and economic conditions. Larger companies tend to be less
42
volatile than companies with smaller market capitalizations. In exchange for this potentially lower risk, the Fund’s value may not rise or fall as much as the value of funds that emphasize companies with smaller market capitalizations.
Large Shareholder and Large Scale Redemption Risk: Certain individuals, accounts, funds (including funds affiliated with the Manager) or institutions, including the Manager and its affiliates, may from time to time own or control a substantial amount of the Fund’s shares. There is no requirement that these entities maintain their investment in the Fund. There is a risk that such large shareholders or that the Fund’s shareholders generally may redeem all or a substantial portion of their investments in the Fund in a short period of time, which could have a significant negative impact on the Fund’s NAV, liquidity, and brokerage costs. Large redemptions could also result in tax consequences to shareholders and impact the Fund’s ability to implement its investment strategy. The Fund’s ability to pursue its investment objective after one or more large scale redemptions may be impaired and, as a result, the Fund may invest a larger portion of its assets in cash or cash equivalents.
Liquidity Risk: Liquidity risk is the risk that the Fund could not meet requests to redeem shares issued by the Fund without significant dilution of remaining investors’ interests in the Fund. The Fund may invest in instruments that trade in lower volumes and are more illiquid than other investments. If the Fund is forced to sell these investments to pay redemption proceeds or for other reasons, the Fund may lose money. In addition, when there is no willing buyer and investments cannot be readily sold at the desired time or price, the Fund may have to accept a lower price or may not be able to sell the instrument at all. An inability to sell a portfolio position can adversely affect the Fund’s value or prevent the Fund from being able to take advantage of other investment opportunities.
Management Risk: Actively managed funds are subject to management risk. The subadviser will apply investment techniques and risk analyses in making investment decisions for the Fund, but the subadviser’s judgments about the attractiveness, value or market trends affecting a particular security, industry or sector or about market movements may be incorrect. Additionally, the investments selected for the Fund may underperform the markets in general, the Fund’s benchmark and other funds with similar investment objectives.
Market Disruption and Geopolitical Risks: Market disruption can be caused by economic, financial or political events and factors, including but not limited to, international wars or conflicts (including Russia’s military invasion of Ukraine), geopolitical developments (including trading and tariff arrangements, sanctions and cybersecurity attacks), instability in regions such as Asia, Eastern Europe and the Middle East, terrorism, natural disasters and public health epidemics (including the outbreak of COVID-19 globally).
The extent and duration of such events and resulting market disruptions cannot be predicted, but could be substantial and could magnify the impact of other risks to the Fund. These and other similar events could adversely affect the U.S. and foreign financial markets and lead to increased market volatility, reduced liquidity in the securities markets, significant
PGIM Quant Solutions Emerging Markets Equity Fund 43
Notes to Financial Statements (continued)
negative impacts on issuers and the markets for certain securities and commodities and/or government intervention. They may also cause short- or long-term economic uncertainties in the United States and worldwide. As a result, whether or not the Fund invests in securities of issuers located in or with significant exposure to the countries directly affected, the value and liquidity of the Fund’s investments may be negatively impacted. Further, due to closures of certain markets and restrictions on trading certain securities, the value of certain securities held by the Fund could be significantly impacted, which could lead to such securities being valued at zero.
Market Risk: Securities markets may be volatile and the market prices of the Fund’s securities may decline. Securities fluctuate in price based on changes in an issuer’s financial condition and overall market and economic conditions. If the market prices of the securities owned by the Fund fall, the value of your investment in the Fund will decline.
Model Design Risk: The subadviser uses certain quantitative models to help guide its investment decisions. The design of the underlying models may be flawed or incomplete. The investment models the subadviser uses are based on historical and theoretical underpinnings that it believes are sound. There can be no guarantee, however, that these underpinnings will correlate with security price behavior in the manner assumed by the subadviser’s models. Additionally, the quantitative techniques that underlie the subadviser’s portfolio construction processes may fail to fully anticipate important risks.
Model Implementation Risk: While the subadviser strives to mitigate the likelihood of material implementation errors, it is impossible to completely eliminate the risk of error in the implementation of the computer models that guide the subadviser’s quantitative investment processes. Additionally, it may be difficult to implement model recommendations in volatile and rapidly changing market conditions.
Portfolio Turnover Risk: The length of time the Fund has held a particular security is not generally a consideration in investment decisions. Under certain market conditions, the Fund’s turnover rate may be higher than that of other mutual funds. Portfolio turnover generally involves some expense to the Fund, including brokerage commissions or dealer mark-ups and other transaction costs on the sale of securities and reinvestment in other securities. These transactions may result in realization of taxable capital gains. The trading costs and tax effects associated with portfolio turnover may adversely affect the Fund’s investment performance.
Small and Medium Sized Companies Risk: Small and medium sized companies usually offer a smaller range of products and services than larger companies. Smaller companies may also have limited financial resources and may lack management depth. As a result, their prices may fluctuate more than the stocks of larger, more established companies.
44
Historically, small and medium sized companies have sometimes gone through extended periods when they did not perform as well as larger companies. Small and medium sized companies generally are more illiquid than larger companies, which may make such investments more difficult to sell at the time and price that the Fund would like.
Value Style Risk: Since the Fund may invest significantly in value stocks or use a value investment style, there is the risk that value stocks or the value style may be out of favor for long periods of time, that the market will not recognize a security’s intrinsic value for a long time or at all, or that a stock judged to be undervalued may actually be appropriately priced or overvalued. Issuers of value stocks may have experienced adverse business developments or may be subject to special risks that have caused the stock to be out of favor. In addition, the Fund’s value investment style may go out of favor with investors, negatively affecting the Fund’s performance. If the Fund’s assessment of market conditions or a company’s value is inaccurate, the Fund could suffer losses or produce poor performance relative to other funds.
| 10. | Recent Regulatory Developments |
Effective January 24, 2023, the SEC adopted rule and form amendments to require mutual funds and ETFs to transmit concise and visually engaging streamlined annual and semiannual reports to shareholders that highlight key information deemed important for retail investors to assess and monitor their fund investments (the “Rule”). Other information, including financial statements, will no longer appear in the funds’ streamlined shareholder reports but must be available online, delivered free of charge upon request, and filed on a semiannual basis on Form N-CSR. The Rule and form amendments have a compliance date of July 24, 2024. At this time, management is evaluating the Rule and its impact to the Fund.
PGIM Quant Solutions Emerging Markets Equity Fund 45
Report of Independent Registered Public Accounting Firm
To the Board of Trustees of Prudential Investment Portfolios 2 and Shareholders of PGIM Quant Solutions Emerging Markets Equity Fund
Opinion on the Financial Statements
We have audited the accompanying statement of assets and liabilities, including the schedule of investments, of PGIM Quant Solutions Emerging Markets Equity Fund (one of the funds constituting Prudential Investment Portfolios 2, referred to hereafter as the “Fund”) as of October 31, 2023, the related statement of operations for the year ended October 31, 2023, the statements of changes in net assets for each of the two years in the period ended October 31, 2023, including the related notes, and the financial highlights for each of the four years in the period ended October 31, 2023 (collectively referred to as the “financial statements”). In our opinion, the financial statements present fairly, in all material respects, the financial position of the Fund as of October 31, 2023, the results of its operations for the year then ended, the changes in its net assets for each of the two years in the period ended October 31, 2023 and the financial highlights for each of the four years in the period ended October 31, 2023 in conformity with accounting principles generally accepted in the United States of America.
The financial statements of the Fund as of and for the year ended October 31, 2019 and the financial highlights for the period ended October 31, 2019 (not presented herein, other than the financial highlights) were audited by other auditors whose report dated December 19, 2019 expressed an unqualified opinion on those financial statements and financial highlights.
Basis for Opinion
These financial statements are the responsibility of the Fund’s management. Our responsibility is to express an opinion on the Fund’s financial statements based on our audits. We are a public accounting firm registered with the Public Company Accounting Oversight Board (United States) (PCAOB) and are required to be independent with respect to the Fund in accordance with the U.S. federal securities laws and the applicable rules and regulations of the Securities and Exchange Commission and the PCAOB.
We conducted our audits of these financial statements in accordance with the standards of the PCAOB. Those standards require that we plan and perform the audit to obtain reasonable assurance about whether the financial statements are free of material misstatement, whether due to error or fraud.
Our audits included performing procedures to assess the risks of material misstatement of the financial statements, whether due to error or fraud, and performing procedures that respond to those risks. Such procedures included examining, on a test basis, evidence regarding the amounts and disclosures in the financial statements. Our audits also included evaluating the accounting principles used and significant estimates made by management, as well as evaluating the overall presentation of the financial statements. Our procedures included confirmation of securities owned as of October 31, 2023 by correspondence with the custodian, transfer agent and brokers. We believe that our audits provide a reasonable basis for our opinion.
/s/PricewaterhouseCoopers LLP
New York, New York
December 18, 2023
We have served as the auditor of one or more investment companies in the PGIM Retail Funds complex since 2020.
46
Tax Information (unaudited)
For the year ended October 31, 2023, the Fund reports the maximum amount allowable, but not less than 51.38% of the ordinary income dividends paid during the period as qualified dividend income in accordance with Section 854 of the Internal Revenue Code.
For the year ended October 31, 2023, the Fund made an election to pass through the maximum amount of the portion of the ordinary income dividends paid derived from foreign source income as well as any foreign taxes paid by the Fund in accordance with Section 853 of the Internal Revenue Code of the following amounts: $180,585 foreign tax credit from recognized foreign source income of $1,004,932.
In January 2024, you will be advised on IRS Form 1099-DIV or substitute 1099-DIV as to the federal tax status of the dividends received by you in calendar year 2023.
PGIM Quant Solutions Emerging Markets Equity Fund 47
INFORMATION ABOUT BOARD MEMBERS AND OFFICERS (unaudited)
Information about Board Members and Officers of the Fund is set forth below. Board Members who are not deemed to be “interested persons” of the Fund, as defined in the 1940 Act, are referred to as “Independent Board Members.” Board Members who are deemed to be “interested persons” of the Fund are referred to as “Interested Board Members.” The Board Members are responsible for the overall supervision of the operations of the Fund and perform the various duties imposed on the directors of investment companies by the 1940 Act. The Board in turn elects the Officers, who are responsible for administering the day-to-day operations of the Fund.
| | | | | | |
| | | |
| Independent Board Members | | | | |
| | | | |
Name Year of Birth Position(s) Portfolios Overseen | | Principal Occupation(s) During Past Five Years | | Other Directorships Held During Past Five Years | | Length of Board Service |
| | | | |
Ellen S. Alberding 1958 Board Member Portfolios Overseen: 100 | | Chief Executive Officer and President, The Joyce Foundation (charitable foundation) (since 2002); formerly Vice Chair, City Colleges of Chicago (community college system) (2011-2015); formerly Trustee, National Park Foundation (charitable foundation for national park system) (2009-2018); formerly Trustee, Economic Club of Chicago (2009-2016); Trustee, Loyola University (since 2018). | | None. | | Since September 2013 |
| | | | |
Kevin J. Bannon 1952 Board Member Portfolios Overseen: 101 | | Retired; formerly Managing Director (April 2008-May 2015) and Chief Investment Officer (October 2008-November 2013) of Highmount Capital LLC (registered investment adviser); formerly Executive Vice President and Chief Investment Officer (April 1993-August 2007) of Bank of New York Company; formerly President (May 2003-May 2007) of BNY Hamilton Family of Mutual Funds. | | Director of Urstadt Biddle Properties (equity real estate investment trust) (September 2008-August 2023). | | Since July 2008 |
PGIM Quant Solutions Emerging Markets Equity Fund
| | | | | | |
| | | |
| Independent Board Members | | | | |
| | | | |
Name Year of Birth Position(s) Portfolios Overseen | | Principal Occupation(s) During Past Five Years | | Other Directorships Held During Past Five Years | | Length of Board Service |
| | �� | | |
Linda W. Bynoe 1952 Board Member Portfolios Overseen: 98 | | President and Chief Executive Officer (since March 1995) and formerly Chief Operating Officer (December 1989-February 1995) of Telemat Limited LLC (formerly Telemat Ltd) (management consulting); formerly Vice President (January 1985-June 1989) at Morgan Stanley & Co. (broker-dealer). | | Trustee of Equity Residential (residential real estate) (since December 2009); Director of Northern Trust Corporation (financial services) (since April 2006); formerly Director of Anixter International, Inc. (communication products distributor) (January 2006-June 2020). | | Since March 2005 |
| | | | |
Barry H. Evans 1960 Board Member Portfolios Overseen: 101 | | Retired; formerly President (2005-2016), Global Chief Operating Officer (2014-2016), Chief Investment Officer - Global Head of Fixed Income (1998-2014), and various portfolio manager roles (1986-2006), Manulife Asset Management (asset management). | | Formerly Director, Manulife Trust Company (2011-2018); formerly Director, Manulife Asset Management Limited (2015-2017); formerly Chairman of the Board of Directors of Manulife Asset Management U.S. (2005-2016); formerly Chairman of the Board, Declaration Investment Management and Research (2008-2016). | | Since September 2017 |
| | | | |
Keith F. Hartstein 1956 Board Member & Independent Chair Portfolios Overseen: 101 | | Retired; formerly Member (November 2014-September 2022) of the Governing Council of the Independent Directors Council (IDC) (organization of independent mutual fund directors); formerly Executive Committee of the IDC Board of Governors (October 2019-December 2021); formerly President and Chief Executive Officer (2005-2012), Senior Vice President (2004-2005), Senior Vice President of Sales and Marketing (1997-2004), and various executive management positions (1990-1997), John Hancock Funds, LLC (asset management); formerly Chairman, Investment Company Institute’s Sales Force Marketing Committee (2003-2008). | | None. | | Since September 2013 |
Visit our website at pgim.com/investments
| | | | | | |
| | | |
| Independent Board Members | | | | |
| | | | |
Name Year of Birth Position(s) Portfolios Overseen | | Principal Occupation(s) During Past Five Years | | Other Directorships Held During Past Five Years | | Length of Board Service |
| | | | |
Laurie Simon Hodrick 1962 Board Member Portfolios Overseen: 98 | | A. Barton Hepburn Professor Emerita of Economics in the Faculty of Business, Columbia Business School (since 2018); Visiting Fellow at the Hoover Institution, Stanford University (since 2015); Sole Member, ReidCourt LLC (since 2008) (a consulting firm); formerly Visiting Professor of Law, Stanford Law School (2015-2021); formerly A. Barton Hepburn Professor of Economics in the Faculty of Business, Columbia Business School (1996-2017); formerly Managing Director, Global Head of Alternative Investment Strategies, Deutsche Bank (2006-2008). | | Independent Director, Andela (since January 2022) (global talent network); Independent Director, Roku (since December 2020) (communication services); formerly Independent Director, Synnex Corporation (2019-2021) (information technology); formerly Independent Director, Kabbage, Inc. (2018-2020) (financial services); formerly Independent Director, Corporate Capital Trust (2017-2018) (a business development company). | | Since September 2017 |
| | | | |
Brian K. Reid 1961 Board Member Portfolios Overseen: 101 | | Retired; formerly Chief Economist for the Investment Company Institute (ICI) (2005-2017); formerly Senior Economist and Director of Industry and Financial Analysis at the ICI (1998-2004); formerly Senior Economist, Industry and Financial Analysis at the ICI (1996-1998); formerly Staff Economist at the Federal Reserve Board (1989-1996); formerly Director, ICI Mutual Insurance Company (2012-2017). | | None. | | Since March 2018 |
PGIM Quant Solutions Emerging Markets Equity Fund
| | | | | | |
| | | |
| Independent Board Members | | | | |
| | | | |
Name Year of Birth Position(s) Portfolios Overseen | | Principal Occupation(s) During Past Five Years | | Other Directorships Held During Past Five Years | | Length of Board Service |
| | | | |
Grace C. Torres 1959 Board Member Portfolios Overseen: 101 | | Retired; formerly Treasurer and Principal Financial and Accounting Officer of the PGIM Funds, Target Funds, Advanced Series Trust, Prudential Variable Contract Accounts and The Prudential Series Fund (1998-June 2014); Assistant Treasurer (March 1999-June 2014) and Senior Vice President (September 1999-June 2014) of PGIM Investments LLC; Assistant Treasurer (May 2003-June 2014) and Vice President (June 2005-June 2014) of AST Investment Services, Inc.; Senior Vice President and Assistant Treasurer (May 2003-June 2014) of Prudential Annuities Advisory Services, Inc. | | Director (since January 2018) of OceanFirst Financial Corp. and OceanFirst Bank; formerly Director (July 2015-January 2018) of Sun Bancorp, Inc. N.A. and Sun National Bank. | | Since November 2014 |
Visit our website at pgim.com/investments
| | | | | | |
| | | |
| Interested Board Members | | | | |
| | | | |
Name Year of Birth Position(s) Portfolios Overseen | | Principal Occupation(s) During Past Five Years | | Other Directorships Held During Past Five Years | | Length of Board Service |
| | | | |
Stuart S. Parker 1962 Board Member & President Portfolios Overseen: 101 | | President, Chief Executive Officer, Chief Operating Officer and Officer in Charge of PGIM Investments LLC (formerly known as Prudential Investments LLC) (since January 2012); President and Principal Executive Officer (“PEO”) (since December 2023) of the PGIM Credit Income Fund; President and PEO (since September 2022) of the PGIM Private Credit Fund; President and PEO (since March 2022) of the PGIM Private Real Estate Fund, Inc.; formerly Executive Vice President of Jennison Associates LLC and Head of Retail Distribution of PGIM Investments LLC (June 2005-December 2011); Investment Company Institute - Board of Governors (since May 2012). | | None. | | Since January 2012 |
| | | | |
Scott E. Benjamin 1973 Board Member & Vice President Portfolios Overseen: 101 | | Executive Vice President (since May 2009) of PGIM Investments LLC; Vice President (since June 2012) of Prudential Investment Management Services LLC; Executive Vice President (since September 2009) of AST Investment Services, Inc.; Senior Vice President of Product Development and Marketing, PGIM Investments (since February 2006); Vice President (since December 2023) of the PGIM Credit Income Fund; Vice President (since September 2022) of the PGIM Private Credit Fund; Vice President (since March 2022) of the PGIM Private Real Estate Fund, Inc.; formerly Vice President of Product Development and Product Management, PGIM Investments LLC (2003-2006). | | None. | | Since March 2010 |
PGIM Quant Solutions Emerging Markets Equity Fund
| | | | |
| | | |
| Fund Officers(a) | | | | |
| | | |
Name Year of Birth Fund Position | | Principal Occupation(s) During Past Five Years | | Length of Service as Fund Officer |
| | | |
Claudia DiGiacomo 1974 Chief Legal Officer | | Chief Legal Officer (since December 2023) of the PGIM Credit Income Fund; Chief Legal Officer (since September 2022) of the PGIM Private Credit Fund; Chief Legal Officer (since July 2022) of the PGIM Private Real Estate Fund, Inc.; Chief Legal Officer, Executive Vice President and Secretary of PGIM Investments LLC (since August 2020); Chief Legal Officer of Prudential Mutual Fund Services LLC (since August 2020); Chief Legal Officer of PIFM Holdco, LLC (since August 2020); Vice President and Corporate Counsel (since January 2005) of Prudential; and Corporate Counsel of AST Investment Services, Inc. (since August 2020); formerly Vice President and Assistant Secretary of PGIM Investments LLC (2005-2020); formerly Associate at Sidley Austin Brown & Wood LLP (1999-2004). | | Since December 2005 |
| | | |
Andrew Donohue 1972 Chief Compliance Officer | | Chief Compliance Officer (since May 2023) of the PGIM Funds, Target Funds, PGIM ETF Trust, PGIM Global High Yield Fund, Inc., PGIM High Yield Bond Fund, Inc., PGIM Short Duration High Yield Opportunities Fund, Advanced Series Trust, The Prudential Series Fund, Prudential’s Gibraltar Fund, Inc., PGIM Private Credit Fund, PGIM Private Real Estate Fund, Inc.; Chief Compliance Officer of AST Investment Services, Inc. (since October 2022); Vice President, Chief Compliance Officer of PGIM Investments LLC (since September 2022); Chief Compliance Officer (since December 2023) of the PGIM Credit Income Fund; formerly various senior compliance roles within Principal Global Investors, LLC., global asset management for Principal Financial (2011-2022), most recently as Global Chief Compliance Officer (2016-2022). | | Since May 2023 |
| | | |
Andrew R. French 1962 Secretary | | Vice President (since December 2018) of PGIM Investments LLC; Secretary (since December 2023) of the PGIM Credit Income Fund; Secretary (since September 2022) of the PGIM Private Credit Fund; Secretary (since March 2022) of the PGIM Private Real Estate Fund, Inc.; formerly Vice President and Corporate Counsel (2010-2018) of Prudential; formerly Director and Corporate Counsel (2006-2010) of Prudential; Vice President and Assistant Secretary (since January 2007) of PGIM Investments LLC; Vice President and Assistant Secretary (since January 2007) of Prudential Mutual Fund Services LLC. | | Since October 2006 |
Visit our website at pgim.com/investments
| | | | |
| | | |
| Fund Officers(a) | | | | |
| | | |
Name Year of Birth Fund Position | | Principal Occupation(s) During Past Five Years | | Length of Service as Fund Officer |
| | | |
Melissa Gonzalez 1980 Assistant Secretary | | Vice President and Corporate Counsel (since September 2018) of Prudential; Vice President and Assistant Secretary (since August 2020) of PGIM Investments LLC; Assistant Secretary (since December 2023) of the PGIM Credit Income Fund; Assistant Secretary (since September 2022) of the PGIM Private Credit Fund; Assistant Secretary (since March 2022) of the PGIM Private Real Estate Fund, Inc.; formerly Director and Corporate Counsel (March 2014-September 2018) of Prudential. | | Since March 2020 |
| | | |
Patrick E. McGuinness 1986 Assistant Secretary | | Vice President and Assistant Secretary (since August 2020) of PGIM Investments LLC; Director and Corporate Counsel (since February 2017) of Prudential; Assistant Secretary (since December 2023) of the PGIM Credit Income Fund; Assistant Secretary (since September 2022) of the PGIM Private Credit Fund; Assistant Secretary (since March 2022) of the PGIM Private Real Estate Fund, Inc. | | Since June 2020 |
| | | |
Debra Rubano 1975 Assistant Secretary | | Vice President and Corporate Counsel (since November 2020) of Prudential; Assistant Secretary (since December 2023) of the PGIM Credit Income Fund; Assistant Secretary (since September 2022) of the PGIM Private Credit Fund; Assistant Secretary (since March 2022) of the PGIM Private Real Estate Fund, Inc; formerly Director and Senior Counsel of Allianz Global Investors U.S. Holdings LLC (2010-2020) and Assistant Secretary of numerous funds in the Allianz fund complex (2015-2020). | | Since December 2020 |
| | | |
George Hoyt 1965 Assistant Secretary | | Vice President and Corporate Counsel of Prudential (since September 2023); formerly Associate General Counsel of Franklin Templeton and Secretary and Chief Legal Officer of certain funds in the Franklin Templeton complex (2020- 2023) and Managing Director (2016-2020) and Associate General Counsel for Legg Mason, Inc. and its predecessors (2004-2020). | | Since December 2023 |
| | | |
Devan Goolsby 1991 Assistant Secretary | | Vice President and Corporate Counsel of Prudential (since May 2023); formerly Associate at Eversheds Sutherland (US) LLP (2021-2023); Compliance Officer at Bloomberg LP (2019-2021); and an Examiner at the Financial Industry Regulatory Authority (2015-2019). | | Since December 2023 |
| | | |
Kelly A. Coyne 1968 Assistant Secretary | | Director, Investment Operations of Prudential Mutual Fund Services LLC (since 2010); Assistant Secretary (since December 2023) of the PGIM Credit Income Fund; Assistant Secretary (since September 2022) of the PGIM Private Credit Fund; Assistant Secretary (since March 2022) of the PGIM Private Real Estate Fund, Inc. | | Since March 2015 |
PGIM Quant Solutions Emerging Markets Equity Fund
| | | | |
| | | |
| Fund Officers(a) | | | | |
| | | |
Name Year of Birth Fund Position | | Principal Occupation(s) During Past Five Years | | Length of Service as Fund Officer |
| | | |
Christian J. Kelly 1975 Chief Financial Officer | | Vice President, Global Head of Fund Administration of PGIM Investments LLC (since November 2018); Chief Financial Officer (since March 2023) of PGIM Investments mutual funds, closed end funds and ETFs, Advanced Series Trust Portfolios, Prudential Series Funds and Prudential Gibraltar Fund; Chief Financial Officer (since December 2023) of the PGIM Credit Income Fund; Chief Financial Officer of PGIM Private Credit Fund (since September 2022); Chief Financial Officer of PGIM Private Real Estate Fund, Inc. (since July 2022); formerly Treasurer and Principal Financial Officer (January 2019- March 2023) of PGIM Investments mutual funds, closed end funds and ETFs, Advanced Series Trust Portfolios, Prudential Series Funds and Prudential Gibraltar Fund; formerly Treasurer and Principal Financial Officer (March 2022 – July 2022) of the PGIM Private Real Estate Fund, Inc.; formerly Director of Fund Administration of Lord Abbett & Co. LLC (2009-2018), Treasurer and Principal Accounting Officer of the Lord Abbett Family of Funds (2017-2018); Director of Accounting, Avenue Capital Group (2008-2009); Senior Manager, Investment Management Practice of Deloitte & Touche LLP (1998-2007). | | Since January 2019 |
| | | |
Russ Shupak 1973 Treasurer and Principal Accounting Officer | | Vice President (since 2017) within PGIM Investments Fund Administration; Treasurer and Principal Accounting Officer of PGIM Investments mutual funds, closed end funds and ETFs (since March 2023); Treasurer and Principal Accounting Officer (since December 2023) of the PGIM Credit Income Fund; Treasurer and Principal Accounting Officer (since July 2022) of the PGIM Private Real Estate Fund, Inc.; Assistant Treasurer (since September 2022) of the PGIM Private Credit Fund; formerly Assistant Treasurer (March 2022 – July 2022) of the PGIM Private Real Estate Fund, Inc.; Assistant Treasurer of Advanced Series Trust Portfolios, Prudential Series Funds and Prudential Gibraltar Fund (since October 2019); formerly Director (2013-2017) within PGIM Investments Fund Administration. | | Since October 2019 |
| | | |
Lana Lomuti 1967 Assistant Treasurer | | Vice President (since 2007) within PGIM Investments Fund Administration; formerly Assistant Treasurer (December 2007-February 2014) of The Greater China Fund, Inc.; formerly Director (2005-2007) within PGIM Investments Fund Administration. | | Since April 2014 |
| | | |
Deborah Conway 1969 Assistant Treasurer | | Vice President (since 2017) within PGIM Investments Fund Administration; formerly Director (2007-2017) within PGIM Investments Fund Administration. | | Since October 2019 |
Visit our website at pgim.com/investments
| | | | |
| | | |
| Fund Officers(a) | | | | |
| | | |
Name Year of Birth Fund Position | | Principal Occupation(s) During Past Five Years | | Length of Service as Fund Officer |
| | | |
Elyse M. McLaughlin 1974 Assistant Treasurer | | Vice President (since 2017) within PGIM Investments Fund Administration; Treasurer and Principal Accounting Officer of the Advanced Series Trust, the Prudential Series Fund and the Prudential Gibraltar Fund (since March 2023); Assistant Treasurer (since December 2023) of the PGIM Credit Income Fund; Treasurer and Principal Accounting Officer (since September 2022) of the PGIM Private Credit Fund; Assistant Treasurer (since March 2022) of the PGIM Private Real Estate Fund, Inc.; Assistant Treasurer of PGIM Investments mutual funds, closed end funds and ETFs (since October 2019); formerly Director (2011-2017) within PGIM Investments Fund Administration. | | Since October 2019 |
| | | |
Robert W. McCormack 1973 Assistant Treasurer | | Vice President (since 2019) within PGIM Investments Fund Administration; Assistant Treasurer (since March 2023) of PGIM Investments mutual funds, closed end funds, ETFs, Advanced Series Trust Portfolios, Prudential Series Funds and Prudential Gibraltar Fund; Assistant Treasurer (since December 2023) of the PGIM Credit Income Fund; Assistant Treasurer (since September 2022) of the PGIM Private Credit Fund; Assistant Treasurer (since March 2022) of the PGIM Private Real Estate Fund, Inc.; formerly Director (2016-2019) within PGIM Investments Fund Administration; formerly Vice President within Goldman, Sachs & Co. Investment Management Controllers (2008-2016), Assistant Treasurer of Goldman Sachs Family of Funds (2015-2016). | | Since March 2023 |
| | | |
Kelly Florio 1978 Anti-Money Laundering Compliance Officer | | Vice President, Corporate Compliance, Global Compliance Programs and Compliance Risk Management (since December 2021) of Prudential; formerly Head of Fraud Risk Management (October 2019-December 2021) at New York Life Insurance Company; formerly Head of Key Risk Area Operations (November 2018-October 2019), Director of the US Anti-Money Laundering Compliance Unit (2009-2018) and Bank Loss Prevention Associate (2006-2009) at MetLife. | | Since June 2022 |
| (a) | Excludes Mr. Parker and Mr. Benjamin, interested Board Members who also serve as President and Vice President, respectively. |
Explanatory Notes to Tables:
| ∎ | | Board Members are deemed to be “Interested,” as defined in the 1940 Act, by reason of their affiliation with PGIM Investments LLC and/or an affiliate of PGIM Investments LLC. |
| ∎ | | Unless otherwise noted, the address of all Board Members and Officers is c/o PGIM Investments LLC, 655 Broad Street, Newark, New Jersey 07102-4410. |
| ∎ | | There is no set term of office for Board Members or Officers. The Board Members have adopted a retirement policy, which calls for the retirement of Board Members on December 31 of the year in which they reach the age of 75. |
| ∎ | | “Other Directorships Held” includes all directorships of companies required to register or file reports with the SEC under the 1934 Act (that is, “public companies”) or other investment companies registered under the 1940 Act. |
PGIM Quant Solutions Emerging Markets Equity Fund
| ∎ | | “Portfolios Overseen” includes such applicable investment companies managed by PGIM Investments LLC and overseen by the Board Member. The investment companies for which PGIM Investments LLC serves as manager include the PGIM Mutual Funds, Target Funds, PGIM ETF Trust, PGIM Private Real Estate Fund, Inc., PGIM Private Credit Fund, PGIM Credit Income Fund, PGIM High Yield Bond Fund, Inc., PGIM Global High Yield Fund, Inc., PGIM Short Duration High Yield Opportunities Fund, The Prudential Series Fund, Prudential’s Gibraltar Fund, Inc. and the Advanced Series Trust. |
| ∎ | | As used in the Fund Officers table “Prudential” means The Prudential Insurance Company of America. |
Visit our website at pgim.com/investments
Approval of Advisory Agreements (unaudited)
The Fund’s Board of Trustees
The Board of Trustees (the “Board”) of PGIM Quant Solutions Emerging Markets Equity Fund (the “Fund”)1 consists of ten individuals, eight of whom are not “interested persons” of the Fund, as defined in the Investment Company Act of 1940, as amended (the “1940 Act”) (the “Independent Trustees”). The Board is responsible for the oversight of the Fund and its operations, and performs the various duties imposed on the directors of investment companies by the 1940 Act. The Independent Trustees have retained independent legal counsel to assist them in connection with their duties. The Chair of the Board is an Independent Trustee. The Board has established five standing committees: the Audit Committee, the Nominating and Governance Committee, the Compliance Committee and two Investment Committees. Each committee is chaired by, and composed of, Independent Trustees.
Annual Approval of the Fund’s Advisory Agreements
As required under the 1940 Act, the Board determines annually whether to renew the Fund’s management agreement with PGIM Investments LLC (“PGIM Investments”) and the Fund’s subadvisory agreement with PGIM Quantitative Solutions LLC (“PGIM Quantitative Solutions”). In considering the renewal of the agreements, the Board, including all of the Independent Trustees, met on May 25 and June 6-8, 2023 (the “Board Meeting”) and approved the renewal of the agreements through July 31, 2024, after concluding that the renewal of the agreements was in the best interests of the Fund and its shareholders.
In advance of the meetings, the Board requested and received materials relating to the agreements, and had the opportunity to ask questions and request further information in connection with its consideration. Among other things, the Board considered comparative fee information from PGIM Investments and PGIM Quantitative Solutions. Also, the Board considered comparisons with other mutual funds in relevant Peer Universes and Peer Groups, as is further discussed below.
In approving the agreements, the Board, including the Independent Trustees advised by independent legal counsel, considered the factors it deemed relevant, including the nature, quality and extent of services provided by PGIM Investments and the subadviser, the performance of the Fund, the profitability of PGIM Investments and its affiliates, expenses and fees, and the potential for economies of scale that may be shared with the Fund and its shareholders as the Fund’s assets grow. In their deliberations, the Trustees did not identify any single factor which alone was responsible for the Board’s decision to approve the agreements with respect to the Fund. In connection with its deliberations, the Board considered information provided by PGIM Investments throughout the year at regular Board meetings, presentations from portfolio managers and other information, as well as information furnished at or in advance of the Board Meeting.
1PGIM Quant Solutions Emerging Markets Equity Fund is a series of Prudential Investment Portfolios 2.
PGIM Quant Solutions Emerging Markets Equity Fund
Approval of Advisory Agreements (continued)
The Trustees determined that the overall arrangements between the Fund and PGIM Investments, which serves as the Fund’s investment manager pursuant to a management agreement, and between PGIM Investments and PGIM Quantitative Solutions, which serves as the Fund’s subadviser pursuant to the terms of a subadvisory agreement with PGIM Investments, are in the best interests of the Fund and its shareholders in light of the services performed, fees charged and such other matters as the Trustees considered relevant in the exercise of their business judgment.
The material factors and conclusions that formed the basis for the Trustees’ reaching their determinations to approve the continuance of the agreements are separately discussed below.
Nature, Quality and Extent of Services
The Board received and considered information regarding the nature, quality and extent of services provided to the Fund by PGIM Investments and PGIM Quantitative Solutions. The Board noted that PGIM Quantitative Solutions is affiliated with PGIM Investments. The Board considered the services provided by PGIM Investments, including but not limited to the oversight of the subadviser for the Fund, as well as the provision of fund recordkeeping, compliance and other services to the Fund, and PGIM Investments’ role as administrator for the Fund’s liquidity risk management program. With respect to PGIM Investments’ oversight of the subadviser, the Board noted that PGIM Investments’ Strategic Investment Research Group (“SIRG”), which is a business unit of PGIM Investments, is responsible for monitoring and reporting to PGIM Investments’ senior management on the performance and operations of the subadviser. The Board also considered that PGIM Investments pays the salaries of all of the officers and interested Trustees of the Fund who are part of Fund management. The Board also considered the investment subadvisory services provided by PGIM Quantitative Solutions, including investment research and security selection, as well as adherence to the Fund’s investment restrictions and compliance with applicable Fund policies and procedures. The Board considered PGIM Investments’ evaluation of the subadviser, as well as PGIM Investments’ recommendation, based on its review of the subadviser, to renew the subadvisory agreement.
The Board considered the qualifications, backgrounds and responsibilities of PGIM Investments’ senior management responsible for the oversight of the Fund and PGIM Quantitative Solutions, and also considered the qualifications, backgrounds and responsibilities of the PGIM Quantitative Solutions portfolio managers who are responsible for the day-to-day management of the Fund’s portfolio. The Board was provided with information pertaining to PGIM Investments’ and PGIM Quantitative Solutions’ organizational structure, senior management, investment operations, and other relevant information pertaining to PGIM Investments and PGIM Quantitative Solutions. The Board also noted that it received favorable compliance reports from the Fund’s Chief Compliance Officer (“CCO”) as to PGIM Investments and PGIM Quantitative Solutions.
Visit our website at pgim.com/investments
The Board concluded that it was satisfied with the nature, extent and quality of the investment management services provided by PGIM Investments and the subadvisory services provided to the Fund by PGIM Quantitative Solutions, and that there was a reasonable basis on which to conclude that the Fund benefits from the services provided by PGIM Investments and PGIM Quantitative Solutions under the management and subadvisory agreements.
Costs of Services and Profits Realized by PGIM Investments
The Board was provided with information on the profitability of PGIM Investments and its affiliates in serving as the Fund’s investment manager. The Board discussed with PGIM Investments the methodology utilized in assembling the information regarding profitability and considered its reasonableness. The Board recognized that it is difficult to make comparisons of profitability from fund management contracts because comparative information is not generally publicly available and is affected by numerous factors, including the structure of the particular adviser, the types of funds it manages, its business mix, numerous assumptions regarding allocations and the adviser’s capital structure and cost of capital. However, the Board considered that the cost of services provided by PGIM Investments to the Fund during the year ended December 31, 2022 exceeded the management fees paid by the Fund, resulting in an operating loss to PGIM Investments. Taking these factors into account, the Board concluded that the profitability of PGIM Investments and its affiliates in relation to the services rendered was not unreasonable.
Economies of Scale
The Board received and discussed information concerning economies of scale that PGIM Investments may realize as the Fund’s assets grow beyond current levels. During the course of time, the Board has considered information regarding the launch date of the Fund, the management fees of the Fund compared to those of similarly managed funds and PGIM Investments’ investment in the Fund over time. The Board noted that, while the management fee schedule for the Fund does not have breakpoints in its management fees, economies of scale can be shared with the Fund in other ways, including low management fees from inception, additional technological and personnel investments to enhance shareholder services, and maintaining existing expense structures in the face of a rising cost environment. The Board also considered PGIM Investments’ assertion that it continually evaluates the management fee schedule of the Fund and the potential to share economies of scale through breakpoints or fee waivers as asset levels increase.
The Board recognized the inherent limitations of any analysis of economies of scale, stemming largely from the Board’s understanding that most of PGIM Investments’ costs are not specific to individual funds, but rather are incurred across a variety of products and services.
PGIM Quant Solutions Emerging Markets Equity Fund
Approval of Advisory Agreements (continued)
Other Benefits to PGIM Investments and PGIM Quantitative Solutions
The Board considered potential ancillary benefits that might be received by PGIM Investments, PGIM Quantitative Solutions and their affiliates as a result of their relationship with the Fund. The Board concluded that potential benefits to be derived by PGIM Investments included transfer agency fees received by the Fund’s transfer agent (which is affiliated with PGIM Investments), and benefits to its reputation as well as other intangible benefits resulting from PGIM Investments’ association with the Fund. The Board concluded that the potential benefits to be derived by PGIM Quantitative Solutions included its ability to use soft dollar credits, as well as the potential benefits consistent with those generally resulting from an increase in assets under management, specifically, potential access to additional research resources and benefits to its reputation. The Board concluded that the benefits derived by PGIM Investments and PGIM Quantitative Solutions were consistent with the types of benefits generally derived by investment managers and subadvisers to mutual funds.
Performance of the Fund / Fees and Expenses
The Board considered certain additional factors and made related conclusions relating to the historical performance of the Fund for the for the one-year and the three-year periods ended December 31, 2022. The Board considered that the Fund commenced operations on November 29, 2016 and that longer-term performance was not yet available.
The Board also considered the Fund’s actual management fee, as well as the Fund’s net total expense ratio, for the fiscal year ended October 31, 2022. The Board considered the management fee for the Fund as compared to the management fee charged by PGIM Investments to other funds and the fee charged by other advisers to comparable mutual funds in a Peer Group. The actual management fee represents the fee rate actually paid by Fund shareholders and includes any fee waivers or reimbursements. The net total expense ratio for the Fund represents the actual expense ratio incurred by Fund shareholders.
The mutual funds included in the Peer Universe, which was used to consider performance, and the Peer Group, which was used to consider expenses and fees, were objectively determined by Broadridge, an independent provider of mutual fund data. In certain circumstances, PGIM Investments also provided supplemental Peer Universe or Peer Group information for reasons addressed with the Board. The comparisons placed the Fund in various quartiles over various periods, with the first quartile being the best 25% of the mutual funds (for performance, the best performing mutual funds and, for expenses, the lowest cost mutual funds).
The section below summarizes key factors considered by the Board and the Board’s conclusions regarding the Fund’s performance, fees and overall expenses. The table sets forth net performance comparisons (which reflect the impact on performance of fund expenses, or any subsidies, expense caps or waivers that may be applicable) with the Peer Universe, actual management fees with the Peer Group (which reflect the
Visit our website at pgim.com/investments
impact of any subsidies or fee waivers), and net total expenses with the Peer Group, each of which were key factors considered by the Board.
| | | | | | | | |
| | | | | |
| Net Performance | | 1 Year | | 3 Years | | 5 Years | | 10 Years |
| | 1st Quartile | | 2nd Quartile | | 3rd Quartile | | N/A |
| |
| Actual Management Fees: 2nd Quartile |
| |
| Net Total Expenses: 4th Quartile |
| · | | The Board noted that the Fund outperformed its benchmark index over the one- and three-year periods, and underperformed its benchmark index over the five-year period. |
| · | | The Board and PGIM Investments agreed to retain the existing contractual cap on Fund expenses that (exclusive of certain fees and expenses) caps total annual operating expenses for Class R6 shares at 1.20% through February 29, 2024. |
| · | | The Board concluded that, in light of the above, it would be in the best interests of the Fund and its shareholders to renew the agreements. |
| · | | The Board concluded that the management fees (including subadvisory fees) and total expenses were reasonable in light of the services provided. |
* * *
After full consideration of these factors, the Board concluded that the approval of the agreements was in the best interests of the Fund and its shareholders.
PGIM Quant Solutions Emerging Markets Equity Fund
| | | | |
| ∎ MAIL | | ∎ TELEPHONE | | ∎ WEBSITE |
| 655 Broad Street | | (800) 225-1852 | | pgim.com/investments |
| Newark, NJ 07102 | | | | |
PROXY VOTING
The Board of Trustees of the Fund has delegated to the Fund’s subadviser the responsibility for voting any proxies and maintaining proxy recordkeeping with respect to the Fund. A description of these proxy voting policies and procedures is available without charge, upon request, by calling (800) 225-1852 or by visiting the Securities and Exchange Commission’s website at sec.gov. Information regarding how the Fund voted proxies relating to portfolio securities during the most recent 12-month period ended June 30 is available on the Fund’s website and on the Securities and Exchange Commission’s website.
TRUSTEES
Ellen S. Alberding · Kevin J. Bannon · Scott E. Benjamin · Linda W. Bynoe · Barry H. Evans · Keith F. Hartstein · Laurie Simon Hodrick · Stuart S. Parker · Brian K. Reid · Grace C. Torres
OFFICERS
Stuart S. Parker, President · Scott E. Benjamin, Vice President · Christian J. Kelly, Chief Financial Officer · Claudia DiGiacomo, Chief Legal Officer · Andrew Donohue, Chief Compliance Officer · Russ Shupak, Treasurer and Principal Accounting Officer · Kelly Florio, Anti-Money Laundering Compliance Officer · Andrew R. French, Secretary · Melissa Gonzalez, Assistant Secretary · Kelly A. Coyne, Assistant Secretary · Patrick E. McGuinness, Assistant Secretary · Debra Rubano, Assistant Secretary · George Hoyt, Assistant Secretary · Devan Goolsby, Assistant Secretary · Lana Lomuti, Assistant Treasurer · Elyse M. McLaughlin, Assistant Treasurer · Deborah Conway, Assistant Treasurer · Robert W. McCormack, Assistant Treasurer
| | | | |
| MANAGER | | PGIM Investments LLC | | 655 Broad Street Newark, NJ 07102 |
| | |
| SUBADVISER | | PGIM Quantitative Solutions LLC | | 655 Broad Street 16th Floor Newark, NJ 07102 |
| | |
| DISTRIBUTOR | | Prudential Investment Management Services
LLC | | 655 Broad Street Newark, NJ 07102 |
| | |
| CUSTODIAN | | The Bank of New York Mellon | | 240 Greenwich Street New York, NY 10286 |
| | |
| TRANSFER AGENT | | Prudential Mutual Fund Services LLC | | PO Box 534432 Pittsburgh, PA 15253 |
| | |
INDEPENDENT REGISTERED PUBLIC
ACCOUNTING FIRM | | PricewaterhouseCoopers LLP | | 300 Madison Avenue New York, NY 10017 |
| | |
| FUND COUNSEL | | Willkie Farr & Gallagher LLP | | 787 Seventh Avenue New York, NY 10019 |
An investor should consider the investment objectives, risks, charges, and expenses of the Fund carefully before investing. The prospectus and summary prospectus contain this and other information about the Fund. An investor may obtain the prospectus and summary prospectus by visiting our website at pgim.com/investments or by calling (800) 225-1852. The prospectus and summary prospectus should be read carefully before investing.
E-DELIVERY
To receive your mutual fund documents online, go to pgim.com/investments/resource/edelivery and enroll. Instead of receiving printed documents by mail, you will receive notification via email when new materials are available. You can cancel your enrollment or change your email address at any time by visiting the website address above.
SHAREHOLDER COMMUNICATIONS WITH TRUSTEES
Shareholders can communicate directly with the Board of Trustees by writing to the Chair of the Board, PGIM Quant Solutions Emerging Markets Equity Fund, PGIM Investments, Attn: Board of Trustees, 655 Broad Street, Newark, NJ 07102. Shareholders can communicate directly with an individual Trustee by writing to that Trustee at the same address. Communications are not screened before being delivered to the addressee.
AVAILABILITY OF PORTFOLIO HOLDINGS
The Fund files its complete schedule of portfolio holdings with the Securities and Exchange Commission for the first and third quarters of each fiscal year as an exhibit to its reports on Form N-PORT. The Fund’s Form N-PORT filings are available on the Commission’s website at sec.gov.
The Fund’s Statement of Additional Information contains additional information about the Fund’s Trustees and is available without charge, upon request, by calling (800) 225-1852.
| | | | |
| | |
| Mutual Funds: | | | | |
| | | |
ARE NOT INSURED BY THE FDIC OR ANY FEDERAL GOVERNMENT AGENCY | | MAY LOSE VALUE | | ARE NOT A DEPOSIT OF OR GUARANTEED BY ANY BANK OR ANY BANK AFFILIATE |
PGIM QUANT SOLUTIONS EMERGING MARKETS EQUITY FUND
| | |
| |
| SHARE CLASS | | R6 |
| |
NASDAQ | | PQEMX |
| |
CUSIP | | 74440E706 |
MF244E

PGIM QUANT SOLUTIONS INTERNATIONAL
DEVELOPED MARKETS INDEX FUND
ANNUAL REPORT
OCTOBER 31, 2023

To enroll in e-delivery, go to pgim.com/investments/resource/edelivery
Table of Contents
This report is not authorized for distribution to prospective investors unless preceded or accompanied by a current prospectus.
The views expressed in this report and information about the Fund’s portfolio holdings are for the period covered by this report and are subject to change thereafter.
Mutual funds are distributed by Prudential Investment Management Services LLC, a Prudential Financial company and member SIPC. PGIM Quantitative Solutions LLC, a wholly owned subsidiary of PGIM, Inc. (PGIM), is a registered investment adviser. © 2023 Prudential Financial, Inc. and its related entities. PGIM and the PGIM logo are service marks of Prudential Financial, Inc. and its related entities, registered in many jurisdictions worldwide.
2 Visit our website at pgim.com/investments
Letter from the President
| | |
 | | Dear Shareholder: We hope you find the annual report for the PGIM Quant Solutions International Developed Markets Index Fund
informative and useful. The report covers performance for the 12-month period that ended October 31, 2023. Although central banks raised interest rates aggressively to tame surging inflation during the period, the global
economy and financial markets demonstrated resilience. Employers continued hiring, consumers continued
spending, home prices rose, and recession fears receded. |
Early in the period, stocks began a rally that eventually ended a bear market and continued to rise globally for much of 2023 as inflation cooled and the Federal Reserve (the Fed) slowed the pace of its rate hikes. However, stocks declined late in the period when the Fed signaled that rates may remain elevated longer than investors had expected. For the entire period, large-cap US stocks and equities in international markets posted gains, while small-cap US stocks declined.
Bond markets benefited during the period as the Fed moderated its rate-hiking cycle, and the higher level of interest rates offered investors an additional cushion from fixed income volatility. US and global investment-grade bonds, along with US high yield corporate bonds and emerging market debt, all posted gains.
Regarding your investments with PGIM, we believe it is important to maintain a diversified portfolio of funds consistent with your tolerance for risk, time horizon, and financial goals. Your financial advisor can help you create a diversified investment plan that may include funds covering all the basic asset classes and that reflects your personal investor profile and risk tolerance. However, diversification and asset allocation strategies do not assure a profit or protect against loss in declining markets.
At PGIM Investments, we provide access to active investment strategies across the global markets in the pursuit of consistent outperformance for investors. PGIM is the world’s 14th-largest investment manager with more than $1.3 trillion in assets under management. Our scale and investment expertise allow us to deliver a diversified suite of actively managed solutions across a broad spectrum of asset classes and investment styles.
Thank you for choosing our family of funds.
Sincerely,

Stuart S. Parker, President
PGIM Quant Solutions International Developed Markets Index Fund
December 15, 2023
PGIM Quant Solutions International Developed Markets Index Fund 3
Your Fund’s Performance (unaudited)
Performance data quoted represent past performance. Past performance does not guarantee future results. The investment return and principal value of an investment will fluctuate so that an investor’s shares, when redeemed, may be worth more or less than their original cost. Current performance may be lower or higher than the past performance data quoted. An investor may obtain performance data as of the most recent month-end by visiting our website at pgim.com/investments or by calling (800) 225-1852.
| | | | | | |
| |
| | | Average Annual Total Returns as of 10/31/23 |
| | | |
| | | One Year (%) | | Five Years (%) | | Since Inception (%) |
| | | |
Fund | | 14.87 | | 3.89 | | 5.07 (11/17/2016) |
| | | |
FTSE Developed Markets Ex-North America Net Index | | | | | | |
| | | |
| | | 14.09 | | 3.97 | | 5.27 |
The returns in the tables do not reflect the deduction of taxes that a shareholder would pay on Fund distributions or following the redemption of Fund shares. Since Inception returns are provided for less than 10 fiscal years of returns. Since Inception returns for the Index are measured from the closest month-end to the Fund’s inception date.
Growth of a $10,000 Investment (unaudited)
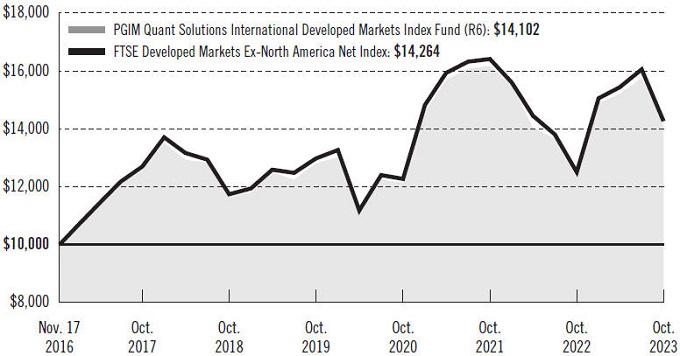
The graph compares a $10,000 investment in the Fund with a similar investment in the FTSE Developed Markets Ex-North America Net Index by portraying the initial account values at the Fund’s commencement of operations (November 17, 2016) and the account values at the end of the current fiscal year (October 31, 2023) as measured on a quarterly basis. For purposes of the graph, and unless otherwise indicated, it has been assumed that (a) all recurring fees (including management fees) were deducted and (b) all dividends and distributions were reinvested. Without waiver of fees and/or expense reimbursements, if any, the returns would have been lower.
4 Visit our website at pgim.com/investments
Past performance does not predict future performance. Total returns and the ending account values in the graphs include changes in share price and reinvestment of dividends and capital gains distributions in a hypothetical investment for the periods shown. The Fund’s total returns do not reflect the deduction of income taxes on an individual’s investment. Taxes may reduce your actual investment returns on income or gains paid by the Fund or any gains you may realize if you sell your shares.
Benchmark Definition
FTSE Developed Markets Ex-North America Net Index—The FTSE Developed Markets Ex-North America Net Index is part of a range of indexes designed to help investors benchmark their international investments. The index comprises large- and mid-cap stocks, providing coverage of developed markets, excluding the United States and Canada. The index is derived from the FTSE Global Equity Index Series (GEIS), which covers 98% of the world’s investable market capitalization.
Investors cannot invest directly in an index. The returns for the Index would be lower if they included the effects of sales charges, operating expenses of a mutual fund, or taxes that may be paid by an investor.
Presentation of Fund Holdings as of 10/31/23
| | | | | | |
| | | |
| Ten Largest Holdings | | Asset Class/Line of Business | | Country | | % of Net Assets |
| | | |
iShares MSCI EAFE ETF | | Unaffiliated Exchange-Traded Funds | | United States | | 3.5% |
| | | |
Novo Nordisk A/S (Class B Stock) | | Pharmaceuticals | | Denmark | | 1.8% |
| | | |
Nestle SA | | Food Products | | United States | | 1.7% |
| | | |
ASML Holding NV | | Semiconductors & Semiconductor Equipment | | Netherlands | | 1.4% |
| | | |
Samsung Electronics Co. Ltd. | | Technology Hardware, Storage & Peripherals | | South Korea | | 1.4% |
| | | |
Shell plc | | Oil, Gas & Consumable Fuels | | Netherlands | | 1.3% |
| | | |
Toyota Motor Corp. | | Automobiles | | Japan | | 1.2% |
| | | |
Novartis AG | | Pharmaceuticals | | Switzerland | | 1.1% |
| | | |
AstraZeneca plc | | Pharmaceuticals | | United Kingdom | | 1.1% |
| | | |
Roche Holding AG | | Pharmaceuticals | | United States | | 1.0% |
Holdings reflect only long-term investments and are subject to change.
PGIM Quant Solutions International Developed Markets Index Fund 5
Strategy and Performance Overview*
(unaudited)
How did the Fund perform?
The PGIM Quantitative Solutions International Developed Markets Index Fund’s Class R6 shares returned 14.87% in the 12-month reporting period that ended October 31, 2023, outperforming the 14.09% return of the FTSE Developed Markets Ex-North America Net Index (the Index).
What were the market conditions?
| · | | Global economic activity remained resilient through the reporting period despite considerable monetary tightening by global central banks over the past 18 months, which prompted speculation early in 2023 that a global recession was on the horizon. |
| · | | Central banks made progress in their fight against inflation, as the Eurozone Core Commercial Price Index moderated from its recent highs. |
| · | | Europe’s post-pandemic recovery quickly faded, with GDP growth at the end of the period barely positive in the Eurozone, UK, and Switzerland. |
| · | | While other central banks raised rates, the Bank of Japan kept interest rates low, and began to allow more flexibility in its yield curve control program. |
| · | | Equity markets had a strong year, despite delivering mixed performance in the third quarter of 2023. |
How was the Fund managed?
| · | | The Fund closely tracked the Index’s performance over the reporting period. |
| · | | The Fund holds almost all stocks included in the Index in approximately the same proportions. |
| · | | The Fund employs a “passively managed”—or index—investment approach. |
Did the Fund use derivatives?
The Fund held several international stock index futures during the reporting period, including Topix Index Futures, DJ Euro Stoxx Futures, FTSE 100 Futures, CAC40 Futures, S&P/ASX 200 Futures, and MSCI-EAFE Mini Futures. These derivatives were used to maintain exposure to equities and provide portfolio liquidity. Futures had minimal impact on performance over the period.
Current outlook
| · | | The risks of a European recession are significant. Available hard data for the third quarter of 2023 are mixed, while soft data appear bleak. |
| · | | In contrast to Europe and China, Japan is a relative bright spot, helped by a more supportive central bank. The Japanese economy remains underpinned by solid consumption and business spending. |
| · | | Although their hiking cycles appear to be ending, central banks are likely to keep monetary policy tight until they have more confidence that they can reach their inflation goals. |
6 Visit our website at pgim.com/investments
| · | | Equity markets face a difficult economic scenario, but given favorable valuation starting points, have a cushion in case of a downside scenario. |
*This strategy and performance overview, which discusses what strategies or holdings (including derivatives, if applicable) affected the Fund’s performance, is compiled based on how the Fund performed relative to the Index and is viewed for performance attribution purposes at the aggregate Fund level, which in most instances will not directly correlate to the amounts disclosed in the Statement of Operations which conform to US generally accepted accounting principles.
PGIM Quant Solutions International Developed Markets Index Fund 7
Fees and Expenses (unaudited)
As a shareholder of the Fund, you incur two types of costs: (1) transaction costs, and (2) ongoing costs, including management fees, and other Fund expenses, as applicable. This example is intended to help you understand your ongoing costs (in dollars) of investing in the Fund and to compare these costs with the ongoing costs of investing in other mutual funds.
The example is based on an investment of $1,000 held through the six-month period ended October 31, 2023. The example is for illustrative purposes only; you should consult the Prospectus for information on initial and subsequent minimum investment requirements.
Actual Expenses
The first line for each share class in the table on the following page provides information about actual account values and actual expenses. You may use the information on this line, together with the amount you invested, to estimate the expenses that you paid over the period. Simply divide your account value by $1,000 (for example, an $8,600 account value ÷ $1,000 = 8.6), then multiply the result by the number on the first line under the heading “Expenses Paid During the Six-Month Period” to estimate the expenses you paid on your account during this period.
Hypothetical Example for Comparison Purposes
The second line in the table on the following page provides information about hypothetical account values and hypothetical expenses based on the Fund’s actual expense ratio and an assumed rate of return of 5% per year before expenses, which is not the Fund’s actual return. The hypothetical account values and expenses may not be used to estimate the actual ending account balance or expenses you paid for the period. You may use this information to compare the ongoing costs of investing in the Fund and other funds. To do so, compare this 5% hypothetical example with the 5% hypothetical examples that appear in the shareholder reports of the other funds.
Please note that the expenses shown in the table are meant to highlight your ongoing costs only and do not reflect any transactional costs such as sales charges (loads). Therefore, the second line in the table is useful in comparing ongoing costs only and will not help you determine the relative total costs of owning different funds. In addition, if these transactional costs were included, your costs would have been higher.
8 Visit our website at pgim.com/investments
| | | | | | | | | | |
| | | | | |
PGIM Quant Solutions International Developed Markets Index Fund | | Beginning Account Value May 1, 2023 | | Ending Account Value October 31, 2023 | | Annualized Expense Ratio Based on the Six-Month Period | | Expenses Paid During the Six-Month Period* |
| | | | |
Class R6 Actual Hypothetical | | $1,000.00 | | $ 927.40 | | 0.29% | | $1.39 |
| | $1,000.00 | | $1,023.76 | | 0.29% | | $1.46 |
*Fund expenses (net of fee waivers or subsidies, if any) are equal to the annualized expense ratio (provided in the table), multiplied by the average account value over the period, multiplied by the 184 days in the six-month period ended October 31, 2023, and divided by the 365 days in the Fund’s fiscal year ended October 31, 2023 (to reflect the six-month period). Expenses presented in the table include the expenses of any underlying portfolios in which the Fund may invest.
PGIM Quant Solutions International Developed Markets Index Fund 9
Schedule of Investments
as of October 31, 2023
| | | | | | | | |
| | |
| Description | | Shares | | | Value | |
| | |
LONG-TERM INVESTMENTS 96.8% | | | | | | | | |
| | |
COMMON STOCKS 92.7% | | | | | | | | |
| | |
Australia 7.1% | | | | | | | | |
| | |
Adbri Ltd.* | | | 1,446 | | | $ | 1,817 | |
AGL Energy Ltd. | | | 2,235 | | | | 15,278 | |
Allkem Ltd.* | | | 2,199 | | | | 13,437 | |
ALS Ltd. | | | 1,851 | | | | 12,668 | |
Altium Ltd. | | | 419 | | | | 10,569 | |
Alumina Ltd.* | | | 9,799 | | | | 4,869 | |
AMP Ltd. | | | 10,235 | | | | 6,819 | |
Ampol Ltd. | | | 902 | | | | 18,291 | |
Ansell Ltd. | | | 481 | | | | 6,499 | |
ANZ Group Holdings Ltd. | | | 10,953 | | | | 172,718 | |
APA Group, UTS | | | 4,406 | | | | 23,096 | |
Aristocrat Leisure Ltd. | | | 2,420 | | | | 59,484 | |
ASX Ltd. | | | 722 | | | | 25,795 | |
Atlas Arteria Ltd., UTS | | | 5,289 | | | | 17,880 | |
Aurizon Holdings Ltd. | | | 6,438 | | | | 14,023 | |
Bank of Queensland Ltd. | | | 2,425 | | | | 7,880 | |
Beach Energy Ltd. | | | 7,103 | | | | 6,996 | |
Bendigo & Adelaide Bank Ltd. | | | 2,137 | | | | 11,840 | |
BHP Group Ltd. | | | 18,404 | | | | 520,971 | |
BlueScope Steel Ltd. | | | 1,679 | | | | 20,127 | |
Boral Ltd.* | | | 1,263 | | | | 3,621 | |
Brambles Ltd. | | | 5,069 | | | | 42,305 | |
carsales.com Ltd. | | | 1,345 | | | | 23,709 | |
Challenger Ltd. | | | 1,632 | | | | 6,085 | |
Charter Hall Group, REIT | | | 1,820 | | | | 10,083 | |
Cleanaway Waste Management Ltd. | | | 8,163 | | | | 11,629 | |
Cochlear Ltd. | | | 239 | | | | 36,633 | |
Coles Group Ltd. | | | 4,742 | | | | 46,024 | |
Commonwealth Bank of Australia | | | 6,178 | | | | 380,045 | |
Computershare Ltd. | | | 1,959 | | | | 30,917 | |
CSR Ltd. | | | 1,791 | | | | 6,400 | |
Deterra Royalties Ltd. | | | 1,608 | | | | 4,805 | |
Dexus, REIT | | | 3,924 | | | | 16,207 | |
Domain Holdings Australia Ltd. | | | 938 | | | | 2,033 | |
Domino’s Pizza Enterprises Ltd. | | | 229 | | | | 7,422 | |
Downer EDI Ltd. | | | 2,521 | | | | 6,063 | |
EBOS Group Ltd. | | | 599 | | | | 12,228 | |
Endeavour Group Ltd. | | | 4,843 | | | | 15,214 | |
Evolution Mining Ltd. | | | 6,539 | | | | 14,625 | |
Flight Centre Travel Group Ltd. | | | 536 | | | | 6,372 | |
Flutter Entertainment PLC* | | | 643 | | | | 101,122 | |
Fortescue Metals Group Ltd. | | | 5,798 | | | | 82,481 | |
Glencore PLC | | | 45,048 | | | | 238,612 | |
See Notes to Financial Statements.
PGIM Quant Solutions International Developed Markets Index Fund 11
Schedule of Investments (continued)
as of October 31, 2023
| | | | | | | | |
| | |
| Description | | Shares | | | Value | |
| | |
COMMON STOCKS (Continued) | | | | | | | | |
| | |
Australia (cont’d.) | | | | | | | | |
| | |
Goodman Group, REIT | | | 6,729 | | | $ | 89,038 | |
GPT Group (The), REIT | | | 7,266 | | | | 16,769 | |
Harvey Norman Holdings Ltd. | | | 2,351 | | | | 5,495 | |
IDP Education Ltd. | | | 1,032 | | | | 14,258 | |
IGO Ltd. | | | 2,319 | | | | 14,042 | |
Iluka Resources Ltd. | | | 1,587 | | | | 7,328 | |
Incitec Pivot Ltd. | | | 7,407 | | | | 12,930 | |
Insignia Financial Ltd. | | | 2,463 | | | | 3,239 | |
Insurance Australia Group Ltd. | | | 8,932 | | | | 32,223 | |
JB Hi-Fi Ltd. | | | 416 | | | | 11,958 | |
Lendlease Corp. Ltd., UTS | | | 2,595 | | | | 10,277 | |
Liontown Resources Ltd.* | | | 6,301 | | | | 6,477 | |
Lottery Corp. Ltd. (The) | | | 8,107 | | | | 23,401 | |
Lynas Rare Earths Ltd.* | | | 3,395 | | | | 15,272 | |
Macquarie Group Ltd. | | | 1,325 | | | | 136,197 | |
Magellan Financial Group Ltd. | | | 531 | | | | 2,204 | |
Medibank Private Ltd. | | | 10,161 | | | | 22,174 | |
Metcash Ltd. | | | 3,744 | | | | 8,768 | |
Mineral Resources Ltd. | | | 628 | | | | 23,146 | |
Mirvac Group, REIT | | | 14,379 | | | | 16,683 | |
National Australia Bank Ltd. | | | 11,446 | | | | 205,047 | |
New Hope Corp. Ltd. | | | 1,973 | | | | 7,261 | |
NEXTDC Ltd.* | | | 1,898 | | | | 14,252 | |
Northern Star Resources Ltd. | | | 4,145 | | | | 30,353 | |
Nufarm Ltd. | | | 1,263 | | | | 3,490 | |
Orica Ltd. | | | 1,682 | | | | 15,716 | |
Origin Energy Ltd. | | | 6,265 | | | | 36,342 | |
Orora Ltd. | | | 4,915 | | | | 7,702 | |
Perpetual Ltd. | | | 418 | | | | 5,110 | |
Pilbara Minerals Ltd. | | | 10,414 | | | | 24,462 | |
Platinum Asset Management Ltd. | | | 2,149 | | | | 1,537 | |
Pro Medicus Ltd. | | | 163 | | | | 7,764 | |
Qantas Airways Ltd.* | | | 3,132 | | | | 9,812 | |
QBE Insurance Group Ltd. | | | 5,435 | | | | 53,894 | |
Qube Holdings Ltd. | | | 6,019 | | | | 10,207 | |
Ramsay Health Care Ltd. | | | 652 | | | | 20,189 | |
REA Group Ltd. | | | 190 | | | | 17,443 | |
Reece Ltd. | | | 822 | | | | 9,165 | |
Region Re Ltd., REIT | | | 4,499 | | | | 5,626 | |
Rio Tinto Ltd. | | | 1,354 | | | | 101,141 | |
Rio Tinto PLC | | | 3,971 | | | | 253,352 | |
Santos Ltd. | | | 10,890 | | | | 53,137 | |
Scentre Group, REIT | | | 19,132 | | | | 29,639 | |
SEEK Ltd. | | | 1,318 | | | | 17,388 | |
See Notes to Financial Statements.
12
| | | | | | | | |
| | |
| Description | | Shares | | | Value | |
| | |
COMMON STOCKS (Continued) | | | | | | | | |
| | |
Australia (cont’d.) | | | | | | | | |
| | |
Seven Group Holdings Ltd. | | | 528 | | | $ | 9,331 | |
Sonic Healthcare Ltd. | | | 1,659 | | | | 30,378 | |
South32 Ltd. | | | 16,640 | | | | 35,599 | |
Star Entertainment Group Ltd. (The)* | | | 8,573 | | | | 2,896 | |
Steadfast Group Ltd. | | | 3,820 | | | | 13,136 | |
Stockland, REIT | | | 8,701 | | | | 19,638 | |
Suncorp Group Ltd. | | | 4,656 | | | | 39,630 | |
Tabcorp Holdings Ltd. | | | 8,373 | | | | 4,131 | |
Telstra Group Ltd. | | | 14,944 | | | | 36,237 | |
TPG Telecom Ltd. | | | 1,473 | | | | 4,859 | |
Transurban Group, UTS | | | 11,228 | | | | 84,530 | |
Treasury Wine Estates Ltd. | | | 2,695 | | | | 20,763 | |
Vicinity Ltd., REIT | | | 13,742 | | | | 14,884 | |
Washington H Soul Pattinson & Co. Ltd. | | | 981 | | | | 20,899 | |
Wesfarmers Ltd. | | | 4,128 | | | | 132,814 | |
Westpac Banking Corp. | | | 12,728 | | | | 167,141 | |
Whitehaven Coal Ltd. | | | 2,751 | | | | 12,958 | |
WiseTech Global Ltd. | | | 600 | | | | 22,339 | |
Woodside Energy Group Ltd. | | | 6,893 | | | | 150,128 | |
Woolworths Group Ltd. | | | 4,444 | | | | 99,478 | |
Worley Ltd. | | | 1,413 | | | | 14,771 | |
Yancoal Australia Ltd. | | | 623 | | | | 1,913 | |
| | | | | | | | |
| | |
| | | | | | | 4,426,053 | |
| | |
Austria 0.2% | | | | | | | | |
| | |
ANDRITZ AG | | | 267 | | | | 12,290 | |
Erste Group Bank AG | | | 1,122 | | | | 40,178 | |
Eurotelesites AG* | | | 139 | | | | 468 | |
Mondi PLC | | | 1,807 | | | | 29,229 | |
OMV AG | | | 529 | | | | 23,201 | |
Raiffeisen Bank International AG* | | | 482 | | | | 6,983 | |
Telekom Austria AG* | | | 558 | | | | 3,896 | |
Verbund AG | | | 251 | | | | 21,808 | |
voestalpine AG | | | 428 | | | | 10,688 | |
| | | | | | | | |
| | |
| | | | | | | 148,741 | |
| | |
Belgium 0.7% | | | | | | | | |
| | |
Ackermans & van Haaren NV | | | 83 | | | | 12,322 | |
Ageas SA/NV | | | 612 | | | | 23,509 | |
Anheuser-Busch InBev SA/NV | | | 3,155 | | | | 179,513 | |
D’ieteren Group | | | 85 | | | | 12,626 | |
Elia Group SA/NV | | | 142 | | | | 13,484 | |
Groupe Bruxelles Lambert NV | | | 358 | | | | 26,184 | |
See Notes to Financial Statements.
PGIM Quant Solutions International Developed Markets Index Fund 13
Schedule of Investments (continued)
as of October 31, 2023
| | | | | | | | |
| | |
| Description | | Shares | | | Value | |
| | |
COMMON STOCKS (Continued) | | | | | | | | |
| | |
Belgium (cont’d.) | | | | | | | | |
| | |
KBC Group NV | | | 896 | | | $ | 49,311 | |
Lotus Bakeries NV | | | 1 | | | | 7,408 | |
Sofina SA | | | 63 | | | | 11,969 | |
Solvay SA | | | 259 | | | | 27,380 | |
UCB SA | | | 445 | | | | 32,547 | |
Umicore SA | | | 765 | | | | 18,202 | |
Warehouses De Pauw CVA, REIT | | | 566 | | | | 14,004 | |
| | | | | | | | |
| | |
| | | | | | | ��428,459 | |
| | |
Brazil 0.0% | | | | | | | | |
| | |
Yara International ASA | | | 607 | | | | 19,862 | |
| | |
Burkina Faso 0.0% | | | | | | | | |
| | |
Endeavour Mining PLC | | | 684 | | | | 14,112 | |
| | |
Cambodia 0.0% | | | | | | | | |
| | |
NagaCorp Ltd.* | | | 4,705 | | | | 2,021 | |
| | |
Chile 0.0% | | | | | | | | |
| | |
Antofagasta PLC | | | 1,261 | | | | 20,619 | |
| | |
China 0.5% | | | | | | | | |
| | |
AAC Technologies Holdings, Inc. | | | 2,200 | | | | 3,960 | |
BOC Aviation Ltd., 144A | | | 800 | | | | 4,920 | |
BOC Hong Kong Holdings Ltd. | | | 12,900 | | | | 34,115 | |
Budweiser Brewing Co. APAC Ltd., 144A | | | 6,500 | | | | 12,352 | |
China Travel International Investment Hong Kong Ltd. | | | 8,000 | | | | 1,423 | |
Chow Tai Fook Jewellery Group Ltd. | | | 6,400 | | | | 9,038 | |
ESR Group Ltd., 144A | | | 10,400 | | | | 13,363 | |
HUTCHMED China Ltd.* | | | 1,500 | | | | 6,032 | |
Kerry Logistics Network Ltd. | | | 1,100 | | | | 933 | |
Lenovo Group Ltd. | | | 27,000 | | | | 31,421 | |
MMG Ltd.* | | | 10,000 | | | | 2,949 | |
Nexteer Automotive Group Ltd. | | | 2,000 | | | | 964 | |
Prosus NV* | | | 5,627 | | | | 157,746 | |
Shangri-La Asia Ltd.* | | | 3,600 | | | | 2,297 | |
SITC International Holdings Co. Ltd. | | | 5,000 | | | | 7,702 | |
Wharf Holdings Ltd. (The) | | | 3,000 | | | | 7,612 | |
Wilmar International Ltd. | | | 7,600 | | | | 19,758 | |
Xinyi Glass Holdings Ltd. | | | 7,000 | | | | 8,043 | |
| | | | | | | | |
| | |
| | | | | | | 324,628 | |
See Notes to Financial Statements.
14
| | | | | | | | |
| | |
| Description | | Shares | | | Value | |
| | |
COMMON STOCKS (Continued) | | | | | | | | |
| | |
Denmark 2.8% | | | | | | | | |
| | |
AP Moller - Maersk A/S (Class A Stock) | | | 10 | | | $ | 16,328 | |
AP Moller - Maersk A/S (Class B Stock) | | | 18 | | | | 29,992 | |
Carlsberg A/S (Class B Stock) | | | 349 | | | | 41,592 | |
Chr Hansen Holding A/S | | | 383 | | | | 26,136 | |
Coloplast A/S (Class B Stock) | | | 454 | | | | 47,345 | |
Danske Bank A/S | | | 2,416 | | | | 56,676 | |
Demant A/S* | | | 352 | | | | 13,432 | |
DSV A/S | | | 646 | | | | 96,539 | |
Genmab A/S* | | | 238 | | | | 67,279 | |
H. Lundbeck A/S | | | 988 | | | | 5,164 | |
H. Lundbeck A/S (Class A Stock) | | | 247 | | | | 1,117 | |
Novo Nordisk A/S (Class B Stock) | | | 11,459 | | | | 1,105,521 | |
Novozymes A/S (Class B Stock) | | | 732 | | | | 32,898 | |
Orsted A/S, 144A | | | 687 | | | | 33,195 | |
Pandora A/S | | | 299 | | | | 33,913 | |
ROCKWOOL A/S (Class B Stock) | | | 32 | | | | 7,121 | |
Royal Unibrew A/S | | | 184 | | | | 13,310 | |
Tryg A/S | | | 1,284 | | | | 25,074 | |
Vestas Wind Systems A/S* | | | 3,668 | | | | 79,503 | |
| | | | | | | | |
| | |
| | | | | | | 1,732,135 | |
| | |
Finland 1.0% | | | | | | | | |
| | |
Elisa OYJ | | | 526 | | | | 22,316 | |
Fortum OYJ | | | 1,609 | | | | 19,104 | |
Kesko OYJ (Class B Stock) | | | 1,024 | | | | 17,317 | |
Kone OYJ (Class B Stock) | | | 1,189 | | | | 51,488 | |
Mandatum OYJ* | | | 1,725 | | | | 6,666 | |
Metso OYJ | | | 2,297 | | | | 20,238 | |
Neste OYJ | | | 1,534 | | | | 51,555 | |
Nokia OYJ | | | 19,179 | | | | 63,879 | |
Nordea Bank Abp | | | 12,455 | | | | 131,231 | |
Orion OYJ (Class B Stock) | | | 393 | | | | 15,636 | |
Sampo OYJ (Class A Stock) | | | 1,725 | | | | 67,842 | |
Stora Enso OYJ (Class R Stock) | | | 2,142 | | | | 25,743 | |
UPM-Kymmene OYJ | | | 1,943 | | | | 65,432 | |
Valmet OYJ | | | 600 | | | | 13,465 | |
Wartsila OYJ Abp | | | 1,832 | | | | 21,862 | |
| | | | | | | | |
| | |
| | | | | | | 593,774 | |
| | |
France 8.6% | | | | | | | | |
| | |
Accor SA | | | 690 | | | | 22,013 | |
Adevinta ASA* | | | 1,063 | | | | 9,343 | |
Aeroports de Paris SA | | | 121 | | | | 13,588 | |
See Notes to Financial Statements.
PGIM Quant Solutions International Developed Markets Index Fund 15
Schedule of Investments (continued)
as of October 31, 2023
| | | | | | | | |
| | |
| Description | | Shares | | | Value | |
| | |
COMMON STOCKS (Continued) | | | | | | | | |
| | |
France (cont’d.) | | | | | | | | |
| | |
Air Liquide SA | | | 1,880 | | | $ | 322,142 | |
Airbus SE | | | 2,135 | | | | 286,253 | |
ALD SA, 144A | | | 715 | | | | 4,809 | |
Alstom SA | | | 1,043 | | | | 14,125 | |
Amundi SA, 144A | | | 215 | | | | 11,231 | |
Arkema SA | | | 213 | | | | 19,959 | |
AXA SA | | | 6,480 | | | | 192,005 | |
BioMerieux | | | 162 | | | | 15,554 | |
BNP Paribas SA | | | 3,959 | | | | 227,658 | |
Bollore SE | | | 3,184 | | | | 17,382 | |
Bouygues SA | | | 759 | | | | 26,701 | |
Bureau Veritas SA | | | 1,063 | | | | 24,213 | |
Capgemini SE | | | 587 | | | | 103,740 | |
Carrefour SA | | | 2,153 | | | | 37,745 | |
Cie de L’Odet SE | | | 1 | | | | 1,393 | |
Cie de Saint-Gobain SA | | | 1,701 | | | | 92,592 | |
Cie Generale des Etablissements Michelin SCA | | | 2,553 | | | | 75,846 | |
Covivio SA, REIT | | | 189 | | | | 8,099 | |
Credit Agricole SA | | | 4,007 | | | | 48,384 | |
Danone SA | | | 2,283 | | | | 135,817 | |
Dassault Aviation SA | | | 88 | | | | 17,493 | |
Dassault Systemes SE | | | 2,439 | | | | 100,471 | |
Edenred SE | | | 908 | | | | 48,334 | |
Eiffage SA | | | 265 | | | | 24,049 | |
Engie SA | | | 6,054 | | | | 96,288 | |
EssilorLuxottica SA | | | 1,115 | | | | 201,908 | |
Eurazeo SE | | | 181 | | | | 10,204 | |
Gecina SA, REIT | | | 194 | | | | 19,049 | |
Getlink SE | | | 1,325 | | | | 21,397 | |
Hermes International SCA | | | 125 | | | | 233,228 | |
Ipsen SA | | | 125 | | | | 14,774 | |
JCDecaux SE* | | | 282 | | | | 4,412 | |
Kering SA | | | 261 | | | | 106,149 | |
Klepierre SA, REIT | | | 763 | | | | 18,528 | |
La Francaise des Jeux SAEM, 144A | | | 370 | | | | 11,935 | |
Legrand SA | | | 940 | | | | 81,316 | |
L’Oreal SA | | | 846 | | | | 355,600 | |
LVMH Moet Hennessy Louis Vuitton SE | | | 906 | | | | 648,633 | |
Neoen SA, 144A | | | 230 | | | | 6,074 | |
Orange SA | | | 6,986 | | | | 82,170 | |
Pernod Ricard SA | | | 747 | | | | 132,650 | |
Publicis Groupe SA | | | 834 | | | | 63,503 | |
Remy Cointreau SA | | | 81 | | | | 9,203 | |
Renault SA | | | 716 | | | | 25,120 | |
See Notes to Financial Statements.
16
| | | | | | | | |
| | |
| Description | | Shares | | | Value | |
| | |
COMMON STOCKS (Continued) | | | | | | | | |
| | |
France (cont’d.) | | | | | | | | |
| | |
Rexel SA | | | 868 | | | $ | 17,727 | |
Safran SA | | | 1,252 | | | | 195,587 | |
Sartorius Stedim Biotech | | | 89 | | | | 16,663 | |
SCOR SE | | | 565 | | | | 16,868 | |
SEB SA | | | 83 | | | | 8,208 | |
Societe Generale SA | | | 2,588 | | | | 58,157 | |
Sodexo SA | | | 325 | | | | 34,394 | |
SOITEC* | | | 92 | | | | 13,732 | |
Teleperformance SE | | | 213 | | | | 24,504 | |
Thales SA | | | 365 | | | | 53,866 | |
TotalEnergies SE | | | 8,253 | | | | 551,775 | |
Ubisoft Entertainment SA* | | | 357 | | | | 10,179 | |
Unibail-Rodamco-Westfield, REIT* | | | 380 | | | | 18,829 | |
Valeo SE | | | 773 | | | | 10,214 | |
Veolia Environnement SA | | | 2,318 | | | | 63,514 | |
Vinci SA | | | 1,786 | | | | 197,486 | |
Vivendi SE | | | 2,462 | | | | 22,078 | |
Wendel SE | | | 101 | | | | 7,566 | |
Worldline SA, 144A* | | | 900 | | | | 11,444 | |
| | | | | | | | |
| | |
| | | | | | | 5,375,871 | |
| | |
Germany 6.6% | | | | | | | | |
| | |
adidas AG | | | 602 | | | | 107,040 | |
Allianz SE | | | 1,455 | | | | 340,823 | |
BASF SE | | | 3,242 | | | | 149,804 | |
Bayer AG | | | 3,584 | | | | 154,859 | |
Bayerische Motoren Werke AG | | | 1,138 | | | | 105,839 | |
Bechtle AG | | | 306 | | | | 13,676 | |
Beiersdorf AG | | | 363 | | | | 47,742 | |
Brenntag SE | | | 572 | | | | 42,535 | |
Carl Zeiss Meditec AG | | | 138 | | | | 11,983 | |
Commerzbank AG | | | 3,849 | | | | 41,514 | |
Continental AG | | | 403 | | | | 26,311 | |
Covestro AG, 144A* | | | 695 | | | | 35,210 | |
CTS Eventim AG & Co. KGaA | | | 222 | | | | 13,441 | |
Daimler Truck Holding AG | | | 1,957 | | | | 61,489 | |
Deutsche Bank AG | | | 7,348 | | | | 80,861 | |
Deutsche Boerse AG | | | 670 | | | | 110,280 | |
Deutsche Lufthansa AG* | | | 2,251 | | | | 15,784 | |
Deutsche Post AG | | | 3,435 | | | | 134,114 | |
Deutsche Telekom AG | | | 12,339 | | | | 267,801 | |
Deutsche Wohnen SE | | | 202 | | | | 4,347 | |
DWS Group GmbH & Co. KGaA, 144A | | | 122 | | | | 3,581 | |
E.ON SE | | | 8,076 | | | | 96,089 | |
See Notes to Financial Statements.
PGIM Quant Solutions International Developed Markets Index Fund 17
Schedule of Investments (continued)
as of October 31, 2023
| | | | | | | | |
| | |
| Description | | Shares | | | Value | |
| | |
COMMON STOCKS (Continued) | | | | | | | | |
| | |
Germany (cont’d.) | | | | | | | | |
| | |
Evonik Industries AG | | | 720 | | | $ | 13,251 | |
Fielmann Group AG | | | 95 | | | | 4,092 | |
Fraport AG Frankfurt Airport Services Worldwide* | | | 133 | | | | 6,610 | |
Fresenius Medical Care AG & Co. KGaA | | | 741 | | | | 24,621 | |
Fresenius SE & Co. KGaA | | | 1,504 | | | | 38,688 | |
Fuchs Petrolub SE | | | 125 | | | | 4,198 | |
GEA Group AG | | | 587 | | | | 20,076 | |
Hannover Rueck SE | | | 221 | | | | 48,800 | |
Heidelberg Materials AG | | | 517 | | | | 37,531 | |
Hella GmbH & Co. KGaA | | | 91 | | | | 6,930 | |
HelloFresh SE* | | | 609 | | | | 13,321 | |
Henkel AG & Co. KGaA | | | 373 | | | | 23,574 | |
HOCHTIEF AG | | | 71 | | | | 7,355 | |
Infineon Technologies AG | | | 4,750 | | | | 138,749 | |
KION Group AG | | | 268 | | | | 8,223 | |
Knorr-Bremse AG | | | 249 | | | | 13,908 | |
LEG Immobilien SE* | | | 279 | | | | 17,441 | |
Mercedes-Benz Group AG | | | 3,133 | | | | 184,328 | |
Merck KGaA | | | 471 | | | | 71,139 | |
MTU Aero Engines AG | | | 197 | | | | 37,027 | |
Muenchener Rueckversicherungs-Gesellschaft AG in Muenchen | | | 502 | | | | 201,457 | |
Nemetschek SE | | | 202 | | | | 15,094 | |
Puma SE | | | 363 | | | | 20,570 | |
Rational AG | | | 17 | | | | 9,695 | |
Rheinmetall AG | | | 160 | | | | 45,935 | |
RWE AG | | | 2,595 | | | | 99,299 | |
SAP SE | | | 4,011 | | | | 538,005 | |
Sartorius AG | | | 9 | | | | 1,853 | |
Scout24 SE, 144A | | | 271 | | | | 16,672 | |
Siemens AG | | | 2,725 | | | | 361,604 | |
Siemens Energy AG* | | | 1,578 | | | | 14,030 | |
Siemens Healthineers AG, 144A | | | 1,009 | | | | 49,640 | |
Sixt SE | | | 52 | | | | 4,486 | |
Symrise AG | | | 482 | | | | 49,255 | |
Talanx AG | | | 200 | | | | 12,604 | |
Telefonica Deutschland Holding AG | | | 3,343 | | | | 5,683 | |
thyssenkrupp AG | | | 1,858 | | | | 12,950 | |
Traton SE | | | 207 | | | | 4,085 | |
Volkswagen AG | | | 107 | | | | 12,369 | |
Vonovia SE | | | 2,545 | | | | 58,591 | |
Wacker Chemie AG | | | 56 | | | | 6,872 | |
Zalando SE, 144A* | | | 796 | | | | 18,619 | |
| | | | | | | | |
| | |
| | | | | | | 4,144,353 | |
See Notes to Financial Statements.
18
| | | | | | | | |
| | |
| Description | | Shares | | | Value | |
| | |
COMMON STOCKS (Continued) | | | | | | | | |
| | |
Hong Kong 1.9% | | | | | | | | |
| | |
AIA Group Ltd. | | | 42,600 | | | $ | 369,930 | |
ASMPT Ltd. | | | 1,100 | | | | 9,317 | |
Bank of East Asia Ltd. (The) | | | 3,600 | | | | 4,275 | |
Brightoil Petroleum Holdings Ltd.*^ | | | 7,000 | | | | — | |
Cathay Pacific Airways Ltd.* | | | 3,700 | | | | 3,720 | |
Champion REIT, REIT | | | 8,000 | | | | 2,527 | |
CK Asset Holdings Ltd. | | | 6,800 | | | | 33,989 | |
CK Infrastructure Holdings Ltd. | | | 2,200 | | | | 10,197 | |
CLP Holdings Ltd. | | | 5,900 | | | | 43,181 | |
Dah Sing Banking Group Ltd. | | | 2,400 | | | | 1,575 | |
Dah Sing Financial Holdings Ltd. | | | 400 | | | | 905 | |
DFI Retail Group Holdings Ltd. | | | 1,200 | | | | 2,560 | |
Guotai Junan International Holdings Ltd. | | | 7,000 | | | | 555 | |
Haitong International Securities Group Ltd.* | | | 14,300 | | | | 2,580 | |
Hang Lung Group Ltd. | | | 2,800 | | | | 3,729 | |
Hang Lung Properties Ltd. | | | 6,000 | | | | 7,887 | |
Hang Seng Bank Ltd. | | | 2,600 | | | | 29,726 | |
Henderson Land Development Co. Ltd. | | | 5,004 | | | | 13,093 | |
Hong Kong & China Gas Co. Ltd. | | | 41,356 | | | | 28,788 | |
Hong Kong Exchanges & Clearing Ltd. | | | 4,640 | | | | 162,319 | |
Hongkong Land Holdings Ltd. | | | 4,300 | | | | 13,638 | |
Huabao International Holdings Ltd. | | | 4,000 | | | | 1,346 | |
Hutchison Port Holdings Trust, UTS | | | 21,100 | | | | 3,314 | |
Hutchison Telecommunications Hong Kong Holdings Ltd. | | | 8,000 | | | | 1,075 | |
Hysan Development Co. Ltd. | | | 1,800 | | | | 3,313 | |
Jardine Matheson Holdings Ltd. | | | 687 | | | | 27,838 | |
Johnson Electric Holdings Ltd. | | | 1,500 | | | | 1,861 | |
Kerry Properties Ltd. | | | 1,900 | | | | 3,197 | |
Link REIT, REIT | | | 9,400 | | | | 43,138 | |
Man Wah Holdings Ltd. | | | 5,200 | | | | 3,230 | |
Melco International Development Ltd.* | | | 2,600 | | | | 1,817 | |
MTR Corp. Ltd. | | | 5,000 | | | | 18,691 | |
New World Development Co. Ltd. | | | 4,900 | | | | 8,993 | |
NWS Holdings Ltd. | | | 4,000 | | | | 4,733 | |
Orient Overseas International Ltd. | | | 500 | | | | 6,305 | |
PCCW Ltd. | | | 16,000 | | | | 7,831 | |
Power Assets Holdings Ltd. | | | 5,100 | | | | 24,382 | |
Prudential PLC | | | 10,033 | | | | 104,909 | |
Sino Land Co. Ltd. | | | 11,600 | | | | 11,581 | |
Sun Hung Kai Properties Ltd. | | | 5,250 | | | | 53,911 | |
Swire Pacific Ltd. (Class A Stock) | | | 1,500 | | | | 9,582 | |
Swire Pacific Ltd. (Class B Stock) | | | 2,900 | | | | 2,977 | |
Swire Properties Ltd. | | | 4,000 | | | | 7,745 | |
Techtronic Industries Co. Ltd. | | | 4,500 | | | | 41,083 | |
See Notes to Financial Statements.
PGIM Quant Solutions International Developed Markets Index Fund 19
Schedule of Investments (continued)
as of October 31, 2023
| | | | | | | | |
| | |
| Description | | Shares | | | Value | |
| | |
COMMON STOCKS (Continued) | | | | | | | | |
| | |
Hong Kong (cont’d.) | | | | | | | | |
| | |
United Energy Group Ltd. | | | 30,000 | | | $ | 4,790 | |
Vitasoy International Holdings Ltd. | | | 3,000 | | | | 3,701 | |
VTech Holdings Ltd. | | | 600 | | | | 3,491 | |
WH Group Ltd., 144A | | | 28,700 | | | | 17,141 | |
Wharf Real Estate Investment Co. Ltd. | | | 5,500 | | | | 19,239 | |
Yue Yuen Industrial Holdings Ltd. | | | 2,700 | | | | 3,157 | |
| | | | | | | | |
| | |
| | | | | | | 1,188,862 | |
| | |
Indonesia 0.0% | | | | | | | | |
| | |
First Pacific Co. Ltd. | | | 10,000 | | | | 3,786 | |
| | |
Ireland 0.3% | | | | | | | | |
| | |
AIB Group PLC | | | 4,613 | | | | 20,027 | |
Bank of Ireland Group PLC | | | 3,903 | | | | 34,978 | |
Glanbia PLC | | | 703 | | | | 11,071 | |
Kerry Group PLC (Class A Stock) | | | 567 | | | | 43,797 | |
Kingspan Group PLC | | | 551 | | | | 37,082 | |
Smurfit Kappa Group PLC | | | 960 | | | | 31,339 | |
| | | | | | | | |
| | |
| | | | | | | 178,294 | |
| | |
Israel 0.5% | | | | | | | | |
| | |
Airport City Ltd.* | | | 285 | | | | 3,753 | |
Amot Investments Ltd. | | | 798 | | | | 3,342 | |
Azrieli Group Ltd. | | | 138 | | | | 5,942 | |
Bank Hapoalim BM | | | 4,928 | | | | 35,250 | |
Bank Leumi Le-Israel BM | | | 5,601 | | | | 36,076 | |
Bezeq The Israeli Telecommunication Corp. Ltd. | | | 7,689 | | | | 9,461 | |
Big Shopping Centers Ltd.* | | | 50 | | | | 3,505 | |
Delek Group Ltd. | | | 31 | | | | 3,391 | |
Elbit Systems Ltd. | | | 88 | | | | 16,368 | |
Electra Ltd. | | | 6 | | | | 1,901 | |
Energix-Renewable Energies Ltd. | | | 729 | | | | 1,774 | |
Enlight Renewable Energy Ltd.* | | | 388 | | | | 5,221 | |
Fattal Holdings 1998 Ltd.* | | | 20 | | | | 1,655 | |
First International Bank of Israel Ltd. (The) | | | 193 | | | | 6,570 | |
Gav-Yam Lands Corp. Ltd. | | | 115 | | | | 651 | |
Harel Insurance Investments & Financial Services Ltd. | | | 462 | | | | 2,967 | |
ICL Group Ltd. | | | 2,689 | | | | 13,079 | |
Israel Corp. Ltd.* | | | 14 | | | | 3,022 | |
Israel Discount Bank Ltd. (Class A Stock) | | | 4,619 | | | | 20,302 | |
Melisron Ltd. | | | 93 | | | | 5,041 | |
Mivne Real Estate KD Ltd. | | | 2,419 | | | | 5,219 | |
Mizrahi Tefahot Bank Ltd. | | | 517 | | | | 16,002 | |
See Notes to Financial Statements.
20
| | | | | | | | |
| | |
| Description | | Shares | | | Value | |
| | |
COMMON STOCKS (Continued) | | | | | | | | |
| | |
Israel (cont’d.) | | | | | | | | |
| | |
Nice Ltd.* | | | 234 | | | $ | 35,871 | |
Nova Ltd.* | | | 107 | | | | 10,246 | |
OPC Energy Ltd.* | | | 304 | | | | 1,649 | |
Phoenix Holdings Ltd. (The) | | | 606 | | | | 5,145 | |
Shapir Engineering & Industry Ltd. | | | 527 | | | | 2,824 | |
Strauss Group Ltd.* | | | 145 | | | | 2,687 | |
Teva Pharmaceutical Industries Ltd.* | | | 4,135 | | | | 35,495 | |
Tower Semiconductor Ltd.* | | | 407 | | | | 9,452 | |
| | | | | | | | |
| | |
| | | | | | | 303,861 | |
| | |
Italy 2.1% | | | | | | | | |
| | |
A2A SpA | | | 5,689 | | | | 10,678 | |
Amplifon SpA | | | 485 | | | | 13,708 | |
Assicurazioni Generali SpA | | | 4,904 | | | | 97,411 | |
Banca Mediolanum SpA | | | 938 | | | | 7,659 | |
Banco BPM SpA | | | 5,141 | | | | 26,303 | |
Buzzi SpA | | | 332 | | | | 8,791 | |
Coca-Cola HBC AG* | | | 743 | | | | 19,290 | |
Davide Campari-Milano NV | | | 1,811 | | | | 20,018 | |
DiaSorin SpA | | | 83 | | | | 7,439 | |
Enel SpA | | | 28,319 | | | | 179,757 | |
Eni SpA | | | 8,019 | | | | 131,092 | |
Ferrari NV | | | 431 | | | | 130,466 | |
FinecoBank Banca Fineco SpA | | | 2,227 | | | | 26,271 | |
Hera SpA | | | 2,932 | | | | 8,248 | |
Infrastrutture Wireless Italiane SpA, 144A | | | 1,327 | | | | 14,531 | |
Interpump Group SpA | | | 290 | | | | 12,126 | |
Intesa Sanpaolo SpA | | | 56,340 | | | | 146,810 | |
Italgas SpA | | | 1,849 | | | | 9,396 | |
Leonardo SpA | | | 1,508 | | | | 22,790 | |
Mediobanca Banca di Credito Finanziario SpA | | | 2,329 | | | | 27,821 | |
Moncler SpA | | | 744 | | | | 38,641 | |
Nexi SpA, 144A* | | | 2,126 | | | | 12,354 | |
Pirelli & C SpA, 144A | | | 1,825 | | | | 8,131 | |
Poste Italiane SpA, 144A | | | 1,720 | | | | 17,028 | |
PRADA SpA | | | 2,000 | | | | 12,048 | |
Prysmian SpA | | | 971 | | | | 36,361 | |
Recordati Industria Chimica e Farmaceutica SpA | | | 366 | | | | 16,929 | |
Reply SpA | | | 86 | | | | 8,115 | |
Snam SpA | | | 8,083 | | | | 37,065 | |
Telecom Italia SpA* | | | 40,042 | | | | 10,353 | |
Telecom Italia SpA, RSP* | | | 22,509 | | | | 5,862 | |
Terna - Rete Elettrica Nazionale | | | 5,211 | | | | 39,901 | |
See Notes to Financial Statements.
PGIM Quant Solutions International Developed Markets Index Fund 21
Schedule of Investments (continued)
as of October 31, 2023
| | | | | | | | |
| | |
| Description | | Shares | | | Value | |
| | |
COMMON STOCKS (Continued) | | | | | | | | |
| | |
Italy (cont’d.) | | | | | | | | |
| | |
UniCredit SpA | | | 6,434 | | | $ | 161,298 | |
UnipolSai Assicurazioni SpA | | | 1,497 | | | | 3,548 | |
| | | | | | | | |
| | |
| | | | | | | 1,328,239 | |
| | |
Japan 22.3% | | | | | | | | |
| | |
ABC-Mart, Inc. | | | 300 | | | | 4,647 | |
Acom Co. Ltd. | | | 1,200 | | | | 2,818 | |
Activia Properties, Inc., REIT | | | 2 | | | | 5,411 | |
Advance Residence Investment Corp., REIT | | | 5 | | | | 10,871 | |
Advantest Corp. | | | 2,680 | | | | 69,033 | |
Aeon Co. Ltd. | | | 2,530 | | | | 53,230 | |
AEON Financial Service Co. Ltd. | | | 410 | | | | 3,380 | |
Aeon Mall Co. Ltd. | | | 430 | | | | 4,890 | |
AEON REIT Investment Corp., REIT | | | 7 | | | | 6,664 | |
AGC, Inc. | | | 620 | | | | 21,092 | |
Aica Kogyo Co. Ltd. | | | 180 | | | | 4,136 | |
Ain Holdings, Inc. | | | 100 | | | | 2,827 | |
Air Water, Inc. | | | 680 | | | | 8,574 | |
Aisin Corp. | | | 600 | | | | 20,901 | |
Ajinomoto Co., Inc. | | | 1,720 | | | | 62,819 | |
Alfresa Holdings Corp. | | | 650 | | | | 10,296 | |
Alps Alpine Co. Ltd. | | | 800 | | | | 6,565 | |
Amada Co. Ltd. | | | 1,100 | | | | 10,671 | |
Amano Corp. | | | 210 | | | | 4,290 | |
Amvis Holdings, Inc. | | | 100 | | | | 1,706 | |
ANA Holdings, Inc.* | | | 550 | | | | 10,798 | |
Anritsu Corp. | | | 560 | | | | 4,169 | |
Aozora Bank Ltd. | | | 420 | | | | 8,567 | |
As One Corp. | | | 20 | | | | 637 | |
Asahi Group Holdings Ltd. | | | 1,740 | | | | 62,937 | |
Asahi Intecc Co. Ltd. | | | 700 | | | | 11,762 | |
Asahi Kasei Corp. | | | 4,600 | | | | 28,280 | |
Asics Corp. | | | 600 | | | | 19,006 | |
ASKUL Corp. | | | 200 | | | | 2,611 | |
Astellas Pharma, Inc. | | | 6,530 | | | | 82,604 | |
Azbil Corp. | | | 400 | | | | 11,819 | |
AZ-COM MARUWA Holdings, Inc. | | | 200 | | | | 2,745 | |
Bandai Namco Holdings, Inc. | | | 2,160 | | | | 44,752 | |
BayCurrent Consulting, Inc. | | | 500 | | | | 12,553 | |
Benefit One, Inc. | | | 200 | | | | 1,434 | |
Benesse Holdings, Inc. | | | 320 | | | | 3,783 | |
Bic Camera, Inc. | | | 600 | | | | 4,543 | |
BIPROGY, Inc. | | | 200 | | | | 4,988 | |
Bridgestone Corp. | | | 2,100 | | | | 79,475 | |
See Notes to Financial Statements.
22
| | | | | | | | |
| | |
| Description | | Shares | | | Value | |
| | |
COMMON STOCKS (Continued) | | | | | | | | |
| | |
Japan (cont’d.) | | | | | | | | |
| | |
Brother Industries Ltd. | | | 850 | | | $ | 13,260 | |
Calbee, Inc. | | | 240 | | | | 4,610 | |
Canon Marketing Japan, Inc. | | | 160 | | | | 3,837 | |
Canon, Inc. | | | 3,530 | | | | 83,452 | |
Capcom Co. Ltd. | | | 600 | | | | 19,314 | |
Casio Computer Co. Ltd. | | | 800 | | | | 6,410 | |
Central Japan Railway Co. | | | 3,470 | | | | 78,104 | |
Chiba Bank Ltd. (The) | | | 2,250 | | | | 16,759 | |
Chubu Electric Power Co., Inc. | | | 2,600 | | | | 31,419 | |
Chugai Pharmaceutical Co. Ltd. | | | 2,370 | | | | 70,286 | |
Chugin Financial Group, Inc. | | | 650 | | | | 5,183 | |
Chugoku Electric Power Co., Inc. (The) | | | 1,080 | | | | 6,753 | |
Coca-Cola Bottlers Japan Holdings, Inc. | | | 540 | | | | 7,241 | |
COMSYS Holdings Corp. | | | 400 | | | | 8,228 | |
Concordia Financial Group Ltd. | | | 4,100 | | | | 19,050 | |
Cosmo Energy Holdings Co. Ltd. | | | 300 | | | | 10,974 | |
Cosmos Pharmaceutical Corp. | | | 90 | | | | 9,366 | |
Credit Saison Co. Ltd. | | | 650 | | | | 9,743 | |
CyberAgent, Inc. | | | 1,610 | | | | 8,452 | |
Dai Nippon Printing Co. Ltd. | | | 950 | | | | 24,783 | |
Daicel Corp. | | | 980 | | | | 8,334 | |
Daido Steel Co. Ltd. | | | 160 | | | | 6,277 | |
Daifuku Co. Ltd. | | | 1,050 | | | | 17,349 | |
Dai-ichi Life Holdings, Inc. | | | 3,450 | | | | 72,881 | |
Daiichi Sankyo Co. Ltd. | | | 6,860 | | | | 176,880 | |
Daiichikosho Co. Ltd. | | | 260 | | | | 3,843 | |
Daikin Industries Ltd. | | | 1,000 | | | | 144,179 | |
Daio Paper Corp. | | | 300 | | | | 2,465 | |
Daito Trust Construction Co. Ltd. | | | 246 | | | | 26,388 | |
Daiwa House Industry Co. Ltd. | | | 2,320 | | | | 63,813 | |
Daiwa House REIT Investment Corp., REIT | | | 8 | | | | 14,158 | |
Daiwa Office Investment Corp., REIT | | | 1 | | | | 4,374 | |
Daiwa Securities Group, Inc. | | | 5,350 | | | | 30,851 | |
Daiwa Securities Living Investments Corp., REIT | | | 8 | | | | 5,915 | |
DeNA Co. Ltd. | | | 310 | | | | 3,028 | |
Denka Co. Ltd. | | | 290 | | | | 5,238 | |
Denso Corp. | | | 6,320 | | | | 93,323 | |
Dentsu Group, Inc. | | | 780 | | | | 22,656 | |
Descente Ltd. | | | 150 | | | | 4,184 | |
DIC Corp. | | | 300 | | | | 4,731 | |
Disco Corp. | | | 300 | | | | 52,980 | |
DMG Mori Co. Ltd. | | | 400 | | | | 6,616 | |
Dowa Holdings Co. Ltd. | | | 170 | | | | 5,197 | |
East Japan Railway Co. | | | 1,330 | | | | 69,077 | |
See Notes to Financial Statements.
PGIM Quant Solutions International Developed Markets Index Fund 23
Schedule of Investments (continued)
as of October 31, 2023
| | | | | | | | |
| | |
| Description | | Shares | | | Value | |
| | |
COMMON STOCKS (Continued) | | | | | | | | |
| | |
Japan (cont’d.) | | | | | | | | |
| | |
Ebara Corp. | | | 300 | | | $ | 13,285 | |
Eisai Co. Ltd. | | | 964 | | | | 51,071 | |
Electric Power Development Co. Ltd. | | | 600 | | | | 9,198 | |
ENEOS Holdings, Inc. | | | 10,260 | | | | 38,018 | |
EXEO Group, Inc. | | | 390 | | | | 8,100 | |
Ezaki Glico Co. Ltd. | | | 210 | | | | 6,104 | |
Fancl Corp. | | | 300 | | | | 4,485 | |
FANUC Corp. | | | 3,465 | | | | 85,989 | |
Fast Retailing Co. Ltd. | | | 585 | | | | 129,517 | |
Food & Life Cos. Ltd. | | | 400 | | | | 6,742 | |
FP Corp. | | | 180 | | | | 3,466 | |
Frontier Real Estate Investment Corp., REIT | | | 1 | | | | 2,992 | |
Fuji Electric Co. Ltd. | | | 400 | | | | 15,230 | |
Fuji Kyuko Co. Ltd. | | | 100 | | | | 2,823 | |
Fuji Media Holdings, Inc. | | | 200 | | | | 1,986 | |
Fuji Oil Holdings, Inc. | | | 160 | | | | 2,541 | |
FUJIFILM Holdings Corp. | | | 1,310 | | | | 71,654 | |
Fujikura Ltd. | | | 1,000 | | | | 7,182 | |
Fujitsu General Ltd. | | | 200 | | | | 3,557 | |
Fujitsu Ltd. | | | 650 | | | | 84,206 | |
Fukuoka Financial Group, Inc. | | | 560 | | | | 14,803 | |
Furukawa Electric Co. Ltd. | | | 200 | | | | 2,997 | |
Fuyo General Lease Co. Ltd. | | | 50 | | | | 4,065 | |
GLP J-REIT, REIT | | | 17 | | | | 15,226 | |
GMO internet group, Inc. | | | 200 | | | | 2,913 | |
GMO Payment Gateway, Inc. | | | 190 | | | | 7,588 | |
Goldwin, Inc. | | | 142 | | | | 8,968 | |
GS Yuasa Corp. | | | 300 | | | | 4,840 | |
GungHo Online Entertainment, Inc. | | | 120 | | | | 1,809 | |
Hachijuni Bank Ltd. (The) | | | 1,640 | | | | 9,340 | |
Hakuhodo DY Holdings, Inc. | | | 900 | | | | 7,304 | |
Hamamatsu Photonics KK | | | 450 | | | | 16,714 | |
Hankyu Hanshin Holdings, Inc. | | | 770 | | | | 24,227 | |
Harmonic Drive Systems, Inc. | | | 200 | | | | 4,332 | |
Haseko Corp. | | | 970 | | | | 11,938 | |
Heiwa Corp. | | | 200 | | | | 2,831 | |
Hikari Tsushin, Inc. | | | 80 | | | | 11,542 | |
Hino Motors Ltd.* | | | 1,100 | | | | 3,202 | |
Hirogin Holdings, Inc. | | | 1,100 | | | | 6,995 | |
Hirose Electric Co. Ltd. | | | 145 | | | | 16,428 | |
Hisamitsu Pharmaceutical Co., Inc. | | | 210 | | | | 6,698 | |
Hitachi Construction Machinery Co. Ltd. | | | 420 | | | | 10,851 | |
Hitachi Ltd. | | | 3,330 | | | | 211,077 | |
Honda Motor Co. Ltd. | | | 18,120 | | | | 185,708 | |
See Notes to Financial Statements.
24
| | | | | | | | |
| | |
| Description | | Shares | | | Value | |
| | |
COMMON STOCKS (Continued) | | | | | | | | |
| | |
Japan (cont’d.) | | | | | | | | |
| | |
Horiba Ltd. | | | 150 | | | $ | 7,584 | |
Hoshizaki Corp. | | | 440 | | | | 14,210 | |
House Foods Group, Inc. | | | 240 | | | | 5,068 | |
Hoya Corp. | | | 1,280 | | | | 123,224 | |
Hulic Co. Ltd. | | | 1,510 | | | | 13,844 | |
Ibiden Co. Ltd. | | | 360 | | | | 15,349 | |
Idemitsu Kosan Co. Ltd. | | | 847 | | | | 19,231 | |
IHI Corp. | | | 430 | | | | 8,253 | |
Iida Group Holdings Co. Ltd. | | | 530 | | | | 8,229 | |
Industrial & Infrastructure Fund Investment Corp., REIT | | | 8 | | | | 7,190 | |
Information Services International-Dentsu Ltd. | | | 100 | | | | 3,394 | |
INFRONEER Holdings, Inc. | | | 828 | | | | 8,734 | |
Inpex Corp. | | | 3,400 | | | | 49,337 | |
Internet Initiative Japan, Inc. | | | 400 | | | | 6,463 | |
Invincible Investment Corp., REIT | | | 24 | | | | 9,230 | |
Isetan Mitsukoshi Holdings Ltd. | | | 1,250 | | | | 14,101 | |
Isuzu Motors Ltd. | | | 1,850 | | | | 20,629 | |
Ito En Ltd. | | | 230 | | | | 7,474 | |
ITOCHU Corp. | | | 4,900 | | | | 176,503 | |
Itoham Yonekyu Holdings, Inc. | | | 80 | | | | 2,211 | |
Iwatani Corp. | | | 150 | | | | 7,174 | |
Iyogin Holdings, Inc. | | | 970 | | | | 6,982 | |
Izumi Co. Ltd. | | | 200 | | | | 5,057 | |
J Front Retailing Co. Ltd. | | | 900 | | | | 8,580 | |
Japan Airlines Co. Ltd. | | | 560 | | | | 10,295 | |
Japan Airport Terminal Co. Ltd. | | | 150 | | | | 6,597 | |
Japan Aviation Electronics Industry Ltd. | | | 220 | | | | 4,147 | |
Japan Exchange Group, Inc. | | | 1,950 | | | | 38,561 | |
Japan Hotel REIT Investment Corp., REIT | | | 17 | | | | 7,729 | |
Japan Logistics Fund, Inc., REIT | | | 3 | | | | 5,557 | |
Japan Metropolitan Fund Investment Corp., REIT | | | 25 | | | | 16,134 | |
Japan Post Bank Co. Ltd. | | | 5,250 | | | | 48,663 | |
Japan Post Holdings Co. Ltd. | | | 7,550 | | | | 66,827 | |
Japan Post Insurance Co. Ltd. | | | 700 | | | | 13,479 | |
Japan Prime Realty Investment Corp., REIT | | | 3 | | | | 7,027 | |
Japan Real Estate Investment Corp., REIT | | | 5 | | | | 18,572 | |
Japan Steel Works Ltd. (The) | | | 200 | | | | 3,245 | |
Japan Tobacco, Inc. | | | 4,480 | | | | 104,289 | |
JCR Pharmaceuticals Co. Ltd. | | | 200 | | | | 1,531 | |
Jeol Ltd. | | | 100 | | | | 2,823 | |
JFE Holdings, Inc. | | | 2,080 | | | | 28,980 | |
JGC Holdings Corp. | | | 780 | | | | 9,607 | |
JMDC, Inc. | | | 100 | | | | 2,801 | |
JSR Corp. | | | 650 | | | | 17,398 | |
See Notes to Financial Statements.
PGIM Quant Solutions International Developed Markets Index Fund 25
Schedule of Investments (continued)
as of October 31, 2023
| | | | | | | | |
| | |
| Description | | Shares | | | Value | |
| | |
COMMON STOCKS (Continued) | | | | | | | | |
| | |
Japan (cont’d.) | | | | | | | | |
| | |
JTEKT Corp. | | | 900 | | | $ | 7,420 | |
Justsystems Corp. | | | 60 | | | | 1,069 | |
Kadokawa Corp. | | | 300 | | | | 5,779 | |
Kagome Co. Ltd. | | | 300 | | | | 6,241 | |
Kajima Corp. | | | 1,600 | | | | 26,444 | |
Kakaku.com, Inc. | | | 450 | | | | 4,340 | |
Kamigumi Co. Ltd. | | | 380 | | | | 7,709 | |
Kandenko Co. Ltd. | | | 400 | | | | 3,707 | |
Kaneka Corp. | | | 230 | | | | 5,629 | |
Kansai Electric Power Co., Inc. (The) | | | 2,620 | | | | 33,546 | |
Kansai Paint Co. Ltd. | | | 630 | | | | 9,220 | |
Kao Corp. | | | 1,680 | | | | 61,293 | |
Katitas Co. Ltd. | | | 200 | | | | 2,669 | |
Kawasaki Heavy Industries Ltd. | | | 590 | | | | 13,022 | |
Kawasaki Kisen Kaisha Ltd. | | | 800 | | | | 27,432 | |
KDDI Corp. | | | 5,810 | | | | 173,805 | |
KDX Realty Investment Corp., REIT | | | 4 | | | | 4,172 | |
Keihan Holdings Co. Ltd. | | | 310 | | | | 7,582 | |
Keikyu Corp. | | | 1,000 | | | | 8,478 | |
Keio Corp. | | | 360 | | | | 10,683 | |
Keisei Electric Railway Co. Ltd. | | | 450 | | | | 16,951 | |
Kewpie Corp. | | | 460 | | | | 7,984 | |
Keyence Corp. | | | 726 | | | | 281,048 | |
Kikkoman Corp. | | | 660 | | | | 37,551 | |
Kinden Corp. | | | 500 | | | | 7,574 | |
Kintetsu Group Holdings Co. Ltd. | | | 660 | | | | 18,570 | |
Kirin Holdings Co. Ltd. | | | 2,700 | | | | 37,944 | |
Kobayashi Pharmaceutical Co. Ltd. | | | 230 | | | | 9,495 | |
Kobe Bussan Co. Ltd. | | | 450 | | | | 11,137 | |
Kobe Steel Ltd. | | | 1,200 | | | | 14,188 | |
Koei Tecmo Holdings Co. Ltd. | | | 520 | | | | 6,790 | |
Koito Manufacturing Co. Ltd. | | | 860 | | | | 12,885 | |
Kokuyo Co. Ltd. | | | 300 | | | | 4,650 | |
Komatsu Ltd. | | | 3,310 | | | | 76,052 | |
Konami Group Corp. | | | 300 | | | | 15,541 | |
Konica Minolta, Inc.* | | | 1,600 | | | | 4,482 | |
Kose Corp. | | | 130 | | | | 8,613 | |
Kotobuki Spirits Co. Ltd. | | | 350 | | | | 4,648 | |
K’s Holdings Corp. | | | 600 | | | | 5,583 | |
Kubota Corp. | | | 3,900 | | | | 52,452 | |
Kuraray Co. Ltd. | | | 1,250 | | | | 14,301 | |
Kurita Water Industries Ltd. | | | 360 | | | | 10,938 | |
Kyocera Corp. | | | 1,050 | | | | 51,756 | |
Kyoto Financial Group, Inc. | | | 240 | | | | 13,607 | |
See Notes to Financial Statements.
26
| | | | | | | | |
| | |
| Description | | Shares | | | Value | |
| | |
COMMON STOCKS (Continued) | | | | | | | | |
| | |
Japan (cont’d.) | | | | | | | | |
| | |
Kyowa Kirin Co. Ltd. | | | 920 | | | $ | 14,430 | |
Kyudenko Corp. | | | 150 | | | | 4,481 | |
Kyushu Electric Power Co., Inc.* | | | 1,800 | | | | 11,500 | |
Kyushu Financial Group, Inc. | | | 1,500 | | | | 9,452 | |
Kyushu Railway Co. | | | 520 | | | | 10,632 | |
LaSalle Logiport REIT, REIT | | | 7 | | | | 6,865 | |
Lasertec Corp. | | | 300 | | | | 49,554 | |
Lawson, Inc. | | | 150 | | | | 7,249 | |
Lion Corp. | | | 940 | | | | 9,021 | |
Lixil Corp. | | | 920 | | | | 10,088 | |
LY Corp. | | | 9,700 | | | | 24,730 | |
M3, Inc. | | | 1,470 | | | | 22,640 | |
Mabuchi Motor Co. Ltd. | | | 160 | | | | 4,571 | |
Macnica Holdings, Inc. | | | 150 | | | | 6,094 | |
Makita Corp. | | | 900 | | | | 23,262 | |
Mani, Inc. | | | 280 | | | | 3,809 | |
Marubeni Corp. | | | 5,550 | | | | 81,151 | |
Marui Group Co. Ltd. | | | 680 | | | | 10,753 | |
Maruichi Steel Tube Ltd. | | | 270 | | | | 6,700 | |
Matsui Securities Co. Ltd. | | | 300 | | | | 1,492 | |
MatsukiyoCocokara & Co. | | | 1,320 | | | | 23,155 | |
Mazda Motor Corp. | | | 2,150 | | | | 20,782 | |
McDonald’s Holdings Co. Japan Ltd. | | | 300 | | | | 11,672 | |
Mebuki Financial Group, Inc. | | | 3,400 | | | | 10,293 | |
Medipal Holdings Corp. | | | 500 | | | | 8,406 | |
MEIJI Holdings Co. Ltd. | | | 932 | | | | 22,940 | |
Menicon Co. Ltd. | | | 200 | | | | 2,319 | |
Mercari, Inc.* | | | 350 | | | | 7,024 | |
MINEBEA MITSUMI, Inc. | | | 1,550 | | | | 24,303 | |
MISUMI Group, Inc. | | | 1,050 | | | | 15,896 | |
Mitsubishi Chemical Group Corp. | | | 4,750 | | | | 26,878 | |
Mitsubishi Corp. | | | 4,180 | | | | 194,853 | |
Mitsubishi Electric Corp. | | | 7,080 | | | | 81,183 | |
Mitsubishi Estate Co. Ltd. | | | 4,020 | | | | 51,457 | |
Mitsubishi Gas Chemical Co., Inc. | | | 620 | | | | 8,380 | |
Mitsubishi HC Capital, Inc. | | | 2,423 | | | | 15,973 | |
Mitsubishi Heavy Industries Ltd. | | | 1,010 | | | | 52,020 | |
Mitsubishi Logistics Corp. | | | 190 | | | | 4,970 | |
Mitsubishi Materials Corp. | | | 510 | | | | 8,195 | |
Mitsubishi Motors Corp. | | | 2,450 | | | | 8,003 | |
Mitsubishi UFJ Financial Group, Inc. | | | 42,500 | | | | 356,539 | |
Mitsui & Co. Ltd. | | | 5,400 | | | | 196,259 | |
Mitsui Chemicals, Inc. | | | 640 | | | | 16,131 | |
Mitsui Fudosan Co. Ltd. | | | 3,260 | | | | 70,660 | |
See Notes to Financial Statements.
PGIM Quant Solutions International Developed Markets Index Fund 27
Schedule of Investments (continued)
as of October 31, 2023
| | | | | | | | |
| | |
| Description | | Shares | | | Value | |
| | |
COMMON STOCKS (Continued) | | | | | | | | |
| | |
Japan (cont’d.) | | | | | | | | |
| | |
Mitsui Fudosan Logistics Park, Inc., REIT | | | 2 | | | $ | 6,046 | |
Mitsui High-Tec, Inc. | | | 50 | | | | 2,111 | |
Mitsui Mining & Smelting Co. Ltd. | | | 200 | | | | 5,193 | |
Mitsui OSK Lines Ltd. | | | 1,210 | | | | 31,239 | |
Miura Co. Ltd. | | | 330 | | | | 6,398 | |
Mizuho Financial Group, Inc. | | | 9,330 | | | | 158,408 | |
Money Forward, Inc.* | | | 100 | | | | 2,526 | |
MonotaRO Co. Ltd. | | | 920 | | | | 7,353 | |
Mori Hills REIT Investment Corp., REIT | | | 6 | | | | 5,616 | |
Morinaga & Co. Ltd. | | | 140 | | | | 5,049 | |
Morinaga Milk Industry Co. Ltd. | | | 110 | | | | 4,291 | |
MS&AD Insurance Group Holdings, Inc. | | | 1,660 | | | | 60,823 | |
Murata Manufacturing Co. Ltd. | | | 6,210 | | | | 106,373 | |
Nabtesco Corp. | | | 380 | | | | 6,730 | |
Nagase & Co. Ltd. | | | 400 | | | | 6,060 | |
Nagoya Railroad Co. Ltd. | | | 760 | | | | 10,639 | |
Nankai Electric Railway Co. Ltd. | | | 330 | | | | 6,320 | |
NEC Corp. | | | 900 | | | | 43,336 | |
NEC Networks & System Integration Corp. | | | 300 | | | | 4,060 | |
NET One Systems Co. Ltd. | | | 260 | | | | 3,968 | |
Nexon Co. Ltd. | | | 1,440 | | | | 26,423 | |
NGK Insulators Ltd. | | | 930 | | | | 11,363 | |
NH Foods Ltd. | | | 300 | | | | 9,001 | |
NHK Spring Co. Ltd. | | | 680 | | | | 4,812 | |
Nichirei Corp. | | | 400 | | | | 8,658 | |
Nidec Corp. | | | 1,890 | | | | 69,327 | |
Nifco, Inc. | | | 250 | | | | 5,863 | |
Nihon Kohden Corp. | | | 300 | | | | 7,086 | |
Nihon M&A Center Holdings, Inc. | | | 1,000 | | | | 4,567 | |
Nikon Corp. | | | 1,150 | | | | 10,919 | |
Nintendo Co. Ltd. | | | 3,800 | | | | 156,995 | |
Nippon Accommodations Fund, Inc., REIT | | | 2 | | | | 8,058 | |
Nippon Building Fund, Inc., REIT | | | 6 | | | | 24,108 | |
Nippon Electric Glass Co. Ltd. | | | 330 | | | | 6,597 | |
NIPPON EXPRESS HOLDINGS, Inc. | | | 270 | | | | 13,877 | |
Nippon Kayaku Co. Ltd. | | | 700 | | | | 6,013 | |
Nippon Paint Holdings Co. Ltd. | | | 3,750 | | | | 25,212 | |
Nippon Prologis REIT, Inc., REIT | | | 9 | | | | 16,014 | |
Nippon Sanso Holdings Corp. | | | 490 | | | | 12,357 | |
Nippon Shinyaku Co. Ltd. | | | 150 | | | | 6,083 | |
Nippon Shokubai Co. Ltd. | | | 130 | | | | 4,828 | |
Nippon Steel Corp. | | | 2,980 | | | | 64,275 | |
Nippon Telegraph & Telephone Corp. | | | 103,650 | | | | 121,973 | |
Nippon Yusen KK | | | 1,800 | | | | 44,041 | |
See Notes to Financial Statements.
28
| | | | | | | | |
| | |
| Description | | Shares | | | Value | |
| | |
COMMON STOCKS (Continued) | | | | | | | | |
| | |
Japan (cont’d.) | | | | | | | | |
| | |
Nipro Corp. | | | 500 | | | $ | 3,807 | |
Nishi-Nippon Railroad Co. Ltd. | | | 280 | | | | 4,524 | |
Nissan Chemical Corp. | | | 410 | | | | 16,722 | |
Nissan Motor Co. Ltd. | | | 7,050 | | | | 27,128 | |
Nisshin Seifun Group, Inc. | | | 910 | | | | 13,726 | |
Nissin Foods Holdings Co. Ltd. | | | 250 | | | | 21,752 | |
Niterra Co. Ltd. | | | 710 | | | | 15,892 | |
Nitori Holdings Co. Ltd. | | | 272 | | | | 29,456 | |
Nitto Denko Corp. | | | 500 | | | | 32,353 | |
NOF Corp. | | | 200 | | | | 7,890 | |
NOK Corp. | | | 450 | | | | 5,334 | |
Nomura Holdings, Inc. | | | 11,300 | | | | 43,657 | |
Nomura Real Estate Holdings, Inc. | | | 330 | | | | 7,707 | |
Nomura Real Estate Master Fund, Inc., REIT | | | 17 | | | | 18,759 | |
Nomura Research Institute Ltd. | | | 1,610 | | | | 42,262 | |
NS Solutions Corp. | | | 130 | | | | 3,775 | |
NSK Ltd. | | | 1,550 | | | | 8,343 | |
NTT Data Group Corp. | | | 2,350 | | | | 28,975 | |
Obayashi Corp. | | | 2,500 | | | | 21,415 | |
OBIC Business Consultants Co. Ltd. | | | 60 | | | | 2,578 | |
Obic Co. Ltd. | | | 250 | | | | 36,954 | |
Odakyu Electric Railway Co. Ltd. | | | 1,090 | | | | 15,518 | |
Oji Holdings Corp. | | | 3,500 | | | | 14,969 | |
OKUMA Corp. | | | 50 | | | | 2,059 | |
Olympus Corp. | | | 4,480 | | | | 59,832 | |
Omron Corp. | | | 670 | | | | 24,004 | |
Ono Pharmaceutical Co. Ltd. | | | 1,580 | | | | 27,286 | |
Open House Group Co. Ltd. | | | 210 | | | | 6,922 | |
Oracle Corp. | | | 150 | | | | 10,641 | |
Orient Corp. | | | 180 | | | | 1,342 | |
Oriental Land Co. Ltd. | | | 3,450 | | | | 111,592 | |
ORIX Corp. | | | 4,300 | | | | 78,201 | |
Orix JREIT, Inc., REIT | | | 10 | | | | 11,493 | |
Osaka Gas Co. Ltd. | | | 1,440 | | | | 27,155 | |
OSG Corp. | | | 260 | | | | 2,967 | |
Otsuka Corp. | | | 390 | | | | 15,637 | |
Otsuka Holdings Co. Ltd. | | | 1,760 | | | | 59,217 | |
PALTAC Corp. | | | 100 | | | | 3,242 | |
Pan Pacific International Holdings Corp. | | | 1,500 | | | | 29,049 | |
Panasonic Holdings Corp. | | | 7,760 | | | | 68,082 | |
Park24 Co. Ltd.* | | | 520 | | | | 5,858 | |
Penta-Ocean Construction Co. Ltd. | | | 1,200 | | | | 7,055 | |
PeptiDream, Inc.* | | | 370 | | | | 2,697 | |
Persol Holdings Co. Ltd. | | | 6,500 | | | | 9,746 | |
See Notes to Financial Statements.
PGIM Quant Solutions International Developed Markets Index Fund 29
Schedule of Investments (continued)
as of October 31, 2023
| | | | | | | | |
| | |
| Description | | Shares | | | Value | |
| | |
COMMON STOCKS (Continued) | | | | | | | | |
| | |
Japan (cont’d.) | | | | | | | | |
| | |
Pigeon Corp. | | | 360 | | | $ | 3,822 | |
Pola Orbis Holdings, Inc. | | | 310 | | | | 3,114 | |
Rakus Co. Ltd. | | | 400 | | | | 4,980 | |
Rakuten Group, Inc. | | | 3,900 | | | | 14,426 | |
Recruit Holdings Co. Ltd. | | | 4,850 | | | | 139,063 | |
Relo Group, Inc. | | | 400 | | | | 3,966 | |
Renesas Electronics Corp.* | | | 4,380 | | | | 57,534 | |
Rengo Co. Ltd. | | | 800 | | | | 5,298 | |
Resona Holdings, Inc. | | | 7,710 | | | | 41,197 | |
Resonac Holdings Corp. | | | 700 | | | | 11,348 | |
Resorttrust, Inc. | | | 220 | | | | 3,166 | |
Ricoh Co. Ltd. | | | 2,100 | | | | 17,021 | |
Rinnai Corp. | | | 380 | | | | 6,980 | |
Rohm Co. Ltd. | | | 1,190 | | | | 19,066 | |
Rohto Pharmaceutical Co. Ltd. | | | 650 | | | | 15,165 | |
Ryohin Keikaku Co. Ltd. | | | 880 | | | | 12,407 | |
Sanken Electric Co. Ltd. | | | 100 | | | | 4,974 | |
Sankyo Co. Ltd. | | | 160 | | | | 6,649 | |
Sankyu, Inc. | | | 200 | | | | 6,022 | |
Sanrio Co. Ltd. | | | 150 | | | | 6,388 | |
Santen Pharmaceutical Co. Ltd. | | | 1,200 | | | | 10,408 | |
Sanwa Holdings Corp. | | | 760 | | | | 10,254 | |
Sapporo Holdings Ltd. | | | 200 | | | | 7,041 | |
Sawai Group Holdings Co. Ltd. | | | 150 | | | | 4,780 | |
SBI Holdings, Inc. | | | 900 | | | | 19,363 | |
SCREEN Holdings Co. Ltd. | | | 360 | | | | 16,737 | |
SCSK Corp. | | | 480 | | | | 8,194 | |
Secom Co. Ltd. | | | 700 | | | | 48,618 | |
Sega Sammy Holdings, Inc. | | | 570 | | | | 8,915 | |
Seibu Holdings, Inc. | | | 750 | | | | 7,323 | |
Seiko Epson Corp. | | | 950 | | | | 13,189 | |
Seino Holdings Co. Ltd. | | | 600 | | | | 8,728 | |
Sekisui Chemical Co. Ltd. | | | 1,250 | | | | 17,121 | |
Sekisui House Ltd. | | | 2,030 | | | | 39,753 | |
Sekisui House REIT, Inc., REIT | | | 16 | | | | 8,427 | |
Seven & i Holdings Co. Ltd. | | | 2,850 | | | | 104,420 | |
Seven Bank Ltd. | | | 2,000 | | | | 3,960 | |
SG Holdings Co. Ltd. | | | 1,550 | | | | 21,971 | |
Sharp Corp.* | | | 740 | | | | 4,627 | |
SHIFT, Inc.* | | | 30 | | | | 5,443 | |
Shikoku Electric Power Co., Inc. | | | 600 | | | | 4,097 | |
Shimadzu Corp. | | | 980 | | | | 23,173 | |
Shimamura Co. Ltd. | | | 50 | | | | 4,934 | |
Shimano, Inc. | | | 270 | | | | 38,855 | |
See Notes to Financial Statements.
30
| | | | | | | | |
| | |
| Description | | Shares | | | Value | |
| | |
COMMON STOCKS (Continued) | | | | | | | | |
| | |
Japan (cont’d.) | | | | | | | | |
| | |
Shimizu Corp. | | | 2,100 | | | $ | 14,945 | |
Shin-Etsu Chemical Co. Ltd. | | | 7,100 | | | | 212,314 | |
Shinko Electric Industries Co. Ltd. | | | 200 | | | | 6,422 | |
Shionogi & Co. Ltd. | | | 940 | | | | 43,771 | |
Ship Healthcare Holdings, Inc. | | | 300 | | | | 4,632 | |
Shiseido Co. Ltd. | | | 1,400 | | | | 44,402 | |
Shizuoka Financial Group, Inc. | | | 1,860 | | | | 15,817 | |
SHO-BOND Holdings Co. Ltd. | | | 182 | | | | 7,168 | |
Skylark Holdings Co. Ltd.* | | | 800 | | | | 11,803 | |
SMC Corp. | | | 210 | | | | 96,970 | |
SMS Co. Ltd. | | | 200 | | | | 3,174 | |
Socionext, Inc. | | | 80 | | | | 7,803 | |
SoftBank Corp. | | | 10,300 | | | | 116,461 | |
SoftBank Group Corp. | | | 3,550 | | | | 145,387 | |
Sohgo Security Services Co. Ltd. | | | 1,250 | | | | 7,320 | |
Sojitz Corp. | | | 830 | | | | 17,235 | |
Sompo Holdings, Inc. | | | 1,110 | | | | 48,085 | |
Sony Group Corp. | | | 4,530 | | | | 376,619 | |
Sotetsu Holdings, Inc. | | | 260 | | | | 4,590 | |
Square Enix Holdings Co. Ltd. | | | 230 | | | | 7,641 | |
Stanley Electric Co. Ltd. | | | 540 | | | | 8,637 | |
Subaru Corp. | | | 2,170 | | | | 37,563 | |
Sugi Holdings Co. Ltd. | | | 150 | | | | 6,072 | |
SUMCO Corp. | | | 1,230 | | | | 15,894 | |
Sumitomo Bakelite Co. Ltd. | | | 100 | | | | 4,450 | |
Sumitomo Chemical Co. Ltd. | | | 5,650 | | | | 14,361 | |
Sumitomo Corp. | | | 4,030 | | | | 79,220 | |
Sumitomo Electric Industries Ltd. | | | 2,820 | | | | 29,605 | |
Sumitomo Forestry Co. Ltd. | | | 500 | | | | 11,806 | |
Sumitomo Heavy Industries Ltd. | | | 410 | | | | 9,385 | |
Sumitomo Metal Mining Co. Ltd. | | | 810 | | | | 22,754 | |
Sumitomo Mitsui Financial Group, Inc. | | | 4,620 | | | | 222,721 | |
Sumitomo Mitsui Trust Holdings, Inc. | | | 1,280 | | | | 47,996 | |
Sumitomo Pharma Co. Ltd. | | | 700 | | | | 2,138 | |
Sumitomo Realty & Development Co. Ltd. | | | 1,500 | | | | 37,641 | |
Sumitomo Rubber Industries Ltd. | | | 700 | | | | 7,101 | |
Sundrug Co. Ltd. | | | 220 | | | | 5,982 | |
Suntory Beverage & Food Ltd. | | | 420 | | | | 12,639 | |
Suzuken Co. Ltd. | | | 230 | | | | 7,045 | |
Suzuki Motor Corp. | | | 1,620 | | | | 62,875 | |
Sysmex Corp. | | | 710 | | | | 34,011 | |
T&D Holdings, Inc. | | | 1,800 | | | | 32,111 | |
Taiheiyo Cement Corp. | | | 430 | | | | 7,369 | |
Taisei Corp. | | | 650 | | | | 22,043 | |
See Notes to Financial Statements.
PGIM Quant Solutions International Developed Markets Index Fund 31
Schedule of Investments (continued)
as of October 31, 2023
| | | | | | | | |
| | |
| Description | | Shares | | | Value | |
| | |
COMMON STOCKS (Continued) | | | | | | | | |
| | |
Japan (cont’d.) | | | | | | | | |
| | |
Taisho Pharmaceutical Holdings Co. Ltd. | | | 180 | | | $ | 7,128 | |
Taiyo Yuden Co. Ltd. | | | 400 | | | | 8,967 | |
Takara Bio, Inc. | | | 130 | | | | 1,146 | |
Takara Holdings, Inc. | | | 700 | | | | 5,835 | |
Takashimaya Co. Ltd. | | | 500 | | | | 6,800 | |
Takeda Pharmaceutical Co. Ltd. | | | 5,583 | | | | 151,549 | |
TBS Holdings, Inc. | | | 170 | | | | 2,771 | |
TDK Corp. | | | 1,260 | | | | 47,143 | |
TechnoPro Holdings, Inc. | | | 340 | | | | 6,736 | |
Teijin Ltd. | | | 740 | | | | 6,698 | |
Terumo Corp. | | | 2,410 | | | | 65,933 | |
THK Co. Ltd. | | | 470 | | | | 8,400 | |
TIS, Inc. | | | 800 | | | | 17,132 | |
Tobu Railway Co. Ltd. | | | 730 | | | | 17,571 | |
Toda Corp. | | | 800 | | | | 4,443 | |
Toho Co. Ltd. | | | 420 | | | | 14,348 | |
Toho Gas Co. Ltd. | | | 370 | | | | 6,372 | |
Tohoku Electric Power Co., Inc. | | | 1,780 | | | | 11,114 | |
Tokai Carbon Co. Ltd. | | | 800 | | | | 6,139 | |
Tokio Marine Holdings, Inc. | | | 6,760 | | | | 151,236 | |
Tokyo Century Corp. | | | 160 | | | | 6,165 | |
Tokyo Electric Power Co. Holdings, Inc.* | | | 5,800 | | | | 24,544 | |
Tokyo Electron Ltd. | | | 1,620 | | | | 214,063 | |
Tokyo Gas Co. Ltd. | | | 1,540 | | | | 34,584 | |
Tokyo Ohka Kogyo Co. Ltd. | | | 150 | | | | 8,667 | |
Tokyo Seimitsu Co. Ltd. | | | 150 | | | | 7,012 | |
Tokyo Tatemono Co. Ltd. | | | 770 | | | | 10,224 | |
Tokyu Corp. | | | 2,150 | | | | 24,271 | |
Tokyu Fudosan Holdings Corp. | | | 2,200 | | | | 12,818 | |
TOPPAN Holdings, Inc. | | | 1,000 | | | | 23,064 | |
Toray Industries, Inc. | | | 5,840 | | | | 28,253 | |
Toshiba Corp.* | | | 410 | | | | 12,464 | |
Toshiba TEC Corp. | | | 100 | | | | 2,174 | |
Tosoh Corp. | | | 1,050 | | | | 12,856 | |
TOTO Ltd. | | | 530 | | | | 12,779 | |
Toyo Seikan Group Holdings Ltd. | | | 570 | | | | 9,583 | |
Toyo Suisan Kaisha Ltd. | | | 270 | | | | 12,455 | |
Toyo Tire Corp. | | | 400 | | | | 5,941 | |
Toyoda Gosei Co. Ltd. | | | 210 | | | | 4,172 | |
Toyota Boshoku Corp. | | | 280 | | | | 4,869 | |
Toyota Industries Corp. | | | 530 | | | | 39,281 | |
Toyota Motor Corp. | | | 43,950 | | | | 768,850 | |
Toyota Tsusho Corp. | | | 760 | | | | 40,460 | |
Trend Micro, Inc. | | | 440 | | | | 16,581 | |
See Notes to Financial Statements.
32
| | | | | | | | |
| | |
| Description | | Shares | | | Value | |
| | |
COMMON STOCKS (Continued) | | | | | | | | |
| | |
Japan (cont’d.) | | | | | | | | |
| | |
TS Tech Co. Ltd. | | | 360 | | | $ | 4,032 | |
Tsumura & Co. | | | 280 | | | | 5,010 | |
Tsuruha Holdings, Inc. | | | 110 | | | | 8,080 | |
UBE Corp. | | | 400 | | | | 6,160 | |
Ulvac, Inc. | | | 200 | | | | 6,878 | |
Unicharm Corp. | | | 1,440 | | | | 48,930 | |
United Urban Investment Corp., REIT | | | 11 | | | | 11,090 | |
Ushio, Inc. | | | 400 | | | | 4,878 | |
USS Co. Ltd. | | | 750 | | | | 13,109 | |
Welcia Holdings Co. Ltd. | | | 420 | | | | 6,962 | |
West Japan Railway Co. | | | 860 | | | | 32,779 | |
Workman Co. Ltd. | | | 150 | | | | 3,865 | |
Yakult Honsha Co. Ltd. | | | 1,000 | | | | 23,565 | |
Yamada Holdings Co. Ltd. | | | 2,250 | | | | 7,116 | |
Yamaguchi Financial Group, Inc. | | | 750 | | | | 6,883 | |
Yamaha Corp. | | | 520 | | | | 13,889 | |
Yamaha Motor Co. Ltd. | | | 1,150 | | | | 28,102 | |
Yamato Holdings Co. Ltd. | | | 1,230 | | | | 20,487 | |
Yamato Kogyo Co. Ltd. | | | 100 | | | | 4,791 | |
Yamazaki Baking Co. Ltd. | | | 500 | | | | 10,586 | |
Yaoko Co. Ltd. | | | 100 | | | | 5,148 | |
Yaskawa Electric Corp. | | | 970 | | | | 31,751 | |
Yokogawa Electric Corp. | | | 900 | | | | 16,340 | |
Yokohama Rubber Co. Ltd. (The) | | | 470 | | | | 8,685 | |
Zenkoku Hosho Co. Ltd. | | | 200 | | | | 6,396 | |
Zensho Holdings Co. Ltd. | | | 300 | | | | 15,769 | |
Zeon Corp. | | | 600 | | | | 4,959 | |
ZOZO, Inc. | | | 390 | | | | 7,416 | |
| | | | | | | | |
| | |
| | | | | | | 13,941,549 | |
| | |
Jordan 0.0% | | | | | | | | |
| | |
Hikma Pharmaceuticals PLC | | | 588 | | | | 13,624 | |
| | |
Luxembourg 0.1% | | | | | | | | |
| | |
ArcelorMittal SA | | | 1,814 | | | | 40,139 | |
Eurofins Scientific SE | | | 456 | | | | 23,135 | |
L’Occitane International SA | | | 1,750 | | | | 4,498 | |
RTL Group SA | | | 144 | | | | 5,037 | |
| | | | | | | | |
| | |
| | | | | | | 72,809 | |
| | |
Macau 0.1% | | | | | | | | |
| | |
Galaxy Entertainment Group Ltd. | | | 8,000 | | | | 44,972 | |
MGM China Holdings Ltd.* | | | 3,100 | | | | 3,858 | |
See Notes to Financial Statements.
PGIM Quant Solutions International Developed Markets Index Fund 33
Schedule of Investments (continued)
as of October 31, 2023
| | | | | | | | |
| | |
| Description | | Shares | | | Value | |
| | |
COMMON STOCKS (Continued) | | | | | | | | |
| | |
Macau (cont’d.) | | | | | | | | |
| | |
Sands China Ltd.* | | | 8,800 | | | $ | 23,690 | |
SJM Holdings Ltd.* | | | 7,600 | | | | 2,638 | |
Wynn Macau Ltd.* | | | 6,000 | | | | 5,314 | |
| | | | | | | | |
| | |
| | | | | | | 80,472 | |
| | |
Mexico 0.0% | | | | | | | | |
| | |
Fresnillo PLC | | | 723 | | | | 4,866 | |
| | |
Netherlands 4.6% | | | | | | | | |
| | |
Aalberts NV | | | 362 | | | | 11,302 | |
ABN AMRO Bank NV, 144A, CVA | | | 1,397 | | | | 18,816 | |
Adyen NV, 144A* | | | 107 | | | | 72,170 | |
Aegon Ltd. | | | 6,193 | | | | 30,118 | |
Akzo Nobel NV | | | 629 | | | | 42,196 | |
Argenx SE* | | | 211 | | | | 99,251 | |
ASM International NV | | | 169 | | | | 69,743 | |
ASML Holding NV | | | 1,442 | | | | 866,816 | |
ASR Nederland NV | | | 526 | | | | 19,630 | |
BE Semiconductor Industries NV | | | 283 | | | | 29,234 | |
CTP NV, 144A | | | 392 | | | | 5,715 | |
Euronext NV, 144A | | | 303 | | | | 21,131 | |
EXOR NV | | | 376 | | | | 32,272 | |
Heineken Holding NV | | | 482 | | | | 36,672 | |
Heineken NV | | | 1,020 | | | | 91,640 | |
IMCD NV | | | 212 | | | | 25,524 | |
ING Groep NV | | | 13,180 | | | | 168,975 | |
JDE Peet’s NV | | | 441 | | | | 12,247 | |
Koninklijke Ahold Delhaize NV | | | 3,544 | | | | 104,944 | |
Koninklijke KPN NV | | | 11,668 | | | | 39,218 | |
Koninklijke Philips NV* | | | 3,359 | | | | 63,896 | |
Koninklijke Vopak NV | | | 242 | | | | 8,160 | |
NN Group NV | | | 1,026 | | | | 32,906 | |
OCI NV | | | 360 | | | | 8,388 | |
Randstad NV | | | 409 | | | | 21,180 | |
Shell PLC | | | 24,614 | | | | 793,232 | |
Universal Music Group NV | | | 2,732 | | | | 66,903 | |
Wolters Kluwer NV | | | 907 | | | | 116,374 | |
| | | | | | | | |
| | |
| | | | | | | 2,908,653 | |
| | |
New Zealand 0.3% | | | | | | | | |
| | |
a2 Milk Co. Ltd. (The)* | | | 2,779 | | | | 6,769 | |
Air New Zealand Ltd. | | | 6,155 | | | | 2,402 | |
Auckland International Airport Ltd. | | | 4,413 | | | | 18,876 | |
See Notes to Financial Statements.
34
| | | | | | | | |
| | |
| Description | | Shares | | | Value | |
| | |
COMMON STOCKS (Continued) | | | | | | | | |
| | |
New Zealand (cont’d.) | | | | | | | | |
| | |
Contact Energy Ltd. | | | 2,946 | | | $ | 13,382 | |
Fisher & Paykel Healthcare Corp. Ltd. | | | 2,125 | | | | 25,775 | |
Fletcher Building Ltd. | | | 3,020 | | | | 7,611 | |
Infratil Ltd. | | | 2,986 | | | | 17,098 | |
Kiwi Property Group Ltd. | | | 6,110 | | | | 2,760 | |
Mainfreight Ltd. | | | 307 | | | | 10,247 | |
Mercury NZ Ltd. | | | 2,554 | | | | 8,786 | |
Meridian Energy Ltd. | | | 4,693 | | | | 13,217 | |
Ryman Healthcare Ltd. | | | 2,082 | | | | 6,903 | |
SKYCITY Entertainment Group Ltd. | | | 3,080 | | | | 3,357 | |
Spark New Zealand Ltd. | | | 6,975 | | | | 20,249 | |
Xero Ltd.* | | | 465 | | | | 31,791 | |
| | | | | | | | |
| | |
| | | | | | | 189,223 | |
| | |
Nigeria 0.0% | | | | | | | | |
| | |
Airtel Africa PLC, 144A | | | 4,017 | | | | 5,534 | |
| | |
Norway 0.6% | | | | | | | | |
| | |
Aker ASA (Class A Stock) | | | 89 | | | | 5,352 | |
Aker BP ASA | | | 1,141 | | | | 32,886 | |
AutoStore Holdings Ltd., 144A* | | | 2,344 | | | | 2,595 | |
DNB Bank ASA | | | 3,733 | | | | 67,350 | |
Equinor ASA | | | 3,404 | | | | 114,113 | |
Gjensidige Forsikring ASA | | | 639 | | | | 9,583 | |
Kongsberg Gruppen ASA | | | 280 | | | | 11,438 | |
Mowi ASA | | | 1,649 | | | | 26,796 | |
Norsk Hydro ASA | | | 4,930 | | | | 28,114 | |
Orkla ASA | | | 2,775 | | | | 19,127 | |
Salmar ASA | | | 235 | | | | 11,143 | |
Schibsted ASA (Class A Stock) | | | 291 | | | | 5,830 | |
Schibsted ASA (Class B Stock) | | | 366 | | | | 6,791 | |
Telenor ASA | | | 2,364 | | | | 24,166 | |
TOMRA Systems ASA | | | 882 | | | | 6,991 | |
Var Energi ASA | | | 2,054 | | | | 6,939 | |
| | | | | | | | |
| | |
| | | | | | | 379,214 | |
| | |
Poland 0.3% | | | | | | | | |
| | |
Allegro.eu SA, 144A* | | | 1,684 | | | | 12,080 | |
Bank Polska Kasa Opieki SA | | | 590 | | | | 17,929 | |
Dino Polska SA, 144A* | | | 179 | | | | 16,961 | |
InPost SA* | | | 777 | | | | 7,688 | |
KGHM Polska Miedz SA | | | 515 | | | | 13,743 | |
LPP SA | | �� | 4 | | | | 12,886 | |
See Notes to Financial Statements.
PGIM Quant Solutions International Developed Markets Index Fund 35
Schedule of Investments (continued)
as of October 31, 2023
| | | | | | | | |
| | |
| Description | | Shares | | | Value | |
| | |
COMMON STOCKS (Continued) | | | | | | | | |
| | |
Poland (cont’d.) | | | | | | | | |
| | |
ORLEN SA | | | 2,101 | | | $ | 33,225 | |
Powszechna Kasa Oszczednosci Bank Polski SA* | | | 3,145 | | | | 32,578 | |
Powszechny Zaklad Ubezpieczen SA | | | 2,122 | | | | 24,012 | |
Santander Bank Polska SA* | | | 113 | | | | 12,273 | |
| | | | | | | | |
| | |
| | | | | | | 183,375 | |
| | |
Portugal 0.2% | | | | | | | | |
| | |
EDP - Energias de Portugal SA | | | 10,970 | | | | 46,101 | |
Galp Energia SGPS SA | | | 1,862 | | | | 28,032 | |
Jeronimo Martins SGPS SA | | | 1,003 | | | | 23,124 | |
| | | | | | | | |
| | |
| | | | | | | 97,257 | |
| | |
Russia 0.0% | | | | | | | | |
| | |
Evraz PLC*^ | | | 2,361 | | | | — | |
| | |
Singapore 1.3% | | | | | | | | |
| | |
CapitaLand Ascendas REIT, REIT | | | 13,016 | | | | 24,731 | |
CapitaLand Ascott Trust, REIT, UTS | | | 8,341 | | | | 5,484 | |
CapitaLand Integrated Commercial Trust, REIT | | | 18,888 | | | | 24,275 | |
CapitaLand Investment Ltd. | | | 9,100 | | | | 19,539 | |
City Developments Ltd. | | | 1,700 | | | | 7,847 | |
ComfortDelGro Corp. Ltd. | | | 8,000 | | | | 7,727 | |
DBS Group Holdings Ltd. | | | 6,591 | | | | 158,338 | |
Frasers Logistics & Commercial Trust, REIT | | | 10,500 | | | | 7,976 | |
Genting Singapore Ltd. | | | 21,800 | | | | 13,696 | |
Jardine Cycle & Carriage Ltd. | | | 290 | | | | 5,974 | |
Keppel Corp. Ltd. | | | 5,000 | | | | 22,697 | |
Keppel DC REIT, REIT | | | 4,700 | | | | 5,800 | |
Keppel REIT, REIT | | | 9,000 | | | | 5,226 | |
Mapletree Industrial Trust, REIT | | | 7,106 | | | | 11,170 | |
Mapletree Logistics Trust, REIT | | | 12,000 | | | | 12,886 | |
Mapletree Pan Asia Commercial Trust, REIT | | | 8,500 | | | | 8,261 | |
NetLink NBN Trust, UTS | | | 10,600 | | | | 6,427 | |
Olam Group Ltd. | | | 4,300 | | | | 3,116 | |
Oversea-Chinese Banking Corp. Ltd. | | | 12,773 | | | | 118,420 | |
SATS Ltd.* | | | 3,100 | | | | 5,577 | |
Seatrium Ltd.* | | | 149,777 | | | | 12,267 | |
Sembcorp Industries Ltd. | | | 3,300 | | | | 11,071 | |
SIA Engineering Co. Ltd. | | | 1,000 | | | | 1,674 | |
Singapore Airlines Ltd. | | | 5,000 | | | | 22,326 | |
Singapore Exchange Ltd. | | | 3,000 | | | | 20,771 | |
Singapore Post Ltd. | | | 6,000 | | | | 1,971 | |
Singapore Technologies Engineering Ltd. | | | 5,500 | | | | 15,099 | |
See Notes to Financial Statements.
36
| | | | | | | | |
| | |
| Description | | Shares | | | Value | |
| | |
COMMON STOCKS (Continued) | | | | | | | | |
| | |
Singapore (cont’d.) | | | | | | | | |
| | |
Singapore Telecommunications Ltd. | | | 27,400 | | | $ | 47,612 | |
StarHub Ltd. | | | 2,100 | | | | 1,581 | |
STMicroelectronics NV | | | 2,374 | | | | 90,497 | |
Suntec Real Estate Investment Trust, REIT | | | 8,000 | | | | 6,429 | |
United Overseas Bank Ltd. | | | 4,357 | | | | 85,941 | |
UOL Group Ltd. | | | 1,800 | | | | 7,752 | |
Venture Corp. Ltd. | | | 900 | | | | 7,684 | |
| | | | | | | | |
| | |
| | | | | | | 807,842 | |
| | |
South Africa 0.2% | | | | | | | | |
| | |
Anglo American PLC | | | 4,399 | | | | 112,085 | |
| | |
South Korea 4.3% | | | | | | | | |
| | |
Alteogen, Inc.* | | | 133 | | | | 6,169 | |
Amorepacific Corp. | | | 112 | | | | 10,513 | |
AMOREPACIFIC Group | | | 118 | | | | 2,507 | |
BGF retail Co. Ltd. | | | 25 | | | | 2,557 | |
BNK Financial Group, Inc. | | | 1,143 | | | | 5,753 | |
Celltrion Healthcare Co. Ltd. | | | 372 | | | | 18,401 | |
Celltrion Pharm, Inc.* | | | 80 | | | | 3,764 | |
Celltrion, Inc. | | | 400 | | | | 44,421 | |
Cheil Worldwide, Inc. | | | 277 | | | | 4,079 | |
CJ CheilJedang Corp. | | | 29 | | | | 6,075 | |
CJ Corp. | | | 48 | | | | 2,994 | |
CJ ENM Co. Ltd.* | | | 39 | | | | 1,508 | |
CJ Logistics Corp. | | | 27 | | | | 1,518 | |
CosmoAM&T Co. Ltd.* | | | 81 | | | | 8,433 | |
Coway Co. Ltd. | | | 212 | | | | 6,784 | |
Daewoo Engineering & Construction Co. Ltd.* | | | 691 | | | | 2,016 | |
DB Insurance Co. Ltd. | | | 165 | | | | 10,735 | |
Delivery Hero SE, 144A* | | | 704 | | | | 17,992 | |
DGB Financial Group, Inc. | | | 628 | | | | 3,658 | |
DL E&C Co. Ltd. | | | 116 | | | | 2,948 | |
DL Holdings Co. Ltd. | | | 46 | | | | 1,449 | |
Dongsuh Cos., Inc. | | | 129 | | | | 1,649 | |
Doosan Bobcat, Inc. | | | 182 | | | | 5,229 | |
Doosan Enerbility Co. Ltd.* | | | 1,574 | | | | 15,683 | |
Ecopro BM Co. Ltd. | | | 166 | | | | 24,285 | |
Ecopro Co. Ltd. | | | 70 | | | | 32,345 | |
E-MART, Inc. | | | 72 | | | | 3,882 | |
F&F Co. Ltd. | | | 61 | | | | 4,229 | |
Fila Holdings Corp. | | | 204 | | | | 5,402 | |
Green Cross Corp. | | | 23 | | | | 1,639 | |
See Notes to Financial Statements.
PGIM Quant Solutions International Developed Markets Index Fund 37
Schedule of Investments (continued)
as of October 31, 2023
| | | | | | | | |
| | |
| Description | | Shares | | | Value | |
| | |
COMMON STOCKS (Continued) | | | | | | | | |
| | |
South Korea (cont’d.) | | | | | | | | |
| | |
GS Engineering & Construction Corp. | | | 233 | | | $ | 2,281 | |
GS Holdings Corp. | | | 165 | | | | 4,818 | |
GS Retail Co. Ltd. | | | 144 | | | | 2,594 | |
Hana Financial Group, Inc. | | | 1,046 | | | | 30,414 | |
Hanjin Kal Corp. | | | 117 | | | | 3,695 | |
Hankook Tire & Technology Co. Ltd. | | | 276 | | | | 7,831 | |
Hanmi Pharm Co. Ltd. | | | 28 | | | | 5,854 | |
Hanmi Science Co. Ltd. | | | 90 | | | | 2,115 | |
Hanon Systems | | | 660 | | | | 3,368 | |
Hanwha Aerospace Co. Ltd. | | | 128 | | | | 9,623 | |
Hanwha Corp. | | | 141 | | | | 2,323 | |
Hanwha Life Insurance Co. Ltd.* | | | 1,329 | | | | 2,731 | |
Hanwha Ocean Co. Ltd.* | | | 177 | | | | 3,095 | |
Hanwha Solutions Corp.* | | | 390 | | | | 8,307 | |
HD Hyundai Co. Ltd. | | | 156 | | | | 6,644 | |
HD Hyundai Heavy Industries Co. Ltd.* | | | 69 | | | | 5,232 | |
HD Hyundai Infracore Co. Ltd. | | | 420 | | | | 2,084 | |
HD Korea Shipbuilding & Offshore Engineering Co. Ltd.* | | | 161 | | | | 10,800 | |
Hite Jinro Co. Ltd. | | | 102 | | | | 1,607 | |
HL Mando Co. Ltd. | | | 122 | | | | 2,971 | |
HLB, Inc.* | | | 393 | | | | 8,468 | |
HMM Co. Ltd. | | | 1,083 | | | | 11,730 | |
Hotel Shilla Co. Ltd. | | | 115 | | | | 5,321 | |
HYBE Co. Ltd.* | | | 68 | | | | 11,075 | |
Hyundai Department Store Co. Ltd. | | | 60 | | | | 2,376 | |
Hyundai Engineering & Construction Co. Ltd. | | | 273 | | | | 6,771 | |
Hyundai Glovis Co. Ltd. | | | 68 | | | | 8,630 | |
Hyundai Marine & Fire Insurance Co. Ltd. | | | 225 | | | | 5,249 | |
Hyundai Mipo Dockyard Co. Ltd.* | | | 75 | | | | 3,865 | |
Hyundai Mobis Co. Ltd. | | | 228 | | | | 35,309 | |
Hyundai Motor Co. | | | 500 | | | | 62,992 | |
Hyundai Steel Co. | | | 282 | | | | 6,858 | |
Hyundai Wia Corp. | | | 65 | | | | 2,706 | |
Industrial Bank of Korea | | | 944 | | | | 7,813 | |
Kakao Corp. | | | 1,102 | | | | 31,061 | |
Kakao Games Corp.* | | | 149 | | | | 2,586 | |
KakaoBank Corp. | | | 791 | | | | 10,705 | |
Kakaopay Corp.* | | | 85 | | | | 2,167 | |
Kangwon Land, Inc. | | | 408 | | | | 4,443 | |
KB Financial Group, Inc. | | | 1,374 | | | | 52,375 | |
KCC Corp. | | | 15 | | | | 2,644 | |
KEPCO Plant Service & Engineering Co. Ltd. | | | 71 | | | | 1,718 | |
Kia Corp. | | | 908 | | | | 51,875 | |
Korea Aerospace Industries Ltd. | | | 265 | | | | 8,720 | |
See Notes to Financial Statements.
38
| | | | | | | | |
| | |
| Description | | Shares | | | Value | |
| | |
COMMON STOCKS (Continued) | | | | | | | | |
| | |
South Korea (cont’d.) | | | | | | | | |
| | |
Korea Electric Power Corp.* | | | 948 | | | $ | 11,866 | |
Korea Gas Corp.* | | | 107 | | | | 1,813 | |
Korea Investment Holdings Co. Ltd. | | | 141 | | | | 5,271 | |
Korea Zinc Co. Ltd. | | | 38 | | | | 13,206 | |
Korean Air Lines Co. Ltd. | | | 659 | | | | 10,027 | |
Krafton, Inc.* | | | 112 | | | | 13,634 | |
KT&G Corp. | | | 374 | | | | 23,593 | |
Kumho Petrochemical Co. Ltd. | | | 67 | | | | 6,297 | |
L&F Co. Ltd. | | | 86 | | | | 8,365 | |
LG Chem Ltd. | | | 171 | | | | 56,044 | |
LG Corp. | | | 322 | | | | 18,431 | |
LG Display Co. Ltd.* | | | 829 | | | | 7,501 | |
LG Electronics, Inc. | | | 400 | | | | 29,673 | |
LG Energy Solution Ltd.* | | | 145 | | | | 41,567 | |
LG H&H Co. Ltd. | | | 32 | | | | 7,502 | |
LG Innotek Co. Ltd. | | | 52 | | | | 8,631 | |
LG Uplus Corp. | | | 786 | | | | 5,891 | |
Lotte Chemical Corp. | | | 67 | | | | 7,276 | |
Lotte Chilsung Beverage Co. Ltd. | | | 11 | | | | 1,186 | |
Lotte Corp. | | | 108 | | | | 2,083 | |
Lotte Energy Materials Corp. | | | 68 | | | | 1,948 | |
LOTTE Fine Chemical Co. Ltd. | | | 52 | | | | 2,160 | |
Lotte Shopping Co. Ltd. | | | 46 | | | | 2,460 | |
LS Corp. | | | 61 | | | | 3,547 | |
Meritz Financial Group, Inc.* | | | 372 | | | | 13,845 | |
Mirae Asset Securities Co. Ltd. | | | 1,014 | | | | 4,967 | |
NAVER Corp. | | | 522 | | | | 72,977 | |
NCSoft Corp. | | | 56 | | | | 9,675 | |
Netmarble Corp., 144A* | | | 71 | | | | 2,038 | |
NH Investment & Securities Co. Ltd. | | | 553 | | | | 3,967 | |
NongShim Co. Ltd. | | | 11 | | | | 3,618 | |
OCI Co. Ltd.* | | | 20 | | | | 1,548 | |
OCI Holdings Co. Ltd. | | | 46 | | | | 3,324 | |
Orion Corp. | | | 81 | | | | 7,169 | |
Ottogi Corp. | | | 5 | | | | 1,387 | |
Pan Ocean Co. Ltd. | | | 732 | | | | 2,337 | |
Paradise Co. Ltd.* | | | 142 | | | | 1,545 | |
Pearl Abyss Corp.* | | | 115 | | | | 4,213 | |
POSCO Future M Co. Ltd. | | | 102 | | | | 17,975 | |
POSCO Holdings, Inc. | | | 272 | | | | 83,266 | |
Posco International Corp. | | | 167 | | | | 6,229 | |
S-1 Corp. | | | 75 | | | | 3,031 | |
Samsung Biologics Co. Ltd., 144A* | | | 64 | | | | 33,645 | |
Samsung C&T Corp. | | | 311 | | | | 24,589 | |
See Notes to Financial Statements.
PGIM Quant Solutions International Developed Markets Index Fund 39
Schedule of Investments (continued)
as of October 31, 2023
| | | | | | | | |
| | |
| Description | | Shares | | | Value | |
| | |
COMMON STOCKS (Continued) | | | | | | | | |
| | |
South Korea (cont’d.) | | | | | | | | |
| | |
Samsung Card Co. Ltd. | | | 124 | | | $ | 2,880 | |
Samsung Electro-Mechanics Co. Ltd. | | | 207 | | | | 19,139 | |
Samsung Electronics Co. Ltd. | | | 17,325 | | | | 862,350 | |
Samsung Engineering Co. Ltd.* | | | 592 | | | | 10,434 | |
Samsung Fire & Marine Insurance Co. Ltd. | | | 119 | | | | 22,755 | |
Samsung Heavy Industries Co. Ltd.* | | | 2,295 | | | | 11,634 | |
Samsung Life Insurance Co. Ltd. | | | 276 | | | | 14,777 | |
Samsung SDI Co. Ltd. | | | 191 | | | | 60,477 | |
Samsung SDS Co. Ltd. | | | 136 | | | | 13,941 | |
Samsung Securities Co. Ltd. | | | 234 | | | | 6,130 | |
SD Biosensor, Inc. | | | 136 | | | | 972 | |
Seegene, Inc. | | | 120 | | | | 1,700 | |
Shinhan Financial Group Co. Ltd. | | | 1,800 | | | | 46,268 | |
Shinsegae, Inc. | | | 26 | | | | 3,257 | |
SK Biopharmaceuticals Co. Ltd.* | | | 91 | | | | 5,093 | |
SK Bioscience Co. Ltd.* | | | 77 | | | | 3,466 | |
SK Chemicals Co. Ltd. | | | 37 | | | | 1,549 | |
SK Hynix, Inc. | | | 1,963 | | | | 170,471 | |
SK IE Technology Co. Ltd., 144A* | | | 95 | | | | 4,189 | |
SK Innovation Co. Ltd.* | | | 213 | | | | 19,405 | |
SK Networks Co. Ltd. | | | 404 | | | | 1,668 | |
SK Square Co. Ltd.* | | | 366 | | | | 11,565 | |
SK, Inc. | | | 129 | | | | 13,601 | |
SKC Co. Ltd. | | | 71 | | | | 4,152 | |
S-Oil Corp. | | | 154 | | | | 7,600 | |
Solus Advanced Materials Co. Ltd. | | | 38 | | | | 619 | |
SSANGYONG C&E Co. Ltd. | | | 309 | | | | 1,275 | |
Wemade Co. Ltd. | | | 66 | | | | 1,929 | |
Woori Financial Group, Inc. | | | 2,353 | | | | 20,783 | |
Yuhan Corp. | | | 193 | | | | 8,227 | |
| | | | | | | | |
| | |
| | | | | | | 2,668,084 | |
| | |
Spain 2.2% | | | | | | | | |
| | |
Acciona SA | | | 87 | | | | 10,968 | |
ACS Actividades de Construccion y Servicios SA | | | 807 | | | | 29,184 | |
Aena SME SA, 144A | | | 256 | | | | 37,146 | |
Amadeus IT Group SA | | | 1,641 | | | | 93,657 | |
Banco Bilbao Vizcaya Argentaria SA | | | 21,795 | | | | 171,466 | |
Banco de Sabadell SA | | | 19,190 | | | | 23,861 | |
Banco Santander SA | | | 58,385 | | | | 214,736 | |
Bankinter SA | | | 2,554 | | | | 16,150 | |
CaixaBank SA | | | 13,788 | | | | 56,056 | |
Cellnex Telecom SA, 144A | | | 2,041 | | | | 59,997 | |
Corp. ACCIONA Energias Renovables SA | | | 212 | | | | 5,742 | |
See Notes to Financial Statements.
40
| | | | | | | | |
| | |
| Description | | Shares | | | Value | |
| | |
COMMON STOCKS (Continued) | | | | | | | | |
| | |
Spain (cont’d.) | | | | | | | | |
| | |
EDP Renovaveis SA | | | 1,076 | | | $ | 17,310 | |
Enagas SA | | | 937 | | | | 15,675 | |
Endesa SA | | | 1,182 | | | | 22,239 | |
Grifols SA* | | | 1,223 | | | | 13,724 | |
Iberdrola SA | | | 21,869 | | | | 243,227 | |
Industria de Diseno Textil SA | | | 3,827 | | | | 132,100 | |
Mapfre SA | | | 3,686 | | | | 7,662 | |
Merlin Properties Socimi SA, REIT | | | 1,256 | | | | 10,472 | |
Naturgy Energy Group SA | | | 509 | | | | 14,402 | |
Redeia Corp. SA | | | 1,608 | | | | 25,077 | |
Repsol SA | | | 4,724 | | | | 69,170 | |
Telefonica SA | | | 18,393 | | | | 71,046 | |
| | | | | | | | |
| | |
| | | | | | | 1,361,067 | |
| | |
Sweden 2.6% | | | | | | | | |
| | |
Alfa Laval AB | | | 1,140 | | | | 36,944 | |
Assa Abloy AB (Class B Stock) | | | 3,543 | | | | 75,519 | |
Atlas Copco AB (Class A Stock) | | | 9,209 | | | | 119,248 | |
Atlas Copco AB (Class B Stock) | | | 5,506 | | | | 61,850 | |
Axfood AB | | | 402 | | | | 8,888 | |
Beijer Ref AB | | | 1,384 | | | | 13,157 | |
Boliden AB | | | 1,008 | | | | 25,838 | |
Castellum AB | | | 1,584 | | | | 15,181 | |
Electrolux AB (Class B Stock)* | | | 805 | | | | 6,774 | |
Epiroc AB (Class A Stock) | | | 2,307 | | | | 38,007 | |
Epiroc AB (Class B Stock) | | | 1,408 | | | | 19,550 | |
EQT AB | | | 1,533 | | | | 28,008 | |
Essity AB (Class B Stock) | | | 2,246 | | | | 51,213 | |
Evolution AB, 144A | | | 669 | | | | 59,612 | |
Fastighets AB Balder (Class B Stock)* | | | 2,331 | | | | 9,904 | |
Getinge AB (Class B Stock) | | | 841 | | | | 15,141 | |
H & M Hennes & Mauritz AB (Class B Stock) | | | 2,402 | | | | 32,270 | |
Hexagon AB (Class B Stock) | | | 7,702 | | | | 62,768 | |
Holmen AB (Class B Stock) | | | 297 | | | | 11,209 | |
Husqvarna AB (Class B Stock) | | | 1,534 | | | | 9,940 | |
Industrivarden AB (Class A Stock) | | | 481 | | | | 12,446 | |
Industrivarden AB (Class C Stock) | | | 559 | | | | 14,416 | |
Indutrade AB | | | 1,063 | | | | 18,840 | |
Investment AB Latour (Class B Stock) | | | 540 | | | | 9,352 | |
Investor AB (Class A Stock) | | | 1,771 | | | | 32,235 | |
Investor AB (Class B Stock) | | | 6,044 | | | | 110,950 | |
Kinnevik AB (Class B Stock)* | | | 896 | | | | 7,661 | |
L E Lundbergforetagen AB (Class B Stock) | | | 279 | | | | 11,394 | |
Lifco AB (Class B Stock) | | | 855 | | | | 15,645 | |
See Notes to Financial Statements.
PGIM Quant Solutions International Developed Markets Index Fund 41
Schedule of Investments (continued)
as of October 31, 2023
| | | | | | | | |
| | |
| Description | | Shares | | | Value | |
| | |
COMMON STOCKS (Continued) | | | | | | | | |
| | |
Sweden (cont’d.) | | | | | | | | |
| | |
Nibe Industrier AB (Class B Stock) | | | 5,298 | | | $ | 30,513 | |
Saab AB (Class B Stock) | | | 341 | | | | 17,518 | |
Sagax AB (Class B Stock) | | | 648 | | | | 11,731 | |
Sagax AB (Class D Stock) | | | 430 | | | | 968 | |
Sandvik AB | | | 3,924 | | | | 66,838 | |
Securitas AB (Class B Stock) | | | 1,809 | | | | 14,491 | |
Skandinaviska Enskilda Banken AB (Class A Stock) | | | 5,940 | | | | 66,287 | |
Skandinaviska Enskilda Banken AB (Class C Stock) | | | 100 | | | | 1,150 | |
Skanska AB (Class B Stock) | | | 1,301 | | | | 19,533 | |
SKF AB (Class B Stock) | | | 1,438 | | | | 23,313 | |
SSAB AB (Class A Stock) | | | 893 | | | | 5,350 | |
SSAB AB (Class B Stock) | | | 2,465 | | | | 14,301 | |
Svenska Cellulosa AB SCA (Class B Stock) | | | 2,215 | | | | 30,393 | |
Svenska Handelsbanken AB (Class A Stock) | | | 5,411 | | | | 46,133 | |
Svenska Handelsbanken AB (Class B Stock) | | | 131 | | | | 1,351 | |
Sweco AB (Class B Stock) | | | 751 | | | | 6,924 | |
Swedbank AB (Class A Stock) | | | 3,670 | | | | 60,274 | |
Swedish Orphan Biovitrum AB* | | | 658 | | | | 13,537 | |
Tele2 AB (Class B Stock) | | | 2,010 | | | | 14,274 | |
Telefonaktiebolaget LM Ericsson (Class A Stock) | | | 197 | | | | 922 | |
Telefonaktiebolaget LM Ericsson (Class B Stock) | | | 10,650 | | | | 47,709 | |
Telia Co. AB | | | 9,098 | | | | 19,287 | |
Trelleborg AB (Class B Stock) | | | 840 | | | | 21,243 | |
Volvo AB (Class A Stock) | | | 777 | | | | 15,578 | |
Volvo AB (Class B Stock) | | | 5,502 | | | | 109,023 | |
Volvo Car AB (Class B Stock)* | | | 1,999 | | | | 6,895 | |
| | | | | | | | |
| | |
| | | | | | | 1,599,496 | |
| | |
Switzerland 5.1% | | | | | | | | |
| | |
ABB Ltd. | | | 5,452 | | | | 183,175 | |
Adecco Group AG | | | 592 | | | | 22,403 | |
Alcon, Inc. | | | 1,793 | | | | 128,336 | |
Bachem Holding AG | | | 114 | | | | 8,281 | |
Baloise Holding AG | | | 141 | | | | 20,246 | |
Banque Cantonale Vaudoise | | | 108 | | | | 12,208 | |
Barry Callebaut AG | | | 13 | | | | 19,711 | |
Belimo Holding AG | | | 34 | | | | 14,315 | |
BKW AG | | | 67 | | | | 11,263 | |
Chocoladefabriken Lindt & Spruengli AG | | | 8 | | | | 88,570 | |
Cie Financiere Richemont SA (Class A Stock) | | | 1,869 | | | | 220,496 | |
Clariant AG* | | | 856 | | | | 12,162 | |
DKSH Holding AG | | | 70 | | | | 4,287 | |
DSM-Firmenich AG | | | 640 | | | | 58,020 | |
Dufry AG* | | | 295 | | | | 10,341 | |
See Notes to Financial Statements.
42
| | | | | | | | |
| | |
| Description | | Shares | | | Value | |
| | |
COMMON STOCKS (Continued) | | | | | | | | |
| | |
Switzerland (cont’d.) | | | | | | | | |
| | |
Emmi AG | | | 8 | | | $ | 7,554 | |
EMS-Chemie Holding AG | | | 28 | | | | 19,154 | |
Flughafen Zurich AG | | | 71 | | | | 13,267 | |
Geberit AG | | | 121 | | | | 56,339 | |
Georg Fischer AG | | | 305 | | | | 15,827 | |
Givaudan SA | | | 29 | | | | 96,527 | |
Helvetia Holding AG | | | 127 | | | | 17,073 | |
Julius Baer Group Ltd. | | | 777 | | | | 46,046 | |
Kuehne + Nagel International AG | | | 183 | | | | 49,348 | |
Logitech International SA | | | 581 | | | | 45,731 | |
Lonza Group AG | | | 270 | | | | 94,555 | |
Novartis AG | | | 7,578 | | | | 709,449 | |
Partners Group Holding AG | | | 80 | | | | 84,709 | |
PSP Swiss Property AG | | | 156 | | | | 19,194 | |
Sandoz Group AG* | | | 1,505 | | | | 39,128 | |
Schindler Holding AG | | | 69 | | | | 13,451 | |
Schindler Holding AG (Part. Cert.) | | | 148 | | | | 29,944 | |
SGS SA | | | 575 | | | | 46,961 | |
SIG Group AG* | | | 1,201 | | | | 26,478 | |
Sika AG | | | 490 | | | | 117,262 | |
Sonova Holding AG | | | 194 | | | | 45,981 | |
Straumann Holding AG | | | 394 | | | | 46,565 | |
Swatch Group AG (The) | | | 194 | | | | 9,396 | |
Swatch Group AG (The) (Bearer Shares) | | | 107 | | | | 27,389 | |
Swiss Life Holding AG | | | 121 | | | | 77,716 | |
Swiss Prime Site AG | | | 283 | | | | 26,304 | |
Swisscom AG | | | 98 | | | | 58,720 | |
Tecan Group AG | | | 46 | | | | 13,239 | |
Temenos AG | | | 227 | | | | 16,354 | |
UBS Group AG | | | 10,416 | | | | 244,739 | |
VAT Group AG, 144A | | | 94 | | | | 33,334 | |
Zurich Insurance Group AG | | | 541 | | | | 256,971 | |
| | | | | | | | |
| | |
| | | | | | | 3,218,519 | |
| | |
Taiwan 0.0% | | | | | | | | |
| | |
FIT Hon Teng Ltd., 144A* | | | 3,000 | | | | 402 | |
| | |
United Arab Emirates 0.0% | | | | | | | | |
| | |
NMC Health PLC*^ | | | 372 | | | | — | |
| | |
United Kingdom 9.8% | | | | | | | | |
| | |
3i Group PLC | | | 3,472 | | | | 81,861 | |
abrdn PLC | | | 7,298 | | | | 13,933 | |
See Notes to Financial Statements.
PGIM Quant Solutions International Developed Markets Index Fund 43
Schedule of Investments (continued)
as of October 31, 2023
| | | | | | | | |
| | |
| Description | | Shares | | | Value | |
| | |
COMMON STOCKS (Continued) | | | | | | | | |
| | |
United Kingdom (cont’d.) | | | | | | | | |
| | |
Admiral Group PLC | | | 1,075 | | | $ | 31,941 | |
Allfunds Group PLC | | | 1,262 | | | | 6,459 | |
Ashtead Group PLC | | | 1,590 | | | | 91,191 | |
Associated British Foods PLC | | | 1,262 | | | | 31,131 | |
AstraZeneca PLC | | | 5,403 | | | | 676,476 | |
Auto Trader Group PLC, 144A | | | 3,326 | | | | 25,159 | |
Aviva PLC | | | 10,219 | | | | 49,496 | |
B&M European Value Retail SA | | | 3,399 | | | | 21,882 | |
BAE Systems PLC | | | 11,114 | | | | 149,443 | |
Barclays PLC | | | 56,496 | | | | 90,679 | |
Barratt Developments PLC | | | 3,608 | | | | 18,196 | |
Beazley PLC | | | 2,472 | | | | 15,486 | |
Berkeley Group Holdings PLC | | | 392 | | | | 19,269 | |
BP PLC | | | 61,930 | | | | 378,146 | |
British American Tobacco PLC | | | 8,110 | | | | 242,266 | |
British Land Co. PLC (The), REIT | | | 3,488 | | | | 12,645 | |
BT Group PLC | | | 23,019 | | | | 31,615 | |
Bunzl PLC | | | 1,247 | | | | 44,488 | |
Burberry Group PLC | | | 1,393 | | | | 28,710 | |
Centrica PLC | | | 20,286 | | | | 38,834 | |
CK Hutchison Holdings Ltd. | | | 9,600 | | | | 48,598 | |
CNH Industrial NV | | | 3,543 | | | | 39,263 | |
Compass Group PLC | | | 6,353 | | | | 160,168 | |
ConvaTec Group PLC, 144A | | | 6,199 | | | | 15,404 | |
Croda International PLC | | | 513 | | | | 27,341 | |
DCC PLC | | | 374 | | | | 20,777 | |
Dechra Pharmaceuticals PLC | | | 422 | | | | 19,559 | |
Diageo PLC | | | 8,094 | | | | 306,083 | |
Dowlais Group PLC | | | 5,047 | | | | 6,145 | |
DS Smith PLC | | | 4,821 | | | | 16,722 | |
Entain PLC | | | 2,354 | | | | 26,723 | |
Halma PLC | | | 1,381 | | | | 31,056 | |
Hargreaves Lansdown PLC | | | 1,426 | | | | 12,281 | |
Hiscox Ltd. | | | 1,279 | | | | 14,604 | |
Howden Joinery Group PLC | | | 1,986 | | | | 15,424 | |
HSBC Holdings PLC | | | 72,586 | | | | 524,102 | |
IMI PLC | | | 969 | | | | 17,305 | |
Imperial Brands PLC | | | 3,347 | | | | 71,305 | |
Informa PLC | | | 5,206 | | | | 45,107 | |
InterContinental Hotels Group PLC | | | 634 | | | | 44,927 | |
Intermediate Capital Group PLC | | | 1,048 | | | | 16,685 | |
International Consolidated Airlines Group SA* | | | 4,173 | | | | 7,332 | |
Intertek Group PLC | | | 602 | | | | 28,037 | |
ITV PLC | | | 14,051 | | | | 10,941 | |
See Notes to Financial Statements.
44
| | | | | | | | |
| | |
| Description | | Shares | | | Value | |
| | |
COMMON STOCKS (Continued) | | | | | | | | |
| | |
United Kingdom (cont’d.) | | | | | | | | |
| | |
J Sainsbury PLC | | | 6,490 | | | $ | 20,306 | |
JD Sports Fashion PLC | | | 9,292 | | | | 14,448 | |
Johnson Matthey PLC | | | 674 | | | | 12,253 | |
Kingfisher PLC | | | 7,068 | | | | 18,048 | |
Land Securities Group PLC, REIT | | | 2,700 | | | | 18,716 | |
Legal & General Group PLC | | | 21,859 | | | | 56,320 | |
Lloyds Banking Group PLC | | | 236,703 | | | | 115,203 | |
London Stock Exchange Group PLC | | | 1,659 | | | | 167,385 | |
M&G PLC | | | 8,162 | | | | 19,710 | |
Melrose Industries PLC | | | 4,878 | | | | 27,774 | |
National Grid PLC | | | 13,396 | | | | 159,720 | |
NatWest Group PLC | | | 20,187 | | | | 43,923 | |
Next PLC | | | 454 | | | | 38,064 | |
Ocado Group PLC* | | | 2,227 | | | | 12,639 | |
Pearson PLC | | | 2,604 | | | | 30,143 | |
Pepco Group NV* | | | 543 | | | | 2,201 | |
Persimmon PLC | | | 1,198 | | | | 14,836 | |
Phoenix Group Holdings PLC | | | 2,767 | | | | 15,285 | |
Reckitt Benckiser Group PLC | | | 2,612 | | | | 174,761 | |
RELX PLC | | | 6,912 | | | | 241,420 | |
Renishaw PLC | | | 127 | | | | 4,772 | |
Rentokil Initial PLC | | | 9,251 | | | | 47,111 | |
Rightmove PLC | | | 3,062 | | | | 17,657 | |
Rolls-Royce Holdings PLC* | | | 30,520 | | | | 80,336 | |
RS Group PLC | | | 1,776 | | | | 14,656 | |
Sage Group PLC (The) | | | 3,800 | | | | 44,893 | |
Schroders PLC | | | 3,108 | | | | 13,996 | |
Segro PLC, REIT | | | 4,443 | | | | 38,619 | |
Severn Trent PLC | | | 1,006 | | | | 32,502 | |
Smith & Nephew PLC | | | 3,228 | | | | 36,125 | |
Smiths Group PLC | | | 1,339 | | | | 26,265 | |
Spirax-Sarco Engineering PLC | | | 271 | | | | 27,050 | |
SSE PLC | | | 3,975 | | | | 78,997 | |
St. James’s Place PLC | | | 1,996 | | | | 15,560 | |
Standard Chartered PLC | | | 8,438 | | | | 64,697 | |
Tate & Lyle PLC | | | 1,513 | | | | 11,610 | |
Taylor Wimpey PLC | | | 13,079 | | | | 17,665 | |
Tesco PLC | | | 25,839 | | | | 84,792 | |
Unilever PLC | | | 9,180 | | | | 434,771 | |
UNITE Group PLC (The), REIT | | | 1,190 | | | | 12,593 | |
United Utilities Group PLC | | | 2,545 | | | | 32,916 | |
Vodafone Group PLC | | | 79,672 | | | | 73,341 | |
Weir Group PLC (The) | | | 944 | | | | 19,607 | |
Whitbread PLC | | | 734 | | | | 29,762 | |
See Notes to Financial Statements.
PGIM Quant Solutions International Developed Markets Index Fund 45
Schedule of Investments (continued)
as of October 31, 2023
| | | | | | | | |
| | |
| Description | | Shares | | | Value | |
| | |
COMMON STOCKS (Continued) | | | | | | | | |
| | |
United Kingdom (cont’d.) | | | | | | | | |
| | |
Wise PLC (Class A Stock)* | | | 2,605 | | | $ | 21,173 | |
WPP PLC | | | 3,863 | | | | 33,265 | |
| | | | | | | | |
| | |
| | | | | | | 6,143,081 | |
| | |
United States 6.4% | | | | | | | | |
| | |
Amcor PLC, CDI | | | 5,292 | | | | 46,693 | |
CRH PLC | | | 2,641 | | | | 141,734 | |
CSL Ltd. | | | 1,756 | | | | 259,523 | |
Experian PLC | | | 3,341 | | | | 101,362 | |
Ferguson PLC | | | 747 | | | | 112,202 | |
Ferrovial SE | | | 1,893 | | | | 56,972 | |
GSK PLC | | | 14,667 | | | | 261,465 | |
Haleon PLC | | | 20,158 | | | | 80,795 | |
Holcim AG* | | | 1,857 | | | | 114,814 | |
James Hardie Industries PLC, CDI* | | | 1,621 | | | | 40,443 | |
JS Global Lifestyle Co. Ltd., 144A | | | 5,000 | | | | 787 | |
Nestle SA | | | 9,782 | | | | 1,054,879 | |
Newmont Corp., CDI* | | | 1,321 | | | | 50,622 | |
QIAGEN NV* | | | 810 | | | | 30,187 | |
Roche Holding AG | | | 2,533 | | | | 652,779 | |
Roche Holding AG (Bearer Shares) | | | 105 | | | | 28,614 | |
Samsonite International SA, 144A* | | | 4,800 | | | | 14,866 | |
Sanofi SA | | | 3,985 | | | | 361,863 | |
Schneider Electric SE | | | 1,954 | | | | 300,637 | |
Signify NV, 144A | | | 471 | | | | 12,210 | |
Sims Ltd. | | | 597 | | | | 4,759 | |
Stellantis NV | | | 7,955 | | | | 148,618 | |
Swiss Re AG | | | 1,052 | | | | 114,945 | |
Tenaris SA | | | 1,703 | | | | 26,930 | |
| | | | | | | | |
| | |
| | | | | | | 4,018,699 | |
| | | | | | | | |
TOTAL COMMON STOCKS | | | | | | | | |
(cost $48,834,516) | | | | | | | 58,039,521 | |
| | | | | | | | |
| | |
PREFERRED STOCKS 0.6% | | | | | | | | |
| | |
Germany 0.3% | | | | | | | | |
| | |
Bayerische Motoren Werke AG (PRFC) | | | 208 | | | | 17,686 | |
Fuchs Petrolub SE (PRFC) | | | 262 | | | | 10,641 | |
Henkel AG & Co. KGaA (PRFC) | | | 610 | | | | 44,003 | |
Sartorius AG (PRFC) | | | 90 | | | | 22,558 | |
See Notes to Financial Statements.
46
| | | | | | | | |
| | |
| Description | | Shares | | | Value | |
| | |
PREFERRED STOCKS (Continued) | | | | | | | | |
| | |
Germany (cont’d.) | | | | | | | | |
| | |
Sixt SE (PRFC) | | | 67 | | | $ | 3,860 | |
Volkswagen AG (PRFC) | | | 733 | | | | 77,735 | |
| | | | | | | | |
| | |
| | | | | | | 176,483 | |
| | |
South Korea 0.3% | | | | | | | | |
| | |
Amorepacific Corp. (PRFC) | | | 46 | | | | 1,246 | |
CJ CheilJedang Corp. (PRFC) | | | 4 | | | | 367 | |
Hanwha Corp. (3rd PRFC) | | | 100 | | | | 983 | |
Hyundai Motor Co. (2nd PRFC) | | | 135 | | | | 10,029 | |
Hyundai Motor Co. (PRFC) | | | 88 | | | | 6,499 | |
LG Chem Ltd. (PRFC) | | | 30 | | | | 6,266 | |
LG Electronics, Inc. (PRFC) | | | 64 | | | | 2,143 | |
LG H&H Co. Ltd. (PRFC) | | | 8 | | | | 841 | |
Mirae Asset Securities Co. Ltd. (2nd PRFC) | | | 574 | | | | 1,488 | |
Samsung Electronics Co. Ltd. (PRFC) | | | 3,002 | | | | 119,854 | |
Samsung Fire & Marine Insurance Co. Ltd. (PRFC) | | | 10 | | | | 1,370 | |
Samsung SDI Co. Ltd. (PRFC) | | | 5 | | | | 810 | |
| | | | | | | | |
| | |
| | | | | | | 151,896 | |
| | |
Spain 0.0% | | | | | | | | |
| | |
Grifols SA (Class B Stock) (PRFC)* | | | 957 | | | | 7,656 | |
| | | | | | | | |
| | |
TOTAL PREFERRED STOCKS
(cost $347,722) | | | | | | | 336,035 | |
| | | | | | | | |
| | |
UNAFFILIATED EXCHANGE-TRADED FUND 3.5% | | | | | | | | |
| | |
United States | | | | | | | | |
| | |
iShares MSCI EAFE ETF
(cost $2,243,058) | | | 33,000 | | | | 2,208,360 | |
| | | | | | | | |
| | |
TOTAL LONG-TERM INVESTMENTS
(cost $51,425,296) | | | | | | | 60,583,916 | |
| | | | | | | | |
| | |
SHORT-TERM INVESTMENTS 2.1% | | | | | | | | |
| | |
AFFILIATED MUTUAL FUND 1.8% | | | | | | | | |
PGIM Core Government Money Market Fund
(cost $1,142,230)(wb) | | | 1,142,230 | | | | 1,142,230 | |
| | | | | | | | |
See Notes to Financial Statements.
PGIM Quant Solutions International Developed Markets Index Fund 47
Schedule of Investments (continued)
as of October 31, 2023
| | | | | | | | | | | | | | | | |
| | | | |
| Description | | Interest Rate | | | Maturity Date | | | Principal Amount (000)# | | | Value | |
| | | | |
U.S. TREASURY OBLIGATION(k)(n) 0.3% | | | | | | | | | | | | | | | | |
U.S. Treasury Bills
(cost $149,058) | | | 5.330% | | | | 12/14/23 | | | | 150 | | | $ | 149,051 | |
| | | | | | | | | | | | | | | | |
| | | | |
TOTAL SHORT-TERM INVESTMENTS | | | | | | | | | | | | | | | | |
(cost $1,291,288) | | | | | | | | | | | | | | | 1,291,281 | |
| | | | | | | | | | | | | | | | |
| | | | |
TOTAL INVESTMENTS 98.9% | | | | | | | | | | | | | | | | |
(cost $52,716,584) | | | | | | | | | | | | | | | 61,875,197 | |
Other assets in excess of liabilities(z) 1.1% | | | | | | | | | | | | | | | 712,253 | |
| | | | | | | | | | | | | | | | |
| | | | |
NET ASSETS 100.0% | | | | | | | | | | | | | | $ | 62,587,450 | |
| | | | | | | | | | | | | | | | |
Below is a list of the abbreviation(s) used in the annual report:
USD—US Dollar
144A—Security was purchased pursuant to Rule 144A under the Securities Act of 1933 and, pursuant to the requirements of Rule 144A, may not be resold except to qualified institutional buyers.
ASX—Australian Securities Exchange
CDI—Chess Depository Interest
CVA—Certificate Van Aandelen (Bearer)
EAFE—Europe, Australasia, Far East
ETF—Exchange-Traded Fund
FTSE—Financial Times Stock Exchange
MSC—Morgan Stanley & Co. LLC
MSCI—Morgan Stanley Capital International
OTC—Over-the-counter
PRFC—Preference Shares
REITs—Real Estate Investment Trust
RSP—Savings Shares
SOFR—Secured Overnight Financing Rate
SPI—Share Price Index
STOXX—Stock Index of the Eurozone
TOPIX—Tokyo Stock Price Index
UTS—Unit Trust Security
| * | Non-income producing security. |
| # | Principal amount is shown in U.S. dollars unless otherwise stated. |
| ^ | Indicates a Level 3 instrument. The aggregate value of Level 3 instruments is $0 and 0.0% of net assets. |
| (k) | Represents security, or a portion thereof, segregated as collateral for centrally cleared/exchange-traded derivatives. |
| (n) | Rate shown reflects yield to maturity at purchased date. |
| (wb) | Represents an investment in a Fund affiliated with the Manager. |
| (z) | Includes net unrealized appreciation/(depreciation) and/or market value of the below holdings which are excluded from the Schedule of Investments: |
See Notes to Financial Statements.
48
Futures contracts outstanding at October 31, 2023:
| | | | | | | | | | | | | | | | | | | | |
Number of Contracts | | Type | | Expiration Date | | Current
Notional
Amount | | | Value / Unrealized Appreciation (Depreciation) | |
| | | | | |
Long Positions: | | | | | | | | | | | | | | | | | | |
1 | | ASX SPI 200 Index | | Dec. 2023 | | $ | 107,570 | | | | | | | $ | (8,231 | ) | | | | |
6 | | Euro STOXX 50 Index | | Dec. 2023 | | | 258,388 | | | | | | | | (13,626 | ) | | | | |
2 | | FTSE 100 Index | | Dec. 2023 | | | 178,136 | | | | | | | | (5,545 | ) | | | | |
10 | | Mini MSCI EAFE Index | | Dec. 2023 | | | 987,050 | | | | | | | | (65,864 | ) | | | | |
2 | | TOPIX Index | | Dec. 2023 | | | 297,411 | | | | | | | | (7,195 | ) | | | | |
| | | | | | | | | | | | | | | | | | | | |
| | | | | | |
| | | | | | | | | | | | | | $ | (100,461 | ) | | | | |
| | | | | | | | | | | | | | | | | | | | |
Summary of Collateral for Centrally Cleared/Exchange-traded Derivatives:
Cash and securities segregated as collateral, including pending settlement for closed positions, to cover requirements for centrally cleared/exchange-traded derivatives are listed by broker as follows:
| | | | | | | | | | | | |
Broker | | Cash and/or Foreign Currency | | Securities Market Value |
| | | | | | |
MSC | | | | $— | | | | | | $149,051 | | |
| | | | | | | | | | | | |
Fair Value Measurements:
Various inputs are used in determining the value of the Fund’s investments. These inputs are summarized in the three broad levels listed below.
Level 1—unadjusted quoted prices generally in active markets for identical securities.
Level 2—quoted prices for similar securities, interest rates and yield curves, prepayment speeds, foreign currency exchange rates and other observable inputs.
Level 3—unobservable inputs for securities valued in accordance with Board approved fair valuation procedures.
The following is a summary of the inputs used as of October 31, 2023 in valuing such portfolio securities:
| | | | | | | | | | | | |
| | | Level 1 | | | Level 2 | | | Level 3 |
| | | |
Investments in Securities | | | | | | | | | | | | |
Assets | | | | | | | | | | | | |
Long-Term Investments | | | | | | | | | | | | |
Common Stocks | | | | | | | | | | | | |
Australia | | $ | — | | | $ | 4,426,053 | | | | $— | |
Austria | | | 468 | | | | 148,273 | | | | — | |
Belgium | | | — | | | | 428,459 | | | | — | |
Brazil | | | — | | | | 19,862 | | | | — | |
Burkina Faso | | | — | | | | 14,112 | | | | — | |
Cambodia | | | — | | | | 2,021 | | | | — | |
Chile | | | — | | | | 20,619 | | | | — | |
China | | | — | | | | 324,628 | | | | — | |
See Notes to Financial Statements.
PGIM Quant Solutions International Developed Markets Index Fund 49
Schedule of Investments (continued)
as of October 31, 2023
| | | | | | | | | | | | |
| | | Level 1 | | | Level 2 | | | Level 3 |
| | | |
Investments in Securities (continued) | | | | | | | | | | | | |
Assets (continued) | | | | | | | | | | | | |
Long-Term Investments (continued) | | | | | | | | | | | | |
Common Stocks (continued) | | | | | | | | | | | | |
Denmark | | $ | — | | | $ | 1,732,135 | | | | $— | |
Finland | | | 6,666 | | | | 587,108 | | | | — | |
France | | | — | | | | 5,375,871 | | | | — | |
Germany | | | — | | | | 4,144,353 | | | | — | |
Hong Kong | | | — | | | | 1,188,862 | | | | — | ** |
Indonesia | | | — | | | | 3,786 | | | | — | |
Ireland | | | — | | | | 178,294 | | | | — | |
Israel | | | — | | | | 303,861 | | | | — | |
Italy | | | — | | | | 1,328,239 | | | | — | |
Japan | | | — | | | | 13,941,549 | | | | — | |
Jordan | | | — | | | | 13,624 | | | | — | |
Luxembourg | | | — | | | | 72,809 | | | | — | |
Macau | | | — | | | | 80,472 | | | | — | |
Mexico | | | — | | | | 4,866 | | | | — | |
Netherlands | | | — | | | | 2,908,653 | | | | — | |
New Zealand | | | — | | | | 189,223 | | | | — | |
Nigeria | | | — | | | | 5,534 | | | | — | |
Norway | | | — | | | | 379,214 | | | | — | |
Poland | | | — | | | | 183,375 | | | | — | |
Portugal | | | — | | | | 97,257 | | | | — | |
Russia | | | — | | | | — | | | | — | ** |
Singapore | | | — | | | | 807,842 | | | | — | |
South Africa | | | — | | | | 112,085 | | | | — | |
South Korea | | | — | | | | 2,668,084 | | | | — | |
Spain | | | — | | | | 1,361,067 | | | | — | |
Sweden | | | — | | | | 1,599,496 | | | | — | |
Switzerland | | | 39,128 | | | | 3,179,391 | | | | — | |
Taiwan | | | — | | | | 402 | | | | — | |
United Arab Emirates | | | — | | | | — | | | | — | ** |
United Kingdom | | | — | | | | 6,143,081 | | | | — | |
United States | | | 77,552 | | | | 3,941,147 | | | | — | |
Preferred Stocks | | | | | | | | | | | | |
Germany | | | — | | | | 176,483 | | | | — | |
South Korea | | | — | | | | 151,896 | | | | — | |
Spain | | | — | | | | 7,656 | | | | — | |
Unaffiliated Exchange-Traded Fund | | | | | | | | | | | | |
United States | | | 2,208,360 | | | | — | | | | — | |
Short-Term Investments | | | | | | | | | | | | |
Affiliated Mutual Fund | | | 1,142,230 | | | | — | | | | — | |
U.S. Treasury Obligation | | | — | | | | 149,051 | | | | — | |
| | | | | | | | | | | | |
| | | |
Total | | $ | 3,474,404 | | | $ | 58,400,793 | | | | $— | ** |
| | | | | | | | | | | | |
See Notes to Financial Statements.
50
| | | | | | | | | | |
| | | Level 1 | | | Level 2 | | | Level 3 |
Other Financial Instruments* | | | | | | | | | | |
Liabilities | | | | | | | | | | |
Futures Contracts | | $ | (100,461 | ) | | $ | — | | | $— |
| | | | | | | | | | |
| * | Other financial instruments are derivative instruments not reflected in the Schedule of Investments, such as futures, forwards and centrally cleared swap contracts, which are recorded at the unrealized appreciation (depreciation) on the instrument, and OTC swap contracts which are recorded at fair value. |
| ** | Includes Level 3 investments with an aggregate value of $0. |
Industry Classification:
The industry classification of investments and other assets in excess of liabilities shown as a percentage of net assets as of October 31, 2023 were as follows:
| | | | |
Banks | | | 9.0 | % |
Pharmaceuticals | | | 7.9 | |
Insurance | | | 4.8 | |
Oil, Gas & Consumable Fuels | | | 4.2 | |
Unaffiliated Exchange-Traded Fund | | | 3.5 | |
Metals & Mining | | | 3.3 | |
Automobiles | | | 3.2 | |
Semiconductors & Semiconductor Equipment | | | 3.1 | |
Chemicals | | | 3.0 | |
Food Products | | | 2.9 | |
Machinery | | | 2.9 | |
Textiles, Apparel & Luxury Goods | | | 2.5 | |
Capital Markets | | | 2.4 | |
Technology Hardware, Storage & Peripherals | | | 2.0 | |
Trading Companies & Distributors | | | 1.9 | |
Affiliated Mutual Fund | | | 1.8 | |
Personal Care Products | | | 1.7 | |
Health Care Equipment & Supplies | | | 1.7 | |
Beverages | | | 1.6 | |
Electric Utilities | | | 1.6 | |
Electrical Equipment | | | 1.6 | |
Aerospace & Defense | | | 1.6 | |
Hotels, Restaurants & Leisure | | | 1.6 | |
Diversified Telecommunication Services | | | 1.6 | |
Industrial Conglomerates | | | 1.4 | |
Electronic Equipment, Instruments & Components | | | 1.4 | |
Software | | | 1.4 | |
Professional Services | | | 1.4 | |
Consumer Staples Distribution & Retail | | | 1.2 | |
Real Estate Management & Development | | | 1.2 | |
Household Durables | | | 1.1 | |
Financial Services | | | 1.0 | |
| | | | |
Construction & Engineering | | | 0.9 | % |
Wireless Telecommunication Services | | | 0.8 | |
Building Products | | | 0.8 | |
Biotechnology | | | 0.8 | |
Automobile Components | | | 0.8 | |
Multi-Utilities | | | 0.8 | |
Broadline Retail | | | 0.8 | |
Specialty Retail | | | 0.8 | |
IT Services | | | 0.7 | |
Tobacco | | | 0.7 | |
Ground Transportation | | | 0.7 | |
Entertainment | | | 0.7 | |
Construction Materials | | | 0.6 | |
Household Products | | | 0.6 | |
Air Freight & Logistics | | | 0.5 | |
Life Sciences Tools & Services | | | 0.5 | |
Interactive Media & Services | | | 0.4 | |
Industrial REITs | | | 0.4 | |
Transportation Infrastructure | | | 0.4 | |
Media | | | 0.4 | |
Commercial Services & Supplies | | | 0.4 | |
Marine Transportation | | | 0.4 | |
Gas Utilities | | | 0.3 | |
Health Care Providers & Services | | | 0.3 | |
Retail REITs | | | 0.3 | |
Paper & Forest Products | | | 0.3 | |
Diversified REITs | | | 0.3 | |
Independent Power & Renewable Electricity Producers | | | 0.3 | |
U.S. Treasury Obligation | | | 0.3 | |
Containers & Packaging | | | 0.2 | |
Office REITs | | | 0.2 | |
See Notes to Financial Statements.
PGIM Quant Solutions International Developed Markets Index Fund 51
Schedule of Investments (continued)
as of October 31, 2023
Industry Classification (continued):
| | | | |
Communications Equipment | | | 0.2 | % |
Leisure Products | | | 0.2 | |
Passenger Airlines | | | 0.2 | |
Water Utilities | | | 0.1 | |
Diversified Consumer Services | | | 0.1 | |
Residential REITs | | | 0.1 | |
Health Care Technology | | | 0.1 | |
Consumer Finance | | | 0.0 | * |
Energy Equipment & Services | | | 0.0 | * |
Hotel & Resort REITs | | | 0.0 | * |
| | | | |
Distributors | | | 0.0 | *% |
Specialized REITs | | | 0.0 | * |
| | | | |
| |
| | | 98.9 | |
Other assets in excess of liabilities | | | 1.1 | |
| | | | |
| |
| | | 100.0 | % |
| | | | |
Effects of Derivative Instruments on the Financial Statements and Primary Underlying Risk Exposure:
The Fund invested in derivative instruments during the reporting period. The primary type of risk associated with these derivative instruments is equity risk. See the Notes to Financial Statements for additional detail regarding these derivative instruments and their risks. The effect of such derivative instruments on the Fund’s financial position and financial performance as reflected in the Statement of Assets and Liabilities and Statement of Operations is presented in the summary below.
Fair values of derivative instruments as of October 31, 2023 as presented in the Statement of Assets and Liabilities:
| | | | | | | | | | | | |
| | | Asset Derivatives | | | | Liability Derivatives | |
Derivatives not accounted for as hedging instruments, carried at fair value | | Statement of Assets and Liabilities Location | | Fair
Value | | | | Statement of Assets and Liabilities Location | | Fair
Value | |
Equity contracts | | — | | $— | | | | Due from/to broker-variation margin futures | | $ | 100,461 | * |
| | | | | | | | | | | | |
| * | Includes cumulative appreciation (depreciation) as reported in the schedule of open futures and centrally cleared swap contracts. Only unsettled variation margin receivable (payable) is reported within the Statement of Assets and Liabilities. |
The effects of derivative instruments on the Statement of Operations for the year ended October 31, 2023 are as follows:
| | | | |
| Amount of Realized Gain (Loss) on Derivatives Recognized in Income | | | |
| |
Derivatives not accounted for as hedging instruments, carried at fair value | | Futures | |
Equity contracts | | $ | 276,671 | |
| | | | |
See Notes to Financial Statements.
52
| | | | |
| Change in Unrealized Appreciation (Depreciation) on Derivatives Recognized in Income | | | |
Derivatives not accounted for as hedging instruments, carried at fair value | | Futures | |
| |
Equity contracts | | $ | (59,557 | ) |
| | | | |
For the year ended October 31, 2023, the Fund’s average volume of derivative activities is as follows:
| | |
| Derivative Contract Type | | Average Volume of Derivative Activities* |
Futures Contracts - Long Positions (1) | | $1,849,008 |
| * | Average volume is based on average quarter end balances as noted for the year ended October 31, 2023. |
| (1) | Notional Amount in USD. |
See Notes to Financial Statements.
PGIM Quant Solutions International Developed Markets Index Fund 53
Statement of Assets and Liabilities
as of October 31, 2023
| | | | | | | | |
| | |
Assets | | | | | | | | |
| | |
Investments at value: | | | | | | | | |
Unaffiliated investments (cost $51,574,354) | | | | | | $ | 60,732,967 | |
Affiliated investments (cost $1,142,230) | | | | | | | 1,142,230 | |
Foreign currency, at value (cost $651,097) | | | | | | | 643,318 | |
Tax reclaim receivable | | | | | | | 196,083 | |
Receivable for Fund shares sold | | | | | | | 157,311 | |
Dividends receivable | | | | | | | 150,594 | |
Due from Manager | | | | | | | 42,875 | |
Due from broker—variation margin futures | | | | | | | 8,812 | |
Prepaid expenses | | | | | | | 1,020 | |
| | | | | | | | |
| | |
Total Assets | | | | | | | 63,075,210 | |
| | | | | | | | |
| | |
Liabilities | | | | | | | | |
| | |
Payable for investments purchased | | | | | | | 266,896 | |
Payable for Fund shares purchased | | | | | | | 115,821 | |
Audit fee payable | | | | | | | 29,681 | |
Professional fees payable | | | | | | | 25,409 | |
Accrued expenses and other liabilities | | | | | | | 24,061 | |
Custodian and accounting fee payable | | | | | | | 19,038 | |
Shareholders’ reports fee payable | | | | | | | 5,772 | |
Trustees’ fees payable | | | | | | | 973 | |
Affiliated transfer agent fee payable | | | | | | | 109 | |
| | | | | | | | |
| | |
Total Liabilities | | | | | | | 487,760 | |
| | | | | | | | |
| | |
Net Assets | | | | | | $ | 62,587,450 | |
| | | | | | | | |
| | | | | | | | | |
| | |
Net assets were comprised of: | | | | | | | | |
Paid-in capital | | | | | | $ | 56,847,189 | |
Total distributable earnings (loss) | | | | | | | 5,740,261 | |
| | | | | | | | |
| | |
Net assets, October 31, 2023 | | | | | | $ | 62,587,450 | |
| | | | | | | | |
| | |
Class R6 | | | | | | | | |
Net asset value, offering price and redemption price per share, ($62,587,450 ÷ 5,161,580 shares of beneficial interest issued and outstanding) | | | | | | $ | 12.13 | |
| | | | | | | | |
See Notes to Financial Statements.
54
Statement of Operations
Year Ended October 31, 2023
| | | | |
Net Investment Income (Loss) | | | | |
| |
Income | | | | |
Unaffiliated dividend income (net of $238,091 foreign withholding tax) | | $ | 1,924,392 | |
Affiliated dividend income | | | 20,892 | |
Interest income | | | 7,066 | |
Affiliated income from securities lending, net | | | 1,758 | |
| | | | |
| |
Total income | | | 1,954,108 | |
| | | | |
| |
Expenses | | | | |
Management fee | | | 165,050 | |
Custodian and accounting fees | | | 104,058 | |
Pricing fees | | | 70,587 | |
Professional fees | | | 66,309 | |
Audit fee | | | 29,680 | |
Shareholders’ reports | | | 19,753 | |
Fund data services | | | 11,362 | |
Trustees’ fees | | | 10,830 | |
Commitment fees | | | 5,164 | |
Insurance expense | | | 1,383 | |
Transfer agent’s fees and expenses (including affiliated expense of $660) | | | 796 | |
Interest expense | | | 341 | |
Registration fees | | | 222 | |
Miscellaneous | | | 25,554 | |
| | | | |
| |
Total expenses | | | 511,089 | |
Less: Fee waiver and/or expense reimbursement | | | (319,565 | ) |
| | | | |
| |
Net expenses | | | 191,524 | |
| | | | |
| |
Net investment income (loss) | | | 1,762,584 | |
| | | | |
| |
Realized And Unrealized Gain (Loss) On Investment And Foreign Currency Transactions | | | | |
| |
Net realized gain (loss) on: | | | | |
Investment transactions (including affiliated of $119) | | | (698,633 | ) |
Futures transactions | | | 276,671 | |
Foreign currency transactions | | | 34,412 | |
| | | | |
| |
| | | (387,550 | ) |
| | | | |
Net change in unrealized appreciation (depreciation) on: | | | | |
Investments (including affiliated of $285) | | | 7,665,283 | |
Futures | | | (59,557 | ) |
Foreign currencies | | | 4,846 | |
| | | | |
| |
| | | 7,610,572 | |
| | | | |
| |
Net gain (loss) on investment and foreign currency transactions | | | 7,223,022 | |
| | | | |
| |
Net Increase (Decrease) In Net Assets Resulting From Operations | | $ | 8,985,606 | |
| | | | |
See Notes to Financial Statements.
PGIM Quant Solutions International Developed Markets Index Fund 55
Statements of Changes in Net Assets
| | | | | | | | |
| |
| | | Year Ended
October 31, | |
| | |
| | | 2023 | | | 2022 | |
| | |
Increase (Decrease) in Net Assets | | | | | | | | |
| | |
Operations | | | | | | | | |
Net investment income (loss) | | $ | 1,762,584 | | | $ | 1,871,461 | |
Net realized gain (loss) on investment and foreign currency transactions | | | (387,550 | ) | | | (2,487,895 | ) |
Net change in unrealized appreciation (depreciation) on investments and foreign currencies | | | 7,610,572 | | | | (18,902,484 | ) |
| | | | | | | | |
| | |
Net increase (decrease) in net assets resulting from operations | | | 8,985,606 | | | | (19,518,918 | ) |
| | | | | | | | |
| | |
Dividends and Distributions | | | | | | | | |
Distributions from distributable earnings Class R6 | | | (1,557,701 | ) | | | (2,691,266 | ) |
| | | | | | | | |
| | |
Fund share transactions | | | | | | | | |
Net proceeds from shares sold (620,905 and 1,825,257 shares, respectively) | | | 7,856,647 | | | | 23,072,500 | |
Net asset value of shares issued in reinvestment of dividends and distributions (133,023 and 192,233 shares, respectively) | | | 1,557,701 | | | | 2,691,265 | |
Cost of shares purchased (1,197,009 and 1,952,166 shares, respectively) | | | (14,905,886 | ) | | | (24,514,276 | ) |
| | | | | | | | |
| | |
Net increase (decrease) in net assets from Fund share transactions | | | (5,491,538 | ) | | | 1,249,489 | |
| | | | | | | | |
| | |
Total increase (decrease) | | | 1,936,367 | | | | (20,960,695 | ) |
| | |
Net Assets: | | | | | | | | |
| | |
Beginning of year | | | 60,651,083 | | | | 81,611,778 | |
| | | | | | | | |
| | |
End of year | | $ | 62,587,450 | | | $ | 60,651,083 | |
| | | | | | | | |
See Notes to Financial Statements.
56
Financial Highlights
| | | | | | | | | | | | | | | | | | | | |
| | | | | | | | | | | | | | | | | | | | | |
| | | Year Ended October 31, | |
| | | | | | |
| | | 2023 | | | 2022 | | | 2021 | | | 2020 | | | 2019 | |
| | | | | | |
| Per Share Operating Performance(a): | | | | | | | | | | | | | | | | | | | | |
| Net Asset Value, Beginning of Year | | | $10.82 | | | | $14.73 | | | | $11.23 | | | | $12.16 | | | | $11.36 | |
| Income (loss) from investment operations: | | | | | | | | | | | | | | | | | | | | |
| Net investment income (loss) | | | 0.34 | | | | 0.32 | | | | 0.31 | | | | 0.22 | | | | 0.32 | |
| Net realized and unrealized gain (loss) on investment and foreign currency transactions | | | 1.26 | | | | (3.76 | ) | | | 3.40 | | | | (0.82 | ) | | | 0.76 | |
| Total from investment operations | | | 1.60 | | | | (3.44 | ) | | | 3.71 | | | | (0.60 | ) | | | 1.08 | |
| Less Dividends and Distributions: | | | | | | | | | | | | | | | | | | | | |
| Dividends from net investment income | | | (0.29 | ) | | | (0.43 | ) | | | (0.21 | ) | | | (0.33 | ) | | | (0.27 | ) |
| Distributions from net realized gains | | | - | | | | (0.04 | ) | | | - | | | | - | | | | (0.01 | ) |
| Total dividends and distributions | | | (0.29 | ) | | | (0.47 | ) | | | (0.21 | ) | | | (0.33 | ) | | | (0.28 | ) |
| Net asset value, end of year | | | $12.13 | | | | $10.82 | | | | $14.73 | | | | $11.23 | | | | $12.16 | |
| Total Return(b): | | | 14.87 | % | | | (24.07 | )% | | | 33.21 | % | | | (5.21 | )% | | | 9.88 | % |
| | | | | | | | | | | | | | | | | | | | | |
| Ratios/Supplemental Data: | | | | | | | | | | | | | | | | | | | | |
| Net assets, end of year (000) | | | $62,587 | | | | $60,651 | | | | $81,612 | | | | $66,162 | | | | $50,807 | |
| Average net assets (000) | | | $66,020 | | | | $72,851 | | | | $82,645 | | | | $56,084 | | | | $45,226 | |
| Ratios to average net assets(c): | | | | | | | | | | | | | | | | | | | | |
| Expenses after waivers and/or expense reimbursement | | | 0.29 | % | | | 0.30 | % | | | 0.30 | % | | | 0.30 | % | | | 0.30 | % |
| Expenses before waivers and/or expense reimbursement | | | 0.77 | % | | | 0.70 | % | | | 0.69 | % | | | 0.95 | % | | | 1.12 | % |
| Net investment income (loss) | | | 2.67 | % | | | 2.57 | % | | | 2.16 | % | | | 1.93 | % | | | 2.83 | % |
| Portfolio turnover rate(d) | | | 8 | % | | | 26 | % | | | 23 | % | | | 13 | % | | | 13 | % |
| (a) | Calculated based on average shares outstanding during the year. |
| (b) | Total return is calculated assuming a purchase of a share on the first day and a sale on the last day of each year reported and includes reinvestment of dividends and distributions, if any. Total returns may reflect adjustments to conform to GAAP. |
| (c) | Does not include expenses of the underlying funds in which the Fund invests. |
| (d) | The Fund’s portfolio turnover rate is calculated in accordance with regulatory requirements, without regard to transactions involving short-term investments, certain derivatives and in-kind transactions (if any). If such transactions were included, the Fund’s portfolio turnover rate may be higher. |
See Notes to Financial Statements.
PGIM Quant Solutions International Developed Markets Index Fund 57
Notes to Financial Statements
Prudential Investment Portfolios 2 (the “Registered Investment Company” or “RIC”) is registered under the Investment Company Act of 1940, as amended (“1940 Act”), as an open-end management investment company. The RIC is organized as a Delaware Statutory Trust. These financial statements relate only to the PGIM Quant Solutions International Developed Markets Index Fund (the “Fund”), a series of the RIC. The Fund is classified as a diversified fund for purposes of the 1940 Act.
The investment objective of the Fund is to provide investment results that approximate the performance of the FTSE Developed Markets Ex-North America Net Index.
The Fund follows the investment company accounting and reporting guidance of the Financial Accounting Standards Board (“FASB”) Accounting Standard Codification (“ASC”) Topic 946 Financial Services —Investment Companies. The following is a summary of significant accounting policies followed by the Fund in the preparation of its financial statements. The policies conform to U.S. generally accepted accounting principles (“GAAP”). The Fund consistently follows such policies in the preparation of its financial statements.
Securities Valuation: The Fund holds securities and other assets and liabilities that are fair valued as of the close of each day (generally, 4:00 PM Eastern time) the New York Stock Exchange (“NYSE”) is open for trading. As described in further detail below, the Fund’s investments are valued daily based on a number of factors, including the type of investment and whether market quotations are readily available. The RIC’s Board of Trustees (the “Board”) has approved the Fund’s valuation policies and procedures for security valuation and designated PGIM Investments LLC (“PGIM Investments” or the “Manager”) as the “Valuation Designee,” as defined by Rule 2a-5(b) under the 1940 Act, to perform the fair value determination relating to all Fund investments. Pursuant to the Board’s oversight, the Valuation Designee has established a Valuation Committee to perform the duties and responsibilities as Valuation Designee under Rule 2a-5. The valuation procedures permit the Fund to utilize independent pricing vendor services, quotations from market makers, and alternative valuation methods when market quotations are either not readily available or not deemed representative of fair value. Fair value is the estimated price that would be received to sell an asset or paid to transfer a liability in an orderly transaction between market participants on the measurement date.
For the fiscal reporting year-end, securities and other assets and liabilities were fair valued at the close of the last U.S. business day. Trading in certain foreign securities may occur when the NYSE is closed (including weekends and holidays). Because such foreign securities
58
trade in markets that are open on weekends and U.S. holidays, the values of some of the Fund’s foreign investments may change on days when investors cannot purchase or redeem Fund shares.
Various inputs determine how the Fund’s investments are valued, all of which are categorized according to the three broad levels (Level 1, 2, or 3) detailed in the Schedule of Investments and referred to herein as the “fair value hierarchy” in accordance with FASB ASC Topic 820—Fair Value Measurement.
Common or preferred stocks, exchange-traded funds (ETFs) and derivative instruments, if applicable, that are traded on a national securities exchange are valued at the last sale price as of the close of trading on the applicable exchange where the security principally trades. Securities traded via NASDAQ are valued at the NASDAQ official closing price. To the extent these securities are valued at the last sale price or NASDAQ official closing price, they are classified as Level 1 in the fair value hierarchy. In the event that no sale or official closing price on a valuation date exists, these securities are generally valued at the mean between the last reported bid and ask prices, or at the last bid price in the absence of an ask price. These securities are classified as Level 2 in the fair value hierarchy.
Foreign equities traded on foreign securities exchanges are generally valued using pricing vendor services that provide model prices derived using adjustment factors based on information such as local closing price, relevant general and sector indices, currency fluctuations, depositary receipts, and futures, as applicable. Securities valued using such model prices are classified as Level 2 in the fair value hierarchy. The models generate an evaluated adjustment factor for each security, which is applied to the local closing price to adjust it for post closing market movements up to the time the Fund is valued. Utilizing that evaluated adjustment factor, the vendor provides an evaluated price for each security. If the vendor does not provide an evaluated price, securities are valued in accordance with exchange-traded common and preferred stock valuation policies discussed above.
Investments in open-end funds (other than ETFs) are valued at their net asset values as of the close of the NYSE on the date of valuation. These securities are classified as Level 1 in the fair value hierarchy since they may be purchased or sold at their net asset values on the date of valuation.
Fixed income securities traded in the OTC market are generally classified as Level 2 in the fair value hierarchy. Such fixed income securities are typically valued using the market approach which generally involves obtaining data from an approved independent third-party vendor source. The Fund utilizes the market approach as the primary method to value securities when market prices of identical or comparable instruments are available. The third-party vendors’ valuation techniques used to derive the evaluated bid price are based on evaluating observable inputs, including but not limited to, yield curves, yield spreads, credit ratings, deal terms, tranche level attributes, default rates, cash flows, prepayment speeds, broker/dealer quotations and reported trades. Certain Level 3 securities are also valued using the market approach when obtaining a single broker quote or when utilizing
PGIM Quant Solutions International Developed Markets Index Fund 59
Notes to Financial Statements (continued)
transaction prices for identical securities that have been used in excess of five business days. During the reporting period, there were no changes to report with respect to the valuation approach and/or valuation techniques discussed above.
Securities and other assets that cannot be priced according to the methods described above are valued based on policies and procedures approved by the Board. In the event that unobservable inputs are used when determining such valuations, the securities will be classified as Level 3 in the fair value hierarchy. Altering one or more unobservable inputs may result in a significant change to a Level 3 security’s fair value measurement.
When determining the fair value of securities, some of the factors influencing the valuation include: the nature of any restrictions on disposition of the securities; assessment of the general liquidity of the securities; the issuer’s financial condition and the markets in which it does business; the cost of the investment; the size of the holding and the capitalization of the issuer; the prices of any recent transactions or bids/offers for such securities or any comparable securities; and any available analyst media or other reports or information deemed reliable by the Valuation Designee regarding the issuer or the markets or industry in which it operates. Using fair value to price securities may result in a value that is different from a security’s most recent closing price and from the price used by other unaffiliated mutual funds to calculate their net asset values.
Foreign Currency Translation: The books and records of the Fund are maintained in U.S. dollars. Foreign currency amounts are translated into U.S. dollars on the following basis:
(i) market value of investment securities, other assets and liabilities—at the exchange rate as of the valuation date;
(ii) purchases and sales of investment securities, income and expenses—at the rates of exchange prevailing on the respective dates of such transactions.
Although the net assets of the Fund are presented at the foreign exchange rates and market values at the close of the period, the Fund does not generally isolate that portion of the results of operations arising as a result of changes in the foreign exchange rates from the fluctuations arising from changes in the market prices of long-term portfolio securities held at the end of the period. Similarly, the Fund does not isolate the effect of changes in foreign exchange rates from the fluctuations arising from changes in the market prices of long-term portfolio securities sold during the period. Accordingly, holding period unrealized and realized foreign currency gains (losses) are included in the reported net change in unrealized appreciation (depreciation) on investments and net realized gains (losses) on investment transactions on the Statements of Operations.
60
Net realized gains (losses) on foreign currency transactions represent net foreign exchange gains (losses) from the disposition of holdings of foreign currencies, currency gains (losses) realized between the trade and settlement dates on investment transactions, and the difference between the amounts of interest, dividends and foreign withholding taxes recorded on the Fund’s books and the U.S. dollar equivalent amounts actually received or paid. Net unrealized currency gains (losses) arise from valuing foreign currency denominated assets and liabilities (other than investments) at period end exchange rates.
Financial Futures Contracts: A financial futures contract is an agreement to purchase (long) or sell (short) an agreed amount of securities at a set price for delivery on a future date. Upon entering into a financial futures contract, the Fund is required to pledge to the broker an amount of cash and/or other assets equal to a certain percentage of the contract amount. This amount is known as the “initial margin.” Subsequent payments, known as “variation margin,” are made or received by the Fund each day, depending on the daily fluctuations in the value of the underlying security. Such variation margin is recorded for financial statement purposes on a daily basis as unrealized gain (loss). When the contract expires or is closed, the gain (loss) is realized and is presented in the Statement of Operations as net realized gain (loss) on futures transactions.
The Fund invested in financial futures contracts in order to hedge its existing portfolio securities, or securities the Fund intends to purchase, against fluctuations in value caused by changes in prevailing interest rates. Should interest rates move unexpectedly, the Fund may not achieve the anticipated benefits of the financial futures contracts and may realize a loss. The use of futures transactions involves the risk of imperfect correlation in movements in the price of futures contracts, interest rates and the underlying hedged assets. Since futures contracts are exchange-traded, there is minimal counterparty credit risk to the Fund since the exchanges’ clearinghouse acts as counterparty to all exchange-traded futures and guarantees the futures contracts against default.
Master Netting Arrangements: The Fund is subject to various Master Agreements, or netting arrangements, with select counterparties. These are agreements which a subadviser may have negotiated and entered into on behalf of all or a portion of the Fund. A master netting arrangement between the Fund and the counterparty permits the Fund to offset amounts payable by the Fund to the same counterparty against amounts to be received and by the receipt of collateral from the counterparty by the Fund to cover the Fund’s exposure to the counterparty. However, there is no assurance that such mitigating factors are easily enforceable. In addition to master netting arrangements, the right to set-off exists when all the conditions are met such that each of the parties owes the other determinable amounts, the reporting party has the right to set-off the amount owed with the amount owed by the other party, the reporting party intends to set-off and the right of set-off is enforceable by law.
Securities Lending: The Fund lends its portfolio securities to banks and broker-dealers. The loans are secured by collateral at least equal to the market value of the securities loaned. Collateral pledged by each borrower is invested in an affiliated money market fund and is
PGIM Quant Solutions International Developed Markets Index Fund 61
Notes to Financial Statements (continued)
marked to market daily, based on the previous day’s market value, such that the value of the collateral exceeds the value of the loaned securities. In the event of significant appreciation in value of the securities on loan on the last business day of the reporting period, the financial statements may reflect a collateral value that is less than the market value of the loaned securities. Such shortfall is remedied as described above. Loans are subject to termination at the option of the borrower or the Fund. Upon termination of the loan, the borrower will return to the Fund securities identical to the loaned securities. The remaining open loans of the securities lending transactions are considered overnight and continuous. Should the borrower of the securities fail financially, the Fund has the right to repurchase the securities in the open market using the collateral.
The Fund recognizes income, net of any rebate and securities lending agent fees, for lending its securities in the form of fees or interest on the investment of any cash received as collateral. The borrower receives all interest and dividends from the securities loaned and such payments are passed back to the lender in amounts equivalent thereto, which are reflected in interest income or unaffiliated dividend income based on the nature of the payment on the Statement of Operations. The Fund also continues to recognize any unrealized gain (loss) in the market price of the securities loaned and on the change in the value of the collateral invested that may occur during the term of the loan. In addition, realized gain (loss) is recognized on changes in the value of the collateral invested upon liquidation of the collateral. Net earnings from securities lending are disclosed in the Statement of Operations.
Securities Transactions and Net Investment Income: Securities transactions are recorded on the trade date. Realized gains (losses) from investment and currency transactions are calculated on the specific identification method. Dividend income is recorded on the ex-date, or for certain foreign securities, when the Fund becomes aware of such dividends. Interest income, including amortization of premium and accretion of discount on debt securities, as required, is recorded on the accrual basis. Expenses are recorded on an accrual basis, which may require the use of certain estimates by management that may differ from actual expense amounts.
Taxes: It is the Fund’s policy to continue to meet the requirements of the Internal Revenue Code applicable to regulated investment companies and to distribute all of its taxable net investment income and capital gains, if any, to its shareholders. Therefore, no federal income tax provision is required. Withholding taxes on foreign dividends, interest and capital gains, if any, are recorded, net of reclaimable amounts, at the time the related income is earned.
Dividends and Distributions: Dividends and distributions to shareholders, which are determined in accordance with federal income tax regulations and which may differ from
62
GAAP, are recorded on the ex-date. Permanent book/tax differences relating to income and gain (loss) are reclassified between total distributable earnings (loss) and paid-in capital, as appropriate. The chart below sets forth the expected frequency of dividend and capital gains distributions to shareholders. Various factors may impact the frequency of dividend distributions to shareholders, including but not limited to adverse market conditions or portfolio holding-specific events.
| | |
| | |
| Expected Distribution Schedule to Shareholders* | | Frequency |
Net Investment Income | | Annually |
Short-Term Capital Gains | | Annually |
Long-Term Capital Gains | | Annually |
| * | Under certain circumstances, the Fund may make more than one distribution of short-term and/or long-term capital gains during a fiscal year. |
Estimates: The preparation of financial statements requires management to make estimates and assumptions that affect the reported amounts and disclosures in the financial statements. Actual results could differ from those estimates.
The Fund has a management agreement with the Manager pursuant to which it has responsibility for all investment advisory services, including supervision of the subadviser’s performance of such services, and for rendering administrative services.
The Manager has entered into a subadvisory agreement with PGIM Quantitative Solutions LLC (“PGIM Quantitative Solutions” or the “subadviser”). The Manager pays for the services of PGIM Quantitative Solutions.
Fees payable under the management agreement are computed daily and paid monthly. For the reporting period ended October 31, 2023, the contractual and effective management fee rates were as follows:
| | |
| | |
| Contractual Management Rate | | Effective Management Fee, before any waivers
and/or expense reimbursements |
0.25% of average daily net assets. | | 0.25% |
The Manager has contractually agreed, through February 28, 2025, to limit total annual operating expenses after fee waivers and/or expense reimbursements. Prior to July 1, 2023, the Manager has contractually agreed to limit total annual operating expenses after fee waivers and/or expense reimbursements (exclusive of taxes, interest, distribution (12b-1 fees) and certain extraordinary expenses) to 0.30% of the Fund’s average daily assets on an annualized basis. This contractual waiver excludes interest, brokerage, taxes (such as income and foreign withholding taxes, stamp duty and deferred tax expenses), acquired fund fees and expenses, extraordinary expenses, and certain other Fund expenses such as dividend and interest expense and broker charges on short sales. Fees and/or expenses waived and/or reimbursed by the Manager for the purpose of preventing the expenses from
PGIM Quant Solutions International Developed Markets Index Fund 63
Notes to Financial Statements (continued)
exceeding a certain expense ratio limit may be recouped by the Manager within the same fiscal year during which such waiver and/or reimbursement is made if such recoupment can be realized without exceeding the expense limit in effect at the time of the recoupment for that fiscal year. The expense limitation attributable to class R6 is as follows:
| | |
| | |
| Class | | Expense
Limitations |
| R6 | | 0.25% |
Effective December 11, 2023, the Manager has contractually agreed to limit total annual operating expenses after fee waivers and/or expense reimbursements (exclusive of taxes, interest, distribution (12b-1 fees) and certain extraordinary expenses) to 0.19% of the Fund’s average daily net assets on an annualized basis.
The RIC, on behalf of the Fund, has a distribution agreement with Prudential Investment Management Services LLC (“PIMS”), which acts as the distributor of the Class R6 shares of the Fund. No distribution or service fees are paid to PIMS as distributor for Class R6 shares of the Fund.
PGIM, Inc., PGIM Investments, PIMS and PGIM Quantitative Solutions are indirect, wholly-owned subsidiaries of Prudential Financial, Inc. (“Prudential”).
| 4. | Other Transactions with Affiliates |
Prudential Mutual Fund Services LLC (“PMFS”), an affiliate of PGIM Investments and an indirect, wholly-owned subsidiary of Prudential, serves as the Fund’s transfer agent and shareholder servicing agent. Transfer agent’s fees and expenses in the Statement of Operations include certain out-of-pocket expenses paid to non-affiliates, where applicable.
The Fund may invest its overnight sweep cash in the PGIM Core Government Money Market Fund (the “Core Government Fund”), a series of the Prudential Government Money Market Fund, Inc., and its securities lending cash collateral in the PGIM Institutional Money Market Fund (the “Money Market Fund”), a series of Prudential Investment Portfolios 2, each registered under the 1940 Act and managed by PGIM Investments. PGIM Investments and/or its affiliates are paid fees or reimbursed for providing their services to the Core Government Fund and the Money Market Fund. In addition to the realized and unrealized gains on investments in the Core Government Fund and the Money Market Fund, earnings from such investments are disclosed on the Statement of Operations as “Affiliated dividend income” and “Affiliated income from securities lending, net”, respectively.
The Fund may enter into certain securities purchase or sale transactions under Board approved Rule 17a-7 procedures. Rule 17a-7 is an exemptive rule under the 1940 Act that,
64
subject to certain conditions, permits purchase and sale transactions among affiliated investment companies, or between an investment company and a person that is affiliated solely by reason of having a common (or affiliated) investment adviser, common directors/trustees, and/or common officers. For the year ended October 31, 2023, no Rule 17a-7 transactions were entered into by the Fund.
The aggregate cost of purchases and proceeds from sales of portfolio securities (excluding short-term investments and U.S. Government securities) for the reporting period ended October 31, 2023, were as follows:
| | |
| | |
| Cost of Purchases | | Proceeds from Sales |
$5,332,719 | | $10,687,230 |
A summary of the cost of purchases and proceeds from sales of shares of affiliated mutual funds for the year ended October 31, 2023, is presented as follows:
| | | | | | | | | | | | | | |
| | | | | | | | |
Value, Beginning of Year | | Cost of Purchases | | Proceeds from Sales | | Change in Unrealized Gain (Loss) | | Realized Gain (Loss) | | Value, End of Year | | Shares, End of Year | | Income |
|
| Short-Term Investments - Affiliated Mutual Funds: |
|
| PGIM Core Government Money Market Fund(1)(wb) |
| $ — | | $ 8,000,563 | | $ 6,858,333 | | $ — | | $ — | | $1,142,230 | | 1,142,230 | | $20,892 |
|
| PGIM Institutional Money Market Fund(1)(b)(wb) |
| 1,550,153 | | 20,496,023 | | 22,046,580 | | 285 | | 119 | | — | | — | | 1,758(2) |
|
| $1,550,153 | | $28,496,586 | | $28,904,913 | | $285 | | $119 | | $1,142,230 | | | | $22,650 |
|
| (1) | The Fund did not have any capital gain distributions during the reporting period. |
| (2) | The amount, or a portion thereof, represents the affiliated securities lending income shown on the Statement of Operations. |
| (b) | Represents security, or portion thereof, purchased with cash collateral received for securities on loan and includes dividend reinvestment. |
| (wb) | Represents an investment in a Fund affiliated with the Manager. |
| 6. | Distributions and Tax Information |
Distributions to shareholders, which are determined in accordance with federal income tax regulations and which may differ from GAAP, are recorded on the ex-date.
For the year ended October 31, 2023, the tax character of dividends paid as reflected in the Statement of Changes in Net Assets were as follows:
| | | | | | |
| | | | |
Ordinary
Income | | Long-Term Capital Gains | | Tax Return of Capital | | Total Dividends and Distributions |
$1,557,701 | | $— | | $— | | $1,557,701 |
PGIM Quant Solutions International Developed Markets Index Fund 65
Notes to Financial Statements (continued)
For the year ended October 31, 2022, the tax character of dividends paid as reflected in the Statement of Changes in Net Assets were as follows:
| | | | | | |
| | | | |
Ordinary
Income | | Long-Term Capital Gains | | Tax Return of Capital | | Total Dividends and Distributions |
$2,691,266 | | $— | | $— | | $2,691,266 |
For the year ended October 31, 2023, the Fund had the following amounts of accumulated undistributed earnings on a tax basis:
| | |
| | |
Undistributed
Ordinary
Income | | Undistributed Long-Term Capital Gains |
$1,844,839 | | $— |
The United States federal income tax basis of the Fund’s investments and the net unrealized appreciation as of October 31, 2023 were as follows:
| | | | | | |
| | | | |
| Tax Basis | | Gross
Unrealized
Appreciation | | Gross
Unrealized
Depreciation | | Net Unrealized Appreciation |
$55,438,735 | | $17,455,082 | | $(11,119,081) | | $6,336,001 |
The differences between GAAP basis and tax basis were primarily attributable to deferred losses on wash sales, investments in passive foreign investment companies, corporate spin-off adjustment, investment in partnerships and mark-to-market of futures contracts.
For federal income tax purposes, the Fund had an approximated capital loss carryforward as of October 31, 2023 which can be carried forward for an unlimited period. No capital gains distributions are expected to be paid to shareholders until net gains have been realized in excess of such losses.
| | |
| | |
Capital Loss
Carryforward | | Capital Loss Carryforward Utilized |
$2,426,000 | | $— |
The Manager has analyzed the Fund’s tax positions taken on federal, state and local income tax returns for all open tax years and has concluded that no provision for income tax is required in the Fund’s financial statements for the current reporting period. Since tax authorities can examine previously filed tax returns, the Fund’s U.S. federal and state tax returns for each of the four fiscal years up to the most recent fiscal year ended October 31, 2023 are subject to such review.
66
The Fund offers Class R6 shares. Class R6 shares are not subject to any sales or redemption charge and are available exclusively for sale to a limited group of investors.
The RIC is authorized to issue an unlimited number of shares of beneficial interest, which may be divided into an unlimited number of series of such shares.
As of October 31, 2023, Prudential, through its affiliated entities, including affiliated funds (if applicable), owned shares of the Fund as follows:
| | | | |
| | | |
| Class | | Number of Shares | | Percentage of Outstanding Shares |
R6 | | 5,137,371 | | 99.5% |
At the reporting period end, the number of shareholders holding greater than 5% of the Fund are as follows:
| | | | |
| | | |
| | | Number of Shareholders | | Percentage of Outstanding Shares |
Affiliated | | 7 | | 87.2% |
Unaffiliated | | — | | — |
The RIC, on behalf of the Fund, along with other affiliated registered investment companies (the “Participating Funds”), is a party to a Syndicated Credit Agreement (“SCA”) with a group of banks. The purpose of the SCA is to provide an alternative source of temporary funding for capital share redemptions. The table below provides details of the current SCA in effect at the reporting period-end as well as the prior SCA.
| | | | |
| | | |
| | | Current SCA | | Prior SCA |
| | |
Term of Commitment | | 9/29/2023 - 9/26/2024 | | 9/30/2022 – 9/28/2023 |
Total Commitment | | $1,200,000,000 | | $1,200,000,000 |
Annualized Commitment Fee on the Unused Portion of the SCA | | 0.15% | | 0.15% |
Annualized Interest Rate on Borrowings | | 1.00% plus the higher of (1) the effective federal funds rate, (2) the daily SOFR rate plus 0.10% or (3) zero percent | | 1.00% plus the higher of (1) the effective federal funds rate, (2) the daily SOFR rate plus 0.10% or (3) zero percent |
Certain affiliated registered investment companies that are parties to the SCA include portfolios that are subject to a predetermined mathematical formula used to manage certain benefit guarantees offered under variable annuity contracts. The formula may result in large scale asset flows into and out of these portfolios. Consequently, these portfolios may be more likely to utilize the SCA for purposes of funding redemptions. It may be possible for those portfolios to fully exhaust the committed amount of the SCA, thereby requiring the Manager to allocate available funding per a Board-approved methodology designed to treat the Participating Funds in the SCA equitably.
PGIM Quant Solutions International Developed Markets Index Fund 67
Notes to Financial Statements (continued)
The Fund utilized the SCA during the year ended October 31, 2023. The average daily balance for the 10 days that the Fund had loans outstanding during the period was approximately $221,600, borrowed at a weighted average interest rate of 5.54%. The maximum loan outstanding amount during the period was $514,000. At October 31, 2023, the Fund did not have an outstanding loan amount.
| 9. | Risks of Investing in the Fund |
The Fund’s risks include, but are not limited to, some or all of the risks discussed below. For further information on the Fund’s risks, please refer to the Fund’s Prospectus and Statement of Additional Information.
Country Risk: Changes in the business environment may adversely affect operating profits or the value of assets in a specific country. For example, financial factors such as currency controls, devaluation or regulatory changes or stability factors such as mass riots, civil war and other potential events may contribute to companies’ operational risks.
Currency Risk: The Fund’s net asset value could decline as a result of changes in exchange rates, which could adversely affect the Fund’s investments in currencies, or in securities that trade in, and receive revenues related to, currencies, or in derivatives that provide exposure to currencies. Certain foreign countries may impose restrictions on the ability of issuers of foreign securities to make payment of principal and interest or dividends to investors located outside the country, due to blockage of foreign currency exchanges or otherwise.
Economic and Market Events Risk: Events in the U.S. and global financial markets, including actions taken by the U.S. Federal Reserve or foreign central banks to stimulate or stabilize economic growth or the functioning of the securities markets, or otherwise reduce inflation, may at times result in unusually high market volatility, which could negatively impact performance. Governmental efforts to curb inflation often have negative effects on the level of economic activity. Relatively reduced liquidity in credit and fixed income markets could adversely affect issuers worldwide.
Equity and Equity-Related Securities Risk: Equity and equity-related securities may be subject to changes in value, and their values may be more volatile than those of other asset classes. In addition to an individual security losing value, the value of the equity markets or a sector in which the Fund invests could go down. Different parts of a market can react differently to adverse issuer, market, regulatory, political and economic developments.
Exchange-Traded Funds (“ETFs”) Risk: Investing in securities issued by ETFs involves risks similar to those of investing directly in the securities and other assets held by the ETF. Unlike shares of typical mutual funds, shares of ETFs are generally traded on an exchange
68
throughout a trading day and bought and sold based on market values and not at net asset value. For this reason, shares could trade at either a premium or discount to net asset value, which may be substantial during periods of market stress. The trading price of an index-based ETF is expected to (but may not) closely track the net asset value of the ETF, and the Fund will generally gain or lose value consistent with the performance of the ETF’s portfolio securities. The Fund will pay brokerage commissions in connection with the purchase and sale of shares of ETFs. In addition, the Fund will indirectly bear its pro rata share of the fees and expenses incurred by an ETF (including ETFs managed by the Manager or the subadviser(s)) in which it invests, including advisory fees (to the extent not offset by the Manager through waivers). These expenses are in addition to the advisory and other expenses that the Fund bears directly in connection with its own operations. An index-based ETF may not replicate exactly the performance of the benchmark index it seeks to track for a number of reasons, including transaction costs incurred by the ETF, the temporary unavailability of certain index securities in the secondary market or discrepancies between the ETF and the index with respect to the weighting of securities or the number of securities held. Investments in ETFs are subject to the risk that the listing exchange may halt trading of an ETF’s shares, in which case the Fund would be unable to sell its ETF shares unless and until trading is resumed.
Foreign Securities Risk: Investments in securities of non-U.S. issuers (including those denominated in U.S. dollars) may involve more risk than investing in securities of U.S. issuers. Foreign political, economic and legal systems, especially those in developing and emerging market countries, may be less stable and more volatile than in the United States. Foreign legal systems generally have fewer regulatory requirements than the U.S. legal system, particularly those of emerging markets. In general, less information is publicly available with respect to non-U.S. companies than U.S. companies. Non-U.S. companies generally are not subject to the same accounting, auditing, and financial reporting standards as are U.S. companies. Additionally, the changing value of foreign currencies and changes in exchange rates could also affect the value of the assets the Fund holds and the Fund’s performance. Certain foreign countries may impose restrictions on the ability of issuers of foreign securities to make payment of principal and interest or dividends to investors located outside the country, due to blockage of foreign currency exchanges or otherwise. Investments in emerging markets are subject to greater volatility and price declines.
In addition, the Fund’s investments in non-U.S. securities may be subject to the risks of nationalization or expropriation of assets, imposition of currency exchange controls or restrictions on the repatriation of non-U.S. currency, confiscatory taxation and adverse diplomatic developments. Special U.S. tax considerations may apply.
Fund of Funds Risk: The Fund is an investment option for other PGIM Investments-advised mutual funds that are managed as “funds of funds.” As a result, from time to time, the Fund may experience relatively large redemptions and could be required to liquidate its assets at inopportune times or at a loss or depressed value, which could cause the value of your investment to decline.
PGIM Quant Solutions International Developed Markets Index Fund 69
Notes to Financial Statements (continued)
Geographic Concentration Risk: The Fund’s performance may be closely tied to the market, economic, political, regulatory or other conditions in the countries or regions in which the Fund invests. This can result in more pronounced risks based upon conditions that impact one or more countries or regions more or less than other countries or regions.
Increase in Expenses Risk: Your actual cost of investing in the Fund may be higher than the expenses shown in the expense table in the Fund’s prospectus for a variety of reasons. For example, expense ratios may be higher than those shown if average net assets decrease. Net assets are more likely to decrease and Fund expense ratios are more likely to increase when markets are volatile. Active and frequent trading of Fund securities can increase expenses.
Index Investment Approach Risk: Since the Fund is passively managed, assets are not allocated from one stock or group of stocks to another based on their prospects, or from stocks into bonds or cash equivalents in an attempt to cushion the impact of a market decline. As a result, the Fund’s performance may be less favorable than that of a portfolio using an active investment strategy. There is no guarantee that the Fund’s investment results will have a high degree of correlation to those of the Index. The Fund’s expenses, changes in securities markets, changes in the composition of the Index, errors in index provider data, and the timing of purchases and redemptions of Fund shares, among other things, may affect the correlation between Fund and Index performance. The Fund may not perform as well as other investments if, among other things, the Index declines or performs poorly relative to other related indexes or individual securities or the securities issued by companies that comprise the Index fall out of favor with investors.
Large Capitalization Company Risk: Companies with large market capitalizations go in and out of favor based on market and economic conditions. Larger companies tend to be less volatile than companies with smaller market capitalizations. In exchange for this potentially lower risk, the Fund’s value may not rise or fall as much as the value of funds that emphasize companies with smaller market capitalizations.
Large Shareholder and Large Scale Redemption Risk: Certain individuals, accounts, funds (including funds affiliated with the Manager) or institutions, including the Manager and its affiliates, may from time to time own or control a substantial amount of the Fund’s shares. There is no requirement that these entities maintain their investment in the Fund. There is a risk that such large shareholders or that the Fund’s shareholders generally may redeem all or a substantial portion of their investments in the Fund in a short period of time, which could have a significant negative impact on the Fund’s NAV, liquidity, and brokerage costs. Large redemptions could also result in tax consequences to shareholders and impact the Fund’s ability to implement its investment strategy. The Fund’s ability to pursue its
70
investment objective after one or more large scale redemptions may be impaired and, as a result, the Fund may invest a larger portion of its assets in cash or cash equivalents.
Market Disruption and Geopolitical Risks: Market disruption can be caused by economic, financial or political events and factors, including but not limited to, international wars or conflicts (including Russia’s military invasion of Ukraine), geopolitical developments (including trading and tariff arrangements, sanctions and cybersecurity attacks), instability in regions such as Asia, Eastern Europe and the Middle East, terrorism, natural disasters and public health epidemics (including the outbreak of COVID-19 globally).
The extent and duration of such events and resulting market disruptions cannot be predicted, but could be substantial and could magnify the impact of other risks to the Fund. These and other similar events could adversely affect the U.S. and foreign financial markets and lead to increased market volatility, reduced liquidity in the securities markets, significant negative impacts on issuers and the markets for certain securities and commodities and/or government intervention. They may also cause short- or long-term economic uncertainties in the United States and worldwide. As a result, whether or not the Fund invests in securities of issuers located in or with significant exposure to the countries directly affected, the value and liquidity of the Fund’s investments may be negatively impacted. Further, due to closures of certain markets and restrictions on trading certain securities, the value of certain securities held by the Fund could be significantly impacted, which could lead to such securities being valued at zero.
Market Risk: Securities markets may be volatile and the market prices of the Fund’s securities may decline. Securities fluctuate in price based on changes in an issuer’s financial condition and overall market and economic conditions. If the market prices of the securities owned by the Fund fall, the value of your investment in the Fund will decline.
Small and Medium Sized Companies Risk: Small and medium sized companies usually offer a smaller range of products and services than larger companies. Smaller companies may also have limited financial resources and may lack management depth. As a result, their prices may fluctuate more than the stocks of larger, more established companies. Historically, small and medium sized companies have sometimes gone through extended periods when they did not perform as well as larger companies. Small and medium sized companies generally are more illiquid than larger companies, which may make such investments more difficult to sell at the time and price that the Fund would like.
Tracking Error Risk: Tracking error is the divergence of the Fund’s performance from that of the Index. Tracking error may occur because of differences between the securities and other instruments held in the Fund’s portfolio and those included in the Index, pricing differences, transaction costs, the Fund’s holding of uninvested cash, differences in timing of the accrual of distributions, tax gains or losses, changes to the Index or the need to meet various new or existing regulatory requirements. This risk may be heightened during times of increased market volatility or other unusual market conditions. Tracking error also may result because the Fund incurs fees and expenses, while the Index does not.
PGIM Quant Solutions International Developed Markets Index Fund 71
Notes to Financial Statements (continued)
| 10. | Recent Regulatory Developments |
Effective January 24, 2023, the SEC adopted rule and form amendments to require mutual funds and ETFs to transmit concise and visually engaging streamlined annual and semiannual reports to shareholders that highlight key information deemed important for retail investors to assess and monitor their fund investments (the “Rule”). Other information, including financial statements, will no longer appear in the funds’ streamlined shareholder reports but must be available online, delivered free of charge upon request, and filed on a semiannual basis on Form N-CSR. The Rule and form amendments have a compliance date of July 24, 2024. At this time, management is evaluating the Rule and its impact to the Fund.
72
Report of Independent Registered Public Accounting Firm
To the Board of Trustees of Prudential Investment Portfolios 2 and Shareholders of PGIM Quant Solutions International Developed Markets Index Fund
Opinion on the Financial Statements
We have audited the accompanying statement of assets and liabilities, including the schedule of investments, of PGIM Quant Solutions International Developed Markets Index Fund (one of the funds constituting Prudential Investment Portfolios 2, referred to hereafter as the “Fund”) as of October 31, 2023, the related statement of operations for the year ended October 31, 2023, the statements of changes in net assets for each of the two years in the period ended October 31, 2023, including the related notes, and the financial highlights for each of the four years in the period ended October 31, 2023 (collectively referred to as the “financial statements”). In our opinion, the financial statements present fairly, in all material respects, the financial position of the Fund as of October 31, 2023, the results of its operations for the year then ended, the changes in its net assets for each of the two years in the period ended October 31, 2023 and the financial highlights for each of the four years in the period ended October 31, 2023 in conformity with accounting principles generally accepted in the United States of America.
The financial statements of the Fund as of and for the year ended October 31, 2019 and the financial highlights for the period ended October 31, 2019 (not presented herein, other than the financial highlights) were audited by other auditors whose report dated December 16, 2019 expressed an unqualified opinion on those financial statements and financial highlights.
Basis for Opinion
These financial statements are the responsibility of the Fund’s management. Our responsibility is to express an opinion on the Fund’s financial statements based on our audits. We are a public accounting firm registered with the Public Company Accounting Oversight Board (United States) (PCAOB) and are required to be independent with respect to the Fund in accordance with the U.S. federal securities laws and the applicable rules and regulations of the Securities and Exchange Commission and the PCAOB.
We conducted our audits of these financial statements in accordance with the standards of the PCAOB. Those standards require that we plan and perform the audit to obtain reasonable assurance about whether the financial statements are free of material misstatement, whether due to error or fraud.
Our audits included performing procedures to assess the risks of material misstatement of the financial statements, whether due to error or fraud, and performing procedures that respond to those risks. Such procedures included examining, on a test basis, evidence regarding the amounts and disclosures in the financial statements. Our audits also included evaluating the accounting principles used and significant estimates made by management, as well as evaluating the overall presentation of the financial statements. Our procedures included confirmation of securities owned as of October 31, 2023 by correspondence with the custodian, transfer agent and brokers. We believe that our audits provide a reasonable basis for our opinion.
/s/PricewaterhouseCoopers LLP
New York, New York
December 18, 2023
We have served as the auditor of one or more investment companies in the PGIM Retail Funds complex since 2020.
PGIM Quant Solutions International Developed Markets Index Fund 73
Tax Information (unaudited)
For the year ended October 31, 2023, the Fund reports the maximum amount allowable under Section 854 of the Internal Revenue Code, but not less than, the following percentages of the ordinary income dividends paid as 1) qualified dividend income (QDI):
| | | | | |
| | |
| Fund | | QDI |
| |
PGIM Quant Solutions International Developed Markets Index Fund | | 95.09% |
For the year ended October 31, 2023, the Fund made an election to pass through the maximum amount of the portion of the ordinary income dividends paid derived from foreign source income as well as any foreign taxes paid by the Fund in accordance with Section 853 of the Internal Revenue Code of the following amounts: $157,923 foreign tax credit from recognized foreign source income of $1,841,523.
In January 2024, you will be advised on IRS Form 1099-DIV or substitute 1099-DIV, as to the federal tax status of dividends received by you in calendar year 2023.
74
INFORMATION ABOUT BOARD MEMBERS AND OFFICERS (unaudited)
Information about Board Members and Officers of the Fund is set forth below. Board Members who are not deemed to be “interested persons” of the Fund, as defined in the 1940 Act, are referred to as “Independent Board Members.” Board Members who are deemed to be “interested persons” of the Fund are referred to as “Interested Board Members.” The Board Members are responsible for the overall supervision of the operations of the Fund and perform the various duties imposed on the directors of investment companies by the 1940 Act. The Board in turn elects the Officers, who are responsible for administering the day-to-day operations of the Fund.
| | | | | | |
| | | |
| Independent Board Members | | | | |
| | | | |
Name
Year of Birth
Position(s)
Portfolios Overseen | | Principal Occupation(s) During Past Five Years | | Other Directorships Held During Past Five Years | | Length of
Board Service |
| | | | |
Ellen S. Alberding 1958 Board Member Portfolios Overseen: 100 | | Chief Executive Officer and President, The Joyce Foundation (charitable foundation) (since 2002); formerly Vice Chair, City Colleges of Chicago (community college system) (2011-2015); formerly Trustee, National Park Foundation (charitable foundation for national park system) (2009-2018); formerly Trustee, Economic Club of Chicago (2009-2016); Trustee, Loyola University (since 2018). | | None. | | Since September 2013 |
| | | | |
Kevin J. Bannon 1952 Board Member Portfolios Overseen: 101 | | Retired; formerly Managing Director (April 2008-May 2015) and Chief Investment Officer (October 2008-November 2013) of Highmount Capital LLC (registered investment adviser); formerly Executive Vice President and Chief Investment Officer (April 1993-August 2007) of Bank of New York Company; formerly President (May 2003-May 2007) of BNY Hamilton Family of Mutual Funds. | | Director of Urstadt Biddle Properties (equity real estate investment trust) (September 2008-August 2023). | | Since July 2008 |
PGIM Quant Solutions International Developed Markets Index Fund
| | | | | | |
| | | |
| Independent Board Members | | | | |
| | | | |
Name
Year of Birth
Position(s)
Portfolios Overseen | | Principal Occupation(s) During Past Five Years | | Other Directorships Held During Past Five Years | | Length of
Board Service |
| | | | |
Linda W. Bynoe 1952 Board Member Portfolios Overseen: 98 | | President and Chief Executive Officer (since March 1995) and formerly Chief Operating Officer (December 1989-February 1995) of Telemat Limited LLC (formerly Telemat Ltd) (management consulting); formerly Vice President (January 1985-June 1989) at Morgan Stanley & Co. (broker-dealer). | | Trustee of Equity Residential (residential real estate) (since December 2009); Director of Northern Trust Corporation (financial services) (since April 2006); formerly Director of Anixter International, Inc. (communication products distributor) (January 2006-June 2020). | | Since March 2005 |
| | | | |
Barry H. Evans 1960 Board Member Portfolios Overseen: 101 | | Retired; formerly President (2005-2016), Global Chief Operating Officer (2014-2016), Chief Investment Officer - Global Head of Fixed Income (1998-2014), and various portfolio manager roles (1986-2006), Manulife Asset Management (asset management). | | Formerly Director, Manulife Trust Company (2011-2018); formerly Director, Manulife Asset Management Limited (2015-2017); formerly Chairman of the Board of Directors of Manulife Asset Management U.S. (2005-2016); formerly Chairman of the Board, Declaration Investment Management and Research (2008-2016). | | Since September 2017 |
| | | | |
Keith F. Hartstein 1956 Board Member & Independent Chair Portfolios Overseen: 101 | | Retired; formerly Member (November 2014-September 2022) of the Governing Council of the Independent Directors Council (IDC) (organization of independent mutual fund directors); formerly Executive Committee of the IDC Board of Governors (October 2019-December 2021); formerly President and Chief Executive Officer (2005-2012), Senior Vice President (2004-2005), Senior Vice President of Sales and Marketing (1997-2004), and various executive management positions (1990-1997), John Hancock Funds, LLC (asset management); formerly Chairman, Investment Company Institute’s Sales Force Marketing Committee (2003-2008). | | None. | | Since September 2013 |
Visit our website at pgim.com/investments
| | | | | | |
| | | |
| Independent Board Members | | | | |
| | | | |
Name
Year of Birth
Position(s)
Portfolios Overseen | | Principal Occupation(s) During Past Five Years | | Other Directorships Held During Past Five Years | | Length of
Board Service |
| | | | |
Laurie Simon Hodrick 1962 Board Member Portfolios Overseen: 98 | | A. Barton Hepburn Professor Emerita of Economics in the Faculty of Business, Columbia Business School (since 2018); Visiting Fellow at the Hoover Institution, Stanford University (since 2015); Sole Member, ReidCourt LLC (since 2008) (a consulting firm); formerly Visiting Professor of Law, Stanford Law School (2015-2021); formerly A. Barton Hepburn Professor of Economics in the Faculty of Business, Columbia Business School (1996-2017); formerly Managing Director, Global Head of Alternative Investment Strategies, Deutsche Bank (2006-2008). | | Independent Director, Andela (since January 2022) (global talent network); Independent Director, Roku (since December 2020) (communication services); formerly Independent Director, Synnex Corporation (2019-2021) (information technology); formerly Independent Director, Kabbage, Inc. (2018-2020) (financial services); formerly Independent Director, Corporate Capital Trust (2017-2018) (a business development company). | | Since September 2017 |
| | | | |
Brian K. Reid 1961 Board Member Portfolios Overseen: 101 | | Retired; formerly Chief Economist for the Investment Company Institute (ICI) (2005-2017); formerly Senior Economist and Director of Industry and Financial Analysis at the ICI (1998-2004); formerly Senior Economist, Industry and Financial Analysis at the ICI (1996-1998); formerly Staff Economist at the Federal Reserve Board (1989-1996); formerly Director, ICI Mutual Insurance Company (2012-2017). | | None. | | Since March 2018 |
PGIM Quant Solutions International Developed Markets Index Fund
| | | | | | |
| | | |
| Independent Board Members | | | | |
| | | | |
Name
Year of Birth
Position(s)
Portfolios Overseen | | Principal Occupation(s) During Past Five Years | | Other Directorships Held During Past Five Years | | Length of
Board Service |
| | | | |
Grace C. Torres 1959 Board Member Portfolios Overseen: 101 | | Retired; formerly Treasurer and Principal Financial and Accounting Officer of the PGIM Funds, Target Funds, Advanced Series Trust, Prudential Variable Contract Accounts and The Prudential Series Fund (1998-June 2014); Assistant Treasurer (March 1999-June 2014) and Senior Vice President (September 1999-June 2014) of PGIM Investments LLC; Assistant Treasurer (May 2003-June 2014) and Vice President (June 2005-June 2014) of AST Investment Services, Inc.; Senior Vice President and Assistant Treasurer (May 2003-June 2014) of Prudential Annuities Advisory Services, Inc. | | Director (since January 2018) of OceanFirst Financial Corp. and OceanFirst Bank; formerly Director (July 2015-January 2018) of Sun Bancorp, Inc. N.A. and Sun National Bank. | | Since November 2014 |
Visit our website at pgim.com/investments
| | | | | | |
| | | |
| Independent Board Members | | | | |
| | | | |
Name
Year of Birth
Position(s)
Portfolios Overseen | | Principal Occupation(s) During Past Five Years | | Other Directorships Held During Past Five Years | | Length of
Board Service |
| | | | |
Stuart S. Parker 1962 Board Member & President
Portfolios Overseen: 101 | | President, Chief Executive Officer, Chief Operating Officer and Officer in Charge of PGIM Investments LLC (formerly known as Prudential Investments LLC) (since January 2012); President and Principal Executive Officer (‘‘PEO’’) (since December 2023) of the PGIM Credit Income Fund; President and PEO (since September 2022) of the PGIM Private Credit Fund; President and PEO (since March 2022) of the PGIM Private Real Estate Fund, Inc.; formerly Executive Vice President of Jennison Associates LLC and Head of Retail Distribution of PGIM Investments LLC (June 2005-December 2011); Investment Company Institute - Board of Governors (since May 2012). | | None. | | Since January 2012 |
| | | | |
Scott E. Benjamin 1973 Board Member & Vice President
Portfolios Overseen: 101 | | Executive Vice President (since May 2009) of PGIM Investments LLC; Vice President (since June 2012) of Prudential Investment Management Services LLC; Executive Vice President (since September 2009) of AST Investment Services, Inc.; Senior Vice President of Product Development and Marketing, PGIM Investments (since February 2006); Vice President (since December 2023) of the PGIM Credit Income Fund; Vice President (since September 2022) of the PGIM Private Credit Fund; Vice President (since March 2022) of the PGIM Private Real Estate Fund, Inc.; formerly Vice President of Product Development and Product Management, PGIM Investments LLC (2003-2006). | | None. | | Since March 2010 |
PGIM Quant Solutions International Developed Markets Index Fund
| | | | |
| | | |
| Fund Officers(a) | | | | |
| | | |
Name Year of Birth Fund Position | | Principal Occupation(s) During Past Five Years | | Length of Service as Fund Officer |
| | | |
Claudia DiGiacomo 1974 Chief Legal Officer | | Chief Legal Officer (since December 2023) of the PGIM Credit Income Fund; Chief Legal Officer (since September 2022) of the PGIM Private Credit Fund; Chief Legal Officer (since July 2022) of the PGIM Private Real Estate Fund, Inc.; Chief Legal Officer, Executive Vice President and Secretary of PGIM Investments LLC (since August 2020); Chief Legal Officer of Prudential Mutual Fund Services LLC (since August 2020); Chief Legal Officer of PIFM Holdco, LLC (since August 2020); Vice President and Corporate Counsel (since January 2005) of Prudential; and Corporate Counsel of AST Investment Services, Inc. (since August 2020); formerly Vice President and Assistant Secretary of PGIM Investments LLC (2005-2020); formerly Associate at Sidley Austin Brown & Wood LLP (1999-2004). | | Since December 2005 |
| | | |
Andrew Donohue 1972 Chief Compliance Officer | | Chief Compliance Officer (since May 2023) of the PGIM Funds, Target Funds, PGIM ETF Trust, PGIM Global High Yield Fund, Inc., PGIM High Yield Bond Fund, Inc., PGIM Short Duration High Yield Opportunities Fund, Advanced Series Trust, The Prudential Series Fund, Prudential’s Gibraltar Fund, Inc., PGIM Private Credit Fund, PGIM Private Real Estate Fund, Inc.; Chief Compliance Officer of AST Investment Services, Inc. (since October 2022); Vice President, Chief Compliance Officer of PGIM Investments LLC (since September 2022); Chief Compliance Officer (since December 2023) of the PGIM Credit Income Fund; formerly various senior compliance roles within Principal Global Investors, LLC., global asset management for Principal Financial (2011-2022), most recently as Global Chief Compliance Officer (2016-2022). | | Since May 2023 |
| | | |
Andrew R. French 1962 Secretary | | Vice President (since December 2018) of PGIM Investments LLC; Secretary (since December 2023) of the PGIM Credit Income Fund; Secretary (since September 2022) of the PGIM Private Credit Fund; Secretary (since March 2022) of the PGIM Private Real Estate Fund, Inc.; formerly Vice President and Corporate Counsel (2010-2018) of Prudential; formerly Director and Corporate Counsel (2006-2010) of Prudential; Vice President and Assistant Secretary (since January 2007) of PGIM Investments LLC; Vice President and Assistant Secretary (since January 2007) of Prudential Mutual Fund Services LLC. | | Since October 2006 |
Visit our website at pgim.com/investments
| | | | |
| | | |
| Fund Officers(a) | | | | |
| | | |
Name Year of Birth Fund Position | | Principal Occupation(s) During Past Five Years | | Length of Service as Fund Officer |
| | | |
Melissa Gonzalez 1980 Assistant Secretary | | Vice President and Corporate Counsel (since September 2018) of Prudential; Vice President and Assistant Secretary (since August 2020) of PGIM Investments LLC; Assistant Secretary (since December 2023) of the PGIM Credit Income Fund; Assistant Secretary (since September 2022) of the PGIM Private Credit Fund; Assistant Secretary (since March 2022) of the PGIM Private Real Estate Fund, Inc.; formerly Director and Corporate Counsel (March 2014-September 2018) of Prudential. | | Since March 2020 |
| | | |
Patrick E. McGuinness 1986 Assistant Secretary | | Vice President and Assistant Secretary (since August 2020) of PGIM Investments LLC; Director and Corporate Counsel (since February 2017) of Prudential; Assistant Secretary (since December 2023) of the PGIM Credit Income Fund; Assistant Secretary (since September 2022) of the PGIM Private Credit Fund; Assistant Secretary (since March 2022) of the PGIM Private Real Estate Fund, Inc. | | Since June 2020 |
| | | |
Debra Rubano 1975 Assistant Secretary | | Vice President and Corporate Counsel (since November 2020) of Prudential; Assistant Secretary (since December 2023) of the PGIM Credit Income Fund; Assistant Secretary (since September 2022) of the PGIM Private Credit Fund; Assistant Secretary (since March 2022) of the PGIM Private Real Estate Fund, Inc; formerly Director and Senior Counsel of Allianz Global Investors U.S. Holdings LLC (2010-2020) and Assistant Secretary of numerous funds in the Allianz fund complex (2015-2020). | | Since December 2020 |
| | | |
George Hoyt 1965 Assistant Secretary | | Vice President and Corporate Counsel of Prudential (since September 2023); formerly Associate General Counsel of Franklin Templeton and Secretary and Chief Legal Officer of certain funds in the Franklin Templeton complex (2020- 2023) and Managing Director (2016-2020) and Associate General Counsel for Legg Mason, Inc. and its predecessors (2004-2020). | | Since December 2023 |
| | | |
Devan Goolsby 1991 Assistant Secretary | | Vice President and Corporate Counsel of Prudential (since May 2023); formerly Associate at Eversheds Sutherland (US) LLP (2021-2023); Compliance Officer at Bloomberg LP (2019-2021); and an Examiner at the Financial Industry Regulatory Authority (2015-2019). | | Since December 2023 |
| | | |
Kelly A. Coyne 1968 Assistant Secretary | | Director, Investment Operations of Prudential Mutual Fund Services LLC (since 2010); Assistant Secretary (since December 2023) of the PGIM Credit Income Fund; Assistant Secretary (since September 2022) of the PGIM Private Credit Fund; Assistant Secretary (since March 2022) of the PGIM Private Real Estate Fund, Inc. | | Since March 2015 |
PGIM Quant Solutions International Developed Markets Index Fund
| | | | |
| |
| Fund Officers(a) |
| | | |
Name Year of Birth Fund Position | | Principal Occupation(s) During Past Five Years | | Length of Service as Fund Officer |
| | | |
Christian J. Kelly 1975 Chief Financial Officer | | Vice President, Global Head of Fund Administration of PGIM Investments LLC (since November 2018); Chief Financial Officer (since March 2023) of PGIM Investments mutual funds, closed end funds and ETFs, Advanced Series Trust Portfolios, Prudential Series Funds and Prudential Gibraltar Fund; Chief Financial Officer (since December 2023) of the PGIM Credit Income Fund; Chief Financial Officer of PGIM Private Credit Fund (since September 2022); Chief Financial Officer of PGIM Private Real Estate Fund, Inc. (since July 2022); formerly Treasurer and Principal Financial Officer (January 2019- March 2023) of PGIM Investments mutual funds, closed end funds and ETFs, Advanced Series Trust Portfolios, Prudential Series Funds and Prudential Gibraltar Fund; formerly Treasurer and Principal Financial Officer (March 2022 – July 2022) of the PGIM Private Real Estate Fund, Inc.; formerly Director of Fund Administration of Lord Abbett & Co. LLC (2009-2018), Treasurer and Principal Accounting Officer of the Lord Abbett Family of Funds (2017-2018); Director of Accounting, Avenue Capital Group (2008-2009); Senior Manager, Investment Management Practice of Deloitte & Touche LLP (1998-2007). | | Since January 2019 |
| | | |
Russ Shupak 1973 Treasurer and Principal Accounting Officer | | Vice President (since 2017) within PGIM Investments Fund Administration; Treasurer and Principal Accounting Officer of PGIM Investments mutual funds, closed end funds and ETFs (since March 2023); Treasurer and Principal Accounting Officer (since December 2023) of the PGIM Credit Income Fund; Treasurer and Principal Accounting Officer (since July 2022) of the PGIM Private Real Estate Fund, Inc.; Assistant Treasurer (since September 2022) of the PGIM Private Credit Fund; formerly Assistant Treasurer (March 2022 – July 2022) of the PGIM Private Real Estate Fund, Inc.; Assistant Treasurer of Advanced Series Trust Portfolios, Prudential Series Funds and Prudential Gibraltar Fund (since October 2019); formerly Director (2013-2017) within PGIM Investments Fund Administration. | | Since October 2019 |
| | | |
Lana Lomuti 1967 Assistant Treasurer | | Vice President (since 2007) within PGIM Investments Fund Administration; formerly Assistant Treasurer (December 2007-February 2014) of The Greater China Fund, Inc.; formerly Director (2005-2007) within PGIM Investments Fund Administration. | | Since April 2014 |
| | | |
Deborah Conway 1969 Assistant Treasurer | | Vice President (since 2017) within PGIM Investments Fund Administration; formerly Director (2007-2017) within PGIM Investments Fund Administration. | | Since October 2019 |
Visit our website at pgim.com/investments
| | | | |
| |
| Fund Officers(a) |
| | | |
Name Year of Birth Fund Position | | Principal Occupation(s) During Past Five Years | | Length of Service as Fund Officer |
| | | |
Elyse M. McLaughlin 1974
Assistant Treasurer | | Vice President (since 2017) within PGIM Investments Fund Administration; Treasurer and Principal Accounting Officer of the Advanced Series Trust, the Prudential Series Fund and the Prudential Gibraltar Fund (since March 2023); Assistant Treasurer (since December 2023) of the PGIM Credit Income Fund; Treasurer and Principal Accounting Officer (since September 2022) of the PGIM Private Credit Fund; Assistant Treasurer (since March 2022) of the PGIM Private Real Estate Fund, Inc.; Assistant Treasurer of PGIM Investments mutual funds, closed end funds and ETFs (since October 2019); formerly Director (2011-2017) within PGIM Investments Fund Administration. | | Since October 2019 |
| | | |
Robert W. McCormack 1973
Assistant Treasurer | | Vice President (since 2019) within PGIM Investments Fund Administration; Assistant Treasurer (since March 2023) of PGIM Investments mutual funds, closed end funds, ETFs, Advanced Series Trust Portfolios, Prudential Series Funds and Prudential Gibraltar Fund; Assistant Treasurer (since December 2023) of the PGIM Credit Income Fund; Assistant Treasurer (since September 2022) of the PGIM Private Credit Fund; Assistant Treasurer (since March 2022) of the PGIM Private Real Estate Fund, Inc.; formerly Director (2016-2019) within PGIM Investments Fund Administration; formerly Vice President within Goldman, Sachs & Co. Investment Management Controllers (2008-2016), Assistant Treasurer of Goldman Sachs Family of Funds (2015-2016). | | Since March 2023 |
| | | |
Kelly Florio 1978
Anti-Money Laundering Compliance Officer | | Vice President, Corporate Compliance, Global Compliance Programs and Compliance Risk Management (since December 2021) of Prudential; formerly Head of Fraud Risk Management (October 2019-December 2021) at New York Life Insurance Company; formerly Head of Key Risk Area Operations (November 2018-October 2019), Director of the US Anti-Money Laundering Compliance Unit (2009-2018) and Bank Loss Prevention Associate (2006-2009) at MetLife. | | Since June 2022 |
(a) Excludes Mr. Parker and Mr. Benjamin, interested Board Members who also serve as President and Vice President, respectively.
Explanatory Notes to Tables:
| ∎ | | Board Members are deemed to be “Interested,” as defined in the 1940 Act, by reason of their affiliation with PGIM Investments LLC and/or an affiliate of PGIM Investments LLC. |
| ∎ | | Unless otherwise noted, the address of all Board Members and Officers is c/o PGIM Investments LLC, 655 Broad Street, Newark, New Jersey 07102-4410. |
| ∎ | | There is no set term of office for Board Members or Officers. The Board Members have adopted a retirement policy, which calls for the retirement of Board Members on December 31 of the year in which they reach the age of 75. |
| ∎ | | “Other Directorships Held” includes all directorships of companies required to register or file reports with the SEC under the 1934 Act (that is, “public companies”) or other investment companies registered under the 1940 Act. |
PGIM Quant Solutions International Developed Markets Index Fund
| ∎ | | “Portfolios Overseen” includes such applicable investment companies managed by PGIM Investments LLC and overseen by the Board Member. The investment companies for which PGIM Investments LLC serves as manager include the PGIM Mutual Funds, Target Funds, PGIM ETF Trust, PGIM Private Real Estate Fund, Inc., PGIM Private Credit Fund, PGIM Credit Income Fund, PGIM High Yield Bond Fund, Inc., PGIM Global High Yield Fund, Inc., PGIM Short Duration High Yield Opportunities Fund, The Prudential Series Fund, Prudential’s Gibraltar Fund, Inc. and the Advanced Series Trust. |
| ∎ | | As used in the Fund Officers table “Prudential” means The Prudential Insurance Company of America. |
Visit our website at pgim.com/investments
Approval of Advisory Agreements (unaudited)
The Fund’s Board of Trustees
The Board of Trustees (the “Board”) of PGIM Quant Solutions International Developed Markets Index Fund (the “Fund”)1 consists of ten individuals, eight of whom are not “interested persons” of the Fund, as defined in the Investment Company Act of 1940, as amended (the “1940 Act”) (the “Independent Trustees”). The Board is responsible for the oversight of the Fund and its operations, and performs the various duties imposed on the directors of investment companies by the 1940 Act. The Independent Trustees have retained independent legal counsel to assist them in connection with their duties. The Chair of the Board is an Independent Trustee. The Board has established five standing committees: the Audit Committee, the Nominating and Governance Committee, the Compliance Committee and two Investment Committees. Each committee is chaired by, and composed of, Independent Trustees.
Annual Approval of the Fund’s Advisory Agreements
As required under the 1940 Act, the Board determines annually whether to renew the Fund’s management agreement with PGIM Investments LLC (“PGIM Investments”) and the Fund’s subadvisory agreement with PGIM Quantitative Solutions LLC (“PGIM Quantitative Solutions”). In considering the renewal of the agreements, the Board, including all of the Independent Trustees, met on May 25 and June 6-8, 2023 (the “Board Meeting”) and approved the renewal of the agreements through July 31, 2024, after concluding that the renewal of the agreements was in the best interests of the Fund and its shareholders.
In advance of the meetings, the Board requested and received materials relating to the agreements, and had the opportunity to ask questions and request further information in connection with its consideration. Among other things, the Board considered comparative fee information from PGIM Investments and PGIM Quantitative Solutions. Also, the Board considered comparisons with other mutual funds in relevant Peer Universes and Peer Groups, as is further discussed below.
In approving the agreements, the Board, including the Independent Trustees advised by independent legal counsel, considered the factors it deemed relevant, including the nature, quality and extent of services provided by PGIM Investments and the subadviser, the performance of the Fund, the profitability of PGIM Investments and its affiliates, expenses and fees, and the potential for economies of scale that may be shared with the Fund and its shareholders as the Fund’s assets grow. In their deliberations, the Trustees did not identify any single factor which alone was responsible for the Board’s decision to approve the agreements with respect to the Fund. In connection with its deliberations, the Board considered information provided by PGIM Investments throughout the year at regular Board meetings, presentations from portfolio managers and other information, as well as information furnished at or in advance of the Board Meeting.
1PGIM Quant Solutions International Developed Markets Index Fund is a series of Prudential Investment Portfolios 2.
PGIM Quant Solutions International Developed Markets Index Fund
Approval of Advisory Agreements (continued)
The Trustees determined that the overall arrangements between the Fund and PGIM Investments, which serves as the Fund’s investment manager pursuant to a management agreement, and between PGIM Investments and PGIM Quantitative Solutions, which serves as the Fund’s subadviser pursuant to the terms of a subadvisory agreement with PGIM Investments, are in the best interests of the Fund and its shareholders in light of the services performed, fees charged and such other matters as the Trustees considered relevant in the exercise of their business judgment.
The material factors and conclusions that formed the basis for the Trustees’ reaching their determinations to approve the continuance of the agreements are separately discussed below.
Nature, Quality and Extent of Services
The Board received and considered information regarding the nature, quality and extent of services provided to the Fund by PGIM Investments and PGIM Quantitative Solutions. The Board noted that PGIM Quantitative Solutions is affiliated with PGIM Investments. The Board considered the services provided by PGIM Investments, including but not limited to the oversight of the subadviser for the Fund, as well as the provision of fund recordkeeping, compliance and other services to the Fund, and PGIM Investments’ role as administrator for the Fund’s liquidity risk management program. With respect to PGIM Investments’ oversight of the subadviser, the Board noted that PGIM Investments’ Strategic Investment Research Group (“SIRG”), which is a business unit of PGIM Investments, is responsible for monitoring and reporting to PGIM Investments’ senior management on the performance and operations of the subadviser. The Board also considered that PGIM Investments pays the salaries of all of the officers and interested Trustees of the Fund who are part of Fund management. The Board also considered the investment subadvisory services provided by PGIM Quantitative Solutions, including investment research and security selection, as well as adherence to the Fund’s investment restrictions and compliance with applicable Fund policies and procedures. The Board considered PGIM Investments’ evaluation of the subadviser, as well as PGIM Investments’ recommendation, based on its review of the subadviser, to renew the subadvisory agreement.
The Board considered the qualifications, backgrounds and responsibilities of PGIM Investments’ senior management responsible for the oversight of the Fund and PGIM Quantitative Solutions, and also considered the qualifications, backgrounds and responsibilities of the PGIM Quantitative Solutions portfolio managers who are responsible for the day-to-day management of the Fund’s portfolio. The Board was provided with information pertaining to PGIM Investments’ and PGIM Quantitative Solutions’ organizational structure, senior management, investment operations, and other relevant information pertaining to PGIM Investments and PGIM Quantitative Solutions. The Board also noted that it received favorable compliance reports from the Fund’s Chief Compliance Officer (“CCO”) as to PGIM Investments and PGIM Quantitative Solutions.
Visit our website at pgim.com/investments
The Board concluded that it was satisfied with the nature, extent and quality of the investment management services provided by PGIM Investments and the subadvisory services provided to the Fund by PGIM Quantitative Solutions, and that there was a reasonable basis on which to conclude that the Fund benefits from the services provided by PGIM Investments and PGIM Quantitative Solutions under the management and subadvisory agreements.
Costs of Services and Profits Realized by PGIM Investments
The Board was provided with information on the profitability of PGIM Investments and its affiliates in serving as the Fund’s investment manager. The Board discussed with PGIM Investments the methodology utilized in assembling the information regarding profitability and considered its reasonableness. The Board recognized that it is difficult to make comparisons of profitability from fund management contracts because comparative information is not generally publicly available and is affected by numerous factors, including the structure of the particular adviser, the types of funds it manages, its business mix, numerous assumptions regarding allocations and the adviser’s capital structure and cost of capital. However, the Board considered that the cost of services provided by PGIM Investments to the Fund during the year ended December 31, 2022 exceeded the management fees paid by the Fund, resulting in an operating loss to PGIM Investments. Taking these factors into account, the Board concluded that the profitability of PGIM Investments and its affiliates in relation to the services rendered was not unreasonable.
Economies of Scale
The Board received and discussed information concerning economies of scale that PGIM Investments may realize as the Fund’s assets grow beyond current levels. During the course of time, the Board has considered information regarding the launch date of the Fund, the management fees of the Fund compared to those of similarly managed funds and PGIM Investments’ investment in the Fund over time. The Board noted that, while the management fee schedule for the Fund does not have breakpoints in its management fees, economies of scale can be shared with the Fund in other ways, including low management fees from inception, additional technological and personnel investments to enhance shareholder services, and maintaining existing expense structures in the face of a rising cost environment. The Board also considered PGIM Investments’ assertion that it continually evaluates the management fee schedule of the Fund and the potential to share economies of scale through breakpoints or fee waivers as asset levels increase.
The Board recognized the inherent limitations of any analysis of economies of scale, stemming largely from the Board’s understanding that most of PGIM Investments’ costs are not specific to individual funds, but rather are incurred across a variety of products and services.
PGIM Quant Solutions International Developed Markets Index Fund
Approval of Advisory Agreements (continued)
Other Benefits to PGIM Investments and PGIM Quantitative Solutions
The Board considered potential ancillary benefits that might be received by PGIM Investments, PGIM Quantitative Solutions and their affiliates as a result of their relationship with the Fund. The Board concluded that potential benefits to be derived by PGIM Investments included transfer agency fees received by the Fund’s transfer agent (which is affiliated with PGIM Investments), and benefits to its reputation as well as other intangible benefits resulting from PGIM Investments’ association with the Fund. The Board concluded that the potential benefits to be derived by PGIM Quantitative Solutions included its ability to use soft dollar credits, as well as the potential benefits consistent with those generally resulting from an increase in assets under management, specifically, potential access to additional research resources and benefits to its reputation. The Board concluded that the benefits derived by PGIM Investments and PGIM Quantitative Solutions were consistent with the types of benefits generally derived by investment managers and subadvisers to mutual funds.
Performance of the Fund / Fees and Expenses
The Board considered certain additional factors and made related conclusions relating to the historical performance of the Fund for the for the one-year and the three-year periods ended December 31, 2022. The Board considered that the Fund commenced operations on November 17, 2016 and that longer-term performance was not yet available.
The Board also considered the Fund’s actual management fee, as well as the Fund’s net total expense ratio, for the fiscal year ended October 31, 2022. The Board considered the management fee for the Fund as compared to the management fee charged by PGIM Investments to other funds and the fee charged by other advisers to comparable mutual funds in a Peer Group. The actual management fee represents the fee rate actually paid by Fund shareholders and includes any fee waivers or reimbursements. The net total expense ratio for the Fund represents the actual expense ratio incurred by Fund shareholders.
The mutual funds included in the Peer Universe, which was used to consider performance, and the Peer Group, which was used to consider expenses and fees, were objectively determined by Broadridge, an independent provider of mutual fund data. In certain circumstances, PGIM Investments also provided supplemental Peer Universe or Peer Group information for reasons addressed with the Board. The comparisons placed the Fund in various quartiles over various periods, with the first quartile being the best 25% of the mutual funds (for performance, the best performing mutual funds and, for expenses, the lowest cost mutual funds).
The section below summarizes key factors considered by the Board and the Board’s conclusions regarding the Fund’s performance, fees and overall expenses. The table sets forth net performance comparisons (which reflect the impact on performance of fund expenses, or any subsidies, expense caps or waivers that may be applicable) with the Peer Universe, actual management fees with the Peer Group (which reflect the
Visit our website at pgim.com/investments
impact of any subsidies or fee waivers), and net total expenses with the Peer Group, each of which were key factors considered by the Board.
| | | | | | | | |
| Net Performance | | 1 Year | | 3 Years | | 5 Years | | 10 Years |
| | 3rd Quartile | | 2nd Quartile | | 2nd Quartile | | N/A |
Actual Management Fees: 1st Quartile | | | | |
Net Total Expenses: 4th Quartile | | | | |
| · | | The Board noted that the Fund outperformed its benchmark index over the one- and five-year periods, and underperformed its benchmark index over the three-year period. |
| · | | The Board noted that the Fund’s performance is consistent with the Fund’s objective and exhibits a similar composition and high correlation to the Fund’s benchmark index, the FTSE Developed Markets Ex-North America Net Index, minus expenses. |
| · | | The Board further considered that the Fund outperformed its benchmark index and peer group average for the year-to-date and one-year periods ended March 31, 2023. |
| · | | The Board and PGIM Investments agreed to a contractual cap on Fund expenses that (exclusive of certain fees and expenses) caps total annual operating expenses for Class R6 shares at 0.25% through February 28, 2025. |
| · | | The Board concluded that, in light of the above, it would be in the best interests of the Fund and its shareholders to continue to allow the Fund to create a longer-term performance record, and to renew the agreements. |
| · | | The Board concluded that the management fees (including subadvisory fees) and total expenses were reasonable in light of the services provided. |
* * *
After full consideration of these factors, the Board concluded that the approval of the agreements was in the best interests of the Fund and its shareholders.
PGIM Quant Solutions International Developed Markets Index Fund
| | | | |
| ∎ MAIL | | ∎ TELEPHONE | | ∎ WEBSITE |
655 Broad Street Newark, NJ 07102 | | (800) 225-1852 | | pgim.com/investments |
| | | | |
PROXY VOTING The Board of Trustees of the Fund has delegated to the Fund’s subadviser the responsibility for voting any proxies and maintaining proxy recordkeeping
with respect to the Fund. A description of these proxy voting policies and procedures is available without charge, upon request, by calling (800) 225-
1852 or by visiting the Securities and Exchange Commission’s website at sec.gov. Information regarding how the Fund voted proxies relating to portfolio
securities during the most recent 12-month period ended June 30 is available on the Fund’s website and on the Securities and Exchange Commission’s
website. |
| | | | |
TRUSTEES Ellen S. Alberding · Kevin J. Bannon · Scott E. Benjamin · Linda W. Bynoe · Barry H. Evans · Keith F. Hartstein · Laurie Simon Hodrick ·
Stuart S. Parker · Brian K. Reid · Grace C. Torres |
|
OFFICERS Stuart S. Parker, President · Scott E. Benjamin, Vice President · Christian J. Kelly, Chief Financial Officer · Claudia DiGiacomo, Chief Legal Officer · Andrew Donohue, Chief Compliance Officer · Russ Shupak, Treasurer and Principal Accounting Officer · Kelly Florio, Anti-Money Laundering Compliance Officer · Andrew R. French, Secretary · Melissa Gonzalez, Assistant Secretary · Kelly A. Coyne, Assistant Secretary · Patrick E. McGuinness, Assistant Secretary · Debra Rubano, Assistant Secretary · George Hoyt, Assistant Secretary · Devan Goolsby, Assistant Secretary · Lana Lomuti, Assistant Treasurer · Elyse M. McLaughlin, Assistant Treasurer · Deborah Conway, Assistant Treasurer · Robert W. McCormack, Assistant Treasurer |
| | | | |
| | |
| MANAGER | | PGIM Investments LLC | | 655 Broad Street Newark, NJ 07102 |
| | |
| SUBADVISER | | PGIM Quantitative Solutions LLC | | 655 Broad Street 16th Floor Newark, NJ 07102 |
| | |
| DISTRIBUTOR | | Prudential Investment Management Services LLC | | 655 Broad Street Newark, NJ 07102 |
| | |
| CUSTODIAN | | The Bank of New York Mellon | | 240 Greenwich Street New York, NY 10286 |
| | |
| TRANSFER AGENT | | Prudential Mutual Fund Services LLC | | PO Box 534432 Pittsburgh, PA 15253 |
| | |
| INDEPENDENT REGISTERED PUBLIC ACCOUNTING FIRM | | PricewaterhouseCoopers LLP | | 300 Madison Avenue New York, NY 10017 |
| | |
| FUND COUNSEL | | Willkie Farr & Gallagher LLP | | 787 Seventh Avenue New York, NY 10019 |
|
An investor should consider the investment objectives, risks, charges, and expenses of the Fund carefully before investing. The prospectus
and summary prospectus contain this and other information about the Fund. An investor may obtain the prospectus and summary
prospectus by visiting our website at pgim.com/investments or by calling (800) 225-1852. The prospectus and summary prospectus should be
read carefully before investing. |
|
E-DELIVERY To receive your mutual fund documents online, go to pgim.com/investments/resource/edelivery and enroll. Instead of receiving printed documents by mail, you will receive notification via email when new materials are available. You can cancel your enrollment or change your email address at any time by visiting the website address above. |
|
SHAREHOLDER COMMUNICATIONS WITH TRUSTEES Shareholders can communicate directly with the Board of Trustees by writing to the Chair of the Board, PGIM Quant Solutions International Developed Markets Index Fund, PGIM Investments, Attn: Board of Trustees, 655 Broad Street, Newark, NJ 07102. Shareholders can communicate directly with an individual Trustee by writing to that Trustee at the same address. Communications are not screened before being delivered to the addressee. |
|
AVAILABILITY OF PORTFOLIO HOLDINGS The Fund files its complete schedule of portfolio holdings with the Securities and Exchange Commission for the first and third quarters of each fiscal year as an exhibit to its reports on Form N-PORT. The Fund’s Form N-PORT filings are available on the Commission’s website at sec.gov. |
|
| The Fund’s Statement of Additional Information contains additional information about the Fund’s Trustees and is available without charge, upon request, by calling (800) 225-1852. |
Mutual Funds:
| | | | |
ARE NOT INSURED BY THE FDIC OR ANY FEDERAL GOVERNMENT AGENCY | | MAY LOSE VALUE | | ARE NOT A DEPOSIT OF OR GUARANTEED BY ANY BANK OR ANY BANK AFFILIATE |

PGIM QUANT SOLUTIONS INTERNATIONAL DEVELOPED MARKETS INDEX FUND
| | | | |
| | |
SHARE CLASS | | R6 | | |
| | |
NASDAQ | | PQDMX | | |
| | |
CUSIP | | 74440E607 | | |
MF243E
Item 2 – Code of Ethics — See Exhibit (a)
As of the end of the period covered by this report, the registrant has adopted a code of ethics (the “Section 406 Standards for Investment Companies – Ethical Standards for Principal Executive and Financial Officers”) that applies to the registrant’s Principal Executive Officer and Principal Financial Officer; the registrant’s Principal Financial Officer also serves as the Principal Accounting Officer.
The registrant hereby undertakes to provide any person, without charge, upon request, a copy of the code of ethics. To request a copy of the code of ethics, contact the registrant 800-225-1852, and ask for a copy of the Section 406 Standards for Investment Companies - Ethical Standards for Principal Executive and Financial Officers.
Item 3 – Audit Committee Financial Expert –
The registrant’s Board has determined that Ms. Grace C. Torres, member of the Board’s Audit Committee is an “audit committee financial expert,” and that she is “independent,” for purposes of this item.
Item 4 – Principal Accountant Fees and Services –
(a) Audit Fees
For the fiscal years ended October 31, 2023 and October 31, 2022, PricewaterhouseCoopers LLP (“PwC”), the Registrant’s principal accountant, billed the Registrant $59,360 and $64,600, respectively, for professional services rendered for the audit of the Registrant’s annual financial statements or services that are normally provided in connection with statutory and regulatory filings.
(b) Audit-Related Fees
For the fiscal years ended October 31, 2023 and October 31, 2022: none.
(c) Tax Fees
For the fiscal years ended October 31, 2023 and October 31, 2022: none.
(d) All Other Fees
For the fiscal years ended October 31, 2023 and October 31, 2022: none.
(e) (1) Audit Committee Pre-Approval Policies and Procedures
THE PGIM MUTUAL FUNDS
AUDIT COMMITTEE POLICY
on
Pre-Approval of Services Provided by the Independent
Accountants
The Audit Committee of each PGIM Mutual Fund is charged with the responsibility to monitor the independence of the Fund’s independent accountants. As part of this responsibility, the Audit Committee must pre-approve the independent accounting firm’s engagement to render audit and/or permissible non-audit services, as required by law. In evaluating a proposed engagement of the independent accountants, the Audit Committee will assess the effect that the engagement might reasonably be expected to have on the accountant’s independence. The Committee’s evaluation will be based on:
| | • | | a review of the nature of the professional services expected to be provided, |
| | • | | a review of the safeguards put into place by the accounting firm to safeguard independence, and |
| | • | | periodic meetings with the accounting firm. |
Policy for Audit and Non-Audit Services Provided to the Funds
On an annual basis, the scope of audits for each Fund, audit fees and expenses, and audit-related and non-audit services (and fees proposed in respect thereof) proposed to be performed by the Fund’s independent accountants will be presented by the Treasurer and the independent accountants to the Audit Committee for review and, as appropriate, approval prior to the initiation of such services.
Such presentation shall be accompanied by confirmation by both the Treasurer and the independent accountants that the proposed
non-audit services will not adversely affect the independence of the independent accountants. Such proposed non-audit services shall be described in sufficient detail to enable the Audit Committee to assess the appropriateness of such services and fees, and the compatibility of the provision of such services with the auditor’s independence. The Committee shall receive periodic reports on the progress of the audit and other services which are approved by the Committee or by the Committee Chair pursuant to authority delegated in this Policy.
The categories of services enumerated under “Audit Services”, “Audit-related Services”, and “Tax Services” are intended to provide guidance to the Treasurer and the independent accountants as to those categories of services which the Committee believes are generally consistent with the independence of the independent accountants and which the Committee (or the Committee Chair) would expect upon the presentation of specific proposals to pre-approve. The enumerated categories are not intended as an exclusive list of audit, audit-related or tax services, which the Committee (or the Committee Chair) would consider for pre-approval.
Audit Services
The following categories of audit services are considered to be consistent with the role of the Fund’s independent accountants:
| | • | | Annual Fund financial statement audits |
| | • | | Seed audits (related to new product filings, as required) |
| | • | | SEC and regulatory filings and consents |
Audit-related Services
The following categories of audit-related services are considered to be consistent with the role of the Fund’s independent accountants:
| | • | | Accounting consultations |
| | • | | Fund merger support services |
| | • | | Agreed Upon Procedure Reports |
| | • | | Other Internal Control Reports |
Individual audit-related services that fall within one of these categories (except for fund merger support services) and are not presented to the Audit Committee as part of the annual pre-approval process are subject to an authorized pre-approval by the Audit Committee so long as the estimated fee for those services does not exceed $30,000. Any services provided under such
pre-approval will be reported to the Audit Committee at its next regular meeting. Should the amount of such services exceed $30,000 any additional fees will be subject to pre-approval by the Committee Chair (or any other Committee member on whom this responsibility has been delegated). Fees related to fund merger support services are subject to a separate authorized pre-approval by the Audit Committee with fees determined on a per occurrence and merger complexity basis.
Tax Services
The following categories of tax services are considered to be consistent with the role of the Fund’s independent accountants:
| | • | | Tax compliance services related to the filing or amendment of the following: |
| | • | | Federal, state and local income tax compliance; and, |
| | • | | Sales and use tax compliance |
| | • | | Timely RIC qualification reviews |
| | • | | Tax distribution analysis and planning |
| | • | | Tax authority examination services |
| | • | | Tax appeals support services |
| | • | | Accounting methods studies |
| | • | | Fund merger support services |
| | • | | Tax consulting services and related projects |
Individual tax services that fall within one of these categories and are not presented to the Audit Committee as part of the annual pre-approval process are subject to an authorized pre-approval by the Audit Committee so long as the estimated fee for those services does not exceed $30,000. Any services provided under such pre-approval will be reported to the Audit Committee at its next regular meeting. Should the amount of such services exceed $30,000 any additional fees will be subject to pre-approval by the Committee Chair (or any other Committee member on whom this responsibility has been delegated).
Other Non-Audit Services
Certain non-audit services that the independent accountants are legally permitted to render will be subject to pre-approval by the Committee or by one or more Committee members to whom the Committee has delegated this authority and who will report to the full Committee any pre-approval decisions made pursuant to this Policy. Non-audit services presented for pre-approval pursuant to this paragraph will be accompanied by a confirmation from both the Treasurer and the independent accountants that the proposed services will not adversely affect the independence of the independent accountants.
Proscribed Services
The Fund’s independent accountants will not render services in the following categories of non-audit services:
| | • | | Bookkeeping or other services related to the accounting records or financial statements of the Fund |
| | • | | Financial information systems design and implementation |
| | • | | Appraisal or valuation services, fairness opinions, or contribution-in-kind reports |
| | • | | Internal audit outsourcing services |
| | • | | Management functions or human resources |
| | • | | Broker or dealer, investment adviser, or investment banking services |
| | • | | Legal services and expert services unrelated to the audit |
| | • | | Any other service that the Public Company Accounting Oversight Board determines, by regulation, is impermissible. |
Pre-approval of Non-Audit Services Provided to Other Entities Within the PGIM Fund Complex
Certain non-audit services provided to PGIM Investments LLC or any of its affiliates that also provide ongoing services to the PGIM Mutual Funds will be subject to pre-approval by the Audit Committee. The only non-audit services provided to these entities that will require pre-approval are those related directly to the operations and financial reporting of the Funds. Individual projects that are not presented to the Audit Committee as part of the annual pre-approval process will be subject to pre-approval by the Committee Chair (or any other Committee member on whom this responsibility has been delegated) so long as the estimated fee for those services does not exceed $30,000. Services presented for pre-approval pursuant to this paragraph will be accompanied by a confirmation from both the Treasurer and the independent accountants that the proposed services will not adversely affect the independence of the independent accountants.
Although the Audit Committee will not pre-approve all services provided to PGIM Investments LLC and its affiliates, the Committee will receive an annual report from the Fund’s independent accounting firm showing the aggregate fees for all services provided to PGIM Investments and its affiliates.
(e) (2) Percentage of services described in each of paragraphs (b) through (d) of this Item that were approved by the audit committee pursuant to paragraph (c)(7)(i)(C) of Rule 2-01 of Regulation S-X –
| | | | | | | | | | |
| | | | | Fiscal Year Ended October 31,
2023 | | | | Fiscal Year Ended October 31,
2022 | | |
| | 4(b) | | Not applicable. | | | | Not applicable. | | |
| | 4(c) | | Not applicable. | | | | Not applicable. | | |
| | 4(d) | | Not applicable. | | | | Not applicable. | | |
(f) Percentage of hours expended attributable to work performed by other than full time employees of principal accountant if greater than 50%.
The percentage of hours expended on the principal accountant’s engagement to audit the registrant’s financial statements for the most recent fiscal year that were attributed to work performed by persons other than the principal accountant’s full-time, permanent employees was 0%.
(g) Non-Audit Fees
The aggregate non-audit fees billed by the Registrant’s principal accountant for services rendered to the registrant’s investment adviser and any entity controlling, controlled by, or under common control with the investment adviser that provides ongoing services to the registrant for the fiscal years ended October 31, 2023 and October 31, 2022 was $0 and $0, respectively.
(h) Principal Accountant’s Independence
Not applicable as the Registrant’s principal accountant has not provided non-audit services to the registrant’s investment adviser and any entity controlling, controlled by, or under common control with the investment adviser that provides ongoing services to the registrant that were not pre-approved pursuant to Rule 2-01(c)(7)(ii) of Regulation S-X.
(i) Not applicable.
(j) Not applicable.
Item 5 – Audit Committee of Listed Registrants – Not applicable.
Item 6 – Schedule of Investments – The schedule is included as part of the report to shareholders filed under Item 1 of this Form.
Item 7 – Disclosure of Proxy Voting Policies and Procedures for Closed-End Management Investment Companies – Not applicable.
Item 8 – Portfolio Managers of Closed-End Management Investment Companies – Not applicable.
Item 9 – Purchases of Equity Securities by Closed-End Management Investment Company and Affiliated Purchasers – Not applicable.
Item 10 – Submission of Matters to a Vote of Security Holders – There have been no material changes to these procedures.
Item 11 – Controls and Procedures
| | (a) | It is the conclusion of the registrant’s principal executive officer and principal financial officer that the effectiveness of the registrant’s current disclosure controls and procedures (such disclosure controls and procedures having been evaluated within 90 days of the date of this filing) provide reasonable assurance that the information required to be disclosed by the registrant has been recorded, processed, summarized and reported within the time period specified in the Commission’s rules and forms and that the information required to be disclosed by the registrant has been accumulated and communicated to the registrant’s principal executive officer and principal financial officer in order to allow timely decisions regarding required disclosure. |
| | (b) | There has been no significant change in the registrant’s internal control over financial reporting (as defined in Rule 30a-3(d) under the Act (17 CFR 270.30a-3(d))) that occurred during the period covered by this report that has materially affected, or is reasonably likely to materially affect, the registrant’s internal control over financial reporting. |
Item 12 – Controls and Procedures—Disclosure of Securities Lending Activities for Closed-End Management Investment Companies – Not applicable.
Item 13 – Exhibits
(a)(1) Code of Ethics – Attached hereto as Exhibit EX-99.CODE-ETH.
(a)(2) Certifications pursuant to Section 302 of the Sarbanes-Oxley Act – Attached hereto as Exhibit EX-99.CERT.
(a)(2)(1) Any written solicitation to purchase securities under Rule 23c-1 – Not applicable.
(a)(2)(2) Change in the registrant’s independent public accountant – Not applicable.
(b) Certifications pursuant to Section 906 of the Sarbanes-Oxley Act – Attached hereto as Exhibit EX-99.906CERT.
SIGNATURES
Pursuant to the requirements of the Securities Exchange Act of 1934 and the Investment Company Act of 1940, the registrant has duly caused this report to be signed on its behalf by the undersigned, thereunto duly authorized.
| | |
| Registrant | | Prudential Investment Portfolios 2 |
| |
| By: | | /s/ Andrew R. French |
| | Andrew R. French |
| | Secretary |
| |
| Date: | | December 18, 2023 |
Pursuant to the requirements of the Securities Exchange Act of 1934 and the Investment Company Act of 1940, this report has been signed below by the following persons on behalf of the registrant and in the capacities and on the dates indicated.
| | |
| |
| By: | | /s/ Stuart S. Parker |
| | Stuart S. Parker |
| | President and Principal Executive Officer |
| |
| Date: | | December 18, 2023 |
| |
| By: | | /s/ Christian J. Kelly |
| | Christian J. Kelly |
| | Chief Financial Officer (Principal Financial Officer) |
| |
| Date: | | December 18, 2023 |