UNITED STATES
SECURITIES AND EXCHANGE COMMISSION
Washington, D.C. 20549
CERTIFIED SHAREHOLDER REPORT OF REGISTERED MANAGEMENT INVESTMENT COMPANIES
| | |
| Investment Company Act file number: | | 811-09999 |
| |
| Exact name of registrant as specified in charter: | | Prudential Investment Portfolios 2 |
| |
| (This Form N-CSR relates solely to the Registrant’s PGIM Quant Solutions Emerging Markets Equity Fund and PGIM Quant Solutions International Developed Markets Index Fund (each a “Fund” and collectively the “Funds”)) |
| |
| Address of principal executive offices: | | 655 Broad Street, 6 th Floor |
| | | Newark, New Jersey 07102 |
| |
| Name and address of agent for service: | | Andrew R. French |
| | | 655 Broad Street, 6 th Floor |
| | | Newark, New Jersey 07102 |
| |
| Registrant’s telephone number, including area code: | | |
| |
| Date of fiscal year end: | | 10/31/20 24 |
| |
| Date of reporting period: | | 10/31/2024 |
Item 1 – Reports to Stockholders
| | (a) | Report transmitted to stockholders pursuant to Rule 30e-1 under the Act (17 CFR 270.30e-1). |
PGIM Quant Solutions Emerging Markets
Equity Fund
ANNUAL SHAREHOLDER REPORT – October 31, 2024
This annual shareholder report contains important information about the Class R6 shares of PGIM Quant Solutions Emerging Markets Equity
Fund (the “Fund”) for the period of November 1, 2023 to October 31, 2024.
You can find additional information about the Fund at
pgim.com/investments/mutual-funds/prospectuses-fact-sheets
. You can also request
this information by contacting us at (800) 225-1852 or (973) 367-3529 from outside the US.
This report describes changes to the Fund that occurred during the reporting period.
WHAT WERE THE FUND COSTS FOR THE LAST YEAR?
(Based on a hypothetical $10,000 investment)
| Costs of a $10,000 investment | Costs paid as a percentage of a $10,000 investment |
PGIM Quant Solutions Emerging Markets Equity | | |
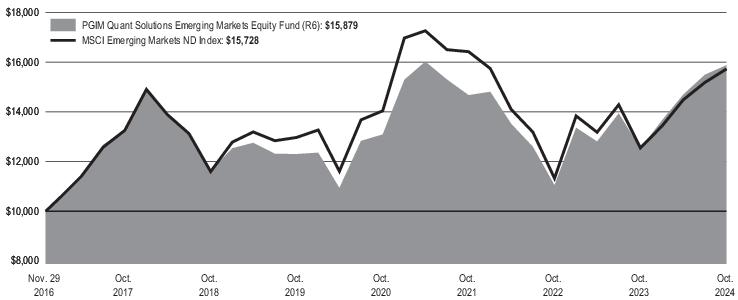
WHAT AFFECTED THE FUND’S PERFORMANCE DURING THE REPORTING PERIOD?
■
Over the reporting period, market performance was strong, with MSCI Emerging Markets ND Index gains primarily driven by strong
performance in Taiwan, India, and China, particularly within the information technology, financials, and consumer discretionary sectors.
■
The Fund benefited from strong performance across all factor groups. Top contributors included overweight exposure to stocks with cheap
valuations, strong quality measures, and improving sentiment measures, as well as underweight exposure to stocks with expensive valuations,
weak quality measures, and decreasing sentiment measures.
■
By country, Korea (overweight/stock selection in industrials and financials), Taiwan (overweight in information technology), and India (stock
selection in financials, overweight in materials) led outperformers.
■
The best-performing sectors, in relative terms, were industrials (underweight/stock selection in Korea), financials (stock selection in India and
China), and energy (stock selection in India and China).
HOW HAS THE FUND PERFORMED OVER THE PAST 10 YEARS?
The Fund’s past performance is not a good predictor of the Fund’s future performance.
The returns do not reflect the deduction of
taxes that a shareholder would pay on Fund distributions or redemption of Fund shares.
Visit
pgim.com/investments/mutual-funds/prospectuses-fact-sheets
or call (800) 225-1852 or (973) 367-3529 from outside the US for more recent performance data.
The line graph reflects a hypothetical $10,000 investment in Class R6 shares and assumes that all
recurring
fees (including management fees)
were deducted and dividend and distributions were reinvested. Without waiver of fees and/or expense reimbursements, if any, the returns would
have been lower.
Cumulative Performance: November 29, 2016 to October 31, 2024 Initial Investment of $10,000 |
Average Annual Total Returns as of 10/31/2024 |
| | | |
| | | |
Broad-Based Securities Market Index: MSCI Emerging Markets
ND Index | | | |
Since Inception returns are provided for the share class since it has less than 10 fiscal years of returns. Since Inception returns for the Index are measured from the
closest month-end to the class’s inception date.
WHAT ARE SOME KEY FUND STATISTICS AS OF 10/31/2024?
| |
| |
Total advisory fees paid for the year | |
Portfolio turnover rate for the year | |
WHAT ARE SOME CHARACTERISTICS OF THE FUND’S HOLDINGS AS OF 10/31/2024?
| |
| |
Semiconductors & Semiconductor Equipment | |
Affiliated Mutual Fund - Short-Term Investment (0.7% represents investments purchased with collateral from securities on loan) | |
| |
Interactive Media & Services | |
Technology Hardware, Storage & Peripherals | |
| |
Oil, Gas & Consumable Fuels | |
| |
| |
| |
Hotels, Restaurants & Leisure | |
| |
Real Estate Management & Development | |
| |
Electronic Equipment, Instruments & Components | |
| |
| |
Diversified Telecommunication Services | |
| |
| |
| |
| |
Wireless Telecommunication Services | |
| |
Textiles, Apparel & Luxury Goods | |
| |
Consumer Staples Distribution & Retail | |
| |
Health Care Providers & Services | |
| |
| |
| |
| |
| |
| |
| |
| |
| |
Liabilities in excess of other assets | |
| |
* Consists of Industries that each make up less than 0.5% of the Fund's net assets
WERE THERE ANY CHANGES TO THE FUND THIS YEAR?
The following is a summary of certain changes to the Fund since November 1, 2023:
■
The Fund's principal risk disclosure was revised to include Sector Exposure Risk as a principal risk of the Fund due to changes in the Fund's
portfolio which may result in greater exposure to certain economic sectors.
For more complete information, you should review the Fund’s next prospectus, which we expect to be available by February 28, 2025 at
pgim.com/investments/mutual-funds/prospectuses-fact-sheets
or by request at (800) 225-1852.
You can find additional information at
pgim.com/investments/mutual-funds/prospectuses-fact-sheets
or by scanning the QR code below,
including the Fund’s prospectus, financial information, fund holdings, and proxy voting information. You can also request this information by
contacting us at (800) 225-1852 or (973) 367-3529 from outside the US.
To receive your fund documents online, go to
pgim.com/investments/resource/edelivery
and enroll.
PGIM Quant Solutions Emerging Markets Equity Fund
PGIM Quant Solutions International Developed
Markets Index Fund
ANNUAL SHAREHOLDER REPORT – October 31, 2024
This annual shareholder report contains important information about the Class R6 shares of PGIM Quant Solutions International Developed
Markets Index Fund (the “Fund”) for the period of November 1, 2023 to October 31, 2024.
You can find additional information about the Fund at
pgim.com/investments/mutual-funds/prospectuses-fact-sheets
. You can also request
this information by contacting us at (800) 225-1852 or (973) 367-3529 from outside the US.
This report describes changes to the Fund that occurred during the reporting period.
WHAT WERE THE FUND COSTS FOR THE LAST YEAR?
(Based on a hypothetical $10,000 investment)
| Costs of a $10,000 investment | Costs paid as a percentage of a $10,000 investment |
PGIM Quant Solutions International Developed Markets Index Fund—Class R6 | | |
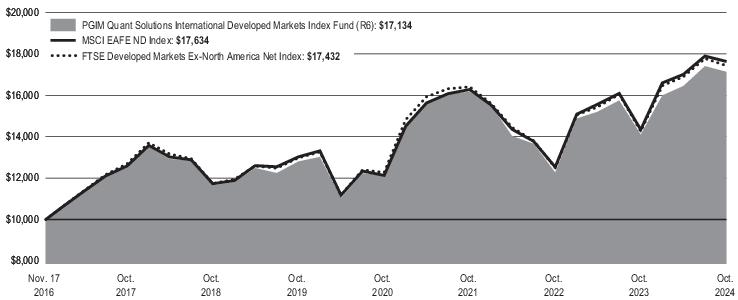
WHAT AFFECTED THE FUND’S PERFORMANCE DURING THE REPORTING PERIOD?
■
International equities advanced at the end of 2023, based on the hope that a continued decline in inflation data would lead to interest rate cuts
by central banks. The markets continued upward in the first quarter of 2024, based on expectations of future interest rate cuts. Despite volatility
during the remainder of the reporting period, as investors digested the outcomes of various international elections and the hoped-for easing of
monetary policy in Europe, these markets ended the period little changed from their March 2024 levels.
■
The Fund closely tracked the MSCI EAFE ND Index’s performance over the reporting period, holding almost all stocks included in the Index in
approximately the same proportions, in keeping with its “passively managed”—or index—investment approach.
■
The Fund used TOPIX Futures, EURO STOXX 50 Futures, FTSE 100 Futures, and MSCI EAFE Mini Futures to equitize cash and enhance
portfolio liquidity. These positions had a negligible effect on performance.
HOW HAS THE FUND PERFORMED OVER THE PAST 10 YEARS?
The Fund’s past performance is not a good predictor of the Fund’s future performance.
The returns do not reflect the deduction of
taxes that a shareholder would pay on Fund distributions or redemption of Fund shares.
Visit
pgim.com/investments/mutual-funds/prospectuses-fact-sheets
or call (800) 225-1852 or (973) 367-3529 from outside the US for more recent performance data.
The line graph reflects a hypothetical $10,000 investment in Class R6 shares and assumes that all recurring fees (including management fees)
were deducted and dividend and distributions were reinvested. Without waiver of fees and/or
expense
reimbursements, if any, the returns would
have been lower.
Cumulative Performance: November 17, 2016 to October 31, 2024 Initial Investment of $10,000 |
Average Annual Total Returns as of 10/31/2024 |
| | | |
| | | |
Broad-Based Securities Market Index: MSCI EAFE ND Index | | | |
FTSE Developed Markets Ex-North America Net Index | | | |
Since Inception returns are provided for the share class since it has less than 10 fiscal years of returns. Since Inception returns for the Indexes are measured from the
closest month-end to the class’s inception date.
WHAT ARE SOME KEY FUND STATISTICS AS OF 10/31/2024?
| |
| |
Total advisory fees paid for the year | |
Portfolio turnover rate for the year | |
WHAT ARE SOME CHARACTERISTICS OF THE FUND’S HOLDINGS AS OF 10/31/2024?
| |
| |
| |
| |
Oil, Gas & Consumable Fuels | |
Semiconductors & Semiconductor Equipment | |
| |
| |
| |
| |
| |
Unaffiliated Exchange-Traded Funds | |
Textiles, Apparel & Luxury Goods | |
| |
| |
| |
| |
Health Care Equipment & Supplies | |
Trading Companies & Distributors | |
| |
| |
| |
| |
Diversified Telecommunication Services | |
| |
Hotels, Restaurants & Leisure | |
Electronic Equipment, Instruments & Components | |
Consumer Staples Distribution & Retail | |
| |
Real Estate Management & Development | |
| |
| |
Wireless Telecommunication Services | |
| |
| |
| |
| |
| |
| |
| |
Affiliated Mutual Fund - Short-Term Investment (0.0% represents investments purchased with collateral from securities on loan) | |
| |
Construction & Engineering | |
| |
| |
| |
Technology Hardware, Storage & Peripherals | |
| |
| |
Other assets in excess of liabilities | |
| |
* Consists of Industries that each make up less than 0.5% of the Fund's net assets
WERE THERE ANY CHANGES TO THE FUND THIS YEAR?
The following is a summary of certain changes to the Fund since November 1, 2023:
■
Effective December 11, 2023, the Fund's contractual expense limitation was lowered from 0.25% to 0.19% of the average daily net assets for
Class R6 shares.
For more complete information, you should review the Fund’s next prospectus, which we expect to be available by February 28, 2025 at
pgim.com/investments/mutual-funds/prospectuses-fact-sheets
or by request at (800) 225-1852.
You can find additional information at
pgim.com/investments/mutual-funds/prospectuses-fact-sheets
or by scanning the QR code below,
including the Fund’s prospectus, financial information, fund holdings, and proxy voting information. You can also request this information by
contacting us at (800) 225-1852 or (973) 367-3529 from outside the US.
To receive your fund documents online, go to
pgim.com/investments/resource/edelivery
and enroll.
PGIM Quant Solutions International Developed Markets Index Fund
| | (b) | Copy of each notice transmitted to stockholders in reliance on Rule 30e-3 under the Act (17 CFR 270.30e-3) that contains disclosures specified by paragraph (c)(3) of that rule – Not applicable. |
Item 2 – Code of Ethics – See Exhibit (a)
As of the end of the period covered by this report, the registrant has adopted a code of ethics (the “Section 406 Standards for Investment Companies – Ethical Standards for Principal Executive and Financial Officers”) that applies to the registrant’s Principal Executive Officer, Principal Financial Officer and Principal Accounting Officer.
The registrant hereby undertakes to provide any person, without charge, upon request, a copy of the code of ethics. To request a copy of the code of ethics, contact the registrant 800-225-1852, and ask for a copy of the Section 406 Standards for Investment Companies - Ethical Standards for Principal Executive and Financial Officers.
Item 3 – Audit Committee Financial Expert –
The registrant’s Board has determined that Ms. Grace C. Torres, member of the Board’s Audit Committee is an “audit committee financial expert,” and that she is “independent,” for purposes of this item.
Item 4 – Principal Accountant Fees and Services –
For the fiscal years ended October 31, 2024 and October 31, 2023, PricewaterhouseCoopers LLP (“PwC”), the Registrant’s principal accountant, billed the Registrant $62,328 and $59,360, respectively, for professional services rendered for the audit of the Registrant’s annual financial statements or services that are normally provided in connection with statutory and regulatory filings.
For the fiscal years ended October 31, 2024 and October 31, 2023: none.
For the fiscal years ended October 31, 2024 and October 31, 2023: none.
For the fiscal years ended October 31, 2024 and October 31, 2023: none.
| | (e) | (1) Audit Committee Pre-Approval Policies and Procedures |
THE PGIM MUTUAL FUNDS
AUDIT COMMITTEE POLICY
on
Pre-Approval of Services Provided by the Independent Accountants
The Audit Committee of each PGIM Mutual Fund is charged with the responsibility to monitor the independence of the Fund’s independent accountants. As part of this responsibility, the Audit Committee must pre-approve the independent accounting firm’s engagement to render audit and/or permissible non-audit services, as required by law. In evaluating a proposed engagement of the independent accountants, the Audit Committee will assess the effect that the engagement might reasonably be expected to have on the accountant’s independence. The Committee’s evaluation will be based on:
| | • | | a review of the nature of the professional services expected to be provided, |
| | • | | a review of the safeguards put into place by the accounting firm to safeguard independence, and |
| | • | | periodic meetings with the accounting firm. |
Policy for Audit and Non-Audit Services Provided to the Funds
On an annual basis, the scope of audits for each Fund, audit fees and expenses, and audit-related and non-audit services (and fees proposed in respect thereof) proposed to be performed by the Fund’s independent accountants will be presented by the Treasurer and the independent accountants to the Audit Committee for review and, as appropriate, approval prior to the initiation of such services.
Such presentation shall be accompanied by confirmation by both the Treasurer and the independent accountants that the proposed non-audit services will not adversely affect the independence of the independent accountants. Such proposed non-audit services shall be described in sufficient detail to enable the Audit Committee to assess the appropriateness of such services and fees, and the compatibility of the provision of such services with the auditor’s independence. The Committee shall receive periodic reports on the progress of the audit and other services which are approved by the Committee or by the Committee Chair pursuant to authority delegated in this Policy.
The categories of services enumerated under “Audit Services”, “Audit-related Services”, and “Tax Services” are intended to provide guidance to the Treasurer and the independent accountants as to those categories of services which the Committee believes are generally consistent with the independence of the independent accountants and which the Committee (or the Committee Chair) would expect upon the presentation of specific proposals to pre-approve. The enumerated categories are not intended as an exclusive list of audit, audit-related or tax services, which the Committee (or the Committee Chair) would consider for pre-approval.
Audit Services
The following categories of audit services are considered to be consistent with the role of the Fund’s independent accountants:
| | • | | Annual Fund financial statement audits |
| | • | | Seed audits (related to new product filings, as required) |
| | • | | SEC and regulatory filings and consents |
Audit-related Services
The following categories of audit-related services are considered to be consistent with the role of the Fund’s independent accountants:
| | • | | Accounting consultations |
| | • | | Fund merger support services |
| | • | | Agreed Upon Procedure Reports |
| | • | | Other Internal Control Reports |
Individual audit-related services that fall within one of these categories (except for fund merger support services) and are not presented to the Audit Committee as part of the annual pre-approval process are subject to an authorized pre-approval by the Audit Committee so long as the estimated fee for those services does not exceed $30,000. Any services provided under such pre-approval will be reported to the Audit Committee at its next regular meeting. Should the amount of such services exceed $30,000 any additional fees will be subject to pre-approval by the Committee Chair (or any other Committee member on whom this responsibility has been delegated). Fees related to fund merger support services are subject to a separate authorized pre-approval by the Audit Committee with fees determined on a per occurrence and merger complexity basis.
Tax Services
The following categories of tax services are considered to be consistent with the role of the Fund’s independent accountants:
| | • | | Tax compliance services related to the filing or amendment of the following: |
| | • | | Federal, state and local income tax compliance; and, |
| | • | | Sales and use tax compliance |
| | • | | Timely RIC qualification reviews |
| | • | | Tax distribution analysis and planning |
| | • | | Tax authority examination services |
| | • | | Tax appeals support services |
| | • | | Accounting methods studies |
| | • | | Fund merger support services |
| | • | | Tax consulting services and related projects |
Individual tax services that fall within one of these categories and are not presented to the Audit Committee as part of the annual pre-approval process are subject to an authorized pre-approval by the Audit Committee so long as the estimated fee for those services does not exceed $30,000. Any services provided under such pre-approval will be reported to the Audit Committee at its next regular meeting. Should the amount of such services exceed $30,000 any additional fees will be subject to pre-approval by the Committee Chair (or any other Committee member on whom this responsibility has been delegated).
Other Non-Audit Services
Certain non-audit services that the independent accountants are legally permitted to render will be subject to pre-approval by the Committee or by one or more Committee members to whom the Committee has delegated this authority and who will report to the full Committee any pre-approval decisions made pursuant to this Policy. Non-audit services presented for pre-approval pursuant to this paragraph will be accompanied by a confirmation from both the Treasurer and the independent accountants that the proposed services will not adversely affect the independence of the independent accountants.
Proscribed Services
The Fund’s independent accountants will not render services in the following categories of non-audit services:
| | • | | Bookkeeping or other services related to the accounting records or financial statements of the Fund |
| | • | | Financial information systems design and implementation |
| | • | | Appraisal or valuation services, fairness opinions, or contribution-in-kind reports |
| | • | | Internal audit outsourcing services |
| | • | | Management functions or human resources |
| | • | | Broker or dealer, investment adviser, or investment banking services |
| | • | | Legal services and expert services unrelated to the audit |
| | • | | Any other service that the Public Company Accounting Oversight Board determines, by regulation, is impermissible. |
Pre-approval of Non-Audit Services Provided to Other Entities Within the PGIM Fund Complex
Certain non-audit services provided to PGIM Investments LLC or any of its affiliates that also provide ongoing services to the PGIM Mutual Funds will be subject to pre-approval by the Audit Committee. The only non-audit services provided to these entities that will require pre-approval are those related directly to the operations and financial reporting of the Funds. Individual projects that are not presented to the Audit Committee as part of the annual pre-approval process will be subject to pre-approval by the Committee Chair (or any other Committee member on whom this responsibility has been delegated) so long as the estimated fee for those services does not exceed $30,000. Services presented for pre-approval pursuant to this paragraph will be accompanied by a confirmation from both the Treasurer and the independent accountants that the proposed services will not adversely affect the independence of the independent accountants.
Although the Audit Committee will not pre-approve all services provided to PGIM Investments LLC and its affiliates, the Committee will receive an annual report from the Fund’s independent accounting firm showing the aggregate fees for all services provided to PGIM Investments and its affiliates.
| (e) | (2) Percentage of services described in each of paragraphs (b) through (d) of this Item that were approved by the audit committee pursuant to paragraph (c)(7)(i)(C) of Rule 2-01 of Regulation S-X – |
| | | | | | |
| | | Fiscal Year Ended October 31, 2024 | | Fiscal Year Ended October 31, 2023 | | |
| 4(b) | | Not applicable. | | Not applicable. | | |
| 4(c) | | Not applicable. | | Not applicable. | | |
| 4(d) | | Not applicable. | | Not applicable. | | |
| (f) | Percentage of hours expended attributable to work performed by other than full time employees of principal accountant if greater than 50%. |
The percentage of hours expended on the principal accountant’s engagement to audit the registrant’s financial statements for the most recent fiscal year that were attributed to work performed by persons other than the principal accountant’s full-time, permanent employees was 0%.
The aggregate non-audit fees billed by the Registrant’s principal accountant for services rendered to the registrant’s investment adviser and any entity controlling, controlled by, or under common control with the investment adviser that provides ongoing services to the registrant for the fiscal years ended October 31, 2024 and October 31, 2023 was $0 and $0, respectively.
| (h) | Principal Accountant’s Independence |
Not applicable as the Registrant’s principal accountant has not provided non-audit services to the registrant’s investment adviser and any entity controlling, controlled by, or under common control with the investment adviser that provides ongoing services to the registrant that were not pre-approved pursuant to Rule 2-01(c)(7)(ii) of Regulation S-X.
Item 5 – Audit Committee of Listed Registrants – Not applicable.
| Item 6 | – Investments – The registrant’s Schedule of Investments is included in the financial statements filed under Item 7 of this Form. |
| Items | 7 – 11 (Refer to Report below) |

PRUDENTIAL INVESTMENT PORTFOLIOS 2
PGIM Quant Solutions Emerging Markets Equity Fund
PGIM Quant Solutions International Developed Markets Index Fund
FINANCIAL STATEMENTS AND OTHER INFORMATION
OCTOBER 31, 2024

| | | | |
Table of Contents | | Financial Statements and Other Information | | October 31, 2024 |
Form N-CSR Item 7 - Financial Statements and Financial Highlights for Open-End Management Investment Companies.
Other Information - Form N-CSR Items 8-11
Glossary
The following abbreviations are used in the Funds’ descriptions:
USD—US Dollar
144A—Security was purchased pursuant to Rule 144A under the Securities Act of 1933 and, pursuant to the requirements of Rule 144A, may not be resold except to qualified institutional buyers.
ADR—American Depositary Receipt
CDI—Chess Depository Interest
CVA—Certificate Van Aandelen (Bearer)
EAFE—Europe, Australasia, Far East
ETF—Exchange-Traded Fund
FTSE—Financial Times Stock Exchange
GDR—Global Depositary Receipt
MSC—Morgan Stanley & Co. LLC
MSCI—Morgan Stanley Capital International
OTC—Over-the-counter
PJSC—Public Joint-Stock Company
PRFC—Preference Shares
REITs—Real Estate Investment Trust
SOFR—Secured Overnight Financing Rate
STOXX—Stock Index of the Eurozone
TOPIX—Tokyo Stock Price Index
UTS—Unit Trust Security
XLON—London Stock Exchange
XSTU—Stuttgart Stock Exchange
1
PGIM Quant Solutions Emerging Markets Equity Fund
Schedule of Investments
as of October 31, 2024
| | | | | | | | |
| | |
| Description | | Shares | | | Value | |
| | |
LONG-TERM INVESTMENTS 92.9% | | | | | | | | |
| | |
COMMON STOCKS 89.6% | | | | | | | | |
| | |
Brazil 3.1% | | | | | | | | |
| | |
Ambev SA | | | 49,500 | | | $ | 107,890 | |
B3 SA - Brasil Bolsa Balcao | | | 27,600 | | | | 50,751 | |
Banco Bradesco SA | | | 8,801 | | | | 19,350 | |
Banco BTG Pactual SA, UTS | | | 3,600 | | | | 20,245 | |
Banco do Brasil SA | | | 56,800 | | | | 258,016 | |
Centrais Eletricas Brasileiras SA | | | 5,900 | | | | 38,660 | |
CPFL Energia SA | | | 21,400 | | | | 121,495 | |
Embraer SA* | | | 3,200 | | | | 26,864 | |
Engie Brasil Energia SA | | | 1,100 | | | | 7,897 | |
Klabin SA, UTS | | | 3,520 | | | | 12,781 | |
Pagseguro Digital Ltd. (Class A Stock)* | | | 1,800 | | | | 14,472 | |
Petroleo Brasileiro SA | | | 18,900 | | | | 127,343 | |
Vale SA | | | 29,932 | | | | 320,761 | |
WEG SA | | | 15,800 | | | | 148,628 | |
XP, Inc. (Class A Stock) | | | 2,600 | | | | 45,396 | |
| | | | | | | | |
| | |
| | | | | | | 1,320,549 | |
| | |
Chile 0.7% | | | | | | | | |
| | |
Banco de Chile | | | 720,850 | | | | 83,733 | |
Enel Americas SA | | | 304,339 | | | | 28,483 | |
Enel Chile SA | | | 2,735,263 | | | | 145,153 | |
Falabella SA* | | | 14,619 | | | | 52,361 | |
| | | | | | | | |
| | |
| | | | | | | 309,730 | |
| | |
China 24.6% | | | | | | | | |
| | |
Agricultural Bank of China Ltd. (Class H Stock) | | | 416,000 | | | | 204,400 | |
Alibaba Group Holding Ltd. | | | 72,700 | | | | 889,289 | |
Aluminum Corp. of China Ltd. (Class H Stock) | | | 112,000 | | | | 71,361 | |
Anhui Conch Cement Co. Ltd. (Class H Stock) | | | 6,500 | | | | 18,881 | |
ANTA Sports Products Ltd. | | | 14,600 | | | | 155,829 | |
Bank of China Ltd. (Class H Stock) | | | 330,000 | | | | 156,628 | |
Bank of Hangzhou Co. Ltd. (Class A Stock) | | | 35,600 | | | | 69,322 | |
Bank of Nanjing Co. Ltd. (Class A Stock) | | | 46,000 | | | | 66,274 | |
Bank of Shanghai Co. Ltd. (Class A Stock) | | | 59,100 | | | | 64,377 | |
Bosideng International Holdings Ltd. | | | 402,000 | | | | 225,420 | |
BYD Co. Ltd. (Class H Stock) | | | 3,000 | | | | 108,356 | |
Chifeng Jilong Gold Mining Co. Ltd. (Class A Stock) | | | 19,800 | | | | 52,362 | |
China Construction Bank Corp. (Class H Stock) | | | 413,000 | | | | 320,586 | |
China Feihe Ltd., 144A | | | 68,000 | | | | 51,323 | |
China Hongqiao Group Ltd. | | | 71,500 | | | | 114,879 | |
See Notes to Financial Statements.
2
PGIM Quant Solutions Emerging Markets Equity Fund
Schedule of Investments (continued)
as of October 31, 2024
| | | | | | | | |
| | |
| Description | | Shares | | | Value | |
| | |
COMMON STOCKS (Continued) | | | | | | | | |
| | |
China (cont’d.) | | | | | | | | |
| | |
China Life Insurance Co. Ltd. (Class H Stock) | | | 29,000 | | | $ | 61,473 | |
China Pacific Insurance Group Co. Ltd. (Class H Stock) | | | 91,000 | | | | 316,030 | |
China Resources Mixc Lifestyle Services Ltd., 144A | | | 13,200 | | | | 54,455 | |
China Resources Power Holdings Co. Ltd. | | | 20,000 | | | | 48,110 | |
China Taiping Insurance Holdings Co. Ltd. | | | 44,200 | | | | 76,132 | |
Chongqing Rural Commercial Bank Co. Ltd. (Class A Stock) | | | 82,000 | | | | 64,253 | |
CMOC Group Ltd. (Class H Stock) | | | 57,000 | | | | 47,183 | |
Contemporary Amperex Technology Co. Ltd. (Class A Stock) | | | 3,100 | | | | 107,503 | |
COSCO SHIPPING Holdings Co. Ltd. (Class H Stock) | | | 74,500 | | | | 110,330 | |
Dong-E-E-Jiao Co. Ltd. (Class A Stock) | | | 900 | | | | 7,448 | |
ENN Energy Holdings Ltd. | | | 2,400 | | | | 16,909 | |
Fuyao Glass Industry Group Co. Ltd. (Class H Stock), 144A | | | 3,200 | | | | 22,635 | |
Geely Automobile Holdings Ltd. | | | 31,000 | | | | 54,495 | |
Goneo Group Co. Ltd. (Class A Stock) | | | 1,330 | | | | 13,616 | |
Gree Electric Appliances, Inc. of Zhuhai (Class A Stock) | | | 9,200 | | | | 56,241 | |
Haier Smart Home Co. Ltd. (Class H Stock) | | | 12,600 | | | | 45,728 | |
Haitian International Holdings Ltd. | | | 3,000 | | | | 8,298 | |
Hangzhou Great Star Industrial Co. Ltd. (Class A Stock) | | | 7,300 | | | | 29,376 | |
Henan Shenhuo Coal Industry & Electricity Power Co. Ltd. (Class A Stock) | | | 4,500 | | | | 11,290 | |
Hisense Home Appliances Group Co. Ltd. (Class H Stock) | | | 6,000 | | | | 19,010 | |
Huaxia Bank Co. Ltd. (Class A Stock) | | | 59,800 | | | | 59,383 | |
Hubei Jumpcan Pharmaceutical Co. Ltd. (Class A Stock) | | | 5,627 | | | | 23,864 | |
Industrial Bank Co. Ltd. (Class A Stock) | | | 30,500 | | | | 78,337 | |
Inner Mongolia Yuan Xing Energy Co. Ltd. (Class A Stock) | | | 8,800 | | | | 8,346 | |
JD.com, Inc., ADR | | | 11,600 | | | | 471,192 | |
Jiangxi Copper Co. Ltd. (Class H Stock) | | | 15,000 | | | | 25,232 | |
Jinduicheng Molybdenum Co. Ltd. (Class A Stock) | | | 41,100 | | | | 61,916 | |
KE Holdings, Inc., ADR | | | 2,300 | | | | 50,439 | |
Kingsoft Corp. Ltd. | | | 5,000 | | | | 17,231 | |
Kuaishou Technology, 144A* | | | 28,900 | | | | 170,308 | |
Kweichow Moutai Co. Ltd. (Class A Stock) | | | 100 | | | | 21,460 | |
Meihua Holdings Group Co. Ltd. (Class A Stock) | | | 41,000 | | | | 54,520 | |
Meituan (Class B Stock), 144A* | | | 32,760 | | | | 774,131 | |
Midea Group Co. Ltd. (Class A Stock) | | | 6,400 | | | | 64,103 | |
NetEase, Inc. | | | 600 | | | | 9,653 | |
NetEase, Inc., ADR(a) | | | 2,300 | | | | 185,173 | |
New China Life Insurance Co. Ltd. (Class H Stock) | | | 3,000 | | | | 10,124 | |
Ningbo Deye Technology Co. Ltd. (Class A Stock) | | | 700 | | | | 9,311 | |
Ningbo Sanxing Medical Electric Co. Ltd. (Class A Stock) | | | 4,100 | | | | 17,809 | |
PDD Holdings, Inc., ADR* | | | 2,700 | | | | 325,593 | |
See Notes to Financial Statements.
PGIM Quant Solutions Emerging Markets Equity Fund 3
PGIM Quant Solutions Emerging Markets Equity Fund
Schedule of Investments (continued)
as of October 31, 2024
| | | | | | | | |
| | |
| Description | | Shares | | | Value | |
| | |
COMMON STOCKS (Continued) | | | | | | | | |
| | |
China (cont’d.) | | | | | | | | |
| | |
People’s Insurance Co. Group of China Ltd. (The) (Class H Stock) | | | 332,000 | | | $ | 167,579 | |
Ping An Bank Co. Ltd. (Class A Stock) | | | 39,300 | | | | 62,885 | |
Ping An Insurance Group Co. of China Ltd. (Class H Stock) | | | 53,500 | | | | 331,474 | |
Pop Mart International Group Ltd., 144A | | | 29,600 | | | | 267,610 | |
Qifu Technology, Inc., ADR | | | 1,500 | | | | 49,215 | |
Satellite Chemical Co. Ltd. (Class A Stock) | | | 5,400 | | | | 14,340 | |
Shandong Himile Mechanical Science & Technology Co. Ltd. (Class A Stock) | | | 10,200 | | | | 65,150 | |
Shandong Nanshan Aluminum Co. Ltd. (Class A Stock) | | | 45,500 | | | | 26,041 | |
Shanghai Pudong Development Bank Co. Ltd. (Class A Stock) | | | 55,000 | | | | 76,141 | |
Shanjin International Gold Co. Ltd. (Class A Stock) | | | 16,200 | | | | 40,790 | |
Shenzhou International Group Holdings Ltd. | | | 3,500 | | | | 27,027 | |
Sinopharm Group Co. Ltd. (Class H Stock) | | | 3,600 | | | | 8,969 | |
Sinotruk Hong Kong Ltd. | | | 14,500 | | | | 39,137 | |
Sungrow Power Supply Co. Ltd. (Class A Stock) | | | 4,120 | | | | 52,468 | |
Suzhou TFC Optical Communication Co. Ltd. (Class A Stock) | | | 2,200 | | | | 39,208 | |
Tencent Holdings Ltd. | | | 38,000 | | | | 1,981,401 | |
Tencent Music Entertainment Group, ADR | | | 4,100 | | | | 45,633 | |
Tianshan Aluminum Group Co. Ltd. (Class A Stock) | | | 35,400 | | | | 41,108 | |
Trip.com Group Ltd.* | | | 4,150 | | | | 267,071 | |
Want Want China Holdings Ltd. | | | 61,000 | | | | 37,958 | |
Weichai Power Co. Ltd. (Class H Stock) | | | 74,000 | | | | 111,819 | |
Western Mining Co. Ltd. (Class A Stock) | | | 23,800 | | | | 58,777 | |
Xiaomi Corp. (Class B Stock), 144A* | | | 77,000 | | | | 264,102 | |
Yunnan Aluminium Co. Ltd. (Class A Stock) | | | 18,300 | | | | 36,467 | |
Yunnan Yuntianhua Co. Ltd. (Class A Stock) | | | 19,400 | | | | 62,732 | |
Yutong Bus Co. Ltd. (Class A Stock) | | | 17,200 | | | | 58,531 | |
Zhejiang Century Huatong Group Co. Ltd. (Class A Stock)* | | | 64,800 | | | | 42,983 | |
Zhejiang China Commodities City Group Co. Ltd. (Class A Stock) | | | 7,500 | | | | 11,245 | |
Zhuzhou CRRC Times Electric Co. Ltd. (Class H Stock) | | | 2,500 | | | | 9,594 | |
Zijin Mining Group Co. Ltd. (Class H Stock) | | | 22,000 | | | | 46,862 | |
| | | | | | | | |
| | |
| | | | | | | 10,522,244 | |
| | |
Colombia 0.0% | | | | | | | | |
| | |
Bancolombia SA | | | 1,330 | | | | 11,451 | |
| | |
Greece 0.2% | | | | | | | | |
| | |
Eurobank Ergasias Services & Holdings SA | | | 8,675 | | | | 17,950 | |
See Notes to Financial Statements.
4
PGIM Quant Solutions Emerging Markets Equity Fund
Schedule of Investments (continued)
as of October 31, 2024
| | | | | | | | |
| | |
| Description | | Shares | | | Value | |
| | |
COMMON STOCKS (Continued) | | | | | | | | |
| | |
Greece (cont’d.) | | | | | | | | |
| | |
National Bank of Greece SA | | | 3,770 | | | $ | 29,537 | |
Piraeus Financial Holdings SA | | | 5,518 | | | | 20,791 | |
| | | | | | | | |
| | |
| | | | | | | 68,278 | |
| | |
India 15.5% | | | | | | | | |
| | |
ABB India Ltd. | | | 2,573 | | | | 226,629 | |
Aditya Birla Sun Life Asset Management Co. Ltd. | | | 3,485 | | | | 32,812 | |
Aurobindo Pharma Ltd. | | | 11,425 | | | | 189,382 | |
Bajaj Auto Ltd. | | | 878 | | | | 102,545 | |
Bharat Electronics Ltd. | | | 29,583 | | | | 99,860 | |
Bharat Petroleum Corp. Ltd. | | | 20,474 | | | | 75,525 | |
Canara Bank | | | 16,650 | | | | 20,231 | |
Cipla Ltd. | | | 15,062 | | | | 277,092 | |
Coal India Ltd. | | | 45,554 | | | | 244,350 | |
Colgate-Palmolive India Ltd. | | | 3,104 | | | | 112,894 | |
Cummins India Ltd. | | | 3,820 | | | | 158,454 | |
DLF Ltd. | | | 3,876 | | | | 37,677 | |
Dr. Reddy’s Laboratories Ltd. | | | 15,005 | | | | 226,962 | |
GAIL India Ltd. | | | 9,144 | | | | 21,666 | |
HCL Technologies Ltd. | | | 15,705 | | | | 328,621 | |
HDFC Asset Management Co. Ltd., 144A | | | 5,180 | | | | 264,343 | |
HDFC Bank Ltd. | | | 7,486 | | | | 153,873 | |
Hindalco Industries Ltd. | | | 24,459 | | | | 198,470 | |
Hindustan Aeronautics Ltd. | | | 4,625 | | | | 232,739 | |
ICICI Bank Ltd. | | | 10,606 | | | | 162,691 | |
Indraprastha Gas Ltd. | | | 1,764 | | | | 8,796 | |
Indus Towers Ltd.* | | | 5,798 | | | | 23,395 | |
Infosys Ltd. | | | 8,890 | | | | 185,487 | |
Infosys Ltd., ADR | | | 18,900 | | | | 395,199 | |
InterGlobe Aviation Ltd., 144A* | | | 1,271 | | | | 61,058 | |
LTIMindtree Ltd., 144A | | | 1,270 | | | | 85,939 | |
Lupin Ltd. | | | 3,901 | | | | 101,218 | |
Mahindra & Mahindra Ltd. | | | 1,075 | | | | 34,714 | |
Mankind Pharma Ltd.* | | | 2,524 | | | | 79,872 | |
Maruti Suzuki India Ltd. | | | 1,925 | | | | 252,661 | |
Muthoot Finance Ltd. | | | 8,463 | | | | 193,766 | |
NMDC Ltd. | | | 18,256 | | | | 47,944 | |
Oil & Natural Gas Corp. Ltd. | | | 22,692 | | | | 71,564 | |
Persistent Systems Ltd. | | | 1,107 | | | | 70,484 | |
Power Finance Corp. Ltd. | | | 8,572 | | | | 46,051 | |
Reliance Industries Ltd. | | | 14,466 | | | | 228,736 | |
See Notes to Financial Statements.
PGIM Quant Solutions Emerging Markets Equity Fund 5
PGIM Quant Solutions Emerging Markets Equity Fund
Schedule of Investments (continued)
as of October 31, 2024
| | | | | | | | |
| | |
| Description | | Shares | | | Value | |
| | |
COMMON STOCKS (Continued) | | | | | | | | |
| | |
India (cont’d.) | | | | | | | | |
| | |
Samvardhana Motherson International Ltd. | | | 18,976 | | | $ | 40,658 | |
Sun Pharmaceutical Industries Ltd. | | | 14,050 | | | | 308,331 | |
Suzlon Energy Ltd.* | | | 10,274 | | | | 8,147 | |
Tata Consultancy Services Ltd. | | | 984 | | | | 46,285 | |
Tata Motors Ltd. | | | 13,756 | | | | 136,061 | |
Tech Mahindra Ltd. | | | 3,072 | | | | 58,473 | |
Torrent Pharmaceuticals Ltd. | | | 1,474 | | | | 56,028 | |
Trent Ltd. | | | 4,039 | | | | 341,307 | |
UTI Asset Management Co. Ltd. | | | 2,254 | | | | 35,650 | |
Vedanta Ltd. | | | 43,582 | | | | 239,905 | |
Wipro Ltd. | | | 32,122 | | | | 209,095 | |
Zydus Lifesciences Ltd. | | | 6,277 | | | | 74,558 | |
| | | | | | | | |
| | |
| | | | | | | 6,608,198 | |
| | |
Indonesia 1.9% | | | | | | | | |
| | |
Adaro Energy Indonesia Tbk PT | | | 1,197,500 | | | | 275,621 | |
Astra International Tbk PT | | | 238,800 | | | | 77,526 | |
Bank Central Asia Tbk PT | | | 151,800 | | | | 99,137 | |
Bank Mandiri Persero Tbk PT | | | 230,500 | | | | 97,851 | |
Indofood Sukses Makmur Tbk PT | | | 420,900 | | | | 203,644 | |
United Tractors Tbk PT | | | 21,200 | | | | 37,005 | |
| | | | | | | | |
| | |
| | | | | | | 790,784 | |
| | |
Kuwait 0.0% | | | | | | | | |
| | |
Mobile Telecommunications Co. KSCP | | | 13,175 | | | | 19,600 | |
| | |
Luxembourg 0.3% | | | | | | | | |
| | |
Reinet Investments SCA | | | 4,408 | | | | 122,963 | |
| | |
Malaysia 1.2% | | | | | | | | |
| | |
AMMB Holdings Bhd | | | 84,000 | | | | 97,519 | |
CIMB Group Holdings Bhd | | | 57,800 | | | | 104,810 | |
Hong Leong Bank Bhd | | | 8,100 | | | | 37,789 | |
IHH Healthcare Bhd | | | 5,600 | | | | 9,268 | |
Malayan Banking Bhd | | | 47,400 | | | | 113,514 | |
Telekom Malaysia Bhd | | | 33,100 | | | | 49,004 | |
YTL Corp. Bhd | | | 13,000 | | | | 5,811 | |
YTL Power International Bhd | | | 141,600 | | | | 98,632 | |
| | | | | | | | |
| | |
| | | | | | | 516,347 | |
See Notes to Financial Statements.
6
PGIM Quant Solutions Emerging Markets Equity Fund
Schedule of Investments (continued)
as of October 31, 2024
| | | | | | | | |
| | |
| Description | | Shares | | | Value | |
| | |
COMMON STOCKS (Continued) | | | | | | | | |
| | |
Mexico 1.3% | | | | | | | | |
| | |
America Movil SAB de CV (Class B Stock) | | | 9,900 | | | $ | 7,832 | |
Banco del Bajio SA, 144A | | | 86,000 | | | | 190,700 | |
Grupo Financiero Banorte SAB de CV (Class O Stock) | | | 9,700 | | | | 67,698 | |
Grupo Financiero Inbursa SAB de CV (Class O Stock)* | | | 8,100 | | | | 18,006 | |
Grupo Mexico SAB de CV (Class B Stock) | | | 19,900 | | | | 104,416 | |
Prologis Property Mexico SA de CV, REIT | | | 39,600 | | | | 132,597 | |
Promotora y Operadora de Infraestructura SAB de CV | | | 3,920 | | | | 34,154 | |
| | | | | | | | |
| | |
| | | | | | | 555,403 | |
| | |
Philippines 0.4% | | | | | | | | |
| | |
Converge Information & Communications Technology Solutions, Inc. | | | 65,000 | | | | 17,949 | |
International Container Terminal Services, Inc. | | | 9,930 | | | | 67,482 | |
Manila Electric Co. | | | 3,340 | | | | 28,164 | |
PLDT, Inc. | | | 2,220 | | | | 54,558 | |
| | | | | | | | |
| | |
| | | | | | | 168,153 | |
| | |
Poland 1.2% | | | | | | | | |
| | |
Alior Bank SA | | | 348 | | | | 7,605 | |
Bank Polska Kasa Opieki SA | | | 5,038 | | | | 176,261 | |
Budimex SA | | | 64 | | | | 8,004 | |
Powszechna Kasa Oszczednosci Bank Polski SA | | | 5,368 | | | | 74,584 | |
Powszechny Zaklad Ubezpieczen SA | | | 6,365 | | | | 63,123 | |
Santander Bank Polska SA | | | 1,433 | | | | 160,694 | |
| | | | | | | | |
| | |
| | | | | | | 490,271 | |
| | |
Qatar 0.9% | | | | | | | | |
| | |
Ooredoo QPSC | | | 94,126 | | | | 295,411 | |
Qatar National Bank QPSC | | | 10,956 | | | | 52,146 | |
Vodafone Qatar QSC | | | 36,648 | | | | 18,722 | |
| | | | | | | | |
| | |
| | | | | | | 366,279 | |
| | |
Russia 0.0% | | | | | | | | |
| | |
Inter RAO UES PJSC^ | | | 202,400 | | | | — | |
LUKOIL PJSC^ | | | 2,762 | | | | — | |
Magnit PJSC^ | | | 1,716 | | | | — | |
PhosAgro PJSC^ | | | 232 | | | | — | |
PhosAgro PJSC, GDR (XSTU)*^ | | | 4 | | | | — | |
PhosAgro PJSC, GDR (XLON)*^ | | | 2 | | | | — | |
See Notes to Financial Statements.
PGIM Quant Solutions Emerging Markets Equity Fund 7
PGIM Quant Solutions Emerging Markets Equity Fund
Schedule of Investments (continued)
as of October 31, 2024
| | | | | | | | |
| | |
| Description | | Shares | | | Value | |
| | |
COMMON STOCKS (Continued) | | | | | | | | |
| | |
Russia (cont’d.) | | | | | | | | |
| | |
Rosneft Oil Co. PJSC^ | | | 5,856 | | | $ | — | |
Sberbank of Russia PJSC^ | | | 55,364 | | | | — | |
Surgutneftegas PJSC^ | | | 38,400 | | | | — | |
| | | | | | | | |
| | |
| | | | | | | — | |
| | |
Saudi Arabia 2.2% | | | | | | | | |
| | |
Al Rajhi Bank | | | 7,456 | | | | 174,214 | |
Almarai Co. JSC | | | 1,324 | | | | 19,387 | |
Dr. Sulaiman Al Habib Medical Services Group Co. | | | 451 | | | | 34,355 | |
Etihad Etisalat Co. | | | 17,581 | | | | 242,065 | |
Jamjoom Pharmaceuticals Factory Co. | | | 196 | | | | 8,824 | |
Jarir Marketing Co. | | | 10,032 | | | | 35,273 | |
Nahdi Medical Co. | | | 3,970 | | | | 130,294 | |
Riyad Bank | | | 5,148 | | | | 35,188 | |
SAL Saudi Logistics Services | | | 810 | | | | 59,340 | |
Saudi Awwal Bank | | | 6,734 | | | | 60,615 | |
Saudi Telecom Co. | | | 14,196 | | | | 159,325 | |
| | | | | | | | |
| | |
| | | | | | | 958,880 | |
| | |
South Africa 2.1% | | | | | | | | |
| | |
Absa Group Ltd. | | | 883 | | | | 8,462 | |
FirstRand Ltd. | | | 3,285 | | | | 14,433 | |
Harmony Gold Mining Co. Ltd. | | | 27,972 | | | | 303,479 | |
Kumba Iron Ore Ltd. | | | 3,546 | | | | 67,153 | |
Naspers Ltd. (Class N Stock) | | | 96 | | | | 22,689 | |
Nedbank Group Ltd. | | | 16,725 | | | | 283,480 | |
Old Mutual Ltd. | | | 27,166 | | | | 18,753 | |
Standard Bank Group Ltd. | | | 11,533 | | | | 158,781 | |
| | | | | | | | |
| | |
| | | | | | | 877,230 | |
| | |
South Korea 10.4% | | | | | | | | |
| | |
BNK Financial Group, Inc. | | | 1,751 | | | | 11,940 | |
CJ CheilJedang Corp. | | | 254 | | | | 50,256 | |
Coway Co. Ltd. | | | 272 | | | | 12,427 | |
DB Insurance Co. Ltd. | | | 869 | | | | 68,494 | |
Hana Financial Group, Inc. | | | 4,079 | | | | 175,986 | |
Hankook Tire & Technology Co. Ltd. | | | 7,920 | | | | 201,711 | |
Hanmi Semiconductor Co. Ltd. | | | 272 | | | | 17,696 | |
HD Hyundai Electric Co. Ltd. | | | 276 | | | | 64,599 | |
See Notes to Financial Statements.
8
PGIM Quant Solutions Emerging Markets Equity Fund
Schedule of Investments (continued)
as of October 31, 2024
| | | | | | | | |
| | |
| Description | | Shares | | | Value | |
| | |
COMMON STOCKS (Continued) | | | | | | | | |
| | |
South Korea (cont’d.) | | | | | | | | |
| | |
HD Hyundai Heavy Industries Co. Ltd.* | | | 96 | | | $ | 12,641 | |
HD Korea Shipbuilding & Offshore Engineering Co. Ltd.* | | | 470 | | | | 62,186 | |
Hyundai Glovis Co. Ltd. | | | 2,486 | | | | 218,724 | |
Hyundai Mobis Co. Ltd. | | | 358 | | | | 64,344 | |
JB Financial Group Co. Ltd. | | | 1,675 | | | | 21,730 | |
KB Financial Group, Inc. | | | 5,804 | | | | 377,659 | |
Kia Corp. | | | 4,304 | | | | 284,619 | |
Korea Electric Power Corp.* | | | 7,296 | | | | 121,979 | |
Korea Investment Holdings Co. Ltd. | | | 548 | | | | 30,413 | |
Krafton, Inc.* | | | 150 | | | | 35,861 | |
KT Corp. | | | 3,221 | | | | 102,702 | |
KT&G Corp. | | | 3,757 | | | | 298,434 | |
NH Investment & Securities Co. Ltd. | | | 832 | | | | 8,012 | |
Orion Corp. | | | 369 | | | | 26,594 | |
Samsung Electronics Co. Ltd. | | | 18,448 | | | | 783,320 | |
Samsung Life Insurance Co. Ltd. | | | 2,842 | | | | 207,962 | |
Samsung Securities Co. Ltd. | | | 5,450 | | | | 179,846 | |
Shinhan Financial Group Co. Ltd. | | | 7,888 | | | | 293,830 | |
SK Hynix, Inc. | | | 3,878 | | | | 507,684 | |
SK Telecom Co. Ltd. | | | 2,725 | | | | 111,832 | |
Woori Financial Group, Inc. | | | 6,955 | | | | 77,430 | |
| | | | | | | | |
| | |
| | | | | | | 4,430,911 | |
| | |
Taiwan 16.9% | | | | | | | | |
| | |
Accton Technology Corp. | | | 2,000 | | | | 33,607 | |
Asia Vital Components Co. Ltd. | | | 4,000 | | | | 76,627 | |
Asustek Computer, Inc. | | | 13,000 | | | | 229,553 | |
Catcher Technology Co. Ltd. | | | 4,000 | | | | 29,113 | |
Cathay Financial Holding Co. Ltd. | | | 26,000 | | | | 54,911 | |
China Airlines Ltd. | | | 15,000 | | | | 10,461 | |
Compal Electronics, Inc. | | | 21,000 | | | | 23,053 | |
Delta Electronics, Inc. | | | 17,000 | | | | 209,965 | |
Eva Airways Corp. | | | 240,000 | | | | 277,176 | |
Evergreen Marine Corp. Taiwan Ltd. | | | 24,000 | | | | 152,067 | |
Far Eastern New Century Corp. | | | 15,000 | | | | 17,309 | |
Hon Hai Precision Industry Co. Ltd. | | | 89,000 | | | | 570,465 | |
MediaTek, Inc. | | | 11,000 | | | | 428,210 | |
Nien Made Enterprise Co. Ltd. | | | 3,000 | | | | 44,704 | |
Pegatron Corp. | | | 18,000 | | | | 54,579 | |
President Chain Store Corp. | | | 11,000 | | | | 101,000 | |
Quanta Computer, Inc. | | | 42,000 | | | | 381,416 | |
See Notes to Financial Statements.
PGIM Quant Solutions Emerging Markets Equity Fund 9
PGIM Quant Solutions Emerging Markets Equity Fund
Schedule of Investments (continued)
as of October 31, 2024
| | | | | | | | |
| | |
| Description | | Shares | | | Value | |
| | |
COMMON STOCKS (Continued) | | | | | | | | |
| | |
Taiwan (cont’d.) | | | | | | | | |
| | |
Realtek Semiconductor Corp. | | | 13,000 | | | $ | 190,742 | |
Synnex Technology International Corp. | | | 4,000 | | | | 8,786 | |
Taiwan Semiconductor Manufacturing Co. Ltd. | | | 130,000 | | | | 4,076,733 | |
United Microelectronics Corp. | | | 82,000 | | | | 118,305 | |
Yang Ming Marine Transport Corp. | | | 20,000 | | | | 41,060 | |
Yuanta Financial Holding Co. Ltd. | | | 107,460 | | | | 107,779 | |
| | | | | | | | |
| | |
| | | | | | | 7,237,621 | |
| | |
Thailand 2.3% | | | | | | | | |
| | |
Bangkok Dusit Medical Services PCL | | | 58,400 | | | | 47,604 | |
Bumrungrad Hospital PCL | | | 30,500 | | | | 246,154 | |
Central Pattana PCL | | | 103,800 | | | | 193,120 | |
CP ALL PCL | | | 31,200 | | | | 58,481 | |
Intouch Holdings PCL | | | 12,600 | | | | 39,949 | |
Kasikornbank PCL | | | 59,500 | | | | 257,885 | |
Krung Thai Bank PCL | | | 18,000 | | | | 10,933 | |
PTT PCL | | | 32,000 | | | | 31,791 | |
TMBThanachart Bank PCL | | | 1,957,200 | | | | 103,268 | |
| | | | | | | | |
| | |
| | | | | | | 989,185 | |
| | |
Turkey 1.1% | | | | | | | | |
| | |
Anadolu Efes Biracilik Ve Malt Sanayii A/S | | | 14,858 | | | | 83,026 | |
BIM Birlesik Magazalar A/S | | | 6,114 | | | | 83,424 | |
Coca-Cola Icecek A/S | | | 116,591 | | | | 173,194 | |
Turk Hava Yollari AO* | | | 13,028 | | | | 103,618 | |
Turkcell Iletisim Hizmetleri A/S | | | 9,570 | | | | 23,663 | |
Turkiye Is Bankasi A/S (Class C Stock) | | | 1 | | | | — | |
Turkiye Petrol Rafinerileri A/S | | | 5,264 | | | | 22,243 | |
| | | | | | | | |
| | |
| | | | | | | 489,168 | |
| | |
United Arab Emirates 2.9% | | | | | | | | |
| | |
Abu Dhabi Islamic Bank PJSC | | | 82,848 | | | | 283,976 | |
Abu Dhabi National Oil Co. for Distribution PJSC | | | 30,927 | | | | 30,352 | |
Aldar Properties PJSC | | | 78,263 | | | | 162,224 | |
Dubai Islamic Bank PJSC | | | 10,397 | | | | 17,667 | |
Emaar Properties PJSC | | | 140,884 | | | | 333,098 | |
Emirates NBD Bank PJSC | | | 60,638 | | | | 313,424 | |
First Abu Dhabi Bank PJSC | | | 22,601 | | | | 80,769 | |
| | | | | | | | |
| | |
| | | | | | | 1,221,510 | |
See Notes to Financial Statements.
10
PGIM Quant Solutions Emerging Markets Equity Fund
Schedule of Investments (continued)
as of October 31, 2024
| | | | | | | | |
| | |
| Description | | Shares | | | Value | |
| | |
COMMON STOCKS (Continued) | | | | | | | | |
| | |
United Kingdom 0.1% | | | | | | | | |
| | |
Anglogold Ashanti PLC | | | 2,025 | | | $ | 56,496 | |
| | |
United States 0.3% | | | | | | | | |
| | |
JBS SA | | | 21,400 | | | | 133,933 | |
| | | | | | | | |
| | |
TOTAL COMMON STOCKS | | | | | | | | |
(cost $30,203,445) | | | | | | | 38,265,184 | |
| | | | | | | | |
| | |
PREFERRED STOCKS 3.0% | | | | | | | | |
| | |
Brazil 2.6% | | | | | | | | |
| | |
Banco ABC Brasil SA (PRFC) | | | 3,700 | | | | 13,447 | |
Cia Energetica de Minas Gerais (PRFC) | | | 85,537 | | | | 167,940 | |
Gerdau SA (PRFC) | | | 65,694 | | | | 207,506 | |
Itau Unibanco Holding SA (PRFC) | | | 59,300 | | | | 360,566 | |
Metalurgica Gerdau SA (PRFC) | | | 6,400 | | | | 11,370 | |
Petroleo Brasileiro SA (PRFC) | | | 57,300 | | | | 355,245 | |
| | | | | | | | |
| | |
| | | | | | | 1,116,074 | |
| | |
Russia 0.0% | | | | | | | | |
| | |
Surgutneftegas PJSC (PRFC)^ | | | 38,200 | | | | — | |
| | |
South Korea 0.4% | | | | | | | | |
| | |
Hyundai Motor Co. (2nd PRFC) | | | 200 | | | | 23,107 | |
Hyundai Motor Co. (PRFC) | | | 128 | | | | 14,455 | |
Samsung Electronics Co. Ltd. (PRFC) | | | 4,194 | | | | 144,275 | |
| | | | | | | | |
| | |
| | | | | | | 181,837 | |
| | | | | | | | |
| | |
TOTAL PREFERRED STOCKS | | | | | | | | |
(cost $1,178,883) | | | | | | | 1,297,911 | |
| | | | | | | | |
| | |
UNAFFILIATED EXCHANGE-TRADED FUND 0.3% | | | | | | | | |
| | |
United States | | | | | | | | |
| | |
iShares MSCI Emerging Markets ETF(a)
(cost $127,748) | | | 3,000 | | | | 133,350 | |
| | | | | | | | |
| | |
TOTAL LONG-TERM INVESTMENTS | | | | | | | | |
(cost $31,510,076) | | | | | | | 39,696,445 | |
| | | | | | | | |
See Notes to Financial Statements.
PGIM Quant Solutions Emerging Markets Equity Fund 11
PGIM Quant Solutions Emerging Markets Equity Fund
Schedule of Investments (continued)
as of October 31, 2024
| | | | | | | | |
| | |
| Description | | Shares | | | Value | |
| | |
SHORT-TERM INVESTMENTS 7.7% | | | | | | | | |
| | |
AFFILIATED MUTUAL FUNDS 7.5% | | | | | | | | |
PGIM Core Government Money Market Fund (7-day effective yield 5.011%)(wb) | | | 2,900,286 | | | $ | 2,900,286 | |
PGIM Institutional Money Market Fund (7-day effective yield 5.096%) (cost $302,980; includes $301,281 of cash collateral for securities on loan)(b)(wb) | | | 303,132 | | | | 302,980 | |
| | | | | | | | |
| | |
TOTAL AFFILIATED MUTUAL FUNDS | | | | | | | | |
(cost $3,203,266) | | | | | | | 3,203,266 | |
| | | | | | | | |
| | | | | | | | | | | | | | | | |
| | | Interest
Rate | | | Maturity
Date | | | Principal
Amount
(000)# | | | | |
| | | | |
U.S. TREASURY OBLIGATION(k)(n) 0.2% | | | | | | | | | | | | | | | | |
U.S. Treasury Bills | | | | | | | | | | | | | | | | |
(cost $69,558) | | | 4.799% | | | | 12/19/24 | | | | 70 | | | | 69,576 | |
| | | | | | | | | | | | | | | | |
| | | | |
TOTAL SHORT-TERM INVESTMENTS | | | | | | | | | | | | | | | | |
(cost $3,272,824) | | | | | | | | | | | | | | | 3,272,842 | |
| | | | | | | | | | | | | | | | |
| | | | |
TOTAL INVESTMENTS 100.6% | | | | | | | | | | | | | | | | |
(cost $34,782,900) | | | | | | | | | | | | | | | 42,969,287 | |
Liabilities in excess of other assets(z) (0.6)% | | | | | | | | | | | | | | | (237,088 | ) |
| | | | | | | | | | | | | | | | |
| | | | |
NET ASSETS 100.0% | | | | | | | | | | | | | | $ | 42,732,199 | |
| | | | | | | | | | | | | | | | |
See the Glossary for a list of the abbreviation(s) used in the annual report.
| * | Non-income producing security. |
| # | Principal amount is shown in U.S. dollars unless otherwise stated. |
| ^ | Indicates a Level 3 instrument. The aggregate value of Level 3 instruments is $0 and 0.0% of net assets. |
| (a) | All or a portion of security is on loan. The aggregate market value of such securities, including those sold and pending settlement, is $293,531; cash collateral of $301,281 (included in liabilities) was received with which the Fund purchased highly liquid short-term investments. In the event of significant appreciation in value of securities on loan on the last business day of the reporting period, the Fund may reflect a collateral value that is less than the market value of the loaned securities and such shortfall is remedied the following business day. |
| (b) | Represents security, or portion thereof, purchased with cash collateral received for securities on loan and includes dividend reinvestment. |
| (k) | Represents security, or a portion thereof, segregated as collateral for centrally cleared/exchange-traded derivatives. |
| (n) | Rate shown reflects yield to maturity at purchased date. |
| (wb) | Represents an investment in a Fund affiliated with the Manager. |
| (z) | Includes net unrealized appreciation/(depreciation) and/or market value of the below holdings which are excluded from the Schedule of Investments: |
See Notes to Financial Statements.
12
PGIM Quant Solutions Emerging Markets Equity Fund
Schedule of Investments (continued)
as of October 31, 2024
Futures contracts outstanding at October 31, 2024:
| | | | | | | | | | | | | | | | | | | | | | |
Number
of
Contracts | | Type | | Expiration
Date | | | Current
Notional
Amount | | | Value /
Unrealized
Appreciation
(Depreciation) | |
Long Position: | | | | | | | | | | | | | | | | | | | | |
53 | | Mini MSCI Emerging Markets Index | | | Dec. 2024 | | | $ | 2,985,225 | | | | | | | $ | 20,289 | | | | | |
| | | | | | | | | | | | | | | | | | | | | | |
Summary of Collateral for Centrally Cleared/Exchange-traded Derivatives:
Cash and securities segregated as collateral, including pending settlement for closed positions, to cover requirements for centrally cleared/exchange-traded derivatives are listed by broker as follows:
| | | | | | | | | | | | | | | | | | | | | | | | |
Broker | | Cash and/or Foreign Currency | | | Securities Market Value | |
MSC | | | | | | $ | — | | | | | | | | | | | $ | 69,576 | | | | | |
| | | | | | | | | | | | | | | | | | | | | | | | |
Fair Value Measurements:
Various inputs are used in determining the value of the Fund’s investments. These inputs are summarized in the three broad levels listed below.
Level 1—unadjusted quoted prices generally in active markets for identical securities.
Level 2—quoted prices for similar securities, interest rates and yield curves, prepayment speeds, foreign currency exchange rates and other observable inputs.
Level 3—unobservable inputs for securities valued in accordance with Board approved fair valuation procedures.
The following is a summary of the inputs used as of October 31, 2024 in valuing such portfolio securities:
| | | | | | | | | | | | | | | | | | | | |
| | | Level 1 | | | Level 2 | | | Level 3 | |
Investments in Securities | | | | | | | | | | | | | | | | | | | | |
Assets | | | | | | | | | | | | | | | | | | | | |
Long-Term Investments | | | | | | | | | | | | | | | | | | | | |
Common Stocks | | | | | | | | | | | | | | | | | | | | |
Brazil | | $ | 1,320,549 | | | $ | — | | | | | | | $ | — | | | | | |
Chile | | | 145,153 | | | | 164,577 | | | | | | | | — | | | | | |
China | | | 1,127,245 | | | | 9,394,999 | | | | | | | | — | | | | | |
Colombia | | | 11,451 | | | | — | | | | | | | | — | | | | | |
Greece | | | — | | | | 68,278 | | | | | | | | — | | | | | |
India | | | 395,199 | | | | 6,212,999 | | | | | | | | — | | | | | |
Indonesia | | | 99,137 | | | | 691,647 | | | | | | | | — | | | | | |
Kuwait | | | — | | | | 19,600 | | | | | | | | — | | | | | |
Luxembourg | | | — | | | | 122,963 | | | | | | | | — | | | | | |
Malaysia | | | — | | | | 516,347 | | | | | | | | — | | | | | |
Mexico | | | 555,403 | | | | — | | | | | | | | — | | | | | |
See Notes to Financial Statements.
PGIM Quant Solutions Emerging Markets Equity Fund 13
PGIM Quant Solutions Emerging Markets Equity Fund
Schedule of Investments (continued)
as of October 31, 2024
| | | | | | | | | | | | | | | | | | | | |
| | | Level 1 | | | Level 2 | | | Level 3 | |
Investments in Securities (continued) | | | | | | | | | | | | | | | | | | | | |
Assets (continued) | | | | | | | | | | | | | | | | | | | | |
Long-Term Investments (continued) | | | | | | | | | | | | | | | | | | | | |
Common Stocks (continued) | | | | | | | | | | | | | | | | | | | | |
Philippines | | $ | 28,164 | | | $ | 139,989 | | | | | | | $ | — | | | | | |
Poland | | | — | | | | 490,271 | | | | | | | | — | | | | | |
Qatar | | | 18,722 | | | | 347,557 | | | | | | | | — | | | | | |
Russia | | | — | | | | — | | | | | | | | — | ** | | | | |
Saudi Arabia | | | — | | | | 958,880 | | | | | | | | — | | | | | |
South Africa | | | — | | | | 877,230 | | | | | | | | — | | | | | |
South Korea | | | — | | | | 4,430,911 | | | | | | | | — | | | | | |
Taiwan | | | — | | | | 7,237,621 | | | | | | | | — | | | | | |
Thailand | | | — | | | | 989,185 | | | | | | | | — | | | | | |
Turkey | | | 173,194 | | | | 315,974 | | | | | | | | — | | | | | |
United Arab Emirates | | | — | | | | 1,221,510 | | | | | | | | — | | | | | |
United Kingdom | | | — | | | | 56,496 | | | | | | | | — | | | | | |
United States | | | 133,933 | | | | — | | | | | | | | — | | | | | |
Preferred Stocks | | | | | | | | | | | | | | | | | | | | |
Brazil | | | 1,116,074 | | | | — | | | | | | | | — | | | | | |
Russia | | | — | | | | — | | | | | | | | — | ** | | | | |
South Korea | | | — | | | | 181,837 | | | | | | | | — | | | | | |
Unaffiliated Exchange-Traded Fund | | | | | | | | | | | | | | | | | | | | |
United States | | | 133,350 | | | | — | | | | | | | | — | | | | | |
Short-Term Investments | | | | | | | | | | | | | | | | | | | | |
Affiliated Mutual Funds | | | 3,203,266 | | | | — | | | | | | | | — | | | | | |
U.S. Treasury Obligation | | | — | | | | 69,576 | | | | | | | | — | | | | | |
| | | | | | | | | | | | | | | | | | | | |
| | | | | |
Total | | $ | 8,460,840 | | | $ | 34,508,447 | | | | | | | $ | — | ** | | | | |
| | | | | | | | | | | | |
| | | | | |
Other Financial Instruments* | | | | | | | | | | | | | | | | | | | | |
Assets | | | | | | | | | | | | | | | | | | | | |
Futures Contracts | | $ | 20,289 | | | $ | — | | | | | | | $ | — | | | | | |
| | | | | | | | | | | | |
| * | Other financial instruments are derivative instruments not reflected in the Schedule of Investments, such as futures, forwards and centrally cleared swap contracts, which are recorded at unrealized appreciation (depreciation) on the instrument, and OTC swap contracts which are recorded at fair value. |
| ** | Includes Level 3 investments with an aggregate value of $0. |
Industry Classification:
The industry classification of investments and liabilities in excess of other assets shown as a percentage of net assets as of October 31, 2024 were as follows:
| | | | |
Banks | | | 15.1 | % |
Semiconductors & Semiconductor Equipment | | | 12.5 | |
See Notes to Financial Statements.
14
PGIM Quant Solutions Emerging Markets Equity Fund
Schedule of Investments (continued)
as of October 31, 2024
Industry Classification (continued):
| | | | |
Affiliated Mutual Funds (0.7% represents investments purchased with collateral from securities on loan) | | | 7.5 | % |
Metals & Mining | | | 5.1 | |
Interactive Media & Services | | | 5.0 | |
Technology Hardware, Storage & Peripherals | | | 4.6 | |
Broadline Retail | | | 4.2 | |
Oil, Gas & Consumable Fuels | | | 3.4 | |
IT Services | | | 3.2 | |
Insurance | | | 3.2 | |
Pharmaceuticals | | | 3.2 | |
Hotels, Restaurants & Leisure | | | 2.4 | |
Automobiles | | | 2.4 | |
Real Estate Management & Development | | | 2.0 | |
Capital Markets | | | 1.9 | |
Electronic Equipment, Instruments & Components | | | 1.9 | |
Specialty Retail | | | 1.6 | |
Electric Utilities | | | 1.5 | |
Diversified Telecommunication Services | | | 1.5 | |
Electrical Equipment | | | 1.5 | |
Machinery | | | 1.3 | |
Food Products | | | 1.2 | |
Wireless Telecommunication Services | | | 1.2 | |
Passenger Airlines | | | 1.1 | |
Textiles, Apparel & Luxury Goods | | | 1.0 | |
Beverages | | | 0.9 | |
Consumer Staples Distribution & Retail | | | 0.9 | |
Aerospace & Defense | | | 0.8 | |
Health Care Providers & Services | | | 0.8 | |
Entertainment | | | 0.8 | |
Automobile Components | | | 0.8 | |
Marine Transportation | | | 0.7 | |
Tobacco | | | 0.7 | |
Air Freight & Logistics | | | 0.7 | |
Household Durables | | | 0.6 | |
Consumer Finance | | | 0.6 | |
Financial Services | | | 0.4 | |
Chemicals | | | 0.3 | |
Unaffiliated Exchange-Traded Fund | | | 0.3 | |
Industrial REITs | | | 0.3 | |
Personal Care Products | | | 0.3 | |
Multi-Utilities | | | 0.2 | |
Transportation Infrastructure | | | 0.2 | |
| | | | |
Industrial Conglomerates | | | 0.2 | % |
Communications Equipment | | | 0.2 | |
U.S. Treasury Obligation | | | 0.2 | |
Independent Power & Renewable Electricity Producers | | | 0.1 | |
Gas Utilities | | | 0.1 | |
Construction Materials | | | 0.0 | * |
Containers & Packaging | | | 0.0 | * |
Construction & Engineering | | | 0.0 | * |
| | | | |
| |
| | | 100.6 | |
Liabilities in excess of other assets | | | (0.6 | ) |
| | | | |
| |
| | | 100.0 | % |
| | | | |
See Notes to Financial Statements.
PGIM Quant Solutions Emerging Markets Equity Fund 15
PGIM Quant Solutions Emerging Markets Equity Fund
Schedule of Investments (continued)
as of October 31, 2024
Effects of Derivative Instruments on the Financial Statements and Primary Underlying Risk Exposure:
The Fund invested in derivative instruments during the reporting period. The primary type of risk associated with these derivative instruments is equity risk. See the Notes to Financial Statements for additional detail regarding these derivative instruments and their risks. The effect of such derivative instruments on the Fund’s financial position and financial performance as reflected in the Statement of Assets and Liabilities and Statement of Operations is presented in the summary below.
Fair values of derivative instruments as of October 31, 2024 as presented in the Statement of Assets and Liabilities:
| | | | | | | | | | | | | | | | | | | | |
| | | Asset Derivatives | | | Liability Derivatives | |
Derivatives not accounted for as hedging instruments, carried at fair value | | Statement of Assets and Liabilities Location | | Fair
Value | | | Statement of Assets and Liabilities Location | | Fair
Value | |
Equity contracts | | Due from/to broker-variation margin futures | | $ | 20,289 | * | | — | | | | | | $ | — | | | | | |
| | | | | | | | | | | | | | | | | | | | |
| * | Includes cumulative appreciation (depreciation) as reported in the schedule of open futures and centrally cleared swap contracts. Only unsettled variation margin receivable (payable) is reported within the Statement of Assets and Liabilities. |
The effects of derivative instruments on the Statement of Operations for the year ended October 31, 2024 are as follows:
| | | | |
Amount of Realized Gain (Loss) on Derivatives Recognized in Income | |
Derivatives not accounted for as hedging instruments, carried at fair value | | Futures | |
Equity contracts | | $ | 102,205 | |
| | | | |
| | | | |
Change in Unrealized Appreciation (Depreciation) on Derivatives Recognized in Income | |
Derivatives not accounted for as hedging instruments, carried at fair value | | Futures | |
Equity contracts | | $ | 83,233 | |
| | | | |
For the year ended October 31, 2024, the Fund’s average volume of derivative activities is as follows:
| | |
| Derivative Contract Type | | Average Volume of Derivative Activities* |
Futures Contracts - Long Positions (1) | | $1,474,700 |
| * | Average volume is based on average quarter end balances for the year ended October 31, 2024. |
| (1) | Notional Amount in USD. |
See Notes to Financial Statements.
16
PGIM Quant Solutions Emerging Markets Equity Fund
Schedule of Investments (continued)
as of October 31, 2024
| | | | | | |
| Description | | Gross Market
Value of
Recognized
Assets/(Liabilities) | | Collateral
Pledged/(Received)(1) | | Net
Amount |
Securities on Loan | | $293,531 | | $(293,531) | | $— |
| (1) | Collateral amount disclosed by the Fund is limited to the market value of financial instruments/transactions. |
See Notes to Financial Statements.
PGIM Quant Solutions Emerging Markets Equity Fund 17
PGIM Quant Solutions Emerging Markets Equity Fund
Statement of Assets & Liabilities
as of October 31, 2024
| | | | | | |
Assets | | | | | | |
| | |
Investments at value, including securities on loan of $293,531: | | | | | | |
Unaffiliated investments (cost $31,579,634) | | $ | 39,766,021 | | | |
Affiliated investments (cost $3,203,266) | | | 3,203,266 | | | |
Foreign currency, at value (cost $47,767) | | | 47,415 | | | |
Receivable for Fund shares sold | | | 223,303 | | | |
Dividends and interest receivable | | | 71,548 | | | |
Tax reclaim receivable | | | 5,445 | | | |
Prepaid expenses and other assets | | | 3,931 | | | |
| | | | | | |
| | |
Total Assets | | | 43,320,929 | | | |
| | | | | | |
Liabilities | | | | | | |
| | |
Payable to broker for collateral for securities on loan | | | 301,281 | | | |
Foreign capital gains tax liability accrued | | | 178,396 | | | |
Custodian and accounting fees payable | | | 32,519 | | | |
Audit fee payable | | | 31,166 | | | |
Accrued expenses and other liabilities | | | 20,065 | | | |
Payable for Fund shares purchased | | | 9,332 | | | |
Due to broker—variation margin futures | | | 8,387 | | | |
Management fee payable | | | 6,693 | | | |
Trustees’ fees payable | | | 826 | | | |
Affiliated transfer agent fee payable | | | 65 | | | |
| | | | | | |
| | |
Total Liabilities | | | 588,730 | | | |
| | | | | | |
| | |
Net Assets | | $ | 42,732,199 | | | |
| | | | | | |
| | | | | | |
| | |
Net assets were comprised of: | | | | | | |
Paid-in capital | | $ | 36,550,866 | | | |
Total distributable earnings (loss) | | | 6,181,333 | | | |
| | | | | | |
| | |
Net assets, October 31, 2024 | | $ | 42,732,199 | | | |
| | | | | | |
| | |
Class R6 | | | | | | |
| | |
Net asset value, offering price and redemption price per share, | | | | | | |
($42,732,199 ÷ 3,430,950 shares of beneficial interest issued and outstanding) | | $ | 12.45 | | | |
| | | | | | |
See Notes to Financial Statements.
18
PGIM Quant Solutions Emerging Markets Equity Fund
Statement of Operations
Year Ended October 31, 2024
| | | | |
Net Investment Income (Loss) | | | | |
| |
Income | | | | |
Unaffiliated dividend income (net of $188,152 foreign withholding tax) | | $ | 1,292,322 | |
Affiliated dividend income | | | 54,446 | |
Interest income | | | 3,982 | |
Income from securities lending, net (including affiliated income of $161) | | | 605 | |
| | | | |
| |
Total income | | | 1,351,355 | |
| | | | |
| |
Expenses | | | | |
Management fee | | | 291,149 | |
Custodian and accounting fees | | | 131,272 | |
Professional fees | | | 85,605 | |
Audit fee | | | 31,164 | |
Shareholders’ reports | | | 13,698 | |
Trustees’ fees | | | 10,097 | |
Transfer agent’s fees and expenses (including affiliated expense of $387) | | | 427 | |
Registration fees | | | 249 | |
Miscellaneous | | | 16,461 | |
| | | | |
| |
Total expenses | | | 580,122 | |
Less: Fee waiver and/or expense reimbursement | | | (112,911 | ) |
| | | | |
| |
Net expenses | | | 467,211 | |
| | | | |
| |
Net investment income (loss) | | | 884,144 | |
| | | | |
| |
Realized And Unrealized Gain (Loss) On Investment And Foreign Currency Transactions | | | | |
| |
Net realized gain (loss) on: | | | | |
Investment transactions (including affiliated of $(69)) (net of foreign capital gains taxes $(274,086)) | | | 2,229,054 | |
Futures transactions | | | 102,205 | |
Foreign currency transactions | | | (28,623 | ) |
| | | | |
| |
| | | 2,302,636 | |
| | | | |
| |
Net change in unrealized appreciation (depreciation) on: | | | | |
Investments (net of change in foreign capital gains taxes $(108,318)) | | | 5,716,244 | |
Futures | | | 83,233 | |
Foreign currencies | | | (3,745 | ) |
| | | | |
| |
| | | 5,795,732 | |
| | | | |
| |
Net gain (loss) on investment and foreign currency transactions | | | 8,098,368 | |
| | | | |
| |
Net Increase (Decrease) In Net Assets Resulting From Operations | | $ | 8,982,512 | |
| | | | |
See Notes to Financial Statements.
PGIM Quant Solutions Emerging Markets Equity Fund 19
PGIM Quant Solutions Emerging Markets Equity Fund
Statements of Changes in Net Assets
| | | | | | | | |
| |
| | | Year Ended
October 31, | |
| | |
| | | 2024 | | | 2023 | |
| | |
Increase (Decrease) in Net Assets | | | | | | | | |
| | |
Operations | | | | | | | | |
Net investment income (loss) | | $ | 884,144 | | | $ | 947,391 | |
Net realized gain (loss) on investment and foreign currency transactions | | | 2,302,636 | | | | (1,162,979 | ) |
Net change in unrealized appreciation (depreciation) on investments and foreign currencies | | | 5,795,732 | | | | 4,576,407 | |
| | | | | | | | |
| | |
Net increase (decrease) in net assets resulting from operations | | | 8,982,512 | | | | 4,360,819 | |
| | | | | | | | |
| | |
Dividends and Distributions | | | | | | | | |
Distributions from distributable earnings | | | | | | | | |
Class R6 | | | (1,306,279 | ) | | | (1,391,984 | ) |
| | | | | | | | |
| | |
Fund share transactions | | | | | | | | |
Net proceeds from shares sold (463,928 and 337,480 shares, respectively) | | | 5,528,953 | | | | 3,482,394 | |
Net asset value of shares issued in reinvestment of dividends and distributions (125,123 and 136,737 shares, respectively) | | | 1,306,279 | | | | 1,391,984 | |
Cost of shares purchased (640,346 and 437,103 shares, respectively) | | | (7,214,867 | ) | | | (4,588,650 | ) |
| | | | | | | | |
| | |
Net increase (decrease) in net assets from Fund share transactions | | | (379,635 | ) | | | 285,728 | |
| | | | | | | | |
Total increase (decrease) | | | 7,296,598 | | | | 3,254,563 | |
| | |
Net Assets: | | | | | | | | |
| | |
Beginning of year | | | 35,435,601 | | | | 32,181,038 | |
| | | | | | | | |
| | |
End of year | | $ | 42,732,199 | | | $ | 35,435,601 | |
| | | | | | | | |
See Notes to Financial Statements.
20
PGIM Quant Solutions Emerging Markets Equity Fund
Financial Highlights
| | | | | | | | | | | | | | | | | | | | |
| | | | | | |
| Class R6 Shares | | | | | | | | | | | | | | | | | | | | |
| | | Year Ended October 31, | |
| | | 2024 | | | 2023 | | | 2022 | | | 2021 | | | 2020 | |
| | | | | | |
| Per Share Operating Performance(a): | | | | | | | | | | | | | | | | | | | | |
| Net Asset Value, Beginning of Year | | | $10.18 | | | | $9.34 | | | | $12.83 | | | | $11.61 | | | | $11.14 | |
| Income (loss) from investment operations: | | | | | | | | | | | | | | | | | | | | |
| Net investment income (loss) | | | 0.26 | | | | 0.27 | | | | 0.38 | | | | 0.29 | | | | 0.18 | |
| Net realized and unrealized gain (loss) on investment and foreign currency transactions | | | 2.38 | | | | 0.98 | | | | (3.45 | ) | | | 1.11 | | | | 0.53 | |
| Total from investment operations | | | 2.64 | | | | 1.25 | | | | (3.07 | ) | | | 1.40 | | | | 0.71 | |
| Less Dividends and Distributions: | | | | | | | | | | | | | | | | | | | | |
| Dividends from net investment income | | | (0.37 | ) | | | (0.41 | ) | | | (0.35 | ) | | | (0.18 | ) | | | (0.24 | ) |
| Distributions from net realized gains | | | - | | | | - | | | | (0.07 | ) | | | - | | | | - | |
| Total dividends and distributions | | | (0.37 | ) | | | (0.41 | ) | | | (0.42 | ) | | | (0.18 | ) | | | (0.24 | ) |
| Net asset value, end of year | | | $12.45 | | | | $10.18 | | | | $9.34 | | | | $12.83 | | | | $11.61 | |
| Total Return(b): | | | 26.77 | % | | | 13.37 | % | | | (24.71 | )% | | | 12.08 | % | | | 6.42 | % |
| | | | | | | | | | | | | | | | | | | | | |
| | | | | | |
| Ratios/Supplemental Data: | | | | | | | | | | | | | | | | | | | | |
| Net assets, end of year (000) | | | $42,732 | | | | $35,436 | | | | $32,181 | | | | $41,893 | | | | $36,054 | |
| Average net assets (000) | | | $38,820 | | | | $37,262 | | | | $38,004 | | | | $45,007 | | | | $32,007 | |
| Ratios to average net assets(c): | | | | | | | | | | | | | | | | | | | | |
| Expenses after waivers and/or expense reimbursement | | | 1.20 | % | | | 1.21 | %(d) | | | 1.20 | % | | | 1.20 | % | | | 1.20 | % |
| Expenses before waivers and/or expense reimbursement | | | 1.49 | % | | | 1.61 | % | | | 1.54 | % | | | 1.42 | % | | | 1.53 | % |
| Net investment income (loss) | | | 2.28 | % | | | 2.54 | % | | | 3.36 | % | | | 2.15 | % | | | 1.66 | % |
| Portfolio turnover rate(e) | | | 96 | % | | | 101 | % | | | 101 | % | | | 108 | % | | | 106 | % |
| (a) | Calculated based on average shares outstanding during the year. |
| (b) | Total return is calculated assuming a purchase of a share on the first day and a sale on the last day of each year reported and includes reinvestment of dividends and distributions, if any. Total returns may reflect adjustments to conform to GAAP. |
| (c) | Does not include expenses of the underlying funds in which the Fund invests. |
| (d) | Includes certain non-recurring expenses of 0.01% which are being excluded from the Fund’s contractual waiver, if applicable, for the year ended October 31, 2023. |
| (e) | The Fund’s portfolio turnover rate is calculated in accordance with regulatory requirements, without regard to transactions involving short-term investments, certain derivatives and in-kind transactions (if any). If such transactions were included, the Fund’s portfolio turnover rate may be higher. |
See Notes to Financial Statements.
PGIM Quant Solutions Emerging Markets Equity Fund 21
PGIM Quant Solutions International Developed Markets Index Fund
Schedule of Investments
as of October 31, 2024
| | | | | | | | |
| | |
| Description | | Shares | | | Value | |
| | |
LONG-TERM INVESTMENTS 93.2% | | | | | | | | |
| | |
COMMON STOCKS 90.4% | | | | | | | | |
| | |
Australia 7.0% | | | | | | | | |
| | |
Ampol Ltd. | | | 492 | | | $ | 9,008 | |
ANZ Group Holdings Ltd. | | | 6,533 | | | | 133,146 | |
APA Group, UTS | | | 2,646 | | | | 12,115 | |
Aristocrat Leisure Ltd. | | | 1,234 | | | | 49,656 | |
ASX Ltd. | | | 419 | | | | 17,844 | |
BHP Group Ltd. | | | 11,011 | | | | 305,914 | |
BlueScope Steel Ltd. | | | 932 | | | | 12,385 | |
Brambles Ltd. | | | 3,015 | | | | 36,301 | |
CAR Group Ltd. | | | 782 | | | | 19,261 | |
Cochlear Ltd. | | | 139 | | | | 25,734 | |
Coles Group Ltd. | | | 2,899 | | | | 33,459 | |
Commonwealth Bank of Australia | | | 3,634 | | | | 338,959 | |
Computershare Ltd. | | | 1,121 | | | | 19,379 | |
Dexus, REIT | | | 2,218 | | | | 10,410 | |
Endeavour Group Ltd. | | | 3,200 | | | | 9,844 | |
Fortescue Ltd. | | | 3,623 | | | | 45,370 | |
Glencore PLC* | | | 22,516 | | | | 118,088 | |
Goodman Group, REIT | | | 3,700 | | | | 88,354 | |
GPT Group (The), REIT | | | 4,147 | | | | 12,848 | |
Insurance Australia Group Ltd. | | | 5,026 | | | | 24,680 | |
Lottery Corp. Ltd. (The) | | | 4,818 | | | | 15,743 | |
Macquarie Group Ltd. | | | 785 | | | | 118,807 | |
Medibank Private Ltd. | | | 5,961 | | | | 14,009 | |
Mineral Resources Ltd. | | | 384 | | | | 9,868 | |
Mirvac Group, REIT | | | 8,139 | | | | 11,378 | |
National Australia Bank Ltd. | | | 6,693 | | | | 169,635 | |
Northern Star Resources Ltd. | | | 2,459 | | | | 28,535 | |
Orica Ltd. | | | 1,016 | | | | 11,541 | |
Origin Energy Ltd. | | | 3,686 | | | | 23,274 | |
Pilbara Minerals Ltd.* | | | 5,897 | | | | 10,922 | |
Pro Medicus Ltd. | | | 120 | | | | 15,201 | |
Qantas Airways Ltd.* | | | 1,743 | | | | 9,228 | |
QBE Insurance Group Ltd. | | | 3,241 | | | | 36,591 | |
Ramsay Health Care Ltd. | | | 378 | | | | 9,942 | |
REA Group Ltd. | | | 115 | | | | 17,001 | |
Reece Ltd. | | | 466 | | | | 6,944 | |
Rio Tinto Ltd. | | | 801 | | | | 62,893 | |
Rio Tinto PLC | | | 2,448 | | | | 158,209 | |
Santos Ltd. | | | 7,030 | | | | 31,276 | |
Scentre Group, REIT | | | 11,114 | | | | 25,481 | |
SEEK Ltd. | | | 734 | | | | 11,925 | |
Seven Group Holdings Ltd. | | | 441 | | | | 12,015 | |
See Notes to Financial Statements.
22
PGIM Quant Solutions International Developed Markets Index Fund
Schedule of Investments (continued)
as of October 31, 2024
| | | | | | | | |
| | |
| Description | | Shares | | | Value | |
| | |
COMMON STOCKS (Continued) | | | | | | | | |
| | |
Australia (cont’d.) | | | | | | | | |
| | |
Sonic Healthcare Ltd. | | | 977 | | | $ | 17,215 | |
South32 Ltd. | | | 9,770 | | | | 23,430 | |
Stockland, REIT | | | 5,167 | | | | 17,473 | |
Suncorp Group Ltd. | | | 2,754 | | | | 32,305 | |
Telstra Group Ltd. | | | 8,652 | | | | 21,660 | |
Transurban Group, UTS | | | 6,714 | | | | 55,954 | |
Treasury Wine Estates Ltd. | | | 1,751 | | | | 13,000 | |
Vicinity Ltd., REIT | | | 7,981 | | | | 11,346 | |
Washington H Soul Pattinson & Co. Ltd. | | | 484 | | | | 10,606 | |
Wesfarmers Ltd. | | | 2,464 | | | | 108,394 | |
Westpac Banking Corp. | | | 7,492 | | | | 157,345 | |
WiseTech Global Ltd. | | | 357 | | | | 27,410 | |
Woodside Energy Group Ltd. | | | 4,110 | | | | 64,685 | |
Woolworths Group Ltd. | | | 2,644 | | | | 51,857 | |
| | | | | | | | |
| | |
| | | | | | | 2,745,853 | |
| | |
Austria 0.2% | | | | | | | | |
| | |
Erste Group Bank AG | | | 726 | | | | 41,067 | |
Mondi PLC | | | 952 | | | | 15,416 | |
OMV AG | | | 319 | | | | 13,219 | |
Verbund AG | | | 141 | | | | 11,612 | |
voestalpine AG | | | 239 | | | | 4,975 | |
| | | | | | | | |
| | |
| | | | | | | 86,289 | |
| | |
Belgium 0.8% | | | | | | | | |
| | |
Ageas SA/NV | | | 346 | | | | 18,057 | |
Anheuser-Busch InBev SA/NV | | | 1,951 | | | | 115,678 | |
D’ieteren Group | | | 48 | | | | 10,392 | |
Elia Group SA/NV | | | 61 | | | | 5,804 | |
Groupe Bruxelles Lambert NV | | | 181 | | | | 13,078 | |
KBC Group NV | | | 497 | | | | 36,202 | |
Lotus Bakeries NV | | | 1 | | | | 13,108 | |
Sofina SA | | | 32 | | | | 7,846 | |
Syensqo SA | | | 162 | | | | 12,567 | |
UCB SA | | | 273 | | | | 52,566 | |
Warehouses De Pauw CVA, REIT | | | 388 | | | | 9,234 | |
| | | | | | | | |
| | |
| | | | | | | 294,532 | |
See Notes to Financial Statements.
PGIM Quant Solutions International Developed Markets Index Fund 23
PGIM Quant Solutions International Developed Markets Index Fund
Schedule of Investments (continued)
as of October 31, 2024
| | | | | | | | |
| | |
| Description | | Shares | | | Value | |
| | |
COMMON STOCKS (Continued) | | | | | | | | |
| | |
Brazil 0.0% | | | | | | | | |
| | |
Yara International ASA | | | 341 | | | $ | 10,287 | |
| | |
Burkina Faso 0.0% | | | | | | | | |
| | |
Endeavour Mining PLC | | | 381 | | | | 8,544 | |
| | |
Chile 0.1% | | | | | | | | |
| | |
Antofagasta PLC | | | 844 | | | | 18,852 | |
| | |
China 0.5% | | | | | | | | |
| | |
BOC Hong Kong Holdings Ltd. | | | 7,989 | | | | 26,082 | |
Prosus NV | | | 3,078 | | | | 129,798 | |
SITC International Holdings Co. Ltd. | | | 3,096 | | | | 8,750 | |
Wharf Holdings Ltd. (The) | | | 2,477 | | | | 7,018 | |
Wilmar International Ltd. | | | 3,963 | | | | 9,566 | |
| | | | | | | | |
| | |
| | | | | | | 181,214 | |
| | |
Denmark 3.1% | | | | | | | | |
| | |
AP Moller - Maersk A/S (Class A Stock) | | | 7 | | | | 10,675 | |
AP Moller - Maersk A/S (Class B Stock) | | | 10 | | | | 15,818 | |
Carlsberg A/S (Class B Stock) | | | 203 | | | | 22,434 | |
Coloplast A/S (Class B Stock) | | | 270 | | | | 33,818 | |
Danske Bank A/S | | | 1,476 | | | | 43,644 | |
Demant A/S* | | | 208 | | | | 7,683 | |
DSV A/S | | | 443 | | | | 96,975 | |
Genmab A/S* | | | 136 | | | | 30,458 | |
Novo Nordisk A/S (Class B Stock) | | | 6,992 | | | | 784,258 | |
Novonesis (Novozymes) B (Class B Stock) | | | 765 | | | | 48,074 | |
Orsted A/S, 144A* | | | 405 | | | | 23,837 | |
Pandora A/S | | | 175 | | | | 26,459 | |
ROCKWOOL A/S (Class B Stock) | | | 19 | | | | 8,222 | |
Tryg A/S | | | 720 | | | | 16,992 | |
Vestas Wind Systems A/S* | | | 2,161 | | | | 41,183 | |
Zealand Pharma A/S* | | | 139 | | | | 16,046 | |
| | | | | | | | |
| | |
| | | | | | | 1,226,576 | |
| | |
Finland 0.9% | | | | | | | | |
| | |
Elisa OYJ | | | 308 | | | | 14,677 | |
Fortum OYJ | | | 971 | | | | 14,336 | |
Kesko OYJ (Class B Stock) | | | 564 | | | | 12,114 | |
Kone OYJ (Class B Stock) | | | 736 | | | | 40,360 | |
See Notes to Financial Statements.
24
PGIM Quant Solutions International Developed Markets Index Fund
Schedule of Investments (continued)
as of October 31, 2024
| | | | | | | | |
| | |
| Description | | Shares | | | Value | |
| | |
COMMON STOCKS (Continued) | | | | | | | | |
| | |
Finland (cont’d.) | | | | | | | | |
| | |
Metso OYJ | | | 1,299 | | | $ | 12,363 | |
Neste OYJ | | | 913 | | | | 14,659 | |
Nokia OYJ | | | 11,409 | | | | 53,988 | |
Nordea Bank Abp | | | 6,829 | | | | 79,947 | |
Orion OYJ (Class B Stock) | | | 222 | | | | 10,798 | |
Sampo OYJ (Class A Stock) | | | 1,091 | | | | 48,376 | |
Stora Enso OYJ (Class R Stock) | | | 1,260 | | | | 14,061 | |
UPM-Kymmene OYJ | | | 1,151 | | | | 33,870 | |
Wartsila OYJ Abp | | | 1,089 | | | | 20,857 | |
| | | | | | | | |
| | |
| | | | | | | 370,406 | |
| | |
France 8.6% | | | | | | | | |
| | |
Accor SA | | | 410 | | | | 18,601 | |
Aeroports de Paris SA | | | 71 | | | | 8,447 | |
Air Liquide SA | | | 1,255 | | | | 225,023 | |
Airbus SE | | | 1,286 | | | | 196,168 | |
Alstom SA* | | | 723 | | | | 15,903 | |
Amundi SA, 144A | | | 126 | | | | 9,135 | |
Arkema SA | | | 124 | | | | 10,927 | |
AXA SA | | | 3,945 | | | | 148,124 | |
BioMerieux | | | 85 | | | | 9,513 | |
BNP Paribas SA | | | 2,203 | | | | 150,452 | |
Bollore SE | | | 1,522 | | | | 9,502 | |
Bouygues SA | | | 393 | | | | 12,632 | |
Bureau Veritas SA | | | 688 | | | | 21,820 | |
Capgemini SE | | | 336 | | | | 58,290 | |
Carrefour SA | | | 1,188 | | | | 18,867 | |
Cie de Saint-Gobain SA | | | 985 | | | | 89,325 | |
Cie Generale des Etablissements Michelin SCA | | | 1,465 | | | | 49,510 | |
Covivio SA, REIT | | | 121 | | | | 6,884 | |
Credit Agricole SA | | | 2,266 | | | | 34,733 | |
Danone SA | | | 1,398 | | | | 99,871 | |
Dassault Aviation SA | | | 41 | | | | 8,278 | |
Dassault Systemes SE | | | 1,449 | | | | 49,592 | |
Edenred SE | | | 534 | | | | 17,271 | |
Eiffage SA | | | 159 | | | | 14,799 | |
Engie SA | | | 3,953 | | | | 66,258 | |
EssilorLuxottica SA | | | 646 | | | | 151,524 | |
Eurazeo SE | | | 99 | | | | 7,551 | |
Gecina SA, REIT | | | 95 | | | | 10,152 | |
Getlink SE | | | 632 | | | | 10,741 | |
See Notes to Financial Statements.
PGIM Quant Solutions International Developed Markets Index Fund 25
PGIM Quant Solutions International Developed Markets Index Fund
Schedule of Investments (continued)
as of October 31, 2024
| | | | | | | | |
| | |
| Description | | Shares | | | Value | |
| | |
COMMON STOCKS (Continued) | | | | | | | | |
| | |
France (cont’d.) | | | | | | | | |
| | |
Hermes International SCA | | | 69 | | | $ | 156,820 | |
Ipsen SA | | | 78 | | | | 9,509 | |
Kering SA | | | 162 | | | | 40,463 | |
Klepierre SA, REIT | | | 468 | | | | 14,963 | |
La Francaise des Jeux SAEM, 144A | | | 217 | | | | 9,276 | |
Legrand SA | | | 565 | | | | 63,771 | |
L’Oreal SA | | | 523 | | | | 196,214 | |
LVMH Moet Hennessy Louis Vuitton SE | | | 598 | | | | 398,101 | |
Orange SA | | | 3,984 | | | | 43,767 | |
Pernod Ricard SA | | | 442 | | | | 55,148 | |
Publicis Groupe SA | | | 497 | | | | 52,823 | |
Renault SA | | | 411 | | | | 18,805 | |
Rexel SA | | | 468 | | | | 12,894 | |
Safran SA | | | 743 | | | | 168,190 | |
Sartorius Stedim Biotech | | | 64 | | | | 12,839 | |
SEB SA | | | 51 | | | | 5,388 | |
Societe Generale SA | | | 1,559 | | | | 44,777 | |
Sodexo SA | | | 191 | | | | 16,579 | |
Teleperformance SE | | | 113 | | | | 11,978 | |
Thales SA | | | 203 | | | | 32,723 | |
TotalEnergies SE | | | 4,685 | | | | 294,010 | |
Unibail-Rodamco-Westfield, REIT | | | 255 | | | | 20,852 | |
Veolia Environnement SA | | | 1,487 | | | | 47,212 | |
Vinci SA | | | 1,081 | | | | 121,094 | |
Vivendi SE | | | 1,525 | | | | 16,295 | |
| | | | | | | | |
| | |
| | | | | | | 3,394,384 | |
| | |
Germany 7.9% | | | | | | | | |
| | |
adidas AG | | | 351 | | | | 84,061 | |
Allianz SE | | | 848 | | | | 266,955 | |
BASF SE | | | 1,932 | | | | 93,920 | |
Bayer AG | | | 2,119 | | | | 57,101 | |
Bayerische Motoren Werke AG | | | 690 | | | | 54,397 | |
Bechtle AG | | | 169 | | | | 5,770 | |
Beiersdorf AG | | | 216 | | | | 29,159 | |
Brenntag SE | | | 276 | | | | 18,004 | |
Carl Zeiss Meditec AG | | | 83 | | | | 5,225 | |
Commerzbank AG | | | 2,180 | | | | 38,664 | |
Continental AG | | | 238 | | | | 14,854 | |
Covestro AG, 144A* | | | 409 | | | | 25,905 | |
CTS Eventim AG & Co. KGaA | | | 131 | | | | 13,757 | |
See Notes to Financial Statements.
26
PGIM Quant Solutions International Developed Markets Index Fund
Schedule of Investments (continued)
as of October 31, 2024
| | | | | | | | |
| | |
| Description | | Shares | | | Value | |
| | |
COMMON STOCKS (Continued) | | | | | | | | |
| | |
Germany (cont’d.) | | | | | | | | |
| | |
Daimler Truck Holding AG | | | 1,069 | | | $ | 44,204 | |
Deutsche Bank AG | | | 4,102 | | | | 69,692 | |
Deutsche Boerse AG | | | 411 | | | | 95,466 | |
Deutsche Lufthansa AG | | | 1,234 | | | | 8,575 | |
Deutsche Post AG | | | 2,208 | | | | 88,694 | |
Deutsche Telekom AG | | | 7,578 | | | | 229,110 | |
E.ON SE | | | 4,843 | | | | 65,357 | |
Evonik Industries AG | | | 536 | | | | 11,813 | |
Fresenius Medical Care AG | | | 445 | | | | 17,419 | |
Fresenius SE & Co. KGaA* | | | 904 | | | | 33,006 | |
GEA Group AG | | | 338 | | | | 16,648 | |
Hannover Rueck SE | | | 131 | | | | 34,400 | |
Heidelberg Materials AG | | | 293 | | | | 32,271 | |
Henkel AG & Co. KGaA | | | 214 | | | | 16,704 | |
Infineon Technologies AG | | | 2,818 | | | | 89,118 | |
Knorr-Bremse AG | | | 159 | | | | 13,116 | |
LEG Immobilien SE | | | 162 | | | | 15,304 | |
Mercedes-Benz Group AG | | | 1,621 | | | | 98,477 | |
Merck KGaA | | | 277 | | | | 45,795 | |
MTU Aero Engines AG | | | 117 | | | | 38,240 | |
Muenchener Rueckversicherungs-Gesellschaft AG in Muenchen | | | 290 | | | | 148,300 | |
Nemetschek SE | | | 125 | | | | 13,469 | |
Puma SE | | | 218 | | | | 9,941 | |
Rational AG | | | 12 | | | | 11,752 | |
Rheinmetall AG | | | 95 | | | | 48,909 | |
RWE AG | | | 1,353 | | | | 43,850 | |
SAP SE | | | 2,267 | | | | 529,311 | |
Scout24 SE, 144A | | | 157 | | | | 13,562 | |
Siemens AG | | | 1,650 | | | | 321,007 | |
Siemens Energy AG* | | | 1,384 | | | | 56,845 | |
Siemens Healthineers AG, 144A | | | 611 | | | | 31,897 | |
Symrise AG | | | 287 | | | | 34,535 | |
Talanx AG | | | 133 | | | | 10,250 | |
Vonovia SE | | | 1,603 | | | | 52,556 | |
Zalando SE, 144A* | | | 487 | | | | 14,743 | |
| | | | | | | | |
| | |
| | | | | | | 3,112,108 | |
| | |
Hong Kong 1.7% | | | | | | | | |
| | |
AIA Group Ltd. | | | 24,152 | | | | 190,615 | |
Brightoil Petroleum Holdings Ltd.*^ | | | 7,000 | | | | — | |
CK Asset Holdings Ltd. | | | 4,211 | | | | 17,214 | |
See Notes to Financial Statements.
PGIM Quant Solutions International Developed Markets Index Fund 27
PGIM Quant Solutions International Developed Markets Index Fund
Schedule of Investments (continued)
as of October 31, 2024
| | | | | | | | |
| | |
| Description | | Shares | | | Value | |
| | |
COMMON STOCKS (Continued) | | | | | | | | |
| | |
Hong Kong (cont’d.) | | | | | | | | |
| | |
CK Infrastructure Holdings Ltd. | | | 1,362 | | | $ | 9,638 | |
CLP Holdings Ltd. | | | 3,654 | | | | 31,039 | |
Futu Holdings Ltd., ADR* | | | 124 | | | | 11,779 | |
Hang Seng Bank Ltd. | | | 1,672 | | | | 20,452 | |
Henderson Land Development Co. Ltd. | | | 3,099 | | | | 9,938 | |
HKT Trust & HKT Ltd., UTS | | | 8,670 | | | | 10,774 | |
Hong Kong & China Gas Co. Ltd. | | | 24,372 | | | | 18,878 | |
Hong Kong Exchanges & Clearing Ltd. | | | 2,626 | | | | 105,146 | |
Hongkong Land Holdings Ltd. | | | 2,291 | | | | 9,823 | |
Jardine Matheson Holdings Ltd. | | | 364 | | | | 13,986 | |
Link REIT, REIT | | | 5,450 | | | | 25,394 | |
MTR Corp. Ltd. | | | 3,406 | | | | 12,392 | |
Power Assets Holdings Ltd. | | | 3,158 | | | | 21,036 | |
Prudential PLC | | | 5,999 | | | | 49,941 | |
Sino Land Co. Ltd. | | | 8,422 | | | | 8,428 | |
Sun Hung Kai Properties Ltd. | | | 3,251 | | | | 35,202 | |
Swire Pacific Ltd. (Class A Stock) | | | 929 | | | | 7,781 | |
Techtronic Industries Co. Ltd. | | | 3,096 | | | | 44,785 | |
WH Group Ltd., 144A | | | 18,393 | | | | 14,316 | |
Wharf Real Estate Investment Co. Ltd. | | | 4,025 | | | | 12,102 | |
| | | | | | | | |
| | |
| | | | | | | 680,659 | |
| | |
Ireland 0.4% | | | | | | | | |
| | |
AerCap Holdings NV | | | 433 | | | | 40,507 | |
AIB Group PLC | | | 3,930 | | | | 21,069 | |
Bank of Ireland Group PLC | | | 2,179 | | | | 20,196 | |
Kerry Group PLC (Class A Stock) | | | 338 | | | | 33,758 | |
Kingspan Group PLC | | | 336 | | | | 29,671 | |
| | | | | | | | |
| | |
| | | | | | | 145,201 | |
| | |
Israel 0.6% | | | | | | | | |
| | |
Azrieli Group Ltd. | | | 87 | | | | 6,642 | |
Bank Hapoalim BM | | | 2,718 | | | | 28,319 | |
Bank Leumi Le-Israel BM | | | 3,258 | | | | 33,100 | |
Check Point Software Technologies Ltd.* | | | 186 | | | | 32,217 | |
Elbit Systems Ltd. | | | 55 | | | | 12,598 | |
Enlight Renewable Energy Ltd.* | | | 1 | | | | 8 | |
Global-e Online Ltd.* | | | 248 | | | | 9,533 | |
ICL Group Ltd. | | | 1,596 | | | | 6,552 | |
Israel Discount Bank Ltd. (Class A Stock) | | | 2,678 | | | | 15,741 | |
See Notes to Financial Statements.
28
PGIM Quant Solutions International Developed Markets Index Fund
Schedule of Investments (continued)
as of October 31, 2024
| | | | | | | | |
| | |
| Description | | Shares | | | Value | |
| | |
COMMON STOCKS (Continued) | | | | | | | | |
| | |
Israel (cont’d.) | | | | | | | | |
| | |
Mizrahi Tefahot Bank Ltd. | | | 336 | | | $ | 13,854 | |
Nice Ltd.* | | | 135 | | | | 23,458 | |
Teva Pharmaceutical Industries Ltd., ADR* | | | 2,477 | | | | 45,676 | |
Wix.com Ltd.* | | | 124 | | | | 20,723 | |
| | | | | | | | |
| | |
| | | | | | | 248,421 | |
| | |
Italy 2.4% | | | | | | | | |
| | |
Amplifon SpA | | | 257 | | | | 7,179 | |
Banco BPM SpA | | | 2,788 | | | | 18,805 | |
Coca-Cola HBC AG* | | | 473 | | | | 16,552 | |
Davide Campari-Milano NV | | | 1,328 | | | | 8,916 | |
DiaSorin SpA | | | 51 | | | | 5,539 | |
Enel SpA | | | 17,658 | | | | 133,920 | |
Eni SpA | | | 4,977 | | | | 75,816 | |
Ferrari NV | | | 274 | | | | 130,799 | |
FinecoBank Banca Fineco SpA | | | 1,307 | | | | 20,865 | |
Generali | | | 2,208 | | | | 61,219 | |
Infrastrutture Wireless Italiane SpA, 144A | | | 693 | | | | 7,813 | |
Intesa Sanpaolo SpA | | | 31,755 | | | | 135,912 | |
Leonardo SpA | | | 866 | | | | 20,642 | |
Mediobanca Banca di Credito Finanziario SpA | | | 1,058 | | | | 17,454 | |
Moncler SpA | | | 474 | | | | 26,334 | |
Nexi SpA, 144A* | | | 1,218 | | | | 7,699 | |
Poste Italiane SpA, 144A | | | 990 | | | | 13,921 | |
Prysmian SpA | | | 585 | | | | 41,286 | |
Recordati Industria Chimica e Farmaceutica SpA | | | 227 | | | | 12,879 | |
Snam SpA | | | 4,350 | | | | 20,897 | |
Telecom Italia SpA* | | | 20,553 | | | | 5,206 | |
Terna - Rete Elettrica Nazionale | | | 3,010 | | | | 26,072 | |
UniCredit SpA | | | 3,189 | | | | 141,079 | |
| | | | | | | | |
| | |
| | | | | | | 956,804 | |
| | |
Japan 20.4% | | | | | | | | |
| | |
Advantest Corp. | | | 1,691 | | | | 97,908 | |
Aeon Co. Ltd. | | | 1,443 | | | | 35,358 | |
AGC, Inc. | | | 446 | | | | 13,668 | |
Aisin Corp. | | | 1,208 | | | | 12,560 | |
Ajinomoto Co., Inc. | | | 1,034 | | | | 39,722 | |
ANA Holdings, Inc. | | | 341 | | | | 6,717 | |
Asahi Group Holdings Ltd. | | | 3,140 | | | | 37,697 | |
See Notes to Financial Statements.
PGIM Quant Solutions International Developed Markets Index Fund 29
PGIM Quant Solutions International Developed Markets Index Fund
Schedule of Investments (continued)
as of October 31, 2024
| | | | | | | | |
| | |
| Description | | Shares | | | Value | |
| | |
COMMON STOCKS (Continued) | | | | | | | | |
| | |
Japan (cont’d.) | | | | | | | | |
| | |
Asahi Kasei Corp. | | | 2,570 | | | $ | 17,730 | |
Asics Corp. | | | 1,486 | | | | 25,956 | |
Astellas Pharma, Inc. | | | 3,920 | | | | 45,897 | |
Bandai Namco Holdings, Inc. | | | 1,245 | | | | 26,103 | |
Bridgestone Corp. | | | 1,239 | | | | 44,152 | |
Brother Industries Ltd. | | | 464 | | | | 9,037 | |
Canon, Inc. | | | 2,031 | | | | 66,058 | |
Capcom Co. Ltd. | | | 743 | | | | 14,703 | |
Central Japan Railway Co. | | | 1,684 | | | | 34,874 | |
Chiba Bank Ltd. (The) | | | 1,084 | | | | 7,911 | |
Chubu Electric Power Co., Inc. | | | 1,331 | | | | 15,300 | |
Chugai Pharmaceutical Co. Ltd. | | | 1,499 | | | | 71,325 | |
Concordia Financial Group Ltd. | | | 2,198 | | | | 10,887 | |
Dai Nippon Printing Co. Ltd. | | | 867 | | | | 15,048 | |
Daifuku Co. Ltd. | | | 712 | | | | 13,383 | |
Dai-ichi Life Holdings, Inc. | | | 1,951 | | | | 48,639 | |
Daiichi Sankyo Co. Ltd. | | | 4,062 | | | | 132,211 | |
Daikin Industries Ltd. | | | 582 | | | | 69,873 | |
Daito Trust Construction Co. Ltd. | | | 152 | | | | 16,797 | |
Daiwa House Industry Co. Ltd. | | | 1,220 | | | | 36,391 | |
Daiwa Securities Group, Inc. | | | 2,756 | | | | 18,031 | |
Denso Corp. | | | 4,069 | | | | 57,794 | |
Dentsu Group, Inc. | | | 483 | | | | 14,909 | |
Disco Corp. | | | 192 | | | | 54,631 | |
East Japan Railway Co. | | | 1,914 | | | | 38,443 | |
Eisai Co. Ltd. | | | 566 | | | | 19,176 | |
ENEOS Holdings, Inc. | | | 6,261 | | | | 31,584 | |
FANUC Corp. | | | 2,022 | | | | 53,646 | |
Fast Retailing Co. Ltd. | | | 418 | | | | 133,644 | |
Fuji Electric Co. Ltd. | | | 310 | | | | 15,788 | |
FUJIFILM Holdings Corp. | | | 2,403 | | | | 57,163 | |
Fujitsu Ltd. | | | 3,592 | | | | 69,059 | |
Hamamatsu Photonics KK | | | 681 | | | | 9,005 | |
Hankyu Hanshin Holdings, Inc. | | | 539 | | | | 14,655 | |
Hikari Tsushin, Inc. | | | 50 | | | | 10,092 | |
Hitachi Construction Machinery Co. Ltd. | | | 260 | | | | 5,641 | |
Hitachi Ltd. | | | 10,063 | | | | 252,831 | |
Honda Motor Co. Ltd. | | | 9,611 | | | | 96,659 | |
Hoshizaki Corp. | | | 272 | | | | 8,940 | |
Hoya Corp. | | | 731 | | | | 97,803 | |
Hulic Co. Ltd. | | | 842 | | | | 7,797 | |
Ibiden Co. Ltd. | | | 285 | | | | 9,053 | |
See Notes to Financial Statements.
30
PGIM Quant Solutions International Developed Markets Index Fund
Schedule of Investments (continued)
as of October 31, 2024
| | | | | | | | |
| | |
| Description | | Shares | | | Value | |
| | |
COMMON STOCKS (Continued) | | | | | | | | |
| | |
Japan (cont’d.) | | | | | | | | |
| | |
Idemitsu Kosan Co. Ltd. | | | 2,003 | | | $ | 13,655 | |
Inpex Corp. | | | 2,013 | | | | 26,535 | |
Isuzu Motors Ltd. | | | 1,208 | | | | 15,622 | |
ITOCHU Corp. | | | 2,570 | | | | 127,132 | |
Japan Airlines Co. Ltd. | | | 285 | | | | 4,571 | |
Japan Exchange Group, Inc. | | | 2,167 | | | | 25,400 | |
Japan Post Bank Co. Ltd. | | | 3,158 | | | | 28,205 | |
Japan Post Holdings Co. Ltd. | | | 4,180 | | | | 38,565 | |
Japan Post Insurance Co. Ltd. | | | 403 | | | | 6,641 | |
Japan Real Estate Investment Corp., REIT | | | 3 | | | | 10,912 | |
Japan Tobacco, Inc. | | | 2,589 | | | | 72,278 | |
JFE Holdings, Inc. | | | 1,195 | | | | 14,387 | |
Kajima Corp. | | | 867 | | | | 14,935 | |
Kansai Electric Power Co., Inc. (The) | | | 1,499 | | | | 24,040 | |
Kao Corp. | | | 1,009 | | | | 44,472 | |
Kawasaki Kisen Kaisha Ltd. | | | 836 | | | | 11,549 | |
KDDI Corp. | | | 3,381 | | | | 105,418 | |
Keisei Electric Railway Co. Ltd. | | | 279 | | | | 7,259 | |
Keyence Corp. | | | 409 | | | | 184,628 | |
Kikkoman Corp. | | | 1,424 | | | | 16,707 | |
Kirin Holdings Co. Ltd. | | | 1,610 | | | | 23,703 | |
Kobe Bussan Co. Ltd. | | | 372 | | | | 9,125 | |
Kokusai Electric Corp. | | | 310 | | | | 5,652 | |
Komatsu Ltd. | | | 2,019 | | | | 52,262 | |
Konami Group Corp. | | | 248 | | | | 22,732 | |
Kubota Corp. | | | 2,075 | | | | 26,512 | |
Kyocera Corp. | | | 2,787 | | | | 28,265 | |
Kyowa Kirin Co. Ltd. | | | 570 | | | | 9,395 | |
Lasertec Corp. | | | 170 | | | | 23,068 | |
LY Corp. | | | 5,512 | | | | 15,036 | |
M3, Inc. | | | 910 | | | | 9,353 | |
Makita Corp. | | | 526 | | | | 17,175 | |
Marubeni Corp. | | | 3,096 | | | | 46,283 | |
MatsukiyoCocokara & Co. | | | 694 | | | | 9,449 | |
Mazda Motor Corp. | | | 1,177 | | | | 8,321 | |
McDonald’s Holdings Co. Japan Ltd. | | | 186 | | | | 7,882 | |
MEIJI Holdings Co. Ltd. | | | 484 | | | | 11,290 | |
MINEBEA MITSUMI, Inc. | | | 805 | | | | 14,172 | |
Mitsubishi Chemical Group Corp. | | | 2,849 | | | | 15,373 | |
Mitsubishi Corp. | | | 7,270 | | | | 132,998 | |
Mitsubishi Electric Corp. | | | 4,168 | | | | 73,326 | |
Mitsubishi Estate Co. Ltd. | | | 2,490 | | | | 36,822 | |
See Notes to Financial Statements.
PGIM Quant Solutions International Developed Markets Index Fund 31
PGIM Quant Solutions International Developed Markets Index Fund
Schedule of Investments (continued)
as of October 31, 2024
| | | | | | | | |
| | |
| Description | | Shares | | | Value | |
| | |
COMMON STOCKS (Continued) | | | | | | | | |
| | |
Japan (cont’d.) | | | | | | | | |
| | |
Mitsubishi HC Capital, Inc. | | | 1,748 | | | $ | 11,705 | |
Mitsubishi Heavy Industries Ltd. | | | 6,874 | | | | 97,040 | |
Mitsubishi UFJ Financial Group, Inc. | | | 23,966 | | | | 252,607 | |
Mitsui & Co. Ltd. | | | 5,574 | | | | 113,641 | |
Mitsui Chemicals, Inc. | | | 396 | | | | 9,047 | |
Mitsui Fudosan Co. Ltd. | | | 5,778 | | | | 49,300 | |
Mitsui OSK Lines Ltd. | | | 780 | | | | 26,556 | |
Mizuho Financial Group, Inc. | | | 5,221 | | | | 108,445 | |
MonotaRO Co. Ltd. | | | 570 | | | | 8,599 | |
MS&AD Insurance Group Holdings, Inc. | | | 2,805 | | | | 62,045 | |
Murata Manufacturing Co. Ltd. | | | 3,660 | | | | 63,944 | |
NEC Corp. | | | 526 | | | | 44,758 | |
Nexon Co. Ltd. | | | 706 | | | | 12,236 | |
Nidec Corp. | | | 1,845 | | | | 36,754 | |
Nintendo Co. Ltd. | | | 2,260 | | | | 119,380 | |
Nippon Building Fund, Inc., REIT | | | 19 | | | | 16,297 | |
Nippon Paint Holdings Co. Ltd. | | | 1,951 | | | | 14,932 | |
Nippon Prologis REIT, Inc., REIT | | | 5 | | | | 8,044 | |
Nippon Sanso Holdings Corp. | | | 427 | | | | 14,822 | |
Nippon Steel Corp. | | | 1,907 | | | | 38,158 | |
Nippon Telegraph & Telephone Corp. | | | 64,467 | | | | 62,200 | |
Nippon Yusen KK | | | 1,053 | | | | 35,254 | |
Nissan Motor Co. Ltd. | | | 4,799 | | | | 12,785 | |
Nissin Foods Holdings Co. Ltd. | | | 464 | | | | 12,494 | |
Nitori Holdings Co. Ltd. | | | 162 | | | | 20,631 | |
Nitto Denko Corp. | | | 1,548 | | | | 25,470 | |
Nomura Holdings, Inc. | | | 6,502 | | | | 33,342 | |
Nomura Real Estate Holdings, Inc. | | | 235 | | | | 5,786 | |
Nomura Research Institute Ltd. | | | 842 | | | | 25,187 | |
NTT Data Group Corp. | | | 1,300 | | | | 20,566 | |
Obayashi Corp. | | | 1,331 | | | | 16,317 | |
Obic Co. Ltd. | | | 774 | | | | 25,292 | |
Olympus Corp. | | | 2,558 | | | | 45,027 | |
Omron Corp. | | | 415 | | | | 16,385 | |
Ono Pharmaceutical Co. Ltd. | | | 793 | | | | 9,905 | |
Oracle Corp. | | | 93 | | | | 8,897 | |
Oriental Land Co. Ltd. | | | 2,384 | | | | 57,615 | |
ORIX Corp. | | | 2,477 | | | | 52,190 | |
Osaka Gas Co. Ltd. | | | 830 | | | | 17,786 | |
Otsuka Corp. | | | 483 | | | | 10,840 | |
Otsuka Holdings Co. Ltd. | | | 935 | | | | 56,484 | |
Pan Pacific International Holdings Corp. | | | 836 | | | | 20,740 | |
See Notes to Financial Statements.
32
PGIM Quant Solutions International Developed Markets Index Fund
Schedule of Investments (continued)
as of October 31, 2024
| | | | | | | | |
| | |
| Description | | Shares | | | Value | |
| | |
COMMON STOCKS (Continued) | | | | | | | | |
| | |
Japan (cont’d.) | | | | | | | | |
| | |
Panasonic Holdings Corp. | | | 4,899 | | | $ | 40,319 | |
Rakuten Group, Inc.* | | | 3,096 | | | | 18,479 | |
Recruit Holdings Co. Ltd. | | | 3,189 | | | | 194,728 | |
Renesas Electronics Corp. | | | 3,641 | | | | 48,783 | |
Resona Holdings, Inc. | | | 4,372 | | | | 28,845 | |
Ricoh Co. Ltd. | | | 1,115 | | | | 12,078 | |
Rohm Co. Ltd. | | | 675 | | | | 7,442 | |
SBI Holdings, Inc. | | | 588 | | | | 12,912 | |
SCREEN Holdings Co. Ltd. | | | 167 | | | | 10,661 | |
SCSK Corp. | | | 328 | | | | 6,120 | |
Secom Co. Ltd. | | | 929 | | | | 33,038 | |
Seiko Epson Corp. | | | 588 | | | | 10,687 | |
Sekisui Chemical Co. Ltd. | | | 805 | | | | 11,361 | |
Sekisui House Ltd. | | | 1,319 | | | | 31,856 | |
Seven & i Holdings Co. Ltd. | | | 4,830 | | | | 69,552 | |
SG Holdings Co. Ltd. | | | 650 | | | | 6,518 | |
Shimadzu Corp. | | | 545 | | | | 16,076 | |
Shimano, Inc. | | | 167 | | | | 24,534 | |
Shin-Etsu Chemical Co. Ltd. | | | 3,932 | | | | 144,084 | |
Shionogi & Co. Ltd. | | | 1,653 | | | | 23,609 | |
Shiseido Co. Ltd. | | | 898 | | | | 19,383 | |
Shizuoka Financial Group, Inc. | | | 966 | | | | 7,708 | |
SMC Corp. | | | 118 | | | | 50,096 | |
SoftBank Corp. | | | 61,928 | | | | 77,961 | |
SoftBank Group Corp. | | | 2,229 | | | | 132,890 | |
Sompo Holdings, Inc. | | | 2,062 | | | | 44,207 | |
Sony Group Corp. | | | 13,562 | | | | 238,658 | |
Subaru Corp. | | | 1,282 | | | | 22,896 | |
SUMCO Corp. | | | 731 | | | | 6,989 | |
Sumitomo Corp. | | | 2,217 | | | | 46,771 | |
Sumitomo Electric Industries Ltd. | | | 1,468 | | | | 22,582 | |
Sumitomo Metal Mining Co. Ltd. | | | 564 | | | | 15,594 | |
Sumitomo Mitsui Financial Group, Inc. | | | 8,212 | | | | 174,214 | |
Sumitomo Mitsui Trust Group, Inc. | | | 1,400 | | | | 30,702 | |
Sumitomo Realty & Development Co. Ltd. | | | 650 | | | | 19,281 | |
Suntory Beverage & Food Ltd. | | | 353 | | | | 11,908 | |
Suzuki Motor Corp. | | | 3,425 | | | | 33,987 | |
Sysmex Corp. | | | 1,040 | | | | 19,296 | |
T&D Holdings, Inc. | | | 1,022 | | | | 16,313 | |
Taisei Corp. | | | 403 | | | | 16,971 | |
Takeda Pharmaceutical Co. Ltd. | | | 3,457 | | | | 96,455 | |
TDK Corp. | | | 4,211 | | | | 49,502 | |
See Notes to Financial Statements.
PGIM Quant Solutions International Developed Markets Index Fund 33
PGIM Quant Solutions International Developed Markets Index Fund
Schedule of Investments (continued)
as of October 31, 2024
| | | | | | | | |
| | |
| Description | | Shares | | | Value | |
| | |
COMMON STOCKS (Continued) | | | | | | | | |
| | |
Japan (cont’d.) | | | | | | | | |
| | |
Terumo Corp. | | | 2,923 | | | $ | 55,669 | |
TIS, Inc. | | | 464 | | | | 11,571 | |
Toho Co. Ltd. | | | 260 | | | | 9,929 | |
Tokio Marine Holdings, Inc. | | | 4,093 | | | | 147,414 | |
Tokyo Electric Power Co. Holdings, Inc.* | | | 3,158 | | | | 12,754 | |
Tokyo Electron Ltd. | | | 972 | | | | 143,033 | |
Tokyo Gas Co. Ltd. | | | 768 | | | | 18,949 | |
Tokyu Corp. | | | 1,022 | | | | 12,600 | |
TOPPAN Holdings, Inc. | | | 557 | | | | 16,293 | |
Toray Industries, Inc. | | | 2,843 | | | | 15,460 | |
TOTO Ltd. | | | 328 | | | | 9,151 | |
Toyota Industries Corp. | | | 328 | | | | 22,738 | |
Toyota Motor Corp. | | | 22,232 | | | | 383,066 | |
Toyota Tsusho Corp. | | | 1,319 | | | | 22,421 | |
Trend Micro, Inc. | | | 272 | | | | 14,232 | |
Unicharm Corp. | | | 892 | | | | 28,763 | |
West Japan Railway Co. | | | 941 | | | | 16,725 | |
Yakult Honsha Co. Ltd. | | | 526 | | | | 11,431 | |
Yamaha Motor Co. Ltd. | | | 1,827 | | | | 15,970 | |
Yaskawa Electric Corp. | | | 570 | | | | 16,336 | |
Yokogawa Electric Corp. | | | 526 | | | | 11,662 | |
Zensho Holdings Co. Ltd. | | | 248 | | | | 12,442 | |
ZOZO, Inc. | | | 334 | | | | 10,830 | |
| | | | | | | | |
| | |
| | | | | | | 8,058,342 | |
| | |
Jordan 0.0% | | | | | | | | |
| | |
Hikma Pharmaceuticals PLC | | | 342 | | | | 8,191 | |
| | |
Luxembourg 0.1% | | | | | | | | |
| | |
ArcelorMittal SA | | | 1,016 | | | | 25,130 | |
Eurofins Scientific SE | | | 292 | | | | 14,402 | |
| | | | | | | | |
| | |
| | | | | | | 39,532 | |
| | |
Macau 0.1% | | | | | | | | |
| | |
Galaxy Entertainment Group Ltd. | | | 4,954 | | | | 22,048 | |
Sands China Ltd.* | | | 5,450 | | | | 13,867 | |
| | | | | | | | |
| | |
| | | | | | | 35,915 | |
See Notes to Financial Statements.
34
PGIM Quant Solutions International Developed Markets Index Fund
Schedule of Investments (continued)
as of October 31, 2024
| | | | | | | | |
| | |
| Description | | Shares | | | Value | |
| | |
COMMON STOCKS (Continued) | | | | | | | | |
| | |
Netherlands 3.7% | | | | | | | | |
| | |
ABN AMRO Bank NV, 144A, CVA | | | 992 | | | $ | 16,393 | |
Adyen NV, 144A* | | | 48 | | | | 73,328 | |
Aegon Ltd. | | | 2,859 | | | | 18,045 | |
Akzo Nobel NV | | | 365 | | | | 23,292 | |
Argenx SE* | | | 129 | | | | 76,066 | |
ASM International NV | | | 102 | | | | 56,968 | |
ASML Holding NV | | | 868 | | | | 584,278 | |
ASR Nederland NV | | | 343 | | | | 16,258 | |
BE Semiconductor Industries NV | | | 165 | | | | 17,563 | |
Euronext NV, 144A | | | 175 | | | | 19,308 | |
EXOR NV | | | 216 | | | | 22,814 | |
Heineken Holding NV | | | 277 | | | | 19,193 | |
Heineken NV | | | 624 | | | | 51,178 | |
IMCD NV | | | 123 | | | | 19,556 | |
ING Groep NV | | | 7,172 | | | | 121,712 | |
JDE Peet’s NV | | | 255 | | | | 5,757 | |
Koninklijke Ahold Delhaize NV | | | 2,020 | | | | 66,657 | |
Koninklijke KPN NV | | | 8,515 | | | | 33,291 | |
Koninklijke Philips NV* | | | 1,720 | | | | 45,251 | |
NN Group NV | | | 584 | | | | 28,670 | |
Randstad NV | | | 228 | | | | 10,512 | |
Universal Music Group NV | | | 1,761 | | | | 44,318 | |
Wolters Kluwer NV | | | 537 | | | | 90,261 | |
| | | | | | | | |
| | |
| | | | | | | 1,460,669 | |
| | |
New Zealand 0.2% | | | | | | | | |
| | |
Auckland International Airport Ltd. | | | 3,230 | | | | 14,093 | |
Fisher & Paykel Healthcare Corp. Ltd. | | | 1,250 | | | | 26,789 | |
Mercury NZ Ltd. | | | 1,582 | | | | 6,227 | |
Meridian Energy Ltd. | | | 2,668 | | | | 9,475 | |
Spark New Zealand Ltd. | | | 3,792 | | | | 6,579 | |
Xero Ltd.* | | | 314 | | | | 30,507 | |
| | | | | | | | |
| | |
| | | | | | | 93,670 | |
| | |
Norway 0.5% | | | | | | | | |
| | |
Aker BP ASA | | | 684 | | | | 14,636 | |
DNB Bank ASA | | | 1,938 | | | | 40,161 | |
Equinor ASA | | | 1,814 | | | | 43,105 | |
Gjensidige Forsikring ASA | | | 433 | | | | 7,831 | |
Kongsberg Gruppen ASA | | | 190 | | | | 19,834 | |
See Notes to Financial Statements.
PGIM Quant Solutions International Developed Markets Index Fund 35
PGIM Quant Solutions International Developed Markets Index Fund
Schedule of Investments (continued)
as of October 31, 2024
| | | | | | | | |
| | |
| Description | | Shares | | | Value | |
| | |
COMMON STOCKS (Continued) | | | | | | | | |
| | |
Norway (cont’d.) | | | | | | | | |
| | |
Mowi ASA | | | 972 | | | $ | 16,757 | |
Norsk Hydro ASA | | | 3,044 | | | | 18,895 | |
Orkla ASA | | | 1,518 | | | | 14,024 | |
Salmar ASA | | | 150 | | | | 7,628 | |
Telenor ASA | | | 1,299 | | | | 15,954 | |
| | | | | | | | |
| | |
| | | | | | | 198,825 | |
| | |
Poland 0.0% | | | | | | | | |
| | |
InPost SA* | | | 418 | | | | 8,154 | |
| | |
Portugal 0.1% | | | | | | | | |
| | |
EDP SA | | | 6,714 | | | | 26,432 | |
Galp Energia SGPS SA | | | 977 | | | | 16,699 | |
Jeronimo Martins SGPS SA | | | 584 | | | | 11,352 | |
| | | | | | | | |
| | |
| | | | | | | 54,483 | |
| | |
Russia 0.0% | | | | | | | | |
| | |
Evraz PLC*^ | | | 2,361 | | | | — | |
| | |
Singapore 1.4% | | | | | | | | |
| | |
CapitaLand Ascendas REIT, REIT | | | 8,123 | | | | 16,461 | |
CapitaLand Integrated Commercial Trust, REIT | | | 12,378 | | | | 18,806 | |
CapitaLand Investment Ltd. | | | 5,078 | | | | 10,728 | |
DBS Group Holdings Ltd. | | | 4,335 | | | | 125,692 | |
Genting Singapore Ltd. | | | 12,448 | | | | 7,840 | |
Grab Holdings Ltd. (Class A Stock)* | | | 4,459 | | | | 18,193 | |
Keppel Ltd. | | | 3,158 | | | | 15,204 | |
Oversea-Chinese Banking Corp. Ltd. | | | 7,353 | | | | 84,362 | |
Sea Ltd., ADR* | | | 805 | | | | 75,710 | |
Sembcorp Industries Ltd. | | | 1,858 | | | | 7,049 | |
Singapore Airlines Ltd. | | | 3,096 | | | | 15,103 | |
Singapore Exchange Ltd. | | | 1,858 | | | | 15,921 | |
Singapore Technologies Engineering Ltd. | | | 3,468 | | | | 11,890 | |
Singapore Telecommunications Ltd. | | | 16,101 | | | | 37,986 | |
STMicroelectronics NV | | | 1,461 | | | | 39,713 | |
United Overseas Bank Ltd. | | | 2,760 | | | | 67,093 | |
| | | | | | | | |
| | |
| | | | | | | 567,751 | |
See Notes to Financial Statements.
36
PGIM Quant Solutions International Developed Markets Index Fund
Schedule of Investments (continued)
as of October 31, 2024
| | | | | | | | |
| | |
| Description | | Shares | | | Value | |
| | |
COMMON STOCKS (Continued) | | | | | | | | |
| | |
South Africa 0.2% | | | | | | | | |
| | |
Anglo American PLC | | | 2,751 | | | $ | 85,282 | |
| | |
South Korea 0.0% | | | | | | | | |
| | |
Delivery Hero SE, 144A * | | | 401 | | | | 17,023 | |
| | |
Spain 2.5% | | | | | | | | |
| | |
Acciona SA | | | 51 | | | | 6,545 | |
ACS Actividades de Construccion y Servicios SA | | | 398 | | | | 19,086 | |
Aena SME SA, 144A | | | 160 | | | | 35,459 | |
Amadeus IT Group SA | | | 972 | | | | 70,464 | |
Banco Bilbao Vizcaya Argentaria SA | | | 12,475 | | | | 124,185 | |
Banco de Sabadell SA | | | 11,776 | | | | 22,968 | |
Banco Santander SA | | | 33,538 | | | | 163,846 | |
CaixaBank SA | | | 7,866 | | | | 47,934 | |
Cellnex Telecom SA, 144A | | | 1,147 | | | | 42,124 | |
EDP Renovaveis SA | | | 676 | | | | 9,162 | |
Endesa SA | | | 688 | | | | 14,848 | |
Grifols SA* | | | 615 | | | | 6,904 | |
Iberdrola SA | | | 13,220 | | | | 196,377 | |
Industria de Diseno Textil SA | | | 2,369 | | | | 135,068 | |
Redeia Corp. SA | | | 879 | | | | 16,275 | |
Repsol SA | | | 2,635 | | | | 32,986 | |
Telefonica SA | | | 9,008 | | | | 42,271 | |
| | | | | | | | |
| | |
| | | | | | | 986,502 | |
| | |
Sweden 2.9% | | | | | | | | |
| | |
AddTech AB (Class B Stock) | | | 563 | | | | 15,675 | |
Alfa Laval AB | | | 619 | | | | 27,403 | |
Assa Abloy AB (Class B Stock) | | | 2,170 | | | | 67,970 | |
Atlas Copco AB (Class A Stock) | | | 5,794 | | | | 95,621 | |
Atlas Copco AB (Class B Stock) | | | 3,389 | | | | 49,275 | |
Beijer Ref AB | | | 794 | | | | 11,960 | |
Boliden AB | | | 592 | | | | 18,520 | |
Epiroc AB (Class A Stock) | | | 1,410 | | | | 27,538 | |
Epiroc AB (Class B Stock) | | | 844 | | | | 14,540 | |
EQT AB | | | 806 | | | | 23,384 | |
Essity AB (Class B Stock) | | | 1,319 | | | | 37,273 | |
Evolution AB, 144A | | | 390 | | | | 36,873 | |
Fastighets AB Balder (Class B Stock)* | | | 1,435 | | | | 11,164 | |
Getinge AB (Class B Stock) | | | 472 | | | | 8,350 | |
See Notes to Financial Statements.
PGIM Quant Solutions International Developed Markets Index Fund 37
PGIM Quant Solutions International Developed Markets Index Fund
Schedule of Investments (continued)
as of October 31, 2024
| | | | | | | | |
| | |
| Description | | Shares | | | Value | |
| | |
COMMON STOCKS (Continued) | | | | | | | | |
| | |
Sweden (cont’d.) | | | | | | | | |
| | |
H & M Hennes & Mauritz AB (Class B Stock) | | | 1,200 | | | $ | 17,889 | |
Hexagon AB (Class B Stock) | | | 4,442 | | | | 41,529 | |
Holmen AB (Class B Stock) | | | 157 | | | | 6,204 | |
Husqvarna AB (Class B Stock) | | | 721 | | | | 4,656 | |
Industrivarden AB (Class A Stock) | | | 268 | | | | 9,244 | |
Industrivarden AB (Class C Stock) | | | 347 | | | | 11,927 | |
Indutrade AB | | | 591 | | | | 16,082 | |
Investment AB Latour (Class B Stock) | | | 305 | | | | 8,419 | |
Investor AB (Class B Stock) | | | 3,734 | | | | 105,687 | |
L E Lundbergforetagen AB (Class B Stock) | | | 157 | | | | 7,773 | |
Lifco AB (Class B Stock) | | | 505 | | | | 15,068 | |
Nibe Industrier AB (Class B Stock) | | | 3,280 | | | | 15,903 | |
Saab AB (Class B Stock) | | | 694 | | | | 14,254 | |
Sagax AB (Class B Stock) | | | 459 | | | | 11,061 | |
Sandvik AB | | | 2,281 | | | | 44,898 | |
Securitas AB (Class B Stock) | | | 1,014 | | | | 11,929 | |
Skandinaviska Enskilda Banken AB (Class A Stock) | | | 3,446 | | | | 48,669 | |
Skanska AB (Class B Stock) | | | 737 | | | | 15,004 | |
SKF AB (Class B Stock) | | | 738 | | | | 13,998 | |
Svenska Cellulosa AB SCA (Class B Stock) | | | 1,312 | | | | 17,370 | |
Svenska Handelsbanken AB (Class A Stock) | | | 3,121 | | | | 32,429 | |
Swedbank AB (Class A Stock) | | | 1,838 | | | | 37,294 | |
Swedish Orphan Biovitrum AB* | | | 422 | | | | 13,166 | |
Tele2 AB (Class B Stock) | | | 1,245 | | | | 13,064 | |
Telefonaktiebolaget LM Ericsson (Class B Stock) | | | 5,935 | | | | 49,760 | |
Telia Co. AB | | | 5,107 | | | | 14,853 | |
Trelleborg AB (Class B Stock) | | | 450 | | | | 14,969 | |
Volvo AB (Class A Stock) | | | 413 | | | | 10,837 | |
Volvo AB (Class B Stock) | | | 3,438 | | | | 89,549 | |
Volvo Car AB (Class B Stock)* | | | 1,546 | | | | 3,340 | |
| | | | | | | | |
| | |
| | | | | | | 1,162,371 | |
| | |
Switzerland 5.8% | | | | | | | | |
| | |
ABB Ltd. | | | 3,423 | | | | 190,220 | |
Adecco Group AG | | | 352 | | | | 11,011 | |
Avolta AG* | | | 202 | | | | 8,031 | |
Bachem Holding AG | | | 69 | | | | 5,461 | |
Baloise Holding AG | | | 90 | | | | 17,224 | |
Banque Cantonale Vaudoise | | | 62 | | | | 6,178 | |
Barry Callebaut AG | | | 8 | | | | 14,031 | |
BKW AG | | | 43 | | | | 7,555 | |
See Notes to Financial Statements.
38
PGIM Quant Solutions International Developed Markets Index Fund
Schedule of Investments (continued)
as of October 31, 2024
| | | | | | | | |
| | |
| Description | | Shares | | | Value | |
| | |
COMMON STOCKS (Continued) | | | | | | | | |
| | |
Switzerland (cont’d.) | | | | | | | | |
| | |
Chocoladefabriken Lindt & Spruengli AG | | | 4 | | | $ | 47,185 | |
Cie Financiere Richemont SA (Class A Stock) | | | 1,167 | | | | 169,916 | |
Clariant AG* | | | 445 | | | | 6,184 | |
DSM-Firmenich AG | | | 404 | | | | 47,908 | |
EMS-Chemie Holding AG | | | 15 | | | | 11,536 | |
Galderma Group AG* | | | 129 | | | | 12,072 | |
Geberit AG | | | 75 | | | | 46,987 | |
Givaudan SA | | | 20 | | | | 94,949 | |
Helvetia Holding AG | | | 77 | | | | 13,006 | |
Julius Baer Group Ltd. | | | 441 | | | | 26,888 | |
Kuehne + Nagel International AG | | | 108 | | | | 26,961 | |
Logitech International SA | | | 336 | | | | 27,512 | |
Lonza Group AG | | | 158 | | | | 97,222 | |
Novartis AG | | | 4,266 | | | | 462,888 | |
Partners Group Holding AG | | | 50 | | | | 68,791 | |
Sandoz Group AG | | | 887 | | | | 40,437 | |
Schindler Holding AG | | | 48 | | | | 13,684 | |
Schindler Holding AG (Part. Cert.) | | | 85 | | | | 24,737 | |
SGS SA | | | 333 | | | | 35,254 | |
SIG Group AG* | | | 662 | | | | 14,286 | |
Sika AG | | | 330 | | | | 91,911 | |
Sonova Holding AG | | | 110 | | | | 40,253 | |
Straumann Holding AG | | | 242 | | | | 31,905 | |
Swatch Group AG (The) | | | 120 | | | | 4,862 | |
Swatch Group AG (The) (Bearer Shares) | | | 63 | | | | 12,928 | |
Swiss Life Holding AG | | | 65 | | | | 52,930 | |
Swiss Prime Site AG | | | 168 | | | | 18,225 | |
Swisscom AG | | | 58 | | | | 35,338 | |
Temenos AG | | | 132 | | | | 9,143 | |
UBS Group AG | | | 7,119 | | | | 217,756 | |
VAT Group AG, 144A | | | 59 | | | | 24,567 | |
Zurich Insurance Group AG | | | 315 | | | | 185,726 | |
| | | | | | | | |
| | |
| | | | | | | 2,273,658 | |
| | |
United Arab Emirates 0.0% | | | | | | | | |
| | |
NMC Health PLC*^ | | | 372 | | | | — | |
| | |
United Kingdom 10.0% | | | | | | | | |
| | |
3i Group PLC | | | 2,107 | | | | 86,403 | |
Admiral Group PLC | | | 562 | | | | 18,597 | |
Ashtead Group PLC | | | 947 | | | | 70,843 | |
See Notes to Financial Statements.
PGIM Quant Solutions International Developed Markets Index Fund 39
PGIM Quant Solutions International Developed Markets Index Fund
Schedule of Investments (continued)
as of October 31, 2024
| | | | | | | | |
| | |
| Description | | Shares | | | Value | |
| | |
COMMON STOCKS (Continued) | | | | | | | | |
| | |
United Kingdom (cont’d.) | | | | | | | | |
| | |
Associated British Foods PLC | | | 711 | | | $ | 20,435 | |
AstraZeneca PLC | | | 3,366 | | | | 478,960 | |
Auto Trader Group PLC, 144A | | | 1,883 | | | | 20,332 | |
Aviva PLC | | | 5,793 | | | | 33,949 | |
BAE Systems PLC | | | 6,579 | | | | 106,036 | |
Barclays PLC | | | 32,151 | | | | 98,559 | |
Barratt Redrow PLC | | | 2,984 | | | | 17,193 | |
Berkeley Group Holdings PLC | | | 221 | | | | 12,611 | |
British American Tobacco PLC | | | 4,332 | | | | 151,486 | |
BT Group PLC | | | 13,839 | | | | 24,711 | |
Bunzl PLC | | | 723 | | | | 31,830 | |
Centrica PLC | | | 11,302 | | | | 17,109 | |
CK Hutchison Holdings Ltd. | | | 5,945 | | | | 31,266 | |
Coca-Cola Europacific Partners PLC | | | 495 | | | | 37,620 | |
Compass Group PLC | | | 3,674 | | | | 119,318 | |
Croda International PLC | | | 288 | | | | 13,819 | |
DCC PLC | | | 214 | | | | 13,539 | |
Diageo PLC | | | 4,827 | | | | 149,066 | |
Entain PLC | | | 1,318 | | | | 12,676 | |
Halma PLC | | | 812 | | | | 25,940 | |
Hargreaves Lansdown PLC | | | 734 | | | | 10,301 | |
HSBC Holdings PLC | | | 40,204 | | | | 368,993 | |
Imperial Brands PLC | | | 1,756 | | | | 52,993 | |
Informa PLC | | | 2,936 | | | | 30,672 | |
InterContinental Hotels Group PLC | | | 349 | | | | 38,494 | |
Intertek Group PLC | | | 346 | | | | 20,771 | |
J Sainsbury PLC | | | 3,419 | | | | 11,771 | |
JD Sports Fashion PLC | | | 5,346 | | | | 8,572 | |
Kingfisher PLC | | | 3,903 | | | | 14,760 | |
Land Securities Group PLC, REIT | | | 1,460 | | | | 11,339 | |
Legal & General Group PLC | | | 12,894 | | | | 36,166 | |
Lloyds Banking Group PLC | | | 135,067 | | | | 92,710 | |
London Stock Exchange Group PLC | | | 1,035 | | | | 140,280 | |
M&G PLC | | | 4,895 | | | | 12,263 | |
Melrose Industries PLC | | | 2,777 | | | | 17,008 | |
National Grid PLC | | | 10,416 | | | | 130,785 | |
NatWest Group PLC | | | 14,388 | | | | 68,174 | |
Next PLC | | | 259 | | | | 32,767 | |
Pearson PLC | | | 1,318 | | | | 19,354 | |
Persimmon PLC | | | 692 | | | | 13,114 | |
Phoenix Group Holdings PLC | | | 1,549 | | | | 9,840 | |
Reckitt Benckiser Group PLC | | | 1,512 | | | | 91,724 | |
See Notes to Financial Statements.
40
PGIM Quant Solutions International Developed Markets Index Fund
Schedule of Investments (continued)
as of October 31, 2024
| | | | | | | | |
| | |
| Description | | Shares | | | Value | |
| | |
COMMON STOCKS (Continued) | | | | | | | | |
| | |
United Kingdom (cont’d.) | | | | | | | | |
| | |
RELX PLC | | | 4,049 | | | $ | 185,686 | |
Rentokil Initial PLC | | | 5,401 | | | | 27,090 | |
Rolls-Royce Holdings PLC* | | | 18,409 | | | | 127,029 | |
Sage Group PLC (The) | | | 2,172 | | | | 27,145 | |
Schroders PLC | | | 1,663 | | | | 7,369 | |
Segro PLC, REIT | | | 2,781 | | | | 28,178 | |
Severn Trent PLC | | | 581 | | | | 19,221 | |
Smith & Nephew PLC | | | 1,871 | | | | 23,262 | |
Smiths Group PLC | | | 747 | | | | 14,740 | |
Spirax Group PLC | | | 160 | | | | 13,355 | |
SSE PLC | | | 2,367 | | | | 53,786 | |
Standard Chartered PLC | | | 4,723 | | | | 54,770 | |
Taylor Wimpey PLC | | | 7,662 | | | | 14,486 | |
Tesco PLC | | | 14,992 | | | | 66,200 | |
Unilever PLC | | | 5,404 | | | | 329,655 | |
United Utilities Group PLC | | | 1,471 | | | | 19,413 | |
Vodafone Group PLC | | | 49,243 | | | | 45,792 | |
Whitbread PLC | | | 399 | | | | 15,524 | |
Wise PLC (Class A Stock)* | | | 1,442 | | | | 13,153 | |
WPP PLC | | | 2,307 | | | | 24,249 | |
| | | | | | | | |
| | |
| | | | | | | 3,935,252 | |
| | |
United States 8.3% | | | | | | | | |
| | |
Alcon AG | | | 1,078 | | | | 99,017 | |
BP PLC | | | 35,779 | | | | 174,989 | |
CSL Ltd. | | | 1,046 | | | | 196,392 | |
CyberArk Software Ltd.* | | | 93 | | | | 25,716 | |
Experian PLC | | | 1,989 | | | | 97,075 | |
Ferrovial SE | | | 1,130 | | | | 45,350 | |
GSK PLC | | | 8,972 | | | | 162,022 | |
Haleon PLC | | | 16,808 | | | | 80,780 | |
Holcim AG* | | | 1,125 | | | | 110,476 | |
James Hardie Industries PLC, CDI* | | | 932 | | | | 29,724 | |
Monday.com Ltd.* | | | 74 | | | | 21,746 | |
Nestle SA | | | 5,689 | | | | 537,569 | |
QIAGEN NV* | | | 474 | | | | 20,087 | |
Roche Holding AG | | | 1,525 | | | | 472,603 | |
Roche Holding AG (Bearer Shares) | | | 69 | | | | 23,451 | |
Sanofi SA | | | 2,475 | | | | 261,558 | |
Schneider Electric SE | | | 1,187 | | | | 307,491 | |
Shell PLC | | | 13,681 | | | | 456,772 | |
See Notes to Financial Statements.
PGIM Quant Solutions International Developed Markets Index Fund 41
PGIM Quant Solutions International Developed Markets Index Fund
Schedule of Investments (continued)
as of October 31, 2024
| | | | | | | | |
| | |
| Description | | Shares | | | Value | |
| | |
COMMON STOCKS (Continued) | | | | | | | | |
| | |
United States (cont’d.) | | | | | | | | |
| | |
Stellantis NV | | | 4,581 | | | $ | 62,770 | |
Swiss Re AG | | | 653 | | | | 83,380 | |
Tenaris SA | | | 1,022 | | | | 16,838 | |
| | | | | | | | |
| | |
| | | | | | | 3,285,806 | |
| | | | | | | | |
| | |
TOTAL COMMON STOCKS | | | | | | | | |
(cost $21,047,742) | | | | | | | 35,751,556 | |
| | | | | | | | |
| | |
PREFERRED STOCKS 0.3% | | | | | | | | |
| | |
Germany | | | | | | | | |
| | |
Bayerische Motoren Werke AG (PRFC) | | | 121 | | | | 8,904 | |
Dr. Ing. h.c. F. Porsche AG (PRFC), 144A | | | 245 | | | | 17,238 | |
Henkel AG & Co. KGaA (PRFC) | | | 362 | | | | 31,347 | |
Porsche Automobil Holding SE (PRFC) | | | 332 | | | | 13,792 | |
Sartorius AG (PRFC) | | | 57 | | | | 14,766 | |
Volkswagen AG (PRFC) | | | 442 | | | | 42,902 | |
| | | | | | | | |
| | |
TOTAL PREFERRED STOCKS | | | | | | | | |
(cost $136,478) | | | | | | | 128,949 | |
| | | | | | | | |
| | |
UNAFFILIATED EXCHANGE-TRADED FUND 2.5% | | | | | | | | |
| | |
United States | | | | | | | | |
| | |
iShares MSCI EAFE ETF | | | | | | | | |
(cost $759,730) | | | 12,160 | | | | 963,315 | |
| | | | | | | | |
| | |
TOTAL LONG-TERM INVESTMENTS | | | | | | | | |
(cost $21,943,950) | | | | | | | 36,843,820 | |
| | | | | | | | |
| | |
SHORT-TERM INVESTMENTS 1.1% | | | | | | | | |
| | |
AFFILIATED MUTUAL FUNDS 0.7% | | | | | | | | |
PGIM Core Government Money Market Fund (7-day effective yield 5.011%)(wb) | | | 282,543 | | | | 282,543 | |
PGIM Institutional Money Market Fund (7-day effective yield 5.096%)(b)(wb) | | | 1,355 | | | | 1,355 | |
| | | | | | | | |
| | |
TOTAL AFFILIATED MUTUAL FUNDS | | | | | | | | |
(cost $283,898) | | | | | | | 283,898 | |
| | | | | | | | |
See Notes to Financial Statements.
42
PGIM Quant Solutions International Developed Markets Index Fund
Schedule of Investments (continued)
as of October 31, 2024
| | | | | | | | | | | | | | | | |
| | | | |
| Description | | Interest
Rate | | | Maturity
Date | | | Principal
Amount
(000)# | | | Value | |
| | | | |
U.S. TREASURY OBLIGATION(k)(n) 0.4% | | | | | | | | | | | | | | | | |
U.S. Treasury Bills (cost $149,052) | | | 4.799% | | | | 12/19/24 | | | | 150 | | | $ | 149,090 | |
| | | | | | | | | | | | | | | | |
| | | | |
TOTAL SHORT-TERM INVESTMENTS | | | | | | | | | | | | | | | | |
(cost $432,950) | | | | | | | | | | | | | | | 432,988 | |
| | | | | | | | | | | | | | | | |
| | | | |
TOTAL INVESTMENTS 94.3% | | | | | | | | | | | | | | | | |
(cost $22,376,900) | | | | | | | | | | | | | | | 37,276,808 | |
Other assets in excess of liabilities(z) 5.7% | | | | | | | | | | | | | | | 2,259,188 | |
| | | | | | | | | | | | | | | | |
| | | | |
NET ASSETS 100.0% | | | | | | | | | | | | | | $ | 39,535,996 | |
| | | | | | | | | | | | | | | | |
See the Glossary for a list of the abbreviation(s) used in the annual report.
| * | Non-income producing security. |
| # | Principal amount is shown in U.S. dollars unless otherwise stated. |
| ^ | Indicates a Level 3 instrument. The aggregate value of Level 3 instruments is $0 and 0.0% of net assets. |
| (b) | Represents security, or portion thereof, purchased with cash collateral received for securities on loan and includes dividend reinvestment. |
| (k) | Represents security, or a portion thereof, segregated as collateral for centrally cleared/exchange-traded derivatives. |
| (n) | Rate shown reflects yield to maturity at purchased date. |
| (wb) | Represents an investment in a Fund affiliated with the Manager. |
| (z) | Includes net unrealized appreciation/(depreciation) and/or market value of the below holdings which are excluded from the Schedule of Investments: |
Futures contracts outstanding at October 31, 2024:
| | | | | | | | | | | | | | | | | | | | | | |
Number
of
Contracts | | Type | | Expiration
Date | | | Current
Notional
Amount | | | Value /
Unrealized
Appreciation
(Depreciation) | |
| Long Positions: | | | | | | | | | | | | | | | | | | | | |
4 | | Euro STOXX 50 Index | | | Dec. 2024 | | | $ | 210,327 | | | | | | | $ | (1,333 | ) | | | | |
1 | | FTSE 100 Index | | | Dec. 2024 | | | | 104,794 | | | | | | | | (2,748 | ) | | | | |
6 | | Mini MSCI EAFE Index | | | Dec. 2024 | | | | 705,060 | | | | | | | | (23,889 | ) | | | | |
1 | | TOPIX Index | | | Dec. 2024 | | | | 177,340 | | | | | | | | 8,456 | | | | | |
| | | | | | | | | | | | | | | | | | | | | | |
| | | | | | | | | | | | | | | | $ | (19,514 | ) | | | | |
| | | | | | | | | | | | | | | | | | | | | | |
See Notes to Financial Statements.
PGIM Quant Solutions International Developed Markets Index Fund 43
PGIM Quant Solutions International Developed Markets Index Fund
Schedule of Investments (continued)
as of October 31, 2024
Summary of Collateral for Centrally Cleared/Exchange-traded Derivatives:
Cash and securities segregated as collateral, including pending settlement for closed positions, to cover requirements for centrally cleared/exchange-traded derivatives are listed by broker as follows:
| | | | | | | | | | | | | | | | | | | | | | | | |
Broker | | Cash and/or Foreign Currency | | | Securities Market Value | |
| | | | | | |
MSC | | | | | | $ | — | | | | | | | | | | | $ | 149,090 | | | | | |
| | | | | | | | | | | | | | | | | | | | | | | | |
Fair Value Measurements:
Various inputs are used in determining the value of the Fund’s investments. These inputs are summarized in the three broad levels listed below.
Level 1—unadjusted quoted prices generally in active markets for identical securities.
Level 2—quoted prices for similar securities, interest rates and yield curves, prepayment speeds, foreign currency exchange rates and other observable inputs.
Level 3—unobservable inputs for securities valued in accordance with Board approved fair valuation procedures.
The following is a summary of the inputs used as of October 31, 2024 in valuing such portfolio securities:
| | | | | | | | | | | | | | | | | | | | |
| | | Level 1 | | | Level 2 | | | Level 3 | |
Investments in Securities | | | | | | | | | | | | | | | | | | | | |
Assets | | | | | | | | | | | | | | | | | | | | |
Long-Term Investments | | | | | | | | | | | | | | | | | | | | |
Common Stocks | | | | | | | | | | | | | | | | | | | | |
Australia | | $ | — | | | $ | 2,745,853 | | | | | | | $ | — | | | | | |
Austria | | | — | | | | 86,289 | | | | | | | | — | | | | | |
Belgium | | | — | | | | 294,532 | | | | | | | | — | | | | | |
Brazil | | | — | | | | 10,287 | | | | | | | | — | | | | | |
Burkina Faso | | | — | | | | 8,544 | | | | | | | | — | | | | | |
Chile | | | — | | | | 18,852 | | | | | | | | — | | | | | |
China | | | — | | | | 181,214 | | | | | | | | — | | | | | |
Denmark | | | — | | | | 1,226,576 | | | | | | | | — | | | | | |
Finland | | | — | | | | 370,406 | | | | | | | | — | | | | | |
France | | | 16,579 | | | | 3,377,805 | | | | | | | | — | | | | | |
Germany | | | — | | | | 3,112,108 | | | | | | | | — | | | | | |
Hong Kong | | | 11,779 | | | | 668,880 | | | | | | | | — | ** | | | | |
Ireland | | | 40,507 | | | | 104,694 | | | | | | | | — | | | | | |
Israel | | | 108,149 | | | | 140,272 | | | | | | | | — | | | | | |
Italy | | | — | | | | 956,804 | | | | | | | | — | | | | | |
Japan | | | — | | | | 8,058,342 | | | | | | | | — | | | | | |
Jordan | | | — | | | | 8,191 | | | | | | | | — | | | | | |
Luxembourg | | | — | | | | 39,532 | | | | | | | | — | | | | | |
Macau | | | — | | | | 35,915 | | | | | | | | — | | | | | |
Netherlands | | | — | | | | 1,460,669 | | | | | | | | — | | | | | |
New Zealand | | | 14,093 | | | | 79,577 | | | | | | | | — | | | | | |
See Notes to Financial Statements.
44
PGIM Quant Solutions International Developed Markets Index Fund
Schedule of Investments (continued)
as of October 31, 2024
| | | | | | | | | | | | | | | | | | | | |
| | | Level 1 | | | Level 2 | | | Level 3 | |
Investments in Securities (continued) | | | | | | | | | | | | | | | | | | | | |
Assets (continued) | | | | | | | | | | | | | | | | | | | | |
Long-Term Investments (continued) | | | | | | | | | | | | | | | | | | | | |
Common Stocks (continued) | | | | | | | | | | | | | | | | | | | | |
Norway | | $ | 15,954 | | | $ | 182,871 | | | | | | | $ | — | | | | | |
Poland | | | — | | | | 8,154 | | | | | | | | — | | | | | |
Portugal | | | 11,352 | | | | 43,131 | | | | | | | | — | | | | | |
Russia | | | — | | | | — | | | | | | | | — | ** | | | | |
Singapore | | | 93,903 | | | | 473,848 | | | | | | | | — | | | | | |
South Africa | | | — | | | | 85,282 | | | | | | | | — | | | | | |
South Korea | | | — | | | | 17,023 | | | | | | | | — | | | | | |
Spain | | | — | | | | 986,502 | | | | | | | | — | | | | | |
Sweden | | | — | | | | 1,162,371 | | | | | | | | — | | | | | |
Switzerland | | | 12,072 | | | | 2,261,586 | | | | | | | | — | | | | | |
United Arab Emirates | | | — | | | | — | | | | | | | | — | ** | | | | |
United Kingdom | | | 37,620 | | | | 3,897,632 | | | | | | | | — | | | | | |
United States | | | 47,462 | | | | 3,238,344 | | | | | | | | — | | | | | |
Preferred Stocks | | | | | | | | | | | | | | | | | | | | |
Germany | | | — | | | | 128,949 | | | | | | | | — | | | | | |
Unaffiliated Exchange-Traded Fund | | | | | | | | | | | | | | | | | | | | |
United States | | | 963,315 | | | | — | | | | | | | | — | | | | | |
Short-Term Investments | | | | | | | | | | | | | | | | | | | | |
Affiliated Mutual Funds | | | 283,898 | | | | — | | | | | | | | — | | | | | |
U.S. Treasury Obligation | | | — | | | | 149,090 | | | | | | | | — | | | | | |
| | | | | | | | | | | | | | | | | | | | |
Total | | $ | 1,656,683 | | | $ | 35,620,125 | | | | | | | $ | — | ** | | | | |
| | | | | | | | | | | | |
| | | | | |
Other Financial Instruments* | | | | | | | | | | | | | | | | | | | | |
Assets | | | | | | | | | | | | | | | | | | | | |
Futures Contracts | | $ | 8,456 | | | $ | — | | | | | | | $ | — | | | | | |
| | | | | | | | | | | | |
| | | | | |
Liabilities | | | | | | | | | | | | | | | | | | | | |
Futures Contracts | | $ | (27,970 | ) | | $ | — | | | | | | | $ | — | | | | | |
| | | | | | | | | | | | |
| * | Other financial instruments are derivative instruments not reflected in the Schedule of Investments, such as futures, forwards and centrally cleared swap contracts, which are recorded at unrealized appreciation (depreciation) on the instrument, and OTC swap contracts which are recorded at fair value. |
| ** | Includes Level 3 investments with an aggregate value of $0. |
Industry Classification:
The industry classification of investments and other assets in excess of liabilities shown as a percentage of net assets as of October 31, 2024 were as follows:
| | | | |
Banks | | | 10.3 | % |
Pharmaceuticals | | | 8.6 | |
| | | | |
Insurance | | | 5.1 | % |
Oil, Gas & Consumable Fuels | | | 3.3 | |
See Notes to Financial Statements.
PGIM Quant Solutions International Developed Markets Index Fund 45
PGIM Quant Solutions International Developed Markets Index Fund
Schedule of Investments (continued)
as of October 31, 2024
Industry Classification (continued):
| | | | |
Semiconductors & Semiconductor Equipment | | | 3.0 | % |
Capital Markets | | | 2.9 | |
Machinery | | | 2.7 | |
Automobiles | | | 2.6 | |
Chemicals | | | 2.6 | |
Metals & Mining | | | 2.6 | |
Unaffiliated Exchange-Traded Fund | | | 2.5 | |
Textiles, Apparel & Luxury Goods | | | 2.4 | |
Food Products | | | 2.3 | |
Electrical Equipment | | | 2.1 | |
Aerospace & Defense | | | 2.1 | |
Software | | | 2.1 | |
Health Care Equipment & Supplies | | | 1.9 | |
Trading Companies & Distributors | | | 1.9 | |
Industrial Conglomerates | | | 1.8 | |
Personal Care Products | | | 1.8 | |
Professional Services | | | 1.8 | |
Electric Utilities | | | 1.7 | |
Diversified Telecommunication Services | | | 1.6 | |
Beverages | | | 1.4 | |
Hotels, Restaurants & Leisure | | | 1.4 | |
Electronic Equipment, Instruments & Components | | | 1.2 | |
Consumer Staples Distribution & Retail | | | 1.0 | |
Real Estate Management & Development | | | 1.0 | |
Household Durables | | | 1.0 | |
Financial Services | | | 1.0 | |
Wireless Telecommunication Services | | | 0.9 | |
Specialty Retail | | | 0.9 | |
Building Products | | | 0.9 | |
Biotechnology | | | 0.9 | |
Multi-Utilities | | | 0.8 | |
Entertainment | | | 0.8 | |
Broadline Retail | | | 0.8 | |
IT Services | | | 0.8 | |
Affiliated Mutual Funds | | | 0.7 | |
Tobacco | | | 0.7 | |
Construction & Engineering | | | 0.7 | |
Household Products | | | 0.5 | |
| | | | |
Automobile Components | | | 0.5 | % |
Air Freight & Logistics | | | 0.5 | |
Technology Hardware, Storage & Peripherals | | | 0.5 | |
Construction Materials | | | 0.4 | |
Life Sciences Tools & Services | | | 0.4 | |
Ground Transportation | | | 0.4 | |
Industrial REITs | | | 0.4 | |
U.S. Treasury Obligation | | | 0.4 | |
Commercial Services & Supplies | | | 0.4 | |
Media | | | 0.4 | |
Marine Transportation | | | 0.3 | |
Transportation Infrastructure | | | 0.3 | |
Retail REITs | | | 0.3 | |
Communications Equipment | | | 0.3 | |
Interactive Media & Services | | | 0.2 | |
Gas Utilities | | | 0.2 | |
Paper & Forest Products | | | 0.2 | |
Independent Power & Renewable Electricity Producers | | | 0.2 | |
Health Care Providers & Services | | | 0.2 | |
Diversified REITs | | | 0.2 | |
Leisure Products | | | 0.1 | |
Office REITs | | | 0.1 | |
Passenger Airlines | | | 0.1 | |
Water Utilities | | | 0.1 | |
Health Care Technology | | | 0.1 | |
Diversified Consumer Services | | | 0.0 | * |
Energy Equipment & Services | | | 0.0 | * |
Containers & Packaging | | | 0.0 | * |
Distributors | | | 0.0 | * |
| | | | |
| | | 94.3 | |
Other assets in excess of liabilities | | | 5.7 | |
| | | | |
| |
| | | 100.0 | % |
| | | | |
See Notes to Financial Statements.
46
PGIM Quant Solutions International Developed Markets Index Fund
Schedule of Investments (continued)
as of October 31, 2024
Effects of Derivative Instruments on the Financial Statements and Primary Underlying Risk Exposure:
The Fund invested in derivative instruments during the reporting period. The primary type of risk associated with these derivative instruments is equity risk. See the Notes to Financial Statements for additional detail regarding these derivative instruments and their risks. The effect of such derivative instruments on the Fund’s financial position and financial performance as reflected in the Statement of Assets and Liabilities and Statement of Operations is presented in the summary below.
Fair values of derivative instruments as of October 31, 2024 as presented in the Statement of Assets and Liabilities:
| | | | | | | | | | | | |
| | | Asset Derivatives | | | Liability Derivatives | |
Derivatives not accounted for as hedging instruments, carried at fair value | | Statement of Assets and Liabilities Location | | Fair
Value | | | Statement of Assets and Liabilities Location | | Fair
Value | |
Equity contracts | | Due from/to broker-variation margin futures | | $ | 8,456 | * | | Due from/to broker-variation margin futures | | $ | 27,970 | * |
| | | | | | | | | | | | |
| * | Includes cumulative appreciation (depreciation) as reported in the schedule of open futures and centrally cleared swap contracts. Only unsettled variation margin receivable (payable) is reported within the Statement of Assets and Liabilities. |
The effects of derivative instruments on the Statement of Operations for the year ended October 31, 2024 are as follows:
| | | | |
Amount of Realized Gain (Loss) on Derivatives Recognized in Income | |
Derivatives not accounted for as hedging
instruments, carried at fair value | | Futures | |
Equity contracts | | $ | 220,153 | |
| | | | |
| | | | |
Change in Unrealized Appreciation (Depreciation) on Derivatives Recognized in Income | |
Derivatives not accounted for
as hedging instruments,
carried at fair value | | Futures | |
Equity contracts | | $ | 80,947 | |
| | | | |
For the year ended October 31, 2024, the Fund’s average volume of derivative activities is as follows:
| | |
| Derivative Contract Type | | Average Volume of Derivative Activities* |
Futures Contracts - Long Positions (1) | | $1,901,713 |
| * | Average volume is based on average quarter end balances for the year ended October 31, 2024. |
| (1) | Notional Amount in USD. |
See Notes to Financial Statements.
PGIM Quant Solutions International Developed Markets Index Fund 47
PGIM Quant Solutions International Developed Markets Index Fund
Statement of Assets & Liabilities
as of October 31, 2024
| | | | |
Assets | | | | |
| |
Investments at value: | | | | |
Unaffiliated investments (cost $22,093,002) | | $ | 36,992,910 | |
Affiliated investments (cost $283,898) | | | 283,898 | |
Foreign currency, at value (cost $362,794) | | | 362,928 | |
Receivable for Fund shares sold | | | 1,540,170 | |
Tax reclaim receivable | | | 241,268 | |
Dividends receivable | | | 134,255 | |
Receivable for investments sold | | | 82,031 | |
Due from Manager | | | 10,228 | |
Prepaid expenses and other assets | | | 9,715 | |
| | | | |
| |
Total Assets | | | 39,657,403 | |
| | | | |
| |
Liabilities | | | | |
| |
Payable for Fund shares purchased | | | 30,454 | |
Audit fee payable | | | 29,681 | |
Custodian and accounting fees payable | | | 21,986 | |
Shareholders’ reports payable | | | 9,635 | |
Due to broker—variation margin futures | | | 8,886 | |
Professional fees payable | | | 7,166 | |
Accrued expenses and other liabilities | | | 5,808 | |
Pricing fees payable | | | 5,075 | |
Fund data services payable | | | 1,331 | |
Trustees’ fees payable | | | 946 | |
Commitment fee payable | | | 333 | |
Affiliated transfer agent fee payable | | | 106 | |
| | | | |
| |
Total Liabilities | | | 121,407 | |
| | | | |
| |
Net Assets | | $ | 39,535,996 | |
| | | | |
| |
| | | | |
| |
Net assets were comprised of: | | | | |
Paid-in capital | | $ | 27,587,398 | |
Total distributable earnings (loss) | | | 11,948,598 | |
| | | | |
| |
Net assets, October 31, 2024 | | $ | 39,535,996 | |
| | | | |
| |
Class R6 | | | | |
| |
Net asset value, offering price and redemption price per share, ($39,535,996 ÷ 2,766,689 shares of beneficial interest issued and outstanding) | | $ | 14.29 | |
| | | | |
See Notes to Financial Statements.
48
PGIM Quant Solutions International Developed Markets Index Fund
Statement of Operations
Year Ended October 31, 2024
| | | | |
Net Investment Income (Loss) | | | | |
| |
Income | | | | |
Unaffiliated dividend income (net of $209,266 foreign withholding tax) | | $ | 1,676,989 | |
Affiliated dividend income | | | 47,453 | |
Interest income | | | 10,326 | |
Affiliated income from securities lending, net | | | 880 | |
| | | | |
| |
Total income | | | 1,735,648 | |
| | | | |
| |
Expenses | | | | |
Management fee | | | 155,022 | |
Custodian and accounting fees | | | 93,028 | |
Professional fees | | | 83,135 | |
Pricing fees | | | 42,313 | |
Audit fee | | | 29,680 | |
Shareholders’ reports | | | 20,188 | |
Commitment fees | | | 18,765 | |
Trustees’ fees | | | 10,493 | |
Transfer agent’s fees and expenses (including affiliated expense of $600) | | | 757 | |
Registration fees | | | 250 | |
Miscellaneous | | | 22,209 | |
| | | | |
| |
Total expenses | | | 475,840 | |
Less: Fee waiver and/or expense reimbursement | | | (347,837 | ) |
| | | | |
| |
Net expenses | | | 128,003 | |
| | | | |
| |
Net investment income (loss) | | | 1,607,645 | |
| | | | |
| |
Realized And Unrealized Gain (Loss) On Investment And Foreign Currency Transactions | | | | |
| |
Net realized gain (loss) on: | | | | |
Investment transactions (including affiliated of $(228)) | | | 28,504 | |
Futures transactions | | | 220,153 | |
In-kind redemptions(1) | | | 5,204,160 | |
Foreign currency transactions | | | 6,698 | |
| | | | |
| |
| | | 5,459,515 | |
| | | | |
Net change in unrealized appreciation (depreciation) on: | | | | |
Investments | | | 5,741,295 | |
Futures | | | 80,947 | |
Foreign currencies | | | 13,725 | |
| | | | |
| |
| | | 5,835,967 | |
| | | | |
| |
Net gain (loss) on investment and foreign currency transactions | | | 11,295,482 | |
| | | | |
| |
Net Increase (Decrease) In Net Assets Resulting From Operations | | $ | 12,903,127 | |
| | | | |
| (1) | See Note 9, Redemption In-kind, in Notes to Financial Statements. |
See Notes to Financial Statements.
PGIM Quant Solutions International Developed Markets Index Fund 49
PGIM Quant Solutions International Developed Markets Index Fund
Statements of Changes in Net Assets
| | | | | | | | |
| |
| | | Year Ended
October 31, | |
| | |
| | | 2024 | | | 2023 | |
| | |
Increase (Decrease) in Net Assets | | | | | | | | |
| | |
Operations | | | | | | | | |
Net investment income (loss) | | $ | 1,607,645 | | | $ | 1,762,584 | |
Net realized gain (loss) on investment and foreign currency transactions | | | 5,459,515 | | | | (387,550 | ) |
Net change in unrealized appreciation (depreciation) on investments and foreign currencies | | | 5,835,967 | | | | 7,610,572 | |
| | | | | | | | |
| | |
Net increase (decrease) in net assets resulting from operations | | | 12,903,127 | | | | 8,985,606 | |
| | | | | | | | |
| | |
Dividends and Distributions | | | | | | | | |
Distributions from distributable earnings | | | | | | | | |
Class R6 | | | (2,059,921 | ) | | | (1,557,701 | ) |
| | | | | | | | |
| | |
Fund share transactions | | | | | | | | |
Net proceeds from shares sold (962,550 and 620,905 shares, respectively) | | | 13,508,656 | | | | 7,856,647 | |
Net asset value of shares issued in reinvestment of dividends and distributions (159,808 and 133,023 shares, respectively) | | | 2,059,921 | | | | 1,557,701 | |
Cost of shares purchased (3,517,249 and 1,197,009 shares, respectively) | | | (49,463,237 | ) | | | (14,905,886 | ) |
| | | | | | | | |
| | |
Net increase (decrease) in net assets from Fund share transactions | | | (33,894,660 | ) | | | (5,491,538 | ) |
| | | | | | | | |
Total increase (decrease) | | | (23,051,454 | ) | | | 1,936,367 | |
| | |
Net Assets: | | | | | | | | |
| | |
Beginning of year | | | 62,587,450 | | | | 60,651,083 | |
| | | | | | | | |
| | |
End of year | | $ | 39,535,996 | | | $ | 62,587,450 | |
| | | | | | | | |
See Notes to Financial Statements.
50
PGIM Quant Solutions International Developed Markets Index Fund
Financial Highlights
| | | | | | | | | | | | | | | | | | | | |
| | |
| Class R6 Shares | | | | |
| | | Year Ended October 31, | |
| | | 2024 | | | 2023 | | | 2022 | | | 2021 | | | 2020 | |
| Per Share Operating Performance(a): | | | | | | | | | | | | | | | | | | | | |
| Net Asset Value, Beginning of Year | | | $12.13 | | | | $10.82 | | | | $14.73 | | | | $11.23 | | | | $12.16 | |
| Income (loss) from investment operations: | | | | | | | | | | | | | | | | | | | | |
| Net investment income (loss) | | | 0.36 | | | | 0.34 | | | | 0.32 | | | | 0.31 | | | | 0.22 | |
| Net realized and unrealized gain (loss) on investment and foreign currency transactions | | | 2.20 | | | | 1.26 | | | | (3.76 | ) | | | 3.40 | | | | (0.82 | ) |
| Total from investment operations | | | 2.56 | | | | 1.60 | | | | (3.44 | ) | | | 3.71 | | | | (0.60 | ) |
| Less Dividends and Distributions: | | | | | | | | | | | | | | | | | | | | |
| Dividends from net investment income | | | (0.40 | ) | | | (0.29 | ) | | | (0.43 | ) | | | (0.21 | ) | | | (0.33 | ) |
| Distributions from net realized gains | | | - | | | | - | | | | (0.04 | ) | | | - | | | | - | |
| Total dividends and distributions | | | (0.40 | ) | | | (0.29 | ) | | | (0.47 | ) | | | (0.21 | ) | | | (0.33 | ) |
| Net asset value, end of year | | | $14.29 | | | | $12.13 | | | | $10.82 | | | | $14.73 | | | | $11.23 | |
| Total Return(b): | | | 21.50 | % | | | 14.87 | % | | | (24.07 | )% | | | 33.21 | % | | | (5.21 | )% |
| | | | | | | | | | | | | | | | | | | | | |
| | | | | | |
| Ratios/Supplemental Data: | | | | | | | | | | | | | | | | | | | | |
| Net assets, end of year (000) | | | $39,536 | | | | $62,587 | | | | $60,651 | | | | $81,612 | | | | $66,162 | |
| Average net assets (000) | | | $62,009 | | | | $66,020 | | | | $72,851 | | | | $82,645 | | | | $56,084 | |
| Ratios to average net assets(c): | | | | | | | | | | | | | | | | | | | | |
| Expenses after waivers and/or expense reimbursement | | | 0.21 | %(d) | | | 0.29 | % | | | 0.30 | % | | | 0.30 | % | | | 0.30 | % |
| Expenses before waivers and/or expense reimbursement | | | 0.77 | % | | | 0.77 | % | | | 0.70 | % | | | 0.69 | % | | | 0.95 | % |
| Net investment income (loss) | | | 2.59 | % | | | 2.67 | % | | | 2.57 | % | | | 2.16 | % | | | 1.93 | % |
| Portfolio turnover rate(e) | | | 24 | % | | | 8 | % | | | 26 | % | | | 23 | % | | | 13 | % |
| (a) | Calculated based on average shares outstanding during the year. |
| (b) | Total return is calculated assuming a purchase of a share on the first day and a sale on the last day of each year reported and includes reinvestment of dividends and distributions, if any. Total returns may reflect adjustments to conform to GAAP. |
| (c) | Does not include expenses of the underlying funds in which the Fund invests. |
| (d) | Includes interest expense on borrowings from the Syndicated Credit Agreement of 0.01% which are being excluded from the Fund’s contractual waiver, if applicable, for the year ended October 31, 2024. |
| (e) | The Fund’s portfolio turnover rate is calculated in accordance with regulatory requirements, without regard to transactions involving short-term investments, certain derivatives and in-kind transactions (if any). If such transactions were included, the Fund’s portfolio turnover rate may be higher. |
See Notes to Financial Statements.
PGIM Quant Solutions International Developed Markets Index Fund 51
Notes to Financial Statements
Prudential Investment Portfolios 2 (the “Registered Investment Company” or “RIC”) is registered under the Investment Company Act of 1940, as amended (“1940 Act”), as an open-end management investment company. The RIC is organized as a Delaware Statutory Trust. These financial statements relate to the following series of the RIC: PGIM Quant Solutions Emerging Markets Equity Fund and PGIM Quant Solutions International Developed Markets Index Fund (each, a “Fund” and collectively, the “Funds”). The Funds are classified as diversified funds for purposes of the 1940 Act.
| | |
| Fund | | Investment Objective(s) |
PGIM Quant Solutions Emerging Markets Equity Fund (“Quant Solutions Emerging Markets Equity”) | | To seek to provide returns in excess of the Morgan Stanley Capital International Emerging Markets Index over full market cycles |
PGIM Quant Solutions International Developed Markets Index Fund (“Quant Solutions International Developed Markets Index”) | | To provide investment results that approximate the performance of the MSCI EAFE Index |
The Funds follow the investment company accounting and reporting guidance of the Financial Accounting Standards Board (“FASB”) Accounting Standard Codification (“ASC”) Topic 946 Financial Services — Investment Companies. The following is a summary of significant accounting policies followed by the Funds in the preparation of their financial statements. The policies conform to U.S. generally accepted accounting principles (“GAAP”). The Funds consistently follow such policies in the preparation of their financial statements.
Securities Valuation: The Funds hold securities and other assets and liabilities that are fair valued as of the close of each day (generally, 4:00 PM Eastern time) the New York Stock Exchange (“NYSE”) is open for trading. As described in further detail below, the Funds’ investments are valued daily based on a number of factors, including the type of investment and whether market quotations are readily available. The RIC’s Board of Trustees (the “Board”) has approved the Funds’ valuation policies and procedures for security valuation and designated PGIM Investments LLC (“PGIM Investments” or the “Manager”) as the “Valuation Designee,” as defined by Rule 2a-5(b) under the 1940 Act, to perform the fair value determination relating to all Funds investments. Pursuant to the Board’s oversight, the Valuation Designee has established a Valuation Committee to perform the duties and responsibilities of the Valuation Designee under Rule 2a-5. The valuation procedures permit the Funds to utilize independent pricing vendor services, quotations from market makers, and alternative valuation methods when market quotations are either not readily available or not deemed representative of fair value. Fair value is the estimated price that would be
52
received to sell an asset or paid to transfer a liability in an orderly transaction between market participants on the measurement date.
For the fiscal reporting year-end, securities and other assets and liabilities were fair valued at the close of the last U.S. business day. Trading in certain foreign securities may occur when the NYSE is closed (including weekends and holidays). Because such foreign securities trade in markets that are open on weekends and U.S. holidays, the values of some of the Funds’ foreign investments may change on days when investors cannot purchase or redeem Fund shares.
Various inputs determine how the Funds’ investments are valued, all of which are categorized according to the three broad levels (Level 1, 2, or 3) detailed in the Schedule of Investments and referred to herein as the “fair value hierarchy” in accordance with FASB ASC Topic 820 Fair Value Measurement.
Common or preferred stocks, exchange-traded funds (“ETFs”) and derivative instruments, if applicable, that are traded on a national securities exchange are valued at the last sale price as of the close of trading on the applicable exchange where the security principally trades. Securities traded via NASDAQ are valued at the NASDAQ official closing price. To the extent these securities are valued at the last sale price or NASDAQ official closing price, they are classified as Level 1 in the fair value hierarchy. In the event that no sale or official closing price on a valuation date exists, these securities are generally valued at the mean between the last reported bid and ask prices, or at the last bid price in the absence of an ask price. These securities are classified as Level 2 in the fair value hierarchy.
Foreign equities traded on foreign securities exchanges are generally valued using pricing vendor services that provide model prices derived using adjustment factors based on information such as local closing price, relevant general and sector indices, currency fluctuations, depositary receipts, and futures, as applicable. Securities valued using such model prices are classified as Level 2 in the fair value hierarchy. The models generate an evaluated adjustment factor for each security, which is applied to the local closing price to adjust it for post closing market movements up to the time each Fund is valued. Utilizing that evaluated adjustment factor, the vendor provides an evaluated price for each security. If the vendor does not provide an evaluated price, securities are valued in accordance with exchange-traded common and preferred stock valuation policies discussed above.
Investments in open-end funds (other than ETFs) are valued at their net asset values as of the close of the NYSE on the date of valuation. These securities are classified as Level 1 in the fair value hierarchy since they may be purchased or sold at their net asset values on the date of valuation.
Fixed income securities traded in the OTC market are generally classified as Level 2 in the fair value hierarchy. Such fixed income securities are typically valued using the market approach which generally involves obtaining data from an approved independent third-party vendor source. The Funds utilize the market approach as the primary method to value
53
Notes to Financial Statements (continued)
securities when market prices of identical or comparable instruments are available. The third-party vendors’ valuation techniques used to derive the evaluated bid price are based on evaluating observable inputs, including but not limited to, yield curves, yield spreads, credit ratings, deal terms, tranche level attributes, default rates, cash flows, prepayment speeds, broker/dealer quotations and reported trades. Certain Level 3 securities are also valued using the market approach when obtaining a single broker quote or when utilizing transaction prices for identical securities that have been used in excess of five business days. During the reporting period, there were no changes to report with respect to the valuation approach and/or valuation techniques discussed above.
Securities and other assets that cannot be priced according to the methods described above are valued based on policies and procedures approved by the Board. In the event that unobservable inputs are used when determining such valuations, the securities will be classified as Level 3 in the fair value hierarchy. Altering one or more unobservable inputs may result in a significant change to a Level 3 security’s fair value measurement.
When determining the fair value of securities, some of the factors influencing the valuation include: the nature of any restrictions on disposition of the securities; assessment of the general liquidity of the securities; the issuer’s financial condition and the markets in which it does business; the cost of the investment; the size of the holding and the capitalization of the issuer; the prices of any recent transactions or bids/offers for such securities or any comparable securities; and any available analyst media or other reports or information deemed reliable by the Valuation Designee regarding the issuer or the markets or industry in which it operates. Using fair value to price securities may result in a value that is different from a security’s most recent closing price and from the price used by other unaffiliated mutual funds to calculate their net asset values.
Foreign Currency Translation: The books and records of the Funds are maintained in U.S. dollars. Foreign currency amounts are translated into U.S. dollars on the following basis:
(i) market value of investment securities, other assets and liabilities — at the exchange rate as of the valuation date;
(ii) purchases and sales of investment securities, income and expenses — at the rates of exchange prevailing on the respective dates of such transactions.
Although the net assets of the Funds are presented at the foreign exchange rates and market values at the close of the period, the Funds do not generally isolate that portion of the results of operations arising as a result of changes in the foreign exchange rates from the fluctuations arising from changes in the market prices of long-term portfolio securities held at the end of the period. Similarly, the Funds do not isolate the effect of changes in foreign
54
exchange rates from the fluctuations arising from changes in the market prices of long-term portfolio securities sold during the period. Accordingly, holding period unrealized and realized foreign currency gains (losses) are included in the reported net change in unrealized appreciation (depreciation) on investments and net realized gains (losses) on investment transactions on the Statements of Operations.
Additionally, net realized gains (losses) on foreign currency transactions represent net foreign exchange gains (losses) from the disposition of holdings of foreign currencies, currency gains (losses) realized between the trade and settlement dates on investment transactions, and the difference between the amounts of interest, dividends and foreign withholding taxes recorded on the Funds’ books and the U.S. dollar equivalent amounts actually received or paid. Net unrealized currency gains (losses) arise from valuing foreign currency denominated assets and liabilities (other than investments) at period end exchange rates.
Financial Futures Contracts: A financial futures contract is an agreement to purchase (long) or sell (short) an agreed amount of securities at a set price for delivery on a future date. Upon entering into a financial futures contract, the Funds are required to pledge to the broker an amount of cash and/or other assets equal to a certain percentage of the contract amount. This amount is known as the “initial margin.” Subsequent payments, known as “variation margin,” are made or received by the Funds each day, depending on the daily fluctuations in the value of the underlying security. Such variation margin is recorded for financial statement purposes on a daily basis as unrealized gain (loss). When the contract expires or is closed, the gain (loss) is realized and is presented in the Statement of Operations as net realized gain (loss) on futures transactions.
Certain Funds invested in financial futures contracts in order to hedge their existing portfolio securities, or securities the Funds intend to purchase, against fluctuations in value caused by changes in prevailing interest rates. Should interest rates move unexpectedly, the Funds may not achieve the anticipated benefits of the financial futures contracts and may realize a loss. The use of futures transactions involves the risk of imperfect correlation in movements in the price of futures contracts, interest rates and the underlying hedged assets. Since futures contracts are exchange-traded, there is minimal counterparty credit risk to the Funds since the exchanges’ clearinghouse acts as counterparty to all exchange-traded futures and guarantees the futures contracts against default.
Master Netting Arrangements: The RIC, on behalf of each Fund, is subject to various Master Agreements, or netting arrangements, with select counterparties. These are agreements which a subadviser may have negotiated and entered into on behalf of all or a portion of each Fund. A master netting arrangement between each Fund and the counterparty permits each Fund to offset amounts payable by each Fund to the same counterparty against amounts to be received and by the receipt of collateral from the counterparty by each Fund to cover each Fund’s exposure to the counterparty. However, there is no assurance that such mitigating factors are easily enforceable. In addition to master netting arrangements, the right to set-off exists when all the conditions are met such that each of the parties owes
55
Notes to Financial Statements (continued)
the other determinable amounts, the reporting party has the right to set-off the amount owed with the amount owed by the other party, the reporting party intends to set-off and the right of set-off is enforceable by law.
Securities Lending: Certain Funds lend their portfolio securities to banks and broker-dealers. The loans are secured by collateral at least equal to the market value of the securities loaned. Collateral pledged by each borrower is invested in an affiliated money market fund and is marked to market daily, based on the previous day’s market value, such that the value of the collateral exceeds the value of the loaned securities. In the event of significant appreciation in value of the securities on loan on the last business day of the reporting period, the financial statements may reflect a collateral value that is less than the market value of the loaned securities. Such shortfall is remedied as described above. Loans are subject to termination at the option of the borrower or the Funds. Upon termination of the loan, the borrower will return to the Funds securities identical to the loaned securities. The remaining open loans of the securities lending transactions are considered overnight and continuous. Should the borrower of the securities fail financially, the Funds have the right to repurchase the securities in the open market using the collateral.
The Funds recognize income, net of any rebate and securities lending agent fees, for lending their securities in the form of fees or interest on the investment of any cash received as collateral. The borrower receives all interest and dividends from the securities loaned and such payments are passed back to the lender in amounts equivalent thereto, which are reflected in interest income or unaffiliated dividend income based on the nature of the payment on the Statement of Operations. The Funds also continue to recognize any unrealized gain (loss) in the market price of the securities loaned and on the change in the value of the collateral invested that may occur during the term of the loan. In addition, realized gain (loss) is recognized on changes in the value of the collateral invested upon liquidation of the collateral. Net earnings from securities lending are disclosed in the Statement of Operations.
Securities Transactions and Net Investment Income: Securities transactions are recorded on the trade date. Realized gains (losses) from investment and currency transactions are calculated on the specific identification method. Dividend income is recorded on the ex-date, or for certain foreign securities, when the Funds become aware of such dividends. Interest income, including amortization of premium and accretion of discount on debt securities, as required, is recorded on the accrual basis. Expenses are recorded on an accrual basis, which may require the use of certain estimates by management that may differ from actual expense amounts.
Taxes: It is each Fund’s policy to continue to meet the requirements of the Internal Revenue Code applicable to regulated investment companies and to distribute all of its taxable net
56
investment income and capital gains, if any, to its shareholders. Therefore, no federal income tax provision is required. Withholding taxes on foreign dividends, interest and capital gains, if any, are recorded, net of reclaimable amounts, at the time the related income is earned.
Quant Solutions Emerging Markets Equity is subject to foreign income taxes imposed by certain countries in which it invests. Additionally, capital gains realized upon disposition of securities issued in or by certain foreign countries are subject to capital gains tax imposed by those countries. All taxes are computed in accordance with the applicable foreign tax law, and, to the extent permitted, capital losses are used to offset capital gains. Taxes attributable to income are accrued by the Fund as a reduction of income. Current and deferred tax expense attributable to capital gains is reflected as a component of realized or change in unrealized gain/loss on securities in the accompanying financial statements. To the extent that the Fund has country specific capital loss carryforwards, such carryforwards are applied against net unrealized gains when determining the deferred tax liability. Any deferred tax liability incurred by the Fund is included in either Other liabilities or Deferred tax liability on the accompanying Statement of Assets and Liabilities.
Dividends and Distributions: Dividends and distributions to shareholders, which are determined in accordance with federal income tax regulations and which may differ from GAAP, are recorded on the ex-date. Permanent book/tax differences relating to income and gain (loss) are reclassified between total distributable earnings (loss) and paid-in capital, as appropriate. The chart below sets forth the expected frequency of dividend and capital gains distributions to shareholders. Various factors may impact the frequency of dividend distributions to shareholders, including but not limited to adverse market conditions or portfolio holding-specific events.
| | |
| Expected Distribution Schedule to Shareholders* | | Frequency |
| |
| Net Investment Income | | Annually |
| |
| Short-Term Capital Gains | | Annually |
| |
| Long-Term Capital Gains | | Annually |
| * | Under certain circumstances, each Fund may make more than one distribution of short-term and/or long-term capital gains during a fiscal year. |
Estimates: The preparation of financial statements requires management to make estimates and assumptions that affect the reported amounts and disclosures in the financial statements. Actual results could differ from those estimates.
The RIC, on behalf of each Fund, has entered into management agreements with the Manager pursuant to which it has responsibility for all investment advisory services, including supervision of the subadviser’s performance of such services, and for rendering administrative services.
57
Notes to Financial Statements (continued)
The Manager has entered into subadvisory agreements with PGIM Quantitative Solutions LLC (“PGIM Quantitative Solutions” or the “subadviser”). The Manager pays for the services of PGIM Quantitative Solutions.
Fees payable under the management agreement are computed daily and paid monthly. For the reporting period ended October 31, 2024, the contractual and effective management fee rates were as follows:
| | | | |
| Fund | | Management Fee | | Effective Management Fee, before any waiver and/or expense reimbursements |
Quant Solutions Emerging Markets Equity | | 0.75% of average daily net assets. | | 0.75% |
Quant Solutions International Developed Markets Index | | 0.25% of average daily net assets. | | 0.25 |
The Manager has contractually agreed to limit total annual operating expenses after fee waivers and/or expense reimbursements. This contractual waiver excludes interest, brokerage, taxes (such as income and foreign withholding taxes, stamp duty and deferred tax expenses), acquired fund fees and expenses, extraordinary expenses, and certain other Fund expenses such as dividend and interest expense and broker charges on short sales. Fees and/or expenses waived and/or reimbursed by the Manager for the purpose of preventing the expenses from exceeding a certain expense ratio limit may be recouped by the Manager within the same fiscal year during which such waiver and/or reimbursement is made if such recoupment can be realized without exceeding the expense limit in effect at the time of the waiver/reimbursement and/or recoupment for that fiscal year, as applicable. With respect to Quant Solutions Emerging Markets, this waiver may not be terminated prior to February 28, 2026. With respect to Quant Solutions International Developed Markets Index, this waiver has no express termination date and may not be terminated by PGIM Investments without prior approval of the Fund’s Board of Trustees. The expense limitation attributable to the below class is:
| | |
| Fund | | Class Expense Limitation |
Quant Solutions Emerging Markets Equity - Class R6 | | 1.20% |
Quant Solutions International Developed Markets Index - Class R6 | | 0.19* |
*Prior to December 11, 2023, the Manager had contractually agreed to limit total annual operating expenses after fee waivers and/or expense reimbursements (exclusive of taxes, interest, distribution (12b-1 fees) and certain extraordinary expenses) to 0.25% of the Fund’s average daily net assets on an annualized basis.
58
The RIC, on behalf of each Fund, has a distribution agreement with Prudential Investment Management Services LLC (“PIMS”), which acts as the distributor of the Class R6 shares of each Fund. No distribution or service fees are paid to PIMS as distributor for Class R6 shares of each Fund.
PGIM Investments, PIMS and PGIM Quantitative Solutions are indirect, wholly-owned subsidiaries of Prudential Financial, Inc. (“Prudential”).
| 4. | Other Transactions with Affiliates |
Prudential Mutual Fund Services LLC (“PMFS”), an affiliate of PGIM Investments and an indirect, wholly-owned subsidiary of Prudential, serves as each Fund’s transfer agent and shareholder servicing agent. Transfer agent’s fees and expenses in the Statement of Operations include certain out-of-pocket expenses paid to non-affiliates, where applicable.
The Funds may invest their overnight sweep cash in the PGIM Core Government Money Market Fund (the “Core Government Fund”), a series of the Prudential Government Money Market Fund, Inc., and their securities lending cash collateral in the PGIM Institutional Money Market Fund (the “Money Market Fund”), a series of Prudential Investment Portfolios 2, each registered under the 1940 Act and managed by PGIM Investments. PGIM Investments and/or its affiliates are paid fees or reimbursed for providing their services to the Core Government Fund and the Money Market Fund. In addition to the realized and unrealized gains on investments in the Core Government Fund and the Money Market Fund, earnings from such investments are disclosed on the Statement of Operations as “Affiliated dividend income” and “Income from securities lending, net”, respectively.
The Funds may enter into certain securities purchase or sale transactions under Board approved Rule 17a-7 procedures. Rule 17a-7 is an exemptive rule under the 1940 Act that, subject to certain conditions, permits purchase and sale transactions among affiliated investment companies, or between an investment company and a person that is affiliated solely by reason of having a common (or affiliated) investment adviser, common directors/trustees, and/or common officers. For the year ended October 31, 2024, no Rule 17a-7 transactions were entered into by the Funds.
The aggregate cost of purchases and proceeds from sales of portfolio securities (excluding short-term investments, in-kind transactions and U.S. Government securities) for the reporting period ended October 31, 2024, were as follows:
| | | | | | | | |
| Fund | | Cost of Purchases | | | Proceeds from Sales | |
Quant Solutions Emerging Markets Equity | | | $36,096,647 | | | $ | 39,476,474 | |
Quant Solutions International Developed Markets Index | | | 14,687,315 | | | | 26,454,803 | |
A summary of the cost of purchases and proceeds from sales of shares of affiliated mutual funds for the year ended October 31, 2024, is presented as follows:
59
Notes to Financial Statements (continued)
Quant Solutions Emerging Markets Equity:
| | | | | | | | | | | | | | | | | | | | | | | | | | |
Value, Beginning of Year | | | Cost of Purchases | | | Proceeds from Sales | | | Change in Unrealized Gain (Loss) | | Realized Gain (Loss) | | Value, End of Year | | | Shares, End of Year | | | Income | |
| |
| | Short-Term Investments - Affiliated Mutual Funds: | | | | | |
| |
| | PGIM Core Government Money Market Fund (7-day effective yield 5.011%)(1)(wb) | | | | | |
| | $466,140 | | | | $19,812,705 | | | | $17,378,559 | | | $— | | $— | | | $2,900,286 | | | | 2,900,286 | | | | $54,446 | |
|
| | PGIM Institutional Money Market Fund (7-day effective yield 5.096%)(1)(b)(wb) | |
| | — | | | | 1,985,549 | | | | 1,682,500 | | | — | | (69) | | | 302,980 | | | | 303,132 | | | | 161 | (2) |
| | $466,140 | | | | $21,798,254 | | | | $19,061,059 | | | $— | | $(69) | | | $3,203,266 | | | | | | | | $54,607 | |
Quant Solutions International Developed Markets Index:
| | | | | | | | | | | | | | | | | | | | | | | | | | |
Value, Beginning of Year | | | Cost of Purchases | | | Proceeds from Sales | | | Change in Unrealized Gain (Loss) | | Realized Gain (Loss) | | Value, End of Year | | | Shares, End of Year | | | Income | |
| |
| | Short-Term Investments - Affiliated Mutual Funds: | | | | | |
| |
| | PGIM Core Government Money Market Fund (7-day effective yield 5.011%)(1)(wb) | | | | | |
| | $1,142,230 | | | | $13,950,455 | | | | $14,810,142 | | | $— | | $— | | | $282,543 | | | | 282,543 | | | | $47,453 | |
|
| | PGIM Institutional Money Market Fund (7-day effective yield 5.096%)(1)(b)(wb) | |
| | — | | | | 19,798,866 | | | | 19,797,283 | | | — | | (228) | | | 1,355 | | | | 1,355 | | | | 880 | (2) |
| | $1,142,230 | | | | $33,749,321 | | | | $34,607,425 | | | $— | | $(228) | | | $283,898 | | | | | | | | $48,333 | |
| (1) | The Fund did not have any capital gain distributions during the reporting period. |
| (2) | The amount, or a portion thereof, represents the affiliated securities lending income shown on the Statement of Operations. |
| (b) | Represents security, or portion thereof, purchased with cash collateral received for securities on loan and includes dividend reinvestment. |
| (wb) | Represents an investment in a Fund affiliated with the Manager. |
| 6. | Distributions and Tax Information |
Distributions to shareholders, which are determined in accordance with federal income tax regulations and which may differ from GAAP, are recorded on the ex-date. In order to present total distributable earnings (loss) and paid-in capital in excess of par on the Statement of Assets and Liabilities that more closely represent their tax character, certain adjustments have been made to total distributable earnings (loss) and paid-in capital in excess of par for the Funds indicated below.
60
For the year ended October 31, 2024, the adjustments were as follows:
| | | | | | | | | | |
| Fund | | Total Distributable Earnings (Loss) | | Paid-in Capital in Excess of Par |
Quant Solutions Emerging Markets Equity | | | $ | — | | | | $ | — | |
Quant Solutions International Developed Markets Index (a) | | | | (4,634,869 | ) | | | | 4,634,869 | |
| (a) | Redemptions In Kind Adjustments. |
For the year ended October 31, 2024, the tax character of dividends paid as reflected in the Statement of Changes in Net Assets were as follows:
| | | | | | | | | | | | | | |
| Fund | | Ordinary Income | | | Long-Term Capital Gains | | | Tax Return of Capital | | | Total Dividends and Distributions |
Quant Solutions Emerging Markets Equity | | | $1,306,279 | | | | $— | | | | $— | | | $1,306,279 |
Quant Solutions International Developed Markets Index | | | 2,059,921 | | | | — | | | | — | | | 2,059,921 |
For the year ended October 31, 2023, the tax character of dividends paid as reflected in the Statement of Changes in Net Assets were as follows:
| | | | | | | | | | | | | | | | | | | | |
| Fund | | Ordinary Income | | Long-Term Capital Gains | | Tax Return of Capital | | Total Dividends and Distributions |
Quant Solutions Emerging Markets Equity | | | | $1,391,984 | | | | | $— | | | | | $— | | | | | $1,391,984 | |
Quant Solutions International Developed Markets Index | | | | 1,557,701 | | | | | — | | | | | — | | | | | 1,557,701 | |
For the year ended October 31, 2024, the Funds indicated below had the following amounts of accumulated undistributed earnings on a tax basis:
| | | | | | |
| Fund | | Undistributed Ordinary Income | | Undistributed Long-Term Capital Gains | |
Quant Solutions Emerging Markets Equity | | $ 894,512 | | | $— | |
Quant Solutions International Developed Markets Index | | 1,606,047 | | | — | |
The United States federal income tax basis of the Funds’ investments and the net unrealized appreciation as of October 31, 2024 were as follows:
| | | | | | | | |
| Fund | | Tax Basis | | Gross Unrealized Appreciation | | Gross Unrealized Depreciation | | Net Unrealized Appreciation |
Quant Solutions Emerging Markets Equity | | $35,488,213 | | $10,277,213 | | $(2,775,850) | | $7,501,363 |
Quant Solutions International Developed Markets Index | | 24,077,261 | | 16,712,792 | | (3,532,759) | | 13,180,033 |
The differences between GAAP basis and tax basis were primarily attributable to deferred losses on wash sales, investments in passive foreign investment companies, corporate spin-off adjustment, investment in partnerships and mark-to-market of futures contracts.
61
Notes to Financial Statements (continued)
For federal income tax purposes, the following Funds had an approximated capital loss carryforward as of October 31, 2024 which can be carried forward for an unlimited period. No capital gains distributions are expected to be paid to shareholders until net gains have been realized in excess of such losses.
| | | | | | | | |
| Fund | | Capital Loss
Carryforward | | | Capital Loss
Carryforward Utilized | |
| Quant Solutions Emerging Markets Equity | | | $2,029,000 | | | | $2,130,000 | |
| Quant Solutions International Developed Markets Index | | | 2,837,000 | | | | — | |
The Manager has analyzed the Funds’ tax positions taken on federal, state and local income tax returns for all open tax years and has concluded that no provision for income tax is required in the Funds’ financial statements for the current reporting period. Since tax authorities can examine previously filed tax returns, the Funds’ U.S. federal and state tax returns for each of the four fiscal years up to the most recent fiscal year ended October 31, 2024 are subject to such review.
Each Fund offers Class R6 shares. Class R6 shares are not subject to any sales or redemption charge and are available exclusively for sale to a limited group of investors.
The RIC is authorized to issue an unlimited number of shares of beneficial interest, which may be divided into an unlimited number of series of such shares.
As of October 31, 2024, Prudential, through its affiliated entities, including affiliated funds (if applicable), owned shares of each Fund as follows:
| | | | | | |
| Fund | | Number of Shares | | Percentage of
Outstanding Shares | |
| Quant Solutions Emerging Markets Equity–Class R6 | | 3,430,950 | | | 100.0% | |
| Quant Solutions International Developed Markets Index–Class R6 | | 2,740,818 | | | 99.1 | |
At the reporting period end, the number of shareholders holding greater than 5% of the Funds are as follows:
| | | | | | | | |
| Fund | | Number of Shareholders | | | Percentage of Outstanding Shares | |
| | |
| Affiliated: | | | | | | | | |
| Quant Solutions Emerging Markets Equity | | | 2 | | | | 80.0% | |
| Quant Solutions International Developed Markets Index | | | 9 | | | | 92.1 | |
| Unaffiliated: | | | | | | | | |
| Quant Solutions Emerging Markets Equity | | | — | | | | — | |
| Quant Solutions International Developed Markets Index | | | — | | | | — | |
62
The RIC, on behalf of each Fund, along with other affiliated registered investment companies (the “Participating Funds”), is a party to a Syndicated Credit Agreement (“SCA”) with a group of banks. The purpose of the SCA is to provide an alternative source of temporary funding for capital share redemptions. The table below provides details of the current SCA in effect at the reporting period-end as well as the prior SCA.
| | | | | | |
| | | | |
| | | Current SCA | | | | Prior SCA |
Term of Commitment | | 9/27/2024 – 9/25/2025 | | | | 9/29/2023 – 9/26/2024 |
Total Commitment | | $ 1,200,000,000 | | | | $ 1,200,000,000 |
Annualized Commitment Fee on the Unused Portion of the SCA | | 0.15% | | | | 0.15% |
Annualized Interest Rate on Borrowings | | 1.00% plus the higher of (1) the effective federal funds rate, (2) the daily SOFR rate plus 0.10% or (3) zero percent | | | | 1.00% plus the higher of (1) the effective federal funds rate, (2) the daily SOFR rate plus 0.10% or (3) zero percent |
Certain affiliated registered investment companies that are parties to the SCA include portfolios that are subject to a predetermined mathematical formula used to manage certain benefit guarantees offered under variable annuity contracts. The formula may result in large scale asset flows into and out of these portfolios. Consequently, these portfolios may be more likely to utilize the SCA for purposes of funding redemptions. It may be possible for those portfolios to fully exhaust the committed amount of the SCA, thereby requiring the Manager to allocate available funding per a Board-approved methodology designed to treat the Participating Funds in the SCA equitably.
Each Fund indicated below utilized the SCA during the year ended October 31, 2024. The average balance outstanding is for the number of days each Fund utilized the credit facility.
| | | | | | | | | | |
| Fund | | Average
Balance
Outstanding | | Weighted
Average
Interest Rates | | Number of
Days
Outstanding | | Maximum
Balance
Outstanding | | Balance
Outstanding at
October 31, 2024 |
Quant Solutions Emerging Markets Equity | | $ 206,000 | | 6.41% | | 4 | | $ 206,000 | | $— |
Quant Solutions International Developed Markets Index | | 8,639,000 | | 6.42 | | 3 | | 11,256,000 | | — |
As of the close of business on October 24, 2024, Quant Solutions International Developed Markets Index settled the redemption of fund Class R6 shares by delivering to an affiliate portfolio securities and other assets. The value of such securities and other assets that were transferred in-kind was $23,755,556.
In-kind redemption gains and losses are excluded in the calculation of taxable gain (loss) for federal income tax purposes.
63
Notes to Financial Statements (continued)
| 10. | Risks of Investing in the Funds |
Each Fund’s principal risks include, but are not limited to, some or all of the risks discussed below. For further information on the risks applicable to any given Fund, please refer to the Prospectus and Statement of Additional Information of that Fund.
| | | | |
| | | |
| Risks | | Quant Solutions
Emerging Markets Equity | | Quant Solutions
International
Developed
Markets Index |
Concentration | | X | | – |
Country | | X | | X |
Currency | | X | | X |
Economic and Market Events | | X | | X |
Emerging Markets | | X | | X |
Equity and Equity-Related Securities | | X | | X |
Exchange-Traded Funds | | – | | X |
Foreign Securities | | X | | X |
Fund of Funds | | X | | X |
Geographic Concentration | | – | | X |
Increase in Expenses | | X | | X |
Index Investment Approach | | – | | X |
Investments in China | | X | | – |
Large Capitalization Company | | X | | X |
Large Shareholder and Large Scale Redemption | | X | | X |
Liquidity | | X | | – |
Management | | X | | – |
Market Disruption and Geopolitical | | X | | X |
Market | | X | | X |
Model Design | | X | | – |
Model Implementation | | X | | – |
Portfolio Turnover | | X | | – |
Small and Medium Capitalization | | X | | – |
Tracking Error | | – | | X |
Value Style | | X | | – |
Concentration Risk: To the extent that the Fund is concentrated in the securities of companies, a particular market, industry, group of industries, sector or asset class, country, region or group of countries, the Fund may be adversely affected by the performance of those securities, may be subject to increased price volatility and may be more susceptible to adverse economic, market, political or regulatory occurrences affecting that market, industry, group of industries, sector or asset class, country, region or group of countries.
Country Risk: Changes in the business environment may adversely affect operating profits or the value of assets in a specific country. For example, financial factors such as currency
64
controls, devaluation or regulatory changes or stability factors such as mass riots, civil war and other potential events may contribute to companies’ operational risks.
Currency Risk: The Fund’s net asset value could decline as a result of changes in exchange rates, which could adversely affect the Fund’s investments in currencies, or in securities that trade in, and receive revenues related to, currencies, or in derivatives that provide exposure to currencies. Certain foreign countries may impose restrictions on the ability of issuers of foreign securities to make payment of principal and interest or dividends to investors located outside the country, due to blockage of foreign currency exchanges or otherwise.
Economic and Market Events Risk: Events in the U.S. and global financial markets, including actions taken by the U.S. Federal Reserve or foreign central banks to stimulate or stabilize economic growth or the functioning of the securities markets, or otherwise reduce inflation, may at times result in unusually high market volatility, which could negatively impact performance. Governmental efforts to curb inflation often have negative effects on the level of economic activity. Relatively reduced liquidity in credit and fixed income markets could adversely affect issuers worldwide.
Emerging Markets Risk: The risks of foreign investments are greater for investments in or exposed to emerging markets. Emerging market countries typically have economic and political systems that are less fully developed, and can be expected to be less stable, than those of more developed countries. For example, the economies of such countries can be subject to rapid and unpredictable rates of inflation or deflation. Low trading volumes may result in a lack of liquidity and price volatility. Emerging market countries may have policies that restrict investment by non-U.S. investors, or that prevent non-U.S. investors from withdrawing their money at will.
The Fund may invest in some emerging markets that subject it to risks such as those associated with illiquidity, custody of assets, different settlement and clearance procedures and asserting legal title under a developing legal and regulatory regime to a greater degree than in developed markets or even in other emerging markets.
Equity and Equity-Related Securities Risk: Equity and equity-related securities may be subject to changes in value, and their values may be more volatile than those of other asset classes. In addition to an individual security losing value, the value of the equity markets or a sector in which the Fund invests could go down. Different parts of a market can react differently to adverse issuer, market, regulatory, political and economic developments.
Exchange-Traded Funds (“ETFs”) Risk: Investing in securities issued by ETFs involves risks similar to those of investing directly in the securities and other assets held by the ETF. Unlike shares of typical mutual funds, shares of ETFs are generally traded on an exchange throughout a trading day and bought and sold based on market values and not at net asset value. For this reason, shares could trade at either a premium or discount to net asset value, which may be substantial during periods of market stress. The trading price of an index-based ETF is expected to (but may not) closely track the net asset value of the ETF,
65
Notes to Financial Statements (continued)
and the Fund will generally gain or lose value consistent with the performance of the ETF’s portfolio securities. The Fund will pay brokerage commissions in connection with the purchase and sale of shares of ETFs. In addition, the Fund will indirectly bear its pro rata share of the fees and expenses incurred by an ETF (including ETFs managed by the Manager or the subadviser(s)) in which it invests, including advisory fees (to the extent not offset by the Manager through waivers). These expenses are in addition to the advisory and other expenses that the Fund bears directly in connection with its own operations. An index-based ETF may not replicate exactly the performance of the benchmark index it seeks to track for a number of reasons, including transaction costs incurred by the ETF, the temporary unavailability of certain index securities in the secondary market or discrepancies between the ETF and the index with respect to the weighting of securities or the number of securities held. Investments in ETFs are subject to the risk that the listing exchange may halt trading of an ETF’s shares, in which case the Fund would be unable to sell its ETF shares unless and until trading is resumed.
Foreign Securities Risk: Investments in securities of non-U.S. issuers (including those denominated in U.S. dollars) may involve more risk than investing in securities of U.S. issuers. Foreign political, economic and legal systems, especially those in developing and emerging market countries, may be less stable and more volatile than in the United States. Foreign legal systems generally have fewer regulatory requirements than the U.S. legal system, particularly those of emerging markets. In general, less information is publicly available with respect to non-U.S. companies than U.S. companies. Non-U.S. companies generally are not subject to the same accounting, auditing, and financial reporting standards as are U.S. companies. Additionally, the changing value of foreign currencies and changes in exchange rates could also affect the value of the assets the Fund holds and the Fund’s performance. Certain foreign countries may impose restrictions on the ability of issuers of foreign securities to make payment of principal and interest or dividends to investors located outside the country, due to blockage of foreign currency exchanges or otherwise. Investments in emerging markets are subject to greater volatility and price declines.
In addition, the Fund’s investments in non-U.S. securities may be subject to the risks of nationalization or expropriation of assets, imposition of currency exchange controls or restrictions on the repatriation of non-U.S. currency, confiscatory taxation and adverse diplomatic developments. Special U.S. tax considerations may apply.
Fund of Funds Risk: The Fund is an investment option for other PGIM Investments-advised mutual funds that are managed as “funds of funds.” As a result, from time to time, the Fund may experience relatively large redemptions and could be required to liquidate its assets at inopportune times or at a loss or depressed value, which could cause the value of your investment to decline.
66
Geographic Concentration Risk: The Fund’s performance may be closely tied to the market, economic, political, regulatory or other conditions in the countries or regions in which the Fund invests. This can result in more pronounced risks based upon conditions that impact one or more countries or regions more or less than other countries or regions.
Increase in Expenses Risk: Your actual cost of investing in the Fund may be higher than the expenses shown in the expense table in the Fund’s prospectus for a variety of reasons. For example, expense ratios may be higher than those shown if average net assets decrease. Net assets are more likely to decrease and Fund expense ratios are more likely to increase when markets are volatile. Active and frequent trading of Fund securities can increase expenses.
Index Investment Approach Risk: Since the Fund is passively managed, assets are not allocated from one stock or group of stocks to another based on their prospects, or from stocks into bonds or cash equivalents in an attempt to cushion the impact of a market decline. As a result, the Fund’s performance may be less favorable than that of a portfolio using an active investment strategy. There is no guarantee that the Fund’s investment results will have a high degree of correlation to those of the Index. The Fund’s expenses, changes in securities markets, changes in the composition of the Index, errors in index provider data, and the timing of purchases and redemptions of Fund shares, among other things, may affect the correlation between Fund and Index performance. The Fund may not perform as well as other investments if, among other things, the Index declines or performs poorly relative to other related indexes or individual securities or the securities issued by companies that comprise the Index fall out of favor with investors.
Investments in China Risk: Investments in China subject the Fund to risks specific to China and may make it more volatile than other funds. Over the last few decades, the Chinese government has undertaken reform of economic and market practices and has expanded the sphere of private ownership of property in China. However, Chinese markets generally continue to experience inefficiency, volatility and pricing anomalies resulting from governmental influence, a lack of publicly available information and/or political and social instability. Internal social unrest or confrontations with other neighboring countries, including military conflicts in response to such events, may also disrupt economic development in China and result in a greater risk of currency fluctuations, currency non-convertibility, interest rate fluctuations and higher rates of inflation.
China has experienced security concerns, such as terrorism and strained international relations. Incidents involving China’s or the region’s security may cause uncertainty in Chinese markets and may adversely affect the Chinese economy and the Fund’s investments. Export growth continues to be a major driver of China’s rapid economic growth. Reduction in spending on Chinese products and services, institution of additional tariffs or other trade barriers, including as a result of heightened trade tensions between China and the U.S., or a downturn in any of the economies of China’s key trading partners may have an adverse impact on the Chinese economy or the Fund. For example, a series of executive orders issued between November 2020 and June 2021 prohibit the Fund from investing in
67
Notes to Financial Statements (continued)
certain companies identified by the U.S. government as “Chinese Military Industrial Complex Companies.” The restrictions in these executive orders may force the subadviser to sell certain positions and may restrict the Fund from future investments the subadviser deems otherwise attractive.
Chinese companies, including Chinese companies that are listed on U.S. exchanges, are not subject to the same degree of regulatory requirements, accounting standards or auditor oversight as companies in more developed countries, and as a result, information about the Chinese securities in which the Fund invests may be less reliable or complete. There may be significant obstacles to obtaining information necessary for investigations into or litigation against Chinese companies and shareholders may have limited legal remedies.
Large Capitalization Company Risk: Companies with large market capitalizations go in and out of favor based on market and economic conditions. Larger companies tend to be less volatile than companies with smaller market capitalizations. In exchange for this potentially lower risk, the Fund’s value may not rise or fall as much as the value of funds that emphasize companies with smaller market capitalizations.
Large Shareholder and Large Scale Redemption Risk: Certain individuals, accounts, funds (including funds affiliated with the Manager) or institutions, including the Manager and its affiliates, may from time to time own or control a substantial amount of the Fund’s shares. There is no requirement that these entities maintain their investment in the Fund. There is a risk that such large shareholders or that the Fund’s shareholders generally may redeem all or a substantial portion of their investments in the Fund in a short period of time, which could have a significant negative impact on the Fund’s NAV, liquidity, and brokerage costs. Large redemptions could also result in tax consequences to shareholders and impact the Fund’s ability to implement its investment strategy. The Fund’s ability to pursue its investment objective after one or more large scale redemptions may be impaired and, as a result, the Fund may invest a larger portion of its assets in cash or cash equivalents.
Liquidity Risk: Liquidity risk is the risk that the Fund could not meet requests to redeem shares issued by the Fund without significant dilution of remaining investors’ interests in the Fund. The Fund may invest in instruments that trade in lower volumes and are more illiquid than other investments. If the Fund is forced to sell these investments to pay redemption proceeds or for other reasons, the Fund may lose money. In addition, when there is no willing buyer and investments cannot be readily sold at the desired time or price, the Fund may have to accept a lower price or may not be able to sell the instrument at all. An inability to sell a portfolio position can adversely affect the Fund’s value or prevent the Fund frombeing able to take advantage of other investment opportunities.
68
Management Risk: Actively managed funds are subject to management risk. The subadviser will apply investment techniques and risk analyses in making investment decisions for the Fund, but the subadviser’s judgments about the attractiveness, value or market trends affecting a particular security, industry or sector or about market movements may be incorrect. Additionally, the investments selected for the Fund may underperform the markets in general, the Fund’s benchmark and other funds with similar investment objectives.
Market Disruption and Geopolitical Risks: Market disruption can be caused by economic, financial or political events and factors, including but not limited to, international wars or conflicts (including Russia’s military invasion of Ukraine and the Israel-Hamas war), geopolitical developments (including trading and tariff arrangements, sanctions and cybersecurity attacks), instability in regions such as Asia, Eastern Europe and the Middle East, terrorism, natural disasters and public health epidemics (including the outbreak of COVID-19 globally).
The extent and duration of such events and resulting market disruptions cannot be predicted, but could be substantial and could magnify the impact of other risks to the Fund. These and other similar events could adversely affect the U.S. and foreign financial markets and lead to increased market volatility, reduced liquidity in the securities markets, significant negative impacts on issuers and the markets for certain securities and commodities and/or government intervention. They may also cause short- or long-term economic uncertainties in the United States and worldwide. As a result, whether or not the Fund invests in securities of issuers located in or with significant exposure to the countries directly affected, the value and liquidity of the Fund’s investments may be negatively impacted. Further, due to closures of certain markets and restrictions on trading certain securities, the value of certain securities held by the Fund could be significantly impacted, which could lead to such securities being valued at zero.
Market Risk: Securities markets may be volatile and the market prices of the Fund’s securities may decline. Securities fluctuate in price based on changes in an issuer’s financial condition and overall market and economic conditions. If the market prices of the securities owned by the Fund fall, the value of your investment in the Fund will decline.
Model Design Risk: The subadviser uses certain quantitative models to help guide its investment decisions. The design of the underlying models may be flawed or incomplete. The investment models the subadviser uses are based on historical and theoretical underpinnings that it believes are sound. There can be no guarantee, however, that these underpinnings will correlate with security price behavior in the manner assumed by the subadviser’s models. Additionally, the quantitative techniques that underlie the subadviser’s portfolio construction processes may fail to fully anticipate important risks.
Model Implementation Risk: While the subadviser strives to mitigate the likelihood of material implementation errors, it is impossible to completely eliminate the risk of error in the implementation of the computer models that guide the subadviser’s quantitative
69
Notes to Financial Statements (continued)
investment processes. Additionally, it may be difficult to implement model recommendations in volatile and rapidly changing market conditions.
Portfolio Turnover Risk: The length of time the Fund has held a particular security is not generally a consideration in investment decisions. Under certain market conditions, the Fund’s turnover rate may be higher than that of other mutual funds. Portfolio turnover generally involves some expense to the Fund, including brokerage commissions or dealer mark-ups and other transaction costs on the sale of securities and reinvestment in other securities. These transactions may result in realization of taxable capital gains. The trading costs and tax effects associated with portfolio turnover may adversely affect the Fund’s investment performance.
Small and Medium Capitalization Risk: Small and medium capitalization companies usually offer a smaller range of products and services than larger companies. Smaller companies may also have limited financial resources and may lack management expertise. As a result, their prices may fluctuate more than the stocks of larger, more established companies. Historically, small and mid-cap companies have sometimes gone through extended periods when they did not perform as well as larger companies. Small and mid-capitalization companies generally are less liquid than larger companies, which may make such investments more difficult to sell at the time and price that the Fund would like.
Tracking Error Risk: Tracking error is the divergence of the Fund’s performance from that of the Index. Tracking error may occur because of differences between the securities and other instruments held in the Fund’s portfolio and those included in the Index, pricing differences, transaction costs, the Fund’s holding of uninvested cash, differences in timing of the accrual of distributions, tax gains or losses, changes to the Index or the need to meet various new or existing regulatory requirements. This risk may be heightened during times of increased market volatility or other unusual market conditions. Tracking error also may result because the Fund incurs fees and expenses, while the Index does not.
Value Style Risk: Since the Fund follows a value investment style, there is the risk that the value style may be out of favor for long periods of time, that the market will not recognize a security’s intrinsic value for a long time or at all, or that a stock judged to be undervalued may actually be appropriately priced or overvalued. Issuers of value stocks may have experienced adverse business developments or may be subject to special risks that have caused the stock to be out of favor. In addition, the Fund’s value investment style may go out of favor with investors, negatively affecting the Fund’s performance. If the Fund’s assessment of market conditions or a company’s value is inaccurate, the Fund could suffer losses or produce poor performance relative to other funds.
70
Report of Independent Registered Public Accounting Firm
To the Board of Trustees of Prudential Investment Portfolios 2 and Shareholders of PGIM Quant Solutions International Developed Markets Index Fund and PGIM Quant Solutions Emerging Markets Equity Fund
Opinions on the Financial Statements
We have audited the accompanying statements of assets and liabilities, including the schedules of investments, of PGIM Quant Solutions International Developed Markets Index Fund and PGIM Quant Solutions Emerging Markets Equity Fund (two of the funds constituting Prudential Investment Portfolios 2, hereafter collectively referred to as the “Funds”) as of October 31, 2024, the related statements of operations for the year ended October 31, 2024, the statements of changes in net assets for each of the two years in the period ended October 31, 2024, including the related notes, and the financial highlights for each of the five years in the period ended October 31, 2024 (collectively referred to as the “financial statements”). In our opinion, the financial statements present fairly, in all material respects, the financial position of each of the Funds as of October 31, 2024, the results of each of their operations for the year then ended, the changes in each of their net assets for each of the two years in the period ended October 31, 2024 and each of the financial highlights for each of the five years in the period ended October 31, 2024 in conformity with accounting principles generally accepted in the United States of America.
Basis for Opinions
These financial statements are the responsibility of the Funds’ management. Our responsibility is to express an opinion on the Funds’ financial statements based on our audits. We are a public accounting firm registered with the Public Company Accounting Oversight Board (United States) (PCAOB) and are required to be independent with respect to the Funds in accordance with the U.S. federal securities laws and the applicable rules and regulations of the Securities and Exchange Commission and the PCAOB.
We conducted our audits of these financial statements in accordance with the standards of the PCAOB. Those standards require that we plan and perform the audit to obtain reasonable assurance about whether the financial statements are free of material misstatement, whether due to error or fraud.
Our audits included performing procedures to assess the risks of material misstatement of the financial statements, whether due to error or fraud, and performing procedures that respond to those risks. Such procedures included examining, on a test basis, evidence regarding the amounts and disclosures in the financial statements. Our audits also included evaluating the accounting principles used and significant estimates made by management, as well as evaluating the overall presentation of the financial statements. Our procedures included confirmation of securities owned as of October 31, 2024 by correspondence with the custodian, transfer agent and brokers. We believe that our audits provide a reasonable basis for our opinions.
/s/PricewaterhouseCoopers LLP
New York, New York
December 18, 2024
We have served as the auditor of one or more investment companies in the PGIM Retail Funds complex since 2020.
71
Other Information
Form N-CSR Item 8 - Changes in and Disagreements with Accountants for Open-End Management Investment Companies - None.
Form N-CSR Item 9 - Proxy Disclosures for Open-End Management Investment Companies-None.
Form N-CSR Item 10 - Remuneration Paid to Directors, Officers, and Others of Open-End Management Investment Companies - Included within the Statement of Operations of the financial statements filed under Item 7 of this Form.
Form N-CSR Item 11 - Statement Regarding Basis for Approval of Investment Advisory Contract.
Approval of Advisory Agreements
PGIM Quant Solutions Emerging Markets Equity Fund
The Fund’s Board of Trustees
The Board of Trustees (the “Board”) of PGIM Quant Solutions Emerging Markets Equity Fund (the “Fund”)1 consists of ten individuals, eight of whom are not “interested persons” of the Fund, as defined in the Investment Company Act of 1940, as amended (the “1940 Act”) (the “Independent Trustees”). The Board is responsible for the oversight of the Fund and its operations, and performs the various duties imposed on the directors of investment companies by the 1940 Act. The Independent Trustees have retained independent legal counsel to assist them in connection with their duties. The Chair of the Board is an Independent Trustee. The Board has established five standing committees: the Audit Committee, the Nominating and Governance Committee, the Compliance Committee and two Investment Committees. Each committee is chaired by, and composed of, Independent Trustees.
Annual Approval of the Fund’s Advisory Agreements
As required under the 1940 Act, the Board determines annually whether to renew the Fund’s management agreement with PGIM Investments LLC (“PGIM Investments”) and the Fund’s subadvisory agreement with PGIM Quantitative Solutions LLC (“PGIM Quantitative Solutions”). In considering the renewal of the agreements, the Board, including all of the Independent Trustees, met on May 28 and June 4-6, 2024 (the “Board Meeting”) and approved the renewal of the agreements through July 31, 2025, after concluding that the renewal of the agreements was in the best interests of the Fund and its shareholders.
In advance of the meetings, the Board requested and received materials relating to the agreements, and had the opportunity to ask questions and request further information in connection with its consideration. Among other things, the Board considered comparative fee information from PGIM Investments and PGIM Quantitative Solutions. Also, the Board considered comparisons with other mutual funds in relevant peer universes and peer groups, as is further discussed below.
In approving the agreements, the Board, including the Independent Trustees advised by independent legal counsel, considered the factors it deemed relevant, including the nature, quality and extent of services provided by PGIM Investments and the subadviser, the performance of the Fund, the profitability of PGIM Investments and its affiliates, expenses and fees, and the potential for economies of scale that may be shared with the Fund and its shareholders as the Fund’s assets grow. In their deliberations, the Trustees did not identify
| 1 | PGIM Quant Solutions Emerging Markets Equity Fund is a series of Prudential Investment Portfolios 2. |
PGIM Quant Solutions Emerging Markets Equity Fund
Approval of Advisory Agreements (continued)
any single factor which alone was responsible for the Board’s decision to approve an agreement with respect to the Fund. In connection with its deliberations, the Board considered information provided by PGIM Investments throughout the year at regular and special Board meetings, presentations from portfolio managers and other information, as well as information furnished at or in advance of the Board Meeting.
The Trustees determined that the overall arrangements between the Fund and PGIM Investments, which serves as the Fund’s investment manager pursuant to a management agreement, and between PGIM Investments and PGIM Quantitative Solutions, which serves as the Fund’s subadviser pursuant to the terms of a subadvisory agreement with PGIM Investments, are in the best interests of the Fund and its shareholders in light of the services performed, fees charged and such other matters as the Trustees considered relevant in the exercise of their business judgment. The Board considered the approval of the agreements for the Fund as part of its consideration of agreements for multiple funds, but its approvals were made on a fund-by-fund basis.
The material factors and conclusions that formed the basis for the Trustees’ reaching their determinations to approve the continuance of the agreements are separately discussed below.
Nature, Quality and Extent of Services
The Board received and considered information regarding the nature, quality and extent of services provided to the Fund by PGIM Investments and PGIM Quantitative Solutions. The Board noted that PGIM Quantitative Solutions is affiliated with PGIM Investments. The Board considered the services provided by PGIM Investments, including but not limited to the oversight of the subadviser for the Fund, as well as the provision of accounting oversight, fund recordkeeping, compliance and other services to the Fund, such as PGIM Investments’ role as administrator for the Fund’s liquidity risk management program and as valuation designee. With respect to PGIM Investments’ oversight of the subadviser, the Board noted that PGIM Investments’ Strategic Investment Research Group (“SIRG”), which is a business unit of PGIM Investments, is responsible for monitoring and reporting to PGIM Investments’ senior management on the performance and operations of the subadviser. The Board also considered that PGIM Investments pays the salaries of all of the officers and interested Trustees of the Fund who are part of Fund management. The Board also considered the investment subadvisory services provided by PGIM Quantitative Solutions, including investment research and security selection, as well as adherence to the Fund’s investment restrictions and compliance with applicable Fund policies and procedures. The Board considered PGIM Investments’ evaluation of the subadviser, as well as PGIM Investments’ recommendation, based on its review of the subadviser, to renew the subadvisory agreement.
Visit our website at pgim.com/investments
The Board considered the qualifications, backgrounds and responsibilities of PGIM Investments’ senior management responsible for the oversight of the Fund and PGIM Quantitative Solutions, and also considered the qualifications, backgrounds and responsibilities of the PGIM Quantitative Solutions portfolio managers who are responsible for the day-to-day management of the Fund’s portfolio. The Board was provided with information pertaining to PGIM Investments’ and PGIM Quantitative Solutions’ organizational structure, senior management, investment operations, and other relevant information pertaining to PGIM Investments and PGIM Quantitative Solutions. The Board also noted that it received favorable compliance reports from the Fund’s Chief Compliance Officer (“CCO”) as to PGIM Investments and PGIM Quantitative Solutions.
The Board concluded that it was satisfied with the nature, extent and quality of the investment management services provided by PGIM Investments and the subadvisory services provided to the Fund by PGIM Quantitative Solutions, and that there was a reasonable basis on which to conclude that the Fund benefits from the services provided by PGIM Investments and PGIM Quantitative Solutions under the management and subadvisory agreements.
Costs of Services and Profits Realized by PGIM Investments
The Board was provided with information on the profitability of PGIM Investments and its affiliates in serving as the Fund’s investment manager. The Board discussed with PGIM Investments the methodology utilized in assembling the information regarding profitability and considered its reasonableness. The Board recognized that it is difficult to make comparisons of profitability from fund management contracts because comparative information is not generally publicly available and is affected by numerous factors, including the structure of the particular adviser, the types of funds it manages, its business mix, numerous assumptions regarding allocations of direct and indirect costs, and the adviser’s capital structure and cost of capital. However, the Board considered that the cost of services provided by PGIM Investments to the Fund during the year ended December 31, 2023 exceeded the management fees paid by the Fund, resulting in an operating loss to PGIM Investments. Taking these factors into account, the Board concluded that the profitability of PGIM Investments and its affiliates in relation to the services rendered was not unreasonable.
Economies of Scale
The Board received and discussed information concerning economies of scale that PGIM Investments may realize as the Fund’s assets grow beyond current levels. During the course of time, the Board has considered information regarding the launch date of the Fund, the management fees of the Fund compared to those of similarly managed funds and PGIM Investments’ investment in the Fund over time. The Board noted that, while the
PGIM Quant Solutions Emerging Markets Equity Fund
Approval of Advisory Agreements (continued)
management fee schedule for each Fund does not have breakpoints in its management fees, economies of scale can be shared with the Fund in other ways, including low management fees from inception, additional technological and personnel investments to enhance shareholder services, and maintaining existing expense structures in the face of a rising cost environment. The Board also considered PGIM Investments’ assertion that it continually evaluates the management fee schedule of the Fund and the potential to share economies of scale through breakpoints or fee waivers as asset levels increase.
The Board recognized the inherent limitations of any analysis of economies of scale, stemming largely from the Board’s understanding that most of PGIM Investments’ costs are not specific to individual funds, but rather are incurred across a variety of products and services.
Other Benefits to PGIM Investments and PGIM Quantitative Solutions
The Board considered potential ancillary benefits that might be received by PGIM Investments, PGIM Quantitative Solutions and their affiliates as a result of their relationship with the Fund. The Board concluded that potential benefits to be derived by PGIM Investments included transfer agency fees received by the Fund’s transfer agent (which is affiliated with PGIM Investments), and benefits to its reputation as well as other intangible benefits resulting from PGIM Investments’ association with the Fund. The Board concluded that the potential benefits to be derived by PGIM Quantitative Solutions included its ability to use soft dollar credits, as well as the potential benefits consistent with those generally resulting from an increase in assets under management, specifically, potential access to additional research resources and benefits to its reputation. The Board concluded that the benefits derived by PGIM Investments and PGIM Quantitative Solutions were consistent with the types of benefits generally derived by investment managers and subadvisers to mutual funds.
Performance of the Fund / Fees and Expenses
The Board considered certain additional factors and made related conclusions relating to the historical performance of the Fund for the for the one-year and the three-year periods ended December 31, 2023. The Board considered that the Fund commenced operations on November 29, 2016 and that longer-term performance was not yet available.
The Board also considered the Fund’s actual management fee, as well as the Fund’s net total expense ratio, for the fiscal year ended October 31, 2023. The Board considered the management fee for the Fund as compared to the management fee charged by PGIM Investments to other funds and the fee charged by other advisers to comparable mutual funds in a peer group. The actual management fee represents the fee rate actually paid by
Visit our website at pgim.com/investments
Fund shareholders and includes any fee waivers or reimbursements. The net total expense ratio for the Fund represents the actual expense ratio incurred by Fund shareholders.
The mutual funds included in the peer universe, which was used to consider performance, and the peer group, which was used to consider expenses and fees, were objectively determined by Broadridge, an independent provider of mutual fund data. In certain circumstances, PGIM Investments also provided supplemental peer universe or peer group information for reasons addressed with the Board. The comparisons placed the Fund in various quartiles over various periods, with the first quartile being the best 25% of the mutual funds (for performance, the best performing mutual funds and, for expenses, the lowest cost mutual funds).
The section below summarizes key factors considered by the Board and the Board’s conclusions regarding the Fund’s performance, fees and overall expenses. The table sets forth net performance comparisons (which reflect the impact on performance of fund expenses, or any subsidies, expense caps or waivers that may be applicable) with the peer universe, actual management fees with the peer group (which reflect the impact of any subsidies or fee waivers), and net total expenses with the peer group, each of which were key factors considered by the Board.
| | | | | | | | |
Net Performance | | 1 Year | | 3 Years | | 5 Years | | 10 Years |
| | 2nd Quartile | | 2nd Quartile | | 2nd Quartile | | N/A |
| | | |
| | | Actual Management Fees: 2nd Quartile | | |
| | | |
| | | Net Total Expenses: 4th Quartile | | |
| · | | The Board noted that the Fund outperformed its benchmark index over all periods. |
| · | | The Board and PGIM Investments agreed to retain the existing contractual cap on Fund expenses that (exclusive of certain fees and expenses) caps total annual operating expenses for Class R6 shares at 1.20% through February 28, 2025. |
| · | | The Board concluded that, in light of the above, it would be in the best interests of the Fund and its shareholders to renew the agreements. |
| · | | The Board concluded that the management fees (including subadvisory fees) and total expenses were reasonable in light of the services provided. |
* * *
After full consideration of these factors, the Board concluded that the approval of the agreements was in the best interests of the Fund and its shareholders.
PGIM Quant Solutions Emerging Markets Equity Fund
Approval of Advisory Agreements
PGIM Quant Solutions International Developed Markets Index Fund
The Fund’s Board of Trustees
The Board of Trustees (the “Board”) of PGIM Quant Solutions International Developed Markets Index Fund (the “Fund”)1 consists of ten individuals, eight of whom are not “interested persons” of the Fund, as defined in the Investment Company Act of 1940, as amended (the “1940 Act”) (the “Independent Trustees”). The Board is responsible for the oversight of the Fund and its operations, and performs the various duties imposed on the directors of investment companies by the 1940 Act. The Independent Trustees have retained independent legal counsel to assist them in connection with their duties. The Chair of the Board is an Independent Trustee. The Board has established five standing committees: the Audit Committee, the Nominating and Governance Committee, the Compliance Committee and two Investment Committees. Each committee is chaired by, and composed of, Independent Trustees.
Annual Approval of the Fund’s Advisory Agreements
As required under the 1940 Act, the Board determines annually whether to renew the Fund’s management agreement with PGIM Investments LLC (“PGIM Investments”) and the Fund’s subadvisory agreement with PGIM Quantitative Solutions LLC (“PGIM Quantitative Solutions”). In considering the renewal of the agreements, the Board, including all of the Independent Trustees, met on May 28 and June 4-6, 2024 (the “Board Meeting”) and approved the renewal of the agreements through July 31, 2025, after concluding that the renewal of the agreements was in the best interests of the Fund and its shareholders.
In advance of the meetings, the Board requested and received materials relating to the agreements, and had the opportunity to ask questions and request further information in connection with its consideration. Among other things, the Board considered comparative fee information from PGIM Investments and PGIM Quantitative Solutions. Also, the Board considered comparisons with other mutual funds in relevant peer universes and peer groups, as is further discussed below.
In approving the agreements, the Board, including the Independent Trustees advised by independent legal counsel, considered the factors it deemed relevant, including the nature, quality and extent of services provided by PGIM Investments and the subadviser, the performance of the Fund, the profitability of PGIM Investments and its affiliates, expenses and fees, and the potential for economies of scale that may be shared with the Fund and its shareholders as the Fund’s assets grow. In their deliberations, the Trustees did not identify any single factor which alone was responsible for the Board’s decision to approve an
| 1 | PGIM Quant Solutions International Developed Markets Index Fund is a series of Prudential Investment Portfolios 2. |
Visit our website at pgim.com/investments
agreement with respect to the Fund. In connection with its deliberations, the Board considered information provided by PGIM Investments throughout the year at regular and special Board meetings, presentations from portfolio managers and other information, as well as information furnished at or in advance of the Board Meeting.
The Trustees determined that the overall arrangements between the Fund and PGIM Investments, which serves as the Fund’s investment manager pursuant to a management agreement, and between PGIM Investments and PGIM Quantitative Solutions, which serves as the Fund’s subadviser pursuant to the terms of a subadvisory agreement with PGIM Investments, are in the best interests of the Fund and its shareholders in light of the services performed, fees charged and such other matters as the Trustees considered relevant in the exercise of their business judgment. The Board considered the approval of the agreements for the Fund as part of its consideration of agreements for multiple funds, but its approvals were made on a fund-by-fund basis.
The material factors and conclusions that formed the basis for the Trustees’ reaching their determinations to approve the continuance of the agreements are separately discussed below.
Nature, Quality and Extent of Services
The Board received and considered information regarding the nature, quality and extent of services provided to the Fund by PGIM Investments and PGIM Quantitative Solutions. The Board noted that PGIM Quantitative Solutions is affiliated with PGIM Investments. The Board considered the services provided by PGIM Investments, including but not limited to the oversight of the subadviser for the Fund, as well as the provision of accounting oversight, fund recordkeeping, compliance and other services to the Fund, such as PGIM Investments’ role as administrator for the Fund’s liquidity risk management program and as valuation designee. With respect to PGIM Investments’ oversight of the subadviser, the Board noted that PGIM Investments’ Strategic Investment Research Group (“SIRG”), which is a business unit of PGIM Investments, is responsible for monitoring and reporting to PGIM Investments’ senior management on the performance and operations of the subadviser. The Board also considered that PGIM Investments pays the salaries of all of the officers and interested Trustees of the Fund who are part of Fund management. The Board also considered the investment subadvisory services provided by PGIM Quantitative Solutions, including investment research and security selection, as well as adherence to the Fund’s investment restrictions and compliance with applicable Fund policies and procedures. The Board considered PGIM Investments’ evaluation of the subadviser, as well as PGIM Investments’ recommendation, based on its review of the subadviser, to renew the subadvisory agreement.
The Board considered the qualifications, backgrounds and responsibilities of PGIM Investments’ senior management responsible for the oversight of the Fund and PGIM
PGIM Quant Solutions International Developed Markets Index Fund
Approval of Advisory Agreements (continued)
Quantitative Solutions, and also considered the qualifications, backgrounds and responsibilities of the PGIM Quantitative Solutions portfolio managers who are responsible for the day-to-day management of the Fund’s portfolio. The Board was provided with information pertaining to PGIM Investments’ and PGIM Quantitative Solutions’ organizational structure, senior management, investment operations, and other relevant information pertaining to PGIM Investments and PGIM Quantitative Solutions. The Board also noted that it received favorable compliance reports from the Fund’s Chief Compliance Officer (“CCO”) as to PGIM Investments and PGIM Quantitative Solutions.
The Board concluded that it was satisfied with the nature, extent and quality of the investment management services provided by PGIM Investments and the subadvisory services provided to the Fund by PGIM Quantitative Solutions, and that there was a reasonable basis on which to conclude that the Fund benefits from the services provided by PGIM Investments and PGIM Quantitative Solutions under the management and subadvisory agreements.
Costs of Services and Profits Realized by PGIM Investments
The Board was provided with information on the profitability of PGIM Investments and its affiliates in serving as the Fund’s investment manager. The Board discussed with PGIM Investments the methodology utilized in assembling the information regarding profitability and considered its reasonableness. The Board recognized that it is difficult to make comparisons of profitability from fund management contracts because comparative information is not generally publicly available and is affected by numerous factors, including the structure of the particular adviser, the types of funds it manages, its business mix, numerous assumptions regarding allocations of direct and indirect costs, and the adviser’s capital structure and cost of capital. However, the Board considered that the cost of services provided by PGIM Investments to the Fund during the year ended December 31, 2023 exceeded the management fees paid by the Fund, resulting in an operating loss to PGIM Investments. Taking these factors into account, the Board concluded that the profitability of PGIM Investments and its affiliates in relation to the services rendered was not unreasonable.
Economies of Scale
The Board received and discussed information concerning economies of scale that PGIM Investments may realize as the Fund’s assets grow beyond current levels. During the course of time, the Board has considered information regarding the launch date of the Fund, the management fees of the Fund compared to those of similarly managed funds and PGIM Investments’ investment in the Fund over time. The Board noted that, while the management fee schedule for each Fund does not have breakpoints in its management fees, economies of scale can be shared with the Fund in other ways, including low management fees from inception, additional technological and personnel investments to
Visit our website at pgim.com/investments
enhance shareholder services, and maintaining existing expense structures in the face of a rising cost environment. The Board also considered PGIM Investments’ assertion that it continually evaluates the management fee schedule of the Fund and the potential to share economies of scale through breakpoints or fee waivers as asset levels increase.
The Board recognized the inherent limitations of any analysis of economies of scale, stemming largely from the Board’s understanding that most of PGIM Investments’ costs are not specific to individual funds, but rather are incurred across a variety of products and services.
Other Benefits to PGIM Investments and PGIM Quantitative Solutions
The Board considered potential ancillary benefits that might be received by PGIM Investments, PGIM Quantitative Solutions and their affiliates as a result of their relationship with the Fund. The Board concluded that potential benefits to be derived by PGIM Investments included transfer agency fees received by the Fund’s transfer agent (which is affiliated with PGIM Investments), and benefits to its reputation as well as other intangible benefits resulting from PGIM Investments’ association with the Fund. The Board concluded that the potential benefits to be derived by PGIM Quantitative Solutions included its ability to use soft dollar credits, as well as the potential benefits consistent with those generally resulting from an increase in assets under management, specifically, potential access to additional research resources and benefits to its reputation. The Board concluded that the benefits derived by PGIM Investments and PGIM Quantitative Solutions were consistent with the types of benefits generally derived by investment managers and subadvisers to mutual funds.
Performance of the Fund / Fees and Expenses
The Board considered certain additional factors and made related conclusions relating to the historical performance of the Fund for the for the one-year and the three-year periods ended December 31, 2023. The Board considered that the Fund commenced operations on November 17, 2016 and that longer-term performance was not yet available.
The Board also considered the Fund’s actual management fee, as well as the Fund’s net total expense ratio, for the fiscal year ended October 31, 2023. The Board considered the management fee for the Fund as compared to the management fee charged by PGIM Investments to other funds and the fee charged by other advisers to comparable mutual funds in a peer group. The actual management fee represents the fee rate actually paid by Fund shareholders and includes any fee waivers or reimbursements. The net total expense ratio for the Fund represents the actual expense ratio incurred by Fund shareholders.
The mutual funds included in the peer universe, which was used to consider performance, and the peer group, which was used to consider expenses and fees, were objectively
PGIM Quant Solutions International Developed Markets Index Fund
Approval of Advisory Agreements (continued)
determined by Broadridge, an independent provider of mutual fund data. In certain circumstances, PGIM Investments also provided supplemental peer universe or peer group information for reasons addressed with the Board. The comparisons placed the Fund in various quartiles over various periods, with the first quartile being the best 25% of the mutual funds (for performance, the best performing mutual funds and, for expenses, the lowest cost mutual funds).
The section below summarizes key factors considered by the Board and the Board’s conclusions regarding the Fund’s performance, fees and overall expenses. The table sets forth net performance comparisons (which reflect the impact on performance of fund expenses, or any subsidies, expense caps or waivers that may be applicable) with the peer universe, actual management fees with the peer group (which reflect the impact of any subsidies or fee waivers), and net total expenses with the peer group, each of which were key factors considered by the Board.
| | | | | | | | |
Net Performance | | 1 Year | | 3 Years | | 5 Years | | 10 Years |
| | 2nd Quartile | | 2nd Quartile | | 2nd Quartile | | N/A |
| | | |
| | | Actual Management Fees: 1st Quartile | | |
| | | |
| | | Net Total Expenses: 1st Quartile | | |
| · | | The Board noted that the Fund underperformed its benchmark index over all periods. |
| · | | The Board noted that, effective December 11, 2023, the Fund’s benchmark changed in connection with a change in the Fund’s investment objective and strategy to track the new benchmark index. |
| · | | The Board noted PGIM Investments’ assertions that as of December 11, 2023, the Fund’s performance is consistent with the Fund’s new objective and exhibits a similar composition and high correlation to the Fund’s new benchmark index (gross of expenses). |
| · | | The Board and PGIM Investments agreed to a contractual cap on Fund expenses that (exclusive of certain fees and expenses) caps total annual operating expenses for Class R6 shares at 0.19%. |
| · | | The Board concluded that, in light of the above, it would be in the best interests of the Fund and its shareholders to continue to allow the Fund to create a longer-term performance record, and to renew the agreements. |
| · | | The Board concluded that the management fees (including subadvisory fees) and total expenses were reasonable in light of the services provided. |
* * *
After full consideration of these factors, the Board concluded that the approval of the agreements was in the best interests of the Fund and its shareholders.
Visit our website at pgim.com/investments
| | | | | | |
| Item 12 | | – | | Disclosure of Proxy Voting Policies and Procedures for Closed-End Management Investment Companies – Not applicable. |
| | |
| Item 13 | | – | | Portfolio Managers of Closed-End Management Investment Companies – Not applicable. |
| | |
| Item 14 | | – | | Purchases of Equity Securities by Closed-End Management Investment Company and Affiliated Purchasers – Not applicable. |
| | |
| Item 15 | | – | | Submission of Matters to a Vote of Security Holders – There have been no material changes to the procedures by which shareholders may recommend nominees to the registrant’s board of directors. |
| | |
| Item 16 | | – | | Controls and Procedures |
| | |
| | | | (a) It is the conclusion of the registrant's principal executive officer and principal financial officer that the effectiveness of the registrant's current disclosure controls and procedures (such disclosure controls and procedures having been evaluated within 90 days of the date of this filing) provide reasonable assurance that the information required to be disclosed by the registrant has been recorded, processed, summarized and reported within the time period specified in the Commission's rules and forms and that the information required to be disclosed by the registrant has been accumulated and communicated to the registrant's principal executive officer and principal financial officer in order to allow timely decisions regarding required disclosure. |
| | |
| | | | (b) There has been no significant change in the registrant’s internal control over financial reporting (as defined in Rule 30a-3(d) under the Act (17 CFR 270.30a-3(d))) that occurred during the period covered by this report that has materially affected, or is reasonably likely to materially affect, the registrant’s internal control over financial reporting. |
| | |
| Item 17 | | – | | Disclosure of Securities Lending Activities for Closed-End Management Investment Companies – Not applicable. |
| | |
| Item 18 | | – | | Recovery of Erroneously Awarded Compensation – Not applicable. |
| | |
| Item 19 | | – | | Exhibits |
| | | |
| | | | (a)(1) | | Code of Ethics – Attached hereto as Exhibit EX-99.CODE-ETH. |
| | | |
| | | | (a)(2) | | Policy required by the listing standards adopted pursuant to Rule 10D-1 under the Securities Exchange Act of 1934 – Not applicable. |
| | | |
| | | | (a)(3) | | Certifications pursuant to Section 302 of the Sarbanes-Oxley Act of 2002 – Attached hereto as Exhibit EX- 99.CERT. |
| | | |
| | | | (a)(4) | | Any written solicitation to purchase securities under Rule 23c-1 under the Investment Company Act of 1940 – Not applicable. |
| | | |
| | | | (a)(5) | | Change in the registrant’s independent public accountant – Not applicable. |
| | |
| | | | (b) Certifications pursuant to Section 906 of the Sarbanes-Oxley Act of 2002 – Attached hereto as Exhibit EX- 99.906CERT. |
SIGNATURES
Pursuant to the requirements of the Securities Exchange Act of 1934 and the Investment Company Act of 1940, the registrant has duly caused this report to be signed on its behalf by the undersigned, thereunto duly authorized.
| | |
| Registrant | | Prudential Investment Portfolios 2 |
| |
| By: | | /s/ Andrew R. French |
| | Andrew R. French |
| | Secretary |
| |
| Date: | | December 18, 2024 |
Pursuant to the requirements of the Securities Exchange Act of 1934 and the Investment Company Act of 1940, this report has been signed below by the following persons on behalf of the registrant and in the capacities and on the dates indicated.
| | |
| By: | | /s/ Stuart S. Parker |
| | Stuart S. Parker |
| | President and Principal Executive Officer |
| |
| Date: | | December 18, 2024 |
| |
| By: | | /s/ Christian J. Kelly |
| | Christian J. Kelly |
| | Chief Financial Officer (Principal Financial Officer) |
| |
| Date: | | December 18, 2024 |