UNITED STATES
SECURITIES AND EXCHANGE COMMISSION
WASHINGTON, D.C. 20549
FORM N-CSR
CERTIFIED SHAREHOLDER REPORT OF REGISTERED MANAGEMENT INVESTMENT COMPANIES
Investment Company Act file number 811-09781
PFS Funds
(Exact name of registrant as specified in charter)
1939 Friendship Drive, Suite C, El Cajon, CA 92020
(Address of principal executive offices) (Zip code)
CT Corporation System
155 Federal St., Suite 700, Boston, MA 02110
(Name and address of agent for service)
Registrant's telephone number, including area code: (619) 588-9700
Date of fiscal year end: October 31
Date of reporting period: October 31, 2020
Item 1. Report to Stockholders.

ANNUAL REPORT
October 31, 2020
TICKER ENSBX
IMPORTANT NOTE: Beginning on January 1, 2021, as permitted by regulations adopted by the
Securities and Exchange Commission, paper copies of the Fund's shareholder reports will no longer be
sent by mail, unless you specifically request paper copies of the reports from the Fund or from your
financial intermediary, such as a broker-dealer or bank. Instead, the reports will be made available on a
website, and you will be notified by mail each time a report is posted and provided with a website link to
access the report.
If you already elected to receive shareholder reports electronically, you will not be affected by this change
and you need not take any action. You may elect to receive shareholder reports and other
communications from the Fund or your financial intermediary electronically by calling or sending an email
request.
You may elect to receive all future reports in paper free of charge. You can inform the Fund or your
financial intermediary that you wish to continue receiving paper copies of your shareholder reports by
calling or sending an email request. Your election to receive reports in paper will apply to all funds held
with the fund complex/your financial intermediary. |
Ensemble Fund
Annual Report
October 31, 2020
(Unaudited)
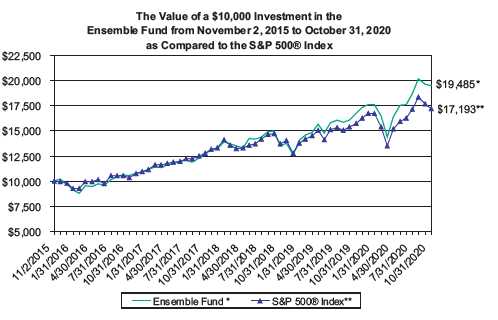
The Ensemble Fund (the “Fund”) returned 16.73% for the fiscal year ended October 31, 2020. For comparative purposes, the S&P 500® Index (“S&P 500”), which is the Fund’s benchmark, had a total return of 9.71% over the same time period.
The Fund began the fiscal year performing similarly to the S&P 500 up until February 19th, when the S&P 500 hit its peak level prior to the Coronavirus driven sell off. The Fund then slightly outperformed the market during the 33% decline that occurred over the following four weeks. But during the recovery of the market, the Fund materially outperformed the S&P 500 generating returns of 55.65% versus the S&P 500 up 47.71% . We attributed our outperformance during the market recovery to our portfolio companies as a group being less negatively effected by Coronavirus related headwinds than the average company in our benchmark and being more positively affected by the acceleration towards digital commerce triggered by the pandemic.
During the fiscal year, we owned 25 different companies of which 20 generated a positive return for the Fund.
Significant detractors from the Fund’s total return included the following:
• Sensata Technologies: The Fund owned Sensata from inception until late March of 2020. We exited this position after it had declined materially during the Coronavirus fueled sell off because we believed that despite it trading at a very discounted value versus our assessment of intrinsic value, that we had better investment opportunities to direct the sales proceeds into. We also believed that while Sensata remained a mission critical supplier to global automakers, that the massive potential disruption to the global auto supply chain would be difficult for Sensata to navigate.
• Booking Holdings Inc. (4.4%* weight in Fund): Booking Holdings Inc. is the leading global online travel agency with a focus on making hotel reservations, particularly in Europe. After the stock price declined by nearly 42% during the month-long market selloff (from February 14, 2020 through March 23, 2020), the stock rallied by 47% through the end of the Fund’s fiscal year for a full fiscal year return of -17%. While we expect demand for hotel rooms to remain depressed for a number of years, we also believe that the independent hotels that depend on Booking to deliver customers to them will need Booking more than ever. The company has a strong balance sheet to weather a period of even very weak demand and we continue to believe the stock is materially undervalued.
• First American Financial Corporation (3.7%* weight in the Fund): First American Financial is one of the two leading title insurance companies in the United States. Under US real estate law, any disputes about the title to a home must be resolved in the courts. There is no single, centralized, government record database that determines who holds title to a house. Therefore, mortgage lenders require home buyers to purchaser title insurance. We believed prior to the pandemic that the US housing market was on the verge of staging a multiyear increase in the number of homes being sold. While the pandemic initially halted the sale of homes, during the recovery phase there has been an intense interest in moving, with the number of home sales on a year to date basis fully making up for the lost sales in the spring. First American’s stock price was down over the Fund’s fiscal year, but we believe that the pandemic has triggered a long awaited recovery in housing transactions and are confident in First American’s medium to long term outlook.
Significant contributors to the Fund’s total return included the following:
• Netflix Inc. (8.6%* weight in Fund): Netflix Inc. was our largest average holding during the fiscal year and one of our top performers, rallying by 65.53% . While the pandemic negatively impacted the financial results of most public companies, at least initially, the requirement for people around the globe to shelter in their home greatly boosted the number of new Netflix subscribers. This huge increase in paying customers coincided with the closure of movie theaters and postponement of televised sporting events, both of which are alternatives to watching Netflix. We continue to believe that Netflix has a long path of future growth ahead of it as it consolidates its position as the first truly global streaming media company.
| * Portfolio Information as of October 31, 2020. |
• Masimo Corp (6.5%* weight in Fund): Masimo Corp. is a provider of patient monitoring systems to hospitals, with many of their offerings focused on monitoring the level of oxygen in a patient’s blood stream. Coronavirus is a respiratory illness and the severity of a patient’s illness can be monitored using Masimo’s sensors. In addition to spurring increased demand for their existing products, the company also launched a new remote monitoring product that allows hospitals to send patients with mild cases of Coronavirus home, while continuing to monitor them and bringing them back to the hospital should their oxygen levels decline. We believe that these remote monitoring tools have broad applicability beyond monitoring Coronavirus cases and think that the company is building a large new addition to its earnings power via this tool set.
• Chipotle Mexican Grill, Inc. (3.8%* weight in Fund): We first purchased shares of Chipotle during the initial stages of the pandemic fueled market sell off in March after it had declined by over 20%. We then added materially to our position in late March after the stock had declined further. Given high levels of volatility in Chipotle and other stocks in our portfolio, we traded out of some of our shares during the market recovery before adding materially to our position in June as it became clear to us that Chipotle was greatly benefiting from the pandemic as independent restaurants went out of business and Chipotle’s best in class digital ordering and delivery offering made it well prepared to serve customers during the pandemic and beyond.
The 2020 fiscal year saw the fastest market decline of over 30% in history as well as one of the most whiplashing inducing market rallies as the market came to understand that the economy would be hurt by the pandemic but was likely to avoid entering a prolonged and deep recession or depression. We believe that many of the changes in commerce seen during the pandemic will reverse once people are safely able to spend time in public, while other important changes are likely here to stay. In managing the Fund, we will continue to prioritize investing in companies that have the ability to survive the Coronavirus recession as well as thrive as the world recovers.
We will continue to seek to identify outstanding companies that exhibit three core characteristics:
Moat: We seek companies that have strong and persistent competitive advantages and offer products and services from within this moat that we believe consumers will continue to value over the long term.
Management: We seek companies that are managed by executive teams who have displayed strong talent for creating value for their customers, generating value for shareholders, and delivering a positive impact to all of their stakeholders.
Forecastable: We seek companies that operate in industries and use business models that we believe make their financial results relatively forecastable over the long term and which we believe that our research team has the specific domain expertise to analyze as well or better than our competition.
In closing, we want to thank you for your investment in the Fund and we look forward to serving you into the future.
Sincerely,
Sean Stannard-Stockton
Past performance does not guarantee future results. The investment return and principal value of an investment in the Fund will fluctuate so that an investor’s shares, when redeemed, may be worth more or less than their original cost. Current performance may be higher or lower than the performance data quoted. Performance data current to the most recent month end are available by calling 1-800-785-8165.
The Ensemble Fund’s prospectus contains important information about the Fund’s investment objectives, potential risks, management fees, charges and expenses, and other information and should be read and considered carefully before investing. You may obtain a current copy of the Fund’s prospectus by calling 1-800-785-8165. Distributed by Rafferty Capital Markets, LLC-Garden City, NY 11530.
| * Portfolio Information as of October 31, 2020. |
Ensemble Fund (Unaudited)
PERFORMANCE INFORMATION
October 31, 2020 NAV $15.97
AVERAGE ANNUAL TOTAL RETURNS AS OF OCTOBER 31, 2020
| | | | | | Since | |
| | 1 Year(A) | | 3 Years(A) | | Inception(A) | |
| Ensemble Fund | 16.73% | | 15.44% | | 14.28% | |
| S&P 500® Index (B) | 9.71% | | 10.42% | | 11.45% | |
Annual Fund Operating Expense Ratio (from 2/28/2020 Prospectus): 1.00%
The Fund’s expense ratio for the year ended October 31, 2020 can be found in the financial highlights included within this report.
(A)1 Year, 3 Years and Since Inception returns include change in share prices and in each case includes reinvestment of any dividends and capital gain distributions. The Ensemble Fund commenced operations on November 2, 2015.
(B)The S&P 500® Index is a widely recognized unmanaged index of equity prices and is representative of a broader market and range of securities than is found in the Fund’s portfolio. The Index is an unmanaged benchmark that assumes reinvestment of all distributions and excludes the effect of taxes and fees. Individuals cannot invest directly in this Index; however, an individual can invest in exchange traded funds or other investment vehicles that attempt to track the performance of a benchmark index.
For a commentary on the Fund’s calendar quarter performance visit the Fund’s website at www.ensemblefund.com.
PAST PERFORMANCE DOES NOT GUARANTEE FUTURE RESULTS. INVESTMENT RETURN AND PRINCIPAL VALUE WILL FLUCTUATE SO THAT SHARES, WHEN REDEEMED, MAY BE WORTH MORE OR LESS THAN THEIR ORIGINAL COST. RETURNS DO NOT REFLECT THE DEDUCTION OF TAXES THAT A SHAREHOLDER WOULD PAY ON FUND DISTRIBUTIONS OR THE REDEMPTION OF FUND SHARES. CURRENT PERFORMANCE MAY BE LOWER OR HIGHER THAN THE PERFORMANCE DATA QUOTED. TO OBTAIN PERFORMANCE DATA CURRENT TO THE MOST RECENT MONTH END, PLEASE CALL 1-800-785-8165. AN INVESTMENT IN THE FUND IS SUBJECT TO INVESTMENT RISKS, INCLUDING THE POSSIBLE LOSS OF THE PRINCIPAL AMOUNT INVESTED. THE FUND'S DISTRIBUTOR IS RAFFERTY CAPITAL MARKETS, LLC.
2020 Annual Report 3
| Ensemble Fund (Unaudited) |
Ensemble Fund
by Sectors (as a percentage of Net Assets)
October 31, 2020
(Unaudited) |

* Net Cash represents cash and other assets in excess of liabilities.
Availability of Quarterly Schedule of Investments
The Fund publicly files its complete schedule of portfolio holdings with the Securities and Exchange Commission (“SEC”) for the first and third quarters of each fiscal year on Form N-PORT. The Fund’s Form N-PORT is available on the SEC’s website at http://www.sec.gov.
Ensemble Capital Management, LLC, the Fund’s investment adviser (“Adviser”), is responsible for exercising the voting rights associated with the securities held by the Fund. A description of the policies and procedures used by the Adviser in fulfilling this responsibility is available without charge on the Fund’s website at www.ensemblefund.com. It is also included in the Fund’s Statement of Additional Information, which is available on the SEC’s website at http://www.sec.gov.
Information regarding how the Fund voted proxies, Form N-PX, relating to portfolio securities during the most recent period ended June 30th, is available without charge, upon request, by calling our toll free number (1-800-785-8165). This information is also available on the SEC’s website at http://www.sec.gov.
2020 Annual Report 4
Expense Example
(Unaudited) |
Shareholders of this Fund incur ongoing costs consisting of management fees. Although the Fund charges no sales loads or transaction fees, you will be assessed fees for outgoing wire transfers, returned checks and stop payment orders at prevailing rates charged by Mutual Shareholder Services, LLC, the Fund’s transfer agent. IRA accounts will be charged an $8.00 annual maintenance fee. Additionally, your account will be indirectly subject to the expenses of any underlying funds. The following example is intended to help you understand your ongoing costs of investing in the Fund and to compare these costs with similar costs of investing in other mutual funds. The example is based on an investment of $1,000 invested in the Fund on May 1, 2020 and held through October 31, 2020.
The first line of the table below provides information about actual account values and actual expenses. In order to estimate the expenses a shareholder paid during the period covered by this report, shareholders can divide their account value by $1,000 (for example, an $8,600 account value divided by $1,000 = 8.6) and then multiply the result by the number in the first line under the heading entitled “Expenses Paid During the Period.”
The second line of the table below provides information about hypothetical account values and hypothetical expenses based on the Fund’s actual expense ratio and an assumed rate of return of 5% per year before expenses, which is not the Fund’s actual return. The hypothetical account values and expenses may not be used to estimate the actual ending account balance or expenses paid by a shareholder for the period. Shareholders may use this information to compare the ongoing costs of investing in this Fund and other funds. To do so, compare this 5% hypothetical example with the 5% hypothetical examples that appear in other funds’ shareholder reports.
Please note that the expenses shown in the table are meant to highlight your ongoing costs only and do not reflect any transactional costs, such as the charges assessed by Mutual Shareholder Services, LLC as described above and expenses of any underlying funds. Therefore, the second line of the table is useful in comparing ongoing costs only, and will not help you determine the relative total costs of owning different funds. In addition, if these transactional costs were included, your costs would have been higher.
| | | | | | | Expenses Paid |
| | | Beginning | | Ending | | During the Period* |
| | | Account Value | | Account Value | | May 1, 2020 to |
| | | May 1, 2020 | | October 31, 2020 | | October 31, 2020 |
| |
| Actual | | $1,000.00 | | $1,190.01 | | $5.50 |
| |
| Hypothetical | | $1,000.00 | | $1,020.11 | | $5.08 |
| (5% annual return | | | | | | |
| before expenses) | | | | | | |
| * | Expenses are equal to the Fund’s annualized expense ratio of 1.00%, multiplied by the average account value over the period, multiplied by 184/366 (to reflect the one-half year period). |
| |
2020 Annual Report 5
| Ensemble Fund | | |
| | | | Schedule of Investments |
| | | | October 31, 2020 |
| Shares | | Fair Value | | % of Net Assets |
| COMMON STOCKS | | | | | |
| | | | | | |
| Aircraft Engines & Engine Parts | | | | | |
| 12,613 | HEICO Corporation | $ | 1,179,315 | | 2.99 | % |
| Banks | | | | | | |
| 25,870 | First Republic Bank | | 3,263,242 | | 8.26 | % |
| Electromedical & Electrotherapeutic Apparatus | | | | | |
| 11,425 | Masimo Corporation * | | 2,557,143 | | 6.48 | % |
| Entertainment | | | | | | |
| 11,500 | Nintendo Co., Ltd. * ** | | 778,895 | | 1.97 | % |
| Motor Vehicles & Passenger Car Bodies | | | | | |
| 13,657 | Ferrari N.V. (Italy) | | 2,436,682 | | 6.17 | % |
| Operative Builders | | | | | |
| 351 | NVR, Inc. * | | 1,387,535 | | 3.51 | % |
| Orthopedic, Prosthetic & Surgical Appliances & Supplies | | | | | |
| 2,908 | Intuitive Surgical, Inc. * | | 1,939,869 | | 4.91 | % |
| Retail - Building Materials, Hardware, Garden Supply | | | | | |
| 20,113 | Fastenal Company | | 869,485 | | 2.20 | % |
| Retail - Eating & Drinking Places | | | | | |
| 1,242 | Chipotle Mexican Grill, Inc. * | | 1,492,238 | | | |
| 13,646 | Starbucks Corporation | | 1,186,656 | | | |
| | | | 2,678,894 | | 6.79 | % |
| Retail - Lumber & Other Building Materials Dealers | | | | | |
| 11,774 | The Home Depot, Inc. | | 3,140,244 | | 7.95 | % |
| Retail - Variety Stores | | | | | |
| 1,100 | Costco Wholesale Corporation | | 393,382 | | 1.00 | % |
| Security Brokers, Dealers & Flotation Companies | | | | | |
| 47,657 | The Charles Schwab Corporation | | 1,959,179 | | 4.96 | % |
| Services - Business Services, NEC | | | | | |
| 1,074 | Booking Holdings Inc. * | | 1,742,565 | | | |
| 13,856 | Broadridge Financial Solutions, Inc. | | 1,906,585 | | | |
| 10,056 | Mastercard Incorporated - Class A | | 2,902,564 | | | |
| | | | 6,551,714 | | 16.60 | % |
| Services - Computer Programming, Data Processing, Etc. | | | | | |
| 1,354 | Alphabet Inc. - Class A * | | 2,188,213 | | 5.54 | % |
| Services - Engineering, Accounting, Research, Management | | | | | |
| 13,159 | Paychex, Inc. | | 1,082,328 | | 2.74 | % |
| Services - Prepackaged Software | | | | | |
| 11,340 | BlackLine, Inc. * | | 1,107,691 | | 2.81 | % |
| Services - Video Tape Rental | | | | | |
| 7,163 | Netflix, Inc. * | | 3,407,726 | | 8.63 | % |
| Title Insurance | | | | | | |
| 33,011 | First American Financial Corporation | | 1,471,960 | | 3.73 | % |
| Trucking (No Local) | | | | | |
| 7,868 | Landstar System, Inc. | | 981,140 | | 2.48 | % |
| Total for Common Stocks (Cost - $31,462,767) | | 39,374,637 | | 99.72 | % |
| Total Investment Securities | | 39,374,637 | | | |
| Other Assets in Excess of Liabilities | | 110,224 | | 0.28 | % |
| Net Assets | | $ | 39,484,861 | | 100.00 | % |
* Non-Income Producing Security.
** ADR - American Depositary Receipt.
The accompanying notes are an integral part of these
financial statements. |
2020 Annual Report 6
| Ensemble Fund | | |
| |
| Statement of Assets and Liabilities | | |
| October 31, 2020 | | |
| |
| Assets: | | |
| Investment Securities at Fair Value | $ | 39,374,637 |
| (Cost - $31,462,767) | | |
| Cash | | 257,030 |
| Receivable for Securities Sold | | 903,168 |
| Dividends Receivable | | 23,429 |
| Total Assets | | 40,558,264 |
| Liabilities: | | |
| Payable to Adviser (Note 4) | | 34,805 |
| Payable for Investments Purchased | | 1,038,598 |
| Total Liabilities | | 1,073,403 |
| Net Assets | $ | 39,484,861 |
| |
| Net Assets Consist of: | | |
| Paid In Capital | $ | 28,777,443 |
| Total Distributable Earnings | | 10,707,418 |
| Net Assets, for 2,472,655 Shares Outstanding | $ | 39,484,861 |
| (Unlimited shares authorized) | | |
| Net Asset Value, Offering Price and Redemption Price Per Share | | |
| ($39,484,861/2,472,655 shares) | $ | 15.97 |
| |
| Statement of Operations | | |
| For the fiscal year ended October 31, 2020 | | |
| |
| Investment Income: | | |
| Dividends (Net of foreign withholding tax of $2,694) | $ | 377,008 |
| Total Investment Income | | 377,008 |
| Expenses: | | |
| Management Fees (Note 4) | | 353,273 |
| Total Expenses | | 353,273 |
| |
| Net Investment Income (Loss) | | 23,735 |
| |
| Realized and Unrealized Gain (Loss) on Investments: | | |
| Net Realized Gain (Loss) on Investments | | 3,175,671 |
| Net Change in Unrealized Appreciation (Depreciation) on Investments | | 2,238,828 |
| Net Realized and Unrealized Gain (Loss) on Investments | | 5,414,499 |
| |
| Net Increase (Decrease) in Net Assets from Operations | $ | 5,438,234 |
The accompanying notes are an integral part of these
financial statements. |
2020 Annual Report 7
| Ensemble Fund |
| |
| Statements of Changes in Net Assets | | | | | | | |
| | | 11/1/2019 | | | | 11/1/2018 | |
| | | to | | | | to | |
| | | 10/31/2020 | | | | 10/31/2019 | |
| Operations: | | | | | | | |
| Net Investment Income (Loss) | $ | 23,735 | | | $ | 63,668 | |
| Net Realized Gain (Loss) on Investments | | 3,175,671 | | | | 2,800,242 | |
| Net Change in Unrealized Appreciation (Depreciation) on Investments | | 2,238,828 | | | | 3,321,822 | |
| Net Increase (Decrease) in Net Assets from Operations | | 5,438,234 | | | | 6,185,732 | |
| |
| Distributions to Shareholders: | | (2,950,662 | ) | | | (1,053,387 | ) |
| |
| Capital Share Transactions: | | | | | | | |
| Proceeds From Sale of Shares | | 8,242,714 | | | | 4,411,688 | |
| Shares Issued on Reinvestment of Dividends | | 2,950,663 | | | | 1,053,385 | |
| Cost of Shares Redeemed | | (6,385,393 | ) | | | (1,883,951 | ) |
| Net Increase (Decrease) from Shareholder Activity | | 4,807,984 | | | | 3,581,122 | |
| |
| Net Increase (Decrease) in Net Assets | | 7,295,556 | | | | 8,713,467 | |
| |
| Net Assets at Beginning of Year | | 32,189,305 | | | | 23,475,838 | |
| Net Assets at End of Year | $ | 39,484,861 | | | $ | 32,189,305 | |
| |
| Share Transactions: | | | | | | | |
| Issued | | 564,439 | | | | 348,728 | |
| Reinvested | | 204,623 | | | | 94,052 | |
| Redeemed | | (443,434 | ) | | | (141,941 | ) |
| Net Increase (Decrease) in Shares | | 325,628 | | | | 300,839 | |
| Shares Outstanding Beginning of Year | | 2,147,027 | | | | 1,846,188 | |
| Shares Outstanding End of Year | | 2,472,655 | | | | 2,147,027 | |
| Financial Highlights | | | | | | | | | | | | | | | | | | | | |
| Selected data for a share outstanding | | | | | | | | | | | | | | | | | | | | |
| throughout the period: | | 11/1/2019 | | | | 11/1/2018 | | | | 11/1/2017 | | | | 11/1/2016 | | | | 11/2/2015* | | |
| | | to | | | | to | | | | to | | | | to | | | | to | | |
| | | 10/31/2020 | | | | 10/31/2019 | | | | 10/31/2018 | | | | 10/31/2017 | | | | 10/31/2016 | | |
| Net Asset Value - | | | | | | | | | | | | | | | | | | | | |
| Beginning of Period | $ | 14.99 | | | $ | 12.72 | | | $ | 12.48 | | | $ | 10.50 | | | $ | 10.00 | | |
| Net Investment Income (Loss) (a) | | 0.01 | | | | 0.03 | | | | 0.01 | | | | 0.04 | | | | 0.09 | | |
| Net Realized and Unrealized Gains (Losses) | | | | | | | | | | | | | | | | | | | | |
| on Investments | | 2.35 | | | | 2.80 | | | | 0.79 | | | | 2.10 | | | | 0.41 | | |
| Total from Investment Operations | | 2.36 | | | | 2.83 | | | | 0.80 | | | | 2.14 | | | | 0.50 | | |
| Distributions (From Net Investment Income) | | (0.03 | ) | | | (0.01 | ) | | | (0.03 | ) | | | (0.06 | ) | | | - | | |
| Distributions (From Realized Capital Gains) | | (1.35 | ) | | | (0.55 | ) | | | (0.53 | ) | | | (0.10 | ) | | | - | | |
| Total Distributions | | (1.38 | ) | | | (0.56 | ) | | | (0.56 | ) | | | (0.16 | ) | | | - | | |
| Proceeds from Redemption Fee (c) | | - | | | | - | | | | - | | + | | - | | + | | - | | |
| Net Asset Value - | | | | | | | | | | | | | | | | | | | | |
| End of Period | $ | 15.97 | | | $ | 14.99 | | | $ | 12.72 | | | $ | 12.48 | | | $ | 10.50 | | |
| Total Return (b) | | 16.73% | | | | 23.76% | | | | 6.49% | | | | 20.62 | % | | | 5.00% | | ** |
| Ratios/Supplemental Data | | | | | | | | | | | | | | | | | | | | |
| Net Assets - End of Period (Thousands) | $ | 39,485 | | | $ | 32,189 | | | $ | 23,476 | | | $ | 18,221 | | | $ | 8,847 | | |
| Ratio of Expenses to Average Net Assets | | 1.00% | | | | 1.00% | | | | 1.00% | | | | 1.00 | % | | | 1.00% | | *** |
| Ratio of Net Investment Income (Loss) to | | | | | | | | | | | | | | | | | | | | |
| Average Net Assets | | 0.07% | | | | 0.23% | | | | 0.08% | | | | 0.33 | % | | | 0.92% | | *** |
| Portfolio Turnover Rate | | 61.28% | | | | 47.01% | | | | 63.49% | | | | 41.81 | % | | | 31.91% | | ** |
* Commencement of Operations.
** Not Annualized.
*** Annualized.
+ Amount less than $0.005 per share.
(a) Per share amounts were calculated using the average shares method.
(b) Total return represents the rate that the investor would have earned or lost on an investment in the Fund
assuming reinvestment of dividends and distributions.
(c) Prior to February 28, 2018, the Fund was subject to a redemption fee of 2% if redeemed within 90 days or
less of purchase. |
The accompanying notes are an integral part of these
financial statements. |
2020 Annual Report 8
NOTES TO THE FINANCIAL STATEMENTS
ENSEMBLE FUND
October 31, 2020
1.) ORGANIZATION
The Ensemble Fund (the “Fund”) was organized as a non-diversified series of PFS Funds (the “Trust”) on September 23, 2015 and commenced operations on November 2, 2015. The Trust was established under the laws of Massachusetts by an Agreement and Declaration of Trust dated January 13, 2000, as amended on January 20, 2011. The Trust is registered as an open-end investment company under the Investment Company Act of 1940, as amended (the “1940 Act”). The Trust may offer an unlimited number of shares of beneficial interest in a number of separate series, each series representing a distinct fund with its own investment objectives and policies. As of October 31, 2020, there were thirteen series authorized by the Trust. The Fund’s objective is to seek long-term capital appreciation. The investment adviser to the Fund is Ensemble Capital Management, LLC (the “Adviser”).
2.) SIGNIFICANT ACCOUNTING POLICIES
The Fund is an investment company and accordingly follows the investment company accounting and reporting guidance of the Financial Accounting Standards Board (“FASB”) Accounting Standards Codification Topic 946 Financial Services - Investment Companies. The financial statements are prepared in conformity with accounting principles generally accepted in the United States (“GAAP”). The Fund follows the significant accounting policies described in this section.
SECURITY VALUATION
All investments in securities are recorded at their estimated fair value, as described in Note 3.
SHARE VALUATION
The net asset value (the “NAV”) is generally calculated as of the close of trading on the New York Stock Exchange (the “Exchange”)(normally 4:00 p.m. Eastern time) every day the Exchange is open. The NAV is calculated by taking the total value of the Fund’s assets, subtracting its liabilities, and then dividing by the total number of shares outstanding, rounded to the nearest cent. The offering price and redemption price per share is equal to the net asset value per share. Prior to February 28, 2018, the Fund was subject to a redemption fee of 2% if redeemed within 90 days of purchase.
FEDERAL INCOME TAXES
The Fund’s policy is to continue to comply with the requirements of the Internal Revenue Code that are applicable to regulated investment companies and to distribute all of its taxable income to shareholders. Therefore, no federal income tax provision is required. It is the Fund’s policy to distribute annually, prior to the end of the calendar year, dividends sufficient to satisfy excise tax requirements of the Internal Revenue Code. This Internal Revenue Code requirement may cause an excess of distributions over the book year-end accumulated income. In addition, it is the Fund’s policy to distribute annually, after the end of the fiscal year, any remaining net investment income and net realized capital gains.
The Fund recognizes the tax benefits of certain tax positions only where the position is “more likely than not” to be sustained assuming examination by tax authorities. Management has analyzed the Fund’s tax positions, and has concluded that no liability for unrecognized tax benefits should be recorded related to uncertain tax positions taken on returns filed for open tax years.The Fund identifies its major tax jurisdictions as U.S. Federal tax authorities; however, the Fund is not aware of any tax positions for which it is reasonably possible that the total amounts of unrecognized tax benefits will change materially in the next twelve months. The Fund recognizes interest and penalties, if any, related to unrecognized tax benefits as income tax expense in the Statement of Operations. During the fiscal year ended October 31, 2020, the Fund did not incur any interest or penalties.
DISTRIBUTIONS TO SHAREHOLDERS
Distributions to shareholders, which are determined in accordance with income tax regulations, are recorded on the ex-dividend date.
The treatment for financial reporting purposes of distributions made to shareholders during the year from net investment income or net realized capital gains may differ from their ultimate treatment for federal income tax purposes. The differences between book and tax basis are caused primarily by differences in the timing of the recognition of certain components of income, expense, or realized capital gain for federal income tax purposes. Where such differences are permanent in nature, they are reclassified in the components of the net assets based on their ultimate characterization for federal income tax purposes. Any such reclassifications will have no effect on net assets, results of operations, or net asset value per share of the Fund. The Fund may utilize earnings and profits distributed to shareholders on redemption of shares as part of the dividends
2020 Annual Report 9
Notes to the Financial Statements - continued
paid deduction. For the tax period ended October 31, 2020 the following permanent adjustment was recorded. The adjustment was primarily attributed to the use of equalization for tax purposes:
| Paid In Capital | | $302,160 | |
| Total Distributable Earnings | | ($302,160 | ) |
USE OF ESTIMATES
The financial statements are prepared in accordance with GAAP, which requires management to make estimates and assumptions that affect the reported amounts of assets and liabilities and disclosure of contingent assets and liabilities at the date of the financial statements and the reported amounts of increases and decreases in net assets from operations during the reporting period. Actual results could differ from those estimates.
EXPENSES
Expenses incurred by the Trust that do not relate to a specific fund of the Trust are allocated to the individual funds based on each fund’s relative net assets or another appropriate basis.
OTHER
The Fund records security transactions based on a trade date for financial reporting purposes. Dividend income is recognized on the ex-dividend date, and interest income, if any, is recognized on an accrual basis. The Fund uses the specific identification method in computing gain or loss on the sale of investment securities. Withholding taxes on foreign dividends have been provided for in accordance with the Fund’s understanding of the applicable country’s tax rules and rates. 3.) INVESTMENT SECURITIES VALUATIONS
The Fund utilizes various methods to measure the fair value of most of its investments on a recurring basis. GAAP establishes a hierarchy that prioritizes inputs to valuation methods. The three levels of inputs are:
Level 1 - Unadjusted quoted prices in active markets for identical assets or liabilities that the Fund has the ability to access.
Level 2 - Observable inputs other than quoted prices in active markets included in level 1 that are observable for the asset or liability, either directly or indirectly. These inputs may include quoted prices for the identical instrument on an inactive market, prices for similar instruments, interest rates, prepayment speeds, credit risk, yield curves, default rates and similar data.
Level 3 - Unobservable inputs for the asset or liability, to the extent relevant observable inputs are not available, representing the Fund’s own assumptions about the assumptions a market participant would use in valuing the asset or liability, and would be based on the best information available.
The availability of observable inputs can vary from security to security and is affected by a wide variety of factors, including, for example, the type of security, whether the security is new and not yet established in the marketplace, the liquidity of markets, and other characteristics particular to the security. To the extent that valuation is based on models or inputs that are less observable or unobservable in the market, the determination of fair value requires more judgment. Accordingly, the degree of judgment exercised in determining fair value is greatest for instruments categorized in level 3.
The inputs used to measure fair value may fall into different levels of the fair value hierarchy. In such cases, for disclosure purposes, the level in the fair value hierarchy within which the fair value measurement falls in its entirety, is determined based on the lowest level input that is significant to the fair value measurement in its entirety.
FAIR VALUE MEASUREMENTS
A description of the valuation techniques applied to the Fund’s major categories of assets and liabilities measured at fair value on a recurring basis follows.
Equity securities (common stocks). Equity securities generally are valued by using market quotations, but may be valued on the basis of prices furnished by a pricing service when the Adviser believes such prices accurately reflect the fair value of such securities. Securities that are traded on any stock exchange or on the NASDAQ over-the-counter market are generally valued by the pricing service at the last quoted sale price. Lacking a last sale price, an equity security is generally valued by the pricing service at its last bid price. Generally, if the security is traded in an active market and is valued at the last sale price, the security is categorized as a level 1 security, and if an equity security is valued by the pricing service at its last bid, it is generally categorized as a level 2 security. When market quotations are not readily available, when the Adviser determines that the market quotation or the price provided by the pricing service does not accurately
2020 Annual Report 10
Notes to the Financial Statements - continued
reflect the current fair value, or when restricted securities are being valued, such securities are valued as determined in good faith by the Adviser, subject to review of the Board of Trustees (the “Trustees” or the “Board”) and are categorized in level 2 or level 3, when appropriate.
In accordance with the Trust’s good faith pricing guidelines, the Adviser is required to consider all appropriate factors relevant to the value of securities for which it has determined other pricing sources are not available or reliable as described above. There is no standard procedure for determining fair value, since fair value depends upon the circumstances of each individual case. As a general principle, the current fair value of an issue of securities being valued by the Adviser would appear to be the amount which the owner might reasonably expect to receive for them upon their current sale. Methods which are in accordance with this principle may, for example, be based on (i) a multiple of earnings; (ii) a discount from market of a similar freely traded security (including a derivative security or a basket of securities traded on other markets, exchanges or among dealers); or (iii) yield to maturity with respect to debt issues, or a combination of these and other methods.
The following table summarizes the inputs used to value the Fund’s assets measured at fair value as of October 31, 2020:
| Valuation Inputs of Assets | | Level 1 | Level 2 | Level 3 | | Total |
| Common Stocks | | $39,374,637 | $– | $– | | $39,374,637 |
| Total | | $39,374,637 | $– | $– | | $39,374,637 |
The Fund did not hold any Level 3 assets during the fiscal year ended October 31, 2020. The Fund did not invest in any derivative instruments during the fiscal year ended October 31, 2020. 4.) INVESTMENT ADVISORY AGREEMENT
The Fund has entered into an investment advisory agreement (“Management Agreement”) with the Adviser. The Adviser manages the investment portfolio of the Fund, subject to policies adopted by the Trust’s Board of Trustees. Under the Management Agreement, the Adviser, at its own expense and without reimbursement from the Trust, furnishes office space and all necessary office facilities, equipment, and executive personnel necessary for managing the Fund and pays the operating expenses of the Fund excluding management fees, brokerage fees and commissions, taxes, borrowing costs (such as (a) interest and (b) dividend expenses on securities sold short), ADR fees, fees and expenses of acquired funds, fees pursuant to Rule 12b-1 distribution plans, and extraordinary or non-recurring expenses. For its services the Adviser receives an investment management fee equal to 1.00% of the average daily net assets of the Fund.
As a result of the above calculation, for the fiscal year ended October 31, 2020, the Adviser earned management fees totaling $353,273. At October 31, 2020, the Fund owed $34,805 to the Adviser.
5.) RELATED PARTY TRANSACTIONS
Jeffrey R. Provence of Premier Fund Solutions, Inc. (the “Administrator”) also serves as trustee/officer of the Fund. This individual receives benefits from the Administrator resulting from administration fees paid to the Administrator of the Fund by the Adviser.
The Trustees who are not interested persons of the Fund were each paid $1,500, for a total of $4,500, in Trustees’ fees for the fiscal year ended October 31, 2020 by the Adviser.
6.) PURCHASES AND SALES OF SECURITIES
For the fiscal year ended October 31, 2020, purchases and sales of investment securities other than U.S. Government obligations and short-term investments aggregated $23,352,942 and $21,485,287, respectively. Purchases and sales of U.S. Government obligations aggregated $0 and $0, respectively.
7.) CONTROL OWNERSHIP
The beneficial ownership, either directly or indirectly, of more than 25% of the voting securities of a fund creates a presumption of control of that fund, under Section 2(a)(9) of the 1940 Act. As of October 31, 2020, Charles Schwab & Co., Inc., for the benefit of its customers, held, in aggregate, 90.70% of the shares in the Fund. The Trust does not know whether any underlying accounts held at Charles Schwab & Co., Inc. owned or controlled 25% or more of the voting securities of the Fund.
8.) TAX MATTERS
For Federal income tax purposes, the cost of securities owned at October 31, 2020 was $31,699,881. At October 31, 2020, the composition of unrealized appreciation (the excess of value over tax cost) and depreciation (the excess of tax cost over value) on a tax basis was as follows:
2020 Annual Report 11
| Notes to the Financial Statements - continued | | |
| |
| | Appreciation | | (Depreciation) | | Net Appreciation (Depreciation) |
| | $8,488,743 | | ($813,987) | | $7,674,756 |
The tax character of distributions was as follows:
| | | Fiscal Year Ended | | Fiscal Year Ended |
| | | October 31, 2020 | | October 31, 2019 |
| Ordinary Income | | $ 523,630 | | $ 17,500 |
| Long-term Capital Gain | | 2,427,032 | | 1,035,887 |
| | | $2,950,662 | | $1,053,387 |
Subsequent to October 31, 2020, there were distributions paid on December 18, 2020 to the shareholders of record on December 17, 2020 of $0.009563 per share from net investment income, $0.089297 per share from short-term capital gains and $1.123043 per share from long-term capital gains.
As of October 31, 2020, the components of distributable earnings on a tax basis were as follows:
| Undistributed ordinary income | $ | 245,362 |
| Undistributed long-term capital gain (accumulated losses) | | 2,787,300 |
| Unrealized appreciation (depreciation) - net | | 7,674,756 |
| | $ | 10,707,418 |
Book to tax differences are primarily attributable to the tax deferral of wash sales.
9.) COVID-19 RISKS
Unexpected local, regional or global events, such as war; acts of terrorism; financial, political or social disruptions; natural, environmental or man-made disasters; the spread of infectious illnesses or other public health issues; and recessions and depressions could have a significant impact on the Fund and its investments and may impair market liquidity. Such events can cause investor fear, which can adversely affect the economies of nations, regions and the market in general, in ways that cannot necessarily be foreseen. An outbreak of infectious respiratory illness known as COVID-19, which is caused by a novel coronavirus (SARS-CoV-2), was first detected in China in December 2019 and subsequently spread globally. This coronavirus has resulted in, among other things, travel restrictions, closed international borders, enhanced health screenings at ports of entry and elsewhere, disruption of and delays in healthcare service preparation and delivery, prolonged quarantines, significant disruptions to business operations, market closures, cancellations and restrictions, supply chain disruptions, lower consumer demand, and significant volatility and declines in global financial markets, as well as general concern and uncertainty. The impact of COVID-19 has adversely affected, and other infectious illness outbreaks that may arise in the future could adversely affect, the economies of many nations and the entire global economy, individual issuers and capital markets in ways that cannot necessarily be foreseen. Public health crises caused by the COVID-19 outbreak may exacerbate other pre-existing political, social and economic risks in certain countries or globally. The duration of the COVID-19 outbreak and its effects cannot be determined with certainty.
10.) CONCENTRATION OF SECTOR RISK
If a Fund has significant investments in the securities of issuers in industries within a particular sector, any development affecting that sector will have a greater impact on the value of the net assets of the Fund than would be the case if the Fund did not have significant investments in that sector. In addition, this may increase the risk of loss of an investment in the Fund and increase the volatility of the Fund’s NAV per share. From time to time, circumstances may affect a particular sector and the companies within such sector. For instance, economic or market factors, regulation or deregulation, and technological or other developments may negatively impact all companies in a particular sector and therefore the value of a Fund’s portfolio will be adversely affected. As of October 31, 2020, the Fund had 28.83% of the value of its net assets invested in stocks within the Consumer Discretionary sector.
11.) SUBSEQUENT EVENTS
Subsequent events after the date of the Statement of Assets and Liabilities have been evaluated through the date the financial statements were issued. Management has concluded that, other than the December 18, 2020 distributions reported in Note 8, there are no events requiring adjustment or disclosure in the financial statements.
2020 Annual Report 12
REPORT OF INDEPENDENT REGISTERED PUBLIC ACCOUNTING FIRM
To the Shareholders of Ensemble Fund and
Board of Trustees of PFS Funds
Opinion on the Financial Statements
We have audited the accompanying statement of assets and liabilities, including the schedule of investments, of Ensemble Fund (the “Fund”), a series of PFS Funds, as of October 31, 2020, and the related statement of operations for the year then ended, the statements of changes in net assets for each of the two years in the period then ended, including the related notes, and the financial highlights for each of the five periods in the period then ended (collectively referred to as the “financial statements”). In our opinion, the financial statements present fairly, in all material respects, the financial position of the Fund as of October 31, 2020, the results of its operations for the year then ended, the changes in its net assets for each of the two years in the period then ended, and the financial highlights for each of the five periods in the period then ended, in conformity with accounting principles generally accepted in the United States of America.
Basis for Opinion
These financial statements are the responsibility of the Fund’s management. Our responsibility is to express an opinion on the Fund’s financial statements based on our audits. We are a public accounting firm registered with the Public Company Accounting Oversight Board (United States) (“PCAOB”) and are required to be independent with respect to the Fund in accordance with the U.S. federal securities laws and the applicable rules and regulations of the Securities and Exchange Commission and the PCAOB.
We conducted our audits in accordance with the standards of the PCAOB. Those standards require that we plan and perform the audit to obtain reasonable assurance about whether the financial statements are free of material misstatement whether due to error or fraud.
Our audits included performing procedures to assess the risks of material misstatement of the financial statements, whether due to error or fraud, and performing procedures that respond to those risks. Such procedures included examining, on a test basis, evidence regarding the amounts and disclosures in the financial statements. Our procedures included confirmation of securities owned as of October 31, 2020, by correspondence with the custodian and brokers. Our audits also included evaluating the accounting principles used and significant estimates made by management, as well as evaluating the overall presentation of the financial statements. We believe that our audits provide a reasonable basis for our opinion.
We have served as the Fund’s auditor since 2015.

COHEN & COMPANY, LTD.
Milwaukee, Wisconsin
December 22, 2020 |
2020 Annual Report 13
Trustees and Officers
(Unaudited) |
The Board of Trustees supervises the business activities of the Trust. The names of the Trustees and executive officers of the Trust are shown below. For more information regarding the Trustees, please refer to the Statement of Additional Information, which is available upon request by calling 1-800-785-8165. Each Trustee serves until the Trustee sooner dies, resigns, retires, or is removed.
The Trustees and Officers of the Trust and their principal business activities during the past five years are:
Interested Trustees and Officers
| | | | | Number of | |
| | | | Principal | Portfolios In | Other |
| Name, | Position(s) | Term of Office | Occupation(s) | Fund | Directorships |
| Address(1), | Held With | and Length of | During | Complex | Held By |
| and Year of Birth | the Trust | Time Served | Past 5 Years | Overseen By | Trustee |
| | | | | Trustee | |
| |
| Ross C. Provence, | President | Indefinite Term; | General Partner and Portfolio | N/A | N/A |
| Year of Birth: 1938 | | Since 2000 | Manager for Value Trend Capital | | |
| | | | Management, LP (1995 to current). | | |
| | | | Estate planning attorney (1963 to | | |
| current). |
| |
| Jeffrey R. Provence(2), | Trustee, | Indefinite Term; | CEO, Premier Fund Solutions, Inc. | 13 | Blue Chip |
| Year of Birth: 1969 | Secretary | Since 2000 | (2001 to current). General Partner | | Investor Funds, |
| | and | | and Portfolio Manager for Value | | Meeder Funds |
| | Treasurer | | Trend Capital Management, LP | | |
| | | | (1995 to current). | | |
| |
| Julian G. Winters, | Chief | Indefinite Term; | Managing Member, Watermark | N/A | N/A |
| Year of Birth: 1968 | Compliance | Since 2010 | Solutions LLC (investment compli- | | |
| | Officer | | ance and consulting) since March | | |
| | | | 2007. | | |
(1) The address of each trustee and officer is c/o PFS Funds, 1939 Friendship Drive, Suite C, El Cajon, California 92020.
(2) Jeffrey R. Provence is considered an “interested person” as defined in Section 2(a)(19) of the Investment Company Act of 1940 by virtue of his position with the Trust.
| | | | | Number of | |
| | | | Principal | Portfolios In | Other |
| Name, | Position | Term of Office | Occupation(s) | Fund | Directorships |
| Address(1), | Held With | and Length of | During | Complex | Held By |
| and Year of Birth | the Trust | Time Served | Past 5 Years | Overseen By | Trustee |
| | | | | Trustee | |
| |
| Thomas H. Addis III, | Independent | Indefinite Term; | Executive Director/CEO, Southern | 13 | None |
| Year of Birth: 1945 | Trustee | Since 2000 | California PGA (2006 to current). | | |
| |
| Allen C. Brown, | Independent | Indefinite Term; | Law Office of Allen C. Brown, estate | 13 | Blue Chip |
| Year of Birth: 1943 | Trustee | Since 2010 | planning and business attorney | | Investor Funds |
| | | | (1970 to current). | | |
| |
| George Cossolias, CPA, | Independent | Indefinite Term; | Partner of CWDL, CPAs (February 1, | 13 | Blue Chip |
| Year of Birth: 1935 | Trustee | Since 2000 | 2014 to current). Owner of George | | Investor Funds, |
| | | | Cossolias & Company, CPAs (1972 | | Neiman Funds |
| | | | to January 31, 2014). President of | | |
| | | | Lubrication Specialists, Inc. (1996 to | | |
| current). |
(1) The address of each trustee and officer is c/o PFS Funds, 1939 Friendship Drive, Suite C, El Cajon, California 92020.
2020 Annual Report 14
Investment Adviser
Ensemble Capital Management, LLC
Legal Counsel
Practus, LLP
Custodian
US Bank, N.A.
Distributor
Rafferty Capital Markets, LLC
Dividend Paying Agent,
Shareholders’ Servicing Agent,
Transfer Agent
Mutual Shareholder Services, LLC
Fund Administrator
Premier Fund Solutions, Inc.
Independent Registered Public Accounting Firm
Cohen & Company, Ltd. |
This report is provided for the general information of the shareholders of the Ensemble
Fund. This report is not intended for distribution to prospective investors in the Fund,
unless preceded or accompanied by an effective prospectus. |
Ensemble Fund
www.ensemblefund.com
1-800-785-8165 |
Item 2. Code of Ethics.
The registrant has adopted a code of ethics that applies to the registrant’s principal executive officer and the principal financial officer. The registrant has not made any amendments to its code of ethics during the covered period. The registrant has not granted any waivers from any provisions of the code of ethics during the covered period. A copy of the registrant’s Code of Ethics is filed herewith.
Item 3. Audit Committee Financial Expert.
The registrant’s Board of Trustees has determined that George Cossolias is an audit committee finical expert. Mr. Cossolias is independent for purposes of this Item 3.
Item 4. Principal Accountant Fees and Services.
(a-d) The following table details the aggregate fees billed for each of the last two fiscal years for audit fees, audit-related fees, tax fees and other fees by the principal accountant to the registrant. The principal accountant has provided no services to the adviser or any entity controlled by, or under common control with the adviser that provides ongoing services to the registrant.
| | | FYE 10/31/2020 | | FYE 10/31/2019 |
| Audit Fees | | $16,750 | | $13,750 |
| Audit-Related Fees | | $0 | | $0 |
| Tax Fees | | $3,000 | | $3,000 |
| All Other Fees | | $750 | | $750 |
Nature of Tax Fees: preparation of Excise Tax Statement and 1120 RIC.
All Other Fees: Semi-Annual Report Review
(e) (1) The audit committee approves all audit and non-audit related services and, therefore, has not adopted pre-approval policies and procedures described in paragraph (c)(7) of Rule 2-01 of Regulation S-X.
(e) (2) None of the services described in paragraph (b) through (d) of this Item were approved by the audit committee pursuant to paragraph (c)(7)(i)(C) of Rule 2-01 of Regulation S-X.
(f) All of the principal accountant’s hours spent on auditing the registrant’s financial statements were attributed to work performed by full-time permanent employees of the principal accountant.
(g) The following table indicates the aggregate non-audit fees billed by the registrant’s principal accountant for services to the registrant , the registrant’s investment adviser (not sub-adviser), and any entity controlling, controlled by, or under common control with the adviser that provides ongoing services to the registrant, for the last two years.
| Non-Audit Fees | | FYE 10/31/2020 | | FYE 10/31/2019 |
| Registrant | | $3,750 | | $3,750 |
| Registrant’s Investment Adviser | | $0 | | $0 |
(h) The principal accountant provided no services to the investment adviser or any entity controlling, controlled by, or under common control with the adviser that provides ongoing services to the registrant.
Item 5. Audit Committee of Listed Companies. Not applicable.
Item 6. Investments.
(a) Not applicable. Schedule filed with Item 1.
(b) Not applicable.
Item 7. Disclosure of Proxy Voting Policies and Procedures for Closed-End Management Investment Companies. Not applicable.
Item 8. Portfolio Managers of Closed End Management Investment Companies. Not applicable.
Item 9. Purchases of Equity Securities by Closed-End Management Investment Companies and Affiliated Purchasers. Not applicable.
Item 10. Submission of Matters to a Vote of Security Holders.
The registrant has not adopted procedures by which shareholders may recommend nominees to the registrant’s board of trustees.
Item 11. Controls and Procedures.
(a) The Registrant’s president and chief financial officer concluded that the disclosure controls and procedures (as defined in Rule 30a-3(c) under the Act (17 CFR 270.30a -3(c))) as of a date within 90 days of the filing date of the report that includes the disclosure required by this paragraph, based on the evaluation of these controls and procedures required by Rule 30a-3(b) under the Act (17 CFR 270.30a -3(b)) and Rules 13a-15(b) or 15d-15(b) under the Exchange Act (17 CFR 240.13a -15(b) or 240.15d -15(b)).
(b) There were no changes in the registrant’s internal control over financial reporting (as defined in Rule 30a-3(d) under the Act (17 CFR 270.30a -3(d)) that occurred during the period covered by this report that has materially affected, or is reasonably likely to materially affect, the registrant’s internal control over financial reporting.
Item 12. Disclosure of Securities Lending Activities for Closed-End Management Investment Companies.
Not applicable.
Item 13. Exhibits.
(a)(1) Code of Ethics. Filed herewith.
(a)(2) Certifications pursuant to Section 302 of the Sarbanes-Oxley Act of 2002. Filed herewith.
(a)(3) Not applicable.
(a)(4) Not applicable.
(b) Certification pursuant to Section 906 of the Sarbanes-Oxley Act of 2002. Filed herewith.
Pursuant to the requirements of the Securities Exchange Act of 1934 and the Investment Company Act of 1940, the registrant has duly caused this report to be signed on its behalf by the undersigned, thereunto duly authorized.
| | By: /s/Ross C. Provence
Ross C. Provence
President |
Pursuant to the requirements of the Securities Exchange Act of 1934 and the Investment Company Act of 1940, this report has been signed below by the following persons on behalf of the registrant and in the capacities and on the dates indicated.
| | By: /s/Ross C. Provence
Ross C. Provence
President |
| | By: /s/Jeffrey R. Provence
Jeffrey R. Provence
Chief Financial Officer |