UNITED STATES
SECURITIES AND EXCHANGE COMMISSION
WASHINGTON, D.C. 20549
FORM N-CSR
CERTIFIED SHAREHOLDER REPORT OF REGISTERED MANAGEMENT
INVESTMENT COMPANIES
Investment Company Act file number 811-09781
PFS Funds
(Exact name of registrant as specified in charter)
1939 Friendship Drive, Suite C, El Cajon, CA 92020
(Address of principal executive offices) (Zip code)
CT Corporation System
155 Federal St., Suite 700, Boston, MA 02110
(Name and address of agent for service)
Registrant’s telephone number, including area code: (619) 588-9700
Date of fiscal year end: December 31
Date of reporting period: December 31, 2020
Item 1. Report to Stockholders.

| | IMPORTANT NOTE: Beginning on January 1, 2021, as permitted by regulations adopted by the
Securities and Exchange Commission, paper copies of the Fund’s shareholder reports will no longer be
sent by mail, unless you specifically request paper copies of the reports from the Fund or from your finan-
cial intermediary, such as a broker-dealer or bank. Instead, the reports will be made available on a web-
site, and you will be notified by mail each time a report is posted and provided with a website link to
access the report. If you already elected to receive shareholder reports electronically, you will not be
affected by this change and you need not take any action. You may elect to receive shareholder reports
and other communications from the Fund or your financial intermediary electronically by calling or send-
ing an email request. You may elect to receive all future reports in paper, free of charge. You can inform
the Fund or your financial intermediary that you wish to continue receiving paper copies of your share-
holder reports by calling or sending an email request. Your election to receive reports in paper will apply
to all funds held with the fund complex/your financial intermediary. |
Annual Report
December 31, 2020
BRTNX |
February 16, 2021
Dear Fellow Shareholders:
After a number of years of competitive relative returns, we had a disappointing 2020. Many of our holdings—namely our retailers and banks—were disproportionately hit by the pandemic, and we did not hold enough of the more exuberant areas of the market that took off in the latter half of the year. Our underperformance wasn’t solely because we didn’t participate in those sectors, but it didn’t help. We have pushed ourselves to adjust to the realities of low interest rates and high valuations by “paying up” for faster-growing businesses and trying to keep an open mind on what the future holds, but we’re not going to put our capital—and yours—at risk in securities whose prices have no relationship to their underlying value. We don’t think the current market is a bubble. But we do think there are areas of the market that are seeing excesses that haven’t been seen since 2000, and we suspect it ends the same way it did then.
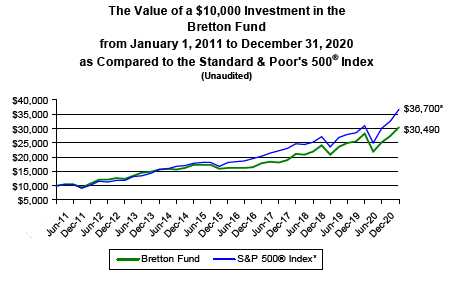
| Returns as of December 31, 2020(A) | | | | | | | | | |
| |
| | 4th | | Annualized Annualized Annualized | | Annualized | |
| | Quarter | | 1 Year | | 3 Years | | 5 Years | | 10 Years | | Since Inception | |
| Bretton Fund | 11.52% | | 8.44% | | 12.92% | | 13.50% | | 11.80% | | 12.14% | |
| S&P 500 Index(B) | 12.15% | | 18.40% | | 14.18% | | 15.22% | | 13.88% | | 14.66% | |
| Calendar Year Total Returns(A) | | | | |
| |
| | Bretton Fund | | S&P 500 Index(B) | |
| 2020 | 8.44% | | 18.40% | |
| 2019 | 35.39% | | 31.49% | |
| 2018 | -1.94% | | -4.38% | |
| 2017 | 18.19% | | 21.83% | |
| 2016 | 10.68% | | 11.96% | |
| 2015 | -6.59% | | 1.38% | |
| 2014 | 9.79% | | 13.69% | |
| 2013 | 26.53% | | 32.39% | |
| 2012 | 15.66% | | 16.00% | |
| 2011 | 7.90% | | 2.11% | |
| 9/30/10–12/31/10 | 6.13% | | 10.76% | |
| Cumulative Since Inception | 223.68% | | 306.47% | |
(A) All returns include change in share prices and, in each case, include reinvestment of any dividends and capital gain distributions. The inception date of the Bretton Fund was September 30, 2010.
(B) The S&P 500® Index is a stock market index based on the market capitalizations of 500 leading companies publicly traded in the US stock market, as determined by Standard & Poor’s, and captures approximately 80% coverage of available market capitalization.
Performance data quoted represents past performance. Past performance does not guarantee future results. The investment return and principal value of an investment will fluctuate so that an investor’s shares, when redeemed, may be worth more or less than their original cost. Current performance may be lower or higher than the performance data quoted. You may obtain performance data current to the most recent month-end at http://brettonfund.com or by calling 800.231.2901.
All returns include change in share prices, reinvestment of any dividends, and capital gains distributions. Indices shown are broad-based, unmanaged indices commonly used to measure performance of US stocks. These indices do not incur expenses and are not available for investment. The fund’s expense ratio is 1.35% (effective January 1, 2020).The fund’s principal underwriter is Rafferty Capital Markets, LLC.
1
4th Quarter
The market kept up its surge in the fourth quarter, with almost all of our holdings increasing in value. The biggest contributor to the fund was Google, which added 1.6% to performance. Ross Stores and JPMorgan each added 1.3% .
The main laggard was S&P Global, which took off 0.3% from performance. The company announced a large acquisition of another market-data provider, which may have dampened its share price. While we’re generally skeptical of mega mergers, we’re optimistic this will turn out well for the company. We bought more shares during the quarter.
We parted with Discovery Communications in the fourth quarter. We were originally attracted to its loyal fan base, high cash flows, and cheap stock. While Discovery retains those attributes, we’ve become less optimistic that Discovery will find a home in the new media ecosystem as lucrative as its old one. As people cut the cable cord, they are re-bundling content from various providers like Netflix and Disney, but media companies without enough “must have” content risk being left behind. Discovery recently launched its own streaming service, discovery+, but people only want to subscribe to so many services. By last quarter, it was only a 2% position, but it was still a drag on our returns. We recognized a loss of 36.6% on the investment, -9.3% on an annualized basis.
Contributors to Performance for 2020
Our largest holding remains Google (aka Alphabet), so its stock-price performance—good or bad—is often going to have the largest impact on performance. Its stock did well this year, which contributed 2.8% to the fund’s 2020 performance. Progressive, which benefited from fewer people driving during the pandemic and thus fewer accidents, contributed 1.9% . Microsoft, another Covid-19 beneficiary, contributed 1.8% . Railroad operator Canadian Pacific, which continues to grow revenue and cut costs, added 1.7% .
The three main clunkers this year were companies that we have since parted with, albeit too late in hindsight: Wells Fargo, -2.2%; Discovery, -1.1%; and Carter’s, -0.9% . Armanino Foods took off 0.5% from performance as many restaurants closed, though we remain optimistic the company will do just fine in the imminent post-vaccine world.
2
Taxes
The fund issued a long-term capital gain dividend of $0.126701 per share to shareholders on December 18, 2020, which amounted to 0.3% of the fund’s NAV. We continue to have a very small tax burden given our low portfolio turnover.
| Portfolio | | |
| |
| Security | % of Net Assets | |
| Alphabet, Inc. | 10.2% | |
| MasterCard, Inc. | 6.8% | |
| Union Pacific Corp. | 6.5% | |
| The Progressive Corporation | 5.5% | |
| Microsoft Corporation | 5.4% | |
| Ross Stores, Inc. | 5.4% | |
| JPMorgan Chase & Co. | 5.4% | |
| Canadian Pacific Railway Limited | 5.2% | |
| American Express Co. | 5.2% | |
| Visa, Inc. | 5.2% | |
| The TJX Companies Inc. | 5.1% | |
| NVR, Inc. | 5.0% | |
| Bank of America Corp. | 4.8% | |
| AutoZone, Inc. | 4.8% | |
| UnitedHealth Group Incorporated | 4.6% | |
| S&P Global, Inc. | 4.6% | |
| Berkshire Hathaway, Inc. | 3.5% | |
| PerkinElmer, Inc. | 3.2% | |
| Armanino Foods of Distinction, Inc. | 1.3% | |
| Cash* | 2.1% | |
* Cash represents cash and other assets in excess of liabilities.
Technology
Google (aka Alphabet) was one of our best performing stocks last year, returning 30.9%, while its earnings per share increased 19%. As lockdowns first went into place in the spring, many advertisers hit pause on their campaigns, waiting—like a lot of us—to see what the world would look like. And then—like a lot of us—advertisers adjusted. Travel companies cut back their campaigns, while ads for other goods, like athleisure wear and video games, picked up the slack. Google had a rough second quarter, but was back in the swing of things by the next quarter.
Microsoft’s stock also had a great year, returning 42.4% on increased earnings per share of 30%. The main driver of their growth in recent years is their cloud computing business, and while it did see a bump in demand as office workers went remote, most of the growth is from the continued shift of corporate computing systems to “the cloud.” We think this shift is still in its early stages.
While consumers resumed much of their spending by summer, what and how they used their Visas and Mastercards changed. For obvious reasons, people shifted to contactless payments—one of the Covid-era changes we think is permanent—and replaced travel purchases with online shopping and food delivery. Consumers spent more on their debit cards and less on their credit cards; Visa and Mastercard make more per transaction on the latter. They also make more on cross-border transactions that come mostly from international travel, which ground to a halt early in the pandemic. Visa’s and Mastercard’s earnings per share fell by 7% and 16%, respectively, compared to their usual mid-teens
3
growth. We’re not too worried, and we think they’ll catch up nicely in the post-vaccine world. Visa’s stock returned 17.1% and Mastercard’s 20.2% .
Consumer
Not surprisingly, Ross and TJX were among the hardest hit in our portfolio. In spring, almost all of their stores were closed. As health officials found that masks and distancing could significantly reduce transmission, the stores were able to reopen and continue operating during the recent winter surges. We estimate earnings per share declined roughly 80% for both companies. Most of the losses came from the second-quarter shutdowns, yet by the third quarter, sales were roughly the same as pre-crisis levels, which was honestly a little surprising to us. People really love their off-price apparel. Ross’s stock returned 5.8% and TJX’s 12.3% .
Homebuilder NVR’s stock dropped much more than the rest of the market as conventional wisdom held that an economic collapse wouldn’t exactly set the housing market on fire. But that’s exactly what happened. As the economy held up better than expected with government help, families flocked to the suburbs looking for new homes with more space and took advantage of working from home. Single-family home construction is booming, inventories are at an all-time low, and homebuilders can’t build houses fast enough. As we’ve discussed a number of times, there is a structural shortage of homes in the US, and we expect there to be many years of growth ahead for NVR, even post-Covid. Its stock returned 7.1%, and earnings per share grew 4%.
Like all retailers, AutoZone saw its sales drop sharply at the beginning of the lockdown, but since most of AutoZone’s sales are nondiscretionary (think spark plugs and brake pads), sales rebounded quite quickly. Earnings per share increased 13%, while the stock returned -0.5% .
Armanino Foods really struggled last year as so many of its food-service customers, like cafeterias, remain shut down. It hasn’t announced its 2020 earnings yet; they’re on track for a decline of over 50%. The total return from the stock was -24.9% .
Financials
After a strong performance in 2019, we wrote this about our bank stocks in last year’s report: “There will be another recession sooner than later, and our banks will see larger loans losses, but we think this is more than priced into the stock, and our banks are well reserved for that eventuality.” Little did we know “sooner” really meant “a few weeks from now.” Despite the economic shock, the banks still have huge capital cushions that can absorb large loan losses. Our remaining bank investments, JPMorgan and Bank of America, increased their reserves significantly at the beginning of the Covid-19 crisis in anticipation of imminent loan defaults, but with the government stimulus and perhaps a more resilient economy than many would have guessed, actual loan losses are up only slightly. They might happen later in 2021, but with an additional stimulus package and the vaccine rolling out, the large-scale losses may not be as bad as most people predicted. The bigger drag on the banks’ earnings power is lower rates, which in our opinion will persist for a long time. Despite this drag, we estimate both JPMorgan and Bank of America will continue to grow revenue and earnings over the next few years, while we believe their stocks remain bargains in a somewhat expensive market. JPMorgan’s earnings per share declined 17% last year, and its stock returned -5.5% . Bank of America’s earnings, which are more sensitive to interest rates, were down 32%, and its stock returned -11.6% .
American Express has elements of both a bank (it extends credit card loans) and a payments processor (most of its revenue is fees from cardholders and merchants) and
4
was hit pretty hard by Covid-19, though we expect most of the impact will be transitory. It has a relatively diversified customer base overall, but a meaningful portion of its card activity is from business travel, which…there wasn’t a lot of last year. Similar to the banks, American Express recognized loan losses in anticipation of large defaults, though it’s not clear all of that will come to pass. Its stock returned -1.1%, while earnings per share were down 53%.
Progressive was one of the few companies that benefited significantly from lockdowns. People drove less and got into fewer accidents, but kept paying their car insurance bills. Like most of the major auto insurers, Progressive kicked some of those gains back to customers through rebates, but still increased earnings per share by 42%, leading to a 41.5% return for the stock. And in the mirror image of the banks, those excess gains will revert once drivers are on the roads again.
Bond rating agency and new holding S&P Global was also a Covid-19 beneficiary, as companies issued a record amount of debt given low rates and the desire for cash to bridge through the crisis. Earnings per share increased 23%, and we are up 23.8% so far on the investment.
Industrials
Union Pacific and Canadian Pacific saw their rail traffic rebound by the end of the year and are now seeing higher volume from pent-up shipping demand. Union Pacific’s earnings were essentially flat from 2019, while its stock returned 17.6% . Canadian Pacific managed an 8% increase in earnings per share, while its stock returned 34.7% .
Berkshire Hathaway’s wide collection of businesses held up okay last year, though its stock trailed the market with a modest 2.4% return. Book value per share, the most relevant metric for Berkshire, increased an estimated 9%, while the ratio of its stock price to book value remains quite low compared to its historical average. While owning good, cash-generating businesses at reasonable prices can be decidedly uncool in a soaring market, history suggests that this works out well in the long run.
Healthcare
There may be no better example of the strangeness of our healthcare system than the performance of the largest health insurer in the middle of a pandemic that has killed 400,000 Americans. UnitedHealth’s earnings increased 12%, from $15.11/share to $16.88/share, as foregone medical care more than outweighed the costs of coronavirus treatment. Meanwhile, after a year that began with the two major political parties offering vastly different views of the healthcare landscape, from eliminating private health insurance to eliminating Medicaid, we elected a divided government with other priorities and a general tendency to make only marginal changes to the existing ecosystem. UnitedHealth returned 27.1% during our partial year of ownership, and we expect it to have a strong 2021 as employers resume hiring and Medicare Advantage continues to grow in popularity.
PerkinElmer
PerkinElmer is a laboratory testing equipment company with two major lines of business: Diagnostics and Discovery & Analytical (DAS). Both have broadly similar business models where PerkinElmer sells a piece of capital equipment and then monetizes a long stream of consumables purchases by customers; 70% of the revenue and the overwhelming majority of the operating income come from these consumables purchases.
5
The Diagnostic division focuses on the identification of diseases. For obvious reasons, this year the business was dominated by Covid-19, with PerkinElmer generating over $1 billion in revenue selling the most accurate coronavirus tests in the US. Crucially, this was accompanied by the installation of nearly two thousand testing machines; while Covid-19 may go away, we expect the testing machines to stay busy for years to come running other tests. Labs tend to use their tools. The company’s portfolio as a whole offers 500 tests, largely clustered in autoimmune, allergy, and infectious diseases. Diagnostics also houses the legacy core of the company, which is the prenatal screening franchise; PerkinElmer is the leader in noninvasive prenatal testing (NIPT), which uses fragments of fetal DNA found in the mother’s bloodstream to test for genetic disorders. We expect demand for NIPT to increase substantially after the American College of Gynecology’s decision in September 2020 to endorse NIPT for all pregnant women as the “standard of care”; commercial insurers have historically denied reimbursement to women under the age of 35.
The DAS business is similar to Diagnostics, except that instead of providing tests that will be used to identify conditions in people, it provides tests that are used to identify conditions in processes. The bulk of its business is with pharma companies, where it sells tests for all steps in the drug development and manufacturing processes. (A researcher might use a PerkinElmer test to identify antibodies in a sample, while a production engineer might use very different tests to check for contaminants in a manufacturing process.) Smaller portions of DAS sell into the food and cannabis industries.
Setting aside the Covid-19 windfall, we expect PKI to earn about $7/share on a sustainable basis. We own it for a little more than 20 times earnings and are up 13.9% so far.
Investments Initiated in 2020
PerkinElmer
S&P Global
UnitedHealth |
Investments Exited in 2020, Internal Rate of Return
Carter’s, 5.5%
Continental Building Products, 18.5%
Discovery Communications, -9.3%
Wells Fargo, -1.8%
Investing Climate
The financial markets’ story of the year was exuberance. In the face of a pandemic, the US government unleashed so much fiscal and monetary stimulus that household balance sheets are better today than they were a year ago. Stocks are up, real estate is up, lucky-number schemes that call themselves “blockchain” are up. In most cases, the riskier the better.
Is this exuberance rational? We don’t know for sure. When Alan Greenspan famously described the market as “irrationally exuberant” in December 1996, the S&P 500 was 744. It went down on the day of his speech, then up to 1,522 in March of 2000, and on a total return basis, never came back to Greenspan’s irrational level. While the market of 1996 was expensive in terms of the preceding years, it turned out to be quite inexpensive based on what the future would offer.
6
At the same time, price matters, even for quality companies with fantastic prospects. Take Microsoft, perhaps the most successful American company of the last half century. In early 2000, Microsoft was generating about $8 billion in net income on $20 billion in revenue. The leading software analyst at the time projected that revenue growth would slow from nearly 30% in 1999 to closer to 6% as PC shipments slowed. He told investors not to worry about the slowing growth, and he had a “buy” rating on the stock. His projections ended up being too conservative, and today the company generates almost $50 billion of net income on $150 billion in revenue. But the advice to buy? From a peak of $56 (split-adjusted) in early 2000, Microsoft stock fell to $23 by the end of that year. In 2009, Microsoft’s only year of revenue contraction, it traded for $15, having lost 73% of its value despite tripling its revenue and doubling its net income. It would not reach its 2000 peak again until 2016 (16 years!), at which point it quadrupled the next four years. Put slightly differently, it went from trading for 30x revenues to 3x revenues to 11x revenues.
There are exceptional companies for sale in today’s market. At zero interest rates, maybe there is no time value of money and it is impossible to pay too much for growth. At the risk of being prisoners of our history, we don’t think this will persist over time. We think capital will generally be cheaper in the future than it has been in the past—and we can see the logic that this means prices should generally be higher—but we still think our investments need to combine elements of strategic relevance, business growth, profitability, and prices that account for an uncertain future. As it happened, we did not weigh these factors properly for last year’s market activity. We were insufficiently exuberant. We expect that discipline will work for us over a longer time frame.
As always, thank you for investing.
Stephen Dodson
Portfolio Manager | Raphael de Balmann
Portfolio Manager |
7
Bretton Fund by Sectors
(as a percentage of Net Assets)
(Unaudited)
December 31, 2020 |
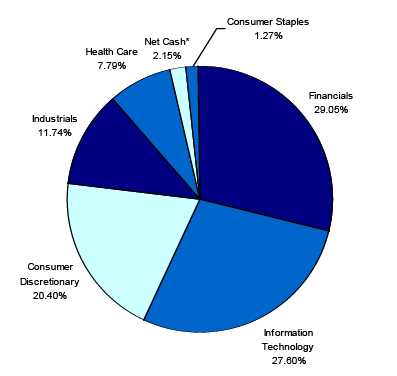
* Net Cash represents cash and other assets in excess of liabilities.
8
| Bretton Fund |
| | | | | | | Schedule of Investments |
| | | | | | | December 31, 2020 |
| Shares | | Cost | | Fair Value | | % of Net Assets |
| COMMON STOCKS | | | | | | | | |
| | | | | | | |
| Canned, Frozen & Preserved Fruit, Vegetables & Food Specialties | | | | | | |
| 245,430 | Armanino Foods of Distinction, Inc. | $ | 241,491 | | $ | 623,392 | | 1.27 | % |
| Finance Services | | | | | | | | |
| 21,100 | American Express Company | | 1,585,155 | | | 2,551,201 | | 5.20 | % |
| Fire, Marine & Casualty Insurance | | | | | | | | |
| 7,500 | Berkshire Hathaway Inc. - Class B * | | 1,116,560 | | | 1,739,025 | | | |
| 27,500 | The Progressive Corporation | | 1,807,417 | | | 2,719,200 | | | |
| | | | 2,923,977 | | | 4,458,225 | | 9.08 | % |
| Hospital & Medical Service Plans | | | | | | | | |
| 6,400 | UnitedHealth Group Incorporated | | 1,784,645 | | | 2,244,352 | | 4.57 | % |
| Laboratory Analytical Instruments | | | | | | | | |
| 11,000 | PerkinElmer, Inc. | | 1,385,326 | | | 1,578,500 | | 3.22 | % |
| National Commercial Banks | | | | | | | | |
| 78,400 | Bank of America Corporation | | 1,323,375 | | | 2,376,304 | | | |
| 20,800 | JPMorgan Chase & Co. | | 1,346,779 | | | 2,643,056 | | | |
| | | | 2,670,154 | | | 5,019,360 | | 10.22 | % |
| Operative Builders | | | | | | | | |
| 600 | NVR, Inc. * | | 1,692,500 | | | 2,447,916 | | 4.99 | % |
| Railroad, Line-Haul Operating | | | | | | | | |
| 7,400 | Canadian Pacific Railway Limited (Canada) | | 1,162,494 | | | 2,565,506 | | | |
| 15,350 | Union Pacific Corporation | | 1,243,056 | | | 3,196,177 | | | |
| | | | 2,405,550 | | | 5,761,683 | | 11.74 | % |
| Retail - Auto & Home Supply Stores | | | | | | | | |
| 2,000 | AutoZone, Inc. * | | 1,416,158 | | | 2,370,880 | | 4.83 | % |
| Retail - Family Clothing Stores | | | | | | | | |
| 21,700 | Ross Stores Inc. | | 519,491 | | | 2,664,977 | | | |
| 37,000 | The TJX Companies, Inc. | | 1,387,519 | | | 2,526,730 | | | |
| | | | 1,907,010 | | | 5,191,707 | | 10.58 | % |
| Services - Business Services, NEC | | | | | | | | |
| 9,380 | MasterCard Incorporated - Class A | | 849,356 | | | 3,348,097 | | | |
| 11,600 | Visa Inc. - Class A | | 962,813 | | | 2,537,268 | | | |
| | | | 1,812,169 | | | 5,885,365 | | 11.99 | % |
| Services - Computer Processing & Data Preparation | | | | | | | | |
| 2,850 | Alphabet Inc. - Class C * | | 2,082,582 | | | 4,992,858 | | 10.17 | % |
| Services - Consumer Credit Reporting, Collection Agencies | | | | | | | | |
| 6,800 | S&P Global Inc. * | | 1,811,661 | | | 2,235,364 | | 4.55 | % |
| Services - Prepackaged Software | | | | | | | | |
| 12,000 | Microsoft Corporation | | 1,828,314 | | | 2,669,040 | | 5.44 | % |
| Total for Common Stocks | $ | 25,546,692 | | $ | 48,029,843 | | 97.85 | % |
| Total Investments | $ | 25,546,692 | | $ | 48,029,843 | | | |
| Other Assets in Excess of Liabilities | | | | $ | 1,054,918 | | 2.15 | % |
| Net Assets | | | | | $ | 49,084,761 | | 100.00 | % |
| | * Non-Income Producing Securities.
The accompanying notes are an integral part of these financial statements. |
9
| Bretton Fund | | | |
| |
| Statement of Assets and Liabilities | | | |
| December 31, 2020 | | | |
| |
| Assets: | | | |
| Investments at Fair Value | $ | 48,029,843 | |
| (Cost $25,546,692) | | | |
| Cash | | 1,099,826 | |
| Dividend Receivable | | 9,801 | |
| Total Assets | | 49,139,470 | |
| Liabilities: | | | |
| Payable to Adviser (Note 4) | | 54,709 | |
| Total Liabilities | | 54,709 | |
| Net Assets | $ | 49,084,761 | |
| |
| Net Assets Consist of: | | | |
| Paid In Capital | $ | 26,601,610 | |
| Total Distributable Earnings | | 22,483,151 | |
| Net Assets, for 1,117,426 Shares Outstanding | $ | 49,084,761 | |
| (Unlimited shares authorized) | | | |
| Net Asset Value, Offering Price and Redemption Price Per Share | | | |
| ($49,084,761/1,117,426 shares) | $ | 43.93 | |
| |
| Statement of Operations | | | |
| For the fiscal year ended December 31, 2020 | | | |
| |
| Investment Income: | | | |
| Dividends (Net of foreign withholding taxes and fees of $2,841) | $ | 440,613 | |
| Total Investment Income | | 440,613 | |
| Expenses: | | | |
| Management Fees (Note 4) | | 562,396 | |
| Total Expenses | | 562,396 | |
| |
| Net Investment Income (Loss) | | (121,783 | ) |
| |
| Realized and Unrealized Gain (Loss) on Investments: | | | |
| Realized Gain (Loss) on Investments | | 141,118 | |
| Net Change in Unrealized Appreciation (Depreciation) on Investments | | 4,000,549 | |
| Net Realized and Unrealized Gain (Loss) on Investments | | 4,141,667 | |
| |
| Net Increase (Decrease) in Net Assets from Operations | $ | 4,019,884 | |
The accompanying notes are an integral part of these financial statements.
10
| Bretton Fund |
| | |
| Statements of Changes in Net Assets | | | | | | | | |
| | | 1/1/2020 | | | | 1/1/2019 | | |
| | | to | | | | to | | |
| | | 12/31/2020 | | | | 12/31/2019 | | |
| From Operations: | | | | | | | | |
| Net Investment Income (Loss) | $ | (121,783 | ) | | $ | (82,169 | ) | |
| Net Realized Gain (Loss) on Investments | | 141,118 | | | | - | | |
| Net Change in Unrealized Appreciation (Depreciation) on Investments | | 4,000,549 | | | | 10,730,898 | | |
| Increase (Decrease) in Net Assets from Operations | | 4,019,884 | | | | 10,648,729 | | |
| | |
| From Distributions to Shareholders: | | (141,118 | ) | | | - | | |
| | |
| From Capital Share Transactions: | | | | | | | | |
| Proceeds From Sale of Shares | | 3,117,395 | | | | 3,658,038 | | |
| Shares Issued on Reinvestment of Distributions | | 141,118 | | | | - | | |
| Cost of Shares Redeemed | | (104,118 | ) | | | (271,823 | ) | |
| Net Increase (Decrease) from Shareholder Activity | | 3,154,395 | | | | 3,386,215 | | |
| | |
| Net Increase (Decrease) in Net Assets | | 7,033,161 | | | | 14,034,944 | | |
| | |
| Net Assets at Beginning of Year | | 42,051,600 | | | | 28,016,656 | | |
| Net Assets at End of Year | $ | 49,084,761 | | | $ | 42,051,600 | | |
| | |
| Share Transactions: | | | | | | | | |
| Issued | | 81,988 | | | | 109,142 | | |
| Reinvested | | 3,287 | | | | - | | |
| Redeemed | | (2,732 | ) | | | (7,936 | ) | |
| Net Increase (Decrease) in Shares | | 82,543 | | | | 101,206 | | |
| Shares Outstanding Beginning of Year | | 1,034,883 | | | | 933,677 | | |
| Shares Outstanding End of Year | | 1,117,426 | | | | 1,034,883 | | |
| Financial Highlights | | | | | | | | | | | | | | | | | | | |
| Selected data for a share outstanding | | | | | | | | | | | | | | | | | | | |
| throughout the year: | | 1/1/2020 | | | | 1/1/2019 | | | | 1/1/2018 | | | | 1/1/2017 | | | | 1/1/2016 | |
| | | to | | | | to | | | | to | | | | to | | | | to | |
| | | 12/31/2020 | | | | 12/31/2019 | | | | 12/31/2018 | | | | 12/31/2017 | | | | 12/31/2016 | |
| Net Asset Value - | | | | | | | | | | | | | | | | | | | |
| Beginning of Year | $ | 40.63 | | | $ | 30.01 | | | $ | 30.87 | | | $ | 26.12 | | | $ | 23.98 | |
| Net Investment Income (Loss) (a) | | (0.11 | ) | | | (0.08 | ) | | | (0.14 | ) | | | (0.14 | ) | | | (0.11 | ) |
| Net Gain (Loss) on Investments | | | | | | | | | | | | | | | | | | | |
| (Realized and Unrealized) | | 3.54 | | | | 10.70 | | | | (0.46 | ) | | | 4.89 | | | | 2.68 | |
| Total from Investment Operations | | 3.43 | | | | 10.62 | | | | (0.60 | ) | | | 4.75 | | | | 2.57 | |
| |
| Distributions (From Net Investment Income) | | - | | | | - | | | | - | | | | - | | | | - | |
| Distributions (From Realized Capital Gains) | | (0.13 | ) | | | - | | | | (0.26 | ) | | | - | | | | (0.43 | ) |
| Total Distributions | | (0.13 | ) | | | - | | | | (0.26 | ) | | | - | | | | (0.43 | ) |
| |
| Net Asset Value - | | | | | | | | | | | | | | | | | | | |
| End of Year | $ | 43.93 | | | $ | 40.63 | | | $ | 30.01 | | | $ | 30.87 | | | $ | 26.12 | |
| Total Return (b) | | 8.44 | % | | | 35.39 | % | | | (1.94 | )% | | | 18.19 | % | | | 10.68 | % |
| Ratios/Supplemental Data | | | | | | | | | | | | | | | | | | | |
| Net Assets - End of Period (Thousands) | $ | 49,085 | | | $ | 42,052 | | | $ | 28,017 | | | $ | 30,716 | | | $ | 24,657 | |
| Ratio of Expenses to Average Net Assets | | 1.35 | % | | | 1.50 | % | | | 1.50 | % | | | 1.50 | % | | | 1.50 | % |
| Ratio of Net Investment Income (Loss) to | | | | | | | | | | | | | | | | | | | |
| Average Net Assets | | -0.29 | % | | | -0.23 | % | | | -0.45 | % | | | -0.53 | % | | | -0.47 | % |
| Portfolio Turnover Rate | | 14.51 | % | | | 0.00 | % | | | 11.40 | % | | | 10.81 | % | | | 16.27 | % |
(a) Per share amounts were calculated using the average shares method.
(b) Total return represents the rate that the investor would have earned or lost on an
in the Fund assuming reinvestment of dividends and distributions.
The accompanying notes are an integral part of these financial statements. |
11
Notes to Financial Statements
Bretton Fund
December 31, 2020
1.) ORGANIZATION
Bretton Fund (the “Fund”) was organized as a non-diversified series of the PFS Funds (the “Trust”) on September 21, 2010. The Trust was established under the laws of Massachusetts by an Agreement and Declaration of Trust dated January 13, 2000, which was amended and restated January 20, 2011. The Trust is registered as an open-end investment company under the Investment Company Act of 1940, as amended. The Trust may offer an unlimited number of shares of beneficial interest in a number of separate series, each series representing a distinct fund with its own investment objectives and policies. As of December 31, 2020, there were thirteen series authorized by the Trust. The Fund commenced operations on September 30, 2010. The Fund’s investment objective is to seek long-term capital appreciation. The investment adviser to the Fund is Bretton Capital Management, LLC (the “Adviser”).
2.) SIGNIFICANT ACCOUNTING POLICIES
The Fund is an investment company and accordingly follows the investment company accounting and reporting guidance of the Financial Accounting Standards Board (“FASB”) Accounting Standards Codification Topic 946 Financial Services - Investment Companies. The financial statements are prepared in conformity with accounting principles generally accepted in the United States of America (“GAAP”). The Fund follows the significant accounting policies described in this section.
SECURITY VALUATION:
All investments in securities are recorded at their estimated fair value, as described in Note 3.
SHARE VALUATION:
The net asset value (the “NAV”) is generally calculated as of the close of trading on the New York Stock Exchange (the “Exchange”) (normally 4:00 p.m. Eastern time) every day the Exchange is open. The NAV is calculated by taking the total value of the Fund’s assets, subtracting its liabilities, and then dividing by the total number of shares outstanding, rounded to the nearest cent. The offering price and redemption price per share are equal to the net asset value per share.
FEDERAL INCOME TAXES:
The Fund’s policy is to continue to comply with the requirements of the Internal Revenue Code that are applicable to regulated investment companies and to distribute all of its taxable income to shareholders. Therefore, no federal income tax provision is required. It is the Fund’s policy to distribute annually, prior to the end of the calendar year, dividends sufficient to satisfy excise tax requirements of the Internal Revenue Code. This Internal Revenue Code requirement may cause an excess of distributions over the book year-end accumulated income. In addition, it is the Fund’s policy to distribute annually, after the end of the fiscal year, any remaining net investment income and net realized capital gains.
The Fund recognizes the tax benefits of certain tax positions only where the position is “more likely than not” to be sustained assuming examination by tax authorities. Management has analyzed the Fund’s tax positions, and has concluded that no liability for unrecognized tax benefits should be recorded related to uncertain tax positions taken on returns filed for open tax years. The Fund identifies its major tax jurisdictions as U.S. Federal and Massachusetts tax authorities; however, the Fund is not aware of any tax positions for which it is reasonably possible that the total amounts of unrecognized tax benefits will change materially in the next 12 months. The Fund recognizes interest and penalties, if any, related to unrecognized tax benefits as income tax expense in the Statement of Operations. During the fiscal year ended December 31, 2020, the Fund did not incur any interest or penalties.
DISTRIBUTIONS TO SHAREHOLDERS:
Distributions to shareholders, which are determined in accordance with income tax regulations, are recorded on the ex-dividend date.
12
Notes to Financial Statements - continued
The treatment for financial reporting purposes of distributions made to shareholders during the period from net investment income or net realized capital gains may differ from their ultimate treatment for federal income tax purposes. These differences are caused primarily by differences in the timing of the recognition of certain components of income, expense, or realized capital gain for federal income tax purposes. Where such differences are permanent in nature, they are reclassified in the components of the net assets based on their ultimate characterization for federal income tax purposes. Any such reclassifications will have no effect on net assets, results of operations, or net asset value per share of the Fund.
USE OF ESTIMATES:
The financial statements are prepared in accordance with GAAP, which requires management to make estimates and assumptions that affect the reported amounts of assets and liabilities and disclosure of contingent assets and liabilities at the date of the financial statements and the reported amounts of increases and decreases in net assets from operations during the reporting period. Actual results could differ from those estimates.
EXPENSES:
Expenses incurred by the Trust that do not relate to a specific fund of the Trust are allocated to the individual funds based on each fund’s relative net assets or another appropriate basis.
CASH:
The Fund maintains cash at its custodian which, at times, may exceed United States federally insured limits.
OTHER:
The Fund records security transactions based on the trade date. Dividend income is recognized on the ex-dividend date. Interest income, if any, is recognized on an accrual basis. The Fund uses the specific identification method in computing gain or loss on sales of investment securities. Withholding taxes on foreign dividends have been provided for in accordance with the Fund’s understanding of the applicable country’s tax rules and rates.
3.) SECURITIES VALUATIONS
As described below, the Fund utilizes various methods to measure the fair value of most of its investments on a recurring basis. GAAP establishes a hierarchy that prioritizes inputs to valuation methods. The three levels of inputs are:
Level 1 - Unadjusted quoted prices in active markets for identical assets or liabilities that the Fund has the ability to access.
Level 2 - Observable inputs other than quoted prices included in level 1 that are observable for the asset or liability, either directly or indirectly. These inputs may include quoted prices for the identical instrument in an inactive market, prices for similar instruments, interest rates, prepayment speeds, credit risk, yield curves, default rates, and similar data.
Level 3 - Unobservable inputs for the asset or liability, to the extent relevant observable inputs are not available, representing the Fund’s own assumptions about the assumptions a market participant would use in valuing the asset or liability, and would be based on the best information available.
The availability of observable inputs can vary from security to security and is affected by a wide variety of factors, including, for example, the type of security, whether the security is new and not yet established in the marketplace, the liquidity of markets, and other characteristics particular to the security. To the extent that valuation is based on models or inputs that are less observable or unobservable in the market, the determination of fair value requires more judgment. Accordingly, the degree of judgment exercised in determining fair value is greatest for instruments categorized in level 3.
The inputs used to measure fair value may fall into different levels of the fair value hierarchy. In such cases, for disclosure purposes, the level in the fair value hierarchy within which the fair value measurement falls in its entirety, is determined based on the lowest level input that is significant to the fair value measurement in its entirety.
13
Notes to Financial Statements - continued
FAIR VALUE MEASUREMENTS
A description of the valuation techniques applied to the Fund’s major categories of assets and liabilities measured at fair value on a recurring basis follows.
Equity securities (common stocks). Equity securities generally are valued by using market quotations, but may be valued on the basis of prices furnished by a pricing service when the Adviser believes such prices accurately reflect the fair value of such securities. Securities that are traded on any stock exchange or on the NASDAQ over-the-counter market are generally valued by the pricing service at the last quoted sale price. Lacking a last sale price, an equity security is generally valued by the pricing service at its last bid price. Generally, if the security is traded in an active market and is valued at the last sale price, the security is categorized as a level 1 security, and if an equity security is valued by the pricing service at its last bid, it is generally categorized as a level 2 security. When market quotations are not readily available, when the Adviser determines that the market quotation or the price provided by the pricing service does not accurately reflect the current fair value, or when restricted securities are being valued, such securities are valued as determined in good faith by the Adviser, subject to review of the Board of Trustees (the “Trustees” or the “Board”) and are categorized in level 2 or level 3, when appropriate.
In accordance with the Trust’s good faith pricing guidelines, the Adviser is required to consider all appropriate factors relevant to the value of securities for which it has determined other pricing sources are not available or reliable as described above. There is no single standard for determining fair value controls, since fair value depends upon the circumstances of each individual case. As a general principle, the current fair value of an issue of securities being valued by the Adviser would appear to be the amount which the owner might reasonably expect to receive for them upon their current sale. Methods which are in accordance with this principle may, for example, be based on (i) a multiple of earnings; (ii) a discount from market of a similar freely traded security (including a derivative security or a basket of securities traded on other markets, exchanges or among dealers); or (iii) yield to maturity with respect to debt issues, or a combination of these and other methods.
The following table summarizes the inputs used to value the Fund’s assets measured at fair value as of December 31, 2020:
| Valuation Inputs of Assets | | Level 1 | | Level 2 | | Level 3 | | Total |
| Common Stocks | | $48,029,843 | | $0 | | $0 | | $48,029,843 |
| Total Investments in Securities | | $48,029,843 | | $0 | | $0 | | $48,029,843 |
The Fund did not hold any Level 3 assets during the fiscal year ended December 31, 2020.
The Fund did not invest in derivative instruments during the fiscal year ended December 31, 2020.
4.) INVESTMENT ADVISORY AGREEMENT AND RELATED PARTY TRANSACTIONS
The Fund has entered into an investment advisory agreement (“Management Agreement”) with the Adviser. The Adviser manages the investment portfolio of the Fund, subject to policies adopted by the Trust’s Board of Trustees, and, at its own expense and without reimbursement from the Fund, furnishes office space and all necessary office facilities, equipment, and executive personnel necessary for managing the Fund. The Adviser pays the expenses of the Fund except for the management fee, all brokerage fees and commissions, taxes, borrowing costs (such as (a) interest and (b) dividend expenses on securities sold short), fees and expenses of acquired funds, extraordinary or non-recurring expenses as may arise, including litigation to which the Fund may be a party and indemnification of the Trust’s Trustees and officers with respect thereto. For its services, effective January 1, 2020, the Adviser receives a management fee equal to 1.35% of the average daily net assets of the Fund. Prior to January 1, 2020 the Adviser received a management fee equal to 1.50% of the average daily net assets of the Fund.
For the fiscal year ended December 31, 2020, the Adviser earned management fees totaling $562,396, of which $54,709 was due to the Adviser at December 31, 2020.
14
Notes to Financial Statements - continued
5.) RELATED PARTY TRANSACTIONS
Mr. Jeffrey R. Provence of Premier Fund Solutions, Inc. (the “Administrator”) also serves as trustee/officer of the Fund. This individual receives benefits from the Administrator resulting from administration fees paid to the Administrator of the Fund by the Adviser.
The Trustees who are not interested persons of the Trust each received $1,500, for a total of $4,500, in Trustees’ fees plus travel and related expenses related to the Bretton Fund for the fiscal year ended December 31, 2020. Under the Management Agreement, the Adviser pays these fees.
6.) PURCHASES AND SALES OF SECURITIES
For the fiscal year ended December 31, 2020, purchases and sales of investment securities other than U.S. Government obligations and short-term investments aggregated $7,821,305 and $5,764,242, respectively. Purchases and sales of U.S. Government obligations aggregated $0 and $0, respectively.
7.) CONTROL OWNERSHIP
The beneficial ownership, either directly or indirectly, of more than 25% of the voting shares of a fund creates a presumption of control of the fund, under Section 2(a)(9) of the Investment Company Act of 1940. As of December 31, 2020, YDB LLC, beneficially held, in aggregate, approximately 30.04% of the Fund and Thao Dodson, held, in aggregate, approximately 36.95% of the Fund and therefore, each may be deemed to control the Fund.
8.) TAX MATTERS
For Federal income tax purposes, the cost of investments owned at December 31, 2020, was $25,546,692. At December 31, 2020, the composition of unrealized appreciation (the excess of value over tax cost) and depreciation (the excess of tax cost over value) was as follows:
| | Appreciation | | (Depreciation) | | Net Appreciation (Depreciation) |
| | $22,499,998 | | ($16,847) | | $22,483,151 |
The tax character of distributions was as follows:
| | | 2020 | | | 2019 | |
| Ordinary Income . | | $ -0- | | | $ -0- | |
| Long-Term Capital Gain | | 141,118 | | | -0- | |
| | | $ 141,118 | | | $ -0- | |
As of December 31, 2020, the components of distributable earnings (accumulated losses) on a tax basis were as follows:
| Unrealized appreciation (depreciation) | | $22,483,151 |
| Total distributable earnings | | $22,483,151 |
As of December 31, 2020, there are no differences between book basis and tax basis unrealized appreciation.
As of December 31, 2020, total distributable earnings was increased by $121,783 and paid in capital was decreased by $121,783. The adjustment was primarily related to the reclassification of net operating loss.
9.) CONCENTRATION OF SECTOR RISK
If the Fund has significant investments in the securities of issuers in industries within a particular sector, any development affecting that sector will have a greater impact on the value of the net assets of the Fund than would be the case if the Fund did not have significant investments in that sector. In addition, this may increase the risk of loss of an investment in the Fund and increase the volatility of the Fund’s NAV per share. From time to time, circumstances may affect a particular sector and the companies within such sector. For instance, economic or market factors, regulation or deregulation, and technological or other developments may negatively impact all
15
companies in a particular sector and therefore the value of a Fund’s portfolio will be adversely affected. As of December 31, 2020, the Fund had 29.05% and 27.60% of the value of its net assets invested in stocks within the Financials and Information Technology sectors, respectively.
10.) COVID-19 RISKS
Unexpected local, regional or global events, such as war; acts of terrorism; financial, political or social disruptions; natural, environmental or man-made disasters; the spread of infectious illnesses or other public health issues; and recessions and depressions could have a significant impact on the Fund and its investments and may impair market liquidity. Such events can cause investor fear, which can adversely affect the economies of nations, regions and the market in general, in ways that cannot necessarily be foreseen. An outbreak of infectious respiratory illness known as COVID-19, which is caused by a novel coronavirus (SARS-CoV-2), was first detected in China in December 2019 and subsequently spread globally. This coronavirus has resulted in, among other things, travel restrictions, closed international borders, enhanced health screenings at ports of entry and elsewhere, disruption of and delays in healthcare service preparation and delivery, prolonged quarantines, significant disruptions to business operations, market closures, cancellations and restrictions, supply chain disruptions, lower consumer demand, and significant volatility and declines in global financial markets, as well as general concern and uncertainty. The impact of COVID-19 has adversely affected, and other infectious illness outbreaks that may arise in the future could adversely affect, the economies of many nations and the entire global economy, individual issuers and capital markets in ways that cannot necessarily be foreseen. Public health crises caused by the COVID-19 outbreak may exacerbate other pre-existing political, social and economic risks in certain countries or globally. The duration of the COVID-19 outbreak and its effects cannot be determined with certainty.
11.) SUBSEQUENT EVENTS
Subsequent events after the date of the Statement of Assets and Liabilities have been evaluated through the date the financial statements were issued. Management has concluded that there is no impact requiring adjustment to or disclosure in the financial statements.
16
REPORT OF INDEPENDENT REGISTERED PUBLIC ACCOUNTING FIRM
To the Shareholders of Bretton Fund and
Board of Trustees of PFS Funds
Opinion on the Financial Statements
We have audited the accompanying statement of assets and liabilities, including the schedule of investments, of Bretton Fund (the “Fund”), a series of PFS Funds, as of December 31, 2020, the related statement of operations for the year then ended, the statements of changes in net assets for each of the two years in the period then ended, the related notes, and the financial highlights for each of the five years in the period then ended (collectively referred to as the “financial statements”). In our opinion, the financial statements present fairly, in all material respects, the financial position of the Fund as of December 31, 2020, the results of its operations for the year then ended, the changes in net assets for each of the two years in the period then ended, and the financial highlights for each of the five years in the period then ended, in conformity with accounting principles generally accepted in the United States of America.
Basis for Opinion
These financial statements are the responsibility of the Fund’s management. Our responsibility is to express an opinion on the Fund’s financial statements based on our audits. We are a public accounting firm registered with the Public Company Accounting Oversight Board (United States) (“PCAOB”) and are required to be independent with respect to the Fund in accordance with the U.S. federal securities laws and the applicable rules and regulations of the Securities and Exchange Commission and the PCAOB.
We conducted our audits in accordance with the standards of the PCAOB. Those standards require that we plan and perform the audit to obtain reasonable assurance about whether the financial statements are free of material misstatement whether due to error or fraud.
Our audits included performing procedures to assess the risks of material misstatement of the financial statements, whether due to error or fraud, and performing procedures that respond to those risks. Such procedures included examining, on a test basis, evidence regarding the amounts and disclosures in the financial statements. Our procedures included confirmation of securities owned as of December 31, 2020, by correspondence with the custodian. Our audits also included evaluating the accounting principles used and significant estimates made by management, as well as evaluating the overall presentation of the financial statements. We believe that our audits provide a reasonable basis for our opinion.
We have served as the Fund’s auditor since 2010.

| | COHEN & COMPANY, LTD.
Milwaukee, Wisconsin
February 16, 2021 |
17
Additional Information
December 31, 2020
(Unaudited) |
1.) AVAILABILITY OF QUARTERLY SCHEDULE OF INVESTMENTS
The Fund files its complete schedule of portfolio holdings with the Securities and Exchange Commission (“SEC”) for the first and third quarters of each fiscal year on Form N-PORT. The Fund’s Form N-PORT is available on the SEC’s website at http://www.sec.gov.
2.) PROXY VOTING GUIDELINES
Bretton Capital Management, LLC, the Fund’s investment adviser (“Adviser”), is responsible for exercising the voting rights associated with the securities held by the Fund. A description of the policies and procedures used by the Adviser in fulfilling this responsibility is available without charge on the Fund’s website at www.brettonfund.com. It is also included in the Fund’s Statement of Additional Information, which is available on the SEC’s website at http://www.sec.gov.
Information regarding how the Fund voted proxies, Form N-PX, relating to portfolio securities during the most recent 12-month period ended June 30, is available without charge, upon request, by calling our toll free number (800.231.2901) . This information is also available on the SEC’s website at http://www.sec.gov.
3.) LIQUIDITY RISK MANAGEMENT PROGRAM
The Fund has adopted and implemented a written liquidity risk management program as required by Rule 22e-4 (the “Liquidity Rule”) under the Investment Company Act. The program is reasonably designed to assess and manage the Fund’s liquidity risk, taking into consideration, among other factors, the Fund’s investment strategies and the liquidity of its portfolio investments during normal and reasonably foreseeable stressed conditions; its short and long-term cash flow projections; and its cash holdings and access to other funding sources.
During the fiscal year ended December 31, 2020, the Board and the Trust’s Liquidity Program Administartor reviewed a report from the Liquidity Program Administrator and reviewed the Fund’s investments and they determined that the Fund held adequate levels of cash and highly liquid investments to meet shareholder redemption activities in accordance with applicable requirements. Accordingly, the Board concluded that (i) the Fund’s liquidity risk management program is reasonably designed to prevent violations of the Liquidity Rule and (ii) the Fund’s liquidity risk management program has been effectively implemented.
4.) DISCLOSURE OF EXPENSES
As a shareholder of the Fund, you incur ongoing expenses consisting solely of management fees. You will be assessed fees for outgoing wire transfers, returned checks and stop payment orders at prevailing rates charged by Mutual Shareholder Services, LLC, the Fund’s transfer agent, and IRA accounts will be charged an $8.00 annual maintenance fee. This Example is intended to help you understand your ongoing costs (in dollars) of investing in the Fund and to compare these costs with the ongoing costs of investing in other mutual funds.
The Example is based on an investment of $1,000 invested in the Fund on July 1, 2020 and held through December 31, 2020.
Actual Expenses
The first line of the table below provides information about actual account values and actual expenses. You may use the information in this line, together with the amount you invested, to estimate the expenses that you paid over the period. Simply divide your account value by $1,000 (for example, an $8,600 account value divided by $1,000 = 8.6), then multiply the result by the number in the first line under the heading entitled “Expenses Paid During the Period” to estimate the expenses you paid on your account during this period.
18
Additional Information (Unaudited) - continued
Hypothetical Example for Comparison Purposes
The second line of the table below provides information about hypothetical account values and hypothetical expenses based on the Fund’s actual expense ratio and an assumed rate of return of 5% per year before expenses, which is not the Fund’s actual return. The hypothetical account values and expenses may not be used to estimate the actual ending account balance or expenses you paid for the period. You may use this information to compare the ongoing costs of investing in this Fund and other funds. To do so, compare this 5% hypothetical example with the 5% hypothetical examples that appear in the shareholder reports of the other funds.
Please note that the expenses shown in the table are meant to highlight your ongoing costs only and do not reflect any transactional costs, such as sales charges (loads) or the charges assessed by Mutual Shareholder Services, LLC as described above. Therefore, the second line of the table is useful in comparing ongoing costs only, and will not help you determine the relative cost of owning different funds. In addition, if these transactional costs were included, your cost could have been higher.
| | | | | | | Expenses Paid |
| | | Beginning | | Ending | | During the Period* |
| | | Account Value | | Account Value | | July 1, 2020 to |
| | | July 1, 2020 | | December 31, 2020 | | December 31, 2020 |
| |
| Actual | | $1,000.00 | | $1,213.76 | | $7.51 |
| |
| Hypothetical | | $1,000.00 | | $1,018.35 | | $6.85 |
| (5% annual return | | | | | | |
| before expenses) | | | | | | |
| * | Expenses are equal to the Fund’s annualized expense ratio of 1.35%, multiplied by the average account value over the period, multiplied by 184/366 (to reflect the one-half year period ended December 31, 2020). |
| |
19
Trustees and Officers
(Unaudited) |
The Board of Trustees supervises the business activities of the Trust. The names of the Trustees and executive officers of the Trust are shown below. For more information regarding the Trustees, please refer to the Statement of Additional Information, which is available upon request by calling 800.231.2901. Each Trustee serves until the Trustee sooner dies, resigns, retires, or is removed.
The Trustees and Officers of the Trust and their principal business activities during the past five years are:
Interested Trustees and Officers
| | | | | Number of | |
| | | | Principal | Portfolios In | Other |
| Name, | Position(s) | Term of Office | Occupation(s) | Fund | Directorships |
| Address(1), | Held With | and Length of | During | Complex | Held By |
| and Year of Birth | the Trust | Time Served | Past 5 Years | Overseen By | Trustee |
| | | | | Trustee | |
| |
| Ross C. Provence, | President | Indefinite Term; | General Partner and Portfolio | N/A | N/A |
| Year of Birth: 1938 | | Since 2000 | Manager for Value Trend Capital | | |
| | | | Management, LP (1995 to current). | | |
| | | | Estate planning attorney (1963 to | | |
| current). |
| |
| Jeffrey R. Provence(2), | Trustee, | Indefinite Term; | CEO, Premier Fund Solutions, Inc. | 13 | Blue Chip |
| Year of Birth: 1969 | Secretary | Since 2000 | (2001 to current). General Partner | | Investor Funds, |
| | and | | and Portfolio Manager for Value | | Meeder Funds |
| | Treasurer | | Trend Capital Management, LP | | |
| | | | (1995 to current). | | |
| |
| Julian G. Winters, | Chief | Indefinite Term; | Managing Member, Watermark | N/A | N/A |
| Year of Birth: 1968 | Compliance | Since 2010 | Solutions LLC (investment compli- | | |
| | Officer | | ance and consulting) (2007 to cur- | | |
| rent). |
(1) The address of each trustee and officer is c/o PFS Funds, 1939 Friendship Drive, Suite C, El Cajon, California 92020.
(2) Jeffrey R. Provence is considered an "interested person" as defined in Section 2(a)(19) of the Investment Company Act of 1940 by
virtue of his position with the Trust.
Independent Trustees |
| | | | | Number of | |
| | | | Principal | Portfolios In | Other |
| Name, | Position | Term of Office | Occupation(s) | Fund | Directorships |
| Address(1), | Held With | and Length of | During | Complex | Held By |
| and Year of Birth | the Trust | Time Served | Past 5 Years | Overseen By | Trustee |
| | | | | Trustee | |
| |
| Thomas H. Addis III, | Independent | Indefinite Term; | Executive Director/CEO, Southern | 13 | None |
| Year of Birth: 1945 | Trustee | Since 2000 | California PGA (2006 to current). | | |
| |
| Allen C. Brown, | Independent | Indefinite Term; | Law Office of Allen C. Brown, | 13 | Blue Chip |
| Year of Birth: 1943 | Trustee | Since 2010 | estate planning and business attor- | | Investor Funds |
| | | | ney (1970 to current). | | |
| |
| George Cossolias, CPA, | Independent | Indefinite Term; | Partner of CWDL, CPAs (February 1, | 13 | Blue Chip |
| Year of Birth: 1935 | Trustee | Since 2000 | 2014 to current). Owner of George | | Investor Funds, |
| | | | Cossolias & Company, CPAs (1972 | | Neiman Funds |
| | | | to January 31, 2014). President of | | |
| | | | LubricationSpecialists, Inc. (1996 to | | |
| current). |
(1) The address of each trustee and officer is c/o PFS Funds, 1939 Friendship Drive, Suite C, El Cajon, California 92020.
20

Investment Adviser
Bretton Capital Management, LLC
Legal Counsel
Practus, LLP
Custodian
US Bank, N.A.
Dividend Paying Agent,
Shareholders’ Servicing Agent,
Transfer Agent
Mutual Shareholder Services, LLC
Fund Administrator
Premier Fund Solutions, Inc.
Independent Registered Public Accounting Firm
Cohen & Company, Ltd.
Distributor
Rafferty Capital Markets, LLC |
This report is provided for the general information of the shareholders of the Bretton
Fund. This report is not intended for distribution to prospective investors in the Fund,
unless preceded or accompanied by an effective prospectus. |
Item 2. Code of Ethics.
The registrant has adopted a code of ethics that applies to the registrant’s principal executive officer and the principal financial officer. The registrant has not made any amendments to its code of ethics during the covered period. The registrant has not granted any waivers from any provisions of the code of ethics during the covered period. A copy of the registrant’s Code of Ethics is filed herewith.
Item 3. Audit Committee Financial Expert.
The registrant’s Board of Trustees has determined that George Cossolias is an audit committee finical expert. Mr. Cossolias is independent for purposes of this Item 3.
Item 4. Principal Accountant Fees and Services.
(a-d) The following table details the aggregate fees billed for each of the last two fiscal years for audit fees, audit-related fees, tax fees and other fees by the principal accountant to the registrant. The principal accountant has provided no services to the adviser or any entity controlled by, or under common control with the adviser that provides ongoing services to the registrant.
| | | FYE 12/31/2020 | | FYE 12/31/2019 |
| Audit Fees | | $13,750 | | $13,750 |
| Audit-Related Fees | | $0 | | $0 |
| Tax Fees | | $3,000 | | $3,000 |
| All Other Fees | | $750 | | $750 |
Nature of Tax Fees: preparation of Excise Tax Statement and 1120 RIC. All Other Fees: Semi-Annual Report Review
(e) (1) The audit committee approves all audit and non-audit related services and, therefore, has not adopted pre-approval policies and procedures described in paragraph (c)(7) of Rule 2-01 of Regulation S-X.
(e) (2) None of the services described in paragraph (b) through (d) of this Item were approved by the audit committee pursuant to paragraph (c)(7)(i)(C) of Rule 2-01 of Regulation S-X.
(f) All of the principal accountant’s hours spent on auditing the registrant’s financial statements were attributed to work performed by full-time permanent employees of the principal accountant.
(g) The following table indicates the aggregate non-audit fees billed by the registrant’s principal accountant for services to the registrant , the registrant’s investment adviser (not sub-adviser), and any entity controlling, controlled by, or under common control with the adviser that provides ongoing services to the registrant, for the last two years.
| Non-Audit Fees | | FYE 12/31/2020 | | FYE 12/31/2019 |
| Registrant | | $3,750 | | $3,750 |
| Registrant’s Investment Adviser | | $0 | | $0 |
(h) The principal accountant provided no services to the investment adviser or any entity controlling, controlled by, or under common control with the adviser that provides ongoing services to the registrant.
Item 5. Audit Committee of Listed Companies. Not applicable.
Item 6. Investments.
(a) Not applicable. Schedule filed with Item 1.
(b) Not applicable.
Item 7. Disclosure of Proxy Voting Policies and Procedures for Closed-End Management Investment Companies. Not applicable.
Item 8. Portfolio Managers of Closed End Management Investment Companies. Not applicable.
Item 9. Purchases of Equity Securities by Closed-End Management Investment Companies and Affiliated Purchasers. Not applicable.
Item 10. Submission of Matters to a Vote of Security Holders.
The registrant has not adopted procedures by which shareholders may recommend nominees to the registrant’s board of trustees.
Item 11. Controls and Procedures.
(a) The Registrant’s president and chief financial officer concluded that the disclosure controls and procedures (as defined in Rule 30a-3(c) under the Act (17 CFR 270.30a -3(c))) as of a date within 90 days of the filing date of the report that includes the disclosure required by this paragraph, based on the evaluation of these controls and procedures required by Rule 30a-3(b) under the Act (17 CFR 270.30a -3(b)) and Rules 13a-15(b) or 15d-15(b) under the Exchange Act (17 CFR 240.13a -15(b) or 240.15d -15(b)).
(b) There were no changes in the registrant’s internal control over financial reporting (as defined in Rule 30a-3(d) under the Act (17 CFR 270.30a -3(d)) that occurred during the period covered by this report that has materially affected, or is reasonably likely to materially affect, the registrant’s internal control over financial reporting.
Item 12. Disclosure of Securities Lending Activities for Closed-End Management Investment Companies.
Not applicable.
Item 13. Exhibits.
(a)(1) Code of Ethics. Filed herewith.
(a)(2) Certifications pursuant to Section 302 of the Sarbanes-Oxley Act of 2002. Filed herewith.
(a)(3) Not applicable.
(a)(4) Not applicable.
(b) Certification pursuant to Section 906 of the Sarbanes-Oxley Act of 2002. Filed herewith.
Pursuant to the requirements of the Securities Exchange Act of 1934 and the Investment Company Act of 1940, the registrant has duly caused this report to be signed on its behalf by the undersigned, thereunto duly authorized.
| | By: /s/Ross C. Provence
Ross C. Provence
President |
Pursuant to the requirements of the Securities Exchange Act of 1934 and the Investment Company Act of 1940, this report has been signed below by the following persons on behalf of the registrant and in the capacities and on the dates indicated.
| | By: /s/Ross C. Provence
Ross C. Provence
President |
| | By: /s/Jeffrey R. Provence
Jeffrey R. Provence
Chief Financial Officer |