UNITED STATES
SECURITIES AND EXCHANGE COMMISSION
WASHINGTON, D.C. 20549
FORM N-CSR
CERTIFIED SHAREHOLDER REPORT OF REGISTERED MANAGEMENT
INVESTMENT COMPANIES
Investment Company Act file number 811-09781
PFS Funds
(Exact name of registrant as specified in charter)
1939 Friendship Drive, Suite C, El Cajon, CA 92020
(Address of principal executive offices) (Zip code)
CT Corporation System
155 Federal St., Suite 700, Boston, MA 02110
(Name and address of agent for service)
Registrant’s telephone number, including area code: (619) 588-9700
Date of fiscal year end: November 30
Date of reporting period: November 30, 2020
Item 1. Report to Stockholders.
Christopher Weil & Company Core Investment Fund
Ticker CWCFX
For Investors Seeking Long-Term Capital Appreciation
ANNUAL REPORT
November 30, 2020
IMPORTANT NOTE: Beginning on January 1, 2021, as permitted by regulations adopted by the Securities
and Exchange Commission, paper copies of the Fund's shareholder reports will no longer be sent by mail,
unless you specifically request paper copies of the reports from the Fund or from your financial intermediary,
such as a broker-dealer or bank. Instead, the reports will be made available on a website, and you will be
notified by mail each time a report is posted and provided with a website link to access the report.
If you already elected to receive shareholder reports electronically, you will not be affected by this change
and you need not take any action. You may elect to receive shareholder reports and other communications
from the Fund or your financial intermediary electronically by calling or sending an email request.
You may elect to receive all future reports in paper free of charge. You can inform the Fund or your financial
intermediary that you wish to continue receiving paper copies of your shareholder reports by calling or send-
ing an email request. Your election to receive reports in paper will apply to all funds held with the fund com-
plex/your financial intermediary. |
| CHRISTOPHER WEIL & COMPANY CORE INVESTMENT FUND | |
| |
| Letter to Shareholders | 1 |
| Sector Allocation | 3 |
| Performance Information | 4 |
| Schedule of Investments | 5 |
| Schedule of Call Options Written | 9 |
| Statement of Assets and Liabilities | 10 |
| Statement of Operations | 10 |
| Statements of Changes in Net Assets | 11 |
| Financial Highlights | 12 |
| |
| NOTES TO FINANCIAL STATEMENTS | 13 |
| |
| REPORT OF INDEPENDENT REGISTERED PUBLIC ACCOUNTING FIRM | 20 |
| |
| DISCLOSURE OF EXPENSES | 21 |
| |
| ADDITIONAL INFORMATION | 22 |
| |
| TRUSTEES AND OFFICERS | 23 |
Christopher Weil & Company Core Investment Fund
Management’s Discussion of Fund Performance (Unaudited)
Investment Summary
The Christopher Weil & Company Core Investment Fund (the “Fund”) returned 23.86% for the fiscal year ended November 30, 2020 compared to 17.46% for the S&P 500® Index (the “S&P 500”), the Fund’s benchmark index. Excluding option positions, we started the fiscal year with 50 equity positions and ended the fiscal year with 73 positions. 16 positions were fully liquidated, 7 positions were purchased and sold, while 39 new positions were purchased with the proceeds during the fiscal year. We primarily added and retained through the fiscal year, new positions in information technology, materials, and health care while we reduced positions in financials. We purchased multiple puts throughout the fiscal year on indexes and sectors, to hedge against market declines and what we thought could take advantage of the volatility. We also bought calls and puts to gain directional exposure on individual equities and wrote calls on equity positions in conjunction with the Fund’s covered call writing strategies. Option trading in the Fund had an overall negative effect on performance. Our equity protection and directional equity exposure options trading performed worse than our index and sector hedging.
The Fund’s performance was most negatively affected by exposure to transportation, retail, and financials. Our exposure to Alaska Air Group, Inc (ALK) contributed to our poor performance in transportation. In the retail sector Macy’s (M) was our sole negative performer. Although we had overall strong performance in the financials and communications sectors, our biggest losers there were The Walt Disney Company (DIS), and Citigroup, Inc (C).
On the positive side, a number of our holdings in industrials and information technology sectors helped the Fund’s performance. Within industrials, our positions in Deere and Company (DE), Valmont Industries (VMI) and Trimble Inc (TRMB) were some of our best performers. In information technology, Solaredge Technologies (SEDG), Ubiquiti Inc (UI) and Clearfield Inc (CLFD) were significant outperformers. Having no direct exposure to the energy sector also helped us avoid losses.
Themes From Last Year
2020 was a year like no other. There were plenty of themes that you could pluck from other years, but the combination of them was unprecedented. We’ve seen late economic cycle. We’ve seen high debt (corporate and sovereign). We’ve seen expensive valuations. We’ve seen examples of government stimulus, government intervention and “quantitative easing”. We’ve seen recessions. We’ve even seen a pandemic. But colliding with each other at the same time was a new one. Even if you said the Federal Reserve (the “Fed”) would keep interest rates at zero and they would open up their bond buying efforts to areas that far extended beyond what they did during the Great Financial crisis, few would have expected the dramatic performance of the S&P500 or the Nasdaq. Our ultimate thought was that over time things would come back to normal, but markets and economies typically take a bit more ebbing and flowing before you go from late cycle-> recession-> trough->recovery. What we wouldn’t have guessed (back in March) was that the time for the bear market to recover was the shortest in 60+ years and nearly the 2nd quickest in modern time.
In light of the above, the hardest thing for people to comprehend is that certain areas of the economy are doing very well. Restaurants, travel (hotel/air/cruise lines), certain real estate, brick and mortar retail (to name a few areas) have struggled mightily, but as of this writing certain areas of the economy are back to recent highs, or better. For instance, manufacturing has rebounded strongly, home sales are the highest they’ve been any time since the Great Financial crisis, and overall retail sales have done very well.
We believe the following general market narrative is present today:
• Even though small businesses across the country are feeling the most pain, large companies are still doing well (See Amazon, Microsoft, etc).
- Shining perhaps the brightest light on the idea that investing in the long run doesn’t mean you are buying “the economy” at one brief moment in time.
- The United States demographics, led by millennials hitting their high earning years (while finally settling down and starting families), combined with baby boomers having money to spend, is a good enough future backdrop to keep the U.S. stock market buoy- ant.
2020 Annual Report 1
º In light of the above, we will look through the bad news until the vaccine gets here.
Last year we mentioned the negative correlation between equity market returns and consumer confidence. We also said that high equity valuations, high corporate and sovereign debt, and late cycle “keeps us cautious on domestic equity markets”. Well, we got it right for the first 90 days of the year. We also said that we believed investors should be looking at more value leaning strategies. Well, as judged by the major indices, we got that quite wrong for the first 300 days of the year. In spite of us getting that second part wrong, our representation of value, has allowed us to sidestep some of the pitfalls that value stocks as a whole have experienced.
What concerns us the most (in the short/intermediate term), is that typically a recession will wash away some of the excesses of the prior markets peak. The excessive debt goes bad and/or gets reworked, high valuations go to low valuations, excessive optimism goes to excessive pessimism and in that world, a market bottom forms, and a new bull market is born. In our opinion, what is extremely atypical about this latest market recovery is that the excessive debt never went bad, (because the Fed backstopped it and massive amounts of distressed funds were lined up to buy), equity valuations went higher (because the biggest stocks in the world that were already expensive, got more expensive), and excessive optimism has never been more excessive. Obviously, a lot of people panicked in March, but the evidence shows that thousands of new brokerage accounts opened this year. Additionally, there is a record number of small options traders making leveraged long bets as opposed to hedging. Frankly, it’s hard to say how the above plays out. History would suggest it means lower equity returns going forward, but the markets this year certainly have been a great humbler of many.
International markets were mixed this year, where the developed world fared worse than the emerging world. We think that is a reasonable backdrop going forward for the longer term, but it will most likely come with more volatility. One of the deciding factors may be the long-term direction of the dollar. The dollar has weakened materially in the back half of the year and if that continues, international markets should continue to have respectable returns. We do believe that a world is emerging where the dependance on the dollar will lessen. That will lead to many different outcomes, but we think two scenarios make the most sense, a more robust international market, and a possible resurgence of domestic manufacturing. We believe both are themes worth paying attention to.
After having a volatile start to the year, the Barclays Bond Aggregate Index was a steady winner for the majority of the year. The three week corporate credit crisis that the Fed “fixed” with one wave of its wand in late March eventually led to recovering credit spreads (as we said earlier). One of the more interesting backdrops in the bond market is that 40 years ago we were trying to slay the inflation dragon, whereas today the Fed has been trying it’s best to revive it, stating quite plainly that they are trying to target longer term 2% inflation, but that it could run considerably hotter in the short term. With the Fed trying to do so, it’s hard to make a great case for extended duration bonds.
Investment Strategy and Summary
Previously we have targeted a portfolio that consists of approximately 40-50 positions, and we aim for most of the holdings to have a weighting of between 2% and 8% of the net asset value of the Fund. As the economic and investment climate changes, we may increase or decrease our target number of positions. In recent months, we have found more interesting ideas than we have in prior years. Some of these warrant smaller allocations and some larger. We have overweighted companies in various sectors that have strong earnings or revenue growth, strong free cash flow yields and strong balance sheets. Technical analysis helps in choosing entry and exit points. Companies represent most major industry sectors, but we have, in practice, generally, over weighted information technology and consumer discretionary while underweighting financials, energy, utilities, materials, and telecoms. This past year, we found many interesting ideas in industrials as well.
While we look to macro trends for guidance, note that our methodology is fundamentally bottoms up. We rigorously screen the investable universe for stocks that have strong balance sheets and income statements along with positive track records and likely potential for growth. The search for good value remains a top priority as we believe that even a great company can trade for too high a price and a mediocre one can trade well below its intrinsic value. We look for stocks that will outperform over the next few years, but more importantly ones that are creating real long-term value. We mostly shun short term plays, maintaining a mix of stocks of varied sectors, market capitalization, and anticipated volatility. We continue to believe that well managed companies will lead their industries, take market share, and grow earnings. Therefore, investors in well run
2020 Annual Report 2
companies should continue to profit over the longer term. We continue to buy companies we hope will deliver outsized positive returns, reserving the option to employ hedging strategies to weather more volatile times.
John Wells, President/CEO & Mike Hubbert, Portfolio Manager Christopher Weil & Company, Inc., Investment Advisor
Past performance does not guarantee future results. The investment return and principal value of an investment will fluctuate so that an investor’s shares, when redeemed, may be worth more or less than their original cost. Current performance may be lower or higher than the performance data quoted. You may obtain performance data current to the most recent month-end by calling toll free 1-888-550-9266. Investors should consider the investment objectives, risks, and charges and expenses of the Fund carefully before investing. The prospectus contains this and other information about the Fund. You may obtain a prospectus on our website www.cweil.com or by calling toll free 1-888-550-9266. The Fund’s Distributor is Rafferty Capital Markets, LLC.
Christopher Weil & Company Core Investment Fund (Unaudited)
CHRISTOPHER WEIL & COMPANY CORE INVESTMENT FUND
Sector Allocation (Unaudited)
(As a Percentage of Net Assets)
November 30, 2020

* Net Cash represents cash equivalents and other assets in excess of
liabilities (which include Options Written).
2020 Annual Report 3
Christopher Weil & Company Core Investment Fund (Unaudited)
PERFORMANCE INFORMATION
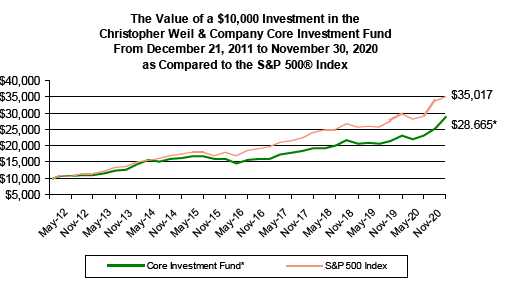
November 30, 2020 NAV $16.79
Average Annual Total Returns for the Periods ended November 30, 2020.
| | | | | | Since | |
| | 1 Year(A) | | 5 Year(A) | | Inception(A) | |
| Christopher Weil & Company Core Investment Fund | 23.86% | | 12.27% | | 12.49% | |
| S&P 500® Index (B) | 17.46% | | 13.99% | | 15.04% | |
Total Annual Fund Operating Expense Ratio (from Prospectus dated 3/27/2020): Gross – 1.52%; Net – 1.24%
The Total Annual Fund Operating Expense Ratio reported above may not correlate to the expense ratio in the Fund’s financial highlights because (a) of the application of waivers as described in Note 4, and (b) the financial highlights include only the direct operating expenses incurred by the Fund, not the indirect costs of investing in acquired funds.
(A) 1 Year, 5 Year and Since Inception returns include change in share prices and in each case includes reinvestment of any dividends and capital gain distributions. The inception date of the Christopher Weil & Company Core Investment Fund was December 21, 2011.
(B) The S&P 500® Index is a widely recognized unmanaged index of equity prices and is representative of a broader market and range of securities than is found in the Fund’s portfolio. The Index is an unmanaged benchmark that assumes reinvestment of all distributions and excludes the effect of taxes and fees. Individuals cannot invest directly in this Index; however, an individual can invest in exchange traded funds or other investment vehicles that attempt to track the performance of a benchmark index.
PAST PERFORMANCE DOES NOT GUARANTEE FUTURE RESULTS. INVESTMENT RETURN AND PRINCIPAL VALUE WILL FLUCTUATE SO THAT SHARES, WHEN REDEEMED, MAY BE WORTH MORE OR LESS THAN THEIR ORIGINAL COST. RETURNS DO NOT REFLECT THE DEDUCTION OF TAXES THAT A SHAREHOLDER WOULD PAY ON FUND DISTRIBUTIONS OR THE REDEMPTION OF FUND SHARES. CURRENT PERFORMANCE MAY BE LOWER OR HIGHER THAN THE PERFORMANCE DATA QUOTED. TO OBTAIN PERFORMANCE DATA CURRENT TO THE MOST RECENT MONTH END, PLEASE CALL 1-888-550-9266 OR VISIT OUR WEBSITE AT www.cweil.com. THE FUND'S DISTRIBUTOR IS RAFFERTY CAPITAL MARKETS, LLC.
2020 Annual Report 4
| Christopher Weil & Company Core Investment Fund | | |
| | | | Schedule of Investments |
| | | | November 30, 2020 |
| Shares | | | Fair Value | % of Net Assets |
| COMMON STOCKS | | | | |
| |
| COMMUNICATIONS | | | | |
| Cable & Other Pay Television Services | | | | |
| 1,232 | Roku, Inc. Class A * | $ | 361,678 | | |
| Services - Computer Programming, Data Processing, Etc. | | | | |
| 1,254 | Alphabet Inc. Class A * | | 2,200,018 | | |
| 1,497 | Baidu, Inc. * ** | | 208,068 | | |
| 1,101 | Facebook, Inc. Class A * | | 304,944 | | |
| 4,000 | Pinterest, Inc. Class A * | | 280,080 | | |
| 8,882 | Twitter, Inc. * | | 413,102 | | |
| | | | 3,406,212 | | |
| Total for Communications | | 3,767,890 | 6.57 | % |
| | | | | |
| CONSUMER DISCRETIONARY | | | | |
| Automobiles | | | | |
| 14,016 | Volkswagen AG ** | | 260,137 | | |
| 5,063 | XPeng Inc. * ** + | | 297,502 | | |
| | | | 557,639 | | |
| Cable & Other Pay Television Services | | | | |
| 16,890 | The Walt Disney Co. | | 2,499,889 | | |
| Household Audio & Video Equipment | | | | |
| 15,218 | Sonos, Inc. * | | 338,448 | | |
| Photographic Equipment & Supplies | | | | |
| 12,500 | GoPro, Inc. Class A * | | 87,375 | | |
| Retail - Department Stores | | | | |
| 48,170 | Macy's, Inc. | | 491,816 | | |
| Retail - Variety Stores | | | | |
| 2,232 | Target Corporation | | 400,711 | | |
| Services - Advertising Agencies | | | | |
| 24,777 | Criteo S.A. * ** | | 479,931 | | |
| 22,600 | Groupon, Inc. * | | 681,616 | | |
| | | | 1,161,547 | | |
| Services - Computer Programming, Data Processing, Etc. | | | | |
| 17,036 | Magnite, Inc. * | | 323,684 | | |
| Services - Educational Services | | | | |
| 8,778 | K12 Inc. * | | 204,790 | | |
| Total for Consumer Discretionary | | 6,065,899 | 10.58 | % |
| | | | | |
| CONSUMER STAPLES | | | | |
| Food and Kindred Products | | | | |
| 41,048 | The Hain Celestial Group, Inc. * | | 1,580,348 | | |
| Total for Consumer Staples | | 1,580,348 | 2.76 | % |
| | | | | |
| FINANCIALS | | | | |
| Banks | | | | | |
| 5,290 | First Republic Bank | | 685,372 | | |
| Blank Checks | | | | |
| 10,000 | Longview Acquisition Corp. Class A * | | 157,500 | | |
| Fire, Marine & Casualty Insurance | | | | |
| 7,676 | Berkshire Hathaway Inc. Class B | | 1,757,113 | | |
* Non-Income Producing Securities.
** ADR - American Depositary Receipt.
+ Portion or all of the security is pledged as collateral for call options written. |
The accompanying notes are an integral part of these
financial statements. |
2020 Annual Report 5
| Christopher Weil & Company Core Investment Fund | | |
| | | | Schedule of Investments |
| | | | November 30, 2020 |
| Shares | | Fair Value | % of Net Assets |
| COMMON STOCKS - Continued | | | | |
| |
| FINANCIALS - Continued | | | | |
| Investment Advice | | | | |
| 40,856 | Houlihan Lokey, Inc. Class A | $ | 2,646,652 | | |
| National Commercial Banks | | | | |
| 39,999 | Bank of America Corporation | | 1,126,372 | | |
| 14,438 | JPMorgan Chase & Co. | | 1,701,951 | | |
| | | | 2,828,323 | | |
| Security Brokers, Dealers & Flotation Companies | | | | |
| 5,000 | Morgan Stanley | | 309,150 | | |
| Total for Financials | | 8,384,110 | 14.62 | % |
| | | | | |
| HEALTH CARE | | | | |
| In Vitro & In Vivo Diagnostic Substances | | | | |
| 1,700 | Heska Corporation * | | 212,500 | | |
| Laboratory Analytical Instruments | | | | |
| 720 | Illumina, Inc. * | | 231,905 | | |
| Pharmaceutical Preparations | | | | |
| 10,000 | Amicus Therapeutics, Inc. * | | 228,900 | | |
| 9,500 | Frequency Therapeutics, Inc. * | | 272,650 | | |
| 100,756 | Paratek Pharmaceuticals, Inc. * | | 623,680 | | |
| 2,500 | Schrödinger, Inc. * | | 173,950 | | |
| 71,942 | VBI Vaccines Inc. * | | 246,401 | | |
| | | | 1,545,581 | | |
| Retail - Drug Stores and Proprietary Stores | | | | |
| 33,258 | CVS Health Corporation | | 2,254,560 | | |
| Services - Business Services, NEC | | | | |
| 9,934 | Akamai Technologies, Inc. * | | 1,028,268 | | |
| Services - Computer Integrated Systems Design | | | | |
| 13,876 | Cerner Corporation | | 1,038,480 | | |
| Services - Miscellaneous Health & Allied Services, NEC | | | | |
| 7,170 | Progyny, Inc. * | | 254,463 | | |
| Total for Health Care | | 6,565,757 | 11.45 | % |
| | | | | |
| INDUSTRIALS | | | | |
| Air Transportation, Scheduled | | | | |
| 4,500 | Alaska Air Group, Inc. | | 229,365 | | |
| Construction Machinery & Equipment | | | | |
| 3,538 | Caterpillar Inc. | | 614,161 | | |
| 16,380 | Gencor Industries, Inc. * | | 197,543 | | |
| | | | 811,704 | | |
| Fabricated Structural Metal Products | | | | |
| 8,501 | Valmont Industries, Inc. | | 1,385,493 | | |
| Farm Machinery & Equipment | | | | |
| 5,049 | Deere & Company + | | 1,320,919 | | |
| Measuring & Controlling Devices, NEC | | | | |
| 3,361 | Rockwell Automation, Inc. | | 858,937 | | |
| Retail - Building Materials, Hardware, Garden Supply | | | | |
| 7,000 | GrowGeneration Corp. * + | | 246,190 | | |
| Services - Auto Rental & Leasing (No Drivers) | | | | |
| 1,970 | AMERCO | | 816,033 | | |
* Non-Income Producing Securities.
** ADR - American Depositary Receipt.
+ Portion or all of the security is pledged as collateral for call options written. |
The accompanying notes are an integral part of these
financial statements. |
2020 Annual Report 6
| Christopher Weil & Company Core Investment Fund | | |
| | | | Schedule of Investments |
| | | | November 30, 2020 |
| Shares | | Fair Value | % of Net Assets |
| COMMON STOCKS - Continued | | | | |
| |
| INDUSTRIALS - Continued | | | | |
| Services - Computer Processing & Data Preparation | | | | |
| 5,415 | Verisk Analytics, Inc. Class A | $ | 1,073,849 | | |
| Water, Sewer, Pipeline, Comm & Power Line Construction | | | | |
| 2,097 | Preformed Line Products Company | | 127,183 | | |
| Total for Industrials | | 6,869,673 | 11.98 | % |
| | | | | |
| INFORMATION TECHNOLOGY | | | | |
| Computer Communications Equipment | | | | |
| 3,109 | Arista Networks, Inc. * | | 841,606 | | |
| Computer Peripheral Equipment, NEC | | | | |
| 3,597 | Palo Alto Networks, Inc. * | | 1,057,230 | | |
| 54,489 | Stratasys Ltd. (Israel) * | | 931,762 | | |
| | | | 1,988,992 | | |
| Computer & Office Equipment | | | | |
| 10,482 | International Business Machines Corporation | | 1,294,737 | | |
| Measuring & Controlling Devices, NEC | | | | |
| 25,533 | Trimble Inc. * | | 1,528,661 | | |
| Radio & TV Broadcasting & Communications Equipment | | | | |
| 6,724 | Ubiquiti Networks, Inc. + | | 1,668,292 | | |
| Semiconductors & Related Devices | | | | |
| 19,539 | MaxLinear, Inc. Class A * | | 610,594 | | |
| 13,373 | Micron Technology, Inc. * | | 857,076 | | |
| 12,026 | SolarEdge Technologies, Inc. * + | | 3,342,987 | | |
| 4,096 | Skyworks Solutions, Inc. | | 578,232 | | |
| | | | 5,388,889 | | |
| Services - Business Services, NEC | | | | |
| 42,200 | GreenSky, Inc. Class A * | | 179,772 | | |
| 6,300 | MAXIMUS, Inc. | | 452,403 | | |
| | | | 632,175 | | |
| Services - Computer Processing & Data Preparation | | | | |
| 58,992 | Yext, Inc. * | | 1,121,438 | | |
| Services - Computer Programming Services | | | | |
| 25,215 | Amdocs Limited (Island of Guernsey) | | 1,659,399 | | |
| Services - Prepackaged Software | | | | |
| 31,500 | 3D Systems Corporation * | | 288,225 | | |
| 9,612 | Box, Inc. Class A * | | 179,648 | | |
| 10,782 | National Instruments Corporation | | 403,570 | | |
| | | | 871,443 | | |
| Telephone & Telegraph Apparatus | | | | |
| 14,281 | Akoustis Technologies, Inc. * | | 108,678 | | |
| 3,211 | Ciena Corporation * | | 143,853 | | |
| 60,248 | Clearfield, Inc. * | | 1,432,697 | | |
| | | | 1,685,228 | | |
| Total for Information Technology | | 18,680,860 | 32.58 | % |
| | | | | |
| MATERIALS | | | | |
| Chemicals & Allied Products | | | | |
| 21,460 | Livent Corporation * | | 325,548 | | |
| Metal Mining | | | | |
| 65,638 | Freeport-McMoRan Inc. | | 1,535,273 | | |
* Non-Income Producing Securities.
** ADR - American Depositary Receipt.
+ Portion or all of the security is pledged as collateral for call options written. |
The accompanying notes are an integral part of these
financial statements. |
2020 Annual Report 7
| Christopher Weil & Company Core Investment Fund |
| | | | | | | Schedule of Investments |
| | | | | | | November 30, 2020 |
| Shares | | | | | | Fair Value | | | % of Net Assets |
| COMMON STOCKS - Continued | | | | | | | | | |
| |
| MATERIALS - Continued | | | | | | | | | |
| Mining & Quarrying of Nonmetallic Minerals (No Fuels) | | | | | | | | |
| 4,238 Vulcan Materials Company | | | | $ | 591,837 | | | | |
| Total for Materials | | | | | 2,452,658 | | | 4.28 | % |
| Total for Common Stocks (Cost $37,480,431) | | | | | 54,367,195 | | | 94.82 | % |
| | | | | | | | | | |
| CONTINGENT VALUE RIGHTS | | | | | | | | | |
| 6,925 | resTORbio, Inc. ++ ***** | | | | | - | | | 0.00 | % |
| | (Cost - $0) | | | | | | | | | |
| | | | | | | | | | |
| EXCHANGE TRADED FUNDS | | | | | | | | | |
| 18,000 | The 3D Printing ETF | | | | | 524,970 | | | | |
| 24,213 | Global X Copper Miners ETF | | | | | 652,298 | | | | |
| 12,875 | VanEck Vectors® Gold Miners ETF | | | | | 446,505 | | | | |
| 5,516 | VanEck Vectors® Junior Gold Miners ETF | | | | 275,966 | | | | |
| | (Cost - $1,797,845) | | | | | 1,899,739 | | | 3.32 | % |
| | | | | | | | | | |
| MONEY MARKET FUNDS | | | | | | | | | |
| 1,125,200 | Invesco Short-Term Investments Trust Treasury Portfolio | | | | | | |
| | Institutional Class 0.01% *** | | | | | 1,125,200 | | | 1.96 | % |
| | (Cost $1,125,200) | | | | | | | | | |
| | | | | | | | | | |
| TREASURY BILLS | | | | | | | | | |
| 250,000 | United States Treasury Bill 12/17/2020 - 0.00% (a) **** | | 249,993 | | | 0.44 | % |
| | (Cost - $249,987) | | | | | | | | | |
| CALL OPTIONS PURCHASED | | | Notional | | | | | | |
| Expiration Date/Exercise Price | Contracts | | Amount | | Fair Value | | | % of Net Assets |
| Criteo S.A. * **** | 90 | $ | 174,330 | | 900 | | | | |
| January 15, 2021 Calls @ $25.00 | | | | | | | | | |
| VanEck Vectors® Gold Miners ETF * **** | 143 | | 495,924 | | 279,565 | | | | |
| January 21, 2022 Calls @ $15.00 | | | | | | | | | |
| Total for Options Purchased (Premiums Paid - $224,214) | $ | 670,254 | | 280,465 | | | 0.49 | % |
| Total Investment Securities | | | | | 57,922,592 | | | 101.03 | % |
| | (Cost $40,877,676) | | | | | | | | | |
| Liabilities in Excess of Other Assets | | | | | (588,113 | ) | | -1.03 | % |
| Net Assets | | | | | $ | 57,334,479 | | | 100.00 | % |
(a) Zero coupon security. The rate represents the current yield to maturity.
* Non-Income Producing Securities.
*** The rate shown was the 7-day yield at November 30, 2020.
**** Level 2 Security.
***** Level 3 Security.
+ Portion or all of the security is pledged as collateral for call options written.
++ Under the terms of the Contingent Value Rights ("CRV"), the holder has the right to receive substantially
all of the net proceeds from the commercialization, if any, received from a third party commercial partner of
RTB101, a small molecule product candidate, previously developed by resTORbio, Inc. that is a potent
inhibitor of target of rapamycin complex 1 (RORC1), for a COVID-19 related indication. |
The accompanying notes are an integral part of these
financial statements. |
2020 Annual Report 8
| Christopher Weil & Company Core Investment Fund |
| | | Schedule of Call Options Written |
| | | | November 30, 2020 |
| Underlying Security | | | Notional | | | | |
| Expiration Date/Exercise Price | Contracts | | Amount | | | Fair Value | |
| Deere & Company * | | | | | | | |
| March 19, 2021 Calls @ $270.00 | 12 | $ 313,944 | | $ | (15,720 | ) |
| GrowGeneration Corp. * | | | | | | | |
| January 15, 2021 Calls @ $20.00 | 70 | | 246,190 | | | (107,800 | ) |
| SolarEdge Technologies, Inc. * | | | | | | | |
| December 18, 2020 Calls @ $160.00 **** | 30 | | 833,940 | | | (361,200 | ) |
| December 18, 2020 Calls @ $170.00 **** | 20 | | 555,960 | | | (220,800 | ) |
| December 18, 2020 Calls @ $250.00 | 15 | | 416,970 | | | (49,200 | ) |
| January 15, 2021 Calls @ $300.00 | 50 | | 1,389,900 | | | (80,000 | ) |
| | | | 3,196,770 | | | (711,200 | ) |
| Ubiquiti Networks, Inc. * **** | 10 | | 248,110 | | | (19,200 | ) |
| March 19, 2021 Calls @ $270.00 | | | | | | | |
| XPeng Inc. * | | | | | | | |
| January 15, 2021 Calls @ $40.00 | 50 | | 293,800 | | | (103,300 | ) |
| Total (Premiums Received $523,130) | | | $ 4,298,814 | | $ | (957,220 | ) |
* Non-Income Producing Securities.
**** Level 2 Security.
The accompanying notes are an integral part of these
financial statements. |
2020 Annual Report 9
| Christopher Weil & Company Core Investment Fund | |
| |
| Statement of Assets and Liabilities | | | |
| November 30, 2020 | | | |
| |
| Assets: | | | |
| Investment Securities at Fair Value | $ | 57,922,592 | |
| (Cost $40,877,676) | | | |
| Dividends Receivable | | 28,064 | |
| Receivable for Securities Sold | | 391,643 | |
| Total Assets | | 58,342,299 | |
| Liabilities: | | | |
| Call Options Written at Fair Value (Premiums Received $523,130) | | 957,220 | |
| Payable for Management Fees | | 33,114 | |
| Payable for Services Fees | | 17,486 | |
| Total Liabilities | | 1,007,820 | |
| Net Assets | $ | 57,334,479 | |
| Net Assets Consist of: | | | |
| Paid In Capital | $ | 37,618,401 | |
| Total Distributable Earnings | | 19,716,078 | |
| Net Assets, for 3,414,043 Shares Outstanding | $ | 57,334,479 | |
| (Unlimited number of shares authorized without par value) | | | |
| |
| Net Asset Value, Redemption Price and Offering Price | $ | 16.79 | |
| Per Share ($57,334,479/3,414,043 shares) | | | |
| |
| |
| Statement of Operations | | | |
| For the fiscal year ended November 30, 2020 | | | |
| |
| Investment Income: | | | |
| Dividends (Net of Foreign Withholding Taxes of $4,138) | $ | 556,922 | |
| Interest | | 125 | |
| Total Investment Income | | 557,047 | |
| Expenses: | | | |
| Management Fees | | 447,458 | |
| Services Fees | | 223,729 | |
| Total Expenses | | 671,187 | |
| Less: Management Fees Waived (Note 4) | | (111,865 | ) |
| Less: Services Fees Waived (Note 4) | | (29,601 | ) |
| Net Expenses | | 529,721 | |
| |
| Net Investment Income (Loss) | | 27,326 | |
| |
| Net Realized and Unrealized Gain (Loss) on Investments, Options Purchased and Options Written: | |
| Capital Gain Distributions from Investments | | 58 | |
| Net Realized Gain (Loss) on Investments | | 3,652,617 | |
| Net Realized Gain (Loss) on Options Purchased | | (227,901 | ) |
| Net Realized Gain (Loss) on Options Written | | 39,319 | |
| Net Change in Unrealized Appreciation (Depreciation) on Investments | | 7,883,009 | |
| Net Change in Unrealized Appreciation (Depreciation) on Options Purchased | | 211,517 | |
| Net Change in Unrealized Appreciation (Depreciation) on Options Written | | (434,090 | ) |
| Net Realized and Unrealized Gain (Loss) on Investments, Options Purchased and | | | |
| Options Written | | 11,124,529 | |
| |
| Net Increase (Decrease) in Net Assets from Operations | $ | 11,151,855 | |
The accompanying notes are an integral part of these
financial statements. |
2020 Annual Report 10
| Christopher Weil & Company Core Investment Fund |
| | |
| Statements of Changes in Net Assets | | | | | | | | |
| | |
| | | 12/1/2019 | | | | 12/1/2018 | | |
| | | to | | | | to | | |
| | | 11/30/2020 | | | | 11/30/2019 | | |
| From Operations: | | | | | | | | |
| Net Investment Income (Loss) | $ | 27,326 | | | $ | 87,923 | | |
| Capital Gain Distributions from Investments | | 58 | | | | - | | |
| Net Realized Gain (Loss) on Investments, Options Purchased | | | | | | | | |
| and Options Written | | 3,464,035 | | | | 4,503,038 | | |
| Net Change in Unrealized Appreciation (Depreciation) on | | | | | | | | |
| Investments, Options Purchased and Options Written | | 7,660,436 | | | | 42,778 | | |
| Net Increase (Decrease) in Net Assets from Operations | | 11,151,855 | | | | 4,633,739 | | |
| | |
| From Distributions to Shareholders: | | (4,633,052 | ) | | | (4,218,345 | ) | |
| | |
| From Capital Share Transactions: | | | | | | | | |
| Proceeds From Sale of Shares | | 9,387,123 | | | | 1,848,860 | | |
| Proceeds from Redemption Fees (Note 2) | | 1,035 | | | | - | | |
| Shares Issued on Reinvestment of Dividends | | 4,633,052 | | | | 4,218,345 | | |
| Cost of Shares Redeemed | | (4,660,153 | ) | | | (3,798,509 | ) | |
| Net Increase (Decrease) from Shareholder Activity | | 9,361,057 | | | | 2,268,696 | | |
| Net Increase (Decrease) in Net Assets | | 15,879,860 | | | | 2,684,090 | | |
| | |
| Net Assets at Beginning of Year | | 41,454,619 | | | | 38,770,529 | | |
| Net Assets at End of Year | $ | 57,334,479 | | | $ | 41,454,619 | | |
| | |
| | |
| Share Transactions: | | | | | | | | |
| Issued | | 703,132 | | | | 139,974 | | |
| Reinvested | | 331,880 | | | | 357,790 | | |
| Redeemed | | (346,866 | ) | | | (278,672 | ) | |
| Net Increase (Decrease) in Shares | | 688,146 | | | | 219,092 | | |
| Shares Outstanding Beginning of Year | | 2,725,897 | | | | 2,506,805 | | |
| Shares Outstanding End of Year | | 3,414,043 | | | | 2,725,897 | | |
The accompanying notes are an integral part of these
financial statements. |
2020 Annual Report 11
| Christopher Weil & Company Core Investment Fund |
| | |
| Financial Highlights | | | | | | | | | | | | | | | | | | | | |
| | |
| Selected data for a share outstanding throughout the period: | | 12/1/2019 | | | | 12/1/2018 | | | | 12/1/2017 | | | | 12/1/2016 | | | | 12/1/2015 | | |
| | | to | | | | to | | | | to | | | | to | | | | to | | |
| | | 11/30/2020 | | | | 11/30/2019 | | | | 11/30/2018 | | | | 11/30/2017 | | | | 11/30/2016 | | |
| Net Asset Value - Beginning of Year | $ | 15.21 | | | $ | 15.47 | | | $ | 15.71 | | | $ | 13.17 | | | $ | 14.26 | | |
| Net Investment Income (Loss) (a) | | 0.01 | | | | 0.03 | | | | (0.03 | ) | | | (0.04 | ) | | | (0.05 | ) | |
| Net Gains (Loss) on Investments (Realized and Unrealized) | | 3.27 | | | | 1.41 | | | | 1.10 | | | | 2.66 | | | | (0.06 | ) | |
| Total from Investment Operations (b) | | 3.28 | | | | 1.44 | | | | 1.07 | | | | 2.62 | | | | (0.11 | ) | |
| Distributions (From Net Investment Income) | | (0.03 | ) | | | - | | | | - | | | | - | | | | - | | |
| Distributions (From Capital Gains) | | (1.67 | ) | | | (1.70 | ) | | | (1.31 | ) | | | (0.08 | ) | | | (0.98 | ) | |
| Total Distributions | | (1.70 | ) | | | (1.70 | ) | | | (1.31 | ) | | | (0.08 | ) | | | (0.98 | ) | |
| Proceeds from Redemption Fee (Note 2) | | - | | + | | - | | | | - | | | | - | | + | | - | | + |
| Net Asset Value - End of Period | $ | 16.79 | | | $ | 15.21 | | | $ | 15.47 | | | $ | 15.71 | | | $ | 13.17 | | |
| Total Return (c) | | 23.86 | % | | | 12.46 | % | | | 7.38 | % | | | 20.01 | % | | | (0.63 | )% | |
| | |
| Ratios/Supplemental Data | | | | | | | | | | | | | | | | | | | | |
| Net Assets - End of Year (Thousands) | $ | 57,334 | | | $ | 41,455 | | | $ | 38,771 | | | $ | 37,974 | | | $ | 36,611 | | |
| Before Waiver | | | | | | | | | | | | | | | | | | | | |
| Ratio of Expenses to Average Net Assets | | 1.50 | % | | | 1.50 | % | | | 1.50 | % | | | 1.50 | % | | | 1.50 | % | |
| Ratio of Net Investment Income (Loss) to Average | | | | | | | | | | | | | | | | | | | | |
| Net Assets | | -0.26 | % | | | -0.05 | % | | | -0.45 | % | | | -0.57 | % | | | -0.65 | % | |
| After Waiver | | | | | | | | | | | | | | | | | | | | |
| Ratio of Expenses to Average Net Assets (d) | | 1.18 | % | | | 1.22 | % | | | 1.22 | % | | | 1.24 | % | | | 1.23 | % | |
| Ratio of Net Investment Income (Loss) to Average | | | | | | | | | | | | | | | | | | | | |
| Net Assets (d) | | 0.06 | % | | | 0.23 | % | | | -0.17 | % | | | -0.31 | % | | | -0.38 | % | |
| Portfolio Turnover Rate | | 75.80 | % | | | 49.35 | % | | | 50.30 | % | | | 49.43 | % | | | 20.58 | % | |
| | + Amount less than $0.005 per share.
(a) Per share amount calculated using the average shares method.
(b) Realized and unrealized gains and losses per share in this caption are balancing amounts necessary to reconcile the
change in net asset value for the period, and may not reconcile with the aggregate gains and losses in the Statements of
Operations due to share transactions for the period.
(c) Total return represents the rate that the investor would have earned or lost on an investment in the Fund assuming
reinvestment of dividends. Returns do not reflect the deduction of taxes a shareholder would pay on Fund distributions or
redemption of Fund shares.
(d) Effective April 1, 2015, the Advisor has contractually agreed to waive a portion of its Management and Service Fees. (Note 4) |
The accompanying notes are an integral part of these
financial statements. |
2020 Annual Report 12
NOTES TO FINANCIAL STATEMENTS
CHRISTOPHER WEIL & COMPANY CORE INVESTMENT FUND
November 30, 2020
1.) ORGANIZATION
Christopher Weil & Company Core Investment Fund (the “Fund”) was organized as a series of the PFS Funds (the “Trust”) on December 16, 2011. The Fund is non-diversified. The Trust was established under the laws of Massachusetts by an Agreement and Declaration of Trust dated January 13, 2000, which was amended and restated as of January 20, 2011. The Trust is registered as an open-end investment company under the Investment Company Act of 1940, as amended (the “1940 Act”). The Trust may offer an unlimited number of shares of beneficial interest in a number of separate series, each series representing a distinct fund with its own investment objectives and policies. As of November 30, 2020, there were thirteen series authorized by the Trust. The investment advisor to the Fund is Christopher Weil & Company, Inc. (the “Advisor”). The Fund commenced operations on December 21, 2011. The Fund’s investment objective is to seek long-term capital appreciation.
2.) SIGNIFICANT ACCOUNTING POLICIES
The Fund is an investment company and accordingly follows the investment company accounting and reporting guidance of the Financial Accounting Standards Board (“FASB”) Accounting Standards Codification Topic 946 Financial Services - Investment Companies. The financial statements are prepared in conformity with accounting principles generally accepted in the United States of America (“GAAP”). The Fund follows the significant accounting policies described in this section.
SECURITY VALUATION: All investments in securities are recorded at their estimated fair value, as described in Note 3.
SHARE VALUATION: The net asset value (the “NAV”) is generally calculated as of the close of trading on the New York Stock Exchange (“Exchange”) (normally 4:00 p.m. Eastern time) every day the Exchange is open. The NAV for the Fund is calculated by taking the total value of the Fund’s assets, subtracting its liabilities, and then dividing by the total number of shares outstanding, rounded to the nearest cent. The offering price and redemption price per share are equal to the net asset value per share. Prior to November 5, 2020, the Fund was subject to a redemption fee of 2% if redeemed within 90 days or less of purchase. During the fiscal year ended November 30, 2020, proceeds from redemption fees were $1,035.
OPTIONS: The purchase and writing of options requires additional skills and techniques beyond normal portfolio management, and involves certain risks. The purchase of options limits a fund’s potential loss to the amount of the premium paid and can afford a fund the opportunity to profit from favorable movements in the price of the underlying security to a greater extent than if the transaction were effected directly. When a fund writes an option, an amount equal to the premium received by the fund is recorded as a liability and is subsequently adjusted to the current fair value of the option written. Premiums received from writing options that expire unexercised are treated by a fund on the expiration date as realized gains on options written. The difference between the premium and the amount paid on effecting a closing purchase transaction, including brokerage commissions, is also treated as a realized gain, or, if the premium is less than the amount paid for the closing purchase transaction, as a realized loss. If a written call option is exercised, the premium is added to the proceeds from the sale of the underlying security or currency in determining whether a fund has realized a gain or a loss. If a written put option is exercised, the premium reduces the cost basis of the securities purchased by the fund. A fund, as writer of an option, bears the market risk of an unfavorable change in the price of the security underlying the written option.
FEDERAL INCOME TAXES: The Fund’s policy is to continue to comply with the requirements of the Internal Revenue Code that are applicable to regulated investment companies and to distribute all of its taxable income to shareholders. Therefore, no federal income tax provision is required. It is the Fund’s policy to distribute annually, prior to the end of the calendar year, dividends sufficient to satisfy excise tax requirements of the Internal Revenue Code. This Internal Revenue Code requirement may cause an excess of distributions over the book year-end accumulated income. In addition, it is the Fund’s policy to distribute annually, after the end of the fiscal year, net realized capital gains.
The Fund recognizes the tax benefits of certain tax positions only where the position is “more likely than not” to be sustained assuming examination by tax authorities. Management has analyzed the Fund’s tax positions, and has concluded that no liability for unrecognized tax benefits should be recorded related to uncertain tax positions taken on returns filed for open tax years. The Fund identifies its major tax jurisdictions as U.S. Federal tax authorities; however the Fund is not aware of any
2020 Annual Report 13
Notes to Financial Statements - continued
tax positions for which it is reasonably possible that the total amounts of unrecognized tax benefits will change materially in the next twelve months. The Fund recognizes interest and penalties, if any, related to unrecognized tax benefits as income tax expense in the Statement of Operations. During the fiscal year ended November 30, 2020, the Fund did not incur any interest or penalties.
USE OF ESTIMATES: The financial statements are prepared in accordance with GAAP, which requires management to make estimates and assumptions that affect the reported amounts of assets and liabilities and disclosure of contingent assets and liabilities at the date of the financial statements and the reported amounts of increases and decreases in net assets from operations during the reporting period. Actual results could differ from those estimates.
DISTRIBUTIONS TO SHAREHOLDERS: Distributions to shareholders, which are determined in accordance with income tax regulations, are recorded on the ex-dividend date. The treatment for financial reporting purposes of distributions made to shareholders during the year from net investment income or net realized capital gains may differ from their ultimate treatment for federal income tax purposes. These differences are caused primarily by differences in the timing of recognition of certain components of income, expense or realized capital gain for federal income tax purposes. Where such differences are permanent in nature, they are reclassified in the components of the net assets based on their ultimate characterization for federal income tax purposes. Any such reclassification will have no effect on net assets, results of operations or net asset values per share of the Fund. The Fund may utilize earnings and profits distributed to shareholders on redemption of shares as part of the dividend paid deduction. For the tax year ended November 30, 2020, the following permanent adjustment was recorded. The adjustment was primarily attributed to the use of equalization for tax purposes:
| Paid In Capital | | $174,559 | |
| Total Distributable Earnings | | ($174,559 | ) |
EXPENSES: Expenses incurred by the Trust that do not relate to a specific fund of the Trust are allocated to the individual fund based on each fund’s relative net assets or another appropriate basis.
OTHER: The Fund records security transactions based on a trade date for financial statement purposes. Dividend income is recognized on the ex-dividend date, and interest income, if any, is recognized on an accrual basis. Discounts and premiums on fixed income securities purchased are accreted or amortized over the life of the respective securities using the effective interest method. The Fund uses the specific identification method in computing gain or loss on the sale of investment securities. Withholding taxes on foreign dividends have been provided for in accordance with the Fund’s understanding of the applicable country’s tax rules and rates.
3.) SECURITY VALUATIONS
The Fund utilizes various methods to measure the fair value of its investments on a recurring basis. GAAP establishes a hierarchy that prioritizes inputs to valuation methods. The three levels of inputs are:
Level 1 - Unadjusted quoted prices in active markets for identical assets or liabilities that the Fund has the ability to access.
Level 2 - Observable inputs other than quoted prices included in level 1 that are observable for the asset or liability, either directly or indirectly. These inputs may include quoted prices for the identical instrument on an inactive market, prices for similar instruments, interest rates, prepayment speeds, credit risk, yield curves, default rates and similar data.
Level 3 - Unobservable inputs for the asset or liability, to the extent relevant observable inputs are not available, representing the Fund’s own assumptions about the assumptions a market participant would use in valuing the assets or liabilities, and would be based on the best information available.
The availability of observable inputs can vary from security to security and is affected by a wide variety of factors, including, for example, the type of security, whether the security is new and not yet established in the marketplace, the liquidity of markets, and other characteristics particular to the security. To the extent that valuation is based on models or inputs that are less observable or unobservable in the market, the determination of fair value requires more judgment. Accordingly, the degree of judgment exercised in determining fair value is greatest for instruments categorized in level 3.
2020 Annual Report 14
Notes to Financial Statements - continued
The inputs used to measure fair value may fall into different levels of the fair value hierarchy. In such cases, for disclosure purposes, the level in the fair value hierarchy within which the fair value measurement falls in its entirety, is determined based on the lowest level input that is significant to the fair value measurement in its entirety.
FAIR VALUE MEASUREMENTS
A description of the valuation techniques applied to the Fund’s major categories of assets measured at fair value on a recurring basis follows:
Equity securities (common stocks, including ADRs). Equity securities are valued by a pricing service when the Advisor believes such prices accurately reflect the fair value of such securities. Securities that are traded on any stock exchange or on the NASDAQ over-the-counter market are generally valued by the pricing service at the last quoted sale price. Lacking a last sale price, an equity security is generally valued by the pricing service at its last bid price. Generally, if the security is traded in an active market and is valued at the last sale price, the security is categorized as a level 1 security, and if an equity security is valued by the pricing service at its last bid, it is generally categorized as a level 2 security. When market quotations are not readily available, when the Advisor determines that the market quotation or the price provided by the pricing service does not accurately reflect the current fair value, or when restricted securities are being valued, such securities are valued as determined in good faith by the Advisor, subject to review of the Board of Trustees (the “Trustees” or the “Board”) and are categorized in level 2 or level 3, when appropriate.
Fixed income securities (including treasury bills). Fixed income securities generally are valued by using market quotations, but may be valued on the basis of prices furnished by a pricing service when the Advisor believes such prices accurately reflect the fair value of such securities. A pricing service utilizes electronic data processing techniques based on yield spreads relating to securities with similar characteristics to determine prices for normal institutional-size trading units of debt securities without regard to sale or bid prices. When prices are not readily available from a pricing service, or when restricted or illiquid securities are being valued, securities are valued at fair value as determined in good faith by the Advisor, subject to review of the Trustees. Short-term investments in fixed income securities with maturities of less than 60 days when acquired, or which subsequently are within 60 days of maturity, are valued by using the amortized cost method of valuation. Generally, fixed income securities are categorized as level 2.
Money market funds. Money market funds are valued at net asset value provided by the fund and are classified in level 1 of the fair value hierarchy.
Options. Option positions that are traded on any exchange or on the NASDAQ over-the-counter market are valued at the last quoted sale price. To the extent these option positions are actively traded and valuation adjustments are not applied, they are classified in level 1 of the fair value hierarchy. Lacking a last sale price, a purchased option position is valued at its last bid price except when, in the Advisor’s opinion, the last bid price does not accurately reflect the fair value of the option position. Lacking a last sale price, a written option position is valued at its last ask price except when, in the Advisor’s opinion, the last ask price does not accurately reflect the fair value of the option position. When such bid or ask prices are used for valuation or when the security is not actively traded, those securities are generally categorized in level 2 of the fair value hierarchy.
In accordance with the Trust’s good faith pricing guidelines, the Advisor is required to consider all appropriate factors relevant to the value of securities for which it has determined other pricing sources are not available or reliable as described above. There is no single standard for determining fair value, since fair value depends upon the circumstances of each individual case. As a general principle, the current fair value of an issue of securities being valued by the Advisor would appear to be the amount which the owner might reasonably expect to receive for them upon their current sale. Methods which are in accordance with this principle may, for example, be based on (i) a multiple of earnings; (ii) a discount from market of a similar freely traded security (including a derivative security or a basket of securities traded on other markets, exchanges or among dealers); or (iii) yield to maturity with respect to debt issues, or a combination of these and other methods.
The following table summarizes the inputs used to value the Fund’s assets and liabilities measured at fair value as of November 30, 2020:
| Valuation Inputs of Assets | | Level 1 | | Level 2 | | Level 3 | | Total |
| Common Stocks (including ADRs) | | $54,367,195 | | $0 | | $0 | | $54,367,195 |
| Contingent Value Rights | | 0 | | 0 | | 0 | | 0 |
| Exchange Traded Funds | | 1,899,739 | | 0 | | 0 | | 1,899,739 |
2020 Annual Report 15
| Notes to Financial Statements - continued | | | | | | |
| |
| Money Market Funds | | 1,125,200 | | 0 | | 0 | | 1,125,200 |
| Treasury Bills | | 0 | | 249,993 | | 0 | | 249,993 |
| Call Options Purchased | | 0 | | 280,465 | | 0 | | 280,465 |
| Total | | $57,392,134 | | $530,458 | | $0 | | $57,922,592 |
| |
| Valuation Inputs of Liabilities | | Level 1 | | Level 2 | | Level 3 | | Total |
| Call Options Written | | $356,020 | | $601,200 | | $0 | | $957,220 |
| Total | | $356,020 | | $601,200 | | $0 | | $957,220 |
The Fund did not hold any level 3 assets, other than an immaterial Contingent Value Right, or liabilities during the fiscal year ended November 30, 2020.
4.) INVESTMENT ADVISORY AGREEMENTS AND SERVICES AGREEMENTS
The Fund has an investment advisory agreement (the “Management Agreement”) with the Advisor. Under the Management Agreement, the Advisor, at its own expense and without reimbursement from the Fund, furnishes office space and all necessary office facilities, equipment and executive personnel necessary for managing the assets of the Fund. For its services the Advisor receives a Management Fee equal to 1.00% of the average daily net assets of the Fund. Since April 1, 2015, the Advisor has contractually agreed to waive a portion of its Management Fee such that it will be equal to 0.75% of the Fund’s average daily net assets. This waiver will automatically terminate on March 31, 2021 unless it is renewed by the Advisor. The Advisor may not terminate the waiver prior to March 31, 2021.
As a result of the above calculation, for the fiscal year ended November 30, 2020, the Advisor earned management fees totaling $447,458. At November 30, 2020, the Fund owed $33,114 to the Advisor. A total of $111,865 of management fees was waived with no recoupment provisions by the Fund for the fiscal year ended November 30, 2020.
Additionally, the Fund has a Services Agreement with the Advisor (the “Services Agreement”). Under the Services Agreement the Advisor receives an additional fee of 0.50% of the average daily net assets of the Fund and is obligated to pay the operating expenses of the Fund excluding, as applicable, management fees and sub-advisory fees, brokerage fees and commissions, 12b-1 fees, taxes, borrowing costs (such as (a) interest and (b) dividend expenses on securities sold short), ADR fees, the cost of acquired funds and extraordinary expenses. Effective April 1, 2015, the Advisor has contractually agreed to waive a portion of its Services Fee to 0.20% of the Fund’s average daily net assets greater than $35 million. This waiver will automatically terminate on March 31, 2021 unless it is renewed by the Advisor. The Advisor may not terminate this waiver prior to March 31, 2021.
For the fiscal year ended November 30, 2020, the Advisor earned services fees of $223,729. At November 30, 2020, the Fund owed the Advisor services fees of $17,486. A total of $29,601 of services fees was waived with no recoupment provisions by the Fund for the fiscal year ended November 30, 2020.
5.) OPTION TRANSACTIONS
As of November 30, 2020, portfolio securities valued at $4,298,814 were held by the Fund as collateral for options written by the Fund. For the fiscal year ended November 30, 2020, the total amount of options written, as presented in the table below, is representative of the volume of activity for these derivative types during the period:
| | Number of | | | Premiums | |
| | Contracts | | | Received | |
| Options outstanding at November 30, 2019 | 0 | | $ | 0 | |
| Options written | 403 | | | 698,976 | |
| Options terminated in closing purchase transactions | (40 | ) | | (48,586 | ) |
| Options expired | (50 | ) | | (19,617 | ) |
| Options exercised | (56 | ) | | (107,643 | ) |
| Options outstanding at November 30, 2020 | 257 | | $ | 523,130 | |
For the fiscal year ended November 30, 2020, the total amount of options purchased, as presented in the table below, is representative of the volume of activity for these derivative types during the period:
2020 Annual Report 16
| Notes to Financial Statements - continued | | | | | |
| |
| | Number of | | | Premiums | |
| | Contracts | | | Paid | |
| Options outstanding at November 30, 2019 | 351 | | | $170,911 | |
| Options purchased | 4,237 | | | 608,019 | |
| Options terminated in closing sale transactions | (1,857 | ) | | (302,562 | ) |
| Options expired | (2,447 | ) | | (247,760 | ) |
| Options exercised | (51 | ) | | (4,394 | ) |
| Options outstanding at November 30, 2020 | 233 | | | $224,214 | |
The locations on the Statement of Assets and Liabilities of the Fund’s derivative positions, which are not accounted for as hedging instruments under GAAP, are as follows:
| | Asset | | | Liability | |
| | Derivatives | | | Derivatives | |
| Options purchased: | | Options Written | | | |
| Included In Investment | $280,465 | at Fair Value | | ($957,220) | |
| Securities at Fair Value | | | | | |
Realized and unrealized gains and losses on derivatives contracts entered into during the fiscal year ended November 30, 2020 by the Fund are recorded in the following locations in the Statement of Operations:
| | | Realized | | Unrealized | |
| Equity Contracts | Location | Gain (Loss) | Location | Gain (Loss) | |
| Options | Net Realized | | Net Change In Unrealized | | |
| Purchased | Gain (Loss) on | ($227,901) | Appreciation (Depreciation) | $211,517 | |
| | Options Purchased | | on Options Purchased | | |
| |
| Options | Net Realized | | Net Change In Unrealized | | |
| Written | Gain (Loss) on | $39,319 | Appreciation (Depreciation) | ($434,090) | |
| | Options Written | | on Options Written | | |
The Fund engages in option transactions involving individual securities and stock indexes. An option involves either: (a) the right or the obligation to buy or sell a specific instrument at a specific price until the expiration date of the option; or (b) the right to receive payments or the obligation to make payments representing the difference between the closing price of a stock index and the exercise price of the option expressed in dollars times a specified multiple until the expiration date of the option. The Fund may purchase and write options. Options are sold (written) on securities and stock indexes. The purchaser of an option on a security pays the seller (the writer) a premium for the right granted but is not obligated to buy or sell the underlying security. The purchaser of an option on a stock index pays the seller a premium for the right granted, and in return the seller of such an option is obligated to make the payment. A writer of an option may terminate the obligation prior to expiration of the option by making an offsetting purchase of an identical option. Options are traded on organized exchanges and in the over-the-counter market. To cover the potential obligations involved in writing options, a Fund will either: (a) own the underlying security, or in the case of an option on a market index, will hold a portfolio of stocks substantially replicating the movement of the index; or (b) the Fund will segregate with the custodian high grade liquid assets sufficient to purchase the underlying security or equal to the market value of the stock index option, marked to market daily.
The purchase of options limits a Fund’s potential loss to the amount of the premium paid and can afford the Fund the opportunity to profit from favorable movements in the price of an underlying security to a greater extent than if transactions were effected in the security directly. However, the purchase of an option could result in the Fund losing a greater percentage of its investment than if the transaction were effected directly. When the Fund writes a call option, it will receive a premium, but it will give up the opportunity to profit from a price increase in the underlying security above the exercise price as long as its obligation as a writer continues, and it will retain the risk of loss should the price of the security decline. When the Fund writes a put option, it will assume the risk that the price of the underlying security or instrument will fall below the exercise price, in which case the Fund may be required to purchase the security or instrument at a higher price than the market price of the security or instrument. In addition, there can be no assurance that the Fund can effect a closing transaction on a particular option it has written. Further, the total premium paid for any option may be lost if the Fund does not exercise the option.
2020 Annual Report 17
Notes to Financial Statements - continued
The Fund engages in option transactions involving securities and stock indices in order to gain exposure to particular securities or markets, in connection with hedging transactions, or to try to enhance returns. Options require additional skills and techniques beyond normal portfolio management. The Fund’s use of options involves risk that such instruments may not work as intended due to unanticipated developments, especially in abnormal market conditions, or if the Advisor makes an error in judgment, or other causes. The use of options may magnify the increase or decrease in the performance of the Fund, and may also subject the Fund to higher price volatility.
The premiums paid for the options represent the cost of the investment and the options are valued daily at their closing price. The Fund recognizes a realized gain or loss when the option is sold or expires. Option holdings within the Fund, which may include put options and call options, are subject to loss of value with the passage of time, and may experience a total loss of value upon expiration. With options, there is minimal counterparty risk to the Fund since they are exchange traded.
During the fiscal year ended November 30, 2020, the Fund was not subject to any master netting arrangements.
6.) RELATED PARTY TRANSACTIONS
Jeffrey R. Provence of Premier Fund Solutions, Inc. (the “Administrator”) also serves as trustee/officer of the Fund. This individual receives benefits from the Administrator resulting from administration fees paid to the Administrator of the Fund by the Advisor.
The Trustees who are not interested persons of the Fund were each paid $1,500, for a total of $4,500, in Trustees’ fees for their services to the Fund for the fiscal year ended November 30, 2020. These fees were paid by the Advisor.
7.) INVESTMENTS
For the fiscal year ended November 30, 2020, purchases and sales of investment securities other than short-term investments and U.S. Government obligations aggregated $39,216,378 and $30,349,628, respectively.
8.) CONTROL OWNERSHIP
The beneficial ownership, either directly or indirectly, of more than 25% of the voting shares of a fund creates a presumption of control of the fund, under section 2(a)(9) of the 1940 Act. At November 30, 2020, National Financial Services, LLC, located at 200 Liberty Street, New York, New York 10281, held for the benefit of its customers, in aggregate, 99.00% of Fund shares. The Trust does not know whether any underlying accounts of National Financial Services, LLC, owned or controlled 25% or more of the voting securities of the Fund.
9.) TAX MATTERS
For Federal income tax purposes, the cost of investments owned at November 30, 2020 was $41,259,728, and premiums received from options written was $523,130.
At November 30, 2020, the composition of gross unrealized appreciation (the excess of value over tax cost) and depreciation (the excess of tax cost over value) of investments (including open positions in options written) on a tax basis was as follows:
| | Appreciation | | (Depreciation) | | Net Appreciation (Depreciation) |
| | $17,791,575 | | ($1,562,801) | | $16,228,774 |
The tax character of distributions was as follows:
| | | Fiscal Year Ended | | Fiscal Year Ended |
| | | November 30, 2020 | | November 30, 2019 |
| Ordinary Income | | $ 87,922 | | $ 121,133 |
| Long-term Capital Gain | | 4,545,130 | | 4,097,212 |
| | | $ 4,633,052 | | $ 4,218,345 |
Subsequent to November 30, 2020, the Fund paid a distribution of $0.009803 per share from ordinary income and $1.072979 per share from long-term capital gains on December 29, 2020 to the shareholders of record on December 28, 2020.
As of November 30, 2020, the components of distributable earnings (accumulated losses) on a tax basis were as follows:
2020 Annual Report 18
| Notes to Financial Statements - continued | | | |
| |
| Accumulated undistributed ordinary income | | $ 33,188 | |
| Accumulated undistributed realized gains | | 3,632,450 | |
| Other accumulated losses | | (178,334 | ) |
| Unrealized appreciation on investment securities - net | | 16,228,774 | |
| | | $19,716,078 | |
As of November 30, 2020, the primary differences between book basis and tax basis unrealized appreciation are attributable to the tax deferral of losses on wash sales. Under current tax law, late year ordinary losses incurred after December 31 of a Fund’s fiscal year maybe deferred and treated as occuring on the first business day of the following fiscal year for tax purposes. As of November 30, 2020, other accumulated losses are attributable to deferred late year ordinary losses of $5,862 and losses on straddles from options of $172,472.
10.) CONCENTRATION OF SECTOR RISK
If a Fund has significant investments in the securities of issuers in industries within a particular sector, any development affecting that sector will have a greater impact on the value of the net assets of the Fund than would be the case if the Fund did not have significant investments in that sector. In addition, this may increase the risk of loss of an investment in the Fund and increase the volatility of the Fund’s NAV per share. From time to time, circumstances may affect a particular sector and the companies within such sector. For instance, economic or market factors, regulation or deregulation, and technological or other developments may negatively impact all companies in a particular sector and therefore the value of a Fund’s portfolio will be adversely affected. As of November 30, 2020, the Fund had 32.58% of the value of its net assets invested in stocks within the Information Technology sector.
11.) COVID-19 RISKS
Unexpected local, regional or global events, such as war; acts of terrorism; financial, political or social disruptions; natural, environmental or man-made disasters; the spread of infectious illnesses or other public health issues; and recessions and depressions could have a significant impact on the Fund and its investments and may impair market liquidity. Such events can cause investor fear, which can adversely affect the economies of nations, regions and the market in general, in ways that cannot necessarily be foreseen. An outbreak of infectious respiratory illness known as COVID-19, which is caused by a novel coronavirus (SARS-CoV-2), was first detected in China in December 2019 and subsequently spread globally. This coronavirus has resulted in, among other things, travel restrictions, closed international borders, enhanced health screenings at ports of entry and elsewhere, disruption of and delays in healthcare service preparation and delivery, prolonged quarantines, significant disruptions to business operations, market closures, cancellations and restrictions, supply chain disruptions, lower consumer demand, and significant volatility and declines in global financial markets, as well as general concern and uncertainty. The impact of COVID-19 has adversely affected, and other infectious illness outbreaks that may arise in the future could adversely affect, the economies of many nations and the entire global economy, individual issuers and capital markets in ways that cannot necessarily be foreseen. Public health crises caused by the COVID-19 outbreak may exacerbate other pre-existing political, social and economic risks in certain countries or globally. The duration of the COVID-19 outbreak and its effects cannot be determined with certainty.
12.) SUBSEQUENT EVENTS
Management has evaluated subsequent events through the date of issuance of these financial statements and has noted no such events except for the December 29, 2020 distributions reported in Note 9 herein.
2020 Annual Report 19
REPORT OF INDEPENDENT REGISTERED PUBLIC ACCOUNTING FIRM
To the Shareholders of Christopher Weil & Company Core Investment Fund and
Board of Trustees of PFS Funds
Opinion on the Financial Statements
We have audited the accompanying statement of assets and liabilities, including the schedules of investments and call options written, of Christopher Weil & Company Core Investment Fund (the “Fund”), a series of PFS Funds, as of November 30, 2020, and the related statement of operations for the year then ended, the statements of changes in net assets for each of the two years in the period then ended, the related notes, and the financial highlights for each of the five years in the period then ended (collectively referred to as the “financial statements”). In our opinion, the financial statements present fairly, in all material respects, the financial position of the Fund as of November 30, 2020, the results of its operations for the year then ended, the changes in its net assets for each of the two years in the period then ended, and the financial highlights for each of the five years in the period then ended, in conformity with accounting principles generally accepted in the United States of America.
Basis for Opinion
These financial statements are the responsibility of the Fund’s management. Our responsibility is to express an opinion on the Fund’s financial statements based on our audits. We are a public accounting firm registered with the Public Company Accounting Oversight Board (United States) (“PCAOB”) and are required to be independent with respect to the Fund in accordance with the U.S. federal securities laws and the applicable rules and regulations of the Securities and Exchange Commission and the PCAOB.
We conducted our audits in accordance with the standards of the PCAOB. Those standards require that we plan and perform the audit to obtain reasonable assurance about whether the financial statements are free of material misstatement, whether due to error or fraud.
Our audits included performing procedures to assess the risks of material misstatement of the financial statements, whether due to error or fraud, and performing procedures that respond to those risks. Such procedures included examining, on a test basis, evidence regarding the amounts and disclosures in the financial statements. Our procedures included confirmation of securities owned as of November 30, 2020, by correspondence with the custodian and brokers or by other appropriate auditing procedures where replies from brokers were not received. Our audits also included evaluating the accounting principles used and significant estimates made by management, as well as evaluating the overall presentation of the financial statements. We believe that our audits provide a reasonable basis for our opinion.
We have served as the Fund’s auditor since 2012.

COHEN & COMPANY, LTD.
Milwaukee, Wisconsin
January 21, 2021
2020 Annual Report 20
DISCLOSURE OF EXPENSES
(Unaudited) |
Shareholders of this Fund incur ongoing costs consisting of management and service fees. Although the Fund charges no sales loads or transaction fees, you will be assessed fees for outgoing wire transfers, returned checks and stop payment orders at prevailing rates charged by Mutual Shareholder Services, LLC, the Fund’s transfer agent. IRA accounts will be charged an $8.00 annual maintenance fee. Additionally, your account will be indirectly subject to the expenses of any underlying funds. The following example is intended to help you understand your ongoing costs of investing in the Fund and to compare these costs with similar costs of investing in other mutual funds. The example is based on an investment of $1,000 invested in the Fund on June 1, 2020 and held through November 30, 2020.
Actual Expenses
The first line of the table below provides information about actual account values and actual expenses. You may use the information in this line, together with the amount you invested, to estimate the expenses that you paid over the period. Simply divide your account value by $1,000 (for example, an $8,600 account value divided by $1,000 = 8.6), then multiply the result by the number in the first line under the heading entitled “Expenses Paid During Period” to estimate the expenses you paid on your account during this period.
Hypothetical Example for Comparison Purposes
The second line of the table below provides information about hypothetical account values and hypothetical expenses based on the Fund’s actual expense ratio and an assumed rate of return of 5% per year before expenses, which is not the Fund’s actual return. The hypothetical account values and expenses may not be used to estimate the actual ending account balance or expenses you paid for the period. You may use this information to compare the ongoing costs of investing in the Fund and other funds. To do so, compare this 5% hypothetical example with the 5% hypothetical examples that appear in the shareholder reports of the other funds.
Please note that the expenses shown in the table are meant to highlight your ongoing costs only and do not reflect any transactional costs, such as redemption fees or IRA maintenance fees described above or the expenses of the underlying funds. Therefore, the second line of the table is useful in comparing ongoing costs only, and will not help you determine the relative cost of owning different funds. In addition, if these transactional costs were included, your cost could have been higher.
| | | | | | | Expenses Paid |
| | | Beginning | | Ending | | During the Period* |
| | | Account Value | | Account Value | | June 1, 2020 to |
| | | June 1, 2020 | | November 30, 2020 | | November 30, 2020 |
| |
| Actual | | $1,000.00 | | $1,238.20 | | $6.49 |
| |
| Hypothetical | | $1,000.00 | | $1,019.20 | | $5.86 |
| (5% annual return | | | | | | |
| before expenses) | | | | | | |
| * | Expenses are equal to the Fund’s annualized expense ratio of 1.16%, multiplied by the average account value over the period, multiplied by 183/366 (to reflect the one-half year period). |
| |
2020 Annual Report 21
ADDITIONAL INFORMATION
November 30, 2020
(Unaudited) |
AVAILABILITY OF QUARTERLY SCHEDULE OF INVESTMENTS
The Fund publicly files its complete schedule of portfolio holdings with the Securities and Exchange Commission (“SEC”) for the first and third quarters of each fiscal year on Form N-PORT. The Fund’s Forms N-PORT are available on the SEC’s website at http://www.sec.gov.
Christopher Weil & Company, Inc., the Fund’s Advisor, is responsible for exercising the voting rights associated with the securities held by the Fund. A description of the policies and procedures used by the Advisor in fulfilling this responsibility is available without charge on the Fund’s website at www.cweil.com. It is also included in the Fund’s Statement of Additional Information, which is available on the SEC’s website at http://www.sec.gov.
Information regarding how the Fund voted proxies, Form N-PX, relating to portfolio securities during the most recent 12-month period ended June 30 is available without charge, upon request, by calling our toll free number(1-888-550-9266). This information is also available on the SEC’s website at http://www.sec.gov.
You will find more information about the Fund at www.cweil.com. For shareholder inquiries, please call toll-free in the U.S. at 1-888-550-9266.
2020 Annual Report 22
Trustees and Officers
(Unaudited) |
The Board of Trustees supervises the business activities of the Trust. The names of the Trustees and executive officers of the Trust are shown below. For more information regarding the Trustees, please refer to the Statement of Additional Information, which is available upon request by calling 1-888-550-9266. Each Trustee serves until the Trustee sooner dies, resigns, retires, or is removed.
The Trustees and Officers of the Trust and their principal business activities during the past five years are:
Interested Trustees and Officers
| | | | | Number of | |
| | | | Principal | Portfolios In | Other |
| Name, | Position(s) | Term of Office | Occupation(s) | Fund | Directorships |
| Address(1), | Held With | and Length of | During | Complex | Held By |
| and Year of Birth | the Trust | Time Served | Past 5 Years | Overseen By | Trustee |
| | | | | Trustee | |
| |
| Ross C. Provence, | President | Indefinite Term; | General Partner and Portfolio | N/A | N/A |
| Year of Birth: 1938 | | Since 2000 | Manager for Value Trend Capital | | |
| | | | Management, LP (1995 to current). | | |
| | | | Estate planning attorney (1963 to | | |
| current). |
| |
| Jeffrey R. Provence(2), | Trustee, | Indefinite Term; | CEO, Premier Fund Solutions, Inc. | 13 | Blue Chip |
| Year of Birth: 1969 | Secretary | Since 2000 | (2001 to current). General Partner | | Investor Funds, |
| | and | | and Portfolio Manager for Value | | Meeder Funds |
| | Treasurer | | Trend Capital Management, LP | | |
| | | | (1995 to current). | | |
| |
| Julian G. Winters, | Chief | Indefinite Term; | Managing Member, Watermark | N/A | N/A |
| Year of Birth: 1968 | Compliance | Since 2010 | Solutions LLC (investment compli- | | |
| | Officer | | ance and consulting) (2007 to cur- | | |
| rent). |
(1) The address of each trustee and officer is c/o PFS Funds, 1939 Friendship Drive, Suite C, El Cajon, California 92020.
(2) Jeffrey R. Provence is considered an "interested person" as defined in Section 2(a)(19) of the Investment Company Act of 1940 by virtue of his position with the Trust.
Independent Trustees
| | | | | Number of | |
| | | | Principal | Portfolios In | Other |
| Name, | Position | Term of Office | Occupation(s) | Fund | Directorships |
| Address(1), | Held With | and Length of | During | Complex | Held By |
| and Year of Birth | the Trust | Time Served | Past 5 Years | Overseen By | Trustee |
| | | | | Trustee | |
| |
| Thomas H. Addis III, | Independent | Indefinite Term; | Executive Director/CEO, Southern | 13 | None |
| Year of Birth: 1945 | Trustee | Since 2000 | California PGA (2006 to current). | | |
| |
| Allen C. Brown, | Independent | Indefinite Term; | Law Office of Allen C. Brown, estate | 13 | Blue Chip |
| Year of Birth: 1943 | Trustee | Since 2010 | planning and business attorney | | Investor Funds |
| | | | (1970 to current). | | |
| |
| George Cossolias, CPA, | Independent | Indefinite Term; | Partner of CWDL, CPAs (February 1, | 13 | Blue Chip |
| Year of Birth: 1935 | Trustee | Since 2000 | 2014 to current). Owner of George | | Investor Funds, |
| | | | Cossolias & Company, CPAs (1972 | | Neiman Funds |
| | | | to January 31, 2014). President of | | |
| | | | Lubrication Specialists, Inc. (1996 to | | |
| current). |
(1) The address of each trustee and officer is c/o PFS Funds, 1939 Friendship Drive, Suite C, El Cajon, California 92020.
2020 Annual Report 23
Investment Advisor
Christopher Weil & Company, Inc.
Custodian
US Bank, N.A.
Distributor
Rafferty Capital Markets, LLC
Fund Administrator
Premier Fund Solutions, Inc.
Independent Registered
Public Accounting Firm
Cohen & Company, Ltd.
Legal Counsel
Practus, LLP
Transfer Agent
Mutual Shareholder Services, LLC |
This report is provided for the general information of the shareholders of the Christopher
Weil & Company Core Investment Fund. This report is not intended for distribution to
prospective investors in the Fund, unless preceded or accompanied by an effective
prospectus. |
Christopher Weil & Company Funds
11236 El Camino Real, Suite 200
San Diego, California 92130
1-888-550-9266 OR 1-800-355-9345
www.cweil.com |
Item 2. Code of Ethics.
The registrant has adopted a code of ethics that applies to the registrant’s principal executive officer and the principal financial officer. The registrant has not made any amendments to its code of ethics during the covered period. The registrant has not granted any waivers from any provisions of the code of ethics during the covered period. A copy of the registrant’s Code of Ethics is filed herewith.
Item 3. Audit Committee Financial Expert.
The registrant’s Board of Trustees has determined that George Cossolias is an audit committee finical expert. Mr. Cossolias is independent for purposes of this Item 3.
Item 4. Principal Accountant Fees and Services.
(a-d) The following table details the aggregate fees billed for each of the last two fiscal years for audit fees, audit-related fees, tax fees and other fees by the principal accountant to the registrant. The principal accountant has provided no services to the adviser or any entity controlled by, or under common control with the adviser that provides ongoing services to the registrant.
| | | FYE 11/30/2020 | | FYE 11/30/2019 |
| Audit Fees | | $13,750 | | $13,750 |
| Audit-Related Fees | | $0 | | $0 |
| Tax Fees | | $3,000 | | $3,000 |
| All Other Fees | | $3,750 | | $750 |
Nature of Tax Fees: preparation of Excise Tax Statement and 1120 RIC.
All Other Fees: Semi-Annual Report Review and Equalization
(e) (1) The audit committee approves all audit and non-audit related services and, therefore, has not adopted pre-approval policies and procedures described in paragraph (c)(7) of Rule 2-01 of Regulation S-X.
(e) (2) None of the services described in paragraph (b) through (d) of this Item were approved by the audit committee pursuant to paragraph (c)(7)(i)(C) of Rule 2-01 of Regulation S-X.
(f) All of the principal accountant’s hours spent on auditing the registrant’s financial statements were attributed to work performed by full-time permanent employees of the principal accountant.
(g) The following table indicates the aggregate non-audit fees billed by the registrant’s principal accountant for services to the registrant , the registrant’s investment adviser (not sub-adviser), and any entity controlling, controlled by, or under common control with the adviser that provides ongoing services to the registrant, for the last two years.
| Non-Audit Fees | | FYE 11/30/2020 | | FYE 11/30/2019 |
| Registrant | | $6,750 | | $3,750 |
| Registrant’s Investment Adviser | | $0 | | $0 |
(h) The principal accountant provided no services to the investment adviser or any entity controlling, controlled by, or under common control with the adviser that provides ongoing services to the registrant.
Item 5. Audit Committee of Listed Companies. Not applicable.
Item 6. Investments.
(a) Not applicable. Schedule filed with Item 1.
(b) Not applicable.
Item 7. Disclosure of Proxy Voting Policies and Procedures for Closed-End Management Investment Companies. Not applicable.
Item 8. Portfolio Managers of Closed End Management Investment Companies. Not applicable.
Item 9. Purchases of Equity Securities by Closed-End Management Investment Companies and Affiliated Purchasers. Not applicable.
Item 10. Submission of Matters to a Vote of Security Holders.
The registrant has not adopted procedures by which shareholders may recommend nominees to the registrant’s board of trustees.
Item 11. Controls and Procedures.
(a) The Registrant’s president and chief financial officer concluded that the disclosure controls and procedures (as defined in Rule 30a-3(c) under the Act (17 CFR 270.30a -3(c))) as of a date within 90 days of the filing date of the report that includes the disclosure required by this paragraph, based on the evaluation of these controls and procedures required by Rule 30a-3(b) under the Act (17 CFR 270.30a -3(b)) and Rules 13a-15(b) or 15d-15(b) under the Exchange Act (17 CFR 240.13a -15(b) or 240.15d -15(b)).
(b) There were no changes in the registrant’s internal control over financial reporting (as defined in Rule 30a-3(d) under the Act (17 CFR 270.30a -3(d)) that occurred during the period covered by this report that has materially affected, or is reasonably likely to materially affect, the registrant’s internal control over financial reporting.
Item 12. Disclosure of Securities Lending Activities for Closed-End Management Investment Companies.
Not applicable.
Item 13. Exhibits.
(a)(1) Code of Ethics. Filed herewith.
(a)(2) Certifications pursuant to Section 302 of the Sarbanes-Oxley Act of 2002. Filed herewith.
(a)(3) Not applicable.
(a)(4) Not applicable.
(b) Certification pursuant to Section 906 of the Sarbanes-Oxley Act of 2002. Filed herewith.
Pursuant to the requirements of the Securities Exchange Act of 1934 and the Investment Company Act of 1940, the registrant has duly caused this report to be signed on its behalf by the undersigned, thereunto duly authorized.
| | By: /s/Ross C. Provence
Ross C. Provence
President |
Pursuant to the requirements of the Securities Exchange Act of 1934 and the Investment Company Act of 1940, this report has been signed below by the following persons on behalf of the registrant and in the capacities and on the dates indicated.
| | By: /s/Ross C. Provence
Ross C. Provence
President |
| | By: /s/Jeffrey R. Provence
Jeffrey R. Provence
Chief Financial Officer |