UNITED STATES
SECURITIES AND EXCHANGE COMMISSION
WASHINGTON, D.C. 20549
CERTIFIED SHAREHOLDER REPORT OF REGISTERED MANAGEMENT
INVESTMENT COMPANIES
Investment Company Act file number 811-09781
PFS Funds
(Exact name of registrant as specified in charter)
| 1939 Friendship Drive, Suite C, El Cajon, CA 92020 |
| (Address of principal executive offices) | (Zip code) |
CT Corporation System
155 Federal St., Suite 700, Boston, MA 02110
(Name and address of agent for service) |
Registrant’s telephone number, including area code: (619) 588-9700
Date of fiscal year end: June 30
Date of reporting period: June 30, 2021
| Item 1. Report to Stockholders. |
Conquer Risk Funds
Conquer Risk Defensive Bull Fund
Ticker CRDBX
Conquer Risk Managed Volatility Fund
Ticker CRMVX
Conquer Risk Tactical Opportunities Fund
Ticker CRTOX
Conquer Risk Tactical Rotation Fund
Ticker CRTBX
ANNUAL REPORT
June 30, 2021 |
| Table of Contents | |
| |
| |
| |
| CONQUER RISK FUNDS | |
| Shareholder Report | 2 |
| Sector Allocation | 4 |
| Performance Information | 6 |
| Schedules of Investments | 10 |
| Statements of Assets and Liabilities | 14 |
| Statements of Operations | 14 |
| Statements of Changes in Net Assets | 16 |
| Financial Highlights | 18 |
| NOTES TO FINANCIAL STATEMENTS | 22 |
| REPORT OF INDEPENDENT REGISTERED PUBLIC ACCOUNTING FIRM | 28 |
| DISCLOSURE OF EXPENSES | 29 |
| ADDITIONAL INFORMATION | 31 |
| TRUSTEES & OFFICERS | 32 |
2021 Annual Report 1
Shareholder Report
June 30, 2021 |
Potomac Fund Management
From a thematic perspective, the fiscal year ended June 30, 2021, can best be described as a “tale of two halves.” The key driver in the first half of the year was the “reopening.” Positive news relating to COVID-19 vaccines stoked the flames of a return to normalcy after the virus shut down the global economy.
With the global economy effectively shut down for much of the first half of calendar year (CY) 2020, the prospects for a reopening created a scenario where growth numbers were going to be strong in the first half of CY2021. Given this dynamic, investors felt less compelled to own the secular growth themes in the equity market during the final quarter of CY2020 and in the first quarter of CY2021. The thinking being that if economic growth is no longer scarce, there is less of a need to pay a premium price for the sectors of the market that are growing the fastest. Longtime leaders, such as Technology, Consumer Discretionary, and Communication Services, began to move aside on a relative basis. In their place, the cyclical areas of the market began to attract investor capital. Sectors such as Materials and Industrials, which had been long time laggards, began to outperform, especially within the small cap universe.
At the same time, the impacts of a massive, globally coordinated, stimulus effort aimed at aiding those who were most impacted by the pandemic were beginning to reverberate through the markets in the form of higher inflation expectations. This led to a selloff in the treasury market, pushing yields higher and causing the yield curve to steepen. The steeper curve was a benefit to Financials, a sector of the market that had been lagging for more than two years. This led to a positive contribution from a long position in the Regional Banking ETF (KRE) in the first quarter of CY2021.
The prospect for higher inflation also was a boon for the commodity markets and the equities that are leveraged to them. After trading in negative territory in April 2020, the price of Crude Oil rebounded to close above $70 per barrel on June 30, 2021. This rebound in the price of oil had a generally positive impact on stocks in the Energy sector, which also benefitted from the prospects of an economic reopening. In addition to Crude Oil, Agricultural Commodities and Industrial Metals had a bullish trend during the back half of CY2020 and the first quarter of CY2021. Long positions in the Global X Copper Miners ETF (COPX) and the VanEck Vectors Steel ETF (SLX) provided exposure to this trend and were a positive impact on the performance.
As these themes and trends unfolded, Potomac’s tactical framework, which is mostly driven by momentum, was able to identify them and benefit from their rising tide through the end of the first quarter of CY2021. During this timeframe, long positions in ETFs such as the iShares Russell 2000 ETF (IWM), the Arrow Reverse Cap 500 ETF (YPS), the Energy Select Sector SPDR Fund (XLE), and the Industrial Select Sector SPDR Fund (XLI) had a positive impact on performance.
However, during the second quarter of CY2021 (the Funds’ fiscal 4Q), the market appeared to have begun to fully appreciate these themes and to start to rotate once again. Investors began to question the persistence of rising inflation, especially as the Federal Reserve insisted those inflationary pressures were likely “transitory” in nature. The cyclical/value themes began to turn lower, leading to a negative impact on performance as the quarter progressed. Exposure to the SPDR S&P Metals and Mining ETF (XME) was a drag on performance as the fiscal year ended. At the same time, interest rates began to move lower which had a negative impact on our long position in the Financial Select Sector SPDR ETF (XLF).
Our momentum strategy is a form of trend following. There must be a trend in place to follow it. This leads to a lag effect. The strong performance further in the past of the defined look-back period takes time to cycle out of the momentum metrics, leaving them vulnerable during
2021 Annual Report 2
periods of rotation. By the same token, new leadership takes time to be identified. This is precisely what played out during the final quarter of the fiscal year. Cyclical themes began to lag in the short term but remained in the portfolio due to their strength over the preceding six months.
Our approach remains systematic and does not aim to predict what trends will unfold next. As the new fiscal year begins, there are early signs that the trends which were in place for much of the previous year may be ending. Should this be the case, our goal is to identify new trends, that are likely to persist, as early as possible and position in line with them, confident that this is the best path for long-term investment success.
Fund Performance (FY Ending June 30, 2021):
Conquer Risk Defensive Bull Fund
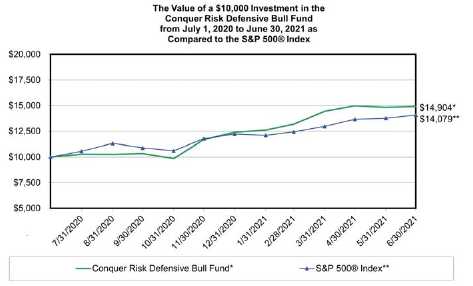
For the fiscal year ended June 30, 2021, the Conquer Risk Defensive Bull Fund returned 49.04% . The Fund’s benchmark index, the S&P 500 Index, returned 40.79% in the same period. Performance was driven by the overall trend higher for the S&P 500 and enhanced by the Fund’s ability to own leveraged ETFs to take advantage of that bullish trend.
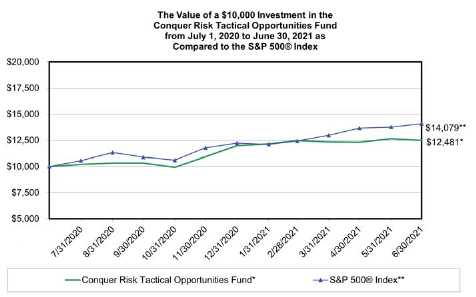
Conquer Risk Tactical Opportunities Fund
For the fiscal year ended June 30, 2021, the Conquer Risk Tactical Opportunities Fund returned 24.81% while its benchmark index, the S&P 500 Index, returned 40.79% in the same period. The Tactical Opportunities Fund seeks granular exposure to specific themes and trends that are playing out in asset markets. Performance was helped by a rotation into the areas of the market that benefitted from the prospects of an economic reopening as well as the scope for higher-than-expected inflation. A rotation away from these themes during the final quarter of the fiscal year had a negative impact on performance.
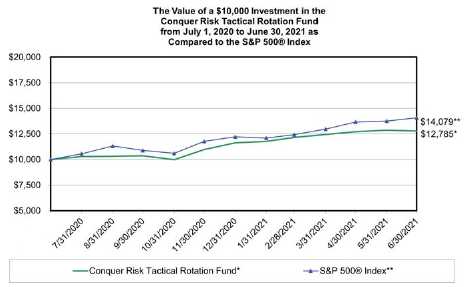
Conquer Risk Tactical Rotation Fund
For the fiscal year ended June 30, 2021, the Conquer Risk Tactical Rotation Fund returned 27.85% while its benchmark index, the S&P 500 Index, returned 40.79% in the same period. The Tactical Rotation Fund seeks to identify broad-based trends and themes across asset markets. Performance was helped by a rotation into the areas of the market that benefitted from the prospects of an economic reopening as well as the scope for higher-than-expected inflation. A rotation away from these themes during the final quarter of the fiscal year had a negative impact on performance.
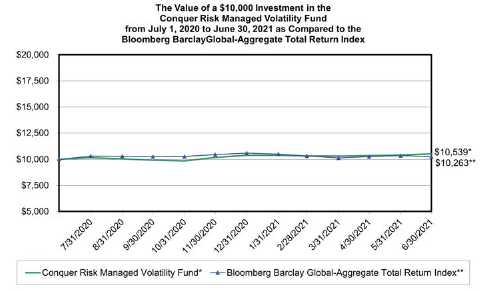
Conquer Risk Managed Volatility Fund
For the fiscal year ended June 30, 2021, the Conquer Risk Managed Volatility Fund returned 5.39% while its benchmark index, the Bloomberg Barclays Global Aggregate Total Return Index, returned 2.63% . Performance was helped by exposure to fixed income funds that benefit from rising inflation expectations as well as funds that were tied to the economic reopening theme.
Past performance does not guarantee future results. The investment return and principal value of an investment in the Funds will fluctuate so that an investor’s shares, when redeemed, may be worth more or less than their original cost. Current performance may be higher or lower than the performance data quoted. Performance data current to the most recent month end are available by calling 1-888-774-6679.
The Conquer Risk Funds’ prospectus contains important information about the Funds’ investment objectives, potential risks, management fees, charges and expenses, and other information and should be read and considered carefully before investing. You may obtain a current copy of the Funds’ prospectus by calling 1-888-774-6679. Distributed by Rafferty Capital Markets, LLC-Garden City, NY 11530.
2021 Annual Report 3
Conquer Risk Funds (Unaudited)
CONQUER RISK DEFENSIVE BULL FUND
Sector Allocation as of June 30, 2021
(As a Percentage of Total Investments Held)

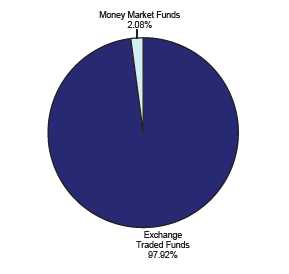
CONQUER RISK MANAGED VOLATILITY FUND
Sector Allocation as of June 30, 2021
(As a Percentage of Total Investments Held)
2021 Annual Report 4
Conquer Risk Funds (Unaudited)
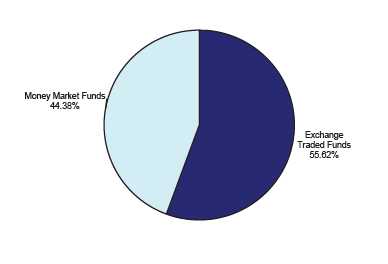
CONQUER RISK TACTICAL OPPORTUNITIES FUND
Sector Allocation as of June 30, 2021
(As a Percentage of Total Investments Held)
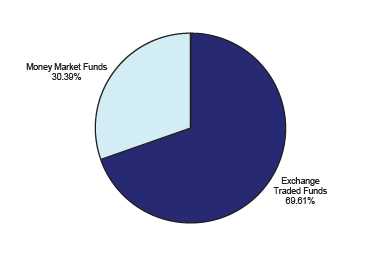
CONQUER RISK TACTICAL ROTATION FUND
Sector Allocation as of June 30, 2021
(As a Percentage of Total Investments Held)
2021 Annual Report 5
Conquer Risk Defensive Bull Fund (Unaudited)
| PERFORMANCE INFORMATION | | |
| |
| TOTAL RETURNS AS OF JUNE 30, 2021 | | |
| | | |
| June 30, 2021 NAV $14.66 | | |
| |
| | Since | |
| | Inception(A) | |
| Conquer Risk Defensive Bull Fund | 49.04% | |
| S&P 500® Index (B) | 40.79% | |
Annual Fund Operating Expense Ratio (from 7/1/2020 Prospectus): 2.03%
The Fund’s expense ratio for the period ended June 30, 2021 can be found in the financial highlights included within this report. The Annual Fund Operating Expense Ratio reported above may not correlate to the expense ratio in the Fund’s financial highlights because (a) of the use of breakpoints and the voluntary waiver which was implemented June 1, 2021 as described in Note 4 and (b) the financial highlights include only the direct operating expenses incurred by the Fund, not the indirect costs of investing in acquired funds.
(A)Since Inception returns include change in share prices and in each case includes reinvestment of any dividends and capital gain distributions. The Conquer Risk Defensive Bull Fund commenced operations on July 1, 2020.
(B)The S&P 500® Index is a widely recognized unmanaged index of equity prices and is representative of a broader market and range of securities than is found in the Fund’s portfolio. The Index is an unmanaged benchmark that assumes reinvestment of all distributions and excludes the effect of taxes and fees. Individuals cannot invest directly in this Index; however, an individual can invest in exchange traded funds or other investment vehicles that attempt to track the performance of a benchmark index.
PAST PERFORMANCE DOES NOT GUARANTEE FUTURE RESULTS. INVESTMENT RETURN AND PRINCIPAL VALUE WILL FLUCTUATE SO THAT SHARES, WHEN REDEEMED, MAY BE WORTH MORE OR LESS THAN THEIR ORIGINAL COST. RETURNS DO NOT REFLECT THE DEDUCTION OF TAXES THAT A SHAREHOLDER WOULD PAY ON FUND DISTRIBUTIONS OR THE REDEMPTION OF FUND SHARES. CURRENT PERFORMANCE MAY BE LOWER OR HIGHER THAN THE PERFORMANCE DATA QUOTED. TO OBTAIN PERFORMANCE DATA CURRENT TO THE MOST RECENT MONTH END, PLEASE CALL 1-888-774-6679. AN INVESTMENT IN THE FUND IS SUBJECT TO INVESTMENT RISKS, INCLUDING THE POSSIBLE LOSS OF THE PRINCIPAL AMOUNT INVESTED. THE FUND'S DISTRIBUTOR IS RAFFERTY CAPITAL MARKETS, LLC.
2021 Annual Report 6
Conquer Risk Managed Volatility Fund (Unaudited)
| PERFORMANCE INFORMATION | | |
| | | |
| TOTAL RETURNS AS OF JUNE 30, 2021 | | |
| | | |
| June 30, 2021 NAV $10.44 | | |
| | Since | |
| | Inception(A) | |
| Conquer Risk Managed Volatility Fund | 5.39% | |
| Bloomberg Barclay Global-Aggregate Total Return Index (B) | 2.63% | |
Annual Fund Operating Expense Ratio (from 7/1/2020 Prospectus): 2.00%
The Fund’s expense ratio for the period ended June 30, 2021 can be found in the financial highlights included within this report. The Annual Fund Operating Expense Ratio reported above may not correlate to the expense ratio in the Fund’s financial highlights because (a) of the use of breakpoints and the voluntary waiver which was implemented June 1, 2021 as described in Note 4 and (b) the financial highlights include only the direct operating expenses incurred by the Fund, not the indirect costs of investing in acquired funds.
(A)Since Inception returns include change in share prices and in each case includes reinvestment of any dividends and capital gain distributions. The Conquer Risk Managed Volatility Fund commenced operations on July 1, 2020.
(B)The Bloomberg Barclay Global-Aggregate Total Return Index measures the performance of global investment grade fixed income securities. The Index is widely used as a benchmark for fixed income securities. Individuals cannot invest directly in this Index.
PAST PERFORMANCE DOES NOT GUARANTEE FUTURE RESULTS. INVESTMENT RETURN AND PRINCIPAL VALUE WILL FLUCTUATE SO THAT SHARES, WHEN REDEEMED, MAY BE WORTH MORE OR LESS THAN THEIR ORIGINAL COST. RETURNS DO NOT REFLECT THE DEDUCTION OF TAXES THAT A SHAREHOLDER WOULD PAY ON FUND DISTRIBUTIONS OR THE REDEMPTION OF FUND SHARES. CURRENT PERFORMANCE MAY BE LOWER OR HIGHER THAN THE PERFORMANCE DATA QUOTED. TO OBTAIN PERFORMANCE DATA CURRENT TO THE MOST RECENT MONTH END, PLEASE CALL 1-888-774-6679. AN INVESTMENT IN THE FUND IS SUBJECT TO INVESTMENT RISKS, INCLUDING THE POSSIBLE LOSS OF THE PRINCIPAL AMOUNT INVESTED. THE FUND'S DISTRIBUTOR IS RAFFERTY CAPITAL MARKETS, LLC.
2021 Annual Report 7
Conquer Risk Tactical Opportunities Fund (Unaudited)
| PERFORMANCE INFORMATION | | |
| | | |
| TOTAL RETURNS AS OF JUNE 30, 2021 | | |
| | | |
| June 30, 2021 NAV $12.12 | | |
| | Since | |
| | Inception(A) | |
| Conquer Risk Tactical Opportunities Fund | 24.81% | |
| S&P 500® Index (B) | 40.79% | |
Annual Fund Operating Expense Ratio (from 7/1/2020 Prospectus): 2.07%
The Fund’s expense ratio for the period ended June 30, 2021 can be found in the financial highlights included within this report. The Annual Fund Operating Expense Ratio reported above may not correlate to the expense ratio in the Fund’s financial highlights because (a) of the use of breakpoints and the voluntary waiver which was implemented June 1, 2021 as described in Note 4 and (b) the financial highlights include only the direct operating expenses incurred by the Fund, not the indirect costs of investing in acquired funds.
(A)Since Inception returns include change in share prices and in each case includes reinvestment of any dividends and capital gain distributions. The Conquer Risk Tactical Opportunities Fund commenced operations on July 1, 2020.
(B)The S&P 500® Index is a widely recognized unmanaged index of equity prices and is representative of a broader market and range of securities than is found in the Fund’s portfolio. The Index is an unmanaged benchmark that assumes reinvestment of all distributions and excludes the effect of taxes and fees. Individuals cannot invest directly in this Index; however, an individual can invest in exchange traded funds or other investment vehicles that attempt to track the performance of a benchmark index.
PAST PERFORMANCE DOES NOT GUARANTEE FUTURE RESULTS. INVESTMENT RETURN AND PRINCIPAL VALUE WILL FLUCTUATE SO THAT SHARES, WHEN REDEEMED, MAY BE WORTH MORE OR LESS THAN THEIR ORIGINAL COST. RETURNS DO NOT REFLECT THE DEDUCTION OF TAXES THAT A SHAREHOLDER WOULD PAY ON FUND DISTRIBUTIONS OR THE REDEMPTION OF FUND SHARES. CURRENT PERFORMANCE MAY BE LOWER OR HIGHER THAN THE PERFORMANCE DATA QUOTED. TO OBTAIN PERFORMANCE DATA CURRENT TO THE MOST RECENT MONTH END, PLEASE CALL 1-888-774-6679. AN INVESTMENT IN THE FUND IS SUBJECT TO INVESTMENT RISKS, INCLUDING THE POSSIBLE LOSS OF THE PRINCIPAL AMOUNT INVESTED. THE FUND'S DISTRIBUTOR IS RAFFERTY CAPITAL MARKETS, LLC.
2021 Annual Report 8
Conquer Risk Tactical Rotation Fund (Unaudited)
| PERFORMANCE INFORMATION | | |
| | | |
| TOTAL RETURNS AS OF JUNE 30, 2021 | | |
| |
| June 30, 2021 NAV $12.43 | | |
| | Since | |
| | Inception(A) | |
| Conquer Risk Tactical Rotation Fund | 27.85% | |
| S&P 500® Index (B) | 40.79% | |
Annual Fund Operating Expense Ratio (from 7/1/2020 Prospectus): 2.05%
The Fund’s expense ratio for the period ended June 30, 2021 can be found in the financial highlights included within this report. The Annual Fund Operating Expense Ratio reported above may not correlate to the expense ratio in the Fund’s financial highlights because (a) of the use of breakpoints and the voluntary waiver which was implemented June 1, 2021 as described in Note 4 and (b) the financial highlights include only the direct operating expenses incurred by the Fund, not the indirect costs of investing in acquired funds.
(A)Since Inception returns include change in share prices and in each case includes reinvestment of any dividends and capital gain distributions. The Conquer Risk Tactical Rotation Fund commenced operations on July 1, 2020.
(B)The S&P 500® Index is a widely recognized unmanaged index of equity prices and is representative of a broader market and range of securities than is found in the Fund’s portfolio. The Index is an unmanaged benchmark that assumes reinvestment of all distributions and excludes the effect of taxes and fees. Individuals cannot invest directly in this Index; however, an individual can invest in exchange traded funds or other investment vehicles that attempt to track the performance of a benchmark index.
PAST PERFORMANCE DOES NOT GUARANTEE FUTURE RESULTS. INVESTMENT RETURN AND PRINCIPAL VALUE WILL FLUCTUATE SO THAT SHARES, WHEN REDEEMED, MAY BE WORTH MORE OR LESS THAN THEIR ORIGINAL COST. RETURNS DO NOT REFLECT THE DEDUCTION OF TAXES THAT A SHAREHOLDER WOULD PAY ON FUND DISTRIBUTIONS OR THE REDEMPTION OF FUND SHARES. CURRENT PERFORMANCE MAY BE LOWER OR HIGHER THAN THE PERFORMANCE DATA QUOTED. TO OBTAIN PERFORMANCE DATA CURRENT TO THE MOST RECENT MONTH END, PLEASE CALL 1-888-774-6679. AN INVESTMENT IN THE FUND IS SUBJECT TO INVESTMENT RISKS, INCLUDING THE POSSIBLE LOSS OF THE PRINCIPAL AMOUNT INVESTED. THE FUND'S DISTRIBUTOR IS RAFFERTY CAPITAL MARKETS, LLC.
| Conquer Risk Defensive Bull Fund |
| | | | Schedule of Investments |
| | | | | | June 30, 2021 |
| Shares | | | Fair Value | | % of Net Assets |
| EXCHANGE TRADED FUNDS | | | | | |
| Equity | | | | | | |
| 374,370 | Direxion Daily S&P 500 Bull 3X Shares | $ | 39,900,355 | | | |
| 354,279 | iShares Core S&P 500 ETF * | | 152,311,628 | | | |
| 351,833 | ProShares UltraPro S&P500 | | 39,894,344 | | | |
| Total for Exchange Traded Funds (Cost - $231,590,299) | | 232,106,327 | | 99.25 | % |
| MONEY MARKET FUNDS | | | | | |
| 616,161 | First American Government Obligations Fund - Class X 0.03% ** | | 616,161 | | 0.26 | % |
| Total for Money Market Funds (Cost $616,161) | | | | | |
| | Total Investments (Cost - $232,206,460) | | 232,722,488 | | 99.51 | % |
| | Other Assets in Excess of Liabilities | | 1,136,926 | | 0.49 | % |
| | Net Assets | $ | 233,859,414 | | 100.00 | % |
| | * Additional Information, including current Prospectus and Annual Reports, is available at
https://www.ishares.com/prospectus/
** The rate shown represents the 7-day yield at June 30, 2021. |
The accompanying notes are an integral part of these
financial statements. |
2021 Annual Report 10
| Conquer Risk Managed Volatility Fund |
| | | | Schedule of Investments |
| | | | | | | June 30, 2021 |
| Shares | | | Fair Value | | | % of Net Assets |
| EXCHANGE TRADED FUNDS | | | | | | |
| Fixed Income | | | | | | |
| 67,914 | iShares J.P. Morgan USD Emerging Markets Bond ETF * | $ | 7,637,608 | | | | |
| 125,791 | SPDR Nuveen Bloomberg Barclays High Yield Municipal Bond ETF ** | | 7,650,609 | | | | |
| 233,551 | VanEck Vectors Fallen Angel High Yield Bond ETF *** | | 7,683,828 | | | | |
| 69,067 | Vanguard Long-Term Corporate Bond ETF **** | | 7,386,025 | | | | |
| Total for Exchange Traded Funds (Cost - $29,876,847) | | 30,358,070 | | | 97.95 | % |
| MONEY MARKET FUNDS | | | | | | |
| 644,770 | First American Government Obligations Fund - Class X 0.03% + | | 644,770 | | | 2.08 | % |
| Total for Money Market Funds (Cost $644,770) | | | | | | |
| | Total Investments (Cost - $30,521,617) | | 31,002,840 | | | 100.03 | % |
| | Liabilities in Excess of Other Assets | | (10,785 | ) | | -0.03 | % |
| | Net Assets | $ | 30,992,055 | | | 100.00 | % |
| | * Additional Information, including current Prospectus and Annual Reports, is available at
https://www.ishares.com/prospectus
** Additional Information, including current Prospectus and Annual Reports, is available at
https://www.ssga.com/spdrs
*** Additional Information, including current Prospectus and Annual Reports, is available at
https://www.vaneck.com/resources/documents/equity-etfs-literature/
**** Additional Information, including current Prospectus and Annual Reports, is available at
www.vanguard.com/prospectus
+ The rate shown represents the 7-day yield at June 30, 2021. |
The accompanying notes are an integral part of these
financial statements. |
2021 Annual Report 11
| Conquer Risk Tactical Opportunities Fund |
| | | | Schedule of Investments |
| | | | | | | June 30, 2021 |
| Shares | | | Fair Value | | | % of Net Assets |
| |
| EXCHANGE TRADED FUNDS | | | | | | |
| Equity | | | | | | | |
| 149,652 | Global X Uranium ETF | $ | 3,172,622 | | | | |
| 428,757 | Invesco S&P SmallCap Energy ETF | | 3,442,919 | | | | |
| 22,245 | iShares Expanded Tech-Software Sector ETF | | 8,676,440 | | | | |
| 36,354 | SPDR S&P Retail ETF | | 3,534,699 | | | | |
| 14,676 | VanEck Vectors Oil Services ETF | | 3,213,017 | | | | |
| 35,212 | VanEck Vectors Steel ETF | | 2,181,735 | | | | |
| Total for Exchange Traded Funds (Cost - $24,215,069) | | 24,221,432 | | | 55.65 | % |
| MONEY MARKET FUNDS | | | | | | |
| 19,327,132 | First American Government Obligations Fund - Class X 0.03% * ** | | 19,327,132 | | | 44.41 | % |
| Total for Money Market Funds (Cost $19,327,132) | | | | | | |
| |
| | Total Investments (Cost - $43,542,201) | | 43,548,564 | | | 100.06 | % |
| | Liabilities in Excess of Other Assets | | (24,041 | ) | | -0.06 | % |
| | Net Assets | $ | 43,524,523 | | | 100.00 | % |
| | * Additional Information, including current Prospectus and Annual Reports, is available at
https://www.firstamericanfunds.com/index/FundPerformance/ShareholderDocuments.html.
** The rate shown represents the 7-day yield at June 30, 2021. |
The accompanying notes are an integral part of these
financial statements. |
2021 Annual Report 12
| Conquer Risk Tactical Rotation Fund |
| | | | Schedule of Investments |
| | | | | | June 30, 2021 |
| Shares | | | Fair Value | | % of Net Assets |
| |
| EXCHANGE TRADED FUNDS | | | | | |
| Equity | | | | | | |
| 23,491 | Invesco QQQ TrustSM, Series 1 | $ | 8,325,915 | | | |
| 90,578 | Invesco S&P 500 Equal Weight ETF * | | 13,652,822 | | | |
| 56,592 | Invesco S&P 500 High Beta ETF | | 4,276,657 | | | |
| 27,942 | iShares Micro-Cap ETF | | 4,263,949 | | | |
| 25,389 | iShares Russell 2000 Value ETF | | 4,208,735 | | | |
| 87,197 | The Real Estate Select Sector SPDR Fund | | 3,865,443 | | | |
| Total for Exchange Traded Funds (Cost - $38,592,852) | | 38,593,521 | | 69.54 | % |
| MONEY MARKET FUNDS | | | | | |
| 16,846,464 | First American Government Obligations Fund - Class X 0.03% ** + | | 16,846,464 | | 30.36 | % |
| Total for Money Market Funds (Cost $16,846,464) | | | | | |
| |
| | Total Investments (Cost - $55,439,316) | | 55,439,985 | | 99.90 | % |
| | Other Assets in Excess of Liabilities | | 57,286 | | 0.10 | % |
| | Net Assets | $ | 55,497,271 | | 100.00 | % |
| | * Additional Information, including current Prospectus and Annual Reports, is available at
www.invesco.com/etfprospectus
** The rate shown represents the 7-day yield at June 30, 2021.
+ Additional Information, including current Prospectus and Annual Reports, is available at
https://www.firstamericanfunds.com/index/FundPerformance/ShareholderDocuments.html. |
| | The accompanying notes are an integral part of these
financial statements. |
2021 Annual Report 13
| Conquer Risk Funds |
| | |
| Statements of Assets and Liabilities | | Defensive | | | | Managed | | |
| June 30, 2021 | | Bull Fund | | | | Volatility Fund | | |
| | |
| Assets: | | | | | | | | |
| Investment Securities at Fair Value* | $ | 232,722,488 | | | $ | 31,002,840 | | |
| Receivable for Fund Shares Sold | | 710,740 | | | | 35,431 | | |
| Receivable for Securities Sold | | 679,945 | | | | - | | |
| Dividends Receivable | | 4,035 | | | | 14 | | |
| Total Assets | | 234,117,208 | | | | 31,038,285 | | |
| Liabilities: | | | | | | | | |
| Payable for Fund Shares Redeemed | | 11,928 | | | | 2,994 | | |
| Management Fees Payable | | 203,697 | | | | 30,893 | | |
| Service Fees Payable | | 42,169 | | | | 12,343 | | |
| Total Liabilities | | 257,794 | | | | 46,230 | | |
| Net Assets | $ | 233,859,414 | | | $ | 30,992,055 | | |
| Net Assets Consist of: | | | | | | | | |
| Paid In Capital | $ | 185,982,994 | | | $ | 29,755,703 | | |
| Total Distributable Earnings | | 47,876,420 | | | | 1,236,352 | | |
| Net Assets | $ | 233,859,414 | | | $ | 30,992,055 | | |
| | |
| Net Asset Value, Offering Price and Redemption Price per Share | $ | 14.66 | | | $ | 10.44 | | |
| | |
| * Investments at Identified Cost | $ | 232,206,460 | | | $ | 30,521,617 | | |
| | |
| Shares Outstanding (Unlimited number of shares | | 15,956,936 | | | | 2,967,630 | | |
| authorized without par value) | | | | | | | | |
| | |
| Statements of Operations | | | | | | | | |
| For the period July 1, 2020** through June 30, 2021 | | | | | | | | |
| | |
| Investment Income: | | | | | | | | |
| Dividends | $ | 1,507,522 | | | $ | 791,933 | | |
| Total Investment Income | | 1,507,522 | | | | 791,933 | | |
| Expenses: | | | | | | | | |
| Management Fees (Note 4) | | 1,549,389 | | | | 298,748 | | |
| Service Fees (Note 4) | | 496,234 | | | | 151,746 | | |
| Total Expenses | | 2,045,623 | | | | 450,494 | | |
| Less: Expenses Waived | | (18,523 | ) | | | (2,471 | ) | |
| Net Expenses | | 2,027,100 | | | | 448,023 | | |
| | |
| Net Investment Income (Loss) | | (519,578 | ) | | | 343,910 | | |
| | |
| Realized and Unrealized Gain on Investments: | | | | | | | | |
| Net Realized Gain on Investments | | 49,831,551 | | | | 645,062 | | |
| Net Change in Net Unrealized Appreciation on Investments | | 516,028 | | | | 481,223 | | |
| Net Realized and Unrealized Gain on Investments | | 50,347,579 | | | | 1,126,285 | | |
| | |
| Net Increase in Net Assets from Operations | $ | 49,828,001 | | | $ | 1,470,195 | | |
** Commencement of Operations.
The accompanying notes are an integral part of these
financial statements. |
2021 Annual Report 14
| Conquer Risk Funds |
| | |
| Statements of Assets and Liabilities | | Tactical | | | | Tactical | | |
| June 30, 2021 | | Opportunities | | | | Rotation | | |
| | | Fund | | | | Fund | | |
| | |
| Assets: | | | | | | | | |
| Investment Securities at Fair Value* | $ | 43,548,564 | | | $ | 55,439,985 | | |
| Receivable for Fund Shares Sold | | 31,493 | | | | 130,894 | | |
| Dividends Receivable | | 4,156 | | | | 387 | | |
| Total Assets | | 43,584,213 | | | | 55,571,266 | | |
| Liabilities: | | | | | | | | |
| Payable for Fund Shares Redeemed | | 324 | | | | 700 | | |
| Management Fees Payable | | 44,335 | | | | 55,942 | | |
| Service Fees Payable | | 15,031 | | | | 17,353 | | |
| Total Liabilities | | 59,690 | | | | 73,995 | | |
| Net Assets | $ | 43,524,523 | | | $ | 55,497,271 | | |
| Net Assets Consist of: | | | | | | | | |
| Paid In Capital | $ | 37,548,400 | | | $ | 48,058,157 | | |
| Total Distributable Earnings | | 5,976,123 | | | | 7,439,114 | | |
| Net Assets | $ | 43,524,523 | | | $ | 55,497,271 | | |
| | |
| Net Asset Value, Offering Price and Redemption Price per Share | $ | 12.12 | | | $ | 12.43 | | |
| | |
| * Investments at Identified Cost | $ | 43,542,201 | | | $ | 55,439,316 | | |
| | |
| Shares Outstanding (Unlimited number of shares | | 3,590,364 | | | | 4,466,546 | | |
| authorized without par value) | | | | | | | | |
| | |
| Statements of Operations | | | | | | | | |
| For the period July 1, 2020** through June 30, 2021 | | | | | | | | |
| | |
| Investment Income: | | | | | | | | |
| Dividends | $ | 296,174 | | | $ | 601,132 | | |
| Total Investment Income | | 296,174 | | | | 601,132 | | |
| Expenses: | | | | | | | | |
| Management Fees (Note 4) | | 448,710 | | | | 465,403 | | |
| Service Fees (Note 4) | | 199,408 | | | | 204,081 | | |
| Total Expenses | | 648,118 | | | | 669,484 | | |
| Less: Expenses Waived | | (3,547 | ) | | | (4,475 | ) | |
| Net Expenses | | 644,571 | | | | 665,009 | | |
| | |
| Net Investment Income (Loss) | | (348,397 | ) | | | (63,877 | ) | |
| | |
| Realized and Unrealized Gain on Investments: | | | | | | | | |
| Net Realized Gain on Investments | | 7,270,662 | | | | 8,524,398 | | |
| Net Change in Net Unrealized Appreciation on Investments | | 6,363 | | | | 669 | | |
| Net Realized and Unrealized Gain on Investments | | 7,277,025 | | | | 8,525,067 | | |
| | |
| Net Increase in Net Assets from Operations | $ | 6,928,628 | | | $ | 8,461,190 | | |
** Commencement of Operations.
The accompanying notes are an integral part of these
financial statements. |
| Conquer Risk Funds |
| | |
| | | | | | | | | |
| Statements of Changes in Net Assets | | | | | | Managed Volatility | | |
| | | Defensive Bull Fund | | | | Fund | | |
| | | 7/1/2020* | | | | 7/1/2020* | | |
| | | to | | | | to | | |
| | | 6/30/2021 | | | | 6/30/2021 | | |
| From Operations: | | | | | | | | |
| Net Investment Income (Loss) | $ | (519,578 | ) | | $ | 343,910 | | |
| Net Realized Gain on Investments | | 49,831,551 | | | | 645,062 | | |
| Net Change in Unrealized Appreciation on Investments | | 516,028 | | | | 481,223 | | |
| Net Increase in Net Assets from Operations | | 49,828,001 | | | | 1,470,195 | | |
| From Distributions to Shareholders: | | (1,951,581 | ) | | | (233,843 | ) | |
| From Capital Share Transactions: | | | | | | | | |
| Proceeds From Sale of Shares | | 206,833,494 | | | | 47,952,624 | | |
| Shares Issued on Reinvestment of Dividends | | 1,951,233 | | | | 230,833 | | |
| Cost of Shares Redeemed | | (22,801,733 | ) | | | (18,427,754 | ) | |
| Net Increase from Shareholder Activity | | 185,982,994 | | | | 29,755,703 | | |
| | |
| Net Increase in Net Assets | | 233,859,414 | | | | 30,992,055 | | |
| | |
| Net Assets at Beginning of Period | | - | | | | - | | |
| | |
| Net Assets at End of Period | $ | 233,859,414 | | | $ | 30,992,055 | | |
| | |
| | |
| Share Transactions: | | | | | | | | |
| Issued | | 17,630,917 | | | | 4,747,604 | | |
| Reinvested | | 161,392 | | | | 22,411 | | |
| Redeemed | | (1,835,373 | ) | | | (1,802,385 | ) | |
| Net Increase in Shares | | 15,956,936 | | | | 2,967,630 | | |
| Shares Outstanding Beginning of Period | | - | | | | - | | |
| Shares Outstanding End of Period | | 15,956,936 | | | | 2,967,630 | | |
* Commencement of Operations.
The accompanying notes are an integral part of these
financial statements. |
2021 Annual Report 16
| Conquer Risk Funds |
| | |
| | | Tactical | | | | Tactical Rotation | | |
| Statements of Changes in Net Assets | | Opportunities Fund | | | | Fund | | |
| | | 7/1/2020* | | | | 7/1/2020* | | |
| | | to | | | | to | | |
| | | 6/30/2021 | | | | 6/30/2021 | | |
| From Operations: | | | | | | | | |
| Net Investment Loss | $ | (348,397 | ) | | $ | (63,877 | ) | |
| Net Realized Gain on Investments | | 7,270,662 | | | | 8,524,398 | | |
| Net Change in Unrealized Appreciation on Investments | | 6,363 | | | | 669 | | |
| Net Increase in Net Assets from Operations | | 6,928,628 | | | | 8,461,190 | | |
| | |
| From Distributions to Shareholders: | | (952,505 | ) | | | (1,022,076 | ) | |
| | |
| From Capital Share Transactions: | | | | | | | | |
| Proceeds From Sale of Shares | | 56,051,527 | | | | 58,806,437 | | |
| Shares Issued on Reinvestment of Dividends | | 952,467 | | | | 1,021,750 | | |
| Cost of Shares Redeemed | | (19,455,594 | ) | | | (11,770,030 | ) | |
| Net Increase from Shareholder Activity | | 37,548,400 | | | | 48,058,157 | | |
| Net Increase in Net Assets | | 43,524,523 | | | | 55,497,271 | | |
| | |
| Net Assets at Beginning of Period | | - | | | | - | | |
| | |
| Net Assets at End of Period | $ | 43,524,523 | | | $ | 55,497,271 | | |
| | |
| | |
| Share Transactions: | | | | | | | | |
| Issued | | 5,181,703 | | | | 5,420,846 | | |
| Reinvested | | 81,827 | | | | 90,501 | | |
| Redeemed | | (1,673,166 | ) | | | (1,044,801 | ) | |
| Net Increase in Shares | | 3,590,364 | | | | 4,466,546 | | |
| Shares Outstanding Beginning of Period | | - | | | | - | | |
| Shares Outstanding End of Period | | 3,590,364 | | | | 4,466,546 | | |
* Commencement of Operations.
The accompanying notes are an integral part of these
financial statements. |
2021 Annual Report 17
| Conquer Risk Defensive Bull Fund |
| | |
| | |
| Financial Highlights | | | | |
| | |
| Selected data for a share outstanding throughout the period: | | 7/1/2020* | | |
| | | to | | |
| | | 6/30/2021 | | |
| Net Asset Value - Beginning of Period | $ | 10.00 | | |
| Net Investment Loss (a) (e) | | (0.05 | ) | |
| Net Gain on Investments (Realized and Unrealized) (b) | | 4.91 | | |
| Total from Investment Operations | | 4.86 | | |
| Distributions (From Net Investment Income) | | - | | |
| Distributions (From Capital Gains) | | (0.20 | ) | |
| Total Distributions | | (0.20 | ) | |
| Net Asset Value - End of Period | $ | 14.66 | | |
| Total Return (c) | | 49.04 | % | |
| | |
| Ratios/Supplemental Data | | | | |
| Net Assets - End of Period (Thousands) | $ | 233,859 | | |
| | |
| Before Waiver | | | | |
| Ratio of Expenses to Average Net Assets (d) | | 1.55 | % | |
| Ratio of Net Investment Loss to Average Net Assets (d) (e) | | (0.41 | )% | |
| After Waiver | | | | |
| Ratio of Expenses to Average Net Assets (d) | | 1.53 | % | |
| Ratio of Net Investment Loss to Average Net Assets (d) (e) | | (0.39 | )% | |
| | |
| Portfolio Turnover Rate | | 1,657.50 | % | |
* Commencement of Operations.
(a) Per share amounts were calculated using the average shares method.
(b) Realized and unrealized gains and losses per share in this caption are balancing amounts necessary to reconcile the change in net asset value for the period, and may not reconcile with the aggregate gains and losses in the Statement of Operations due to share transactions for the period.
(c) Total return represents the rate that the investor would have earned or lost on an investment in the Fund assuming reinvestment of dividends and distributions, if any.
(d) These ratios exclude the impact of expenses of the underlying investment security holdings listed in the Schedule of Investments.
(e) Recognition of the net investment income/(loss) by the Fund is affected by the timing of the declaration of dividends by the underlying investment security holdings listed on the Schedule of Investments.
| | The accompanying notes are an integral part of these
financial statements. |
2021 Annual Report 18
| Conquer Risk Managed Volatility Fund |
| | |
| | |
| Financial Highlights | | | | | |
| | |
| Selected data for a share outstanding throughout the period: | | 7/1/2020* | | |
| | | to | | |
| | | 6/30/2021 | | |
| Net Asset Value - Beginning of Period | $ | 10.00 | | |
| Net Investment Income (a) (e) | | | 0.15 | | |
| Net Gain on Investments (Realized and Unrealized) (b) | | | 0.39 | | |
| Total from Investment Operations | | | 0.54 | | |
| Distributions (From Net Investment Income) | | | (0.10 | ) | |
| Distributions (From Capital Gains) | | | - | | |
| Total Distributions | | | (0.10 | ) | |
| | |
| Net Asset Value - End of Period | $ | 10.44 | | |
| Total Return (c) | | | 5.39 | % | |
| Ratios/Supplemental Data | | | | | |
| Net Assets - End of Period (Thousands) | $ | 30,992 | | |
| Before Waiver | | | | | |
| Ratio of Expenses to Average Net Assets (d) | | | 1.88 | % | |
| Ratio of Net Investment Income to Average Net Assets (d) (e) | | | 1.43 | % | |
| After Waiver | | | | | |
| Ratio of Expenses to Average Net Assets (d) | | | 1.87 | % | |
| Ratio of Net Investment Income to Average Net Assets (d) (e) | | | 1.44 | % | |
| Portfolio Turnover Rate | | | 519.72 | % | |
* Commencement of Operations.
(a) Per share amounts were calculated using the average shares method.
(b) Realized and unrealized gains and losses per share in this caption are balancing amounts necessary
to reconcile the change in net asset value for the period, and may not reconcile with the aggregate gains
and losses in the Statement of Operations due to share transactions for the period.
(c) Total return represents the rate that the investor would have earned or lost on an investment in the
Fund assuming reinvestment of dividends and distributions, if any.
(d) These ratios exclude the impact of expenses of the underlying investment security holdings listed in
the Schedule of Investments.
(e) Recognition of the net investment income/(loss) by the Fund is affected by the timing of the declara-
tion of dividends by the underlying investment security holdings listed on the Schedule of Investments. |
The accompanying notes are an integral part of these
financial statements. |
2021 Annual Report 19
| Conquer Risk Tactical Opportunities Fund |
| | |
| | |
| Financial Highlights | | | | |
| | |
| Selected data for a share outstanding throughout the period: | | 7/1/2020* | | |
| | | to | | |
| | | 6/30/2021 | | |
| Net Asset Value - Beginning of Period | $ | 10.00 | | |
| Net Investment Loss (a) (e) | | (0.11 | ) | |
| Net Gain on Investments (Realized and Unrealized) (b) | | 2.58 | | |
| Total from Investment Operations | | 2.47 | | |
| Distributions (From Net Investment Income) | | - | | |
| Distributions (From Capital Gains) | | (0.35 | ) | |
| Total Distributions | | (0.35 | ) | |
| Net Asset Value - End of Period | $ | 12.12 | | |
| Total Return (c) | | 24.81 | % | |
| | |
| Ratios/Supplemental Data | | | | |
| Net Assets - End of Period (Thousands) | $ | 43,525 | | |
| Before Waiver | | | | |
| Ratio of Expenses to Average Net Assets (d) | | 1.81 | % | |
| Ratio of Net Investment Loss to Average Net Assets (d) (e) | | (0.98 | )% | |
| After Waiver | | | | |
| Ratio of Expenses to Average Net Assets (d) | | 1.80 | % | |
| Ratio of Net Investment Loss to Average Net Assets (d) (e) | | (0.97 | )% | |
| Portfolio Turnover Rate | | 1,291.12 | % | |
* Commencement of Operations.
(a) Per share amounts were calculated using the average shares method.
(b) Realized and unrealized gains and losses per share in this caption are balancing amounts necessary
to reconcile the change in net asset value for the period, and may not reconcile with the aggregate gains
and losses in the Statement of Operations due to share transactions for the period.
(c) Total return represents the rate that the investor would have earned or lost on an investment in the
Fund assuming reinvestment of dividends and distributions, if any.
(d) These ratios exclude the impact of expenses of the underlying investment security holdings listed in
the Schedule of Investments.
(e) Recognition of the net investment income/(loss) by the Fund is affected by the timing of the declara-
tion of dividends by the underlying investment security holdings listed on the Schedule of Investments. |
The accompanying notes are an integral part of these
financial statements. |
2021 Annual Report 20
| Conquer Risk Tactical Rotation Fund |
| | |
| | |
| Financial Highlights | | | | |
| | |
| Selected data for a share outstanding throughout the period: | | 7/1/2020* | | |
| | | to | | |
| | | 6/30/2021 | | |
| Net Asset Value - Beginning of Period | $ | 10.00 | | |
| Net Investment Loss (a) (e) | | (0.02 | ) | |
| Net Gain on Investments (Realized and Unrealized) (b) | | 2.77 | | |
| Total from Investment Operations | | 2.75 | | |
| Distributions (From Net Investment Income) | | (0.02 | ) | |
| Distributions (From Capital Gains) | | (0.30 | ) | |
| Total Distributions | | (0.32 | ) | |
| Net Asset Value - End of Period | $ | 12.43 | | |
| Total Return (c) | | 27.85 | % | |
| | |
| Ratios/Supplemental Data | | | | |
| Net Assets - End of Period (Thousands) | $ | 55,497 | | |
| Before Waiver | | | | |
| Ratio of Expenses to Average Net Assets (d) | | 1.80 | % | |
| Ratio of Net Investment Loss to Average Net Assets (d) (e) | | (0.18 | )% | |
| After Waiver | | | | |
| Ratio of Expenses to Average Net Assets (d) | | 1.79 | % | |
| Ratio of Net Investment Loss to Average Net Assets (d) (e) | | (0.17 | )% | |
| Portfolio Turnover Rate | | 1,028.67 | % | |
* Commencement of Operations.
(a) Per share amounts were calculated using the average shares method.
(b) Realized and unrealized gains and losses per share in this caption are balancing amounts necessary
to reconcile the change in net asset value for the period, and may not reconcile with the aggregate gains
and losses in the Statement of Operations due to share transactions for the period.
(c) Total return represents the rate that the investor would have earned or lost on an investment in the
Fund assuming reinvestment of dividends and distributions, if any.
(d) These ratios exclude the impact of expenses of the underlying investment security holdings listed in
the Schedule of Investments.
(e) Recognition of the net investment income/(loss) by the Fund is affected by the timing of the declara-
tion of dividends by the underlying investment security holdings listed on the Schedule of Investments. |
The accompanying notes are an integral part of these
financial statements. |
2021 Annual Report 21
NOTES TO FINANCIAL STATEMENTS
CONQUER RISK FUNDS
JUNE 30, 2021 |
1.) ORGANIZATION
The Conquer Risk Funds (the “Funds”) are each a series of PFS Funds (the “Trust”). The Trust is an open-end management investment company that was organized in Massachusetts by an Agreement and Declaration of Trust dated January 13, 2000, as amended on January 20, 2011 that offers shares of beneficial interest in a number of separate series, each series representing a distinct fund with its own investment objectives and policies. Conquer Risk Defensive Bull Fund (“Defensive Bull Fund”), Conquer Risk Managed Volatility Fund (“Managed Volatility Fund”), Conquer Risk Tactical Opportunities Fund (“Tactical Opportunities Fund”) and Conquer Risk Tactical Rotation Fund (“Tactical Rotation Fund”) (each a “Fund” and collectively the “Funds”) were each organized as a non-diversified series of the Trust, on June 9, 2020 and commenced operations on July 1, 2020. As of June 30, 2021, there were thirteen series authorized by the Trust.The investment advisor to the Funds is Potomac Fund Management, Inc. (the “Advisor”). Significant accounting policies of the Funds are presented below.
2.) SIGNIFICANT ACCOUNTING POLICIES
The Funds are investment companies and accordingly follow the investment company accounting and reporting guidance of the Financial Accounting Standards Board (“FASB”) Accounting Standards Codification Topic 946 Financial Services - Investment Companies. The financial statements are prepared in conformity with accounting principles generally accepted in the United States of America (“GAAP”). The Funds follow the significant accounting policies described in this section.
SECURITY VALUATION
All investments in securities are recorded at their estimated fair value, as described in Note 3.
SHARE VALUATION
Each Fund’s net asset value (the “NAV”) is generally calculated as of the close of trading on the New York Stock Exchange (the “Exchange”) (normally 4:00 p.m. Eastern time) every day the Exchange is open. The NAV for each Fund is calculated by taking the total value of the Fund’s assets, subtracting its liabilities, and then dividing by the total number of shares outstanding, rounded to the nearest cent. The offering price and redemption price per share is equal to the net asset value per share.
FEDERAL INCOME TAXES
The Funds’ policy is to continue to comply with the requirements of the Internal Revenue Code that are applicable to regulated investment companies and to distribute all of their taxable income to shareholders. Therefore, no federal income tax provision is required. It is the Funds’ policy to distribute annually, prior to the end of the calendar year, dividends sufficient to satisfy excise tax requirements of the Internal Revenue Code. This Internal Revenue Code requirement may cause an excess of distributions over the book year-end accumulated income. In addition, it is the Funds’ policy to distribute annually, after the end of the fiscal year, any remaining net investment income and net realized capital gains.
The Funds recognize the tax benefits of certain tax positions only where the position is “more likely than not” to be sustained assuming examination by tax authorities. Management has analyzed the Funds’ tax positions, and has concluded that no liability for unrecognized tax benefits should be recorded related to uncertain tax positions taken on returns filed for the initial tax period. The Funds identify their major tax jurisdictions as U.S. Federal and State tax authorities; the Funds are not aware of any tax positions for which it is reasonably possible that the total amounts of unrecognized tax benefits will change materially in the next twelve months. The Funds recognize interest and penalties, if any, related to unrecognized tax benefits as income tax expense in the Statements of Operations. During the fiscal year ended June 30, 2021, the Funds did not incur any interest or penalties.
DISTRIBUTIONS TO SHAREHOLDERS: Distributions to shareholders, which are determined in accordance with income tax regulations, are recorded on the ex-dividend date. The Funds may utilize earnings and profits distributed to shareholders on redemptions of shares as part of the dividends paid deduction. The treatment for financial reporting purposes of distributions made to shareholders during the year from net investment income or net realized capital gains may differ from their ultimate treatment for federal income tax purposes. These differences are caused primarily by differences in the timing of recognition of certain components of income, expense or realized capital gain for federal income tax purposes. Where such differences are permanent in nature, they are reclassified in the components of the net assets based on their ultimate characterization for federal income tax purposes. Any such reclassification will have no effect on net assets, results of operations or net asset values per share of any Fund.
2021 Annual Report 22
Notes to Financial Statements - continued
USE OF ESTIMATES
The financial statements are prepared in accordance with GAAP, which requires management to make estimates and assumptions that affect the reported amounts of assets and liabilities and disclosure of contingent assets and liabilities at the date of the financial statements and the reported amounts of increases and decreases in net assets from operations during the reporting period. Actual results could differ from those estimates.
OTHER:
The Funds record security transactions based on a trade date. Dividend income is recognized on the ex-dividend date, and interest income, if any, is recognized on an accrual basis. The Funds use the specific identification method in computing gain or loss on the sale of investment securities. Long-term capital gain distributions are recorded as capital gain distributions from investment companies, and short-term capital gain distributions are recorded as dividend income.
ORGANIZATIONAL & OFFERING EXPENSES:
All costs incurred by the Funds in connection with the organization, offering and initial registration of each Fund, principally professional fees, were paid on behalf of the Funds by the Advisor and will not be borne by the Funds and are not recoupable in the future.
EXPENSES:
Expenses incurred by the Trust that do not relate to a specific fund of the Trust are allocated to the individual Fund based on each Fund’s relative net assets or by another appropriate method.
3.) SECURITIES VALUATIONS
The Funds utilize various methods to measure the fair value of their investments on a recurring basis. GAAP establishes a hierarchy that prioritizes inputs to valuation methods. The three levels of inputs are:
Level 1 - Unadjusted quoted prices in active markets for identical assets or liabilities that the Funds have the ability to access.
Level 2 - Observable inputs other than quoted prices included in level 1 that are observable for the asset or liability, either directly or indirectly. These inputs may include quoted prices for the identical instrument on an inactive market, prices for similar instruments, interest rates, prepayment speeds, credit risk, yield curves, default rates and similar data.
Level 3 - Unobservable inputs for the asset or liability, to the extent relevant observable inputs are not available, representing the Funds’ own assumptions about the assumptions a market participant would use in valuing the asset or liability, and would be based on the best information available.
The availability of observable inputs can vary from security to security and is affected by a wide variety of factors, including, for example, the type of security, whether the security is new and not yet established in the marketplace, the liquidity of markets, and other characteristics particular to the security. To the extent that valuation is based on models or inputs that are less observable or unobservable in the market, the determination of fair value requires more judgment. Accordingly, the degree of judgment exercised in determining fair value is greatest for instruments categorized in level 3.
The inputs used to measure fair value may fall into different levels of the fair value hierarchy. In such cases, for disclosure purposes, the level in the fair value hierarchy within which the fair value measurement falls in its entirety, is determined based on the lowest level input that is significant to the fair value measurement in its entirety.
FAIR VALUE MEASUREMENTS
A description of the valuation techniques applied to the Funds’ major categories of assets measured at fair value on a recurring basis follows.
Equity securities (exchange traded funds). Equity securities generally are valued by using market quotations, but may be valued on the basis of prices furnished by a pricing service when the Advisor believes such prices accurately reflect the fair value of such securities. Securities that are traded on any stock exchange or on the NASDAQ over-the-counter market are generally valued by the pricing service at the last quoted sale price. Lacking a last sale price, an equity security is generally valued by the pricing service at its last bid price. Generally, if the security is traded in an active market and is valued at the last sale price, the security is categorized as a level 1 security, and if an equity security is valued by the pricing service at its last bid, it is generally categorized as a level 2 security. When market quotations are not readily available, when the Advisor determines that the market quotation or the price provided by the pricing service does not
2021 Annual Report 23
Notes to Financial Statements - continued
accurately reflect the current fair value, or when restricted securities are being valued, such securities are valued as determined in good faith by the Advisor, subject to review of the Board of Trustees (the “Trustees” or the “Board”) and are categorized in level 2 or level 3, when appropriate.
Money market funds. Money market funds are valued at net asset value provided by the funds and are classified in level 1 of the fair value hierarchy.
In accordance with the Trust’s good faith pricing guidelines, the Advisor is required to consider all appropriate factors relevant to the value of securities for which it has determined other pricing sources are not available or reliable as described above. There is no single standard for determining fair value, since fair value depends upon the circumstances of each individual case. As a general principle, the current fair value of an issue of securities being valued by the Advisor would appear to be the amount which the owner might reasonably expect to receive for them upon their current sale. Methods which are in accordance with this principle may, for example, be based on (i) a multiple of earnings; (ii) a discount from market of a similar freely traded security (including a derivative security or a basket of securities traded on other markets, exchanges or among dealers); or (iii) yield to maturity with respect to debt issues, or a combination of these and other methods.
The following tables summarize the inputs used to value each Fund’s assets measured at fair value as of June 30, 2021:
| Defensive Bull Fund: | | | | | | |
| Valuation Inputs of Assets | | Level 1 | Level 2 | Level 3 | | Total |
| Exchange Traded Funds | | $232,106,327 | $ – | $ – | | $232,106,327 |
| Money Market Funds | | 616,161 | – | – | | 616,161 |
| Total | | $232,722,488 | $ – | $ – | | $232,722,488 |
| |
| Managed Volatility Fund: | | | | | | |
| Valuation Inputs of Assets | | Level 1 | Level 2 | Level 3 | | Total |
| Exchange Traded Funds | | $30,358,070 | $ – | $ – | | $30,358,070 |
| Money Market Funds | | 644,770 | – | – | | 644,770 |
| Total | | $31,002,840 | $ – | $ – | | $31,002,840 |
| |
| Tactical Opportunities Fund: | | | | | | |
| Valuation Inputs of Assets | | Level 1 | Level 2 | Level 3 | | Total |
| Exchange Traded Funds | | $24,221,432 | $ – | $ – | | $24,221,432 |
| Money Market Funds | | 19,327,132 | – | – | | 19,327,132 |
| Total | | $43,548,564 | $ – | $ – | | $43,548,564 |
| |
| Tactical Rotation Fund: | | | | | | |
| Valuation Inputs of Assets | | Level 1 | Level 2 | Level 3 | | Total |
| Exchange Traded Funds | | $38,593,521 | $ – | $ – | | $38,593,521 |
| Money Market Funds | | 16,846,464 | – | – | | 16,846,464 |
| Total | | $55,439,985 | $ – | $ – | | $55,439,985 |
The Funds did not hold any level 3 assets during the fiscal year ended June 30, 2021.
The Funds did not invest in derivative instruments during the fiscal year ended June 30, 2021.
4.) INVESTMENT ADVISORY AGREEMENT AND SERVICES AGREEMENT
The Funds have entered into an investment advisory agreement (“Management Agreement”) with the Advisor. The Advisor manages the investment portfolio of each Fund, subject to the policies adopted by the Trust’s Board of Trustees. Under the Management Agreement, the Advisor, at its own expense and without reimbursement from the Trust, furnishes office space and all necessary office facilities, equipment and executive personnel necessary for managing the assets of each Fund. The Advisor receives an investment management fee equal to 1.25% of each Fund’s average daily net assets up to $100 million, 1.00% of each Fund’s average daily net assets between $100 million and $200 million and 0.90% of each Fund’s average daily net assets in excess of $200 million.
For the fiscal year ended June 30, 2021, the Advisor earned management fees in the amounts of $1,549,389, $298,748, $448,710 and $465,403 for the Defensive Bull Fund, Managed Volatility Fund, Tactical Opportunities Fund and Tactical Rotation Fund, respectively. At June 30, 2021, $203,697, $30,893, $44,335 and $55,942 was due to the Advisor from Defensive Bull Fund, Managed Volatility Fund, Tactical Opportunities Fund and Tactical Rotation Fund, respectively.
2021 Annual Report 24
Notes to Financial Statements - continued
Additionally, the Funds have a Services Agreement with the Advisor (the “Services Agreement”). Under the Services Agreement the Advisor receives a service fee of 0.65% of each Fund’s average daily net assets up to $25 million, 0.35% of each Fund’s average daily net assets from $25 million to $100 million, and 0.25% of such assets in excess of $100 million and is obligated to pay the operating expenses of each Fund excluding management fees, brokerage fees and commissions, 12b-1 fees (if any), taxes, borrowing costs (such as (a) interest and (b) dividend expenses on securities sold short), ADR fees, the cost of acquired funds and extraordinary expenses. Additionally, under the Services Agreement the Advisor supervises each Fund’s business affairs. The Advisor coordinates for the provision of the services of a Chief Compliance Officer for the Trust with respect to each Fund, executive and administrative services including, but are not limited to, the coordination of all third parties furnishing services to each Fund, review of the books and records of each Fund maintained by such third parties, and such other actions with respect to each Fund as may be necessary in the opinion of the Advisor to perform its duties under the Services Agreement.
For the fiscal year ended June 30, 2021, the Advisor earned services fees of $496,234, $151,746, $199,408 and $204,081 from Defensive Bull Fund, Managed Volatility Fund, Tactical Opportunities Fund and Tactical Rotation Fund, respectively. At June 30, 2021, $42,169, $12,343, $15,031 and $17,353 was due to the Advisor from Defensive Bull Fund, Managed Volatility Fund, Tactical Opportunities Fund and Tactical Rotation Fund, respectively.
Effective June 1, 2021, the Advisor has voluntarily waived Service Agreement fees of 0.10% of each Fund’s average daily net assets. The Service Agreement fee waiver is voluntary and may be terminated at any time. There are no recoupment provisions for the waivers described above. A total of $18,523, $2,471, $3,547 and $4,475 was waived from Defensive Bull Fund, Managed Volatility Fund, Tactical Opportunities Fund and Tactical Rotation Fund, respectively.
5.) RELATED PARTY TRANSACTIONS
Jeffrey R. Provence of Premier Fund Solutions, Inc. (the “Administrator”) also serves as a trustee/officer of the Funds. This individual receives benefits from the Administrator resulting from administration fees paid to the Administrator by the Advisor.
The Trustees who are not interested persons of the Funds were each paid $4,000, for a total of $12,000, in Trustees fees for the fiscal year ended June 30, 2021 for the Trust. Under the Management Agreements, the Advisor pays these fees.
6.) INVESTMENTS
For the fiscal year ended June 30, 2021, purchases and sales of investment securities other than U.S. Government obligations and short-term investments were as follows:
| | | Defensive | | Managed | | Tactical | | Tactical |
| | | Bull Fund | | Volatility Fund | | Opportunities Fund | | Rotation Fund |
| Purchases | $ | 2,088,521,708 | $ | 140,510,553 | $ | 331,310,669 | $ | 312,390,564 |
| Sales | $ | 1,906,762,961 | $ | 111,278,767 | $ | 314,366,261 | $ | 282,322,110 |
There were no purchases or sales of U.S. Government obligations.
7.) CONTROL OWNERSHIP
The beneficial ownership, either directly or indirectly, of more than 25% of the voting shares of a fund creates a presumption of control of the fund, under section 2(a)(9) of the Investment Company Act of 1940, as amended. As of June 30, 2021, National Financial Services, LLC (“NFS”), located in New York, New York, and TD Ameritrade, located in Omaha, Nebraska, each held for the benefit of its customers, accounts in excess of 25% of the voting shares of each fund noted below. The Funds do not know whether any underlying accounts of NFS or TD Ameritrade, owned or controlled 25% or more of the voting securities of each Fund.
| | TD Ameritrade | | NFS | |
| Defensive Bull Fund | 31.67% | | 36.72 | % |
| Managed Volatility Fund | 27.41% | | 45.20 | % |
| Tactical Opportunities Fund | – | | 54.38 | % |
| Tactical Rotation Fund | – | | 55.70 | % |
8.) TAX MATTERS
For federal income tax purposes, at June 30, 2021 the cost of securities on a tax basis and the composition of gross unrealized appreciation (the excess of value over tax cost) and depreciation (the excess of tax cost over value) were as follows:
2021 Annual Report 25
| Notes to Financial Statements - continued | | | | | | |
| | | | | | | | | | | | |
| | | Defensive | | | Managed | | Tactical | | | Tactical | |
| | | Bull Fund | | | Volatility Fund | | Opportunities Fund | | | Rotation Fund | |
| Cost of Investments | | $232,884,539 | | | $30,525,612 | | $43,551,836 | | | $55,439,316 | |
| |
| Gross Unrealized Appreciation | | $364,212 | | | $477,228 | | $454,460 | | | $387,711 | |
| Gross Unrealized Depreciation | | (526,263 | ) | | – | | (457,732 | ) | | (387,042 | ) |
| Net Unrealized Appreciation | | | | | | | | | | | |
| (Depreciation) on Investments | | ($162,051 | ) | | $477,228 | | ($3,272 | ) | | $669 | |
The tax character of distributions paid during the fiscal year ended June 30, 2021 were as follows:
| | | Fiscal Year Ended |
| | | June 30, 2021 |
| Defensive Bull Fund | | |
| Ordinary Income | $ | 1,951,581 |
| Long-term Capital Gain | | - |
| | $ | 1,951,581 |
| |
| Managed Volatility Fund | | |
| Ordinary Income | $ | 233,843 |
| Long-term Capital Gain | | - |
| | $ | 233,843 |
| |
| Tactical Opportunities Fund | | |
| Ordinary Income | $ | 952,505 |
| Long-term Capital Gain | | - |
| | $ | 952,505 |
| |
| Tactical Rotation Fund | | |
| Ordinary Income | $ | 1,022,076 |
| Long-term Capital Gain | | - |
| | $ | 1,022,076 |
As of June 30, 2021, the components of distributable earnings on a tax basis were as follows:
| | | Defensive Bull Fund | | | | Managed Volatility Fund |
| Undistributed ordinary income | $ | 48,038,471 | | | $ | 701,614 |
| Undistributed tax-exempt income | | – | | | | 57,510 |
| Unrealized appreciation (depreciation) - net | | (162,051 | ) | | | 477,228 |
| | $ | 47,876,420 | | | $ | 1,236,352 |
| |
| | | Tactical Opportunities Fund | | | | Tactical Rotation Fund |
| Undistributed ordinary income | $ | 5,979,395 | | | $ | 7,438,445 |
| Unrealized appreciation (depreciation) - net | | (3,272 | ) | | | 669 |
| | $ | 5,976,123 | | | $ | 7,439,114 |
As of June 30, 2021, the primary differences between book and tax basis unrealized appreciation (depreciation) were attributable to the tax deferral of wash sales.
9.) DEFENSIVE POSITIONS
Each Fund may hold all or a portion of its assets in cash or cash-equivalents like money market funds, certificates of deposit, short-term debt obligations, and repurchase agreements, either due to pending investments or when investment opportunities are limited or market conditions are adverse. Under these circumstances, the Funds may not participate in stock market advances or declines to the same extent they would had they remained more fully invested in common stocks. If a Fund invests in shares of a money market fund, shareholders of the Fund generally will be subject to duplicative management and other fees and expenses. As of June 30, 2021, Tactical Opportunities Fund and Tactical Rotation Fund had 44.41% and 30.36%, respectively, of the value of their net assets invested in the First American Government Obligations Fund – Class X. Additional information for this money market fund, including its financial statements, is available from the Securities and Exchange Commission’s website at www.sec.gov.
2021 Annual Report 26
Notes to Financial Statements - continued
10.) COVID-19 RISKS
Unexpected local, regional or global events, such as war; acts of terrorism; financial, political or social disruptions; natural, environmental or man-made disasters; the spread of infectious illnesses or other public health issues; and recessions and depressions could have a significant impact on each Fund and its investments and may impair market liquidity. Such events can cause investor fear, which can adversely affect the economies of nations, regions and the market in general, in ways that cannot necessarily be foreseen. An outbreak of infectious respiratory illness known as COVID-19, which is caused by a novel coronavirus (SARS-CoV-2), was first detected in China in December 2019 and subsequently spread globally. This coron-avirus has resulted in, among other things, travel restrictions, closed international borders, enhanced health screenings at ports of entry and elsewhere, disruption of and delays in healthcare service preparation and delivery, prolonged quarantines, significant disruptions to business operations, market closures, cancellations and restrictions, supply chain disruptions, lower consumer demand, and significant volatility and declines in global financial markets, as well as general concern and uncertainty. The impact of COVID-19 has adversely affected, and other infectious illness outbreaks that may arise in the future could adversely affect, the economies of many nations and the entire global economy, individual issuers and capital markets in ways that cannot necessarily be foreseen. Public health crises caused by the COVID-19 outbreak may exacerbate other pre-existing political, social and economic risks in certain countries or globally. The duration of the COVID-19 outbreak and its effects cannot be determined with certainty.
11.) SUBSEQUENT EVENTS
Subsequent events after the date of the Statements of Assets and Liabilities have been evaluated through the date the financial statements were issued. Management has concluded that other than the below change in the voluntary waiver of Service Agreement fees, there is no impact requiring adjustment to or disclosure in the financial statements.
Effective August 1, 2021 the rate of the voluntary waiver of Service Agreement fees changed to 0.15% of each Fund’s average daily net assets. The Service Agreement fee waiver is voluntary and may be terminated at any time.
2021 Annual Report 27
REPORT OF INDEPENDENT REGISTERED PUBLIC ACCOUNTING FIRM
To the Shareholders of Conquer Risk Funds and
Board of Trustees of PFS Funds
Opinion on the Financial Statements
We have audited the accompanying statements of assets and liabilities, including the schedules of investments, of Conquer Risk Defensive Bull Fund, Conquer Risk Managed Volatility Fund, Conquer Risk Tactical Opportunities Fund, and Conquer Risk Tactical Rotation Fund (the “Funds”), each a series of PFS Funds, as of June 30, 2021, the related statements of operations and changes in net assets, the related notes, and the financial highlights for the period July 1, 2020 (commencement of operations) through June 30, 2021 (collectively referred to as the “financial statements”). In our opinion, the financial statements present fairly, in all material respects, the financial position of each of the Funds as of June 30, 2021, the results of their operations, the changes in net assets, and the financial highlights for the period July 1, 2020 (commencement of operations) through June 30, 2021, in conformity with accounting principles generally accepted in the United States of America.
Basis for Opinion
These financial statements are the responsibility of the Funds’ management. Our responsibility is to express an opinion on the Funds’ financial statements based on our audit. We are a public accounting firm registered with the Public Company Accounting Oversight Board (United States) (“PCAOB”) and are required to be independent with respect to the Funds in accordance with the U.S. federal securities laws and the applicable rules and regulations of the Securities and Exchange Commission and the PCAOB.
We conducted our audit in accordance with the standards of the PCAOB. Those standards require that we plan and perform the audit to obtain reasonable assurance about whether the financial statements are free of material misstatement whether due to error or fraud.
Our audit included performing procedures to assess the risks of material misstatement of the financial statements, whether due to error or fraud, and performing procedures that respond to those risks. Such procedures included examining, on a test basis, evidence regarding the amounts and disclosures in the financial statements. Our procedures included confirmation of securities owned as of June 30, 2021, by correspondence with the custodian and brokers. Our audit also included evaluating the accounting principles used and significant estimates made by management, as well as evaluating the overall presentation of the financial statements. We believe that our audit provides a reasonable basis for our opinion.
We have served as the Funds’ auditor since 2020.

COHEN & COMPANY, LTD.
Milwaukee, Wisconsin
August 25, 2021
2021 Annual Report 28
DISCLOSURE OF EXPENSES
(Unaudited) |
The ongoing costs to shareholders associated with the Defensive Bull Fund, Managed Volatility Fund, Tactical Opportunities Fund and Tactical Rotation Fund consist solely of management fees and service fees. Although the Funds charge no sales loads or transaction fees, you will be assessed fees for outgoing wire transfers, returned checks and stop payment orders at prevailing rates charged by Mutual Shareholder Services, LLC, the Funds’ transfer agent. IRA accounts will be charged an $8.00 annual maintenance fee. The following example is intended to help you understand your ongoing costs of investing in the Funds and to compare these costs with similar costs of investing in other mutual funds. The example is based on an investment of $1,000 invested in the Funds on January 1, 2021 and held through June 30, 2021.
The first line of each table below provides information about actual account values and actual expenses. In order to estimate the expenses a shareholder paid during the period covered by this report, shareholders can divide their account value by $1,000 (for example, an $8,600 account value divided by $1,000 = 8.6) and then multiply the result by the number in the first line under the heading entitled “Expenses Paid During the Period.”
The second line of each table below provides information about hypothetical account values and hypothetical expenses based on the Funds’ actual expense ratios and an assumed rate of return of 5% per year before expenses, which is not the Funds’ actual return. The hypothetical account values and expenses may not be used to estimate the actual ending account balance or expenses paid by a shareholder for the period. Shareholders may use this information to compare the ongoing costs of investing in the Funds and other funds. In order to do so, compare these 5% hypothetical examples with the 5% hypothetical examples that appear in other funds’ shareholder reports.
Please note that the expenses shown in each table are meant to highlight your ongoing costs only and do not reflect any transactional costs, such as the annual maintenance fee charged to IRA accounts, redemption fees, or exchange fees. Therefore, the second line of the table is useful in comparing ongoing costs only, and will not help you determine the relative total costs of owning different funds. In addition, if these transactional costs were included, your costs would have been higher.
| DEFENSIVE BULL FUND | | | | | | |
| | | | | | | Expenses Paid |
| | | Beginning | | Ending | | During the Period* |
| | | Account Value | | Account Value | | January 1, 2021 to |
| | | January 1, 2021 | | June 30, 2021 | | June 30, 2021 |
| |
| Actual | | $1,000.00 | | $1,201.64 | | $7.97 |
| |
| Hypothetical | | $1,000.00 | | $1,017.55 | | $7.30 |
| (5% annual return | | | | | | |
| before expenses) | | | | | | |
* Expenses are equal to the Fund’s annualized expense ratio of 1.46%, multiplied by the average
account value over the period, multiplied by 181/365 (to reflect the one-half year period).
| MANAGED VOLATILITY FUND | | | | |
| | | | | | | Expenses Paid |
| | | Beginning | | Ending | | During the Period* |
| | | Account Value | | Account Value | | January 1, 2021 to |
| | | January 1, 2021 | | June 30, 2021 | | June 30, 2021 |
| |
| |
| Actual | | $1,000.00 | | $1,013.59 | | $9.29 |
| |
| Hypothetical | | $1,000.00 | | $1,015.57 | | $9.30 |
| (5% annual return | | | | | | |
| before expenses) | | | | | | |
* Expenses are equal to the Fund’s annualized expense ratio of 1.86%, multiplied by the average
account value over the period, multiplied by 181/365 (to reflect the one-half year period).
2021 Annual Report 29
| Disclosure of Expenses (Unaudited) - continued | | |
| |
| TACTICAL OPPORTUNITIES FUND | | | | |
| | | | | | | Expenses Paid |
| | | Beginning | | Ending | | During the Period* |
| | | Account Value | | Account Value | | January 1, 2021 to |
| | | January 1, 2021 | | June 30, 2021 | | June 30, 2021 |
| |
| Actual | | $1,000.00 | | $1,042.13 | | $8.86 |
| |
| Hypothetical | | $1,000.00 | | $1,016.12 | | $8.75 |
| (5% annual return | | | | | | |
| before expenses) | | | | | | |
* Expenses are equal to the Fund’s annualized expense ratio of 1.75%, multiplied by the average
account value over the period, multiplied by 181/365 (to reflect the one-half year period).
| TACTICAL ROTATION FUND | | | | |
| | | | | | | Expenses Paid |
| | | Beginning | | Ending | | During the Period* |
| | | Account Value | | Account Value | | January 1, 2021 to |
| | | January 1, 2021 | | June 30, 2021 | | June 30, 2021 |
| |
| Actual | | $1,000.00 | | $1,100.00 | | $9.06 |
| |
| Hypothetical | | $1,000.00 | | $1,016.17 | | $8.70 |
| (5% annual return | | | | | | |
| before expenses) | | | | | | |
* Expenses are equal to the Fund’s annualized expense ratio of 1.74%, multiplied by the average
account value over the period, multiplied by 181/365 (to reflect the one-half year period).
2021 Annual Report 30
ADDITIONAL INFORMATION
June 30, 2021 |
AVAILABILITY OF QUARTERLY SCHEDULE OF INVESTMENTS
The Funds publicly file their complete schedules of portfolio holdings with the Securities and Exchange Commission (“SEC”) for the first and third quarters of each fiscal year on Form N-PORT. The Funds’ Forms N-PORT are available on the SEC’s website at http://www.sec.gov.
Potomac Fund Management, Inc., the Funds’ Advisor, is responsible for exercising the voting rights associated with the securities held by the Funds. A description of the policies and procedures used by the Advisor in fulfilling this responsibility is available without charge on the Funds’ website at www.potomacfund.com/funds. It is also included in the Funds’ Statement of Additional Information, which is available on the SEC’s website at http://www.sec.gov.
Information regarding how the Funds voted proxies, Form N-PX, relating to portfolio securities during the most recent 12-month period ended June 30 will be available without charge, upon request, by calling our toll free number (1-888-774-6679). This information is also available on the SEC’s website at http://www.sec.gov.
You will find more information about the Funds at www.potomacfund.com/funds. For shareholder inquiries, please call toll-free in the U.S. at 1-888-774-6679.
| LIQUIDITY RISK MANAGEMENT PROGRAM |
The Funds have adopted and implemented a written liquidity risk management program as required by Rule 22e-4 (the “Liquidity Rule”) under the Investment Company Act. The program is reasonably designed to assess and manage each Fund’s liquidity risk, taking into consideration, among other factors, each Fund’s investment strategies and the liquidity of its portfolio investments during normal and reasonably foreseeable stressed conditions; its short and long-term cash flow projections; and its cash holdings and access to other funding sources.
During the fiscal year ended June 30, 2021, the Board and the Trust’s Liquidity Program Administrator reviewed a report from the Liquidity Program Administrator and reviewed each Fund’s investments and they determined that the Funds held adequate levels of cash and highly liquid investments to meet shareholder redemption activities in accordance with applicable requirements. Accordingly, the Board concluded that (i) the Funds’ liquidity risk management program is reasonably designed to prevent violations of the Liquidity Rule and (ii) the Funds’ liquidity risk management program has been effectively implemented.
2021 Annual Report 31
Trustees and Officers
(Unaudited) |
The Board of Trustees supervises the business activities of the Trust. The names of the Trustees and executive officers of the Trust are shown below. For more information regarding the Trustees, please refer to the Statement of Additional Information, which is available upon request by calling 1-888-774-6679. Each Trustee serves until the Trustee sooner dies, resigns, retires, or is removed.
The Trustees and Officers of the Trust and their principal business activities during the past five years are:
Interested Trustees and Officers
| | | | | Number of | |
| | | | Principal | Portfolios In | Other |
| Name, | Position(s) | Term of Office | Occupation(s) | Fund | Directorships |
| Address(1), | Held With | and Length of | During | Complex | Held By |
| and Year of Birth | the Trust | Time Served | Past 5 Years | Overseen By | Trustee |
| | | | | Trustee | |
| |
| Ross C. Provence, | President | Indefinite Term; | General Partner and Portfolio | N/A | N/A |
| Year of Birth: 1938 | | Since 2000 | Manager for Value Trend Capital | | |
| | | | Management, LP (1995 to current). | | |
| | | | Estate planning attorney (1963 to | | |
| current). |
| |
| Jeffrey R. Provence(2), | Trustee, | Indefinite Term; | CEO, Premier Fund Solutions, Inc. | 13 | Blue Chip |
| Year of Birth: 1969 | Secretary | Since 2000 | (2001 to current). General Partner | | Investor Funds |
| | and | | and Portfolio Manager for Value | | Meeder Funds |
| | Treasurer | | Trend Capital Management, LP | | |
| | | | (1995 to current). | | |
| |
| Julian G. Winters, | Chief | Chief | Managing Member, Watermark | N/A | N/A |
| Year of Birth: 1968 | Compliance | Compliance | Solutions LLC (investment compli- | | |
| | Officer | Officer Since | ance and consulting) since March | | |
| | | 2010 | 2007. | | |
| | (1) The address of each trustee and officer is c/o PFS Funds, 1939 Friendship Drive, Suite C, El Cajon, California 92020.
(2) Jeffrey R. Provence is considered an “interested person” as defined in Section 2(a)(19) of the Investment Company Act of 1940 by
virtue of his position with the Trust. |
| | | | | Number of | |
| | | | Principal | Portfolios In | Other |
| Name, | Position | Term of Office | Occupation(s) | Fund | Directorships |
| Address(1), | Held With | and Length of | During | Complex | Held By |
| and Year of Birth | the Trust | Time Served | Past 5 Years | Overseen By | Trustee |
| | | | | Trustee | |
| |
| Thomas H. Addis III, | Independent | Indefinite Term; | Executive Director/CEO, Southern | 13 | None |
| Year of Birth: 1945 | Trustee | Since 2000 | California PGA (2006 to current). | | |
| |
| Allen C. Brown, | Independent | Indefinite Term; | Law Office of Allen C. Brown, Estate | 13 | Blue Chip |
| Year of Birth: 1943 | Trustee | Since 2010 | planning and business attorney | | Investor Funds |
| | | | (1970 to current). | | |
| |
| George Cossolias, CPA, | Independent | Indefinite Term; | Partner of CWDL, CPAs (February 1, | 13 | Blue Chip |
| Year of Birth: 1935 | Trustee | Since 2000 | 2014 to current). Owner of George | | Investor Funds, |
| | | | Cossolias & Company, CPAs (1972 | | Neiman Funds |
| | | | to January 31, 2014). President of | | |
| | | | LubricationSpecialists, Inc. (1996 to | | |
| current). |
(1) The address of each trustee and officer is c/o PFS Funds, 1939 Friendship Drive, Suite C, El Cajon, California 92020.
2021 Annual Report 32
Investment Advisor
Potomac Fund Management, Inc.
Custodian
U.S. Bank, NA
Distributor
Rafferty Capital Markets, LLC
Fund Administrator
Premier Fund Solutions, Inc.
Independent Registered Public Accounting Firm
Cohen & Company, Ltd.
Legal Counsel
Practus, LLP
Transfer Agent
Mutual Shareholder Services, LLC |
This report is provided for the general information of the shareholders of the Conquer
Risk Funds. This report is not intended for distribution to prospective investors in the
Funds, unless preceded or accompanied by an effective prospectus. |
Conquer Risk Funds
1-888-774-6679
www.potomacfund.com/funds/ |
Item 2. Code of Ethics.
The registrant has adopted a code of ethics that applies to the registrant’s principal executive officer and the principal financial officer. The registrant has not made any amendments to its code of ethics during the covered period. The registrant has not granted any waivers from any provisions of the code of ethics during the covered period. A copy of the registrant’s Code of Ethics is filed herewith.
Item 3. Audit Committee Financial Expert.
The registrant’s Board of Trustees has determined that George Cossolias is an audit committee finical expert. Mr. Cossolias is independent for purposes of this Item 3.
Item 4. Principal Accountant Fees and Services.
(a-d) The following table details the aggregate fees billed for each of the last two fiscal years for audit fees, audit-related fees, tax fees and other fees by the principal accountant to the registrant. The principal accountant has provided no services to the adviser or any entity controlled by, or under common control with the adviser that provides ongoing services to the registrant.
| | | FYE 6/30/2021 |
| Audit Fees | | $50,850 |
| Audit-Related Fees | | $0 |
| Tax Fees | | $12,000 |
| All Other Fees | | $750 |
Nature of Tax Fees: preparation of Excise Tax Statement and 1120 RIC.
All Other Fees: Semi-Annual Report Review
(e) (1) The audit committee approves all audit and non-audit related services and, therefore, has not adopted pre-approval policies and procedures described in paragraph (c)(7) of Rule 2-01 of Regulation S-X.
(e) (2) None of the services described in paragraph (b) through (d) of this Item were approved by the audit committee pursuant to paragraph (c)(7)(i)(C) of Rule 2-01 of Regulation S-X.
(f) All of the principal accountant’s hours spent on auditing the registrant’s financial statements were attributed to work performed by full-time permanent employees of the principal accountant.
(g) The following table indicates the aggregate non-audit fees billed by the registrant’s principal accountant for services to the registrant , the registrant’s investment adviser (not sub-adviser), and any entity controlling, controlled by, or under common control with the adviser that provides ongoing services to the registrant, for the last two years.
| Non-Audit Fees | | FYE 6/30/2021 |
| Registrant | | $12,750 |
| Registrant’s Investment Adviser | | $0 |
(h) The principal accountant provided no services to the investment adviser or any entity controlling, controlled by, or under common control with the adviser that provides ongoing services to the registrant.
Item 5. Audit Committee of Listed Companies. Not applicable.
Item 6. Investments.
(a) Not applicable. Schedule filed with Item 1.
(b) Not applicable.
Item 7. Disclosure of Proxy Voting Policies and Procedures for Closed-End Management Investment Companies. Not applicable.
Item 8. Portfolio Managers of Closed End Management Investment Companies. Not applicable.
Item 9. Purchases of Equity Securities by Closed-End Management Investment Companies and Affiliated Purchasers. Not applicable.
Item 10. Submission of Matters to a Vote of Security Holders.
The registrant has not adopted procedures by which shareholders may recommend nominees to the registrant’s board of trustees.
Item 11. Controls and Procedures.
(a) The Registrant’s president and chief financial officer concluded that the disclosure controls and procedures (as defined in Rule 30a-3(c) under the Act (17 CFR 270.30a -3(c))) as of a date within 90 days of the filing date of the report that includes the disclosure required by this paragraph, based on the evaluation of these controls and procedures required by Rule 30a-3(b) under the Act (17 CFR 270.30a -3(b)) and Rules 13a-15(b) or 15d-15(b) under the Exchange Act (17 CFR 240.13a -15(b) or 240.15d -15(b)).
(b) There were no changes in the registrant’s internal control over financial reporting (as defined in Rule 30a-3(d) under the Act (17 CFR 270.30a -3(d)) that occurred during the period covered by this report that has materially affected, or is reasonably likely to materially affect, the registrant’s internal control over financial reporting.
Item 12. Disclosure of Securities Lending Activities for Closed-End Management Investment Companies.
Not applicable.
Item 13. Exhibits.
(a)(1) Code of Ethics. Filed herewith.
(a)(2) Certifications pursuant to Section 302 of the Sarbanes-Oxley Act of 2002. Filed herewith.
(a)(3) Not applicable.
(a)(4) Not applicable.
(b) Certification pursuant to Section 906 of the Sarbanes-Oxley Act of 2002. Filed herewith.
Pursuant to the requirements of the Securities Exchange Act of 1934 and the Investment Company Act of 1940, the registrant has duly caused this report to be signed on its behalf by the undersigned, thereunto duly authorized.
| | By: /s/Ross C. Provence
Ross C. Provence
President |
Pursuant to the requirements of the Securities Exchange Act of 1934 and the Investment Company Act of 1940, this report has been signed below by the following persons on behalf of the registrant and in the capacities and on the dates indicated.
| | By: /s/Ross C. Provence
Ross C. Provence
President |
| | By: /s/Jeffrey R. Provence
Jeffrey R. Provence
Chief Financial Officer |