UNITED STATES
SECURITIES AND EXCHANGE COMMISSION
WASHINGTON, D.C. 20549
CERTIFIED SHAREHOLDER REPORT OF REGISTERED MANAGEMENT
INVESTMENT COMPANIES
Investment Company Act file number 811-09781
PFS Funds
(Exact name of registrant as specified in charter)
1939 Friendship Drive, Suite C, El Cajon, CA 92020
(Address of principal executive offices) (Zip code)
CT Corporation System
155 Federal St., Suite 700, Boston, MA 02110
(Name and address of agent for service)
Registrant’s telephone number, including area code: (619) 588-9700
Date of fiscal year end: June 30
Date of reporting period: June 30, 2023
Item 1. Reports to Stockholders.

MOATX Investor Shares
CASTX Class C
For Investors Seeking Long-Term Capital Appreciation
Annual Report
June 30, 2023
Dear Castle Focus Fund Shareholder:
It is our pleasure to present to you the Annual Report for the Castle Focus Fund (the “Fund”). This report provides you with important financial information on the Fund as well as portfolio manager commentary for the fiscal year ended June 30, 2023. We are very appreciative of your continued investments in the Fund.
The letter on the following page is from the Fund’s Sub-Adviser — St. James Investment Company — and provides you with an explanation of how the Fund performed over this past fiscal year.
We appreciate your trust and confidence in our management of the Fund.
Kind Regards,

Caeli Andrews
Co-Founder, Managing Director
Castle Investment Management | Andrew Welle
Co-Founder, Managing Director
Castle Investment Management |
2023 Annual Report 1
Dear Castle Focus Fund Shareholder:
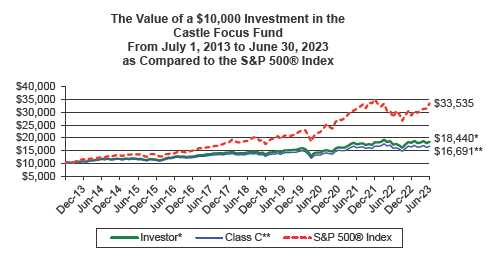
Thank you for your continued investments in the Castle Focus Fund (the “Fund”). It is our pleasure to report to you on the Fund’s performance over the last fiscal year. For the fiscal year ended June 30, 2023, the Investor Class Shares returned 6.29% (Class C Shares returned 5.29%) . Over that same one-year period, the S&P 500® Index (the Fund’s “Benchmark”) returned 19.59% . Our firm, St. James Investment Company, has served as Sub-Adviser to the Fund since its inception in 2010. Over that thirteen year period the Investor Class Shares have experienced an average annual return of 6.97%, while the Benchmark has had an average annual return of 14.13% .
Our process emphasizes fundamentals at a time when inflation is seemingly taking hold, market valuations are dramatically stretched, and corporate debt is at a record high. A few highlights: • We calculate intrinsic value for each holding discounting cash flows at 10%, contending entry price ultimately determines return. Our process when sub-advising the Fund is not deep value – the strategy consists of quality compounders that we believe are trading at a substantial discount to our conservative estimate of intrinsic value.
• Our quality bias prioritizes a solid balance sheet, as manageable debt (covered by operational cash flow) is critical given market fragility.
• We consider not interrupting the compounding process to be key to long-term performance. The following were primary contributing factors to the Fund’s one-year performance relative to its Benchmark: A few of the Fund’s holdings that added to performance during the fiscal year include Berkshire Hathaway (BRK.b), DuPont de Nemours (DD) and Merck & Co (MRK). Merck & Co was first purchased in the Fund in early 2022, at an average cost of approximately $79 per share. The purchase coincided with the sale of Pfizer, as we believed Merck to offer a better opportunity in accordance with our process. At the end of the Fund’s fiscal year, Merck & Co was trading at over $115 per share. The Fund collected a dividend from its investment in Merck & Co during the fiscal year.
The Fund’s positions in Dominion Energy (D), Enbridge (ENB) and Verizon Communications (VZ) detracted from performance. We initiated the Fund’s position in Verizon Communications in November of 2021. Per our process, we believed Verizon offered a quality proven business with a compelling margin of safety. The stock price has decreased since our first purchase, but the Fund has collected dividend payments along the way. At the Fund’s fiscal year end, Verizon’s stock was trading at $37.19 per share, well below our estimate of Verizon’s fair value. We believe Verizon’s fair value is approximately $51 per share. Verizon is a good example of how our investment process is focused on acquiring unloved, quality companies at what we believe is a significant discount to its fair value.
We are bottom up managers, agnostic to relative performance to any particular index with the overall objective of long-term capital appreciation. As a result, our industry weightings have typically been significantly different than that of any benchmark. We pay no attention to these deviations and do not plan to in the future, consistent with our process.
Kind Regards,

| Robert J. Mark | Larry J. Redell |
| Portfolio Manager | St. James Investment Company |
| St. James Investment Company | |
Past performance does not guarantee future results. The investment return and principal value of an investment in the Fund will fluctuate so that an investor’s shares, when redeemed, may be worth more or less than their original cost. Current performance may be higher or lower than the performance data quoted. Performance data current to the most recent month end are available by calling 1-877-743-7820.
The Castle Focus Fund’s prospectus contains important information about the Fund’s investment objectives, potential risks, management fees, charges and expenses, and other information and should be read and considered carefully before investing. You may obtain a current copy of the Fund’s prospectus by calling 1-877-743-7820. Distributed by Arbor Court Capital, LLC.
2023 Annual Report 2
CASTLE FOCUS FUND (Unaudited)
CASTLE FOCUS FUND PERFORMANCE INFORMATION
AVERAGE ANNUAL RETURNS AS OF JUNE 30, 2023
| | 1 Year(A) | | 5 Year(A) | | 10 Year(A) | |
| Investor Shares | 6.29% | | 5.26% | | 6.31% | |
| Class®C | 5.29% | | 4.22% | | 5.26% | |
| S&P 500® Index (B) | 19.59% | | 12.31% | | 12.86% | |
The Fund's Total Annual Operating Expense Ratios (from November 1, 2022 Prospectus):
Investor Shares – Gross 1.59%, Net 1.35%;
Class C – Gross 2.59%, Net 2.35%
The Fund’s actual expense ratios for the fiscal year ended June 30, 2023, can be found in the financial highlights included in this report. The Total Annual Operating Expense Ratios reported above will not correlate to the expense ratio in the Fund’s financial highlights because (a) the financial highlights include only the direct operating expenses incurred by the Fund, not the indirect costs of investing in the Fund, (b) the expense ratios may be for different periods, and (c) the Adviser has contractually agreed to waive Services Agreement fees (see Note 4).
(A) 1 Year, 5 Year and 10 Year returns include change in share prices and in each case includes reinvestment of any dividends and capital gain distributions. The Castle Focus Fund commenced operations on July 1, 2010.
(B) The S&P 500® Index is an unmanaged index comprised of the stocks of large capitalization issues in the United States and it is considered representative of the U.S. equity markets as a whole.
PAST PERFORMANCE DOES NOT GUARANTEE FUTURE RESULTS. INVESTMENT RETURN AND PRINCIPAL VALUE WILL FLUCTUATE SO THAT SHARES, WHEN REDEEMED, MAY BE WORTH MORE OR LESS THAN THEIR ORIGINAL COST. RETURNS DO NOT REFLECT THE DEDUCTION OF TAXES THAT A SHAREHOLDER WOULD PAY ON FUND DISTRIBUTIONS OR THE REDEMPTION OF FUND SHARES. CURRENT PERFORMANCE MAY BE LOWER OR HIGHER THAN THE PERFORMANCE DATA QUOTED. TO OBTAIN PERFORMANCE DATA CURRENT TO THE MOST RECENT MONTH END, PLEASE CALL 1-877-743-7820. AN INVESTMENT IN THE FUND IS SUBJECT TO INVESTMENT RISKS, INCLUDING THE POSSIBLE LOSS OF THE PRINCIPAL AMOUNT INVESTED. THE FUND’S DISTRIBUTOR IS ARBOR COURT CAPITAL, LLC.
2023 Annual Report 3
CASTLE FOCUS FUND (Unaudited)
Castle Focus Fund
by Sectors (as a percentage of Net Assets)
June 30, 2023 |
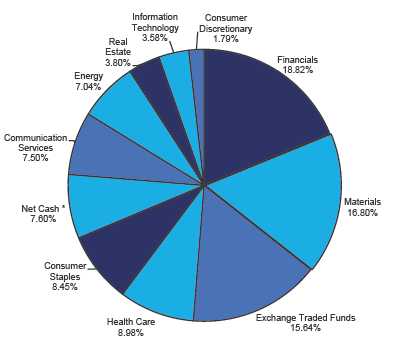
*Net Cash represents cash equivalents and liabilities in excess of other assets.
Availability of Quarterly Schedule of Investments
The Fund publicly files its complete schedule of portfolio holdings with the Securities and Exchange Commission (“SEC”) for the first and third quarters of each fiscal year on Form N-PORT. The Fund’s Form N-PORT is available on the SEC’s website at http://www.sec.gov.
St. James Investment Company, LLC (the “Sub-Adviser”) is responsible for exercising the voting rights associated with the securities held by the Fund. A description of the policies and procedures used by the Sub-Adviser in fulfilling this responsibility is available without charge by calling 1-877-743-7820. It is also included in the Fund’s Statement of Additional Information, which is available on the SEC’s website at http://www.sec.gov.
Form N-PX provides information regarding how the Fund voted proxies with regards to portfolio securities held during the most recent 12-month period ended June 30th and is available without charge, upon request, by calling 1-877-743-7820. This information is also available on the SEC’s website at http://www.sec.gov.
2023 Annual Report 4
Disclosure of Expenses
(Unaudited) |
As a shareholder of the Fund, you incur ongoing costs, including management fees; distribution and/or service (12b-1) fees; and other Fund expenses. This Example is intended to help you understand your ongoing costs (in dollars) of investing in the Fund and to compare these costs with the ongoing costs of investing in other mutual funds. Although the Fund charges no sales load or transaction fees, you will be assessed fees for outgoing wire transfers, returned checks and stop payment orders at prevailing rates charged by Mutual Shareholder Services, LLC, the Fund’s transfer agent, and IRA accounts will be charged an $8.00 annual maintenance fee. Additionally, your account will be indirectly subject to the expenses of any underlying funds.
The Example is based on an investment of $1,000 invested at the beginning of the period and held for the period January 1, 2023, through June 30, 2023.
The first line of the table below provides information about actual account values and actual expenses. You may use the information in this line, together with the amount you invested, to estimate the expenses that you paid over the period. Simply divide your account value by $1,000 (for example, an $8,600 account value divided by $1,000 = 8.6), then multiply the result by the number in the first line under the heading entitled “Expenses Paid During Period” to estimate the expenses you paid on your account during this period.
Hypothetical Example for Comparison Purposes
The second line of the table below provides information about hypothetical account values and hypothetical expenses based on the Fund’s actual expense ratio and an assumed rate of return of 5% per year before expenses, which is not the Fund’s actual return. The hypothetical account values and expenses may not be used to estimate the actual ending account balance or expenses you paid for the period. You may use this information to compare the ongoing costs of investing in this Fund and other funds. To do so, compare this 5% hypothetical example with the 5% hypothetical examples that appear in the shareholder reports of the other funds. Additionally, your account will be indirectly subject to the expenses of any underlying funds.
Please note that the expenses shown in the table are meant to highlight your ongoing costs only and do not reflect any transactional costs, such as, the charges assessed by Mutual Shareholder Services, LLC as described above or the expenses of underlying funds. Therefore, the second line of the table is useful in comparing ongoing costs only, and will not help you determine the relative total costs of owning different funds. In addition, if these transactional costs were included, your costs would have been higher.
| Investor Shares | | | | | | |
| | | | | | | Expenses Paid |
| | | Beginning | | Ending | | During the Period* |
| | | Account Value | | Account Value | | January 1, 2023 |
| | | January 1, 2023 | | June 30, 2023 | | to June 30, 2023 |
| |
| Actual | | $1,000.00 | | $1,022.65 | | $6.72 |
| |
| Hypothetical | | $1,000.00 | | $1,018.15 | | $6.71 |
| (5% annual return | | | | | | |
| before expenses) | | | | | | |
| * | Expenses are equal to the Fund’s annualized expense ratio of 1.34% for Investor Shares, multiplied by the average account value over the period, multiplied by 181/365 (to reflect the one-half year period). |
| |
| Class C | | | | | | |
| | | | | | | Expenses Paid |
| | | Beginning | | Ending | | During the Period* |
| | | Account Value | | Account Value | | January 1, 2023 |
| | | January 1, 2023 | | June 30, 2023 | | to June 30, 2023 |
| |
| Actual | $ | 1,000.00 | $ | 1,018.09 | $ | 11.71 |
| |
| Hypothetical | $ | 1,000.00 | $ | 1,013.19 | $ | 11.68 |
| (5% annual return | | | | | | |
| before expenses) | | | | | | |
| * | Expenses are equal to the Fund’s annualized expense ratio of 2.34% for Class C, multiplied by the average account value over the period, multiplied by 181/365 (to reflect the one-half year period). |
| |
2023 Annual Report 5
| Castle Focus Fund |
| |
| | | Schedule of Investments |
| | | | | | June 30, 2023 |
| Shares | | Fair Value | | | % of Net Assets |
| COMMON STOCKS | | | | | | |
| Agricultural Production-Crops | | | | | | |
| 12,750 Corteva, Inc. | $ | 730,575 | | | 2.98 | % |
| Cable & Other Pay Television Services | | | | | | |
| 25,500 Comcast Corporation - Class A | | 1,059,525 | | | 4.32 | % |
| Communications Equipment | | | | | | |
| 17,000 Cisco Systems, Inc. | | 879,580 | | | 3.58 | % |
| Crude Petroleum & Natural Gas | | | | | | |
| 6,500 EOG Resources, Inc. | | 743,860 | | | 3.03 | % |
| Electromedical & Electrotherapeutic Apparatus | | | | | | |
| 11,250 Medtronic PLC (Ireland) | | 991,125 | | | 4.04 | % |
| Fire, Marine & Casualty Insurance | | | | | | |
| 7,250 Berkshire Hathaway Inc. - Class B * | | 2,472,250 | | | | |
| 23,000 Loews Corporation | | 1,365,740 | | | | |
| 4,500 The Travelers Companies, Inc. | | 781,470 | | | | |
| | | 4,619,460 | | | 18.82 | % |
| Gold and Silver Ores | | | | | | |
| 32,500 Agnico Eagle Mines Limited (Canada) | | 1,624,350 | | | | |
| 28,500 Barrick Gold Corporation (Canada) | | 482,505 | | | | |
| | | 2,106,855 | | | 8.59 | % |
| Grain Mill Products | | | | | | |
| 8,750 Ingredion Incorporated | | 927,062 | | | 3.78 | % |
| Pharmaceutical Preparations | | | | | | |
| 10,500 Merck & Co. | | 1,211,595 | | | 4.94 | % |
| Pipe Lines (No Natural Gas) | | | | | | |
| 26,500 Enbridge Inc. (Canada) | | 984,475 | | | 4.01 | % |
| Plastic Materials, Synth Resins & Nonvulcan Elastomers | | | | | | |
| 18,000 DuPont de Nemours, Inc. | | 1,285,920 | | | 5.24 | % |
| Retail - Eating & Drinking Places | | | | | | |
| 2,200 Starbucks Corporation | | 217,932 | | | 0.89 | % |
| Retail - Family Clothing Stores | | | | | | |
| 2,600 The TJX Companies, Inc. | | 220,454 | | | 0.90 | % |
| Soap, Detergents, Cleaning Preparations, Perfumes, Cosmetics | | | | | | |
| 22,000 Unilever PLC ** | | 1,146,860 | | | 4.67 | % |
| Telephone Communications (No Radiotelephone) | | | | | | |
| 21,000 Verizon Communications Inc. | | 780,990 | | | 3.18 | % |
| Total for Common Stocks (Cost - $12,834,436) | | 17,906,268 | | | 72.96 | % |
| EXCHANGE TRADED FUNDS | | | | | | |
| 20,000 Goldman Sachs Access Treasury 0-1 Year ETF | | 2,001,400 | | | | |
| 20,000 SPDR® Bloomberg 1-3 Month T-Bill ETF | | 1,836,400 | | | | |
| (Cost - $3,827,870) | | 3,837,800 | | | 15.64 | % |
| REAL ESTATE INVESTMENT TRUSTS | | | | | | |
| 46,000 Equity Commonwealth | | 931,960 | | | 3.80 | % |
| (Cost - $1,235,131) | | | | | | |
| MONEY MARKET FUNDS | | | | | | |
| 1,992,307 Invesco Short-Term Investments Trust Treasury Portfolio | | | | | | |
| Institutional Class 5.03% *** | | 1,992,307 | | | 8.12 | % |
| (Cost - $1,992,307) | | | | | | |
| Total Investments | | 24,668,335 | | | 100.52 | % |
| (Cost - $19,889,744) | | | | | | |
| Liabilities in Excess of Other Assets | | (126,536 | ) | | -0.52 | % |
| Net Assets | $ | 24,541,799 | | | 100.00 | % |
* Non-Income Producing Security.
** ADR - American Depositary Receipt.
*** The yield shown represents the 7-day yield at June 30, 2023.
The accompanying notes are an integral part of these
financial statements. |
2023 Annual Report 6
| Castle Focus Fund |
| | |
| Statement of Assets and Liabilities | | | | |
| June 30, 2023 | | | | |
| Assets: | | | | |
| Investments at Fair Value | $ | 24,668,335 | | |
| (Cost - $19,889,744) | | | | |
| Receivables: | | | | |
| Dividends | | 29,772 | | |
| Total Assets | | 24,698,107 | | |
| Liabilities: | | | | |
| Payable for Shareholder Redemptions | | 100,960 | | |
| Accrued Advisory Fees | | 20,102 | | |
| Accrued Service Fees | | 6,835 | | |
| Accrued Distribution and Service (12b-1) Fees - Class C | | 28,411 | | |
| Total Liabilities | | 156,308 | | |
| Net Assets | $ | 24,541,799 | | |
| Net Assets Consist of: | | | | |
| Paid In Capital | $ | 17,246,716 | | |
| Total Distributable Earnings | | 7,295,083 | | |
| Net Assets | $ | 24,541,799 | | |
| | |
| Investor Shares | | | | |
| Net Assets | $ | 13,159,268 | | |
| Shares of Beneficial Interest Outstanding | | | | |
| (Unlimited number of shares authorized without par value) | | 728,460 | | |
| Net Asset Value, Offering Price per Share and Redemption Price per Share | $ | 18.06 | | |
| | |
| Class C | | | | |
| Net Assets | $ | 11,382,531 | | |
| Shares of Beneficial Interest Outstanding | | | | |
| (Unlimited number of shares authorized without par value) | | 722,259 | | |
| Net Asset Value, Offering Price per Share and Redemption Price per Share | $ | 15.76 | | |
| | |
| Statement of Operations | | | | |
| For the fiscal year ended June 30, 2023 | | | | |
| | |
| Investment Income: | | | | |
| Dividends (Net of foreign withholding tax of $29,657) | $ | 1,131,390 | | |
| Total Investment Income | | 1,131,390 | | |
| Expenses: | | | | |
| Advisory Fees | | 324,937 | | |
| Service Fees | | 188,463 | | |
| Distribution and Service (12b-1) Fees - Class C | | 114,198 | | |
| Total Expenses | | 627,598 | | |
| Less: Expenses Waived | | (77,985 | ) | |
| Net Expenses | | 549,613 | | |
| Net Investment Income | | 581,777 | | |
| Net Realized and Unrealized Gain (Loss) on Investments: | | | | |
| Net Realized Gain on Investments | | 2,986,325 | | |
| Net Change in Unrealized Appreciation on Investments | | (1,628,073 | ) | |
| Net Realized and Unrealized Gain on Investments | | 1,358,252 | | |
| | |
| Net Increase in Net Assets from Operations | $ | 1,940,029 | | |
The accompanying notes are an integral part of these
financial statements. |
2023 Annual Report 7
| Castle Focus Fund |
| | |
| Statements of Changes in Net Assets | | | | | | | | |
| | | 7/1/2022 | | | | 7/1/2021 | | |
| | | to | | | | to | | |
| | | 6/30/2023 | | | | 6/30/2022 | | |
| From Operations: | | | | | | | | |
| Net Investment Income | $ | 581,777 | | | $ | 72,035 | | |
| Net Realized Gain on Investments | | 2,986,325 | | | | 5,870,590 | | |
| Net Change in Unrealized Appreciation on Investments | | (1,628,073 | ) | | | (5,800,486 | ) | |
| Net Increase in Net Assets from Operations | | 1,940,029 | | | | 142,139 | | |
| From Distributions to Shareholders: | | | | | | | | |
| Investor Shares | | (3,319,650 | ) | | | (3,824,037 | ) | |
| Class C | | (1,737,437 | ) | | | (1,914,504 | ) | |
| Change in Net Assets from Distributions | | (5,057,087 | ) | | | (5,738,541 | ) | |
| From Capital Share Transactions: | | | | | | | | |
| Proceeds From Sale of Shares | | | | | | | | |
| Investor Shares | | 1,036,186 | | | | 2,251,447 | | |
| Class C | | 92,709 | | | | 7,291 | | |
| Shares Issued on Reinvestment of Dividends | | | | | | | | |
| Investor Shares | | 3,157,092 | | | | 3,629,753 | | |
| Class C | | 1,720,608 | | | | 1,897,355 | | |
| Cost of Shares Redeemed | | | | | | | | |
| Investor Shares | | (14,376,664 | ) | | | (15,041,122 | ) | |
| Class C | | (1,031,906 | ) | | | (2,944,053 | ) | |
| Net Increase (Decrease) from Shareholder Activity | | (9,401,975 | ) | | | (10,199,329 | ) | |
| Net Decrease in Net Assets | | (12,519,033 | ) | | | (15,795,731 | ) | |
| Net Assets at Beginning of Year | | 37,060,832 | | | | 52,856,563 | | |
| Net Assets at End of Year | $ | 24,541,799 | | | $ | 37,060,832 | | |
| | |
| Share Transactions: | | | | | | | | |
| Issued | | | | | | | | |
| Investor Shares | | 54,852 | | | | 103,238 | | |
| Class C | | 5,393 | | | | 395 | | |
| Reinvested | | | | | | | | |
| Investor Shares | | 178,065 | | | | 180,047 | | |
| Class C | | 110,650 | | | | 105,058 | | |
| Redeemed | | | | | | | | |
| Investor Shares | | (786,543 | ) | | | (683,968 | ) | |
| Class C | | (61,204 | ) | | | (155,785 | ) | |
| Net Increase (Decrease) in Shares | | (498,787 | ) | | | (451,015 | ) | |
| Shares Outstanding at Beginning of Year | | 1,949,506 | | | | 2,400,521 | | |
| Shares Outstanding at End of Year | | 1,450,719 | | | | 1,949,506 | | |
The accompanying notes are an integral part of these
financial statements. |
2023 Annual Report 8
| Castle Focus Fund |
| | |
| Financial Highlights - Investor Shares | | | | | | | | | | | | | | | | | | | |
| Selected data for a share outstanding | | 7/1/2022 | | | | 7/1/2021 | | | | 7/1/2020 | | | | 7/1/2019 | | | | 7/1/2018 | | |
| throughout the year: | | to | | | | to | | | | to | | | | to | | | | to | | |
| | | 6/30/2023 | | | | 6/30/2022 | | | | 6/30/2021 | | | | 6/30/2020 | | | | 6/30/2019 | | |
| Net Asset Value - | | | | | | | | | | | | | | | | | | | | | |
| Beginning of Year | $ | 19.75 | | | $ | 22.61 | | | $ | 18.62 | | | $ | 21.21 | | | $ | 22.24 | | |
| Net Investment Income (a) | | | 0.40 | | | | 0.10 | | | | 0.03 | | | | 0.11 | | | | 0.17 | | |
| Net Gains or Losses on Investments | | | | | | | | | | | | | | | | | | | | | |
| (realized and unrealized) | | | 0.79 | | | | (0.17 | ) | | | 4.21 | | | | (1.10 | ) | | | 0.82 | | |
| Total from Investment Operations | | | 1.19 | | | | (0.07 | ) | | | 4.24 | | | | (0.99 | ) | | | 0.99 | | |
| Distributions (From Net Investment Income) | | | (0.17 | ) | | | - | | | | (0.09 | ) | | | (0.21 | ) | | | (0.11 | ) | |
| Distributions (From Capital Gains) | | | (2.71 | ) | | | (2.79 | ) | | | (0.16 | ) | | | (1.39 | ) | | | (1.91 | ) | |
| Total Distributions | | | (2.88 | ) | | | (2.79 | ) | | | (0.25 | ) | | | (1.60 | ) | | | (2.02 | ) | |
| Net Asset Value - | | | | | | | | | | | | | | | | | | | | | |
| End of Year | $ | 18.06 | | | $ | 19.75 | | | $ | 22.61 | | | $ | 18.62 | | | $ | 21.21 | | |
| Total Return (b) | | | 6.29 | % | | | (0.55 | )% | | | 22.90 | % | | | (5.43 | )% | | | 5.19 | % | |
| Ratios/Supplemental Data | | | | | | | | | | | | | | | | | | | | | |
| Net Assets - End of Year (Thousands) | $ | 13,159 | | | $ | 25,315 | | | $ | 38,042 | | | $ | 68,170 | | | $ | 98,792 | | |
| Before Waiver | | | | | | | | | | | | | | | | | | | | | |
| Ratio of Expenses to Average Net Assets | | | 1.58 | % | | | 1.58 | % | | | 1.58 | % | | | 1.58 | % | | | 1.58 | % | |
| Ratio of Net Investment Income (Loss) to | | | | | | | | | | | | | | | | | | | | | |
| Average Net Assets | | | 1.88 | % | | | 0.21 | % | | | -0.10 | % | | | 0.31 | % | | | 0.54 | % | |
| After Waiver | | | | | | | | | | | | | | | | | | | | | |
| Ratio of Expenses to Average Net Assets | | | 1.34 | % | | | 1.34 | % | | | 1.34 | % | | | 1.34 | % | | | 1.34 | % | |
| Ratio of Net Investment Income to Average | | | | | | | | | | | | | | | | | | | | | |
| Net Assets | | | 2.12 | % | | | 0.45 | % | | | 0.14 | % | | | 0.55 | % | | | 0.78 | % | |
| Portfolio Turnover Rate | | | 26.89 | % | | | 17.14 | % | | | 25.19 | % | | | 68.11 | % | | | 74.00 | % | |
| Financial Highlights - Class C | | | | | | | | | | | | | | | | | | | | |
| Selected data for a share outstanding | | 7/1/2022 | | | | 7/1/2021 | | | | 7/1/2020 | | | | 7/1/2019 | | | | 7/1/2018 | | |
| throughout the year: | | to | | | | to | | | | to | | | | to | | | | to | | |
| | | 6/30/2023 | | | | 6/30/2022 | | | | 6/30/2021 | | | | 6/30/2020 | | | | 6/30/2019 | | |
| Net Asset Value - | | | | | | | | | | | | | | | | | | | | |
| Beginning of Year | $ | 17.60 | | | $ | 20.64 | | | $ | 17.11 | | | $ | 19.60 | | | $ | 20.80 | | |
| Net Investment Income or Loss (a) | | 0.19 | | | | (0.10 | ) | | | (0.15 | ) | | | (0.09 | ) | | | (0.04 | ) | |
| Net Gains or Losses on Investments | | | | | | | | | | | | | | | | | | | | |
| (realized and unrealized) | | 0.71 | | | | (0.15 | ) | | | 3.84 | | | | (1.01 | ) | | | 0.75 | | |
| Total from Investment Operations | | 0.90 | | | | (0.25 | ) | | | 3.69 | | | | (1.10 | ) | | | 0.71 | | |
| Distributions (From Net Investment Income) | | (0.03 | ) | | | - | | | | - | | | | - | | | | - | | |
| Distributions (From Capital Gains) | | (2.71 | ) | | | (2.79 | ) | | | (0.16 | ) | | | (1.39 | ) | | | (1.91 | ) | |
| Total Distributions | | (2.74 | ) | | | (2.79 | ) | | | (0.16 | ) | | | (1.39 | ) | | | (1.91 | ) | |
| Net Asset Value - | | | | | | | | | | | | | | | | | | | | |
| End of Year | $ | 15.76 | | | $ | 17.60 | | | $ | 20.64 | | | $ | 17.11 | | | $ | 19.60 | | |
| Total Return (b) | | 5.29 | % | | | (1.54 | )% | | | 21.67 | % | | | (6.38 | )% | | | 4.13 | % | |
| Ratios/Supplemental Data | | | | | | | | | | | | | | | | | | | | |
| Net Assets - End of Year (Thousands) | $ | 11,383 | | | $ | 11,746 | | | $ | 14,814 | | | $ | 14,362 | | | $ | 16,783 | | |
| Before Waiver | | | | | | | | | | | | | | | | | | | | |
| Ratio of Expenses to Average Net Assets | | 2.58 | % | | | 2.58 | % | | | 2.58 | % | | | 2.58 | % | | | 2.58 | % | |
| Ratio of Net Investment Income (Loss) to | | | | | | | | | | | | | | | | | | | | |
| Average Net Assets | | 0.94 | % | | | -0.76 | % | | | -1.04 | % | | | -0.70 | % | | | -0.44 | % | |
| After Waiver | | | | | | | | | | | | | | | | | | | | |
| Ratio of Expenses to Average Net Assets | | 2.34 | % | | | 2.34 | % | | | 2.34 | % | | | 2.34 | % | | | 2.34 | % | |
| Ratio of Net Investment Income (Loss) to | | | | | | | | | | | | | | | | | | | | |
| Average Net Assets | | 1.18 | % | | | -0.52 | % | | | -0.80 | % | | | -0.46 | % | | | -0.20 | % | |
| Portfolio Turnover Rate | | 26.89 | % | | | 17.14 | % | | | 25.19 | % | | | 68.11 | % | | | 74.00 | % | |
(a) Based on Average Shares Outstanding.
(b) Total return represents the rate that the investor would have earned or lost on an investment in the Fund
assuming reinvestment of dividends. |
The accompanying notes are an integral part of these
financial statements. |
2023 Annual Report 9
NOTES TO THE FINANCIAL STATEMENTS
CASTLE FOCUS FUND
June 30, 2023
1.) ORGANIZATION
Castle Focus Fund (the “Fund”) was organized as a non-diversified series of the PFS Funds (the “Trust”) on June 28, 2010. The Trust was established under the laws of Massachusetts by an Agreement and Declaration of Trust dated January 13, 2000, which was amended and restated January 20, 2011. The Trust is registered as an open-end investment company under the Investment Company Act of 1940, as amended (the “1940 Act”). The Trust may offer an unlimited number of shares of beneficial interest in a number of separate series, each series representing a distinct fund with its own investment objectives and policies. As of June 30, 2023, there were thirteen series authorized by the Trust. The Fund commenced operations on July 1, 2010. The Fund currently offers Investor Shares and Class C Shares. The classes differ principally in their respective distribution expenses and service arrangements. All classes of shares have identical rights to earnings, assets and voting privileges, except for class specific expenses and exclusive rights to vote on matters affecting only individual classes. Investor Shares of the Fund are sold at the net asset value (the “NAV”) without an initial sales charge and are not subject to 12b-1 distribution fees. Class C Shares of the Fund are sold at NAV without a sales charge and are subject to 12b-1 distribution/service fees of up to 1.00% per annum. The Fund’s investment objective is to seek long-term capital appreciation. The Investment Adviser to the Fund is Castle Investment Management, LLC (the “Adviser”) and the Sub-Adviser to the Fund is St. James Investment Company, LLC (the “Sub-Adviser”). Significant accounting policies of the Fund are presented below.
2.) SIGNIFICANT ACCOUNTING POLICIES
The Fund is an investment company and accordingly follows the investment company accounting and reporting guidance of the Financial Accounting Standards Board (“FASB”) Accounting Standards Codification Topic 946 Financial Services - Investment Companies. The financial statements are prepared in conformity with accounting principles generally accepted in the United States of America (“GAAP”). The Fund follows the significant accounting policies described in this section.
SECURITY VALUATION:
All investments in securities are valued as described in Note 3. The Trust’s Board of Trustees (“Board”) has designated the Adviser as “Valuation Designee” pursuant to Rule 2a-5 under the 1940 Act.
SHARE VALUATION:
The NAV is generally calculated as of the close of trading on the New York Stock Exchange (the “Exchange”) (normally 4:00 p.m. Eastern time) every day the Exchange is open. The NAV is calculated by taking the total value of each class’ assets, subtracting its liabilities, and then dividing by the total number of shares outstanding, rounded to the nearest cent. For each class, the offering price and redemption price per share is equal to the net asset value per share.
FEDERAL INCOME TAXES:
The Fund’s policy is to continue to comply with the requirements of the Internal Revenue Code that are applicable to regulated investment companies and to distribute all of its taxable income to shareholders. Therefore, no federal income tax provision is required. It is the Fund’s policy to distribute annually, prior to the end of the calendar year, dividends sufficient to satisfy excise tax requirements of the Internal Revenue Code. This Internal Revenue Code requirement may cause an excess of distributions over the book year-end accumulated income. In addition, it is the Fund’s policy to distribute annually, after the end of the fiscal year, any remaining net investment income and net realized capital gains.
The Fund recognizes the tax benefits of certain tax positions only where the position is “more likely than not” to be sustained assuming examination by tax authorities. Management has analyzed the Fund’s tax positions, and has concluded that no liability for unrecognized tax benefits should be recorded related to uncertain tax positions taken on returns filed for open tax years. The Fund identifies its major tax jurisdictions as U.S. Federal and State tax authorities; however, the Fund is not aware of any tax positions for which it is reasonably possible that the total amounts of unrecognized tax benefits will change materially in the next twelve months. The Fund recognizes interest and penalties, if any, related to unrecognized tax benefits as income tax expense in the Statement of Operations. During the fiscal year ended June 30, 2023, the Fund did not incur any interest or penalties.
DISTRIBUTIONS TO SHAREHOLDERS:
Distributions to shareholders, which are determined in accordance with income tax regulations, are recorded on the ex-dividend date.
2023 Annual Report 10
Notes to the Financial Statements - continued
The treatment for financial reporting purposes of distributions made to shareholders during the period from net investment income or net realized capital gains may differ from their ultimate treatment for federal income tax purposes. These differences are caused primarily by differences in the timing of the recognition of certain components of income, expense, or realized capital gain for federal income tax purposes. Where such differences are permanent in nature, they are reclassified in the components of the net assets based on their ultimate characterization for federal income tax purposes. Any such reclassifications will have no effect on net assets, results of operations, or net asset value per share of the Fund.
USE OF ESTIMATES:
The financial statements are prepared in accordance with GAAP, which requires management to make estimates and assumptions that affect the reported amounts of assets and liabilities and disclosure of contingent assets and liabilities at the date of the financial statements and the reported amounts of increases and decreases in net assets from operations during the reporting period. Actual results could differ from those estimates.
OTHER:
The Fund records security transactions based on a trade date. Dividend income is recognized on the ex-dividend date, and interest income, if any, is recognized on an accrual basis. The Fund uses the specific identification method in computing gain or loss on the sale of investment securities. Withholding taxes on foreign dividends have been provided for in accordance with the Fund’s understanding of the applicable country’s tax rules and rates. The Fund may invest in real estate investment trusts (“REITs”) that pay distributions to their shareholders based on available funds from operations. It is common for these distributions to exceed the REITs’ taxable earnings and profits resulting in the excess portion of such distribution to be designated as return of capital. Distributions received from REITs are generally recorded as dividend income and, if necessary, are reclassified annually in accordance with tax information provided by the underlying REITs.
ALLOCATION OF EXPENSES:
Expenses incurred by the Trust that don’t relate to a specific fund of the Trust are allocated pro-rata to the funds based on the total number of funds in the Trust at the time the expense was incurred or by another appropriate method. Class specific expenses are borne by each specific class. Income, non-class specific expenses, and realized and unrealized gains/losses are allocated to the respective classes based on the basis of relative net assets.
3.) SECURITIES VALUATIONS
The Fund utilizes various methods to measure the fair value of its investments on a recurring basis. GAAP establishes a hierarchy that prioritizes inputs to valuation methods. The three levels of inputs are:
Level 1 - Unadjusted quoted prices in active markets for identical assets or liabilities that the Fund has the ability to access.
Level 2 - Observable inputs other than quoted prices included in level 1 that are observable for the asset or liability, either directly or indirectly. These inputs may include quoted prices for the identical instrument on an inactive market, prices for similar instruments, interest rates, prepayment speeds, credit risk, yield curves, default rates and similar data.
Level 3 - Unobservable inputs for the asset or liability, to the extent relevant observable inputs are not available, representing the Fund’s own assumptions about the assumptions a market participant would use in valuing the asset or liability, and would be based on the best information available.
The availability of observable inputs can vary from security to security and is affected by a wide variety of factors, including, for example, the type of security, whether the security is new and not yet established in the marketplace, the liquidity of markets, and other characteristics particular to the security. To the extent that valuation is based on models or inputs that are less observable or unobservable in the market, the determination of fair value requires more judgment. Accordingly, the degree of judgment exercised in determining fair value is greatest for instruments categorized in level 3.
The inputs used to measure fair value may fall into different levels of the fair value hierarchy. In such cases, for disclosure purposes, the level in the fair value hierarchy within which the fair value measurement falls in its entirety, is determined based on the lowest level input that is significant to the fair value measurement in its entirety.
2023 Annual Report 11
Notes to the Financial Statements - continued
VALUATION OF FUND ASSETS:
A description of the valuation techniques applied to the Fund’s major categories of assets and liabilities measured at fair value on a recurring basis follows:
Equity securities (common stocks, including ADRs, exchange traded funds and REITs). Equity securities generally are valued by using market quotations, but may be valued on the basis of prices furnished by a pricing service when the Valuation Designee believes such prices accurately reflect the fair value of such securities. Securities that are traded on any stock exchange or on the NASDAQ over-the-counter market are generally valued by the pricing service at the last quoted sale price. Lacking a last sale price, an equity security is generally valued by the pricing service at its last bid price. Generally, if the security is traded in an active market and is valued at the last sale price, the security is categorized as a level 1 security, and if an equity security is valued by the pricing service at its last bid, it is generally categorized as a level 2 security. When market quotations are not readily available, when the Valuation Designee determines that the market quotation or the price provided by the pricing service does not accurately reflect the current fair value, or when restricted securities are being valued, such securities are valued as determined in good faith by the valuation committee, which includes the Valuation Designee, subject to review of the Board and are categorized in level 2 or level 3, when appropriate.
Money market funds. Money market funds are valued at the net asset value provided by the fund and are classified in level 1 of the fair value hierarchy.
In accordance with the Trust’s good faith pricing guidelines, the Valuation Designee is required to consider all appropriate factors relevant to the value of securities for which it has determined other pricing sources are not available or reliable as described above. There is no standard procedure for determining fair value, since fair value depends upon the circumstances of each individual case. As a general principle, the current fair value of an issue of securities being valued by the Valuation Designee would appear to be the amount which the owner might reasonably expect to receive for them upon their current sale. Methods which are in accordance with this principle may, for example, be based on (i) a multiple of earnings; (ii) a discount from market of a similar freely traded security (including a derivative security or a basket of securities traded on other markets, exchanges or among dealers); or (iii) yield to maturity with respect to debt issues, or a combination of these and other methods. The Board maintains responsibilities for the fair value determinations under Rule 2a-5 under the 1940 Act and oversees the Valuation Designee.
The following table summarizes the inputs used to value the Fund’s assets measured at fair value as of June 30, 2023:
| Valuation Inputs of Assets | | Level 1 | | Level 2 | | Level 3 | | Total |
| Common Stocks (including ADRs) | | $ 17,906,268 | | $0 | | $0 | | $17,906,268 |
| Exchange Traded Funds | | 3,837,800 | | 0 | | 0 | | 3,837,800 |
| Real Estate Investment Trusts | | 931,960 | | 0 | | 0 | | 931,960 |
| Money Market Funds | | 1,992,307 | | 0 | | 0 | | 1,992,307 |
| Total | | $24,668,335 | | $0 | | $0 | | $24,668,335 |
The Fund did not hold any Level 3 assets during the fiscal year ended June 30, 2023.
The Fund did not invest in derivative instruments during the fiscal year ended June 30, 2023.
4.) INVESTMENT ADVISORY AGREEMENT AND SERVICES AGREEMENT
The Fund entered into an Investment Management Agreement with Castle Investment Management, LLC as the investment adviser of the Fund. Under the terms of the Investment Management Agreement, the Adviser manages the investment portfolio of the Fund, subject to policies adopted by the Trust’s Trustees. The Adviser, at its own expense and without reimbursement from the Fund, furnishes office space and all necessary office facilities, equipment and executive personnel necessary for managing the assets of the Fund. The Adviser also pays the salaries and fees of all of its officers and employees that serve as officers of the Trust. For its services, the Adviser receives a fee of 1.00% per annum of the average daily net assets of the Fund. The Sub-Adviser of the Fund has responsibility for providing investment ideas and recommendations for the assets of the Fund, subject to the supervision of the Adviser. As full compensation for all services rendered, including investment ideas and recommendations for the assets of the Fund, the Adviser pays the Sub-Adviser a sub-advisor fee. For the fiscal year ended June 30, 2023, the Adviser received management fees totaling $324,937. At June 30, 2023, the Fund owed $20,102 to the Adviser.
The Fund also has a Services Agreement with the Adviser (the “Services Agreement”), under which the Fund pays the Adviser. Under the Services Agreement, the Adviser shall supervise the Fund’s business affairs and is obligated to pay the operating expenses of the Fund excluding management
2023 Annual Report 12
Notes to the Financial Statements - continued
fees, 12b-1 fees, brokerage fees and commissions, taxes, borrowing costs (such as (a) interest and (b) dividend expenses on securities sold short), ADR fees, the cost of acquired funds and extraordinary expenses. In addition, to the extent not otherwise provided by other parties under agreements with the Trust, the Adviser shall supply: (i) non-investment related statistical and research data; (ii) the services of a Chief Compliance Officer for the Trust; and (iii) executive and administrative services. The Adviser shall also assist with and/or supervise the preparation by the Trust’s administrator, transfer agent, and/or auditors of: (i) tax returns; (ii) reports to shareholders of the Fund; (iii) reports to, and filings with, the SEC, state securities commissions and Blue Sky authorities including preliminary and definitive proxy materials and post-effective amendments to the Trust’s registration statement; and (iv) necessary materials for meetings of the Trust’s Board of Trustees. The Adviser shall provide personnel to serve as officers of the Trust if so elected by the Trustees. Executive and administrative services include, but are not limited to, the coordination of all third parties furnishing services to the Fund, review of the books and records of the Fund maintained by such third parties, and the review and submission to the officers of the Fund for their approval, of invoices or other requests for payment of Fund expenses; and such other action with respect to the Fund as may be necessary in the opinion of the Adviser to perform its duties. For its services, the Adviser receives a service fee equal to 0.58% of the average daily net assets of the Fund. For the fiscal year ended June 30, 2023, the Adviser earned service fees of $188,463. At June 30, 2023, the Fund owed the Adviser service fees of $6,835. Beginning November 1, 2013, the Adviser has contractually agreed to waive Services Agreement fees by 0.24% of its average daily net assets. The Services Agreement fee waiver will automatically terminate on October 31, 2023, unless it is renewed by the Adviser. The Adviser may not terminate the fee waiver before October 31, 2023. There are no recoupment provisions for the waivers described above. A total of $77,985 in service fees was waived for the fiscal year ended June 30, 2023.
5.) DISTRIBUTION AND SHAREHOLDER SERVICING PLAN
The Fund has adopted a Distribution Plan in accordance with Rule 12b-1 under the 1940 Act (the “Plan”) with respect to the Class C Shares of the Fund. Pursuant to the Distribution Plan, the Fund compensates the Distributor for services rendered and expenses borne in connection with activities primarily intended to result in the sale of the Fund’s Class C Shares. This Plan provides that the Fund will pay the annual rate of 1.00% of the average daily net assets of the Fund’s Class C Shares for activities primarily intended to result in the sale of those shares. These activities include payment to entities for providing distribution and shareholder servicing with respect to the Fund’s Class C Shares. The 1.00% for the Class C Shares is comprised of a 0.25% service fee and a 0.75% distribution fee. The Fund incurred distribution and service (12b-1) fees of $114,198 for Class C Shares during the fiscal year ended June 30, 2023. At June 30, 2023, the Fund owed distribution and service (12b-1) fees of $28,411 for Class C Shares.
6.) RELATED PARTY TRANSACTIONS
Certain officers and a Trustee of the Trust are also officers of Premier Fund Solutions, Inc. (the “Administrator”). These individuals receive benefits from the Administrator resulting from administration fees paid to the Administrator of the Fund by the Adviser.
The Trustees who are not interested persons of the Fund were each paid $1,500, for a total of $6,000, in Trustees’ fees for the fiscal year ended June 30, 2023. These fees were paid by the Adviser.
7.) INVESTMENT TRANSACTIONS
For the fiscal year ended June 30, 2023, purchases and sales of investment securities other than U.S. Government obligations and short-term investments aggregated $8,018,456 and $18,842,301, respectively. Purchases and sales of U.S. Government obligations aggregated $0 and $0, respectively.
8.) CONTROL OWNERSHIP
The beneficial ownership, either directly or indirectly, of more than 25% of the voting shares of a fund creates a presumption of control of the fund, under section 2(a)(9) of the 1940 Act. At June 30, 2023, RBC®Capital Markets LLC, held for the benefit of its customers, in aggregate, 44.51% of Fund shares. The Trust does not know whether any underlying accounts of RBC®Capital Markets LLC, owned or controlled 25% or more of the voting securities of the Fund.
9.) TAX MATTERS
For Federal income tax purposes, the cost of securities owned at June 30, 2023 was $19,972,797.
At June 30, 2023, the composition of gross unrealized appreciation (the excess of value over tax cost) and depreciation (the excess of tax cost over value) of investments on a tax basis was as follows:
2023 Annual Report 13
Notes to the Financial Statements - continued
| | Appreciation | | (Depreciation) | | Net Appreciation (Depreciation) |
| | $5,433,423 | | ($737,885) | | $4,695,538 |
The tax character of Investor Shares distributions was as follows:
| | | Fiscal Year Ended | | Fiscal Year Ended |
| | | June 30, 2023 | | June 30, 2022 |
| Ordinary Income | | $ 400,400 | | $ 1,479,977 |
| Long-term Capital Gain | | 2,919,250 | | 2,344,060 |
| | | $ 3,319,650 | | $ 3,824,037 |
The tax character of Class C distributions was as follows:
| | | Fiscal Year Ended | | Fiscal Year Ended |
| | | June 30, 2023 | | June 30, 2022 |
| Ordinary Income | | $ 128,845 | | $ 740,950 |
| Long-term Capital Gain | | 1,608,592 | | 1,173,554 |
| | | $ 1,737,437 | | $ 1,914,504 |
As of June 30, 2023, the components of distributable earnings on a tax basis were as follows:
| Undistributed Ordinary Income | $ | 608,344 |
| Undistributed Long-Term Capital Gain/(Accumulated Losses) | | 1,991,201 |
| Unrealized Appreciation/(Depreciation) - Net | | 4,695,538 |
| | $ | 7,295,083 |
As of June 30, 2023, the primary differences between book and tax basis unrealized appreciation were attributable to the tax deferral of wash sales.
10.) CONTINGENCIES AND COMMITMENTS
The Trust indemnifies its officers and the Board for certain liabilities that may arise from the performance of their duties to the Trust. Additionally, in the normal course of business, the Fund enters into contracts that contain a variety of representations and warranties and which provide general indemnities. The Fund’s maximum exposure under these arrangements is unknown, as this would involve future claims that may be made against the Fund that have not yet occurred. However, based on experience, the risk of loss due to these warranties and indemnities appears to be remote.
11.) SUBSEQUENT EVENTS
Subsequent events after the date of the Statement of Assets and Liabilities have been evaluated through the date the financial statements were issued. Management has concluded that there is no impact requiring adjustment to or disclosure in the financial statements.
2023 Annual Report 14
REPORT OF INDEPENDENT REGISTERED PUBLIC ACCOUNTING FIRM
To the Shareholders of Castle Focus Fund
and Board of Trustees of PFS Funds
Opinion on the Financial Statements
We have audited the accompanying statement of assets and liabilities, including the schedule of investments, of Castle Focus Fund (the “Fund”), a series of PFS Funds, as of June 30, 2023, the related statement of operations for the year then ended, the statements of changes in net assets for each of the two years in the period then ended, the related notes, and the financial highlights for each of the five years in the period then ended (collectively referred to as the “financial statements”). In our opinion, the financial statements present fairly, in all material respects, the financial position of the Fund as of June 30, 2023, the results of its operations for the year then ended, the changes in net assets for each of the two years in the period then ended, and the financial highlights for each of the five years in the period then ended, in conformity with accounting principles generally accepted in the United States of America.
Basis for Opinion
These financial statements are the responsibility of the Fund’s management. Our responsibility is to express an opinion on the Fund’s financial statements based on our audits. We are a public accounting firm registered with the Public Company Accounting Oversight Board (United States) (“PCAOB”) and are required to be independent with respect to the Fund in accordance with the U.S. federal securities laws and the applicable rules and regulations of the Securities and Exchange Commission and the PCAOB.
We conducted our audits in accordance with the standards of the PCAOB. Those standards require that we plan and perform the audit to obtain reasonable assurance about whether the financial statements are free of material misstatement whether due to error or fraud.
Our audits included performing procedures to assess the risks of material misstatement of the financial statements, whether due to error or fraud, and performing procedures that respond to those risks. Such procedures included examining, on a test basis, evidence regarding the amounts and disclosures in the financial statements. Our procedures included confirmation of securities owned as of June 30, 2023, by correspondence with the custodian. Our audits also included evaluating the accounting principles used and significant estimates made by management, as well as evaluating the overall presentation of the financial statements. We believe that our audits provide a reasonable basis for our opinion.
We have served as the Fund’s auditor since 2010.

COHEN & COMPANY, LTD.
Milwaukee, Wisconsin
August 25, 2023
2023 Annual Report 15
ADDITIONAL INFORMATION
June 30, 2023
(Unaudited)
APPROVAL OF CONTINUATION OF THE MANAGEMENT AGREEMENT BETWEEN THE TRUST AND CASTLE INVESTMENT MANAGEMENT, LLC ON BEHALF OF THE CASTLE FOCUS FUND AND THE INVESTMENT SUB-ADVISORY AGREEMENT BETWEEN CASTLE INVESTMENT MANAGEMENT, LLC AND ST. JAMES INVESTMENT COMPANY, LLC ON BEHALF OF THE CASTLE FOCUS FUND
On March 7, 2023, the Board of Trustees (the “Board” or the “Trustees”) considered the renewal of the Management Agreement between the Trust and Castle Investment Management, LLC (“Castle”) on behalf of the Castle Focus Fund and the Investment Sub-Advisory Agreement between Castle and St. James Investment Company, LLC (“St. James”) on behalf of the Castle Focus Fund (the “Agreements”). In approving the Agreements, the Board considered and evaluated the following factors: (i) the nature, extent, and quality of the services provided by Castle and St. James to the Castle Focus Fund; (ii) the investment performance of the Castle Focus Fund, Castle, and St. James; (iii) the cost of the services to be provided and the profits to be realized by Castle and St. James and their respective affiliates (if any) from the relationship with the Castle Focus Fund; (iv) the extent to which economies of scale will be realized as the Castle Focus Fund grows and whether the fee levels reflect these economies of scale to the benefit of its shareholders; and (v) Castle’s and St. James’ practices regarding possible conflicts of interest.
In assessing these factors and reaching its decisions, the Board took into consideration information furnished for its review and consideration throughout the year at regular Board meetings, as well as information specifically prepared or presented in connection with the annual renewal process, including information presented at the Meeting. The Board reflected on the presentation by representatives of Castle earlier in the Meeting. The Board requested and was provided with information and reports relevant to the annual renewal of the Agreements, including: (i) reports regarding the services and support provided to the Castle Focus Fund and its shareholders by Castle and St. James; (ii) assessments of the investment performance of the Castle Focus Fund by personnel of Castle; (iii) commentary on the reasons for the performance; (iv) presentations addressing Castle’s and St. James’ investment philosophy, investment strategy, personnel, and operations; (v) compliance and audit reports concerning the Castle Focus Fund, Castle, and St. James; (vi) disclosure information contained in the registration statement of the Trust and the Forms ADV of Castle and St. James; and (vii) a memorandum from Counsel that summarized the fiduciary duties and responsibilities of the Board in reviewing and approving the Agreements, including the material factors set forth above and the types of information included in each factor that should be considered by the Board in order to make an informed decision. The Board also requested and received various informational materials including, without limitation: (i) documents containing information about Castle and St. James, including financial information, a description of personnel and the services provided to the Castle Focus Fund, information on investment advice, performance, summaries of Castle Focus Fund expenses, compliance program, current legal matters, and other general information; (ii) comparative expense and performance information for other mutual funds with strategies similar to the Castle Focus Fund; and (iii) benefits to be realized by Castle and St. James from their relationship with the Castle Focus Fund. The Board did not identify any information that was most relevant to its consideration to approve the Agreements, and each Trustee may have afforded different weight to the various factors.
1. Nature, Extent, and Quality of the Services Provided by Castle and St. James
In considering the nature, extent, and quality of the services provided by Castle and St. James, the Trustees reviewed the responsibilities of Castle and St. James under the Agreements. The Trustees reviewed the services being provided by Castle and St. James including, without limitation: the quality of investment advisory services (including research and recommendations with respect to portfolio securities); the process for formulating investment recommendations and assuring compliance with the Castle Focus Fund’s investment objective, strategies and limitations, and regulatory requirements. The Trustees reflected on their discussions with representatives from Castle throughout the past year. The Trustees considered the coordination of services for the Castle Focus Fund among Castle and the service providers (including St. James) and Castle’s interactions with the Independent Trustees; and the efforts of Castle to promote the Castle Focus Fund and grow its assets. The Trustees noted Castle’s and St. James’ continuity of, and commitment to retain, qualified personnel and to maintain and enhance its resources and systems and the continued cooperation with the Independent Trustees and Counsel for the Castle Focus Fund. The Trustees evaluated Castle’s and St. James’ personnel, including the education and experience of their personnel. The Trustees reflected on discussions with the representatives from Castle during the Meeting. After reviewing the foregoing information and further information in the materials provided by Castle and St. James, the
2023 Annual Report 16
Additional Information (Unaudited) - continued
Board concluded that, considering all the facts and circumstances, the nature, extent, and quality of the services provided by Castle and St. James were satisfactory and adequate for the Castle Focus Fund.
2. Investment Performance of the Castle Focus Fund, Castle, and St. James
In considering the investment performance of the Castle Focus Fund, Castle, and St. James, the Trustees compared the short-term and longer-term performance of the Castle Focus Fund with the performance of funds with similar objectives managed by other investment advisers, as well as with aggregated peer group data. The Trustees noted that Castle’s only other client is another mutual fund in the Trust. The Trustees discussed the performance of the Castle Focus Fund compared to other accounts managed by St. James which included the performance of other funds sub-advised by St. James. The Trustees considered St. James’ representation that the performance of these other accounts to be within its typical dispersion and any differences in performance can be primarily attributed to the differences in fees charged to the respective accounts. As to the performance of the Castle Focus Fund, the Board was provided with a report that included information regarding the performance of the Castle Focus Fund compared to the Fund’s Morningstar category of US Large Value Funds (the “Category”) and to a group of funds of similar size, style and objective, derived from the Category with assets ranging from $20 million to $50 million (the “Peer Group”). The Trustees noted that for the 1-year period ended December 31, 2022, the Castle Focus Fund outperformed relative to the Category, the Peer Group and its benchmark, the “S&P 500,” and that for the 3-, 5- and 10- year periods ended December 31, 2022, the Castle Focus Fund underperformed relative to the Category, the Peer Group and the S&P 500. They also noted that the Castle Focus Fund has generally maintained a large cash position, which has detracted from performance during periods of general market appreciation. It was further noted that the large cash position has been consistent with the philosophy of St. James and the investment strategies for the Castle Focus Fund. The Trustees reflected on previous conversations with representatives of Castle and St. James on the investment philosophy of the Castle Focus Fund being geared toward longer-term performance and that the Castle Focus Fund may not perform as well as its peers in certain types of markets. The Trustees also considered the comments from Castle regarding the Castle Focus Fund’s recent performance and how the shift in the market towards value-oriented stocks has aided the Castle Focus Fund’s relative performance. The Trustees also considered that the difference in performance for the Castle Focus Fund’s Class C shares versus those of the Investor Class shares was attributable to different fee structures. After reviewing and discussing the investment performance of the Castle Focus Fund further, Castle’s and St. James’ experience managing the Castle Focus Fund, their historical investment performance, and other relevant factors, the Board concluded, considering all the facts and circumstances, that the investment performance of the Castle Focus Fund, Castle, and St. James was satisfactory given the Castle Focus Fund’s investment objectives and strategy.
3. Costs of the Services to be Provided and Profits to be Realized by Castle and St. James
In considering the costs of the services to be provided and profits to be realized by Castle and St. James from the relationship with the Castle Focus Fund, the Trustees considered: (1) Castle’s and St. James’ financial condition and the level of commitment to the Castle Focus Fund and Castle by the principals of Castle; (2) the asset level of the Castle Focus Fund; (3) the overall expenses of the Castle Focus Fund; and (4) the nature and frequency of advisory and sub-advisory fee payments. The Trustees reviewed the information provided by Castle and St. James regarding their respective profits associated with managing the Castle Focus Fund. The Trustees also considered potential benefits for Castle and St. James in managing the Castle Focus Fund. The Trustees then compared the fees and expenses of the Castle Focus Fund (including the management fee) to other comparable mutual funds. The Trustees reviewed the fees under the Agreements compared to the Peer Group and Category, noting that the management fee and net expense ratio for both share classes were above the Peer Group and Category averages. The Trustees also considered the fees charged by St. James’ relative to the fees it charged to their other managed accounts, noting that the fees charged to the Castle Focus Fund were less than the average management fee charged to their other managed accounts. The Trustees noted that, although the management fee is high relative to the Peer Group and Category averages, it was within the range of management fees of the Peer Group and the Category. The Trustees also considered the sub-advisory portion of the fee, noting that it appeared reasonable in light of the services being provided by St. James. They also acknowledged that Castle is responsible for paying the sub-advisory fee to St. James. The Trustees recognized that Castle has committed to continue waive a portion of its Services Agreement fee with the Castle Focus Fund for another annual period. The Trustees also considered that under the contractual arrangements with Castle, it was required to pay most of the Castle Focus Fund’s operating expenses out of its assets. Based on the foregoing, the Board concluded that the fees to be paid to
2023 Annual Report 17
Additional Information (Unaudited) - continued
Castle (and in turn Castle’s payment to St. James) and the profits to be realized by Castle and St. James, in light of all the facts and circumstances, were fair and reasonable in relation to the nature and quality of the services provided by Castle and St. James.
4. Economies of Scale
The Trustees next considered the impact of economies of scale on the Castle Focus Fund’s size and whether advisory fee levels reflect those economies of scale for the benefit of the Castle Focus Fund’s investors. The Trustees considered that while the management fee remained the same at all asset levels, the Castle Focus Fund’s shareholders had experienced benefits from the fact that Castle was obligated to pay certain of the Castle Focus Fund’s operating expenses, which had the effect of limiting the overall fees paid by the Castle Focus Fund. The Trustees also recognized that Castle instituted a fee waiver under the Services Agreement and has indicated that it intends to keep the waiver in place for an additional annual period. The Trustees also noted that the fees payable to St. James were paid from the amounts paid to Castle and not paid directly by Castle Focus Fund shareholders. In light of its ongoing consideration of the Castle Focus Fund’s asset levels, expectations for growth in the Castle Focus Fund, and fee levels, the Board determined that the Castle Focus Fund’s fee arrangements, in light of all the facts and circumstances, were fair and reasonable in relation to the nature and quality of the services provided by Castle and St. James.
5. Possible Conflicts of Interest and Benefits to Castle and St. James
In considering Castle’s and St. James’ practices regarding conflicts of interest, the Trustees evaluated the potential for conflicts of interest and considered such matters as the experience and ability of the advisory personnel assigned to the Castle Focus Fund; the basis of decisions to buy or sell securities for the Castle Focus Fund; and the substance and administration of Castle’s and St. James’ respective codes of ethics. The Trustees also considered disclosure in the registration statement of the Trust related to Castle’s and St. James’ potential conflicts of interest. The Trustees noted that Castle’s only other client is a mutual fund in the Trust, and that it oversees St. James’ compliance with the Trust’s code of ethics. The Trustees also considered St. James’ practices regarding brokerage and portfolio transactions, including particularly St. James’ practice for seeking best execution for the Castle Focus Fund’s portfolio transactions. They considered the representation from St. James that it does not utilize soft dollars or participate in commission recapture programs. The Trustees noted the potential benefit of additional public exposure of St. James based on marketing that is done for the Castle Focus Fund. No other potential benefits (other than the management and service fees paid to Castle and sub-advisory fees paid to St. James) were identified by the Trustees. Based on the foregoing, the Board determined that Castle’s and St. James’ standards and practices relating to the identification and mitigation of possible conflicts of interest were satisfactory.
Next, the Independent Trustees met in executive session along with Counsel to discuss the continuation of the Agreements. The officers of the Trust and others present were excused during this discussion.
After further review and discussion, it was the Trustees’ determination that the best interests of the Castle Focus Fund’s shareholders was served by the renewal of the Agreements.
2023 Annual Report 18
This page was intentionally left blank.
2023 Annual Report 19
This page was intentionally left blank.
2023 Annual Report 20
Trustees and Officers
(Unaudited) |
The Board of Trustees supervises the business activities of the Trust. The names of the Trustees and executive officers of the Trust are shown below. For more information regarding the Trustees, please refer to the Statement of Additional Information, which is available upon request by calling 1-877-743-7820. Each Trustee serves until the Trustee sooner dies, resigns, retires, or is removed.
The Trustees and Officers of the Trust and their principal business activities during the past five years are:
Interested Trustees and Officers
| | | | | Number of | |
| | | | Principal | Portfolios In | Other |
| Name, | Position(s) | Term of Office | Occupation(s) | Fund | Directorships |
| Address(1), | Held With | and Length of | During | Complex | Held By |
| and Year of Birth | the Trust | Time Served | Past 5 Years | Overseen By | Trustee |
| | | | | Trustee | |
| |
| James D. Craft, | President | Indefinite Term; | Fund Administrator, Premier Fund | N/A | N/A |
| Year of Birth: 1982 | | Since 2023 | Solutions, Inc. (2007 - current); | | |
| | | | Chief Technology Officer, Premier | | |
| | | | Fund Solutions, Inc. (2011 - cur- | | |
| rent). |
| |
| Jeffrey R. Provence(2), | Trustee, | Indefinite Term; | CEO, Premier Fund Solutions, Inc. | 13 | Blue Chip |
| Year of Birth: 1969 | Secretary | Since 2000 | (2001 to current). General Partner | | Investor Funds, |
| | and | | and Portfolio Manager for Value | | Meeder Funds |
| | Treasurer | | Trend Capital Management, LP | | |
| | | | (1995 to current). | | |
| |
| Julian G. Winters, | Chief | Indefinite Term; | Managing Member, Watermark | N/A | N/A |
| Year of Birth: 1968 | Compliance | Since 2010 | Solutions LLC (investment compli- | | |
| | Officer | | ance and consulting) (2007 to cur- | | |
| rent). |
| | (1) The address of each trustee and officer is c/o PFS Funds, 1939 Friendship Drive, Suite C, El Cajon, California 92020.
(2) Jeffrey R. Provence is considered an “interested person” as defined in Section 2(a)(19) of the 1940 Act by virtue of his position
with the Trust. |
| | | | | Number of | |
| | | | Principal | Portfolios In | Other |
| Name, | Position | Term of Office | Occupation(s) | Fund | Directorships |
| Address(1), | Held With | and Length of | During | Complex | Held By |
| and Year of Birth | the Trust | Time Served | Past 5 Years | Overseen By | Trustee |
| | | | | Trustee | |
| |
| Thomas H. Addis III, | Independent | Indefinite Term; | Executive Director/CEO, Southern | 13 | None |
| Year of Birth: 1945 | Trustee | Since 2000 | California PGA (2006 to current). | | |
| |
| Robert L. Boerner, | Independent | Indefinite Term; | Owner / Broker of Gecko Realty | 13 | None |
| Year of Birth: 1969 | Trustee | Since 2022 | (2008 to current). | | |
| |
| Allen C. Brown, | Independent | Indefinite Term; | Retired. Law Office of Allen C. | 13 | Blue Chip |
| Year of Birth: 1943 | Trustee | Since 2010 | Brown, estate planning and business | | Investor Funds |
| | | | attorney (1970 to 2021). | | |
| |
| John W. Czechowicz, | Independent | Indefinite Term; | CPA at CWDL (2016 to current). | 13 | None |
| Year of Birth: 1983 | Trustee | Since 2022 | | | |
(1) The address of each trustee and officer is c/o PFS Funds, 1939 Friendship Drive, Suite C, El Cajon, California 92020.
2023 Annual Report 21
Investment Adviser
Castle Investment Management, LLC
Sub-Adviser
St. James Investment Company, LLC
Legal Counsel
Practus, LLP
Custodian
U.S. Bank, N.A.
Distributor
Arbor Court Capital, LLC
Dividend Paying Agent,
Shareholders' Servicing Agent,
Transfer Agent
Mutual Shareholder Services, LLC
Fund Administrator
Premier Fund Solutions, Inc.
Independent Registered Public Accounting Firm
Cohen & Company, Ltd. |
This report is provided for the general information of the shareholders of the Castle
Focus Fund. This report is not intended for distribution to prospective investors in the
Fund, unless preceded or accompanied by an effective prospectus. |
Castle Focus Fund
277 South Washington Street, Suite 335
Alexandria, Virginia 22314
www.castleim.com
703-260-1921

TANDX Institutional Shares
For Investors Seeking Long-Term Capital Appreciation
Annual Report
June 30, 2023
Dear Castle Tandem Fund Shareholder:
It is our pleasure to present to you the Annual Report for the Castle Tandem Fund (the “Fund”). This report provides you with important financial information on the Fund as well as portfolio manager commentary for the fiscal year ended June 30, 2023. We are very appreciative of your continued investments in the Fund.
The letter on the following page is from the Fund’s Sub-Adviser — Tandem Investment Advisors, Inc. — and provides you with an explanation of how the Fund performed over this past fiscal year.
We appreciate your trust and confidence in our management of the Fund.
Kind Regards,

Caeli Andrews
Co-Founder, Managing Director
Castle Investment Management | Andrew Welle
Co-Founder, Managing Director
Castle Investment Management |
2023 Annual Report 1
Dear Castle Tandem Fund Shareholder:
As we reflect on the past year, we are grateful for the continued trust and support you have shown as shareholders of the Castle Tandem Fund (the “Fund”). Our firm, Tandem Investment Advisors, Inc., has managed our flagship strategy — Large Cap Core — for individuals and institutions as a separately managed account (“SMA”) for over 32 years. We have now completed our fourth year as Subadvisor to the Fund, and it is with great pleasure that we share the Fund's performance and our insights with you.
A lot has happened since our last shareholder letter. Over the last twelve months, nearly every major central bank around the globe ratcheted up interest rates to combat persistently high inflation. This increase in interest rates resulted in one of the fastest monetary policy tightening cycles in the Federal Reserve’s history. At the time of our last letter, the Federal Reserve had just delivered the first 75 basis point rate increase since the mid-1990s, taking the Federal Funds Rate to 1.50 -1.75% . Since that historic rate increase, the Federal Reserve has hiked rates seven additional times for a total of 350 basis points. A sharp rise in short-term rates put significant pressure on the banking system as depositors pulled money in droves from low interest-bearing savings accounts to earn higher yields on Treasury bills and money markets. In March of 2023, after months of deposit flight, cracks began to show in the regional banking system, and within days, two of the largest bank failures in U.S history occurred with the collapse of Silicon Valley Bank and Signature Bank. Months later, and after multiple efforts to remain a going concern, in early May of 2023, First Republic Bank was closed by regulators and sold to JPMorgan. That same month, another crisis began to unfold as lawmakers in Washington were gridlocked on negotiations to increase the U.S. debt ceiling. Concerns of a global economic meltdown as a result of a U.S. default nearly hit a boiling point until an agreement was reached just days before the anticipated date of default. Amid all of this idiosyncratic noise and macroeconomic uncertainty, we remained steadfast in our commitment to our disciplined approach.
The objective of the Fund’s strategy is to seek long-term capital appreciation. As we manage the Fund, we seek to meet that objective while providing less volatile returns over a complete market cycle. As Sub-Adviser, we require that portfolio companies have consistent growth in earnings, revenues, and cash flow through any economic environment. Further, we require that all portfolio companies pay a dividend and consistently grow their dividend. A proprietary investment methodology is used to identify these portfolio companies meeting our quantitative investment criteria, and our strict investment process and discipline guide us in managing the Fund.
The Castle Tandem Fund posted a return of 10.35% for the fiscal year ended June 30, 2023, underperforming the S&P 500 Index (the Fund’s “Benchmark”), which over this same one-year period posted a return of 19.59% . As an active manager, our goal is not to replicate the performance of an index over any single time period, whether the index is up, down, or flat. Rather, we seek to produce superior risk-adjusted returns while minimizing volatility over a complete market cycle. We believe that limiting volatility while providing a consistent investment experience will help keep investors invested through all markets.
Three companies that significantly contributed to the Fund’s one-year performance were Stryker (SYK), Amphenol (APH), and Microsoft (MSFT).
• SYK – Over the past year, Stryker has consistently grown its earnings, revenues, and cash flow. Stryker’s business has benefitted from a normalization in volume of elective surgeries post-COVID. Recent pricing initiatives across Stryker’s portfolio of offerings have also served to bolster growth. Stryker continues to innovate and launch new products in both its MedSurg & Neurotechnology and Orthopaedics & Spine segments. Consistent growth in business fundamentals resulted in an 8.0% dividend increase last December.
• APH – Amphenol is one of the world’s largest providers of electronic and fiber optic connectors, sensors, and antennas. APH’s diverse product mix touches virtually every end market, including aerospace, automotive, defense, and telecommunications. Over the last twelve months, Amphenol continued its history of providing consistent growth across its income and cash flow statements. In October of 2022, Amphenol announced a 5.0% dividend increase, marking 11 consecutive years of dividend growth.
2023 Annual Report 2
• MSFT – Microsoft encountered two very different market environments over the last year. Along with the broader mega-cap technology stocks, MSFT’s valuation faced headwinds in the form of higher interest rates in the back half of 2022. The stock experienced a ~27% drawdown from its August 2022 highs to its November 2022 lows. Fast forward to 2023, and the market has put higher interest rates aside to make room for the latest focal point: artificial intelligence. In January 2023, Microsoft announced a $10 billion investment in ChatGPT parent company, OpenAI. Microsoft shares advanced nearly 60% from their November 2022 lows as excitement around an artificial intelligence revolution fueled a rally in mega-cap technology stocks.
Three companies that detracted from the Fund’s one-year performance were Dollar General (DG), Essential Utilities (WTRG), and Walgreens Boots Alliance (WBA).
• DG – Dollar General operates discount retail “general” stores across North America. The company has historically demonstrated its ability to grow earnings and revenues throughout any economic environment. More recently, management has cited a more challenging macroeconomic environment than previously anticipated. While Dollar General’s management team believes the uncertain macroeconomic environment may have a significant impact on customer spending levels, DG remains confident in its long-term growth prospects.
• WTRG – Essential Utilities is a water, wastewater, and natural gas utility company serving approximately 5 million people across 10 states. Essential Utilities has established a strong and consistent track record of increasing its dividend, having increased by an average annual rate of roughly 7% over the last five years. Despite solid dividend growth and steady business fundamentals, Essential Utilities faced headwinds from higher interest rates over the last year, resulting in poor share price performance.
• WBA – Walgreens Boots Alliance started to stumble just before the COVID-19 pandemic. The company faced headwinds in both its retail and pharmacy businesses in the form of competition from online retailers, generic price deflation and declining reimbursement rates. Despite those pressures, the company did just enough to continue to meet our fundamental growth criteria. More recently, amid rising inflation, Walgreens succumbed to increased input costs which eroded their margins and impaired earnings and cash flow. These factors prevented Walgreens from making it through our quantitative model and as a result, the stock was liquidated from the Fund.
As a bottom-up investment manager guided by strict disciplines and a process that eliminates human-bias, we do not seek to chase returns based on theme, allocation, or sector. The most recent fiscal year can be best described as a tale of two halves. In the back half of 2022, U.S. stocks faced the burden of rising interest rates and growing concerns about a potential recession. Investors sought to reduce risk, serving as a tailwind for low-volatility stocks which tend to be businesses that are more economically resilient and defensive during periods of market turmoil. Tandem’s quantitative investment process seeks companies that have historically demonstrated the ability to grow earnings, revenues, and cash flow throughout any economic environment—as a result, the Fund outperformed its Benchmark during the second half of 2022. The tides began to shift in the latter half of the Fund’s fiscal year near the beginning of 2023. Despite additional monetary tightening by the Federal Reserve and apprehension surrounding the banking system, U.S. stocks mounted a noteworthy rally, particularly in more cyclical and economically sensitive pockets of the market. Companies comprising this section of the market, for example non-profitable technology stocks, inherently do not meet our criteria or requirements of consistent earnings and dividend growth, and as a result, the Fund underperformed its Benchmark during the first half of 2023. Rather than chase these high-flying areas of the market or try to pick the next potential big winner in the artificial intelligence race, we remained committed to our time-tested investment discipline. And that discipline is; to only buy companies that meet our consistent fundamental growth criteria, to pare back risk in companies our quantitative model deems significantly and unsustainably overvalued, and to liquidate the companies no longer meeting our fundamental and quantitative requirements. Our adherence to this strict discipline and our patience to wait for opportunities in the interim between buying low and selling high results in a cash position that fluctuates over time. As of June 30, 2023, cash and cash equivalents (including government
2023 Annual Report 3
securities) in the Fund stood at 14.82% of the portfolio. This cash position is simply a byproduct of our investment process and not an allocation decision by the investment team. As attractive opportunities are identified, cash will be put to work, but only in those companies that meet our strict requirements of consistent fundamental growth regardless of economic or market conditions. Over the past 32+ years, this process and investment philosophy have been meticulously refined and adhered to, and remain unwavering.
As always, we remain focused, committed, and disciplined in executing our investment strategy. Thank you again for being a valued shareholder of the Castle Tandem Fund.
Kind regards,
John B. Carew
William L. Little, Jr., CFA
Benjamin G. Carew, CFA
Jordan S. Watson, CFA
Past performance does not guarantee future results. The investment return and principal value of an investment in the Fund will fluctuate so that an investor’s shares, when redeemed, may be worth more or less than their original cost. Current performance may be higher or lower than the performance data quoted. Performance data current to the most recent month end are available by calling 1-877-743-7820.
The Castle Tandem Fund’s prospectus contains important information about the Fund’s investment objectives, potential risks, management fees, charges and expenses, and other information and should be read and considered carefully before investing. You may obtain a current copy of the Fund’s prospectus by calling 1-877-743-7820. Distributed by Arbor Court Capital, LLC.
2023 Annual Report 4
CASTLE TANDEM FUND (Unaudited)
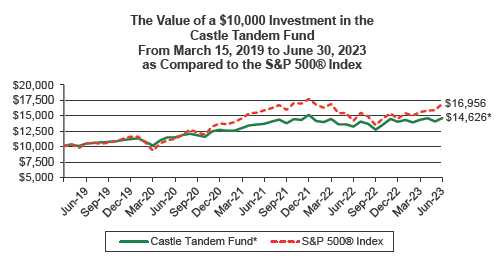
CASTLE TANDEM FUND PERFORMANCE INFORMATION
AVERAGE ANNUAL RETURNS AS OF JUNE 30, 2023
| | | | | | Since | |
| | 1 Year(A) | | 3 Year(A) | | Inception(A) | |
| Castle Tandem Fund | 10.35% | | 8.37% | | 9.26% | |
| S&P 500® Index (B) | 19.59% | | 14.60% | | 13.09% | |
The Fund's Total Annual Operating Expense Ratios (from November 1, 2022 Prospectus):
Institutional Shares – Gross 1.59%, Net 1.19%
The Fund’s actual expense ratios for the fiscal year ended June 30, 2023 can be found in the financial highlights included in this report. The Total Annual Operating Expense Ratios reported above will not correlate to the expense ratio in the Fund’s financial highlights because (a) the financial highlights include only the direct operating expenses incurred by the Fund, not the indirect costs of investing in the Fund and (b) the expense ratios may be for different periods.
(A) 1 Year, 3 Year and Since Inception returns include change in share prices and in each case includes reinvestment of any dividends and capital gain distributions. The Castle Tandem Fund commenced operations on March 15, 2019.
(B) The S&P 500® Index is an unmanaged index comprised of the stocks of large capitalization issues in the United States and it is considered representative of the U.S. equity markets as a whole.
PAST PERFORMANCE DOES NOT GUARANTEE FUTURE RESULTS. INVESTMENT RETURN AND PRINCIPAL VALUE WILL FLUCTUATE SO THAT SHARES, WHEN REDEEMED, MAY BE WORTH MORE OR LESS THAN THEIR ORIGINAL COST. RETURNS DO NOT REFLECT THE DEDUCTION OF TAXES THAT A SHAREHOLDER WOULD PAY ON FUND DISTRIBUTIONS OR THE REDEMPTION OF FUND SHARES. CURRENT PERFORMANCE MAY BE LOWER OR HIGHER THAN THE PERFORMANCE DATA QUOTED. TO OBTAIN PERFORMANCE DATA CURRENT TO THE MOST RECENT MONTH END, PLEASE CALL 1-877-743-7820. AN INVESTMENT IN THE FUND IS SUBJECT TO INVESTMENT RISKS, INCLUDING THE POSSIBLE LOSS OF THE PRINCIPAL AMOUNT INVESTED. THE FUND’S DISTRIBUTOR IS ARBOR COURT CAPITAL, LLC.
2023 Annual Report 5
CASTLE TANDEM FUND (Unaudited)
Castle Tandem Fund
by Sectors (as a percentage of Net Assets)
June 30, 2023 |
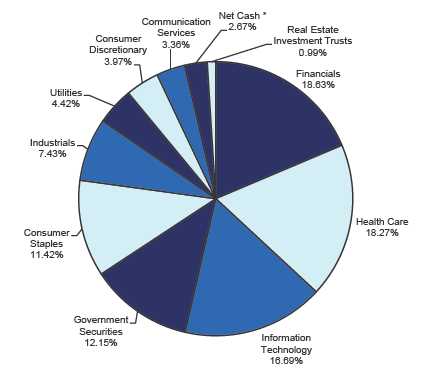
*Net Cash represents cash equivalents and liabilities in excess of other assets.
Availability of Quarterly Schedule of Investments
The Fund publicly files its complete schedule of portfolio holdings with the Securities and Exchange Commission (“SEC”) for the first and third quarters of each fiscal year on Form N-PORT. The Fund’s Form N-PORT is available on the SEC’s website at http://www.sec.gov.
Castle Investment Management, LLC (the “Adviser”) is responsible for exercising the voting rights associated with the securities held by the Fund. A description of the policies and procedures used by the Adviser in fulfilling this responsibility is available without charge by calling 1-877-743-7820. It is also included in the Fund’s Statement of Additional Information, which is available on the SEC’s website at http://www.sec.gov.
Form N-PX provides information regarding how the Fund voted proxies with regards to portfolio securities held during the most recent 12-month period ended June 30th and is available without charge, upon request, by calling 1-877-743-7820. This information is also available on the SEC’s website at http://www.sec.gov.
2023 Annual Report 6
Disclosure of Expenses
(Unaudited) |
As a shareholder of the Fund, you incur ongoing costs, including management fees and service fees. This Example is intended to help you understand your ongoing costs (in dollars) of investing in the Fund and to compare these costs with the ongoing costs of investing in other mutual funds. Although the Fund charges no sales load or transaction fees, you will be assessed fees for outgoing wire transfers, returned checks and stop payment orders at prevailing rates charged by Mutual Shareholder Services, LLC, the Fund’s transfer agent, and IRA accounts will be charged an $8.00 annual maintenance fee. Additionally, your account will be indirectly subject to the expenses of any underlying funds.
The Example is based on an investment of $1,000 invested at the beginning of the period and held for the period January 1, 2023, through June 30, 2023.
The first line of the table below provides information about actual account values and actual expenses. You may use the information in this line, together with the amount you invested, to estimate the expenses that you paid over the period. Simply divide your account value by $1,000 (for example, an $8,600 account value divided by $1,000 = 8.6), then multiply the result by the number in the first line under the heading entitled “Expenses Paid During Period” to estimate the expenses you paid on your account during this period.
Hypothetical Example for Comparison Purposes
The second line of the table below provides information about hypothetical account values and hypothetical expenses based on the Fund’s actual expense ratio and an assumed rate of return of 5% per year before expenses, which is not the Fund’s actual return. The hypothetical account values and expenses may not be used to estimate the actual ending account balance or expenses you paid for the period. You may use this information to compare the ongoing costs of investing in this Fund and other funds. To do so, compare this 5% hypothetical example with the 5% hypothetical examples that appear in the shareholder reports of the other funds.
Please note that the expenses shown in the table are meant to highlight your ongoing costs only and do not reflect any transactional costs, such as the charges assessed by Mutual Shareholder Services, LLC as described above or the expenses of underlying funds. Therefore, the second line of the table is useful in comparing ongoing costs only, and will not help you determine the relative total costs of owning different funds. In addition, if these transactional costs were included, your costs would have been higher.
| Institutional Shares | | | | | | |
| |
| | | | | | | Expenses Paid |
| | | Beginning | | Ending | | During the Period* |
| | | Account Value | | Account Value | | January 1, 2023 |
| | | January 1, 2023 | | June 30, 2023 | | to June 30, 2023 |
| |
| Actual | | $1,000.00 | | $1,042.29 | | $5.98 |
| |
| Hypothetical | | $1,000.00 | | $1,018.94 | | $5.91 |
| (5% annual return | | | | | | |
| before expenses) | | | | | | |
| * | Expenses are equal to the Fund’s annualized expense ratio of 1.18%, multiplied by the average account value over the period, multiplied by 181/365 (to reflect the one-half year period ended June 30, 2023). |
| |
2023 Annual Report 7
| Castle Tandem Fund | | | | |
| |
| | | Schedule of Investments |
| | | | June 30, 2023 |
| Shares / Principal Amount | | Fair Value | % of Net Assets |
| COMMON STOCKS | | | | |
| Arrangement of Transportation of Freight & Cargo | | | | |
| 5,800 Expeditors International of Washington, Inc. | $ | 702,554 | 2.00 | % |
| Beverages | | | | |
| 7,400 Brown-Forman Corporation - Class B | | 494,172 | 1.41 | % |
| Cable & Other Pay Television Services | | | | |
| 28,400 Comcast Corporation - Class A | | 1,180,020 | 3.36 | % |
| Canned, Fruits, Vegetables, Preserves, Jams & Jellies | | | | |
| 7,800 The J.M. Smucker Company | | 1,151,826 | 3.28 | % |
| Electric Services | | | | |
| 7,900 NextEra Energy Inc. | | 586,180 | 1.67 | % |
| Electronic Connectors | | | | |
| 10,400 Amphenol Corporation - Class A | | 883,480 | 2.51 | % |
| Industrial Instruments For Measurement, Display, and Control | | | | |
| 800 Roper Technologies, Inc. | | 384,640 | 1.09 | % |
| Insurance Agents, Brokers & Services | | | | |
| 9,300 Brown & Brown, Inc. | | 640,212 | 1.82 | % |
| Meat Packing Plants | | | | |
| 19,700 Hormel Foods Corporation | | 792,334 | 2.25 | % |
| Orthopedic, Prosthetic & Surgical Appliances & Supplies | | | | |
| 2,900 Steris PLC (Ireland) | | 652,442 | 1.85 | % |
| Pharmaceutical Preparations | | | | |
| 12,200 Abbott Laboratories | | 1,330,044 | | |
| 7,700 AbbVie Inc. | | 1,037,421 | | |
| 6,300 Johnson & Johnson | | 1,042,776 | | |
| | | 3,410,241 | 9.70 | % |
| Refuse Systems | | | | |
| 5,500 Republic Services, Inc. | | 842,435 | | |
| 4,300 Waste Connections, Inc. (Canada) | | 614,599 | | |
| | | 1,457,034 | 4.14 | % |
| Retail - Variety Stores | | | | |
| 1,100 Costco Wholesale Corporation | | 592,218 | | |
| 5,300 Dollar General Corporation | | 899,834 | | |
| | | 1,492,052 | 4.24 | % |
| Rubber & Plastics Footwear | | | | |
| 4,500 NIKE, Inc. - Class B | | 496,665 | 1.41 | % |
| Security & Commodity Brokers, Dealers, Exchanges & Services | | | | |
| 9,700 Cboe Global Markets, Inc. | | 1,338,697 | | |
| 9,700 Intercontinental Exchange, Inc. | | 1,096,876 | | |
| | | 2,435,573 | 6.93 | % |
| Security Brokers, Dealers & Flotation Companies | | | | |
| 1,100 BlackRock, Inc. | | 760,254 | | |
| 2,500 MarketAxess Holdings Inc. | | 653,550 | | |
| 15,100 SEI Investments Company | | 900,262 | | |
| | | 2,314,066 | 6.58 | % |
| Services - Business Services, NEC | | | | |
| 3,000 Accenture PLC - Class A (Ireland) | | 925,740 | | |
| 2,100 Mastercard Incorporated - Class A | | 825,930 | | |
| 4,900 Visa Inc. - Class A | | 1,163,652 | | |
| | | 2,915,322 | 8.29 | % |
| Services - Computer Integrated Systems Design | | | | |
| 4,900 Jack Henry & Associates, Inc. | | 819,917 | 2.33 | % |
| Services - Computer Processing & Data Preparation | | | | |
| 2,000 Automatic Data Processing, Inc. | | 439,580 | | |
| 2,000 Verisk Analytics, Inc. | | 452,060 | | |
| | | 891,640 | 2.54 | % |
The accompanying notes are an integral part of these
financial statements. |
2023 Annual Report 8
| Castle Tandem Fund |
| |
| | | Schedule of Investments |
| | | | | | June 30, 2023 |
| Shares / Principal Amount | | Fair Value | | | % of Net Assets |
| COMMON STOCKS | | | | | | |
| Services - Computer Programming, Data Processing, Etc. | | | | | | |
| 2,900 FactSet Research Systems, Inc. | $ | 1,161,885 | | | 3.30 | % |
| Services - Prepackaged Software | | | | | | |
| 2,400 Microsoft Corporation | | 817,296 | | | 2.32 | % |
| Soap, Detergent, Cleaning Preparations, Perfumes, Cosmetics | | | | | | |
| 6,000 Church & Dwight Co. | | 601,380 | | | 1.71 | % |
| Surgical & Medical Instruments & Apparatus | | | | | | |
| 3,100 Becton, Dickinson and Company | | 818,431 | | | | |
| 2,600 ResMed, Inc. | | 568,100 | | | | |
| 3,200 Stryker Corporation | | 976,288 | | | | |
| | | 2,362,819 | | | 6.72 | % |
| Water Supply | | | | | | |
| 24,200 Essential Utilities, Inc. | | 965,822 | | | 2.75 | % |
| Total for Common Stocks (Cost - $23,601,288) | | 29,609,572 | | | 84.19 | % |
| REAL ESTATE INVESTMENT TRUSTS | | | | | | |
| 5,800 Terreno Realty Corporation | | 348,580 | | | 0.99 | % |
| (Cost - $319,005) | | | | | | |
| GOVERNMENT SECURITIES | | | | | | |
| 992,000 U.S. Treasury Bill, 5.01%, 07/05/2023 * ** | | 991,729 | | | | |
| 992,000 U.S. Treasury Bill, 5.02%, 07/11/2023 * ** | | 990,902 | | | | |
| 992,000 U.S. Treasury Bill, 5.07%, 07/18/2023 * ** | | 989,934 | | | | |
| 1,304,000 U.S. Treasury Bill, 4.97%, 07/25/2023 * ** | | 1,300,024 | | | | |
| (Cost - $4,270,989) | | 4,272,589 | | | 12.15 | % |
| MONEY MARKET FUNDS | | | | | | |
| 950,779 First American Treasury Obligations Fund - X Class 5.03% *** | | 950,779 | | | 2.70 | % |
| (Cost - $950,779) | | | | | | |
| Total Investments | | 35,181,520 | | | 100.03 | % |
| (Cost - $29,142,061) | | | | | | |
| Liabilities in Excess of Other Assets | | (11,620 | ) | | -0.03 | % |
| Net Assets | $ | 35,169,900 | | | 100.00 | % |
* Zero coupon bond. Coupon rate disclosed represents yield at June 30, 2023.
** Level 2 Security.
*** The yield shown represents the 7-day yield at June 30, 2023. |
The accompanying notes are an integral part of these
financial statements. |
2023 Annual Report 9
| Castle Tandem Fund |
| | |
| Statement of Assets and Liabilities | | | | |
| June 30, 2023 | | | | |
| | |
| Assets: | | | | |
| Investments at Fair Value | $ | 35,181,520 | | |
| (Cost - $29,142,061) | | | | |
| Receivables: | | | | |
| Dividends | | 22,487 | | |
| Shareholder Purchases | | 635 | | |
| Total Assets | | 35,204,642 | | |
| Liabilities: | | | | |
| Payable for Shareholder Redemptions | | 1,589 | | |
| Accrued Advisory Fees | | 28,096 | | |
| Accrued Service Fees | | 5,057 | | |
| Total Liabilities | | 34,742 | | |
| Net Assets | $ | 35,169,900 | | |
| | |
| Net Assets Consist of: | | | | |
| Paid In Capital | $ | 28,635,000 | | |
| Total Distributable Earnings | | 6,534,900 | | |
| Net Assets, for 1,033,974 Shares Outstanding | $ | 35,169,900 | | |
| (Unlimited shares authorized) | | | | |
| Net Asset Value, Offering and Redemption Price Per Share | | | | |
| ($35,169,900/1,033,974 shares) | $ | 34.01 | | |
| | |
| Statement of Operations | | | | |
| For the fiscal year ended June 30, 2023 | | | | |
| | |
| Investment Income: | | | | |
| Dividends (Net of foreign withholding tax of $1,070) | $ | 593,242 | | |
| Interest | | 74,267 | | |
| Total Investment Income | | 667,509 | | |
| Expenses: | | | | |
| Advisory Fees | | 340,306 | | |
| Service Fees | | 197,377 | | |
| Total Expenses | | 537,683 | | |
| Less: Expenses Waived | | (136,122 | ) | |
| Net Expenses | | 401,561 | | |
| | |
| Net Investment Income | | 265,948 | | |
| | |
| Realized and Unrealized Gain on Investments | | | | |
| Realized Gain on Investments | | 659,451 | | |
| Net Change in Unrealized Appreciation on Investments | | 2,269,670 | | |
| Net Realized and Unrealized Gain on Investments | | 2,929,121 | | |
| | |
| Net Increase in Net Assets from Operations | $ | 3,195,069 | | |
The accompanying notes are an integral part of these
financial statements. |
2023 Annual Report 10
| Castle Tandem Fund |
| | |
| Statements of Changes in Net Assets | | | | | | | | |
| | | 7/1/2022 | | | | 7/1/2021 | | |
| | | to | | | | to | | |
| | | 6/30/2023 | | | | 6/30/2022 | | |
| From Operations: | | | | | | | | |
| Net Investment Income | $ | 265,948 | | | $ | 74,589 | | |
| Net Realized Gain on Investments | | 659,451 | | | | 1,706,470 | | |
| Change in Net Unrealized Appreciation | | 2,269,670 | | | | (2,562,369 | ) | |
| Increase/(Decrease) in Net Assets from Operations | | 3,195,069 | | | | (781,310 | ) | |
| From Distributions to Shareholders: | | (672,898 | ) | | | (1,733,644 | ) | |
| From Capital Share Transactions: | | | | | | | | |
| Proceeds From Sale of Shares | | 13,414,786 | | | | 7,728,948 | | |
| Shares Issued on Reinvestment of Dividends | | 508,076 | | | | 1,444,888 | | |
| Cost of Shares Redeemed | | (13,963,361 | ) | | | (16,213,165 | ) | |
| Net Decrease from Shareholder Activity | | (40,499 | ) | | | (7,039,329 | ) | |
| Net Increase/(Decrease) in Net Assets | | 2,481,672 | | | | (9,554,283 | ) | |
| Net Assets at Beginning of Year | | 32,688,228 | | | | 42,242,511 | | |
| Net Assets at End of Year | $ | 35,169,900 | | | $ | 32,688,228 | | |
| Share Transactions: | | | | | | | | |
| Issued | | 406,952 | | | | 225,341 | | |
| Reinvested | | 15,180 | | | | 41,508 | | |
| Redeemed | | (428,518 | ) | | | (467,892 | ) | |
| Net Decrease in Shares | | (6,386 | ) | | | (201,043 | ) | |
| Shares Outstanding Beginning of Year | | 1,040,360 | | | | 1,241,403 | | |
| Shares Outstanding End of Year | | 1,033,974 | | | | 1,040,360 | | |
| Financial Highlights | | | | | | | | | | | | | | | | | | | | |
| Selected data for a share outstanding throughout the period: | | 7/1/2022 | | | | 7/1/2021 | | | | 7/1/2020 | | | | 7/1/2019 | | | | 3/15/2019* | | |
| | | to | | | | to | | | | to | | | | to | | | | to | | |
| | | 6/30/2023 | | | | 6/30/2022 | | | | 6/30/2021 | | | | 6/30/2020 | | | | 6/30/2019 | | |
| Net Asset Value - | | | | | | | | | | | | | | | | | | | | |
| Beginning of Period | $ | 31.42 | | | $ | 34.03 | | | $ | 28.62 | | | $ | 26.28 | | | $ | 25.00 | | |
| Net Investment Income (a) | | 0.26 | | | | 0.07 | | | | 0.11 | | | | 0.20 | | | | 0.06 | | |
| Net Gain/(Loss) on Securities (b) | | | | | | | | | | | | | | | | | | | | |
| (Realized and Unrealized) | | 2.98 | | | | (1.04 | ) | | | 5.40 | | | | 2.24 | | | | 1.22 | | |
| Total from Investment Operations | | 3.24 | | | | (0.97 | ) | | | 5.51 | | | | 2.44 | | | | 1.28 | | |
| Distributions (From Net Investment Income) | | (0.17 | ) | | | (0.07 | ) | | | (0.08 | ) | | | (0.09 | ) | | | - | | |
| Distributions (From Realized Capital Gains) | | (0.48 | ) | | | (1.57 | ) | | | (0.02 | ) | | | (0.01 | ) | | | - | | |
| Total Distributions | | (0.65 | ) | | | (1.64 | ) | | | (0.10 | ) | | | (0.10 | ) | | | - | | |
| Net Asset Value - | | | | | | | | | | | | | | | | | | | | |
| End of Period | $ | 34.01 | | | $ | 31.42 | | | $ | 34.03 | | | $ | 28.62 | | | $ | 26.28 | | |
| Total Return (c) | | 10.35 | % | | | (3.31 | )% | | | 19.30 | % | | | 9.31 | % | | | 5.12 | % | ** |
| Ratios/Supplemental Data | | | | | | | | | | | | | | | | | | | | |
| Net Assets - End of Period (Thousands) | $ | 35,170 | | | $ | 32,688 | | | $ | 42,243 | | | $ | 20,238 | | | $ | 3,723 | | |
| Before Waiver | | | | | | | | | | | | | | | | | | | | |
| Ratio of Expenses to Average Net Assets | | 1.58 | % | | | 1.58 | % | | | 1.58 | % | | | 1.58 | % | | | 1.58 | % | *** |
| Ratio of Net Investment Income (Loss) to Average Net Assets | | 0.38 | % | | | (0.20 | )% | | | (0.04 | )% | | | 0.32 | % | | | 0.45 | % | *** |
| After Waiver | | | | | | | | | | | | | | | | | | | | |
| Ratio of Expenses to Average Net Assets | | 1.18 | % | | | 1.18 | % | | | 1.18 | % | | | 1.18 | % | | | 1.18 | % | *** |
| Ratio of Net Investment Income to Average Net Assets | | 0.78 | % | | | 0.20 | % | | | 0.36 | % | | | 0.72 | % | | | 0.85 | % | *** |
| Portfolio Turnover Rate | | 13.64 | % | | | 25.25 | % | | | 14.85 | % | | | 41.69 | % | | | 1.59 | % | ** |
* Commencement of Operations.
** Not Annualized.
*** Annualized.
(a) Per share amounts were calculated using the average shares method.
(b) Realized and unrealized gains and losses per share in this caption are balancing amounts necessary to rec-
oncile the change in net asset value for the period, and may not reconcile with the aggregate gains and losses
in the Statement of Operations due to share transactions for the period.
(c) Total return represents the rate that the investor would have earned or lost on an investment in the Fund
assuming reinvestment of dividends and distributions, if any. |
The accompanying notes are an integral part of these
financial statements. |
2023 Annual Report 11
NOTES TO THE FINANCIAL STATEMENTS
CASTLE TANDEM FUND
June 30, 2023
1.) ORGANIZATION
Castle Tandem Fund (the “Fund”) was organized as a diversified series of the PFS Funds (the “Trust”) on March 5, 2019, and commenced operations on March 15, 2019. The Trust was established under the laws of Massachusetts by an Agreement and Declaration of Trust dated January 13, 2000, as amended on January 20, 2011 (the “Trust Agreement”). The Trust is registered as an open-end investment company under the Investment Company Act of 1940, as amended (the “1940 Act”). The Declaration of Trust permits the Trustees to issue an unlimited number of full and fractional shares of multiple separate and distinct portfolio series the assets and liabilities of which are separate and distinct from the assets and liabilities of the other series portfolios of the Trust. As of June 30, 2023, there were thirteen series authorized by the Trust. The investment adviser to the Fund is Castle Investment Management, LLC (the “Adviser”) and the sub-adviser to the Fund is Tandem Investment Advisors, Inc. (the “Sub-Adviser”). Significant accounting policies of the Fund are presented below.
2.) SIGNIFICANT ACCOUNTING POLICIES
The Fund is an investment company and accordingly follows the investment company accounting and reporting guidance of the Financial Accounting Standards Board (“FASB”) Accounting Standards Codification Topic 946 Financial Services - Investment Companies. The financial statements are prepared in conformity with accounting principles generally accepted in the United States of America (“GAAP”). The Fund follows the significant accounting policies described in this section.
SECURITY VALUATION:
All investments in securities are valued as described in Note 3. The Trust’s Board of Trustees (“Board”) has designated the Adviser as “Valuation Designee” pursuant to Rule 2a-5 under the 1940 Act.
SHARE VALUATION:
The NAV is generally calculated as of the close of trading on the New York Stock Exchange (the “Exchange”) (normally 4:00 p.m. Eastern time) every day the Exchange is open. The NAV is calculated by taking the total value of the Fund’s assets, subtracting its liabilities, and then dividing by the total number of shares outstanding, rounded to the nearest cent. The offering price and redemption price per share is equal to the net asset value per share.
FEDERAL INCOME TAXES:
The Fund’s policy is to continue to comply with the requirements of the Internal Revenue Code that are applicable to regulated investment companies and to distribute all of its taxable income to shareholders. Therefore, no federal income tax provision is required. It is the Fund’s policy to distribute annually, prior to the end of the calendar year, dividends sufficient to satisfy excise tax requirements of the Internal Revenue Code. This Internal Revenue Code requirement may cause an excess of distributions over the book year-end accumulated income. In addition, it is the Fund’s policy to distribute annually, after the end of the fiscal year, any remaining net investment income and net realized capital gains.
The Fund recognizes the tax benefits of certain tax positions only where the position is “more likely than not” to be sustained assuming examination by tax authorities. Management has analyzed the Fund’s tax positions, and has concluded that no liability for unrecognized tax benefits should be recorded related to uncertain tax positions taken on returns filed for open tax years. The Fund identifies its major tax jurisdictions as U.S. Federal and State tax authorities; however, the Fund is not aware of any tax positions for which it is reasonably possible that the total amounts of unrecognized tax benefits will change materially in the next twelve months. The Fund recognizes interest and penalties, if any, related to unrecognized tax benefits as income tax expense in the Statement of Operations. During the fiscal year ended June 30, 2023, the Fund did not incur any interest or penalties.
DISTRIBUTIONS TO SHAREHOLDERS:
Distributions to shareholders, which are determined in accordance with income tax regulations, are recorded on the ex-dividend date.
The treatment for financial reporting purposes of distributions made to shareholders during the period from net investment income or net realized capital gains may differ from their ultimate treatment for federal income tax purposes. These differences are caused primarily by differences in the timing of the recognition of certain components of income, expense, or realized capital gain for federal income
2023 Annual Report 12
Notes to the Financial Statements - continued
tax purposes. Where such differences are permanent in nature, they are reclassified in the components of the net assets based on their ultimate characterization for federal income tax purposes. Any such reclassifications will have no effect on net assets, results of operations, or net asset value per share of the Fund.
USE OF ESTIMATES:
The financial statements are prepared in accordance with GAAP, which requires management to make estimates and assumptions that affect the reported amounts of assets and liabilities and disclosure of contingent assets and liabilities at the date of the financial statements and the reported amounts of increases and decreases in net assets from operations during the reporting period. Actual results could differ from those estimates.
EXPENSES:
Expenses incurred by the Trust that do not relate to a specific fund of the Trust are allocated to the individual funds based on each fund’s relative net assets or another appropriate basis.
OTHER:
The Fund records security transactions based on a trade date for financial reporting purposes. Dividend income is recognized on the ex-dividend date, and interest income, if any, is recognized on an accrual basis. The Fund uses the specific identification method in computing gain or loss on the sale of investment securities. Withholding taxes on foreign dividends have been provided for in accordance with the Fund’s understanding of the applicable country’s tax rules and rates. Discounts and premiums on securities purchased are amortized over the lives of the respective securities. The Fund may invest in real estate investment trusts (“REITs”) that pay distributions to their shareholders based on available funds from operations. It is common for these distributions to exceed the REITs’ taxable earnings and profits resulting in the excess portion of such distribution to be designated as return of capital. Distributions received from REITs are generally recorded as dividend income and, if necessary, are reclassified annually in accordance with tax information provided by the underlying REITs.
3.) SECURITIES VALUATIONS
The Fund utilizes various methods to measure the fair value of its investments on a recurring basis. GAAP establishes a hierarchy that prioritizes inputs to valuation methods. The three levels of inputs are:
Level 1 - Unadjusted quoted prices in active markets for identical assets or liabilities that the Fund has the ability to access.
Level 2 - Observable inputs other than quoted prices included in level 1 that are observable for the asset or liability, either directly or indirectly. These inputs may include quoted prices for the identical instrument on an inactive market, prices for similar instruments, interest rates, prepayment speeds, credit risk, yield curves, default rates and similar data.
Level 3 - Unobservable inputs for the asset or liability, to the extent relevant observable inputs are not available, representing the Fund’s own assumptions about the assumptions a market participant would use in valuing the asset or liability, and would be based on the best information available.
The availability of observable inputs can vary from security to security and is affected by a wide variety of factors, including, for example, the type of security, whether the security is new and not yet established in the marketplace, the liquidity of markets, and other characteristics particular to the security. To the extent that valuation is based on models or inputs that are less observable or unobservable in the market, the determination of fair value requires more judgment. Accordingly, the degree of judgment exercised in determining fair value is greatest for instruments categorized in level 3.
The inputs used to measure fair value may fall into different levels of the fair value hierarchy. In such cases, for disclosure purposes, the level in the fair value hierarchy within which the fair value measurement falls in its entirety, is determined based on the lowest level input that is significant to the fair value measurement in its entirety.
VALUATION OF FUND ASSETS:
A description of the valuation techniques applied to the Fund’s major categories of assets and liabilities measured at fair value on a recurring basis follows.
2023 Annual Report 13
Notes to the Financial Statements - continued
Equity securities (common stocks, including real estate investment companies). Equity securities generally are valued by using market quotations, but may be valued on the basis of prices furnished by a pricing service when the Valuation Designee believes such prices accurately reflect the fair value of such securities. Securities that are traded on any stock exchange or on the NASDAQ over-the-counter market are generally valued by the pricing service at the last quoted sale price. Lacking a last sale price, an equity security is generally valued by the pricing service at its last bid price. Generally, if the security is traded in an active market and is valued at the last sale price, the security is categorized as a level 1 security, and if an equity security is valued by the pricing service at its last bid, it is generally categorized as a level 2 security. When market quotations are not readily available, when the Valuation Designee determines that the market quotation or the price provided by the pricing service does not accurately reflect the current fair value, or when restricted securities are being valued, such securities are valued as determined in good faith by the valuation committee, which includes the Valuation Designee, subject to review of the Board and are categorized in level 2 or level 3, when appropriate.
Fixed Income Securities. Fixed income securities are valued using prices provided by a pricing service approved by the Board. If the Fund's Valuation Designee determines that a price provided by the pricing service does not accurately reflect the fair market value of the securities, when prices are not readily available from a pricing service, or when restricted or illiquid securities are being valued, securities are valued at fair value as determined under the fair value pricing procedures below.
Money market funds. Money market funds are valued at net asset value provided by the funds and are classified in level 1 of the fair value hierarchy.
In accordance with the Trust’s good faith pricing guidelines, the Valuation Designee is required to consider all appropriate factors relevant to the value of securities for which it has determined other pricing sources are not available or reliable as described above. There is no standard procedure for determining fair value, since fair value depends upon the circumstances of each individual case. As a general principle, the current fair value of an issue of securities being valued by the Valuation Designee would appear to be the amount which the owner might reasonably expect to receive for them upon their current sale. Methods which are in accordance with this principle may, for example, be based on (i) a multiple of earnings; (ii) a discount from market of a similar freely traded security (including a derivative security or a basket of securities traded on other markets, exchanges or among dealers); or (iii) yield to maturity with respect to debt issues, or a combination of these and other methods. The Board maintains responsibilities for the fair value determinations under Rule 2a-5 under the 1940 Act and oversees the Valuation Designee.
The following table summarizes the inputs used to value the Fund’s assets measured at fair value as of June 30, 2023:
| Valuation Inputs of Assets | | Level 1 | | Level 2 | | Level 3 | | Total |
| Common Stocks | | $29,609,572 | | $0 | | $0 | | $29,609,572 |
| Real Estate Investment Trusts | | 348,580 | | 0 | | 0 | | 348,580 |
| Government Securities | | 0 | | 4,272,589 | | 0 | | 4,272,589 |
| Money Market Funds | | 950,779 | | 0 | | 0 | | 950,779 |
| Total | | $30,908,931 | | $4,272,589 | | $0 | | $35,181,520 |
The Fund did not hold any Level 3 assets during the fiscal year ended June 30, 2023.
The Fund did not invest in derivative instruments during the fiscal year ended June 30, 2023.
4.) INVESTMENT ADVISORY AGREEMENT AND SERVICES AGREEMENT
The Fund entered into an Investment Management Agreement with Castle Investment Management, LLC as the investment adviser of the Fund. Under the terms of the Investment Management Agreement, the Adviser manages the investment portfolio of the Fund, subject to policies adopted by the Trust’s Trustees. The Adviser, furnishes office space and all necessary office facilities, equipment and executive personnel necessary for managing the assets of the Fund. For its services, the Adviser receives an annual investment management fee of 1.00% of the average daily net assets of the Fund. The Sub-Adviser of the Fund has responsibility for providing investment ideas and recommendations for the assets of the Fund, subject to the supervision of the Adviser. As full compensation for all services rendered, including investment ideas and recommendations for the assets of the Fund, the Adviser pays the Sub-Adviser a sub-adviser fee. For the fiscal year ended June 30, 2023, the Adviser received management fees totaling $340,306. At June 30, 2023, the Fund owed $28,096 to the Adviser.
2023 Annual Report 14
Notes to the Financial Statements - continued
The Fund also has a Services Agreement with the Adviser (the “Services Agreement”), under which the Fund pays the Adviser. Under the Services Agreement, the Adviser shall supervise the Fund’s business affairs and is obligated to pay the operating expenses of the Fund excluding management fees, brokerage fees and commissions, taxes, borrowing costs (such as (a) interest and (b) dividend expenses on securities sold short), underlying fund fees and expenses, and extraordinary or non-recurring expenses. In addition, to the extent not otherwise provided by other parties under agreements with the Trust, the Adviser shall supply: (i) non-investment related statistical and research data; (ii) the services of a Chief Compliance Officer for the Trust; and (iii) executive and administrative services. The Adviser shall also assist with and/or supervise the preparation by the Trust’s administrator, transfer agent, and/or auditors of: (i) tax returns; (ii) reports to shareholders of the Fund; (iii) reports to, and filings with, the SEC, state securities commissions and Blue Sky authorities including preliminary and definitive proxy materials and post-effective amendments to the Trust’s registration statement; and (iv) necessary materials for meetings of the Trust’s Board of Trustees. The Adviser shall provide personnel to serve as officers of the Trust if so elected by the Trustees. Executive and administrative services include, but are not limited to, the coordination of all third parties furnishing services to the Fund, review of the books and records of the Fund maintained by such third parties, and the review and submission to the officers of the Fund for their approval, of invoices or other requests for payment of Fund expenses; and such other action with respect to the Fund as may be necessary in the opinion of the Adviser to perform its duties. For its services, the Adviser receives a service fee equal to 0.58% of the average daily net assets of the Fund. For the fiscal year ended June 30, 2023, the Adviser earned service fees of $197,377. At June 30, 2023, the Fund owed the Adviser service fees of $5,057. Beginning March 15, 2019, the Adviser has contractually agreed to waive Services Agreement fees by 0.40% of its average daily net assets through October 31, 2023. The Services Agreement fee waiver will automatically terminate on October 31, 2023 unless it is renewed by the Adviser. The Adviser may not terminate the fee waiver before October 31, 2023. There are no recoupment provisions for the waivers described above. A total of $136,122 in service fees was waived for the fiscal year ended June 30, 2023.
5.) RELATED PARTY TRANSACTIONS
Certain officers and a Trustee of the Trust are also officers of Premier Fund Solutions, Inc. (the “Administrator”). These individuals receive benefits from the Administrator resulting from administration fees paid to the Administrator of the Fund by the Adviser.
The Trustees who are not interested persons of the Fund were each paid $1,500, for a total of $6,000, in Trustees’ fees for the fiscal year ended June 30, 2023. These fees were paid by the Adviser.
6.) INVESTMENT TRANSACTIONS
For the fiscal year ended June 30, 2023, purchases and sales of investment securities other than U.S. Government obligations and short-term investments aggregated $3,999,926 and $5,825,192, respectively. Purchases and sales of long-term U.S. Government obligations aggregated $0 and $0, respectively.
7.) CONTROL OWNERSHIP
The beneficial ownership, either directly or indirectly, of more than 25% of the voting securities of a fund creates a presumption of control of the fund, under Section 2(a)(9) of the 1940 Act. As of June 30, 2023, National Financial Services, LLC, held for the benefit of its customers, in the aggregate, 61.91% of Fund shares. The Trust does not know whether the foregoing entity or any of the underlying beneficial holders owned or controlled 25% or more of the voting securities of the Fund.
8.) TAX MATTERS
For Federal income tax purposes, the cost of securities owned at June 30, 2023 was $29,155,748.
At June 30, 2023, the composition of gross unrealized appreciation (the excess of value over tax cost) and depreciation (the excess of tax cost over value) of investments on a tax basis was as follows:
| | Appreciation | | (Depreciation) | | Net Appreciation/(Depreciation) |
| | $6,587,856 | | ($562,084) | | $6,025,772 |
2023 Annual Report 15
Notes to the Financial Statements - continued
The tax character of distributions was as follows:
| | | Fiscal Year Ended | | Fiscal Year Ended |
| | | June 30, 2023 | | June 30, 2022 |
| Ordinary Income | | $ 179,700 | | $ 93,311 |
| Long-term Capital Gain | | 493,198 | | 1,640,333 |
| | | $ 672,898 | | $ 1,733,644 |
As of June 30, 2023, the components of distributable earnings (accumulated losses) on a tax basis were as follows:
| Undistributed Ordinary Income | $ | 164,174 |
| Undistributed Long-Term Capital Gain/(Accumulated Losses) | | 344,954 |
| Unrealized Appreciation/(depreciation) – Net | | 6,025,772 |
| | $ | 6,534,900 |
As of June 30, 2023, the primary differences between book and tax basis unrealized appreciation were attributable to the tax deferral of wash sales.
9.) CONTINGENCIES AND COMMITMENTS
The Trust indemnifies its officers and the Board for certain liabilities that may arise from the performance of their duties to the Trust. Additionally, in the normal course of business, the Fund enters into contracts that contain a variety of representations and warranties and which provide general indemnities. The Fund’s maximum exposure under these arrangements is unknown, as this would involve future claims that may be made against the Fund that have not yet occurred. However, based on experience, the risk of loss due to these warranties and indemnities appears to be remote.
10.) SUBSEQUENT EVENTS
Subsequent events after the date of the Statement of Assets and Liabilities have been evaluated through the date the financial statements were issued. Management has concluded that there is no impact requiring adjustment to or disclosure in the financial statements.
2023 Annual Report 16
REPORT OF INDEPENDENT REGISTERED PUBLIC ACCOUNTING FIRM
To the Shareholders of Castle Tandem Fund and
Board of Trustees of PFS Funds
Opinion on the Financial Statements
We have audited the accompanying statement of assets and liabilities, including the schedule of investments, of Castle Tandem Fund (the “Fund”), a series of PFS Funds, as of June 30, 2023, the related statement of operations for the year then ended, the statements of changes in net assets for each of the two years in the period then ended, the related notes, and the financial highlights for the years ended June 30, 2023, 2022, 2021, 2020 and the period from March 15, 2019 (commencement of operations) through June 30, 2019 (collectively referred to as the “financial statements”). In our opinion, the financial statements present fairly, in all material respects, the financial position of the Fund as of June 30, 2023, the results of its operations, the changes in net assets, and the financial highlights for each of the periods indicated above, in conformity with accounting principles generally accepted in the United States of America.
Basis for Opinion
These financial statements are the responsibility of the Fund’s management. Our responsibility is to express an opinion on the Fund’s financial statements based on our audits. We are a public accounting firm registered with the Public Company Accounting Oversight Board (United States) (“PCAOB”) and are required to be independent with respect to the Fund in accordance with the U.S. federal securities laws and the applicable rules and regulations of the Securities and Exchange Commission and the PCAOB.
We conducted our audits in accordance with the standards of the PCAOB. Those standards require that we plan and perform the audit to obtain reasonable assurance about whether the financial statements are free of material misstatement whether due to error or fraud.
Our audits included performing procedures to assess the risks of material misstatement of the financial statements, whether due to error or fraud, and performing procedures that respond to those risks. Such procedures included examining, on a test basis, evidence regarding the amounts and disclosures in the financial statements. Our procedures included confirmation of securities owned as of June 30, 2023, by correspondence with the custodian. Our audits also included evaluating the accounting principles used and significant estimates made by management, as well as evaluating the overall presentation of the financial statements. We believe that our audits provide a reasonable basis for our opinion.
We have served as auditor of one or more investment companies advised by Castle Investment Management, LLC since 2010.

COHEN & COMPANY, LTD.
Milwaukee, Wisconsin
August 25, 2023
2023 Annual Report 17
ADDITIONAL INFORMATION
June 30, 2023
(Unaudited) |
APPROVAL OF CONTINUATION OF THE MANAGEMENT AGREEMENT BETWEEN THE TRUST AND CASTLE INVESTMENT MANAGEMENT, LLC ON BEHALF OF THE CASTLE TANDEM FUND AND THE INVESTMENT SUB-ADVISORY AGREEMENT BETWEEN CASTLE INVESTMENT MANAGEMENT, LLC AND TANDEM INVESTMENT ADVISORS, INC. ON BEHALF OF THE CASTLE TANDEM FUND
On March 7, 2023, the Board of Trustees (the “Board” or the “Trustees”) considered the renewal of the Management Agreement between the Trust and Castle Investment Management, LLC (“Castle”) on behalf of the Castle Tandem Fund and the Investment Sub-Advisory Agreement between Castle and Tandem Investment Advisors, Inc. (“Tandem”) on behalf of the Castle Tandem Fund (the “Agreements”). In approving the Agreements, the Board considered and evaluated the following factors: (i) the nature, extent, and quality of the services provided by Castle and Tandem to the Castle Tandem Fund; (ii) the investment performance of the Castle Tandem Fund, Castle, and Tandem; (iii) the cost of the services to be provided and the profits to be realized by Castle and Tandem and their respective affiliates (if any) from the relationship with the Castle Tandem Fund; (iv) the extent to which economies of scale will be realized as the Castle Tandem Fund grows and whether the fee levels reflect these economies of scale to the benefit of its shareholders; and (v) Castle’s and Tandem’s practices regarding possible conflicts of interest.
In assessing these factors and reaching its decisions, the Board took into consideration information furnished throughout the year at regular Board meetings, as well as information specifically prepared or presented in connection with the annual renewal process, including information presented at the Meeting. The Board reflected on the presentation by representatives of Castle earlier in the Meeting. The Board requested and was provided with information and reports relevant to the annual renewal of the Agreements, including: (i) reports regarding the services and support provided to the Castle Tandem Fund and its shareholders by Castle and Tandem; (ii) assessments of the investment performance of the Castle Tandem Fund by personnel of Castle; (iii) commentary on the reasons for the performance; (iv) presentations addressing Castle’s and Tandem’s investment philosophy, investment strategy, personnel, and operations; (v) compliance and audit reports concerning the Castle Tandem Fund, Castle, and Tandem; (vi) disclosure information contained in the registration statement of the Trust and the Forms ADV of Castle and Tandem; and (vii) a memorandum from Counsel that summarized the fiduciary duties and responsibilities of the Board in reviewing and approving the Agreements, including the material factors set forth above and the types of information included in each factor that should be considered by the Board in order to make an informed decision. The Board also requested and received various informational materials including, without limitation: (i) documents containing information about Castle and Tandem, including financial information, a description of personnel and the services provided to the Castle Tandem Fund, information on investment advice, performance, summaries of Castle Tandem Fund expenses, compliance program, current legal matters, and other general information; (ii) comparative expense and performance information for other mutual funds with strategies similar to the Castle Tandem Fund; and (iii) benefits to be realized by Castle and Tandem from their relationship with the Castle Tandem Fund. The Board did not identify any information that was most relevant to its consideration to approve the Agreements, and each Trustee may have afforded different weight to the various factors.
1. Nature, Extent, and Quality of the Services Provided by Castle and Tandem
In considering the nature, extent, and quality of the services provided by Castle and Tandem, the Trustees reviewed the responsibilities of Castle and Tandem under the Agreements. The Trustees reviewed the services being provided by Castle and Tandem including, without limitation: the quality of investment advisory services (including research and recommendations with respect to portfolio securities); the process for formulating investment recommendations and assuring compliance with the Castle Tandem Fund’s investment objective, strategies and limitations, and regulatory requirements. The Trustees reflected on their discussions with representatives from Castle throughout the past year. The Trustees considered the coordination of services for the Castle Tandem Fund among Castle and the service providers (including Tandem) and Castle’s interactions with the Independent
2023 Annual Report 18
Additional Information (Unaudited) - continued
Trustees; and the efforts of Castle to promote the Castle Tandem Fund and grow its assets. The Trustees noted Castle’s and Tandem’s continuity of, and commitment to retain, qualified personnel and to maintain and enhance its resources and systems and the continued cooperation with the Independent Trustees and Counsel for the Castle Tandem Fund. The Trustees evaluated Castle’s and Tandem’s personnel, including the education and experience of their personnel. The Trustees reflected on discussions with representatives from Castle during the Meeting. After reviewing the foregoing information and further information in the materials provided by Castle and Tandem, the Board concluded that, considering all the facts and circumstances, the nature, extent, and quality of the services provided by Castle and Tandem were satisfactory and adequate for the Castle Tandem Fund.
2. Investment Performance of the Castle Tandem Fund, Castle, and Tandem
In considering the investment performance of the Castle Tandem Fund, Castle, and Tandem, the Trustees compared the performance of the Castle Tandem Fund with the performance of funds with similar objectives managed by other investment advisers, as well as with aggregated peer group data. The Trustees noted that Castle’s only other client is another mutual fund in the Trust. The Trustees discussed the performance of the Castle Tandem Fund compared to other accounts managed by Tandem. The Trustees considered Tandem’s representation that the performance of these other accounts to be within its typical dispersion and any differences in performance can be primarily attributed to the differences in fees charged to the respective accounts. As to the performance of the Castle Tandem Fund, the Board was provided with a report that included information regarding the performance of the Castle Tandem Fund compared to the Fund’s Morningstar category of US Large Blend Funds (the “Category”) and to a group of funds of similar size, style, and objective, derived from the Category with assets ranging from $20 million to $60 million (the “Peer Group”). The Trustees noted that for the 1-, and 3-year periods ended December 31, 2022, the Castle Tandem Fund outperformed its benchmark, the S&P 500, the Category and the Peer Group. After reviewing and discussing the investment performance of the Castle Tandem Fund further, Castle’s and Tandem’s experience managing the Castle Tandem Fund, Tandem’s historical investment performance, and other relevant factors, the Board concluded, considering all the facts and circumstances, that the investment performance of the Castle Tandem Fund, Castle, and Tandem was satisfactory given the Castle Tandem Fund’s investment objectives and strategy.
3. Costs of the Services to be Provided and Profits to be Realized by Castle and Tandem
In considering the costs of the services to be provided and profits to be realized by Castle and Tandem from the relationship with the Castle Tandem Fund, the Trustees considered: (1) Castle’s and Tandem’s financial condition and the level of commitment to the Castle Tandem Fund and Castle by the principals of Castle; (2) the asset level of the Castle Tandem Fund; (3) the overall expenses of the Castle Tandem Fund; and (4) the nature and frequency of advisory and sub-advisory fee payments. The Trustees reviewed the information provided by Castle and Tandem regarding their respective profits associated with managing the Castle Tandem Fund. The Trustees also considered potential benefits for Castle and Tandem in managing the Castle Tandem Fund. The Trustees then compared the fees and expenses of the Castle Tandem Fund (including the management fee) to other comparable mutual funds. The Trustees reviewed the fees under the Agreements compared to the Peer Group and the Category, noting that the management fee and net expense ratio were above the Peer Group and Category averages. The Trustees also considered the fees charged by Tandem relative to the fees it charged to its other managed accounts, noting that the fees charged to the Castle Tandem Fund were less than the average management fee charged to their other managed accounts. The Trustees noted that, although the management fee is high relative to the Peer Group and Category averages, it was within the range of management fees of the Peer Group and the Category. The Trustees also considered the sub-advisory portion of the fee, noting that it appeared reasonable in light of the services being provided by Tandem. They also acknowledged that Castle is responsible for paying the sub-advisory fee to Tandem. The Trustees recognized that Castle has indicated its intention to continue the fee waiver arrangement as it relates to the Services Agreement with the Castle Tandem Fund for another annual period. It was noted that the Castle Tandem Fund’s net expense ratio of 1.19% was only 3 basis points higher than the average net expense ratio of the funds in the Peer Group. The Trustees also considered that under the contractual arrangements with
2023 Annual Report 19
Additional Information (Unaudited) - continued
Castle, it was required to pay most of the Castle Tandem Fund’s operating expenses out of its assets. Based on the foregoing, the Board concluded that the fees to be paid to Castle (and in turn Castle’s payment to Tandem) and the profits to be realized, if any, by Castle and Tandem, in light of all the facts and circumstances, were fair and reasonable in relation to the nature and quality of the services provided by Castle and Tandem.
4. Economies of Scale
The Trustees next considered the impact of economies of scale on the Castle Tandem Fund’s size and whether advisory fee levels will reflect those economies of scale for the benefit of the Castle Tandem Fund’s investors. The Trustees considered that while the management fee remained the same at all asset levels, the Castle Tandem Fund’s shareholders will experience benefits from the fact that Castle is obligated to pay certain of the Castle Tandem Fund’s operating expenses, which has the effect of limiting the overall fees paid by the Castle Tandem Fund. The Trustees also recognized, as noted above, that Castle has indicated its intention to continue the waiver of a portion of its fees under the Services Agreement for an additional annual period. The Trustees also noted that the contractual arrangements with the Trust required that Castle effectively cap the expenses of the Castle Tandem Fund, which has a similar effect as a breakpoint, although the Trustees noted that shareholders would benefit without the need for the Castle Tandem Fund’s assets to reach or be maintained at certain asset thresholds. The Trustees also noted that the fees payable to Tandem were paid from the amounts paid to Castle and not paid directly by Castle Tandem Fund shareholders. In light of its ongoing consideration of the Castle Tandem Fund’s current asset levels, expectations for growth in the Castle Tandem Fund, and fee levels, the Board determined that the Castle Tandem Fund’s fee arrangements, in light of all the facts and circumstances, were fair and reasonable in relation to the nature and quality of the services provided by Castle and Tandem.
5. Possible Conflicts of Interest and Benefits to Castle and Tandem
In considering Castle and Tandem’s practices regarding conflicts of interest, the Trustees evaluated the potential for conflicts of interest and considered such matters as the experience and ability of the advisory personnel assigned to the Castle Tandem Fund; the basis of decisions to buy or sell securities for the Castle Tandem Fund; and the substance and administration of Castle’s and Tandem’ respective codes of ethics. The Trustees also considered disclosure in the registration statement of the Trust related to Castle and Tandem’s potential conflicts of interest. The Trustees noted that Castle has no other clients other than another fund in the Trust. The Trustees considered Castle’s role in monitoring Tandem’s compliance with such things as personal trading, brokerage and portfolio transactions, and trade allocations among clients. The Trustees noted that Tandem does not utilize soft dollars. The Trustees discussed the potential benefit of additional public exposure of Castle and Tandem based on marketing that is done for the Castle Tandem Fund. No other potential benefits (other than the management and service fees paid to Castle and sub-advisory fees paid to Tandem) were identified by the Trustees. Based on the foregoing, the Board determined that Castle’s and Tandem’ standards and practices relating to the identification and mitigation of possible conflicts of interest were satisfactory.
Next, the Independent Trustees met in executive session along with Counsel to discuss the continuation of the Agreements. The officers of the Trust and others present were excused during this discussion.
After further review and discussion, it was the Trustees’ determination that the best interests of the Castle Tandem Fund’s shareholders were served by the renewal of the Agreements.
2023 Annual Report 20
Trustees and Officers
(Unaudited) |
The Board of Trustees supervises the business activities of the Trust. The names of the Trustees and executive officers of the Trust are shown below. For more information regarding the Trustees, please refer to the Statement of Additional Information, which is available upon request by calling 1-877-743-7820. Each Trustee serves until the Trustee sooner dies, resigns, retires, or is removed.
The Trustees and Officers of the Trust and their principal business activities during the past five years are:
Interested Trustees and Officers
| | | | | Number of | |
| | | | Principal | Portfolios In | Other |
| Name, | Position(s) | Term of Office | Occupation(s) | Fund | Directorships |
| Address(1), | Held With | and Length of | During | Complex | Held By |
| and Year of Birth | the Trust | Time Served | Past 5 Years | Overseen By | Trustee |
| | | | | Trustee | |
| |
| James D. Craft, | President | Indefinite Term; | Fund Administrator, Premier Fund | N/A | N/A |
| Year of Birth: 1982 | | Since 2023 | Solutions, Inc. (2007 - current); | | |
| | | | Chief Technology Officer, Premier | | |
| | | | Fund Solutions, Inc. (2011 - cur- | | |
| rent). |
| |
| Jeffrey R. Provence(2), | Trustee, | Indefinite Term; | CEO, Premier Fund Solutions, Inc. | 13 | Blue Chip |
| Year of Birth: 1969 | Secretary | Since 2000 | (2001 to current). General Partner | | Investor Funds, |
| | and | | and Portfolio Manager for Value | | Meeder Funds |
| | Treasurer | | Trend Capital Management, LP | | |
| | | | (1995 to current). | | |
| |
| Julian G. Winters, | Chief | Indefinite Term; | Managing Member, Watermark | N/A | N/A |
| Year of Birth: 1968 | Compliance | Since 2010 | Solutions LLC (investment compli- | | |
| | Officer | | ance and consulting) (2007 to cur- | | |
| rent). |
(1) The address of each trustee and officer is c/o PFS Funds, 1939 Friendship Drive, Suite C, El Cajon, California 92020.
(2) Jeffrey R. Provence is considered an “interested person” as defined in Section 2(a)(19) of the 1940 Act by virtue of his position
with the Trust. |
Independent Trustees
| | | | | Number of | |
| | | | Principal | Portfolios In | Other |
| Name, | Position | Term of Office | Occupation(s) | Fund | Directorships |
| Address(1), | Held With | and Length of | During | Complex | Held By |
| and Year of Birth | the Trust | Time Served | Past 5 Years | Overseen By | Trustee |
| | | | | Trustee | |
| |
| Thomas H. Addis III, | Independent | Indefinite Term; | Executive Director/CEO, Southern | 13 | None |
| Year of Birth: 1945 | Trustee | Since 2000 | California PGA (2006 to current). | | |
| |
| Robert L. Boerner, | Independent | Indefinite Term; | Owner / Broker of Gecko Realty | 13 | None |
| Year of Birth: 1969 | Trustee | Since 2022 | (2008 to current). | | |
| �� |
| Allen C. Brown, | Independent | Indefinite Term; | Retired. Law Office of Allen C. | 13 | Blue Chip |
| Year of Birth: 1943 | Trustee | Since 2010 | Brown, estate planning and business | | Investor Funds |
| | | | attorney (1970 to 2021). | | |
| |
| John W. Czechowicz, | Independent | Indefinite Term; | CPA at CWDL (2016 to current). | 13 | None |
| Year of Birth: 1983 | Trustee | Since 2022 | | | |
(1) The address of each trustee and officer is c/o PFS Funds, 1939 Friendship Drive, Suite C, El Cajon, California 92020.
2023 Annual Report 21
Investment Adviser
Castle Investment Management, LLC
Sub-Adviser
Tandem Investment Advisors, Inc.
Legal Counsel
Practus, LLP
Custodian
US Bank, N.A.
Distributor
Arbor Court Capital, LLC
Dividend Paying Agent,
Shareholders’ Servicing Agent,
Transfer Agent
Mutual Shareholder Services, LLC
Fund Administrator
Premier Fund Solutions, Inc.
Independent Registered Public Accounting Firm
Cohen & Company, Ltd. |
This report is provided for the general information of the shareholders of the Castle
Tandem Fund. This report is not intended for distribution to prospective investors in the
Fund, unless preceded or accompanied by an effective prospectus. |
Castle Tandem Fund
277 South Washington Street, Suite 335
Alexandria, Virginia 22314
www.castleim.com
703-260-1921
Item 2. Code of Ethics.
The registrant has adopted a code of ethics that applies to the registrant’s principal executive officer and the principal financial officer. The registrant has not made any amendments to its code of ethics during the covered period. The registrant has not granted any waivers from any provisions of the code of ethics during the covered period. A copy of the registrant’s Code of Ethics is filed herewith.
Item 3. Audit Committee Financial Expert.
The registrant's Board of Trustees has determined that John W. Czechowicz is an audit committee financial expert. Mr. Czechowicz is independent for purposes of this Item 3.
Item 4. Principal Accountant Fees and Services.
(a-d) The following table details the aggregate fees billed for each of the last two fiscal years for audit fees, audit-related fees, tax fees and other fees by the principal accountant to the registrant. The principal accountant has provided no services to the adviser or any entity controlled by, or under common control with the adviser that provides ongoing services to the registrant.
| | | FYE 6/30/2023 | | FYE 6/30/2022 |
| Audit Fees | | $27,750 | | $27,750 |
| Audit-Related Fees | | $0 | | $0 |
| Tax Fees | | $7,000 | | $9,000 |
| All Other Fees | | $1,000 | | $1,000 |
Nature of Tax Fees: preparation of Excise Tax Statement, 1120 RIC, and review of year end dividend calculations. All Other Fees: Semi-Annual Reports Review
(e) (1) The audit committee approves all audit and non-audit related services and, therefore, has not adopted pre-approval policies and procedures described in paragraph (c)(7) of Rule 2-01 of Regulation S-X.
(e) (2) None of the services described in paragraph (b) through (d) of this Item were approved by the audit committee pursuant to paragraph (c)(7)(i)(C) of Rule 2-01 of Regulation S-X.
(f) All of the principal accountant’s hours spent on auditing the registrant’s financial statements were attributed to work performed by full-time permanent employees of the principal accountant.
(g) The following table indicates the aggregate non-audit fees billed by the registrant’s principal accountant for services to the registrant , the registrant’s investment adviser (not sub-adviser), and any entity controlling, controlled by, or under common control with the adviser that provides ongoing services to the registrant, for the last two years.
| Non-Audit Fees | | FYE 6/30/2023 | | FYE 6/30/2022 |
| Registrant | | $8,000 | | $10,000 |
| Registrant’s Investment Adviser | | $0 | | $0 |
(h) The principal accountant provided no services to the investment adviser or any entity controlling, controlled by, or under common control with the adviser that provides ongoing services to the registrant.
(i) Not applicable.
(j) Not applicable.
Item 5. Audit Committee of Listed Companies. Not applicable.
Item 6. Investments.
(a) Not applicable. Schedule filed with Item 1.
(b) Not applicable.
Item 7. Disclosure of Proxy Voting Policies and Procedures for Closed-End Management Investment Companies. Not applicable.
Item 8. Portfolio Managers of Closed End Management Investment Companies. Not applicable.
Item 9. Purchases of Equity Securities by Closed-End Management Investment Companies and Affiliated Purchasers. Not applicable.
Item 10. Submission of Matters to a Vote of Security Holders.
The registrant has not adopted procedures by which shareholders may recommend nominees to the registrant’s board of trustees.
Item 11. Controls and Procedures.
(a) The Registrant’s president and chief financial officer concluded that the disclosure controls and procedures (as defined in Rule 30a-3(c) under the Act (17 CFR 270.30a -3(c))) as of a date within 90 days of the filing date of the report that includes the disclosure required by this paragraph, based on the evaluation of these controls and procedures required by Rule 30a-3(b) under the Act (17 CFR 270.30a -3(b)) and Rules 13a-15(b) or 15d-15(b) under the Exchange Act (17 CFR 240.13a -15(b) or 240.15d -15(b)).
(b) There were no changes in the registrant’s internal control over financial reporting (as defined in Rule 30a-3(d) under the Act (17 CFR 270.30a -3(d)) that occurred during the period covered by this report that has materially affected, or is reasonably likely to materially affect, the registrant’s internal control over financial reporting.
Item 12. Disclosure of Securities Lending Activities for Closed-End Management Investment Companies.
Not applicable.
Item 13. Exhibits.
(a)(1) Code of Ethics. Filed herewith.
(a)(2) Certifications pursuant to Section 302 of the Sarbanes-Oxley Act of 2002. Filed herewith.
(a)(3) Not applicable.
(a)(4) Not applicable.
(b) Certification pursuant to Section 906 of the Sarbanes-Oxley Act of 2002. Filed herewith.
Pursuant to the requirements of the Securities Exchange Act of 1934 and the Investment Company Act of 1940, the registrant has duly caused this report to be signed on its behalf by the undersigned, thereunto duly authorized.
| | By: /s/James Craft
James Craft
President |
Pursuant to the requirements of the Securities Exchange Act of 1934 and the Investment Company Act of 1940, this report has been signed below by the following persons on behalf of the registrant and in the capacities and on the dates indicated.
| | By: /s/James Craft
James Craft
President |
| | By: /s/Jeffrey R. Provence
Jeffrey R. Provence
Chief Financial Officer |