UNITED STATES
SECURITIES AND EXCHANGE COMMISSION
WASHINGTON, D.C. 20549
CERTIFIED SHAREHOLDER REPORT OF REGISTERED MANAGEMENT
INVESTMENT COMPANIES
Investment Company Act file number 811-09781
PFS Funds
(Exact name of registrant as specified in charter)
1939 Friendship Drive, Suite C, El Cajon, CA 92020
(Address of principal executive offices) (Zip code)
CT Corporation System
155 Federal St., Suite 700, Boston, MA 02110
(Name and address of agent for service)
Registrant’s telephone number, including area code: (619) 588-9700
Date of fiscal year end: June 30
Date of reporting period: June 30, 2023
Item 1. Report to Stockholders.
Conquer Risk Funds
Conquer Risk Defensive Bull Fund
Ticker CRDBX
Conquer Risk Managed Volatility Fund
Ticker CRMVX
Conquer Risk Tactical Opportunities Fund
Ticker CRTOX
Conquer Risk Tactical Rotation Fund
Ticker CRTBX
ANNUAL REPORT
June 30, 2023
| Table of Contents | |
| |
| |
| |
| CONQUER RISK FUNDS | |
| Shareholder Report | 2 |
| Sector Allocation | 5 |
| Performance Information | 7 |
| Schedules of Investments | 11 |
| Statements of Assets and Liabilities | 15 |
| Statements of Operations | 15 |
| Statements of Changes in Net Assets | 17 |
| Financial Highlights | 19 |
| NOTES TO FINANCIAL STATEMENTS | 23 |
| REPORT OF INDEPENDENT REGISTERED PUBLIC ACCOUNTING FIRM | 29 |
| DISCLOSURE OF EXPENSES | 30 |
| ADDITIONAL INFORMATION | 32 |
| TRUSTEES & OFFICERS | 36 |
2023 Annual Report 1
Shareholder Report
June 30, 2023 |
Potomac Fund Management
The third quarter of calendar year 2022 (Conquer Risk Funds’ first fiscal quarter) began with volatility as a key theme. The Cboe S&P 500 Volatility Index (VIX) was regularly registering readings above 20, with some days seeing the market’s “fear gauge” crossing into the thirties. At the same time the market, where many investors turn for relative tranquility, was offering no such thing. The less followed (compared to the VIX) ICE BofA MOVE Index traded at levels that lined up with what was seen during the COVID pandemic and the collapse of Long-Term Capital Management. The MOVE Index measures volatility in the Treasury market, and it was signaling that the seas were not calm there. The volatility in the treasury market played out as this “haven” turned into one of its worst years in recent memory.
The third quarter was when investors began to take the Federal Reserve at face value and came to grips with the fact that interest rates were likely to head higher for longer. Many investors believed that the Fed was on the wrong path as an inverted yield curve signaled that a recession was surely in the cards.
As is often the case, the market did what it does best, making the greatest number of people look like fools. As volatility was rising, as the Fed was signaling that rates were going to continue to move higher, as the yield curve signaled an impending recession, the stock market bottomed in October 2022.
As is also often the case, investors were searching for the “why?” Why are stocks suddenly moving higher? Wasn’t inflation still a concern? Isn’t the inverted yield curve a sign of impending doom? The short answer is yes. Yes, those are valid concerns, however, the market is a discounting mechanism and forward-looking. As investors we know that, but what tends to surprise people in the market, is that it is not the absolute levels of key metrics that matter so much as the rate of change.
As the fourth quarter of 2022 progressed, the rate of change of inflation slowed, the pace at which interest rates were rising began to slow, and the rapid advance of the U.S. Dollar began to slow. This last point may have been overlooked by many, but it was important. It may be the key catalyst for the market’s bottom in October.
There tends to be an inverse relationship between the dollar and risk assets. Stocks spent much of 2021 under pressure as the Dollar Index bottomed and then rallied from a low near 89 to a peak above 114 in September 2022. As the fourth quarter progressed, the dollar continued to weaken, and risk assets continued to rally.
As the calendar turned to 2023, there were few believers in the strength being displayed in the equity market. The prevailing macroeconomic narrative remained centered on the fact that the inverted yield curve signaled that the economy was slowing, but the Federal Reserve would continue to hike. In rate of change terms, the market was already looking past these perceived negatives, but many investors were still not convinced. The market must have it wrong; they argued.
Then it happened! The moment that would vindicate the bears was at hand. In March 2023, regional banking stocks came under immense pressure. The rapid rise in interest rates had caught some of the more aggressive banks off guard. They had taken their “cheap” deposits and invested them in long-term treasuries and/or made other riskier loans to improve their net-interest margins in what was previously a low-rate world. Silicon Valley Bank was facing a run, and there were rumors circulating that Signature Bank was on the verge of collapse (both have subsequently failed). From there, attention began to turn to First Republic Bank
2023 Annual Report 2
(shuttered) and other regional banks that may have an issue with their loan books and investments now that interest rates have begun to move higher.
With memories of Lehman weekend flooding the minds of bulls and bears alike, many assumed that the Federal Reserve would surely have to stop raising rates. This was the wrong assumption on both fronts. The sell-off in the banks did not spread to the broader market for more than a week or so. It was not going to be Lehman 2.0. Also, the Federal Reserve was not going to stop raising rates. The “panic” was short-lived, and the equity markets resumed their march to the upside.
Conquer Risk Funds’ fiscal year ended on June 30, 2023. In the face of many bearish narratives, the NASDAQ 100 turned in its best first half of the year on record. Many of the high-growth technology stocks, that are not “supposed” to fare well when interest rates rise, were leading the market higher. At the same time, more stocks began to join the large technology leaders. The percentage of issues on the New York Stock Exchange making new 52-week highs expanded throughout the quarter.
In June, the Federal Reserve paused their rate-hiking cycle for a meeting. They would like to give their prior hikes time to work their way through the economy. The market continues to look forward. It is widely believed that this tightening cycle is nearing an end. Inflation is moving in the right direction, if not yet to the Fed target level.
The bear market of 2021/2022 may prove to be a cyclical bear within a secular bull market and not the start of something more prolonged. Unfortunately, that is something we will only know with the benefit of hindsight. Our approach remains systematic and does not aim to predict what trends will unfold next
Fund Performance (Fiscal Year Ending June 30, 2023):
Conquer Risk Defensive Bull Fund
For the year ended June 30, 2023, the Conquer Risk Defensive Bull Fund returned 40.72% . The S&P 500 Total Return Index returned 19.59% in the same period. The S&P Target Risk Aggressive Index returned 13.25% in the same period. Performance was helped by leveraged long positions in the ETFs that track the S&P 500. Key long positions that helped performance during the fiscal year were the Direxion Daily S&P 500 Bull 3x ETF (SPXL), the ProShares UltraPro S&P500 (UPRO), the Vanguard S&P 500 ETF (VOO), and the iShares Core S&P 500 ETF (IVV).
Conquer Risk Tactical Opportunities Fund
For the year ended June 30, 2023, the Conquer Risk Tactical Opportunities Fund returned 26.51% . The S&P 500 Total Return Index returned 19.59% in the same period. The S&P Target Risk Growth Index returned 9.85% in the period. The Tactical Opportunities Fund seeks granular exposure to specific themes and trends that are playing out in asset markets. During the period performance was helped by positions that provided exposure to the NAS-DAQ 100 Index such as the Invesco QQQ Trust (QQQ) and the ProShares UltraPro QQQ (TQQQ). Performance also benefited from leveraged exposure to the Technology sector via the Direxion Daily Technology Bull 3x Shares (TECL). Other positions that helped performance during the fiscal year were those that provided exposure to energy such as the Energy Select Sector SPDR Fund ETF (XLE). During the second half of the fiscal year, exposure to the Chinese Technology space via the KraneShares CSI China Internet Fund (KWEB) acted as a drag on performance. Additionally, positions in the iShares U.S. Broker-Dealers ETF (IAI), the Global X Silver Miners ETF (SIL), and the iShares Global Infrastructure ETF (IGF) hindered performance.
2023 Annual Report 3
Conquer Risk Tactical Rotation Fund
For the year ended June 30, 2023, the Conquer Risk Tactical Rotation Fund returned 8.27% . The S&P 500 Total Return Index returned 19.59% in the same period. The S&P Target Risk Moderate Index returned 6.54% . The Tactical Rotation Fund seeks to identify broad-based trends and themes across asset markets while attempting to position in a manner that tends to be more conservative than the S&P 500. Performance was helped by exposure to broad equity indexes via ETFs such as the Invesco S&P 500 Equal Weight ETF (RSP) and the Invesco QQQ Trust (QQQ). Additionally, a defensive posture in the early days of the fiscal year provided exposure to the Utilities Select Sector SPDR ETF (XLU) and the Consumer Staples Select Sector SPDR ETF (XLP), which aided performance. Positions that detracted from performance were the iShares China Large-Cap ETF (FXI), the iShares MSCI All Country Asia ex-Japan ETF (AAXJ), the VanEck Vectors Gold Miners ETF (GDX), the iShares Pharmaceuticals ETF (IHE), and the Financial Select Sector SPDR ETF (XLF).
Conquer Risk Managed Volatility Fund
For the year ended June 30, 2023, the Conquer Risk Managed Volatility Fund returned 7.16% . The Bloomberg Barclays Global Aggregate Total Return Index returned -1.32% . The S&P Target Risk Conservative Index returned 4.93% in the same period. Performance benefitted from exposure to the managed futures asset class via the AlphaSimplex Managed Futures Strategy Fund (AMFNX). Inverse exposure to the treasury market via the Direxion Daily 20-Year Treasury Bear 3x ETF (TMV) was a benefit in the first half of the fiscal year but functioned as a net detractor on the year overall. Exposure to High Yield Municipal Bond and Emerging Market Bond funds added to performance during the fiscal year while positions in High Yield Bond funds were a detractor.
Past performance does not guarantee future results. The investment return and principal value of an investment in the Funds will fluctuate so that an investor’s shares, when redeemed, may be worth more or less than their original cost. Current performance may be higher or lower than the performance data quoted. Performance data current to the most recent month end are available by calling 1-888-774-6679.
The Conquer Risk Funds’ prospectus contains important information about the Funds’ investment objectives, potential risks, management fees, charges and expenses, and other information and should be read and considered carefully before investing. You may obtain a current copy of the Funds’ prospectus by calling 1-888-774-6679. Distributed by Arbor Court Capital, LLC.
2023 Annual Report 4
Conquer Risk Funds (Unaudited)
CONQUER RISK DEFENSIVE BULL FUND
Sector Allocation as of June 30, 2023
(As a Percentage of Total Investments Held)
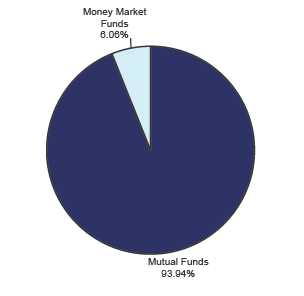
CONQUER RISK MANAGED VOLATILITY FUND
Sector Allocation as of June 30, 2023
(As a Percentage of Total Investments Held)
2023 Annual Report 5
Conquer Risk Funds (Unaudited)
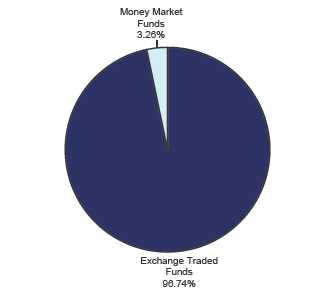
CONQUER RISK TACTICAL OPPORTUNITIES FUND
Sector Allocation as of June 30, 2023
(As a Percentage of Total Investments Held)

CONQUER RISK TACTICAL ROTATION FUND
Sector Allocation as of June 30, 2023
(As a Percentage of Total Investments Held)

2023 Annual Report 6
Conquer Risk Defensive Bull Fund (Unaudited)

PERFORMANCE INFORMATION
AVERAGE ANNUAL RETURNS AS OF JUNE 30, 2023
June 30, 2023 NAV $14.44
| | | | Since | |
| | 1 Year(A) | | Inception(A) | |
| Conquer Risk Defensive Bull Fund | 40.72% | | 22.53% | |
| S&P 500® Index (B) | 19.59% | | 14.61% | |
| S&P Target Risk Aggressive Index (C) | 13.25% | | 8.75% | |
Annual Fund Operating Expense Ratio (from 11/1/2022 Prospectus): 1.47%
The Fund’s expense ratio for the fiscal year ended June 30, 2023, can be found in the financial highlights included within this report. The Annual Fund Operating Expense Ratio reported above may not correlate to the expense ratio in the Fund’s financial highlights because (a) the financial highlights include only the direct operating expenses incurred by the Fund, not the indirect costs of investing in acquired funds, and (b) the application of breakpoints and waivers as described in Note 4.
(A) 1 Year and Since Inception returns include change in share prices and in each case includes reinvestment of any dividends and capital gain distributions. The Conquer Risk Defensive Bull Fund commenced operations on July 1, 2020.
(B) The S&P 500® Index is a widely recognized unmanaged index of equity prices and is representative of a broader market and range of securities than is found in the Fund’s portfolio. The Index is an unmanaged benchmark that assumes reinvestment of all distributions and excludes the effect of taxes and fees. Individuals cannot invest directly in this Index; however, an individual can invest in exchange traded funds or other investment vehicles that attempt to track the performance of a benchmark index.
(C) The S&P Target Risk Aggressive Index is designed to measure the performance of aggressive stock-bond allocations to equities, seeking to maximize opportunities for long-term capital accumulation. It may include small allocations to fixed income to enhance portfolio efficiency. The index is made up of 80% equities and 20% fixed income.
PAST PERFORMANCE DOES NOT GUARANTEE FUTURE RESULTS. INVESTMENT RETURN AND PRINCIPAL VALUE WILL FLUCTUATE SO THAT SHARES, WHEN REDEEMED, MAY BE WORTH MORE OR LESS THAN THEIR ORIGINAL COST. RETURNS DO NOT REFLECT THE DEDUCTION OF TAXES THAT A SHAREHOLDER WOULD PAY ON FUND DISTRIBUTIONS OR THE REDEMPTION OF FUND SHARES. CURRENT PERFORMANCE MAY BE LOWER OR HIGHER THAN THE PERFORMANCE DATA QUOTED. TO OBTAIN PERFORMANCE DATA CURRENT TO THE MOST RECENT MONTH END, PLEASE CALL 1-888-774-6679. AN INVESTMENT IN THE FUND IS SUBJECT TO INVESTMENT RISKS, INCLUDING THE POSSIBLE LOSS OF THE PRINCIPAL AMOUNT INVESTED. THE FUND'S DISTRIBUTOR IS ARBOR COURT CAPITAL, LLC.
2023 Annual Report 7
Conquer Risk Managed Volatility Fund (Unaudited)

PERFORMANCE INFORMATION
AVERAGE ANNUAL RETURNS AS OF JUNE 30, 2023
June 30, 2023 NAV $10.10
| | | | Since | |
| | 1 Year(A) | | Inception(A) | |
| Conquer Risk Managed Volatility Fund | 7.16% | | 1.60% | |
| Bloomberg Global-Aggregate Total Return Index (B) | -1.32% | | -4.97% | |
| S&P Target Risk Conservative Index (C) | 4.93% | | 1.18% | |
Annual Fund Operating Expense Ratio (from 11/1/2022 Prospectus): 1.95%
The Fund’s expense ratio for the fiscal year ended June 30, 2023, can be found in the financial highlights included within this report. The Annual Fund Operating Expense Ratio reported above may not correlate to the expense ratio in the Fund’s financial highlights because (a) the financial highlights include only the direct operating expenses incurred by the Fund, not the indirect costs of investing in acquired funds, and (b) the application of breakpoints and waivers as described in Note 4.
(A) 1 Year and Since Inception returns include change in share prices and in each case includes reinvestment of any dividends and capital gain distributions. The Conquer Risk Managed Volatility Fund commenced operations on July 1, 2020.
(B) The Bloomberg Global-Aggregate Total Return Index measures the performance of global investment grade fixed income securities. The Index is widely used as a benchmark for fixed income securities. Individuals cannot invest directly in this Index.
(C) The S&P Target Risk Conservative Index is designed to measure the performance of conservative stock-bond allocations to fixed income, seeking to produce a current income stream and avoid excessive volatility of returns. Equities are included to protect long-term purchasing power. The index is made up of 70% fixed income and 30% equities.
PAST PERFORMANCE DOES NOT GUARANTEE FUTURE RESULTS. INVESTMENT RETURN AND PRINCIPAL VALUE WILL FLUCTUATE SO THAT SHARES, WHEN REDEEMED, MAY BE WORTH MORE OR LESS THAN THEIR ORIGINAL COST. RETURNS DO NOT REFLECT THE DEDUCTION OF TAXES THAT A SHAREHOLDER WOULD PAY ON FUND DISTRIBUTIONS OR THE REDEMPTION OF FUND SHARES. CURRENT PERFORMANCE MAY BE LOWER OR HIGHER THAN THE PERFORMANCE DATA QUOTED. TO OBTAIN PERFORMANCE DATA CURRENT TO THE MOST RECENT MONTH END, PLEASE CALL 1-888-774-6679. AN INVESTMENT IN THE FUND IS SUBJECT TO INVESTMENT RISKS, INCLUDING THE POSSIBLE LOSS OF THE PRINCIPAL AMOUNT INVESTED. THE FUND'S DISTRIBUTOR IS ARBOR COURT CAPITAL, LLC.
2023 Annual Report 8
Conquer Risk Tactical Opportunities Fund (Unaudited)
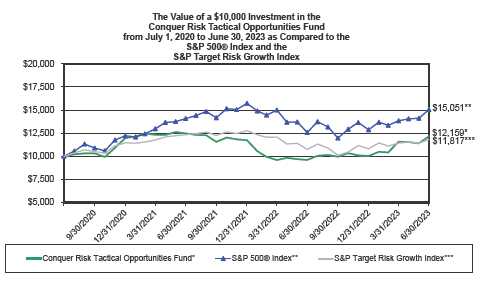
PERFORMANCE INFORMATION
AVERAGE ANNUAL RETURNS AS OF JUNE 30, 2023
June 30, 2023 NAV $10.26
| | | | Since | |
| | 1 Year(A) | | Inception(A) | |
| Conquer Risk Tactical Opportunities Fund | 26.51% | | 6.75% | |
| S&P 500® Index (B) | 19.59% | | 14.61% | |
| S&P Target Risk Growth Index (C) | 9.85% | | 5.73% | |
Annual Fund Operating Expense Ratio (from 11/1/2022 Prospectus): 1.90%
The Fund’s expense ratio for the fiscal year ended June 30, 2023, can be found in the financial highlights included within this report. The Annual Fund Operating Expense Ratio reported above may not correlate to the expense ratio in the Fund’s financial highlights because (a) the financial highlights include only the direct operating expenses incurred by the Fund, not the indirect costs of investing in acquired funds, and (b) the application of breakpoints and waivers as described in Note 4.
(A) 1 Year and Since Inception returns include change in share prices and in each case includes reinvestment of any dividends and capital gain distributions. The Conquer Risk Tactical Opportunities Fund commenced operations on July 1, 2020.
(B) The S&P 500® Index is a widely recognized unmanaged index of equity prices and is representative of a broader market and range of securities than is found in the Fund’s portfolio. The Index is an unmanaged benchmark that assumes reinvestment of all distributions and excludes the effect of taxes and fees. Individuals cannot invest directly in this Index; however, an individual can invest in exchange traded funds or other investment vehicles that attempt to track the performance of a benchmark index.
(C) The S&P Target Risk Growth Index is designed to measure the performance of equity allocations, while seeking to provide limited fixed income exposure to diversify risk. The index is made up of 60% equities and 40% fixed income.
PAST PERFORMANCE DOES NOT GUARANTEE FUTURE RESULTS. INVESTMENT RETURN AND PRINCIPAL VALUE WILL FLUCTUATE SO THAT SHARES, WHEN REDEEMED, MAY BE WORTH MORE OR LESS THAN THEIR ORIGINAL COST. RETURNS DO NOT REFLECT THE DEDUCTION OF TAXES THAT A SHAREHOLDER WOULD PAY ON FUND DISTRIBUTIONS OR THE REDEMPTION OF FUND SHARES. CURRENT PERFORMANCE MAY BE LOWER OR HIGHER THAN THE PERFORMANCE DATA QUOTED. TO OBTAIN PERFORMANCE DATA CURRENT TO THE MOST RECENT MONTH END, PLEASE CALL 1-888-774-6679. AN INVESTMENT IN THE FUND IS SUBJECT TO INVESTMENT RISKS, INCLUDING THE POSSIBLE LOSS OF THE PRINCIPAL AMOUNT INVESTED. THE FUND'S DISTRIBUTOR IS ARBOR COURT CAPITAL, LLC.
2023 Annual Report 9
Conquer Risk Tactical Rotation Fund (Unaudited)
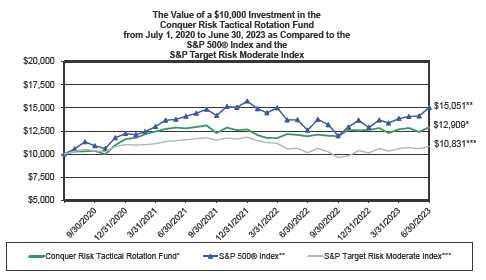
PERFORMANCE INFORMATION
AVERAGE ANNUAL RETURNS AS OF JUNE 30, 2023
June 30, 2023 NAV $10.51
| | | | Since | |
| | 1 Year(A) | | Inception(A) | |
| Conquer Risk Tactical Rotation Fund | 8.27% | | 8.90% | |
| S&P 500® Index (B) | 19.59% | | 14.61% | |
| S&P Target Risk Moderate Index (C) | 6.54% | | 2.70% | |
Annual Fund Operating Expense Ratio (from 11/1/2022 Prospectus): 1.71%
The Fund’s expense ratio for the fiscal year ended June 30, 2023, can be found in the financial highlights included within this report. The Annual Fund Operating Expense Ratio reported above may not correlate to the expense ratio in the Fund’s financial highlights because (a) the financial highlights include only the direct operating expenses incurred by the Fund, not the indirect costs of investing in acquired funds, and (b) the application of breakpoints and waivers as described in Note 4.
(A) 1 Year and Since Inception returns include change in share prices and in each case includes reinvestment of any dividends and capital gain distributions. The Conquer Risk Tactical Rotation Fund commenced operations on July 1, 2020.
(B) The S&P 500® Index is a widely recognized unmanaged index of equity prices and is representative of a broader market and range of securities than is found in the Fund’s portfolio. The Index is an unmanaged benchmark that assumes reinvestment of all distributions and excludes the effect of taxes and fees. Individuals cannot invest directly in this Index; however, an individual can invest in exchange traded funds or other investment vehicles that attempt to track the performance of a benchmark index.
(C) The S&P Target Risk Moderate Index is designed to measure the performance of moderate stock-bond allocations to fixed income while seeking to increase opportunities for higher returns through equities. The index is made up of 60% fixed income and 40% equities.
PAST PERFORMANCE DOES NOT GUARANTEE FUTURE RESULTS. INVESTMENT RETURN AND PRINCIPAL VALUE WILL FLUCTUATE SO THAT SHARES, WHEN REDEEMED, MAY BE WORTH MORE OR LESS THAN THEIR ORIGINAL COST. RETURNS DO NOT REFLECT THE DEDUCTION OF TAXES THAT A SHAREHOLDER WOULD PAY ON FUND DISTRIBUTIONS OR THE REDEMPTION OF FUND SHARES. CURRENT PERFORMANCE MAY BE LOWER OR HIGHER THAN THE PERFORMANCE DATA QUOTED. TO OBTAIN PERFORMANCE DATA CURRENT TO THE MOST RECENT MONTH END, PLEASE CALL 1-888-774-6679. AN INVESTMENT IN THE FUND IS SUBJECT TO INVESTMENT RISKS, INCLUDING THE POSSIBLE LOSS OF THE PRINCIPAL AMOUNT INVESTED. THE FUND'S DISTRIBUTOR IS ARBOR COURT CAPITAL, LLC.
2023 Annual Report 10
| Conquer Risk Defensive Bull Fund | |
| |
| | | Schedule of Investments |
| | | | | June 30, 2023 |
| Shares | Fair Value | | % of Net Assets |
| EXCHANGE TRADED FUNDS | | | | | |
| Equity | | | | | |
| 2,390,290 Direxion Daily S&P 500 Bull 3X Shares * # | $ | 215,078,294 | | | |
| 1,006,959 Vanguard 500 Index Fund ETF ** | | 410,114,262 | | | |
| Total for Exchange Traded Funds (Cost - $611,077,916) | | 625,192,556 | | 95.87 | % |
| MONEY MARKET FUNDS | | | | | |
| 21,086,975 First American Treasury Obligations Fund - Class X 5.03% + | | 21,086,975 | | 3.23 | % |
| Total for Money Market Funds (Cost $21,086,975) | | | | | |
| Total Investments (Cost - $632,164,891) | | 646,279,531 | | 99.10 | % |
| Other Assets in Excess of Other Liabilities | | 5,831,578 | | 0.90 | % |
| Net Assets | $ | 652,111,109 | | 100.00 | % |
* Additional Information, including current Prospectus and Annual Reports, is available at
http://www.direxion.com/regulatory-documents.
** Additional Information, including current Prospectus and Annual Reports, is available at
www.vanguard.com/prospectus and http://personal.vanguard.com/us/literature/reports/ETFs.
+ The rate shown represents the 7-day yield at June 30, 2023.
# Affiliated investment due to Fund holding more than 5% of outstanding shares. See Note 10. |
The accompanying notes are an integral part of these
financial statements. |
2023 Annual Report 11
| Conquer Risk Managed Volatility Fund | |
| |
| �� | | Schedule of Investments |
| | | | | June 30, 2023 |
| Shares | Fair Value | | % of Net Assets |
| |
| MUTUAL FUNDS | | | | | |
| Fixed Income | | | | | |
| 1,739,284 Fidelity® Capital & Income Fund | $ | 16,192,731 | | | |
| 1,168,731 TCW Emerging Markets Income Fund I Shares | | 7,152,635 | | | |
| | | 23,345,366 | | | |
| |
| High Yield Bond | | | | | |
| 461,947 American High-Income Municipal Bond Fund Class F-3 | | 6,776,763 | | | |
| 757,740 Federated Hermes Institutional High Yield Bond Fund Institutional Shares | | 6,418,061 | | | |
| 770,792 Franklin High Yield Tax-Free Income Fund Advisor Class | | 6,744,427 | | | |
| 1,271,083 MainStay MacKay High Yield Corporate Bond Fund Class I | | 6,368,124 | | | |
| 1,001,041 Nuveen High Yield Municipal Bond Fund Class I | | 14,935,532 | | | |
| 980,169 Vanguard High-Yield Corporate Fund Admiral Shares | | 5,116,483 | | | |
| | | 46,359,390 | | | |
| |
| Total for Mutual Funds (Cost - $69,745,979) | | 69,704,756 | | 93.30 | % |
| MONEY MARKET FUNDS | | | | | |
| 4,497,104 First American Treasury Obligations Fund - Class X 5.03% + | | 4,497,104 | | 6.02 | % |
| Total for Money Market Funds (Cost $4,497,104) | | | | | |
| |
| Total Investments (Cost - $74,243,083) | | 74,201,860 | | 99.32 | % |
| |
| Other Assets in Excess of Other Liabilities | | 507,327 | | 0.68 | % |
| |
| Net Assets | $ | 74,709,187 | | 100.00 | % |
+ The rate shown represents the 7-day yield at June 30, 2023.
The accompanying notes are an integral part of these
financial statements. |
2023 Annual Report 12
| Conquer Risk Tactical Opportunities Fund | |
| |
| | | Schedule of Investments |
| | | | | June 30, 2023 |
| Shares | Fair Value | | % of Net Assets |
| |
| EXCHANGE TRADED FUNDS | | | | | |
| Equity | | | | | |
| 150,373 ARK Innovation ETF * | $ | 6,637,464 | | | |
| 40,549 The Consumer Discretionary Select Sector SPDR Fund | | 6,885,626 | | | |
| 287,889 Direxion Daily Technology Bull 3X Shares | | 15,551,764 | | | |
| 39,323 First Trust Dow Jones Internet Index Fund * | | 6,409,256 | | | |
| 99,388 Invesco QQQ TrustSM, Series 1 ETF ** | | 36,715,915 | | | |
| 19,908 iShares Expanded Tech-Software Sector ETF | | 6,886,376 | | | |
| 61,403 iShares MSCI EAFE Growth ETF | | 5,858,460 | | | |
| 78,617 iShares U.S. Home Construction ETF | | 6,717,036 | | | |
| 47,222 VanEck Semiconductor ETF | | 7,189,550 | | | |
| Total for Exchange Traded Funds (Cost - $92,480,381) | | 98,851,447 | | 95.50 | % |
| MONEY MARKET FUNDS | | | | | |
| 3,869,232 First American Treasury Obligations Fund - Class X 5.03% + | | 3,869,232 | | 3.74 | % |
| Total for Money Market Funds (Cost $3,869,232) | | | | | |
| |
| Total Investments (Cost - $96,349,613) | | 102,720,679 | | 99.24 | % |
| Other Assets in Excess of Other Liabilities | | 782,640 | | 0.76 | % |
| Net Assets | $ | 103,503,319 | | 100.00 | % |
* Non income-producing security.
** Additional Information, including current Prospectus and Annual Reports, is available at
http://www.sec.gov.
+ The rate shown represents the 7-day yield at June 30, 2023. |
The accompanying notes are an integral part of these
financial statements. |
2023 Annual Report 13
| Conquer Risk Tactical Rotation Fund | |
| |
| | | Schedule of Investments |
| | | | | June 30, 2023 |
| Shares | Fair Value | | % of Net Assets |
| |
| EXCHANGE TRADED FUNDS | | | | | |
| Equity | | | | | |
| 131,590 The Communication Services Select Sector | $ | 8,563,877 | | | |
| 23,149 Invesco QQQ TrustSM, Series 1 ETF | | 8,551,703 | | | |
| 309,543 Invesco S&P 500® Equal Weight ETF * | | 46,320,014 | | | |
| 134,444 iShares MSCI Japan ETF | | 8,322,084 | | | |
| 63,618 iShares MSCI USA Quality Factor ETF | | 8,580,160 | | | |
| 234,800 VanEck® Gold Miners ETF | | 7,069,828 | | | |
| Total for Exchange Traded Funds (Cost - $85,855,494) | | 87,407,666 | | 96.00 | % |
| MONEY MARKET FUNDS | | | | | |
| 3,389,842 First American Treasury Obligations Fund - Class X 5.03% + | | 3,389,842 | | 3.72 | % |
| Total for Money Market Funds (Cost $3,389,842) | | | | | |
| |
| Total Investments (Cost - $89,245,336) | | 90,797,508 | | 99.72 | % |
| Other Assets in Excess of Liabilities | | 257,204 | | 0.28 | % |
| Net Assets | $ | 91,054,712 | | 100.00 | % |
| | * Additional Information, including current Prospectus and Annual Reports, is available at
www.invesco.com/etfprospectus.
+ The rate shown represents the 7-day yield at June 30, 2023. |
The accompanying notes are an integral part of these
financial statements. |
2023 Annual Report 14
Conquer Risk Funds |
| | |
| Statements of Assets and Liabilities | | Defensive | | | Managed | | |
| June 30, 2023 | | Bull Fund | | | Volatility Fund | | |
| | |
| Assets: | | | | | | | |
| Unaffiliated Investment Securities at Fair Value* | $ | 431,201,237 | | $ | 74,201,860 | | |
| Affiliated Investment Securities at Fair Value** | | 215,078,294 | | | - | | |
| Receivable for Fund Shares Sold | | 3,199,924 | | | 302,305 | | |
| Dividends Receivable | | 3,439,549 | | | 315,502 | | |
| Total Assets | | 652,919,004 | | | 74,819,667 | | |
| Liabilities: | | | | | | | |
| Payable for Fund Shares Redeemed | | 269,337 | | | 20,493 | | |
| Management Fees Payable | | 475,455 | | | 72,261 | | |
| Service Fees Payable | | 63,103 | | | 17,726 | | |
| Total Liabilities | | 807,895 | | | 110,480 | | |
| Net Assets | $ | 652,111,109 | | $ | 74,709,187 | | |
| Net Assets Consist of: | | | | | | | |
| Paid In Capital | $ | 571,352,527 | | $ | 75,917,572 | | |
| Total Distributable Earnings/(Accumulated Deficit) | | 80,758,582 | | | (1,208,385 | ) | |
| Net Assets | $ | 652,111,109 | | $ | 74,709,187 | | |
| | |
| Net Asset Value, Offering Price and Redemption Price per Share | $ | 14.44 | | $ | 10.10 | | |
| | |
| * Unaffiliated Investments at Identified Cost | $ | 426,408,011 | | $ | 74,243,083 | | |
| | |
| ** Affiliated Investments at Identified Cost | $ | 205,756,880 | | $ | - | | |
| | |
| Shares Outstanding (Unlimited number of shares | | 45,163,134 | | | 7,393,924 | | |
| authorized without par value) | | | | | | | |
| | |
| Statements of Operations | | | | | | | |
| For the fiscal year ended June 30, 2023 | | | | | | | |
| | |
| Investment Income: | | | | | | | |
| Dividends from Unaffiliated Investments | $ | 12,404,546 | | $ | 2,366,089 | | |
| Dividends from Affiliated Investments | | 289,584 | | | - | | |
| Total Investment Income | | 12,694,130 | | | 2,366,089 | | |
| Expenses: | | | | | | | |
| Management Fees | | 3,672,989 | | | 620,953 | | |
| Service Fees | | 533,112 | | | 174,354 | | |
| Interest Expense | | - | | | 26,518 | | |
| Total Expenses | | 4,206,101 | | | 821,825 | | |
| Less: Contractual Expenses Waived | | - | | | (5,243 | ) | |
| Net Expenses | | 4,206,101 | | | 816,582 | | |
| | |
| Net Investment Income | | 8,488,029 | | | 1,549,507 | | |
| | |
| Realized and Unrealized Gain (Loss) on Investments: | | | | | | | |
| Capital Gain Distributions from Unaffiliated Investment Companies | | - | | | 145,856 | | |
| Net Realized Gain on Unaffiliated Investments | | 71,934,772 | | | 1,553,959 | | |
| Net Realized Gain on Affiliated Investments | | 35,966,806 | | | - | | |
| Net Change in Net Unrealized Appreciation (Depreciation) on Unaffliated Investments | | 4,793,226 | | | (552,193 | ) | |
| Net Change in Net Unrealized Appreciation (Depreciation) on Affliated Investments | | 9,321,414 | | | - | | |
| Net Realized and Unrealized Gain on Investments | | 122,016,218 | | | 1,147,622 | | |
| | |
| Net Increase in Net Assets from Operations | $ | 130,504,247 | | $ | 2,697,129 | | |
The accompanying notes are an integral part of these
financial statements. |
2023 Annual Report 15
| Conquer Risk Funds |
| | |
| Statements of Assets and Liabilities | | Tactical | | | | Tactical | |
| June 30, 2023 | | Opportunities | | | | Rotation | |
| | | Fund | | | | Fund | |
| | |
| Assets: | | | | | | | |
| Investment Securities at Fair Value* | $ | 102,720,679 | | | $ | 90,797,508 | |
| Receivable for Fund Shares Sold | | 782,303 | | | | 222,450 | |
| Dividends Receivable | | 154,724 | | | | 154,713 | |
| Total Assets | | 103,657,706 | | | | 91,174,671 | |
| Liabilities: | | | | | | | |
| Payable for Fund Shares Redeemed | | 35,692 | | | | 11,470 | |
| Management Fees Payable | | 97,009 | | | | 88,211 | |
| Service Fees Payable | | 21,686 | | | | 20,278 | |
| Total Liabilities | | 154,387 | | | | 119,959 | |
| Net Assets | $ | 103,503,319 | | | $ | 91,054,712 | |
| Net Assets Consist of: | | | | | | | |
| Paid In Capital | $ | 100,907,099 | | | $ | 90,543,784 | |
| Total Distributable Earnings | | 2,596,220 | | | | 510,928 | |
| Net Assets | $ | 103,503,319 | | | $ | 91,054,712 | |
| | |
| Net Asset Value, Offering Price and Redemption Price per Share | $ | 10.26 | | | $ | 10.51 | |
| | |
| * Investments at Identified Cost | $ | 96,349,613 | | | $ | 89,245,336 | |
| | |
| Shares Outstanding (Unlimited number of shares | | 10,083,872 | | | | 8,660,569 | |
| authorized without par value) | | | | | | | |
| | |
| Statements of Operations | | | | | | | |
| For the fiscal year ended June 30, 2023 | | | | | | | |
| | |
| Investment Income: | | | | | | | |
| Dividends | $ | 1,219,102 | | | $ | 1,774,950 | |
| Total Investment Income | | 1,219,102 | | | | 1,774,950 | |
| Expenses: | | | | | | | |
| Management Fees | | 670,113 | | | | 894,732 | |
| Service Fees | | 182,220 | | | | 218,159 | |
| Total Expenses | | 852,333 | | | | 1,112,891 | |
| Less: Contractual Expenses Waived | | (114 | ) | | | - | |
| Net Expenses | | 852,219 | | | | 1,112,891 | |
| | |
| Net Investment Income | | 366,883 | | | | 662,059 | |
| | |
| Realized and Unrealized Gain on Investments: | | | | | | | |
| Net Realized Gain on Investments | | 6,524,087 | | | | 3,651,655 | |
| Net Change in Net Unrealized Appreciation on Investments | | 6,934,497 | | | | 1,842,924 | |
| Net Realized and Unrealized Gain on Investments | | 13,458,584 | | | | 5,494,579 | |
| | |
| Net Increase in Net Assets from Operations | $ | 13,825,467 | | | $ | 6,156,638 | |
The accompanying notes are an integral part of these
financial statements. |
2023 Annual Report 16
| Conquer Risk Funds |
| | |
| Statements of Changes in Net Assets | | Defensive Bull Fund | | | | Managed Volatility Fund | | |
| | |
| | | 7/1/2022 | | | | 7/1/2021 | | | | 7/1/2022 | | | | 7/1/2021 | | |
| | | to | | | | to | | | | to | | | | to | | |
| | | 6/30/2023 | | | | 6/30/2022 | | | | 6/30/2023 | | | | 6/30/2022 | | |
| From Operations: | | | | | | | | | | | | | | | | |
| Net Investment Income (Loss) | $ | 8,488,029 | | | $ | (1,539,107 | ) | | $ | 1,549,507 | | | $ | 259,845 | | |
| Capital Gain Distributions from Investment Companies | | - | | | | - | | | | 145,856 | | | | 563,817 | | |
| Net Realized Gain (Loss) on Investments | | 107,901,578 | | | | (34,548,986 | ) | | | 1,553,959 | | | | (4,475,069 | ) | |
| Net Change in Unrealized Appreciation (Depreciation) | | | | | | | | | | | | | | | | |
| on Investments | | 14,114,640 | | | | (516,028 | ) | | | (552,193 | ) | | | 29,747 | | |
| Net Increase (Decrease) in Net Assets from Operations | | 130,504,247 | | | | (36,604,121 | ) | | | 2,697,129 | | | | (3,621,660 | ) | |
| | |
| From Distributions to Shareholders: | | (549,021 | ) | | | (60,468,943 | ) | | | (399,696 | ) | | | (1,120,510 | ) | |
| | |
| From Capital Share Transactions: | | | | | | | | | | | | | | | | |
| Proceeds From Sale of Shares | | 375,953,521 | | | | 134,678,524 | | | | 94,101,178 | | | | 31,798,175 | | |
| Shares Issued on Reinvestment of Dividends | | 547,864 | | | | 60,336,125 | | | | 355,004 | | | | 1,088,060 | | |
| Cost of Shares Redeemed | | (89,621,709 | ) | | | (96,524,792 | ) | | | (64,739,257 | ) | | | (16,441,291 | ) | |
| Net Increase from Shareholder Activity | | 286,879,676 | | | | 98,489,857 | | | | 29,716,925 | | | | 16,444,944 | | |
| | |
| Net Increase in Net Assets | | 416,834,902 | | | | 1,416,793 | | | | 32,014,358 | | | | 11,702,774 | | |
| | |
| Net Assets at Beginning of Year | | 235,276,207 | | | | 233,859,414 | | | | 42,694,829 | | | | 30,992,055 | | |
| | |
| Net Assets at End of Year | $ | 652,111,109 | | | $ | 235,276,207 | | | $ | 74,709,187 | | | $ | 42,694,829 | | |
| | |
| | |
| Share Transactions: | | | | | | | | | | | | | | | | |
| Issued | | 29,582,999 | | | | 10,156,826 | | | | 9,276,891 | | | | 3,088,939 | | |
| Reinvested | | 47,932 | | | | 4,800,010 | | | | 34,234 | | | | 107,729 | | |
| Redeemed | | (7,356,254 | ) | | | (8,025,315 | ) | | | (6,421,938 | ) | | | (1,659,561 | ) | |
| Net Increase in Shares | | 22,274,677 | | | | 6,931,521 | | | | 2,889,187 | | | | 1,537,107 | | |
| Shares Outstanding Beginning of Year | | 22,888,457 | | | | 15,956,936 | | | | 4,504,737 | | | | 2,967,630 | | |
| Shares Outstanding End of Year | | 45,163,134 | | | | 22,888,457 | | | | 7,393,924 | | | | 4,504,737 | | |
The accompanying notes are an integral part of these
financial statements. |
2023 Annual Report 17
| Conquer Risk Funds |
| | |
| Statements of Changes in Net Assets | | Tactical Opportunities Fund | | | | Tactical Rotation Fund | | |
| | |
| | | 7/1/2022 | | | | 7/1/2021 | | | | 7/1/2022 | | | | 7/1/2021 | | |
| | | to | | | | to | | | | to | | | | to | | |
| | | 6/30/2023 | | | | 6/30/2022 | | | | 6/30/2023 | | | | 6/30/2022 | | |
| From Operations: | | | | | | | | | | | | | | | | |
| Net Investment Income (Loss) | $ | 366,883 | | | $ | (418,251 | ) | | $ | 662,059 | | | $ | (439,704 | ) | |
| Net Realized Gain (Loss) on Investments | | 6,524,087 | | | | (10,395,683 | ) | | | 3,651,655 | | | | (3,717,140 | ) | |
| Net Change in Unrealized Appreciation (Depreciation) | | | | | | | | | | | | | | | | |
| on Investments | | 6,934,497 | | | | (569,794 | ) | | | 1,842,924 | | | | (291,421 | ) | |
| Net Increase (Decrease) in Net Assets from Operations | | 13,825,467 | | | | (11,383,728 | ) | | | 6,156,638 | | | | (4,448,265 | ) | |
| | |
| From Distributions to Shareholders: | | - | | | | (5,979,395 | ) | | | (81,288 | ) | | | (8,555,271 | ) | |
| | |
| From Capital Share Transactions: | | | | | | | | | | | | | | | | |
| Proceeds From Sale of Shares | | 67,252,220 | | | | 15,909,273 | | | | 77,204,565 | | | | 36,704,021 | | |
| Shares Issued on Reinvestment of Dividends | | - | | | | 5,972,303 | | | | 81,026 | | | | 8,528,067 | | |
| Cost of Shares Redeemed | | (13,838,576 | ) | | | (11,778,768 | ) | | | (57,254,306 | ) | | | (22,777,746 | ) | |
| Net Increase from Shareholder Activity | | 53,413,644 | | | | 10,102,808 | | | | 20,031,285 | | | | 22,454,342 | | |
| Net Increase (Decrease) in Net Assets | | 67,239,111 | | | | (7,260,315 | ) | | | 26,106,635 | | | | 9,450,806 | | |
| | |
| Net Assets at Beginning of Year | | 36,264,208 | | | | 43,524,523 | | | | 64,948,077 | | | | 55,497,271 | | |
| | |
| Net Assets at End of Year | $ | 103,503,319 | | | $ | 36,264,208 | | | $ | 91,054,712 | | | $ | 64,948,077 | | |
| | |
| | |
| Share Transactions: | | | | | | | | | | | | | | | | |
| Issued | | 7,115,933 | | | | 1,550,397 | | | | 7,558,636 | | | | 3,505,021 | | |
| Reinvested | | - | | | | 599,629 | | | | 7,889 | | | | 822,378 | | |
| Redeemed | | (1,503,608 | ) | | | (1,268,843 | ) | | | (5,589,158 | ) | | | (2,110,744 | ) | |
| Net Increase in Shares | | 5,612,325 | | | | 881,183 | | | | 1,977,367 | | | | 2,216,655 | | |
| Shares Outstanding Beginning of Year | | 4,471,547 | | | | 3,590,364 | | | | 6,683,201 | | | | 4,466,546 | | |
| Shares Outstanding End of Year | | 10,083,872 | | | | 4,471,547 | | | | 8,660,568 | | | | 6,683,201 | | |
The accompanying notes are an integral part of these
financial statements. |
2023 Annual Report 18
| Conquer Risk Defensive Bull Fund |
| | |
| Financial Highlights | | | | | | | | | | | | |
| | |
| Selected data for a share outstanding throughout the year: | | 7/1/2022 | | | | 7/1/2021 | | | | 7/1/2020* | | |
| | | to | | | | to | | | | to | | |
| | | 6/30/2023 | | | | 6/30/2022 | | | | 6/30/2021 | | |
| Net Asset Value - Beginning of Year | $ | 10.28 | | | $ | 14.66 | | | $ | 10.00 | | |
| Net Investment Income (Loss) (a) (e) | | 0.29 | | | | (0.08 | ) | | | (0.05 | ) | |
| Net Gain (Loss) on Investments (Realized and Unrealized) (b) | | 3.89 | | | | (1.16 | ) | | | 4.91 | | |
| Total from Investment Operations | | 4.18 | | | | (1.24 | ) | | | 4.86 | | |
| Distributions (From Net Investment Income) | | - | | | | - | | | | - | | |
| Distributions (From Capital Gains) | | (0.02 | ) | | | (3.14 | ) | | | (0.20 | ) | |
| Total Distributions | | (0.02 | ) | | | (3.14 | ) | | | (0.20 | ) | |
| Net Asset Value - End of Year | $ | 14.44 | | | $ | 10.28 | | | $ | 14.66 | | |
| Total Return (c) | | 40.72 | % | | | (12.38 | )% | | | 49.04 | % | |
| | |
| Ratios/Supplemental Data | | | | | | | | | | | | |
| Net Assets - End of Year (Thousands) | $ | 652,111 | | | $ | 235,276 | | | $ | 233,859 | | |
| | |
| Before Waiver | | | | | | | | | | | | |
| Ratio of Expenses to Average Net Assets (d) | | 1.17 | % | | | 1.29 | % | | | 1.55 | % | |
| Ratio of Net Investment Income (Loss) to Average Net Assets (d) (e) | | 2.37 | % | | | (0.64 | )% | | | (0.41 | )% | |
| After Waiver | | | | | | | | | | | | |
| Ratio of Expenses to Average Net Assets (d) | | 1.17 | % | | | 1.24 | % | (f) | | 1.53 | % | (f) |
| Ratio of Net Investment Income (Loss) to Average Net Assets (d) (e) | | 2.37 | % | | | (0.59 | )% | | | (0.39 | )% | |
| | |
| Portfolio Turnover Rate | | 1,628.24 | % | | | 1,558.57 | % | | | 1,657.50 | % | |
* Commencement of Operations.
(a) Per share amounts were calculated using the average shares method.
(b) Realized and unrealized gains and losses per share in this caption are balancing amounts necessary to
reconcile the change in net asset value for the period, and may not reconcile with the aggregate gains and
losses in the Statement of Operations due to share transactions for the period.
(c) Total return represents the rate that the investor would have earned or lost on an investment in the Fund
assuming reinvestment of dividends and distributions, if any.
(d) These ratios exclude the impact of expenses of the underlying investment security holdings listed in the
Schedule of Investments.
(e) Recognition of the net investment income/(loss) by the Fund is affected by the timing of the declaration of
dividends by the underlying investment security holdings listed on the Schedule of Investments.
(f) All waivers incurred during the noted period were voluntary. If the voluntary waivers had not occurred,
the expense ratios would have been higher. See Note 4 for additional information on the application of waivers
during the period. |
The accompanying notes are an integral part of these
financial statements. |
2023 Annual Report 19
| Conquer Risk Managed Volatility Fund |
| | |
| Financial Highlights | | | | | | | | | | | | |
| | |
| Selected data for a share outstanding throughout the year: | | 7/1/2022 | | | | 7/1/2021 | | | | 7/1/2020* | | |
| | | to | | | | to | | | | to | | |
| | | 6/30/2023 | | | | 6/30/2022 | | | | 6/30/2021 | | |
| Net Asset Value - Beginning of Year | $ | 9.48 | | | $ | 10.44 | | | $ | 10.00 | | |
| Net Investment Income (a) (e) | | 0.32 | | | | 0.06 | | | | 0.15 | | |
| Net Gain (Loss) on Investments (Realized and Unrealized) (b) | | 0.36 | | | | (0.79 | ) | | | 0.39 | | |
| Total from Investment Operations | | 0.68 | | | | (0.73 | ) | | | 0.54 | | |
| Distributions (From Net Investment Income) | | (0.06 | ) | | | (0.10 | ) | | | (0.10 | ) | |
| Distributions (From Capital Gains) | | - | | | | (0.13 | ) | | | - | | |
| Total Distributions | | (0.06 | ) | | | (0.23 | ) | | | (0.10 | ) | |
| | |
| Net Asset Value - End of Year | $ | 10.10 | | | $ | 9.48 | | | $ | 10.44 | | |
| Total Return (c) | | 7.16 | % | | | (7.15 | )% | | | 5.39 | % | |
| Ratios/Supplemental Data | | | | | | | | | | | | |
| Net Assets - End of Year (Thousands) | $ | 74,709 | | | $ | 42,695 | | | $ | 30,992 | | |
| Before Waiver | | | | | | | | | | | | |
| Ratio of Expenses to Average Net Assets (d) | | 1.65 | % | (g) | | 1.66 | % | | | 1.88 | % | |
| Ratio of Net Investment Income to Average Net Assets (d) (e) | | 3.11 | % | | | 0.52 | % | | | 1.43 | % | |
| After Waiver | | | | | | | | | | | | |
| Ratio of Expenses to Average Net Assets (d) | | 1.64 | % | (g) | | 1.62 | % | (f) | | 1.87 | % | (f) |
| Ratio of Net Investment Income to Average Net Assets (d) (e) | | 3.12 | % | | | 0.56 | % | | | 1.44 | % | |
| Portfolio Turnover Rate | | 761.70 | % | | | 620.91 | % | | | 519.72 | % | |
* Commencement of Operations.
(a) Per share amounts were calculated using the average shares method.
(b) Realized and unrealized gains and losses per share in this caption are balancing amounts necessary to
reconcile the change in net asset value for the period, and may not reconcile with the aggregate gains and
losses in the Statement of Operations due to share transactions for the period.
(c) Total return represents the rate that the investor would have earned or lost on an investment in the Fund
assuming reinvestment of dividends and distributions, if any.
(d) These ratios exclude the impact of expenses of the underlying investment security holdings listed in the
Schedule of Investments.
(e) Recognition of the net investment income/(loss) by the Fund is affected by the timing of the declaration of
dividends by the underlying investment security holdings listed on the Schedule of Investments.
(f) All waivers incurred during the noted period were voluntary. If the voluntary waivers had not occurred,
the expense ratios would have been higher. See Note 4 for additional information on the application of waivers
during the period.
(g) Excluding interest expense, the before waiver and after waiver ratios of expenses to average net assets
would have been 1.60% and 1.59%, respectively. |
The accompanying notes are an integral part of these
financial statements. |
2023 Annual Report 20
| Conquer Risk Tactical Opportunities Fund |
| | |
| Financial Highlights | | | | | | | | | | | | |
| | |
| Selected data for a share outstanding throughout the year: | | 7/1/2022 | | | | 7/1/2021 | | | | 7/1/2020* | | |
| | | to | | | | to | | | | to | | |
| | | 6/30/2023 | | | | 6/30/2022 | | | | 6/30/2021 | | |
| Net Asset Value - Beginning of Year | $ | 8.11 | | | $ | 12.12 | | | $ | 10.00 | | |
| Net Investment Income (Loss) (a) (e) | | 0.06 | | | | (0.10 | ) | | | (0.11 | ) | |
| Net Gain (Loss) on Investments (Realized and Unrealized) (b) | | 2.09 | | | | (2.41 | ) | | | 2.58 | | |
| Total from Investment Operations | | 2.15 | | | | (2.51 | ) | | | 2.47 | | |
| Distributions (From Net Investment Income) | | - | | | | - | | | | - | | |
| Distributions (From Capital Gains) | | - | | | | (1.50 | ) | | | (0.35 | ) | |
| Total Distributions | | - | | | | (1.50 | ) | | | (0.35 | ) | |
| Net Asset Value - End of Year | $ | 10.26 | | | $ | 8.11 | | | $ | 12.12 | | |
| Total Return (c) | | 26.51 | % | | | (23.00 | )% | | | 24.81 | % | |
| | |
| Ratios/Supplemental Data | | | | | | | | | | | | |
| Net Assets - End of Year (Thousands) | $ | 103,503 | | | $ | 36,264 | | | $ | 43,525 | | |
| Before Waiver | | | | | | | | | | | | |
| Ratio of Expenses to Average Net Assets (d) | | 1.59 | % | | | 1.68 | % | | | 1.81 | % | |
| Ratio of Net Investment Income (Loss) to Average Net Assets (d) (e) | | 0.68 | % | | | (1.05 | )% | | | (0.98 | )% | |
| After Waiver | | | | | | | | | | | | |
| Ratio of Expenses to Average Net Assets (d) | | 1.59 | % | | | 1.63 | % | (f) | | 1.80 | % | (f) |
| Ratio of Net Investment Income (Loss) to Average Net Assets (d) (e) | | 0.68 | % | | | (1.00 | )% | | | (0.97 | )% | |
| Portfolio Turnover Rate | | 1,208.66 | % | | | 1,483.56 | % | | | 1,291.12 | % | |
* Commencement of Operations.
(a) Per share amounts were calculated using the average shares method.
(b) Realized and unrealized gains and losses per share in this caption are balancing amounts necessary to
reconcile the change in net asset value for the period, and may not reconcile with the aggregate gains and
losses in the Statement of Operations due to share transactions for the period.
(c) Total return represents the rate that the investor would have earned or lost on an investment in the Fund
assuming reinvestment of dividends and distributions, if any.
(d) These ratios exclude the impact of expenses of the underlying investment security holdings listed in the
Schedule of Investments.
(e) Recognition of the net investment income/(loss) by the Fund is affected by the timing of the declaration of
dividends by the underlying investment security holdings listed on the Schedule of Investments.
(f) Voluntary expense waivers reduced the gross expense ratio by 0.01% and 0.05%, respectfully, during the
fiscal years ended June 30, 2021 and June 30, 2022, respectfully. If the voluntary waivers had not occurred,
the expense ratios would have been higher. See Note 4 for additional information on the application of waivers
during the period. |
The accompanying notes are an integral part of these
financial statements. |
2023 Annual Report 21
| Conquer Risk Tactical Rotation Fund |
| | |
| Financial Highlights | | | | | | | | | | | | |
| | |
| Selected data for a share outstanding throughout the year: | | 7/1/2022 | | | | 7/1/2021 | | | | 7/1/2020* | | |
| | | to | | | | to | | | | to | | |
| | | 6/30/2023 | | | | 6/30/2022 | | | | 6/30/2021 | | |
| Net Asset Value - Beginning of Year | $ | 9.72 | | | $ | 12.43 | | | $ | 10.00 | | |
| Net Investment Income (Loss) (a) (e) | | 0.09 | | | | (0.08 | ) | | | (0.02 | ) | |
| Net Gain (Loss) on Investments (Realized and Unrealized) (b) | | 0.71 | | | | (0.63 | ) | | | 2.77 | | |
| Total from Investment Operations | | 0.80 | | | | (0.71 | ) | | | 2.75 | | |
| Distributions (From Net Investment Income) | | - | | | | - | | | | (0.02 | ) | |
| Distributions (From Capital Gains) | | (0.01 | ) | | | (2.00 | ) | | | (0.30 | ) | |
| Total Distributions | | (0.01 | ) | | | (2.00 | ) | | | (0.32 | ) | |
| Net Asset Value - End of Year | $ | 10.51 | | | $ | 9.72 | | | $ | 12.43 | | |
| Total Return (c) | | 8.27 | % | | | (6.74 | )% | | | 27.85 | % | |
| | |
| Ratios/Supplemental Data | | | | | | | | | | | | |
| Net Assets - End of Year (Thousands) | $ | 91,055 | | | $ | 64,948 | | | $ | 55,497 | | |
| Before Waiver | | | | | | | | | | | | |
| Ratio of Expenses to Average Net Assets (d) | | 1.55 | % | | | 1.62 | % | | | 1.80 | % | |
| Ratio of Net Investment Income (Loss) to Average Net Assets (d) (e) | | 0.92 | % | | | (0.79 | )% | | | (0.18 | )% | |
| After Waiver | | | | | | | | | | | | |
| Ratio of Expenses to Average Net Assets (d) | | 1.55 | % | | | 1.58 | % | (f) | | 1.79 | % | (f) |
| Ratio of Net Investment Income (Loss) to Average Net Assets (d) (e) | | 0.92 | % | | | (0.75 | )% | | | (0.17 | )% | |
| Portfolio Turnover Rate | | 1,420.24 | % | | | 1,544.72 | % | | | 1,028.67 | % | |
* Commencement of Operations.
(a) Per share amounts were calculated using the average shares method.
(b) Realized and unrealized gains and losses per share in this caption are balancing amounts necessary to
reconcile the change in net asset value for the period, and may not reconcile with the aggregate gains and
losses in the Statement of Operations due to share transactions for the period.
(c) Total return represents the rate that the investor would have earned or lost on an investment in the Fund
assuming reinvestment of dividends and distributions, if any.
(d) These ratios exclude the impact of expenses of the underlying investment security holdings listed in the
Schedule of Investments.
(e) Recognition of the net investment income/(loss) by the Fund is affected by the timing of the declaration of
dividends by the underlying investment security holdings listed on the Schedule of Investments.
(f) All waivers incurred during the noted period were voluntary. If the voluntary waivers had not occurred, the
expense ratios would have been higher. See Note 4 for additional information on the application of waivers
during the period. |
The accompanying notes are an integral part of these
financial statements. |
2023 Annual Report 22
NOTES TO FINANCIAL STATEMENTS
CONQUER RISK FUNDS
JUNE 30, 2023
1.) ORGANIZATION
The Conquer Risk Funds (the “Funds”) are each a series of PFS Funds (the “Trust”). The Trust is an open-end management investment company that was organized in Massachusetts by an Agreement and Declaration of Trust dated January 13, 2000, as amended on January 20, 2011. The Trust is registered as an open-end investment company under the Investment Company Act of 1940, as amended (the “1940 Act”). The Trust may offer an unlimited number of shares of beneficial interest in a number of separate series, each series representing a distinct fund with its own investment objectives and policies. Conquer Risk Defensive Bull Fund (“Defensive Bull Fund”), Conquer Risk Managed Volatility Fund (“Managed Volatility Fund”), Conquer Risk Tactical Opportunities Fund (“Tactical Opportunities Fund”) and Conquer Risk Tactical Rotation Fund (“Tactical Rotation Fund”) (each a “Fund” and collectively the “Funds”) were each organized as a non-diversified series of the Trust, on June 9, 2020 and commenced operations on July 1, 2020. As of June 30, 2023, there were thirteen series authorized by the Trust. The investment advisor to the Funds is Potomac Fund Management, Inc. (the “Advisor”). Significant accounting policies of the Funds are presented below.
2.) SIGNIFICANT ACCOUNTING POLICIES
The Funds are investment companies and accordingly follow the investment company accounting and reporting guidance of the Financial Accounting Standards Board (“FASB”) Accounting Standards Codification Topic 946 Financial Services - Investment Companies. The financial statements are prepared in conformity with accounting principles generally accepted in the United States of America (“GAAP”). The Funds follow the significant accounting policies described in this section.
SECURITY VALUATION
All investments in securities are valued as described in Note 3. The Trust’s Board of Trustees (“Board”) has designated the Advisor as “Valuation Designee” pursuant to Rule 2a-5 under the 1940 Act.
SHARE VALUATION
Each Fund’s net asset value (the “NAV”) is generally calculated as of the close of trading on the New York Stock Exchange (the “Exchange”) (normally 4:00 p.m. Eastern time) every day the Exchange is open. The NAV for each Fund is calculated by taking the total value of the Fund’s assets, subtracting its liabilities, and then dividing by the total number of shares outstanding, rounded to the nearest cent. The offering price and redemption price per share is equal to the net asset value per share.
FEDERAL INCOME TAXES
The Funds’ policy is to continue to comply with the requirements of the Internal Revenue Code that are applicable to regulated investment companies and to distribute all of their taxable income to shareholders. Therefore, no federal income tax provision is required. It is the Funds’ policy to distribute annually, prior to the end of the calendar year, dividends sufficient to satisfy excise tax requirements of the Internal Revenue Code. This Internal Revenue Code requirement may cause an excess of distributions over the book year-end accumulated income. In addition, it is the Funds’ policy to distribute annually, after the end of the fiscal year, any remaining net investment income and net realized capital gains.
The Funds recognize the tax benefits of certain tax positions only where the position is “more likely than not” to be sustained assuming examination by tax authorities. Management has analyzed the Funds’ tax positions, and has concluded that no liability for unrecognized tax benefits should be recorded related to uncertain tax positions taken on returns filed for open tax years. The Funds identify their major tax jurisdictions as U.S. Federal and State tax authorities; the Funds are not aware of any tax positions for which it is reasonably possible that the total amounts of unrecognized tax benefits will change materially in the next twelve months. The Funds recognize interest and penalties, if any, related to unrecognized tax benefits as income tax expense in the Statements of Operations. During the fiscal year ended June 30, 2023, the Funds did not incur any interest or penalties.
DISTRIBUTIONS TO SHAREHOLDERS
Distributions to shareholders, which are determined in accordance with income tax regulations, are recorded on the ex-dividend date. The Funds may utilize earnings and profits distributed to shareholders on redemptions of shares as part of the dividends paid deduction. The treatment for financial reporting purposes of distributions made to shareholders during the year from net investment income or net realized capital gains may differ from their ultimate treatment for federal income tax purposes. These differences are caused primarily by differences in the timing of recognition of certain components of income, expense or realized capital gain for federal income tax purposes. Where such differences are permanent in nature, they are reclassified in the components of the net assets based on their ultimate characterization for federal income tax pur-
2023 Annual Report 23
Notes to Financial Statements - continued
poses. Any such reclassification will have no effect on net assets, results of operations or net asset values per share of any Fund.
USE OF ESTIMATES
The financial statements are prepared in accordance with GAAP, which requires management to make estimates and assumptions that affect the reported amounts of assets and liabilities and disclosure of contingent assets and liabilities at the date of the financial statements and the reported amounts of increases and decreases in net assets from operations during the reporting period. Actual results could differ from those estimates.
OTHER
The Funds record security transactions based on a trade date. Dividend income is recognized on the ex-dividend date, and interest income, if any, is recognized on an accrual basis. The Funds use the specific identification method in computing gain or loss on the sale of investment securities. Long-term capital gain distributions are recorded as capital gain distributions from investment companies, and short-term capital gain distributions are recorded as dividend income. Additionally, the Funds may hold investments which are structured as master limited partnerships (“MLPs”) for tax purposes. It is common for distributions from MLPs to exceed taxable earnings and profits resulting in the excess portion of such dividends to be designated as return of capital. Annually, income or loss from MLPs is reclassified upon receipt of the MLPs K-1. For financial reporting purposes, management does not estimate the tax character of MLP distributions for which actual information has not been reported.
EXPENSES
Expenses incurred by the Trust that do not relate to a specific fund of the Trust are allocated to the individual Fund based on each Fund’s relative net assets or by another appropriate method.
3.) SECURITIES VALUATIONS
The Funds utilize various methods to measure the fair value of their investments on a recurring basis. GAAP establishes a hierarchy that prioritizes inputs to valuation methods. The three levels of inputs are:
Level 1 - Unadjusted quoted prices in active markets for identical assets or liabilities that the Funds have the ability to access.
Level 2 - Observable inputs other than quoted prices included in level 1 that are observable for the asset or liability, either directly or indirectly. These inputs may include quoted prices for the identical instrument on an inactive market, prices for similar instruments, interest rates, prepayment speeds, credit risk, yield curves, default rates and similar data.
Level 3 - Unobservable inputs for the asset or liability, to the extent relevant observable inputs are not available, representing the Funds’ own assumptions about the assumptions a market participant would use in valuing the asset or liability, and would be based on the best information available.
The availability of observable inputs can vary from security to security and is affected by a wide variety of factors, including, for example, the type of security, whether the security is new and not yet established in the marketplace, the liquidity of markets, and other characteristics particular to the security. To the extent that valuation is based on models or inputs that are less observable or unobservable in the market, the determination of fair value requires more judgment. Accordingly, the degree of judgment exercised in determining fair value is greatest for instruments categorized in level 3.
The inputs used to measure fair value may fall into different levels of the fair value hierarchy. In such cases, for disclosure purposes, the level in the fair value hierarchy within which the fair value measurement falls in its entirety, is determined based on the lowest level input that is significant to the fair value measurement in its entirety.
VALUATION OF FUND ASSETS
A description of the valuation techniques applied to the Funds’ major categories of assets measured at fair value on a recurring basis follows.
Equity securities (exchange traded funds). Equity securities generally are valued by using market quotations, but may be valued on the basis of prices furnished by a pricing service when the Valuation Designee believes such prices accurately reflect the fair value of such securities. Securities that are traded on any stock exchange or on the NASDAQ over-the-counter market are generally valued by the pricing service at the last quoted sale price. Lacking a last sale price, an equity security is generally valued by the pricing service at its last bid price. Generally, if the security is traded in an active market and is valued at the last sale price, the security is categorized as a level 1 security, and if an equity security is valued by the pricing service at its last bid, it is generally categorized as a level 2 security. When market quotations are not readily available, when the Valuation Designee determines that the market quotation or the price provided by the
2023 Annual Report 24
Notes to Financial Statements - continued
pricing service does not accurately reflect the current fair value, or when restricted securities are being valued, such securities are valued as determined in good faith by the valuation committee, which includes the Valuation Designee, subject to review of the Board of Trustees and are categorized in level 2 or level 3, when appropriate.
Money market funds. Money market funds are valued at net asset value provided by the funds and are classified in level 1 of the fair value hierarchy.
Mutual funds. Mutual funds are valued at the net asset value as reported by the underlying fund and are classified in level 1 of the fair value hierarchy. The underlying mutual funds value securities in their portfolios for which market quotations are readily available at their market values (generally the last reported sale price) and all other securities and assets at their fair value by the methods established by the boards of the underlying funds. In the event a mutual fund does not report its net asset value, the Fund will value such an asset using its fair value procedures which incorporate, among other information, price changes from reference indexes or reference funds to assist in the valuation of a non-reporting mutual fund.
In accordance with the Trust’s fair value pricing guidelines, the Valuation Designee is required to consider all appropriate factors relevant to the value of securities for which it has determined other pricing sources are not available or reliable as described above. There is no standard procedure for determining fair value, since fair value depends upon the circumstances of each individual case. As a general principle, the current fair value of an issue of securities being valued by the Valuation Designee would appear to be the amount which the owner might reasonably expect to receive for them upon their current sale. Methods which are in accordance with this principle may, for example, be based on (i) a multiple of earnings; (ii) a discount from market of a similar freely traded security (including a derivative security or a basket of securities traded on other markets, exchanges or among dealers); or (iii) yield to maturity with respect to debt issues, or a combination of these and other methods. The Board maintains responsibilities for the fair value determinations under Rule 2a-5 under the 1940 Act and oversees the Valuation Designee.
The following tables summarize the inputs used to value each Fund’s assets measured at fair value as of June 30, 2023:
| Defensive Bull Fund: | | | | | |
| Valuation Inputs of Assets | | Level 1 | Level 2 | Level 3 | Total |
| Exchange Traded Funds | | $625,192,556 | $ – | $ – | $625,192,556 |
| Money Market Funds | | 21,086,975 | – | – | 21,086,975 |
| Total | | $646,279,531 | $ – | $ – | $646,279,531 |
| |
| Managed Volatility Fund: | | | | | |
| Valuation Inputs of Assets | | Level 1 | Level 2 | Level 3 | Total |
| Mutual Funds | | $69,704,756 | $ – | $ – | $69,704,756 |
| Money Market Funds | | 4,497,104 | – | – | 4,497,104 |
| Total | | $74,201,860 | $ – | $ – | $74,201,860 |
| |
| Tactical Opportunities Fund: | | | | | |
| Valuation Inputs of Assets | | Level 1 | Level 2 | Level 3 | Total |
| Exchange Traded Funds | | $ 98,851,447 | $ – | $ – | $ 98,851,447 |
| Money Market Funds | | 3,869,232 | – | – | 3,869,232 |
| Total | | $102,720,679 | $ – | $ – | $102,720,679 |
| |
| Tactical Rotation Fund: | | | | | |
| Valuation Inputs of Assets | | Level 1 | Level 2 | Level 3 | Total |
| Exchange Traded Funds | | $87,407,666 | $ – | $ – | $87,407,666 |
| Money Market Funds | | 3,389,842 | – | – | 3,389,842 |
| Total | | $90,797,508 | $ – | $ – | $90,797,508 |
The Funds did not hold any level 3 assets during the fiscal year ended June 30, 2023.
The Funds did not invest in derivative instruments during the fiscal year ended June 30, 2023.
4.) INVESTMENT ADVISORY AGREEMENT AND SERVICES AGREEMENT
The Funds have entered into an investment advisory agreement (“Management Agreement”) with the Advisor. The Advisor manages the investment portfolio of each Fund, subject to the policies adopted by the Trust’s Board of Trustees. Under the Management Agreement, the Advisor, at its own expense and without reimbursement from the Trust, furnishes office space and all necessary office facilities, equipment and executive personnel necessary for managing the assets of each Fund. The Advisor receives an investment management fee equal to 1.25% of each Fund’s average daily net assets up to $100 million, 1.00% of each Fund’s average daily net assets between $100 million and $200 million and 0.90% of each Fund’s average daily net assets in excess of $200 million.
2023 Annual Report 25
Notes to Financial Statements - continued
For the fiscal year ended June 30, 2023, the Advisor earned management fees in the amounts of $3,672,989, $620,953, $670,113 and $894,732 for the Defensive Bull Fund, Managed Volatility Fund, Tactical Opportunities Fund and Tactical Rotation Fund, respectively. At June 30, 2023, $475,455, $72,261, $97,009 and $88,211 was due to the Advisor from Defensive Bull Fund, Managed Volatility Fund, Tactical Opportunities Fund and Tactical Rotation Fund, respectively.
Additionally, the Funds have a Services Agreement with the Advisor (the “Services Agreement”). Effective November 1, 2021, under the Services Agreement the Advisor receives an additional fee of 0.50% of each Fund's average daily net assets up to $25 million, 0.20% of each Fund's average daily net assets from $25 million to $100 million, and 0.10% of such assets in excess of $100 million and is obligated to pay the operating expenses of each Fund excluding management fees, brokerage fees and commissions, 12b-1 fees (if any), taxes, borrowing costs (such as (a) interest and (b) dividend expenses on securities sold short), ADR fees, the cost of acquired funds and extraordinary expenses. Prior to November 1, 2021, under the Services Agreement the Advisor received a service fee of 0.65% of each Fund's average daily net assets up to $25 million, 0.35% of each Fund's average daily net assets from $25 million to $100 million, and 0.25% of such assets in excess of $100 million and was obligated to pay the operating expenses of each Fund excluding management fees, brokerage fees and commissions, 12b-1 fees (if any), taxes, borrowing costs (such as (a) interest and (b) dividend expenses on securities sold short), ADR fees, the cost of acquired funds and extraordinary expenses. Additionally, under the Services Agreement the Advisor supervises each Fund's business affairs. The Advisor coordinates for the provision of the services of a Chief Compliance Officer for the Trust with respect to each Fund, executive and administrative services including, but are not limited to, the coordination of all third parties furnishing services to each Fund, review of the books and records of each Fund maintained by such third parties, and such other actions with respect to each Fund as may be necessary in the opinion of the Advisor to perform its duties under the Services Agreement.
For the fiscal year ended June 30, 2023, the Advisor earned services fees of $533,112, $174,354, $182,220 and $218,159 from Defensive Bull Fund, Managed Volatility Fund, Tactical Opportunities Fund and Tactical Rotation Fund, respectively. At June 30, 2023, $63,103, $17,726, $21,686 and $20,278 was due to the Advisor from Defensive Bull Fund, Managed Volatility Fund, Tactical Opportunities Fund and Tactical Rotation Fund, respectively.
From November 1, 2021 through October 31, 2022, the Advisor contractually agreed to waive a portion of its Service Fee to limit the Service Fee to 0.40% of Managed Volatility Fund's, Tactical Opportunities Fund's and Tactical Rotation Fund's average daily net assets. During the period July 1, 2022 through June 30, 2023, a total of $0, $5,243, $114 and $0 was contractually waived from Defensive Bull Fund, Managed Volatility Fund, Tactical Opportunities Fund and Tactical Rotation Fund, respectively.
Additionally, from August 1, 2021 through October 31, 2021, the Advisor voluntarily waived Service Agreement fees of 0.15% of each Fund's average daily net assets, and from June 1, 2021, through July 31, 2021, the Advisor voluntarily waived Service Agreement fees of 0.10% of each Fund's average daily net assets. The Service Agreement fee waivers prior to November 1, 2021, were voluntary and were subject to termination at any time. There are no provisions for recoupment for any waivers described in this note.
5.) RELATED PARTY TRANSACTIONS
Certain officers and a Trustee of the Trust are also officers of Premier Fund Solutions, Inc. (the “Administrator”). These individuals receive benefits from the Administrator resulting from administration fees paid to the Administrator of the Fund by the Adviser.
The Trustees who are not interested persons of the Funds were each paid $6,000, for a total of $24,000, in Trustees fees for the fiscal year ended June 30, 2023. Under the Management Agreements, the Advisor pays these fees.
6.) INVESTMENTS
For the fiscal year ended June 30, 2023, purchases and sales of investment securities other than U.S. Government obligations and short-term investments were as follows:
| | | Defensive | | Managed | | Tactical | | Tactical |
| | | Bull Fund | | Volatility Fund | | Opportunities Fund | | Rotation Fund |
| Purchases | | $5,001,444,333 | | $295,124,707 | | $555,330,097 | | $784,294,051 |
| Sales | | $4,498,267,995 | | $233,180,187 | | $491,528,587 | | $734,913,567 |
There were no purchases or sales of U.S. Government obligations.
7.) CONTROL OWNERSHIP
The beneficial ownership, either directly or indirectly, of more than 25% of the voting shares of a fund creates a presumption of control of the fund, under section 2(a)(9) of the 1940 Act, as amended. As of June 30,
2023 Annual Report 26
Notes to Financial Statements - continued
2023, National Financial Services, LLC (“NFS”), located in New York, New York, and TD Ameritrade, located in Omaha, Nebraska, each held for the benefit of its customers, accounts in excess of 25% of the voting shares of each fund noted below. The Funds do not know whether any underlying accounts of NFS or TD Ameritrade, owned or controlled 25% or more of the voting securities of each Fund.
| | TD Ameritrade | | NFS | |
| Defensive Bull Fund | 36.16% | | – ** | |
| Managed Volatility Fund | 31.49% | | 29.02% | |
| Tactical Opportunities Fund | 32.44% | | 30.63% | |
| Tactical Rotation Fund | 30.51% | | 33.87% | |
| |
| ** Balance under 25% as of June 30, 2023. | | | |
8.) TAX MATTERS
For federal income tax purposes, at June 30, 2023 the cost of securities on a tax basis and the composition of gross unrealized appreciation (the excess of value over tax cost) and depreciation (the excess of tax cost over value) were as follows:
| | | Defensive | | Managed | | Tactical | | Tactical | |
| | | Bull Fund | | Volatility Fund | | Opportunities Fund | | Rotation Fund | |
| Cost of Investments | | $632,164,891 | | $74,271,337 | | $96,349,613 | | $89,245,336 | |
| |
| Gross Unrealized Appreciation | | $14,144,640 | | $ 186,675 | | $6,373,064 | | $2,523,607 | |
| Gross Unrealized Depreciation | | - | | (256,152 | ) | (1,998 | ) | (971,435 | ) |
| Net Unrealized Appreciation | | | | | | | | | |
| (Depreciation) on Investments | | $14,114,640 | | $ (69,477 | ) | $6,371,066 | | $1,552,172 | |
The tax character of distributions paid during the fiscal years ended June 30, 2023 and June 30, 2022 were as follows:
| | | Fiscal Year Ended | | Fiscal Year Ended |
| | | June 30, 2023 | | June 30, 2022 |
| Defensive Bull Fund | | | | |
| Ordinary Income | | $ 549,021 | | $60,468,943 |
| Long-term Capital Gain | | - | | - |
| | | $ 549,021 | | $60,468,943 |
| |
| Managed Volatility Fund | | | | |
| Ordinary Income | | $ 328,375 | | $ 954,660 |
| Tax-Exempt Income | | 71,321 | | 165,850 |
| Long-term Capital Gain | | - | | - |
| | | $ 399,696 | | $1,120,510 |
| |
| Tactical Opportunities Fund | | | | |
| Ordinary Income | | $ - | | $5,979,395 |
| Long-term Capital Gain | | - | | - |
| | | $ - | | $5,979,395 |
| |
| Tactical Rotation Fund | | | | |
| Ordinary Income | | $ 81,288 | | $8,555,271 |
| Long-term Capital Gain | | - | | - |
| | | $ 81,288 | | $8,555,271 |
As of June 30, 2023, the components of distributable earnings on a tax basis were as follows:
| | | Defensive Bull Fund | | | Managed Volatility Fund | |
| Undistributed Ordinary Income | | $66,643,942 | | | $ 815,265 | |
| Undistributed Tax-Exempt Income | | - | | | 245,641 | |
| Accumulated Capital and Other Losses | | - | | | (2,199,814) | |
| Unrealized Appreciation (Depreciation) - Net | | 14,114,640 | | | (69,477) | |
| | | $80,758,582 | | | $ (1,208,385) | |
| |
| | | Tactical Opportunities Fund | | | Tactical Rotation Fund | |
| Undistributed Ordinary Income | | $ 106,332 | | | $ 423,017 | |
| Accumulated Capital and Other Losses | | (3,881,178) | | | (1,464,261) | |
| Unrealized Appreciation - Net | | 6,371,066 | | | 1,552,172 | |
| | | $ 2,596,220 | | | $ 510,928 | |
2023 Annual Report 27
Notes to Financial Statements - continued
As of June 30, 2023, the primary differences between book and tax basis unrealized appreciation (depreciation) were attributable to the tax deferral of wash sales.
As of June 30, 2023, accumulated capital and other losses include the following:
| Managed Volatility Fund | | |
| Post-October Losses | | $337,209 |
| Short Term Capital Loss Carryforward | | $1,862,605 |
| |
| Tactical Opportunities Fund | | |
| Short Term Capital Loss Carryforward | | $3,452,659 |
| Long Term Capital Loss Carryforward | | $428,519 |
| |
| Tactical Rotation Fund | | |
| Short Term Capital Loss Carryforward | | $1,464,261 |
Under current tax law, post-October capital losses incurred after October 31 of a fund’s fiscal year end may be deferred and treated as occurring on the first business day of the following fiscal year for tax purposes. Capital loss carryforwards have no expiration.
9.) LEVERAGED ETF RISKS
The Funds may invest in leveraged Exchange Traded Funds (“ETFs”). The net asset value and market price of leveraged ETFs are usually more volatile than the value of the tracked index or of other ETFs that do not use leverage. Inverse and leveraged ETFs use investment techniques and financial instruments that may be considered aggressive, including the use of derivative transactions. Most leveraged ETFs are designed to achieve their stated objectives on a daily basis. Their performance over long periods of time can differ significantly from the performance of the underlying index during the same period of time. This effect can be magnified in volatile markets.
10.) AFFILIATED ISSUER TRANSCTIONS
When a Fund holds more than 5% of the outstanding shares of an investment, that investment is consider to be an affiliated investment of the Fund. During the fiscal year ended June 30, 2023, Defensive Bull Fund had the following transactions with affiliated companies:
| | | Direxion Daily S&P | |
| | | 500 3X Bull Shares | |
| Security Name | | ETF | |
| Value as of June 30, 2022 | $ | - | |
| Purchases | | 1,162,723,229 | |
| Sales | | (992,933,155 | ) |
| Change in Unrealized Gain (Loss) | | 9,321,414 | |
| Realized Gain (Loss) | | 35,966,806 | |
| Value as of June 30, 2023 | $ | 215,078,294 | |
| Shares Balance as of June 30, 2023 | | 2,390,290 | |
| Dividends | $ | 289,584 | |
| Capital Gain Distributions | $ | - | |
There were no affiliated investment transactions in Managed Volatility Fund, Tactical Opportunities Fund, or Tactical Rotation Fund during the fiscal year ended June 30, 2023.
11.) CONTINGENCIES AND COMMITMENTS
The Trust indemnifies its officers and the Board for certain liabilities that may arise from the performance of their duties to the Trust. Additionally, in the normal course of business, each Fund enters into contracts that contain a variety of representations and warranties and which provide general indemnities. Each Fund’s maximum exposure under these arrangements is unknown, as this would involve future claims that may be made against a Fund that have not yet occurred. However, based on experience, the risk of loss due to these warranties and indemnities appears to be remote.
12.) SUBSEQUENT EVENTS
Subsequent events after the date of the Statements of Assets and Liabilities have been evaluated through the date the financial statements were issued. Management has concluded that there is no impact requiring adjustment to or disclosure in the financial statements.
2023 Annual Report 28
REPORT OF INDEPENDENT REGISTERED PUBLIC ACCOUNTING FIRM
To the Shareholders of Conquer Risk Funds and
Board of Trustees of PFS Funds
Opinion on the Financial Statements
We have audited the accompanying statements of assets and liabilities, including the schedules of investments, of Conquer Risk Defensive Bull Fund, Conquer Risk Managed Volatility Fund, Conquer Risk Tactical Opportunities Fund, and Conquer Risk Tactical Rotation Fund (the “Funds”), each a series of PFS Funds, as of June 30, 2023, the related statements of operations for the year then ended, the statements of changes in net assets for each of the two years in the period then ended, the related notes, and the financial highlights for the years ended June 30, 2023, 2022 and for the period from July 1, 2020 (commencement of operations) through June 30, 2021 (collectively referred to as the “financial statements”). In our opinion, the financial statements present fairly, in all material respects, the financial position of each of the Funds as of June 30, 2023, the results of their operations, the changes in net assets, and the financial highlights for each of the periods indicated above, in conformity with accounting principles generally accepted in the United States of America.
Basis for Opinion
These financial statements are the responsibility of the Funds’ management. Our responsibility is to express an opinion on the Funds’ financial statements based on our audits. We are a public accounting firm registered with the Public Company Accounting Oversight Board (United States) (“PCAOB”) and are required to be independent with respect to the Funds in accordance with the U.S. federal securities laws and the applicable rules and regulations of the Securities and Exchange Commission and the PCAOB.
We conducted our audits in accordance with the standards of the PCAOB. Those standards require that we plan and perform the audit to obtain reasonable assurance about whether the financial statements are free of material misstatement whether due to error or fraud.
Our audits included performing procedures to assess the risks of material misstatement of the financial statements, whether due to error or fraud, and performing procedures that respond to those risks. Such procedures included examining, on a test basis, evidence regarding the amounts and disclosures in the financial statements. Our procedures included confirmation of securities owned as of June 30, 2023, by correspondence with the custodian. Our audits also included evaluating the accounting principles used and significant estimates made by management, as well as evaluating the overall presentation of the financial statements. We believe that our audits provide a reasonable basis for our opinion.
We have served as the Funds’ auditor since 2020.

COHEN & COMPANY, LTD.
Milwaukee, Wisconsin
August 25, 2023
2023 Annual Report 29
DISCLOSURE OF EXPENSES
(Unaudited) |
The ongoing costs to shareholders associated with the Defensive Bull Fund, Managed Volatility Fund, Tactical Opportunities Fund and Tactical Rotation Fund consist of management fees and service fees and interest expense. Although the Funds charge no sales loads or transaction fees, you will be assessed fees for outgoing wire transfers, returned checks and stop payment orders at prevailing rates charged by Mutual Shareholder Services, LLC, the Funds’ transfer agent. IRA accounts will be charged an $8.00 annual maintenance fee. Additionally, your account will be indirectly subject to the expenses of any underlying funds. The following example is intended to help you understand your ongoing costs of investing in the Funds and to compare these costs with similar costs of investing in other mutual funds. The example is based on an investment of $1,000 invested in the Funds on January 1, 2023, and held through June 30, 2023.
The first line of each table below provides information about actual account values and actual expenses. In order to estimate the expenses a shareholder paid during the period covered by this report, shareholders can divide their account value by $1,000 (for example, an $8,600 account value divided by $1,000 = 8.6) and then multiply the result by the number in the first line under the heading entitled “Expenses Paid During the Period.”
The second line of each table below provides information about hypothetical account values and hypothetical expenses based on the Funds’ actual expense ratios and an assumed rate of return of 5% per year before expenses, which is not the Funds’ actual return. The hypothetical account values and expenses may not be used to estimate the actual ending account balance or expenses paid by a shareholder for the period. Shareholders may use this information to compare the ongoing costs of investing in the Funds and other funds. In order to do so, compare these 5% hypothetical examples with the 5% hypothetical examples that appear in other funds’ shareholder reports.
Please note that the expenses shown in each table are meant to highlight your ongoing costs only and do not reflect expenses of any underlying funds or any transactional costs, such as the annual maintenance fee charged to IRA accounts, or exchange fees. Therefore, the second line of the table is useful in comparing ongoing costs only, and will not help you determine the relative total costs of owning different funds. In addition, if these transactional costs were included, your costs would have been higher.
| DEFENSIVE BULL FUND | | | | | | |
| | | | | | | Expenses Paid |
| | | Beginning | | Ending | | During the Period* |
| | | Account Value | | Account Value | | January 1, 2023 to |
| | | January 1, 2023 | | June 30, 2023 | | June 30, 2023 |
| |
| Actual | | $1,000.00 | | $1,263.34 | | $6.40 |
| |
| Hypothetical | | $1,000.00 | | $1,019.14 | | $5.71 |
| (5% annual return | | | | | | |
| before expenses) | | | | | | |
* Expenses are equal to the Fund’s annualized expense ratio of 1.14%, multiplied by the average
account value over the period, multiplied by 181/365 (to reflect the one-half year period). |
| MANAGED VOLATILITY FUND | | | | |
| | | | | | | Expenses Paid |
| | | Beginning | | Ending | | During the Period* |
| | | Account Value | | Account Value | | January 1, 2023 to |
| | | January 1, 2023 | | June 30, 2023 | | June 30, 2023 |
| |
| |
| Actual | | $1,000.00 | | $970.22 | | $8.16 |
| |
| Hypothetical | | $1,000.00 | | $1,016.51 | | $8.35 |
| (5% annual return | | | | | | |
| before expenses) | | | | | | |
* Expenses are equal to the Fund’s annualized expense ratio of 1.67%, multiplied by the average
account value over the period, multiplied by 181/365 (to reflect the one-half year period). |
2023 Annual Report 30
| Disclosure of Expenses (Unaudited) - continued | | |
| |
| TACTICAL OPPORTUNITIES FUND | | | | |
| | | | | | | Expenses Paid |
| | | Beginning | | Ending | | During the Period* |
| | | Account Value | | Account Value | | January 1, 2023 to |
| | | January 1, 2023 | | June 30, 2023 | | June 30, 2023 |
| |
| Actual | | $1,000.00 | | $1,211.33 | | $8.55 |
| |
| Hypothetical | | $1,000.00 | | $1,017.06 | | $7.80 |
| (5% annual return | | | | | | |
| before expenses) | | | | | | |
* Expenses are equal to the Fund’s annualized expense ratio of 1.56%, multiplied by the average
account value over the period, multiplied by 181/365 (to reflect the one-half year period). |
| TACTICAL ROTATION FUND | | | | |
| | | | | | | Expenses Paid |
| | | Beginning | | Ending | | During the Period* |
| | | Account Value | | Account Value | | January 1, 2023 to |
| | | January 1, 2023 | | June 30, 2023 | | June 30, 2023 |
| |
| Actual | | $1,000.00 | | $1,023.37 | | $7.73 |
| |
| Hypothetical | | $1,000.00 | | $1,017.16 | | $7.70 |
| (5% annual return | | | | | | |
| before expenses) | | | | | | |
* Expenses are equal to the Fund’s annualized expense ratio of 1.54%, multiplied by the average
account value over the period, multiplied by 181/365 (to reflect the one-half year period). |
2023 Annual Report 31
ADDITIONAL INFORMATION
June 30, 2023 |
APPROVAL OF CONTINUATION OF MANAGEMENT AGREEMENT FOR THE CONQUER RISK FUNDS
On June 8, 2023, the Board of Trustees (the “Board” or the “Trustees”) considered the renewal of the Management Agreement (the “Management Agreement”) between Potomac Fund Management, Inc. (“Potomac”) and the Trust with respect to the Conquer Risk Funds. In approving the continuation of the Management Agreement, the Board considered and evaluated the following factors: (i) the nature, extent and quality of the services provided by Potomac to the Conquer Risk Funds; (ii) the investment performance of the Conquer Risk Funds; (iii) the cost of the services to be provided and the profits to be realized by Potomac from the relationship with the Conquer Risk Funds; (iv) the extent to which economies of scale will be realized as the Conquer Risk Funds grow and whether the fee levels reflect these economies of scale to the benefit of shareholders; and (v) Potomac’s practices regarding possible conflicts of interest.
In assessing these factors and reaching its decisions, the Board took into consideration information furnished for the Board’s review and consideration throughout the year at its regular Board meetings, as well as information specifically prepared and/or presented in connection with the annual renewal process. The Board also considered the presentation made by a representative of Potomac at the Meeting. The Board requested and was provided with information and reports relevant to the annual renewal of the Management Agreement, as well as information relevant to their consideration of the Management Agreement including: (i) information regarding the services and support provided to the Conquer Risk Funds and their shareholders by Potomac; (ii) assessments of the investment performance of the Conquer Risk Funds by the portfolio manager from Potomac; (iii) commentary on the reasons for the performance; (iv) presentations addressing Potomac’s investment philosophy, investment strategy, personnel and operations; (v) compliance and audit related information concerning the Conquer Risk Funds and Potomac; (vi) disclosure information contained in the registration statement of the Trust and the Form ADV of Potomac; and (vii) a memorandum from legal counsel that summarized the fiduciary duties and responsibilities of the Board in reviewing and approving the Management Agreement, including the material factors set forth above and the types of information included in each factor that should be considered by the Board in order to make an informed decision. The Board also requested and received various informational materials including, without limitation: (i) documents containing information about Potomac, including financial information, a description of personnel and the services provided to the Conquer Risk Funds, information on investment advice, performance, summaries of the Conquer Risk Funds’ expenses, compliance program, current legal matters, and other general information; (ii) comparative expense and performance information for other mutual funds with strategies similar to the Conquer Risk Funds; (iii) the anticipated effect of size on the Conquer Risk Funds’ performance and expenses; and (iv) benefits to be realized by Potomac from its relationship with the Conquer Risk Funds. The Board did not identify any particular information that was most relevant to its consideration to approve the Management Agreement and each Trustee may have afforded a different weight to the various factors.
In deciding whether to approve the continuation of the Management Agreement, the Trustees considered numerous factors, including:
1. The nature, extent, and quality of the services to be provided by Potomac.
In this regard, the Board considered the responsibilities of Potomac under the Management Agreement. The Board reviewed the services provided by Potomac to the Conquer Risk Funds including, without limitation, the procedures for formulating investment recommendations and assuring compliance with the Conquer Risk Funds’ investment objectives and limitations; Potomac’s coordination of services for the Conquer Risk Funds among the service providers; and the efforts of Potomac to promote the Conquer Risk Funds and grow assets. The Board considered: Potomac’s staffing, personnel, and methods of operating; the education and experience of its personnel; and its compliance programs, policies, and procedures. After reviewing the foregoing and further information from Potomac, the Board concluded that the quality, extent, and nature of the services provided by Potomac was satisfactory and adequate for the Conquer Risk Funds.
2. The investment performance of the Conquer Risk Funds and Potomac.
In considering the investment performance of the Conquer Risk Funds and Potomac, the Trustees compared the performance of the Conquer Risk Funds with the performance of funds with similar objectives managed by other investment advisers, as well as with aggregated peer group data. As to the performance of the Conquer Risk Funds, the Trustees compared each Conquer Risk Fund’s performance to its
2023 Annual Report 32
Additional Information (Unaudited) - continued
Morningstar category, (each, a “Category”) and to a group of funds of similar size, style and objective, derived from the Category (the “Peer Group”). The performance data from the Category and the Peer Group covered periods ended March 31, 2023. The Trustees noted that with respect to the Conquer Risk Defensive Bull Fund, for the 1- year period ended March 31, 2023, the Fund had outperformed the average fund in its Category (US Fund Tactical Allocation Funds) and Peer Group, and had outperformed compared to its benchmark index, the S&P 500. The Trustees noted that with respect to the Conquer Risk Managed Volatility Fund, for the 1- year period ended March 31, 2023, the Fund had outperformed the average fund in its Category (US Fund Multisector Bond Funds) and Peer Group, and had outperformed compared to its benchmark index, the Bloomberg Global Aggregate TR Index. The Trustees noted that with respect to the Conquer Risk Tactical Opportunities Fund, for the 1- year period ended March 31, 2023, the Fund had outperformed the average fund in its Category (US Fund Tactical Allocation Funds) and Peer Group, and had outperformed compared to its benchmark index, the S&P 500. The Trustees noted that with respect to the Conquer Risk Tactical Rotation Fund, for the 1- year period ended March 31, 2023, the Fund had outperformed the average fund in its Category (US Fund Allocation 50% -70% Equity Funds) and Peer Group, and had outperformed compared to its benchmark index, the S&P 500. The Trustees reflected on the management style utilized for each of the Conquer Risk Funds, and noted the positive performance of each of the Conquer Risk Funds in a difficult market environment. After reviewing and discussing the investment performance of each of the Conquer Risk Funds further, Potomac’s experience managing the Conquer Risk Funds, and other relevant factors, the Board concluded, in light of all the facts and circumstances, that the investment performance of the Conquer Risk Funds and Potomac was satisfactory.
3. The costs of the services to be provided and the profits to be realized by Potomac from the relationship with the Conquer Risk Funds.
In considering the costs of the services to be provided and profits to be realized by Potomac from the relationship with the Conquer Risk Funds, the Trustees considered: (1) Potomac’s financial condition and the level of commitment to the Conquer Risk Funds and Potomac by the principals of Potomac; (2) the asset level of the Conquer Risk Funds; (3) the overall expenses of the Conquer Risk Funds; and (4) the nature and frequency of advisory fee payments. The Trustees reviewed information provided by Potomac regarding its profits associated with managing the Conquer Risk Funds. The Trustees also considered potential benefits for Potomac in managing the Conquer Risk Funds, noting it was created to provide an efficient structure for clients of Potomac to access the investment strategy. The Trustees then compared the fees and expenses of the Conquer Risk Funds (including the management fee) to other comparable mutual funds. The Trustees reviewed the fees under the Management Agreement and compared them to the average management fee of the Category and Peer Group, noting that each of the Conquer Risk Funds’ management fee was higher than the average management fee for the Category and Peer Group, respectively. The Board also noted that each of the Conquer Risk Funds’ management fees and expense ratios were within the range of funds in its Category and Peer Group. The Board noted that Potomac doesn’t offer similar strategies as employed by the Conquer Risk Funds to non-mutual fund clients. The Board performed the same comparison as it relates to each Conquer Risk Funds’ expense ratio, noting that each Fund’s expense ratio was higher than the average net expense ratio for the Category and Peer Group, respectively. The Trustees also considered that under the contractual arrangements with Potomac, it was required to pay most of the Conquer Risk Funds’ operating expenses out of its assets. The Trustees also considered a profitability analysis of Potomac’s relationship with the Fund. Based on the foregoing, the Board concluded that the fee arrangements to Potomac and the profitability of Potomac, considering all the facts and circumstances, were fair and reasonable in relation to the nature and quality of the services provided by Potomac.
4. The extent to which economies of scale would be realized as the Conquer Risk Funds grow and whether advisory fee levels reflect these economies of scale for the benefit of the Conquer Risk Funds’ investors.
In this regard, the Board considered the Conquer Risk Funds’ fee arrangements with Potomac. The Board discussed the breakpoints included in the Management Agreement and the Services Agreement and the impact on shareholders. It was further noted that under the Services Agreement, Potomac is obligated to pay certain of the Conquer Risk Funds’ operating expenses which had the effect of limiting the overall fees paid by each Fund. Following further discussion of the Conquer Risk Funds’ projected asset levels, expectations for growth, and levels of fees, the Board determined that each of the Conquer Risk Fund’s fee arrangement with Potomac was fair and reasonable and reasonable in relation to the nature and quality of the services to be provided by Potomac.
5. Possible conflicts of interest and benefits to Potomac.
In evaluating the possibility for conflicts of interest, the Board considered such matters as: the experience and ability of the advisory personnel assigned to the Conquer Risk Funds; the basis of decisions to
2023 Annual Report 33
Additional Information (Unaudited) - continued
buy or sell securities for the Conquer Risk Funds; the method for bunching of portfolio securities transactions; and the substance and administration of Potomac’s Code of Ethics and other relevant policies described in Potomac’s Form ADV and compliance manual. Following further consideration and discussion, the Board indicated that Potomac’s standards and practices relating to the identification and mitigation of potential conflicts of interest were satisfactory. The Trustees noted Potomac’s utilization of soft dollars and the benefits that could be derived by the Funds.
After further discussion and careful review by the Board, the Board determined that the compensation payable under the Management Agreement was fair, reasonable and within a range of what could have been negotiated at arms-length in light of all the surrounding circumstances, and they approved the Management Agreement for another one-year term.
AVAILABILITY OF QUARTERLY SCHEDULE OF INVESTMENTS
The Funds publicly file their complete schedules of portfolio holdings with the Securities and Exchange Commission (“SEC”) for the first and third quarters of each fiscal year on Form N-PORT. The Funds’ Forms N-PORT are available on the SEC’s website at http://www.sec.gov.
Potomac Fund Management, Inc., the Funds’ Advisor, is responsible for exercising the voting rights associated with the securities held by the Funds. A description of the policies and procedures used by the Advisor in fulfilling this responsibility is available without charge on the Funds’ website at www.potomacfund.com/funds. It is also included in the Funds’ Statement of Additional Information, which is available on the SEC’s website at http://www.sec.gov.
Form N-PX provides information regarding how the Funds voted proxies with regards to portfolio securities held during the most recent 12-month period ended June 30th and is available without charge, upon request, by calling our toll free number (1-888-774-6679). This information is also available on the SEC’s website at http://www.sec.gov.
You will find more information about the Funds at www.potomacfund.com/funds. For shareholder inquiries, please call toll-free in the U.S. at 1-888-774-6679.
2023 Annual Report 34
This page intentionally left blank.
2023 Annual Report 35
Trustees and Officers
(Unaudited) |
The Board of Trustees supervises the business activities of the Trust. The names of the Trustees and executive officers of the Trust are shown below. For more information regarding the Trustees, please refer to the Statement of Additional Information, which is available upon request by calling 1-888-774-6679. Each Trustee serves until the Trustee sooner dies, resigns, retires, or is removed.
The Trustees and Officers of the Trust and their principal business activities during the past five years are:
Interested Trustees and Officers
| | | | | Number of | |
| | | | Principal | Portfolios In | Other |
| Name, | Position(s) | Term of Office | Occupation(s) | Fund | Directorships |
| Address(1), | Held With | and Length of | During | Complex | Held By |
| and Year of Birth | the Trust | Time Served | Past 5 Years | Overseen By | Trustee |
| | | | | Trustee | |
| |
| James D. Craft, | President | Indefinite Term; | Fund Administrator, Premier Fund | N/A | N/A |
| Year of Birth: 1982 | | Since 2023 | Solutions, Inc. (2007 - current); | | |
| | | | Chief Technology Officer, Premier | | |
| | | | Fund Solutions, Inc. (2011 - cur- | | |
| rent). |
| |
| Jeffrey R. Provence(2), | Trustee, | Indefinite Term; | CEO, Premier Fund Solutions, Inc. | 13 | Blue Chip |
| Year of Birth: 1969 | Secretary | Since 2000 | (2001 to current). General Partner | | Investor Funds, |
| | and | | and Portfolio Manager for Value | | Meeder Funds |
| | Treasurer | | Trend Capital Management, LP | | |
| | | | (1995 to current). | | |
| |
| Julian G. Winters, | Chief | Indefinite Term; | Managing Member, Watermark | N/A | N/A |
| Year of Birth: 1968 | Compliance | Since 2010 | Solutions LLC (investment compli- | | |
| | Officer | | ance and consulting) (2007 to cur- | | |
| rent). |
(1) The address of each trustee and officer is c/o PFS Funds, 1939 Friendship Drive, Suite C, El Cajon, California 92020.
(2) Jeffrey R. Provence is considered an “interested person” as defined in Section 2(a)(19) of the 1940 Act by virtue of his position
with the Trust. |
| | | | | Number of | |
| | | | Principal | Portfolios In | Other |
| Name, | Position | Term of Office | Occupation(s) | Fund | Directorships |
| Address(1), | Held With | and Length of | During | Complex | Held By |
| and Year of Birth | the Trust | Time Served | Past 5 Years | Overseen By | Trustee |
| | | | | Trustee | |
| |
| Thomas H. Addis III, | Independent | Indefinite Term; | Executive Director/CEO, Southern | 13 | None |
| Year of Birth: 1945 | Trustee | Since 2000 | California PGA (2006 to current). | | |
| |
| Robert L. Boerner, | Independent | Indefinite Term; | Owner / Broker of Gecko Realty | 13 | None |
| Year of Birth: 1969 | Trustee | Since 2022 | (2008 to current). | | |
| |
| Allen C. Brown, | Independent | Indefinite Term; | Retired. Law Office of Allen C. | 13 | Blue Chip |
| Year of Birth: 1943 | Trustee | Since 2010 | Brown, estate planning and business | | Investor Funds |
| | | | attorney (1970 to 2021). | | |
| |
| John W. Czechowicz, | Independent | Indefinite Term; | CPA at CWDL (2016 to current). | 13 | None |
| Year of Birth: 1983 | Trustee | Since 2022 | | | |
(1) The address of each trustee and officer is c/o PFS Funds, 1939 Friendship Drive, Suite C, El Cajon, California 92020.
2023 Annual Report 36
Investment Advisor
Potomac Fund Management, Inc.
Custodian
U.S. Bank, NA
Distributor
Arbor Court Capital, LLC
Fund Administrator
Premier Fund Solutions, Inc.
Independent Registered Public Accounting Firm
Cohen & Company, Ltd.
Legal Counsel
Practus, LLP
Transfer Agent
Mutual Shareholder Services, LLC |
This report is provided for the general information of the shareholders of the Conquer
Risk Funds. This report is not intended for distribution to prospective investors in the
Funds, unless preceded or accompanied by an effective prospectus. |
Conquer Risk Funds
1-888-774-6679
www.potomacfund.com/funds/
Item 2. Code of Ethics.
The registrant has adopted a code of ethics that applies to the registrant’s principal executive officer and the principal financial officer. The registrant has not made any amendments to its code of ethics during the covered period. The registrant has not granted any waivers from any provisions of the code of ethics during the covered period. A copy of the registrant’s Code of Ethics is filed herewith.
Item 3. Audit Committee Financial Expert.
The registrant's Board of Trustees has determined that John W. Czechowicz is an audit committee financial expert. Mr. Czechowicz is independent for purposes of this Item 3.
Item 4. Principal Accountant Fees and Services.
(a-d) The following table details the aggregate fees billed for each of the last two fiscal years for audit fees, audit-related fees, tax fees and other fees by the principal accountant to the registrant. The principal accountant has provided no services to the adviser or any entity controlled by, or under common control with the adviser that provides ongoing services to the registrant.
| | | FYE 6/30/2023 | | FYE 6/30/2022 |
| Audit Fees | | $51,500 | | $51,500 |
| Audit-Related Fees | | $0 | | $0 |
| Tax Fees | | $14,000 | | $12,000 |
| All Other Fees | | $1,000 | | $1,000 |
Nature of Tax Fees: preparation of Excise Tax Statement and 1120 RIC.
All Other Fees: Semi-Annual Report Review
(e) (1) The audit committee approves all audit and non-audit related services and, therefore, has not adopted pre-approval policies and procedures described in paragraph (c)(7) of Rule 2-01 of Regulation S-X.
(e) (2) None of the services described in paragraph (b) through (d) of this Item were approved by the audit committee pursuant to paragraph (c)(7)(i)(C) of Rule 2-01 of Regulation S-X.
(f) All of the principal accountant’s hours spent on auditing the registrant’s financial statements were attributed to work performed by full-time permanent employees of the principal accountant.
(g) The following table indicates the aggregate non-audit fees billed by the registrant’s principal accountant for services to the registrant , the registrant’s investment adviser (not sub-adviser), and any entity controlling, controlled by, or under common control with the adviser that provides ongoing services to the registrant, for the last two years.
| Non-Audit Fees | | FYE 6/30/2023 | | FYE 6/30/2022 |
| Registrant | | $15,000 | | $13,000 |
| Registrant’s Investment Adviser | | $0 | | $0 |
(h) The principal accountant provided no services to the investment adviser or any entity controlling, controlled by, or under common control with the adviser that provides ongoing services to the registrant.
(i) Not applicable.
(j) Not applicable.
Item 5. Audit Committee of Listed Companies. Not applicable.
Item 6. Investments.
(a) Not applicable. Schedule filed with Item 1.
(b) Not applicable.
Item 7. Disclosure of Proxy Voting Policies and Procedures for Closed-End Management Investment Companies. Not applicable.
Item 8. Portfolio Managers of Closed End Management Investment Companies. Not applicable.
Item 9. Purchases of Equity Securities by Closed-End Management Investment Companies and Affiliated Purchasers. Not applicable.
Item 10. Submission of Matters to a Vote of Security Holders.
The registrant has not adopted procedures by which shareholders may recommend nominees to the registrant’s board of trustees.
Item 11. Controls and Procedures.
(a) The Registrant’s president and chief financial officer concluded that the disclosure controls and procedures (as defined in Rule 30a-3(c) under the Act (17 CFR 270.30a -3(c))) as of a date within 90 days of the filing date of the report that includes the disclosure required by this paragraph, based on the evaluation of these controls and procedures required by Rule 30a-3(b) under the Act (17 CFR 270.30a -3(b)) and Rules 13a-15(b) or 15d-15(b) under the Exchange Act (17 CFR 240.13a -15(b) or 240.15d -15(b)).
(b) There were no changes in the registrant’s internal control over financial reporting (as defined in Rule 30a-3(d) under the Act (17 CFR 270.30a -3(d)) that occurred during the period covered by this report that has materially affected, or is reasonably likely to materially affect, the registrant’s internal control over financial reporting.
Item 12. Disclosure of Securities Lending Activities for Closed-End Management Investment Companies.
Not applicable.
Item 13. Exhibits.
(a)(1) Code of Ethics. Filed herewith.
(a)(2) Certifications pursuant to Section 302 of the Sarbanes-Oxley Act of 2002. Filed herewith.
(a)(3) Not applicable.
(a)(4) Not applicable.
(b) Certification pursuant to Section 906 of the Sarbanes-Oxley Act of 2002. Filed herewith.
Pursuant to the requirements of the Securities Exchange Act of 1934 and the Investment Company Act of 1940, the registrant has duly caused this report to be signed on its behalf by the undersigned, thereunto duly authorized.
| | By: /s/James Craft
James Craft
President |
Pursuant to the requirements of the Securities Exchange Act of 1934 and the Investment Company Act of 1940, this report has been signed below by the following persons on behalf of the registrant and in the capacities and on the dates indicated.
| | By: /s/James Craft
James Craft
President |
| | By: /s/Jeffrey R. Provence
Jeffrey R. Provence
Chief Financial Officer |