UNITED STATES
SECURITIES AND EXCHANGE COMMISSION
WASHINGTON, D.C. 20549
CERTIFIED SHAREHOLDER REPORT OF REGISTERED MANAGEMENT
INVESTMENT COMPANIES
Investment Company Act file number 811-09781
PFS Funds
(Exact name of registrant as specified in charter)
1939 Friendship Drive, Suite C, El Cajon, CA 92020
(Address of principal executive offices) (Zip code)
CT Corporation System
155 Federal St., Suite 700, Boston, MA 02110
(Name and address of agent for service) |
Registrant’s telephone number, including area code: (619) 588-9700
Date of fiscal year end: July 31
Date of reporting period: July 31, 2023
Item 1. Report to Stockholders.
Alpha Fiduciary Quantitative Strategy Fund
ANNUAL REPORT
July 31, 2023
TICKER AFQSX
Alpha Fiduciary Quantitative Strategy Fund
Annual Report
July 31, 2023
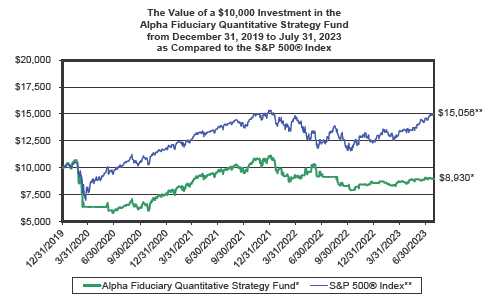
During the Alpha Fiduciary Quantitative Strategy Fund’s (the “Fund” or “AFQSX”) fiscal year August 1, 2022 through July 31, 2023, the Fund’s performance was down (2.40)% versus the S&P 500® Index (the “S&P 500“), the Fund’s benchmark, which returned 13.02% during the same period.
The Fund is a trend-following fund. Its model is continuously updated with market data as it performs its comparative tests between the shorter-term and longer-term trends. Management also utilizes other data in its decision making as it considers risks to the trends presented by its model.
Generally, calendar year 2022 was a very trendless and volatile period for the S&P 500. The Fund’s model generally performed well given the exceptionally volatile and trendless environment. During the first quarter of calendar year 2023, the S&P 500 was also very choppy. Then, the S&P 500 began to trend higher starting in Q2 2023. The Fund did not fully capture the S&P 500’s upside during the period from April 1, 2023 to July 31, 2023, due in part to the Fund’s more cautious stance in June and July. The Fund did deliver positive returns and management believes the Fund’s risk management will be a key differentiator for the Fund in the near future.
In February 2023, management received confirmation that its prospectus amendment permitting the Fund to be net short was effective. Management believes now having this ability significantly enhances the Fund’s value as a portfolio management tool. In summary, the Fund now can invest appropriately -105% to +165% at cost, giving management the ability to play both upside and downside market patterns as they develop.
In closing, resilience and durability are key attributes of the AFQSX strategy. Management believes both are enhanced with the amended prospectus. We remain confident the Fund can be postured for both upside and downside market trends.
Arthur Doglione
Curtis Anderson
Past performance does not guarantee future results. The investment return and principal value of an investment in the Fund will fluctuate so that an investor’s shares, when redeemed, may be worth more or less than their original cost. Current performance may be higher or lower than the performance data quoted. Performance data current to the most recent month end are available by calling 1-888-266-3996.
The Alpha Fiduciary Quantitative Strategy Fund’s prospectus contains important information about the Fund’s investment objectives, potential risks, management fees, charges and expenses, and other information and should be read and considered carefully before investing. You may obtain a current copy of the Fund’s prospectus by calling 1-888-266-3996. Distributed by Arbor Court Capital, LLC.
2023 Annual Report 1
Alpha Fiduciary Quantitative Strategy Fund (Unaudited)
PERFORMANCE INFORMATION
July 31, 2023 NAV $8.93
AVERAGE ANNUAL RETURNS AS OF JULY 31, 2023
| | | | Since | |
| | 1 Year(A) | | Inception(A) | |
| Alpha Fiduciary Quantitative Strategy Fund | (2.40)% | | (3.11)% | |
| S&P 500® Index (B) | 13.02% | | 12.10% | |
Annual Fund Operating Expense Ratio (from 11/30/2022 Prospectus): 1.77%
The Fund’s expense ratio for the period ended July 31, 2023, can be found in the financial highlights included within this report. The Annual Fund Operating Expense Ratio reported above may not correlate to the expense ratio in the Fund’s financial highlights because (a) the financial highlights include only the direct operating expenses incurred by the Fund, not the indirect costs of investing in acquired funds, and (b) the application of expense breakpoints under the Services Agreement as discussed in Note 4 in the attached financial statements.
(A) 1 Year and Since Inception returns include change in share prices and in each case includes reinvestment of any dividends and capital gain distributions. The Alpha Fiduciary Quantitative Strategy Fund went effective November 5, 2019, and commenced operations on December 31, 2019.
(B)The S&P 500® Index is a widely recognized unmanaged index of equity prices and is representative of a broader market and range of securities than is found in the Fund’s portfolio. The Index is an unmanaged benchmark that assumes reinvestment of all distributions and excludes the effect of taxes and fees. Individuals cannot invest directly in this Index; however, an individual can invest in exchange traded funds or other investment vehicles that attempt to track the performance of a benchmark index.
PAST PERFORMANCE DOES NOT GUARANTEE FUTURE RESULTS. INVESTMENT RETURN AND PRINCIPAL VALUE WILL FLUCTUATE SO THAT SHARES, WHEN REDEEMED, MAY BE WORTH MORE OR LESS THAN THEIR ORIGINAL COST. RETURNS DO NOT REFLECT THE DEDUCTION OF TAXES THAT A SHAREHOLDER WOULD PAY ON FUND DISTRIBUTIONS OR THE REDEMPTION OF FUND SHARES. CURRENT PERFORMANCE MAY BE LOWER OR HIGHER THAN THE PERFORMANCE DATA QUOTED. TO OBTAIN PERFORMANCE DATA CURRENT TO THE MOST RECENT MONTH END, PLEASE CALL 1-888-266-3996. AN INVESTMENT IN THE FUND IS SUBJECT TO INVESTMENT RISKS, INCLUDING THE POSSIBLE LOSS OF THE PRINCIPAL AMOUNT INVESTED. THE FUND'S DISTRIBUTOR IS ARBOR COURT CAPITAL, LLC.
2023 Annual Report 2
Alpha Fiduciary Quantitative Strategy Fund (Unaudited)
Alpha Fiduciary Quantitative Strategy Fund
by Sectors (as a percentage of Net Assets)
July 31, 2023
(Unaudited)
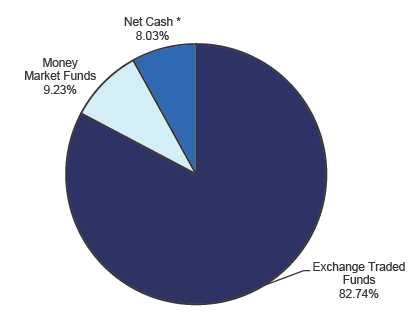
* Net Cash represents cash and other assets in excess of liabilities, including futures contracts.
Availability of Quarterly Schedule of Investments (Unaudited)
The Fund publicly files its complete schedule of portfolio holdings with the Securities and Exchange Commission (“SEC”) for the first and third quarters of each fiscal year on Form N-PORT. The Fund’s Form N-PORT is be available on the SEC’s website at http://www.sec.gov.
Proxy Voting Guidelines
(Unaudited) |
Alpha Fiduciary, Inc., the Fund’s investment adviser (“Adviser”), is responsible for exercising the voting rights associated with the securities held by the Fund. A description of the policies and procedures used by the Adviser in fulfilling this responsibility is available without charge on the Fund’s website at www.alphafiduciaryfunds.com. It is also included in the Fund’s Statement of Additional Information, which is available on the SEC’s website at http://www.sec.gov.
Form N-PX provides information regarding how the Fund voted proxies with regards to portfolio securities held during the most recent 12-month period ended June 30th and is available without charge, upon request, by calling 1-888-266-3996. This information is also available on the SEC’s website at http://www.sec.gov.
2023 Annual Report 3
Expense Example
(Unaudited) |
Shareholders of this Fund incur ongoing costs consisting of management and service fees. Although the Fund charges no sales loads or transaction fees, you will be assessed fees for outgoing wire transfers, returned checks and stop payment orders at prevailing rates charged by Mutual Shareholder Services, LLC, the Fund’s transfer agent. IRA accounts will be charged an $8.00 annual maintenance fee. Additionally, your account will be indirectly subject to the expenses of any underlying funds. The following example is intended to help you understand your ongoing costs of investing in the Fund and to compare these costs with similar costs of investing in other mutual funds. The example is based on an investment of $1,000 invested in the Fund on February 1, 2023, and held through July 31, 2023.
Actual Expenses
The first line of the table below provides information about actual account values and actual expenses. In order to estimate the expenses a shareholder paid during the period covered by this report, shareholders can divide their account value by $1,000 (for example, an $8,600 account value divided by $1,000 = 8.6) and then multiply the result by the number in the first line under the heading entitled “Expenses Paid During the Period.”
Hypothetical Example for Comparison Purposes
The second line of the table below provides information about hypothetical account values and hypothetical expenses based on the Fund’s actual expense ratio and an assumed rate of return of 5% per year before expenses, which is not the Fund’s actual return. The hypothetical account values and expenses may not be used to estimate the actual ending account balance or expenses paid by a shareholder for the period. Shareholders may use this information to compare the ongoing costs of investing in this Fund and other funds. To do so, compare this 5% hypothetical example with the 5% hypothetical examples that appear in other funds’ shareholder reports.
Please note that the expenses shown in the table are meant to highlight your ongoing costs only and do not reflect any transactional costs, the charges assessed by Mutual Shareholder Services, LLC as described above and expenses of any underlying funds. Therefore, the second line of the table is useful in comparing ongoing costs only, and will not help you determine the relative total costs of owning different funds. In addition, if these transactional costs were included, your costs would have been higher.
| | | | | | | Expenses Paid |
| | | Beginning | | Ending | | During the Period* |
| | | Account Value | | Account Value | | February 1, 2023 |
| | | February 1, 2023 | | July 31, 2023 | | to July 31, 2023 |
| |
| Actual | | $1,000.00 | | $1,025.26 | | $8.54 |
| |
| Hypothetical | | $1,000.00 | | $1,016.36 | | $8.50 |
| (5% annual return | | | | | | |
| before expenses) | | | | | | |
| * | Expenses are equal to the Fund’s annualized expense ratio of 1.70%, multiplied by the average account value over the period, multiplied by 181/365 (to reflect the one-half year period). |
| |
2023 Annual Report 4
| Alpha Fiduciary Quantitative Strategy Fund |
| |
| | | Schedule of Investments |
| | | | | July 31, 2023 |
| Shares | | Fair Value | | % of Net Assets |
| EXCHANGE TRADED FUNDS | | | | | |
| Equity | | | | | |
| 36,700 iShares Core S&P 500 ETF * | $ | 16,888,606 | | | |
| Total for Exchange Traded Funds (Cost - $13,748,780) | | 16,888,606 | | 82.74 | % |
| MONEY MARKET FUNDS | | | | | |
| 1,884,042 First American Government Obligations Fund | | 1,884,042 | | | |
| X Class 5.18% ** | | | | | |
| Total for Money Market Funds (Cost - $1,884,042) | | 1,884,042 | | 9.23 | % |
| Total Investment Securities | | 18,772,648 | | 91.97 | % |
| (Cost - $15,632,822) | | | | | |
| Other Assets in Excess of Liabilities | | 1,638,857 | | 8.03 | % |
| Net Assets | $ | 20,411,505 | | 100.00 | % |
| Alpha Fiduciary Quantitative Strategy Fund | | | | |
| |
| | | | Schedule of Futures Contracts |
| | | | | | | | | July 31, 2023 |
| | Number of | | | | | | | Unrealized | |
| | Contracts | | Expiration | | Notional | | | Appreciation/ | |
| Description | Purchased/(Sold) | | Date | | Value | | | (Depreciation) | |
| Index Futures Sold Short | | | | | | | | | |
| E-mini Standard & Poor's 500 Futures | (136) | | 9/15/2023 | | $ (31,378,600) | | | $ (310,088 | ) |
| Total | (136) | | | | $ (31,378,600) | | | $ (310,088 | ) |
* Additional Information, including current Prospectus and Annual Reports, is available at
https://www.iShares.com/us/prospectus.
** The rate shown represents the 7-day yield at July 31, 2023.
The accompanying notes are an integral part of these
financial statements. |
2023 Annual Report 5
| Alpha Fiduciary Quantitative Strategy Fund |
| | |
| Statement of Assets and Liabilities | | | | |
| July 31, 2023 | | | | |
| | |
| Assets: | | | | |
| Investment Securities at Fair Value | $ | 18,772,648 | | |
| (Cost - $15,632,822) | | | | |
| Cash | | 1,000 | | |
| Margin Deposits for Futures Contracts | | 1,972,063 | | |
| Dividends Receivable | | 5,606 | | |
| Total Assets | | 20,751,317 | | |
| Liabilities: | | | | |
| Unrealized Depreciation on Futures Contracts | | 310,088 | | |
| Management Fees Payable | | 17,485 | | |
| Service Fees Payable | | 12,239 | | |
| Total Liabilities | | 339,812 | | |
| Net Assets | $ | 20,411,505 | | |
| | |
| Net Assets Consist of: | | | | |
| Paid In Capital | $ | 29,753,986 | | |
| Distributable Earnings/(Accumulated Deficit) | | (9,342,481 | ) | |
| Net Assets, for 2,284,657 Shares Outstanding | $ | 20,411,505 | | |
| (Unlimited shares authorized) | | | | |
| Net Asset Value, Offering Price and Redemption Price Per Share | | | | |
| ($20,411,505/2,284,657 shares) | $ | 8.93 | | |
| | |
| Statement of Operations | | | | |
| For the fiscal year ended July 31, 2023 | | | | |
| | |
| Investment Income: | | | | |
| Dividend Income | $ | 361,003 | | |
| Total Investment Income | | 361,003 | | |
| Expenses: | | | | |
| Management Fees (Note 4) | | 209,112 | | |
| Service Fees (Note 4) | | 146,378 | | |
| Total Expenses | | 355,490 | | |
| | |
| Net Investment Income/(Loss) | | 5,513 | | |
| | |
| Net Realized and Unrealized Gain/(Loss) on Investments and Futures Contracts | | | | |
| Net Realized Gain/(Loss) on Investments | | (469,943 | ) | |
| Net Realized Gain/(Loss) on Futures Contracts | | (3,774,062 | ) | |
| Net Change in Unrealized Appreciation/(Depreciation) on Investments | | 2,317,715 | | |
| Net Change in Unrealized Appreciation/(Depreciation) on Futures Contracts | | 1,334,712 | | |
| Net Realized and Unrealized Gain/(Loss) on Investments and Futures Contracts | | (591,578 | ) | |
| | |
| Net Increase/(Decrease) in Net Assets from Operations | $ | (586,065 | ) | |
The accompanying notes are an integral part of these
financial statements. |
2023 Annual Report 6
| Alpha Fiduciary Quantitative Strategy Fund |
| | |
| Statements of Changes in Net Assets | | | | | | | | |
| | | 8/1/2022 | | | | 8/1/2021 | | |
| | | to | | | | to | | |
| | | 7/31/2023 | | | | 7/31/2022 | | |
| From Operations: | | | | | | | | |
| Net Investment Income/(Loss) | $ | 5,513 | | | $ | (110,826 | ) | |
| Net Realized Gain/(Loss) on Investments | | (469,943 | ) | | | 1,502,723 | | |
| Net Realized Gain/(Loss) on Futures Contracts | | (3,774,062 | ) | | | 1,517,370 | | |
| Change in Net Unrealized Appreciation/(Depreciation) on Investments | | 2,317,715 | | | | (2,411,267 | ) | |
| Change in Net Unrealized Appreciation/(Depreciation) on Futures | | | | | | | | |
| Contracts | | 1,334,712 | | | | (1,939,980 | ) | |
| Increase/(Decrease) in Net Assets from Operations | | (586,065 | ) | | | (1,441,980 | ) | |
| From Distributions to Shareholders: | | - | | | | - | | |
| From Capital Share Transactions: | | | | | | | | |
| Proceeds From Sale of Shares | | 2,208,600 | | | | 9,400,500 | | |
| Shares Issued on Reinvestment of Dividends | | - | | | | - | | |
| Cost of Shares Redeemed | | (3,178,889 | ) | | | (2,899,572 | ) | |
| Net Increase/(Decrease) from Shareholder Activity | | (970,289 | ) | | | 6,500,928 | | |
| Net Increase/(Decrease) in Net Assets | | (1,556,354 | ) | | | 5,058,948 | | |
| Net Assets at Beginning of Year | | 21,967,859 | | | | 16,908,911 | | |
| Net Assets at End of Year | $ | 20,411,505 | | | $ | 21,967,859 | | |
| Share Transactions: | | | | | | | | |
| Issued | | 251,615 | | | | 979,875 | | |
| Reinvested | | - | | | | - | | |
| Redeemed | | (368,412 | ) | | | (303,801 | ) | |
| Net Increase/(Decrease) in Shares | | (116,797 | ) | | | 676,074 | | |
| Shares Outstanding Beginning of Year | | 2,401,454 | | | | 1,725,380 | | |
| Shares Outstanding End of Year | | 2,284,657 | | | | 2,401,454 | | |
| Financial Highlights | | | | | | | | | | | | | | | | |
| Selected data for a share outstanding throughout the period: | | 8/1/2022 | | | | 8/1/2021 | | | | 8/1/2020 | | | | 12/31/2019* | | |
| | | to | | | | to | | | | to | | | | to | | |
| | | 7/31/2023 | | | | 7/31/2022 | | | | 7/31/2021 | | | | 7/31/2020 | | |
| Net Asset Value - | | | | | | | | | | | | | | | | |
| Beginning of Period | $ | 9.15 | | | $ | 9.80 | | | $ | 6.33 | | | $ | 10.00 | | |
| Net Investment Income/(Loss) (a)(e) | | - | | (f) | | (0.06 | ) | | | (0.04 | ) | | | (0.06 | ) | |
| Net Gain/(Loss) on Securities (b) | | | | | | | | | | | | | | | | |
| (Realized and Unrealized) | | (0.22 | ) | | | (0.59 | ) | | | 3.51 | | | | (3.61 | ) | |
| Total from Investment Operations | | (0.22 | ) | | | (0.65 | ) | | | 3.47 | | | | (3.67 | ) | |
| Distributions (From Net Investment Income) | | - | | | | - | | | | - | | | | - | | |
| Distributions (From Realized Capital Gains) | | - | | | | - | | | | - | | | | - | | |
| Total Distributions | | - | | | | - | | | | - | | | | - | | |
| Net Asset Value - | | | | | | | | | | | | | | | | |
| End of Period | $ | 8.93 | | | $ | 9.15 | | | $ | 9.80 | | | $ | 6.33 | | |
| Total Return (c) | | (2.40 | )% | | | (6.63 | )% | | | 54.82 | % | | | (36.70 | )% | ** |
| Ratios/Supplemental Data | | | | | | | | | | | | | | | | |
| Net Assets - End of Period (Thousands) | $ | 20,412 | | | $ | 21,968 | | | $ | 16,909 | | | $ | 10,768 | | |
| Ratio of Expenses to Average Net Assets (d) | | 1.70 | % | | | 1.70 | % | | | 1.70 | % | | | 1.65 | % | *** |
| Ratio of Net Investment Income/(Loss) to Average Net Assets (d)(e) | | 0.03 | % | | | (0.59 | )% | | | (0.50 | )% | | | (1.39 | )% | *** |
| Portfolio Turnover Rate | | 10.60 | % | | | 67.50 | % | | | 59.13 | % | | | 464.61 | % | ** |
| | * Commencement of Investment Operations.
** Not Annualized.
*** Annualized.
(a) Per share amounts were calculated using the average shares method.
(b) Realized and unrealized gains and losses per share in this caption are balancing amounts necessary to
reconcile the change in net asset value for the period, and may not reconcile with the aggregate gains and
losses in the Statement of Operations due to share transactions for the period.
(c) Total return represents the rate that the investor would have earned or lost on an investment in the Fund
assuming reinvestment of dividends and distributions, if any.
(d) These ratios exclude the impact of expenses of the underlying investment security holdings (ETFs) listed in
the Schedule of Investments.
(e) Recognition of the net investment income/(loss) by the Fund is affected by the timing of the declaration of
dividends by the underlying investment security holdings listed on the Schedule of Investments.
(f) Less than $0.005. |
The accompanying notes are an integral part of these
financial statements. |
2023 Annual Report 7
NOTES TO THE FINANCIAL STATEMENTS
ALPHA FIDUCIARY QUANTITATIVE STRATEGY FUND
July 31, 2023
1.) ORGANIZATION
Alpha Fiduciary Quantitative Strategy Fund (the “Fund”) was organized as a non-diversified series of the PFS Funds (the “Trust”) on June 11, 2019. The Fund went effective on November 5, 2019, but did not commence investing in line with its objectives until December 31, 2019. The Trust was established under the laws of Massachusetts by an Agreement and Declaration of Trust dated January 13, 2000, which was amended and restated January 20, 2011. The Trust is registered as an open-end investment company under the Investment Company Act of 1940, as amended (the “1940 Act”). The Trust may offer an unlimited number of shares of beneficial interest in a number of separate series, each series representing a distinct fund with its own investment objectives and policies. As of July 31, 2023, there were thirteen series authorized by the Trust. The Fund’s investment objective is to seek long-term capital appreciation. The Fund pursues its investment objective using a quantitative strategy by investing primarily in a portfolio of exchange traded funds (“ETFs”) and equity index futures. The investment adviser to the Fund is Alpha Fiduciary, Inc. (the “Adviser”). Significant accounting policies of the Fund are presented below.
2.) SIGNIFICANT ACCOUNTING POLICIES
The Fund is an investment company and accordingly follows the investment company accounting and reporting guidance of the Financial Accounting Standards Board (“FASB”) Accounting Standards Codification Topic 946 Financial Services - Investment Companies. The financial statements are prepared in conformity with accounting principles generally accepted in the United States of America (“GAAP”). The Fund follows the significant accounting policies described in this section.
SECURITY VALUATION:
All investments in securities are valued as described in Note 3. The Trust’s Board of Trustees (“Board”) has designated the Adviser as “Valuation Designee” pursuant to Rule 2a-5 under the 1940 Act.
SHARE VALUATION:
The net asset value (“NAV”) is generally calculated as of the close of trading on the New York Stock Exchange (the “Exchange”) (normally 4:00 p.m. Eastern time) every day the Exchange is open. The NAV is calculated by taking the total value of the Fund’s assets, subtracting its liabilities, and then dividing by the total number of shares outstanding, rounded to the nearest cent. The offering price and redemption price per share is equal to the NAV per share.
FUTURES:
The Fund may buy and sell stock index futures contracts. A stock index futures contract obligates the seller to deliver (and the buyer to take) an amount of cash equal to a specific dollar amount times the difference between the value of a specific stock index at the close of the last trading day of the contract and the price at which the agreement was made. To the extent the Fund enters into a futures contract, it will deposit with the broker cash, cash equivalents or U.S. Treasury obligations equal to a specified percentage of the value of the futures contract (the initial margin), as required by the relevant contract market and futures commission merchant. The futures contract will be marked to market daily. Should the value of the futures contract decline relative to the Fund’s position, the Fund, if required by law, will pay the futures commission merchant an amount equal to the change in value to maintain its appropriate margin balance. When the contract is closed, the Fund records a realized gain or loss equal to the difference between the proceeds from (or cost of) the closing transaction and the Fund’s basis in the contract. The use of futures transactions involves the risk of imperfect correlation in movements in the price of futures contracts, interest rates, and the underlying hedged assets. The Fund may sell stock index futures contracts in anticipation of or during a market decline to attempt to offset the decrease in market value of its long positions in equity securities that might otherwise result. When the Fund is not fully invested in equity securities and anticipates a significant market advance, it may buy stock index futures in order to gain rapid market exposure that may in part or entirely offset increases in the cost of equity securities that it intends to buy. With futures, there is minimal counterparty credit risk to the Fund since futures are exchange traded and the exchange’s clearinghouse, as coun-terparty to all exchange traded futures, guarantees the futures against default.
2023 Annual Report 8
Notes to the Financial Statements - continued
FEDERAL INCOME TAXES:
The Fund’s policy is to continue to comply with the requirements of the Internal Revenue Code that are applicable to regulated investment companies and to distribute all of its taxable income to shareholders. Therefore, no federal income tax provision is required. It is the Fund’s policy to distribute annually, prior to the end of the calendar year, dividends sufficient to satisfy excise tax requirements of the Internal Revenue Code. This Internal Revenue Code requirement may cause an excess of distributions over the book year-end accumulated income. In addition, it is the Fund’s policy to distribute annually, after the end of the fiscal year, any remaining net investment income and net realized capital gains.
The Fund recognizes the tax benefits of certain tax positions only where the position is “more likely than not” to be sustained assuming examination by tax authorities. Management has analyzed the Fund’s tax positions, and has concluded that no liability for unrecognized tax benefits should be recorded related to uncertain tax positions taken on returns filed for open tax years. The Fund identifies its major tax jurisdictions as U.S. Federal and State tax authorities; however, the Fund is not aware of any tax positions for which it is reasonably possible that the total amounts of unrecognized tax benefits will change materially in the next twelve months. The Fund recognizes interest and penalties, if any, related to unrecognized tax benefits as income tax expense in the Statement of Operations. During the fiscal year ended July 31, 2023, the Fund did not incur any interest or penalties.
DISTRIBUTIONS TO SHAREHOLDERS:
Distributions to shareholders, which are determined in accordance with income tax regulations, are recorded on the ex-dividend date.
The treatment for financial reporting purposes of distributions made to shareholders during the period from net investment income or net realized capital gains may differ from their ultimate treatment for federal income tax purposes. These differences are caused primarily by differences in the timing of the recognition of certain components of income, expense, or realized capital gain for federal income tax purposes. Where such differences are permanent in nature, they are reclassified in the components of the net assets based on their ultimate characterization for federal income tax purposes. Any such reclassifications will have no effect on net assets, results of operations, or net asset value per share of the Fund.
USE OF ESTIMATES:
The financial statements are prepared in accordance with GAAP, which requires management to make estimates and assumptions that affect the reported amounts of assets and liabilities and disclosure of contingent assets and liabilities at the date of the financial statements and the reported amounts of increases and decreases in net assets from operations during the reporting period. Actual results could differ from those estimates.
OTHER:
The Fund records security transactions based on a trade date for financial statement reporting purposes. Dividend income is recognized on the ex-dividend date, and interest income, if any, is recognized on an accrual basis. The Fund uses the specific identification method in computing gain or loss on the sale of investment securities. Long-term capital gain distributions are recorded as capital gain distributions from investment companies, and short-term capital gain distributions are recorded as dividend income. Withholding taxes on foreign dividends, if any, are provided for in accordance with the Fund’s understanding of the applicable country’s tax rules and rates.
ALLOCATION OF EXPENSES:
Expenses incurred by the Trust that don’t relate to a specific fund of the Trust are allocated pro-rata to the funds based on the total number of funds in the Trust at the time the expense was incurred or by another appropriate method.
3.) SECURITIES VALUATIONS
The Fund utilizes various methods to measure the fair value of its investments on a recurring basis. GAAP establishes a hierarchy that prioritizes inputs to valuation methods. The three levels of inputs are:
Level 1 - Unadjusted quoted prices in active markets for identical assets or liabilities that the Fund has the ability to access.
2023 Annual Report 9
Notes to the Financial Statements - continued
Level 2 - Observable inputs other than quoted prices included in level 1 that are observable for the asset or liability, either directly or indirectly. These inputs may include quoted prices for the identical instrument on an inactive market, prices for similar instruments, interest rates, prepayment speeds, credit risk, yield curves, default rates and similar data.
Level 3 - Unobservable inputs for the asset or liability, to the extent relevant observable inputs are not available, representing the Fund’s own assumptions about the assumptions a market participant would use in valuing the asset or liability, and would be based on the best information available.
The availability of observable inputs can vary from security to security and is affected by a wide variety of factors, including, for example, the type of security, whether the security is new and not yet established in the marketplace, the liquidity of markets, and other characteristics particular to the security. To the extent that valuation is based on models or inputs that are less observable or unobservable in the market, the determination of fair value requires more judgment. Accordingly, the degree of judgment exercised in determining fair value is greatest for instruments categorized in level 3.
The inputs used to measure fair value may fall into different levels of the fair value hierarchy. In such cases, for disclosure purposes, the level in the fair value hierarchy within which the fair value measurement falls in its entirety, is determined based on the lowest level input that is significant to the fair value measurement in its entirety.
VALUATION OF FUND ASSETS:
A description of the valuation techniques applied to the Fund’s major categories of assets and liabilities measured at fair value on a recurring basis follows.
Equity securities (including exchange traded funds). Equity securities generally are valued by using market quotations, but may be valued on the basis of prices furnished by a pricing service when the Valuation Designee believes such prices accurately reflect the fair value of such securities. Securities that are traded on any stock exchange or on the NASDAQ over-the-counter market are generally valued by the pricing service at the last quoted sale price. Lacking a last sale price, an equity security is generally valued by the pricing service at its last bid price. Generally, if the security is traded in an active market and is valued at the last sale price, the security is categorized as a level 1 security, and if an equity security is valued by the pricing service at its last bid, it is generally categorized as a level 2 security. When market quotations are not readily available, when the Valuation Designee determines that the market quotation or the price provided by the pricing service does not accurately reflect the current fair value, or when restricted securities are being valued, such securities are valued as determined in good faith by the valuation committee, which includes the Valuation Designee, subject to review of the Board and are categorized in level 2 or level 3, when appropriate.
Derivative Instruments (including futures contracts). Listed derivative instruments that are actively traded, including futures contracts, are valued based on quoted prices from the exchange and are categorized as Level 1 of the fair value hierarchy. Lacking a last sale price, a derivative held long is generally valued by the pricing service at its last bid price and a derivative held short is generally valued by the pricing service at its last ask price and are generally categorized as a level 2 security. If there is not a bid or ask price on the primary exchange on which the future trades, the future will be valued at fair value as determined in good faith by the Valuation Committee which includes the Valuation Designee, subject to review of the Board and are categorized in level 2 or level 3, when appropriate.
Money market funds. Money market funds are valued at net asset value and are classified as level 1 of the fair value hierarchy.
In accordance with the Trust’s good faith pricing guidelines, the Valuation Designee is required to consider all appropriate factors relevant to the value of securities for which it has determined other pricing sources are not available or reliable as described above. There is no single standard for determining fair value, since fair value depends upon the circumstances of each individual case. As a general principle, the current fair value of an issue of securities being valued by the Valuation Designee would appear to be the amount which the owner might reasonably expect to receive for them upon their current sale. Methods which are in accordance with this principle may, for example, be based on (i) a multiple of earnings; (ii) a discount from market of a similar freely traded security (including a derivative security or a basket of securities traded on other mar-
2023 Annual Report 10
Notes to the Financial Statements - continued
kets, exchanges or among dealers); or (iii) yield to maturity with respect to debt issues, or a combination of these and other methods. The Board maintains responsibilities for the fair value determinations under Rule 2a-5 under the 1940 Act and oversees the Valuation Designee.
The following table summarizes the inputs used to value the Fund’s assets/(liabilities) measured at fair value as of July 31, 2023:
| Valuation Inputs of Assets/(Liabilities) | | | | | | | |
| |
| | | Level 1 | | Level 2 | | Level 3 | | Total | |
| Exchange Traded Funds | | $16,888,606 | | $0 | | $0 | | $16,888,606 | |
| Money Market Funds | | 1,884,042 | | 0 | | 0 | | 1,884,042 | |
| Total Investment Securities | | $18,772,648 | | $0 | | $0 | | $18,772,648 | |
| |
| Futures Contracts – Sold Short | | $ (310,088) | | $0 | | $0 | | $ (310,008) | |
The Fund did not hold any Level 3 assets during the fiscal year ended July 31, 2023. Futures contracts include unrealized gain/(loss) on contracts open at July 31, 2023.
4.) INVESTMENT ADVISORY AGREEMENT AND SERVICES AGREEMENT
The Fund has entered into an investment advisory agreement (“Management Agreement”) with the Adviser. The Adviser manages the investment portfolio of the Fund, subject to the policies adopted by the Trust’s Board of Trustees. Under the Management Agreement, the Adviser, at its own expense and without reimbursement from the Trust, furnishes office space and all necessary office facilities, equipment and executive personnel necessary for managing the assets of the Fund. The Adviser receives an investment management fee equal to 1.00% of the Fund’s average daily net assets.
For the fiscal year ended July 31, 2023, the Adviser earned management fees totaling $209,112. At July 31, 2023, the Fund owed $17,485 to the Adviser.
Additionally, the Fund has a Services Agreement with the Adviser (the “Services Agreement”). Under the Services Agreement the Adviser receives an additional fee of 0.70% of the Fund’s average daily net assets up to $25 million, 0.35% of the Fund’s average daily net assets from $25 million to $100 million, and 0.25% of such assets in excess of $100 million and is obligated to pay the operating expenses of the Fund excluding management fees, brokerage fees and commissions, 12b-1 fees (if any), taxes, borrowing costs (such as (a) interest and (b) dividend expenses on securities sold short), ADR fees, the cost of acquired funds and extraordinary expenses. Additionally, under the Services Agreement the Adviser supervises the Fund’s business affairs. The Adviser coordinates for the provision of the services of a Chief Compliance Officer for the Trust with respect to the Fund, executive and administrative services including, but are not limited to, the coordination of all third parties furnishing services to the Fund, review of the books and records of the Fund maintained by such third parties, and such other actions with respect to the Fund as may be necessary in the opinion of the Adviser to perform its duties under the Services Agreement.
For the fiscal year ended July 31, 2023, the Adviser earned services fees of $146,378. At July 31, 2023, the Fund owed the Adviser services fees of $12,239.
5.) DERIVATIVE TRANSACTIONS
The fair value of derivative instruments, not accounted for as hedging instruments, as reported within the Statement of Assets and Liabilities as of July 31, 2023, was as follows:
| Unrealized Appreciation/(Depreciation) on Derivatives |
| | | | |
| | | | Value of Unrealized | |
| | Statement of Assets and Liabilities | | Appreciation/ | |
| Type of Derivative / Risk | Location | | (Depreciation) | |
| | Unrealized Depreciation on Futures | | | |
| Equity Contracts | Contracts | | ($310,088) | |
Realized and unrealized gains and losses on derivative contracts entered during the fiscal year ended July 31, 2023, by the Fund are recorded in the following locations in the Statement of Operations:
2023 Annual Report 11
| Notes to the Financial Statements - continued | | |
| |
| | | | | | | | Unrealized |
| | | | Realized | | | | Appreciation/ |
| | Location | | Gain/(Loss) | | Location | | (Depreciation) |
| Futures | Net Realized Gain/ | | | | Net Change in Unrealized | | |
| Contracts | (Loss) on Futures | | $(474,599) | | Appreciation/(Depreciation) | | $– |
| Purchased | Contracts | | | | on Futures Contracts | | |
| |
| Futures | Net Realized Gain/ | | | | Net Change in Unrealized | | |
| Contracts | (Loss) on Futures | | $(3,299,463) | | Appreciation/(Depreciation) | | $1,334,712 |
| Sold | Contracts | | | | on Futures Contracts | | |
During the fiscal year ended July 31, 2023, the average monthly notional value of the futures contracts purchased long and futures contracts sold short were $725,025 and $(19,003,746), respectively.
The table below reflects the offsetting assets and liabilities relating to futures contracts as shown on the Statement of Assets and Liabilities as of July 31, 2023:
| | | | | | | Gross Amounts Not Offset | |
| | | | | | | in the Statement of Assets | |
| | | | | | | and Liabilities | |
| | | | | Net Amounts | | | | | |
| | | | | Presented in | | | | Cash | |
| Gross Amounts of | | Gross Amounts Offset in | | the Statement | | | | Collateral | |
| Recognized | | the Statement of Assets | | of Assets and | | Financial | | Pledged/ | |
| Assets/(Liabilities) | | and Liabilities | | Liabilities | | Instruments | | (Received) | Net Amount |
| ($310,088) | | $0 | | ($310,088) | | $0 | | $310,088* | $0 |
* The amount is limited to the derivative liability balance and accordingly does not include excess collateral pledged.
6.) RELATED PARTY TRANSACTIONS
Certain officers and a Trustee of the Trust are also officers of Premier Fund Solutions (the “Administrator”). These individuals are not paid any fees directly by the Fund for serving in such capacity. These individuals receive benefits from the Administrator resulting from administration fees paid to the Administrator by the Adviser.
The Trustees who are not interested persons of the Fund were each paid $1,500, for a total of $6,000, in Trustees’ fees for the fiscal year ended July 31, 2023. These fees were paid by the Adviser.
7.) CONTROL OWNERSHIP
The beneficial ownership, either directly or indirectly, of more than 25% of the voting securities of a fund creates a presumption of control of the fund, under Section 2(a)(9) of the 1940 Act. As of July 31, 2023, TD Ameritrade, Inc., held for the benefit of its customers, in the aggregate, 90.67% of Fund shares.
8.) INVESTMENT TRANSACTIONS
For the fiscal year ended July 31, 2023, purchases and sales of investment securities other than U.S. Government obligations and short-term investments aggregated $1,797,870 and $5,441,063, respectively. Purchases and sales of U.S. Government obligations aggregated $0 and $0, respectively.
9.) TAX MATTERS
For Federal income tax purposes, the cost of investment securities owned at July 31, 2023, was $15,889,332.
At July 31, 2023, the composition of gross unrealized appreciation (the excess of value over tax cost) and depreciation (the excess of tax cost over value) of investments on a tax basis was as follows:
2023 Annual Report 12
| Notes to the Financial Statements - continued | | |
| |
| | Appreciation | | (Depreciation) | | Net Appreciation (Depreciation) |
| | $2,883,741 | | $(425) | | $2,883,316 |
The Fund did not pay any distributions during the fiscal years ended July 31, 2022 and July 31, 2023.
As of July 31, 2023, the components of distributable earnings (accumulated losses) on a tax basis were as follows:
| Other Accumulated Gains/(Accumulated Losses) | $ | (12,225,797 | ) |
| Unrealized Appreciation/(Depreciation) – Net | | 2,883,316 | |
| | $ | (9,342,481 | ) |
As of July 31, 2023, other accumulated gains/(accumulated losses) included losses on straddles of $2,883,741, deferred late year ordinary losses of $29,857 and an available unused capital loss carryforward of $9,312,199. For Federal tax purposes, $8,095,213 of the capital loss carryforward is short-term with no expiration and $1,216,986 is long-term with no expiration. As of July 31, 2023, the difference between book and tax basis unrealized appreciation (depreciation) – net was primarily related to the tax deferral of losses on wash sales.
For the fiscal year ended July 31, 2023, the following reclassification was recorded and was primarily attributed to the reclassification of net operating loss.
| Paid In Capital | $ | (45,121 | ) |
| Total Distributable Earnings | $ | 45,121 | |
10.) RISKS TO CONSIDER
Futures Contract Risk. The successful use of futures contracts draws upon the Adviser’s skill and experience with respect to such instruments and is subject to special risk considerations. The primary risks associated with the use of futures contracts, which may adversely affect the Fund’s net asset value and total return, are the imperfect correlation between the change in market value of the futures contract held by the Fund and the price of the futures contract; (b) possible lack of a liquid secondary market for a futures contract and the resulting inability to close a futures contract when desired; (c) losses caused by unanticipated market movements, which are potentially unlimited; (d) the Adviser’s inability to predict correctly the direction of securities prices; (e) the possibility that the counterparty will default in the performance of its obligations; and (f) if the Fund has insufficient cash, it may have to sell securities from its portfolio to meet daily variation margin requirements, and the Fund may have to sell securities at a time when it may be disadvantageous to do so. The Fund’s use of futures contracts for the purpose of increasing the Fund’s long and/or short exposure creates leverage, which can magnify the Fund’s potential for gain or loss and therefore amplify the effect of market volatility on the Fund’s share price.
Leveraging Risk. The Fund’s use of futures contracts will have the economic effect of financial leverage. Financial leverage magnifies exposure to the swings in prices of an asset class underlying an instrument and results in increased volatility, which means the Fund will have the potential for greater gains, as well as the potential for greater losses, than if the Fund does not use instruments that have a leveraging effect. For example, if the Adviser seeks to gain enhanced exposure to a specific asset class through an instrument providing leveraged exposure to the asset class and that instrument increases in value, the gain to the Fund will be magnified; however, if that investment decreases in value, the loss to the Fund will be magnified. A decline in the Fund’s assets due to losses magnified by the instruments providing leveraged exposure may require the Fund to liquidate portfolio positions to satisfy its obligations, to meet redemption requests or to meet asset segregation requirements when it may not be advantageous to do so. There is no assurance that the Fund’s use of instruments providing enhanced exposure will enable the Fund to achieve its investment objective.
Risks of Exchange Traded Funds. Investment in an ETF carries security-specific risk and market risk. Also, if the area of the market representing the underlying index or benchmark does not perform as expected for any reason, the value of the investment in the ETF may decline. In addition, due to transactions via market prices rather than at net asset value, the performance of an ETF may not completely replicate the performance of the underlying index. The Fund will indirectly pay its proportionate share of any fees and expenses paid by the ETF in which it invests in addition to the fees and expenses paid directly by the Fund, many of which may be duplicative. The Fund also will incur brokerage costs when it purchases ETFs. As a result, the cost of investing in the
2023 Annual Report 13
Notes to the Financial Statements - continued
Fund generally will be higher than the cost of investing directly in ETFs. Additionally, ETFs are subject to the following risks: (i) the market price of an ETF’s shares may be above or below its net asset value; (ii) an active trading market for an ETF’s shares may not develop or be maintained; (iii) the ETF may employ an investment strategy that utilizes high leverage ratios; (iv) trading of an ETF’s shares may be halted if the listing exchange’s officials deem such action appropriate; and (v) underlying ETF shares may be de-listed from the exchange or the activation of market-wide “circuit breakers” (which are tied to large decreases in stock prices) temporarily stop stock trading.
Risk of Non-Diversification. The Fund is a non-diversified fund, which means that it has the ability to take larger positions in a smaller number of securities than a fund that is “diversified.” Non-diversification increases the risk that the value of the Fund could go down because of the poor performance of a single investment. The Fund may invest a significant percentage of its assets in a single ETF, ETN and/or money market fund, and at times may hold only one such position along with a cash or cash equivalent position.
11.) CONTINGENCIES AND COMMITMENTS
The Trust indemnifies its officers and the Board for certain liabilities that may arise from the performance of their duties to the Trust. Additionally, in the normal course of business, the Fund enters into contracts that contain a variety of representations and warranties and which provide general indemnities. The Fund’s maximum exposure under these arrangements is unknown, as this would involve future claims that may be made against the Fund that have not yet occurred. However, based on experience, the risk of loss due to these warranties and indemnities appears to be remote.
12.) SUBSEQUENT EVENTS
Subsequent events after the date of the Statement of Assets and Liabilities have been evaluated through the date the financial statements were issued. Management has concluded that there is no impact requiring adjustment to or disclosure in the financial statements.
2023 Annual Report 14
REPORT OF INDEPENDENT REGISTERED PUBLIC ACCOUNTING FIRM
To the Shareholders of Alpha Fiduciary Quantitative Strategy Fund and
Board of Trustees of PFS Funds
Opinion on the Financial Statements
We have audited the accompanying statement of assets and liabilities, including the schedules of investments and futures contracts, of Alpha Fiduciary Quantitative Strategy Fund (the “Fund”), a series of PFS Funds, as of July 31, 2023, the related statement of operations for the year then ended, the statements of changes in net assets for each of the two years in the period then ended, the related notes, and the financial highlights for the years ended July 31, 2023, 2022, 2021 and the period from December 31, 2019 (commencement of operations) through July 31, 2020 (collectively referred to as the “financial statements”). In our opinion, the financial statements present fairly, in all material respects, the financial position of the Fund as of July 31, 2023, the results of its operations for the year then ended, the changes in net assets for each of the two years in the period then ended, and the financial highlights for each of the periods indicated above, in conformity with accounting principles generally accepted in the United States of America.
Basis for Opinion
These financial statements are the responsibility of the Fund’s management. Our responsibility is to express an opinion on the Fund’s financial statements based on our audits. We are a public accounting firm registered with the Public Company Accounting Oversight Board (United States) (“PCAOB”) and are required to be independent with respect to the Fund in accordance with the U.S. federal securities laws and the applicable rules and regulations of the Securities and Exchange Commission and the PCAOB.
We conducted our audits in accordance with the standards of the PCAOB. Those standards require that we plan and perform the audit to obtain reasonable assurance about whether the financial statements are free of material misstatement whether due to error or fraud.
Our audits included performing procedures to assess the risks of material misstatement of the financial statements, whether due to error or fraud, and performing procedures that respond to those risks. Such procedures included examining, on a test basis, evidence regarding the amounts and disclosures in the financial statements. Our procedures included confirmation of securities owned as of July 31, 2023, by correspondence with the custodian and broker. Our audits also included evaluating the accounting principles used and significant estimates made by management, as well as evaluating the overall presentation of the financial statements. We believe that our audits provide a reasonable basis for our opinion.
We have served as the Fund’s auditor since 2019.

COHEN & COMPANY, LTD.
Milwaukee, Wisconsin
September 26, 2023
2023 Annual Report 15
This page was intentionally left blank.
2023 Annual Report 16
Trustees and Officers
(Unaudited) |
The Board of Trustees supervises the business activities of the Trust. The names of the Trustees and executive officers of the Trust are shown below. For more information regarding the Trustees, please refer to the Statement of Additional Information, which is available upon request by calling 1-888-266-3996. Each Trustee serves until the Trustee sooner dies, resigns, retires, or is removed.
The Trustees and Officers of the Trust and their principal business activities during the past five years are:
| Interested Trustees and Officers | | | | |
| |
| | | | | Number of | |
| | | | Principal | Portfolios In | Other |
| Name, | Position(s) | Term of Office | Occupation(s) | Fund | Directorships |
| Address(1), | Held With | and Length of | During | Complex | Held By |
| and Year of Birth | the Trust | Time Served | Past 5 Years | Overseen By | Trustee |
| | | | | Trustee | |
| |
| James D. Craft, | President | Indefinite Term; | Fund Administrator, Premier Fund | N/A | N/A |
| Year of Birth: 1982 | | Since 2023 | Solutions, Inc. (2007 to current); | | |
| | | | Chief Technology Officer, Premier | | |
| | | | Fund Solutions, Inc. (2011 to cur- | | |
| rent). |
| |
| Jeffrey R. Provence(2), | Trustee, | Indefinite Term; | CEO, Premier Fund Solutions, Inc. | 13 | Blue Chip |
| Year of Birth: 1969 | Secretary | Since 2000 | (2001 to current). General Partner | | Investor Funds, |
| | and | | and Portfolio Manager for Value | | Meeder Funds |
| | Treasurer | | Trend Capital Management, LP | | |
| | | | (1995 to current). | | |
| |
| Julian G. Winters, | Chief | Indefinite Term; | Managing Member, Watermark | N/A | N/A |
| Year of Birth: 1968 | Compliance | Since 2010 | Solutions LLC (investment compli- | | |
| | Officer | | ance and consulting) (2007 to cur- | | |
| rent). |
(1) The address of each trustee and officer is c/o PFS Funds, 1939 Friendship Drive, Suite C, El Cajon, California 92020.
(2) Jeffrey R. Provence is considered an “interested person” as defined in Section 2(a)(19) of the 1940 Act by virtue of his position with the Trust.
Independent Trustees
| | | | | Number of | |
| | | | Principal | Portfolios In | Other |
| Name, | Position | Term of Office | Occupation(s) | Fund | Directorships |
| Address(1), | Held With | and Length of | During | Complex | Held By |
| and Year of Birth | the Trust | Time Served | Past 5 Years | Overseen By | Trustee |
| | | | | Trustee | |
| |
| Thomas H. Addis III, | Independent | Indefinite Term; | Executive Director/CEO, Southern | 13 | None |
| Year of Birth: 1945 | Trustee | Since 2000 | California PGA (2006 to current). | | |
| |
| Robert L. Boerner, | Independent | Indefinite Term; | Owner / Broker of Gecko Realty | 13 | None |
| Year of Birth: 1969 | Trustee | Since 2022 | (2008 to current). | | |
| |
| Allen C. Brown, | Independent | Indefinite Term; | Retired. Law Office of Allen C. | 13 | Blue Chip |
| Year of Birth: 1943 | Trustee | Since 2010 | Brown, estate planning and business | | Investor Funds |
| | | | attorney (1970 to 2021). | | |
| |
| John W. Czechowicz, | Independent | Indefinite Term; | CPA at CWDL (2016 to current). | 13 | None |
| Year of Birth: 1983 | Trustee | Since 2022 | | | |
(1) The address of each trustee and officer is c/o PFS Funds, 1939 Friendship Drive, Suite C, El Cajon, California 92020.
2023 Annual Report 17
Investment Adviser
Alpha Fiduciary, Inc.
Legal Counsel
Practus, LLP
Custodian
US Bank, N.A.
Distributor
Arbor Court Capital, LLC
Dividend Paying Agent,
Shareholders' Servicing Agent,
Transfer Agent
Mutual Shareholder Services, LLC
Fund Administrator
Premier Fund Solutions, Inc.
Independent Registered Public Accounting Firm
Cohen & Company, Ltd. |
This report is provided for the general information of the shareholders of the Alpha
Fiduciary Quantitative Strategy Fund. This report is not intended for distribution to
prospective investors in the Fund, unless preceded or accompanied by an effective
prospectus. |
Alpha Fiduciary Quantitative Strategy Fund
www.alphafiduciaryfunds.com
1-888-266-3996
Item 2. Code of Ethics.
The registrant has adopted a code of ethics that applies to the registrant’s principal executive officer and the principal financial officer. The registrant has not made any amendments to its code of ethics during the covered period. The registrant has not granted any waivers from any provisions of the code of ethics during the covered period. A copy of the registrant’s Code of Ethics is filed herewith.
Item 3. Audit Committee Financial Expert.
The registrant's Board of Trustees has determined that John W. Czechowicz is an audit committee financial expert. Mr. Czechowicz is independent for purposes of this Item 3.
Item 4. Principal Accountant Fees and Services.
(a-d) The following table details the aggregate fees billed for each of the last two fiscal years for audit fees, audit-related fees, tax fees and other fees by the principal accountant to the registrant. The principal accountant has provided no services to the adviser or any entity controlled by, or under common control with the adviser that provides ongoing services to the registrant.
| | | FYE 7/31/2023 | | FYE 7/31/2022 |
| Audit Fees | | $15,250 | | $15,250 |
| Audit-Related Fees | | $0 | | $0 |
| Tax Fees | | $3,500 | | $3,000 |
| All Other Fees | | $750 | | $750 |
Nature of Tax Fees: preparation of Excise Tax Statement and 1120 RIC.
All Other Fees: Semi-Annual Reports Review
(e) (1) The audit committee approves all audit and non-audit related services and, therefore, has not adopted pre-approval policies and procedures described in paragraph (c)(7) of Rule 2-01 of Regulation S-X.
(e) (2) None of the services described in paragraph (b) through (d) of this Item were approved by the audit committee pursuant to paragraph (c)(7)(i)(C) of Rule 2-01 of Regulation S-X.
(f) All of the principal accountant’s hours spent on auditing the registrant’s financial statements were attributed to work performed by full-time permanent employees of the principal accountant.
(g) The following table indicates the aggregate non-audit fees billed by the registrant’s principal accountant for services to the registrant , the registrant’s investment adviser (not sub-adviser), and any entity controlling, controlled by, or under common control with the adviser that provides ongoing services to the registrant, for the last two years.
| Non-Audit Fees | | FYE 7/31/2023 | | FYE 7/31/2022 |
| Registrant | | $4,250 | | $3,750 |
| Registrant’s Investment Adviser | | $0 | | $0 |
(h) The principal accountant provided no services to the investment adviser or any entity controlling, controlled by, or under common control with the adviser that provides ongoing services to the registrant.
(i) Not applicable.
(j) Not applicable.
Item 5. Audit Committee of Listed Companies. Not applicable.
Item 6. Investments.
(a) Not applicable. Schedule filed with Item 1.
(b) Not applicable.
Item 7. Disclosure of Proxy Voting Policies and Procedures for Closed-End Management Investment Companies. Not applicable.
Item 8. Portfolio Managers of Closed End Management Investment Companies. Not applicable.
Item 9. Purchases of Equity Securities by Closed-End Management Investment Companies and Affiliated Purchasers. Not applicable.
Item 10. Submission of Matters to a Vote of Security Holders.
The registrant has not adopted procedures by which shareholders may recommend nominees to the registrant’s board of trustees.
Item 11. Controls and Procedures.
(a) The Registrant’s president and chief financial officer concluded that the disclosure controls and procedures (as defined in Rule 30a-3(c) under the Act (17 CFR 270.30a -3(c))) as of a date within 90 days of the filing date of the report that includes the disclosure required by this paragraph, based on the evaluation of these controls and procedures required by Rule 30a-3(b) under the Act (17 CFR 270.30a -3(b)) and Rules 13a-15(b) or 15d-15(b) under the Exchange Act (17 CFR 240.13a -15(b) or 240.15d -15(b)).
(b) There were no changes in the registrant’s internal control over financial reporting (as defined in Rule 30a-3(d) under the Act (17 CFR 270.30a -3(d)) that occurred during the period covered by this report that has materially affected, or is reasonably likely to materially affect, the registrant’s internal control over financial reporting.
Item 12. Disclosure of Securities Lending Activities for Closed-End Management Investment Companies.
Not applicable.
Item 13. Exhibits.
(a)(1) Code of Ethics. Filed herewith.
(a)(2) Certifications pursuant to Section 302 of the Sarbanes-Oxley Act of 2002. Filed herewith.
(a)(3) Not applicable.
(a)(4) Not applicable.
(b) Certification pursuant to Section 906 of the Sarbanes-Oxley Act of 2002. Filed herewith.
Pursuant to the requirements of the Securities Exchange Act of 1934 and the Investment Company Act of 1940, the registrant has duly caused this report to be signed on its behalf by the undersigned, thereunto duly authorized.
| | By: /s/James Craft
James Craft
President |
Pursuant to the requirements of the Securities Exchange Act of 1934 and the Investment Company Act of 1940, this report has been signed below by the following persons on behalf of the registrant and in the capacities and on the dates indicated.
| | By: /s/James Craft
James Craft
President |
| | By: /s/Jeffrey R. Provence
Jeffrey R. Provence
Chief Financial Officer |