UNITED STATES
SECURITIES AND EXCHANGE COMMISSION
WASHINGTON, D.C. 20549
CERTIFIED SHAREHOLDER REPORT OF REGISTERED MANAGEMENT
INVESTMENT COMPANIES
Investment Company Act file number 811-09781
PFS Funds
(Exact name of registrant as specified in charter)
1939 Friendship Drive, Suite C, El Cajon, CA 92020
(Address of principal executive offices) (Zip code)
CT Corporation System
155 Federal St., Suite 700, Boston, MA 02110
(Name and address of agent for service)
Registrant’s telephone number, including area code: (619) 588-9700
Date of fiscal year end: December 31
Date of reporting period: December 31, 2023
Item 1. Report to Stockholders.

Annual Report
December 31, 2023
BRTNX
February 9, 2024
Dear Fellow Shareholders:
On October 17, 2022, a widely read Bloomberg headline declared, “Forecast for US Recession Within Year Hits 100%,” and the article calmly informed readers that “a US recession is effectively certain in the next 12 months.” The Federal Reserve was going to raise interest rates multiple times, which was going to hammer consumer spending, squeeze corporate profits, and trigger a recession—all necessary evils to slay inflation. Many stock market prognosticators predicted another down year.
When it comes to economic and stock market predictions, no one knows anything—and that’s perfectly fine. For the most part, we restrict our predictions to the micro. Will people keep buying discounted brand-name clothes at T.J. Maxx, or will they shift to fast fashion online retailers from China? Will consumers ditch their Visa cards for payment apps? Will corporate IT departments shift their computing to startups and away from Microsoft? These aren’t easy questions to answer, but they’re infinitely more manageable than “How much will the output of the entire US economy grow over the next 365 days, and what multiple will stock market investors in aggregate apply to the corporate earnings of publicly traded companies 365 days from now?” We’re okay saying we don’t know.
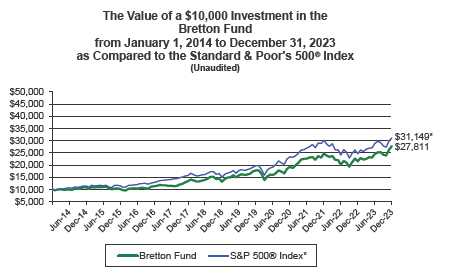
Returns as of December 31, 2023(A)
| | 4th | | | | Annualized | | Annualized | | Annualized | | Annualized | |
| | Quarter | | 1 Year | | 3 Years | | 5 Years | | 10 Years | | Since Inception | |
| Bretton Fund | 14.83% | | 28.91% | | 12.93% | | 16.15% | | 10.77% | | 12.32% | |
| S&P 500 Index(B) | 11.69% | | 26.29% | | 10.00% | | 15.69% | | 12.03% | | 13.59% | |
| Calendar Year Total Returns(A) | | | | |
| |
| | Bretton Fund | S&P 500 Index(B) |
| 2023 | 28.91 | % | 26.29 | % |
| 2022 | -12.56 | % | -18.11 | % |
| 2021 | 27.76 | % | 28.71 | % |
| 2020 | 8.44 | % | 18.40 | % |
| 2019 | 35.39 | % | 31.49 | % |
| 2018 | -1.94 | % | -4.38 | % |
| 2017 | 18.19 | % | 21.83 | % |
| 2016 | 10.68 | % | 11.96 | % |
| 2015 | -6.59 | % | 1.38 | % |
| 2014 | 9.79 | % | 13.69 | % |
| 2013 | 26.53 | % | 32.39 | % |
| 2012 | 15.66 | % | 16.00 | % |
| 2011 | 7.90 | % | 2.11 | % |
| 9/30/10–12/31/10 | 6.13 | % | 10.76 | % |
| Cumulative Since Inception | 366.12 | % | 441.02 | % |
(A) All returns include change in share prices and, in each case, include reinvestment of any dividends and capital gain distributions. The inception date of the Bretton Fund was September 30, 2010.
(B) The S&P 500® Index is a stock market index based on the market capitalizations of 500 leading companies publicly traded in the US stock market, as determined by Standard & Poor’s, and captures approximately 80% coverage of available market capitalization.
Performance data quoted represents past performance. Past performance does not guarantee future results. The investment return and principal value of an investment will fluctuate so that an investor’s shares, when redeemed, may be worth more or less than their original cost. Current performance may be lower or higher than the performance data quoted. You may obtain performance data current to the most recent month-end at http://brettonfund.com or by calling 800.231.2901.
All returns include change in share prices, reinvestment of any dividends, and capital gains distributions. Indices shown are broad-based, unmanaged indices commonly used to measure performance of US stocks. These indices do not incur expenses and are not available for investment. The fund’s expense ratio is 1.35% .The fund’s principal underwriter is Arbor Court Capital, LLC.
1
4th Quarter
In the fourth quarter, the main contributors to performance were Dream Finders Homes adding 2.1%, Ross Stores 1.2%, and American Express 1.2% . There were no major detractors.
Contributors to Performance for 2023
For the full year, the largest contributor to performance was also Dream Finders, which added 4.7% to performance despite starting the year as only a 1.7% position in the fund. At the end of 2022, it was a given that higher mortgage rates would decimate the housing market, and the values of home builders reflected that sentiment, especially smaller ones like Dream Finders, which traded for only three times earnings at year-end.
Our near-term view on the housing market wasn’t all that different, but we knew the market would turn at some point and we’d be rewarded for holding through uncomfortable times. The market for new homes turned out to be quite resilient, and the stock quadrupled during the year. Our other home builder, NVR, added 2.3% .
Tech led the market down in 2022, and it led it on the way back up in 2023. Alphabet, Google’s parent company, added 4.2% and Microsoft added 2.5% .
The only detractor for the year was Revvity (formerly PerkinElmer), which took off 0.3% from the fund.
Taxes
The fund did not make any tax distributions in 2023.
| Portfolio | | |
| |
| Security | % of Net Assets |
| Alphabet, Inc. | 9.64 | % |
| The Progressive Corporation | 6.38 | % |
| AutoZone, Inc. | 6.20 | % |
| NVR, Inc. | 5.80 | % |
| Microsoft Corporation | 5.79 | % |
| Ross Stores, Inc. | 5.77 | % |
| Dream Finders Homes, Inc. | 5.31 | % |
2
| The TJX Companies Inc. | 5.29 | % |
| American Express Co. | 5.19 | % |
| Bank of America Corp. | 5.09 | % |
| S&P Global, Inc. | 4.92 | % |
| MasterCard, Inc. | 4.80 | % |
| Visa, Inc. | 4.78 | % |
| JPMorgan Chase & Co. | 4.69 | % |
| UnitedHealth Group Incorporated | 4.55 | % |
| Union Pacific Corp. | 4.52 | % |
| Moody’s Corporation | 3.89 | % |
| Berkshire Hathaway, Inc. | 3.21 | % |
| Revvity, Inc. | 1.44 | % |
| Armanino Foods of Distinction, Inc. | 1.41 | % |
| Cash* | 1.37 | % |
* Cash represents cash and other assets in excess of liabilities.
Financials
As we’ve written before, one of the lasting, and tragic, behavior changes brought on by the pandemic is reckless driving. There are lots of theories as to why, but we think the shift away from commutes and their traffic jams to driving on emptier roads around people’s homes at irregular hours has led to faster speeding and more severe crashes. Americans’ addiction to mobile phone use has not helped either. Progressive was one of the first insurers to identify this shift—we think their data is the best in the industry—and raised rates before their competitors did. Despite raising rates by over 30% the past two years, Progressive still grew customers by 10%, quite a bit in a low-growth industry. Progressive’s core earnings from insurance operations increased 53%, and the stock returned 23%.
American Express’s stock had a strong year, returning 29%, as the big recession many investors were expecting to result in cardholder delinquencies never materialized. The company recently set ambitious, long-term goals of 10% revenue growth and mid-teens earnings per share growth, and while those numbers may be a touch optimistic, the investment will continue to do quite well if they even get close. Earnings per share increased 14% last year.
It was a little less than a year ago that the spike in interest rates caused the failure of multiple banks, most notably Silicon Valley Bank and First Republic. Those banks had tied up too much of their newly acquired deposits into long-term bonds, which decrease in value when interest rates rise and can then be a problem when depositors want their money back. Our two bank investments, JPMorgan and Bank of America, were the beneficiaries of these small banks’ struggles. In a banking crisis, depositors tend to favor safe banks. JPMorgan increased earnings per share 34%, and the stock returned 31%. Bank of America only managed a 7% increase in earnings per share; it, too, had tied up a significant, though manageable, amount of its liquidity into long-term bonds, dampening earnings. The stock returned 5%.
Rating agencies S&P Global and Moody’s both had terrible years in 2022 when bond issuance dropped from higher rates, but rebounded as issuance ticked back up. S&P Global’s stock returned 33%, and Moody’s returned 41%. We estimate earnings per share increased 24% and 22%, respectively.
Technology
Microsoft and Alphabet returned 58% and 59%, respectively. Corporate tech and advertising spending accelerated after a weak 2022, but it was mostly a change in investor enthusiasm for the space that drove those returns. Investors are optimistic about artificial intelligence and increasingly see AI as a good thing for Microsoft and Google. We agree. Microsoft’s earnings per share increased 12%, and Alphabet’s, which benefited from a much better advertising environment, increased 27%.
3
Like clockwork, people keep spending more on their debit and credit cards. Visa and Mastercard increased earnings per share by 17% and 15%, while their stocks returned 26% and 23%, respectively. Customers and merchants have a growing variety of ways to make payments—Zelle, Venmo, Bitcoin, Affirm, etc.—but nothing has yet to displace the coverage, speed, fraud protection, and rewards that cards offer.
Consumer
Having focused on retail customers for decades, AutoZone expanded a number of years ago into serving repair shops, and it’s gone swimmingly. They’ve already taken 4% of the market and continue to take more. They’re also planning to expand faster in Mexico and Brazil, having dabbled in both countries for over a decade. These markets have large bases of older vehicles served by a highly fragmented group of informal distributors and stores, a great opportunity for AutoZone. Earnings per share increased 13%, and the stock returned 5%.
As we wrote last year, Ross Stores and TJX struggled when inflation was at its worst. Costs rose faster than they could push price increases through to their cost-conscious shoppers. Inflation eased, and revenue and margins are back up. We estimate Ross and TJX increased earnings per share by 22% and 26%; their stocks returned 21% and 20%.
Our home builders—NVR and Dream Finders—continued their tradition of consistent operating performance and volatile share prices, with NVR increasing 52% and Dream Finders increasing 310%.
The older and more established of the two, NVR, delivered 20,662 houses in 2023. It delivered 22,732 in 2022, 21,540 in 2021, and 19,766 in Covid-impacted 2020. Looking at the rhythm of operations, you would be hard-pressed to notice much difference. The share price, however, went from $5,900 at the beginning of 2022, to $3,700 that June, before climbing back over $7,000 at the end of 2023. The share price movement had good reason: mortgage interest rates nearly tripled from their fiat currency–era lows in January 2021 to the end of 2023, although they are still lower than almost any point in the 1990s. We continue to believe that the nation has dramatically under-built housing for decades, and the principal competitor to new houses is used houses, which are owned by people who have low mortgage rates and would face a major penalty if they were to sell and move.
Dream Finders is slightly more complicated, in that it is a young, rapidly growing business with a less-experienced team. It made a series of acquisitions between 2019 and 2021 to enter new markets more rapidly, and when interest rates suddenly shot upwards, it seemed to be in a somewhat precarious position. By the end of 2022, the stock was half of its IPO price. It then proceeded to roughly quadruple in 2023 when the sky didn’t fall. Although consciously emulating the land-light NVR model, Dream Finders doesn’t operate at the same level: it typically runs a much higher cancellation rate than NVR, branches out into adjacent areas such as active senior communities and custom house building, and uses related parties to secure land.
Our tiny manufacturer of frozen sauce and pasta, Armanino Foods of Distinction, sports a market capitalization of just $150 million, a sliver of Microsoft’s $3 trillion. Both are high-margin, high return-on-capital businesses that are growing nicely, but only one of these has delicious products that are quite satisfying to “research.” Armanino expanded its presence in grocery stores like Safeway and Albertsons with a broad line of pastas and sauces, in addition to its core market of cafeterias and restaurants. The stock returned 37%, and earnings per share increased an estimated 20%.
Industrials
Union Pacific struggled in 2023. Carloads, revenue, revenue per carload, operating income, earnings, free cash flow—everything went in the wrong direction. This was not
4
too surprising; industrial production has been flat, and a new labor agreement dinged margins. A brief activist campaign resulted in the replacement of the CEO with former COO Jim Vena, and the narrative shift from “imminent recession” to “maybe the economy isn’t so bad” caused the stock to return 22%. Earnings per share declined 7%.
Berkshire Hathaway’s operating businesses performed moderately well. GEICO emerged from several years of struggles to make a positive contribution, and comparatively calm weather meant that Berkshire’s reinsurance segment performed well; this was partially offset by challenges at BNSF Railway (which had a similar experience to our Union Pacific) and Berkshire Hathaway Energy. Interest income increased thanks to higher rates, and the value of the equity portfolio increased along with the overall stock market. Berkshire’s shares increased 15%.
Healthcare
Stock market investors turned bearish on the healthcare sector in 2023, perhaps best encapsulated by the S&P Pharmaceuticals ETF now trading below its value on the eve of Covid. Our investments were not immune to this sentiment.
United Healthcare stock was flat for the year, ostensibly over concerns about its medical loss ratio (MLR) and slower enrollment growth in Medicare Advantage. The MLR is the portion of health insurance revenue spent on healthcare, and it came in at 85% versus analyst expectations of slightly higher than 84%. As concerns about Covid wane, subscribers are scheduling more procedures.
We take some comfort in a longer perspective. In 2019—the last full pre-Covid year—United Healthcare had 5.2 million Medicare Advantage members out of a nationwide Medicaid population of 60.2 million; this business had a fantastic year and earned $15.11/share. In 2023, United had 7.7 million Medicare Advantage members out of an estimated nationwide Medicaid population of 64.9 million, and it earned $25.12/share. In four years, it captured over half of the net additions to the Medicare program, adding the equivalent of the entire populations of Idaho and Wyoming to its subscriber base, and increased its earnings by 66%. Medicare actuaries expect the Medicare population to exceed 75 million by 2030, and we think United provides the best platform to serve these new customers.
Revvity—the former PerkinElmer, having sold the name along with its food and environmental testing businesses to a private equity firm earlier in the year—had a rough 2023. Headwinds in the pharmaceutical and biotech industries caused site closures and program cuts, and fewer researchers and fewer projects meant reduced demand for laboratory consumables. Adjusted earnings fell 35% from $6.92 to roughly $4.50, and the stock dropped 22%.
For the market and economy overall, we remain cautiously optimistic, but more importantly, short-term agnostic. Over the long run, we think the right collection of businesses at favorable prices will continue to produce good returns.
As always, thank you for investing.
Stephen Dodson
Portfolio Manager | Raphael de Balmann
Portfolio Manager |
5
Bretton Fund by Sectors
(as a percentage of Net Assets)
(Unaudited)
December 31, 2023 |
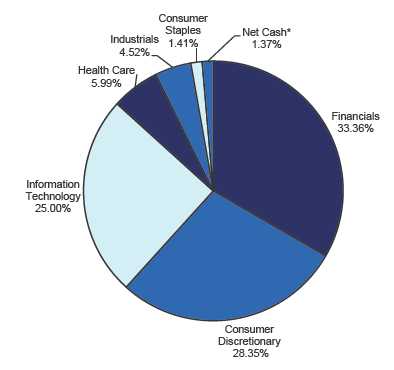
* Net Cash represents cash and other assets in excess of liabilities.
6
| Bretton Fund |
| |
| | | | | | Schedule of Investments |
| | | | | | December 31, 2023 |
| Shares | Cost | | Fair Value | | % of Net Assets |
| COMMON STOCKS | | | | | | | | |
| Canned, Frozen & Preserved Fruit, Vegetables & Food Specialties | | | | | | |
| 245,430 Armanino Foods of Distinction, Inc. | $ | 241,491 | | $ | 1,178,064 | | 1.41 | % |
| Finance Services | | | | | | | | |
| 23,100 American Express Company | | 1,887,694 | | | 4,327,554 | | 5.19 | % |
| Fire, Marine & Casualty Insurance | | | | | | | | |
| 7,500 Berkshire Hathaway Inc. - Class B * | | 1,116,560 | | | 2,674,950 | | | |
| 33,400 The Progressive Corporation | | 2,377,130 | | | 5,319,952 | | | |
| | | 3,493,690 | | | 7,994,902 | | 9.59 | % |
| Hospital & Medical Service Plans | | | | | | | | |
| 7,200 UnitedHealth Group Incorporated | | 2,101,000 | | | 3,790,584 | | 4.55 | % |
| Laboratory Analytical Instruments | | | | | | | | |
| 11,000 Revvity, Inc. | | 1,385,326 | | | 1,202,410 | | 1.44 | % |
| National Commercial Banks | | | | | | | | |
| 126,000 Bank of America Corporation | | 2,683,732 | | | 4,242,420 | | | |
| 23,000 JPMorgan Chase & Co. | | 1,626,993 | | | 3,912,300 | | | |
| | | 4,310,725 | | | 8,154,720 | | 9.78 | % |
| Operative Builders | | | | | | | | |
| 124,500 Dream Finders Homes, Inc. - Class A * | | 2,942,713 | | | 4,423,485 | | | |
| 690 NVR, Inc. * | | 2,103,937 | | | 4,830,311 | | | |
| | | 5,046,650 | | | 9,253,796 | | 11.10 | % |
| Railroad, Line-Haul Operating | | | | | | | | |
| 15,350 Union Pacific Corporation | | 1,243,057 | | | 3,770,267 | | 4.52 | % |
| Retail - Auto & Home Supply Stores | | | | | | | | |
| 2,000 AutoZone, Inc. * | | 1,416,158 | | | 5,171,220 | | 6.20 | % |
| Retail - Family Clothing Stores | | | | | | | | |
| 34,700 Ross Stores Inc. | | 1,801,642 | | | 4,802,133 | | | |
| 47,000 The TJX Companies, Inc. | | 2,014,486 | | | 4,409,070 | | | |
| | | 3,816,128 | | | 9,211,203 | | 11.05 | % |
| Services - Business Services, NEC | | | | | | | | |
| 9,380 MasterCard Incorporated - Class A | | 849,356 | | | 4,000,664 | | | |
| 15,300 Visa Inc. - Class A | | 1,733,343 | | | 3,983,355 | | | |
| | | 2,582,699 | | | 7,984,019 | | 9.58 | % |
| Services - Computer Processing & Data Preparation | | | | | | | | |
| 57,000 Alphabet Inc. - Class C * | | 2,082,582 | | | 8,033,010 | | 9.64 | % |
| Services - Consumer Credit Reporting, Collection Agencies | | | | | | | | |
| 8,300 Moody's Corporation | | 2,461,261 | | | 3,241,648 | | | |
| 9,300 S&P Global Inc. | | 2,655,628 | | | 4,096,836 | | | |
| | | 5,116,889 | | | 7,338,484 | | 8.80 | % |
| Services - Prepackaged Software | | | | | | | | |
| 12,800 Microsoft Corporation | | 2,010,817 | | | 4,813,312 | | 5.78 | % |
| Total for Common Stocks | $ | 36,734,906 | | $ | 82,223,545 | | 98.63 | % |
| Total Investments | $ | 36,734,906 | | $ | 82,223,545 | | | |
| Other Assets in Excess of Liabilities | | | | $ | 1,143,293 | | 1.37 | % |
| Net Assets | | | | $ | 83,366,838 | | 100.00 | % |
| | * Non-Income Producing Securities.
The accompanying notes are an integral part of these financial statements. |
7
| Bretton Fund |
| | |
| Statement of Assets and Liabilities | | | | |
| December 31, 2023 | | | | |
| | |
| Assets: | | | | |
| Investments at Fair Value | $ | 82,223,545 | | |
| (Cost $36,734,906) | | | | |
| Cash | | 1,221,112 | | |
| Receivable for Shareholder Purchases | | 15,000 | | |
| Total Assets | | 83,459,657 | | |
| Liabilities: | | | | |
| Payable to Adviser (Note 4) | | 92,819 | | |
| Total Liabilities | | 92,819 | | |
| Net Assets | $ | 83,366,838 | | |
| | |
| Net Assets Consist of: | | | | |
| Paid In Capital | $ | 37,878,199 | | |
| Total Distributable Earnings (Accumulated Deficit) | | 45,488,639 | | |
| Net Assets, for 1,352,736 Shares Outstanding | $ | 83,366,838 | | |
| (Unlimited shares authorized) | | | | |
| Net Asset Value, Offering Price and Redemption Price Per Share | | | | |
| ($83,366,838/1,352,736 shares) | $ | 61.63 | | |
| | |
| Statement of Operations | | | | |
| For the fiscal year ended December 31, 2023 | | | | |
| | |
| Investment Income: | | | | |
| Dividends (Net of foreign withholding taxes and fees of $0) | $ | 661,289 | | |
| Total Investment Income | | 661,289 | | |
| Expenses: | | | | |
| Management Fees (Note 4) | | 956,949 | | |
| Total Expenses | | 956,949 | | |
| | |
| Net Investment Income (Loss) | | (295,660 | ) | |
| | |
| Realized and Unrealized Gain (Loss) on Investments: | | | | |
| Realized Gain (Loss) on Investments | | - | | |
| Net Change in Unrealized Appreciation (Depreciation) on Investments | | 18,744,296 | | |
| Net Realized and Unrealized Gain (Loss) on Investments | | 18,744,296 | | |
| | |
| Net Increase (Decrease) in Net Assets from Operations | $ | 18,448,636 | | |
| The accompanying notes are an integral part of these financial statements. |
8
| Bretton Fund |
| | |
| Statements of Changes in Net Assets | | | | | | | | |
| | | 1/1/2023 | | | | 1/1/2022 | | |
| | | to | | | | to | | |
| | | 12/31/2023 | | | | 12/31/2022 | | |
| From Operations: | | | | | | | | |
| Net Investment Income (Loss) | $ | (295,660 | ) | | $ | (255,077 | ) | |
| Net Realized Gain (Loss) on Investments | | - | | | | 1,218,585 | | |
| Net Change in Unrealized Appreciation (Depreciation) | | | | | | | | |
| on Investments | | 18,744,296 | | | | (9,489,807 | ) | |
| Increase (Decrease) in Net Assets from Operations | | 18,448,636 | | | | (8,526,299 | ) | |
| | |
| From Distributions to Shareholders: | | - | | | | (1,218,585 | ) | |
| | |
| From Capital Share Transactions: | | | | | | | | |
| Proceeds From Sale of Shares | | 2,516,090 | | | | 4,482,633 | | |
| Shares Issued on Reinvestment of Distributions | | - | | | | 1,218,489 | | |
| Cost of Shares Redeemed | | (243,134 | ) | | | (766,362 | ) | |
| Net Increase (Decrease) from Shareholder Activity | | 2,272,956 | | | | 4,934,760 | | |
| | |
| Net Increase (Decrease) in Net Assets | | 20,721,592 | | | | (4,810,124 | ) | |
| | |
| Net Assets at Beginning of Year | | 62,645,246 | | | | 67,455,370 | | |
| Net Assets at End of Year | $ | 83,366,838 | | | $ | 62,645,246 | | |
| | |
| Share Transactions: | | | | | | | | |
| Issued | | 46,957 | | | | 90,374 | | |
| Reinvested | | - | | | | 25,626 | | |
| Redeemed | | (4,551 | ) | | | (15,171 | ) | |
| Net Increase (Decrease) in Shares | | 42,406 | | | | 100,829 | | |
| Shares Outstanding Beginning of Year | | 1,310,330 | | | | 1,209,501 | | |
| Shares Outstanding End of Year | | 1,352,736 | | | | 1,310,330 | | |
| Financial Highlights | | | | | | | | | | | | | | | | | | | | |
| Selected data for a share outstanding | | | | | | | | | | | | | | | | | | | | |
| throughout each year: | | 1/1/2023 | | | | 1/1/2022 | | | | 1/1/2021 | | | | 1/1/2020 | | | | 1/1/2019 | | |
| | | to | | | | to | | | | to | | | | to | | | | to | | |
| | | 12/31/2023 | | | | 12/31/2022 | | | | 12/31/2021 | | | | 12/31/2020 | | | | 12/31/2019 | | |
| Net Asset Value - | | | | | | | | | | | | | | | | | | | | |
| Beginning of Year | $ | 47.81 | | | $ | 55.77 | | | $ | 43.93 | | | $ | 40.63 | | | $ | 30.01 | | |
| Net Investment Income (Loss) (a) | | (0.22 | ) | | | (0.20 | ) | | | (0.12 | ) | | | (0.11 | ) | | | (0.08 | ) | |
| Net Gain (Loss) on Investments | | | | | | | | | | | | | | | | | | | | |
| (Realized and Unrealized) | | 14.04 | | | | (6.81 | ) | | | 12.31 | | | | 3.54 | | | | 10.70 | | |
| Total from Investment Operations | | 13.82 | | | | (7.01 | ) | | | 12.19 | | | | 3.43 | | | | 10.62 | | |
| | |
| Distributions (From Realized Capital Gains) | | - | | | | (0.95 | ) | | | (0.35 | ) | | | (0.13 | ) | | | - | | |
| Total Distributions | | - | | | | (0.95 | ) | | | (0.35 | ) | | | (0.13 | ) | | | - | | |
| | |
| Net Asset Value - | | | | | | | | | | | | | | | | | | | | |
| End of Year | $ | 61.63 | | | $ | 47.81 | | | $ | 55.77 | | | $ | 43.93 | | | $ | 40.63 | | |
| Total Return (b) | | 28.91 | % | | | (12.56 | )% | | | 27.76 | % | | | 8.44 | % | | | 35.39 | % | |
| Ratios/Supplemental Data | | | | | | | | | | | | | | | | | | | | |
| Net Assets - End of Period (Thousands) | $ | 83,367 | | | $ | 62,645 | | | $ | 67,455 | | | $ | 49,085 | | | $ | 42,052 | | |
| Ratio of Expenses to Average Net Assets | | 1.35 | % | | | 1.35 | % | | | 1.35 | % | | | 1.35 | % | | | 1.50 | % | |
| Ratio of Net Investment Income (Loss) to | | | | | | | | | | | | | | | | | | | | |
| Average Net Assets | | -0.42 | % | | | -0.41 | % | | | -0.24 | % | | | -0.29 | % | | | -0.23 | % | |
| Portfolio Turnover Rate | | 0.00 | % | | | 3.26 | % | | | 1.38 | % | | | 14.51 | % | | | 0.00 | % | |
(a) Per share amounts were calculated using the average shares method.
(b) Total return represents the rate that the investor would have earned or lost on an investment in the
Fund assuming reinvestment of dividends and distributions.
The accompanying notes are an integral part of these financial statements. |
9
Notes to Financial
Statements Bretton Fund
December 31, 2023
1.) ORGANIZATION
Bretton Fund (the “Fund”) was organized as a non-diversified series of the PFS Funds (the “Trust”) on September 21, 2010. The Trust was established under the laws of Massachusetts by an Agreement and Declaration of Trust dated January 13, 2000, which was amended and restated January 20, 2011. The Trust is registered as an open-end investment company under the Investment Company Act of 1940 (the “1940 Act”), as amended. The Trust may offer an unlimited number of shares of beneficial interest in a number of separate series, each series representing a distinct fund with its own investment objectives and policies. As of December 31, 2023, there were thirteen series authorized by the Trust. The Fund commenced operations on September 30, 2010. The Fund’s investment objective is to seek long-term capital appreciation. The investment adviser to the Fund is Bretton Capital Management, LLC (the “Adviser”).
2.) SIGNIFICANT ACCOUNTING POLICIES
The Fund is an investment company and accordingly follows the investment company accounting and reporting guidance of the Financial Accounting Standards Board (“FASB”) Accounting Standards Codification Topic 946 Financial Services - Investment Companies. The financial statements are prepared in conformity with accounting principles generally accepted in the United States of America (“GAAP”). The Fund follows the significant accounting policies described in this section.
SECURITY VALUATION:
All investments in securities are valued as described in Note 3. The Trust's Board of Trustees (the "Board") has designated the Adviser as “Valuation Designee” pursuant to Rule 2a-5 under the 1940 Act.
SHARE VALUATION:
The net asset value (the “NAV”) is generally calculated as of the close of trading on the New York Stock Exchange (the “Exchange”) (normally 4:00 p.m. Eastern time) every day the Exchange is open. The NAV is calculated by taking the total value of the Fund’s assets, subtracting its liabilities, and then dividing by the total number of shares outstanding, rounded to the nearest cent. The offering price and redemption price per share are equal to the net asset value per share.
FEDERAL INCOME TAXES:
The Fund’s policy is to continue to comply with the requirements of the Internal Revenue Code that are applicable to regulated investment companies and to distribute all of its taxable income to shareholders. Therefore, no federal income tax provision is required. It is the Fund’s policy to distribute annually, prior to the end of the calendar year, dividends sufficient to satisfy excise tax requirements of the Internal Revenue Code. This Internal Revenue Code requirement may cause an excess of distributions over the book year-end accumulated income. In addition, it is the Fund’s policy to distribute annually, after the end of the fiscal year, any remaining net investment income and net realized capital gains.
The Fund recognizes the tax benefits of certain tax positions only where the position is “more likely than not” to be sustained assuming examination by tax authorities. Management has analyzed the Fund’s tax positions, and has concluded that no liability for unrecognized tax benefits should be recorded related to uncertain tax positions taken on returns filed for open tax years. The Fund identifies its major tax jurisdictions as U.S. Federal and Massachusetts tax authorities; however, the Fund is not aware of any tax positions for which it is reasonably possible that the total amounts of unrecognized tax benefits will change materially in the next 12 months.
The Fund recognizes interest and penalties, if any, related to unrecognized tax benefits as income tax expense in the Statement of Operations. During the fiscal year ended December 31, 2023, the Fund did not incur any interest or penalties.
DISTRIBUTIONS TO SHAREHOLDERS:
Distributions to shareholders, which are determined in accordance with income tax regulations, are recorded on the ex-dividend date.
10
Notes to Financial Statements - continued
The treatment for financial reporting purposes of distributions made to shareholders during the period from net investment income or net realized capital gains may differ from their ultimate treatment for federal income tax purposes. These differences are caused primarily by differences in the timing of the recognition of certain components of income, expense, or realized capital gain for federal income tax purposes. Where such differences are permanent in nature, they are reclassified in the components of the net assets based on their ultimate characterization for federal income tax purposes. Any such reclassifications will have no effect on net assets, results of operations, or net asset value per share of the Fund.
USE OF ESTIMATES:
The financial statements are prepared in accordance with GAAP, which requires management to make estimates and assumptions that affect the reported amounts of assets and liabilities and disclosure of contingent assets and liabilities at the date of the financial statements and the reported amounts of increases and decreases in net assets from operations during the reporting period. Actual results could differ from those estimates.
EXPENSES:
Expenses incurred by the Trust that do not relate to a specific fund of the Trust are allocated to the individual funds based on each fund’s relative net assets or another appropriate basis.
CASH:
The Fund maintains cash at its custodian which, at times, may exceed United States federally insured limits. See Note 10.
OTHER:
The Fund records security transactions based on the trade date. Dividend income is recognized on the ex-dividend date. Interest income, if any, is recognized on an accrual basis. The Fund uses the specific identification method in computing gain or loss on sales of investment securities. Withholding taxes on foreign dividends have been provided for in accordance with the Fund’s understanding of the applicable country’s tax rules and rates.
3.) SECURITIES VALUATIONS
As described below, the Fund utilizes various methods to measure the fair value of its investments on a recurring basis. GAAP establishes a hierarchy that prioritizes inputs to valuation methods. The three levels of inputs are:
Level 1 - Unadjusted quoted prices in active markets for identical assets or liabilities that the Fund has the ability to access.
Level 2 - Observable inputs other than quoted prices included in level 1 that are observable for the asset or liability, either directly or indirectly. These inputs may include quoted prices for the identical instrument in an inactive market, prices for similar instruments, interest rates, prepayment speeds, credit risk, yield curves, default rates, and similar data.
Level 3 - Unobservable inputs for the asset or liability, to the extent relevant observable inputs are not available, representing the Fund’s own assumptions about the assumptions a market participant would use in valuing the asset or liability, and would be based on the best information available.
The availability of observable inputs can vary from security to security and is affected by a wide variety of factors, including, for example, the type of security, whether the security is new and not yet established in the marketplace, the liquidity of markets, and other characteristics particular to the security. To the extent that valuation is based on models or inputs that are less observable or unobservable in the market, the determination of fair value requires more judgment. Accordingly, the degree of judgment exercised in determining fair value is greatest for instruments categorized in level 3.
The inputs used to measure fair value may fall into different levels of the fair value hierarchy. In such cases, for disclosure purposes, the level in the fair value hierarchy within which the fair value measurement falls in its entirety, is determined based on the lowest level input that is significant to the fair value measurement in its entirety.
11
Notes to Financial Statements - continued
VALUATION OF FUND ASSETS
A description of the valuation techniques applied to the Fund’s major categories of assets and liabilities measured at fair value on a recurring basis follows.
Equity securities (common stocks). Equity securities generally are valued by using market quotations, but may be valued on the basis of prices furnished by a pricing service when the Valuation Designee believes such prices accurately reflect the fair value of such securities. Securities that are traded on any stock exchange or on the NASDAQ over-the-counter market are generally valued by the pricing service at the last quoted sale price. Lacking a last sale price, an equity security is generally valued by the pricing service at its last bid price. Generally, if the security is traded in an active market and is valued at the last sale price, the security is categorized as a level 1 security, and if an equity security is valued by the pricing service at its last bid, it is generally categorized as a level 2 security. When market quotations are not readily available, when the Valuation Designee determines that the market quotation or the price provided by the pricing service does not accurately reflect the current fair value, or when restricted securities are being valued, such securities are valued as determined in good faith by the valuation committee, which includes the Valuation Designee, subject to review of the Board and are categorized in level 2 or level 3, when appropriate.
In accordance with the Trust’s good faith pricing guidelines, the Valuation Designee is required to consider all appropriate factors relevant to the value of securities for which it has determined other pricing sources are not available or reliable as described above. There is no single standard procedure for determining fair value, since fair value depends upon the circumstances of each individual case. As a general principle, the current fair value of an issue of securities being valued by the Valuation Designee would appear to be the amount which the owner might reasonably expect to receive for them upon their current sale. Methods which are in accordance with this principle may, for example, be based on (i) a multiple of earnings; (ii) a discount from market of a similar freely traded security (including a derivative security or a basket of securities traded on other markets, exchanges or among dealers); or (iii) yield to maturity with respect to debt issues, or a combination of these and other methods. The Board maintains responsibilities for the fair value determinations under Rule 2a-5 under the 1940 Act and oversees the Valuation Designee.
The following table summarizes the inputs used to value the Fund’s assets measured at fair value as of December 31, 2023:
| Valuation Inputs of Assets | | Level 1 | Level 2 | Level 3 | Total |
| Common Stocks | | $82,223,545 | $– | $– | $82,223,545 |
| Total Investments | | $82,223,545 | $– | $– | $82,223,545 |
The Fund did not hold any Level 3 assets as of the fiscal year ended December 31, 2023.
The Fund did not invest in derivative instruments during the fiscal year ended December 31, 2023.
4.) INVESTMENT ADVISORY AGREEMENT AND RELATED PARTY TRANSACTIONS
The Fund has entered into an investment advisory agreement (“Management Agreement”) with the Adviser. The Adviser manages the investment portfolio of the Fund, subject to policies adopted by the Trust’s Board of Trustees, and, at its own expense and without reimbursement from the Fund, furnishes office space and all necessary office facilities, equipment, and executive personnel necessary for managing the Fund. The Adviser pays the expenses of the Fund except for the management fee, all brokerage fees and commissions, taxes, borrowing costs (such as (a) interest and (b) dividend expenses on securities sold short), fees and expenses of acquired funds, extraordinary or non-recurring expenses as may arise, including litigation to which the Fund may be a party and indemnification of the Trust’s Trustees and officers with respect thereto. For its services, effective January 1, 2020, the Adviser receives a management fee equal to 1.35% of the average daily net assets of the Fund. Prior to January 1, 2020, the Adviser received a management fee equal to 1.50% of the average daily net assets of the Fund.
For the fiscal year ended December 31, 2023, the Adviser earned management fees totaling $956,949, of which $92,819 was due to the Adviser at December 31, 2023.
12
Notes to Financial Statements - continued
5.) RELATED PARTY TRANSACTIONS
Certain officers and a Trustee of the Trust are also officers of Premier Fund Solutions (the “Administrator”). These individuals receive benefits from the Administrator resulting from administration fees paid to the Administrator of the Fund by the Adviser.
For the fiscal year ended December 31, 2023, the Trustees who are not interested persons of the Fund, each received $1,500, for a total of $6,000, plus travel and related expenses from the Adviser of the Fund. Under the Management Agreement, the Adviser pays these fees.
6.) PURCHASES AND SALES OF SECURITIES
For the fiscal year ended December 31, 2023, purchases and sales of investment securities other than U.S. Government obligations and short-term investments aggregated $1,572,350 and $0, respectively. Purchases and sales of U.S. Government obligations aggregated $0 and $0, respectively.
7.) CONTROL OWNERSHIP
The beneficial ownership, either directly or indirectly, of more than 25% of the voting shares of a fund creates a presumption of control of the fund, under Section 2(a)(9) of the 1940 Act. As of December 31, 2023, YDB LLC, beneficially held, in aggregate, 25.47% of the Fund and Thao Dodson, held, in aggregate, 43.21% of the Fund and therefore, each may be deemed to control the Fund.
8.) TAX MATTERS
For Federal income tax purposes, the cost of investments owned at December 31, 2023, was $36,734,906. At December 31, 2023, the composition of unrealized appreciation (the excess of value over tax cost) and depreciation (the excess of tax cost over value) was as follows:
| | Appreciation | | (Depreciation) | | Net Appreciation (Depreciation) |
| | $45,677,926 | | ($189,287) | | $45,488,639 |
| |
| | The tax character of distributions was as follows: | | |
| |
| | | | 2023 | | 2022 |
| | Ordinary Income . | | $ – | | $ – |
| | Long-Term Capital Gain | | – | | 1,218,585 |
| | | | $ – | | $ 1,218,585 |
As of December 31, 2023, the components of distributable earnings (accumulated losses) on a tax basis were as follows:
| Unrealized Appreciation (Depreciation) | | $45,488,639 |
| Total Distributable Earnings | | $45,488,639 |
As of December 31, 2023, there were no differences between book basis and tax basis unrealized appreciation.
As of December 31, 2023, total distributable earnings was increased by $295,660 and paid in capital was decreased by $295,660. The adjustment was primarily related to the reclassification of net operating loss.
9.) SECTOR CONCENTRATION RISK
If the Fund has significant investments in the securities of issuers in industries within a particular sector, any development affecting that sector will have a greater impact on the value of the net assets of the Fund than would be the case if the Fund did not have significant investments in that sector. In addition, this may increase the risk of loss of an investment in the Fund and increase the volatility of the Fund’s NAV per share. From time to time, circumstances may affect a particular sector and the companies within such sector. For instance, economic or market factors, regulation or deregulation, and technological or other developments may negatively impact all companies in a particular sector and therefore the value of a Fund’s portfolio will be adversely affected. As of December 31, 2023, the Fund had 33.36%, 28.35% and 25.00% of the value of its net assets invested in stocks within the Financials, Consumer Discretionary and Information Technology sectors, respectively.
13
10.) CASH IN UNINSURED ACCOUNT
For cash management purposes, the Fund may concentrate cash with the Fund’s custodian. This may result in cash balances exceeding the Federal Deposit Insurance Corporation (“FDIC”) insurance limits. As of December 31, 2023, the Fund held $1,221,112 in cash at US Bank, N. A., a portion of which exceeded the FDIC insurance limit of $250,000.
11.) SUBSEQUENT EVENTS
Subsequent events after the date of the Statement of Assets and Liabilities have been evaluated through the date the financial statements were issued. Management has concluded that there is no impact requiring adjustment to or disclosure in the financial statements.
14
REPORT OF INDEPENDENT REGISTERED PUBLIC ACCOUNTING FIRM
To the Shareholders of Bretton Fund and
Board of Trustees of PFS Funds
Opinion on the Financial Statements
We have audited the accompanying statement of assets and liabilities, including the schedule of investments, of Bretton Fund (the “Fund”), a series of PFS Funds, as of December 31, 2023, the related statement of operations for the year then ended, the statements of changes in net assets for each of the two years in the period then ended, the related notes, and the financial highlights for each of the five years in the period then ended (collectively referred to as the “financial statements”). In our opinion, the financial statements present fairly, in all material respects, the financial position of the Fund as of December 31, 2023, the results of its operations for the year then ended, the changes in net assets for each of the two years in the period then ended, and the financial highlights for each of the five years in the period then ended, in conformity with accounting principles generally accepted in the United States of America.
Basis for Opinion
These financial statements are the responsibility of the Fund’s management. Our responsibility is to express an opinion on the Fund’s financial statements based on our audits. We are a public accounting firm registered with the Public Company Accounting Oversight Board (United States) (“PCAOB”) and are required to be independent with respect to the Fund in accordance with the U.S. federal securities laws and the applicable rules and regulations of the Securities and Exchange Commission and the PCAOB.
We conducted our audits in accordance with the standards of the PCAOB. Those standards require that we plan and perform the audit to obtain reasonable assurance about whether the financial statements are free of material misstatement whether due to error or fraud.
Our audits included performing procedures to assess the risks of material misstatement of the financial statements, whether due to error or fraud, and performing procedures that respond to those risks. Such procedures included examining, on a test basis, evidence regarding the amounts and disclosures in the financial statements. Our procedures included confirmation of securities owned as of December 31, 2023, by correspondence with the custodian. Our audits also included evaluating the accounting principles used and significant estimates made by management, as well as evaluating the overall presentation of the financial statements. We believe that our audits provide a reasonable basis for our opinion.
We have served as the Fund’s auditor since 2010.

COHEN & COMPANY, LTD.
Milwaukee, Wisconsin
February 9, 2024
15
Additional Information
December 31, 2023
(Unaudited) |
1.) AVAILABILITY OF QUARTERLY SCHEDULE OF INVESTMENTS
The Fund publicly files its complete schedule of portfolio holdings with the Securities and Exchange Commission (“SEC”) for the first and third quarters of each fiscal year on Form N-PORT. The Fund’s Form N-PORT is available on the SEC’s website at http://www.sec.gov.
2.) PROXY VOTING GUIDELINES
Bretton Capital Management, LLC, the Fund’s investment adviser (“Adviser”), is responsible for exercising the voting rights associated with the securities held by the Fund. A description of the policies and procedures used by the Adviser in fulfilling this responsibility is available without charge on the Fund’s website at www.brettonfund.com. It is also included in the Fund’s Statement of Additional Information, which is available on the SEC’s website at http://www.sec.gov.
Form N-PX provides information regarding how the Fund voted proxies with regards to portfolio securities held during the most recent 12-month period ended June 30th and is available without charge, upon request, by calling our toll free number (800.231.2901) . This information is also available on the SEC’s website at http://www.sec.gov.
3.) LIQUIDITY RISK MANAGEMENT PROGRAM
During the fiscal year ended December 31, 2023, the Board reviewed the Fund’s liquidity risk management program, adopted pursuant to Rule 22e-4 under the 1940 Act. The program is overseen by the Adviser, who has delegated certain responsibilities for managing the program to a liquidity program administrator (the “LPA”). The LPA reported that it had assessed, managed and reviewed the program for the Fund taking into consideration several factors including the liquidity of the Fund’s portfolio investments and the market, trading or investment specific considerations that may reasonably affect a security’s classification as a liquid investment. The LPA certified that the program was adequate, effectively implemented and needed no changes at that time.
4.) DISCLOSURE OF EXPENSES
As a shareholder of the Fund, you incur ongoing expenses consisting solely of management fees. You will be assessed fees for outgoing wire transfers, returned checks and stop payment orders at prevailing rates charged by Mutual Shareholder Services, LLC, the Fund’s transfer agent, and IRA accounts will be charged an $8.00 annual maintenance fee. This Example is intended to help you understand your ongoing costs (in dollars) of investing in the Fund and to compare these costs with the ongoing costs of investing in other mutual funds.
The Example is based on an investment of $1,000 invested in the Fund on July 1, 2023, and held through December 31, 2023.
Actual Expenses
The first line of the table below provides information about actual account values and actual expenses. You may use the information in this line, together with the amount you invested, to estimate the expenses that you paid over the period. Simply divide your account value by $1,000 (for example, an $8,600 account value divided by $1,000 = 8.6), then multiply the result by the number in the first line under the heading entitled “Expenses Paid During the Period” to estimate the expenses you paid on your account during this period.
Hypothetical Example for Comparison Purposes
The second line of the table below provides information about hypothetical account values and hypothetical expenses based on the Fund’s actual expense ratio and an assumed rate of return of 5% per year before expenses, which is not the Fund’s actual return. The hypothetical account values and expenses may not be used to estimate the actual ending account balance or expenses you paid for the period. You may use this information to compare the ongoing costs of
16
Additional Information (Unaudited) - continued
investing in this Fund and other funds. To do so, compare this 5% hypothetical example with the 5% hypothetical examples that appear in the shareholder reports of the other funds.
Please note that the expenses shown in the table are meant to highlight your ongoing costs only and do not reflect any transactional costs, such as the charges assessed by Mutual Shareholder Services, LLC as described above. Therefore, the second line of the table is useful in comparing ongoing costs only, and will not help you determine the relative cost of owning different funds. In addition, if these transactional costs were included, your cost could have been higher.
| | | | | | | Expenses Paid |
| | | Beginning | | Ending | | During the Period* |
| | | Account Value | | Account Value | | July 1, 2023 to |
| | | July 1, 2023 | | December 31, 2023 | | December 31, 2023 |
| |
| Actual | | $1,000.00 | | $1,132.70 | | $7.26 |
| |
| Hypothetical | | $1,000.00 | | $1,018.40 | | $6.87 |
| (5% annual return | | | | | | |
| before expenses) | | | | | | |
| * | Expenses are equal to the Fund’s annualized expense ratio of 1.35%, multiplied by the average account value over the period, multiplied by 184/365 (to reflect the one-half year period ended December 31, 2023). |
| |
17
Trustees and Officers
(Unaudited) |
The Board of Trustees supervises the business activities of the Trust. The names of the Trustees and executive officers of the Trust are shown below. For more information regarding the Trustees, please refer to the Statement of Additional Information, which is available upon request by calling 800.231.2901. Each Trustee serves until the Trustee sooner dies, resigns, retires, or is removed.
The Trustees and Officers of the Trust and their principal business activities during the past five years are:
Interested Trustees and Officers
| | | | | Number of | |
| | | | Principal | Portfolios In | Other |
| Name, | Position(s) | Term of Office | Occupation(s) | Fund | Directorships |
| Address(1), | Held With | and Length of | During | Complex | Held By |
| and Year of Birth | the Trust | Time Served | Past 5 Years | Overseen By | Trustee |
| | | | | Trustee | |
| |
| James D. Craft, | President | Indefinite Term; | Fund Administrator, Premier Fund | N/A | N/A |
| Year of Birth: 1982 | | Since 2023 | Solutions, Inc. (2007 to current); | | |
| | | | Chief Technology Officer, Premier | | |
| | | | Fund Solutions, Inc. (2011 to cur- | | |
| rent). |
| |
| Jeffrey R. Provence(2), | Trustee, | Indefinite Term; | CEO, Premier Fund Solutions, Inc. | 13 | Blue Chip |
| Year of Birth: 1969 | Secretary | Since 2000 | (2001 to current). General Partner | | Investor Funds, |
| | and | | and Portfolio Manager for Value | | Meeder Funds |
| | Treasurer | | Trend Capital Management, LP | | |
| | | | (1995 to current). | | |
| |
| Julian G. Winters, | Chief | Indefinite Term; | Managing Member, Watermark | N/A | N/A |
| Year of Birth: 1968 | Compliance | Since 2010 | Solutions LLC (investment compli- | | |
| | Officer | | ance and consulting) (2007 to cur- | | |
| rent). |
(1) The address of each trustee and officer is c/o PFS Funds, 1939 Friendship Drive, Suite C, El Cajon, California 92020.
(2) Jeffrey R. Provence is considered an “interested person” as defined in Section 2(a)(19) of the 1940 Act by virtue of his position
with the Trust.
Independent Trustees |
| | | | | Number of | |
| | | | Principal | Portfolios In | Other |
| Name, | Position | Term of Office | Occupation(s) | Fund | Directorships |
| Address(1), | Held With | and Length of | During | Complex | Held By |
| and Year of Birth | the Trust | Time Served | Past 5 Years | Overseen By | Trustee |
| | | | | Trustee | |
| |
| Thomas H. Addis III, | Independent | Indefinite Term; | Executive Director Emeritus, | 13 | None |
| Year of Birth: 1945 | Trustee | Since 2000 | Southern California PGA (2006 to | | |
| | | | 2023). | | |
| |
| Robert L. Boerner, | Independent | Indefinite Term; | Owner / Broker of Gecko Realty | 13 | Blue Chip |
| Year of Birth: 1969 | Trustee | Since 2022 | (2008 to current). | | Investor Funds, |
| | | | | | Neiman Funds |
| |
| Allen C. Brown, | Independent | Indefinite Term; | Retired. Law Office of Allen C. | 13 | Blue Chip |
| Year of Birth: 1943 | Trustee | Since 2010 | Brown, estate planning and business | | Investor Funds |
| | | | attorney (1970 to 2021). | | |
| |
| John W. Czechowicz, | Independent | Indefinite Term; | CPA at CWDL (2016 to current). | 13 | None |
| Year of Birth: 1983 | Trustee | Since 2022 | | | |
(1) The address of each trustee and officer is c/o PFS Funds, 1939 Friendship Drive, Suite C, El Cajon, California 92020.
18

Investment Adviser
Bretton Capital Management, LLC
Legal Counsel
Practus, LLP
Custodian
US Bank, N.A.
Dividend Paying Agent,
Shareholders’ Servicing Agent,
Transfer Agent
Mutual Shareholder Services, LLC
Fund Administrator
Premier Fund Solutions, Inc.
Independent Registered Public Accounting Firm
Cohen & Company, Ltd.
Distributor
Arbor Court Capital, LLC |
This report is provided for the general information of the shareholders of the Bretton
Fund. This report is not intended for distribution to prospective investors in the Fund,
unless preceded or accompanied by an effective prospectus. |
(b) Not applicable.
Item 2. Code of Ethics.
The registrant has adopted a code of ethics that applies to the registrant’s principal executive officer and the principal financial officer. The registrant has not made any amendments to its code of ethics during the covered period. The registrant has not granted any waivers from any provisions of the code of ethics during the covered period. A copy of the registrant’s Code of Ethics is filed herewith.
Item 3. Audit Committee Financial Expert.
The registrant’s Board of Trustees has determined that John W. Czechowicz is an audit committee finical expert. Mr. Czechowicz is independent for purposes of this Item 3.
Item 4. Principal Accountant Fees and Services.
(a-d) The following table details the aggregate fees billed for each of the last two fiscal years for audit fees, audit-related fees, tax fees and other fees by the principal accountant to the registrant. The principal accountant has provided no services to the adviser or any entity controlled by, or under common control with the adviser that provides ongoing services to the registrant.
| | | FYE 12/31/2023 | | FYE 12/31/2022 |
| Audit Fees | | $13,750 | | $13,750 |
| Audit-Related Fees | | $0 | | $0 |
| Tax Fees | | $3,500 | | $3,000 |
| All Other Fees | | $750 | | $750 |
Nature of Tax Fees: preparation of Excise Tax Statement and 1120 RIC.
All Other Fees: Semi-Annual Report Review
(e) (1) The audit committee approves all audit and non-audit related services and, therefore, has not adopted pre-approval policies and procedures described in paragraph (c)(7) of Rule 2-01 of Regulation S-X.
(e) (2) None of the services described in paragraph (b) through (d) of this Item were approved by the audit committee pursuant to paragraph (c)(7)(i)(C) of Rule 2-01 of Regulation S-X.
(f) All of the principal accountant’s hours spent on auditing the registrant’s financial statements were attributed to work performed by full-time permanent employees of the principal accountant.
(g) The following table indicates the aggregate non-audit fees billed by the registrant’s principal accountant for services to the registrant , the registrant’s investment adviser (not sub-adviser), and any entity controlling, controlled by, or under common control with the adviser that provides ongoing services to the registrant, for the last two years.
| Non-Audit Fees | | FYE 12/31/2023 | | FYE 12/31/2022 |
| Registrant | | $4,250 | | $3,750 |
| Registrant’s Investment Adviser | | $0 | | $0 |
(h) The principal accountant provided no services to the investment adviser or any entity controlling, controlled by, or under common control with the adviser that provides ongoing services to the registrant.
(i) Not applicable.
(j) Not applicable.
Item 5. Audit Committee of Listed Companies. Not applicable.
Item 6. Investments.
(a) Not applicable. Schedule filed with Item 1.
(b) Not applicable.
Item 7. Disclosure of Proxy Voting Policies and Procedures for Closed-End Management Investment Companies. Not applicable.
Item 8. Portfolio Managers of Closed End Management Investment Companies. Not applicable.
Item 9. Purchases of Equity Securities by Closed-End Management Investment Companies and Affiliated Purchasers. Not applicable.
Item 10. Submission of Matters to a Vote of Security Holders.
The registrant has not adopted procedures by which shareholders may recommend nominees to the registrant’s board of trustees.
Item 11. Controls and Procedures.
(a) The Registrant’s president and chief financial officer concluded that the disclosure controls and procedures (as defined in Rule 30a-3(c) under the Act (17 CFR 270.30a -3(c))) as of a date within 90 days of the filing date of the report that includes the disclosure required by this paragraph, based on the evaluation of these controls and procedures required by Rule 30a-3(b) under the Act (17 CFR 270.30a -3(b)) and Rules 13a-15(b) or 15d-15(b) under the Exchange Act (17 CFR 240.13a -15(b) or 240.15d -15(b)).
(b) There were no changes in the registrant’s internal control over financial reporting (as defined in Rule 30a-3(d) under the Act (17 CFR 270.30a -3(d)) that occurred during the period covered by this report that has materially affected, or is reasonably likely to materially affect, the registrant’s internal control over financial reporting.
Item 12. Disclosure of Securities Lending Activities for Closed-End Management Investment Companies.
Not applicable.
Item 13. Exhibits.
(a)(1) Code of Ethics. Filed herewith.
(a)(2) Certifications pursuant to Section 302 of the Sarbanes-Oxley Act of 2002. Filed herewith.
(a)(3) Not applicable.
(a)(4) Not applicable.
(b) Certification pursuant to Section 906 of the Sarbanes-Oxley Act of 2002. Filed herewith.
Pursuant to the requirements of the Securities Exchange Act of 1934 and the Investment Company Act of 1940, the registrant has duly caused this report to be signed on its behalf by the undersigned, thereunto duly authorized.
| | By: /s/James Craft
James Craft
President |
Pursuant to the requirements of the Securities Exchange Act of 1934 and the Investment Company Act of 1940, this report has been signed below by the following persons on behalf of the registrant and in the capacities and on the dates indicated.
| | By: /s/James Craft
James Craft
President |
| | By: /s/Jeffrey R. Provence
Jeffrey R. Provence
Chief Financial Officer |