UNITED STATES
SECURITIES AND EXCHANGE COMMISSION
WASHINGTON, D.C. 20549
CERTIFIED SHAREHOLDER REPORT OF REGISTERED MANAGEMENT
INVESTMENT COMPANIES
Investment Company Act file number 811-09781
PFS Funds
(Exact name of registrant as specified in charter)
1939 Friendship Drive, Suite C, El Cajon, CA 92020
(Address of principal executive offices) (Zip code)
CT Corporation System
155 Federal St., Suite 700, Boston, MA 02110
(Name and address of agent for service) |
Registrant’s telephone number, including area code: (619) 588-9700
Date of fiscal year end: March 31
Date of reporting period: March 31, 2024
Item 1. Report to Stockholders.
WIRELESS FUND
Annual Report
March 31, 2024
Letter To Shareholders, May 2024
For the twelve-month period ended March 31, 2024, the Wireless Fund (the “Fund”) was up 53.58% . For comparative purposes, the Standard & Poor's 500® Index was up 29.88% and the NASDAQ Composite Index gained 35.08%, for the same period.
During the fiscal year ended March 31, 2024, the markets had a significant rebound despite continued record inflation. The Global and U.S. economies were resilient throughout the period despite ongoing wars and the potential for additional interest rate hikes. The information technology and the communication sectors saw significant outperformance. Artificial intelligence (AI) became the buzzword, and for good reason. The acceleration of machine learning and deep learning systems used to recognize patterns within communications channels is moving technology at the speed of light. These systems are optimizing the resources necessary to improve performance.
NVIDIA Corporation (Nasdaq: NVDA), Microsoft (Nasdaq: MSFT) and Alphabet Inc. –Class A (Nasdaq: GOOGL) (the Fund's largest holdings at 17.17%, 13.35% and 10.06%, respectively, of the Fund's net assets as of March 31, 2024) were all up during the period. NVIDIA Corporation was the star performer, significantly outperforming the S&P 500 and NASDAQ Composite. Microsoft and Alphabet Inc. were also up, outperforming the S&P 500 and NASDAQ Composite. The “Semiconductors & Related Devices” sector represented the largest percentage of the Fund’s net assets at 30.41% as of March 31, 2024. The “Services -Prepackaged Software” sector represented the second largest percentage of the Fund's net assets at 17.54% as of March 31, 2024.
The Fund was up during the period of April 1, 2023 through July 31, 2023, but saw a pullback through October 31, 2023. As calendar year 2023 closed, both the Fund and the S&P 500 and NASDAQ Composite saw significant rebounds. This upward trend continued through the Fund’s fiscal year end of March 31, 2024.
2024 Annual Report 1
We appreciate your confidence in our abilities and thank you for your investment in the Wireless Fund.
Jeffrey R. Provence
Past performance does not guarantee future results. The investment return and principal value of an investment will fluctuate so that an investor’s shares, when redeemed, may be worth more or less than their original cost. Current performance may be lower or higher than the performance data quoted. You may obtain performance data current to the most recent month-end by calling toll free 1-800-590-0898. Investors should consider the investment objectives, risks, and charges and expenses of the Fund carefully before investing. The prospectus contains this and other information about the Fund. You may obtain a prospectus on our website www.wireless-fund.com or by calling toll free 1-800-590-0898. An investment in the Fund is subject to investment risks, including the possible loss of the principal amount invested. The Fund’s principal underwriter is Arbor Court Capital, LLC.
2024 Annual Report 2

Average annual total returns for the periods ended 3/31/2024 (Unaudited)
3/31/2024 NAV $16.62
| | 1 Year(A) | | 3 Year(A) | | 5 Year(A) | | 10 Year(A) | |
| Wireless Fund | 53.58% | | 13.45% | | 19.16% | | 16.17% | |
| NASDAQ(B) | 35.08% | | 8.17% | | 17.19% | | 15.73% | |
| Standard & Poor’s 500® Index(C) | 29.88% | | 11.49% | | 15.05% | | 12.96% | |
Total Annual Fund Operating Expense Ratio (from 07/31/2023 Prospectus): 1.95%
The Total Annual Operating Expense Ratio reported above may not correlate to the expense ratio in the Fund’s financial highlights because the financial highlights include only the direct operating expenses incurred by the Fund, not the indirect costs of investing in acquired funds.
(A) 1 Year, 3 Year, 5 Year and 10 Year returns include change in share prices and in each case includes reinvestment of any dividends and capital gain distributions. The returns shown do not reflect the deduction of taxes that a shareholder would pay on Fund distributions or the redemption of Fund shares.
(B) The NASDAQ Composite (NASDAQ) is a capitalization-weighted index of all common stocks listed on NASDAQ and is an unmanaged group of stocks whose composition is different from the Fund.
(C) The Standard & Poor’s 500® Index (S&P 500) is a broad market-weighted average dominated by blue-chip stocks and is an unmanaged group of stocks whose composition is different from the Fund.
PAST PERFORMANCE DOES NOT GUARANTEE FUTURE RESULTS. INVESTMENT RETURN AND PRINCIPAL VALUE WILL FLUCTUATE SO THAT SHARES, WHEN REDEEMED, MAY BE WORTH MORE OR LESS THAN THEIR ORIGINAL COST. RETURNS DO NOT REFLECT THE DEDUCTION OF TAXES THAT A SHAREHOLDER WOULD PAY ON FUND DISTRIBUTIONS OR THE REDEMPTION OF FUND SHARES. CURRENT PERFORMANCE MAY BE LOWER OR HIGHER THAN THE PERFORMANCE DATA QUOTED. TO OBTAIN PERFORMANCE DATA CURRENT TO THE MOST RECENT MONTH END, PLEASE CALL 1-800-590-0898. AN INVESTMENT IN THE FUND IS SUBJECT TO INVESTMENT RISKS, INCLUDING THE POSSIBLE LOSS OF THE PRINCIPAL AMOUNT INVESTED. THE FUND'S DISTRIBUTOR IS ARBOR COURT CAPITAL, LLC.
2024 Annual Report 3
Wireless Fund Sector Distribution (Unaudited)
(As a Percentage of Net Assets)
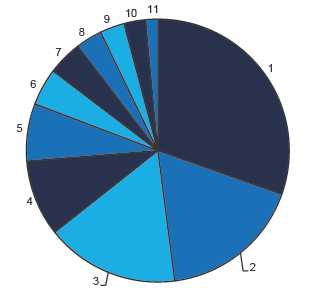
| Industry Sector | Percentage of Net Assets |
| 1. Semiconductors & Related Devices | 30.41 | % |
| 2. Services - Prepackaged Software | 17.54 | % |
| 3. Services - Computer Programming, Data Processing, Etc. | 16.40 | % |
| 4. Radio & TV Broadcasting & Communications Equipment | 9.38 | % |
| 5. Electronic Computers | 7.06 | % |
| 6. Cash Equivalents and Other Assets Less Liabilities | 4.57 | % |
| 7. Optical Instruments & Lenses | 4.25 | % |
| 8. Radio Telephone Communications | 3.24 | % |
| 9. Special Industry Machinery, NEC | 3.02 | % |
| 10. Services - Business Services, NEC | 2.66 | % |
| 11. Computer Communications Equipment | 1.47 | % |
PROXY VOTING GUIDELINES
(Unaudited) |
Value Trend Capital Management, LP, the Fund’s Adviser, is responsible for exercising the voting rights associated with the securities held by the Fund. A description of the policies and procedures used by the Adviser in fulfilling this responsibility is available without charge on the Fund’s website at www.wireless-fund.com. It is also included in the Fund’s Statement of Additional Information, which is available on the Securities and Exchange Commission’s (“SEC”) website at http://www.sec.gov.
Form N-PX provides information regarding how the Fund voted proxies with regards to portfolio securities held during the most recent 12-month period ended June 30th and is available without charge, upon request, by calling 1-800-590-0898. This information is also available on the SEC’s website at http://www.sec.gov.
2024 Annual Report 4
Availability of Quarterly Schedule of Investments (Unaudited)
The Fund publicly files its complete schedule of portfolio holdings with the Securities and Exchange Commission (“SEC”) for the first and third quarters of each fiscal year on Form N-PORT. The Fund’s Forms N-PORT are available on the SEC’s website at http://www.sec.gov.
Disclosure of Expenses
(Unaudited) |
Shareholders of this Fund incur ongoing costs, consisting of management fees and other Fund expenses. The following example is intended to help you understand your ongoing costs of investing in the Fund and to compare these costs with similar costs of investing in other mutual funds. If shares are redeemed within 90 days of purchase from the Fund, the shares are subject to a 2% redemption fee. Additionally, IRA accounts will be charged an $8.00 annual maintenance fee. The example is based on an investment of $1,000 invested at the beginning of the period and held for the entire period from October 1, 2023, to March 31, 2024.
The first line of the table below provides information about actual account values and actual expenses. In order to estimate the expenses a shareholder paid during the period covered by this report, shareholders can divide their account value by $1,000 (for example, an $8,600 account value divided by $1,000 = 8.6) and then multiply the result by the number in the first line under the heading entitled “Expenses Paid During the Period.”
The second line of the table below provides information about hypothetical account values and hypothetical expenses based on the Fund’s actual expense ratio and an assumed rate of return of 5% per year before expenses, which is not the Fund’s actual return. The hypothetical account values and expenses may not be used to estimate the actual ending account balance or expenses paid by a shareholder for the period. You may use this information to compare the ongoing costs of investing in the Fund and other funds. To do so, compare the 5% hypothetical example with the 5% hypothetical examples that appear in other funds’ shareholder reports.
Please note that the expenses shown in the table are meant to highlight your ongoing costs only and do not reflect any transactional costs, such as redemption fees or IRA maintenance fees described above and expenses of the underlying funds. Therefore, the second line of the table is useful in comparing ongoing costs only, and will not help you determine the relative cost of owning different funds. In addition, if these transactional costs and expenses of underlying funds were included, your cost could have been higher.
| | | | | | | Expenses Paid |
| | | Beginning | | Ending | | During the Period* |
| | | Account Value | | Account Value | | October 1, 2023 |
| | | October 1, 2023 | | March 31, 2024 | | to March 31, 2024 |
| |
| Actual | | $1,000 | | $1,367.29 | | $11.54 |
| |
| Hypothetical | | $1,000 | | $1,015.25 | | $9.82 |
| (5% annual return | | | | | | |
| before expenses) | | | | | | |
| * | Expenses are equal to the Fund’s annualized expense ratio of 1.95%, multiplied by the average account value over the period, multiplied by 183/366 (to reflect the one-half year period). |
| |
2024 Annual Report 5
| SCHEDULE OF INVESTMENTS - WIRELESS FUND |
| |
| MARCH 31, 2024 |
| |
| Shares | | Fair Value | | % of Net Assets |
| COMMON STOCKS | | | | | |
| Computer Communications Equipment | | | | | |
| 2,365 | Cisco Systems, Inc. | $ | 118,037 | | 1.47 | % |
| Electronic Computers | | | | | |
| 3,315 | Apple Inc. | | 568,456 | | 7.06 | % |
| Optical Instruments & Lenses | | | | | |
| 490 | KLA Corporation | | 342,299 | | 4.25 | % |
| Radio & TV Broadcasting & Communications Equipment | | | | | |
| 1,095 | Motorola Solutions, Inc. | | 388,703 | | | |
| 1,840 | QUALCOMM Incorporated | | 311,512 | | | |
| 10,000 | Telefonaktiebolaget LM Ericsson ** | | 55,100 | | | |
| | | | 755,315 | | 9.38 | % |
| Radio Telephone Communications | | | | | |
| 1,600 | T-Mobile US, Inc. | | 261,152 | | 3.24 | % |
| Semiconductors & Related Devices | | | | | |
| 600 | Advanced Micro Devices, Inc. * | | 108,294 | | | |
| 1,915 | Applied Materials, Inc. | | 394,931 | | | |
| 290 | Broadcom Inc. | | 384,369 | | | |
| 700 | Microchip Technology Incorporated | | 62,797 | | | |
| 1,530 | NVIDIA Corporation | | 1,382,447 | | | |
| 1,010 | Qorvo, Inc. * | | 115,978 | | | |
| | | | 2,448,816 | | 30.41 | % |
| Services - Business Services, NEC | | | | | |
| 3,200 | PayPal Holdings, Inc. * | | 214,368 | | 2.66 | % |
| Services - Computer Programming, Data Processing, Etc. | | | | | |
| 5,370 | Alphabet Inc. - Class A * | | 810,494 | | | |
| 795 | Meta Platforms, Inc. - Class A * | | 386,036 | | | |
| 1,900 | Zoom Video Communications, Inc. - Class A * | | 124,203 | | | |
| | | | 1,320,733 | | 16.40 | % |
| Services - Prepackaged Software | | | | | |
| 260 | Adobe Inc. * | | 131,196 | | | |
| 2,435 | Block, Inc. - Class A * | | 205,952 | | | |
| 2,555 | Microsoft Corporation | | 1,074,940 | | | |
| | | | 1,412,088 | | 17.54 | % |
| Special Industry Machinery, NEC | | | | | |
| 250 | Lam Research Corporation | | 242,893 | | 3.02 | % |
| |
| Total Common Stocks (Cost $2,963,214) | | 7,684,157 | | 95.43 | % |
| Money Market Funds | | | | | |
| 146,900 | Invesco Government & Agency Portfolio Institutional Class 5.24% *** | | 146,900 | | 1.82 | % |
| | (Cost - $146,900) | | | | | |
| | Total Investments | | | | | |
| | (Cost - $3,110,114) | | 7,831,057 | | 97.25 | % |
| | Other Assets in Excess of Liabilities | | 221,650 | | 2.75 | % |
| | Net Assets | $ | 8,052,707 | | 100.00 | % |
* Non-Income producing securities.
** ADR - American Depositary Receipt.
*** The rate shown was the 7-day yield at March 31, 2024.
The accompanying notes are an integral part of the financial
statements. |
2024 Annual Report 6
| WIRELESS FUND | |
| | |
| Statement of Assets and Liabilities | | | | |
| March 31, 2024 | | | | |
| | |
| Assets: | | | | |
| Investments at Fair Value | $ | 7,831,057 | | |
| (Cost - $3,100,114) | | | | |
| Cash | | 2,153 | | |
| Receivables: | | | | |
| Dividends | | 2,133 | | |
| Securities Sold | | 262,283 | | |
| Total Assets | | 8,097,626 | | |
| Liabilities: | | | | |
| Payables: | | | | |
| Shareholder Redemptions | | 20,146 | | |
| Management Fees | | 24,773 | | |
| Total Liabilities | | 44,919 | | |
| | |
| Net Assets | $ | 8,052,707 | | |
| Net Assets Consist of: | | | | |
| Paid In Capital | $ | 3,231,709 | | |
| Total Distributable Earnings (Accumulated Deficit) | | 4,820,998 | | |
| Net Assets, for 484,642 Shares Outstanding | $ | 8,052,707 | | |
| (Unlimited number of shares authorized without par value) | | | | |
| Net Asset Value and Offering Price | | | | |
| Per Share ($8,052,707/484,642 shares) | $ | 16.62 | | |
| Minimum Redemption Price Per Share * ($16.62x0.98) | $ | 16.29 | | |
| | |
| | |
| Statement of Operations | | | | |
| For the fiscal year ended March 31, 2024 | | | | |
| | |
| Investment Income: | | | | |
| Dividends (Net of foreign withholding tax of $495) | $ | 55,048 | | |
| Total Investment Income | | 55,048 | | |
| Expenses: | | | | |
| Management Fees | | 129,430 | | |
| Total Expenses | | 129,430 | | |
| | |
| Net Investment Income (Loss) | | (74,382 | ) | |
| | |
| Net Realized and Unrealized Gain (Loss) on Investments: | | | | |
| Net Realized Gain (Loss) on Investments | | 122,255 | | |
| Net Change in Unrealized Appreciation (Depreciation) on Investments | | 2,858,159 | | |
| Net Realized and Unrealized Gain (Loss) on Investments | | 2,980,414 | | |
| | |
| Net Increase (Decrease) in Net Assets from Operations | $ | 2,906,032 | | |
* Reflects a 2% redemption fee if shares are redeemed within 90 days of purchase.
The accompanying notes are an integral part of the financial
statements. |
2024 Annual Report 7
| WIRELESS FUND | |
| | |
| Statements of Changes in Net Assets | | | | | | | | |
| | | 4/1/2023 | | | | 4/1/2022 | | |
| | | to | | | | to | | |
| | | 3/31/2024 | | | | 3/31/2023 | | |
| From Operations: | | | | | | | | |
| Net Investment Income (Loss) | $ | (74,382 | ) | | $ | (46,075 | ) | |
| Net Realized Gain (Loss) on Investments | | 122,255 | | | | 118,452 | | |
| Net Change in Unrealized Appreciation (Depreciation) | | 2,858,159 | | | | (819,652 | ) | |
| Increase (Decrease) in Net Assets from Operations | | 2,906,032 | | | | (747,275 | ) | |
| | |
| From Distributions to Shareholders: | | (33,066 | ) | | | (289,211 | ) | |
| | |
| From Capital Share Transactions: | | | | | | | | |
| Proceeds From Sale of Shares | | 878,392 | | | | 71,363 | | |
| Proceeds From Redemption Fees (Note 2) | | 1,027 | | | | 316 | | |
| Shares Issued on Reinvestment of Dividends | | 32,699 | | | | 279,375 | | |
| Cost of Shares Redeemed | | (1,088,250 | ) | | | (402,649 | ) | |
| Net Increase (Decrease) from Shareholder Activity | | (176,132 | ) | | | (51,595 | ) | |
| | |
| Net Increase (Decrease) in Net Assets | | 2,696,834 | | | | (1,088,081 | ) | |
| | |
| Net Assets at Beginning of Year | | 5,355,873 | | | | 6,443,954 | | |
| Net Assets at End of Year | $ | 8,052,707 | | | $ | 5,355,873 | | |
| | |
| Share Transactions: | | | | | | | | |
| Issued | | 66,099 | | | | 6,749 | | |
| Reinvested | | 2,319 | | | | 30,667 | | |
| Redeemed | | (76,447 | ) | | | (37,667 | ) | |
| Net Increase (Decrease) in Shares | | (8,029 | ) | | | (251 | ) | |
| Shares Outstanding, Beginning of Year | | 492,671 | | | | 492,922 | | |
| Shares Outstanding, End of Year | | 484,642 | | | | 492,671 | | |
| Financial Highlights | | | | | | | | | | | | | | | | | | | | | | |
| Selected data for a share outstanding | | | 4/1/2023 | | | | 4/1/2022 | | | | | 4/1/2021 | | | | 4/1/2020 | | | | 4/1/2019 | | |
| throughout the year: | | | to | | | | to | | | | | to | | | | to | | | | to | | |
| | | | 3/31/2024 | | | | 3/31/2023 | | | | | 3/31/2022 | | | | 3/31/2021 | | | | 3/31/2020 | | |
| Net Asset Value - | | | | | | | | | | | | | | | | | | | | | | |
| Beginning of Year | | $ | 10.87 | | | $ | 13.07 | | | | $ | 14.27 | | | $ | 10.02 | | | $ | 11.78 | | |
| Net Investment Income (Loss) (a) | | | (0.15 | ) | | | (0.10 | ) | | | | (0.20 | ) | | | (0.19 | ) | | | (0.14 | ) | |
| Net Realized and Unrealized Gain (Loss) | | | | | | | | | | | | | | | | | | | | | | |
| on Investments (b) | | | 5.96 | | | | (1.49 | ) | | | | 1.44 | | | | 6.02 | | | | 0.76 | | |
| Total from Investment Operations | | | 5.81 | | | | (1.59 | ) | | | | 1.24 | | | | 5.83 | | | | 0.62 | | |
| Proceeds from Redemption Fees | | | - | | * | | - | | * | | | - | | * | | 0.01 | | | | - | | * |
| Distributions (From Net Investment Income) | | | - | | | | - | | | | | - | | | | - | | | | - | | |
| Distributions (From Realized Capital Gains) | | | (0.06 | ) | | | (0.61 | ) | | | | (2.44 | ) | | | (1.59 | ) | | | (2.38 | ) | |
| Total Distributions | | | (0.06 | ) | | | (0.61 | ) | | | | (2.44 | ) | | | (1.59 | ) | | | (2.38 | ) | |
| Net Asset Value - | | | | | | | | | | | | | | | | | | | | | | |
| End of Year | | $ | 16.62 | | | $ | 10.87 | | | | $ | 13.07 | | | $ | 14.27 | | | $ | 10.02 | | |
| Total Return (c) | | | 53.58 | % | | | (11.25 | )% | | | | 7.13 | % | | | 58.58 | % | | | 3.74 | % | |
| Ratios/Supplemental Data | | | | | | | | | | | | | | | | | | | | | | |
| Net Assets - End of Year (Thousands) | | $ | 8,053 | | | $ | 5,356 | | | | $ | 6,444 | | | $ | 8,180 | | | $ | 5,174 | | |
| | |
| Ratio of Expenses to Average Net Assets | | | 1.95 | % | | | 1.95 | % | | | | 1.95 | % | | | 1.95 | % | | | 1.95 | % | |
| Ratio of Net Investment Income (Loss) to | | | | | | | | | | | | | | | | | | | | | | |
| Average Net Assets | | | -1.12 | % | | | -0.92 | % | | | | -1.34 | % | | | -1.44 | % | | | -1.20 | % | |
| Portfolio Turnover Rate | | | 6.79 | % | | | 12.40 | % | | | | 74.51 | % | | | 140.42 | % | | | 113.58 | % | |
* Amounts were less than $0.005 per share.
(a) Per Share amounts calculated using Average Shares Outstanding method.
(b) Realized and unrealized gains and losses per share in this caption are balancing amounts necessary to reconcile the
change in net asset value per share for the period, and may not reconcile with the aggregate gains and losses in the Statement
of Operations due to share transactions for the period.
(c) Total Return represents the rate that the investor would have earned or lost on an investment in the Fund assuming rein-
vestment of dividends. Total return calculations do not reflect redemption fee.
The accompanying notes are an integral part of the financial
statements. |
2024 Annual Report 8
NOTES TO FINANCIAL STATEMENTS - WIRELESS FUND
March 31, 2024
1.) ORGANIZATION
Wireless Fund (the “Fund”) is a non-diversified series of the PFS Funds (the “Trust”), an open-end investment company under the Investment Company Act of 1940 (the “1940 Act”), as amended. Prior to March 5, 2010, the Trust was named Wireless Fund. The Trust was organized in Massachusetts as a business trust on January 13, 2000, and may offer shares of beneficial interest in a number of separate series; each series representing a distinct fund with its own investment objectives and policies. The Fund, under normal market conditions, invests at least 80% of its assets in the securities of companies engaged in the development, production, or distribution of wireless related products or services. As of March 31, 2024, there were twelve series operating in the Trust. The Fund’s primary investment objective is to seek long-term growth of capital.
2.) SIGNIFICANT ACCOUNTING POLICIES
The Fund is an investment company and accordingly follows the investment company accounting and reporting guidance of the Financial Accounting Standards Board (“FASB”) Accounting Standards Codification Topic 946 Financial Services - Investment Companies. The financial statements are prepared in conformity with accounting principles generally accepted in the United States of America (“GAAP”). The Fund follows the significant accounting policies described in this section.
SECURITY VALUATION
All investments in securities are recorded at their estimated fair value, as described in Note 3.
SHARE VALUATION
The net asset value per share (the “NAV”) is generally calculated as of the close of trading on the New York Stock Exchange (the “Exchange”) (normally 4:00 p.m. Eastern time) every day the Exchange is open. The NAV is calculated by taking the total value of the Fund’s assets, subtracting its liabilities, and then dividing by the total number of shares outstanding, rounded to the nearest cent. The offering price and redemption price per share is equal to the net asset value per share, except that shares of the Fund are subject to a redemption fee of 2% if redeemed within 90 days of purchase. During the fiscal year ended March 31, 2024, proceeds from redemption fees were $1,027.
DISTRIBUTIONS TO SHAREHOLDERS
Distributions to shareholders, which are determined in accordance with income tax regulations, are recorded on the ex-dividend date. The Fund may utilize earnings and profits distributed to shareholders on redemptions of shares as part of the dividends paid deduction. The treatment for financial reporting purposes of distributions made to shareholders during the year from net investment income or net realized capital gains may differ from their ultimate treatment for federal income tax purposes. These differences are caused primarily by differences in the timing of the recognition of certain components of income, expense, or realized capital gain for federal income tax purposes. Where such differences are permanent in nature, they are reclassified in the components of the net assets based on their ultimate characterization for federal income tax purposes. Any such reclassifications will have no effect on net assets, results of operations, or net asset values per share of the Fund.
FEDERAL INCOME TAXES
The Fund’s policy is to continue to comply with the requirements of the Internal Revenue Code that are applicable to regulated investment companies and to distribute all of its taxable income to shareholders. Therefore, no federal income tax provision is required. It is the Fund’s policy to distribute annually, prior to the end of the calendar year, dividends sufficient to satisfy excise tax requirements of the Internal Revenue Code. This Internal Revenue Code requirement may cause an excess of distributions over the book year-end accumulated income. In addition, it is the Fund’s policy to distribute annually, after the end of the fiscal year, any remaining net investment income and net realized capital gains.
The Fund recognizes the tax benefits of certain tax positions only where the position is “more likely than not” to be sustained assuming examination by tax authorities. Management has analyzed the Fund’s tax positions, and has concluded that no liability for unrecognized tax benefits should be recorded related to uncertain tax positions taken on returns filed for open tax years. The Fund identifies its major tax jurisdictions as U.S. Federal and State tax authorities; however the Fund is not aware of any tax positions for which it is reasonably possible that the total amounts of unrecognized tax benefits will change materially in the next twelve months. The
2024 Annual Report 9
Notes to Financial Statements - continued
Fund recognizes interest and penalties, if any, related to unrecognized tax benefits as income tax expense in the Statement of Operations. During the fiscal year ended March 31, 2024, the Fund did not incur any interest or penalties.
USE OF ESTIMATES
The financial statements are prepared in accordance with GAAP, which requires management to make estimates and assumptions that affect the reported amounts of assets and liabilities and disclosure of contingent assets and liabilities at the date of the financial statements and the reported amounts of increases and decreases in net assets from operations during the reporting period. Actual results could differ from those estimates.
OTHER
The Fund records security transactions based on trade date. Dividend income is recognized on the ex-dividend date, and interest income, if any, is recognized on an accrual basis. The Fund uses the specific identification method in computing gain or loss on the sale of investment securities. Withholding taxes on foreign dividends have been provided for in accordance with the Fund’s understanding of the applicable country’s tax rules and rates.
The Fund may invest in real estate investment trusts (“REITs”) that pay distributions to their shareholders based on available funds from operations. It is common for these distributions to exceed the REITs’ taxable earnings and profits resulting in the excess portion of such distribution to be designated as return of capital. Distributions received from REITs are generally recorded as dividend income and, if necessary, are reclassified annually in accordance with tax information provided by the underlying REITs.
EXPENSES
Expenses incurred by the Trust that do not relate to a specific fund of the Trust are allocated to the individual funds based on each fund’s relative net assets or another appropriate basis.
3.) SECURITIES VALUATIONS
The Fund utilizes various methods to measure the fair value of its investments on a recurring basis. GAAP establishes a hierarchy that prioritizes inputs to valuation methods. The three levels of inputs are:
Level 1 - Unadjusted quoted prices in active markets for identical assets or liabilities that the Fund has the ability to access.
Level 2 - Observable inputs other than quoted prices in active markets included in level 1 that are observable for the asset or liability, either directly or indirectly. These inputs may include quoted prices for the identical instrument on an inactive market, prices for similar instruments, interest rates, prepayment speeds, credit risk, yield curves, default rates and similar data.
Level 3 - Unobservable inputs for the asset or liability, to the extent relevant observable inputs are not available, representing the Fund’s own assumptions about the assumptions a market participant would use in valuing the asset or liability, and would be based on the best information available.
The availability of observable inputs can vary from security to security and is affected by a wide variety of factors, including, for example, the type of security, whether the security is new and not yet established in the marketplace, the liquidity of markets, and other characteristics particular to the security. To the extent that valuation is based on models or inputs that are less observable or unobservable in the market, the determination of fair value requires more judgment. Accordingly, the degree of judgment exercised in determining fair value is greatest for instruments categorized in level 3.
The inputs used to measure fair value may fall into different levels of the fair value hierarchy. In such cases, for disclosure purposes, the level in the fair value hierarchy within which the fair value measurement falls in its entirety, is determined based on the lowest level input that is significant to the fair value measurement in its entirety.
VALUATION OF FUND ASSETS
A description of the valuation techniques applied to the Fund’s major categories of assets measured at fair value on a recurring basis follows.
2024 Annual Report 10
Notes to Financial Statements - continued
Equity securities (common stocks, including ADRs). Equity securities generally are valued by using market quotations, but may be valued on the basis of prices furnished by a pricing service when the Valuation Designee believes such prices accurately reflect the fair value of such securities. Securities that are traded on any stock exchange or on the NASDAQ over-the-counter market are generally valued by the pricing service at the last quoted sale price. Lacking a last sale price, an equity security is generally valued by the pricing service at its last bid price. Generally, if the security is traded in an active market and is valued at the last sale price, the security is categorized as a level 1 security, and if an equity security is valued by the pricing service at its last bid price, it is generally categorized as a level 2 security. When market quotations are not readily available, when the Valuation Designee determines that the market quotation or the price provided by the pricing service does not accurately reflect the current fair value, or when restricted securities are being valued, such securities are valued as determined in good faith by the Valuation Committee, which includes the Valuation Designee, subject to review of the Board and are categorized in level 2 or level 3, when appropriate.
Money market funds. Shares of money market funds are valued at net asset value provided by the fund and are classified in level 1 of the fair value hierarchy.
In accordance with the Trust’s good faith pricing guidelines, the Valuation Designee is required to consider all appropriate factors relevant to the value of securities for which it has determined other pricing sources are not available or reliable as described above. There is no single standard procedure for determining fair value, since fair value depends upon the circumstances of each individual case. As a general principle, the current fair value of an issue of securities being valued by the Valuation Designee would appear to be the amount which the owner might reasonably expect to receive for them upon their current sale. Methods which are in accordance with this principle may, for example, be based on (i) a multiple of earnings; (ii) a discount from market of a similar freely traded security (including a derivative security or a basket of securities traded on other markets, exchanges or among dealers); or (iii) yield to maturity with respect to debt issues, or a combination of these and other methods. The Board maintains responsibilities for the fair value determinations under Rule 2a-5 under the 1940 Act and oversees the Valuation Designee.
The following table summarizes the inputs used to value the Fund’s assets measured at fair value as of March 31, 2024:
| Valuation Inputs of Assets | | Level 1 | Level 2 | Level 3 | Total |
| Common Stocks | | $7,684,157 | $– | $– | $7,684,157 |
| Money Market Funds | | 146,900 | – | – | 146,900 |
| Total | | $7,831,057 | $– | $– | $7,831,057 |
Refer to the Fund’s Schedule of Investments for a listing of securities by industry. The Fund did not hold any level 3 assets during the fiscal year ended March 31, 2024.
The Fund did not invest in any derivative instruments during the fiscal year ended March 31, 2024.
4.) INVESTMENT ADVISORY AGREEMENT
Value Trend Capital Management, LP (the “Adviser”), manages the investment portfolio of the Fund, subject to policies adopted by the Trust’s Trustees. Under the Management Agreement, the Adviser, at its own expense and without reimbursement from the Trust, furnishes office space and all necessary office facilities, equipment and executive personnel necessary for managing the Fund. The Adviser also pays the salaries and fees of all officers and trustees of the Trust who are also officers, partners, or employees of the Adviser. The Adviser pays all operating expenses of the Fund, with the exception of taxes, borrowing expenses (such as (a) interest and (b) dividend expenses on securities sold short), brokerage commissions and extraordinary expenses and any indirect expenses, such as expenses incurred by other investment companies in which the Fund invests. For its services, the Adviser receives a fee of 1.95% per year of the average daily net assets of the Fund. As a result of the above calculation, for the fiscal year ended March 31, 2024, the Adviser received management fees totaling $129,430. At March 31, 2024, the Fund owed $24,773 to the Adviser.
5.) RELATED PARTY TRANSACTIONS
Certain officers and a Trustee of the Trust are also officers of Premier Fund Solutions (the “Administrator”). Additionally, a control person of the Adviser serves as a trustee and officer of
2024 Annual Report 11
Notes to Financial Statements - continued
the Trust. These individuals receive benefits from the Adviser resulting from management fees paid to the Adviser of the Fund.
For the fiscal year ended March 31, 2024, the Trustees who are not interested persons of the Fund, each received $1,500, for a total of $6,000, plus travel and related expenses from the Adviser of the Fund. Under the Management Agreement, the Adviser pays these fees.
6.) PURCHASES AND SALES OF SECURITIES
For the fiscal year ended March 31, 2024, purchases and sales of investment securities other than U.S. Government obligations and short-term investments aggregated $439,941 and $956,724, respectively. Purchases and sales of U.S. Government obligations aggregated $0 and $0, respectively.
7.) TAX MATTERS
For federal income tax purposes, the cost of investments owned at March 31, 2024, was $3,110,114. At March 31, 2024, the composition of unrealized appreciation (the excess of value over tax cost) and depreciation (the excess of tax cost over value) on a tax basis was as follows:
| | Appreciation | | (Depreciation) | | Net Appreciation (Depreciation) |
| | $4,790,209 | | ($69,266) | | $4,720,943 |
The tax character of distributions was as follows:
| | | Year ended | | Year ended |
| | | March 31, 2024 | | March 31, 2023 |
| Ordinary Income: | | $ – | | $ – |
| Long-term Capital Gain: | | 33,066 | | 289,211 |
| | | $ 33,066 | | $ 289,211 |
As of March 31, 2024, the components of distributable earnings (accumulated losses) on a tax basis were as follows:
| Other Accumulated Losses | | $ (22,103 | ) |
| Undistributed Long-Term Capital Gains | | 122,158 | |
| Unrealized Appreciation on Investments – Net | | 4,720,943 | |
| | | $ 4,820,998 | |
As of March 31, 2024, there was no difference between book basis and tax basis unrealized appreciation. As of March 31, 2024, the Fund deferred late year ordinary losses of $22,103, which is included in other accumulated losses. As of the fiscal year ended March 31, 2024, the following adjustment was recorded and was primarily related to the reclassification of net operating loss:
| Paid in Capital | | ($62,443 | ) |
| Total Distributable Earnings | | $62,443 | |
8.) CONCENTRATION OF SECTOR RISK
If a Fund has significant investments in the securities of issuers in industries within a particular sector, any development affecting that sector will have a greater impact on the value of the net assets of the Fund than would be the case if the Fund did not have significant investments in that sector. In addition, this may increase the risk of loss of an investment in the Fund and increase the volatility of the Fund’s NAV per share. From time to time, circumstances may affect a particular sector and the companies within such sector. For instance, economic or market factors, regulation or deregulation, and technological or other developments may negatively impact all companies in a particular sector and therefore the value of a Fund’s portfolio will be adversely affected. As of March 31, 2024, the Fund had 30.41% of the value of its net assets invested in stocks within the Semiconductors & Related Devices sector.
9.) CONTROL OWNERSHIP
The beneficial ownership, either directly or indirectly, of more than 25% of the voting securities of a fund creates a presumption of control of the Fund, under Section 2(a)(9) of the 1940 Act. As of March 31, 2024, Charles Schwab & Co., Inc., held, for the benefit of its customers, in the aggregate, 34.19% of Fund shares. The Trust does not know whether any underlying accounts
2024 Annual Report 12
Notes to Financial Statements - continued
of Charles Schwab & Co., Inc. owned or controlled 25% or more of the voting securities of the Fund.
10.) SUBSEQUENT EVENTS
Subsequent events after the date of the Statement of Assets and Liabilities have been evaluated through the date the financial statements were issued. Management has concluded that there is no impact requiring adjustment to or disclosure in the financial statements.
2024 Annual Report 13
REPORT OF INDEPENDENT REGISTERED PUBLIC ACCOUNTING FIRM
To the Shareholders of Wireless Fund and
Board of Trustees of PFS Funds
Opinion on the Financial Statements
We have audited the accompanying statement of assets and liabilities, including the schedule of investments, of Wireless Fund (the “Fund”), a series of PFS Funds, as of March 31, 2024, the related statement of operations for the year then ended, the statements of changes in net assets for each of the two years in the period then ended, the financial highlights for each of the five years in the period then ended, and the related notes (collectively referred to as the “financial statements”). In our opinion, the financial statements present fairly, in all material respects, the financial position of the Fund as of March 31, 2024, the results of its operations for the year then ended, the changes in net assets for each of the two years in the period then ended, and the financial highlights for each of the five years in the period then ended, in conformity with accounting principles generally accepted in the United States of America.
Basis for Opinion
These financial statements are the responsibility of the Fund’s management. Our responsibility is to express an opinion on the Fund’s financial statements based on our audit. We are a public accounting firm registered with the Public Company Accounting Oversight Board (United States) (“PCAOB”) and are required to be independent with respect to the Fund in accordance with the U.S. federal securities laws and the applicable rules and regulations of the Securities and Exchange Commission and the PCAOB.
We conducted our audits in accordance with the standards of the PCAOB. Those standards require that we plan and perform the audit to obtain reasonable assurance about whether the financial statements are free of material misstatement whether due to error or fraud.
Our audits included performing procedures to assess the risks of material misstatement of the financial statements, whether due to error or fraud, and performing procedures that respond to those risks. Such procedures included examining, on a test basis, evidence regarding the amounts and disclosures in the financial statements. Our procedures included confirmation of securities owned as of March 31, 2024, by correspondence with the custodian and brokers. Our audits also included evaluating the accounting principles used and significant estimates made by management, as well as evaluating the overall presentation of the financial statements. We believe that our audits provide a reasonable basis for our opinion.
We have served as the Fund’s auditor since 2004.

COHEN & COMPANY, LTD.
Milwaukee, Wisconsin
May 24, 2024
2024 Annual Report 14
ADDITIONAL INFORMATION - WIRELESS FUND
March 31, 2024
(UNAUDITED)
1.) APPROVAL OF THE CONTINUATION OF THE MANAGEMENT AGREEMENT
On March 7, 2024 the Board of Trustees (the “Board” or “Trustees”) for the Wireless Fund met to consider the renewal of the Management Agreement (the “Management Agreement”). In approving the Management Agreement, the Board considered and evaluated the following factors: (i) the nature, extent and quality of the services provided by Value Trend to the Wireless Fund; (ii) the investment performance of the Wireless Fund; (iii) the cost of the services to be provided and the profits to be realized by Value Trend and its affiliates from the relationship with the Wireless Fund; (iv) the extent to which economies of scale will be realized as the Wireless Fund grows and whether the fee levels reflect these economies of scale to the benefit of shareholders; and (v) Value Trend’s practices regarding possible conflicts of interest.
In assessing these factors and reaching its decisions, the Board took into consideration information furnished throughout the year at regular Board meetings, as well as information specifically prepared and/or presented in connection with the annual renewal process, including information presented at the Meeting. The Board requested and was provided with information and reports relevant to the annual renewal of the Management Agreement, including: (i) information regarding the services and support provided to the Wireless Fund and its shareholders by Value Trend; (ii) assessments of the investment performance of the Wireless Fund by Value Trend; (iii) commentary on the reasons for the performance; (iv) presentations addressing Value Trend’s investment philosophy, investment strategy, personnel and operations; (v) compliance and audit reports concerning the Wireless Fund and Value Trend; (vi) disclosure information contained in the registration statement of the Wireless Fund and the Form ADV of Value Trend; and (vii) a memorandum from Counsel that summarized the fiduciary duties and responsibilities of the Board in reviewing and approving the Management Agreement, including the material factors set forth above and the types of information included in each factor that should be considered by the Board in order to make an informed decision. The Board also requested and received various informational materials including, without limitation: (i) documents containing information about Value Trend, including financial information, a description of personnel and the services provided to the Wireless Fund, information on investment advice, performance, summaries of Wireless Fund expenses, compliance program, current legal matters, and other general information; (ii) comparative expense and performance information for other mutual funds with strategies similar to the Wireless Fund; and (iii) benefits to be realized by Value Trend from its relationship with the Wireless Fund. The Board did not identify any particular information that was most relevant to its consideration to approve the Management Agreement and each Trustee may have afforded different weight to the various factors.
1. Nature, Extent and Quality of the Services Provided by Value Trend
In considering the nature, extent, and quality of the services provided by Value Trend, the Trustees reviewed the responsibilities of Value Trend under the Management Agreement. The Trustees reviewed the services being provided by Value Trend to the Wireless Fund including, without limitation: the quality of its investment advisory services (including research and recommendations with respect to portfolio securities); its process for formulating investment recommendations and assuring compliance with the Wireless Fund’s investment objective, strategies, and limitations, as well as for ensuring compliance with regulatory requirements; its coordination of services for the Wireless Fund among the service providers and the Independent Trustees; its efforts to promote the Wireless Fund and grow its assets; and its provision of a Chief Compliance Officer to the Wireless Fund. The Trustees noted Value Trend’s commitment to retain qualified personnel and its commitment to maintain its resources and systems; the commitment of Value Trend to finding alternatives and options that allow the Wireless Fund to maintain its goals; and Value Trend’s continued cooperation with the Independent Trustees and Counsel for the Wireless Fund. The Trustees evaluated Value Trend’s personnel, including the education and experience of its personnel. After reviewing the foregoing information and further information in the materials provided by Value Trend (including Value Trend’s Form ADV), the Board concluded that, in light of all the facts and circumstances, the nature, extent, and quality of the services provided by Value Trend were satisfactory and adequate for the Wireless Fund.
2. Investment Performance of the Wireless Fund and Value Trend
In considering the investment performance of the Wireless Fund, the Trustees compared the short and long-term performance of the Wireless Fund with the performance of funds with simi-
2024 Annual Report 15
Additional Information (Unaudited) - continued
lar objectives managed by other investment advisers, as well as with aggregated peer group data and category averages. It was noted that information on the Wireless Fund’s Morningstar category, the U.S. Fund Technology category (“Technology Category”), as well as the U.S. Fund Communications category (“Communications Category”), were both included for comparative purposes. The Trustees noted that Value Trend did not manage any other clients with objectives and strategies like the Wireless Fund. As to the performance of the Wireless Fund, the Trustees considered how the Wireless Fund’s performance compared to the average performance of funds included in the Technology and Communications Categories and to a group of funds of similar size derived from the Technology and Communications Categories with assets up to $35 million (the "Peer Group"). The Trustees noted that the Wireless Fund outperformed both the Technology and Communications Categories for the 1-, 3-, and 5- year periods ended December 31, 2023, and outperformed the Communications Category for the 10- year period ended December 31, 2023, but underperformed the Technology Category for the 10-year period ended December 31, 2023. The Trustees also compared the Wireless Fund’s performance to the Wireless Fund’s benchmark, the NASDAQ Composite Index, noting that the Wireless Fund outperformed the NASDAQ Composite Index for the 1-, 3-, and 5-year periods ended December 31, 2023 but underperformed NASDAQ Composite Index for the 10-year period ended December 31, 2023. After discussing the investment performance of the Wireless Fund further, as well as reflecting on Value Trend’s experience managing and providing services to the Wireless Fund, and other relevant factors, the Board concluded, in light of all the facts and circumstances, that the investment performance of the Wireless Fund was satisfactory.
3. Costs of the Services to be provided and profits to be realized by Value Trend
In considering the costs of the services to be provided and profits to be realized by Value Trend from the relationship with the Wireless Fund, the Trustees considered: (1) Value Trend’s financial condition and the level of commitment to the Wireless Fund by Value Trend; (2) the asset level of the Wireless Fund; (3) the overall expenses of the Wireless Fund; and (4) the nature and frequency of advisory fee payments. The Trustees reviewed information provided by Value Trend regarding its profits associated with managing the Wireless Fund, noting that Value Trend realized a small loss with respect to the services it provided to the Wireless Fund. The Trustees also considered potential benefits for Value Trend in managing the Wireless Fund. The Trustees then compared the fees and expenses of the Wireless Fund (including the management fee) to the Peer Group and the combined Morningstar Technology and Communications Categories. The Trustees reviewed the fees under the Management Agreement compared to the Peer Group, noting that the management fee of 1.95% was the highest management fee in the Peer Group and in the combined Technology and Communications Categories. They also noted that the Wireless Fund’s expense ratio was higher than the average and median expense ratios for the Peer Group and combined Technology and Communications Categories. The Trustees discussed the size of the Wireless Fund and how it compared to average size of funds in the Peer Group and the combined Technology and Communications Categories. The Trustees noted that although the management fee is high relative to the Peer Group and Category averages, the Wireless Fund’s expense ratio was within the range of expense ratios of the Peer Group and the combined Technology and Communications category. They also recognized that Value Trend is responsible under the Management Agreement for paying most of the operating expenses of the Wireless Fund. Based on the foregoing, the Board concluded that the fees to be paid to Value Trend by the Wireless Fund and the profits to be realized by Value Trend, in light of all the facts and circumstances, were fair and reasonable in relation to the nature and quality of the services provided by Value Trend.
4. Economies of Scale
The Trustees next considered the impact of economies of scale on the Wireless Fund’s size and whether management fee levels reflect those economies of scale for the benefit of the Wireless Fund’s investors. The Trustees considered that while the management fee remained the same at all asset levels, the Wireless Fund’s shareholders had experienced benefits from the fact that Value Trend was obligated to pay most of the Wireless Fund’s operating expenses, which had the effect of limiting the overall expense ratio of the Wireless Fund. In light of its ongoing consideration of the Wireless Fund’s asset levels, expectations for growth in the Wireless Fund, Value Trend’s commitment to consider adding fee breakpoints as the Fund grows, and fee levels, the Board determined that the Wireless Fund’s fee arrangements, in light of all the facts and circumstances, were fair and reasonable in relation to the nature and quality of the services provided by Value Trend.
2024 Annual Report 16
Additional Information (Unaudited) - continued
5. Value Trend’s Practices Regarding Possible Conflicts of Interest and Benefits to Value Trend
In considering Value Trend’s practices regarding conflicts of interest, the Trustees evaluated the potential for conflicts of interest and considered such matters as the experience and ability of the advisory personnel assigned to the Wireless Fund; the basis of decisions to buy or sell securities for the Wireless Fund; and the substance and administration of Value Trend’s code of ethics. The Trustees also considered disclosure in the registration statement of the Wireless Fund related to Value Trend’s potential conflicts of interest. The Trustees noted that although an affiliate of Value Trend provides administrative services to the Wireless Fund, as well as the other series portfolios of the Trust, and that the principals of Value Trend derived benefits from that relationship with the Trust – the Trustees concluded that the principals of Value Trend had demonstrated a history of openness and complete disclosure regarding this relationship. Based on the foregoing, the Board determined that Value Trend’s standards and practices relating to the identification and mitigation of possible conflicts of interest were satisfactory.
Next, the Independent Trustees met in executive session to discuss the continuation of the Management Agreement. The officers of the Trust and certain other attendees were excused during this discussion.
After further review and discussion, it was the determination of the Board that the best interests of the Wireless Fund’s shareholders were served by the renewal of the Management Agreement.
2024 Annual Report 17
Trustees and Officers
(Unaudited) |
The Board of Trustees supervises the business activities of the Trust. The names of the Trustees and executive officers of the Trust are shown below. For more information regarding the Trustees, please refer to the Statement of Additional Information, which is available upon request by calling 800.231.2901. Each Trustee serves until the Trustee sooner dies, resigns, retires, or is removed.
The Trustees and Officers of the Trust and their principal business activities during the past five years are:
Interested Trustees and Officers
| | | | | Number of | |
| | | | Principal | Portfolios In | Other |
| Name, | Position(s) | Term of Office | Occupation(s) | Fund | Directorships |
| Address(1), | Held With | and Length of | During | Complex | Held By |
| and Year of Birth | the Trust | Time Served | Past 5 Years | Overseen By | Trustee |
| | | | | Trustee | |
| |
| James D. Craft, | President | Indefinite Term; | Fund Administrator, Premier Fund | N/A | N/A |
| Year of Birth: 1982 | | Since 2023 | Solutions, Inc. (2007 - present); | | |
| | | | Chief Technology Officer, Premier | | |
| | | | Fund Solutions, Inc. (2011 - pre- | | |
| sent). |
| |
| Jeffrey R. Provence(2), | Trustee, | Indefinite Term; | CEO, Premier Fund Solutions, Inc. | 12 | Blue Chip |
| Year of Birth: 1969 | Secretary, | Since 2000 | (2001 to current). General Partner | | Investor Funds, |
| | Treasurer | | and Portfolio Manager for Value | | Meeder Funds |
| | and Chief | | Trend Capital Management, LP | | |
| | Compliance | | (1995 to current). | | |
| | Officer | | | | |
(1) The address of each trustee and officer is c/o PFS Funds, 1939 Friendship Drive, Suite C, El Cajon, California 92020.
(2) Jeffrey R. Provence is considered an “interested person” as defined in Section 2(a)(19) of the 1940 Act by virtue of his position with the Trust.
Independent Trustees
| | | | | Number of | |
| | | | Principal | Portfolios In | Other |
| Name, | Position | Term of Office | Occupation(s) | Fund | Directorships |
| Address(1), | Held With | and Length of | During | Complex | Held By |
| and Year of Birth | the Trust | Time Served | Past 5 Years | Overseen By | Trustee |
| | | | | Trustee | |
| |
| Thomas H. Addis III, | Independent | Indefinite Term; | Executive Director/CEO, Southern | 12 | None |
| Year of Birth: 1945 | Trustee | Since 2000 | California PGA (2006 to current). | | |
| |
| Robert L. Boerner, | Independent | Indefinite Term; | Owner / Broker of Gecko Realty | 12 | Blue Chip |
| Year of Birth: 1969 | Trustee | Since 2022 | (2008 to current). | | Investor Funds, |
| | | | | | Neiman Funds |
| |
| Allen C. Brown, | Independent | Indefinite Term; | Retired. Law Office of Allen C. | 12 | Blue Chip |
| Year of Birth: 1943 | Trustee | Since 2010 | Brown, estate planning and business | | Investor Funds |
| | | | attorney (1970 to 2021). | | |
| |
| John W. Czechowicz, | Independent | Indefinite Term; | CPA at CWDL (2016 to current). | 12 | None |
| Year of Birth: 1983 | Trustee | Since 2022 | | | |
(1) The address of each trustee and officer is c/o PFS Funds, 1939 Friendship Drive, Suite C, El Cajon, California 92020.
2024 Annual Report 18
Investment Adviser
Value Trend Capital Management, LP
1939 Friendship Drive, Suite C
El Cajon, CA 92020
Dividend Paying Agent,
Shareholders' Servicing Agent,
Transfer Agent
Mutual Shareholder Services, LLC
8000 Town Centre Dr., Suite 400
Broadview Heights, OH 44147
Distributor
Arbor Court Capital, LLC
8000 Town Centre Dr., Suite 400
Broadview Heights, OH 44147
Independent Registered Public Accounting Firm
Cohen & Company, Ltd.
342 North Water St., Suite 830
Milwaukee, WI 53202 |
This report is provided for the general information of the shareholders of the Wireless
Fund. This report is not intended for distribution to prospective investors in the Fund,
unless preceded or accompanied by an effective prospectus. |
(b) Not applicable.
Item 2. Code of Ethics.
The registrant has adopted a code of ethics that applies to the registrant’s principal executive officer and the principal financial officer. The registrant has not made any amendments to its code of ethics during the covered period. The registrant has not granted any waivers from any provisions of the code of ethics during the covered period. A copy of the registrant’s Code of Ethics is filed herewith.
Item 3. Audit Committee Financial Expert.
The registrant's Board of Trustees has determined that John W. Czechowicz is an audit committee financial expert. Mr. Czechowicz is independent for purposes of this Item 3.
Item 4. Principal Accountant Fees and Services.
(a-d) The following table details the aggregate fees billed for each of the last two fiscal years for audit fees, audit-related fees, tax fees and other fees by the principal accountant to the registrant. The principal accountant has provided no services to the adviser or any entity controlled by, or under common control with the adviser that provides ongoing services to the registrant.
| | | FYE 3/31/2024 | | FYE 3/31/2023 |
| Audit Fees | | $13,750 | | $13,750 |
| Audit-Related Fees | | $0 | | $0 |
| Tax Fees | | $3,500 | | $3,500 |
| All Other Fees | | $750 | | $750 |
Nature of Tax Fees: preparation of Excise Tax Statement, 1120 RIC, and review of year end dividend calculation.
All Other Fees: Semi-Annual Report Review
(e) (1) The audit committee approves all audit and non-audit related services and, therefore, has not adopted pre-approval policies and procedures described in paragraph (c)(7) of Rule 2-01 of Regulation S-X.
(e) (2) None of the services described in paragraph (b) through (d) of this Item were approved by the audit committee pursuant to paragraph (c)(7)(i)(C) of Rule 2-01 of Regulation S-X.
(f) All of the principal accountant’s hours spent on auditing the registrant’s financial statements were attributed to work performed by full-time permanent employees of the principal accountant.
(g) The following table indicates the aggregate non-audit fees billed by the registrant’s principal accountant for services to the registrant , the registrant’s investment adviser (not sub-adviser), and any entity controlling, controlled by, or under common control with the adviser that provides ongoing services to the registrant, for the last two years.
| Non-Audit Fees | | FYE 3/31/2024 | | FYE 3/31/2023 |
| Registrant | | $4,250 | | $4,250 |
| Registrant’s Investment Adviser | | $0 | | $0 |
(h) The principal accountant provided no services to the investment adviser or any entity controlling, controlled by, or under common control with the adviser that provides ongoing services to the registrant.
(i) Not applicable.
(j) Not applicable.
Item 5. Audit Committee of Listed Companies. Not applicable.
Item 6. Investments.
(a) Not applicable. Schedule filed with Item 1.
(b) Not applicable.
Item 7. Disclosure of Proxy Voting Policies and Procedures for Closed-End Management Investment Companies. Not applicable.
Item 8. Portfolio Managers of Closed End Management Investment Companies. Not applicable.
Item 9. Purchases of Equity Securities by Closed-End Management Investment Companies and Affiliated Purchasers. Not applicable.
Item 10. Submission of Matters to a Vote of Security Holders.
The registrant has not adopted procedures by which shareholders may recommend nominees to the registrant’s board of trustees.
Item 11. Controls and Procedures.
(a) The Registrant’s president and chief financial officer concluded that the disclosure controls and procedures (as defined in Rule 30a-3(c) under the Act (17 CFR 270.30a -3(c))) as of a date within 90 days of the filing date of the report that includes the disclosure required by this paragraph, based on the evaluation of these controls and procedures required by Rule 30a-3(b) under the Act (17 CFR 270.30a -3(b)) and Rules 13a-15(b) or 15d-15(b) under the Exchange Act (17 CFR 240.13a -15(b) or 240.15d -15(b)).
(b) There were no changes in the registrant’s internal control over financial reporting (as defined in Rule 30a-3(d) under the Act (17 CFR 270.30a -3(d)) that occurred during the period covered by this report that has materially affected, or is reasonably likely to materially affect, the registrant’s internal control over financial reporting.
Item 12. Disclosure of Securities Lending Activities for Closed-End Management Investment Companies.
Not applicable.
Item 13. Exhibits.
(a)(1) Code of Ethics. Filed herewith.
(a)(2) Certifications pursuant to Section 302 of the Sarbanes-Oxley Act of 2002. Filed herewith.
(a)(3) Not applicable.
(a)(4) Not applicable.
(b) Certification pursuant to Section 906 of the Sarbanes-Oxley Act of 2002. Filed herewith.
Pursuant to the requirements of the Securities Exchange Act of 1934 and the Investment Company Act of 1940, the registrant has duly caused this report to be signed on its behalf by the undersigned, thereunto duly authorized.
| | By: /s/James Craft
James Craft
President |
Pursuant to the requirements of the Securities Exchange Act of 1934 and the Investment Company Act of 1940, this report has been signed below by the following persons on behalf of the registrant and in the capacities and on the dates indicated.
| | By: /s/James Craft
James Craft
President |
| | By: /s/Jeffrey R. Provence
Jeffrey R. Provence
Chief Financial Officer |