SECURITIES AND EXCHANGE COMMISSION
Washington, D.C. 20549
FORM 10-K
| | ANNUAL REPORT PURSUANT TO SECTION 13 OR 15(d) | |
| þ | OF THE SECURITIES EXCHANGE ACT OF 1934 | |
| | For the Fiscal Year Ended: December 31, 2007 | |
| | OR TRANSITION REPORT PURSUANT TO SECTION 13 OR 15(d) | |
| o | OF THE SECURITIES EXCHANGE ACT OF 1934 | |
| | For the transition period from . . . . to . . . . | |
Commission File Number: 1-7627
FRONTIER OIL CORPORATION
(Exact name of registrant as specified in its charter)
| Wyoming | | 74-1895085 |
| (State or other jurisdiction of | | (I.R.S. Employer |
| incorporation or organization) | | Identification No.) |
| | | |
| 10000 Memorial Drive, Suite 600 | | 77024-3411 |
| Houston, Texas | | (Zip Code) |
| (Address of principal executive offices) | | |
Registrant’s telephone number, including area code: (713) 688-9600
Securities registered pursuant to Section 12(b) of the Act:
| | Name of Each Exchange |
| Title of Each Class | | on Which Registered |
| Common Stock | | New York Stock Exchange |
Securities registered pursuant to Section 12(g) of the Act:
None
Indicate by check mark if the registrant is a well-known seasoned issuer, as defined in Rule 405 of the Securities Act.
Yes þ No ¨
Indicate by check mark if the registrant is not required to file reports pursuant to Section 13 or Section 15(d) of the Act.
Yes ¨ No þ
Indicate by check mark whether the registrant (1) has filed all reports required to be filed by Section 13 or 15(d) of the Securities Exchange Act of 1934 during the preceding 12 months (or for such shorter period that the registrant was required to file such reports), and (2) has been subject to such filing requirements for the past 90 days.
Yes þ No ¨
Indicate by check mark if disclosure of delinquent filers pursuant to rule 405 of Regulation S-K is not contained herein, and will not be contained, to the best of registrant’s knowledge, in definitive proxy or information statements incorporated by reference in Part III of this Form 10-K or any amendment to this Form 10-K. ü
Indicate by check mark whether the registrant is a large accelerated filer, an accelerated filer, a non-accelerated filer, or a smaller reporting company. See the definitions of “large accelerated filer,” “accelerated filer and “smaller reporting company” in Rule 12b-2 of the Exchange Act.
(Check one)
Large accelerated filer þ Accelerated filer ¨ Non-accelerated filer ¨ Smaller reporting company ¨
(Do not check if a smaller reporting company)
Indicate by check mark whether the registrant is a shell company (as defined in Rule 12b-2 of the Exchange Act).
Yes ¨ No þ
The aggregate market value of the voting and non-voting common equity held by non-affiliates computed by reference to the price at which the common equity was last sold as of June 29, 2007 was $4.5 billion.
The number of shares of common stock outstanding as of February 22, 2008 was 103,521,366.
DOCUMENTS INCORPORATED BY REFERENCE
Portions of the Annual Proxy Statement for the registrant’s 2008 annual meeting of shareholders are incorporated by reference into Items 10 through 14 of Part III.
Forward-Looking Statements
This Form 10-K contains “forward-looking statements” as defined by the Securities and Exchange Commission (“SEC”). Such statements are those concerning contemplated transactions and strategic plans, expectations and objectives for future operations. These include, without limitation:
| · | statements, other than statements of historical fact, that address activities, events or developments that we expect, believe or anticipate will or may occur in the future; |
| · | statements relating to future financial performance, future capital sources and other matters; and |
| · | any other statements preceded by, followed by or that include the words “anticipates,” “believes,” “expects,” “plans,” “intends,” “estimates,” “projects,” “could,” “should,” “may,” or similar expressions. |
Although we believe that our plans, intentions and expectations reflected in or suggested by the forward-looking statements we make in this Form 10-K are reasonable, we can give no assurance that such plans, intentions or expectations will be achieved. These statements are based on assumptions made by us based on our experience and perception of historical trends, current conditions, expected future developments and other factors that we believe are appropriate in the circumstances. Such statements are subject to a number of risks and uncertainties, many of which are beyond our control. You are cautioned that any such statements are not guarantees of future performance and that actual results or developments may differ materially from those projected in the forward-looking statements.
All forward-looking statements contained in this Form 10-K only speak as of the date of this document. We undertake no obligation to update or revise publicly any revisions to any such forward-looking statements that may be made to reflect events or circumstances after the date of this Form 10-K, or to reflect the occurrence of unanticipated events.
The terms “Frontier,” “we,” “us” and “our” as used in this Form 10-K refer to Frontier Oil Corporation and its subsidiaries, except where it is clear that those terms mean only the parent company. When we use the term “Rocky Mountain region,” we refer to the states of Colorado, Wyoming, Montana and Utah, and when we use the term “Plains States,” we refer to the states of Kansas, Oklahoma, eastern Nebraska, Iowa, Missouri, North Dakota and South Dakota.
Overview
We are an independent energy company, organized in the State of Wyoming in 1977, engaged in crude oil refining and the wholesale marketing of refined petroleum products. We operate refineries (the “Refineries”) in Cheyenne, Wyoming and El Dorado, Kansas with a total annual average crude oil capacity of approximately 162,000 barrels per day (“bpd”). Both of our Refineries are complex refineries, which means that they can process heavier, less expensive types of crude oil and still produce a high percentage of gasoline, diesel fuel and other high value refined products. We focus our marketing efforts in the Rocky Mountain region and the Plains States, which we believe are among the most attractive refined products markets in the United States. The operations of refining and marketing of petroleum products are considered part of one reporting segment.
Cheyenne Refinery. Our Cheyenne Refinery has a permitted crude oil capacity of 52,000 bpd on a twelve-month average. We market its refined products primarily in the eastern slope of the Rocky Mountain region, which encompasses eastern Colorado (including the Denver metropolitan area), eastern Wyoming and western Nebraska (the “Eastern Slope”). The Cheyenne Refinery has a coking unit, which allows the refinery to process extensive amounts of heavy crude oil for use as a feedstock. The ability to process heavy crude oil lowers our raw material costs because heavy crude oil is generally less expensive than lighter types of crude oil. For the year ended December 31, 2007, heavy crude oil constituted approximately 72% of the Cheyenne Refinery’s total crude oil charge. For the year ended December 31, 2007, the Cheyenne Refinery’s product yield included gasoline (42%), diesel fuel (30%) and asphalt and other refined petroleum products (28%).
El Dorado Refinery. The El Dorado Refinery is one of the largest refineries in the Plains States and the Rocky Mountain region with an average crude oil capacity of 110,000 bpd. The El Dorado Refinery can select from many different types of crude oil because of its direct access to Cushing, Oklahoma, which is connected by pipelines to the Gulf Coast and to Canada. This access, combined with the El Dorado Refinery’s complexity (including a coking unit), gives it the flexibility to refine a wide variety of crude oils. In connection with our acquisition of the El Dorado Refinery in 1999, we entered into a 15-year refined product offtake agreement for gasoline and diesel production at this refinery with Shell Oil Products US (“Shell”). Shell has also agreed to purchase all jet fuel production until the end of the product offtake agreement. As our deliveries to Shell have declined, per the terms of the refined product offtake agreement, we have marketed an increasing portion of the El Dorado Refinery’s gasoline and diesel in the same markets where Shell currently sells the El Dorado Refinery’s products, primarily in Denver and throughout the Plains States. For the year ended December 31, 2007, the El Dorado Refinery’s product yield included gasoline (50%), diesel and jet fuel (36%) and chemicals and other refined petroleum products (14%).
Other Assets. In February 2007, the Company acquired Ethanol Management Company (“EMC”) for approximately $3.1 million cash. EMC’s primary assets are a 25,000 bpd products terminal and blending facility located near Denver, Colorado. The Company owned, until their sale in September 2007, a 34.72% interest in a crude oil pipeline in Wyoming and a 50% interest in two crude oil tanks in Guernsey, Wyoming, both of which were accounted for as undivided interests. Each of these assets and the associated liabilities, revenues and expenses were reported on a proportionate gross basis until their sale in September 2007.
Varieties of Crude Oil and Products. Traditionally, crude oil has been classified within the following types:
· sweet (low sulfur content),
· sour (high sulfur content),
· light (high gravity),
· heavy (low gravity) and
· intermediate (if gravity or sulfur content is in between).
For the most part, heavy crude oil tends to be sour and light crude oil tends to be sweet. When refined, light crude oil produces a higher proportion of high value refined products such as gasoline, diesel and jet fuel and, as a result, is more expensive than heavy crude oil. In contrast, heavy crude oil produces more low value by-products and heavy residual oils. The discount at which heavy crude oil sells compared to light crude oil is known in the industry as the light/heavy spread or differential, while the discount at which sour crude oil sells compared to light crude oil is known as the sweet/sour, or WTI/WTS, spread or differential. Coking units, such as the ones at our Refineries, can process certain by-products and heavy residual oils to produce additional volumes of gasoline and diesel, thus increasing the aggregate yields of higher value refined products from the same initial barrel of crude oil.
Refineries are frequently classified according to their complexity, which refers to the number, type and capacity of processing units at the refinery. Each of our Refineries possesses a coking unit, which provides substantial upgrading capacity and generally increases a refinery’s complexity rating. Upgrading capacity refers to the ability of a refinery to produce high yields of high value refined products such as gasoline and diesel from heavy and intermediate crude oil. In contrast, refiners with low upgrading capacity must process primarily light, sweet crude oil to produce a similar yield of gasoline and diesel. Some low complexity refineries may be capable of processing heavy and intermediate crude oil, but they will produce large volumes of by-products, including heavy residual oils and asphalt. Because gasoline, diesel and jet fuel sales generally achieve higher margins than are available on other refined products, we expect that these products will continue to make up the majority of our production.
Refinery Maintenance. Each of the processing units at our Refineries requires scheduled significant maintenance and repair shutdowns (referred to as “turnarounds”) during which the unit is not in operation. Turnaround cycles vary for different units but are generally required every one to five years. In general, turnarounds at our Refineries are managed so that some units continue to operate while others are down for scheduled maintenance. We also coordinate operations by staggering turnarounds between our two Refineries. Turnarounds are implemented using our regular personnel as well as additional contract labor. Once started, turnaround work typically proceeds 24 hours per day to minimize unit downtime. We defer the costs of turnarounds, reflected as “Deferred turnaround costs” on the Consolidated Balance Sheets, and subsequently amortize them on a straight-line basis over the period of time estimated to lapse until the next turnaround occurs. We normally schedule our turnaround work during the spring or fall of each year. When we perform a turnaround, we may increase product inventories prior to the turnaround to minimize the impact of the turnaround on our sales of refined products.
During 2007, the only major turnaround work at the El Dorado Refinery involved the alkylation unit. For 2008, major turnaround work planned at the El Dorado Refinery is on the crude unit, the coker, and the reformer. The timing of the El Dorado turnaround is expected to coincide with the completion of the crude unit and vacuum expansion project in the spring of 2008.
Fiscal 2007 was a major turnaround year for the Cheyenne Refinery with work completed on the fluid catalytic cracking unit (“FCCU”), the crude unit, the coker, and other operating units. At the Cheyenne refinery, 2008 turnaround work is expected to be modest in scope and will involve a naphtha hydrotreater and its associated reformer, diesel hydrotreater, and sulfur recovery unit.
Cheyenne Refinery. The primary market for the Cheyenne Refinery’s refined products is the Eastern Slope. For the year ended December 31, 2007, we sold approximately 88% of the Cheyenne Refinery’s gasoline volumes in Colorado and 11% in Wyoming. For the year ended December 31, 2007, we sold approximately 67% of the Cheyenne Refinery’s diesel in Wyoming and 30% in Colorado. Because of the location of the Cheyenne Refinery, we are able to sell a significant portion of its diesel product from the truck rack at the Refinery, thereby eliminating transportation costs. The gasoline and remaining diesel produced by this Refinery are primarily shipped via pipeline to terminals for distribution by truck or rail. Pipeline shipments from the Cheyenne Refinery are handled mainly by the Plains All American Pipeline (formerly Rocky Mountain Pipeline), serving Denver and Colorado Springs, Colorado, and the ConocoPhillips Pipeline, serving Sidney, Nebraska.
We sell refined products from our Cheyenne Refinery to a broad base of independent retailers, jobbers and major oil companies. Refined product prices are determined by local market conditions at distribution centers known as “terminal racks,” and prices at the terminal racks are posted daily by sellers. The customer at a terminal rack typically supplies its own truck transportation. In the year ended December 31, 2007, approximately 91% of the Cheyenne Refinery’s sales were made to its 25 largest customers compared to the year ended December 31, 2006, when approximately 88% of the Cheyenne Refinery’s sales were made to its 25 largest customers. Occasionally, volumes sold exceed the Refinery’s production, in which case we purchase product in the spot market as needed.
El Dorado Refinery. The primary markets for the El Dorado Refinery’s refined products are Colorado and the Plains States, which include the Kansas City metropolitan area. The gasoline, diesel and jet fuel produced by the El Dorado Refinery are primarily shipped via pipeline to terminals for distribution by truck or rail. The Valero Pipeline, serving the northern Plains States, the Magellan Pipeline Company, L.P. (“Magellan”) mountain pipeline serving Denver, Colorado, and the Magellan mid-continent pipeline serving the Plains States handle shipments from our El Dorado Refinery.
For the year ended December 31, 2007, Shell was the El Dorado Refinery’s largest customer, representing approximately 61% of the El Dorado Refinery’s total sales and 42% of our total consolidated sales. Under the offtake agreement, Shell purchases gasoline, diesel and jet fuel produced by the El Dorado Refinery at market-based prices. Initially in 1999, Shell purchased all of the El Dorado Refinery’s production of these products. Beginning in 2000, we retained and marketed 5,000 bpd of the Refinery’s gasoline and diesel production. The retained portion increases by 5,000 bpd each year through 2009. In 2007, we retained 40,000 bpd of the Refinery’s gasoline and diesel production. As our sales to Shell under this agreement decrease, we intend to sell the gasoline and diesel produced by the El Dorado Refinery in the same general markets currently served by Shell, as previously described.
Cheyenne Refinery. The most competitive market for the Cheyenne Refinery’s products is the Denver metropolitan area. Other than the Cheyenne Refinery, three principal refineries serve the Denver market: an approximate 70,000 bpd refinery near Rawlins, Wyoming and an approximate 25,000 bpd refinery in Casper, Wyoming, both owned by Sinclair Oil Company (“Sinclair”); and a 90,000 bpd refinery located in Denver and owned by Suncor Energy (U.S.A.) Inc. (“Suncor”). Five product pipelines also supply Denver, including three from outside the region that enable refined products from other regions to be sold in the Denver market. Refined products shipped from other regions typically bear the burden of higher transportation costs.
The Suncor refinery located in Denver has lower product transportation costs to serve the Denver market than we do. However, the Cheyenne Refinery has lower crude oil transportation costs because of its proximity to the Guernsey, Wyoming hub, the major crude oil pipeline hub in the Rocky Mountain region. Moreover, unlike Sinclair and Suncor, we only sell our products to the wholesale market. We believe that our commitment to the wholesale market gives us certain marketing advantages over our principal competitors in the Eastern Slope area, all of which also have retail outlets, because we do not compete directly with independent retailers of gasoline and diesel.
El Dorado Refinery. The El Dorado Refinery faces competition from other Plains States and mid-continent refiners, but the principal competitors for the El Dorado Refinery are Gulf Coast refiners. Although our Gulf Coast competitors typically have lower production costs because of their size (economies of scale) than the El Dorado Refinery, we believe that our competitors’ higher refined product transportation costs allow our El Dorado Refinery to compete effectively in the Plains States and Rocky Mountain region with the Gulf Coast refineries. The Plains States and mid-continent regions are supplied by three product pipelines (Magellan Midstream Partners, L.P., Explorer Pipeline and Nustar Energy L.P.) that originate from the Gulf Coast.
Cheyenne Refinery. In the year ended December 31, 2007, we obtained approximately 61% of the Cheyenne Refinery’s crude oil charge from Canada, 19% from Wyoming, 18% from Colorado and 2% from other domestic sources. During the same period, heavy crude oil constituted approximately 72% of the Cheyenne Refinery’s total crude oil charge, compared to 73% in 2006. Cheyenne is 88 miles south of Guernsey, Wyoming, the main hub and crude oil trading center for the Rocky Mountain region. We have crude oil pipeline capacity from Guernsey to the Cheyenne Refinery via the Plains All American Pipeline, which first transported crude oil in October 2007, and a common carrier pipeline. Ample quantities of heavy crude oil are available at Guernsey, including both locally produced Wyoming general sour and imported Canadian heavy crude oil, which is supplied by the Express pipeline system and the Poplar and Butte pipelines. This type of crude oil typically sells at a discount from lighter crude oil prices. The Cheyenne Refinery’s ability to process a higher percentage of heavy crude oil, gives us an advantage over the three other Eastern Slope refineries, none of which has the necessary upgrading capacity to process such high volumes of heavy crude oil.
We purchase crude oil for the Cheyenne Refinery from several suppliers, including major oil companies, marketing companies and large and small independent producers, under arrangements which contain market-responsive pricing provisions. Many of these arrangements are subject to cancellation by either party or have terms that are not in excess of one year and are subject to periodic renegotiation. We had an agreement with Baytex Marketing Ltd., a Canadian crude oil producer, to supply heavy Canadian crude oil that expired on December 31, 2007. We will continue to purchase crude oil from various suppliers under short-term commitments. In the event we become unable to purchase crude oil from any one of these sources, we believe that adequate alternative supplies of crude oil would be available.
El Dorado Refinery. In the year ended December 31, 2007, we obtained approximately 67% of the El Dorado Refinery’s crude oil charge from Texas, 20% from Canada, 6% from Kansas, 4% from the Gulf of Mexico, and the remaining 3% from other foreign and domestic locations. El Dorado is 125 miles north of Cushing, Oklahoma, a major crude oil hub. The Cushing hub is supplied by the Seaway Pipeline, which runs from the Gulf Coast; the Basin Pipeline, which runs through Wichita Falls, Texas from West Texas; the Sun Pipeline, which originates at the Gulf Coast and connects to the Basin Pipeline at Wichita Falls and the Spearhead Pipeline which connects at Griffith, Indiana with the Enbridge Pipeline to bring crude from Canada. The Osage Pipeline runs from Cushing to El Dorado and transported approximately 94% of our crude oil charge during the year ended December 31, 2007. The remainder of our crude oil charge was transported to the El Dorado Refinery through Kansas gathering system pipelines. We have a Transportation Services Agreement to transport up to 38,000 bpd of crude oil on the Spearhead Pipeline from Griffith, Indiana to Cushing, Oklahoma, enabling us to transport heavy Canadian crude oil to our El Dorado Refinery. The initial term of this agreement is for a period of ten years from the actual commencement date of March 2006. We have the right to extend the agreement for an additional ten years and increase the volume transported under a preferential tariff to 50,000 bpd.
Environmental Matters.
See “Environmental” in Note 9 in the “Notes to Consolidated Financial Statements.”
Centennial Pipeline Regulation. We owned a 34.72% undivided interest in the Centennial Pipeline, which runs approximately 88 miles from Guernsey to Cheyenne, Wyoming. Suncor Pipe Line Company is the sole operator of the Centennial Pipeline and held the remaining ownership interest and purchased our interest in September 2007. During our ownership, the Cheyenne Refinery received up to 25,000 bpd of crude oil feedstock through the Centennial Pipeline. Under the terms of the operating agreement for the Centennial Pipeline, the costs and expenses incurred to operate and maintain the Centennial Pipeline were allocated to us on a combined basis, based on our throughput and ownership interest. The Centennial Pipeline is subject to numerous federal, state and local laws and regulations relating to the protection of health, safety and the environment. We believe that the Centennial Pipeline was operated in accordance with all applicable laws and regulations. We are not aware of any material pending legal proceedings which relate to the Centennial Pipeline during our ownership.
We are subject to the requirements of the federal Occupational Safety and Health Act (“OSHA”) and comparable state occupational safety statutes.
The Cheyenne Refinery’s OSHA recordable incident rate in 2007 of 2.72 is higher than the latest reported U.S. industry average of 0.89 as compiled by the National Petrochemical and Refiner’s Association (“NPRA”) but comparable to the regional NPRA rate of 2.01. While the frequency of injuries at the Cheyenne Refinery has risen above NPRA averages, we continue to emphasize safety at all levels of the Cheyenne organization. In 2007, we reduced our contractor injury rate by 64% and achieved a 2007 contractor incidence rate of 2.19, a significant improvement over prior years. By improving the training and selection of the contractor workforce, we were able to improve the safety of the outside labor we hire. We intend to focus on safety by improving procedures and training for all refinery workers in the coming year. These efforts include programs in both areas of occupational and process safety initiatives and are comprehensive across all areas of the Refinery.
The El Dorado Refinery’s OSHA recordable incident rate of 0.95 in 2007 is a marked improvement against the rate of 1.47 for 2006, and compares favorably to the U.S. refining industry average of 0.89. Management and employees at the El Dorado Refinery remain committed to programs, processes and behaviors that drive safety excellence. Improvement in contractor safety continued to be a key initiative for the El Dorado Refinery during 2007. Behavior-based safety programs were introduced in 2004 for our own employees. During 2006, we included the majority of our contractor base in these programs as well. These efforts resulted in a significant increase in contractor safety awareness and much improved contractor safety results. During 2008, the El Dorado Refinery also plans to undertake extended work and embark upon new efforts to make the plant stronger both in occupational- and process safety-related areas.
Our employees and management continue to dedicate their efforts to a balanced safety program that combines individual behavioral elements in a safety-coaching environment with structured, management-driven programs to improve the safety of our facilities and operating procedures. Our objective is to provide a safe working environment for employees and contractors who know how to work safely. Encouraging all employees and contractors to contribute toward improving safety performance through personal involvement in safety-related activities is an industry-proven method of reducing injuries.
At December 31, 2007, we employed approximately 800 full-time employees: 90 in the Houston and Denver offices, 315 at the Cheyenne Refinery, and 395 at the El Dorado Refinery. The Cheyenne Refinery employees included approximately 110 administrative and technical personnel and approximately 205 union members. The El Dorado Refinery employees included 145 administrative and technical personnel and approximately 250 union members. The union members at our El Dorado Refinery are represented by the United Steel, Paper and Forestry, Rubber, Manufacturing, Energy, Allied Industrial and Service Workers International Union (“USW”). The union members at our Cheyenne Refinery are represented by seven bargaining units, the largest being the USW and the others with various craft unions.
For our Cheyenne Refinery, the current contract between the Company, the USW, and its Local 8-0574 expires in July 2009. The current contract between the Company, the craft unions, and its various local chapters expires in June 2009.
At our El Dorado Refinery, the current contract between the Company, the USW, and its Local 5-241 expires in January 2009.
| Risk Factors Relating to Our Business |
Crude oil prices and refining margins significantly impact our cash flow and have fluctuated substantially in the past.
Our cash flow from operations is primarily dependent upon producing and selling refined products at margins that are high enough to cover our fixed and variable expenses. In recent years, crude oil costs and crack spreads (the difference between refined product sales prices and crude oil prices) have fluctuated substantially. Factors that may affect crude oil costs and refined product prices include:
· overall demand for crude oil and refined products;
· general economic conditions;
· the level of foreign and domestic production of crude oil and refined products;
· the availability of imports of crude oil and refined products;
· the marketing of alternative and competing fuels;
· the extent of government regulation;
· global market dynamics;
· product pipeline capacity;
· local market conditions; and
· the level of operations of competing refineries.
Crude oil supply contracts are generally short-term contracts with price terms that change as market prices change. Our crude oil requirements are supplied from sources that include:
· major oil companies;
· crude oil marketing companies;
· large independent producers; and
· smaller local producers.
The price at which we can sell gasoline and other refined products is strongly influenced by the price of crude oil. Generally, an increase or decrease in the price of crude oil results in a corresponding increase or decrease in the price of gasoline and other refined products. However, if crude oil prices increase significantly, our operating margins would fall unless we could pass along these price increases to our customers.
Our Refineries maintain inventories of crude oil, intermediate products and refined products, the value of each being subject to fluctuations in market prices. Our inventories of crude oil, unfinished products and finished products are recorded at the lower of cost on a first-in, first-out (“FIFO”) basis or market prices. As a result, a rapid and significant increase or decrease in the market prices for crude oil or refined products could have a significant short-term impact on our earnings and cash flow.
Our profitability is affected by crude oil differentials, which may decline and accordingly decrease our profitability.
The light/heavy crude oil differentials that we report is the average differential between the benchmark West Texas Intermediate (“WTI”) crude oil priced at Cushing, Oklahoma (ConocoPhillips WTI crude oil posting plus) and the heavy crude oil priced as delivered to our Cheyenne Refinery or El Dorado Refinery, respectively. The WTI/WTS (sweet/sour) crude oil differential is the average differential between benchmark WTI crude oil priced at Cushing, Oklahoma and West Texas sour crude oil priced at Midland, Texas. Our profitability at our Cheyenne Refinery is affected by the light/heavy crude oil differential, and our profitability at our El Dorado Refinery is affected by the WTI/WTS crude oil differential. Starting in March 2006, when our El Dorado Refinery began receiving heavy Canadian crude oil through the Spearhead Pipeline, its profitability also began benefiting from the light/heavy crude oil differential. We typically prefer to refine heavy sour crude oil at the Cheyenne Refinery and intermediate sour crude oil at the El Dorado Refinery because these crudes provide a higher refining margin than light or sweet crude oil does. Accordingly, any tightening of these crude oil differentials will reduce our profitability. The Cheyenne Refinery light/heavy crude oil differential averaged $18.55 per barrel in the year ended December 31, 2007, compared to $16.21 per barrel in the same period in 2006. The El Dorado Refinery light/heavy crude oil differential averaged $20.60 per barrel in the year ended December 31, 2007 compared to $18.13 per barrel in the ten months ended December 31, 2006. The WTI/WTS crude oil differential averaged $5.02 per barrel in the year ended December 31, 2007, compared to $5.22 per barrel in the same period in 2006. Crude oil prices were historically high during 2007, contributing to attractive light/heavy crude oil differentials and WTI/WTS crude oil differentials. However the crude oil differentials may decline in the future, which would have a negative impact on our earnings.
External factors beyond our control can cause fluctuations in demand for our products, our prices and margins, which may negatively affect income and cash flow.
Among these factors is the demand for crude oil and refined products, which is largely driven by the conditions of local and worldwide economies as well as by weather patterns and the taxation of these products relative to other energy sources. Governmental regulations and policies, particularly in the areas of taxation, energy and the environment, also have a significant impact on our activities. Operating results can be affected by these industry factors, by competition in the particular geographic areas that we serve and by factors that are specific to us, such as the success of particular marketing programs and the efficiency of our Refinery operations. The demand for crude oil and refined products can also be reduced due to a local or national recession or other adverse economic condition that results in lower spending by businesses and consumers on gasoline and diesel fuel, higher gasoline prices due to higher crude oil prices, a shift by consumers to more fuel-efficient vehicles or alternative fuel vehicles (such as ethanol or wider adoption of gas/electric hybrid vehicles), or an increase in vehicle fuel economy, whether as a result of technological advances by manufacturers, legislation mandating or encouraging higher fuel economy or the use of alternative fuel.
In addition, our profitability depends largely on the spread between market prices for refined petroleum products and crude oil prices. This margin is continually changing and may fluctuate significantly from time to time. Crude oil and refined products are commodities whose price levels are determined by market forces beyond our control. Due to the seasonality of refined products markets and refinery maintenance schedules, results of operations for any particular quarter of a fiscal year are not necessarily indicative of results for the full year. In general, prices for refined products are influenced by the price of crude oil. Although an increase or decrease in the price of crude oil may result in a similar increase or decrease in prices for refined products, there may be a time lag in the realization of the similar increase or decrease in prices for refined products. The effect of changes in crude oil prices on operating results therefore depends in part on how quickly refined product prices adjust to reflect these changes. A substantial or prolonged increase in crude oil prices without a corresponding increase in refined product prices, a substantial or prolonged decrease in refined product prices without a corresponding decrease in crude oil prices, or a substantial or prolonged decrease in demand for refined products could have a significant negative effect on our results of operations and cash flows.
We are dependent on others to supply us with substantial quantities of raw materials.
Our business involves converting crude oil and other refinery charges into liquid fuels. We own no crude oil or natural gas reserves and depend on others to supply these feedstocks to our Refineries. We use large quantities of natural gas and electricity to provide heat and mechanical energy required by our processing units. Disruption to our supply of crude oil, natural gas or electricity, or the continued volatility in the costs thereof, could have a material adverse effect on our operations. In addition, our investment in inventory is affected by the general level of crude oil prices, and significant increases in crude oil prices could result in substantial working capital requirements to maintain inventory volumes.
Our Refineries face operating hazards, and the potential limits on insurance coverage could expose us to significant liability costs.
Our operations could be subject to significant interruption, and our profitability could be impacted if either of our Refineries experienced a major accident or fire, was damaged by severe weather or other natural disaster, or was otherwise forced to curtail its operations or shut down. If a pipeline became inoperative, crude oil would have to be supplied to our Refineries through an alternative pipeline or from additional tank trucks to the Refineries, which could hurt our business and profitability. In addition, a major accident, fire or other event could damage our Refineries or the environment or cause personal injuries. If either of our Refineries experiences a major accident or fire or other event or an interruption in supply or operations, our business could be materially adversely affected if the damage or liability exceeds the amounts of business interruption, property, terrorism and other insurance that we maintain against these risks.
Our Refineries consist of many processing units, a number of which have been in operation for many years. One or more of the units may require additional unscheduled down time for unanticipated maintenance or repairs that are more frequent than our scheduled turnaround for such units. Scheduled and unscheduled maintenance could reduce our revenues during the period of time that our units are not operating.
We face substantial competition from other refining companies, and greater competition in the markets where we sell refined products could adversely affect our sales and profitability.
The refining industry is highly competitive. Many of our competitors are large, integrated, major or independent oil companies that, because of their more diverse operations, larger refineries and stronger capitalization, may be better positioned than we are to withstand volatile industry conditions, including shortages or excesses of crude oil or refined products or intense price competition at the wholesale level. Many of these competitors have financial and other resources substantially greater than ours.
We are not engaged in the petroleum exploration and production business and therefore do not produce any of our crude oil feedstocks. We do not have a retail business and therefore are dependent upon others for outlets for our refined products. Certain of our competitors, however, obtain a portion of their feedstocks from company-owned production and have retail outlets. Competitors that have their own production or extensive retail outlets, with brand-name recognition, are at times able to offset losses from refining operations with profits from producing or retailing operations, and may be better positioned to withstand periods of depressed refining margins or feedstock shortages. In addition, we compete with other industries, such as wind, solar and hydropower, that provide alternative means to satisfy the energy and fuel requirements of our industrial, commercial and individual consumers. If we are unable to compete effectively with these competitors, both within and outside our industry, there could be a material adverse effect on our business, financial condition and results of operations.
Our operations involve environmental risks that may require us to make substantial capital expenditures to remain in compliance or that could give rise to material liabilities.
Our results of operations may be affected by increased costs of complying with the extensive environmental laws to which our business is subject and from any possible contamination of our facilities as a result of accidental spills, discharges or other releases of petroleum or hazardous substances.
Our operations are subject to extensive federal, state and local environmental and health and safety laws and regulations relating to the protection of the environment, including those governing the emission or discharge of pollutants into the air and water, product specifications and the generation, treatment, storage, transportation, disposal or remediation of solid and hazardous waste and materials. Environmental laws and regulations that affect the operations, processes and margins for our refined products are extensive and have become progressively more stringent. Additional legislation or regulatory requirements or administrative policies could be imposed with respect to our products or activities. Compliance with more stringent laws or regulations or more vigorous enforcement policies of the regulatory agencies could adversely affect our financial position and results of operations and could require us to make substantial expenditures. Any noncompliance with these laws and regulations could subject us to material administrative, civil or criminal penalties or other liabilities.
We are a defendant in a series of lawsuits alleging, among other things, that emissions from an oil field or the production facilities thereon at the campus of the Beverly Hills High School, which were owned and operated by one of our subsidiaries between 1985 and 1995, caused the plaintiffs to develop cancers or various health problems. See “Litigation – Beverly Hills Lawsuits” in Note 9 in the “Notes to Consolidated Financial Statements” for more information on these lawsuits.
Our business is inherently subject to accidental spills, discharges or other releases of petroleum or hazardous substances. Past or future spills related to any of our operations, including our Refineries, pipelines or product terminals, could give rise to liability (including potential cleanup responsibility) to governmental entities or private parties under federal, state or local environmental laws, as well as under common law. This could involve contamination associated with facilities that we currently own or operate, facilities that we formerly owned or operated and facilities to which we sent wastes or by-product for treatment or disposal and other contamination. Accidental discharges could occur in the future, future action may be taken in connection with past discharges, governmental agencies may assess penalties against us in connection with past or future contamination and third parties may assert claims against us for damages allegedly arising out of any past or future contamination. The potential penalties and clean-up costs for past or future releases or spills, the failure of prior owners of our facilities to complete their clean-up obligations, the liability to third parties for damage to their property, or the need to address newly-discovered information or conditions that may require a response could be significant, and the payment of these amounts could have a material adverse effect on our business, financial condition and results of operations.
Our operations are subject to various laws and regulations relating to occupational health and safety, which could give rise to increased costs and material liabilities.
The nature of our business may result from time to time in industrial accidents. Our operations are subject to various laws and regulations relating to occupational health and safety. Continued efforts to comply with applicable health and safety laws and regulations, or a finding of non-compliance with current regulations, could result in additional capital expenditures or operating expenses, as well as fines and penalties.
We could incur substantial costs or disruptions in our business if we cannot obtain or maintain necessary permits and authorizations.
Our operations require numerous permits and authorizations under various laws and regulations, including environmental and health and safety laws and regulations. These authorizations and permits are subject to revocation, renewal or modification and can require operational changes, which may involve significant costs, to limit impacts or potential impacts on the environment and/or health and safety. A violation of these authorization or permit conditions or other legal or regulatory requirements could result in substantial fines, criminal sanctions, permit revocations, injunctions and/or refinery shutdowns. In addition, major modifications of our operations could require changes to our existing permits or expensive upgrades to our existing pollution control equipment, which could have a material adverse effect on our business, financial condition or results of operations.
Hurricanes along the Gulf Coast could disrupt our supply of crude oil and our ability to complete capital improvement projects in a timely manner.
In August and September of 2005, Hurricanes Katrina and Rita and related storm activity, such as windstorms, storm surges, floods and tornadoes, caused extensive and catastrophic physical damage in and to coastal and inland areas located in the Gulf Coast region of the United States (parts of Texas, Louisiana, Mississippi and Alabama) and certain other parts of the southeastern parts of the United States. Some of the materials we use for our capital projects are fabricated at facilities located along the Gulf Coast. Should other storms of this nature occur in the future, it is possible that the storms and their collateral effects could result in delays or cost increases for our planned capital projects.
In addition, supplies of crude oil to our El Dorado Refinery are sometimes shipped from Gulf Coast production or terminaling facilities. This crude oil supply source could be potentially threatened in the event of future catastrophic damage to such facilities.
We may have labor relations difficulties with some of our employees represented by unions.
Approximately 57 percent of our employees were covered by collective bargaining agreements at December 31, 2007. All of our union contracts expire in 2009, and there is no assurance that we will be able to enter into new contracts on terms acceptable to us or at all. A failure to do so may increase our costs or result in an interruption of our business. See Item 1 “Business-Employees.” In addition, employees may conduct a strike at some time in the future, which may adversely affect our operations.
Terrorist attacks and threats or actual war may negatively impact our business.
Terrorist attacks in the United States and the war in Iraq, as well as events occurring in response to or in connection with them, including future terrorist attacks against U.S. targets, rumors or threats of war, actual conflicts involving the United States or its allies, or military or trade disruptions affecting our suppliers or our customers, could adversely impact our operations. In addition, any terrorist attack could have an adverse impact on energy prices, including prices for our crude oil and refined products, and an adverse impact on the margins from our refining and marketing operations. As a result, there could be delays or losses in the delivery of supplies and raw materials to us, decreased sales of our products and extensions of time for payment of accounts receivable from our customers.
| Unresolved Staff Comments |
None.
Refining and Terminal Operations
We own the approximately 125 acre site on which the Cheyenne Refinery is located in Cheyenne, Wyoming and the approximately 1,000 acre site on which the El Dorado Refinery is located in El Dorado, Kansas. We lease the approximately two acre site in Henderson, Colorado on which the EMC products and blending terminal is located.
Other Properties
We lease approximately 6,500 square feet of office space in Houston, Texas for our corporate headquarters under a lease expiring in October 2009. We also lease approximately 28,000 square feet of office space in Denver, Colorado under a lease expiring in April 2012 for our refining, marketing and raw material supply operations.
See “Litigation” and “Environmental” in Note 9 in the “Notes to Consolidated Financial Statements.”
| Submission of Matters to a Vote of Security Holders |
None.
We file reports with the SEC, including annual reports on Form 10-K, quarterly reports on Form 10-Q and other reports from time to time. The public may read and copy any materials that we file with the SEC at the SEC’s Public Reference Room at 100 F Street, N.E., Room 1580, Washington, DC, 20549. The public may obtain information on the operation of the Public Reference Room by calling the SEC at 1-800-SEC-0330. We are an electronic filer, and the SEC’s Internet site at http://www.sec.gov contains the reports, proxy and information statements, and other information filed electronically.
As required by Section 402 of the Sarbanes-Oxley Act of 2002, we have adopted a code of ethics that applies to our chief executive officer, chief financial officer and principal accounting officer. This code of ethics is posted on our web site. Our web site address is: http://www.frontieroil.com. We make our web site content available for informational purposes only. It should not be relied upon for investment purposes, nor is it incorporated by reference in this Form 10-K. We make available on this web site under “Investor Relations,” free of charge, our annual reports on Form 10-K, quarterly reports on Form 10-Q, current reports on Form 8-K and amendments to those reports as soon as reasonably practicable after we electronically file those materials with, or furnish those materials to, the SEC.
We filed our 2007 annual CEO certification with the New York Stock Exchange (“NYSE”) on May 8, 2007. We anticipate filing our 2008 annual CEO certification with the NYSE on or about April 28, 2008. In addition, we filed with the SEC as exhibits to our Form 10-K for the year ended December 31, 2006 the CEO and CFO certifications required under Section 302 of the Sarbanes-Oxley Act of 2002.
| Market for Registrant’s Common Equity, Related Stockholder Matters and Issuer Purchases of Equity Securities |
Our common stock is listed on the New York Stock Exchange under the symbol FTO. The quarterly high and low sales prices (as adjusted for our June 26, 2006 stock split) as reported on the New York Stock Exchange for 2007 and 2006 are shown in the following table:
| 2007 | High | Low |
Fourth quarter Third quarter Second quarter First quarter | $ 49.13 49.10 45.75 33.75 | $ 39.54 31.61 31.95 25.47 |
| 2006 | High | Low |
Fourth quarter Third quarter Second quarter First quarter | $ 33.00 37.80 33.10 30.98 | $ 24.00 24.33 23.75 18.99 |
The approximate number of holders of record for our common stock as of February 20, 2008 was 939. The quarterly cash divided on our common stock was $0.02 per share for the quarters ended June 30, 2005 through March 31, 2006. In addition, a special cash dividend of $0.50 per share was declared for the quarter ended December 31, 2005 and paid on January 11, 2006, to shareholders of record on December 15, 2005. The quarterly cash dividend was $0.03 per share for the quarters ended June 30, 2006 through March 31, 2007. The quarterly cash dividend was $0.05 per share for the quarters ended June 30, 2007 through December 31, 2007. Our 6.625% Notes and our Revolving Credit Facility may restrict dividend payments based on the covenants related to interest coverage and restricted payments. See Notes 4 and 5 in the “Notes to Consolidated Financial Statements.”
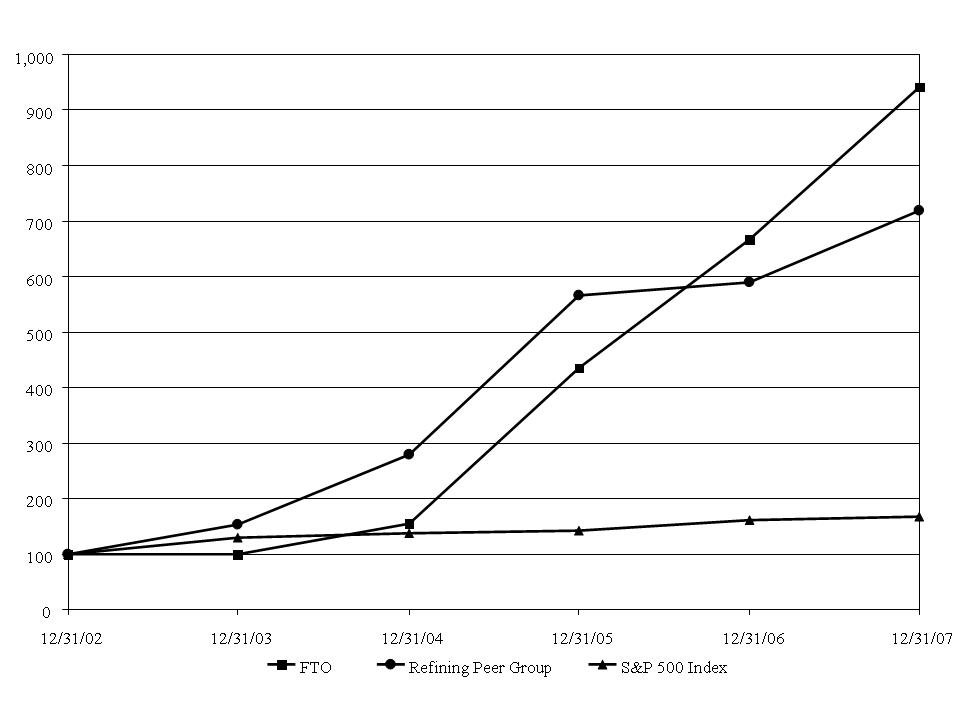
The following graph indicates the performance of our common stock against the S&P 500 Index and against a refining peer group which is comprised of Sunoco Inc., Holly Corporation, Valero Energy Corporation and Tesoro Corporation.
The following table sets forth information regarding equity securities that we have repurchased.
| Period | Total Number of Shares Purchased | | Average Price Paid Per Share | | Total Number of Shares Purchased as Part of Publicly Announced Plans or Programs (1) | | Maximum Approximate Dollar Value of Shares that May Yet Be Purchased Under the Plans or Programs (2) |
| October 1, 2007 to October 31, 2007 | 435,500 | | $ 43.3475 | | 435,500 | | $ 81,767,994 |
| November 1, 2007 to November 30, 2007 | 258,900 | | 44.9867 | | 258,900 | | $ 70,120,933 |
| December 1, 2007 to December 31, 2007 | 326,200 | | 41.9630 | | 326,200 | | $ 56,432,616 |
| Total fourth quarter | 1,020,600 | | $ 43.3208 | | 1,020,600 | | $ 56,432,616 |
(1) In November 2006, our Board of Directors approved a new $100 million share repurchase program, which replaced all existing repurchase authorizations. The program has no expiration date but may be terminated by the Board of Directors at any time. In April 2007, our Board of Directors authorized the utilization of up to an additional $100 million for share repurchases, and in August 2007, our Board of Directors authorized the utilization of another $100 million for share repurchases. No shares were purchased during the periods shown other than through publicly-announced programs.
(2) Amounts shown in this column reflect approximate dollar value of shares remaining as of each month end which may be repurchased under the stock repurchase programs referenced in note 1 above.
| Five Year Financial Data | |
| (Unaudited) | | Years Ended December 31, | |
| | | 2007 | | | 2006 | | | 2005 | | | 2004 | | | 2003 | |
| | | (Dollars in thousands, except per share amounts) | |
| Revenues | | $ | 5,188,740 | | | $ | 4,795,953 | | | $ | 4,001,162 | | | $ | 2,861,716 | | | $ | 2,170,503 | |
| Operating income | | | 755,795 | | | | 574,194 | | | | 450,013 | | | | 142,903 | | | | 53,437 | |
Cumulative effect of accounting change, net of income taxes (1) | | | - | | | | - | | | | (2,503 | ) | | | - | | | | - | |
| Net income | | | 499,125 | | | | 379,277 | | | | 275,158 | | | | 69,392 | | | | 4,200 | |
| Basic earnings per share: | | | | | | | | | | | | | | | | | | | | |
Before cumulative effect of accounting change | | $ | 4.67 | | | $ | 3.40 | | | $ | 2.51 | | | $ | 0.65 | | | $ | 0.04 | |
Cumulative effect of accounting change (1) | | | - | | | | - | | | | (.02 | ) | | | - | | | | - | |
Net income | | $ | 4.67 | | | $ | 3.40 | | | $ | 2.49 | | | $ | 0.65 | | | $ | 0.04 | |
| Diluted earnings per share: | | | | | | | | | | | | | | | | | | | | |
Before cumulative effect of accounting change | | $ | 4.62 | | | $ | 3.37 | | | $ | 2.44 | | | $ | 0.63 | | | $ | 0.04 | |
Cumulative effect of accounting change (1) | | | - | | | | - | | | | (.02 | ) | | | - | | | | - | |
Net income | | $ | 4.62 | | | $ | 3.37 | | | $ | 2.42 | | | $ | 0.63 | | | $ | 0.04 | |
Working capital (current assets less current liabilities) | | $ | 529,510 | | | $ | 479,518 | | | $ | 270,145 | | | $ | 106,760 | | | $ | 45,049 | |
| Total assets | | | 1,863,848 | | | | 1,523,925 | | | | 1,223,057 | | | | 770,177 | | | | 662,495 | |
| Long-term debt | | | 150,000 | | | | 150,000 | | | | 150,000 | | | | 150,000 | | | | 168,689 | |
| Shareholders’ equity | | | 1,038,614 | | | | 775,854 | | | | 478,692 | | | | 271,120 | | | | 200,656 | |
Dividends declared per common share | | $ | 0.180 | | | $ | 0.100 | | | $ | 0.575 | | | $ | 0.055 | | | $ | 0.050 | |
_______________
(1) As of December 31, 2005, we adopted FASB Interpretation No. 47, “Accounting for Conditional Asset Retirement Obligations.” See Note 2 in the “Notes to Consolidated Financial Statements.”
Item 7. Management’s Discussion and Analysis of Financial Condition and Results of Operations |
General
Frontier operates Refineries in Cheyenne, Wyoming and El Dorado, Kansas as previously discussed in Part I, Item 1 of this Form 10-K. We focus our marketing efforts in the Rocky Mountain and Plains States regions of the United States. We purchase crude oil to be refined and market refined petroleum products, including various grades of gasoline, diesel, jet fuel, asphalt and other by-products.
Results of Operations
To assist in understanding our operating results, please refer to the operating data at the end of this analysis which provides key operating information for our Refineries. Refinery operating data is also included in our quarterly reports on Form 10-Q and on our web site address: http://www.frontieroil.com. We make our web site content available for informational purposes only. It should not be relied upon for investment purposes, nor is it incorporated by reference in this Form 10-K.
Overview
Our Refineries have a total annual average crude oil capacity of approximately 162,000 bpd. The four significant indicators of our profitability, which are reflected and defined in the operating data at the end of this analysis, are the gasoline crack spread, the diesel crack spread, the light/heavy crude oil differential and the WTI/WTS crude oil differential. Other significant factors that influence our financial results are refinery utilization, crude oil price trends, asphalt and by-product margins and refinery operating expenses (including natural gas and maintenance). Under our first-in, first-out (“FIFO”) inventory accounting method, crude oil price trends can cause significant fluctuations in the inventory valuation of our crude oil, unfinished products and finished products, thereby resulting in FIFO inventory gains when crude oil prices increase and FIFO inventory losses when crude oil prices decrease during the reporting period. We typically do not use derivative instruments to offset price risk on our base level of operating inventories. See “Price Risk Management Activities” under Item 7A for a discussion of our utilization of futures trading.
Crude oil market fundamentals and geopolitical considerations have caused crude oil prices to be volatile and generally higher than historical averages. The increase in crude oil prices, along with additional production of heavy and/or sour crude oil, increased our crude oil differentials during the year ended December 31, 2007, when compared to the same period in 2006. Our 2007 gasoline and diesel crack spreads were the highest in our history, while 2006 gasoline and diesel crack spreads were the second highest in our history.
2007 Compared with 2006
Overview of Results
We had net income for the year ended December 31, 2007, of $499.1 million, or $4.62 per diluted share, compared to net income of $379.3 million, or $3.37 per diluted share, for the same period in 2006. Our operating income of $755.8 million for the year ended December 31, 2007, reflected an increase of $181.6 million from the $574.2 million operating income for the comparable period in 2006. The average diesel crack spread was higher during 2007 ($22.59 per barrel) than in 2006 ($21.35 per barrel). The average gasoline crack spread was also higher during 2007 ($18.39 per barrel) than in 2006 ($14.10 per barrel), and the light/heavy crude oil differentials improved.
Specific Variances
Refined product revenues. Refined product revenues increased $510.0 million, or 11%, from $4.8 billion to $5.3 billion for the year ended December 31, 2007 compared to the same period in 2006. This increase was due to an increase in average product sales prices ($9.05 higher per sales barrel) partially offset by lower product sales volumes in 2007 (1,890 fewer bpd). Sales prices increased primarily as a result of increased crude oil prices and improvements in the gasoline and diesel crack spreads.
Manufactured product yields. Manufactured product yields (“yields”) are the volumes of specific materials obtained through the distilling of crude oil and the operations of other refinery process units. Yields decreased 1,826 bpd at the El Dorado Refinery and 4,067 bpd at the Cheyenne Refinery for the year ended December 31, 2007 compared to 2006. Planned and unplanned shut downs at the Cheyenne Refinery during 2007 caused yields to be lower during 2007 than 2006. At the El Dorado Refinery, we processed more heavy crude oils during 2007 than in 2006, which resulted in decreased yields.
Other revenues. Other revenues decreased $117.2 million to an $80.9 million loss for the year ended December 31, 2007, compared to a $36.3 million gain for the same period in 2006, the sources of which were $86.4 million in net losses from derivative contracts in the year ended December 31, 2007 compared to net derivative gains of $34.6 million for the same period in 2006 offset by $4.8 million in gasoline sulfur credit sales in 2007 ($1.5 million in 2006). See “Price Risk Management Activities” under Item 7A and Note 11 in the “Notes to Consolidated Financial Statements” for a discussion of our utilization of commodity derivative contracts.
Raw material, freight and other costs. Raw material, freight and other costs include crude oil and other raw materials used in the refining process, purchased products and blendstocks, freight costs for FOB destination sales, as well as the impact of changes in inventory under the FIFO inventory accounting method. Raw material, freight and other costs increased by $188.3 million, or 5%, during the year ended December 31, 2007, from $3.9 billion in 2006 to $4.0 billion in 2007. The increase in raw material, freight and other costs when compared to 2006 was due to higher average crude prices, offset by lower crude oil charges and FIFO inventory gains in the year ended December 31, 2007 compared to FIFO inventory losses in the year ended December 31, 2006. We benefited from improved light/heavy crude oil differentials during the year ended December 31, 2007 compared to the same period in 2006. The average WTI crude oil priced at Cushing, Oklahoma (ConocoPhillips WTI crude oil posting plus) was $71.99 for the year ended December 31, 2007 compared to $64.94 for the year ended December 31, 2006. Average crude oil charges were 146,046 bpd for the year ended December 31, 2007, compared to 154,473 bpd for the comparable period in 2006. For the year ended December 31, 2007, we realized a decrease in raw material, freight and other costs as a result of net FIFO inventory gains of approximately $78.4 million after tax ($126.3 million pretax, comprised of an $84.9 million gain at the El Dorado Refinery and a $41.4 million gain at the Cheyenne Refinery) due to increasing crude oil and refined product prices during 2007. For the year ended December 31, 2006, we realized an increase in raw material, freight and other costs as a result of net FIFO inventory losses of approximately $16.1 million after tax ($25.7 million pretax, comprised of a $31.7 million loss at the El Dorado Refinery and a $6.0 million gain for the Cheyenne Refinery) due to decreasing crude oil and refined product prices during the latter part of 2006.
The Cheyenne Refinery raw material, freight and other costs of $62.08 per sales barrel for the year ended December 31, 2007 increased from $57.07 per sales barrel in the same period in 2006 due to higher crude oil prices partially offset by a FIFO inventory gain in 2007 compared to FIFO inventory loss in 2006, fewer crude oil charges in 2007 and the benefit of an improved light/heavy crude oil differential in 2007. Average crude oil charges of 41,778 bpd for the year ended December 31, 2007 were lower than the 45,999 bpd in the comparable period in 2006 because of a spring 2007 turnaround, a temporary shutdown of the FCCU in the third quarter, and a December 2007 fire in the coker unit at the Cheyenne Refinery. The heavy crude oil utilization rate at the Cheyenne Refinery expressed as a percentage of the total crude oil charge decreased to 72% in the year ended December 31, 2007, from 73% in 2006. The light/heavy crude oil differential for the Cheyenne Refinery averaged $18.55 per barrel in the year ended December 31, 2007 compared to $16.21 per barrel in the same period in 2006.
The El Dorado Refinery raw material, freight and other costs of $66.25 per sales barrel for the year ended December 31, 2007 increased from $63.15 per sales barrel in the same period in 2006 due to higher average crude oil prices partially offset by FIFO inventory gains in 2007 compared to FIFO inventory losses in 2006 and lower crude oil charges in 2007. Average crude oil charges were 104,268 bpd for the year ended December 31, 2007, compared to 108,475 bpd for the comparable period in 2006. Due to the favorable light/heavy differentials, we ran more heavy crude oil in 2007 which limited the overall crude rate. We realized a light/heavy crude oil differential of $20.60 per barrel during 2007. In 2006, our El Dorado Refinery began charging Canadian heavy crude oil and achieved a light/heavy crude oil differential of $18.13 per barrel. For the year ended December 31, 2007, the heavy crude oil utilization rate at our El Dorado Refinery expressed as a percentage of the total crude oil charge was approximately 15%, compared to 11% in 2006. The WTI/WTS crude oil differential decreased from an average of $5.22 per barrel in the year ended December 31, 2006 to an average of $5.02 per barrel for the same period in 2007.
Refinery operating expenses. Refinery operating expenses, excluding depreciation, include both the variable costs (energy and utilities) and the fixed costs (salaries, taxes, maintenance costs and other) of operating the Refineries. Refinery operating expenses, excluding depreciation, increased $23.4 million, or 8%, to $300.5 million in the year ended December 31, 2007 from $277.1 million in the comparable period of 2006.
The Cheyenne Refinery operating expenses, excluding depreciation, were $109.2 million in the year ended December 31, 2007, compared to $101.9 million in the comparable period of 2006. The increased expenses included higher maintenance costs ($5.6 million, with $3.8 million of the costs relating to repair from a coker unit fire in December 2007), higher salaries and benefits ($3.5 million, including $1.0 million in increased maintenance salaries and $1.1 million additional bonus costs due to an increased number of employees), higher turnaround amortization ($1.5 million) and higher consulting and legal expenses ($1.4 million.) These increases were partially offset by decreased environmental costs ($3.2 million, primarily related to an estimated waste water pond clean up accrual recorded in 2006 of $5.0 million offset by a $3.0 million increase in groundwater remediation accrual in 2007), electricity costs ($1.6 million) and natural gas costs ($1.0 million).
The El Dorado Refinery operating expenses, excluding depreciation, were $191.3 million in the year ended December 31, 2007, increasing from $175.3 million for the year ended December 31, 2006. The primary areas of increased costs were in higher property taxes ($6.0 million), increased chemicals and additives costs ($3.8 million), higher salaries and benefits ($2.6 million, including $1.2 million in increased bonus costs and $715,000 in increased stock-based compensation costs), higher consulting and legal expenses ($1.7 million), higher natural gas costs ($1.3 million) and higher environmental expenses ($1.2 million).
Selling and general expenses. Selling and general expenses, excluding depreciation, increased $2.9 million, or 5%, from $52.5 million for the year ended December 31, 2006 to $55.3 million for the year ended December 31, 2007, primarily due to a $1.3 million increase in salaries and benefits expense, which resulted from $4.3 million in additional stock-based compensation expense and general salary increases, offset by a $3.8 million reduction in cash bonus expense. See Note 7 under “Stock-based Compensation” in the “Notes to Consolidated Financial Statements” for a detailed discussion of our stock-based compensation. Stock-based compensation expense was $20.0 million for the year ended December 31, 2007 compared to $15.8 million for the comparable period in 2006. Beverly Hills litigation costs also increased by $641,000 in the year ended December 31, 2007, compared to the year ended December 31, 2006.
Depreciation, amortization and accretion. Depreciation, amortization and accretion increased $11.8 million, or 29%, from $41.2 million for the year ended December 31, 2006 to $53.0 million for the same period in 2007 because of increased capital investment in our Refineries, including the ultra low sulfur diesel projects placed into service in the middle of the second quarter of 2006 and our Cheyenne Refinery coker expansion project placed into service in the second quarter of 2007. We also had higher depreciation expense during the year ended December 31, 2007 due to changes in the estimated useful lives of certain assets that are expected to be retired in connection with certain of our capital projects in 2008 and 2009.
Gain on sale of assets. The $15.2 million gain on sale of assets during the year ended December 31, 2007 resulted from a gain of $17.3 million from the sale of our 34.72% interest in a crude oil pipeline in Wyoming and a 50% interest in two crude oil tanks in Guernsey, Wyoming in September 2007, partially offset by the buyout and sale of a leased aircraft.
Interest expense and other financing costs. Interest expense and other financing costs of $8.8 million for the year ended December 31, 2007 decreased $3.4 million, or 28%, from $12.1 million in the comparable period in 2006. The decrease was due to $8.1 million of interest cost being capitalized in the year ended December 31, 2007, compared to $3.8 million of interest cost being capitalized in the year ended December 31, 2006, offset by $2.4 million in accrued interest expense for income tax contingencies in 2007 ($1.5 million in 2006) and $2.2 million ($1.9 million in 2006) in facility costs and financing expenses related to the Utexam Master Crude Oil Purchase and Sale Contract entered into in March 2006 (“Utexam Arrangement”) (see “Leases and Other Commitments” in Note 9 in the “Notes to Consolidated Financial Statements”). Average debt outstanding (excluding amounts payable under the Utexam Arrangement) decreased to $150.0 million during the year ended December 31, 2007 from $151.7 million for the same period in 2006.
Interest and investment income. Interest and investment income increased $3.8 million, or 21%, from $18.1 million in the year ended December 31, 2006 to $21.9 million in the year ended December 31, 2007, due to larger cash balances and higher interest rates on invested cash.
Provision for income taxes. The provision for income taxes for the year ended December 31, 2007 was $269.7 million on pretax income of $768.9 million (or 35.1%) compared to $200.8 million on pretax income of $580.1 million (or 34.6%) for the same period in 2006. The American Jobs Creation Act of 2004 (“the Act”) benefited our 2006 current income taxes payable by allowing us an accelerated depreciation deduction of 75% of qualified capital costs incurred to achieve low sulfur diesel fuel requirements (See “Environmental” under Note 9 in the “Notes to Consolidated Financial Statements”). The Act also provides for a $0.05 per gallon federal income tax credit on compliant diesel fuel up to an amount equal to the remaining 25% of these qualified capital costs. The $0.05 per gallon federal income tax credit allowed us to realize an $8.5 million federal income tax credit ($5.5 million excess tax benefit) and a $22.4 million federal income tax credit ($14.5 million excess tax benefit) in the years ended December 31, 2007 and 2006, respectively. This credit reduced our 2007 and 2006 income taxes payable and reduced our overall effective income tax rate for those years. Another provision of the Act, the Section 199 production activities deduction for manufacturers, benefited our 2007 and 2006 income taxes payable by an estimated $16.0 million and $5.7 million, respectively, and reduced our overall effective tax rate in both of those years. See Note 6 in the “Notes to Consolidated Financial Statements” for detailed information on our deferred tax assets.
2006 Compared with 2005
Overview of Results
We had net income for the year ended December 31, 2006, of $379.3 million, or $3.37 per diluted share, compared to net income of $275.2 million, or $2.42 per diluted share, in the same period in 2005. Our operating income of $574.2 million for the year ended December 31, 2006, reflected an increase of $124.2 million from the $450.0 million operating income for the comparable period in 2005. The average diesel crack spread was higher during 2006 ($21.35 per barrel) than in 2005 ($17.13 per barrel). The average gasoline crack spread was also higher during 2006 ($14.10 per barrel) than in 2005 ($11.67 per barrel), and both the light/heavy and WTI/WTS crude oil differentials improved.
Specific Variances
Refined product revenues. Refined product revenues increased $759.7 million, or 39%, from $4.0 billion to $4.8 billion for the year ended December 31, 2006 compared to the same period in 2005. This increase was due to both an increase in average product sales prices ($8.81 higher per sales barrel) and an increase in product sales volumes in 2006 (1,657 more bpd). Sales prices increased primarily as a result of increased crude oil prices and improvements in the gasoline and diesel crack spreads.
Manufactured product yields. Yields increased 6,776 bpd at the El Dorado Refinery while decreasing 3,669 bpd at the Cheyenne Refinery for the year ended December 31, 2006 compared to 2005. A Cheyenne Refinery turnaround in April 2006 caused yields to be lower during 2006 than during 2005, and an El Dorado Refinery turnaround from March 1 through April 5, 2005 caused yields to be lower in 2005 than 2006.
Other revenues. Other revenues increased $35.1 million to a $36.3 million gain for the year ended December 31, 2006, compared to a $1.2 million gain for the same period in 2005, the sources of which were $34.6 million in net gains from derivative contracts in the year ended December 31, 2006 compared to net derivative gains of $1.0 million for the same period in 2005 and $1.5 million in gasoline sulfur credit sales in 2006 (none in 2005). We utilized more derivative contracts during the year ended December 31, 2006 than in the comparable period in 2005, primarily to hedge Canadian in-transit crude oil for our El Dorado Refinery. See “Price Risk Management Activities” under Item 7A and Note 11 in the “Notes to Consolidated Financial Statements” for a discussion of our utilization of commodity derivative contracts.
Raw material, freight and other costs. Raw material, freight and other costs increased by $603.6 million, or 19%, during the year ended December 31, 2006, from $3.2 billion in 2005 to $3.9 billion in 2006. The increase in raw material, freight and other costs when compared to 2005 was due to higher average crude prices, higher crude oil charges on an overall combined basis, and FIFO inventory losses in the year ended December 31, 2006. We benefited from slightly improved crude oil differentials during the year ended December 31, 2006 compared to the same period in 2005. The average WTI crude oil priced at Cushing, Oklahoma (ConocoPhillips WTI crude oil posting plus) was $64.94 for the year ended December 31, 2006 compared to $55.77 for the year ended December 31, 2005. Crude oil charges were 154,473 bpd for the year ended December 31, 2006, compared to 152,649 bpd for the comparable period in 2005. For the year ended December 31, 2006, we realized an increase in raw material, freight and other costs as a result of net FIFO inventory losses of approximately $16.1 million after tax ($25.7 million pretax, comprised of a $31.7 million loss at the El Dorado Refinery and a $6.0 million gain at the Cheyenne Refinery) due to decreasing crude oil and refined product prices during the latter part of 2006. For the year ended December 31, 2005, we realized a reduction in raw material, freight and other costs as a result of FIFO inventory gains of approximately $29.4 million after tax ($47.6 million pretax, comprised of $39.0 million for the El Dorado Refinery and $8.6 million for the Cheyenne Refinery) because of increasing crude oil and refined product prices.
The Cheyenne Refinery raw material, freight and other costs of $57.07 per sales barrel for the year ended December 31, 2006 increased from $48.49 per sales barrel in the same period in 2005 due to higher crude oil prices and a lower FIFO inventory gain, offset by fewer crude oil charges and the benefit of a slightly improved light/heavy crude oil differential. Crude oil charges of 45,999 bpd for the year ended December 31, 2006 were lower than the 46,922 bpd in the comparable period in 2005 because of the previously mentioned turnaround in 2006. The heavy crude oil utilization rate at the Cheyenne Refinery expressed as a percentage of the total crude oil charge decreased to 73% in the year ended December 31, 2006, from 82% in 2005 as we increased our charges of lighter crude oil to take advantage of favorable pricing opportunities for light crude purchases. The light/heavy crude oil differential for the Cheyenne Refinery averaged $16.21 per barrel in the year ended December 31, 2006 compared to $15.32 per barrel in the same period in 2005.
The El Dorado Refinery raw material, freight and other costs of $63.15 per sales barrel for the year ended December 31, 2006 increased from $54.01 per sales barrel in the same period in 2005 due to higher average crude oil prices and a FIFO inventory loss in 2006 compared to a FIFO inventory gain in 2005. Crude oil charges were 108,475 bpd for the year ended December 31, 2006, compared to 105,727 bpd for the comparable period in 2005 because of the previously mentioned turnaround in 2005. In 2006, our El Dorado Refinery began charging Canadian heavy crude oil and achieved a light/heavy crude oil differential of $18.13 per barrel. For the year ended December 31, 2006, the heavy crude oil utilization rate at our El Dorado Refinery expressed as a percentage of the total crude oil charge was approximately 11%. The WTI/WTS crude oil differential increased from an average of $4.51 per barrel in the year ended December 31, 2005 to $5.22 per barrel in the same period in 2006.
Refinery operating expenses. Refinery operating expenses, excluding depreciation, increased $35.7 million, or 15%, from $241.5 million in the year ended December 31, 2005 to $277.1 million in the comparable period of 2006.
The Cheyenne Refinery operating expenses, excluding depreciation, were $101.9 million in the year ended December 31, 2006, compared to $78.9 million in the comparable period of 2005. The increased expenses included higher maintenance costs ($8.1 million, with $3.0 million of the costs related to a plant-wide steam outage in February 2006, $1.2 million for slop oil centrifuging, $557,000 related to a September 2006 coker outage and $577,000 related to a butamer unit outage), increased environmental expenses ($5.8 million, including a $5.0 million accrual related to a potential waste-water pond clean up), higher salaries and benefits ($4.3 million, including $1.4 million in increased stock-based compensation costs and $787,000 additional bonus accruals), higher additive and chemical costs ($2.1 million, including increased wastewater treatment chemical use, cost of testing chemicals from a new vendor and increased usage of fresh fluid catalyst) and higher turnaround amortization ($1.0 million).
The El Dorado Refinery operating expenses, excluding depreciation, were $175.3 million in the year ended December 31, 2006, increasing from $162.5 million for the year ended December 31, 2005. The primary areas of increased costs were in electricity ($3.8 million), chemicals and additives ($4.1 million), maintenance ($6.2 million, including $1.8 million due to a fire on a distillate hydrotreater unit, $1.1 million for tank repairs and $1.0 million for a gofiner unit catalyst change-out), salaries and benefits ($1.1 million, including $767,000 in increased stock-based compensation costs), lease and rental equipment ($1.3 million, including higher cogeneration facility lease costs and rentals for a reverse osmosis trailer and filter), environmental ($827,000), insurance ($668,000) and non-maintenance contractors ($928,000). Electricity costs were higher during the year ended December 31, 2006, compared to the same period in 2005, as we produced electricity from our cogeneration facility in 2005 and did not do so in 2006. Chemicals and additive costs were higher during the year ended December 31, 2006, compared to the same period in 2005, as the fluid catalytic cracking unit consumed more additives and chemicals running for the full year in 2006, while it was down for turnaround work for approximately one month in 2005. We also purchased more nitrogen and oxygen during 2006 than in 2005 because the cogeneration facility provided us with some nitrogen and oxygen in 2005. We realized a $7.9 million reduction in natural gas costs due to lower natural gas prices and lower consumption in 2006 because we did not purchase natural gas for the cogeneration facility.
Selling and general expenses. Selling and general expenses, excluding depreciation, increased $21.8 million, or 71%, from $30.7 million for the year ended December 31, 2005 to $52.5 million for the year ended December 31, 2006, primarily due to a $15.0 million increase in salaries and benefits expense, which resulted from the adoption on January 1, 2006 of FAS No. 123(R), the issuance of additional stock-based compensation awards, the vesting of stock-based compensation upon the retirement of an executive officer as of March 31, 2006 and higher bonus accruals. See Note 7 under “Stock-based Compensation” in the “Notes to Consolidated Financial Statements” for a detailed discussion of our stock-based compensation. Stock-based compensation expense was $15.8 million for the year ended December 31, 2006 compared to $1.4 million for the comparable period in 2005. Beverly Hills litigation costs also increased by $6.2 million in the year ended December 31, 2006, compared to the year ended December 31, 2005, as the 2005 litigation costs were reduced by insurance recoveries and 2006 litigation costs increased in preparation for certain court proceedings which took place in the fourth quarter of 2006 and early 2007.
Depreciation, amortization and accretion. Depreciation, amortization and accretion increased $6.0 million, or 17%, for the year ended December 31, 2006 compared to the same period in 2005 because of increased capital investment in our Refineries, including the ultra low sulfur diesel projects.
Interest expense and other financing costs. Interest expense and other financing costs of $12.1 million for the year ended December 31, 2006 increased $1.8 million, or 17%, from $10.3 million in the comparable period in 2005. The increase was due to $1.5 million in accrued interest expense for income tax contingencies in 2006 ($163,000 in 2005) and $1.9 million in facility costs and financing expenses related to the Utexam Master Crude Oil Purchase and Sale Contract entered into in March 2006 (“Utexam Arrangement”) (see “Leases and Other Commitments” in Note 9 in the “Notes to Consolidated Financial Statements”), offset by $3.8 million of interest cost being capitalized in the year ended December 31, 2006, compared to only $2.6 million of interest cost being capitalized in the year ended December 31, 2005 and revolving credit facility interest expense of $79,000 for the year ended December 31, 2006, decreasing by $298,000 from the $377,000 for the year ended December 31, 2005. Average debt outstanding (excluding amounts payable under the Utexam Arrangement) decreased to $151.7 million during the year ended December 31, 2006 from $161.0 million for the same period in 2005.
Interest and investment income. Interest and investment income increased $10.5 million, or 138%, from $7.6 million in the year ended December 31, 2005 to $18.1 million in the year ended December 31, 2006, due to larger cash balances and higher interest rates on invested cash.
Provision for income taxes. The provision for income taxes for the year ended December 31, 2006 was $200.8 million on pretax income of $580.1 million (or 34.6%) compared to $170.0 million on pretax income of $447.3 million (or 37.9%) for the same period in 2005. The American Jobs Creation Act of 2004 (“the Act”) benefited both our 2006 and 2005 current income taxes payable by allowing us an accelerated depreciation deduction of 75% of qualified capital costs incurred to achieve low sulfur diesel fuel requirements (see “Environmental” under Note 9 in the “Notes to Consolidated Financial Statements”). The Act also provides for a $0.05 per gallon credit on compliant diesel fuel up to an amount equal to the remaining 25% of these qualified capital costs for federal income tax purposes, and for the year ended December 31, 2006 we realized a $22.4 million federal income tax credit ($14.5 million excess tax benefit). This credit greatly reduced our 2006 income taxes payable and reduced our overall effective income tax rate. Another provision of the Act which benefited our 2006 and 2005 income taxes payable by an estimated $5.7 million and $3.2 million, respectively, and reduced our overall effective tax rate in both of those years was the Section 199 production activities deduction for manufacturers. See Note 6 in the “Notes to Consolidated Financial Statements” for detailed information about our deferred tax assets.
Liquidity and Capital Resources
Cash flows from operating activities. Net cash provided by operating activities was $429.0 million for the year ended December 31, 2007, compared to net cash provided by operating activities of $340.5 million during the year ended December 31, 2006. Improved results of operations increased cash flow significantly during 2007, but were partially offset by a higher investment in working capital.
Working capital changes used a total of $137.2 million of cash in the year ended December 31, 2007 while using $106.2 million of cash in the comparable period in 2006. Working capital uses of cash during the year ended December 31, 2007 included an increase in inventories of $127.4 million, an increase in trade and other receivables of $45.0 million and an increase in other current assets of $12.7 million. The increase in inventories was primarily due to higher average prices of both crude oil and refined products. The increase in trade and other receivables was a result of a $20.3 million increase in trade receivables due to higher refined products sale prices in 2007 and the income tax receivable of $24.1 million as of December 31, 2007 compared to $52,000 as of December 31, 2006.
The most significant working capital item providing cash during the year ended December 31, 2007 was an increase in accounts payable of $30.3 million primarily due to an increase of purchased product and blendstock accruals of $26.8 million and an increase in outstanding checks of $10.8 million.
We made estimated federal and state income tax payments of $261.0 million and $33.1 million, respectively, during the year ended December 31, 2007. As of December 31, 2007, we had accrued estimated state income taxes payable of $6.8 million and a receivable for our estimated overpayment of federal income taxes for 2007 of $24.0 million. We also have estimated prepaid state income taxes of $7.1 million and prepaid federal income taxes of $2.1 million, which will be applied to the related 2008 income tax liabilities.
At December 31, 2007, we had $297.4 million of cash and cash equivalents, working capital of $529.5 million and $191.8 million available for borrowings under our revolving credit facility. Our operating cash flows are affected by crude oil and refined product prices and other risks as discussed in Item 7A “Quantitative and Qualitative Disclosures About Market Risks.”
Cash flows used in investing activities. Capital expenditures during the year ended December 31, 2007 were $291.2 million, which included approximately $152.9 million for the El Dorado Refinery and $133.7 million for the Cheyenne Refinery. The $152.9 million of capital expenditures for our El Dorado Refinery included $85.6 million for the crude unit and vacuum tower expansion, $28.7 million for the coke drum replacement, $8.3 million for the gasoil hydrotreater revamp, $6.3 million for the catalytic cracker regenerator emission control project and $3.6 million on the catalytic cracker expansion as well as operational, payout, safety, administrative, environmental and optimization projects. The $133.7 million of capital expenditures for our Cheyenne Refinery included approximately $90.7 million for the coker expansion (substantially completing the total estimated $117.0 million coker expansion project) and $9.2 million for the amine plant as well as environmental, operational, safety, administrative and payout projects. The Cheyenne Refinery also completed a $5.8 million crude fractionation project in the spring of 2007. We funded our 2007 capital expenditures with cash generated from our operations.
We also purchased in February 2007 for approximately $3.0 million (net of current assets received), EMC, a 25,000 bpd products terminal and blending facility located in Henderson, Colorado. In the year ended December 31, 2007, we generated net proceeds of $19.9 million from the sale of our 34.72% interest in a crude oil pipeline and 50% interest in two crude oil tanks and $2.3 million from the sale of an aircraft.
Under the provisions of the purchase agreement with Shell for our El Dorado Refinery, we were required to make contingent earn-out payments for each of the years 2000 through 2007 equal to one-half of the excess over $60.0 million per year of the El Dorado Refinery’s annual revenues less raw material, freight and other costs and refinery operating expenses, excluding depreciation. The total amount of these potential contingent earn-out payments was capped at $40.0 million, with an annual cap of $7.5 million. Such payments were recorded as additional acquisition costs. Payments of $7.5 million each were required based on 2005, 2006 and 2007 results, and were accrued as of December 31, 2005, 2006 and 2007, respectively. Each of these payments was paid in January 2006, 2007 and 2008, respectively. Including the payment we made in early 2008, we have paid a total of $37.5 million for contingent earn-out payments and will no longer be subject to this provision of the Shell agreement.
Cash flows used in financing activities. During the year ended December 31, 2007, we issued 396,761 shares of common stock due to stock option exercises by employees and members of our Board of Directors, for which we received $2.3 million in cash and 5,576 shares ($221,000) of our common stock in stock swaps where mature stock was surrendered to facilitate the exercise of the option. During the year ended December 31, 2007, we received 126,923 shares ($4.9 million) of our common stock, now held as treasury stock, from employees and members of our Board of Directors who surrendered stock to pay withholding taxes related to stock-based compensation.
In November 2006, our Board of Directors approved a $100 million share repurchase program, which replaced all existing repurchase authorizations (no shares had been repurchased under this program as of December 31, 2006). At its April 2007 meeting, our Board of Directors increased the size of our repurchase authorization by $100 million and increased the repurchase authorization by an additional $100 million at its August 2007 meeting, bringing the total authorizations since November 2006 to $300 million. We purchased 6,443,700 shares using a total $243.6 million to repurchase stock under this program during the year ended December 31, 2007, leaving a remaining authorization of $56.4 million.
As of December 31, 2007, we had $150.0 million of long-term debt, due 2011, and no borrowings under our $225.0 million revolving credit facility. We had $33.2 million of outstanding letters of credit under our revolving credit facility. On October 1, 2007, we entered into a $225.0 million third amended and restated revolving credit agreement that provides us the ability to increase our maximum commitment amount available to $350 million, extended the termination date of the credit facility to October 3, 2011 as well as updated the financial covenants and other terms of the facility. We were in compliance with the financial covenants of our revolving credit facility as of December 31, 2007. We had shareholders’ equity of $1.0 billion as of December 31, 2007.
Our Board of Directors declared a quarterly cash dividend of $0.03 per share of common stock in December 2006, which was paid in January 2007. In March 2007, our Board of Directors declared a quarterly cash dividend of $0.03 per share of common stock, which was paid in April 2007. Our Board of Directors declared a quarterly cash dividend of $0.05 per share of common stock in April, August and November, 2007, which were paid in July 2007, October 2007, and January 2008, respectively. The total cash required for the dividend declared in November 2007 was approximately $5.4 million and was accrued as a dividend payable at year-end. “Accrued dividends” on the Consolidated Balance Sheets include dividends accrued to date on restricted stock, which are not paid until the restricted stock vests.
Future capital expenditures
Significant future capital projects. Both the Cheyenne and El Dorado Refineries will continue working on significant, multi-year projects in 2008 and 2009. The approximate $117.0 million coker expansion at the Cheyenne Refinery, which was substantially completed in 2007 with the coke handling portion expected to be completed in early 2008, significantly decreased the amount of asphalt produced and increased the amount of higher margin projects. The new amine unit at the Cheyenne Refinery estimated at a total cost of $20.5 million is intended to result in improved alkylation unit reliability and provide a partial backup unit if the main amine unit is not operating. The project is expected to be completed and start-up is expected to occur in mid-2008. The above amounts include estimated capitalized interest.
The approximate $151 million crude unit and vacuum tower expansion at the El Dorado Refinery will allow for higher crude charge rates (including a significantly greater percentage of heavy crude oil) and higher gasoline and distillate yields. This project also includes a significant metallurgical upgrade to the unit which will allow for running high napthenic acid crude oils, a characteristic typical of crude types found in Western Canada, West Africa and the North Sea. We expect to bring this project online in the spring of 2008 during the planned turnaround for the crude/vacuum unit complex. The coke drum replacement project estimated at $60 million for our El Dorado Refinery includes safety and reliability components as well as overall throughput support for the Refinery and is expected to be completed by mid-2008. The gasoil hydrotreater revamp at the El Dorado Refinery is the key project to achieve gasoline sulfur compliance for our El Dorado Refinery and has a total estimated cost of $82 million (see “Environmental” in Note 9 in the “Notes to Consolidated Financial Statements”). The project will also result in significant yield improvement for the catalytic cracking unit and is anticipated to be completed in the fall of 2009. The El Dorado Refinery $84 million catalytic cracker expansion project includes a revamp component and new technology which will increase charge rate and improve product yields and is also anticipated to be completed in the fall of 2009. The El Dorado Refinery catalytic cracker regenerator emission control project, with a fall 2009 estimated completion date and total estimated cost of $36 million, will add a scrubber to improve the environmental performance of the unit, specifically as it relates to flue-gas emissions. This project is necessary to support the catalytic cracking expansion project and to meet a portion of the expected requirements of the EPA Petroleum Refining Initiative (see “Environmental” in Note 9 in the “Notes to Consolidated Financial Statements”). The above amounts include estimated capitalized interest.
2008 capital expenditures. Including the projects discussed above, 2008 capital expenditures aggregating approximately $306.0 million are currently planned, and include $188.0 million at our El Dorado Refinery, $116.0 million at our Cheyenne Refinery, $1.5 million at our products terminal and blending facility and $600,000 of capital expenditures for our Denver and Houston offices. The $188.0 million of planned capital expenditures for our El Dorado Refinery includes $29.0 million of the gasoil hydrotreater revamp project, $28.0 million of the coke drum replacement project, $27.0 million of the crude unit and vacuum expansion project, $22.0 million of the catalytic cracker expansion project and $20.0 million of the catalytic cracker regenerator emission control project, as mentioned above, as well as environmental, operational, safety, payout and administrative projects. The $116.0 million of planned capital expenditures for our Cheyenne Refinery includes $15.0 million for the Refinery main office replacement, $13.0 million for a new boiler project ($14.0 million total cost), $8.0 million for a waste water selenium treatment project ($15.0 million total cost), and $8.0 million for the new amine plant ($20.5 million total cost), as well as environmental, operational, safety, payout and administrative projects. We expect that our 2008 capital expenditures will be funded with cash generated by our operations and by using a portion of our existing cash balance, if necessary. We may experience cost overruns and/or schedule delays on any of these projects because of the strong industry demand for material, labor and engineering resources.
Contractual Cash Obligations
The table on the following page lists the contractual cash obligations we have by period. These items include our long-term debt based on their maturity dates, our operating lease commitments, purchase obligations and other long-term liabilities.
Our operating leases include building, equipment, aircraft and vehicle leases, which expire from 2008 through 2017, as well as an operating sublease for the use of the cogeneration facility at our El Dorado Refinery. The non-cancelable sublease, entered into in connection with the acquisition of our El Dorado Refinery in 1999, expires in 2016 with an option that allows us to renew the sublease for an additional eight years. This lease has both a fixed and a variable component.
Purchase obligations include agreements to purchase goods or services that are enforceable and legally binding and that specify terms, including fixed or minimum quantities to be purchased, fixed, minimum or variable price provisions, and the approximate timing of the transaction. Purchase obligations exclude agreements that are cancelable without penalty.
The amounts shown in the table on the following page for transportation, terminalling and storage contractual obligations include our anticipated commitments based on our agreements for shipping crude oil on the Express Pipeline, the Spearhead Pipeline, the Plains All American Pipeline and the Osage Pipeline.
For more information on the agreements discussed above, see “Lease and Other Commitments” in Note 9 in the “Notes to Consolidated Financial Statements.”
| Contractual Cash Obligations | | Payments Due by Period | |
| | | Total | | | Within 1 Year | | | Within 2-3 years | | | Within 4-5 years | | | After 5 years | |
| | | (in thousands) | |
| Long-term debt | | $ | 150,000 | | | $ | - | | | $ | - | | | $ | 150,000 | | | $ | - | |
| Interest on long-term debt | | | 37,266 | | | | 9,938 | | | | 19,875 | | | | 7,453 | | | | - | |
| Operating leases | | | 82,945 | | | | 13,106 | | | | 26,417 | | | | 17,677 | | | | 25,745 | |
| Purchase obligations: | | | | | | | | | | | | | | | | | | | | |
| Crude supply, feedstocks and natural gas (1) | | | 701,183 | | | | 687,099 | | | | 14,084 | | | | - | | | | - | |
| Transportation, terminalling and storage | | | 351,571 | | | | 53,089 | | | | 93,187 | | | | 78,504 | | | | 126,791 | |
| Refinery capital projects (2) | | | 40,192 | | | | 40,192 | | | | - | | | | - | | | | - | |
| Other goods and services | | | 7,483 | | | | 6,917 | | | | 555 | | | | 11 | | | | - | |
| Total purchase obligations | | | 1,100,429 | | | | 787,297 | | | | 107,826 | | | | 78,515 | | | | 126,791 | |
| Contingent income tax liabilities | | | 32,257 | | | | - | | | | 31,340 | | | | 917 | | | | - | |
| Other long-term liabilities | | | 13,605 | | | | - | | | | 4,054 | | | | 3,202 | | | | 6,349 | |
| Pension and post-retirement healthcareand other benefit plans funding requirements (3) | | | - | | | | - | | | | - | | | | - | | | | - | |
| Total contractual cash | | $ | 1,416,502 | | | $ | 810,341 | | | $ | 189,512 | | | $ | 257,764 | | | $ | 158,885 | |
| (1) | Crude supply, feedstocks and natural gas future obligations were calculated using current market prices and/or prices established in applicable contracts. Of these obligations, $559.3 million relate to January and February 2008 feedstock and natural gas requirements of the Refineries. |
| (2) | The $40.2 million of Refinery capital projects primarily consists of $10.9 million for the crude unit and vacuum tower expansion project, $10.7 million for coke handling equipment and $9.7 million for coke drum replacement project, all at our El Dorado Refinery. These amounts for refinery capital projects reflected here relate to current contractual commitments that have been made but with no current liability as of December 31, 2007, not the total estimated costs of the projects. |
| (3) | No pension funding will be required in 2008 for our cash balance pension plan. Funding requirements for remaining years will be based on actuarial estimates and actual experience. Our retiree health care plan is unfunded. Future payments for retiree health care benefits are estimated for the next ten years in Note 8 “Employee Benefit Plans” in the “Notes to Consolidated Financial Statements.” |
Off-Balance Sheet Arrangements
We have an interest in one unconsolidated entity (see Note 1 “Nature of Operations” in the “Notes to Consolidated Financial Statements”). Other than facility and equipment leasing agreements, we do not participate in any transactions, agreements or other contractual arrangements which would result in any off-balance sheet liabilities or other arrangements to us.
Environmental
We will be making significant future capital expenditures to comply with various environmental regulations. See “Environmental” in Note 9 in the “Notes to Consolidated Financial Statements.”
Application of Critical Accounting Policies
The preparation of financial statements in accordance with United States generally accepted accounting principles requires our management to make estimates and assumptions that affect the amounts reported in the consolidated financial statements and accompanying notes. Actual results could differ from those estimates. The following summary provides information about our critical accounting policies, including identification of those involving critical accounting estimates, and should be read in conjunction with Note 2 “Significant Accounting Policies” in the “Notes to Consolidated Financial Statements.”
Turnarounds. Normal maintenance and repairs are expensed as incurred. Planned major maintenance (“turnarounds”) is the scheduled and required shutdown of refinery processing units for significant overhaul and refurbishment. Turnaround costs include contract services, materials and rental equipment. The costs of turnarounds are deferred when incurred and amortized on a straight-line basis over the period of time estimated to lapse until the next turnaround occurs. These deferred charges are included in our Consolidated Balance Sheets in “Deferred turnaround costs.” Also included in our Consolidated Balance Sheets in “Deferred catalyst costs” are the costs of the catalyst that is replaced at periodic intervals when the quality of the catalyst has deteriorated beyond its prescribed function. The catalyst costs are deferred when incurred and amortized on a straight-line basis over the estimated useful life of the specific catalyst. The amortization expenses for deferred turnaround and catalyst costs are included in “Refinery operating expenses, excluding depreciation” in our Consolidated Statements of Income. Since these policies rely on our estimated timing for the next turnaround and the useful lives of the catalyst, adjustments can occur in the amortization expenses as these estimates change.
Inventories. Inventories of crude oil, unfinished products and all finished products are recorded at the lower of cost on a FIFO basis or market. Crude oil includes both domestic and foreign crude oil volumes at its cost and associated freight and other cost. Unfinished products (work in process) include any crude oil that has entered into the refining process, and other feedstocks that are not finished as far as refining operations are concerned. These include unfinished gasoline and diesel, blendstocks and other feedstocks. Finished product inventory includes saleable gasoline, diesel, jet fuel, chemicals, asphalt and other finished products. Unfinished and finished products inventory values have components of raw material, the associated raw material freight and other costs, and direct refinery operating expense allocated when refining begins relative to their proportionate market values. The FIFO method of accounting for inventories sometimes results in our recognizing substantial gains (in periods of rising prices) or losses (in periods of falling prices) from our inventories of crude oil and products. While we believe that this accounting method accurately reflects the results of our operations, many other refining companies utilize the last-in, first-out (“LIFO”) method of accounting for inventories. Thus, a comparison of our results to those of other refineries must take into account the impact of the inventory accounting differences.
Asset Retirement Obligations. We account for asset retirement obligations as required under the Financial Accounting Standards Board (“FASB”) Statement of Financial Accounting Standard (“FAS”) No. 143, “Accounting for Retirement Asset Obligations.” FAS No. 143 requires that the fair value of a liability for an asset retirement obligation be recognized in the period in which the liability is incurred, with the associated asset retirement costs being capitalized as a part of the carrying amount of the long-lived asset. FAS No. 143 also includes disclosure requirements that provide a description of asset retirement obligations and reconciliation of changes in the components of those obligations.
In March 2005, the FASB issued FASB Interpretation No. 47, “Accounting for Conditional Asset Retirement Obligations” (“FIN 47”). FIN 47 clarified that the term “conditional asset retirement obligation” as used in FAS No. 143 refers to a legal obligation to perform an asset retirement activity in which the timing and/or method of settlement are conditional on a future event that may or may not be within the control of the reporting entity. Since the obligation to perform the asset retirement activity is unconditional, FIN 47 provides that a liability for the fair value of a conditional asset obligation should be recognized if that fair value can be reasonably estimated, even though uncertainty exists about the timing and/or method of settlement. FIN 47 also clarifies when an entity would have sufficient information to reasonably estimate the fair value of a conditional asset retirement obligation under FAS No. 143. We adopted FIN 47 as of December 31, 2005; in doing so, we recorded a net asset retirement obligation of $5.5 million, recognized $4.0 million in 2005 as the pretax cumulative effect of an accounting change ($2.5 million after tax) and recorded a $1.5 million increase in property, plant and equipment. At December 31, 2007, our asset retirement obligation was $6.0 million.
Asset retirement obligations are affected by regulatory changes and refinery operations as well as changes in pricing of services. In order to determine fair value, management must make certain estimates and assumptions, including, among other things, projected cash flows, a credit-adjusted risk-free interest rate, and an assessment of market conditions that could significantly impact the estimated fair value of the asset retirement obligation. These estimates and assumptions are subjective and are currently based on historical costs with adjustments for estimated future changes in the associated costs. Therefore, we expect the dollar amount of these obligations to change as more information is obtained. A 1% change in pricing of services would cause an approximate $50,000 change to the asset retirement obligation. We believe that we have adequately accrued for our asset retirement obligations at this time and that changes in estimates in future periods will not have a significant effect on our results of operations or financial condition. See “Significant Accounting Policies” in Note 2 in the “Notes to Consolidated Financial Statements” for further information about asset retirement obligations.
Environmental Expenditures. Environmental expenditures are expensed or capitalized based upon their future economic benefit. Costs that improve a property’s pre-existing condition, and costs that prevent future environmental contamination, are capitalized. Remediation costs related to environmental damage resulting from operating activities subsequent to acquisition are expensed. Liabilities for these expenditures are recorded when it is probable that obligations have been incurred and the amounts can be reasonably estimated. Such estimates are subject to change due to many factors, including the identification of new sites requiring remediation, changes in environmental laws and regulations and their interpretation, additional information related to the extent and nature of remediation efforts, and potential improvements in remediation technologies.
Pension and Other Post-retirement Benefit Obligations. We have significant pension and post-retirement benefit liabilities and costs that are developed from actuarial valuations. Inherent in these valuations are key assumptions, including discount rates, expected returns on plan assets and health care inflation rates. Changes in these assumptions are primarily influenced by factors outside of our control. These assumptions can have a significant effect on the amounts reported in our consolidated financial statements. See Note 8 “Employee Benefit Plans” in the “Notes to Consolidated Financial Statements” for more information about these plans and the current assumptions used.
Income Taxes. We provide for income taxes in accordance with FAS No. 109, “Accounting for Income Taxes” (“FAS 109”) and FASB Interpretation No. 48, “Accounting for Uncertain Tax Positions – An Interpretation of FAS 109” (“FIN 48”.) We record deferred tax assets and liabilities to account for the expected future tax consequences of events that have been recognized in our financial statements and our tax returns. We routinely assess the realizability of our deferred tax assets and if we conclude that it is more likely than not that some portion or all of the deferred tax assets will not be realized, the tax asset would be reduced by a valuation allowance. We consider future taxable income in making such assessments which requires numerous judgments and assumptions. We record contingent income tax liabilities, interest and penalties, as provided for in FIN 48, based on our estimate as to whether, and the extent to which, additional taxes may be due.
New Accounting Pronouncements
See “New Accounting Pronouncements” in Note 2 in the “Notes to Consolidated Financial Statements.”
Market Risks
See Item 7A “Quantitative and Qualitative Disclosure about Market Risk” and Notes 2 and 11 in the “Notes to Consolidated Financial Statements” under “Price Risk Management Activities” for a discussion of our various price risk management activities. When we make the decision to manage our price exposure, our objective is generally to avoid losses from negative price changes, realizing we will not obtain the benefit of positive price changes.
Item 7A. Quantitative and Qualitative Disclosure About Market Risk |
Impact of Changing Prices. Our revenues and cash flows, as well as estimates of future cash flows, are sensitive to changes in energy prices. Major shifts in the cost of crude oil, the prices of refined products and the cost of natural gas can generate large changes in the operating margin from refining operations. These prices also determine the carrying value of our Refineries’ inventories.
Price Risk Management Activities. At times, we enter into commodity derivative contracts to manage our price exposure to our inventory positions, purchases of foreign crude oil and consumption of natural gas in the refining process or to fix margins on certain future production. Gains or losses on commodity derivative contracts accounted for as hedges are recognized in the related inventory in “Inventory of crude oil, products and other” on the Consolidated Balance Sheets and ultimately, when the inventory is charged or sold, in “Raw material, freight and other costs” on the Consolidated Statements of Income. Gains and losses on transactions accounted for using mark-to-market accounting are reflected in “Other revenues” on the Consolidated Statements of Income at each period end. See “Price Risk Management Activities” under Notes 2 and 11 in the “Notes to Consolidated Financial Statements.”
Our outstanding derivatives sell contracts and net unrealized gains as of December 31, 2007 are summarized below:
Commodity | | Period | | Volume (thousands of bbls) | | Expected Close Out Date | | Unrealized Net Gain (in thousands) |
| Crude Oil | | February 2008 | | 1,597 | | January 2008 | | $ 1,894 |
| Crude Oil | | March 2008 | | 1,690 | | February 2008 | | 7,616 |
Operating Data
The following tables set forth the refining operating statistical information on a consolidated basis and for each Refinery for 2007, 2006 and 2005. The statistical information includes the following terms:
| · | WTI Cushing crude oil price - the benchmark West Texas Intermediate crude oil priced at Cushing, Oklahoma (ConocoPhillips WTI crude oil posting plus). |
| · | Charges - the quantity of crude oil and other feedstock processed through Refinery units on a bpd basis. |
| · | Manufactured product yields - the volumes of specific materials that are obtained through the distilling of crude oil and the operations of other refinery process units on a bpd basis. |
| · | Gasoline and diesel crack spreads - the average non-oxygenated gasoline and diesel net sales prices that we receive for each product less the average WTI Cushing crude oil price. |
| · | Cheyenne light/heavy crude oil differential - the average differential between the WTI Cushing crude oil price and the heavy crude oil delivered to the Cheyenne Refinery. |
| · | WTI/WTS crude oil differential - the average differential between the WTI Cushing crude oil price and the West Texas sour crude oil priced at Midland, Texas. |
| · | El Dorado Refinery light/heavy crude oil differential - the average differential between the WTI Cushing crude oil price and the Canadian heavy crude oil delivered to the El Dorado Refinery. This differential is only applicable beginning in 2006 when we began utilizing Canadian crude oil at the El Dorado Refinery. |
| Consolidated: | | | | | | | | | |
| | | | | | | | | | |
| Years Ended December 31, | | 2007 | | | 2006 | | | 2005 | |
| Charges (bpd) | | | | | | | | | |
Light crude | | | 31,171 | | | | 39,659 | | | | 39,210 | |
Heavy and intermediate crude | | | 114,875 | | | | 114,814 | | | | 113,439 | |
Other feed and blendstocks | | | 18,831 | | | | 17,346 | | | | 15,955 | |
Total | | | 164,877 | | | | 171,819 | | | | 168,604 | |
| | | | | | | | | | | | | |
| Manufactured product yields (bpd) | | | | | | | | | | | | |
Gasoline | | | 76,974 | | | | 81,484 | | | | 83,574 | |
Diesel and jet fuel | | | 55,889 | | | | 57,678 | | | | 55,151 | |
Asphalt | | | 5,945 | | | | 6,032 | | | | 7,434 | |
Other | | | 22,074 | | | | 21,580 | | | | 17,506 | |
Total | | | 160,882 | | | | 166,774 | | | | 163,665 | |
| | | | | | | | | | | | | |
| Total product sales (bpd) | | | | | | | | | | | | |
Gasoline | | | 88,744 | | | | 89,895 | | | | 90,372 | |
Diesel and jet fuel | | | 56,862 | | | | 57,326 | | | | 54,350 | |
Asphalt | | | 5,988 | | | | 6,138 | | | | 7,526 | |
Other | | | 18,554 | | | | 18,679 | | | | 18,133 | |
Total | | | 170,148 | | | | 172,038 | | | | 170,381 | |
| | | | | | | | | | | | | |
| Refinery operating margin information (per sales barrel) | | | | | | | | | | | | |
Refined products revenue | | $ | 84.85 | | | $ | 75.80 | | | $ | 64.32 | |
Raw material, freight and other costs (FIFO inventory accounting) | | | 65.04 | | | | 61.33 | | | | 52.22 | |
Refinery operating expenses, excluding depreciation | | | 4.84 | | | | 4.41 | | | | 3.88 | |
Depreciation and amortization | | | 0.85 | | | | 0.65 | | | | 0.56 | |
| | | | | | | | | | | | | |
| Average WTI crude oil price at Cushing, OK (per barrel) | | $ | 71.99 | | | $ | 64.94 | | | $ | 55.77 | |
| Average gasoline crack spread (per barrel) | | | 18.39 | | | | 14.10 | | | | 11.67 | |
| Average diesel crack spread (per barrel) | | | 22.59 | | | | 21.35 | | | | 17.13 | |
| | | | | | | | | | | | | |
| Average sales price (per sales barrel) | | | | | | | | | | | | |
Gasoline | | $ | 92.15 | | | $ | 80.79 | | | $ | 69.09 | |
Diesel and jet fuel | | | 94.55 | | | | 86.62 | | | | 73.61 | |
Asphalt | | | 44.69 | | | | 37.68 | | | | 26.72 | |
Other | | | 33.18 | | | | 31.11 | | | | 28.28 | |
| Years Ended December 31, | | 2007 | | | 2006 | | | 2005 | |
| Cheyenne Refinery: | | | | | | | | | |
| Charges (bpd) | | | | | | | | | |
Light crude | | | 11,545 | | | | 12,436 | | | | 8,575 | |
Heavy crude | | | 30,233 | | | | 33,563 | | | | 38,347 | |
Other feed and blendstocks | | | 1,304 | | | | 1,694 | | | | 4,399 | |
Total | | | 43,082 | | | | 47,693 | | | | 51,321 | |
| | | | | | | | | | | | | |
| Manufactured product yields (bpd) | | | | | | | | | | | | |
Gasoline | | | 17,504 | | | | 19,089 | | | | 21,035 | |
Diesel | | | 12,281 | | | | 14,261 | | | | 14,580 | |
Asphalt | | | 5,945 | | | | 6,032 | | | | 7,434 | |
Other | | | 5,868 | | | | 6,283 | | | | 6,285 | |
Total | | | 41,598 | | | | 45,665 | | | | 49,334 | |
| | | | | | | | | | | | | |
| Total product sales (bpd) | | | | | | | | | | | | |
Gasoline | | | 27,427 | | | | 26,569 | | | | 27,186 | |
Diesel | | | 12,486 | | | | 14,147 | | | | 14,428 | |
Asphalt | | | 5,988 | | | | 6,138 | | | | 7,526 | |
Other | | | 3,577 | | | | 4,662 | | | | 6,124 | |
Total | | | 49,478 | | | | 51,516 | | | | 55,264 | |
| | | | | | | | | | | | | |
| Refinery operating margin information (per sales barrel) | | | | | | | | | | | | |
Refined products revenue | | $ | 83.04 | | | $ | 74.08 | | | $ | 61.16 | |
Raw material, freight and other costs (FIFO inventory accounting) | | | 62.08 | | | | 57.07 | | | | 48.49 | |
Refinery operating expenses, excluding depreciation | | | 6.05 | | | | 5.42 | | | | 3.91 | |
Depreciation and amortization | | | 1.29 | | | | 1.00 | | | | 0.90 | |
| | | | | | | | | | | | | |
| Average light/heavy crude oil differential (per barrel) | | $ | 18.55 | | | $ | 16.21 | | | $ | 15.32 | |
| Average gasoline crack spread (per barrel) | | | 17.93 | | | | 15.58 | | | | 13.17 | |
| Average diesel crack spread (per barrel) | | | 26.00 | | | | 24.35 | | | | 19.40 | |
| | | | | | | | | | | | | |
| Average sales price (per sales barrel) | | | | | | | | | | | | |
Gasoline | | $ | 92.55 | | | $ | 83.35 | | | $ | 71.14 | |
Diesel | | | 98.84 | | | | 89.99 | | | | 75.57 | |
Asphalt | | | 44.69 | | | | 37.68 | | | | 26.72 | |
Other | | | 19.20 | | | | 20.91 | | | | 25.29 | |
| El Dorado Refinery: | | | | | | | | | |
| Charges (bpd) | | | | | | | | | |
Light crude | | | 19,626 | | | | 27,224 | | | | 30,635 | |
Heavy and intermediate crude | | | 84,642 | | | | 81,251 | | | | 75,092 | |
Other feed and blendstocks | | | 17,527 | | | | 15,652 | | | | 11,556 | |
Total | | | 121,795 | | | | 124,127 | | | | 117,283 | |
| | | | | | | | | | | | | |
| Manufactured product yields (bpd) | | | | | | | | | | | | |
Gasoline | | | 59,470 | | | | 62,395 | | | | 62,539 | |
Diesel and jet fuel | | | 43,608 | | | | 43,417 | | | | 40,572 | |
Other | | | 16,205 | | | | 15,297 | | | | 11,222 | |
Total | | | 119,283 | | | | 121,109 | | | | 114,333 | |
| | | | | | | | | | | | | |
| Total product sales (bpd) | | | | | | | | | | | | |
Gasoline | | | 61,318 | | | | 63,327 | | | | 63,186 | |
Diesel and jet fuel | | | 44,376 | | | | 43,179 | | | | 39,922 | |
Other | | | 14,977 | | | | 14,018 | | | | 12,009 | |
Total | | | 120,671 | | | | 120,524 | | | | 115,117 | |
| | | | | | | | | | | | | |
| Refinery operating margin information (per sales barrel) | | | | | | | | | | | | |
Refined products revenue | | $ | 85.59 | | | $ | 76.53 | | | $ | 65.83 | |
Raw material, freight and other costs (FIFO inventory accounting) | | | 66.25 | | | | 63.15 | | | | 54.01 | |
Refinery operating expenses, excluding depreciation | | | 4.34 | | | | 3.98 | | | | 3.87 | |
Depreciation and amortization | | | 0.67 | | | | 0.50 | | | | 0.40 | |
| | | | | | | | | | | | | |
| Average WTI/WTS crude oil differential (per barrel) | | $ | 5.02 | | | $ | 5.22 | | | $ | 4.51 | |
| Average light/heavy crude oil differential (per barrel) | | | 20.60 | | | | 18.13 | | | | - | |
| Average gasoline crack spread (per barrel) | | | 18.59 | | | | 13.48 | | | | 11.02 | |
| Average diesel crack spread (per barrel) | | | 21.63 | | | | 20.37 | | | | 16.31 | |
| | | | | | | | | | | | | |
| Average sales price (per sales barrel) | | | | | | | | | | | | |
Gasoline | | $ | 91.98 | | | $ | 79.72 | | | $ | 68.21 | |
Diesel and jet fuel | | | 93.34 | | | | 85.51 | | | | 72.90 | |
Other | | | 36.52 | | | | 34.51 | | | | 29.81 | |
Item 8. Financial Statements and Supplementary Data
To the Board of Directors and Shareholders of Frontier Oil Corporation:
We have audited the accompanying consolidated balance sheets of Frontier Oil Corporation and subsidiaries (the “Company”) as of December 31, 2007 and 2006, and the related consolidated statements of income, changes in shareholders’ equity and comprehensive income, and cash flows for each of the three years in the period ended December 31, 2007. Our audits also included the financial statement schedules listed in the Index at Item 15. These consolidated financial statements and financial statement schedules are the responsibility of the Company’s management. Our responsibility is to express an opinion on the financial statements and financial statement schedules based on our audits.
We conducted our audits in accordance with the standards of the Public Company Accounting Oversight Board (United States). Those standards require that we plan and perform the audit to obtain reasonable assurance about whether the financial statements are free of material misstatement. An audit includes examining, on a test basis, evidence supporting the amounts and disclosures in the financial statements. An audit also includes assessing the accounting principles used and significant estimates made by management, as well as evaluating the overall financial statement presentation. We believe that our audits provide a reasonable basis for our opinion.
In our opinion, such consolidated financial statements present fairly, in all material respects, the financial position of Frontier Oil Corporation and subsidiaries as of December 31, 2007 and 2006, and the results of their operations and their cash flows for each of the three years in the period ended December 31, 2007, in conformity with accounting principles generally accepted in the United States of America. Also, in our opinion, such financial statement schedules, when considered in relation to the basic consolidated financial statements taken as a whole, present fairly, in all material respects, the information set forth therein.
As discussed in Note 2 to the consolidated financial statements, on December 31, 2005, the Company adopted the provisions of Financial Accounting Standards Board (“FASB”) Interpretation No. 47, Accounting for Conditional Asset Retirement Obligations.
We have also audited, in accordance with the standards of the Public Company Accounting Oversight Board (United States), the Company’s internal control over financial reporting as of December 31, 2007, based on the criteria established in Internal Control—Integrated Framework issued by the Committee of Sponsoring Organizations of the Treadway Commission and our report dated February 25, 2008 expressed an unqualified opinion on the Company’s internal control over financial reporting.
DELOITTE & TOUCHE LLP
February 25, 2008
CONTROL OVER FINANCIAL REPORTING
The management of Frontier Oil Corporation is responsible for establishing and maintaining adequate internal control over financial reporting. Our internal control system was designed to provide reasonable assurance to the Company’s management and board of directors regarding the preparation and fair presentation of published financial statements. All internal control systems, no matter how well designed, have inherent limitations. Therefore, even those systems determined to be effective can provide only reasonable assurance with respect to financial statement preparation and presentation.
Frontier Oil Corporation’s management assessed the effectiveness of the Company’s internal control over financial reporting as of December 31, 2007. In making this assessment, it used the criteria set forth by the Committee of Sponsoring Organizations of the Treadway Commission in Internal Control-Integrated Framework. Based on our assessment, we believe that, as of December 31, 2007, the Company’s internal control over financial reporting is effective based on those criteria.
Frontier Oil Corporation’s independent registered public accounting firm has issued an audit report on the effectiveness of the Company’s internal control over financial reporting. This report appears on the following page.
February 25, 2008
James R. Gibbs
Chairman of the Board, President and
Michael C. Jennings
Executive Vice President – Chief Financial Officer
Nancy J. Zupan
Vice President – Controller
REPORT OF INDEPENDENT REGISTERED PUBLIC ACCOUNTING FIRM
To the Board of Directors and Shareholders of Frontier Oil Corporation:
We have audited the internal control over financial reporting of Frontier Oil Corporation and its subsidiaries (the “Company”) as of December 31, 2007 based on criteria established in Internal Control—Integrated Framework issued by the Committee of Sponsoring Organizations of the Treadway Commission. The Company's management is responsible for maintaining effective internal control over financial reporting and for its assessment of the effectiveness of internal control over financial reporting, included in the accompanying Management’s Report on Internal Control Over Financial Reporting. Our responsibility is to express an opinion on the Company's internal control over financial reporting based on our audit.
We conducted our audit in accordance with the standards of the Public Company Accounting Oversight Board (United States). Those standards require that we plan and perform the audit to obtain reasonable assurance about whether effective internal control over financial reporting was maintained in all material respects. Our audit included obtaining an understanding of internal control over financial reporting, assessing the risk that a material weakness exists, testing and evaluating the design and operating effectiveness of internal control based on the assessed risk, and performing such other procedures as we considered necessary in the circumstances. We believe that our audit provides a reasonable basis for our opinion.
A company's internal control over financial reporting is a process designed by, or under the supervision of, the company's principal executive and principal financial officers, or persons performing similar functions, and effected by the company's board of directors, management, and other personnel to provide reasonable assurance regarding the reliability of financial reporting and the preparation of financial statements for external purposes in accordance with generally accepted accounting principles. A company's internal control over financial reporting includes those policies and procedures that (1) pertain to the maintenance of records that, in reasonable detail, accurately and fairly reflect the transactions and dispositions of the assets of the company; (2) provide reasonable assurance that transactions are recorded as necessary to permit preparation of financial statements in accordance with generally accepted accounting principles, and that receipts and expenditures of the company are being made only in accordance with authorizations of management and directors of the company; and (3) provide reasonable assurance regarding prevention or timely detection of unauthorized acquisition, use, or disposition of the company's assets that could have a material effect on the financial statements.
Because of the inherent limitations of internal control over financial reporting, including the possibility of collusion or improper management override of controls, material misstatements due to error or fraud may not be prevented or detected on a timely basis. Also, projections of any evaluation of the effectiveness of the internal control over financial reporting to future periods are subject to the risk that the controls may become inadequate because of changes in conditions, or that the degree of compliance with the policies or procedures may deteriorate.
In our opinion, the Company maintained, in all material respects, effective internal control over financial reporting as of December 31, 2007, based on the criteria established in Internal Control—Integrated Framework issued by the Committee of Sponsoring Organizations of the Treadway Commission.
We have also audited, in accordance with the standards of the Public Company Accounting Oversight Board (United States), the consolidated financial statements and financial statement schedules as of and for the year ended December 31, 2007 of the Company and our report dated February 25, 2008, expressed an unqualified opinion on those financial statements and financial statement schedules.
DELOITTE & TOUCHE LLP
Houston, Texas
February 25, 2008
| |
| Consolidated Statements of Income | |
| | | | | | | | | | |
| | | Years Ended December 31, | |
| | | 2007 | | | 2006 | | | 2005 | |
| | | (in thousands, except per share data) | |
| Revenues: | | | | | | | | | |
Refined products | | $ | 5,269,674 | | | $ | 4,759,661 | | | $ | 3,999,935 | |
Other | | | (80,934 | ) | | | 36,292 | | | | 1,227 | |
| | | | 5,188,740 | | | | 4,795,953 | | | | 4,001,162 | |
| | | | | | | | | | | | | |
| Costs and expenses: | | | | | | | | | | | | |
Raw material, freight and other costs | | | 4,039,235 | | | | 3,850,937 | | | | 3,247,372 | |
Refinery operating expenses, excluding depreciation | | | 300,542 | | | | 277,129 | | | | 241,445 | |
Selling and general expenses, excluding depreciation | | | 55,343 | | | | 52,488 | | | | 30,715 | |
Merger termination and legal costs | | | - | | | | - | | | | 48 | |
Depreciation, amortization and accretion | | | 53,039 | | | | 41,213 | | | | 35,213 | |
Gains on sales of assets | | | (15,214 | ) | | | (8 | ) | | | (3,644 | ) |
| | | | 4,432,945 | | | | 4,221,759 | | | | 3,551,149 | |
| | | | | | | | | | | | | |
| Operating income | | | 755,795 | | | | 574,194 | | | | 450,013 | |
| | | | | | | | | | | | | |
| Interest expense and other financing costs | | | 8,773 | | | | 12,139 | | | | 10,341 | |
| Interest and investment income | | | (21,851 | ) | | | (18,059 | ) | | | (7,583 | ) |
| | | | (13,078 | ) | | | (5,920 | ) | | | 2,758 | |
| | | | | | | | | | | | | |
| Income before income taxes | | | 768,873 | | | | 580,114 | | | | 447,255 | |
| Provision for income taxes | | | 269,748 | | | | 200,837 | | | | 169,594 | |
| Income before cumulative effect of accounting change | | | 499,125 | | | | 379,277 | | | | 277,661 | |
Cumulative effect of accounting change, net of income taxes of $1,530 | | | - | | | | - | | | | (2,503 | ) |
| Net income | | $ | 499,125 | | | $ | 379,277 | | | $ | 275,158 | |
| | | | | | | | | | | | | |
| | | | | | | | | | | | | |
| Basic earnings per share of common stock: | | | | | | | | | | | | |
Before cumulative effect of accounting change | | $ | 4.67 | | | $ | 3.40 | | | $ | 2.51 | |
Cumulative effect of accounting change | | | - | | | | - | | | | (0.02 | ) |
Net income | | $ | 4.67 | | | $ | 3.40 | | | $ | 2.49 | |
| | | | | | | | | | | | | |
| Diluted earnings per share of common stock: | | | | | | | | | | | | |
Before cumulative effect of accounting change | | $ | 4.62 | | | $ | 3.37 | | | $ | 2.44 | |
Cumulative effect of accounting change | | | - | | | | - | | | | (0.02 | ) |
Net income | | $ | 4.62 | | | $ | 3.37 | | | $ | 2.42 | |
| | | | | | | | | | | | | |
| The accompanying notes are an integral part of these consolidated financial statements. | |
| |
| Consolidated Balance Sheets | |
| | | December 31, | |
| | | 2007 | | | 2006 | |
| | | (in thousands, except share data) | |
| ASSETS | | | | | | |
| Current assets: | | | | | | |
Cash and cash equivalents | | $ | 297,399 | | | $ | 405,479 | |
Trade receivables, net of allowance of $500 in both years | | | 155,454 | | | | 135,111 | |
Income taxes receivable | | | 24,056 | | | | 52 | |
Other receivables | | | 5,236 | | | | 2,299 | |
Inventory of crude oil, products and other | | | 501,927 | | | | 374,576 | |
Deferred tax assets | | | 9,426 | | | | 3,237 | |
Commutation account | | | 6,280 | | | | - | |
Other current assets | | | 31,245 | | | | 18,462 | |
Total current assets | | | 1,031,023 | | | | 939,216 | |
| Property, plant and equipment, at cost: | | | | | | | | |
Refineries, terminal equipment and pipelines | | | 1,082,275 | | | | 802,498 | |
Furniture, fixtures and other equipment | | | 13,168 | | | | 11,084 | |
| | | | 1,095,443 | | | | 813,582 | |
Less – accumulated depreciation and amortization | | | 317,993 | | | | 276,777 | |
| | | | 777,450 | | | | 536,805 | |
| Deferred turnaround costs | | | 39,276 | | | | 24,640 | |
| Deferred catalyst costs | | | 6,540 | | | | 6,386 | |
| Deferred financing costs, net of amortization | | | | | | | | |
of $1,619 and $1,742 in 2007 and 2006, respectively | | | 2,556 | | | | 2,752 | |
| Commutation account | | | - | | | | 7,290 | |
| Prepaid insurance, net of amortization | | | 909 | | | | 2,120 | |
| Intangible assets, net of amortization | | | | | | | | |
of $370 and $264 in 2007 and 2006, respectively $158 and $53 in 2005 and 2004, respectively | | | 1,460 | | | | 1,316 | |
| Other assets | | | 4,634 | | | | 3,400 | |
| Total assets | | $ | 1,863,848 | | | $ | 1,523,925 | |
| | | | | | | | | |
| LIABILITIES AND SHAREHOLDERS’ EQUITY | | | | | | | | |
| Current liabilities: | | | | | | | | |
Accounts payable | | $ | 417,395 | | | $ | 390,019 | |
Contingent income tax liabilities | | | - | | | | 28,271 | |
Derivative liabilities | | | 15,089 | | | | - | |
Accrued liabilities and other | | | 69,029 | | | | 41,408 | |
Total current liabilities | | | 501,513 | | | | 459,698 | |
| | | | | | | | | |
| Long-term debt | | | 150,000 | | | | 150,000 | |
| Contingent income tax liabilities | | | 32,257 | | | | - | |
| Post-retirement employee liabilities | | | 27,549 | | | | 28,090 | |
| Other long-term liabilities | | | 13,605 | | | | 16,376 | |
| Deferred income taxes | | | 100,310 | | | | 93,907 | |
| | | | | | | | | |
| Commitments and contingencies | | | | | | | | |
| | | | | | | | | |
| Shareholders’ equity: | | | | | | | | |
Preferred stock, $100 par value, 500,000 shares authorized, | | | | | | | | |
no shares issued | | | - | | | | - | |
Common stock, no par, 180,000,000 shares authorized, 131,850,356 and | | | | | | | | |
134,509,256 shares issued at December 31, 2007 and 2006,respectively | | | 57,736 | | | | 57,802 | |
Paid-in capital | | | 211,324 | | | | 181,386 | |
Retained earnings | | | 1,095,540 | | | | 719,802 | |
Accumulated other comprehensive income | | | 1,578 | | | | 256 | |
Treasury stock, at cost, 26,893,939 and 24,164,808 shares | | | | | | | | |
at December 31, 2007 and 2006, respectively | | | (327,564 | ) | | | (183,392 | ) |
Total shareholders’ equity | | | 1,038,614 | | | | 775,854 | |
| Total liabilities and shareholders’ equity | | $ | 1,863,848 | | | $ | 1,523,925 | |
| | | | | | | | | |
| The accompanying notes are an integral part of these consolidated financial statements. | |
| |
| Consolidated Statements of Cash Flows | |
| | | | | | | | | | |
| | | Years Ended December 31, | |
| | | 2007 | | | 2006 | | | 2005 | |
| | | (in thousands) | |
| Cash flows from operating activities: | | | | | | | | | |
| Net income | | $ | 499,125 | | | $ | 379,277 | | | $ | 275,158 | |
Adjustments to reconcile net income to net cash from operating activities: | | | | | | | | | | | | |
Cumulative effect of accounting change, net of income taxes | | | - | | | | - | | | | 2,503 | |
Depreciation, amortization and accretion | | | 67,512 | | | | 54,388 | | | | 47,546 | |
Deferred income taxes | | | (1,916 | ) | | | 6,073 | | | | 30,259 | |
Stock-based compensation expense | | | 22,553 | | | | 18,029 | | | | 1,363 | |
Excess income tax benefits of stock-based compensation | | | (6,962 | ) | | | (8,881 | ) | | | - | |
Amortization of debt issuance costs | | | 769 | | | | 797 | | | | 785 | |
Gains on sales of assets | | | (15,214 | ) | | | (8 | ) | | | (3,644 | ) |
Decrease in commutation account | | | 1,009 | | | | 5,316 | | | | 3,832 | |
Amortization of long-term prepaid insurance | | | 1,211 | | | | 1,211 | | | | 1,211 | |
Increase in other long-term liabilities | | | 27,365 | | | | 9,309 | | | | 4,473 | |
Changes in deferred charges and other | | | (29,287 | ) | | | (18,844 | ) | | | (17,316 | ) |
Changes in components of working capital from operations: | | | | | | | | | | | | |
Increase in trade, note and other receivables | | | (45,018 | ) | | | (7,633 | ) | | | (43,707 | ) |
Increase in inventory | | | (127,351 | ) | | | (126,955 | ) | | | (90,687 | ) |
Increase in other current assets | | | (12,724 | ) | | | (10,527 | ) | | | (5,591 | ) |
Increase in accounts payable | | | 30,312 | | | | 23,187 | | | | 117,275 | |
Increase in accrued liabilities and other | | | 17,629 | | | | 15,778 | | | | 36,877 | |
Net cash provided by operating activities | | | 429,013 | | | | 340,517 | | | | 360,337 | |
| | | | | | | | | | | | | |
| Cash flows from investing activities: | | | | | | | | | | | | |
| Additions to property, plant and equipment | | | (291,174 | ) | | | (129,703 | ) | | | (109,710 | ) |
| Proceeds from sales of assets | | | 22,222 | | | | 8 | | | | 5,500 | |
| El Dorado Refinery contingent earn-out payment | | | (7,500 | ) | | | (7,500 | ) | | | (7,500 | ) |
| Other acquisitions and leasehold improvements | | | (3,561 | ) | | | - | | | | - | |
| Net proceeds from insurance – involuntary conversion claim | | | - | | | | - | | | | 2,142 | |
Net cash used in investing activities | | | (280,013 | ) | | | (137,195 | ) | | | (109,568 | ) |
| | | | | | | | | | | | | |
| Cash flows from financing activities: | | | | | | | | | | | | |
| Purchase of treasury stock | | | (248,486 | ) | | | (98,950 | ) | | | (34,819 | ) |
| Proceeds from issuance of common stock | | | 2,303 | | | | 3,672 | | | | 23,616 | |
| Dividends paid | | | (17,271 | ) | | | (67,498 | ) | | | (7,776 | ) |
| Debt issuance costs and other | | | (588 | ) | | | (13 | ) | | | (114 | ) |
| Excess income tax benefits of stock-based compensation | | | 6,962 | | | | 8,881 | | | | - | |
Net cash used in financing activities | | | (257,080 | ) | | | (153,908 | ) | | | (19,093 | ) |
| (Decrease) increase in cash and cash equivalents | | | (108,080 | ) | | | 49,414 | | | | 231,676 | |
| Cash and cash equivalents, beginning of period | | | 405,479 | | | | 356,065 | | | | 124,389 | |
| Cash and cash equivalents, end of period | | $ | 297,399 | | | $ | 405,479 | | | $ | 356,065 | |
| | |
| The accompanying notes are an integral part of these consolidated financial statements. | |
| |
| Consolidated Statements of Changes in Shareholders’ Equity and Statements of Comprehensive Income | |
| (in thousands, except share data) | |
| | | | | | | | | | | | | | | | | | | | | | | | | | | | | | | | | | |
| | | Common Stock | | | | | | | | | | | | Treasury Stock | | | | | | | | | Total | |
| | | Number of Shares Issued | | | Amount | | | Paid-in Capital | | | Comprehensive Income | | | Retained Earnings | | | Number of Shares | | | Amount | | | Deferred Compensation | | | Accumulated Other Comprehensive Income (Loss) | | | Number of Shares | | | Amount | |
| December 31, 2004 | | | 126,678,096 | | | $ | 57,607 | | | $ | 119,525 | | | | | | $ | 142,475 | | | | (18,553,868 | ) | | $ | (47,024 | ) | | $ | (266 | ) | | $ | (1,197 | ) | | | 108,124,228 | | | $ | 271,120 | |
| Shares issued under stock-based compensation plans | | | 6,951,300 | | | | 173 | | | | 29,369 | | | | | | | - | | | | 339,596 | | | | 450 | | | | (2,810 | ) | | | | | | | 7,290,896 | | | | 27,182 | |
| Issue of restricted stock units to directors | | | - | | | | - | | | | 1,224 | | | | | | | - | | | | - | | | | - | | | | (1,224 | ) | | | - | | | | - | | | | - | |
| Shares received under: | | | | | | | | | | | | | | | | | | | | | | | | | | | | | | | | | | | | | | | | | | | |
| Stock repurchase plans | | | - | | | | - | | | | - | | | | | | | - | | | | (1,441,600 | ) | | | (24,596 | ) | | | - | | | | - | | | | (1,441,600 | ) | | | (24,596 | ) |
| Stock-based compensation plans | | | - | | | | - | | | | - | | | | | | | - | | | | (1,274,956 | ) | | | (15,700 | ) | | | - | | | | - | | | | (1,274,956 | ) | | | (15,700 | ) |
| Comprehensive income: | | | | | | | | | | | | | | | | | | | | | | | | | | | | | | | | | | | | | | | | | | | |
| Net income | | | - | | | | - | | | | - | | | $ | 275,158 | | | | 275,158 | | | | - | | | | - | | | | - | | | | - | | | | - | | | | 275,158 | |
| Other comprehensive income: | | | | | | | | | | | | | | | | | | | | | | | | | | | | | | | | | | | | | | | | | | | | |
| Defined benefit plans, net of tax liability of $755 | | | | | | | | | | | | 1,224 | | | | | | | | | | | | | | | | | | | | | | | | | | | | | |
| Other comprehensive income | | | | | | | | | | | | | | | 1,224 | | | | | | | | | | | | | | | | | | | | 1,224 | | | | - | | | | 1,224 | |
| Comprehensive income | | | | | | | | | | | | | | $ | 276,382 | | | | | | | | | | | | | | | | | | | | | | | | | | | | | |
| Income tax benefits of stock-based compensation, net of contingency | | | - | | | | - | | | | 7,792 | | | | | | | | - | | | | - | | | | - | | | | - | | | | - | | | | - | | | | 7,792 | |
| Stock-based compensation expense | | | - | | | | - | | | | - | | | | | | | | - | | | | - | | | | - | | | | 1,362 | | | | - | | | | - | | | | 1,362 | |
| Dividends declared | | | - | | | | - | | | | - | | | | | | | | (64,850 | ) | | | - | | | | - | | | | - | | | | - | | | | - | | | | (64,850 | ) |
| December 31, 2005 | | | 133,629,396 | | | $ | 57,780 | | | $ | 157,910 | | | | | | | $ | 352,783 | | | | (20,930,828 | ) | | $ | (86,870 | ) | | $ | (2,938 | ) | | $ | 27 | | | | 112,698,568 | | | $ | 478,692 | |
| Adoption of FAS No. 123 (R) | | | - | | | | - | | | | (2,938 | ) | | | | | | | - | | | | - | | | | - | | | | 2,938 | | | | - | | | | - | | | | - | �� |
| Shares issued under stock-based compensation plans | | | 879,860 | | | | 22 | | | | 3,134 | | | | | | | | - | | | | 389,846 | | | | 516 | | | | - | | | | - | | | | 1,269,706 | | | | 3,672 | |
| Shares received under: | | | | | | | | | | | | | | | | | | | | | | | | | | | | | | | | | | | | | | | | | | | | |
| Stock repurchase plans | | | - | | | | - | | | | - | | | | | | | | - | | | | (3,482,088 | ) | | | (92,273 | ) | | | - | | | | - | | | | (3,482,088 | ) | | | (92,273 | ) |
| Stock-based compensation plans | | | - | | | | - | | | | - | | | | | | | | - | | | | (141,738 | ) | | | (4,765 | ) | | | - | | | | - | | | | (141,738 | ) | | | (4,765 | ) |
| Net income and comprehensive income | | | | | | | | | | | $ | 379,277 | | | | 379,277 | | | | - | | | | - | | | | | | | | | | | | | | | | 379,277 | |
| Adjustment to initially apply FAS No. 158, net of tax liability of $141 | | | - | | | | - | | | | - | | | | | | | | - | | | | - | | | | - | | | | - | | | | 229 | | | | - | | | | 229 | |
| Income tax benefits of stock-based compensation, net of contingency | | | - | | | | - | | | | 5,251 | | | | | | | | - | | | | - | | | | - | | | | - | | | | - | | | | - | | | | 5,251 | |
| Stock-based compensation expense | | | - | | | | - | | | | 18,029 | | | | | | | | - | | | | - | | | | - | | | | - | | | | - | | | | - | | | | 18,029 | |
| Dividends declared | | | - | | | | - | | | | - | | | | | | | | (12,258 | ) | | | - | | | | - | | | | - | | | | - | | | | - | | | | (12,258 | ) |
| December 31, 2006 | | | 134,509,256 | | | $ | 57,802 | | | $ | 181,386 | | | | | | | $ | 719,802 | | | | (24,164,808 | ) | | $ | (183,392 | ) | | $ | - | | | $ | 256 | | | | 110,344,448 | | | $ | 775,854 | |
| Adoption of FIN 48 | | | - | | | | - | | | | - | | | | | | | | (1,016 | ) | | | - | | | | - | | | | - | | | | - | | | | - | | | | (1,016 | ) |
| Shares issued under stock-based compensation plans and other | | | - | | | | - | | | | 951 | | | | | | | | - | | | | 1,188,168 | | | | 1,574 | | | | - | | | | - | | | | 1,188,168 | | | | 2,525 | |
| Shares received under: | | | | | | | | | | | | | | | | | | | | | | | | | | | | | | | | | | | | | | | | | | | | |
| Stock repurchase plans | | | - | | | | - | | | | - | | | | | | | | - | | | | (6,443,700 | ) | | | (243,568 | ) | | | - | | | | - | | | | (6,443,700 | ) | | | (243,568 | ) |
| Stock-based compensation plans | | | - | | | | - | | | | - | | | | | | | | - | | | | (132,499 | ) | | | (5,139 | ) | | | - | | | | - | | | | (132,499 | ) | | | (5,139 | ) |
| Comprehensive income: | | | | | | | | | | | | | | | | | | | | | | | | | | | | | | | | | | | | | | | | | | | | |
| Net income | | | - | | | | - | | | | - | | | $ | 499,125 | | | | 499,125 | | | | - | | | | - | | | | - | | | | - | | | | - | | | | 499,125 | |
| Other comprehensive income: | | | | | | | | | | | | | | | | | | | | | | | | | | | | | | | | | | | | | | | | | | | | |
Defined benefit plans, net of tax liability of $805 | | | | | | | | 1,322 | | | | | | | | | | | | | | | | | | | | | | | | | | | | | |
| Other comprehensive income | | | | | | | | | | | | | | | 1,322 | | | | | | | | | | | | | | | | | | | | 1,322 | | | | - | | | | 1,322 | |
| Comprehensive income | | | | | | | | | | | | | | $ | 500,447 | | | | | | | | | | | | | | | | | | | | | | | | | | | | | |
| Income tax benefits of stock-based compensation, net of contingency | | | - | | | | - | | | | 6,434 | | | | | | | | - | | | | - | | | | - | | | | - | | | | - | | | | - | | | | 6,434 | |
| Treasury stock retirements | | | (2,658,900 | ) | | | (66 | ) | | | - | | | | | | | | (102,895 | ) | | | 2,658,900 | | | | 102,961 | | | | - | | | | - | | | | - | | | | | |
| Stock-based compensation expense | | | - | | | | - | | | | 22,553 | | | | | | | | - | | | | - | | | | - | | | | - | | | | - | | | | - | | | | 22,553 | |
| Dividends declared | | | - | | | | - | | | | - | | | | | | | | (19,476 | ) | | | - | | | | - | | | | - | | | | - | | | | - | | | | (19,476 | ) |
| December 31, 2007 | | | 131,850,356 | | | $ | 57,736 | | | $ | 211,324 | | | | | | | $ | 1,095,540 | | | | (26,893,939 | ) | | $ | (327,564 | ) | | $ | - | | | $ | 1,578 | | | | 104,956,417 | | | $ | 1,038,614 | |
| | | | | | | | | | | | | | | | | | | | | | | | | | | | | | | | | | | | | | | | | | | | | |
| The accompanying notes are an integral part of these consolidated financial statements. |
Notes To Consolidated Financial Statements
For The Years Ended December 31, 2007, 2006 and 2005
The financial statements include the accounts of Frontier Oil Corporation (“FOC”), a Wyoming corporation, and its wholly-owned subsidiaries, collectively referred to as “Frontier” or “the Company.” The Company is an energy company engaged in crude oil refining and wholesale marketing of refined petroleum products (the “refining operations”).
The Company operates refineries (“the Refineries”) in Cheyenne, Wyoming and El Dorado, Kansas. In February 2007, the Company acquired Ethanol Management Company (“EMC”) for approximately $3.1 million cash. EMC’s primary assets are a products terminal and blending facility located near Denver, Colorado. The Company also owned, until their sale in September 2007, a 34.72% interest in a crude oil pipeline in Wyoming and a 50% interest in two crude oil tanks in Guernsey, Wyoming, both of which were accounted for as undivided interests. Each of these assets and the associated liabilities, revenues and expenses were reported on a proportionate gross basis until their sale in September 2007. In addition, the equity method of accounting is utilized for the Company’s 25% interest in 8901 Hangar, Inc., a company which leases and operates a private airplane hangar. The Company’s investment in 8901 Hangar, Inc. was $100,000 and $99,000 at December 31, 2007 and 2006, respectively, and is included in “Other assets” on the Consolidated Balance Sheets. The Company also owned, until its sale in November 2005, FGI, LLC, an asphalt terminal and storage facility in Grand Island, Nebraska. The activities of FGI, LLC were included in the consolidated financial statements until its sale. All of the operations of the Company are in the United States, with its marketing efforts focused in the Rocky Mountain and Plains States regions of the United States. The Rocky Mountain region includes the states of Colorado, Wyoming, Montana and Utah, and the Plains States include the states of Kansas, Oklahoma, eastern Nebraska, Iowa, Missouri, North Dakota and South Dakota. The Company purchases crude oil to be refined and markets the refined petroleum products produced, including various grades of gasoline, diesel fuel, jet fuel, asphalt, chemicals and petroleum coke. The operations of refining and marketing of petroleum products are considered part of one reporting segment.
| 2. | Significant Accounting Policies |
Revenue Recognition
Revenues from sales of refined products are earned and realized upon transfer of title to the customer based on the contractual terms of delivery (including payment terms and prices). Title primarily transfers at the refinery or terminal when the refined product is loaded into the common carrier pipelines, trucks or railcars (free on board origin). In some situations, title transfers at the customer’s destination (free on board destination). Nonmonetary product exchanges and certain buy/sell crude oil transactions which are entered into in the normal course of business are included on a net cost basis in “Raw material, freight and other costs” on the Consolidated Statements of Income. Taxes collected from customers and remitted to governmental authorities are not included in reported revenues.
Property, Plant and Equipment
Property, plant and equipment additions are recorded at cost and depreciated using the straight-line method over the estimated useful lives, which range as follows:
| | Refinery buildings and equipment | | 5 to 50 years |
| | Pipelines and pipeline improvements | | 5 to 20 years |
| | Furniture, fixtures and other | | 3 to 10 years |
The costs of components of property units, net of salvage value, retired or abandoned are charged or credited to accumulated depreciation under the composite method of depreciation. Gains or losses on sales or other dispositions of major units of property are recorded in operating income and are reported in “Gains on sales of assets” in the Consolidated Statements of Income.
The Company reviews long-lived assets for impairments under the Financial Accounting Standards Board (“FASB”) Statement of Financial Accounting Standards (“FAS”) No. 144, “Accounting for the Impairment or Disposal of Long-lived Assets” whenever events or changes in circumstances indicate that the carrying value of an asset may not be recoverable. If the undiscounted future cash flow of an asset to be held and used in operations is less than the carrying value, the Company would recognize a loss for the difference between the carrying value and fair value. When fair values are not available, the Company estimates fair value based on a discounted cash flow analysis.
The Company capitalizes interest on the long-term construction of significant assets. Interest capitalized for the years ended December 31, 2007, 2006 and 2005 was $8.1 million, $3.8 million and $2.6 million, respectively.
Turnarounds
Normal maintenance and repairs are expensed as incurred. Planned major maintenance is the scheduled and required shutdowns of refinery processing units for significant overhaul and refurbishment (“turnarounds”). Turnaround costs include contract services, materials and rental equipment. The costs of turnarounds are deferred when incurred and amortized on a straight-line basis over the period of time estimated to lapse until the next turnaround occurs. These deferred charges are included in the Company’s Consolidated Balance Sheets in “Deferred turnaround costs.” Also included in our Consolidated Balance Sheets, in “Deferred catalyst costs,” are the costs of the catalyst that is replaced at periodic intervals when the quality of the catalyst has deteriorated beyond its prescribed function. The catalyst costs are deferred when incurred and amortized on a straight-line basis over the estimated useful life of the specific catalyst. The amortization expenses resulting from the turnaround and catalyst costs are included in “Refinery operating expenses, excluding depreciation” in the Company’s Consolidated Statements of Income.
Inventories
Inventories of crude oil, unfinished products and all finished products are recorded at the lower of cost on a first-in, first-out (“FIFO”) basis or market. Crude oil includes both domestic and foreign crude oil volumes at its cost and associated freight and other costs. Unfinished products (work in process) include any crude oil that has entered into the refining process, and other feedstocks that are not finished as far as refining operations are concerned. These include unfinished gasoline and diesel, blendstocks and other feedstocks. Finished product inventory includes saleable gasoline, diesel, jet fuel, chemicals, asphalt and other finished products. Unfinished and finished products inventory values have components of raw material, the associated raw material freight and other costs, and direct refinery operating expense allocated when refining begins relative to their proportionate market values. Refined product exchange transactions are considered asset exchanges with deliveries offset against receipts. The net exchange balance is included in inventory. Inventories of materials and supplies and process chemicals are recorded at the lower of average cost or market. Crude oil inventories, unfinished product inventories and finished product inventories are used to secure financing for operations under the Company’s revolving credit facility. (See Note 5 “Revolving Credit Facility.”) The components of inventory as of December 31, 2007 and 2006 were as follows:
| | | December 31, | |
| | | 2007 | | | 2006 | |
| | | (in thousands) | |
| Crude oil | | $ | 223,715 | | | $ | 182,215 | |
| Unfinished products | | | 152,572 | | | | 84,682 | |
| Finished products | | | 104,820 | | | | 89,457 | |
| Process chemicals | | | 1,300 | | | | 1,009 | |
| Repairs and maintenance supplies and other | | | 19,520 | | | | 17,213 | |
| | | $ | 501,927 | | | $ | 374,576 | |
Prepaid Insurance
The Company charges the amounts paid for insurance policies to expense over the term of the policy. Prepaid insurance related to policies with terms of one year or less are included in “Other current assets” on the Consolidated Balance Sheets. The loss mitigation insurance premium and related expenses (see “Litigation-Beverly Hills Lawsuits” under Note 9) totaling $6.4 million are included in “Prepaid insurance” in the long-term asset portion of the Consolidated Balance Sheets and are reflected net of accumulated amortization as of December 31, 2007 and 2006. Of the total indemnity premium, $1.4 million related to year one of the policy and was amortized to expense over the one-year period which began October 1, 2003. The remaining $4.3 million of the indemnity premium is being amortized over four years beginning October 1, 2004. The administrative fee and California insurance tax totaling $673,000 is being amortized to expense over the five-year policy term, which began October 1, 2003. Accumulated amortization was $5.5 million and $4.3 million at December 31, 2007 and 2006, respectively.
Income Taxes
The Company accounts for income taxes under the provisions of FAS No. 109, “Accounting for Income Taxes.” FAS No. 109 requires the asset and liability approach for accounting for income taxes. Under this approach, deferred tax assets and liabilities are recognized based on anticipated future tax consequences attributable to differences between the financial statement carrying amounts of assets and liabilities and their respective tax basis. The Company recognizes liabilities, interest and penalties for potential tax issues based on its estimate of whether, and the extent to which, additional taxes may be due as determined under FASB Interpretation No. 48, “Accounting for Uncertain Tax Positions – An Interpretation of FAS No. 109, Accounting for Income Taxes” (“FIN 48”). See Note 6 “Income Taxes” for further information.
Environmental Expenditures
Environmental expenditures are expensed or capitalized based upon their future economic benefit. Costs that improve a property’s pre-existing condition, and costs that prevent future environmental contamination, are capitalized. Remediation costs related to environmental damage resulting from operating activities subsequent to acquisition are expensed. Liabilities for these expenditures are recorded when it is probable that obligations have been incurred and the amounts can be reasonably estimated.
Price Risk Management Activities
The Company, at times, enters into commodity derivative contracts to manage its price exposure to its inventory positions and purchases of foreign crude oil and to fix margins on certain future production. The commodity derivative contracts used by the Company may take the form of futures contracts, collars or price swaps and are entered into with creditworthy counterparties. The Company believes that there is minimal credit risk with respect to its counterparties. The Company accounts for its commodity derivative contracts under the hedge (or deferral) method of accounting when the derivative contracts are designated as hedges for accounting purposes, or mark-to-market accounting if the Company elects not to designate derivative contracts as accounting hedges or if such derivative contracts do not qualify for hedge accounting under FAS No. 133, “Accounting for Derivative Instruments and Hedging Activities.” As such, gains or losses on commodity derivative contracts accounted for as hedges are recognized initially in the related inventory in “Inventory of crude oil, products and other” on the Consolidated Balance Sheets, and ultimately, when the related inventory is charged or sold in “Raw material, freight and other costs” on the Consolidated Statements of Income. Gains and losses on transactions accounted for using mark-to-market accounting are reflected in “Other revenues” at each period end.
Stock-based Compensation
Effective January 1, 2006, the Company accounts for stock-based compensation in accordance with FAS No. 123(R), “Share-Based Payment,” which requires companies to recognize the fair value of stock options and other stock-based compensation in the financial statements. Prior to 2006, stock-based compensation was measured in accordance with Accounting Principles Board (“APB”) No. 25. Under this intrinsic value method, compensation cost was the excess, if any, of the quoted market value of the Company’s common stock at the grant date over the amount the employee must pay to acquire the stock. No compensation cost for stock options was recognized in the Consolidated Statements of Income for the year ended December 31, 2005. See Note 7 for detailed information on the Company’s stock-based compensation. Had compensation costs for share awards been determined based on the fair value at grant dates and amortized over the vesting period pursuant to FAS No. 123, the Company’s income and EPS would have been the pro forma amounts listed in the following table (in thousands expect per share amounts) for the year ended December 31, 2005. The pro forma compensation expense for the year ended December 31, 2005 includes amortization for options granted in prior years.
| | | | | |
| | | | For the Year Ended December 31, 2005 | |
| | Net income | | $ | 275,158 | |
| | Pro forma compensation expense, net of tax | | | (1,255 | ) |
| | Pro forma net income | | $ | 273,903 | |
| | Basic EPS: | | | | |
| | As reported | | $ | 2.49 | |
| | Pro forma | | | 2.47 | |
| | Diluted EPS: | | | | |
| | As reported | | $ | 2.42 | |
| | Pro forma | | | 2.41 | |
Asset Retirement Obligations
The Company accounts for asset retirement obligations as required under FAS No. 143, “Accounting for Retirement Asset Obligations.” FAS No. 143 requires that the fair value of a liability for an asset retirement obligation be recognized in the period in which it is incurred, with the associated asset retirement costs being capitalized as a part of the carrying amount of the long-lived asset.
In March 2005, the FASB issued FASB Interpretation No. 47, “Accounting for Conditional Asset Retirement Obligations” (“FIN 47”). FIN 47 clarified that the term “conditional asset retirement obligation” as used in FAS No. 143 refers to a legal obligation to perform an asset retirement activity in which the timing and/or method of settlement are conditional on a future event that may or may not be within the control of the entity. Because the obligation to perform the asset retirement activity is unconditional, FIN 47 provides that a liability for the fair value of a conditional asset obligation should be recognized if that fair value can be reasonably estimated, although uncertainty exists about the timing and/or method of settlement. FIN 47 also clarifies when an entity would have sufficient information to reasonably estimate the fair value of a conditional asset retirement obligation under FAS No. 143.
The Company adopted FIN 47 as of December 31, 2005 and recognized $4.0 million in 2005 as the pretax cumulative effect of an accounting change ($2.5 million after tax). The Company’s Consolidated Balance Sheets as of December 31, 2007 and 2006 recognized a net asset retirement obligation of $6.0 million for both years. At December 31, 2007, $1.3 million of the $6.0 million was classified as current in “Accrued liabilities and other” and $4.7 million was included in “Other long-term liabilities.” Changes in the Company’s asset retirement obligations for the year ended December 31, 2007 were as follows (in thousands):
| Balance as of December 31, 2006 | | $ | 5,964 | |
| Liabilities incurred | | | 92 | |
| Liabilities settled | | | (475 | ) |
| Accretion expense | | | 401 | |
| Revisions to estimated cash flows | | | 58 | |
| Balance as of December 31, 2007 | | $ | 6,040 | |
The Company has asset retirement obligations related to its Refineries and certain other assets as a result of environmental and other legal requirements. The Company is not required to perform such work in some circumstances until it permanently ceases operations of the long-lived assets. Because the Company considers the useful life of the Refineries and certain other assets indeterminable, an associated asset retirement obligation cannot be calculated at this time. The Company has recorded an asset retirement obligation for the handling and disposal of hazardous substances that the Company is legally obligated to incur in connection with maintaining and improving the Refineries and certain other assets.
Principles of Consolidation
The Consolidated Financial Statements include the accounts of FOC and all 100% owned subsidiaries, as well as the Company’s undivided interests in a crude oil pipeline and crude oil tanks up until their sale in September 2007. The Company utilizes the equity method of accounting for investments in entities in which it does not have the ability to exercise control. Entities in which the Company has the ability to exercise significant influence and control are consolidated. All intercompany transactions and balances are eliminated in consolidation.
Use of Estimates
The preparation of financial statements in conformity with accounting principles generally accepted in the United States of America (“GAAP”) requires management to make estimates and assumptions that affect the reported amounts of assets and liabilities and disclosures of contingent assets and liabilities at the date of the financial statements and the reported amounts of revenues and expenses during the reporting period. Actual results could differ from those estimates.
Cash Equivalents
Highly liquid investments with maturity, when purchased, of three months or less are considered to be cash equivalents. Cash equivalents were $278.3 million and $377.5 million at December 31, 2007 and 2006, respectively.
Supplemental Cash Flow Information
Cash payments for interest, net of capitalized interest, during 2007, 2006 and 2005 were $5.5 million, $8.4 million and $7.8 million, respectively. Cash payments for income taxes during 2007, 2006 and 2005 were $294.1 million, $183.6 million and $106.0 million, respectively. Cash refunds of income taxes during 2007, 2006 and 2005 were zero, $1.4 million and $3.6 million, respectively. Noncash investing activities include accrued capital expenditures of $27.1 million, $30.2 million and $20.2 million, as of December 31, 2007, 2006 and 2005, respectively.
Reclassifications
Certain prior year amounts have been reclassified to conform to the current period financial statement presentation. The Company has combined certain accrued and long-term liabilities from 2006 into “Accrued liabilities and other” and “Other long-term liabilities” on the Consolidated Balance Sheet with detail provided for the accrued liabilities in Note 3, “Accrued Liabilities and Other.” In addition, the Company has broken out certain current and long-term assets from the 2006 presentation in “Other receivables” and “Deferred charges and other assets” on the Consolidated Balance Sheet. These reclassifications have no effect on previously reported net income.
New Accounting Pronouncements
In September 2006, the FASB issued FAS No. 157, “Fair Value Measurements” which establishes a framework for measuring fair value in GAAP and expands disclosures about fair value measurements. FAS No. 157 states that fair value is “the price that would be received to sell the asset or paid to transfer the liability (an exit price), not the price that would be paid to acquire the asset or received to assume the liability (an entry price).” The statement is effective for financial statements issued for fiscal years beginning after November 15, 2007, and interim periods within those fiscal years. The Company is currently evaluating the effect that this statement will have on the Company’s financial statements and any other factors influencing its overall business environment, but does not believe that it will have a material effect on its financial statements.
In February 2007, the FASB issued FAS No. 159, “The Fair Value Option for Financial Assets and Financial Liabilities – Including an amendment of FAS No. 115, Accounting for Certain Investments in Debt and Equity Securities,” which expands the use of fair value accounting but does not affect existing standards which require assets or liabilities to be carried at fair value. Under FAS No. 159, a company may elect to use fair value to measure many financial instruments and certain other assets and liabilities at fair value. The Company has preliminarily decided not to elect fair value accounting for any of its eligible items. The adoption of FAS No. 159 therefore will have no impact on the Company’s financial position, cash flows or results of operations. If the use of fair value is elected (the fair value option), any upfront costs and fees related to the item (e.g., debt issue costs) must be recognized in earnings and cannot be deferred. The fair value election is irrevocable and generally made on an instrument-by-instrument basis even if a company has similar instruments that it elects not to measure based on fair value. At the adoption date, unrealized gains and losses on existing items for which fair value has been elected are reported as a cumulative adjustment to beginning retained earnings. Subsequent to the adoption of FAS No. 159, changes in fair value are recognized in earnings. FAS No. 159 is effective for fiscal years beginning after November 15, 2007.
In April 2007, the FASB issued FASB Staff Position (“FSP”) No. FIN 39-1, an amendment of FASB Interpretation No. 39. This FSP amends paragraph 3 of Interpretation 39 to replace the terms “conditional contracts” and “exchange contracts” with the term “derivative instruments” as defined in FASB Statement No. 133, “Accounting for Derivative Instruments and Hedging Activities.” It also amended paragraph 10 of Interpretation 39 to permit a reporting entity to offset fair value amounts recognized for the right to reclaim cash collateral (a receivable) or the obligation to return cash collateral (a payable) against fair value amounts recognized for derivative instruments executed with the same counterparty under the same master netting arrangement that have been offset in accordance with the paragraph. The guidance in this FSP is effective for fiscal years beginning after November 15, 2007, and an entity must recognize the effects of applying this FSP as a change in accounting principle through retrospective application for all financial statements presented unless it is impracticable to do so. The Company is currently evaluating the aspects of this FSP, but does not believe it will have a material effect on its financial statements.
The Emerging Issues Task Force (“EITF”) of the FASB ratified EITF Issue 06-11, “Accounting for Income Tax Benefits of Dividends on Share-Based Payment Awards” (“EITF 06-11”) in June 2007. In a stock-based compensation arrangement, employees may be entitled to dividends during the vesting period for nonvested shares or share units and until the exercise date for stock options. These dividend payments generally can be treated as a deductible compensation expense for income tax purposes, thereby generating an income tax benefit for the employer. At issue was how such a realized benefit should be recognized in the financial statements. The EITF reached a conclusion that an entity should recognize the realized tax benefit as an increase in additional paid-in capital (“APIC”) and that the amount recognized in APIC should be included in the pool of excess tax benefits available to absorb tax deficiencies on stock-based payment awards. EITF 06-11 will be effective prospectively for the income tax benefits that result from dividends on equity-classified employee share-based payment awards that are declared in fiscal years beginning after December 15, 2007. The Company is currently evaluating the effect that this EITF will have on its financial statements, but does not believe that it will have a material effect on its financial statements.
| 3. | Accrued Liabilities and Other |
| | | December 31, | |
| | | 2007 | | | 2006 | |
| | | (in thousands) | |
| Accrued compensation | | $ | 16,119 | | | $ | 16,971 | |
| Accrued Beverly Hills litigation settlement | | | 10,000 | | | | - | |
| Accrued income taxes | | | 6,819 | | | | 4,557 | |
| Accrued El Dorado Refinery contingent earn-out payment | | | 7,500 | | | | 7,500 | |
| Accrued dividends | | | 5,825 | | | | 3,486 | |
| Accrued environmental costs | | | 8,750 | | | | 2,444 | |
| Accrued property taxes | | | 4,998 | | | | 1,536 | |
| Accrued coker fire costs | | | 2,800 | | | | - | |
| Accrued interest | | | 2,541 | | | | 2,541 | |
| Other | | | 3,677 | | | | 2,373 | |
| | | $ | 69,029 | | | $ | 41,408 | |
Schedule of Long-term Debt
| | | December 31, | |
| | | 2007 | | | 2006 | |
| | | (in thousands) | |
| 6.625% Senior Notes, maturing 2011 | | $ | 150,000 | | | $ | 150,000 | |
On October 1, 2004, the Company issued $150.0 million principal amount of 6.625% Senior Notes. The 6.625% Senior Notes, which mature on October 1, 2011, were issued at par, and the Company received net proceeds (after underwriting fees) of $147.2 million. Interest is paid semi-annually. The 6.625% Senior Notes are redeemable, at the option of the Company, at 103.313% after October 1, 2007, declining to 100% in 2010. The 6.625% Senior Notes may restrict payments, including dividends, and limit the incurrence of additional indebtedness based on covenants related to interest coverage ratio and restricted payments. Frontier Holdings Inc. and its subsidiaries are full and unconditional guarantors of the 6.625% Senior Notes (see Note 12 “Consolidating Financial Statements.”)
| 5. | Revolving Credit Facility |
The refining operations have a working capital credit facility with a group of banks led by Union Bank of California and BNP Paribas (“Facility”). On October 1, 2007, the Company entered into a third amended and restated revolving credit agreement that provides Frontier the ability to increase its maximum commitment amount to $350 million (previously $250 million), extended the termination date of the credit facility to October 3, 2011 as well as updated the financial covenants and other terms of the facility. The Facility is a collateral-based facility with total borrowing capacity, subject to borrowing base availability amounts, of up to $225 million. Any unutilized capacity after cash borrowings is available for letters of credit. No borrowings were outstanding at December 31, 2007 or 2006 under the Facility. Standby letters of credit outstanding were $33.2 million and $43.2 million at December 31, 2007 and 2006, respectively. As of December 31, 2007, the Company had borrowing base availability of $191.8 million under the Facility.
The Facility, secured by inventory, accounts receivable and related contracts and intangibles, and certain deposit accounts, provides working capital financing for operations, generally the financing of crude oil and product supply. The Facility provides for a quarterly commitment fee of 0.25% per annum. The Company’s current borrowing rates are based, at the Company’s option, on the agent bank’s prime rate, the prevailing Federal Funds Rate plus 1.0% or LIBOR plus 1.0%. Outstanding standby letters of credit charges are 0.875% per annum, plus standard issuance and renewal fees. The Company had no funds borrowed at any time during 2007 under the Facility, and thus did not incur any interest expense under the Facility. The Facility is subject to compliance with financial covenants relating to cash coverage and debt leverage ratios. The Company was in compliance with these covenants at December 31, 2007.
The Facility restricts payments to FOC from its subsidiaries and thus, as required by Regulation 210.5-04 of Regulation S-X of the Securities Exchange Act of 1934, as amended, the Condensed Financial Information of FOC is included in Schedule I of this Form 10-K.
The provision for income taxes is comprised of the following:
| | | Years ended December 31, | |
| | | 2007 | | �� | 2006 | | | 2005 | |
| | | (in thousands) | |
| Current: | | | | | | | | | |
Federal | | $ | 238,555 | | | $ | 168,950 | | | $ | 121,455 | |
| State | | | 33,109 | | | | 25,814 | | | | 17,880 | |
| Total current provision | | | 271,664 | | | | 194,764 | | | | 139,335 | |
| Deferred: | | | | | | | | | | | | |
| Federal | | | (1,567 | ) | | | 5,269 | | | | 28,065 | |
| State | | | (349 | ) | | | 804 | | | | 2,194 | |
| Total deferred provision | | | (1,916 | ) | | | 6,073 | | | | 30,259 | |
| Total provision | | $ | 269,748 | | | $ | 200,837 | | | $ | 169,594 | |
| | | | | | | | | | | | | |
The following is a reconciliation of the provision for income taxes computed at the statutory United States income tax rates on pretax income and the provision for income taxes as reported:
| | | Years ended December 31, | |
| | | 2007 | | | 2006 | | | 2005 | |
| | | (in thousands) | |
| Provision based on statutory rates | | $ | 269,106 | | | $ | 203,040 | | | $ | 156,539 | |
| Increase (decrease) resulting from: | | | | | | | | | | | | |
State income taxes | | | 32,760 | | | | 26,618 | | | | 20,074 | |
Federal tax effect of state income taxes | | | (11,466 | ) | | | (9,316 | ) | | | (7,026 | ) |
Benefit of the Section 199 manufacturers production activities deduction | | | (15,387 | ) | | | (5,666 | ) | | | (3,229 | ) |
Benefit of ultra-low sulfur diesel tax credit | | | (5,525 | ) | | | (14,546 | ) | | | - | |
Other, including permanent book-tax differences | | | 260 | | | | 707 | | | | 3,236 | |
| Provision as reported | | $ | 269,748 | | | $ | 200,837 | | | $ | 169,594 | |
Significant components of deferred tax assets and liabilities are shown below:
| | | December 31, 2007 | | December 31, 2006 | |
| | | State | | | Federal | | | Total | | State | | | Federal | | | Total | |
| | | (in thousands) | |
| Current deferred tax assets: | | | | | | | | | | | | | | | | | | |
Gross current assets: | | | | | | | | | | | | | | | | | | |
Accrued bonuses | | $ | 474 | | | $ | 3,734 | | | $ | 4,208 | | | $ | 545 | | | $ | 4,240 | | | $ | 4,785 | |
Stock-based compensation | | | 148 | | | | 1,173 | | | | 1,321 | | | | 94 | | | | 734 | | | | 828 | |
Unrealized loss on derivative contracts | | | 668 | | | | 5,281 | | | | 5,949 | | | | - | | | | - | | | | - | |
Current state income tax liabilities | | | - | | | | 2,334 | | | | 2,334 | | | | - | | | | 683 | | | | 683 | |
Other | | | 170 | | | | 1,346 | | | | 1,516 | | | | 235 | | | | 1,822 | | | | 2,057 | |
Total gross deferred tax assets | | | 1,460 | | | | 13,868 | | | | 15,328 | | | | 874 | | | | 7,479 | | | | 8,353 | |
Gross current liabilities: | | | | | | | | | | | | | | | | | | | | | | | | |
Prepaid expenses | | | (341 | ) | | | (2,698 | ) | | | (3,039 | ) | | | (374 | ) | | | (2,902 | ) | | | (3,276 | ) |
State income tax receivable or prepaid | | | - | | | | (2,472 | ) | | | (2,472 | ) | | | - | | | | (496 | ) | | | (496 | ) |
State deferred taxes | | | - | | | | (391 | ) | | | (391 | ) | | | - | | | | (126 | ) | | | (126 | ) |
Unrealized gain on derivative contracts | | | - | | | | - | | | | - | | | | (139 | ) | | | (1,079 | ) | | | (1,218 | ) |
| Total current net deferred tax assets | | $ | 1,119 | | | $ | 8,307 | | | $ | 9,426 | | | $ | 361 | | | $ | 2,876 | | | $ | 3,237 | |
| | | | | | | | | | | | | | | | | | | | | | | | | |
| Long-term deferred tax liabilities: | | | | | | | | | | | | | | | | | | | | | | | | |
Gross long-term assets: | | | | | | | | | | | | | | | | | | | | | | | | |
Pension and other post-retirement benefits | | $ | 1,185 | | | $ | 9,366 | | | $ | 10,551 | | | $ | 1,265 | | | $ | 9,832 | | | $ | 11,097 | |
Stock-based compensation | | | 1,095 | | | | 8,650 | | | | 9,745 | | | | 628 | | | | 4,878 | | | | 5,506 | |
Environmental liability accruals | | | 301 | | | | 2,375 | | | | 2,676 | | | | 315 | | | | 2,450 | | | | 2,765 | |
Asset retirement obligations | | | 208 | | | | 1,646 | | | | 1,854 | | | | 254 | | | | 1,974 | | | | 2,228 | |
Other | | | 433 | | | | 3,421 | | | | 3,854 | | | | 172 | | | | 1,340 | | | | 1,512 | |
State deferred taxes | | | - | | | | 4,094 | | | | 4,094 | | | | - | | | | 3,879 | | | | 3,879 | |
Total gross long-term assets | | | 3,222 | | | | 29,552 | | | | 32,774 | | | | 2,634 | | | | 24,353 | | | | 26,987 | |
Gross long-term liabilities: | | | | | | | | | | | | | | | | | | | | | | | | |
Depreciation | | | (13,178 | ) | | | (104,419 | ) | | | (117,597 | ) | | | (12,606 | ) | | | (98,554 | ) | | | (111,160 | ) |
Deferred turnaround costs | | | (1,740 | ) | | | (13,747 | ) | | | (15,487 | ) | | | (1,110 | ) | | | (8,624 | ) | | | (9,734 | ) |
| Total long-term net deferred tax liabilities | | $ | (11,696 | ) | | $ | (88,614 | ) | | $ | (100,310 | ) | | $ | (11,082 | ) | | $ | (82,825 | ) | | $ | (93,907 | ) |
As of December 31, 2007, the Company had accrued state income taxes payable of $6.8 million, which are included in “Accrued liabilities and other” on the Consolidated Balance Sheet and a receivable for the Company’s estimated overpayment of federal income taxes for 2007 of $24.0 million. The Company also had estimated overpayments of 2007 state and federal income taxes of $9.2 million, which are included in “Other current assets” on the Consolidated Balance Sheet and will be applied to the related jurisdictions’ 2008 income tax liabilities. The American Jobs Creation Act of 2004 created the Internal Revenue Code Section 199 which provides an income tax benefit to domestic manufacturers. The Company recognized an income tax benefit of approximately $15.4 million in 2007, $5.7 million in 2006 and $3.2 million in 2005 related to the production activities deduction. The income tax provision for the year ended December 31, 2007 was reduced due to the excess $5.5 million income tax benefit of an $8.5 million credit for production of ultra low sulfur diesel fuel. The income tax provision for the year ended December 31, 2006 was reduced due to the excess $14.5 million income tax benefit of a $22.4 million credit for production of ultra low sulfur diesel fuel (see “Environmental” under Note 9 “Commitments and Contingencies”).
The Company recognizes the amount of taxes payable or refundable for the current year and recognizes deferred tax liabilities and assets for the expected future tax consequences of events and transactions that have been recognized in the Company’s financial statements or tax returns. Deferred tax assets are reduced by a valuation allowance when, in the opinion of management, it is more likely than not that some or all of its deferred tax assets will not be realized. Realization of the deferred income tax assets is dependent on generating sufficient taxable income in future years. Although realization is not assured, management believes that it is more likely than not that all of the deferred income tax assets will be realized and thus, no valuation allowance was provided for as of December 31, 2007.
The Company recognized income tax benefits related to the deductibility of stock-based compensation, net of contingency, in the amounts of $6.4 million, $5.3 million, and $7.8 million for the years ended December 31, 2007, 2006 and 2005, respectively. Such benefits were recorded as an increase in additional paid-in capital, a reduction of income taxes payable and an increase in “Contingent income tax liabilities.” The Company also recognized an income tax liability related to the minimum defined benefit liability reflected in “Accumulated other comprehensive income” in the amounts of $805,000, $141,000 and $755,000 for the years ended December 31, 2007, 2006 and 2005, respectively.
The Company utilized all remaining alternative minimum tax carryforwards during 2005. The Company had no federal or state net operating loss carryforwards as of December 31, 2007.
The Company is currently under a U.S. Federal income tax examination for 2005. As of December 31, 2007, no taxing authority has proposed any significant adjustments to the Company's tax positions.
The Company adopted the provisions of FIN 48 on January 1, 2007. The Company reviewed all open tax years for all jurisdictions, primarily U.S. Federal and the states of Kansas, Colorado and Nebraska for the years 2003 through 2006. As a result of the implementation of FIN 48, the Company recognized approximately a $940,000 increase in the liability for unrecognized tax benefits and $76,000 in accrued interest, which were accounted for as reductions to the January 1, 2007 balance of retained earnings. In connection with the adoption of FIN 48, previously recognized contingent income tax liabilities under FAS No. 5, “Accounting for Contingencies” ($28.3 million, including accrued interest, at December 31, 2006) were reclassified from a current liability to a long-term liability. A reconciliation of the beginning and ending amount of unrecognized tax benefits, excluding accrued interest and the federal income tax benefit of state contingencies, is as follows (in thousands):
| Balance as of January 1, 2007 | | $ | 27,710 | |
| Additions based on tax positions related to the current year | | | 692 | |
| Additions for tax positions of prior years | | | - | |
| Reductions for tax positions of prior years | | | - | |
| Settlements | | | - | |
| Reductions due to lapse of applicable statutes of limitations | | | (78 | ) |
| Balance as of December 31, 2007 | | $ | 28,324 | |
| | | | | |
The total contingent income tax liabilities and accrued interest of $32.3 million are reflected in the Consolidated Balance Sheet at December 31, 2007 in “Contingent income tax liabilities.” The Company has no tax positions for which the ultimate deductibility is highly certain but for which there is uncertainty about the timing of such deductibility. Total unrecognized tax benefits at December 31, 2007 that, if recognized, would affect the effective tax rate were $4.3 million.
The Company recognizes penalties and interest accrued related to unrecognized tax benefits in “Interest expense and other financing costs” on the Consolidated Statements of Income. During the years ended December 31, 2007 and 2006, the Company recognized approximately $2.4 million and $1.5 million, respectively, of interest expense on contingent income tax liabilities. During the years ended December 31, 2007 and 2006, the Company recorded $59,000 and $33,000, respectively, in tax penalties. No penalties or interest expense on contingent income tax liabilities were recorded for the year ended December 31, 2005. The Company had approximately $4.1 million and $1.7 million in accrued interest on income tax contingencies at December 31, 2007 and 2006, respectively.
The statutes of limitations for contingencies (totaling $6.7 million as of December 31, 2007) related to the Company’s 2003 and 2004 income tax returns will expire in the third and fourth quarters of 2008. These contingencies primarily relate to the deductibility for income tax purposes of certain stock-based compensation for executives and a deduction taken related to the Company’s prior oil and gas operations. Any income tax benefit related to these contingencies will be recorded as a reduction to the income tax provision ($3.4 million), an increase to paid-in capital ($2.0 million) and a reduction of interest expense ($1.2 million as of December 31, 2007). It is also reasonably possible that contingencies totaling $18.6 million related to certain stock-based compensation for executives on the Company’s 2005 income tax returns may be reversed or settled by the end of 2008 with the completion of the U.S. Federal income tax examination for 2005 now in progress. Any income tax benefit allowed for this stock-based compensation would be recorded as an increase in additional paid-in capital ($16.2 million) and a reduction of interest expense ($2.4 million as of December 31, 2007).
As of December 31, 2007, the Company is generally open to examination in the United States and various individual states for tax years ended December 31, 2004 through December 31, 2007.
Dividends
The Company declared a quarterly cash dividend of $0.03 per share of common stock for the quarter ended March 31, 2007. The quarterly cash dividend was $0.05 per share of common stock for the quarters ended June 30, 2007 through December 31, 2007.
All outstanding common shareholders at the declaration date are eligible to participate in dividends. The payment of dividends is prohibited under the Company’s revolving credit facility only if a default has occurred and is continuing or such payment would cause a default. The 6.625% Notes may restrict dividend payments based on covenants related to interest coverage and a restricted payments calculation.
Treasury stock
The Company accounts for its treasury stock under the cost method on a FIFO basis. In November 2006, the Company’s Board of Directors approved a $100 million share repurchase program, which replaced all existing repurchase authorizations, and was utilized for share repurchases in the year ended December 31, 2007 (no shares had been repurchased under this new program as of December 31, 2006). On April 24, 2007, the Company announced a $100 million increase to the existing $100 million share repurchase authorization. An additional $100 million increase was announced on August 29, 2007 bringing the total share repurchase authorization to $300 million. During the year ended December 31, 2007, the Company purchased 6,443,700 shares ($243.6 million) in open market transactions. At December 31, 2007, the remaining authorization for repurchases was $56.4 million. A portion of the shares of stock which were purchased during 2007 were canceled instead of being held as treasury stock. Thus 2,658,900 shares ($103.0 million) were canceled, resulting in a reduction of common stock by $66,000 and retained earnings by $102.9 million as of December 31, 2007. Subsequent to December 31, 2007 through February 25, 2008, the Company purchased an additional 1,462,000 shares ($52.5 million) in open market transactions under the share repurchase authorizations.
The Company received 5,576 shares ($221,000) in 2007, no shares in 2006 and 381,916 shares ($3.6 million) in 2005 of its common stock, now held as treasury stock, from employees or members of the Company’s Board of Directors in stock swaps where mature stock is surrendered by the employees or board members to exercise their stock options, as provided by the Company’s stock-based compensation plan. The Company received 126,923 shares ($4.9 million) in 2007, 141,738 shares ($4.8 million) in 2006 and 893,040 shares ($12.1 million) in 2005 of its common stock, now held as treasury stock, from employees to cover withholding taxes on stock-based compensation. As of December 31, 2007, the Company had 26,893,939 shares of treasury stock.
Earnings per Share
The following sets forth the computation of diluted earnings per share (“EPS”) for the years ended December 31, 2007, 2006 and 2005.
| | | 2007 | | | 2006 | | | 2005 | |
| | | Income (Numerator) | | | Shares (Denomi-nator) | | | Per Share Amount | | | Income (Numerator) | | | Shares (Denomi-nator) | | | Per Share Amount | | | Income (Numerator) | | | Shares (Denomi-nator) | | | Per Share Amount | |
| | | (in thousands except per share amounts) | |
| Basic EPS: | | | | | | | | | | | | | | | | | | | | | | | | | | | |
| Net income | | $ | 499,125 | | | | 106,804 | | | $ | 4.67 | | | $ | 379,277 | | | | 111,408 | | | $ | 3.40 | | | $ | 275,158 | | | | 110,724 | | | $ | 2.49 | |
| Dilutive securities: | | | | | | | | | | | | | | | | | | | | | | | | | | | | | | | | | | | | |
Stock options | | | - | | | | 291 | | | | - | | | | - | | | | 565 | | | | - | | | | - | | | | 2,792 | | | | - | |
Restricted stock | | | - | | | | 875 | | | | - | | | | - | | | | 539 | | | | - | | | | - | | | | 120 | | | | - | |
| Diluted EPS: | | | | | | | | | | | | | | | | | | | | | | | | | | | | | | | | | | | | |
| Net income | | $ | 499,125 | | | | 107,970 | | | $ | 4.62 | | | $ | 379,277 | | | | 112,512 | | | $ | 3.37 | | | $ | 275,158 | | | | 113,636 | | | $ | 2.42 | |
For the years ended December 31, 2007 and 2005, there were no outstanding stock options that could potentially dilute EPS in future years that were not included in the computation of diluted EPS. For the year ended December 31, 2006, 493,226 outstanding stock options that could potentially dilute EPS in future years were not included in the computation of diluted EPS.
Stock-based Compensation
Effective January 1, 2006, the Company adopted FAS No. 123(R), “Share-Based Payment,” which requires companies to recognize the fair value of stock options and other stock-based compensation in the financial statements. The Company adopted FAS No. 123(R) using the modified prospective application method, and accordingly, prior period amounts have not been retrospectively adjusted. Upon adoption of FAS No. 123(R), deferred compensation recorded as contra-equity in prior periods was eliminated against the appropriate equity accounts. The Company evaluated the need for a cumulative effect of a change in accounting principle as of January 1, 2006, related to previously recognized compensation expense for previously forfeited awards or in recognition of an assumption for future forfeits, and determined that none was necessary. In 2006, the adoption of FAS No. 123(R) resulted in incremental stock-based compensation expense of $7.0 million. This incremental stock-based compensation reduced the Company’s net income by $4.3 million ($0.04 per basic and diluted share) for the year ended December 31, 2006. Cash provided by operating activities decreased $8.9 million and cash provided by financing activities increased by the same amount for the year ended December 31, 2006, due to excess income tax benefits from stock-based payment arrangements.
The Company also elected to use the FSP No. 123(R)-3’s simplified method of calculating the adoption-date additional paid-in capital pool. This is for the purposes of calculating the pool of excess income tax benefits available to absorb tax deficiencies subsequent to the adoption of FAS No. 123(R).
Stock-based compensation costs and income tax benefits recognized in the Consolidated Statements of Income for the years ended December 31, 2007, 2006 and 2005 are as follows:
| | | Years Ended December 31, | |
| | | 2007 | | | 2006 | | | 2005 | |
| | | (in thousands) | |
| Restricted shares and units | | $ | 6,879 | | | $ | 8,539 | | | $ | 1,363 | |
| Stock options | | | 1,515 | | | | 2,110 | | | | - | |
| Performance-based awards | | | 14,159 | | | | 7,290 | | | | - | |
| Stock grant to retiring executive (3,030 shares) | | | - | | | | 90 | | | | - | |
Total stock-based compensation expense | | $ | 22,553 | | | $ | 18,029 | | | $ | 1,363 | |
| | | | | | | | | | | | | |
| Income tax benefit recognized in the income statement | | $ | 8,570 | | | $ | 6,851 | | | $ | 518 | |
Omnibus Incentive Compensation Plan. The shareholders of the Company approved the Frontier Oil Corporation Omnibus Incentive Compensation Plan (the “Plan”) at the Annual Meeting of Shareholders held on April 26, 2006. The Plan is a broad-based incentive plan that provides for granting stock options, stock appreciation rights (“SAR”), restricted stock awards, performance awards, stock units, bonus shares, dividend equivalent rights, other stock-based awards and substitute awards (“Awards”) to employees, consultants and non-employee directors of the Company. The Plan amends and restates the Company’s previously approved 1999 Stock Plan and the Company’s Restricted Stock Plan, both of which were merged into the Omnibus Plan. The maximum number of shares of the Company’s common stock that may be issued under the Plan with respect to Awards is 12,000,000 shares, subject to certain adjustments as provided by the Plan. Awards issued under the prior plans between December 31, 2005 and April 26, 2006 reduced the number of shares available for Awards as though the awards had been issued after April 26, 2006. The number of shares available for Awards will be reduced by 1.7 times the number of shares for each stock-denominated award granted, other than an option or a SAR under the Plan, and will be reduced by 1.0 times the number of option shares or SARs granted. As of December 31, 2007, 6,187,352 shares were available to be awarded under the Plan assuming maximum payout is achieved on the performance awards made in 2007 for which restricted stock will be issued in 2008 and in 2010 if the performance criteria are met (see “Performance Awards” below). For purposes of determining compensation expense, forfeitures are estimated at the time Awards are granted based on historical average forfeiture rates and the group of individuals receiving those Awards. The Plan provides that the source of shares for Awards may be either newly issued shares or treasury shares. The Company does not plan to repurchase additional treasury shares in 2008 strictly for issuing share Awards; however, treasury shares that are repurchased or are currently in treasury may be issued as share Awards in 2008. As of December 31, 2007, there was $21.3 million of total unrecognized compensation cost related to the Plan including costs for stock options, restricted stock, restricted stock units and performance-based awards, which is expected to be recognized over a weighted-average period of 1.95 years.
Stock Options. Stock options are issued at the current market price of the Company’s common stock on the date of grant and generally vest ratably over three years and expire after five years. The grant date fair value is calculated using the Black-Scholes option pricing model. The Company uses historical employee exercise data, including post-vesting termination behavior, to estimate the expected life of the options. Expected volatility is calculated using the historical volatility of the price of the Company’s common stock. The risk-free interest rate is based on the U.S. Treasury yield curve in effect at the time of the grant. No stock options were granted during the year ended December 31, 2007. The $9.615 per share fair value of the five-year options granted during the year ended December 31, 2006 was estimated with the following assumptions: risk-free interest rate of 4.89%, expected volatility of 37.3%, expected life of 3.33 years and no dividend yield.
For the stock options granted in 2006, when common stock dividends are declared by the Company’s Board of Directors, dividend equivalents are accrued but not paid until the options are vested. After vesting, dividend equivalents will be paid concurrently with common stock dividends until the options are exercised or expire. Stock options issued prior to 2006 do not have any dividend equivalent rights.
Stock option changes during the years ended December 31, 2007, 2006 and 2005 are presented below:
| | | 2007 | | | 2006 | | | 2005 | |
| | | Number of Awards | | | Weighted-Average Exercise Price | | | Aggregate Intrinsic Value of Options (in thousands) | | | Number of Awards | | | Weighted-Average Exercise Price | | | Number of Awards | | | Weighted-Average Exercise Price | |
| Outstanding at beginning of year | | | 1,032,126 | | | $ | 16.3104 | | | | | | | 1,381,700 | | | $ | 4.3515 | | | | 8,353,800 | | | $ | 3.9935 | |
| Granted | | | - | | | | - | | | | | | | 493,226 | | | | 29.3850 | | | | - | | | | - | |
| Exercised or issued | | | (396,761 | ) | | | 6.3655 | | | | | | | (842,800 | ) | | | 4.3560 | | | | (6,935,300 | ) | | | 3.9195 | |
| Expired | | | (10,774 | ) | | | 29.3850 | | | | | | | - | | | | - | | | | (36,800 | ) | | | 4.5005 | |
| Outstanding at end of year | | | 624,591 | | | $ | 22.4021 | | | $ | 11,354 | | | | 1,032,126 | | | | | | | | 1,381,700 | | | | 4.3515 | |
| Vested or expected to vest at end of year | | | 613,672 | | | $ | 22.2779 | | | $ | 11,231 | | | | 1,021,207 | | | | | | | | 1,381,700 | | | | | |
Exercisable at end of year | | | 280,249 | | | $ | 13.8223 | | | $ | 7,499 | | | | 501,400 | | | | | | | | 640,700 | | | | 4.5115 | |
| Weighted-average fair value of options granted during the year | | | | | | | - | | | | | | | | | | | | 9.615 | | | | | | | | - | |
The Company received $2.3 million, $3.7 million and $23.6 million of cash for stock options exercised during the years ended December 31, 2007, 2006 and 2005, respectively. The total intrinsic value of stock options exercised during the years ended December 31, 2007, 2006 and 2005 was $13.6 million, $22.4 million and $69.8 million, respectively. The Company realized $5.1 million, $9.5 million and $25.5 million of income tax benefits during the years ended December 31, 2007, 2006 and 2005, respectively, substantially all of which were excess income tax benefits related to the exercises of stock options. Excess income tax benefits are the benefits from additional deductions allowed for income tax purposes in excess of expenses recorded in the financial statements. These excess income tax benefits are recorded as an increase to paid-in capital, and the majority of these amounts beginning in 2006 (as provided for in FAS No. 123(R)), are reflected as cash flows from financing activities in the Consolidated Statements of Cash Flows.
The following table summarizes information about stock options outstanding at December 31, 2007:
| Stock Options Outstanding at December 31, 2007 |
| Number Outstanding | | Weighted-Average Remaining Contractual Life (Years) | | Exercise Price | | Exercisable | Vested or Expected to Vest |
| 449,591 | | 3.32 | | $ 29.3850 | | 105,249 | 438,672 |
| 105,000 | | 1.15 | | 4.6625 | | 105,000 | 105,000 |
| 70,000 | | 0.14 | | 4.1625 | | 70,000 | 70,000 |
Restricted Shares and Restricted Stock Units. Restricted shares and restricted stock units, when granted, are valued at the closing market value of the Company’s common stock on the date of issuance and amortized to compensation expense on a straight-line basis over the nominal vesting period of the stock, and for awards issued subsequent to the adoption of FAS No. 123(R), adjusted for retirement-eligible employees, as required. For awards granted prior to the adoption of FAS No. 123(R), $1.2 million of compensation costs were recognized during the year ended December 31, 2007, and continue to be recognized over the nominal vesting periods which conclude by April 2008. The restricted shares and restricted stock units have vesting dates up to three years from the issue date. When common stock dividends are declared by the Company’s Board of Directors, dividends are accrued on the issued restricted shares but are not paid until the shares vest. When common stock dividends are declared by the Company’s Board of Directors, dividend equivalents are accrued on the restricted stock units and paid when the common stock dividends are paid.
The following table summarizes the changes in the Company’s restricted shares and restricted stock units during the years ended December 31, 2007, 2006 and 2005.
| | | 2007 | | | 2006 | | | 2005 | |
| | | Shares/ Units | | | Weighted-Average Grant-Date Market Value | | | Shares/ Units | | | Weighted-Average Grant-Date Market Value | | | Shares/ Units | | | Weighted-Average Grant-Date Market Value | |
| Nonvested at beginning of year | | | 713,026 | | | $ | 18.5465 | | | | 415,692 | | | $ | 8.8870 | | | | 218,792 | | | $ | 4.8575 | |
| Conversion of 2006 stock unit awards | | | 657,232 | | | | 29.3850 | | | | - | | | | - | | | | - | | | | - | |
| Granted | | | 127,762 | | | | 30.3280 | | | | 459,966 | | | | 26.4773 | | | | 465,616 | | | | 8.9124 | |
| Vested | | | (415,266 | ) | | | 25.0136 | | | | (162,622 | ) | | | 16.2865 | | | | (254,696 | ) | | | 5.5057 | |
| Forfeited | | | (29,671 | ) | | | 24.0291 | | | | - | | | | - | | | | (14,020 | ) | | | 8.2750 | |
| Nonvested at end of year | | | 1,053,083 | | | | 24.0355 | | | | 713,036 | | | | 18.5465 | | | | 415,692 | | | | 8.8870 | |
On April 26, 2006, the Company granted performance-based stock unit awards. Because performance goals were achieved for 2006, the stock unit awards were converted into 657,232 shares of restricted stock in early 2007 following certification of performance by the Compensation Committee of the Company’s Board of Directors, one-third vested on June 30, 2007, one-third will vest on June 30, 2008 and the final one-third on June 30, 2009.
The total fair value of restricted shares and restricted stock units which vested during the years ended December 31, 2007, 2006 and 2005 was $16.0 million, $4.5 million and $2.4 million, respectively. The vesting for the year ended December 31, 2007 in the table above includes 348,382 shares of previously issued restricted stock and 66,884 restricted stock units (for which common stock was issued upon vesting). The vesting for the year ended December 31, 2006 in the table above includes 128,596 shares of previously issued restricted stock and 34,026 restricted stock units (for which common stock was issued upon vesting). The vesting for the year ended December 31, 2005 in the table above includes 238,696 shares of previously issued restricted stock and 16,000 restricted stock units (for which common stock was issued upon vesting). The Company realized $5.8 million, $1.7 million and $893,000 of income tax benefits related to these vestings, of which $2.1 million, $712,000, and $361,000 was excess income tax benefits, for 2007, 2006 and 2005, respectively.
Performance Awards. During the year ended December 31, 2007, the Company granted up to 459,212 (net of forfeitures thru December 31, 2007) performance stock unit awards to be earned if certain performance goals were met for 2007. Upon certification by the Compensation Committee that the performance goals were achieved for 2007, we expect that these stock unit awards (or a portion thereof) will be converted into restricted stock during the first quarter of 2008. One-third of these restricted shares will vest on June 30, 2008, one-third on June 30, 2009 and the final one-third on June 30, 2010. The Company also granted up to 229,587 (net of forfeits) performance stock unit awards contingent upon performance criteria being met for a three-year period ending on December 31, 2009. As of December 31, 2007, the Company has assumed the maximum award will be earned for purposes of stock-based compensation expense. When common stock dividends are declared by the Company’s Board of Directors, dividend equivalents (on the stock unit awards) and dividends (once the stock unit awards are converted to restricted stock) are accrued but are not paid until the restricted stock vests. The stock unit awards were valued at the market value on the date of grant and amortized to compensation expense on a straight-line basis over the nominal vesting period, adjusted for retirement-eligible employees, as required under FAS No. 123(R).
| 8. | Employee Benefit Plans |
Contribution Plans
The Company sponsors defined contribution plans for its employees. All employees may participate by contributing a portion of their annual earnings to the plans. The Company makes pension and/or matching contributions on behalf of participating employees. The cost of the defined contribution plans for the years ended December 31, 2007, 2006 and 2005 was $7.5 million, $6.4 million and $6.1 million, respectively.
Deferred Compensation Plan
The Company sponsors a deferred compensation plan for certain employees and directors whose eligibility to participate in the plan is determined by the Compensation Committee of the Company’s Board of Directors. Participants may contribute a portion of their earnings to the plan, and the Company makes pension and/or matching contributions on behalf of eligible employees. The contributions and any earnings are held in an irrevocable trust known as a “rabbi trust” by an independent trustee. The trust account balance and related liability, both of which are $3.2 million, are reflected in “Other assets” and “Other long-term liabilities,” respectively, in the Consolidated Balance Sheets.
Executive Retiree Medical Benefit Plan
On February 22, 2006, the Compensation Committee of the Company’s Board of Directors approved the Executive Retiree Medical Benefit Plan. The Executive Retiree Medical Benefit Plan provides a post-retirement medical benefit for certain of the Company’s executive officers. Due to the plan design, the amount to be contributed by the retirees is expected to cover approximately the full cost of the plan. The Company incurred costs of approximately $2,000 for the year ended December 31, 2007.
Defined Benefit Plans
The Company established a defined benefit cash balance pension plan, effective January 1, 2000, for eligible El Dorado Refinery employees to supplement retirement benefits that those employees lost upon the sale of the El Dorado Refinery to Frontier. No other current or future employees will be eligible to participate in the plan. This plan had assets of $10.7 million at December 31, 2007, and its funding status is in compliance with ERISA.
The Company provides post-retirement healthcare and other benefits to certain employees of the El Dorado Refinery. Eligible employees are employees hired by the Refinery before certain defined dates and who satisfy certain age and service requirements. Employees hired on or before November 16, 1999 qualify for retirement healthcare insurance until eligible for Medicare. Employees hired on or before January 1, 1995 are also eligible for Medicare supplemental insurance. These plans were unfunded as of December 31, 2007 and 2006. The post-retirement health care plan requires retirees to pay between 20% and 40% of total health care costs based on age and length of service. The plan’s prescription drug benefits are at least equivalent to Medicare Part D benefits. Post-retirement healthcare benefits provided for Medicare eligible retirees were reduced effective December 31, 2006 to levels stipulated at the time of the El Dorado Refinery acquisition.
In accordance with FAS No. 158, which the Company adopted as of December 31, 2006, Frontier is required to 1) recognize the funded status of a benefit plan (measured as the difference between plan assets at fair value and the benefit obligation) in its statement of financial position, 2) recognize as a component of other comprehensive income, net of tax, the gains or losses and prior service costs or credits that arise during the period but are not recognized as components of net period benefit cost, 3) measure defined benefit plan assets and obligations as of the date of the employer’s fiscal year-end statement of financial position, and 4) disclose in the notes to the financial statements additional information about certain effects on net periodic benefit cost for the next fiscal year that arise from delayed recognition of the gains or losses, prior service costs or credits, and transition assets or obligations.
The tables on the following pages set forth the funded status of the pension plan and post-retirement healthcare and other benefit plans change in benefit obligation, items not yet recognized as a component of net periodic benefit costs and reflected as a component of the ending balance of accumulated Other Comprehensive Income (“OCI”), net of tax, and the measurement of defined benefit plan assets and obligations for the years ended December 31, 2007, 2006 and 2005. Also included in the tables on the following pages are weighted average key assumptions, healthcare cost-trend rates and sensitivity analysis for the years ended December 31, 2007, 2006 and 2005.
| | | Pension Benefits | | | Post-retirement Healthcare and Other Benefits (1) | |
| | | 2007 | | | 2006 | | | 2007 | | | 2006 | |
| | | (in thousands) | |
| Change in benefit obligation: | | | | | | | | | | | | |
| Benefit obligation at January 1 | | $ | 9,971 | | | $ | 9,942 | | | $ | 28,223 | | | $ | 41,181 | |
| Service cost | | | - | | | | - | | | | 752 | | | | 1,011 | |
| Interest cost | | | 562 | | | | 541 | | | | 1,612 | | | | 2,075 | |
| Plan participant contributions | | | - | | | | - | | | | 66 | | | | 49 | |
| Actuarial gain | | | (428 | ) | | | (246 | ) | | | (2,269 | ) | | | (2,772 | ) |
| Amendments | | | - | | | | - | | | | - | | | | (13,115 | ) |
| Benefits paid | | | (164 | ) | | | (266 | ) | | | (228 | ) | | | (206 | ) |
| Benefit obligation at December 31 | | $ | 9,941 | | | $ | 9,971 | | | $ | 28,156 | | | $ | 28,223 | |
| | | | | | | | | | | | | | | | | |
| Change in plan assets: | | | | | | | | | | | | | | | | |
| Fair value of plan assets at January 1 | | $ | 9,668 | | | $ | 8,279 | | | $ | - | | | $ | - | |
| Actual return on plan assets | | | 883 | | | | 963 | | | | - | | | | - | |
| Employer contribution | | | 344 | | | | 692 | | | | 162 | | | | 156 | |
| Plan participant contributions | | | - | | | | - | | | | 66 | | | | 50 | |
| Benefits paid | | | (164 | ) | | | (266 | ) | | | (228 | ) | | | (206 | ) |
| Fair value of plan assets at December 31 | | $ | 10,731 | | | $ | 9,668 | | | $ | - | | | $ | - | |
| | | | | | | | | | | | | | | | | |
| Funded status at December 31 | | $ | 790 | | | $ | (303 | ) | | $ | (28,156 | ) | | $ | (28,223 | ) |
| | | | | | | | | | | | | | | | | |
| Amounts recognized in the balance sheets: | | | | | | | | | | | | | | | | |
| Other assets | | $ | 790 | | | $ | - | | | $ | - | | | $ | - | |
| Accrued liabilities and other | | | - | | | | - | | | | (607 | ) | | | (436 | ) |
| Post-retirement employee liabilities | | | - | | | | (303 | ) | | | (27,549 | ) | | | (27,787 | ) |
| Net amount recognized | | $ | 790 | | | $ | (303 | ) | | $ | (28,156 | ) | | $ | (28,223 | ) |
| | | | | | | | | | | | | | | | | |
| Amounts recognized in accumulated OCI (2): | | | | | | | | | | | | | | | | |
| (Gain) loss | | $ | (1,209 | ) | | $ | (611 | ) | | $ | 9,908 | | | $ | 13,314 | |
| Prior service credit | | | - | | | | - | | | | (11,239 | ) | | | (13,115 | ) |
| | | $ | (1,209 | ) | | $ | (611 | ) | | $ | (1,331 | ) | | $ | 199 | |
(1) The disclosed post-retirement healthcare obligations and net periodic costs for 2007 and 2006 reflect government subsidies for prescription drugs as allowed under the Medicare Prescription Drug, Improvement and Modernization Act. The subsidy reduced the benefit obligation at December 31, 2007 and 2006, by approximately $5.1 million and $5.3 million, respectively. The Company did not recognize any benefits of the subsidy during the years ended December 31, 2007 and 2006. (2) None of the pension gain of $1.2 million will be recognized in the pension benefit cost in 2008. For the post-retirement healthcare and other benefits, $871,000 of the $9.9 million net loss and $1.9 million of the $11.2 million of prior service cost credit will be recognized in the benefit cost in 2008. |
| | | Pension Benefits | | | Post-retirement Healthcare and Other Benefits | |
| | | 2007 | | | 2006 | | | 2005 | | | 2007 | | | 2006 | | | 2005 | |
| | | (in thousands) | |
Components of net periodic benefit cost and other amounts recognized in other comprehensive income for the year ended December 31: | | | | | | | | | | | | | | | | | | |
| Service cost | | $ | - | | | $ | - | | | $ | - | | | $ | 752 | | | $ | 1,011 | | | $ | 1,130 | |
| Interest cost | | | 562 | | | | 541 | | | | 526 | | | | 1,611 | | | | 2,075 | | | | 2,093 | |
| Expected return on plan assets | | | (714 | ) | | | (640 | ) | | | (606 | ) | | | - | | | | - | | | | - | |
| Amortization of prior service cost | | | - | | | | - | | | | - | | | | (1,876 | ) | | | - | | | | - | |
| Amortized net actuarial loss | | | - | | | | - | | | | - | | | | 1,137 | | | | 1,087 | | | | 1,525 | |
| Net periodic benefit cost | | $ | (152 | ) | | $ | (99 | ) | | $ | (80 | ) | | $ | 1,624 | | | $ | 4,173 | | | $ | 4,748 | |
Changes in assets and benefit obligations recognized in other comprehensive income: | | | | | | | | | | | | | | | | | | | | | | | | |
| Net gain | | $ | (598 | ) | | $ | - | | | | | | | $ | (2,269 | ) | | $ | - | | | | | |
| Amortization of loss | | | - | | | | - | | | | | | | | (1,137 | ) | | | - | | | | | |
| Amortization of prior service cost | | | - | | | | - | | | | | | | | 1,876 | | | | - | | | | | |
| Adoption of SFAS 158 | | | - | | | | (611 | ) | | | | | | | - | | | | 199 | | | | | |
| Total recognized in other comprehensive income | | | (598 | ) | | | (611 | ) | | | | | | | (1,530 | ) | | | 199 | | | | | |
| Total recognized in net periodic benefit cost and other comprehensive income | | $ | (750 | ) | | $ | (710 | ) | | | | | | $ | 94 | | | $ | 4,372 | | | | | |
| | | | | | | | | | | | | | | | | | | | | | | | | |
| Weighted average assumptions: | | | | | | | | | | | | | | | | | | | | | | | | |
Benefit obligation discount rate as of December 31 | | | 6.25 | % | | | 5.75 | % | | | 5.50 | % | | | 6.25 | % | | | 5.75 | % | | | 5.50 | % |
Net periodic benefit cost discount rate for the year ended December 31 | | | 5.75 | % | | | 5.50 | % | | | 5.50 | % | | | 5.75 | % | | | 5.50 | % | | | 5.50 | % |
| Expected return on plan assets (1) | | | 7.50 | % | | | 7.50 | % | | | 8.00 | % | | | - | | | | - | | | | - | |
| Salary increases | | | n/a | | | | n/a | | | | n/a | | | | - | | | | - | | | | - | |
| (1) | The cash balance pension plan assumes a 7.5% expected long-term rate of return on assets based on a blend of historic returns of equity and debt securities. Actual returns on the Company’s plan assets have exceeded expected returns for 2007 and 2006. |
| | | Post-retirement Healthcare and Other Benefits | |
| | | 2007 | | | 2006 | | | 2005 | |
| | | (dollars in thousands) | |
| | | | | | | | | | |
| Healthcare cost-trend rate: | | | 10.00 | % | | | 10.00 | % | | | 11.00 | % |
| | | ratable to | | | ratable to | | | ratable to | |
| | | | 5.00 | % | | | 5.00 | % | | | 5.00 | % |
| | | from 2012 | | | from 2012 | | | from 2008 | |
| Sensitivity Analysis: | | | | | | | | | | | | |
| Effect of 1% (-1%) change in healthcare cost-trend rate: | | | | | | | | | | | | |
| Year-end benefit obligation | | $ | 4,682 | | | $ | 4,761 | | | $ | 8,641 | |
| | | | (3,808 | ) | | | (3,852 | ) | | | (6,784 | ) |
| Total service and interest cost | | | 438 | | | | 662 | | | | 720 | |
| | | | (351 | ) | | | (519 | ) | | | (560 | ) |
At December 31, 2007, the estimated future benefit payments to be paid over the next ten years are as follows:
Estimated future benefit payments for years ending December 31, | | Pension Benefits | | | Post-retirement Healthcare and Other Benefits | |
| | | Payment | | | Payment | | | Subsidy Receipts | |
| | | (in thousands) | |
| 2008 | | $ | 123 | | | $ | 693 | | | $ | - | |
| 2009 | | | 231 | | | | 992 | | | | 28 | |
| 2010 | | | 398 | | | | 1,294 | | | | 41 | |
| 2011 | | | 499 | | | | 1,653 | | | | 53 | |
| 2012 | | | 530 | | | | 1,962 | | | | 71 | |
| Next 5 fiscal years thereafter | | | 6,505 | | | | 13,694 | | | | 853 | |
| | | | | | | | | | | | | |
Plan Assets
The pension plan assets are held in a Trust Fund (the “Fund”) whose trustee is Frost National Bank (“trustee”). Frontier’s pension plan weighted-average asset allocations in the Fund at December 31, 2007 and 2006, by asset category are as follows:
| | | Percentage of Plan Assets at December 31, | |
| | | 2007 | | | 2006 | |
Asset Category: | | | | | | |
| Cash and cash equivalents | | | 9 | % | | | 7 | % |
| Equity common trust funds | | | 65 | % | | | 69 | % |
| Fixed income common trust funds | | | 25 | % | | | 24 | % |
| Real estate | | | 1 | % | | | - | |
| Total | | | 100 | % | | | 100 | % |
The Company does not have a definitive target for the percentage allocation of assets within the plan. Management reviews the earnings on plan assets each year and assesses portfolio asset allocation along with risk and expected returns. After this review, management may direct the trustee to revise the asset allocation. The trustee has the following investment powers:
| · | except for limitations on investing Fund assets in Company securities or real property, the trustee may invest and reinvest in any property, real, personal or mixed, wherever situated, including, without limitation, common and preferred stocks, bonds, notes, debentures, mutual funds, leaseholds, mortgages, certificates of deposit, and oil, mineral or gas properties, royalties, interests or rights; |
| · | to make commingled, collective or common investments and to invest or reinvest all or any portion of the pension plan assets with funds of other pension and profit sharing trusts exempt from tax under section 501(a) of the Internal Revenue Code; and |
| · | to deposit or invest all or a part of the Fund in savings accounts, certificates of deposit or other deposits which bear a reasonable rate of interest in a bank or similar financial institution, including the commercial department of the trustee. |
The Company contributed $344,000 to the Fund during 2007 and is not required to, but may choose to, contribute to the Fund during the year ending December 31, 2008.
| 9. | Commitments and Contingencies |
Lease and Other Commitments
On November 16, 1999, Frontier acquired the crude oil refinery located in El Dorado, Kansas from Equilon Enterprises LLC, now known as Shell Oil Products US (“Shell”). Under the provisions of the purchase and sale agreement, the Company was required to make contingent earn-out payments for each of the years 2000 through 2007 equal to one-half of the excess over $60.0 million per year of the El Dorado Refinery’s revenues less its material costs and operating costs, other than depreciation. The total amount of these potential contingent earn-out payments was capped at $40.0 million, with an annual cap of $7.5 million. Any contingent earn-out payment was recorded when determinable as additional acquisition cost. The final contingent earn-out payment of $7.5 million was required based on 2007 results, and was accrued at December 31, 2007 and was paid in January 2008. A contingent earn-out payment of $7.5 million was required based on 2006 results and was paid in January 2007. Including the payment made in early 2008, the Company has paid a total of $37.5 million for contingent earn-out payments and will no longer be subject to this provision of the Shell agreement.
In connection with the acquisition of the El Dorado Refinery, the Company entered into an operating sublease agreement with Shell for the use of the cogeneration facility at the El Dorado Refinery. The non-cancelable operating sublease, which has both a fixed and a variable component, expires in 2016, although the Company has the option to renew the sublease for an additional eight years. At the end of the renewal period, the Company has the option to purchase the cogeneration facility for the greater of fair value or $22.3 million. The Company also has building, equipment, aircraft and vehicle operating leases that expire from 2007 through 2017. Operating lease rental expense was approximately $13.6 million, $13.8 million and $13.5 million for the years ended December 31, 2007, 2006 and 2005, respectively. The approximate future minimum lease payments for operating leases as of December 31, 2007 were $13.1 million for 2008, $13.5 million for 2009, $12.9 million for 2010, $10.6 million for 2011, $7.1 million for 2012 and $25.7 million thereafter.
The Company has commitments for crude oil pipeline capacity on four pipelines (see below) totaling approximately $33.6 million in 2008, an average of $33.9 million for each of the years 2009 through 2011, an average of $28.8 million for each of the years 2012 through 2014, $24.5 million in 2015 and an average of $9.8 million for each of the years 2016 and 2017. The Company incurred expenses under these commitments of $16.0 million, $9.8 million and $3.2 million for the years ended December 31, 2007, 2006 and 2005, respectively.
The Company has two contracts for crude oil pipeline capacity on the Express Pipeline. The first contract, which began in 1997, is for 15 years and for an average of 13,800 barrels per day (“bpd”) over that 15-year period. In December 2003, the Company entered into an expansion capacity agreement on the Express Pipeline for an additional 10,000 bpd from April 2005 through 2015.
The Company has a Transportation Services Agreement (“Agreement”) to transport 38,000 bpd of crude oil on the Spearhead Pipeline from Griffith, Indiana to Cushing, Oklahoma (“Cushing”). This pipeline enables the Company to transport Canadian crude oil to the El Dorado Refinery. The initial term of this Agreement is for a period of ten years from the actual commencement date of March 2006, although the Company has the right to extend the Agreement for an additional ten-year term and increase the volume transported.
The Company entered into a definitive agreement with Rocky Mountain Pipeline System LLC, now owned by Plains All American Pipeline, L.P. (“Plains All American”), on March 31, 2006 to support construction of a new crude pipeline from Guernsey, Wyoming to Rocky Mountain’s Fort Laramie, Wyoming tank farm and then to the Cheyenne Refinery. The Company made a ten-year commitment to ship 35,000 bpd based on a filed tariff on the new pipeline and will concurrently lease approximately 300,000 barrels of dedicated storage capacity in the Plains All American tank farm. The pipeline, which is designed to transport 55,000 bpd of heavy crude and is expandable to 90,000 bpd, first transported crude oil in October 2007.
The Company entered into an agreement with Osage Pipeline in 2007 to ship additional crude oil volumes from Cushing, Oklahoma to its El Dorado Refinery. The annual average increased commitment of 7,500 bpd is expected to commence in the summer of 2008 with a term of five years.
Effective March 10, 2006, the Company’s subsidiary, Frontier Oil and Refining Company (“FORC”), entered into a Master Crude Oil Purchase and Sale Contract (“Contract”) with Utexam Limited (“Utexam”), a wholly-owned subsidiary of BNP Paribas Ireland. Under this $200.0 million Contract, Utexam will purchase, transport and subsequently sell crude oil to FORC at a location near Cushing, Oklahoma or other locations as agreed. Under this agreement, Utexam is the owner of record of the crude oil as it is transported from the point of injection, typically Hardisty, Alberta, Canada to the point of ultimate sale to FORC. The Company has provided a guarantee of FORC’s obligations under this Contract, primarily to receive crude oil and make payment for crude oil purchases arranged under this Contract. As of December 31, 2007, FORC and Utexam had entered into certain commitments to purchase and sell crude oil in January 2008 under this Contract; however, neither party has a continuing commitment to purchase or sell crude oil in the future. The Company accounts for the transactions under this Contract as a financing arrangement, whereby the inventory and the associated liability are recorded in the Company’s financial statements when the crude oil is injected into the pipeline in Canada.
Litigation
Beverly Hills Lawsuits. On October 12, 2007, the Company announced that it had reached agreement in principle on the terms of a settlement with the attorneys for the plaintiffs in the Beverly Hills lawsuits. Under the terms of the settlement, the plaintiffs will receive $10.0 million from the Company, its subsidiary and its insurance provider. Frontier’s share of the cost is approximately $6.3 million, which will be funded from the Company’s commutation account that had previously been established with an insurance provider. Once a settlement agreement is finalized between the plaintiffs and the Company and its subsidiary, including releases by the plaintiffs, the settlement will be subject to approval by the Los Angeles Superior Court. Following court approval, the settlement should resolve all of the litigation against the Company and its subsidiary currently pending in both the Los Angeles Superior Court and the California Court of Appeal. The following provides more information about the Beverly Hills litigation and associated insurance coverage.
A Frontier subsidiary, Wainoco Oil & Gas Company, owned and operated an interest in an oil field in the Los Angeles, California metropolitan area from 1985 to 1995. The production facilities for that oil field are located at the campus of the Beverly Hills High School. In April 2003, a law firm began filing claims against the Beverly Hills Unified School District and the City of Beverly Hills on behalf of former students, school employees, area residents and others alleging that emissions from the oil field or the production facilities caused cancers or various other health problems in those individuals. Wainoco Oil & Gas Company and Frontier have been named in seven such suits: Moss et al. v. Venoco, Inc. et al., filed in June 2003; Ibraham et al. v. City of Beverly Hills et al., filed in July 2003; Yeshoua et al. v. Venoco, Inc. et al., filed in August 2003; Jacobs v. Wainoco Oil & Gas Company et al., filed in December 2003; Bussel et al. v. Venoco, Inc. et al., filed in January 2004; Steiner et al. v. Venoco, Inc. et al., filed in May 2004; and Kalcic et al. v. Venoco, Inc. et al., filed in April 2005. Of the approximately 1,025 plaintiffs in the seven lawsuits, Wainoco Oil & Gas Company and Frontier are named as defendants by approximately 450 of those plaintiffs. Other defendants in these lawsuits include the Beverly Hills Unified School District, the City of Beverly Hills, three other oil and gas companies (and their related companies), and one company (and its related companies) involved in owning or operating a power plant adjacent to the Beverly Hills High School. The lawsuits include claims for personal injury, wrongful death, loss of consortium and/or fear of contracting diseases, and also ask for punitive damages. No dollar amounts of damages have been specified in any of the lawsuits. The seven lawsuits and two lawsuits that do not name Wainoco Oil & Gas Company or Frontier as defendants have been consolidated and are pending before a judge on the complex civil litigation panel in the Superior Court of the State of California for the County of Los Angeles. A case management order was entered pursuant to which 12 plaintiffs were selected as the initial group of plaintiffs to proceed to trial.
The oil production site operated by Frontier’s subsidiary was a modern facility and was operated with a high level of safety and responsibility. Frontier believes that its subsidiary’s activities did not cause any health problems for anyone, including former Beverly Hills High School students, school employees or area residents. Nevertheless, as a matter of prudent risk management, Frontier purchased insurance in 2003 from a highly-rated insurance company covering the existing claims described above and any similar claims for bodily injury or property damage asserted during the five-year period following the policy’s September 30, 2003 commencement date. The claims are covered, whether asserted directly against the insured parties or as a result of contractual indemnity. In October 2003, the Company paid $6.25 million to the insurance company for loss mitigation insurance and also funded with the insurance company a commutation account of approximately $19.5 million, which is funding the first costs incurred under the policy including, but not limited to, the costs of defense of the claims. The policy covers defense costs and any payments made to claimants, up to an aggregate limit of $120 million, including coinsurance by Frontier of up to $3.9 million of the coverage between $40 million and $120 million. As of December 31, 2007, the commutation account balance was approximately $6.3 million and was included in current assets on the Condensed Consolidated Balance Sheet. The Company also has been seeking coverage with respect to the Beverly Hills, California claims from the insurance companies that provided policies to Frontier during the 1985 to 1995 period. The Company has reached a settlement on some of the policies and is continuing to pursue coverage efforts on other policies.
On October 27, 2006, the Los Angeles Superior Court granted summary judgment in favor of the parent, Frontier Oil Corporation. As a result of this order, the plaintiffs in all of the lawsuits in which Frontier is a defendant can no longer prosecute claims against Frontier Oil Corporation, either for Frontier Oil Corporation’s alleged direct liability or for any of the plaintiffs’ claims against its subsidiary. The order does not affect unresolved indemnity claims asserted by or against Frontier Oil Corporation. In addition, on November 22, 2006, the Court entered a ruling granting summary judgment in favor of all of the defendants, including Wainoco Oil & Gas Company and Frontier Oil Corporation, against the initial 12 trial plaintiffs. A final judgment was entered by the Los Angeles Superior Court on January 31, 2007 that included the ruling in favor of Frontier Oil Corporation in October and the ruling in favor of all of the defendants in November. The plaintiffs’ notice of appeal from this final judgment was filed March 29, 2007 and is currently pending before the California Court of Appeal.
Additional rulings by the Los Angeles Superior Court include a January 9, 2007 ruling granting summary judgment in favor of the City of Beverly Hills, concluding that the City has no liability to the plaintiffs in any of the lawsuits in which the City is a defendant under the California governmental tort liability statutes, and a March 23, 2007 ruling granting summary judgment in favor of the Beverly Hills Unified School District, concluding that the School District has no liability under the California governmental tort liability statutes. The entry of a final judgment by the Court in favor of the City and the School District on these recent rulings remains subject to appeal.
In accordance with FAS No. 5, “Accounting for Contingencies,” Frontier accrued as of December 31, 2007 the $10.0 million settlement (“Accrued Beverly Hills litigation settlement” on the Condensed Consolidated Balance Sheet) because it is probable and reasonably estimable, as well as an expense of $6.3 million (included in “Selling and general expense, excluding depreciation” on the Condensed Consolidated Statement of Income) and a receivable from insurance providers of $3.7 million (included in “Other receivables” on the Condensed Consolidated Balance Sheet). Frontier does not believe that any potential future claims or litigation, by which similar or related claims may be asserted against the Company or its subsidiary, will result in any material liability or have any material adverse effect upon the Company.
Other. The Company is also involved in various other lawsuits which are incidental to its business. In management’s opinion, the adverse determination of such lawsuits would not have a material adverse effect on the Company’s liquidity, financial position or results of operations.
Concentration of Credit Risk
The Company has concentrations of credit risk with respect to sales within the same or related industry and within limited geographic areas. The Company sells its Cheyenne Refinery products exclusively at wholesale, principally to independent retailers and major oil companies located primarily in the Denver, Colorado, western Nebraska and eastern Wyoming regions. The Company sells a majority of its El Dorado Refinery gasoline, diesel and jet fuel to Shell at market-based prices under a 15-year offtake agreement executed in conjunction with the purchase of the El Dorado Refinery in 1999. Beginning in 2000, the Company retained and marketed 5,000 bpd of the El Dorado Refinery’s gasoline and diesel production. The retained portion is scheduled to increase by 5,000 bpd each year for ten years. In 2007, Frontier retained 40,000 bpd of the El Dorado Refinery’s gasoline and diesel production. Shell has also agreed to purchase all jet fuel production from the El Dorado Refinery through the offtake agreement term. The Company retains and markets all by-products produced from the El Dorado Refinery. The Company made sales to Shell of approximately $2.2 billion, $2.1 billion and $1.8 billion in the years 2007, 2006 and 2005, respectively, which accounted for 42%, 44% and 46% of consolidated refined products revenues in 2007, 2006 and 2005, respectively.
The Company extends credit to its customers based on ongoing credit evaluations. An allowance for doubtful accounts is provided based on the current evaluation of each customer’s credit risk, past experience and other factors. For the year ended December 31, 2007, $198,000 of previously written off bad debts was collected. A bad debt loss of $26,000 was recorded in the year ended December 31, 2006. No bad debt losses were recorded during the year ended December 31, 2005.
Environmental
The Company’s operations and many of its manufactured products are specifically subject to certain requirements of the Clean Air Act (“CAA”) and related state and local regulations. The 1990 amendments to the CAA contain provisions that will require capital expenditures for the production of cleaner transportation fuels and the installation of certain air pollution control devices at the Refineries during the next several years.
The Environmental Protection Agency (“EPA”) has promulgated regulations requiring the phase-in of gasoline sulfur standards, which began January 1, 2004 and continues through 2008, with special provisions for small business refiners such as Frontier. As allowed by subsequent regulation, Frontier elected to extend its small refinery interim gasoline sulfur standard at each of the Refineries until January 1, 2011 by complying with the highway ultra low sulfur diesel standard by June 2006. The Cheyenne Refinery has spent approximately $28.9 million (including capitalized interest) to meet the interim gasoline sulfur standard, which was required by January 1, 2004. To meet final federal gasoline sulfur standards, the Company has identified expenditures of $9.3 million in new process unit capacity plus $10.0 million for intermediate inventory handling at the Cheyenne Refinery. However, new federal benzene regulations and anticipated state requirements for reduction in Reid Vapor Pressure (“RVP”) suggest that additional capital expenditures may be required to meet these standards. The Company is presently estimating the total cost in connection with an overall compliance strategy for the Cheyenne Refinery. Total capital expenditures estimated as of December 31, 2007 for the El Dorado Refinery to comply with the final gasoline sulfur standard are approximately $83.0 million, including capitalized interest, and are expected to be incurred by the end of 2009. As of December 31, 2007, $11.4 million of the estimated $83.0 million had been incurred. Substantially all of the estimated $83.0 million of expenditures relates to the Company’s El Dorado Refinery gasoil hydrotreater revamp project. The gasoil hydrotreater revamp project will address most of the El Dorado Refinery’s modifications needed to achieve gasoline sulfur compliance, and the Company anticipates this project will provide a substantial economic benefit.
The Company had available to sell or use at its El Dorado Refinery 68,672 gasoline sulfur credits as of December 31, 2006 that were generated by its Cheyenne Refinery by producing gasoline with a lower sulfur content than the small refiner EPA requirement. In the second quarter of 2007, Frontier sold 34,748 of the 68,672 available sulfur credits for total proceeds of $4.8 million recorded in “Other revenue” on the Consolidated Statements of Income for the year ended December 31, 2007. As of December 31, 2007 the Company had available to sell or use approximately 172,000 gasoline sulfur credits that were generated by its Cheyenne and El Dorado Refineries.
The EPA has embarked on a Petroleum Refining Initiative (“Initiative”) alleging industry-wide noncompliance with certain longstanding regulatory programs. These programs are:
| · | New Source Review (“NSR”) – a program requiring permitting of certain facility modifications, |
| · | New Source Performance Standards – a program establishing emission standards for new emission sources as defined in the regulations, |
| · | Benzene Waste National Elimination System for Hazardous Air Pollutants (“NESHAPS”) – a program limiting the amount of benzene allowable in industrial wastewaters, and |
| · | Leak Detection and Repair (“LDAR”) – a program designed to control hydrocarbon emissions from refinery pipes, pumps and valves. |
The Initiative has caused many refiners to enter into consent decrees typically requiring substantial expenditures for penalties and the installation of additional pollution control equipment. In anticipation of such a consent decree, the Company has undertaken certain modifications at each of the Company’s Refineries. At the Cheyenne Refinery, the Company has spent $4.6 million on the flare gas recovery system which was completed in 2006. At the El Dorado Refinery, the flare gas recovery system was completed in 2007 for a total cost of $4.7 million. Settlement negotiations with the EPA and state regulatory agencies regarding additional regulatory issues associated with the Initiative are underway. The Company now estimates that, in addition to the flare gas recovery systems discussed above, capital expenditures totaling approximately $56.0 million at the Cheyenne Refinery and $70 million at the El Dorado Refinery ($7.4 million of the $70.0 million had been incurred as of December 31, 2007) will be required prior to 2015 to satisfy these issues. Notwithstanding these anticipated regulatory settlements, many of these same expenditures would be required for the Company to implement its planned facility expansions. In addition to the capital costs described above, the EPA has proposed a civil penalty in the amount of $1.9 million as of December 31, 2007, to be discounted for a related $100,000 penalty and associated supplemental environment project (“SEP”) paid to the State of Wyoming in 2005 and further offset up to 50 percent by the completion of mutually agreed upon additional SEPs. The Company has made an accrual for this estimated penalty at December 31, 2007.
The EPA has promulgated regulations to enact the provisions of the Energy Policy Act of 2005 regarding mandated blending of renewable fuels in gasoline. The Energy Independence and Security Act of 2007 greatly increases the amount of renewable fuels that had been required by the 2005 legislation. The Company, as a small refiner, will be exempt until 2012 from these requirements. While not yet enacted or promulgated, other pending legislation or regulation regarding the mandated use of alternative or renewable fuels and/or the reduction of greenhouse gas emissions from either transportation fuels or manufacturing processes is under consideration by the U.S. Congress and certain federal regulatory agencies. If enacted or promulgated, these requirements may impact the operations of the Company.
On February 26, 2007, the EPA promulgated regulations limiting the amount of benzene in gasoline. These regulations take effect for large refiners on January 1, 2011 and for small refiners, such as Frontier, on January 1, 2015. While not yet estimated, the Company anticipates that potentially material capital expenditures may be necessary to achieve compliance with the new regulation at its Cheyenne Refinery as discussed above. Gasoline manufactured at the El Dorado Refinery typically contains benzene concentrations near the new standard. The Company therefore believes that necessary compliance expenditures at the El Dorado Refinery will be substantially less than those at its Cheyenne Refinery.
As is the case with companies engaged in similar industries, the Company faces potential exposure from future claims and lawsuits involving environmental matters, including soil and water contamination, air pollution, personal injury and property damage allegedly caused by substances that the Company may have manufactured, handled, used, released or disposed.
Cheyenne Refinery. The Company is party to an agreement with the State of Wyoming requiring investigation and interim remediation actions at the Cheyenne Refinery’s property that may have been impacted by past operational activities. As a result of past and ongoing investigative efforts, capital expenditures and remediation of conditions found to exist have already taken place, including the completion of surface impoundment closures, waste stabilization activities and other site remediation projects. In addition, the Company estimates that an ongoing groundwater remediation program will be required for approximately ten more years. As of December 31, 2007, the Company had an accrual included on the Consolidated Balance Sheets of $5.0 million reflecting the estimated present value of $410,000 estimated cost for 2008 and $700,000 annual cost for 2009 through 2018 assuming a 3% inflation rate and discounted at a rate of 7.5%. As of December 31, 2006, the Company’s accrual for groundwater remediation was $2.0 million. The Company also had accrued a total of $4.8 million and $5.0 million, as of December 31, 2007 and 2006, respectively, for the cleanup of a waste water treatment pond located on land adjacent to the Cheyenne Refinery which the Company had historically leased from the landowner. The Company allowed the lease to expire and ceased use of the pond on the scheduled expiration date of June 30, 2006. The waste water pond will be cleaned up pursuant to the aforementioned agreement with the State of Wyoming. Depending upon the results of the ongoing investigation, or by a subsequent administrative order or permit, additional remedial action and costs could be required.
The Company has completed the negotiation of a settlement of a Notice of Violation (“NOV”) from the Wyoming Department of Environmental Quality alleging non-compliance with certain refinery waste management requirements. A negotiated penalty in the amount of $631,000 was accrued as of December 31, 2006, and was paid in 2007 as part of the settlement of this NOV. The Company has estimated that the capital cost for required corrective measures will be approximately $2.7 million. In addition, the Company had an accrual at both December 31, 2007 and 2006 for an additional $1.2 million for expense work.
Pursuant to an agreement with the City of Cheyenne, the Company will contribute $1.5 million toward a project (estimated to take place in 2008) to relocate a city storm water conveyance pipe, which is presently located on Refinery property and therefore is potentially subject to contaminants from Refinery operations.
El Dorado Refinery. The El Dorado Refinery is subject to a 1988 consent order with the Kansas Department of Health and Environment (“KDHE”). Subject to the terms of the purchase and sale agreement for the El Dorado Refinery entered into between the Company and Shell, Shell is responsible for the costs of continued compliance with this order. This order, including various subsequent modifications, requires the El Dorado Refinery to continue the implementation of a groundwater management program with oversight provided by the KDHE Bureau of Environmental Remediation. More specifically, the El Dorado Refinery must continue to operate the hydrocarbon recovery well systems and containment barriers at the site and conduct sampling from monitoring wells and surface water stations. Quarterly and annual reports must also be submitted to the KDHE. The order requires that remediation activities continue until KDHE-established groundwater criteria or other criteria agreed to by the KDHE and the Refinery are met.
Collective Bargaining Agreements
The union members at our Cheyenne and El Dorado Refineries, comprising 56% of the Company’s workforce, are represented by seven bargaining units, the largest being the United Steel, Paper and Forestry, Rubber, Manufacturing, Energy, Allied Industrial and Service Workers International Union (“USW”) and the others being affiliated with the AFL-CIO. The current union contracts expire in 2009.
| 10. | Fair Value of Financial Instruments |
The fair value of the Company’s Senior Notes was estimated based on quotations obtained from broker-dealers who make markets in these and similar securities. At both December 31, 2007 and 2006, the carrying amounts of long-term debt instruments were $150.0 million, and the estimated fair values were $150.0 million and $148.9 million, respectively. For cash and cash equivalents, trade receivables, inventory and accounts payable, the carrying amount is a reasonable estimate of fair value.
| 11. | Price Risk Management Activities |
The Company, at times, enters into commodity derivative contracts to manage its price exposure to its inventory positions, purchases of foreign crude oil and consumption of natural gas in the refining process or to fix margins on certain future production. The commodity derivative contracts used by the Company may take the form of futures contracts, collars or price swaps and are entered into with creditworthy counterparties. The Company believes that there is minimal credit risk with respect to its counterparties. The Company accounts for its commodity derivative contracts under the hedge (or deferral) method of accounting when the derivative contracts are designated as hedges for accounting purposes, or mark-to-market accounting if the Company elects not to designate derivative contracts as accounting hedges or if such derivative contracts do not qualify for hedge accounting under FAS No. 133, “Accounting for Derivative Instruments and Hedging Activities.” As such, gains or losses on commodity derivative contracts accounted for as fair value hedges are recognized in the related inventory in “Inventory of crude oil, products and other” on the Consolidated Balance Sheets and ultimately, when the inventory is charged or sold, in “Raw material, freight and other costs” on the Consolidated Statements of Income. Gains and losses on transactions accounted for using mark-to-market accounting are reflected in “Other revenues” at each period end. The Company has derivative contracts which it holds directly and also derivative contracts held on Frontier’s behalf by Utexam, in connection with the Master Crude Oil Purchase and Sale Contract (see Note 9 “Lease and Other Commitments”). The market value of open derivative contracts is included on the Consolidated Balance Sheets in “Accrued liabilities and other” when the unrealized value is a loss ($15.1 million at December 31, 2007), or in “Other current assets” when the unrealized value is a gain ($2.5 million at December 31, 2006).
Trading Activities
During 2007, 2006 and 2005, the Company had the following derivative activities which, while economic hedges, were not accounted for as hedges and whose gains or losses are reflected in “Other revenues” on the Consolidated Statements of Income:
Crude Purchases. As of December 31, 2007, the Company had open derivative contracts held on Frontier’s behalf by Utexam on 621,000 barrels of crude oil to hedge in-transit Canadian crude oil costs for the El Dorado Refinery. At December 31, 2007, these positions had a $2.8 million unrealized loss. During the year ended December 31, 2007, the Company reported in “Other revenues” $18.0 million (including the previously mentioned $2.8 million unrealized amount), in net losses on positions to hedge in-transit crude oil, mainly Canadian crude oil for the El Dorado Refinery. During the year ended December 31, 2006, the Company reported in “Other revenues” $14.6 million in net gains on positions to hedge in-transit Canadian crude oil for the El Dorado Refinery. During the year ended December 31, 2005, the Company reported in “Other revenues” a net $461,000 loss on positions to hedge in-transit Canadian crude oil for the El Dorado Refinery.
Derivative contracts on barrels of crude oil to hedge excess intermediate, finished product and crude oil inventory for both the Cheyenne and El Dorado Refineries. As of December 31, 2007, the Company had open derivative contracts on 2,666,000 barrels of crude oil to hedge crude oil, intermediate or finished product inventory. At December 31, 2007, these positions had a $12.3 million unrealized gain. During the year ended December 31, 2007, the Company reported in “Other revenues” $68.4 million (including the previously mentioned $12.3 million unrealized amount), in net losses on positions to hedge crude oil, intermediate or finished product inventory. During the years ended December 31, 2006 and 2005, the Company recorded a $15.9 million gain and a $1.4 million gain, respectively, on these types of positions.
Hedging Activities
During the year ended December 31, 2007, the Company had no derivatives which were accounted for as hedges. During the years ended December 31, 2006 and 2005, the Company had the following derivatives which were appropriately designated and accounted for as fair value hedges.
Crude purchases in-transit. During the year ended December 31, 2006, the Company recorded $10.9 million in net losses on derivative contracts to hedge in-transit Canadian crude oil, primarily for the El Dorado Refinery, of which $15.0 million increased crude costs (“Raw material, freight and other costs”) and $4.1 million increased income, which was reflected in “Other revenues” in the Consolidated Statements of Income for the ineffective portion of these hedges. During the year ended December 31, 2005, the Company recorded $193,000 in net losses on derivative contracts to hedge in-transit Canadian crude oil for the Cheyenne Refinery, of which $296,000 increased crude costs (“Raw material, freight and other costs”) and $103,000 increased income, which was reflected in “Other revenues” in the Consolidated Statements of Income for the ineffective portion of these hedges.
| 12. | Consolidating Financial Statements |
Frontier Holdings Inc. and its subsidiaries (“FHI”) are full and unconditional guarantors of the Company’s 6.625% Senior Notes. Presented on the following pages are the Company’s consolidating balance sheets, statements of operations, and cash flows as required by Rule 3-10 of Regulation S-X of the Securities Exchange Act of 1934, as amended. As specified in Rule 3-10, the condensed consolidating balance sheets, statement of operations, and cash flows presented below meet the requirements for financial statements of the issuer and each guarantor of the notes because the guarantors are all direct or indirect 100% owned subsidiaries of Frontier, and all of the guarantees are full and unconditional on a joint and several basis. The Company files a consolidated U.S. federal income tax return and consolidated state income tax returns in the majority of states in which it does business. Each subsidiary calculates its income tax provisions on a separate company basis, which are eliminated in the consolidation process.
CONSOLIDATING FINANCIAL STATEMENTS | |
| FRONTIER OIL CORPORATION | |
| Condensed Consolidating Statement of Income | |
| For the Year Ended December 31, 2007 | |
| (in thousands) | |
| | | FOC (Parent) | | | FHI (Guarantor Subsidiaries) | | | Other Non-Guarantor Subsidiaries | | | Eliminations | | | Consolidated | |
| Revenues: | | | | | | | | | | | | | | | |
Refined products | | $ | - | | | $ | 5,269,674 | | | $ | - | | | $ | - | | | $ | 5,269,674 | |
Other | | | 2 | | | | (80,981 | ) | | | 45 | | | | - | | | | (80,934 | ) |
| | | | 2 | | | | 5,188,693 | | | | 45 | | | | - | | | | 5,188,740 | |
| | | | | | | | | | | | | | | | | | | | | |
| Costs and expenses: | | | | | | | | | | | | | | | | | | | | |
Raw material, freight and other costs | | | - | | | | 4,039,235 | | | | - | | | | - | | | | 4,039,235 | |
Refinery operating expenses, excluding depreciation | | | - | | | | 300,542 | | | | - | | | | - | | | | 300,542 | |
Selling and general expenses, excluding depreciation | | | 30,593 | | | | 24,750 | | | | - | | | | - | | | | 55,343 | |
Depreciation, amortization andaccretion | | | 61 | | | | 53,299 | | | | - | | | | (321 | ) | | | 53,039 | |
Losses (gains) on sales of assets | | | 2,028 | | | | (17,242 | ) | | | - | | | | - | | | | (15,214 | ) |
| | | | 32,682 | | | | 4,400,584 | | | | - | | | | (321 | ) | | | 4,432,945 | |
| | | | | | | | | | | | | | | | | | | | | |
| Operating income (loss) | | | (32,680 | ) | | | 788,109 | | | | 45 | | | | 321 | | | | 755,795 | |
| | | | | | | | | | | | | | | | | | | | | |
Interest expense and other financing costs | | | 12,723 | | | | 4,122 | | | | - | | | | (8,072 | ) | | | 8,773 | |
| Interest and investment income | | | (11,202 | ) | | | (10,649 | ) | | | - | | | | - | | | | (21,851 | ) |
| Equity in earnings of subsidiaries | | | (802,362 | ) | | | - | | | | - | | | | 802,362 | | | | - | |
| | | | (800,841 | ) | | | (6,527 | ) | | | - | | | | 794,290 | | | | (13,078 | ) |
| | | | | | | | | | | | | | | | | | | | | |
| Income before income taxes | | | 768,161 | | | | 794,636 | | | | 45 | | | | (793,969 | ) | | | 768,873 | |
| Provision for income taxes | | | 269,036 | | | | 279,174 | | | | 15 | | | | (278,477 | ) | | | 269,748 | |
| Net income | | $ | 499,125 | | | $ | 515,462 | | | $ | 30 | | | $ | (515,492 | ) | | $ | 499,125 | |
| | | | | | | | | | | | | | | | | | | | | |
| Condensed Consolidating Statement of Income | |
| For the Year Ended December 31, 2006 | |
| (in thousands) | |
| | | FOC (Parent) | | | FHI (Guarantor Subsidiaries) | | | Other Non-Guarantor Subsidiaries | | | Eliminations | | | Consolidated | |
| Revenues: | | | | | | | | | | | | | | | |
Refined products | | $ | - | | | $ | 4,759,661 | | | $ | - | | | $ | - | | | $ | 4,759,661 | |
Other | | | 4 | | | | 36,146 | | | | 142 | | | | - | | | | 36,292 | |
| | | | 4 | | | | 4,795,807 | | | | 142 | | | | - | | | | 4,795,953 | |
| | | | | | | | | | | | | | | | | | | | | |
| Costs and expenses: | | | | | | | | | | | | | | | | | | | | |
Raw material, freight and other costs | | | - | | | | 3,850,937 | | | | - | | | | - | | | | 3,850,937 | |
Refinery operating expenses, excluding depreciation | | | - | | | | 277,129 | | | | - | | | | - | | | | 277,129 | |
Selling and general expenses, excluding depreciation | | | 30,194 | | | | 22,294 | | | | - | | | | - | | | | 52,488 | |
Depreciation, amortization andaccretion | | | 88 | | | | 41,502 | | | | - | | | | (377 | ) | | | 41,213 | |
Gains on sales of assets | | | (8 | ) | | | - | | | | - | | | | - | | | | (8 | ) |
| | | | 30,274 | | | | 4,191,862 | | | | - | | | | (377 | ) | | | 4,221,759 | |
| | | | | | | | | | | | | | | | | | | | | |
| Operating income (loss) | | | (30,270 | ) | | | 603,945 | | | | 142 | | | | 377 | | | | 574,194 | |
| | | | | | | | | | | | | | | | | | | | | |
Interest expense and other financing costs | | | 11,978 | | | | 3,835 | | | | - | | | | (3,674 | ) | | | 12,139 | |
| Interest and investment income | | | (12,102 | ) | | | (5,957 | ) | | | - | | | | - | | | | (18,059 | ) |
| Equity in earnings of subsidiaries | | | (609,265 | ) | | | - | | | | - | | | | 609,265 | | | | - | |
| | | | (609,389 | ) | | | (2,122 | ) | | | - | | | | 605,591 | | | | (5,920 | ) |
| | | | | | | | | | | | | | | | | | | | | |
| Income before income taxes | | | 579,119 | | | | 606,067 | | | | 142 | | | | (605,214 | ) | | | 580,114 | |
| Provision for income taxes | | | 199,842 | | | | 209,951 | | | | 55 | | | | (209,011 | ) | | | 200,837 | |
| Net income | | $ | 379,277 | | | $ | 396,116 | | | $ | 87 | | | $ | (396,203 | ) | | $ | 379,277 | |
| | | | | | | | | | | | | | | | | | | | | |
| FRONTIER OIL CORPORATION | |
| Condensed Consolidating Statement of Income | |
| For the Year Ended December 31, 2005 | |
| (in thousands) | |
| | | FOC (Parent) | | | FHI (Guarantor Subsidiaries) | | | Other Non-Guarantor Subsidiaries | | | Eliminations | | | Consolidated | |
| Revenues: | | | | | | | | | | | | | | | |
Refined products | | $ | - | | | $ | 3,999,935 | | | $ | - | | | $ | - | | | $ | 3,999,935 | |
Other | | | (6 | ) | | | 1,143 | | | | 90 | | | | - | | | | 1,227 | |
| | | | (6 | ) | | | 4,001,078 | | | | 90 | | | | - | | | | 4,001,162 | |
| | | | | | | | | | | | | | | | | | | | | |
| Costs and expenses: | | | | | | | | | | | | | | | | | | | | |
Raw material, freight and other costs | | | - | | | | 3,247,372 | | | | - | | | | - | | | | 3,247,372 | |
Refinery operating expenses, excluding depreciation | | | - | | | | 241,445 | | | | - | | | | - | | | | 241,445 | |
Selling and general expenses, excluding depreciation | | | 14,681 | | | | 16,034 | | | | - | | | | - | | | | 30,715 | |
Merger termination and legal costs | | | 48 | | | | - | | | | - | | | | - | | | | 48 | |
Depreciation, amortization andaccretion | | | 69 | | | | 35,700 | | | | - | | | | (556 | ) | | | 35,213 | |
Gains on sales of assets | | | (3 | ) | | | (3,641 | ) | | | - | | | | - | | | | (3,644 | ) |
| | | | 14,795 | | | | 3,536,910 | | | | - | | | | (556 | ) | | | 3,551,149 | |
| | | | | | | | | | | | | | | | | | | | | |
| Operating income (loss) | | | (14,801 | ) | | | 464,168 | | | | 90 | | | | 556 | | | | 450,013 | |
| | | | | | | | | | | | | | | | | | | | | |
Interest expense and other financing costs | | | 10,593 | | | | 2,009 | | | | - | | | | (2,261 | ) | | | 10,341 | |
| Interest and investment income | | | (5,905 | ) | | | (1,678 | ) | | | - | | | | - | | | | (7,583 | ) |
| Equity in earnings of subsidiaries | | | (462,027 | ) | | | - | | | | - | | | | 462,027 | | | | - | |
| | | | (457,339 | ) | | | 331 | | | | - | | | | 459,766 | | | | 2,758 | |
| | | | | | | | | | | | | | | | | | | | | |
| Income before income taxes | | | 442,538 | | | | 463,837 | | | | 90 | | | | (459,210 | ) | | | 447,255 | |
| Provision for income taxes | | | 168,910 | | | | 171,921 | | | | - | | | | (171,237 | ) | | | 169,594 | |
Income before cumulative effect of accounting change | | | 273,628 | | | | 291,916 | | | | 90 | | | | (287,973 | ) | | | 277,661 | |
Cumulative effect of accounting change, net of income taxes | | | 1,530 | | | | (2,503 | ) | | | - | | | | (1,530 | ) | | | (2,503 | ) |
| Net income | | $ | 275,158 | | | $ | 289,413 | | | $ | 90 | | | $ | (289,503 | ) | | $ | 275,158 | |
| | | | | | | | | | | | | | | | | | | | | |
| FRONTIER OIL CORPORATION | |
| Condensed Consolidating Balance Sheet | |
| As of December 31, 2007 | |
| (in thousands) | |
| | | FOC (Parent) | | | FHI (Guarantor Subsidiaries) | | | Other Non-Guarantor Subsidiaries | | | Eliminations | | | Consolidated | |
| ASSETS | | | | | | | | | | | | | | | |
| Current assets: | | | | | | | | | | | | | | | |
| Cash and cash equivalents | | $ | 186,368 | | | $ | 111,031 | | | $ | - | | | $ | - | | | $ | 297,399 | |
| Trade and other receivables, net | | | 27,948 | | | | 156,798 | | | | - | | | | - | | | | 184,746 | |
Receivable from affiliated companies | | | - | | | | 2,319 | | | | 296 | | | | (2,615 | ) | | | - | |
| Inventory of crude oil, products andother | | | - | | | | 501,927 | | | | - | | | | - | | | | 501,927 | |
| Deferred tax assets | | | 9,426 | | | | 13,507 | | | | - | | | | (13,507 | ) | | | 9,426 | |
| Commutation account | | | 6,280 | | | | - | | | | - | | | | - | | | | 6,280 | |
| Other current assets | | | 9,646 | | | | 21,599 | | | | - | | | | - | | | | 31,245 | |
| Total current assets | | | 239,668 | | | | 807,181 | | | | 296 | | | | (16,122 | ) | | | 1,031,023 | |
| Property, plant and equipment, at cost: | | | 1,121 | | | | 1,090,695 | | | | - | | | | 3,627 | | | | 1,095,443 | |
Less – accumulated depreciation and amortization | | | 943 | | | | 325,076 | | | | - | | | | (8,026 | ) | | | 317,993 | |
| | | | 178 | | | | 765,619 | | | | - | | | | 11,653 | | | | 777,450 | |
| Deferred turnaround costs | | | - | | | | 39,276 | | | | - | | | | - | | | | 39,276 | |
| Deferred catalyst costs | | | - | | | | 6,540 | | | | - | | | | - | | | | 6,540 | |
| Deferred financing costs, net | | | 1,810 | | | | 746 | | | | - | | | | - | | | | 2,556 | |
| Prepaid insurance, net | | | 909 | | | | - | | | | - | | | | - | | | | 909 | |
| Intangible assets, net | | | - | | | | 1,460 | | | | - | | | | - | | | | 1,460 | |
| Other assets | | | 3,313 | | | | 1,321 | | | | - | | | | - | | | | 4,634 | |
| Investment in subsidiaries | | | 1,106,243 | | | | - | | | | - | | | | (1,106,243 | ) | | | - | |
Total assets | | $ | 1,352,121 | | | $ | 1,622,143 | | | $ | 296 | | | $ | (1,110,712 | ) | | $ | 1,863,848 | |
| | | | | | | | | | | | | | | | | | | | | |
| LIABILITIES AND SHAREHOLDERS’ EQUITY | | | | | | | | | | | | | | | | | | | | |
| Current liabilities: | | | | | | | | | | | | | | | | | | | | |
| Accounts payable | | $ | 242 | | | $ | 417,153 | | | $ | - | | | $ | - | | | $ | 417,395 | |
| Accrued liabilities and other | | | 25,947 | | | | 57,982 | | | | 189 | | | | - | | | | 84,118 | |
| Total current liabilities | | | 26,189 | | | | 475,135 | | | | 189 | | | | - | | | | 501,513 | |
| | | | | | | | | | | | | | | | | | | | | |
| Long-term debt | | | 150,000 | | | | - | | | | - | | | | - | | | | 150,000 | |
| Contingent income tax liabilities | | | 31,185 | | | | 1,072 | | | | - | | | | - | | | | 32,257 | |
| Other long-term liabilities | | | 3,208 | | | | 37,946 | | | | - | | | | - | | | | 41,154 | |
| Deferred income taxes | | | 100,310 | | | | 107,652 | | | | - | | | | (107,652 | ) | | | 100,310 | |
| Payable to affiliated companies | | | 2,615 | | | | 3,365 | | | | 70 | | | | (6,050 | ) | | | - | |
| | | | | | | | | | | | | | | | | | | | | |
| Shareholders’ equity | | | 1,038,614 | | | | 996,973 | | | | 37 | | | | (997,010 | ) | | | 1,038,614 | |
Total liabilities and shareholders’ equity | | $ | 1,352,121 | | | $ | 1,622,143 | | | $ | 296 | | | $ | (1,110,712 | ) | | $ | 1,863,848 | |
| | | | | | | | | | | | | | | | | | | | | |
| FRONTIER OIL CORPORATION | |
| Condensed Consolidating Balance Sheet | |
| As of December 31, 2006 | |
| (in thousands) | |
| | | FOC (Parent) | | | FHI (Guarantor Subsidiaries) | | | Other Non-Guarantor Subsidiaries | | | Eliminations | | | Consolidated | |
| ASSETS | | | | | | | | | | | | | | | |
| Current assets: | | | | | | | | | | | | | | | |
| Cash and cash equivalents | | $ | 215,049 | | | $ | 190,430 | | | $ | - | | | $ | - | | | $ | 405,479 | |
| Trade and other receivables, net | | | 1,363 | | | | 136,099 | | | | - | | | | - | | | | 137,462 | |
Receivable from affiliated companies | | | - | | | | 1,254 | | | | 251 | | | | (1,505 | ) | | | - | |
| Inventory of crude oil, products andother | | | - | | | | 374,576 | | | | - | | | | - | | | | 374,576 | |
| Deferred tax assets | | | 3,237 | | | | 7,846 | | | | - | | | | (7,846 | ) | | | 3,237 | |
| Other current assets | | | 2,082 | | | | 16,380 | | | | - | | | | - | | | | 18,462 | |
| Total current assets | | | 221,731 | | | | 726,585 | | | | 251 | | | | (9,351 | ) | | | 939,216 | |
| Property, plant and equipment, at cost: | | | 1,301 | | | | 817,332 | | | | - | | | | (5,051 | ) | | | 813,582 | |
Less – accumulated depreciation and amortization | | | 1,054 | | | | 284,034 | | | | - | | | | (8,311 | ) | | | 276,777 | |
| | | | 247 | | | | 533,298 | | | | - | | | | 3,260 | | | | 536,805 | |
| Deferred turnaround costs | | | - | | | | 24,640 | | | | - | | | | - | | | | 24,640 | |
| Deferred catalyst costs | | | - | | | | 6,386 | | | | - | | | | - | | | | 6,386 | |
| Deferred financing costs, net | | | 2,293 | | | | 459 | | | | - | | | | - | | | | 2,752 | |
| Commutation account | | | 7,290 | | | | - | | | | - | | | | - | | | | 7,290 | |
| Prepaid insurance, net | | | 2,120 | | | | - | | | | - | | | | - | | | | 2,120 | |
| Intangible assets, net | | | - | | | | 1,316 | | | | - | | | | - | | | | 1,316 | |
| Other assets | | | 2,734 | | | | 666 | | | | - | | | | - | | | | 3,400 | |
| Investment in subsidiaries | | | 831,082 | | | | - | | | | - | | | | (831,082 | ) | | | - | |
Total assets | | $ | 1,067,497 | | | $ | 1,293,350 | | | $ | 251 | | | $ | (837,173 | ) | | $ | 1,523,925 | |
| | | | | | | | | | | | | | | | | | | | | |
| LIABILITIES AND SHAREHOLDERS’ EQUITY | | | | | | | | | | | | | | | | | | | | |
| Current liabilities: | | | | | | | | | | | | | | | | | | | | |
| Accounts payable | | $ | 1,436 | | | $ | 388,583 | | | $ | - | | | $ | - | | | $ | 390,019 | |
| Contingent income tax liabilities | | | 28,271 | | | | - | | | | - | | | | - | | | | 28,271 | |
| Accrued liabilities and other | | | 13,894 | | | | 27,325 | | | | 189 | | | | - | | | | 41,408 | |
| Total current liabilities | | | 43,601 | | | | 415,908 | | | | 189 | | | | - | | | | 459,698 | |
| | | | | | | | | | | | | | | | | | | | | |
| Long-term debt | | | 150,000 | | | | - | | | | - | | | | - | | | | 150,000 | |
| Other long-term liabilities | | | 2,630 | | | | 41,836 | | | | - | | | | - | | | | 44,466 | |
| Deferred income taxes | | | 93,907 | | | | 97,620 | | | | - | | | | (97,620 | ) | | | 93,907 | |
| Payable to affiliated companies | | | 1,505 | | | | 44,644 | | | | 55 | | | | (46,204 | ) | | | - | |
| | | | | | | | | | | | | | | | | | | | | |
| Shareholders’ equity | | | 775,854 | | | | 693,342 | | | | 7 | | | | (693,349 | ) | | | 775,854 | |
Total liabilities and shareholders’ equity | | $ | 1,067,497 | | | $ | 1,293,350 | | | $ | 251 | | | $ | (837,173 | ) | | $ | 1,523,925 | |
| FRONTIER OIL CORPORATION | |
| Condensed Consolidating Statement of Cash Flows | |
| For the Year Ended December 31, 2007 | |
| (in thousands) | |
| | | FOC (Parent) | | | FHI (Guarantor Subsidiaries | | | Other Non-Guarantor Subsidiaries | | | Eliminations | | | Consolidated | |
| | | | | | | | | | | | | | | | |
| Cash flows from operating activities: | | | | | | | | | | | | | | | |
| Net income | | $ | 499,125 | | | $ | 515,462 | | | $ | 30 | | | $ | (515,492 | ) | | $ | 499,125 | |
Adjustments to reconcile net income to net cash from operating activities: | | | | | | | | | | | | | | | | | | | | |
Equity in earnings of subsidiaries | | | (802,362 | ) | | | - | | | | - | | | | 802,362 | | | | - | |
Depreciation, amortization andaccretion | | | 61 | | | | 67,772 | | | | - | | | | (321 | ) | | | 67,512 | |
Deferred income taxes | | | (1,916 | ) | | | - | | | | - | | | | - | | | | (1,916 | ) |
Stock-based compensation expense | | | 22,553 | | | | - | | | | - | | | | - | | | | 22,553 | |
Excess income tax benefits of stock-based compensation | | | (6,962 | ) | | | - | | | | - | | | | - | | | | (6,962 | ) |
Income taxes eliminated in Consolidation | | | - | | | | 278,462 | | | | 15 | | | | (278,477 | ) | | | - | |
Amortization of debt issuance costs | | | 483 | | | | 286 | | | | - | | | | - | | | | 769 | |
Losses (gains) on sales of assets | | | 2,028 | | | | (17,242 | ) | | | - | | | | - | | | | (15,214 | ) |
Decrease in commutation account | | | 1,009 | | | | - | | | | - | | | | - | | | | 1,009 | |
Amortization of long-term prepaid insurance | | | 1,211 | | | | - | | | | - | | | | - | | | | 1,211 | |
Increase (decrease) in other long-term liabilities | | | 31,058 | | | | (3,693 | ) | | | - | | | | - | | | | 27,365 | |
Changes in deferred charges andother | | | (578 | ) | | | (28,709 | ) | | | - | | | | - | | | | (29,287 | ) |
Changes in components of working capital from operations | | | (46,639 | ) | | | (88,900 | ) | | | - | | | | (1,613 | ) | | | (137,152 | ) |
Net cash provided by (used in) operating activities | | | (300,929 | ) | | | 723,438 | | | | 45 | | | | 6,459 | | | | 429,013 | |
| | | | | | | | | | | | | | | | | | | | | |
| Cash flows from investing activities: | | | | | | | | | | | | | | | | | |
Additions to property, plant and equipment | | | (4,310 | ) | | | (280,405 | ) | | | - | | | | (6,459 | ) | | | (291,174 | ) |
| Proceeds from sales of assets | | | 2,290 | | | | 19,932 | | | | - | | | | - | | | | 22,222 | |
El Dorado Refinery contingent earn-out payment | | | - | | | | (7,500 | ) | | | - | | | | - | | | | (7,500 | ) |
| Other acquisitions and leaseholdimprovements | | | - | | | | (3,561 | ) | | | - | | | | - | | | | (3,561 | ) |
| Net cash used in investing activities | | | (2,020 | ) | | | (271,534 | ) | | | - | | | | (6,459 | ) | | | (280,013 | ) |
| | | | | | | | | | | | | | | | | | | | | |
| Cash flows from financing activities: | | | | | | | | | | | | | | | | | |
| Purchase of treasury stock | | | (248,486 | ) | | | - | | | | - | | | | - | | | | (248,486 | ) |
Proceeds from issuance of common stock | | | 2,303 | | | | - | | | | - | | | | - | | | | 2,303 | |
| Dividends paid | | | (17,271 | ) | | | - | | | | - | | | | - | | | | (17,271 | ) |
| Debt issuance costs and other | | | - | | | | (588 | ) | | | - | | | | - | | | | (588 | ) |
Excess income tax benefits of stock-based compensation | | | 6,962 | | | | - | | | | - | | | | - | | | | 6,962 | |
| Intercompany transactions | | | 530,760 | | | | (530,715 | ) | | | (45 | ) | | | - | | | | - | |
Net cash provided by (used in) financing activities | | | 274,268 | | | | (531,303 | ) | | | (45 | ) | | | - | | | | (257,080 | ) |
| Decrease in cash and cash equivalents | | | (28,681 | ) | | | (79,399 | ) | | | - | | | | - | | | | (108,080 | ) |
Cash and cash equivalents, beginning of period | | | 215,049 | | | | 190,430 | | | | - | | | | - | | | | 405,479 | |
Cash and cash equivalents, end of period | | $ | 186,368 | | | $ | 111,031 | | | $ | - | | | $ | - | | | $ | 297,399 | |
| FRONTIER OIL CORPORATION | |
| Condensed Consolidating Statement of Cash Flows | |
| For the Year Ended December 31, 2006 | |
| (in thousands) | |
| | | FOC (Parent) | | | FHI (Guarantor Subsidiaries) | | | Other Non-Guarantor Subsidiaries | | | Eliminations | | | Consolidated | |
| | | | | | | | | | | | | | | | |
| Cash flows from operating activities: | | | | | | | | | | | | | | | |
| Net income | | $ | 379,277 | | | $ | 396,116 | | | $ | 87 | | | $ | (396,203 | ) | | $ | 379,277 | |
Adjustments to reconcile net income to net cash from operating activities: | | | | | | | | | | | | | | | | | | | | |
Equity in earnings of subsidiaries | | | (609,265 | ) | | | - | | | | - | | | | 609,265 | | | | - | |
Depreciation, amortization andaccretion | | | 88 | | | | 54,677 | | | | - | | | | (377 | ) | | | 54,388 | |
Deferred income taxes | | | 6,073 | | | | - | | | | - | | | | - | | | | 6,073 | |
Stock-based compensation expense | | | 18,029 | | | | - | | | | - | | | | - | | | | 18,029 | |
Excess income tax benefits of stock-based compensation | | | (8,881 | ) | | | - | | | | - | | | | - | | | | (8,881 | ) |
Income taxes eliminated in Consolidation | | | - | | | | 208,956 | | | | 55 | | | | (209,011 | ) | | | - | |
Amortization of debt issuance costs | | | 482 | | | | 315 | | | | - | | | | - | | | | 797 | |
Gains on sales of assets | | | (8 | ) | | | - | | | | - | | | | - | | | | (8 | ) |
Decrease in commutation account | | | 5,316 | | | | - | | | | - | | | | - | | | | 5,316 | |
Amortization of long-term prepaid insurance | | | 1,211 | | | | - | | | | - | | | | - | | | | 1,211 | |
Increase in other long-termliabilities | | | 416 | | | | 8,893 | | | | - | | | | - | | | | 9,309 | |
Changes in deferred charges andother | | | (420 | ) | | | (18,424 | ) | | | - | | | | - | | | | (18,844 | ) |
Changes in components of working capital from operations | | | 19,089 | | | | (124,306 | ) | | | (80 | ) | | | (853 | ) | | | (106,150 | ) |
Net cash (used in) provided by operating activities | | | (188,593 | ) | | | 526,227 | | | | 62 | | | | 2,821 | | | | 340,517 | |
| | | | | | | | | | | | | | | | | | | | | |
| Cash flows from investing activities: | | | | | | | | | | | | | | | | | |
Additions to property, plant and equipment | | | (88 | ) | | | (126,794 | ) | | | - | | | | (2,821 | ) | | | (129,703 | ) |
El Dorado Refinery contingent earn-out payment | | | - | | | | (7,500 | ) | | | - | | | | - | | | | (7,500 | ) |
| Proceeds from sale of assets | | | 8 | | | | - | | | | - | | | | - | | | | 8 | |
| Net cash used in investing activities | | | (80 | ) | | | (134,294 | ) | | | - | | | | (2,821 | ) | | | (137,195 | ) |
| | | | | | | | | | | | | | | | | | | | | |
| Cash flows from financing activities: | | | | | | | | | | | | | | | | | |
| Purchase of treasury stock | | | (98,950 | ) | | | - | | | | - | | | | - | | | | (98,950 | ) |
Proceeds from issuance of common stock | | | 3,672 | | | | - | | | | - | | | | - | | | | 3,672 | |
| Dividends paid | | | (67,498 | ) | | | - | | | | - | | | | - | | | | (67,498 | ) |
| Debt issuance costs and other | | | - | | | | (13 | ) | | | - | | | | - | | | | (13 | ) |
| Excess income tax benefits of stock-based compensation | | | 8,881 | | | | - | | | | - | | | | - | | | | 8,881 | |
| Intercompany transactions | | | 313,260 | | | | (313,198 | ) | | | (62 | ) | | | - | | | | - | |
Net cash provided by (used in) financing activities | | | 159,365 | | | | (313,211 | ) | | | (62 | ) | | | - | | | | (153,908 | ) |
| (Decrease) increase in cash and cashequivalents | | | (29,308 | ) | | | 78,722 | | | | - | | | | - | | | | 49,414 | |
Cash and cash equivalents, beginning of period | | | 244,357 | | | | 111,708 | | | | - | | | | - | | | | 356,065 | |
Cash and cash equivalents, end of period | | $ | 215,049 | | | $ | 190,430 | | | $ | - | | | $ | - | | | $ | 405,479 | |
| FRONTIER OIL CORPORATION | |
| Condensed Consolidating Statement of Cash Flows | |
| For the Year Ended December 31, 2005 | |
| (in thousands) | |
| | | FOC (Parent) | | | FHI (Guarantor Subsidiaries) | | | Other Non-Guarantor Subsidiaries | | | Eliminations | | | Consolidated | |
| | | | | | | | | | | | | | | | |
| Cash flows from operating activities: | | | | | | | | | | | | | |
| Net income | | $ | 275,158 | | | $ | 289,413 | | | $ | 90 | | | $ | (289,503 | ) | | $ | 275,158 | |
Adjustments to reconcile net income to net cash from operating activities: | | | | | | | | | | | | | | | | | | | | |
Equity in earnings of subsidiaries | | | (462,027 | ) | | | - | | | | - | | | | 462,027 | | | | - | |
Cumulative effect of accounting change, net of income taxes | | | (1,530 | ) | | | 2,503 | | | | - | | | | 1,530 | | | | 2,503 | |
Depreciation, amortization andaccretion | | | 69 | | | | 48,033 | | | | - | | | | (556 | ) | | | 47,546 | |
Deferred income taxes | | | 30,259 | | | | - | | | | - | | | | - | | | | 30,259 | |
Income taxes eliminated in consolidation | | | - | | | | 171,237 | | | | - | | | | (171,237 | ) | | | - | |
Amortization of debt issuance costs | | | 483 | | | | 302 | | | | - | | | | - | | | | 785 | |
Stock-based compensation expense | | | 1,363 | | | | - | | | | - | | | | - | | | | 1,363 | |
Gains on sales of assets | | | (3 | ) | | | (3,641 | ) | | | - | | | | - | | | | (3,644 | ) |
Decrease in commutation account | | | 3,832 | | | | - | | | | - | | | | - | | | | 3,832 | |
Amortization of long-term prepaid insurance | | | 1,211 | | | | - | | | | - | | | | - | | | | 1,211 | |
Increase in other long-termliabilities | | | 698 | | | | 3,775 | | | | | | | | | | | | 4,473 | |
Changes in deferred charges andother | | | (206 | ) | | | (17,110 | ) | | | - | | | | - | | | | (17,316 | ) |
Changes in components of working capital from operations | | | 32,645 | | | | (18,478 | ) | | | - | | | | - | | | | 14,167 | |
Net cash (used in) provided by operating activities | | | (118,048 | ) | | | 476,034 | | | | 90 | | | | 2,261 | | | | 360,337 | |
| | | | | | | | | | | | | | | | | | | | | |
| Cash flows from investing activities: | | | | | | | | | | | | | | | | | |
Additions to property, plant and equipment | | | (143 | ) | | | (107,306 | ) | | | - | | | | (2,261 | ) | | | (109,710 | ) |
El Dorado Refinery contingent earn-out payment | | | - | | | | (7,500 | ) | | | - | | | | - | | | | (7,500 | ) |
| Proceeds from sale of assets | | | 3 | | | | 5,497 | | | | - | | | | - | | | | 5,500 | |
Net proceeds from insurance – involuntary conversion claim | | | - | | | | 2,142 | | | | - | | | | - | | | | 2,142 | |
| Net cash used in investing activities | | | (140 | ) | | | (107,167 | ) | | | - | | | | (2,261 | ) | | | (109,568 | ) |
| | | | | | | | | | | | | | | | | | | | | |
| Cash flows from financing activities: | | | | | | | | | | | | | | | | | |
| Purchase of treasury stock | | | (34,819 | ) | | | - | | | | - | | | | - | | | | (34,819 | ) |
Proceeds from issuance of common stock | | | 23,616 | | | | - | | | | - | | | | - | | | | 23,616 | |
| Dividends paid | | | (7,776 | ) | | | - | | | | - | | | | - | | | | (7,776 | ) |
| Debt issuance costs and other | | | (100 | ) | | | (14 | ) | | | - | | | | - | | | | (114 | ) |
| Intercompany transactions | | | 276,215 | | | | (276,125 | ) | | | (90 | ) | | | - | | | | - | |
Net cash provided by (used in) financing activities | | | 257,136 | | | | (276,139 | ) | | | (90 | ) | | | - | | | | (19,093 | ) |
| Increase in cash and cash equivalents | | | 138,948 | | | | 92,728 | | | | - | | | | - | | | | 231,676 | |
Cash and cash equivalents, beginning of period | | | 105,409 | | | | 18,980 | | | | - | | | | - | | | | 124,389 | |
Cash and cash equivalents, end of period | | $ | 244,357 | | | $ | 111,708 | | | $ | - | | | $ | - | | | $ | 356,065 | |
| 13. | Selected Quarterly Financial and Operating Data |
| (Dollars in thousands, except per share and per bbl) | | | | | | | | | | | | | | | | | | | |
| | | 2007 | | | 2006 | |
| Unaudited | | Fourth | | | Third | | | Second | | | First | | | Fourth | | | Third | | | Second | | | First | |
| Revenues | | $ | 1,319,637 | | | $ | 1,386,520 | | | $ | 1,434,700 | | | $ | 1,047,883 | | | $ | 1,087,267 | | | $ | 1,381,127 | | | $ | 1,315,366 | | | $ | 1,012,193 | |
| Operating income | | | 61,806 | | | | 207,024 | | | | 374,293 | | | | 112,672 | | | | 75,486 | | | | 180,762 | | | | 226,355 | | | | 91,591 | |
| Net income | | | 43,417 | | | | 137,225 | | | | 243,763 | | | | 74,720 | | | | 52,434 | | | | 123,626 | | | | 145,864 | | | | 57,353 | |
| Basic net income per share | | | 0.42 | | | | 1.30 | | | | 2.26 | | | | 0.68 | | | | 0.48 | | | | 1.11 | | | | 1.30 | | | | 0.51 | |
| Diluted net income per share | | | 0.41 | | | | 1.28 | | | | 2.23 | | | | 0.68 | | | | 0.47 | | | | 1.10 | | | | 1.29 | | | | 0.51 | |
| Refining operations: | | | | | | | | | | | | | | | | | | | | | | | | | | | | | | | | |
| Total charges (bpd) (1) | | | 157,772 | | | | 171,243 | | | | 163,991 | | | | 166,529 | | | | 173,613 | | | | 175,907 | | | | 171,426 | | | | 166,202 | |
| Gasoline yields (bpd) (2) | | | 72,173 | | | | 78,302 | | | | 79,921 | | | | 77,545 | | | | 83,283 | | | | 79,298 | | | | 79,817 | | | | 83,564 | |
| Diesel and jet fuel yields (bpd) (2) | | | 51,475 | | | | 55,389 | | | | 55,437 | | | | 61,367 | | | | 60,950 | | | | 62,137 | | | | 54,857 | | | | 52,627 | |
| Total product sales (bpd) | | | 161,899 | | | | 174,116 | | | | 173,888 | | | | 170,744 | | | | 174,252 | | | | 175,456 | | | | 173,642 | | | | 164,661 | |
| Average gasoline crack spread (per bbl) | | $ | 3.27 | | | $ | 20.51 | | | $ | 36.73 | | | $ | 12.92 | | | $ | 7.96 | | | $ | 18.41 | | | $ | 20.92 | | | $ | 9.22 | |
| Average diesel crack spread (per bbl) | | | 16.06 | | | | 23.43 | | | | 29.08 | | | | 21.66 | | | | 20.21 | | | | 26.21 | | | | 23.49 | | | | 15.51 | |
| Cheyenne average light/heavy crude oil differential (per bbl) | | | 28.40 | | | | 18.40 | | | | 14.17 | | | | 13.24 | | | | 14.35 | | | | 16.30 | | | | 15.19 | | | | 18.99 | |
| El Dorado average light/heavy crude oil differential (per bbl) | | | 30.64 | | | | 20.60 | | | | 18.78 | | | | 12.46 | | | | 13.99 | | | | 12.83 | | | | 25.41 | | | | 24.65 | |
| Average WTI/WTS crude oil differential (per bbl) | | | 6.95 | | | | 4.20 | | | | 4.59 | | | | 4.34 | | | | 4.84 | | | | 4.69 | | | | 4.89 | | | | 6.44 | |
(1) | Charges are the quantity of crude oil and other feedstock processed through refinery units. |
| (2) | Manufactured product yields are the volumes of specific materials that are obtained through the distilling of crude oil and the operations of other refinery process units. |
| Changes in and Disagreements With Accountants on Accounting and Financial Disclosure |
None.
The information contained in this Form 10-K, as well as the financial and operational data we present concerning the Company, is prepared by management. Our financial statements are fairly presented in all material respects in conformity with generally accepted accounting principles. It has always been our intent to apply proper and prudent accounting guidelines in the presentation of our financial statements, and we are committed to full and accurate representation of our condition through complete and clear disclosures.
We maintain a set of disclosure controls and procedures that are designed to ensure that information required to be disclosed by us in the reports filed by us under the Securities Exchange Act of 1934, as amended (“Exchange Act”), is recorded, processed, summarized and reported within the time periods specified in the SEC’s rules and forms, and that such information is accumulated and communicated to management, including the Chief Executive Officer and Chief Financial Officer, as appropriate, to allow timely decisions regarding required disclosure. Management necessarily applies its judgment in assessing the costs and benefits of such controls and procedures, which, by their nature, can provide only reasonable assurance regarding management's control objectives.
As of the end of the period covered by this report, we evaluated, under the supervision and with the participation of our management, including our Chairman of the Board, President and Chief Executive Officer and our Executive Vice President and Chief Financial Officer, the effectiveness of our disclosure controls and procedures pursuant to Rule 13a-15 of the Exchange Act. Based on that evaluation, our Chairman of the Board, President and Chief Executive Officer and our Executive Vice President and Chief Financial Officer concluded that our disclosure controls and procedures are effective.
During the most recent fiscal quarter, there have been no changes in our internal control over financial reporting that have materially affected, or is reasonably likely to materially affect, our internal control over financial reporting.
Our “Management’s Report on Internal Control Over Financial Reporting” and the related “Report of Independent Registered Public Accounting Firm” on our report are include on pages 29 and 30.
None.
The information required by Part III of this Form is incorporated by reference from the Company’s definitive proxy statement to be filed with the SEC pursuant to Regulation 14A within 120 days after the close of its last fiscal year.
| Exhibits and Financial Statement Schedules |
| (a)1.Financial Statements and Supplemental Data |
| |
|
|
|
|
|
|
|
| (a)2.Financial Statements Schedules |
| |
|
|
| Other Schedules are omitted because of the absence of the conditions under which they are required or because the required information is included in the financial statements or notes thereto. |
| * | 2.1 | | Asset Purchase and Sale Agreement, dated as of October 19, 1999, among Frontier El Dorado Refining Company, as buyer, the Company, as Guarantor, and Equilon Enterprises LLC, as seller (Exhibit 10.1 to Form 8-K, File Number 1-07627, filed December 1, 1999). |
| * | 3.1 | | Restated Articles of Incorporation of Wainoco Oil Corporation (now Frontier Oil Corporation) dated August 5, 1987 (Exhibit 3.1.1 to Registration Statement No. 333-120643, filed November 19, 2004). |
| * | 3.2 | | Articles of Amendment to the Restated Articles of Incorporation of Wainoco Oil Corporation (now Frontier Oil Corporation) dated June 14, 1988 (Exhibit 3.1.2 to Registration Statement Number 333-120643, filed November 19, 2004). |
| * | 3.3 | | Articles of Amendment to the Restated Articles of Incorporation of Wainoco Oil Corporation (now Frontier Oil Corporation) dated April 24, 1992 (Exhibit 3.1.3 to Registration Statement Number 333-120643, filed November 19, 2004). |
| * | 3.4 | | Articles of Amendment to the Restated Articles of Incorporation of Wainoco Oil Corporation (now Frontier Oil Corporation) dated April 27, 1998 (Exhibit 3.1.4 to Registration Statement Number 333-120643, filed November 19, 2004). |
| * | 3.5 | | Articles of Amendment to the Restated Articles of Incorporation of Frontier Oil Corporation dated May 23, 2005 (Exhibit 3.1 to Form 8-K, File Number 1-07627, filed May 24, 2005). |
| * | 3.6 | | Articles of Amendment to the Restated Articles of Incorporation of Frontier Oil Corporation dated June 12, 2006 (Exhibit 3.1 to Form 8-K, File Number 1-07627, filed June 15, 2006). |
| * | 3.7 | | Fourth Restated Bylaws of Wainoco Oil Corporation (now Frontier Oil Corporation), as amended through February 20, 2002 (Exhibit 3.2 to Wainoco Oil Corporation’s Annual Report on Form 10-K, File Number 1-07627, filed March 10, 1993). |
| * | 3.8 | | First Amendment to Fourth Restated Bylaws of Frontier Oil Corporation, effective December 31, 2007 (Exhibit 10.1 to Form 8-K, File Number 1-07627, filed January 4, 2008). |
| * | 4.1 | | Indenture, dated as of October 1, 2004, among the Company, as issuer, the guarantors party thereto and Wells Fargo Bank, N.A., as trustee relating to the Company’s 6.625% Senior Notes due 2011 (Exhibit 4.1 to Form 8-K, File Number1-07627, filed October 4, 2004). |
| *² | 10.1 | | Frontier Deferred Compensation Plan (previously named Wainoco Deferred Compensation Plan dated October 29, 1993 and filed as Exhibit 10.19 to Form 10-K, File Number 1-07627, filed March 17, 1995). |
*² | 10.2 | | Frontier Deferred Compensation Plan for Directors (previously named Wainoco Deferred Compensation Plan for Directors dated May 1, 1994 and filed as Exhibit 10.20 to Form 10-K, File Number 1-07627, filed March 17, 1995). |
*² | 10.3 | | Executive Change in Control Severance Agreement effective December 30, 2005, between the Company and James R. Gibbs (Exhibit 10.1 to Form 8-K, File Number 1-07627, filed February 2, 2006). |
*² | 10.4 | | Executive Change in Control Severance Agreement effective December 30, 2005, between the Company and Michael C. Jennings (Exhibit 10.3 to Form 8-K, File Number 1-07627, filed February 2, 2006). |
*² | 10.5 | | Executive Change in Control Severance Agreement effective December 30, 2005, between the Company and Doug S. Aron (Exhibit 10.4 to Form 8-K, File Number 1-07627, filed February 2, 2006). |
| *² | 10.6 | | Executive Change in Control Severance Agreement effective December 30, 2005, between the Company and J. Currie Bechtol (Exhibit 10.5 to Form 8-K, File Number 1-07627, filed February 2, 2006). |
*² | 10.7 | | Executive Change in Control Severance Agreement effective December 30, 2005, between the Company and Gerald B. Faudel (Exhibit 10.6 to Form 8-K, File Number 1-07627, filed February 2, 2006). |
*² | 10.8 | | Executive Change in Control Severance Agreement effective December 30, 2005, between the Company and Jon D. Galvin (Exhibit 10.7 to Form 8-K, File Number 1-07627, filed February 2, 2006). |
*² | 10.9 | | Executive Change in Control Severance Agreement effective December 30, 2005, between the Company and Nancy J. Zupan (Exhibit 10.8 to Form 8-K, File Number 1-07627, filed February 2, 2006). |
*² | 10.10 | | Executive Change in Control Severance Agreement effective December 30, 2005, between the Company and Penny S. Newmark (Exhibit 10.9 to Form 8-K, File Number 1-07627, filed February 2, 2006). |
*² | 10.11 | | Executive Change in Control Severance Agreement effective December 30, 2005, between the Company and Kent A. Olsen (Exhibit 10.11 to Form 8-K, File Number 1-07627, filed February 2, 2006). |
| *² | 10.12 | | Executive Change in Control Severance Agreement effective December 30, 2005, between the Company and Joel W. Purdy (Exhibit 10.12 to Form 8-K, File Number 1-07627, filed February 2, 2006). |
*² | 10.13 | | Executive Change in Control Severance Agreement effective December 30, 2005, between the Company and Billy N. Rigby (Exhibit 10.13 to Form 8-K, File Number 1-07627, filed February 2, 2006). |
| *² | 10.14 | | Executive Change in Control Severance Agreement effective December 30, 2005, between the Company and James M. Stump (Exhibit 10.14 to Form 8-K, File Number 1-07627, filed February 2, 2006). |
*² | 10.15 | | Executive Change in Control Severance Agreement, effective December 30, 2005, between the Company and Leo J. Hoonakker (Exhibit 10.1 to Form 8-K, File Number 1-07627, filed March 9, 2006). |
| *² | 10.16 | | Executive Change in Control Severance Agreement, effective as of May 30, 2006, by and between the Company and W. Paul Eisman (Exhibit 10.1 to Form 8-K, filed May 31, 2006). |
*² | 10.17 | | Form of Executive Severance Agreement, effective as of May 30, 2006, by and between the Company and each of James R. Gibbs, W. Paul Eisman, Michael C. Jennings, Doug S. Aron, J. Currie Bechtol, Gerald B. Faudel, Jon D. Galvin, Nancy J. Zupan, Leo J. Hoonakker, Penny S. Newmark, Kent A. Olsen, Joel W. Purdy, Billy N. Rigby, and James M. Stump (Exhibit 10.2 to Form 8-K, File Number 1-07627, filed May 31, 2006). |
| * | 10.18 | | Crude Oil Supply Agreement dated October 15, 2002, between Baytex Energy Ltd. and Frontier Oil and Refining Company (Exhibit 10.2 to Form 10-Q, File Number 1-07627, filed October 30, 2002). On November 28, 2002, this agreement was assigned by Baytex Energy Ltd. to its wholly-owned subsidiary, Baytex Marketing Ltd. |
| * | 10.19 | | Master Crude Oil Purchase and Sale Contract, dated March 10, 2006, among Utexam Limited, Frontier Oil and Refining Company and the Company (Exhibit 10.1 to Form 8-K, File Number 1-07627, filed March 14, 2006). |
| * | 10.20 | | Guaranty, dated March 10, 2006, by the Company in favor of Utexam Limited (Exhibit 10.2 to Form 8-K, File Number 1-07627, filed March 14, 2006). |
| * | 10.21 | | Third Amended and Restated Revolving Credit Agreement dated October 1, 2007, among the Company, Frontier Oil and Refining Company, as borrower, the lenders named therein, Union Bank of California, N.A., as administrative agent, and BNP Paribas, as syndication agent (Exhibit 10.1 to Form 8-K, File Number 1-07627, filed October 4, 2007). |
*² | 10.22 | | Frontier Oil Corporation Omnibus Incentive Compensation Plan (Annex A to Proxy Statement, File Number 1-07627, filed March 21, 2006). |
*² | 10.23 | | Form of Frontier Oil Corporation Omnibus Incentive Compensation Plan Stock Unit/Restricted Stock Agreement (Exhibit 4.8 to Form S-8, File Number 333-133595, filed April 27, 2006). |
*² | 10.24 | | Form of Frontier Oil Corporation Omnibus Incentive Compensation Plan Nonqualified Stock Option Agreement (Exhibit 4.9 to Form S-8, File Number 333-133595, filed April 27, 2006). |
*² | 10.25 | | Form of Non-Employee Director Restricted Stock Unit Grant Agreement (Exhibit 10.1 to Form 8-K, File Number 1-07627, filed April 7, 2006). |
*² | 10.26 | | Form of First Amendment to Restricted Stock Unit Grant (Exhibit 10.1 to Form 10-Q, File Number 1-07627, filed August 7, 2006). |
*² | 10.27 | | Form of Restricted Stock Agreement (Exhibit 10.2 to Form 8-K, File Number 1-07627, filed April 7, 2006). |
*² | 10.28 | | Separation Agreement and Release, effective as of March 7, 2006, between W. Reed Williams and the Company (Exhibit 10.1 to Form 8-K, File Number 1-07627, filed March 15, 2006). |
*² | 10.29 | | Executive Retiree Medical Benefit Plan (Exhibit 10.3 to Form 10-Q, File Number 1-07627, filed May 8, 2006). |
*² | 10.30 | | Management Incentive Compensation Plan for Fiscal 2006 (Exhibit 10.1 to Form 8-K, File Number 1-07627, filed February 28, 2007). |
*² | 10.31 | | Form of Indemnification Agreement by and between the Company and each of its officers and directors (Exhibit 10.41 to Form 10-K, File Number 1-07627, filed February 28, 2007). |
*² | 10.32 | | Management Incentive Compensation Plan for Fiscal 2007 (Exhibit 10.1 to Form 8-K, File Number 1-07627, filed March 2, 2007). |
*² | 10.33 | | Form of 2007 Stock Unit / Restricted Stock Agreement (Exhibit 10.1 to Form 10-Q, File Number 1-07627, filed May 9, 2007). |
| ² | | | |
| ² | | | |
| ² | | | |
| | 21 | | |
| | | | |
| | | | |
| | 31.2 | | |
| | | | |
| | | | |
* Asterisk indicates exhibits incorporated by reference as shown.
² Diamond indicates management contract or compensatory plan or arrangement.
The Company’s 2007 Annual Report is available upon request. Shareholders of the Company may obtain a copy of any exhibits to this Form 10-K at a charge of $0.05 per page. Requests should be directed to:
Investor Relations
Frontier Oil Corporation
10000 Memorial Drive, Suite 600
Houston, Texas 77024-3411
| | | | | | |
| Condensed Financial Information of Registrant | | | | | | |
| Balance Sheets | | | | | | |
| | | | | | Schedule I | |
| | | | |
| | | December 31, | |
| | | 2007 | | | 2006 | |
| ASSETS | | (in thousands) | |
| Current assets: | | | | | | |
Cash and cash equivalents | | $ | 186,368 | | | $ | 215,049 | |
Trade and other receivables | | | 27,948 | | | | 1,363 | |
Deferred tax assets | | | 9,426 | | | | 3,237 | |
Commutation account | | | 6,280 | | | | - | |
Other current assets | | | 9,646 | | | | 2,082 | |
Total current assets | | | 239,668 | | | | 221,731 | |
| Property, plant and equipment, at cost: | | | | | | | | |
Furniture, fixtures and other | | | 1,121 | | | | 1,301 | |
Less - accumulated depreciation | | | 943 | | | | 1,054 | |
| | | | 178 | | | | 247 | |
| Deferred financing costs, net | | | 1,810 | | | | 2,293 | |
| Commutation account | | | - | | | | 7,290 | |
| Prepaid insurance, net | | | 909 | | | | 2,120 | |
| Other assets | | | 3,313 | | | | 2,734 | |
| Investment in subsidiaries | | | 1,106,243 | | | | 831,082 | |
| | | | | | | | | |
| Total assets | | $ | 1,352,121 | | | $ | 1,067,497 | |
| | | | | | | | | |
| LIABILITIES AND SHAREHOLDERS’ EQUITY | | | | | | | | |
| Current liabilities: | | | | | | | | |
Accounts payable | | $ | 242 | | | $ | 1,436 | |
Contingent income tax liabilities | | | - | | | | 28,271 | |
Accrued liabilities and other | | | 25,947 | | | | 13,894 | |
Total current liabilities | | | 26,189 | | | | 43,601 | |
| | | | | | | | | |
| Long-term debt | | | 150,000 | | | | 150,000 | |
| Contingent income tax liabilities | | | 31,185 | | | | - | |
| Other long-term liabilities | | | 3,208 | | | | 2,630 | |
| Deferred income taxes | | | 100,310 | | | | 93,907 | |
| Payable to affiliated companies | | | 2,615 | | | | 1,505 | |
| | | | | | | | | |
| Shareholders’ equity | | | 1,038,614 | | | | 775,854 | |
| | | | | | | | | |
| Total liabilities and shareholders’ equity | | $ | 1,352,121 | | | $ | 1,067,497 | |
The “Notes to Consolidated Financial Statements” in Item 8 of this Form 10-K are an integral part of these financial statements.
| Frontier Oil Corporation | | | | | | | | | |
| Condensed Financial Information of Registrant | | | | | | | | | |
| Statements of Income | | | | | | | | | |
| | | | | | | | | Schedule I | |
| | | | |
| | | Years Ended December 31, | |
| | | 2007 | | | 2006 | | | 2005 | |
| | | (in thousands) | |
| | | | | | | | | | |
| Revenues | | $ | 2 | | | $ | 4 | | | $ | (6 | ) |
| | | | | | | | | | | | | |
| Costs and expenses: | | | | | | | | | | | | |
Selling and general expenses, excluding depreciation | | | 30,593 | | | | 30,194 | | | | 14,681 | |
Merger termination and legal costs | | | - | | | | - | | | | 48 | |
Depreciation | | | 61 | | | | 88 | | | | 69 | |
Loss (gain) on sales of assets | | | 2,028 | | | | (8 | ) | | | (3 | ) |
| | | | 32,682 | | | | 30,274 | | | | 14,795 | |
| | | | | | | | | | | | | |
| Operating income | | | (32,680 | ) | | | (30,270 | ) | | | (14,801 | ) |
| | | | | | | | | | | | | |
| Interest expense and other financing costs | | | 12,723 | | | | 11,978 | | | | 10,593 | |
| Interest and investment income | | | (11,202 | ) | | | (12,102 | ) | | | (5,905 | ) |
| Equity in earnings of subsidiaries | | | (802,362 | ) | | | (609,265 | ) | | | (462,027 | ) |
| | | | (800,841 | ) | | | (609,389 | ) | | | (457,339 | ) |
| | | | | | | | | | | | | |
| Income before income taxes | | | 768,161 | | | | 579,119 | | | | 442,538 | |
| Provision for income taxes | | | 269,036 | | | | 199,842 | | | | 168,910 | |
| | | | | | | | | | | | | |
| Income before cumulative effect of accounting change | | | 499,125 | | | | 379,277 | | | | 273,628 | |
Income tax benefit for cumulative effect of accounting change | | | - | | | | - | | | | 1,530 | |
| Net income | | $ | 499,125 | | | $ | 379,277 | | | $ | 275,158 | |
The “Notes to Consolidated Financial Statements” in Item 8 of this Form 10-K are an integral part of these financial statements.
| Frontier Oil Corporation | | | | | | | | | |
| Condensed Financial Information of Registrant | |
| Statements of Cash Flows | | | | | | | | | |
| | | | | | | | | Schedule I | |
| | | | |
| | | Years Ended December 31, | |
| | | 2007 | | | 2006 | | | 2005 | |
| | | (in thousands) | |
| Cash flows from operating activities: | | | | | | | | | |
Net income | | $ | 499,125 | | | $ | 379,277 | | | $ | 275,158 | |
Equity in earnings of subsidiaries | | | (802,362 | ) | | | (609,265 | ) | | | (462,027 | ) |
Cumulative effect of accounting change, net of income taxes | | | - | | | | - | | | | (1,530 | ) |
Depreciation | | | 61 | | | | 88 | | | | 69 | |
Deferred income taxes | | | (1,916 | ) | | | 6,073 | | | | 30,259 | |
Stock-based compensation expense | | | 22,553 | | | | 18,029 | | | | 1,363 | |
Excess income tax benefits of stock-based compensation | | | (6,962 | ) | | | (8,881 | ) | | | - | |
Amortization of debt issuance costs | | | 483 | | | | 482 | | | | 483 | |
Loss (gain) on sales of assets | | | 2,028 | | | | (8 | ) | | | (3 | ) |
Decrease in commutation account | | | 1,009 | | | | 5,316 | | | | 3,832 | |
Amortization of long-term prepaid insurance | | | 1,211 | | | | 1,211 | | | | 1,211 | |
Increase (decrease) in other long-term liabilities | | | 31,058 | | | | 416 | | | | 698 | |
Other | | | (578 | ) | | | (420 | ) | | | (206 | ) |
Changes in components of working capital from operations | | | (46,639 | ) | | | 19,089 | | | | 32,645 | |
| Net cash used by operating activities | | | (300,929 | ) | | | (188,593 | ) | | | (118,048 | ) |
| | | | | | | | | | | | | |
| Cash flows from investing activities: | | | | | | | | | | | | |
Additions to property, plant and equipment | | | (4,310 | ) | | | (88 | ) | | | (143 | ) |
Proceeds from sale of assets | | | 2,290 | | | | 8 | | | | 3 | |
| Net cash used by investing activities | | | (2,020 | ) | | | (80 | ) | | | (140 | ) |
| | | | | | | | | | | | | |
| Cash flows from financing activities: | | | | | | | | | | | | |
Purchase of treasury stock | | | (248,486 | ) | | | (98,950 | ) | | | (34,819 | ) |
Proceeds from issuance of common stock | | | 2,303 | | | | 3,672 | | | | 23,616 | |
Dividends paid to shareholders | | | (17,271 | ) | | | (67,498 | ) | | | (7,776 | ) |
Intercompany transactions, net | | | 1,110 | | | | (3,240 | ) | | | 4,215 | |
Dividends received from subsidiaries | | | 529,650 | | | | 316,500 | | | | 272,000 | |
Excess income tax benefits of stock-based compensation | | | 6,962 | | | | 8,881 | | | | - | |
Debt issuance costs and other | | | - | | | | - | | | | (100 | ) |
| Net cash provided by financing activities | | | 274,268 | | | | 159,365 | | | | 257,136 | |
| | | | | | | | | | | | | |
| (Decrease) Increase in cash and cash equivalents | | | (28,681 | ) | | | (29,308 | ) | | | 138,948 | |
| Cash and cash equivalents, beginning of period | | | 215,049 | | | | 244,357 | | | | 105,409 | |
| | | | | | | | | | | | | |
| Cash and cash equivalents, end of period | | $ | 186,368 | | | $ | 215,049 | | | $ | 244,357 | |
The “Notes to Consolidated Financial Statements” in Item 8 of this Form 10-K are an integral part of these financial statements.
| | | | | | | | | | | | |
| Valuation and Qualifying Accounts | | | | |
| For the three years ended December 31, | | | Schedule II | |
| | | | | | | | | | | | | |
| | | | | | | | | | | | | |
| Description | | Balance at beginning of period | | | Additions | | | Deductions | | | Balance at end of period | |
| | | (in thousands) | |
| 2007 | | | | | | | | | | | | |
| Allowance for doubtful accounts | | $ | 500 | | | $ | 198 | | | $ | 198 | | | $ | 500 | |
| | | | | | | | | | | | | | | | | |
| 2006 | | | | | | | | | | | | | | | | |
| Allowance for doubtful accounts | | | 500 | | | | 26 | | | | 26 | | | | 500 | |
| | | | | | | | | | | | | | | | | |
| 2005 | | | | | | | | | | | | | | | | |
| Allowance for doubtful accounts | | | 500 | | | | - | | | | - | | | | 500 | |
SIGNATURES
Pursuant to the requirements of Section 13 or 15(d) of the Securities Exchange Act of 1934, the registrant has duly caused this report to be signed on its behalf by the undersigned, thereunto duly authorized on the date indicated.
| | FRONTIER OIL CORPORATION | |
| | | | |
| | By: | /s/ James R. Gibbs | |
| | | James R. Gibbs | |
| | | Chairman of the Board, President and Chief Executive Officer (chief executive officer) | |
| | | | |
Pursuant to the requirements of the Securities Exchange Act of 1934, this report has been signed below by the following persons on behalf of Frontier Oil Corporation and in the capacities and on the date indicated.
| | | | | |
| /s/ James R. Gibbs | | | /s/ T. Michael Dossey | |
| James R. Gibbs | | | T. Michael Dossey | |
Chairman of the Board, President and Chief Executive Officer and Director (chief executive officer) | | | Director | |
| | | | | |
| /s/ Michael C. Jennings | | | /s/ James H. Lee | |
| Michael C. Jennings | | | James H. Lee | |
Chief Financial Officer (principal financial officer) | | | Director | |
| | | | | |
| /s/ Nancy J. Zupan | | | /s/ Paul B. Loyd, Jr. | |
| Nancy J. Zupan | | | Paul B. Loyd, Jr. | |
Vice President - Controller (principal accounting officer) | | | Director | |
| | | | | |
| /s/ Douglas Y. Bech | | | /s/ Michael E. Rose | |
| Douglas Y. Bech | | | Michael E. Rose | |
| Director | | | Director | |