This Form 10-K contains “forward-looking statements” as defined by the Securities and Exchange Commission (“SEC”). Such statements are those concerning contemplated transactions and strategic plans, expectations and objectives for future operations. These include, without limitation:
Although we believe that our plans, intentions and expectations reflected in or suggested by the forward-looking statements we make in this Form 10-K are reasonable, we can give no assurance that such plans, intentions or expectations will be achieved. These statements are based on assumptions made by us based on our experience and perception of historical trends, current conditions, expected future developments and other factors that we believe are appropriate in the circumstances. Such statements are subject to a number of risks and uncertainties, many of which are beyond our control. You are cautioned that any such statements are not guarantees of future performance and that actual results or developments may differ materially from those projected in the forward-looking statements.
All forward-looking statements contained in this Form 10-K only speak as of the date of this document. We undertake no obligation to update or revise publicly any revisions to any such forward-looking statements that may be made to reflect events or circumstances after the date of this Form 10-K, or to reflect the occurrence of unanticipated events.
The terms “Frontier,” “we,” “us” and “our” as used in this Form 10-K refer to Frontier Oil Corporation and its subsidiaries, except where it is clear that those terms mean only the parent company. When we use the term “Rocky Mountain region,” we refer to the states of Colorado, Wyoming, western Nebraska, Montana and Utah, and when we use the term “Plains States,” we refer to the states of Kansas, Oklahoma, eastern Nebraska, Iowa, Missouri, North Dakota and South Dakota.
We are an independent energy company, organized in the State of Wyoming in 1977, engaged in crude oil refining and the wholesale marketing of refined petroleum products. We operate refineries (the “Refineries”) in Cheyenne, Wyoming and El Dorado, Kansas with a total annual average crude oil capacity of approximately 187,000 barrels per day (“bpd”). Both of our Refineries are complex refineries, which means that they can process heavier, less expensive types of crude oil and still produce a high percentage of gasoline, diesel fuel and other high value refined products. We focus our marketing efforts in the Rocky Mountain region and the Plains States, which we believe are among the most attractive refined products markets in the United States. The operations of refining an d marketing of petroleum products are considered part of one reporting segment.
For the most part, heavy crude oil tends to be sour and light crude oil tends to be sweet. When refined, light crude oil produces a higher proportion of high value refined products such as gasoline, diesel and jet fuel and, as a result, is more expensive than heavy crude oil. In contrast, heavy crude oil produces more low value by-products and heavy residual oils. The discount at which heavy crude oil sells compared to light crude oil is known in the industry as the light/heavy spread or differential, while the discount at which sour crude oil sells compared to sweet crude oil is known as the sweet/sour, or WTI/WTS, spread or differential. Coking units, such as the ones at our Refineries, can process certain by-products and heavy residual oils to produce additional volumes of gasoline and diesel , thus increasing the aggregate yields of higher value refined products from the same initial barrel of crude oil.
Refineries are frequently classified according to their complexity, which refers to the number, type and capacity of processing units at the refinery. Each of our Refineries possesses a coking unit, which provides substantial upgrading capacity and generally increases a refinery’s complexity rating. Upgrading capacity refers to the ability of a refinery to produce high yields of high value refined products such as gasoline and diesel from heavy and intermediate crude oil. In contrast, refiners with low upgrading capacity must process primarily light, sweet crude oil to produce a similar yield of gasoline and diesel. Some low complexity refineries may be capable of processing heavy and intermediate crude oil, but will generally produce large volumes of by-products, including heavy residual oils and a sphalt. Because gasoline, diesel and jet fuel sales generally achieve higher margins than are available on other refined products, we expect that these products will continue to make up the majority of our production.
During 2010, the El Dorado Refinery turnaround scope was limited to annual catalyst reformer regenerations and coker furnace cleaning. In addition, the final phase of the gofiner project was completed in December 2010. The year 2011 will be another moderate turnaround year for the El Dorado Refinery, with a third quarter turnaround scheduled on the aromatics recovery unit. Annual reformer regenerations, ongoing coker furnace piggings, and catalyst changes on the kerosene hydrotreater and one of the diesel hydrotreaters are also scheduled for 2011.
The Cheyenne Refinery also had a light turnaround year in 2010 as we deferred 2010 scheduled turnarounds associated with the fluid catalytic cracking unit (“FCCU”), alkylation unit, butamer unit and scanfiner into early 2011. The 2010 activity involved two reformer regenerations and a diesel hydrotreater catalyst change. The crude unit was shut down for repairs for 28 days following a fire in late July 2010. The Cheyenne Refinery will have significant turnaround activity in 2011 as we complete the turnarounds on the FCCU, alkylation unit, butamer unit, and scanfiner.
We sell refined products from our Cheyenne Refinery to a broad base of independent retailers, jobbers and major oil companies. Refined product prices are determined by local market conditions at distribution centers known as “terminal racks,” and prices at the terminal racks are posted daily by sellers. Our customers at the terminal rack typically supply their own truck transportation. In the year ended December 31, 2010, approximately 89% of the Cheyenne Refinery’s sales were made to its 25 largest customers compared to the year ended December 31, 2009, when approximately 90% of the Cheyenne Refinery’s sales were made to its 25 largest customers. Occasionally, volumes sold exceed the Refinery’s production, in which case we purchase product in the spot market as ne eded.
For the year ended December 31, 2010, Shell was the El Dorado Refinery’s largest customer, and our only customer which represented more than 10% of our total consolidated sales. For 2010, sales to Shell represented approximately 51% of the El Dorado Refinery’s total sales and 39% of our total consolidated sales. Under the offtake agreement, Shell purchases gasoline, diesel and jet fuel produced by the El Dorado Refinery at market-based prices through December 2014. In aggregate during 2010, we retained and marketed 60,000 bpd of the Refinery’s gasoline and diesel production while the remaining production was sold to Shell. Upon expiration of the offtake agreement, we intend to sell the gasoline and diesel produced by the El Dorado Refinery in the same general markets serv ed by Shell, as previously described.
The Suncor refinery located in Denver has lower product transportation costs to serve the Denver market than we do. However, the Cheyenne Refinery has lower crude oil transportation costs because of its proximity to the Guernsey, Wyoming hub, the major crude oil pipeline hub in the Rocky Mountain region. Moreover, unlike Sinclair and Suncor, we only sell our products to the wholesale market. We believe that our commitment to the wholesale market gives us certain marketing advantages over our principal competitors in the Eastern Slope area, all of which also have retail outlets, because we do not compete directly with independent retailers of gasoline and diesel.
We purchase crude oil from numerous suppliers, including major oil companies, marketing companies and large and small independent producers, under arrangements which contain market-responsive pricing provisions. Most of these arrangements are subject to cancellation by either party or have terms that are not in excess of one year and are subject to periodic renegotiation. We intend to continue purchasing crude oil from a variety of suppliers and typically under short-term commitments. In the event we become unable to purchase crude oil from any one of these sources, we believe that adequate alternative supplies of crude oil would be available. Crude oil charges are the quantity of crude oil and other feedstock processed through Refinery units.
We place significant emphasis on working and operating our plants safely. We are committed as a company to provide a safe workplace and have a culture and knowledge base that facilitates safe operation of our Refineries. As an employer, we are subject to the requirements of the federal Occupational Safety and Health Act (“OSHA”) and comparable state occupational safety statutes.
The Cheyenne Refinery’s employee OSHA recordable incident rate in 2010 was 2.9, which was an increase over the 2009 recordable rate of 2.0 and remains higher than the latest reported U.S. refining industry average of 1.0 as compiled by the United States Department of Labor. Although the overall rate was high in 2010, we realized a significant reduction of recordable injuries in the second half of 2010, with a July through December 2010 recordable rate of 1.3. We believe that our efforts have resulted in sustained improvement. The Cheyenne 2010 contractor recordable rate was 2.1, which represents one contractor injury.
The El Dorado Refinery sustained good safety performance with a 2010 recordable incident rate of 0.9, up slightly from the 2009 recordable rate of 0.6, and slightly better than the refining industry average of 1.0. Management and employees at the El Dorado Refinery remain committed to programs, processes and behaviors that drive safety excellence. A key initiative for the El Dorado Refinery during 2010 was to continue to facilitate an improvement in the safety performance of its contractors. This focus resulted in the contractor recordable rate at the El Dorado Refinery improving to 0.9, a solid reduction from the 2009 contractor recordable injury rate of 1.4.
During 2011, we will continue with the safety processes and initiatives that have proven to promote and sustain continued safety improvement in our Refineries. These efforts include programs in both areas of occupational and process safety and are comprehensive across all areas of the Refineries. Behavior-based safety programs have been in place at both Refineries for many years, and continue to evolve in response to our performance. Process safety became a more focused aspect of our safety management systems four years ago, with dedicated process safety departments at both Refineries. Our employees and management continue to dedicate their efforts to a balanced safety program that combines individual behavioral elements and risk-based process safety elements in a safety-coaching environment wi th structured, management-driven programs to improve the safety of our facilities. Our objective is to provide a safe working environment for employees and contractors and continue educating them about how to work safely. Encouraging all employees and contractors to contribute toward improving safety performance through personal involvement in safety-related activities is an industry-proven method of reducing injuries.
At December 31, 2010, we employed 811 full-time employees: 96 in the Houston and Denver offices, 276 at the Cheyenne Refinery, and 439 at the El Dorado Refinery. The Cheyenne Refinery employees included 97 administrative and technical personnel and 179 union members. The El Dorado Refinery employees included 149 administrative and technical personnel and 290 union members. The union members at our El Dorado Refinery are represented by the United Steel, Paper and Forestry, Rubber, Manufacturing, Energy, Allied Industrial and Service Workers International Union (“USW”). The union members at our Cheyenne Refinery are represented by six bargaining units, the largest being the USW and the others being various craft unions.
For our Cheyenne Refinery, the current contract between the Company, the USW, and its Local 11-0574 expires in March 2012. The current contract between the Company, the craft unions, and its various local chapters expires in July 2012.
At our El Dorado Refinery, the current contract between the Company, the USW, and its Local 241 expires in January 2012.
Crude oil prices and refining margins significantly impact our cash flow and may fluctuate substantially.
Our cash flow from operations is primarily dependent upon producing and selling refined products at margins that are high enough to cover our fixed and variable expenses. In recent years, crude oil costs and crack spreads (the difference between refined product sales prices and crude oil prices) have fluctuated substantially. Factors that may affect crude oil costs and refined product prices include:
Crude oil supply contracts are generally short-term contracts with price terms that change as market prices change. Our crude oil requirements are supplied from sources that include:
The price at which we can sell gasoline and other refined products is strongly influenced by the price of crude oil. Generally, an increase or decrease in the price of crude oil results in a corresponding increase or decrease in the price of gasoline and other refined products. However, if crude oil prices increase significantly, our operating margins would fall unless we could pass along these price increases to our customers.
Our profitability is affected by crude oil differentials, which may fluctuate substantially.
The light/heavy crude oil differentials that we report are the average differential between the benchmark West Texas Intermediate (“WTI”) crude oil priced on the New York Mercantile Exchange and the heavy crude oil priced as delivered to our Cheyenne Refinery or El Dorado Refinery, respectively. The WTI/WTS (sweet/sour) crude oil differential is the average differential between benchmark WTI crude oil priced on the New York Mercantile Exchange and West Texas sour crude oil priced at Midland, Texas. Our profitability at our Cheyenne Refinery is affected by the light/heavy crude oil differential, and our profitability at our El Dorado Refinery is affected by the WTI/WTS crude oil differential and the light/heavy crude oil differential. Traditionally, we have preferred to refine heavy sour crude oil at the Cheyenne Refinery and intermediate sour crude oil at the El Dorado Refinery because these crudes have provided a higher refining margin than light or sweet crude oil. Accordingly, the reduction of these crude oil differentials from 2008 to 2009 reduced our profitability, and an increase in these crude oil differentials during 2010 improved our profitability. The Cheyenne Refinery light/heavy crude oil differential averaged $11.79 per barrel in the year ended December 31, 2010, compared to $6.61 per barrel in the same period in 2009 and $17.15 per barrel in 2008. The El Dorado Refinery light/heavy crude oil differential averaged $8.60 per barrel in the year ended December 31, 2010 compared to $6.01 per barrel in 2009 and $17.85 per barrel in 2008. The WTI/WTS crude oil differential averaged $2.15 per barrel in the year ended December 31, 2010, compared to $1.65 per barrel in the same period in 2009 and $2.15 per barrel in 2008. Crude oil prices dropped dramatically during the latter part of 2008 and trended upward through 2009 and 2010, without a corresponding upward trend in crude oil differentials. This resulted in significant narrowing of the light/heavy crude oil differentials and WTI/WTS crude oil differentials from 2008 to 2009. In addition, the light/heavy crude oil differential has declined over the last three years due to the significant industry investment in equipment to process heavy/sour crude oil. The crude oil differentials could resume a negative trend, which would negatively impact on our profitability.
Our inventory risk management activities relating to hedging may generate substantial gains and losses.
In order to manage our price risk exposure on certain of our inventories, we from time to time enter into derivative contracts to make forward sales or purchases of crude oil and refined products. We may also use options or swaps to accomplish similar objectives. Our inventory risk management strategy is to hedge price risk on inventory positions in excess of our base level of operating inventories in order to minimize the impact of crude oil price fluctuations on our cash flows. This strategy generally produces losses when hedged crude oil or refined products increase in value and gains when hedged crude oil or refined products decrease in value. Consequently, our inventory hedging results may fluctuate significantly from one reporting period to the next depending on commodity price fluctuatio ns. For example, during the years ended December 31, 2010 and 2008 we incurred pre-tax hedging gains of $6.3 million and $146.5 million, respectively, which were recorded in “Other revenues” in the Consolidated Statements of Operations. During the year ended December 31, 2009, we incurred pre-tax hedging losses of $11.7 million, which was also recorded in “Other revenues” in the Consolidated Statements of Operations. To the extent we use progressively more Canadian crude oil at our Refineries, both our total crude oil inventories and the amount of hedged inventories are likely to increase in future periods. See “Quantitative and Qualitative Disclosures about Market Risk” in Part II, Item 7A.
On July 21, 2010, the Dodd-Frank Wall Street Reform and Consumer Protection Act was enacted into law. This financial reform legislation includes provisions that require over-the-counter derivative transactions to be executed through an exchange or centrally cleared. In addition, the legislation provides an exemption from mandatory clearing requirements based on regulations to be developed by the Commodity Futures Trading Commission (“CFTC”) and the Securities and Exchange Commission for transactions by non-financial institutions to hedge or mitigate commercial risk. At the same time, the legislation includes provisions under which the CFTC may impose collateral requirements for transactions, including those that are used to hedge commercial risk. Final rules on major provisions in t he legislation, like new margin requirements, will be established through rulemakings. Although we cannot predict the ultimate outcome of these rulemakings, new regulations in this area may result in increased costs and cash collateral requirements for the types of oil and gas derivative instruments we use to hedge and otherwise manage our financial risks related to volatility in oil and gas commodity prices.
Instability and volatility in the financial markets could have a negative impact on our business, financial condition, results of operations and cash flows.
The financial markets have recently experienced substantial and unprecedented volatility as a result of dislocations in the credit markets. Market disruptions in the United States and abroad may increase our cost of borrowing or adversely affect our ability to access sources of liquidity upon which we may rely to finance our operations and satisfy our obligations as they become due, and capital may not be available on terms that are reasonably acceptable to us, or at all. These disruptions may include turmoil in the financial services industry, including substantial uncertainty surrounding particular lending institutions with which we do business, reduction in available trade credit due to counterparties’ liquidity concerns, more strict lending requirements, unprecedented volatility in the markets where our ou tstanding securities trade, and general economic downturns in the areas where we do business. In addition, a general economic slowdown or the lack of liquidity may result in contractual counterparties with which we do business being unable to satisfy their obligations to us in a timely manner, or at all.
We maintain significant amounts of cash and cash equivalents at several financial institutions that are in excess of federally insured limits, which may result in losses if these financial institutions become financially troubled.
External factors beyond our control can cause fluctuations in demand for our products, prices and margins, which may negatively affect income and cash flow.
Among these factors is the demand for crude oil and refined products, which is largely driven by the conditions of local and worldwide economies as well as by weather patterns and the taxation of these products relative to other energy sources. Governmental regulations and policies, particularly in the areas of taxation, energy and the environment, also have a significant impact on our activities. Operating results can be affected by these industry factors and by competition in the particular geographic areas that we serve. The demand for crude oil and refined products can also be reduced due to a local or national recession or other adverse economic condition that results in lower spending by businesses and consumers on gasoline and diesel fuel, a shift by consumers to more fuel-efficient vehicles or alternative fu el vehicles (such as ethanol or wider adoption of gas/electric hybrid vehicles), or an increase in vehicle fuel economy, whether as a result of technological advances by manufacturers, legislation mandating or encouraging higher fuel economy or the use of alternative fuel.
In addition, our profitability depends largely on the spread between market prices for refined petroleum products and crude oil prices. This margin is continually changing and may fluctuate significantly from time to time. Crude oil and refined products are commodities whose price levels are determined by market forces beyond our control. Due to the seasonality of refined products markets and refinery maintenance schedules, results of operations for any particular quarter of a fiscal year are not necessarily indicative of results for the full year. In general, prices for refined products are influenced by the price of crude oil. Although an increase or decrease in the price of crude oil may result in a similar increase or decrease in prices for refined products, there may be a time l ag in the realization of the similar increase or decrease in prices for refined products. The effect of changes in crude oil prices on operating results therefore depends in part on how quickly refined product prices adjust to reflect these changes. A substantial or prolonged increase in crude oil prices without a corresponding increase in refined product prices, a substantial or prolonged decrease in refined product prices without a corresponding decrease in crude oil prices, or a substantial or prolonged decrease in demand for refined products could have a significant negative effect on our results of operations and cash flows. This potential negative impact on our income and cash flows from these external factors could result in an impairment of our property, plant and equipment or if significant enough the closure of one or both of our Refineries.
We are dependent on others to supply us with substantial quantities of raw materials.
Our business involves converting crude oil and other refinery charges into liquid fuels. We own no crude oil or natural gas reserves and depend on others to supply these feedstocks to our Refineries. We use large quantities of natural gas and electricity to provide heat and mechanical energy required by our processing units. Disruption to our supply of crude oil, natural gas or electricity, or the continued volatility in the costs thereof, could have a material adverse effect on our operations. In addition, our investment in inventory is affected by the general level of crude oil prices, and significant increases in crude oil prices could result in substantial working capital requirements to maintain inventory volumes.
Our operations could be subject to significant interruption, and our profitability could be impacted if either of our Refineries experienced a major accident or fire, was damaged by severe weather or other natural disaster, or was otherwise forced to curtail its operations or shut down. See Item 7 “Management’s Discussion and Analysis of Financial Condition and Results of Operations” and our Form 8-K filed on July 29, 2010, for more information on the fire at the Cheyenne Refinery. If a crude oil pipeline that supplies crude oil to our Refineries became inoperative, crude oil would have to be supplied to our Refineries through an alternative pipeline or from additional tank truck deliveries to the Refineries. Alternative supply arrangements could require additional capital expenditures, hurt our business and profitability and cause us to operate the affected Refinery at less than full capacity until pipeline access was restored or crude oil transportation was fully replaced. In addition, a major accident, fire or other event could damage our Refineries or the environment or cause personal injuries. If either of our Refineries experiences a major accident or fire or other event or an interruption in supply or operations, our business could be materially adversely affected if the damage or liability exceeds the amounts of business interruption, property, terrorism and other insurance that we maintain against these risks.
Our Refineries consist of many processing units, a number of which have been in operation for many years. One or more of the units may require additional unscheduled down time for unanticipated maintenance or repairs that are more frequent than our scheduled turnaround for such units. Scheduled and unscheduled maintenance could reduce our revenues during the period of time that our units are not operating.
We face substantial competition from other refining companies, and greater competition in the markets where we sell refined products could adversely affect our sales and profitability.
The refining industry is highly competitive. Many of our competitors are either large integrated oil companies or major independent refining companies, that because of their more diverse operations, larger refineries and stronger capitalization may be better positioned than we are to withstand volatile industry conditions, including shortages or excesses of crude oil or refined products or intense price competition at the wholesale level. Many of these competitors have financial and other resources substantially greater than ours.
We are not engaged in the petroleum exploration and production business and therefore do not produce any of our crude oil feedstocks. We do not have a retail business and therefore are dependent upon others for outlets for our refined products. Certain of our competitors, however, obtain a portion of their feedstocks from company-owned oil and gas production and also have retail outlets. Competitors that have their own crude oil production or extensive retail outlets, with brand-name recognition, are at times able to offset losses from refining operations with profits from producing or retailing operations, and may be better positioned to withstand periods of depressed refining margins or feedstock shortages. In addition, we compete with other industries, such as wind, solar and hydropower that provide alternative means to satisfy the energy and fuel requirements of our industrial, commercial and individual consumers. If we are unable to compete effectively with these competitors, both within and outside our industry, there could be a material adverse effect on our business, financial condition and results of operations.
Our operations involve environmental risks that may require us to make substantial capital expenditures to remain in compliance or that could give rise to material liabilities.
Our results of operations may be affected by increased costs of complying with the extensive environmental laws to which our business is subject and from any possible contamination of our facilities as a result of accidental spills, discharges or other releases of petroleum or hazardous substances.
Our operations are subject to extensive federal, state and local environmental and health and safety laws and regulations relating to the protection of the environment, including those governing the emission or discharge of pollutants into the air and water, product specifications and the generation, treatment, storage, transportation, disposal or remediation of solid and hazardous waste and materials. Environmental laws and regulations that affect the operations, processes and margins for our refined products are extensive and have become progressively more stringent. Additional legislation or regulatory requirements or administrative policies could be imposed with respect to our products or activities. Compliance with more stringent laws or regulations or more vigorous enforcement policies of the regula tory agencies could adversely affect our financial position and results of operations and could require us to make substantial expenditures. Any noncompliance with these laws and regulations could subject us to material administrative, civil or criminal penalties or other liabilities. For examples of existing and potential future regulations and their possible effects on us, please see “Environmental” in Note 13 in the “Notes to Consolidated Financial Statements.”
Our business is inherently subject to accidental spills, discharges or other releases of petroleum or hazardous substances. Past or future spills related to any of our operations, including our Refineries, pipelines or product terminals, could give rise to liability (including potential cleanup responsibility) to governmental entities or private parties under federal, state or local environmental laws, as well as under common law. This could involve contamination associated with facilities that we currently own or operate, facilities that we formerly owned or operated and facilities to which we sent wastes or by-product for treatment or disposal and other contamination. Accidental discharges could occur in the future, future action may be taken in connection with past discharges, governmental agencies may assess pen alties against us in connection with past or future contamination and third parties may assert claims against us for damages allegedly arising out of any past or future contamination. The potential penalties and clean-up costs for past or future releases or spills, the failure of prior owners of our facilities to complete their clean-up obligations, the liability to third parties for damage to their property, or the need to address newly-discovered information or conditions that may require a response could be significant, and the payment of these amounts could have a material adverse effect on our business, financial condition and results of operations.
Climate change legislation or regulations restricting emissions of “greenhouse gases” could result in increased operating costs and reduced demand for the refined petroleum products we produce.
In December 2009, the U.S. Environmental Protection Agency, or “EPA”, published its findings that emissions of carbon dioxide, methane and other greenhouse gases, or “GHGs,” present an endangerment to public health and the environment because emissions of such gases are, according to the EPA, contributing to the warming of the earth’s atmosphere and other climate changes. These findings allow the EPA to adopt and implement regulations that would restrict emissions of GHGs under existing provisions of the federal Clean Air Act. In response to the endangerment finding, the EPA adopted regulations that require a reduction in emissions of GHGs from motor vehicles and also could trigger permit review for GHG emission from certain stationary sources. The EPA has determined that the motor vehicle GHG emission standards triggered Clean Air Act construction and operating permit requirements for stationary sources beginning on January 2, 2011 when the motor vehicle standards took effect. In June 2010, the EPA published its final rule to address the permitting of GHG emissions from stationary sources under the Prevention of Significant Deterioration, or “PSD,” and Title V permitting programs. This rule “tailors” these permitting programs to apply to certain stationary sources of GHG emissions in a multi-step process, with the largest sources first subject to permitting. Those facilities required to obtain PSD permits for their GHG emissions also will be required to reduce those emissions according to “best available control technology” standards for GHG that have yet to be developed. In October 2009, the EPA also published a final rule requiring the reporting of GHG emissions from specified large GHG emission s ources in the United States, including refineries, on an annual basis, beginning in 2011 for emissions occurring after January 1, 2010. We are currently monitoring GHG emissions in anticipation of preparing and submitting reports on these emissions to the EPA in 2011 and 2012. Legislation to delay or reduce the EPA’s ability to proceed with the regulation of GHGs continues to be considered by the U.S. Congress.
The adoption of any legislation or regulations that requires reporting of GHGs or otherwise limits emission of GHGs from our equipment and operations could require us to incur costs to monitor and report on GHG emissions or reduce emissions of GHGs associated with our operations, and such requirements also could adversely affect demand for the refined petroleum products we produce.
Our operations are subject to various laws and regulations relating to occupational health and safety, which could give rise to increased costs and material liabilities.
The nature of our business may result from time to time in industrial accidents. Our operations are subject to various laws and regulations relating to occupational health and safety. Continued efforts to comply with applicable health and safety laws and regulations, or a finding of non-compliance with current regulations, could result in additional capital expenditures or operating expenses, as well as fines and penalties.
We could incur substantial costs or disruptions in our business if we cannot obtain or maintain necessary permits and authorizations.
Our operations require numerous permits and authorizations under various laws and regulations, including environmental and health and safety laws and regulations. These authorizations and permits are subject to revocation, renewal or modification and can require operational changes, which may involve significant costs, to limit impacts or potential impacts on the environment and/or health and safety. A violation of these authorization or permit conditions or other legal or regulatory requirements could result in substantial fines, criminal sanctions, permit revocations, injunctions and/or refinery shutdowns. In addition, major modifications of our operations could require changes to our existing permits or expensive upgrades to our existing pollution control equipment, which could have a material adverse effect on our business, financial condition or results of operations.
Hurricanes along the Gulf Coast could disrupt our supply of crude oil and our ability to complete capital investment projects in a timely manner.
In 2008 and 2005, tropical hurricanes and related storm activity, such as windstorms, storm surges, floods and tornadoes, caused extensive and catastrophic physical damage in and to coastal and inland areas located in the Gulf Coast region of the United States (parts of Texas, Louisiana, Mississippi and Alabama) and certain other southeastern parts of the United States. Some of the materials we use for our capital projects are fabricated at facilities located along the Gulf Coast. Should other storms of this nature occur in the future, it is possible that the storms and their collateral effects could result in delays or cost increases for our capital investment projects.
In addition, supplies of crude oil to our El Dorado Refinery are sometimes shipped from Gulf Coast production or terminalling facilities. This crude oil supply source could be potentially threatened in the event of future catastrophic damage to such facilities.
We may have labor relations difficulties with some of our employees represented by unions.
Approximately 58 percent of our employees were covered by collective bargaining agreements at December 31, 2010. Our El Dorado Refinery union contract expires in January 2012 and our Cheyenne Refinery union contracts expire March and July 2012, and there is no assurance that we will be able to enter into new contracts on terms acceptable to us or at all. A failure to do so may increase our costs or result in an interruption of our business. See Item 1 “Business-Employees.” In addition, employees may conduct a strike at some time in the future, which may adversely affect our operations.
Terrorist attacks and threats or actual war may negatively impact our business.
Terrorist attacks in the United States and the conflicts in the Middle East, as well as events occurring in response to or in connection with them, including future terrorist attacks against U.S. targets, rumors or threats of war, actual conflicts involving the United States or its allies, or military or trade disruptions affecting our suppliers or our customers, could adversely impact our operations. In addition, any terrorist attack could have an adverse impact on energy prices, including prices for our crude oil and refined products, and an adverse impact on the margins from our refining and marketing operations. As a result, there could be delays or losses in the delivery of supplies and raw materials to us, decreased sales of our products and extensions of time for payment of accounts receivable from our custom ers.
We may not be able to make dividend payments in the future.
Our ability to pay dividends on our common stock is dependent on our operating results and cash flows, which may be subject to certain economic, financial, competitive and other factors that are beyond our control. Restrictions in our credit agreement and senior notes indentures restrict, and similar restrictions in future debt agreements may restrict, our ability to make dividend payments if we do not meet certain financial performance measures. For example, during 2010, we were unable to declare dividends because of our inability to pass the incurrence of additional indebtedness test in our senior notes indentures. We may not be able to pay dividends in the future, or we may change the amount of our dividends or the frequency with which they are paid.
None.
We own an approximately 255 acre site on which the Cheyenne Refinery is located in Cheyenne, Wyoming and an approximately 1,000 acre site on which the El Dorado Refinery is located in El Dorado, Kansas. We lease the approximately two acre site in Henderson, Colorado on which our products and blending terminal is located. We own an approximately 17 acre site on which our products terminal in Sidney, Nebraska is located. We also own a 31 acre site on which a products terminal was previously located in North Platte, Nebraska.
We lease approximately 6,500 square feet of office space in Houston, Texas for our corporate headquarters under a lease expiring in October 2014. We also lease approximately 28,000 square feet of office space in Denver, Colorado under a lease expiring in August 2015 for our refining, marketing and raw material supply operations.
See “Litigation” and “Environmental” in Note 13 in the “Notes to Consolidated Financial Statements.”
We file reports with the SEC, including annual reports on Form 10-K, quarterly reports on Form 10-Q and other reports from time to time. The public may read and copy any materials that we file with the SEC at the SEC’s Public Reference Room at 100 F Street, N.E., Room 1580, Washington, D.C., 20549. The public may obtain information on the operation of the Public Reference Room by calling the SEC at 1-800-SEC-0330. We are an electronic filer, and the SEC’s Internet site at http://www.sec.gov contains the reports, proxy and information statements, and other information filed electronically.
As required by Section 402 of the Sarbanes-Oxley Act of 2002, we have adopted a code of ethics that applies to our chief executive officer, chief financial officer and principal accounting officer. This code of ethics is posted on our web site. Our web site address is: http://www.frontieroil.com. We make our web site content available for informational purposes only. It should not be relied upon for investment purposes, nor is it incorporated by reference in this Form 10-K. We make available on this web site under “Investor Relations,” free of charge, our annual reports on Form 10-K, quarterly reports on Form 10-Q, current reports on Form 8-K and amendments to those reports as soon as reasonably practicable after we electronically file those materials with, or furnish tho se materials to, the SEC.
Our common stock is listed on the New York Stock Exchange under the symbol FTO. The quarterly high and low sales as reported on the New York Stock Exchange for 2010 and 2009 are shown in the following table:
The approximate number of holders of record for our common stock as of February 18, 2011 was 837. The quarterly cash dividend was $0.05 per share for the quarters ended June 30, 2007 through March 31, 2008. The quarterly cash dividend was $0.06 per share for the quarters ended June 30, 2008 through December 31, 2009. Our 6.875% Senior Notes, our 8.5% Senior Notes and our Revolving Credit Facility may restrict dividend payments based on the covenants related to interest coverage and restricted payments. See Notes 6 and 8 in the “Notes to Consolidated Financial Statements.” During the year ended December 31, 2010, we were contractually unable to declare dividends under the restricted payments provision of our senior notes indentures. However, due to our positive results of operations for the year ended December 31, 2010, we are no longer under these contractual restrictions. On February 21, 2011, our Board of Directors declared a special dividend of $0.28 per share and a quarterly dividend of $0.06 per share, payable on March 21, 2011 to shareholders of record on March 7, 2011.
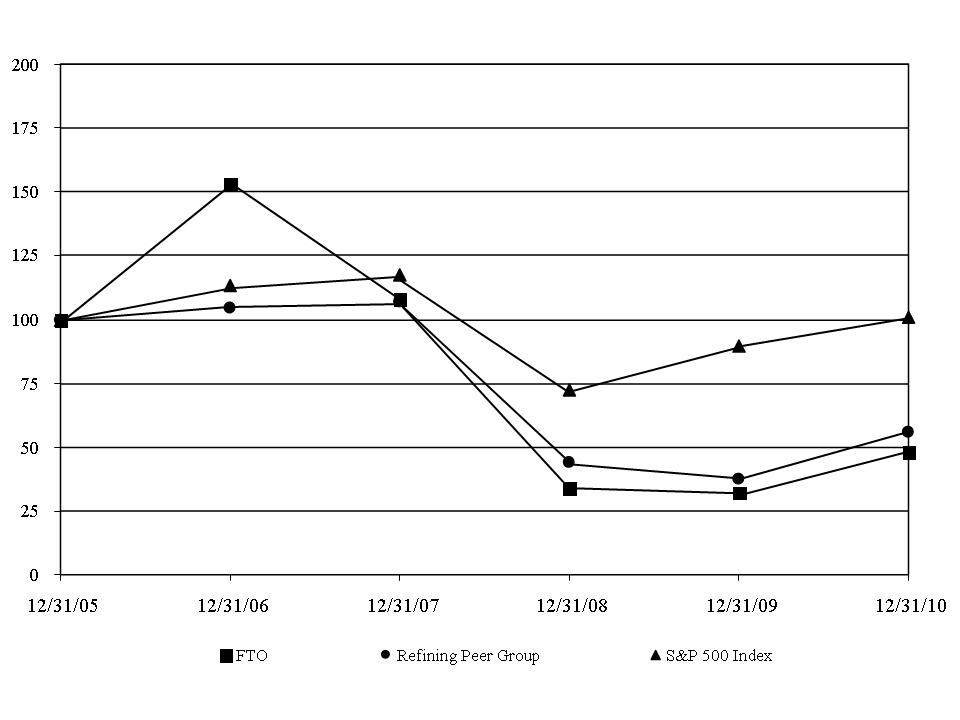
The following graph indicates the performance of our common stock against the S&P 500 Index and against a refining peer group which is comprised of Sunoco Inc., Holly Corporation, Valero Energy Corporation and Tesoro Corporation. The following information in this Item 5 of this Annual Report on Form 10-K is not deemed to be “soliciting material” or to be “filed” with the SEC or subject to Regulation 14A or 14C under the Securities Exchange Act of 1934 or to the liabilities of Section 18 of the Securities Exchange Act of 1934, and will not be deemed to be incorporated by reference into any filing under the Securities Act of 1933 or the Securities Exchange Act of 1934, except to the extent we specifically incorporate it by reference into such a filing.
Frontier operates Refineries in Cheyenne, Wyoming and El Dorado, Kansas as previously discussed in Part I, Item 1 of this Form 10-K. We focus our marketing efforts in the Rocky Mountain and Plains States regions of the United States. We purchase crude oil to be refined and market refined petroleum products, including various grades of gasoline, diesel, jet fuel, asphalt and other by-products.
To assist in understanding our operating results, please refer to the operating data at the end of this analysis which provides key operating information for our Refineries. Refinery operating data is also included in our quarterly reports on Form 10-Q and on our web site at http://www.frontieroil.com. We make our web site content available for informational purposes only. It should not be relied upon for investment purposes, nor is it incorporated by reference in this Form 10-K.
Our Refineries have a total annual average crude oil capacity of approximately 187,000 bpd. The four significant indicators of our profitability, which are reflected and defined in the operating data at the end of this analysis, are the gasoline crack spread, the diesel crack spread, the light/heavy crude oil differential and the WTI/WTS crude oil differential. Other significant factors that influence our financial results are refinery utilization, crude oil price trends, asphalt and by-product margins and refinery operating expenses (including natural gas and maintenance). We typically do not use derivative instruments to offset price risk on our base level of operating inventories. See “Price Risk Management Activities” under Item 7A for a discussion of our utilization of futures trading.
In late 2009, we began taking actions to improve the profitability at our Cheyenne Refinery with the objective of improving profitability at the Refinery by $3 to $4 per barrel (compared to a historical average) by the end of 2011. These actions include a combination of operating expense reductions (including maintenance, personnel, consulting, legal, environmental and water treatment chemicals) and projects aimed at energy efficiency, yield improvements and enhancing the types of crude oil that can be processed at the Refinery. During 2010, in response to an increase in locally available light sweet crudes we have processed a higher percentage of light crude oils and reduced controllable Cheyenne Refinery operating expenses. We are proceeding with a liquefied petroleum gas (“LPG”) recovery ca pital project that will recover significant quantities of saleable propane and butane and other LPGs. We believe that we are on course to meet our objective; however, future profitability of the Cheyenne Refinery cannot be guaranteed and is dependent on factors outside our control, including the price of crude oil.
We had net income for the year ended December 31, 2010 of $37.8 million, or $0.36 per diluted share, compared to a net loss of $83.8 million, or $0.81 per diluted share, for the same period in 2009. Our operating income of $83.8 million for the year ended December 31, 2010 reflected an increase of $189.2 million from the $105.4 million operating loss for the comparable period in 2009. The increase in our results for the year ended December 31, 2010, compared to our net loss for 2009, was due to the improvement of certain profitability indicators during the year ended December 31, 2010, including the average diesel crack spread ($12.59 per barrel in 2010 compared to $8.25 per barrel in 2009), the average gasoline crack spread ($8.18 per barrel in 2010 compared to $7.60 per barrel in 2009), and increased gasoline and diesel yields. During the third quarter of 2010, we experienced a fire in the crude unit at the Cheyenne Refinery. The crude unit was down for 28 days with repair costs of approximately $6.4 million, during which time we also spent approximately $1.8 million on accelerated maintenance.
The Cheyenne Refinery raw material, freight and other costs of $78.10 per sales barrel for the year ended December 31, 2010 increased from $62.17 per sales barrel in the same period in 2009 due to higher average crude oil prices, partially offset by decreased overall crude oil charges, a higher average laid-in crude oil differential and lower purchased products costs. Average crude oil charges of 40,882 bpd for the year ended December 31, 2010 were lower than the 41,475 bpd in 2009 because of the unplanned downtime in the third quarter of 2010 due to the crude unit fire. The heavy crude oil utilization rate at the Cheyenne Refinery expressed as a percentage of the total crude oil charge decreased to 39% in the year ended December 31, 2010, from 50% in 2009. Despite the improvement in the light/heavy crude oil differential, market conditions during most of 2010 favored higher light sweet runs due in large part to the substantial growth of domestic light sweet crude oil supply from areas like the Bakken shale. The average laid-in crude oil differential for the Cheyenne Refinery increased to $6.89 per barrel for the year ended December 31, 2010, due to the widening of the light/heavy crude oil differential, compared to $4.28 per barrel in the same period in 2009. The light/heavy crude oil differential for the Cheyenne Refinery averaged $11.79 per barrel in the year ended December 31, 2010 compared to $6.61 per barrel in 2009.
The El Dorado Refinery raw material, freight and other costs of $77.85 per sales barrel for the year ended December 31, 2010 increased from $60.25 per sales barrel in the same period in 2009 due to higher average crude oil prices, increased overall crude oil charges, and a lower average laid-in crude oil differential. Average crude oil charges were 128,965 bpd for the year ended December 31, 2010, compared to 112,312 bpd in 2009 because of better crude unit utilization and no significant turnarounds. The average laid-in crude oil differential decreased to $2.61 per barrel for the year ended December 31, 2010 compared to $3.31 per barrel in the same period in 2009, despite improved light/heavy and WTI/WTS crude oil differentials, due to a stronger contango market in 2009. We realized a light/heavy crude oi l differential of $8.60 per barrel during 2010 compared to $6.01 per barrel in 2009. For the year ended December 31, 2010, the heavy crude oil utilization rate at our El Dorado Refinery expressed as a percentage of the total crude oil charge was approximately 18%, compared to 15% in 2009. The WTI/WTS crude oil differential increased from an average of $1.65 per barrel in the year ended December 31, 2009 to an average of $2.15 per barrel in 2010.
The Cheyenne Refinery operating expenses, excluding depreciation, were $100.0 million in the year ended December 31, 2010 compared to $109.1 million in 2009. The primary areas of decreased costs were: lower salaries and benefits ($3.3 million) and environmental costs ($11.0 million). The environmental cost decrease is primarily due to a $6.8 million EPA proposed penalty accrual recorded in 2009 and upon settlement in 2010, a reversal of $5.8 million of the penalty accrual partially offset by $1.9 million of pond cleanup and closure costs related to the EPA complaint. These decreased costs were partially offset by increased natural gas costs ($2.5 million due to higher prices and volumes), and increased maintenance costs ($6.4 million attributable to repairs for the crude unit fire in July 2010).The El Dorado Refinery operating expenses, excluding depreciation, were $181.8 million in the year ended December 31, 2010, decreasing from $186.4 million for the year ended December 31, 2009. Cost decreases were realized in lower maintenance costs ($7.0 million), lower environmental expenses ($1.6 million), reduced consulting and legal expenses ($1.1 million), reduced insurance costs ($954,000) and lower additive and chemicals costs ($824,000). The maintenance costs for the year ended December 31, 2009 included $5.8 million for demolition costs related to several capital projects and $1.2 million for repair work related to a spring 2009 storm. Primary areas of increased costs and variance amounts for the 2010 period compared to the 2009 period were: natural gas costs ($3.3 million due to higher prices an d significantly higher volumes), increased electricity costs ($2.0 million due to higher prices and volumes) and higher salaries and benefits ($1.9 million).
Selling and general expenses. Selling and general expenses, excluding depreciation, decreased $11.5 million, or 20%, from $58.7 million for the year ended December 31, 2009 to $47.2 million for the year ended December 31, 2010, due to a decrease in salaries and benefits ($4.5 million), a decrease in stock-based compensation expense ($4.4 million), and $5.3 million net proceeds received in 2010 from insurance related to prior years’ litigation expenses. These decreases were partially offset by higher aircraft maintenance costs ($2.0 million, primarily related to a major engine overhaul), and a $646,000 increase in professional, consulting and other outside services primarily related to litigation costs which resulted in the $5.3 milli on insurance recovery.
Depreciation, amortization and accretion. Depreciation, amortization and accretion includes depreciation on property, plant and equipment, amortization of deferred turnaround and catalyst costs and accretion expenses for asset retirement obligation liabilities. For the year ended December 31, 2010, depreciation, amortization and accretion increased $4.7 million, or 5%, to $104.8 million from $100.1 million in 2009.
Depreciation on property, plant and equipment for the year ended December 31, 2010 increased $7.8 million (including $6.7 million for the El Dorado Refinery and $914,000 for the Cheyenne Refinery) to $81.5 million from $73.7 million in 2009 because of increased capital investments in our Refineries, including the El Dorado Refinery’s catalytic cracker regenerator emission control and reliability projects placed into service in the fourth quarter of 2009 and the gasoil hydrotreater revamp placed into service in late 2009 and the final phase in December 2010.
Deferred turnaround and catalyst amortization for the year ended December 31, 2010 decreased a net $2.0 million (including a $3.6 million increase for the El Dorado Refinery offset by a $5.6 million decrease for the Cheyenne Refinery) to $23.8 million from $25.8 million in 2009. The decrease for the Cheyenne Refinery was primarily due to a deferral to 2011 of certain 2010 turnarounds and catalyst change-outs. The increase for the El Dorado Refinery was due to higher turnaround costs which were incurred in late 2009.
Accretion expense for the year ended December 31, 2010 decreased $1.2 million (including $969,000 for the Cheyenne Refinery and $191,000 for the El Dorado Refinery) to a negative $776,000 compared to positive $376,000 in 2009 due to lowering previous estimates during 2010 for asset retirement obligations.
Interest expense and other financing costs. Interest expense and other financing costs of $32.6 million for the year ended December 31, 2010 increased $4.4 million, or 16%, from $28.2 million in 2009. The increase in interest expense related to a $3.4 million reduction in the amount of capitalized interest, a $1.6 million increase in facility fees on our revolving credit facility, $872,000 increased interest on the Master Crude Oil Purchase and Sale Contracts with Utexam and BNP (“Crude Oil Purchase Arrangements”) (see “Leases and Other Commitments” in Note 13 in the “Notes to Consolidated Financial Statements”), and a $750,000 loss on the early extinguishment of our 6.625% Senior Notes. The increased expense relat ed to the Crude Oil Purchase Arrangements resulted from higher utilization of these arrangements during 2010 than during 2009 due to our increased Canadian crude oil purchases. Capitalized interest for the year ended December 31, 2010 was $1.9 million compared to $5.3 million in 2009. These increases were partially offset by our interest rate swaps which reduced our interest expense by a net $2.0 million from 2009, and a decrease of $850,000 due lower interest expense on income tax contingencies. Average debt outstanding (excluding amounts reflected as accounts payable under the Crude Oil Purchase Arrangements) increased to $353.5 million during the year ended December 31, 2010 from $350.0 million for the same period in 2009.
Interest and investment income. Interest and investment income during the year ended December 31, 2010 was $2.3 million and was an increase of $66,000, or 3%, compared to the year ended December 31, 2009. During the year ended December 31, 2010, we had $884,000 more interest income on federal and state tax refunds than in the comparable period of 2009. This was offset by $737,000 less interest income on our cash investments and other miscellaneous interest, resulting from decreased interest rates on invested cash. We also had $82,000 less investment income in 2010 compared to 2009.
Provision for income taxes. The provision for income taxes for the year ended December 31, 2010 was $15.8 million on pretax income of $53.6 million (or 29.5%) compared to a $47.5 million benefit on a pretax loss of $131.3 million (or 36.2%) in 2009. The change in the effective tax rate is due to a decrease of 10.6% in the state effective tax rate, partially offset by an increase in the federal effective tax rate of 3.9% for the year ended December 31, 2010 compared to 2009. The state effective tax rate of a negative 3.2% on pretax income for the year ended December 31, 2010 includes a 6.8% decrease from the benefit of Kansas income tax credits and the reversal of state income tax contingencies. The state effective tax benefit of 7.4% on a pretax loss for the year ended December 31, 2009 included a 3.4% benefit from Kansas income tax credits. The federal effective tax rate of 32.7% on pretax income for the year ended December 31, 2010 includes a 2.1% reduction from the Section 199 production activities deduction, a 1.3% reduction from permanent book-tax differences and a 1.1% increase from the state tax benefit. The federal effective tax benefit of 28.8% on a pretax loss for the year ended December 31, 2009 included reductions to the effective federal rate of 2.6% from the state income tax benefit, and 2.9% from permanent book-tax differences. The Tax Relief, Unemployment Insurance Reauthorization and Job Creation Act of 2010, the American Recovery and Investment Act of 2009, the Housing and Economic Recovery Act of 2008 and the Energy Policy Act of 2005 which added Section 179C to the Internal Revenue Code, all provided accelerated deductions for our capital projects placed into service in both years. These ac celerated deductions, while not impacting the effective tax rate, were major factors in reducing our 2010 taxable income and contributing to our 2009 taxable loss. Our 2010 and 2009 income tax provisions included the benefit from $2.9 million and $4.5 million, respectively, of Kansas income tax credits for expansion projects at our El Dorado Refinery. See “Income Taxes” in Note 9 in the “Notes to Consolidated Financial Statements” for more information on our income taxes and detailed information on our deferred tax assets.
2009 Compared with 2008
Overview of Results
We had a net loss for the year ended December 31, 2009, of $83.8 million, or $0.81 per diluted share, compared to net income of $226.1 million, or $2.18 per diluted share, for the same period in 2008. Our operating loss of $105.4 million for the year ended December 31, 2009 reflected a decrease of $456.8 million from the $351.4 million operating income for the comparable period in 2008. The decrease in our results to a net loss for the year ended December 31, 2009, compared to our net income for 2008, was due to the decline of the average diesel crack spread ($8.25 per barrel in 2009 compared to $24.59 per barrel in 2008), and the crude oil differentials. The light/heavy crude oil differential decreased from $17.38 per barrel for the year ended December 31, 2008 to $6.34 per barrel for the comparable peri od of 2009. The WTI/WTS crude oil differential decreased from $3.92 per barrel for the year ended December 31, 2008 to $1.65 per barrel for the comparable period of 2009. Our results did benefit slightly from a higher average gasoline crack spread during the year ended December 31, 2009 ($7.60 per barrel) than in 2008 ($4.75 per barrel).
Product yields and sales volumes were higher during the year ended December 31, 2009 compared to 2008 because of a 25,000 bpd increase in capacity that resulted from the crude vacuum tower project and the major turnaround work completed at the El Dorado Refinery during the second quarter of 2008. In addition, during the first quarter of 2009, we received the benefit, primarily at our El Dorado Refinery, from purchasing discounted WTI crude oil versus a NYMEX WTI benchmark price because of the excess supply of crude oil at Cushing, Oklahoma. This crude benefit moderated during the remainder of 2009.
Specific Variances
Refined product revenues. Refined product revenues decreased $2.10 billion, or 33%, from $6.34 billion to $4.24 billion for the year ended December 31, 2009 compared to 2008. This decrease was due to a decrease in average product sales prices ($37.83 lower per sales barrel) partially offset by higher product sales volumes in 2009 (8,900 more bpd). Sales prices decreased primarily because of lower crude oil prices, and correspondingly lower refined product prices, during 2009 compared to 2008.
Manufactured product yields. Yields increased 9,314 bpd at the El Dorado Refinery (as described above) and decreased 1,940 bpd at the Cheyenne Refinery for the year ended December 31, 2009 compared to 2008.
Other revenues. Other revenues decreased $162.4 million to a $5.8 million loss for the year ended December 31, 2009 compared to a $156.6 million gain for 2008, the primary source of which was $11.7 million in net realized and unrealized losses from derivative contracts to hedge in-transit crude oil and excess inventories during the year ended December 31, 2009 compared to $146.5 million in net realized and unrealized gains from derivative contracts to hedge in-transit crude oil and excess inventories in 2008. See “Price Risk Management Activities” under Item 7A and Note 14 in the “Notes to Consolidated Financial Statements” for a discussion of our utilization of commodity derivative contracts. We had gasoline sulfur credit sal es of $1.9 million in 2009 compared to $4.6 million in 2008 and $4.6 million of ethanol RIN sales in 2009 compared to $4.5 million in 2008.
Raw material, freight and other costs. Raw material, freight and other costs decreased by $1.83 billion, or 32%, during the year ended December 31, 2009, from $5.72 billion in 2008 to $3.89 billion in 2009. The decrease in raw material, freight and other costs was due to lower average crude oil prices and decreased purchased products, partially offset by increased overall crude oil charges and lower crude oil differentials during the year 2009 compared to 2008. The average NYMEX WTI priced on the New York Mercantile Exchange was $61.82 per barrel for the year ended December 31, 2009 compared to $99.75 per barrel for the year ended December 31, 2008. Average crude oil charges were 153,786 bpd for the year ended December 31, 2009 compared to 142,938 bpd in 2008.
The Cheyenne Refinery raw material, freight and other costs of $62.17 per sales barrel for the year ended December 31, 2009 decreased from $89.29 per sales barrel in the same period in 2008 due to lower average crude oil prices and lower purchased products costs, partially offset by lower light/heavy crude oil differentials and decreased overall crude oil charges. Average crude oil charges of 41,475 bpd for the year ended December 31, 2009 were lower than the 43,590 bpd in 2008 because of the intentional reduction in charges during part of the year due to the low refined product margins. The heavy crude oil utilization rate at the Cheyenne Refinery expressed as a percentage of the total crude oil charge decreased to 50% in the year ended December 31, 2009, from 76% in 2008 because we chose to process more light crud e oils due to the narrowing of the light/heavy crude differential in 2009 (and thus the economic benefit of heavy crude oil). The light/heavy crude oil differential for the Cheyenne Refinery averaged $6.61 per barrel in the year ended December 31, 2009 compared to $17.15 per barrel in 2008.
The El Dorado Refinery raw material, freight and other costs of $60.25 per sales barrel for the year ended December 31, 2009 decreased from $95.84 per sales barrel in the same period in 2008 due to lower average crude oil prices, partially offset by increased overall crude oil charges and lower crude oil differentials. Average crude oil charges were 112,312 bpd for the year ended December 31, 2009, compared to 99,347 bpd in 2008. The increase in average crude oil charges was due to the 25,000 bpd increase in capacity that resulted from the crude vacuum tower project and the major turnaround work completed at the El Dorado Refinery in the second quarter of 2008. We realized a light/heavy crude oil differential of $6.01 per barrel during 2009 compared to $17.85 per barrel in 2008. For the ye ar ended December 31, 2009, the heavy crude oil utilization rate at our El Dorado Refinery expressed as a percentage of the total crude oil charge was approximately 15%, compared to 17% in 2008. The WTI/WTS crude oil differential decreased from an average of $3.92 per barrel in the year ended December 31, 2008 to an average of $1.65 per barrel in 2009.
Refinery operating expenses. Refinery operating expenses, excluding depreciation, decreased $2.9 million, to $295.5 million in the year ended December 31, 2009 from $298.4 million in 2008.
The Cheyenne Refinery operating expenses, excluding depreciation, were $109.1 million in the year ended December 31, 2009 compared to $105.4 million in 2008. The increased expenses for 2009 compared to 2008 included: increased environmental costs ($7.7 million, primarily due to an accrual for a proposed EPA penalty), increased salaries and benefits ($4.6 million, including $2.7 million of increased bonus expense), increased electricity costs ($852,000) and increased water costs ($859,000). These increases were partially offset by decreased maintenance costs ($5.4 million) as 2008 maintenance costs included various unplanned tank, coker repairs and outages, decreased natural gas costs ($2.5 million due to decreased prices partially offset by higher volumes), and decreased consulting and legal expenses ($1.2 million).
The El Dorado Refinery operating expenses, excluding depreciation, were $186.4 million in the year ended December 31, 2009, decreasing from $193.0 million for the year ended December 31, 2008. Natural gas costs decreased by $17.5 million due to lower volumes and prices, partially offset by increased costs in several areas. The primary areas of increased costs for the 2009 period compared to the 2008 period were: increased salaries and benefits ($5.5 million, including $2.0 million of increased bonus expense), increased electricity costs ($2.8 million), increased environmental costs ($1.5 million) and higher property taxes ($1.1 million).
Selling and general expenses. Selling and general expenses, excluding depreciation, increased $14.5 million, or 33%, from $44.2 million for the year ended December 31, 2008 to $58.7 million for the year ended December 31, 2009, primarily due to a $14.0 million increase in salaries and benefits (which included a $9.8 million increase in bonus expense and an increase in deferred compensation expense of $2.2 million).
Depreciation, amortization and accretion. Depreciation, amortization and accretion increased $11.4 million or 13%, to $100.1 million for the year ended December 31, 2009 from $88.7 million in 2008.
Depreciation on property, plant and equipment for the year ended December 31, 2009 increased $8.5 million (including $5.3 million for the El Dorado Refinery and $3.2 million for the Cheyenne Refinery) to $73.7 million from $65.2 million in 2008 because of increased capital investments in our Refineries, including the phase one completion of the gasoil hydrotreater revamp and the catalytic cracker reliability projects at the El Dorado Refinery placed into service in the fourth quarter of 2009 as well as the El Dorado Refinery’s crude unit and vacuum tower expansion project placed into service in the second quarter of 2008. The Cheyenne Refinery’s depreciation increased due to numerous projects placed into service in 2009, including facility site improvements and safety and environmental projects.
Deferred turnaround and catalyst amortization for the year ended December 31, 2009 increased $2.9 million (including a $1.2 million increase for the El Dorado Refinery and a $1.7 million increase for the Cheyenne Refinery) to $25.8 million from $22.9 million in 2008.
Interest expense and other financing costs. Interest expense and other financing costs of $28.2 million for the year ended December 31, 2009 increased $13.1 million, or 86%, from $15.1 million in 2008. The increase in interest expense primarily related to $12.1 million more interest expense on the 8.5% Senior Notes (issued in September 2008). Other increases included $1.2 million more of interest expense on income tax contingencies, $715,000 more of debt discount and finance cost amortization expense (due to the 8.5% Senior Notes) and $529,000 increased interest and facility fees on our revolving credit facility. Capitalized interest for the year ended December 31, 2009 was $5.3 million compared to $6.6 million in 2008. These ne gative variances were partially offset by $2.2 million less interest expense on the Utexam Master Crude Oil Purchase and Sale Contract (“Utexam Arrangement”) (see “Leases and Other Commitments” in Note 13 in the “Notes to Consolidated Financial Statements”). We utilized the Utexam facility less during 2009 than during 2008 as we purchased less Canadian crude oil. Average debt outstanding (excluding amounts reflected as accounts payable under the Utexam Arrangement) increased to $350.0 million during the year ended December 31, 2009 from $214.4 million for the same period in 2008.
Interest and investment income. Interest and investment income decreased $3.1 million, or 58%, from $5.4 million in the year ended December 31, 2008 to $2.3 million in the year ended December 31, 2009, due to $5.9 million less interest income resulting from lower interest rates on invested cash, offset by investment gains of $967,000 in 2009 compared to investment losses of $1.8 million in 2008.
Provision for income taxes. The benefit for income taxes for the year ended December 31, 2009 was $47.5 million on a pretax loss of $131.3 million (or 36.2%) compared to a $115.7 million provision on pretax income of $341.7 million (or 33.9%) in 2008. In 2009, we adopted the LIFO inventory method for GAAP purposes and retrospectively adjusted our previously reported financial statements. For income tax reporting purposes, the effective date of utilizing the LIFO inventory method was January 1, 2009, resulting in a book to tax basis difference in inventory. Utilizing the LIFO method of accounting for inventory for both GAAP and income taxes greatly contributed to the 2009 tax net operating loss, which we carried back to 2005 (as provided for under The Worker, Homeownership and Business Assistance Act of 2009) to offset previously reported taxable income which resulted in refunds received during 2010 of $73.5 million. Our estimated 2009 taxable loss also included accelerated deductions resulting from filing for a change in accounting method for income taxes for certain expenditures which are capitalized and depreciated under GAAP but which we will be allowed to deduct in the year incurred for income tax purposes. The Housing and Economic Recovery Act of 2008 and the American Recovery and Investment Act of 2009 also provided accelerated tax depreciation for our capital projects which were started after January 1, 2008 and which we placed into service in 2009 and 2008. This accelerated deduction allows an expense deduction of 50% of such costs in the year the qualified projects are placed in service with the remaining costs depreciable under regular tax depreciation rules. The Energy Policy Act of 2005 added Section 179C to the Internal Revenue Code which provides an accelerated deduction for qualified capital costs incurred to expand an existing refinery. This accelerated deduction allows an expense deduction of 50% of such costs in the year the qualified projects are placed in service with the remaining costs depreciable under regular tax depreciation rules. These accelerated deductions were major factors in our 2009 and 2008 taxable losses. Our 2009 and 2008 income tax provisions included the benefit from $4.5 million and $23.3 million, respectively, of Kansas income tax credits for expansion projects at our El Dorado Refinery. See “Income Taxes” in Note 9 in the “Notes to Consolidated Financial Statements” for more information on our income taxes and detailed information on our deferred tax assets.
Liquidity and Capital Resources
Cash flows from operating activities. Net cash provided by operating activities was $232.2 million for the year ended December 31, 2010 compared to net cash provided by operating activities of $140.9 million during the year ended December 31, 2009.
Working capital changes provided a total of $106.1 million in 2010 and $94.5 million of cash in 2009. The 2010 net working capital changes primarily resulted from decreased receivables of $79.0 million, increased payables of $29.6 million and decreased inventories of $12.6 million, offset by working capital usages of $16.7 million due to decreased current accrued liabilities. The net decrease in receivables during 2010 was comprised of decreases in income tax and other receivables of $128.8 million (income tax refunds received are discussed below) offset by an increase in trade receivables of $49.8 million. During 2009, the working capital changes provided $94.5 million which primarily resulted from a $171.5 million increase in payables and a $28.8 million decrease in other current assets, offset by a $57 .0 million increase in inventory and a $56.0 million increase in receivables.
We received income tax refunds of $137.1 million and made estimated federal and state income tax payments of $48.1 million and $74,000, respectively, during the year ended December 31, 2010. The federal income tax payments included $18.1 million made in connection with unresolved audit issues for 2005 and 2006 taxes regarding the deductibility for income tax purposes of certain stock-based compensation for executives. The Company filed a petition for a redetermination of this deficiency with the U.S. Tax Court on September 22, 2010. As of December 31, 2010, we had estimated receivables for federal income taxes of $48.9 million and state income taxes of $426,000. Of these income tax receivables, we expect to receive $16.0 million of the federal income tax receivables and have received all of the state income tax receivables during the first quarter of 2011. The timing for the receipt of $30.6 million of the federal income tax receivable is uncertain as these relate to the carryback of net operating losses to 2005 and 2006 and, as discussed above, these years are currently in the jurisdiction of the U.S. Tax Court.
At December 31, 2010, we had $558.6 million of cash and cash equivalents, working capital of $543.4 million and $208.0 million available for borrowings under our revolving credit facility. Our operating cash flows are affected by crude oil and refined product prices and other risks as discussed in Item 7A “Quantitative and Qualitative Disclosures About Market Risks.”
Cash flows used in investing activities. Capital expenditures during the year ended December 31, 2010 were $84.6 million, which included approximately $47.1 million for the El Dorado Refinery and $37.0 million for the Cheyenne Refinery. The $47.1 million of capital expenditures for our El Dorado Refinery included $21.6 million on the gasoil hydrotreater revamp (completed in December 2010 at a total cost of $94.4 million, including capitalized interest), as well as operational, payout, safety, administrative, environmental and optimization projects. The $37.0 million of capital expenditures for our Cheyenne Refinery included $9.7 million for the FCCU gas hydrotreater project, $7.7 million for the liquefied petroleum gas (“LPG”) recovery pr oject, $2.8 million on the groundwater boundary wall control system, as well as environmental, operational, safety, administrative and payout projects. We funded our 2010 capital expenditures with cash generated from our operations.
Cash flows from financing activities. During the year ended December 31, 2010, we paid $6.6 million in dividends. Treasury stock increased by 267,583 shares ($3.6 million) from stock surrendered by employees to pay minimum withholding taxes on 2010 vestings of stock-based compensation. During the fourth quarter of 2010 we paid $150.0 million to redeem the principal of our 6.625% Senior Notes and received net proceeds (after underwriting fees) of $147.0 million upon issuance of our $150.0 million 6.875% Senior Notes.
As of December 31, 2010, we had $347.8 million of long-term debt and no borrowings under our revolving credit facility. We had $292.0 million of outstanding letters of credit under our revolving credit facility. We were in compliance with the financial covenants of our revolving credit facility as of December 31, 2010. We had shareholders’ equity of $986.5 million as of December 31, 2010.
Our Board of Directors declared a regular quarterly cash dividend of $0.06 per share in November 2009, which was paid in January 2010. During the remainder of 2010, we were unable to declare dividends because of our inability to satisfy the incurrence of additional indebtedness test of our Senior Notes. However, because of our positive results from operations for the year ended December 31, 2010, we are no longer limited by these contractual restrictions. On February 21, 2011, our Board of Directors declared a special dividend of $0.28 per share and a quarterly dividend of $0.06 per share, payable on March 21, 2011 to shareholders of record on March 7, 2011.
Future Capital and Turnaround Expenditures
Significant future capital projects. At the Cheyenne Refinery, the completion of the FCCU gas hydrotreater project, originally planned to be completed during the fourth quarter of 2010 to comply with low sulfur gasoline requirements, has been deferred. We plan to initially comply with the low sulfur gasoline requirements at the Cheyenne Refinery through alternative methods and in the long-term with the completion of the FCCU gas hydrotreater project (see “Environmental” in Note 13 in the Notes to Consolidated Financial Statements). The estimated total cost of the project is $40.0 million of which approximately half will be spent by the end of 2011 ($18.4 million had been incurred as of December 31, 2010), with the remaining am ount temporarily postponed. In addition at the Cheyenne Refinery, we are working on a liquefied petroleum gas (LPG) recovery project that will recover significant quantities of saleable propane and butane and other LPGs for alkylation unit feed from the refinery fuel gas system. The total estimated cost of this project is $40.0 million ($12.4 million incurred as of December 31, 2010) and is estimated to be substantially completed by mid-2011. The above amounts include estimated capitalized interest. At the El Dorado Refinery, we plan to do a $26.2 million coker drum charge furnace replacement project which will replace the existing furnace with the latest technology in coking furnaces. This project will let us avoid a substantial rebuild of the existing furnace in the 2013 turnaround and reduce the impact on coker throughput from decoking. This project is estimated to be completed in late 2012.
2011 capital expenditures. Including the projects discussed above, 2011 capital expenditures aggregating approximately $113.0 million are currently planned, and include $75.0 million at our Cheyenne Refinery, $35.0 million at our El Dorado Refinery, $2.0 million for our pipeline and product terminals and blending facility and $627,000 at our Denver and Houston offices. The $75.0 million of planned capital expenditures for our Cheyenne Refinery includes $25.0 million for the LPG recovery project, discussed above, $9.0 million for tank farm optimization and $6.6 million for a FCCU main fractionator replacement, discussed above, as well as environmental, operational, safety, payout and administrative projects. The $35.0 million of planned capital expend itures for our El Dorado Refinery includes $5.0 million for the coke drum charge furnace replacement as well as environmental, operational, safety, payout and administrative projects. We expect that our 2011 capital expenditures will be funded with cash generated by our operations and/or by using a portion of our existing cash balance or additional borrowings, if necessary. We will continue to review our capital expenditures in light of market conditions. We may experience cost overruns and/or schedule delays or adjust the scope on any of these projects.
2011 turnaround expenditures. We plan to spend approximately $21.0 million on turnarounds and catalyst in 2011 comprised of $18.0 million at our Cheyenne Refinery on the alkylation, FCCU, scanfiner and butamer units in the spring of 2011 and $3.0 million at our El Dorado Refinery primarily on the aromatics recovery unit in the fall of 2011. These expenditures will be deferred and subsequently amortized through the next scheduled turnaround or catalyst estimated useful life.
Contractual Cash Obligations
The table below lists the contractual cash obligations we have by period. These items include our long-term debt based on their maturity dates, our operating lease commitments, our capital leases, our purchase obligations and our other long-term liabilities.
Our operating leases include building, equipment, aircraft and vehicle leases, which expire from 2011 through 2017, as well as an operating sublease for the use of the cogeneration facility at our El Dorado Refinery. The non-cancelable sublease, entered into in connection with the acquisition of our El Dorado Refinery in 1999, expires in 2016 with an option that allows us to renew the sublease for an additional eight years. This lease has both a fixed and a variable component.
Purchase obligations include agreements to purchase goods or services that are enforceable and legally binding and that specify terms, including fixed or minimum quantities to be purchased, fixed, minimum or variable price provisions, and the approximate timing of the transaction. Purchase obligations exclude agreements that are cancelable without penalty.
The amounts shown below for transportation, terminalling and storage contractual obligations include our anticipated commitments based on our agreements for shipping crude oil on the Express Pipeline, the Spearhead Pipeline, the Plains All American Pipeline and the Osage Pipeline.
For more information on the agreements discussed above, see “Lease and Other Commitments” in Note 13 in the “Notes to Consolidated Financial Statements.”
| | | Payments Due by Period | |
| Contractual Cash Obligations | | Total | | | Within 1 year | | | Within 2-3 years | | | Within 4-5 years | | | After 5 years | |
| | | (in thousands) | |
| | | | | | | | | | | | | | | | |
| Long-term debt | | $ | 350,000 | | | $ | - | | | $ | - | | | $ | - | | | $ | 350,000 | |
| | | | | | | | | | | | | | | | | | | | | |
| Interest on long-term debt | | | 178,253 | | | | 27,313 | | | | 54,625 | | | | 54,625 | | | | 41,690 | |
| | | | | | | | | | | | | | | | | | | | | |
| Operating leases | | | 43,568 | | | | 11,146 | | | | 14,773 | | | | 12,554 | | | | 5,095 | |
| | | | | | | | | | | | | | | | | | | | | |
| Capital leases | | | 3,394 | | | | 456 | | | | 1,037 | | | | 1,234 | | | | 667 | |
| | | | | | | | | | | | | | | | | | | | | |
| Purchase obligations: | | | | | | | | | | | | | | | | | | | | |
Crude supply, feedstocks and natural gas (1) | | $ | 1,138,412 | | | $ | 1,048,375 | | | $ | 90,037 | | | $ | - | | | $ | - | |
| | | | | | | | | | | | | | | | | | | | | |
| Transportation, terminalling and storage | | | 270,177 | | | | 65,621 | | | | 89,366 | | | | 77,813 | | | | 37,377 | |
| | | | | | | | | | | | | | | | | | | | | |
| Other goods and services | | | 25,395 | | | | 7,499 | | | | 7,118 | | | | 6,958 | | | | 3,820 | |
| Total purchase obligations | | $ | 1,433,984 | | | $ | 1,121,495 | | | $ | 186,521 | | | $ | 84,771 | | | $ | 41,197 | |
| | | | | | | | | | | | | | | | | | | | | |
Contingent income tax liabilities (2) | | | - | | | | - | | | | - | | | | - | | | | - | |
| | | | | | | | | | | | | | | | | | | | | |
| Other long-term liabilities | | | 14,066 | | | | - | | | | 4,781 | | | | 2,903 | | | | 6,382 | |
| | | | | | | | | | | | | | | | | | | | | |
Post-retirement healthcare estimated future benefit payments (3) | | | - | | | | - | | | | - | | | | - | | | | - | |
| | | | | | | | | | | | | | | | | | | | | |
| Total contractual cash | | $ | 2,023,265 | | | $ | 1,160,410 | | | $ | 261,737 | | | $ | 156,087 | | | $ | 445,031 | |
| | | | | | | | | | | | | | | | | | | | | |
(1) Crude supply, feedstocks and natural gas future obligations were calculated using current market prices and/or prices established in applicable contracts. Of these obligations, $689.5 million relate to January and February 2011 feedstock and natural gas requirements of the Refineries. | |
(2) Contingent income tax liabilities of $3.8 million are not included in the table because the timing and certainty cannot be reasonably estimated. | |
(3) Our post-retirement health care plan is unfunded. Future payments for retiree health care benefits are estimated for the next ten years in Note 11 "Employee Benefit Plans" in the "Notes to Consolidated Financial Statements." | |
Off-Balance Sheet Arrangements
Other than facility and equipment leasing agreements, we do not participate in any transactions, agreements or other contractual arrangements which would result in any off-balance sheet liabilities or other arrangements to us. As of December 31, 2010, we had $292.0 million of outstanding letters of credit under our revolving credit facility.
Environmental
We will be making significant future capital expenditures to comply with various environmental regulations. See “Environmental” in Note 13 in the “Notes to Consolidated Financial Statements.”
Application of Critical Accounting Policies
The preparation of financial statements in accordance with United States generally accepted accounting principles (“GAAP”) requires our management to make estimates and assumptions that affect the amounts reported in the consolidated financial statements and accompanying notes. Actual results could differ from those estimates. The following summary provides information about our critical accounting policies, including identification of those involving critical accounting estimates, and should be read in conjunction with Note 2 “Significant Accounting Policies” in the “Notes to Consolidated Financial Statements.”
Turnarounds. Normal maintenance and repairs are expensed as incurred. Planned major maintenance (“turnarounds”) is the scheduled and required shutdown of refinery processing units for significant overhaul and refurbishment. Turnaround costs include contract services, materials and rental equipment. The costs of turnarounds are deferred when incurred and amortized on a straight-line basis over the period of time estimated to lapse until the next turnaround occurs. These deferred charges are included in our Consolidated Balance Sheets in “Deferred turnaround costs.” Also included in our Consolidated Balance Sheets in “Deferred catalyst costs” are the costs of the catalyst that is replaced at per iodic intervals when the quality of the catalyst has deteriorated beyond its prescribed function. The catalyst costs are deferred when incurred and amortized on a straight-line basis over the estimated useful life of the specific catalyst. The amortization expenses for deferred turnaround and catalyst costs are included in “Depreciation, amortization and accretion” in our Consolidated Statements of Operations. Since these policies rely on our estimated timing for the next turnaround and the useful lives of the catalyst, adjustments can occur in the amortization expenses as these estimates change.
Inventories. Inventories of crude oil, unfinished products and all finished products are recorded at the lower of cost on a LIFO basis or market. Crude oil includes both domestic and foreign crude oil volumes at its cost and associated freight and other cost. Unfinished products (work in process) include any crude oil that has entered into the refining process, and other feedstocks that are not finished as far as refining operations are concerned. These include unfinished gasoline and diesel, blendstocks and other feedstocks. Finished product inventory includes saleable gasoline, diesel, jet fuel, chemicals, asphalt and other finished products. Unfinished and finished products inventory values have components of raw m aterial, the associated raw material freight and other costs, and direct refinery operating expense allocated when refining begins relative to their proportionate market values.
Asset Retirement Obligations. GAAP requires that the fair value of a liability for an asset retirement obligation be recognized in the period in which the liability is incurred, with the associated asset retirement costs being capitalized as a part of the carrying amount of the long-lived asset. GAAP also includes disclosure requirements that provide a description of asset retirement obligations and reconciliation of changes in the components of those obligations.
The GAAP guidance clarifies that the term “conditional asset retirement obligation” as used in the current language refers to a legal obligation to perform an asset retirement activity in which the timing and/or method of settlement are conditional on a future event that may or may not be within the control of the reporting entity. Since the obligation to perform the asset retirement activity is unconditional, the guidance provides that a liability for the fair value of a conditional asset obligation should be recognized if that fair value can be reasonably estimated, even though uncertainty exists about the timing and/or method of settlement. The guidance also clarifies when an entity would have sufficient information to reasonably estimate the fair value of a conditional asset retirement obligation und er GAAP. At December 31, 2010, our asset retirement obligation was $4.3 million.
Asset retirement obligations are affected by regulatory changes and refinery operations as well as changes in pricing of services. In order to determine fair value, management must make certain estimates and assumptions, including, among other things, projected cash flows, a credit-adjusted risk-free interest rate, and an assessment of market conditions that could significantly impact the estimated fair value of the asset retirement obligation. These estimates and assumptions are subjective and are currently based on historical costs with adjustments for estimated future changes in the associated costs. Therefore, we expect the dollar amount of these obligations to change as more information is obtained. A 1% change in pricing of services would cause an approximate $50,000 change to the asset r etirement obligation. We believe that we adequately accrued for our asset retirement obligations as of December 31, 2010 and that changes in estimates in future periods will not have a significant effect on our results of operations or financial condition. See “Significant Accounting Policies” in Note 2 in the “Notes to Consolidated Financial Statements” for further information about asset retirement obligations.
Environmental Expenditures. Environmental expenditures are expensed or capitalized based upon their future economic benefit. Costs that improve a property’s pre-existing condition, and costs that prevent future environmental contamination, are capitalized. Remediation costs related to environmental damage resulting from operating activities subsequent to acquisition are expensed. Liabilities for these expenditures are recorded when it is probable that obligations have been incurred and the amounts can be reasonably estimated. Such estimates are subject to change due to many factors, including the identification of new sites requiring remediation, changes in environmental laws and regulations and their interpretation, addit ional information related to the extent and nature of remediation efforts, and potential improvements in remediation technologies.
Post-retirement Benefit Obligations. We have significant post-retirement benefit liabilities and costs that are developed from actuarial valuations. Inherent in these valuations are key assumptions, including discount rates and health care inflation rates. Changes in these assumptions are primarily influenced by factors outside of our control. These assumptions can have a significant effect on the amounts reported in our consolidated financial statements. See Note 11 “Employee Benefit Plans” in the “Notes to Consolidated Financial Statements” for more information about these plans and the current assumptions used.
Income Taxes. In accordance with GAAP, we record deferred tax assets and liabilities to account for the expected future tax consequences of events that have been recognized in our financial statements and our tax returns. We routinely assess the realizability of our deferred tax assets and if we conclude that it is more likely than not that some portion or all of the deferred tax assets will not be realized, the tax asset would be reduced by a valuation allowance. We consider future taxable income in making such assessments, which requires numerous judgments and assumptions. We record contingent income tax liabilities, interest and penalties, based on our estimate as to whether, and the extent to which, additional taxes may be due.
New Accounting Pronouncements
See “New Accounting Pronouncements” in Note 2 in the “Notes to Consolidated Financial Statements.”
Market Risks
See Item 7A “Quantitative and Qualitative Disclosure about Market Risk” and Notes 2 and 14 in the “Notes to Consolidated Financial Statements” under “Price and Interest Risk Management Activities” for a discussion of our various price risk management activities. When we make the decision to manage our price exposure, our objective is generally to avoid losses from negative price changes, realizing we will not obtain the benefit of positive price changes.
| Quantitative and Qualitative Disclosures About Market Risk |
Impact of Changing Energy Prices. Our earnings and cash flows, as well as estimates of future cash flows, are sensitive to changes in energy prices. The prices of crude oil and refined products have fluctuated substantially in recent years. These prices depend on many factors, including the overall demand for crude oil and refined products, which in turn depend on, among other factors, general economic conditions, the level of foreign and domestic production of crude oil and refined products, the availability of imports of crude oil and refined products, the marketing of alternative and competing fuels, the extent of government regulations and global market dynamics. The prices we receive for refined products are also affected by factors s uch as local market conditions and the level of operations of other refineries in our markets. The prices at which we can sell gasoline and other refined products are strongly influenced by the price of crude oil. Generally, an increase or decrease in the price of crude oil results in a corresponding increase or decrease in the price of gasoline and other refined products. The timing of the relative movement of the prices, however, can impact profit margins, which could significantly affect our earnings and cash flows.
Price Risk Management Activities. At times, we enter into commodity derivative contracts to manage our price exposure to our inventory positions, purchases of foreign crude oil and consumption of natural gas in the refining process or to fix margins on certain future production. The commodity derivative contracts used by us may take the form of futures contracts, collars or price swaps. We believe that there is minimal credit risk with respect to our counterparties. We account for our commodity derivative contracts utilizing mark-to-market accounting, with gains and losses on transactions reflected in “Other revenues” on the Consolidated Statements of Operations for each period. See “Price Risk Management Activities” under Note 14 in the “Notes to Consolidated Financial Statements.”
Our outstanding derivative sale contracts and net unrealized losses as of December 31, 2010 are summarized below:
| Commodity | Period | | Volume (thousands of bbls) | | Expected Close Out Date | | Unrealized Net Loss (in thousands) | |
| Crude Oil | February 2011 | | | 593 | | January 2011 | | $ | (1,953 | ) |
| Crude Oil | March 2011 | | | 310 | | February 2011 | | | (436 | ) |
Interest Rate Risk. Borrowings under our revolving credit facility bear a current market rate of interest. A one percent increase or decrease in the interest rates on our revolving credit facility would not significantly affect our earnings or cash flows. Our $150.0 million principal 6.875% Senior Notes due 2018 and $200.0 million 8.5% Senior Notes due 2016 that were outstanding at December 31, 2010 have fixed interest rates. In the fourth quarter of 2009, the Company entered into fixed to floating interest rate swaps of $150.0 million to manage interest rate exposure related to our 6.625% Senior Notes. These interest rate swaps expose that portion of our long-term debt to cash f low risk from interest rate changes. Our long-term debt is also exposed to fair value risk; see below table for fair values at the balance sheet dates. The following table provides information about our financial instruments that are sensitive to changes in short-term interest rates, including interest rate swaps and debt obligations. For our debt obligations, this table presents principal cash flows and related weighted average interest rates by expected maturity dates. For our interest rate swaps, this table presents notional amounts and weighted average interest rates by maturity dates. Weighted-average variable rates are based on implied forward rates in the yield curve at the reporting dates. The fair value of our debt obligations was estimated based on quotations obtained from broker-dealers who make markets in these and similar securities. A mark-to-market valuation that took into consideration anticipated cash flows from the transactions using ma rket prices and other economic data and assumptions were used to value our interest rate swaps.
| | | As of December 31, 2010 | |
| | | Expected maturity dates | | | | | | Fair value | |
| | | 2011 | | | 2012 | | | 2013 | | | 2014 | | | 2015 | | | Thereafter | | | Total | |
| | | (in thousands) | |
| Long-term debt: | | | | | | | | | | | | | | | | | | | | | | | | |
| Fixed rate | | $ | - | | | $ | - | | | $ | - | | | $ | - | | | $ | - | | | $ | 350,000 | | | $ | 350,000 | | | $ | 365,375 | |
| Average interest rate | | | - | | | | - | | | | - | | | | - | | | | - | | | | 7.804 | % | | | 7.804 | % | | | | |
| | | | | | | | | | | | | | | | | | | | | | | | | | | | | | | | | |
| Interest rate swaps: | | | | | | | | | | | | | | | | | | | | | | | | | | | | | | | | |
| Fixed to variable | | $ | 150,000 | | | $ | - | | | $ | - | | | $ | - | | | $ | - | | | $ | - | | | $ | 150,000 | | | $ | 929 | |
| Average pay rate | | | 5.799 | % | | | - | | | | - | | | | - | | | | - | | | | - | | | | 5.799 | % | | | | |
| Average receive rate | | | 6.625 | % | | | - | | | | - | | | | - | | | | - | | | | - | | | | 6.625 | % | | | | |
| | | | | | | | | | | | | | | | | | | | | | | | | | | | | | | | | |
| | | As of December 31, 2009 | |
| | | Expected maturity dates | | | | | | | Fair value | |
| | | | 2010 | | | | 2011 | | | | 2012 | | | | 2013 | | | | 2014 | | | Thereafter | | | Total | |
| | | (in thousands) | |
| Long-term debt: | | | | | | | | | | | | | | | | | | | | | | | | | | | | | | | | |
| Fixed rate | | $ | - | | | $ | 150,000 | | | $ | - | | | $ | - | | | $ | - | | | $ | 200,000 | | | $ | 350,000 | | | $ | 357,750 | |
| Average interest rate | | | - | | | | 6.625 | % | | | - | | | | - | | | | - | | | | 8.500 | % | | | 7.696 | % | | | | |
| | | | | | | | | | | | | | | | | | | | | | | | | | | | | | | | | |
| Interest rate swaps: | | | | | | | | | | | | | | | | | | | | | | | | | | | | | | | | |
| Fixed to variable | | $ | - | | | $ | 150,000 | | | $ | - | | | $ | - | | | $ | - | | | $ | - | | | $ | 150,000 | | | $ | 2 | |
| Average pay rate | | | - | | | | 6.624 | % | | | - | | | | - | | | | - | | | | - | | | | 6.624 | % | | | | |
| Average receive rate | | | - | | | | 6.625 | % | | | - | | | | - | | | | - | | | | - | | | | 6.625 | % | | | | |
Operating Data
The following tables set forth the refining operating statistical information on a consolidated basis and for each Refinery for 2010, 2009 and 2008. The statistical information includes the following terms:
| · | Charges - the quantity of crude oil and other feedstock processed through refinery process units on a bpd basis. |
| · | Manufactured product yields - the volumes of specific materials that are obtained through the distilling of crude oil and the operations of other refinery process units on a bpd basis. |
| · | NYMEX WTI - the benchmark West Texas Intermediate crude oil priced on the New York Mercantile Exchange. |
| · | Average laid-in crude oil differential – the weighted average differential between the NYMEX WTI crude oil price and the composite cost of all crude oil purchased and delivered to our Refineries. |
| · | WTI/WTS crude oil differential - the average differential between the NYMEX WTI crude oil price and the West Texas sour crude oil priced at Midland, Texas. |
| · | Cheyenne Refinery light/heavy crude oil differential - the average differential between the NYMEX WTI crude oil price and the cost of heavy crude oil delivered to the Cheyenne Refinery. |
| · | El Dorado Refinery light/heavy crude oil differential - the average differential between the NYMEX WTI crude oil price and the cost of heavy crude oil delivered to the El Dorado Refinery. |
| · | Gasoline and diesel crack spreads - the average non-oxygenated gasoline and diesel net sales prices that we receive for each product less the average NYMEX WTI crude oil price. |
| | | Years Ended December 31, | |
| Consolidated: | | 2010 | | | 2009 | | | 2008 | |
| Charges (bpd) | | | | | | | | | |
| Light crude | | | 68,932 | | | | 49,892 | | | | 30,265 | |
| Heavy and intermediate crude | | | 100,914 | | | | 103,894 | | | | 112,673 | |
| Other feed and blendstocks | | | 14,548 | | | | 16,125 | | | | 18,899 | |
| Total | | | 184,394 | | | | 169,911 | | | | 161,837 | |
| | | | | | | | | | | | | |
| Manufactured product yields (bpd) | | | | | | | | | | | | |
| Gasoline | | | 89,128 | | | | 80,201 | | | | 76,573 | |
| Diesel and jet fuel | | | 69,609 | | | | 66,039 | | | | 58,748 | |
| Asphalt | | | 2,754 | | | | 2,194 | | | | 3,477 | |
| Other | | | 18,933 | | | | 16,456 | | | | 18,717 | |
| Total | | | 180,424 | | | | 164,890 | | | | 157,515 | |
| | | | | | | | | | | | | |
| Total product sales (bpd) | | | | | | | | | | | | |
| Gasoline | | | 98,969 | | | | 91,127 | | | | 85,515 | |
| Diesel and jet fuel | | | 69,785 | | | | 65,623 | | | | 58,139 | |
| Asphalt | | | 2,726 | | | | 2,035 | | | | 3,900 | |
| Other | | | 17,249 | | | | 16,487 | | | | 18,818 | |
| Total | | | 188,729 | | | | 175,272 | | | | 166,372 | |
| | | | | | | | | | | | | |
| Refinery operating margin information (per sales barrel) | | | | | | | | | | | | |
| Refined products revenue | | $ | 85.33 | | | $ | 66.32 | | | $ | 104.15 | |
| Raw material, freight and other costs | | | 77.92 | | | | 60.78 | | | | 93.87 | |
Refinery operating expenses, excluding depreciation (1) | | | 4.09 | | | | 4.62 | | | | 4.90 | |
Depreciation, amortization and accretion (1) | | | 1.52 | | | | 1.56 | | | | 1.45 | |
| | | | | | | | | | | | | |
| Average NYMEX WTI (per barrel) | | $ | 79.48 | | | $ | 61.82 | | | $ | 99.75 | |
| Average laid-in crude oil differentail (per barrel) | | | 3.65 | | | | 3.57 | | | | 7.80 | |
| Average light/heavy crude oil differential (per barrel) | | | 9.90 | | | | 6.34 | | | | 17.38 | |
| Average gasoline crack spread (per barrel) | | | 8.18 | | | | 7.60 | | | | 4.75 | |
| Average diesel crack spread (per barrel) | | | 12.59 | | | | 8.25 | | | | 24.59 | |
| | | | | | | | | | | | | |
| Average sales price (per sales barrel) | | | | | | | | | | | | |
| Gasoline | | $ | 88.68 | | | $ | 70.83 | | | $ | 105.64 | |
| Diesel and jet fuel | | | 93.06 | | | | 70.01 | | | | 123.69 | |
| Asphalt | | | 70.21 | | | | 66.94 | | | | 65.74 | |
| Other | | | 37.21 | | | | 26.63 | | | | 45.02 | |
(1) Prior period amounts are adjusted to reflect current year presentation of turnaround and catalyst amortization as depreciation, amortization and accretion instead of refinery operating expenses. | |
| | | Years Ended December 31, | |
| Cheyenne Refinery: | | 2010 | | | 2009 | | | 2008 | |
| Charges (bpd) | | | | | | | | | |
| Light crude | | | 24,847 | | | | 20,378 | | | | 10,128 | |
| Heavy and intermediate crude | | | 16,035 | | | | 21,097 | | | | 33,462 | |
| Other feed and blendstocks | | | 2,611 | | | | 1,633 | | | | 1,283 | |
| Total | | | 43,493 | | | | 43,108 | | | | 44,873 | |
| | | | | | | | | | | | | |
| Manufactured product yields (bpd) | | | | | | | | | | | | |
| Gasoline | | | 20,724 | | | | 19,797 | | | | 19,379 | |
| Diesel | | | 14,373 | | | | 15,391 | | | | 13,528 | |
| Asphalt | | | 2,754 | | | | 2,194 | | | | 3,477 | |
| Other | | | 4,015 | | | | 4,049 | | | | 6,987 | |
| Total | | | 41,866 | | | | 41,431 | | | | 43,371 | |
| | | | | | | | | | | | | |
| Total product sales (bpd) | | | | | | | | | | | | |
| Gasoline | | | 27,707 | | | | 27,454 | | | | 26,920 | |
| Diesel | | | 14,529 | | | | 15,168 | | | | 13,112 | |
| Asphalt | | | 2,726 | | | | 2,035 | | | | 3,900 | |
| Other | | | 2,875 | | | | 3,830 | | | | 6,013 | |
| Total | | | 47,837 | | | | 48,487 | | | | 49,945 | |
| | | | | | | | | | | | | |
| Refinery operating margin information (per sales barrel) | | | | | | | | | | | | |
| Refined products revenue | | $ | 85.81 | | | $ | 67.45 | | | $ | 100.96 | |
| Raw material, freight and other costs | | | 78.10 | | | | 62.17 | | | | 89.29 | |
Refinery operating expenses, excluding depreciation (1) | | | 5.73 | | | | 6.17 | | | | 5.77 | |
Depreciation, amortization and accretion (1) | | | 2.11 | | | | 2.40 | | | | 2.05 | |
| | | | | | | | | | | | | |
| Average laid-in crude oil differential (per barrel) | | $ | 6.89 | | | $ | 4.28 | | | $ | 15.90 | |
| Average light/heavy crude oil differential (per barrel) | | | 11.79 | | | | 6.61 | | | | 17.15 | |
| Average gasoline crack spread (per barrel) | | | 9.09 | | | | 7.48 | | | | 5.99 | |
| Average diesel crack spread (per barrel) | | | 15.37 | | | | 9.55 | | | | 27.80 | |
| | | | | | | | | | | | | |
| Average sales price (per sales barrel) | | | | | | | | | | | | |
| Gasoline | | $ | 88.62 | | | $ | 71.47 | | | $ | 106.54 | |
| Diesel | | | 95.19 | | | | 73.00 | | | | 128.04 | |
| Asphalt | | | 70.21 | | | | 66.94 | | | | 65.74 | |
| Other | | | 25.97 | | | | 16.93 | | | | 39.82 | |
| | | | | | | | | | | | | |
| El Dorado Refinery: | | | | | | | | | | | | |
| Charges (bpd) | | | | | | | | | | | | |
| Light crude | | | 44,086 | | | | 29,515 | | | | 20,137 | |
| Heavy and intermediate crude | | | 84,879 | | | | 82,797 | | | | 79,210 | |
| Other feed and blendstocks | | | 11,938 | | | | 14,491 | | | | 17,616 | |
| Total | | | 140,903 | | | | 126,803 | | | | 116,963 | |
| | | | | | | | | | | | | |
| Manufactured product yields (bpd) | | | | | | | | | | | | |
| Gasoline | | | 68,405 | | | | 60,403 | | | | 57,194 | |
| Diesel and jet fuel | | | 55,236 | | | | 50,647 | | | | 45,220 | |
| Other | | | 14,918 | | | | 12,408 | | | | 11,730 | |
| Total | | | 138,559 | | | | 123,458 | | | | 114,144 | |
| | | | | | | | | | | | | |
| Total product sales (bpd) | | | | | | | | | | | | |
| Gasoline | | | 71,262 | | | | 63,673 | | | | 58,595 | |
| Diesel and jet fuel | | | 55,256 | | | | 50,455 | | | | 45,027 | |
| Other | | | 14,374 | | | | 12,657 | | | | 12,804 | |
| Total | | | 140,892 | | | | 126,785 | | | | 116,426 | |
| | | | | | | | | | | | | |
| Refinery operating margin information (per sales barrel) | | | | | | | | | | | | |
| Refined products revenue | | $ | 85.17 | | | $ | 65.89 | | | $ | 105.52 | |
| Raw material, freight and other costs | | | 77.85 | | | | 60.25 | | | | 95.84 | |
Refinery operating expenses, excluding depreciation (1) | | | 3.54 | | | | 4.03 | | | | 4.53 | |
Depreciation, amortization and accretion (1) | | | 1.31 | | | | 1.24 | | | | 1.20 | |
| | | | | | | | | | | | | |
| Average laid-in crude oil differential (per barrel) | | $ | 2.61 | | | $ | 3.31 | | | $ | 4.09 | |
| Average WTI/WTS crude oil differential (per barrel) | | | 2.15 | | | | 1.65 | | | | 3.92 | |
| Average light/heavy crude oil differential (per barrel) | | | 8.60 | | | | 6.01 | | | | 17.85 | |
| Average gasoline crack spread (per barrel) | | | 7.83 | | | | 7.65 | | | | 4.18 | |
| Average diesel crack spread (per barrel) | | | 11.86 | | | | 7.86 | | | | 23.66 | |
| | | | | | | | | | | | | |
| Average sales price (per sales barrel) | | | | | | | | | | | | |
| Gasoline | | $ | 88.71 | | | $ | 70.56 | | | $ | 105.22 | |
| Diesel and jet fuel | | | 92.50 | | | | 69.12 | | | | 122.42 | |
| Other | | | 39.46 | | | | 29.57 | | | | 47.47 | |
(1) Prior period amounts are adjusted to reflect current year presentation of turnaround and catalyst amortization as depreciation, amortization and accretion instead of refinery operating expenses. | |
| Financial Statements and Supplementary Data |
REPORT OF INDEPENDENT REGISTERED PUBLIC ACCOUNTING FIRM
To the Board of Directors and Shareholders of Frontier Oil Corporation:
We have audited the accompanying consolidated balance sheets of Frontier Oil Corporation and subsidiaries (the “Company”) as of December 31, 2010 and 2009, and the related consolidated statements of operations, changes in shareholders’ equity and comprehensive income (loss), and cash flows for each of the three years in the period ended December 31, 2010. Our audits also included the financial statement schedules listed in the Index at Item 15. These consolidated financial statements and financial statement schedules are the responsibility of the Company’s management. Our responsibility is to express an opinion on the financial statements and financial statement schedules based on our audits.
We conducted our audits in accordance with the standards of the Public Company Accounting Oversight Board (United States). Those standards require that we plan and perform the audit to obtain reasonable assurance about whether the financial statements are free of material misstatement. An audit includes examining, on a test basis, evidence supporting the amounts and disclosures in the financial statements. An audit also includes assessing the accounting principles used and significant estimates made by management, as well as evaluating the overall financial statement presentation. We believe that our audits provide a reasonable basis for our opinion.
In our opinion, such consolidated financial statements present fairly, in all material respects, the financial position of Frontier Oil Corporation and subsidiaries as of December 31, 2010 and 2009, and the results of their operations and their cash flows for each of the three years in the period ended December 31, 2010, in conformity with accounting principles generally accepted in the United States of America. Also, in our opinion, such financial statement schedules, when considered in relation to the basic consolidated financial statements taken as a whole, present fairly, in all material respects, the information set forth therein.
We have also audited, in accordance with the standards of the Public Company Accounting Oversight Board (United States), the Company’s internal control over financial reporting as of December 31, 2010, based on the criteria established in Internal Control—Integrated Framework issued by the Committee of Sponsoring Organizations of the Treadway Commission and our report dated February 23, 2011 expressed an unqualified opinion on the Company’s internal control over financial reporting.
/s/ DELOITTE & TOUCHE LLP
February 23, 2011
CONTROL OVER FINANCIAL REPORTING
The management of Frontier Oil Corporation is responsible for establishing and maintaining adequate internal control over financial reporting. Our internal control system was designed to provide reasonable assurance to the Company’s management and board of directors regarding the preparation and fair presentation of published financial statements. All internal control systems, no matter how well designed, have inherent limitations. Therefore, even those systems determined to be effective can provide only reasonable assurance with respect to financial statement preparation and presentation.
Frontier Oil Corporation’s management assessed the effectiveness of the Company’s internal control over financial reporting as of December 31, 2010. In making this assessment, it used the criteria set forth by the Committee of Sponsoring Organizations of the Treadway Commission in Internal Control-Integrated Framework. Based on our assessment, we believe that, as of December 31, 2010, the Company’s internal control over financial reporting is effective based on those criteria.
Frontier Oil Corporation’s independent registered public accounting firm has issued an audit report on the effectiveness of the Company’s internal control over financial reporting. This report appears on the following page.
February 23, 2011
Michael C. Jennings
Chairman of the Board, President and Chief Executive Officer
Doug S. Aron
Executive Vice President and Chief Financial Officer
Nancy J. Zupan
Vice President and Chief Accounting Officer
REPORT OF INDEPENDENT REGISTERED PUBLIC ACCOUNTING FIRM
To the Board of Directors and Shareholders of Frontier Oil Corporation:
We have audited the internal control over financial reporting of Frontier Oil Corporation and its subsidiaries (the “Company”) as of December 31, 2010 based on criteria established in Internal Control—Integrated Framework issued by the Committee of Sponsoring Organizations of the Treadway Commission. The Company's management is responsible for maintaining effective internal control over financial reporting and for its assessment of the effectiveness of internal control over financial reporting, included in the accompanying Management’s Report on Internal Control Over Financial Reporting. Our responsibility is to express an opinion on the Company's internal control over financial reporting based on our audit.
We conducted our audit in accordance with the standards of the Public Company Accounting Oversight Board (United States). Those standards require that we plan and perform the audit to obtain reasonable assurance about whether effective internal control over financial reporting was maintained in all material respects. Our audit included obtaining an understanding of internal control over financial reporting, assessing the risk that a material weakness exists, testing and evaluating the design and operating effectiveness of internal control based on the assessed risk, and performing such other procedures as we considered necessary in the circumstances. We believe that our audit provides a reasonable basis for our opinion.
A company's internal control over financial reporting is a process designed by, or under the supervision of, the company's principal executive and principal financial officers, or persons performing similar functions, and effected by the company's board of directors, management, and other personnel to provide reasonable assurance regarding the reliability of financial reporting and the preparation of financial statements for external purposes in accordance with generally accepted accounting principles. A company's internal control over financial reporting includes those policies and procedures that (1) pertain to the maintenance of records that, in reasonable detail, accurately and fairly reflect the transactions and dispositions of the assets of the company; (2) provide reasonable assurance that transactions are recorded as n ecessary to permit preparation of financial statements in accordance with generally accepted accounting principles, and that receipts and expenditures of the company are being made only in accordance with authorizations of management and directors of the company; and (3) provide reasonable assurance regarding prevention or timely detection of unauthorized acquisition, use, or disposition of the company's assets that could have a material effect on the financial statements.
Because of the inherent limitations of internal control over financial reporting, including the possibility of collusion or improper management override of controls, material misstatements due to error or fraud may not be prevented or detected on a timely basis. Also, projections of any evaluation of the effectiveness of the internal control over financial reporting to future periods are subject to the risk that the controls may become inadequate because of changes in conditions, or that the degree of compliance with the policies or procedures may deteriorate.
In our opinion, the Company maintained, in all material respects, effective internal control over financial reporting as of December 31, 2010, based on the criteria established in Internal Control—Integrated Framework issued by the Committee of Sponsoring Organizations of the Treadway Commission.
We have also audited, in accordance with the standards of the Public Company Accounting Oversight Board (United States), the consolidated financial statements and financial statement schedules as of and for the year ended December 31, 2010 of the Company and our report dated February 23, 2011 expressed an unqualified opinion on those consolidated financial statements and financial statement schedules.
/s/ DELOITTE & TOUCHE LLP
Denver, Colorado
February 23, 2011
| |
| Consolidated Statements of Operations | |
| | | | | | | | | | |
| | | Years Ended December 31, | |
| | | 2010 | | | 2009 | | | 2008 | |
| | | (in thousands, except per share data) | |
| Revenues: | | | | | | | | | |
| Refined products | | $ | 5,878,182 | | | $ | 4,242,966 | | | $ | 6,342,144 | |
| Other | | | 6,724 | | | | (5,753 | ) | | | 156,636 | |
| Total revenues | | | 5,884,906 | | | | 4,237,213 | | | | 6,498,780 | |
| | | | | | | | | | | | | |
| Costs and expenses: | | | | | | | | | | | | |
| Raw material, freight and other costs | | | 5,367,278 | | | | 3,888,308 | | | | 5,716,091 | |
| Refinery operating expenses, excluding depreciation | | | 281,793 | | | | 295,509 | | | | 298,417 | |
| Selling and general expenses, excluding depreciation | | | 47,192 | | | | 58,668 | | | | 44,169 | |
| Depreciation, amortization and accretion | | | 104,821 | | | | 100,098 | | | | 88,703 | |
| Net gains on sales of assets | | | (1 | ) | | | - | | | | (44 | ) |
| Total costs and expenses | | | 5,801,083 | | | | 4,342,583 | | | | 6,147,336 | |
| | | | | | | | | | | | | |
| Operating income (loss) | | | 83,823 | | | | (105,370 | ) | | | 351,444 | |
| | | | | | | | | | | | | |
| Interest expense and other financing costs | | | 32,581 | | | | 28,187 | | | | 15,130 | |
| Interest and investment income | | | (2,345 | ) | | | (2,279 | ) | | | (5,425 | ) |
| Income (loss) before income taxes | | | 53,587 | | | | (131,278 | ) | | | 341,739 | |
| Provision (benefit) for income taxes | | | 15,802 | | | | (47,518 | ) | | | 115,686 | |
| Net income (loss) | | $ | 37,785 | | | $ | (83,760 | ) | | $ | 226,053 | |
| | | | | | | | | | | | | |
| Basic earnings (loss) per share of common stock | | $ | 0.36 | | | $ | (0.81 | ) | | $ | 2.19 | |
| | | | | | | | | | | | | |
| Diluted earnings (loss) per share of common stock | | $ | 0.36 | | | $ | (0.81 | ) | | $ | 2.18 | |
| | | | | | | | | | | | | |
| The accompanying notes are an integral part of these consolidated financial statements. | |
| |
| Consolidated Balance Sheets | |
| | |
| | | December 31, | |
| | | 2010 | | | 2009 | |
| | | (in thousands, except share data) | |
| ASSETS | | | | | | |
| Current assets: | | | | | | |
| Cash and cash equivalents | | $ | 558,641 | | | $ | 425,280 | |
| Trade receivables, net of allowance of $1,000 at 2010 and 2009, respectively | | | 145,033 | | | | 95,261 | |
| Income taxes receivable | | | 49,305 | | | | 174,627 | |
| Other receivables | | | 1,734 | | | | 7,842 | |
| Inventory of crude oil, products and other | | | 280,847 | | | | 293,476 | |
| Deferred income tax assets - current | | | 30,516 | | | | 26,373 | |
| Other current assets | | | 12,981 | | | | 14,507 | |
| Total current assets | | | 1,079,057 | | | | 1,037,366 | |
| | | | | | | | | |
| Property, plant and equipment, net | | | 1,014,868 | | | | 1,021,409 | |
| Deferred turnaround and catalyst costs, net | | | 51,347 | | | | 68,491 | |
Deferred financing costs, net of accumulated amortization of $2,400 and $3,893 at 2010 and 2009, respectively | | | 6,271 | | | | 4,711 | |
Intangible assets, net of accumulated amortization of $736 and $614 at 2010 and 2009, respectively | | | 1,094 | | | | 1,216 | |
| Deferred income tax assets - noncurrent | | | 11,768 | | | | 10,767 | |
| Other assets | | | 4,359 | | | | 3,935 | |
| Total assets | | $ | 2,168,764 | | | $ | 2,147,895 | |
| | | | | | | | | |
| LIABILITIES AND SHAREHOLDERS' EQUITY | | | | | | | | |
| Current liabilities: | | | | | | | | |
| Accounts payable | | $ | 493,212 | | | $ | 474,377 | |
| Accrued liabilities and other | | | 42,412 | | | | 64,799 | |
| Total current liabilities | | | 535,624 | | | | 539,176 | |
| | | | | | | | | |
| Long-term debt | | | 347,773 | | | | 347,485 | |
| Contingent income tax liabilities | | | 3,830 | | | | 29,348 | |
| Post-retirement employee liabilities | | | 43,313 | | | | 33,138 | |
| Long-term capital lease obligation | | | 2,938 | | | | 3,394 | |
| Other long-term liabilities | | | 14,066 | | | | 20,560 | |
| Deferred income tax liabilities | | | 234,673 | | | | 230,818 | |
| | | | | | | | | |
| Commitments and contingencies | | | | | | | | |
| | | | | | | | | |
| Shareholders' equity: | | | | | | | | |
Preferred stock, $100 par value, 500,000 shares authorized, no shares issued | | | - | | | | - | |
Common stock, no par value, 180,000,000 shares authorized, 131,850,356 shares issued at both periods | | | 57,736 | | | | 57,736 | |
| Paid-in capital | | | 263,706 | | | | 252,513 | |
| Retained earnings | | | 1,068,004 | | | | 1,030,203 | |
| Accumulated other comprehensive loss | | | (6,493 | ) | | | (1,234 | ) |
Treasury stock, at cost, 26,097,398 and 27,165,400 shares at 2010 and 2009, respectively | | | (396,406 | ) | | | (395,242 | ) |
| Total shareholders' equity | | | 986,547 | | | | 943,976 | |
| Total liabilities and shareholders' equity | | $ | 2,168,764 | | | $ | 2,147,895 | |
| | | | | | | | | |
| The accompanying notes are an integral part of these consolidated financial statements. | |
| |
| Consolidated Statements of Cash Flows | |
| | | | | | | | | | |
| | | Years Ended December 31, | |
| | | 2010 | | | 2009 | | | 2008 | |
| | | (in thousands) | |
| Cash flows from operating activities: | | | | | | | | | |
| Net income (loss) | | $ | 37,785 | | | $ | (83,760 | ) | | $ | 226,053 | |
Adjustments to reconcile net income (loss) to net cash from operating activities: | | | | | | | | | | | | |
| Depreciation, amortization and accretion | | | 104,821 | | | | 100,098 | | | | 88,703 | |
| Deferred income taxes | | | 1,963 | | | | 31,082 | | | | 169,766 | |
| Stock-based compensation expense | | | 15,840 | | | | 20,608 | | | | 20,014 | |
| Excess income tax benefits of stock-based compensation | | | (152 | ) | | | (244 | ) | | | (3,191 | ) |
| Amortization of debt issuance costs | | | 1,485 | | | | 1,489 | | | | 978 | |
| Senior Notes discount amortization | | | 288 | | | | 264 | | | | 60 | |
| Loss on extinguishment of debt | | | 750 | | | | - | | | | - | |
| (Decrease) increase in allowance for investment loss and bad debts | | | (184 | ) | | | 500 | | | | 499 | |
| Net gains on sales of assets | | | (1 | ) | | | - | | | | (44 | ) |
| (Decrease) increase in other long-term liabilities | | | (27,270 | ) | | | 10,829 | | | | (3,173 | ) |
| Turnaround and catalyst costs paid | | | (8,804 | ) | | | (33,477 | ) | | | (34,746 | ) |
| Other | | | (424 | ) | | | (943 | ) | | | 1,340 | |
| Changes in components of working capital from operations: | | | | | | | | | | | | |
| Decrease (increase) in trade, income taxes and other receivables | | | 79,010 | | | | (56,041 | ) | | | (28,801 | ) |
| Decrease (increase) in inventory | | | 12,628 | | | | (56,971 | ) | | | 11,107 | |
| Decrease (increase) in other current assets | | | 1,527 | | | | 28,849 | | | | (14,984 | ) |
| Increase (decrease) in accounts payable | | | 29,576 | | | | 171,472 | | | | (117,018 | ) |
| (Decrease) increase in accrued liabilities | | | (16,675 | ) | | | 7,187 | | | | (19,288 | ) |
| Net cash provided by operating activities | | | 232,163 | | | | 140,942 | | | | 297,275 | |
| | | | | | | | | | | | | |
| Cash flows from investing activities: | | | | | | | | | | | | |
| Additions to property, plant and equipment | | | (84,633 | ) | | | (168,670 | ) | | | (209,381 | ) |
| Proceeds from sales of assets | | | 1 | | | | - | | | | 46 | |
| Other | | | - | | | | (2,100 | ) | | | (7,500 | ) |
| Net cash used in investing activities | | | (84,632 | ) | | | (170,770 | ) | | | (216,835 | ) |
| | | | | | | | | | | | | |
| Cash flows from financing activities: | | | | | | | | | | | | |
| Proceeds from issuance of Senior Notes | | | 150,000 | | | | - | | | | 197,160 | |
| Repayments of Senior Notes | | | (150,000 | ) | | | - | | | | - | |
| Purchase of treasury stock | | | (3,614 | ) | | | (3,008 | ) | | | (67,030 | ) |
| Proceeds from issuance of common stock | | | - | | | | 70 | | | | 405 | |
| Dividends paid | | | (6,629 | ) | | | (25,349 | ) | | | (23,144 | ) |
| Excess income tax benefits of stock-based compensation | | | 152 | | | | 244 | | | | 3,191 | |
| Debt issuance costs and other | | | (4,079 | ) | | | (381 | ) | | | (4,889 | ) |
| Net cash (used in) provided by financing activities | | | (14,170 | ) | | | (28,424 | ) | | | 105,693 | |
| Increase (decrease) in cash and cash equivalents | | | 133,361 | | | | (58,252 | ) | | | 186,133 | |
| Cash and cash equivalents, beginning of period | | | 425,280 | | | | 483,532 | | | | 297,399 | |
| Cash and cash equivalents, end of period | | $ | 558,641 | | | $ | 425,280 | | | $ | 483,532 | |
| | | | | | | | | | | | | |
| The accompanying notes are an integral part of these consolidated financial statements. | |
| |
| Consolidated Statements of Changes in Shareholders' Equity and Statements of Comprehensive Income (Loss) | |
| (in thousands, except share data) | |
| | | | | | | | | | | | | | | | | | | | | | | | | | | | | |
| | | Common Stock | | | | | | | | | | | | Treasury Stock | | | | | | Total | |
| | | Number of Shares Issued | | | Amount | | | Paid-in-Capital | | | Comprehensive Income (Loss) | | | Retained Earnings | | | Number of Shares | | | Amount | | | Accumulated Other Comprehensive Income (Loss) | | | Number of Shares | | | Amount | |
| December 31, 2007 | | | 131,850,356 | | | $ | 57,736 | | | $ | 211,324 | | | | | | $ | 937,557 | | | | (26,893,939 | ) | | $ | (327,564 | ) | | $ | 1,578 | | | | 104,956,417 | | | $ | 880,631 | |
| Shares issued under stock-based compensation plans | | | | | | | | (457 | ) | | | | | | | | | | 904,996 | | | | 1,168 | | | | | | | | 904,996 | | | | 711 | |
| Shares received under: | | | | | | | | | | | | | | | | | | | | | | | | | | | | | | | | | | | | | | | |
| Stock repurchase plan | | | | | | | | | | | | | | | | | | | | | | (1,561,367 | ) | | | (56,260 | ) | | | | | | | (1,561,367 | ) | | | (56,260 | ) |
| Stock-based compensation plans | | | | | | | | | | | | | | | | | | | | | | (395,574 | ) | | | (11,076 | ) | | | | | | | (395,574 | ) | | | (11,076 | ) |
| Comprehensive income: | | | | | | | | | | | | | | | | | | | | | | | | | | | | | | | | | | | | | | | |
| Net income | | | | | | | | | | | | | | $ | 226,053 | | | | 226,053 | | | | | | | | | | | | | | | | - | | | | 226,053 | |
| Other comprehensive income (loss): | | | | | | | | | | | | | | | | | | | | | | | | | | | | | | | | | | | | | | | | |
| Defined benefit plans, net of tax of $1,405 | | | | | | | | | | | | | | | (2,301 | ) | | | | | | | | | | | | | | | (2,301 | ) | | | - | | | | (2,301 | ) |
| Other comprehensive income (loss) | | | | | | | | | | | | | | | (2,301 | ) | | | | | | | | | | | | | | | | | | | - | | | | - | |
| Comprehensive income | | | | | | | | | | | | | | $ | 223,752 | | | | | | | | | | | | | | | | | | | | - | | | | - | |
Income tax benefits of stock-based compensation, net of contingency | | | | | | | | 5,302 | | | | | | | | | | | | | | | | | | | | | | | | - | | | | 5,302 | |
| Stock-based compensation expense | | | | | | | | | | | 20,014 | | | | | | | | | | | | | | | | | | | | | | | | - | | | | 20,014 | |
| Dividends declared | | | | | | | | | | | | | | | | | | | (24,098 | ) | | | | | | | | | | | | | | | - | | | | (24,098 | ) |
| December 31, 2008 | | | 131,850,356 | | | $ | 57,736 | | | $ | 236,183 | | | | | | | $ | 1,139,512 | | | | (27,945,884 | ) | | $ | (393,732 | ) | | $ | (723 | ) | | | 103,904,472 | | | $ | 1,038,976 | |
| Shares issued under stock-based compensation plans | | | | | | | | (1,428 | ) | | | | | | | | | | | 1,000,823 | | | | 1,498 | | | | | | | | 1,000,823 | | | | 70 | |
| Shares received under: | | | | | | | | | | | | | | | | | | | | | | | | | | | | | | | | | | | | | | | | |
| Stock-based compensation plans | | | | | | | | | | | | | | | | | | | | | | | (220,339 | ) | | | (3,008 | ) | | | | | | | (220,339 | ) | | | (3,008 | ) |
| Comprehensive income (loss): | | | | | | | | | | | | | | | | | | | | | | | | | | | | | | | | | | | | | | | | |
| Net loss | | | | | | | | | | | | | | $ | (83,760 | ) | | | (83,760 | ) | | | | | | | | | | | | | | | - | | | | (83,760 | ) |
| Other comprehensive income (loss): | | | | | | | | | | | | | | | | | | | | | | | | | | | | | | | | | | | | | | | | |
| Defined benefit plans, net of tax of $317 | | | | | | | | | | | | | | | (511 | ) | | | | | | | | | | | | | | | (511 | ) | | | - | | | | (511 | ) |
| Other comprehensive income (loss) | | | | | | | | | | | | | | | (511 | ) | | | | | | | | | | | | | | | | | | | - | | | | - | |
| Comprehensive income (loss): | | | | | | | | | | | | | | $ | (84,271 | ) | | | | | | | | | | | | | | | | | | | - | | | | - | |
Income tax benefits of stock-based compensation, net of contingency | | | | | | | | (2,850 | ) | | | | | | | | | | | | | | | | | | | | | | | - | | | | (2,850 | ) |
| Stock-based compensation expense | | | | | | | | | | | 20,608 | | | | | | | | | | | | | | | | | | | | | | | | - | | | | 20,608 | |
| Dividends declared | | | | | | | | | | | | | | | | | | | (25,549 | ) | | | | | | | | | | | | | | | - | | | | (25,549 | ) |
| December 31, 2009 | | | 131,850,356 | | | $ | 57,736 | | | $ | 252,513 | | | | | | | $ | 1,030,203 | | | | (27,165,400 | ) | | $ | (395,242 | ) | | $ | (1,234 | ) | | | 104,684,956 | | | $ | 943,976 | |
| Shares issued under stock-based compensation plans | | | | | | | | (2,449 | ) | | | | | | | | | | | 1,335,585 | | | | 2,449 | | | | | | | | 1,335,585 | | | | - | |
| Shares received under: | | | | | | | | | | | | | | | | | | | | | | | | | | | | | | | | | | | | | | | | |
| Stock-based compensation plans | | | | | | | | | | | | | | | | | | | | | | | (267,583 | ) | | | (3,613 | ) | | | | | | | (267,583 | ) | | | (3,613 | ) |
| Comprehensive income (loss): | | | | | | | | | | | | | | | | | | | | | | | | | | | | | | | | | | | | | | | | |
| Net income | | | | | | | | | | | | | | $ | 37,785 | | | | 37,785 | | | | | | | | | | | | | | | | - | | | | 37,785 | |
| Other comprehensive income (loss): | | | | | | | | | | | | | | | | | | | | | | | | | | | | | | | | | | | | | | | | |
| Defined benefit plans, net of tax of $3,252 | | | | | | | | | | | | | | | (5,259 | ) | | | | | | | | | | | | | | | (5,259 | ) | | | - | | | | (5,259 | ) |
| Other comprehensive income (loss) | | | | | | | | | | | | | | | (5,259 | ) | | | | | | | | | | | | | | | | | | | - | | | | - | |
| Comprehensive income: | | | | | | | | | | | | | | $ | 32,526 | | | | | | | | | | | | | | | | | | | | - | | | | - | |
Income tax benefits of stock-based compensation, net of contingency | | | | | | | | (2,198 | ) | | | | | | | | | | | | | | | | | | | | | | | - | | | | (2,198 | ) |
| Stock-based compensation expense | | | | | | | | | | | 15,840 | | | | | | | | | | | | | | | | | | | | | | | | - | | | | 15,840 | |
| Dividends declared | | | | | | | | | | | | | | | | | | | 16 | | | | | | | | | | | | | | | | - | | | | 16 | |
| December 31, 2010 | | | 131,850,356 | | | $ | 57,736 | | | $ | 263,706 | | | | | | | $ | 1,068,004 | | | | (26,097,398 | ) | | $ | (396,406 | ) | | $ | (6,493 | ) | | | 105,752,958 | | | $ | 986,547 | |
| | | | | | | | | | | | | | | | | | | | | | | | | | | | | | | | | | | | | | | | | |
| The accompanying notes are an integral part of these consolidated financial statements. | | |
FRONTIER OIL CORPORATION AND SUBSIDIARIES
Notes To Consolidated Financial Statements
For The Years Ended December 31, 2010, 2009 and 2008
The financial statements include the accounts of Frontier Oil Corporation (“FOC”), a Wyoming corporation, and its wholly-owned subsidiaries, collectively referred to as “Frontier” or “the Company.” The Company is an energy company engaged in crude oil refining and wholesale marketing of refined petroleum products (the “refining operations”).
The Company operates refineries (“the Refineries”) in Cheyenne, Wyoming and El Dorado, Kansas. The Company also owns Ethanol Management Company (“EMC”), a products terminal and blending facility located near Denver, Colorado. The Company purchased in December 2009, a refined products pipeline which runs from Cheyenne, Wyoming to Sidney, Nebraska and the associated refined products terminal and truck rack at Sidney, Nebraska. This purchase is included in “Other” on the 2009 Consolidated Statements of Cash Flows. The equity method of accounting is utilized for the Company’s 25% interest in 8901 Hangar, Inc., a company which leases and operates a private airplane hangar. The Company’s investment in 8901 Hangar, Inc. was $82,000 at both December 31, 2010 and 2009, and is included in “Other assets” on the Consolidated Balance Sheets.
All of the operations of the Company are in the United States, with its marketing efforts focused in the Rocky Mountain and Plains States regions of the United States. The Rocky Mountain region includes the states of Colorado, Wyoming, western Nebraska, Montana and Utah, and the Plains States include the states of Kansas, Oklahoma, eastern Nebraska, Iowa, Missouri, North Dakota and South Dakota. The Company purchases crude oil to be refined and markets the refined petroleum products produced, including various grades of gasoline, diesel fuel, jet fuel, asphalt, chemicals and petroleum coke. The operations of refining and marketing of petroleum products are considered part of one reporting segment.
| 2. | Significant Accounting Policies |
Revenue Recognition
Revenues from sales of refined products are earned and realized upon transfer of title to the customer based on the contractual terms of delivery (including payment terms and prices). Title primarily transfers at the refinery or terminal when the refined product is loaded into the common carrier pipelines, trucks or railcars (free on board origin). In some situations, title transfers at the customer’s destination (free on board destination). Nonmonetary product exchanges and certain buy/sell crude oil transactions which are entered into in the normal course of business are included on a net cost basis in “Raw material, freight and other costs” on the Consolidated Statements of Operations. Taxes collected from customers and remitted to governmental authorities are not included in reported revenues.
Property, Plant and Equipment
Property, plant and equipment additions are recorded at cost and depreciated using the straight-line method over the estimated useful lives, which range as follows:
| | Refineries, pipeline and terminal equipment | | 2 to 50 years |
| | Furniture, fixtures and other equipment | | 2 to 20 years |
The costs of components of property, net of salvage value, retired or abandoned are charged or credited to accumulated depreciation. Gains or losses on sales or other dispositions of property are recorded in operating income.
The Company reviews long-lived assets for impairments whenever events or changes in circumstances indicate that the carrying value of an asset may not be recoverable. If the undiscounted future cash flow of an asset to be held and used in operations is less than the carrying value, the Company would recognize a loss for the difference between the carrying value and fair value. When fair values are not available, the Company estimates fair value based on a discounted cash flow analysis.
The Company capitalizes interest on the long-term construction of significant assets. Interest capitalized for the years ended December 31, 2010, 2009 and 2008 was $1.9 million, $5.3 million and $6.6 million, respectively.
The following table shows the components of property, plant and equipment at both period ends:
| | | December 31, | |
| | | 2010 | | | 2009 | |
| | | (in thousands) | |
| | | | | | | |
| Refineries, pipelines and terminal equipment | | $ | 1,454,861 | | | $ | 1,389,351 | |
| Buildings | | | 43,271 | | | | 41,616 | |
| Land and land improvements | | | 15,592 | | | | 15,320 | |
| Furniture, fixtures and other equipment | | | 17,184 | | | | 17,284 | |
| Property, plant and equipment, at cost | | | 1,530,908 | | | | 1,463,571 | |
| Accumulated depreciation | | | (516,040 | ) | | | (442,162 | ) |
| Property, plant and equipment, net | | $ | 1,014,868 | | | $ | 1,021,409 | |
Turnarounds
Normal maintenance and repairs are expensed as incurred. Planned major maintenance (“turnarounds”) relates to the scheduled and required shutdowns of refinery processing units for significant overhaul and refurbishment. Turnaround costs include contract services, materials and rental equipment. The costs of turnarounds are deferred when incurred and amortized on a straight-line basis over the period of time estimated to lapse until the next turnaround occurs. These deferred charges are included in the Company’s Consolidated Balance Sheets in “Deferred turnaround and catalyst costs.” At December 31, 2010 and 2009, the deferred turnaround costs, net of accumulated amortization, were $41.0 million and $56.4 million, respectively. Also included in the Consol idated Balance Sheets, in “Deferred turnaround and catalyst costs,” are the costs of the catalyst that is replaced at periodic intervals when the quality of the catalyst has deteriorated beyond its prescribed function. The catalyst costs are deferred when incurred and amortized on a straight-line basis over the estimated useful life of the specific catalyst. At December 31, 2010 and 2009, the deferred catalyst costs, net of accumulated amortization were $10.4 million and $12.1 million, respectively. The amortization expenses resulting from the turnaround and catalyst costs of $23.8 million, $25.8 million and $22.9 million for the years ended December 31, 2010, 2009 and 2008, respectively, are included in “Depreciation, amortization and accretion” in the Company’s Consolidated Statements of Operations.
Inventories
Inventories of crude oil, unfinished products and all finished products are recorded at the lower of cost on a LIFO basis or market, which is determined using current estimated selling prices. Crude oil includes both domestic and foreign crude oil volumes at its cost and associated freight and other costs. Unfinished products (work in process) include any crude oil that has entered into the refining process, and other feedstocks that are not finished as far as refining operations are concerned. These include unfinished gasoline and diesel, blendstocks and other feedstocks. Finished product inventory includes saleable gasoline, diesel, jet fuel, chemicals, asphalt and other finished products. Unfinished and finished products inventory values have components of raw material, the associ ated raw material freight and other costs, and direct refinery operating expense allocated when refining begins relative to their proportionate market values. Refined product exchange transactions are considered asset exchanges with deliveries offset against receipts. The net exchange balance is included in inventory. Inventories of process chemicals and repairs and maintenance supplies and other are recorded at the lower of average cost or market. Crude oil inventories, unfinished product inventories and finished product inventories are used to secure financing for operations under the Company’s revolving credit facility. (See Note 8 “Revolving Credit Facility.”) The components of inventory as of December 31, 2010 and 2009 were as follows:
| | | | | | | |
| | | December 31, | |
| | | 2010 | | | 2009 | |
| | | (in thousands) | |
| | | | | | | |
| Crude oil | | $ | 319,452 | | | $ | 343,154 | |
| Unfinished products | | | 193,389 | | | | 101,436 | |
| Finished products | | | 86,160 | | | | 94,239 | |
| LIFO reserve - adjustment to inventories | | | (344,149 | ) | | | (272,634 | ) |
| | | | 254,852 | | | | 266,195 | |
| Process chemicals | | | 770 | | | | 1,162 | |
| Repairs and maintenance supplies and other | | | 25,225 | | | | 26,119 | |
| | | $ | 280,847 | | | $ | 293,476 | |
The Company uses the double extension, dollar value approach to price LIFO inventory. A single material business unit pool is used for all crude oil and unfinished and finished products inventories. An actual valuation of inventory under the LIFO method is made annually at the end of each fiscal year based on the inventory levels at that time. Interim LIFO calculations are based on year to date inventory levels at the interim period end. The interim LIFO calculations are subject to the annual LIFO inventory valuation at year end; accordingly, annual results may differ from interim results. During the year ended December 31, 2010, the Company reduced certain inventory quantities resulting in a liquidation of LIFO inventory quantities carried at lower costs prevailing in prior years compared to t he cost of 2010 purchases. The effect of these reductions resulted in a decrease of “Raw material, freight and other costs” of $12.0 million and an increase in “Net income” of $7.4 million after tax or $0.07 per diluted share in 2010. There were no material liquidations of LIFO inventory layers for the years ended December 31, 2009 and 2008. During the year ended December 31, 2010, the Company had inventory write-offs totaling $2.0 million for obsolete and excess repair and maintenance supplies.
Prepaid Insurance
The Company charges the amounts paid for insurance policies to expense over the term of the policy. Prepaid insurance related to policies with terms of one year or less, $6.6 million and $1.7 million as of December 31, 2010 and 2009, respectively, are included in “Other current assets” on the Consolidated Balance Sheets.
Income Taxes
The Company accounts for income taxes under the provisions of accounting principles generally accepted in the United States of America (“GAAP”) which requires the asset and liability approach for accounting for income taxes. Under this approach, deferred tax assets and liabilities are recognized based on anticipated future tax consequences attributable to differences between the financial statement carrying amounts of assets and liabilities and their respective tax basis. The Company recognizes liabilities, interest and penalties for potential tax issues based on its estimate of whether, and the extent to which, additional taxes may be due as determined under GAAP. See Note 9 “Income Taxes” for further information.
Environmental Expenditures
Environmental expenditures are expensed or capitalized based upon their future economic benefit. Costs that improve a property’s pre-existing condition, and costs that prevent future environmental contamination, are capitalized. Remediation costs related to environmental damage resulting from operating activities subsequent to acquisition are expensed. Liabilities for these expenditures are recorded when it is probable that obligations have been incurred and the amounts can be reasonably estimated.
Price Risk Management Activities
The Company, at times, enters into commodity derivative contracts to manage its price exposure to its inventory positions and purchases of foreign crude oil and to fix margins on certain future production. See Note 14, “Price and Interest Risk Management Activities” for detailed information on the Company’s price risk management activities.
Stock-based Compensation
The Company accounts for stock-based compensation in accordance with GAAP which requires companies to recognize the fair value of stock options and other stock-based compensation in the financial statements. See Note 10, under “Stock-based Compensation”, for detailed information on the Company’s stock-based compensation.
Asset Retirement Obligations
The Company accounts for asset retirement obligations as required under GAAP. GAAP requires that the fair value of a liability for an asset retirement obligation be recognized in the period in which it is incurred, with the associated asset retirement costs being capitalized as a part of the carrying amount of the long-lived asset.
The term “conditional asset retirement obligation” as used in GAAP literature refers to a legal obligation to perform an asset retirement activity in which the timing and/or method of settlement are conditional on a future event that may or may not be within the control of the entity. Because the obligation to perform the asset retirement activity is unconditional, the guidance provides that a liability for the fair value of a conditional asset obligation should be recognized if that fair value can be reasonably estimated, although uncertainty exists about the timing and/or method of settlement. The guidance also clarifies when an entity would have sufficient information to reasonably estimate the fair value of a conditional asset retirement obligation under GAAP.
The Company’s Consolidated Balance Sheets as of December 31, 2010 and 2009 recognized a net asset retirement obligation of $4.3 million and $5.4 million, respectively. At December 31, 2010, $686,000 of the $4.3 million was classified as current in “Accrued liabilities and other” and $3.6 million was included in “Other long-term liabilities.” At December 31, 2009, $919,000 of the $5.4 million was classified as current in “Accrued liabilities and other” and $4.5 million was included in “Other long-term liabilities.” Changes in the Company’s asset retirement obligations for the year ended December 31, 2010 were as follows (in thousands):
| Balance as of December 31, 2009 | | $ | 5,392 | |
| Liabilities incurred | | | - | |
| Liabilities settled | | | (120 | ) |
| Accretion expense | | | 325 | |
| Revisions to timing of estimated cash flows | | | (1,274 | ) |
| Balance as of December 31, 2010 | | $ | 4,323 | |
The Company has asset retirement obligations related to its Refineries and certain other assets as a result of environmental and other legal requirements. The Company is not required to perform such work in some circumstances until it permanently ceases operations of the long-lived assets. Because the Company considers the operational life of the Refineries and certain other assets indeterminable, an associated asset retirement obligation cannot be calculated at this time. The Company has recorded an asset retirement obligation for the handling and disposal of hazardous and non-hazardous substances that the Company is legally obligated to incur in connection with maintaining and improving the Refineries and certain other assets.
Foreign currency transactions
The Company at times has receivables and payables denominated in Canadian dollars from certain crude oil purchases and related taxes on such purchases. These amounts are accounted for in accordance with generally accepted accounting principles on the Consolidated Balance Sheets by translating the balances at the applicable exchange rates until they are settled. The corresponding gain or loss is recognized in the Consolidated Statements of Operations. For the years ended December 31, 2010, 2009 and 2008, the Company recognized a loss in “Other Revenues” of $618,000, $1.3 million and $457,000, respectively, due to the translation of its foreign denominated assets and liabilities.
Principles of Consolidation
The Consolidated Financial Statements include the accounts of FOC and all 100% owned subsidiaries. The Company utilizes the equity method of accounting for investments in entities in which it does not have the ability to exercise control. Entities in which the Company has the ability to exercise significant influence and control are consolidated. All intercompany transactions and balances are eliminated in consolidation.
Use of Estimates
The preparation of financial statements in conformity with GAAP requires management to make estimates and assumptions that affect the reported amounts of assets and liabilities and disclosures of contingent assets and liabilities at the date of the financial statements and the reported amounts of revenues and expenses during the reporting period. Actual results could differ from those estimates.
Subsequent Events
The Company has evaluated subsequent events through the date the financial statements were issued. See Note 15 “Subsequent Events”.
Cash Equivalents
Highly liquid investments with maturity, when purchased, of three months or less are considered to be cash equivalents. Cash equivalents were $556.7 million and $424.3 million at December 31, 2010 and 2009, respectively.
Supplemental Cash Flow Information
Cash payments for interest, net of capitalized interest, during 2010, 2009 and 2008 were $34.1 million, $21.7 million and $4.8 million, respectively. Cash payments for income taxes during 2010, 2009 and 2008 were $48.2 million, $36.2 million and $59.7 million, respectively. Cash refunds of income taxes during 2010, 2009 and 2008 were $137.1 million, $52.5 million and $24.9 million, respectively. Noncash investing activities include accrued capital expenditures of $7.7 million, $17.1 million and $26.9 million as of December 31, 2010, 2009 and 2008, respectively.
Reclassifications
Certain prior year amounts have been reclassified to conform to the current period financial statement presentation. The Company has reclassified turnaround and catalyst amortization on the Consolidated Statements of Operations from “Refinery operating expenses, excluding depreciation” to “Depreciation, amortization and accretion” to be more consistent with industry peers. The reclassifications have no effect on previously reported operating income (loss) or net income (loss). In addition, the Company has reflected the turnaround and catalyst costs paid as a separate line on the Consolidated Statements of Cash Flows. The reclassifications have no effect on previously reported cash provided by operating activities.
Related Party Transactions
During the first quarter of 2010, the Company made a relocation-related loan to an officer of one of its subsidiaries in the amount of $120,000 with a maximum term of one year. The Company accounted for this balance in “Other receivables” on the Consolidated Balance Sheet as of December 31, 2010. In February 2011, the term of this loan was extended an additional year.
New Accounting Pronouncements
In December 2009, the FASB issued Accounting Standards Update (“ASU”) 2009-17 which amended guidance to ASC 810 “Consolidations,” specifically, the consolidation guidance that applies to variable interest entities (“VIEs”). This statement amends current consolidation guidance to require companies to perform an analysis to determine whether a company’s variable interest or interests give it a controlling financial interest in a VIE and assess whether the company has implicit financial responsibility to ensure that the VIE operates as designed when determining if it has the power to direct the activities of the VIE that most significantly impact the entity’s economic performance. This statement also amends current guidance to require companies to perform ongoing reassess ments of whether the company is the primary beneficiary of a VIE. This statement amends certain guidance for determining whether an entity is a VIE, and the application of this revised guidance may change a company’s assessment of its VIEs. The statement is effective as of the beginning of the first fiscal year that begins after November 15, 2009. The adoption of ASU 2009-17, in the first quarter of 2010, did not have a material impact on the Company’s financial statements and disclosures.
In June 2009, the FASB issued ASU 2009-16, additional guidance to ASC 860, “Transfers and Servicing” to improve financial reporting by eliminating the exceptions for qualifying special-purpose entities from the consolidating guidance and eliminating the exception that permitted sale accounting for certain mortgage securitizations when a transferor has not surrendered control over the transferred financial assets. The statement also improves the comparability and consistency in accounting for transferred financial assets and enhances the information provided to financial statement users to provide greater transparency about transfers of financial assets and a transferor’s continuing involvement with transferred financial assets. Under the new guidance, many types of transferred financial assets that would have been derecognized previously are no longer eligible for derecognition. This new guidance enhances disclosures about the risks that a transferor continues to be exposed to because of its continuing involvement in transferred financial assets. The statement is effective for financial asset transfers occurring after the beginning of an entity’s first fiscal year that begins after November 15, 2009. The adoption of this ASU did not have a material impact on the Company’s financial statements and disclosures.
In January 2010, the FASB issued ASU 2010-06, which amended ASC 820, “Fair Value Measurements and Disclosures.” New disclosures included in this ASU require the Company to disclose separately the amounts of significant transfers in and out of Level 1 and Level 2 fair value measurements and the related reasoning for the transfer. Also included in the new disclosure requirements is the separate presentation of purchases, sales, issuances and settlements on a gross basis in the reconciliation for significant unobservable inputs, or Level 3 inputs. Further, this ASU clarifies existing fair value disclosures about the level of disaggregation and about inputs and valuation techniques used to measure fair value for either Level 2 or Level 3 measurements. Finally, this ASU amends guidance o n employers’ disclosures about postretirement benefit plan assets under ASC 715 to change terminology from major categories of assets to classes of assets on how to determine appropriate classes to present fair value disclosures. The new disclosures and clarifications of existing disclosures are effective for interim and annual reporting periods beginning after December 15, 2009, except for the disclosures about purchases, sales, issuances and settlements in the rollforward of activity in Level 3 fair value measurements. These Level 3 specific disclosures are effective for fiscal years beginning after December 15, 2010 and for interim periods within those fiscal years. The adoption of the disclosures required for the Company during the first quarter of 2010 did not have a material impact on the Company’s financial statement disclosures. The Company is evaluating the impact of the additional disclosures required for its 2011 filings relating to the Level 3 requirements.
In February 2010, the FASB issued ASU 2010-09, which amends ASC 855, “Subsequent Events” to address certain implementation issues related to the application of disclosure requirements under ASC 855. This ASU requires filers to “evaluate subsequent events through the date the financial statements are issued.” However, this ASU exempts filers from disclosing the date through which subsequent events have been evaluated, thus alleviating potential conflicts between ASC 850-10 and the SEC’s requirements. This ASU is effective immediately for financial statements that are issued, available to be issued or revised. As such, this revised guidance was effective for the Company in the first quarter 2010. The adoption of this guidance did not have a material impact on the Company’s financial statement disclosures.
In July 2010, the FASB issued ASU 2010-20, which amends ASC 310, “Receivables” to provide greater transparency about an entity’s allowance for credit losses and the credit quality of its financing receivables. This ASU requires an entity to disclose (1) the inherent credit risk in its financing receivables, (2) how the credit risk is analyzed and assessed in calculating the allowance for credit losses and (3) the changes and reasons for those changes in the allowance for credit losses. The scope of this ASU applies to all of the Company’s financing receivables, excluding its short-term trade accounts receivables. This ASU is effective for interim and annual reporting periods ending on or after December 31, 2010. There was no material impact in this 2010 annual report fro m the adoption of this ASU.
| | | December 31, | |
| | | 2010 | | | 2009 | |
| | | (in thousands) | |
| | | | | | | |
| Investment fund receivable, net of allowance | | $ | - | | | $ | 2,143 | |
| Realized futures trading receivable | | | - | | | | 2,341 | |
| Other | | | 1,734 | | | | 3,358 | |
| | | $ | 1,734 | | | $ | 7,842 | |
The Company had a $32.7 million investment in a money market fund called the Reserve Primary Fund (“Fund”) that was deemed illiquid in September 2008. The Fund is currently overseen by the SEC, which is determining the amounts and timing of liquidation. Through December 31, 2010, the Company had received total distributions of $32.4 million. As of December 31, 2010, the Company has a loss allowance for the entire remaining receivable balance of $315,000 and thus the Company has no remaining net investment fund receivable. As the distributions received during 2010 exceeded the net investment of $2.1 million as of December 31, 2009, the Company reduced the previously recorded loss allowance on this investment by $184,000, which increased “Interest and Investment Income” on the Consolidated Statements of Operations. While still awaiting final notice regarding proceeds from the Fund, the Company does not anticipate further distributions. If there are any additional distributions received by the Company, they will be recorded into subsequent periods as income.
| | | December 31, | |
| | | 2010 | | | 2009 | |
| | | (in thousands) | |
| | | | | | | |
| Margin deposits | | $ | 3,569 | | | $ | 10,898 | |
| Derivative assets | | | 1,195 | | | | 124 | |
| Prepaid insurance | | | 6,599 | | | | 1,705 | |
| Other | | | 1,618 | | | | 1,780 | |
| | | $ | 12,981 | | | $ | 14,507 | |
| 5. | Accrued Liabilities and Other |
| | | December 31, | |
| | | 2010 | | | 2009 | |
| | | (in thousands) | |
| | | | | | | |
| Accrued compensation | | $ | 21,427 | | | $ | 26,093 | |
| Accrued property taxes | | | 5,805 | | | | 5,573 | |
| Accrued interest | | | 6,188 | | | | 7,638 | |
| Accrued environmental costs | | | 2,245 | | | | 7,599 | |
| Derivative liabilities | | | 2,389 | | | | 6,551 | |
| Accrued dividends | | | 334 | | | | 6,979 | |
| Other | | | 4,024 | | | | 4,366 | |
| | | $ | 42,412 | | | $ | 64,799 | |
| | | December 31, | |
| | | 2010 | | | 2009 | |
| | | (in thousands) | |
| | | | | | | |
| 6.875% Senior Notes (Due November 15, 2018) | | $ | 150,000 | | | $ | - | |
| 6.625% Senior Notes (Due October 1, 2011, redeemed in 2010) | | | - | | | | 150,000 | |
| | | | | | | | | |
| 8.5% Senior Notes (Due September 15, 2016) | | | 200,000 | | | | 200,000 | |
| Less discount | | | (2,227 | ) | | | (2,515 | ) |
| 8.5% Senior Notes, net | | | 197,773 | | | | 197,485 | |
| | | | | | | | | |
| | | $ | 347,773 | | | $ | 347,485 | |
In November 2010, the Company issued $150.0 million principal amount of 6.875% Senior Notes. The 6.875% Senior Notes, which mature on November 15, 2018, were issued at par, and the Company received net proceeds (after underwriting fees) of $147.0 million. Interest will be paid semi-annually on May 15 and November 15. The 6.875% Senior Notes are redeemable, at the option of the Company, at 103.44% after November 15, 2014, declining to 100.00% in 2016. Prior to November 15, 2014, the Company may at its option redeem the 6.875% Senior Notes at a make-whole price comprised of 103.44% of the principal amount plus a make-whole amount. The make-whole amount is the excess, if any, of the present value of the remaining interest and principal payments due on the 6.875% Senior Notes as if such notes were redeemed on November 15, 2014 computed using a discount rate equal to the Treasury Rate plus 50 basis points, over the principal amount of the notes. The 6.875% Senior Notes may restrict payments, including dividends, and limit the incurrence of additional indebtedness based on covenants related to interest coverage and restricted payments. Frontier Holdings Inc. and its material subsidiaries are full and unconditional guarantors of the 6.875% Senior Notes (see Note 16 “Consolidating Financial Statements”). The proceeds of the 6.875% Senior Notes were used to redeem the Company’s 6.625% Senior Notes which had a maturity date of October 1, 2011.
Pursuant to a tender and consent offer, in November 2010 the Company redeemed $104.5 million principal amount of its 6.625% Senior Notes which had been issued in October 2004 and which had been scheduled to mature on October 1, 2011. In connection with this redemption, which was at 97.3% of par resulting in a gain on the redemption of $2.8 million, the Company paid $3.1 million (3% of par) in consent payments, resulting in a net loss on the extinguishment. The remaining $45.5 million principal amount of its 6.625% Senior Notes were redeemed at 100% of par in December 2010. The Company incurred a net loss on the early redemption of the 6.625% Senior Notes of $750,000 which included the consent payment mentioned above and the write-off of the remaining unamortized debt issuance costs and is included in R 20;Interest expense and other financing costs” in the 2010 Statement of Operations.
In September 2008, the Company issued $200.0 million aggregate principal amount of 8.5% Senior Notes. The 8.5% Senior Notes, which mature on September 15, 2016, were issued at a 1.42% discount ($2.8 million) resulting in total Senior Notes, net of discount, of $197.2 million. The Company received net proceeds (after underwriting fees) of $195.3 million. Interest is paid semi-annually on March 15 and September 15. The 8.5% Senior Notes are redeemable, at the option of the Company, at 104.25% after September 15, 2012, declining to 100.00% in 2014. Prior to September 15, 2012, the Company may at its option redeem the 8.5% Senior Notes at a make-whole price comprised of 104.25% of the principal amount plus a make-whole amount. The make-whole amount is the excess, if any, of the present v alue of the remaining interest and principal payments due on the 8.5% Senior Notes as if such notes were redeemed on September 15, 2012 computed using a discount rate equal to the Treasury Rate plus 50 basis points, over the principal amount of the notes. The 8.5% Senior Notes may restrict payments, including dividends, and limit the incurrence of additional indebtedness based on covenants related to interest coverage and restricted payments. Frontier Holdings Inc. and its material subsidiaries are full and unconditional guarantors of the 8.5% Senior Notes (see Note 16 “Consolidating Financial Statements”).
| 7. | Other Long-term Liabilities |
| | | December 31, | |
| | | 2010 | | | 2009 | |
| | | (in thousands) | |
| | | | | | | |
| Environmental liabilities | | $ | 6,165 | | | $ | 12,237 | |
| Deferred compensation liability | | | 4,093 | | | | 3,578 | |
| Asset retirement obligations | | | 3,636 | | | | 4,474 | |
| Other | | | 172 | | | | 271 | |
| | | $ | 14,066 | | | $ | 20,560 | |
| 8. | Revolving Credit Facility |
The refining operations have a working capital credit facility with a group of banks led by Union Bank of California and BNP Paribas (“Facility”). The Facility, collateralized by inventory, accounts receivable and related contracts and intangibles, and certain deposit accounts, provides working capital financing for operations, generally the financing of crude oil and product supply. The Facility matures in August 2012. The maximum amount available under this agreement is $500 million and has a margin at a range from 1.5% to 2% plus the base rate or LIBOR rate, as applicable. The Facility provides for a quarterly commitment fee from 0.30% to 0.375% per annum plus standard issuance and renewal fees. No funds were borrowed at any time during 2010 or 2009 under the Facility, and thus the Company did not incur any interest expense under the Facility in 2010 or 2009. The Company had average daily borrowings of $4.8 million during 2008 under the Facility, with interest expense incurred of $193,000 at an average interest rate of 4.041%. The Facility is subject to compliance with financial covenants relating to cash coverage, debt leverage and current ratios and permitted consolidated long-term funded indebtedness. The Company was in compliance with these covenants at December 31, 2010. No borrowings were outstanding at December 31, 2010 or 2009, under the Facility. Standby letters of credit outstanding were $292.0 million and $53.0 million at December 31, 2010 and 2009, respectively. As of December 31, 2010, the Company had borrowing base availability of $208.0 million under the Facility.
The Facility restricts payments to FOC from its subsidiaries and thus, as required by Regulation 210.5-04 of Regulation S-X of the Securities Exchange Act of 1934, as amended, the Condensed Financial Information of FOC is included in Schedule I of this Form 10-K.
The provision (benefit) for income taxes is comprised of the following:
| | | Years ended December 31, | |
| | | 2010 | | | 2009 | | | 2008 | |
| | | (in thousands) | |
| Current: | | | | | | | | | |
| Federal | | $ | 15,088 | | | $ | (78,177 | ) | | $ | (51,136 | ) |
| State | | | (1,249 | ) | | | (423 | ) | | | (2,944 | ) |
| Total current provision (benefit) | | | 13,839 | | | | (78,600 | ) | | | (54,080 | ) |
| Deferred: | | | | | | | | | | | | |
| Federal | | | 2,436 | | | | 40,332 | | | | 174,437 | |
| State | | | (473 | ) | | | (9,250 | ) | | | (4,671 | ) |
| Total deferred provision | | | 1,963 | | | | 31,082 | | | | 169,766 | |
| | | | | | | | | | | | | |
| Total provision (benefit) | | $ | 15,802 | | | $ | (47,518 | ) | | $ | 115,686 | |
The following is a reconciliation of the provision (benefit) for income taxes computed at the statutory United States income tax rates on pretax income and the provision (benefit) for income taxes as reported:
| | | Years ended December 31, | |
| | | 2010 | | | 2009 | | | 2008 | |
| | | (in thousands) | |
| | | | | | | | | | |
| Provision (benefit) based on statutory rates | | $ | 18,755 | | | $ | (45,947 | ) | | $ | 119,609 | |
| Increase (decrease) resulting from: | | | | | | | | | | | | |
| State income tax benefit | | | (1,722 | ) | | | (9,673 | ) | | | (7,615 | ) |
| Federal tax effect of state income taxes | | | 603 | | | | 3,385 | | | | 2,666 | |
| Federal tax contingency reversals and adjustments | | | (580 | ) | | | - | | | | (2,856 | ) |
(Benefit) increase from the Section 199 manufacturers deduction | | | (564 | ) | | | 838 | | | | 3,052 | |
| Other, including permanent book-tax differences | | | (690 | ) | | | 3,879 | | | | 830 | |
| Provision (benefit) as reported | | $ | 15,802 | | | $ | (47,518 | ) | | $ | 115,686 | |
Significant components of deferred tax assets and liabilities are shown below:
| | | December 31, 2010 | | | December 31, 2009 | |
| | | State | | | Federal | | | Total | | | State | | | Federal | | | Total | |
| | | (in thousands) | |
| Current deferred tax assets: | | | | | | | | | | | | | | | | | | |
| Gross current assets: | | | | | | | | | | | | | | | | | | |
| Inventory differences | | $ | 2,183 | | | $ | 15,556 | | | $ | 17,739 | | | $ | 996 | | | $ | 7,261 | | | $ | 8,257 | |
| Accrued bonuses | | | 776 | | | | 5,527 | | | | 6,303 | | | | 917 | | | | 6,685 | | | | 7,602 | |
| Stock-based compensation | | | 943 | | | | 6,719 | | | | 7,662 | | | | 1,053 | | | | 7,681 | | | | 8,734 | |
| Environmental liability accruals | | | 107 | | | | 763 | | | | 870 | | | | 359 | | | | 2,620 | | | | 2,979 | |
| Kansas income tax credits | | | - | | | | - | | | | - | | | | 304 | | | | - | | | | 304 | |
Unrealized loss on derivative contracts | | | 104 | | | | 743 | | | | 847 | | | | 308 | | | | 2,250 | | | | 2,558 | |
Current state income tax liabilities | | | - | | | | 16 | | | | 16 | | | | - | | | | 85 | | | | 85 | |
| Other | | | 203 | | | | 1,442 | | | | 1,645 | | | | 207 | | | | 1,512 | | | | 1,719 | |
| Total gross current assets | | | 4,316 | | | | 30,766 | | | | 35,082 | | | | 4,144 | | | | 28,094 | | | | 32,238 | |
| | | | | | | | | | | | | | | | | | | | | | | | | |
| Gross current liabilities: | | | | | | | | | | | | | | | | | | | | | | | | |
| Prepaid expenses and other | | | (374 | ) | | | (2,660 | ) | | | (3,034 | ) | | | (94 | ) | | | (685 | ) | | | (779 | ) |
| State income tax receivables | | | - | | | | (152 | ) | | | (152 | ) | | | - | | | | (3,669 | ) | | | (3,669 | ) |
| State deferred taxes | | | - | | | | (1,380 | ) | | | (1,380 | ) | | | - | | | | (1,417 | ) | | | (1,417 | ) |
| Total gross current liabilities | | | (374 | ) | | | (4,192 | ) | | | (4,566 | ) | | | (94 | ) | | | (5,771 | ) | | | (5,865 | ) |
| Total current net deferred tax assets | | $ | 3,942 | | | $ | 26,574 | | | $ | 30,516 | | | $ | 4,050 | | | $ | 22,323 | | | $ | 26,373 | |
| | | | | | | | | | | | | | | | | | | | | | | | | |
| Long-term deferred tax liabilities: | | | | | | | | | | | | | | | | | | | | | | | | |
| Gross long-term assets: | | | | | | | | | | | | | | | | | | | | | | | | |
Pension and other post- retirement benefits | | $ | 2,127 | | | $ | 15,160 | | | $ | 17,287 | | | $ | 1,590 | | | $ | 11,598 | | | $ | 13,188 | |
Interest on contingent income taxes | | | 45 | | | | 323 | | | | 368 | | | | 305 | | | | 2,223 | | | | 2,528 | |
| Environmental liability accruals | | | 233 | | | | 1,660 | | | | 1,893 | | | | 188 | | | | 1,374 | | | | 1,562 | |
| Asset retirement obligations | | | 179 | | | | 1,273 | | | | 1,452 | | | | 215 | | | | 1,566 | | | | 1,781 | |
| Kansas income tax credits | | | 30,936 | | | | - | | | | 30,936 | | | | 27,356 | | | | - | | | | 27,356 | |
| State net operating losses | | | 13,209 | | | | - | | | | 13,209 | | | | 14,600 | | | | - | | | | 14,600 | |
| Other | | | 211 | | | | 1,713 | | | | 1,924 | | | | 176 | | | | 1,846 | | | | 2,022 | |
| Total gross long-term assets | | | 46,940 | | | | 20,129 | | | | 67,069 | | | | 44,430 | | | | 18,607 | | | | 63,037 | |
| Gross long-term liabilities | | | | | | | | | | | | | | | | | | | | | | | | |
| Depreciation | | | (33,159 | ) | | | (236,336 | ) | | | (269,495 | ) | | | (30,959 | ) | | | (225,933 | ) | | | (256,892 | ) |
| Deferred turnaround costs | | | (2,013 | ) | | | (14,347 | ) | | | (16,360 | ) | | | (2,704 | ) | | | (19,724 | ) | | | (22,428 | ) |
| State deferred taxes | | | - | | | | (4,119 | ) | | | (4,119 | ) | | | - | | | | (3,768 | ) | | | (3,768 | ) |
Total long-term net deferred tax assets (liabilities) | | $ | 11,768 | | | $ | (234,673 | ) | | $ | (222,905 | ) | | $ | 10,767 | | | $ | (230,818 | ) | | $ | (220,051 | ) |
As of December 31, 2010, the Company had a federal income tax receivable of $48.9 million and a state income tax receivable of $426,000, which was included in “Income taxes receivable” on the Consolidated Balance Sheet. The federal income tax receivable includes $18.2 million for the 2010 estimated income tax overpayments as well as a $29.6 million receivable for the carryback of the net operating loss (“NOL”) generated in 2008.
The Company recognized the benefits of $2.9 million, $4.5 million and $23.3 million in 2010, 2009 and 2008, respectively for Kansas income tax credits related to expansion projects completed in the years 2006 through 2010 at its El Dorado Refinery. The Company also recognized the benefit of $656,000 Kansas Business and Job Development income tax credits in 2010. Of the $31.4 million Kansas income tax credits, the Company has taken tax credits related to the expansion projects of $217,000 on the Company’s amended 2006 Kansas income tax return and $217,000 on the Company’s 2007 Kansas income tax return, both filed in 2008. The remaining $30.9 million of Kansas income tax credits (reflected as deferred tax assets as of December 31, 2010), are scheduled to be taken over the years 2011 thru 2019.
As of December 31, 2010, the Company has no federal NOLs to offset future taxable income since NOLs generated in 2009 and 2008 were carried back to prior years to facilitate refunds of taxes paid in earlier years. The Company generated state NOLs in 2009 and 2008 and will utilize some of those NOLs to offset the respective states’ 2010 taxable income. As of December 31, 2010, the Company has estimated remaining state NOLs of approximately $143.1 million in Kansas (of which $23.5 million expires after 2018 and the remainder after 2019), $47.1 million in Colorado (of which $6.8 million expires after 2028 and the remainder after 2029) and $11.1 million in Nebraska (of which $2.1 million expires after 2013 and the remainder after 2014), which will be carried forward to reduce income taxes payable in future years.& #160; The state of Colorado has placed a limit on the amount of NOLs which can be utilized in each of the years 2011, 2012 and 2013 to $250,000.
The Company recognizes the amount of taxes payable or refundable for the current year and recognizes deferred tax liabilities and assets for the expected future tax consequences of events and transactions that have been recognized in the Company’s financial statements or tax returns. Deferred tax assets are reduced by a valuation allowance when, in the opinion of management, it is more likely than not that some or all of its deferred tax assets will not be realized. Realization of the deferred income tax assets is dependent on generating sufficient taxable income in future years. Although realization is not assured, management believes that it is more likely than not that all of the deferred income tax assets will be realized and thus, no valuation allowance was provided as of December 31, 2010 and 2009.
During 2010 and 2009, the Company recognized net decreases in its pool of excess income tax benefits of stock-based compensation (“APIC pool”) in the amounts of $2.2 million and $2.9 million, respectively. The Company recognized an increase in its APIC pool in the amount of $5.3 million for the year ended December 31, 2008. Excess income tax benefits are the benefits from deductions that are allowed for income tax purposes in excess of expenses recorded in the Company’s financial statements. Such increases or decreases were recorded as an increase (decrease) in additional paid-in capital, offset by a reduction of income taxes payable, increase or decrease in income taxes receivable or an increase or decrease in “Contingent income tax liabilities.” & #160;The Company also recognized increases in deferred income tax assets related to the minimum defined benefit liability reflected in “Accumulated other comprehensive income (loss)” in the amounts of $3.3 million, $317,000, and $1.4 million for the years ended December 31, 2010, 2009 and 2008, respectively.
The Company has been notified that its 2009 U.S. Federal income tax return has been selected for audit, but field work has not yet begun. Field work for U.S. Federal income tax examinations on the Company for 2008, 2007, 2006 and 2005 has been completed but an issue related to all four of these years regarding the deductibility for income tax purposes of certain stock-based compensation for executives has not yet been resolved. The specific issue not yet resolved is limited to these four taxable years and will not be ongoing as 2008 was the final year of activity for the specific stock-based compensation. During 2010, the Company was unsuccessful during the IRS appeals process of this issue for 2006 and 2005 proposed adjustments. As such, the Company received a Notice of Deficiency from the Internal Reven ue Service for approximately $13.9 million of additional 2005 taxes and approximately $4.2 million of additional 2006 taxes. The Company filed a petition for a redetermination of this deficiency with the U.S. Tax Court on September 22, 2010. In November 2010, in order to stop interest from continuing to accrue, the Company chose to pay the 2006 and 2005 deficiency amounts (totaling $18.1 million and the related accrued interest to date ($6.3 million)) while it appeals this ruling in the U.S. Tax Court. Should the Company prevail on its U.S. Tax Court petition, these amounts will be refunded to the Company. The Company has also received a notice of proposed adjustment from the Internal Revenue Service regarding approximately $711,000 of additional 2007 taxes related to this issue of deductibility of certain stock-based compensation. The Company has submitted a protest of this 2007 amount and is in the appeals process. The $711,000 deficiency amount for 2007 was withheld by the Internal Revenue Service from an income tax refund owed to the Company for a 2007 amended return and which would also be refunded to the Company if it prevails in the appeal and/or U.S. Tax Court process. The Internal Revenue Service has also indicated a notice of proposed adjustment will be issued regarding approximately $460,000 of additional 2008 taxes due because of the same issue on stock-based compensation. As discussed below, the Company has provided income tax contingencies for these amounts in the event it is unsuccessful in its appeal.
The Company recognizes liabilities, interest and penalties for potential tax issues based on its estimate of whether, and the extent to which, additional taxes may be due as determined under ASC 740 “Income Taxes.” Although the amounts the Company has paid are no longer reflected as a liability on the Consolidated Balance Sheet, as of December 31, 2010, the amounts are still included in the following table of unrecognized tax benefits. A reconciliation of the beginning and ending amount of unrecognized tax benefits, excluding accrued interest and the federal income tax benefit of state contingencies for the years ended December 31, 2010, 2009 and 2008 is as follows (in thousands):
| | | Years ended December 31, | |
| | | 2010 | | | 2009 | | | 2008 | |
| | | | | | | | | | |
| Balance beginning of year | | $ | 23,854 | | | $ | 24,278 | | | $ | 28,324 | |
| Additions based on tax positions related to the current year | | | - | | | | - | | | | 521 | |
| Additions for tax positions of prior years | | | 81 | | | | - | | | | 1,294 | |
| Reductions for tax positions of prior years | | | (630 | ) | | | (424 | ) | | | (120 | ) |
| Settlements | | | - | | | | - | | | | - | |
| Reductions due to lapse of applicable statutes of limitations | | | (728 | ) | | | - | | | | (5,741 | ) |
| Balance end of year | | $ | 22,577 | | | $ | 23,854 | | | $ | 24,278 | |
The Company recognizes penalties and interest accrued related to unrecognized tax benefits in “Interest expense and other financing costs” on the Consolidated Statements of Operations. During the years ended December 31, 2010, 2009 and 2008, the Company recognized approximately $848,000 (net of reversals of $325,000), $1.7 million and $530,000 (net of reversals of $1.2 million), respectively, of interest expense on contingent income tax liabilities. The Company had approximately $922,000 and $6.4 million in accrued interest on income tax contingencies at December 31, 2010 and 2009, respectively.
The total contingent income tax liabilities and accrued interest of $3.8 million and $29.3 million are reflected in the Consolidated Balance Sheet at December 31, 2010 and 2009, respectively, in “Contingent income tax liabilities.” These contingencies relate to the deductibility for income tax purposes of certain stock-based compensation for executives and the treatment of certain items for state income tax purposes. The Company has no tax positions for which the ultimate deductibility is highly certain but for which there is uncertainty about the timing of such deductibility. Total unrecognized tax benefits at December 31, 2010 that, if recognized, would affect the effective tax rate were $898,000.
The regular statutes of limitations for contingencies related to the Company’s 2005 and 2006 U.S. Federal income tax returns would normally have expired in the third quarter of 2009 and 2010, respectively; however, these years are still open only as they relate to the unresolved stock-based compensation issue while waiting for the U.S. Tax Court petition process to conclude. These two years are also considered to be open for state purposes on this issue. The statutes of limitations for the stock-based compensation issue contingencies related to the Company’s 2007 U.S. Federal and the majority of its 2007 state income tax returns are currently scheduled to expire in the third quarter of 2011; however, unless the 2007 appeals process and the U.S. Tax Court petition process related to 2006 and 2005 have bot h been completed, an extension of the statute of limitations related only to this unresolved issue is likely.
The states’ statute of limitations for certain contingencies related to the treatment of certain items on the Company’s 2006 and 2007 state income tax returns (totaling $1.1 million, included accrued interest as of December 31, 2010) will expire in the third and fourth quarters of 2011.
As of December 31, 2010, the Company is generally open to examination in the United States and various individual states for tax years ended December 31, 2007 through December 31, 2010.
Dividends
All outstanding common shareholders at the declaration date are eligible to participate in dividends. The payment of dividends is prohibited under the Company’s revolving credit facility only if a default has occurred and is continuing or such payment would cause a default. The 6.875% Senior Notes and 8.5% Senior Notes may restrict dividend payments based on covenants related to interest coverage and a restricted payments calculation.
The Company’s Board of Directors declared a quarterly cash dividend of $0.06 per share of common stock in November 2009, which was paid in January 2010. During the remainder of 2010, the Company was unable to declare dividends under the restricted payments provision of the indentures governing its Senior Notes. Due to the Company’s positive results of operations for the year ended December 31, 2010, it is no longer limited by these contractual restrictions. On February 21, 2011, the Company’s Board of Directors declared a special dividend of $0.28 per share and a quarterly dividend of $0.06 per share, payable on March 21, 2011 to shareholders of record on March 7, 2011.
As of December 31, 2010, the Company had $286.2 million and $298.0 million available for dividends and/or other restricted payments under the restricted payments baskets of its 6.875% Senior Notes and 8.5% Senior Notes covenants, respectively (collectively, the “Senior Notes”).
Treasury stock
The Company accounts for its treasury stock under the cost method on a first-in, first-out basis. Through December 31, 2009, the Company’s Board of Directors has approved a total of $400.0 million for share repurchases, of which $299.8 million has been utilized (none in 2010). During 2010 the Company was unable to repurchase shares in the open market due to the restricted payments provisions of the indentures governing its Senior Notes. As of December 31, 2010 no such restrictions remain. A rollforward of treasury stock for the year ended December 31, 2010 is as follows:
| | | Number of shares | | | Amount | |
| | | (in thousands except share amounts) | |
| | | | | | | |
| Balance as of December 31, 2009 | | | 27,165,400 | | | $ | 395,242 | |
| Shares received to fund withholding taxes | | | 267,583 | | | | 3,613 | |
| Shares issued for restricted stock unit vestings | | | (48,150 | ) | | | (88 | ) |
Shares issued for stock grants and restricted stock grants, net of forfeits | | | (410,810 | ) | | | (756 | ) |
| Shares issued for conversion of stock unit awards | | | (876,625 | ) | | | (1,605 | ) |
| Balance as of December 31, 2010 | | | 26,097,398 | | | $ | 396,406 | |
Earnings per Share
The following sets forth the computation of diluted earnings per share (“EPS”) for the years ended December 31, 2010, 2009 and 2008.
| | | 2010 | | | 2009 | | | 2008 | |
| | | Income (Num-erator) | | | Shares (Denomi-nator) | | | Per Share Amount | | | Income (Num-erator) | | | Shares (Denomi-nator) | | | Per Share Amount | | | Income (Num-erator) | | | Shares (Denomi-nator) | | | Per Share Amount | |
| | | (in thousands except per share amounts) | |
| Basic EPS: | | | | | | | | | | | | | | | | | | | | | | | | | | | |
| Net income (loss) | | $ | 37,785 | | | | 104,261 | | | $ | 0.36 | | | $ | (83,760 | ) | | | 103,597 | | | $ | (0.81 | ) | | $ | 226,053 | | | | 103,139 | | | $ | 2.19 | |
| Dilutive securities: | | | | | | | | | | | | | | | | | | | | | | | | | | | | | | | | | |
| Stock options | | | | | | | - | | | | | | | | | | | | - | | | | | | | | | | | | 40 | | | | | |
| Restricted stock and stock unit awards | | | | | | | 1,465 | | | | | | | | | | | | - | | | | | | | | | | | | 428 | | | | | |
| Diluted EPS: | | | | | | | | | | | | | | | | | | | | | | | | | | | | | | | | | | | | |
| Net income (loss) | | $ | 37,785 | | | | 105,726 | | | $ | 0.36 | | | $ | (83,760 | ) | | | 103,597 | | | $ | (0.81 | ) | | $ | 226,053 | | | | 103,607 | | | $ | 2.18 | |
For the years ended December 31, 2010, 2009 and 2008, 434,793, 434,793 and 449,591 outstanding stock options that could potentially dilute EPS in future years were not included in the computation of diluted EPS as they were anti-dilutive. In addition, for the year ended December 31, 2009, there were 1.2 million shares of outstanding restricted stock and stock unit awards that could potentially dilute EPS in future years that were not included in the computation of diluted EPS as they were anti-dilutive due to the Company’s net loss.
Stock-based Compensation
Stock-based compensation costs and income tax benefits recognized in the Consolidated Statements of Operations for the years ended December 31, 2010, 2009 and 2008 are as follows:
| | | Years Ended December 31, | |
| | | 2010 | | | 2009 | | | 2008 | |
| | | (in thousands) | |
| | | | | | | | | | |
| Restricted shares and units | | $ | 11,035 | | | $ | 16,038 | | | $ | 12,233 | |
| Stock options | | | - | | | | 304 | | | | 1,004 | |
| Contingently issuable stock unit awards | | | 4,805 | | | | 4,266 | | | | 6,777 | |
| Total stock-based compensation expense | | $ | 15,840 | | | $ | 20,608 | | | $ | 20,014 | |
| | | | | | | | | | | | | |
| Income tax benefit recognized in the income statement | | $ | 6,019 | | | $ | 7,831 | | | $ | 6,730 | |
Omnibus Incentive Compensation Plan. The Company’s Omnibus Incentive Compensation Plan (the “Plan”) is a broad-based incentive plan that provides for granting stock options, stock appreciation rights (“SAR”), restricted stock awards, performance awards, stock units, bonus shares, dividend equivalent rights, other stock-based awards and substitute awards (“Awards”) to employees, consultants and non-employee directors of the Company. The original maximum number of shares of the Company’s common stock that may be issued under the Plan with respect to Awards was 12,000,000 shares, subject to certain adjustments as provided by the Plan. The number of shares available for Awards under the original Plan will be reduced by 1.7 times the number of shares for each stock-denominated award granted, other than an option or a SAR under the Plan, and will be reduced by 1.0 times the number of option shares or SARs granted. At the annual meeting held on April 28, 2010, the shareholders of the Company approved the First Amendment to the Frontier Oil Corporation Omnibus Incentive Compensation Plan (the “Amendment”). The Amendment increased the maximum aggregate number of shares that may be allowed with respect to Awards granted under the plan by 7,100,000 shares. The number of shares available for Awards under the new 7,100,000 share pool will be reduced by 1.6 times the shares for each stock award granted, other than an option or SAR under the Plan, and will be reduced by 1.0 times the number of options or SARs granted. As of December 31, 2010, 7,467,488 shares were available to be awarded under the Plan assuming maximum payout is achieved on the contingently is suable awards made in 2009 and 2010 and the achieved performance level on the 2008 contingently issuable awards (see “Contingently Issuable Awards” below). For purposes of determining compensation expense, forfeitures are estimated at the time Awards are granted based on historical average forfeiture rates and the group of individuals receiving those Awards. The Plan provides that the source of shares for Awards may be either newly issued shares or treasury shares. For the year ended December 31, 2010, treasury shares were re-issued for stock awards and restricted stock awards. The Company does not plan to repurchase additional treasury shares in 2011 strictly for issuing share Awards; however, treasury shares that are repurchased or are currently in treasury may be issued as share Awards in 2011. As of December 31, 2010, there was $17.5 million of total unrecognized compensation cost related to the Plan, including costs for restricted stock and performance-based awards, which is expected to be recognized over a weighted-average period of 1.79 years.
Stock Options. Stock options are issued at the current market price of the Company’s common stock on the date of grant and generally vest ratably over three years and expire after five years. The grant date fair value is calculated using the Black-Scholes option pricing model. The Company uses historical employee exercise data, including post-vesting termination behavior, to estimate the expected life of the options. Expected volatility is calculated using the historical volatility of the price of the Company’s common stock. The risk-free interest rate is based on the U.S. Treasury yield curve in effect at the time of the grant. No stock options were granted during the years ended December 31, 2010, 2009 o r 2008.
For the fully vested stock options granted in 2006 when common stock dividends are declared by the Company’s Board of Directors, dividend equivalents will be paid concurrently with common stock dividends until the options are exercised or expire.
Stock option changes during the years ended December 31, 2010, 2009 and 2008 are presented below:
| | | 2010 | | | 2009 | | | 2008 | |
| | | Number of awards | | | Weighted-Average Exercise Price | | | Aggregate Intrinsic Value of Options (in thousands) | | | Number of awards | | | Weighted-Average Exercise Price | | | Number of awards | | | Weighted-Average Exercise Price | |
| | | | | | | | | | | | | | | | | | | | | | |
Outstanding at beginning of year | | | 434,793 | | | $ | 29.3850 | | | $ | - | | | | 464,591 | | | $ | 28.5868 | | | | 624,591 | | | $ | 22.4021 | |
| Granted | | | - | | | | - | | | | | | | | - | | | | - | | | | - | | | | - | |
| Exercised or issued | | | - | | | | - | | | | | | | | (15,000 | ) | | | 4.6625 | | | | (160,000 | ) | | | 4.4438 | |
| Expired or forfeited | | | - | | | | - | | | | | | | | (14,798 | ) | | | 29.3850 | | | | - | | | | - | |
Outstanding at end of year | | | 434,793 | | | $ | 29.3850 | | | $ | - | | | | 434,793 | | | $ | 29.3850 | | | | 464,591 | | | $ | 28.5868 | |
| | | | | | | | | | | | | | | | | | | | | | | | | | | | | |
Vested or expected to vest at end of year | | | 434,793 | | | $ | 29.3850 | | | $ | - | | | | 434,793 | | | $ | 29.3850 | | | | 462,489 | | | $ | 28.5832 | |
| | | | | | | | | | | | | | | | | | | | | | | | | | | | | |
Exercisable at end of period | | | 434,793 | | | $ | 29.3850 | | | $ | - | | | | 434,793 | | | $ | 29.3850 | | | | 235,039 | | | $ | 27.8072 | |
| | | | | | | | | | | | | | | | | | | | | | | | | | | | | |
Weighted-average fair value of options granted during the year | | | | | | | n/a | | | | | | | | | | | | n/a | | | | | | | | n/a | |
There were no stock options exercised during the year end December 31, 2010. The Company received $70,000 and $405,000 of cash for stock options exercised during the years ended December 31, 2009 and 2008, respectively. The total intrinsic value of stock options exercised during the years ended December 31, 2009 and 2008 was $160,000 and $3.7 million, respectively. The Company realized $61,000 and $1.4 million of income tax benefits, nearly all of which increased its APIC pool, during the years ended December 31, 2009 and 2008, respectively, related to the exercises of stock options. All outstanding stock options were vested and exercisable at December 31, 2010 with weighted average remaining contractual lives of 0.33 years.
Restricted Shares and Restricted Stock Units. Restricted shares and restricted stock units, when granted, are valued at the closing market value of the Company’s common stock on the date of issuance and amortized to compensation expense on a straight-line basis over the nominal vesting period of the stock. The restricted shares and restricted stock units have vesting dates up to three years from the issue date. When common stock dividends are declared by the Company’s Board of Directors, dividends are accrued on the issued restricted shares but are not paid until the shares vest. When common stock dividends are declared by the Company’s Board of Directors, dividend equivalents are accrued on the restricted stock units and paid when the common stock dividends are paid.
The following table summarizes the changes in the Company’s restricted shares and restricted stock units during the years ended December 31, 2010, 2009 and 2008.
| | | 2010 | | | 2009 | | | 2008 | |
| | | Shares / Units | | | Weighted-Average Grant-Date Market Value | | | Shares / Units | | | Weighted-Average Grant-Date Market Value | | | Shares / Units | | | Weighted-Average Grant-Date Market Value | |
Nonvested at beginning of year | | | 842,067 | | | $ | 20.4173 | | | | 571,479 | | | $ | 29.2473 | | | | 1,053,083 | | | $ | 24.0234 | |
Conversion of stock unit awards | | | 625,582 | | | | 12.7400 | | | | 242,669 | | | | 37.5632 | | | | 459,171 | | | | 29.5867 | |
| Granted | | | 467,920 | | | | 12.7356 | | | | 752,300 | | | | 13.6143 | | | | 191,603 | | | | 29.2920 | |
| Vested | | | (668,984 | ) | | | 19.0320 | | | | (715,235 | ) | | | 26.2328 | | | | (1,130,600 | ) | | | 24.5279 | |
| Forfeited | | | (18,590 | ) | | | 15.3816 | | | | (9,146 | ) | | | 12.7200 | | | | (1,778 | ) | | | 28.6345 | |
| Nonvested at end of year | | | 1,247,995 | | | | 14.5218 | | | | 842,067 | | | | 20.4173 | | | | 571,479 | | | | 29.2473 | |
The total grant date fair value of restricted shares and restricted stock units which vested during the years ended December 31, 2010, 2009 and 2008 was $12.7 million, $18.8 million and $27.7 million, respectively. The total fair value at vesting of restricted shares and restricted stock during the years ended December 31, 2010, 2009 and 2008 was $9.3 million, $9.6 million and $33.3 million, respectively. The vestings for the years ended December 31, 2010, 2009 and 2008 in the table above include 57,780, 52,560 and 122,250, respectively, of restricted stock units (for which common stock was issued upon vesting). The Company realized $3.6 million of income tax benefit for the 2010 vestings, and reduced the Company’s APIC pool by $1.3 million. The Company realized $3.1 million and $11.6 mil lion of income tax benefits related to the 2009 and 2008 vestings, of which $3.2 million and $1.7 million, respectively, increased its APIC pool. A member of the Company’s Board of Directors was awarded 9,630 unrestricted shares of common stock, valued at approximately $135,000, on April 27, 2010 related to his retirement.
In March 2010, following certification by the Compensation Committee of the Company’s Board of Directors that the specified performance criteria of the Company’s net income goal and return of capital employed versus that of a defined peer group had been achieved for the year ended December 31, 2009, the Company issued 625,582 shares of restricted stock in connection with the February 2009 grant of contingently issuable stock unit awards. The following tables summarize the vesting schedules of the 620,396 stock unit awards converted to restricted stock, net of forfeitures, and 462,341 shares of restricted stock units granted, net of forfeitures, during the year ending December 31, 2010.
| | | Converted stock unit awards | | Vesting Dates and Share Amounts |
Conversion Date | | | March 9, 2010(1) | | June 21, 2010(1) | | June 30, 2010 | | November 24, 2010(1) | | June 30, 2011 | | June 30, 2012 |
| March 9, 2010 | | 620,396 | | 51,872 | | 10,010 | | 187,888 | | 648 | | 185,006 | | 184,972 |
| | | Shares/Units Granted (Net of Forfeits) | | Vesting Dates and Share Amounts |
| Grant Date | | | April 27, 2010 (1) | | November 24, 2010 (1) | | December 31, 2010 | | March 13, 2011 | | March 13, 2012 | | March 13, 2013 |
| January 26, 2010 | | 57,780 | | 9,630 | | | | 48,150 | | | | | | |
| February 23, 2010 | | 404,061 | | | | 1,621 | | | | 100,610 | | 100,610 | | 201,220 |
| September 7, 2010 | | 500 | | | | | | | | 125 | | 125 | | 250 |
| Total | | 462,341 | | 9,630 | | 1,621 | | 48,150 | | 100,735 | | 100,735 | | 201,470 |
| | | | | | | | | | | | | | | |
(1) Accelerated vesting due to termination or retirement of employees or members of the Company's Board of Directors. | | | | | | | | |
Contingently Issuable Awards. During the year ended December 31, 2010, the Company granted 301,830 contingently issuable stock unit awards, net of forfeitures, to be earned if certain return of capital employed versus that of a defined peer group goals are met for 2010. Depending on achievement of the performance goal, awards earned could be between 0% and 125% of the base number of performance stock units. If any portion of the performance goal is achieved for 2010 and certified by the Compensation Committee, these stock unit awards (or a portion thereof) will be converted into restricted stock during the first quarter of 2011. One-third of these restricted shares will vest on June 30, 2011, one-third on June 30, 2012 and the final one-th ird on June 30, 2013. As of December 31, 2010, the Company assumed for purposes of stock-based compensation expense for these awards granted in 2010 that the maximum (125%) level award (377,294 stock units, net of forfeitures) would be earned for the return of capital employed versus that of a defined peer group. The stock unit awards were valued at the market value on the date of grant and are being amortized to compensation expense on a straight-line basis over the nominal vesting period, adjusted for retirement-eligible employees, as required under GAAP.
The Company also granted 301,830 stock unit awards, net of forfeitures, contingent upon certain share price performance versus the Company’s peers being met over a three-year period ending on December 31, 2012. Depending on achievement of the market-based performance goal, awards earned could be between 0% and 125% of the base number of market-based stock units. If any of the market-based performance goals are achieved and certified by the Compensation Committee, these stock unit awards (or a portion thereof) will be converted into stock. For stock unit awards subject to such market-based vesting conditions, the grant date fair value of the award is estimated using a Monte Carlo valuation model. The Monte Carlo model is based on random projections of stock price paths and must be repeated numerous times to achieve a probabilistic assessment. Expected volatility was calculated using a weighted average of historical daily volatilities and implied volatility, and represents the extent to which the Company’s stock price performance, relative to the average stock price performance of the peer group, is expected to fluctuate during each of the three calendar periods of the award’s anticipated term ending December 31, 2012. The risk-free rate is based on a U.S. Treasury rate consistent with the three-year vesting period. The total grant date fair value of the market-based stock units as determined by the Monte Carlo valuation model is $3.4 million, net of forfeitures, and will be recognized ratably over the three-year vesting period. The key assumptions used in valuing these market-based restricted shares are as follows:
| | | 2010 | |
| Number of simulations | | | 100,000 | |
| Expected volatility | | | 65.00 | % |
| Risk-free rate | | | 1.33 | % |
In February 2010, following certification by the Compensation Committee of the Company’s Board of Directors that the specified share price performance criteria in connection with the 2007 grant of contingently issuable stock unit awards to be met over a three-year period ended December 31, 2009 had been achieved, the Company issued 206,348 shares of stock to certain employees of the Company. The total grant date fair value of these performance awards was $4.0 million and the total fair value of these shares at issuance was $2.6 million. The Company recognized $1.0 million of income tax benefit related to these vestings, including a reduction of the Company’s APIC pool by $540,000.
In May 2010, the Compensation Committee of the Company’s Board of Directors approved that certain employees met the retirement criteria of the 2008 grant of contingently issuable stock unit awards to be originally met over a three-year period ended December 31, 2010. The Company issued 44,695 shares of stock following certification by the Compensation Committee of the Company’s Board of Directors that the specified share price performance criteria through the employee’s retirement dates had been achieved. The total grant date fair value of these performance awards was $1.4 million and the total intrinsic value of these shares at issuance was $690,000. The Company recognized $263,000 of income tax benefit related to these vestings, including a reduction of the Company’s APIC pool by $252,000. As of December 31, 2010, the Company had outstanding (net of forfeitures) 119,596 contingently issuable stock unit awards related to this 2008 grant that were earned based on certain share price criteria met over a three-year period ended December 31, 2010. Once the performance goal is certified by the Compensation Committee, these stock unit awards will be converted into stock.
As of December 31, 2010, the Company also had outstanding (net of forfeitures) 230,287 contingently issuable stock unit awards issued in 2009 to be earned should certain share price criteria be met over a three-year period ending December 31, 2011. Depending on achievement of the performance goal, awards earned could be between 0% and 125% of the base number of performance stock units. If the performance goal is achieved and certified by the Compensation Committee, the stock unit awards (or a portion thereof) will be converted into stock.
When common stock dividends are declared by the Company’s Board of Directors, dividend equivalents (on the stock unit awards) and dividends (once the stock unit awards are converted to restricted stock) are accrued on the contingently issuable stock units and restricted stock but are not paid until the restricted stock vests.
| 11. | Employee Benefit Plans |
Defined Contribution Plans
The Company sponsors defined contribution plans for its employees. All employees may participate by contributing a portion of their annual earnings to the plans. The Company makes pension and/or matching contributions on behalf of participating employees. The cost of the defined contribution plans for the years ended December 31, 2010, 2009 and 2008 was $8.2 million, $8.0 million and $7.9 million, respectively.
Deferred Compensation Plan
The Company sponsors a deferred compensation plan for certain employees and directors whose eligibility to participate in the plan is determined by the Compensation Committee of the Company’s Board of Directors. Participants may contribute a portion of their earnings to the plan, and the Company makes pension and/or matching contributions on behalf of eligible employees. The contributions and any earnings are held in an irrevocable trust known as a “rabbi trust” by an independent trustee. The trust account balance and related liability were $4.1 million at December 31, 2010 and $4.0 million at December 31, 2009. The current portions are reflected in “Other current assets” and “Accrued liabilities and other” both of which were $0 and $401,000 at December 31, 2010 and 2009, respectively, in the Consolidated Balance Sheets. The long-term portions are reflected in “Other assets” and “Other long-term liabilities” both of which were $4.1 million and $3.6 million at December 31, 2010 and 2009, respectively.
Defined Benefit Plans
In April 2008, the Company’s Board of Directors approved the termination of the defined benefit cash balance pension plan. In July 2009, the Company received, from the Internal Revenue Service, a letter stating the termination of the pension plan does not affect its qualification. The Company terminated the plan in December 2009. Plan participants received 100% of their account balance, including interest, in the fourth quarter of 2009.
The Company provides post-retirement healthcare and other benefits to certain employees of the El Dorado Refinery. Eligible employees are employees hired by the Refinery before certain defined dates and who satisfy certain age and service requirements. Employees hired on or before November 16, 1999 qualify for retirement healthcare insurance until eligible for Medicare. Employees hired on or before January 1, 1995 are also eligible for Medicare supplemental insurance. These plans were unfunded as of December 31, 2010 and 2009. The post-retirement health care plan requires retirees to pay between 20% and 40% of total health care costs based on age and length of service. The plan’s prescription drug benefits are at least equivalent to Medicare Part D benefits
The tables on the following pages set forth the funded status of the pension plan and post-retirement healthcare and other benefit plans change in benefit obligation, items not yet recognized as a component of net periodic benefit costs and reflected as a component of the ending balance of accumulated Other Comprehensive Income (“OCI”), net of tax, and the measurement of defined benefit plan assets and obligations for the years ended December 31, 2010, 2009 and 2008. Also included in the tables on the following pages are weighted average key assumptions, healthcare cost trend rates and sensitivity analysis for the years ended December 31, 2010, 2009 and 2008.
| | | Pension Benefits | | | Post-retirement and Other Benefits (1) | |
| | | 2010 | | | 2009 | | | 2010 | | | 2009 | |
| | | (in thousands) | |
| Change in benefit obligation: | | | | | | | | | | | | |
| Benefit obligation at January 1 | | $ | - | | | $ | 11,337 | | | $ | 34,156 | | | $ | 31,858 | |
| Service cost | | | - | | | | - | | | | 648 | | | | 693 | |
| Interest cost | | | - | | | | 274 | | | | 2,337 | | | | 1,890 | |
| Plan participant contributions | | | - | | | | - | | | | 169 | | | | 114 | |
| Actuarial loss | | | - | | | | 209 | | | | 8,240 | | | | 27 | |
| Amendments | | | - | | | | - | | | | - | | | | - | |
| Benefits paid | | | - | | | | (11,820 | ) | | | (965 | ) | | | (426 | ) |
| Benefit obligation at December 31 | | $ | - | | | $ | - | | | $ | 44,585 | | | $ | 34,156 | |
| | | | | | | | | | | | | | | | | |
| Change in plan assets: | | | | | | | | | | | | | | | | |
| Fair value of plan assets at January 1 | | $ | - | | | $ | 11,116 | | | $ | - | | | $ | - | |
| Actual return on plan assets | | | - | | | | 104 | | | | - | | | | - | |
| Employer contributions | | | - | | | | 600 | | | | 796 | | | | 312 | |
| Plan participant contributions | | | - | | | | - | | | | 169 | | | | 114 | |
| Benefits paid | | | - | | | | (11,820 | ) | | | (965 | ) | | | (426 | ) |
| Fair value of plan assets at December 31 | | $ | - | | | $ | - | | | $ | - | | | $ | - | |
| | | | | | | | | | | | | | | | | |
| Funded status at December 31 | | $ | - | | | $ | - | | | $ | (44,585 | ) | | $ | (34,156 | ) |
| | | | | | | | | | | | | | | | | |
| Amounts recognized in the balance sheets: | | | | | | | | | | | | | | | | |
| Other assets | | $ | - | | | $ | - | | | $ | - | | | $ | - | |
| Accrued liabilities and other | | | - | | | | - | | | | (1,272 | ) | | | (1,018 | ) |
| Post-retirement employee liabilities | | | - | | | | - | | | | (43,313 | ) | | | (33,138 | ) |
| Net amount recognized | | $ | - | | | $ | - | | | $ | (44,585 | ) | | $ | (34,156 | ) |
| | | | | | | | | | | | | | | | | |
Amounts recognized in accumulated OCI (2) | | | | | | | | | | | | | | | | |
| Loss | | $ | - | | | $ | - | | | $ | 16,115 | | | $ | 9,480 | |
| Prior service credit | | | - | | | | - | | | | (5,610 | ) | | | (7,486 | ) |
| | | $ | - | | | $ | - | | | $ | 10,505 | | | $ | 1,994 | |
(1) The disclosed post-retirement healthcare obligations and net periodic cost for 2010 and 2009 reflect government subsidies for prescription drugs as allowed under the Medicare Prescription Drug, Improvement and Modernization Act. The subsidy reduced the benefit obligation at December 31, 2010 and 2009, by approximately $6.9 million and $5.4 million, respectively. The Company did not recognize any benefits of the subsidy during the years ended December 31, 2010, and 2009. | |
(2) For the post-retirement healthcare and other benefits, $1.9 million of the $16.1 million net loss and $1.9 million of the $5.6 million of prior service cost credit will be recognized in the benefit cost in 2011. | |
| | | Pension Benefits | | | Post-retirement Healthcare and Other Benefits | |
| | | 2010 | | | 2009 | | | 2008 | | | 2010 | | | 2009 | | | 2008 | |
| | | (in thousands) | |
Components of net periodic benefit cost and other amounts recognized in other comprehensive income for the year ended December 31: | | | | | | | | | | | | | | | | | | |
| Service cost | | $ | - | | | $ | - | | | $ | - | | | $ | 648 | | | $ | 693 | | | $ | 627 | |
| Interest cost | | | - | | | | 274 | | | | 508 | | | | 2,337 | | | | 1,890 | | | | 1,788 | |
| Expected return on plan assets | | | - | | | | (2 | ) | | | (501 | ) | | | - | | | | - | | | | - | |
| Amortization of prior service cost | | | - | | | | 426 | | | | 568 | | | | (1,876 | ) | | | (1,876 | ) | | | (1,876 | ) |
| Amortized net actuarial loss | | | - | | | | - | | | | (3 | ) | | | 1,605 | | | | 1,046 | | | | 966 | |
| Net periodic benefit cost | | | - | | | | 698 | | | | 572 | | | | 2,714 | | | | 1,753 | | | | 1,505 | |
| | | | | | | | | | | | | | | | | | | | | | | | | |
Changes in assets and benefit obligations recognized in other comprehensive income: | | | | | | | | | | | | | | | | | | | | | | | | |
Net loss (1) | | | - | | | | 107 | | | | 810 | | | | 8,239 | | | | 27 | | | | 1,557 | |
| Amortization of prior service cost | | | - | | | | - | | | | 3 | | | | 1,876 | | | | 1,876 | | | | 1,876 | |
| Prior service cost | | | - | | | | - | | | | 994 | | | | - | | | | - | | | | - | |
| Amortization of loss | | | - | | | | (426 | ) | | | (568 | ) | | | (1,605 | ) | | | (1,046 | ) | | | (966 | ) |
| Adoption of SFAS 158 | | | - | | | | 289 | | | | - | | | | - | | | | - | | | | - | |
Total recognized in other comprehensive income | | | - | | | | (30 | ) | | | 1,239 | | | | 8,510 | | | | 857 | | | | 2,467 | |
Total recognized in net periodic benefit cost and other comprehensive income | | $ | - | | | $ | 668 | | | $ | 1,811 | | | $ | 11,224 | | | $ | 2,610 | | | $ | 3,972 | |
| | | | | | | | | | | | | | | | | | | | | | | | | |
| Weighted average assumptions: | | | | | | | | | | | | | | | | | | | | | | | | |
Benefit obligation discount rate as of December 31 (2) | | | n/a | | | | n/a | | | | 4.72 | % | | | 5.50 | % | | | 5.90 | % | | | 6.00 | % |
Net periodic benefit cost discount rate for the year ended December 31 (2) | | | n/a | | | | n/a | | | | 4.16 | % | | | 5.90 | % | | | 6.00 | % | | | 6.25 | % |
Expected return on plan assets (2) | | | n/a | | | | n/a | | | | 3.20 | % | | | - | | | | - | | | | - | |
| Salary increases | | | n/a | | | | n/a | | | | n/a | | | | n/a | | | | n/a | | | | n/a | |
| | | | | | | | | | | | | | | | | | | | | | | | | |
(1) The actuarial loss increased significantly as of December 31, 2010 when compared to December 31, 2009, primarily due to the actuary now using the Getzen trend model which assumes a much higher healthcare cost-trend rate in 2010 as indicated in the table below. | |
(2) The pension benefit plan was terminated and payouts of all benefits occurred in the fourth quarter of 2009. | |
| | | Post-retirement Healthcare and Other Benefits | |
| | | 2010 | | | 2009 | | | 2008 | |
| | | (dollars in thousands) | |
| | | | | | | | | | |
| Healthcare cost-trend rate: | | | 14.90 | % | | | 8.00 | % | | | 9.00 | % |
| | | trending down to | | | ratable to | | | ratable to | |
| | | | 4.40 | % | | | 5.00 | % | | | 5.00 | % |
| | | by | | | from | | | from | |
| | | | 2083 | | | | 2012 | | | | 2012 | |
| | | | | | | | | | | | | |
| Sensitivity Analysis: | | | | | | | | | | | | |
| Effect of 1% (-1%) change in healthcare cost-trend rate: | | | | | | | | | | | | |
| Year-end benefit obligation | | $ | 7,012 | | | $ | 5,471 | | | $ | 4,932 | |
| | | | (5,713 | ) | | | (4,463 | ) | | | (4,030 | ) |
| Total service and interest cost | | | 476 | | | | 430 | | | | 388 | |
| | | | (388 | ) | | | (349 | ) | | | (316 | ) |
At December 31, 2010, the estimated future benefit payments for post-retirement healthcare and other benefits to be paid over the next ten years are as follows:
| 2011 | | $ | 1,272 | |
| 2012 | | | 1,612 | |
| 2013 | | | 1,996 | |
| 2014 | | | 2,359 | |
| 2015 | | | 2,537 | |
| Next 5 fiscal years thereafter | | | 14,899 | |
Plan Assets. The pension plan assets were held in a Trust Fund (the “Fund”) whose trustee is Frost National Bank (“trustee”). The Company did not contribute to the Fund during 2010 but contributed $600,000 to the Fund during 2009. As discussed above, the Company terminated the plan in December 2009 and Plan participants received 100% of their account balance, including interest, in the fourth quarter of 2009; thus no assets remained in the plan as of December 31, 2010 and 2009.
| 12. | Fair Value Measurement |
GAAP establishes a three-level valuation hierarchy for disclosure of fair value measurements. The valuation hierarchy is based upon the transparency of inputs to the valuation of an asset or liability as of the measurement date. The three levels are defined as follows:
Level 1 – inputs to the valuation methodology are quoted prices (unadjusted) for identical assets or liabilities in active markets.
Level 2 – inputs to the valuation methodology include quoted prices for similar assets and liabilities in active markets, and inputs that are observable for the asset or liability, either directly or indirectly, for substantially the full term of the financial instrument.
Level 3 – inputs to the valuation methodology are unobservable and significant to the fair value measurement.
A financial instrument’s categorization within the valuation hierarchy is based upon the lowest level of input that is significant to the fair value measurement. The Company’s assessment of the significance of a particular input to the fair value measurement in its entirety requires judgment and considers factors specific to the asset or liability.
The following tables present information about the Company’s assets and liabilities measured at fair value on a recurring basis as of December 31, 2010 and 2009, and indicates the fair value hierarchy of the valuation techniques utilized by the Company to determine such fair value (in thousands):
| | | Derivative asset (liability) as of December 31, 2010 | |
| Description | | Level 1 | | | Level 2 | | | Level 3 | | | Total | |
| Commodity contracts | | $ | (1,263 | ) | | $ | (1,126 | ) | | $ | - | | | $ | (2,389 | ) |
| Foreign exchange contracts | | | - | | | | 266 | | | | - | | | | 266 | |
| Interest rate contracts | | | - | | | | 929 | | | | - | | | | 929 | |
| Other contracts | | | - | | | | - | | | | - | | | | - | |
| | | Derivative asset (liability) as of December 31, 2009 | |
| Description | | Level 1 | | | Level 2 | | | Level 3 | | | Total | |
| Commodity contracts | | $ | (4,710 | ) | | $ | (1,841 | ) | | $ | - | | | $ | (6,551 | ) |
| Foreign exchange contracts | | | - | | | | - | | | | - | | | | - | |
| Interest rate contracts | | | - | | | | 2 | | | | - | | | | 2 | |
| Other contracts | | | 122 | | | | - | | | | - | | | | 122 | |
As of December 31, 2010, the commodity contracts giving rise to the liabilities measured under Level 1 are NYMEX crude oil contracts and thus are valued using quoted market prices at the end of each period. The foreign exchange contracts are valued using month end exchange rates and the variation from each contracts strike price. Due to the variety of sources available to price month end exchange rates, these contracts were deemed to have Level 2 inputs. The commodity contracts giving rise to the liabilities under Level 2 are valued using pricing models based on NYMEX crude oil contracts. The interest rate swap contracts measured under Level 2 are valued using a mark-to-market valuation that took into consideration anticipated cash flows from the transactions using market prices and other economic data, and assumptions were used to value the swaps. Given the degree of varying assumptions used to value the swaps, it was deemed as having Level 2 inputs.
As of December 31, 2009, the Company’s derivative contracts giving rise to the liabilities measured under Level 1 are NYMEX crude oil contracts and thus are valued using quoted market prices at the end of each period. The Company’s derivative contracts giving rise to the assets measured under Level 1 are NYMEX calendar spread options. The Company’s derivative contracts giving rise to the liabilities under Level 2 are valued using pricing models based on NYMEX crude oil contracts. The derivative asset contracts included in Level 2 valuations are interest rate swap contracts. A mark-to-market valuation that took into consideration anticipated cash flows from the transactions using market prices and other economic data and assumptions were used to value the swaps. Give n the degree of varying assumptions used to value the swaps, it was deemed as having Level 2 inputs.
The fair value of the Company’s Senior Notes was estimated based on quotations obtained from broker-dealers who make markets in these and similar securities. At December 31, 2010, the carrying amount of the Company’s 6.875% Senior Notes was $150.0 million and the estimated fair value was $152.6 million. At December 31, 2009, the carrying amount of the Company’s 6.625% Senior Notes was $150.0 million and the estimated fair value was $150.8 million. At December 31, 2010 and 2009, the carrying amount of the Company’s 8.5% Senior Notes were $197.8 million ($200.0 million less the unamortized discount of $2.2 million) and $197.5 million (unamortized discount of $2.5 million), respectively, and the estimated fair values were $212.8 million and $207.0 million, respectively. For cash and cash equivalents, trade receivables, inventory (excluding the LIFO reserve) and accounts payable, the carrying amount is a reasonable estimate of fair value.
| 13. | Commitments and Contingencies |
Lease and Other Commitments
In connection with the acquisition of the El Dorado Refinery, the Company entered into an operating sublease agreement with Shell for the use of the cogeneration facility at the El Dorado Refinery. The non-cancelable operating sublease, which has both a fixed and a variable component, expires in 2016, although the Company has the option to renew the sublease for an additional eight years. At the end of the renewal period, the Company has the option to purchase the cogeneration facility for the greater of fair value or $22.3 million. The Company also has building, equipment, aircraft and vehicle operating leases that expire from 2011 through 2017. Operating lease rental expense was approximately $14.0 million, $13.1 million, and $13.2 million for the years ended December 31, 2010, 2009 and 2008, respectively. The approximate future minimum lease payments for operating leases as of December 31, 2010 were $11.1 million for 2011, $7.6 million for 2012, $7.2 million for 2013, $6.5 million for 2014, $6.1 million for 2015 and $5.1 million thereafter.
On December 2, 2009, the Company entered into a guaranteed throughput agreement with Rocky Mountain Pipeline System Inc. for the operation of its refined products pipeline from the Cheyenne Refinery to Sidney, Nebraska through December 31, 2012 with an annual tariff commitment of $1.6 million.
The approximate future commitments based on current crude oil pricing related to forward crude contracts with a fixed differential and a term of more than one year are $26.1 million in 2011, $51.8 million in 2012 and $38.2 million in 2013. The Company has crude oil terminalling and storage commitments for approximately $9.3 million in 2011, $9.9 million in 2012, $9.4 million each in 2013 and 2014, $8.6 million each in 2015 and 2016 and $7.8 million in 2017. The Company has commitments for crude oil pipeline capacity on four pipelines (see below) totaling approximately $38.2 million in 2011, $31.8 million in 2012, an average of $28.6 million for each of the years 2013 through 2015 and an average of $10.5 million for each of the years 2016 and 2017. The Company incurred expenses under these commitments of $ 48.2 million, $44.6 million and $41.1 million for the years ended December 31, 2010, 2009 and 2008, respectively.
The Company has two contracts for crude oil pipeline capacity on the Express Pipeline. The first contract, which began in 1997, is for 15 years and for an average of 13,800 barrels per day (“bpd”) over that 15-year period. In December 2003, the Company entered into an expansion capacity agreement on the Express Pipeline for an additional 10,000 bpd from April 2005 through 2015.
The Company has a Transportation Services Agreement (“Agreement”) to transport 38,000 bpd of crude oil based on filed tariffs on the Spearhead Pipeline from Flanagan, Illinois to Cushing, Oklahoma (“Cushing”). This pipeline enables the Company to transport Canadian crude oil to the El Dorado Refinery. The initial term of this Agreement is until 2016, although the Company has the right to extend the Agreement for an additional ten-year term and increase the volume transported.
The Company entered into a definitive agreement with Rocky Mountain Pipeline System LLC, now owned by Plains All American Pipeline, L.P. (“Plains All American”), on March 31, 2006 to support construction of a new crude pipeline from Guernsey, Wyoming to Rocky Mountain’s Fort Laramie, Wyoming tank farm and then to the Cheyenne Refinery. The Company made a ten-year commitment to ship 35,000 bpd based on a filed tariff on the new pipeline and will concurrently lease approximately 300,000 barrels of dedicated storage capacity in the Plains All American tank farm. The pipeline, which is designed to transport 55,000 bpd of heavy crude and is expandable to 90,000 bpd, first transported crude oil in October 2007.
The Company entered into an agreement with Osage Pipeline in 2007 to ship additional crude oil volumes from Cushing, Oklahoma to its El Dorado Refinery. The annual average increased commitment of 7,500 bpd commenced in July 2008 with a term of five years.
On November 1, 2010, the Company’s subsidiary, Frontier Oil and Refining Company (“FORC”), entered into a Master Crude Oil Purchase and Sale Contract (“Contract”) with BNP Paribas Energy Trading GP and BNP Paribas Energy Trading Canada Corp. (collectively, “BNP”). The maximum value of crude oil to be purchased under this Contract is $300.0 million. Under this Contract, BNP purchases, transports and subsequently sells crude oil to FORC at a location near Cushing, Oklahoma or other locations as agreed. Under this agreement, BNP is the owner of record of the crude oil as it is transported from the point of injection, typically Hardisty, Alberta, Canada, to the point of ultimate sale to FORC. The Company has provided a guarantee of FORC’s obligations under this Contract, primarily to receive crude oil and make payment for crude oil purchases arranged under this Contract. The Company accounts for the transactions under this Contract as a financing arrangement, whereby the inventory and the associated liability are recorded in the Company’s financial statements when the crude oil is injected into the pipeline in Canada. As of December 31, 2010, FORC and BNP had entered into certain commitments to purchase and sell crude oil in the first quarter of 2011 under this Contract; however, neither party has a continuing commitment to purchase or sell crude oil in the future.
This Contract replaces the Company’s crude oil purchase and sale contract with Utexam, a wholly-owned subsidiary of BNP Paribas Ireland (“Utexam Contract”) which was terminated effective November 1, 2010. However, in accordance with the Utexam Contract, the rights and obligations of both Utexam and the Company arising from transactions entered into prior to the termination date will be completed. The Company anticipates any such transactions will be completed no later than the end of the first quarter of 2011.
Litigation
Other. The Company is involved in various lawsuits and regulatory actions which are incidental to its business. In management’s opinion, the adverse determination of such lawsuits would not have a material adverse effect on the Company’s liquidity, financial position or results of operations.
Concentration of Credit Risk
The Company has concentrations of credit risk with respect to sales within the same or related industries and within limited geographic areas. The Company sells its Cheyenne Refinery products, principally to independent retailers and major oil companies located primarily in the Denver, Colorado, western Nebraska and eastern Wyoming regions. The Company sells a majority of its El Dorado Refinery gasoline, diesel and jet fuel to Shell at market-based prices under a 15-year offtake agreement executed in conjunction with the purchase of the El Dorado Refinery in 1999. In 2010, Frontier retained and marketed 60,000 bpd of the El Dorado Refinery’s gasoline and diesel production. Shell has also agreed to purchase all jet fuel production from the El Dorado Refinery through the offtake agreement t erm. The Company retains and markets all by-products produced from the El Dorado Refinery. The Company made sales to Shell of approximately $2.3 billion, $1.6 billion and $2.3 billion in the years 2010, 2009 and 2008, respectively, which accounted for 39%, 38% and 37% of consolidated refined products revenues in 2010, 2009 and 2008, respectively.
The Company extends credit to its customers based on ongoing credit evaluations. An allowance for doubtful accounts is provided based on the current evaluation of each customer’s credit risk, past experience and other factors. The Company recorded a bad debt loss of $198,000 and a net increase in the allowance for doubtful accounts of $500,000 during the year ended December 31, 2009. No bad debts were recorded in the years ended December 31, 2010 and 2008.
Environmental
The Company’s operations and many of its manufactured products are specifically subject to certain requirements of the Clean Air Act (“CAA”) and related state and local regulations. The 1990 amendments to the CAA contain provisions that will require capital expenditures for the production of cleaner transportation fuels and the installation of certain air pollution control devices at the Refineries during the next several years as discussed below.
The Environmental Protection Agency (“EPA”) has promulgated regulations requiring the phase-in of gasoline sulfur standards, which began January 1, 2004 and continued through 2008, with special provisions for small business refiners such as Frontier. As allowed by subsequent regulation, Frontier elected to extend its small refinery interim gasoline sulfur standard at each of the Refineries until January 1, 2011 by complying with the highway ultra low sulfur diesel standard by June 2006. The Company has reevaluated its initial strategy of capital investment at its Cheyenne Refinery to meet the new gasoline sulfur standard and is now planning to comply with these requirements starting January 1, 2011 for approximately five years through the redemption of gasoline sulfur credits. For long-term co mpliance, the Company expects to utilize internally generated credits and purchased credits and spend approximately $40.0 million ($18.4 million incurred as of December 31, 2010) for the FCCU gasoline hydrotreater project comprised of new process unit capacity and intermediate inventory handling equipment. In addition, new federal benzene regulations and anticipated state requirements for reduction in gasoline Reid Vapor Pressure (“RVP”) suggest that additional capital expenditures may be required for environmental compliance projects. The Company is presently evaluating projects and the total potential cost in connection with an overall compliance strategy for the Cheyenne Refinery. Total capital expenditures as of December 31, 2010 for the El Dorado Refinery to comply with the final gasoline sulfur standard were approximately $95.0 million, including capitalized interest, and were completed in the fourth quarter of 2010. The $95.0 million of expenditu res primarily related to the El Dorado Refinery’s gasoil hydrotreater revamp project. The gasoil hydrotreater revamp project addressed most of the El Dorado Refinery’s modifications needed to achieve gasoline sulfur compliance.
The Company is a holder of gasoline sulfur credits retained from prior generation years at both the Cheyenne and the El Dorado Refineries. There were no sulfur credit sales during the year ended December 31, 2010. During the year ended December 31, 2009 and 2008, Frontier sold sulfur credits for total proceeds of $1.9 million and $4.6 million, respectively, which are recorded in “Other revenues” on the Consolidated Statements of Operations.
In March 2009, settlement agreements associated with the EPA’s National Petroleum Refining Enforcement Initiative were finalized and are now in effect. The Company currently estimates that, in addition to the flare gas recovery systems previously installed at each facility, capital expenditures totaling approximately $37.0 million ($662,000 incurred as of December 31, 2010) at the Cheyenne Refinery and $6.0 million ($1.5 million incurred as of December 31, 2010) at the El Dorado Refinery will need to be incurred prior to 2017. The Company may also choose to incur additional costs at the Cheyenne Refinery and at the El Dorado Refinery to comply with certain requirements of the agreement if such projects are determined to be the most cost effective compliance strategy. Notwithstanding these settlement s, many of these same expenditures are required for the Company to comply with preexisting regulatory requirements or to implement its planned facility expansions. Consequently, the costs associated with these other projects are not included in the totals above. In addition, the settlement agreement provides for stipulated penalties for violations, which are periodically reported by the Company. Stipulated penalties under the decree are not automatic but must be requested by one of the agency signatories. As stipulated penalties are requested, the Company will separately report that matter and the amount of the proposed penalty, if material.
The EPA has promulgated regulations to enact the provisions of the Energy Policy Act of 2005 regarding mandated blending of renewable fuels in gasoline. The Energy Independence and Security Act of 2007 significantly increased the amount of renewable fuels that had been required by the 2005 legislation. The Company, as a small refiner, was exempt until January 1, 2011 from these requirements at which time it began incurring additional costs in order to meet the new requirements. The Company has renewable fuels blending facilities and purchases ethanol with Renewable Identification Numbers (RINs) credits attached. Ethanol RINs were created to assist in tracking compliance with these EPA regulations for the blending of renewable fuels. During the years ended December 31, 2010, 2009 and 2008, the Company sold RIN credits for $648,000, $4.6 million and $4.5 million, respectively, which were recorded in “Other revenues” on the Consolidated Statements of Operations. While not yet proposed or promulgated, other pending regulation regarding the mandated use of alternative or renewable fuels and/or the reduction of greenhouse gas emissions from either transportation fuels or manufacturing processes is under consideration by the EPA. In addition, the EPA has recently determined that greenhouse gases, including carbon dioxide, present a danger to human health and the environment, which may result in future regulation of such gases. If greenhouse gas control regulations are promulgated, these requirements could materially impact the operations and financial position of the Company (see “Other Future Environmental Considerations” below).
On February 26, 2007, the EPA promulgated regulations limiting the amount of benzene in gasoline. These regulations take effect for large refiners on January 1, 2011 and for small refiners, such as Frontier, on January 1, 2015. While not yet estimated, the Company anticipates that potentially material capital expenditures may be necessary to achieve compliance with the new regulation at its Cheyenne Refinery. Gasoline manufactured at the El Dorado Refinery typically contains benzene concentrations near the new standard. The Company therefore believes that necessary benzene compliance expenditures at the El Dorado Refinery will be substantially less than those at its Cheyenne Refinery.
The Company owns terminals and pipelines in which various groundwater remediation and monitoring activities are underway and as of December 31, 2010, the Company had a total accrual of $558,000. As is the case with companies engaged in similar industries, the Company faces potential exposure from future claims and lawsuits involving environmental matters, including soil and water contamination, air pollution, personal injury and property damage allegedly caused by substances that the Company may have manufactured, handled, used, released or disposed.
Cheyenne Refinery. The Company is party to an agreement with the State of Wyoming requiring investigation and interim remediation actions at the Cheyenne Refinery’s property that may have been impacted by past operational activities. As a result of past and ongoing investigative efforts, capital expenditures and remediation of conditions found to exist have already taken place, including the completion of surface impoundment closures, waste stabilization activities and other site remediation projects. As of December 31, 2010 and 2009, the Company had a $4.8 million and $4.6 million accrual, respectively, included on the Consolidated Balance Sheets related to the remediation program. The accrual at December 31, 2010 reflects the estim ated present value of a $705,000 cost in 2011 and $690,000 in annual costs for 2012 through 2020, assuming a 3% inflation rate, ten more years of the ongoing groundwater remediation program, and discounted at a rate of 7.9%. The Company estimates a total cost of $7.8 million for the cleanup and on-going monitoring activities of a waste water treatment pond located on land adjacent to the Cheyenne Refinery which the Company had historically leased from the landowner. Cleanup of the waste water pond pursuant to the aforementioned agreement with the State of Wyoming was completed in 2010 with various on-going monitoring for approximately two years. As of December 31, 2010, the Company had remaining accruals of $551,000 related to the on-going monitoring activities. At December 31, 2009 the Company had a remaining accrual of $5.7 million for this cleanup. Depending upon information collected during the on-going monitoring, or by a subsequent administrative o rder or permit, additional remedial action and costs could be required. Pursuant to this agreement, in the fourth quarter of 2009, the Company completed an $11.3 million capital project for the installation of a groundwater boundary control system and associated groundwater recovery wells.
In October 2009, Frontier Refining Inc. (which owns the Cheyenne Refinery) was served with a Complaint from Region 8 of the EPA alleging unlawful storage of untreated or partially treated refinery wastewater in an on-site surface impoundment and proposing a penalty of $6.8 million in addition to a requirement to clean and close the impoundment at issue. Although not admitting violation, the Company has entered into a negotiated settlement agreement with the EPA. Based on this agreement, the total estimated settlement expense is $2.7 million. This is comprised of a $900,000 penalty (paid in June 2010) and approximately $910,000 for the first phase of the pond cleaning expenses related to injunctive relief with the remaining costs being for legal expenses. The $6.8 million accrual, originally rec orded in the third quarter of 2009, was adjusted downward in 2010 on the Consolidated Balance Sheets to reflect the new estimate of $2.7 million, and as of December 31, 2010, the Company’s remaining accrual was $42,000. Initially, the Company expected capital costs for injunctive relief related to the removal and repair of the liner would have been incurred after June 1, 2011 and were estimated at approximately $800,000. However, after further analysis and review, the Company has decided to close the on-site surface impoundment by third quarter 2011 for an estimated cost of $1.0 million, which was accrued at December 31, 2010. An alternative capital project related to storm water overflow is currently under development.
The Company completed in 2007 the negotiation of a settlement of a Notice of Violation (“NOV”) from the Wyoming Department of Environmental Quality (“WDEQ”) alleging non-compliance with certain refinery waste management requirements. The Company has estimated that the minimum capital cost for required corrective measures will be approximately $4.2 million and is estimated to be completed in early 2011. In addition, the Company accrued a total of $2.3 million for additional work related to the corrective measures, which was substantially completed in 2010, with remaining accruals of $23,000 and $1.2 million at December 31, 2010 and 2009, respectively.
The Company has received a draft wastewater discharge permit from the WDEQ designed to renew the existing permit. This draft includes new discharge limits for selenium and chloride in addition to a requirement for more rigorous toxicity testing of the wastewater discharge. Costs for compliance with the new limits, which are currently drafted to become effective on January 1, 2013, are currently not estimable.
El Dorado Refinery. The El Dorado Refinery is subject to a 1988 consent order with the Kansas Department of Health and Environment (“KDHE”). Subject to the terms of the purchase and sale agreement for the El Dorado Refinery entered into between the Company and Shell Oil Products US (“Shell”), Shell is responsible for the costs of continued compliance with this order. This order, including various subsequent modifications, requires the El Dorado Refinery to continue the implementation of a groundwater management program with oversight provided by the KDHE Bureau of Environmental Remediation. More specifically, the El Dorado Refinery must continue to operate the hydrocarbon recovery well systems and containment barrie rs at the site and conduct sampling from monitoring wells and surface water stations. Quarterly and annual reports must also be submitted to the KDHE. The order requires that remediation activities continue until KDHE-established groundwater criteria or other criteria agreed to by the KDHE and the Refinery are met.
Other Future Environmental Considerations. Recent scientific studies have suggested that emissions of certain gases commonly referred to as “greenhouse gases” and including carbon dioxide and methane, may be contributing to warming of the earth’s atmosphere. On April 2, 2007, in Massachusetts, et al. v. EPA, the U.S. Supreme Court held that carbon dioxide may be regulated as an “air pollutant” under the federal Clean Air Act and that the EPA must consider whether it is required to regulate greenhouse gas emissions from mobile sources such as cars and trucks. On April 17, 2009, the EPA proposed that certain greenhouse gases, including carbon dioxide, present a danger to public health or welfare. The proposed &# 8220;endangerment finding” was promulgated on December 7, 2009, opening the door to direct regulation of such greenhouse gases under the provisions and programs of the existing Clean Air Act. Thus, the EPA can impose restrictions on the emission of greenhouse gases even if the U.S. Congress does not adopt new legislation specifically addressing emissions of greenhouse gases. In October 2009, the EPA published a final rule requiring large emitters of greenhouse gases and certain industrial sectors to monitor and report their greenhouse gas emissions to the EPA beginning in 2011 for emissions in 2010. On November 30, 2010, the EPA published a final rule expanding its existing GHG emission reporting rule to include onshore oil and natural gas production facilities beginning for 2012 for emissions occurring after January 1, 2011. In May 2010, the EPA issued a final rule that determines which stationary sources of greenhouse gas emissions need to obtain a construc tion or operating permit and install the best available control technology for greenhouse gas emissions. The regulation did not identify such technologies. In response to the endangerment finding, the EPA adopted regulations that require a reduction in emissions of GHGs from motor vehicles and also could trigger permit review for GHG emission from certain stationary sources. The EPA has determined that the motor vehicle GHG emission standards triggered Clean Air Act construction and operating permit requirements for stationary sources beginning on January 2, 2011 when the motor vehicle standards took effect. Legislation to prohibit or delay EPA regulation of greenhouse gases may be considered by the U. S. Congress later this year. In addition, the EPA has stated its intent to propose regulations in 2011 that would require utilities and refineries to limit incremental greenhouse gas emissions resulting from future facility expansions. The Agency further stated their intent to promulgate such regulations in 2012. Although it is not possible at this time to predict how legislation or new regulations that may be adopted to address greenhouse gas emissions would impact the Company’s business, any such future laws and regulations will most likely result in increased compliance costs or additional operating restrictions, and could have a material adverse effect on the Company’s business, financial condition and results of operations, including demand for the refined petroleum products that it produces.
| 14. | Price and Interest Risk Management Activities |
The Company, at times, enters into commodity derivative contracts to manage its price exposure to its inventory positions, purchases of foreign crude oil and consumption of natural gas in the refining process or to fix margins on certain future production or to hedge interest rate risk. The commodity derivative contracts used by the Company may take the form of futures contracts, forward contracts, collars or price or interest rate swaps. The Company, also at times, enters into foreign exchange contracts to manage its exposure to foreign currency fluctuations on its purchases of foreign crude oil. The Company believes that there is minimal credit risk with respect to its counterparties. The Company’s commodity derivative contracts and foreign exchange contracts, while economic hedges, are not designated as cash flow or fair value hedges and thus are accounted for under mark-to-market accounting and gains and losses recorded directly to earnings. The Company has derivative contracts which it holds directly and also derivative contracts, in connection with its crude oil purchase and sale contracts held on Frontier’s behalf by BNP and Utexam, in connection with the Master Crude Oil Purchase and Sale Contracts (see Note 13 “Lease and Other Commitments”). For additional fair value disclosures relating to the Company’s derivative contracts, see Note 12 “Fair Value Measurement.” As of December 31, 2010, the Company had the following outstanding commodity derivative contracts:
| Commodity | | Number of barrels |
| | | (in thousands) |
| | | |
| Crude purchases in-transit | | 288 |
| Crude oil contracts to hedge excess intermediate, finished product and crude oil inventory | | 615 |
During October 2009, the Company entered into two $75.0 million interest rate swap transactions totaling $150.0 million of notional amount, that effectively convert a portion of our interest expense from fixed to variable rate debt. Under these swap contracts, interest on each of the $75.0 million notional amount is computed using 30-day LIBOR plus a spread of 5.34% and 5.335%, which equaled an effective interest rate of 5.59% and 5.58%, respectively, as of the transaction date. Interest is paid semi-annually on the swap contracts, April 1 and October 1, until maturity. The maturity of both swap transactions is October 1, 2011. The interest accrued by the Company on these swap contracts effectively reduced “Interest expense and other financing costs” on the Consolidated Statem ents of Operations by $1.4 million and $310,000 for the years ended December 31, 2010 and 2009, respectively. The Company received interest totaling $1.4 million from the counterparty in 2010 and has a receivable for accrued interest of $363,000 and $310,000, which is included in “Other receivables” on the Consolidated Balance Sheets as of December 31, 2010 and 2009, respectively.
The following table presents the location of the Company’s outstanding derivative contracts on the Consolidated Balance Sheet and the related fair values at the balance sheet dates.
| | | Asset Derivatives in Other Current Assets | | | Liability Derivatives in Accrued Liabilities and Other | |
| | | December 31, 2010 | | | December 31, 2009 | | | December 31, 2010 | | | December 31, 2009 | |
| | | Fair Value | | | Fair Value | | | Fair Value | | | Fair Value | |
| | | (in thousands) | |
Derivatives not designated as hedging instruments | | | | | | | | | | | | |
| Commodity contracts | | $ | - | | | $ | - | | | $ | 2,389 | | | $ | 6,551 | |
| Foreign exchange contracts | | | 266 | | | | - | | | | - | | | | - | |
| Interest rate swaps | | | 929 | | | | 2 | | | | - | | | | - | |
| Other contracts | | | - | | | | 122 | | | | - | | | | - | |
| Total derivatives | | $ | 1,195 | | | $ | 124 | | | $ | 2,389 | | | $ | 6,551 | |
The following table presents the location of gains and losses reported in the Consolidated Statements of Operations for the current and previous periods presented.
| | | | | Amount of Derivatives Gain or (Loss) Recognized | |
| | | | | Years Ended December 31, | |
| | | 2010 | | | 2009 | | | 2008 | |
| | | | | (in thousands) | |
| Derivatives not designated as hedging instruments | | Location in Consolidated Statements of Operations | | | | | | | | | |
| Commodity contracts | | Other Revenues | | $ | 6,335 | | | $ | (11,723 | ) | | $ | 146,482 | |
| Foreign exchange contracts | | Other Revenues | | | 322 | | | | 799 | | | | 375 | |
| Other contracts | | Other Revenues | | | (34 | ) | | | (168 | ) | | | 313 | |
| Interest rate swaps | | Interest expense and other financing costs | | | 927 | | | | 2 | | | | - | |
On February 21, 2011, the Company entered into a definitive merger agreement with Holly Corporation (“Holly”) under which the companies will combine in an all-stock merger of equals transaction. Under the terms of the agreement, the Company’s shareholders will receive 0.4811 Holly shares for each share of the Company’s common stock. Upon closing of the transaction, Holly shareholders are expected to own approximately 51 percent and the Company shareholders are expected to own approximately 49 percent of the combined company. The transaction is structured to be tax-free to the shareholders of both companies. The merger is expected to close in the third quarter of 2011. It is subject to, among other things, approval by both companies’ shareholders and other customary closing conditions, as well as clearance under the Hart-Scott-Rodino Act.
| 16. | Consolidating Financial Statements |
Frontier Holdings Inc. and its subsidiaries (“FHI”) are full and unconditional guarantors of the Company’s 6.875% Senior Notes and 8.5% Senior Notes. Presented on the following pages are the Company’s condensed consolidating balance sheets, statements of operations, and statements of cash flows as required by Rule 3-10 of Regulation S-X of the Securities Exchange Act of 1934, as amended. As specified in Rule 3-10, the condensed consolidating balance sheets, statement of operations, and cash flows presented on the following pages meet the requirements for financial statements of the issuer and each guarantor of the notes because the guarantors are all direct or indirect 100%-owned subsidiaries of Frontier Oil Corporation, and all of the guarantees are full and unconditional on a joint and seve ral basis. The Company files a consolidated U.S. federal income tax return and consolidated state income tax returns in the majority of states in which it does business. Accordingly, the equity in earnings of subsidiaries recorded for Frontier Oil Corporation is equal to the subsidiaries’ net income adjusted for consolidating pre-tax adjustments and for the portion of the subsidiaries’ income tax provision which is eliminated in consolidation.
| CONSOLIDATING FINANCIAL STATEMENTS | |
| | | | | | | | | | | | | | | | |
| | | | | | | | | | | | | | | | |
| | | | | | | | | | | | | | | | |
| FRONTIER OIL CORPORATION | |
| Condensed Consolidating Statement of Operations | |
| For the Year Ended December 31, 2010 | |
| (in thousands) | |
| | | | | | | | | | | | | | | | |
| | | | | | | | | | | | | | | | |
| | | | | | | | | | | | | | | | |
| | | FOC (Parent) | | | FHI (Guarantor Subsidiaries) | | | Other Non-Guarantor Subsidiaries | | | Eliminations | | | Consolidated | |
| Revenues: | | | | | | | | | | | | | | | |
| Refined products | | $ | - | | | $ | 5,878,182 | | | $ | - | | | $ | - | | | $ | 5,878,182 | |
| Other | | | (11 | ) | | | 6,655 | | | | 80 | | | | - | | | | 6,724 | |
| | | | (11 | ) | | | 5,884,837 | | | | 80 | | | | - | | | | 5,884,906 | |
| | | | | | | | | | | | | | | | | | | | | |
| Costs and expenses: | | | | | | | | | | | | | | | | | | | | |
Raw material, freight and other costs | | | - | | | | 5,367,278 | | | | - | | | | - | | | | 5,367,278 | |
Refinery operating expenses, excluding depreciation | | | - | | | | 281,793 | | | | - | | | | - | | | | 281,793 | |
Selling and general expenses, excluding depreciation | | | 16,165 | | | | 31,027 | | | | - | | | | - | | | | 47,192 | |
Depreciation, amortization and accretion | | | 63 | | | | 103,822 | | | | - | | | | 936 | | | | 104,821 | |
| Gains on sales of assets | | | (1 | ) | | | - | | | | - | | | | - | | | | (1 | ) |
| | | | 16,227 | | | | 5,783,920 | | | | - | | | | 936 | | | | 5,801,083 | |
| | | | | | | | | | | | | | | | | | | | | |
| Operating (loss) income | | | (16,238 | ) | | | 100,917 | | | | 80 | | | | (936 | ) | | | 83,823 | |
| | | | | | | | | | | | | | | | | | | | | |
Interest expense and other financing costs | | | 27,886 | | | | 6,613 | | | | - | | | | (1,918 | ) | | | 32,581 | |
| Interest and investment income | | | (1,986 | ) | | | (359 | ) | | | - | | | | - | | | | (2,345 | ) |
Equity in earnings of subsidiaries | | | (96,435 | ) | | | - | | | | - | | | | 96,435 | | | | - | |
| Income before income taxes | | | 54,297 | | | | 94,663 | | | | 80 | | | | (95,453 | ) | | | 53,587 | |
| Provision for income taxes | | | 16,512 | | | | 32,050 | | | | 76 | | | | (32,836 | ) | | | 15,802 | |
| Net income | | $ | 37,785 | | | $ | 62,613 | | | $ | 4 | | | $ | (62,617 | ) | | $ | 37,785 | |
| FRONTIER OIL CORPORATION | |
| Condensed Consolidating Statement of Operations | |
| For the Year Ended December 31, 2009 | |
| (in thousands) | |
| | | | | | | | | | | | | | | | |
| | | | | | | | | | | | | | | | |
| | | | | | | | | | | | | | | | |
| | | FOC (Parent) | | | FHI (Guarantor Subsidiaries) | | | Other Non-Guarantor Subsidiaries | | | Eliminations | | | Consolidated | |
| Revenues: | | | | | | | | | | | | | | | |
| Refined products | | $ | - | | | $ | 4,242,966 | | | $ | - | | | $ | - | | | $ | 4,242,966 | |
| Other | | | (7 | ) | | | (5,809 | ) | | | 63 | | | | - | | | | (5,753 | ) |
| | | | (7 | ) | | | 4,237,157 | | | | 63 | | | | - | | | | 4,237,213 | |
| | | | | | | | | | | | | | | | | | | | | |
| Costs and expenses: | | | | | | | | | | | | | | | | | | | | |
Raw material, freight and other costs | | | - | | | | 3,888,308 | | | | - | | | | - | | | | 3,888,308 | |
Refinery operating expenses, excluding depreciation | | | - | | | | 295,509 | | | | - | | | | - | | | | 295,509 | |
Selling and general expenses, excluding depreciation | | | 23,836 | | | | 34,832 | | | | - | | | | - | | | | 58,668 | |
Depreciation, amortization and accretion | | | 70 | | | | 99,398 | | | | - | | | | 630 | | | | 100,098 | |
| | | | 23,906 | | | | 4,318,047 | | | | - | | | | 630 | | | | 4,342,583 | |
| | | | | | | | | | | | | | | | | | | | | |
| Operating (loss) income | | | (23,913 | ) | | | (80,890 | ) | | | 63 | | | | (630 | ) | | | (105,370 | ) |
| | | | | | | | | | | | | | | | | | | | | |
Interest expense and other financing costs | | | 29,278 | | | | 4,254 | | | | - | | | | (5,345 | ) | | | 28,187 | |
| Interest and investment income | | | (1,873 | ) | | | (406 | ) | | | - | | | | - | | | | (2,279 | ) |
Equity in losses of subsidiaries | | | 79,986 | | | | - | | | | - | | | | (79,986 | ) | | | - | |
(Loss) income before income taxes | | | (131,304 | ) | | | (84,738 | ) | | | 63 | | | | 84,701 | | | | (131,278 | ) |
(Benefit) provision for income taxes | | | (47,544 | ) | | | (32,523 | ) | | | 50 | | | | 32,499 | | | | (47,518 | ) |
| Net (loss) income | | $ | (83,760 | ) | | $ | (52,215 | ) | | $ | 13 | | | $ | 52,202 | | | $ | (83,760 | ) |
| FRONTIER OIL CORPORATION |
| Condensed Consolidating Statement of Operations |
| For the Year Ended December 31, 2008 |
| (in thousands) |
| | | | | | | | | | | | | | | | |
| | | | | | | | | | | | | | | | |
| | | | | | | | | | | | | | | | |
| | | FOC (Parent) | | | FHI (Guarantor Subsidiaries) | | | Other Non-Guarantor Subsidiaries | | | Eliminations | | | Consolidated | |
| Revenues: | | | | | | | | | | | | | | | |
| Refined products | | $ | - | | | $ | 6,342,144 | | | $ | - | | | $ | - | | | $ | 6,342,144 | |
| Other | | | (7 | ) | | | 156,287 | | | | 356 | | | | - | | | | 156,636 | |
| | | | (7 | ) | | | 6,498,431 | | | | 356 | | | | - | | | | 6,498,780 | |
| | | | | | | | | | | | | | | | | | | | | |
| Costs and expenses: | | | | | | | | | | | | | | | | | | | | |
Raw material, freight and other costs | | | - | | | | 5,716,091 | | | | - | | | | - | | | | 5,716,091 | |
Refinery operating expenses, excluding depreciation | | | - | | | | 298,418 | | | | - | | | | - | | | | 298,417 | |
Selling and general expenses, excluding depreciation | | | 17,677 | | | | 26,492 | | | | - | | | | - | | | | 44,169 | |
Depreciation, amortization and accretion | | | 55 | | | | 88,356 | | | | - | | | | 292 | | | | 88,703 | |
| Gains on sales of assets | | | (37 | ) | | | (7 | ) | | | - | | | | - | | | | (44 | ) |
| | | | 17,695 | | | | 6,129,350 | | | | - | | | | 292 | | | | 6,147,336 | |
| | | | | | | | | | | | | | | | | | | | | |
| Operating income (loss) | | | (17,702 | ) | | | 369,081 | | | | 356 | | | | (292 | ) | | | 351,444 | |
| | | | | | | | | | | | | | | | | | | | | |
Interest expense and other financing costs | | | 15,939 | | | | 5,569 | | | | - | | | | (6,379 | ) | | | 15,130 | |
| Interest and investment income | | | (2,868 | ) | | | (2,557 | ) | | | - | | | | - | | | | (5,425 | ) |
Equity in earnings of subsidiaries | | | (371,830 | ) | | | - | | | | - | | | | 371,830 | | | | - | |
| Income before income taxes | | | 341,057 | | | | 366,069 | | | | 356 | | | | (365,743 | ) | | | 341,739 | |
| Provision for income taxes | | | 115,004 | | | | 127,280 | | | | 139 | | | | (126,737 | ) | | | 115,686 | |
| Net income | | $ | 226,053 | | | $ | 238,789 | | | $ | 217 | | | $ | (239,006 | ) | | $ | 226,053 | |
| FRONTIER OIL CORPORATION | |
| Condensed Consolidating Balance Sheet | |
| As of December 31, 2010 | |
| (in thousands) | |
| | | | | | | | | | | | | | | | |
| | | FOC (Parent) | | | FHI (Guarantor Subsidiaries) | | | Other Non-Guarantor Subsidiaries | | | Eliminations | | | Consolidated | |
| ASSETS | | | | | | | | | | | | | | | |
| Current assets: | | | | | | | | | | | | | | | |
| Cash and cash equivalents | | $ | 278,163 | | | $ | 280,478 | | | $ | - | | | $ | - | | | $ | 558,641 | |
Trade and other receivables, net | | | 49,398 | | | | 146,674 | | | | - | | | | - | | | | 196,072 | |
Inventory of crude oil, products and other | | | - | | | | 280,847 | | | | - | | | | - | | | | 280,847 | |
Deferred income tax assets - current | | | 30,516 | | | | 26,647 | | | | - | | | | (26,647 | ) | | | 30,516 | |
| Other current assets | | | 1,403 | | | | 11,571 | | | | 7 | | | | - | | | | 12,981 | |
| Total current assets | | | 359,480 | | | | 746,217 | | | | 7 | | | | (26,647 | ) | | | 1,079,057 | |
| | | | | | | | | | | | | | | | | | | | | |
Property, plant and equipment, net | | | 328 | | | | 991,104 | | | | - | | | | 23,436 | | | | 1,014,868 | |
Deferred turnaround and catalyst costs | | | - | | | | 51,347 | | | | - | | | | - | | | | 51,347 | |
| Deferred financing costs, net | | | 5,124 | | | | 1,147 | | | | - | | | | - | | | | 6,271 | |
| Intangible assets, net | | | - | | | | 1,094 | | | | - | | | | - | | | | 1,094 | |
Deferred income tax assets - noncurrent | | | 11,768 | | | | 6,642 | | | | 10 | | | | (6,652 | ) | | | 11,768 | |
| Other assets | | | 4,180 | | | | 179 | | | | - | | | | - | | | | 4,359 | |
Receivable from affiliated companies (1) | | | - | | | | 15,892 | | | | 591 | | | | (16,483 | ) | | | - | |
| Investment in subsidiaries | | | 1,208,245 | | | | - | | | | - | | | | (1,208,245 | ) | | | - | |
| Total assets | | $ | 1,589,125 | | | $ | 1,813,622 | | | $ | 608 | | | $ | (1,234,591 | ) | | $ | 2,168,764 | |
| | | | | | | | | | | | | | | | | | | | | |
| LIABILITIES AND SHAREHOLDERS' EQUITY | | | | | | | | | | | | | | | | | |
| Current liabilities: | | | | | | | | | | | | | | | | | | | | |
| Accounts payable | | $ | 147 | | | $ | 493,050 | | | $ | 15 | | | $ | - | | | $ | 493,212 | |
| Accrued liabilities and other | | | 9,823 | | | | 32,588 | | | | 3 | | | | (2 | ) | | | 42,412 | |
| Total current liabilities | | | 9,970 | | | | 525,638 | | | | 18 | | | | (2 | ) | | | 535,624 | |
| | | | | | | | | | | | | | | | | | | | | |
| Long-term debt | | | 347,773 | | | | - | | | | - | | | | - | | | | 347,773 | |
| Contingent income tax liabilities | | | 2,758 | | | | 1,072 | | | | - | | | | - | | | | 3,830 | |
Long-term capital lease obligations | | | - | | | | 2,938 | | | | - | | | | - | | | | 2,938 | |
| Other long-term liabilities | | | 4,093 | | | | 53,286 | | | | - | | | | - | | | | 57,379 | |
| Deferred income tax liabilities | | | 234,673 | | | | 223,978 | | | | 22 | | | | (224,000 | ) | | | 234,673 | |
| Payable to affiliated companies | | | 3,311 | | | | - | | | | 296 | | | | (3,607 | ) | | | - | |
| | | | | | | | | | | | | | | | | | | | | |
| Shareholders' equity | | | 986,547 | | | | 1,006,710 | | | | 272 | | | | (1,006,982 | ) | | | 986,547 | |
Total liabilities and shareholders' equity | | $ | 1,589,125 | | | $ | 1,813,622 | | | $ | 608 | | | $ | (1,234,591 | ) | | $ | 2,168,764 | |
| | | | | | | | | | | | | | | | | | | | | |
(1) FHI receivable from affiliated companies balance includes $13,173 for income taxes receivable from parent under a tax sharing agreement. | |
| FRONTIER OIL CORPORATION | |
| Condensed Consolidating Balance Sheet | |
| As of December 31, 2009 | |
| (in thousands) | |
| | | | | | | | | | | | | | | | |
| | | FOC (Parent) | | | FHI (Guarantor Subsidiaries) | | | Other Non-Guarantor Subsidiaries | | | Eliminations | | | Consolidated | |
| ASSETS | | | | | | | | | | | | | | | |
| Current assets: | | | | | | | | | | | | | | | |
| Cash and cash equivalents | | $ | 211,775 | | | $ | 213,505 | | | $ | - | | | $ | - | | | $ | 425,280 | |
Trade and other receivables, net | | | 174,843 | | | | 102,887 | | | | - | | | | - | | | | 277,730 | |
Inventory of crude oil, products and other | | | - | | | | 293,476 | | | | - | | | | - | | | | 293,476 | |
Deferred income tax assets - current | | | 26,373 | | | | 26,442 | | | | - | | | | (26,442 | ) | | | 26,373 | |
| Other current assets | | | 926 | | | | 13,581 | | | | - | | | | - | | | | 14,507 | |
| Total current assets | | | 413,917 | | | | 649,891 | | | | - | | | | (26,442 | ) | | | 1,037,366 | |
| | | | | | | | | | | | | | | | | | | | | |
Property, plant and equipment, net | | | 374 | | | | 998,580 | | | | - | | | | 22,455 | | | | 1,021,409 | |
Deferred turnaround and catalyst costs | | | - | | | | 68,491 | | | | - | | | | - | | | | 68,491 | |
| Deferred financing costs, net | | | 2,857 | | | | 1,854 | | | | - | | | | - | | | | 4,711 | |
| Intangible assets, net | | | - | | | | 1,216 | | | | - | | | | - | | | | 1,216 | |
Deferred income tax assets - noncurrent | | | 10,767 | | | | 7,702 | | | | - | | | | (7,702 | ) | | | 10,767 | |
| Other assets | | | 3,665 | | | | 270 | | | | - | | | | - | | | | 3,935 | |
Receivable from affiliated companies (1) | | | - | | | | 61,165 | | | | 516 | | | | (61,681 | ) | | | - | |
| Investment in subsidiaries | | | 1,144,040 | | | | - | | | | - | | | | (1,144,040 | ) | | | - | |
| Total assets | | $ | 1,575,620 | | | $ | 1,789,169 | | | $ | 516 | | | $ | (1,217,410 | ) | | $ | 2,147,895 | |
| | | | | | | | | | | | | | | | | | | | | |
| LIABILITIES AND SHAREHOLDERS' EQUITY | | | | | | | | | | | | | | | | | |
| Current liabilities: | | | | | | | | | | | | | | | | | | | | |
| Accounts payable | | $ | 906 | | | $ | 473,456 | | | $ | 15 | | | $ | - | | | $ | 474,377 | |
| Accrued liabilities and other | | | 20,916 | | | | 43,883 | | | | - | | | | - | | | | 64,799 | |
| Total current liabilities | | | 21,822 | | | | 517,339 | | | | 15 | | | | - | | | | 539,176 | |
| | | | | | | | | | | | | | | | | | | | | |
| Long-term debt | | | 347,485 | | | | - | | | | - | | | | - | | | | 347,485 | |
| Contingent income tax liabilities | | | 27,267 | | | | 2,081 | | | | - | | | | - | | | | 29,348 | |
Long-term capital lease obligations | | | - | | | | 3,394 | | | | - | | | | - | | | | 3,394 | |
| Other long-term liabilities | | | 3,578 | | | | 50,120 | | | | - | | | | - | | | | 53,698 | |
| Deferred income tax liabilities | | | 230,818 | | | | 224,680 | | | | - | | | | (224,680 | ) | | | 230,818 | |
| Payable to affiliated companies | | | 674 | | | | - | | | | 234 | | | | (908 | ) | | | - | |
| | | | | | | | | | | | | | | | | | | | | |
| Shareholders' equity | | | 943,976 | | | | 991,555 | | | | 267 | | | | (991,822 | ) | | | 943,976 | |
Total liabilities and shareholders' equity | | $ | 1,575,620 | | | $ | 1,789,169 | | | $ | 516 | | | $ | (1,217,410 | ) | | $ | 2,147,895 | |
| | | | | | | | | | | | | | | | | | | | | |
(1) FHI receivable from affiliated companies balance includes $61,007 for income taxes receivable from parent under a tax sharing agreement. | |
| FRONTIER OIL CORPORATION | |
| Condensed Consolidating Statement of Cash Flows | |
| For the Year Ended December 31, 2010 | |
| (in thousands) | |
| | | | | | | | | | | | | | | | |
| | | FOC (Parent) | | | FHI (Guarantor Subsidiaries) | | | Other Non-Guarantor Subsidiaries | | | Eliminations | | | Consolidated | |
| Cash flows from operating activities: | | | | | | | | | | | | | | | |
| Net income | | $ | 37,785 | | | $ | 62,613 | | | $ | 4 | | | $ | (62,617 | ) | | $ | 37,785 | |
Adjustments to reconcile net income to net cash from operating activities: | | | | | | | | | | | | | | | | | | | | |
| Equity in earnings of subsidiaries | | | (96,435 | ) | | | - | | | | - | | | | 96,435 | | | | - | |
Depreciation, amortization and accretion | | | 63 | | | | 103,822 | | | | - | | | | 936 | | | | 104,821 | |
| Deferred income taxes | | | 1,963 | | | | - | | | | - | | | | - | | | | 1,963 | |
| Stock-based compensation expense | | | 15,840 | | | | - | | | | - | | | | - | | | | 15,840 | |
Excess income tax benefits of stock-based compensation | | | (152 | ) | | | - | | | | - | | | | - | | | | (152 | ) |
| Intercompany income taxes | | | (18,482 | ) | | | 51,240 | | | | 78 | | | | (32,836 | ) | | | - | |
| Intercompany dividends | | | 42,200 | | | | - | | | | - | | | | (42,200 | ) | | | - | |
| Other intercompany transactions | | | 2,636 | | | | (2,561 | ) | | | (75 | ) | | | - | | | | - | |
| Amortization of debt issuance costs | | | 779 | | | | 706 | | | | - | | | | - | | | | 1,485 | |
| Senior notes discount amortization | | | 288 | | | | - | | | | - | | | | - | | | | 288 | |
| Loss on extinguishment of debt | | | 750 | | | | - | | | | - | | | | - | | | | 750 | |
Decrease in allowance for investment loss and bad debts | | | (15 | ) | | | (169 | ) | | | - | | | | - | | | | (184 | ) |
| Net gains on sales of assets | | | (1 | ) | | | - | | | | - | | | | - | | | | (1 | ) |
Decrease in other long-term liabilities | | | (23,360 | ) | | | (3,910 | ) | | | - | | | | - | | | | (27,270 | ) |
| Turnaround and catalyst costs paid | | | - | | | | (8,804 | ) | | | - | | | | - | | | | (8,804 | ) |
| Other | | | (515 | ) | | | 91 | | | | | | | | | | | | (424 | ) |
Changes in components of working capital from operations | | | 116,812 | | | | (11,338 | ) | | | (7 | ) | | | 599 | | | | 106,066 | |
| Net cash provided by operating activities | | | 80,156 | | | | 191,690 | | | | - | | | | (39,683 | ) | | | 232,163 | |
| | | | | | | | | | | | | | | | | | | | | |
| Cash flows from investing activities: | | | | | | | | | | | | | | | | | | | | |
Additions to property, plant and equipment | | | (17 | ) | | | (82,099 | ) | | | - | | | | (2,517 | ) | | | (84,633 | ) |
| Proceeds from sales of assets | | | 1 | | | | - | | | | - | | | | - | | | | 1 | |
| Net cash used in investing activities | | | (16 | ) | | | (82,099 | ) | | | - | | | | (2,517 | ) | | | (84,632 | ) |
| | | | | | | | | | | | | | | | | | | | | |
| Cash flows from financing activities: | | | | | | | | | | | | | | | | | | | | |
| Proceeds from issuance of Senior Notes | | | 150,000 | | | | - | | | | - | | | | - | | | | 150,000 | |
| Repayments of Senior Notes | | | (150,000 | ) | | | - | | | | - | | | | - | | | | (150,000 | ) |
| Purchase of treasury stock | | | (3,614 | ) | | | - | | | | - | | | | - | | | | (3,614 | ) |
| Dividends paid | | | (6,629 | ) | | | - | | | | - | | | | - | | | | (6,629 | ) |
| Excess income tax benefits of stock-based compensation | | | 152 | | | | - | | | | - | | | | - | | | | 152 | |
| Debt issuance costs and other | | | (3,661 | ) | | | (418 | ) | | | - | | | | - | | | | (4,079 | ) |
| Intercompany dividends | | | - | | | | (42,200 | ) | | | - | | | | 42,200 | | | | - | |
| Net cash used in financing activities | | | (13,752 | ) | | | (42,618 | ) | | | - | | | | 42,200 | | | | (14,170 | ) |
| Increase in cash and cash equivalents | | | 66,388 | | | | 66,973 | | | | - | | | | - | | | | 133,361 | |
Cash and cash equivalents, beginning of period | | | 211,775 | | | | 213,505 | | | | - | | | | - | | | | 425,280 | |
Cash and cash equivalents, end of period | | $ | 278,163 | | | $ | 280,478 | | | $ | - | | | $ | - | | | $ | 558,641 | |
| FRONTIER OIL CORPORATION | |
| Condensed Consolidating Statement of Cash Flows | |
| For the Year Ended December 31, 2009 | |
| (in thousands) | |
| | | | | | | | | | | | | | | | |
| | | FOC (Parent) | | | FHI (Guarantor Subsidiaries) | | | Other Non-Guarantor Subsidiaries | | | Eliminations | | | Consolidated | |
| Cash flows from operating activities: | | | | | | | | | | | | | | | |
| Net (loss) income | | $ | (83,760 | ) | | $ | (52,215 | ) | | $ | 13 | | | $ | 52,202 | | | $ | (83,760 | ) |
Adjustments to reconcile net (loss) income to net cash from operating activities: | | | | | | | | | | | | | | | | | | | | |
| Equity in earnings of subsidiaries | | | 79,986 | | | | - | | | | - | | | | (79,986 | ) | | | - | |
Depreciation, amortization and accretion | | | 70 | | | | 99,398 | | | | - | | | | 630 | | | | 100,098 | |
| Deferred income taxes | | | 31,082 | | | | - | | | | - | | | | - | | | | 31,082 | |
| Stock-based compensation expense | | | 20,608 | | | | - | | | | - | | | | - | | | | 20,608 | |
Excess income tax benefits of stock-based compensation | | | (244 | ) | | | - | | | | - | | | | - | | | | (244 | ) |
| Intercompany income taxes | | | (30,000 | ) | | | (2,523 | ) | | | 24 | | | | 32,499 | | | | - | |
| Intercompany dividends | | | 21,200 | | | | - | | | | - | | | | (21,200 | ) | | | - | |
| Other intercompany transactions | | | 1,321 | | | | (1,273 | ) | | | (48 | ) | | | - | | | | - | |
| Amortization of debt issuance costs | | | 783 | | | | 706 | | | | - | | | | - | | | | 1,489 | |
| Senior notes discount amortization | | | 264 | | | | - | | | | - | | | | - | | | | 264 | |
Decrease in allowance for investment loss and bad debts | | | - | | | | 500 | | | | - | | | | - | | | | 500 | |
| Increase in other long-term liabilities | | | 2,633 | | | | 8,196 | | | | - | | | | - | | | | 10,829 | |
| Turnaround and catalyst costs paid | | | - | | | | (33,477 | ) | | | - | | | | - | | | | (33,477 | ) |
| Other | | | (1,065 | ) | | | 122 | | | | | | | | | | | | (943 | ) |
Changes in components of working capital from operations | | | (57,416 | ) | | | 151,620 | | | | 11 | | | | 281 | | | | 94,496 | |
Net cash (used in) provided by operating activities | | | (14,538 | ) | | | 171,054 | | | | - | | | | (15,574 | ) | | | 140,942 | |
| | | | | | | | | | | | | | | | | | | | | |
| Cash flows from investing activities: | | | | | | | | | | | | | | | | | | | | |
Additions to property, plant and equipment | | | (194 | ) | | | (162,850 | ) | | | - | | | | (5,626 | ) | | | (168,670 | ) |
| Other acquisitions | | | - | | | | (2,100 | ) | | | - | | | | - | | | | (2,100 | ) |
| Net cash used in investing activities | | | (194 | ) | | | (164,950 | ) | | | - | | | | (5,626 | ) | | | (170,770 | ) |
| | | | | | | | | | | | | | | | | | | | | |
| Cash flows from financing activities: | | | | | | | | | | | | | | | | | | | | |
| Purchase of treasury stock | | | (3,008 | ) | | | - | | | | - | | | | - | | | | (3,008 | ) |
Proceeds from issuance of common stock | | | 70 | | | | - | | | | - | | | | - | | | | 70 | |
| Dividends paid | | | (25,349 | ) | | | - | | | | - | | | | - | | | | (25,349 | ) |
Excess income tax benefits of stock-based compensation | | | 244 | | | | - | | | | - | | | | - | | | | 244 | |
| Debt issuance costs and other | | | 2 | | | | (383 | ) | | | - | | | | - | | | | (381 | ) |
| Intercompany dividends | | | - | | | | (21,200 | ) | | | - | | | | 21,200 | | | | - | |
| Net cash used in financing activities | | | (28,041 | ) | | | (21,583 | ) | | | - | | | | 21,200 | | | | (28,424 | ) |
| Decrease in cash and cash equivalents | | | (42,773 | ) | | | (15,479 | ) | | | - | | | | - | | | | (58,252 | ) |
Cash and cash equivalents, beginning of period | | | 254,548 | | | | 228,984 | | | | - | | | | - | | | | 483,532 | |
Cash and cash equivalents, end of period | | $ | 211,775 | | | $ | 213,505 | | | $ | - | | | $ | - | | | $ | 425,280 | |
| FRONTIER OIL CORPORATION | |
| Condensed Consolidating Statement of Cash Flows | |
| For the Year Ended December 31, 2008 | |
| (in thousands) | |
| | | | | | | | | | | | | | | | |
| | | FOC (Parent) | | | FHI (Guarantor Subsidiaries) | | | Other Non-Guarantor Subsidiaries | | | Eliminations | | | Consolidated | |
| Cash flows from operating activities: | | | | | | | | | | | | | | | |
| Net income | | $ | 226,053 | | | $ | 238,789 | | | $ | 217 | | | $ | (239,006 | ) | | $ | 226,053 | |
Adjustments to reconcile net income to net cash from operating activities: | | | | | | | | | | | | | | | | | | | | |
| Equity in earnings of subsidiaries | | | (371,830 | ) | | | - | | | | - | | | | 371,830 | | | | - | |
Depreciation, amortization and accretion | | | 55 | | | | 88,356 | | | | - | | | | 292 | | | | 88,703 | |
| Deferred income taxes | | | 169,766 | | | | - | | | | - | | | | - | | | | 169,766 | |
| Stock-based compensation expense | | | 20,014 | | | | - | | | | - | | | | - | | | | 20,014 | |
Excess income tax benefits of stock-based compensation | | | (3,191 | ) | | | - | | | | - | | | | - | | | | (3,191 | ) |
| Intercompany income taxes | | | (6,000 | ) | | | 132,598 | | | | 139 | | | | (126,737 | ) | | | - | |
| Intercompany dividends | | | 10,000 | | | | - | | | | - | | | | (10,000 | ) | | | - | |
| Other intercompany transactions | | | (3,261 | ) | | | 3,433 | | | | (172 | ) | | | - | | | | - | |
| Amortization of debt issuance costs | | | 570 | | | | 408 | | | | - | | | | - | | | | 978 | |
| Senior notes discount amortization | | | 60 | | | | - | | | | - | | | | - | | | | 60 | |
| Allowance for investment loss | | | 41 | | | | 458 | | | | - | | | | - | | | | 499 | |
| Gains on sales of assets | | | (37 | ) | | | (7 | ) | | | - | | | | - | | | | (44 | ) |
| Turnaround and catalyst costs paid | | | - | | | | (34,746 | ) | | | - | | | | - | | | | (34,746 | ) |
| Other | | | 1,622 | | | | (282 | ) | | | | | | | | | | | 1,340 | |
(Decrease) increase in other long- term liabilities | | | (3,716 | ) | | | 543 | | | | - | | | | - | | | | (3,173 | ) |
Changes in components of working capital from operations | | | (80,054 | ) | | | (90,333 | ) | | | (184 | ) | | | 1,587 | | | | (168,984 | ) |
Net cash (used in) provided by operating activities | | | (39,908 | ) | | | 339,217 | | | | - | | | | (2,034 | ) | | | 297,275 | |
| | | | | | | | | | | | | | | | | | | | | |
| Cash flows from investing activities: | | | | | | | | | | | | | | | | | | | | |
Additions to property, plant and equipment | | | (129 | ) | | | (201,286 | ) | | | - | | | | (7,966 | ) | | | (209,381 | ) |
| Proceeds from sales of assets | | | 37 | | | | 9 | | | | - | | | | - | | | | 46 | |
El Dorado Refinery contingent earn- out payment | | | - | | | | (7,500 | ) | | | - | | | | - | | | | (7,500 | ) |
| Net cash used in investing activities | | | (92 | ) | | | (208,777 | ) | | | - | | | | (7,966 | ) | | | (216,835 | ) |
| | | | | | | | | | | | | | | | | | | | | |
| Cash flows from financing activities: | | | | | | | | | | | | | | | | | | | | |
Proceeds from issuance of Senior Notes | | | 197,160 | | | | - | | | | - | | | | - | | | | 197,160 | |
| Purchase of treasury stock | | | (67,030 | ) | | | - | | | | - | | | | - | | | | (67,030 | ) |
Proceeds from issuance of common stock | | | 405 | | | | - | | | | - | | | | - | | | | 405 | |
| Dividends paid | | | (23,144 | ) | | | - | | | | - | | | | - | | | | (23,144 | ) |
Excess income tax benefits of stock-based compensation | | | 3,191 | | | | - | | | | - | | | | - | | | | 3,191 | |
| Debt issuance costs and other | | | (2,402 | ) | | | (2,487 | ) | | | - | | | | - | | | | (4,889 | ) |
| Intercompany dividends | | | - | | | | (10,000 | ) | | | - | | | | 10,000 | | | | - | |
Net cash provided by (used in) financing activities | | | 108,180 | | | | (12,487 | ) | | | - | | | | 10,000 | | | | 105,693 | |
| Increase in cash and cash equivalents | | | 68,180 | | | | 117,953 | | | | - | | | | - | | | | 186,133 | |
Cash and cash equivalents, beginning of period | | | 186,368 | | | | 111,031 | | | | - | | | | - | | | | 297,399 | |
Cash and cash equivalents, end of period | | $ | 254,548 | | | $ | 228,984 | | | $ | - | | | $ | - | | | $ | 483,532 | |
17. Selected Quarterly Financial and Operating Data (Unaudited)
| (Dollars in thousands, except per share and per bbl) | |
| | | | | | | | | | | | | | | | | | | | | | | | | |
| | | 2010 | | | 2009 | |
| | | Fourth | | | Third | | | Second | | | First | | | Fourth | | | Third | | | Second | | | First | |
| Revenues | | $ | 1,647,410 | | | $ | 1,416,472 | | | $ | 1,548,880 | | | $ | 1,272,144 | | | $ | 1,088,539 | | | $ | 1,200,582 | | | $ | 1,101,844 | | | $ | 846,248 | |
| Operating income (loss) | | | 9,601 | | | | 16,318 | | | | 115,991 | | | | (58,087 | ) | | | (114,365 | ) | | | (4,480 | ) | | | (82,706 | ) | | | 96,181 | |
| Net income (loss) | | | 3,627 | | | | 8,308 | | | | 66,114 | | | | (40,264 | ) | | | (75,054 | ) | | | (8,784 | ) | | | (57,872 | ) | | | 57,950 | |
| | | | | | | | | | | | | | | | | | | | | | | | | | | | | | | | | |
Basic net income (loss) per share | | | 0.03 | | | | 0.08 | | | | 0.63 | | | | (0.39 | ) | | | (0.72 | ) | | | (0.08 | ) | | | (0.56 | ) | | | 0.56 | |
Diluted net income (loss) per share | | | 0.03 | | | | 0.08 | | | | 0.63 | | | | (0.39 | ) | | | (0.72 | ) | | | (0.08 | ) | | | (0.56 | ) | | | 0.56 | |
| | | | | | | | | | | | | | | | | | | | | | | | | | | | | | | | | |
| Refining operations: | | | | | | | | | | | | | | | | | | | | | | | | | | | | | | | | |
Total charges (bpd) (1) | | | 193,455 | | | | 180,605 | | | | 191,017 | | | | 172,308 | | | | 138,673 | | | | 177,741 | | | | 181,152 | | | | 182,475 | |
Gasoline yields (bpd) (2) | | | 94,138 | | | | 87,144 | | | | 92,167 | | | | 82,963 | | | | 69,493 | | | | 84,913 | | | | 83,723 | | | | 82,768 | |
Diesel and jet fuel yields (bpd) (2) | | | 68,497 | | | | 69,603 | | | | 74,215 | | | | 66,094 | | | | 52,360 | | | | 67,167 | | | | 74,059 | | | | 70,759 | |
| Total product sales (bpd) | | | 202,485 | | | | 184,596 | | | | 195,120 | | | | 172,431 | | | | 152,672 | | | | 178,163 | | | | 191,106 | | | | 179,413 | |
Average gasoline crack spread (per bbl) | | $ | 5.65 | | | $ | 10.51 | | | $ | 10.02 | | | $ | 6.36 | | | $ | 4.40 | | | $ | 7.92 | | | $ | 10.85 | | | $ | 7.04 | |
Average diesel crack spread (per bbl) | | | 15.21 | | | | 13.93 | | | | 13.81 | | | | 7.41 | | | | 7.03 | | | | 7.94 | | | | 6.28 | | | | 11.69 | |
Cheyenne average light/heavy crude oil differential (per bbl) | | | 16.62 | | | | 13.03 | | | | 11.06 | | | | 6.46 | | | | 8.56 | | | | 7.11 | | | | 4.93 | | | | 5.84 | |
El Dorado average light/heavy crude oil differential (per bbl) | | | 13.18 | | | | 8.88 | | | | 8.37 | | | | 3.95 | | | | 6.93 | | | | 5.69 | | | | 3.90 | | | | 7.54 | |
Average WTI/WTS crude oil differential (per bbl) | | | 2.58 | | | | 2.13 | | | | 2.11 | | | | 1.77 | | | | 2.27 | | | | 1.62 | | | | 1.02 | | | | 1.69 | |
| | | | | | | | | | | | | | | | | | | | | | | | | | | | | | | | | |
(1) Charges are the quantity of crude oil and other feedstock processed through refinery units. | |
(2) Manufactured product yields are the volumes of specific materials that are obtained through the distilling of crude oil and the operations of other refinery process units. | |
Item 9. Changes in and Disagreements With Accountants on Accounting and Financial Disclosure None.
The information contained in this Form 10-K, as well as the financial and operational data we present concerning the Company, is prepared by management. Our financial statements are fairly presented in all material respects in conformity with generally accepted accounting principles. It has always been our intent to apply proper and prudent accounting guidelines in the presentation of our financial statements, and we are committed to full and accurate representation of our condition through complete and clear disclosures.
We maintain a set of disclosure controls and procedures that are designed to ensure that information required to be disclosed by us in the reports filed by us under the Securities Exchange Act of 1934, as amended (“Exchange Act”), is recorded, processed, summarized and reported within the time periods specified in the SEC’s rules and forms, and that such information is accumulated and communicated to management, including the Chief Executive Officer and Chief Financial Officer, as appropriate, to allow timely decisions regarding required disclosure. Management necessarily applies its judgment in assessing the costs and benefits of such controls and procedures, which, by their nature, can provide only reasonable assurance regarding management's control objectives.
As of the end of the period covered by this report, we evaluated, under the supervision and with the participation of our management, including our President and Chief Executive Officer, our Executive Vice President and Chief Financial Officer and our Vice-President and Chief Accounting Officer, the effectiveness of our disclosure controls and procedures pursuant to Rule 13a-15 of the Exchange Act. Based on that evaluation, our President and Chief Executive Officer, our Executive Vice President and Chief Financial Officer and our Vice-President and Chief Accounting Officer concluded that our disclosure controls and procedures are effective.
During the most recent fiscal quarter, there have been no changes in our internal control over financial reporting that have materially affected, or is reasonably likely to materially affect, our internal control over financial reporting.
Our “Management’s Report on Internal Control Over Financial Reporting” and the related “Report of Independent Registered Public Accounting Firm” on our report are included on pages 27 and 28.
None.
The information required by Part III of this Form is incorporated by reference from the Company’s definitive proxy statement to be filed with the SEC pursuant to Regulation 14A within 120 days after the close of its last fiscal year.
| Exhibits and Financial Statement Schedules |
| (a)1.Financial Statements and Supplemental Data |
| |
|
|
|
|
|
|
|
| (a)2.Financial Statements Schedules |
| |
|
|
| Other Schedules are omitted because of the absence of the conditions under which they are required or because the required information is included in the financial statements or notes thereto. |
| * | 2.1 | Asset Purchase and Sale Agreement, dated as of October 19, 1999, among Frontier El Dorado Refining Company, as buyer, the Company, as Guarantor, and Equilon Enterprises LLC, as seller (Exhibit 10.1 to Form 8-K, File Number 1-07627, filed December 1, 1999). |
| * | 2.2 | Agreement and Plan of Merger, dated as of February 21, 2011, by and among Frontier Oil Corporation, North Acquisition, Inc. and Holly Corporation (Exhibit 2.1 to Form 8-K, File Number 1-07627, filed February 22, 2011). |
| * | 3.1 | Second Amended and Restated Articles of Incorporation of Frontier Oil Corporation dated May 1, 2009 (Exhibit 10.11 to Form 10-K, File Number 1-07627, filed February 25, 2010). |
| * | 3.2 | Fifth Restated Bylaws of Wainoco Oil Corporation (now Frontier Oil Corporation), effective November 12, 2008 (Exhibit 2.1 to Form 8-K, File Number 1-07627, filed November 14, 2008). |
| * | 4.1 | Indenture, dated as of September 17, 2008, among Frontier Oil Corporation, the guarantors named therein and Wells Fargo Bank, N.A., as trustee relating to the Company’s 8.5% Senior Notes due 2016 (Exhibit 4.1 to Form 8-K, File Number 1-07627, filed September 17, 2008). |
| * | 4.2 | First Supplemental Indenture, dated as of September 17, 2008, among Frontier Oil Corporation, the guarantors named therein and Wells Fargo Bank, N.A., as trustee relating to the Company’s 8.5% Senior Notes due 2016 (Exhibit 4.2 to Form 8-K, File Number 1-07627, filed September 17, 2008). |
| * | 4.3 | Second Supplemental Indenture, dated as of November 22, 2010, among Frontier Oil Corporation, the guarantors named therein, and Wells Fargo Bank, N.A., as trustee, relating to the Company’s 8.5% Senior Notes due 2016 (Exhibit 4.1 to Form 8-K, File Number 1-07627, filed November 22, 2010). |
| * | 4.4 | Form of the Company’s global note for 8.5% Senior Notes due 2016 (Exhibit 4.3 to Form 8-K, File Number1-07627, filed September 17, 2008). |
| * | 4.5 | Indenture, dated as of November 22, 2010, among Frontier Oil Corporation, the guarantors named therein, and Wells Fargo Bank, N.A., as trustee, relating to the Company’s 6.875% Senior Notes due 2018 (Exhibit 4.1 to Form 8-K, File Number1-07627, filed November 22, 2010). |
| * | 4.6 | First Supplemental Indenture, dated as of November 22, 2010, among Frontier Oil Corporation, the guarantors named therein, and Wells Fargo Bank, N.A., as trustee, relating to the Company’s 6.875% Senior Notes due 2018 (Exhibit 4.1 to Form 8-K, File Number1-07627, filed November 22, 2010). |
| * | 4.7 | Form of global note for 6.875% Senior Notes due 2018 Exhibit 4.1 to Form 8-K, File Number1-07627, filed November 22, 2010). |
*² | 10.1 | Frontier Deferred Compensation Plan (previously named Wainoco Deferred Compensation Plan dated October 29, 1993 and filed as Exhibit 10.19 to Form 10-K, File Number 1-07627, filed March 17, 1995). |
*² | 10.2 | Frontier Deferred Compensation Plan for Directors (previously named Wainoco Deferred Compensation Plan for Directors dated May 1, 1994 and filed as Exhibit 10.20 to Form 10-K, File Number 1-07627, filed March 17, 1995). |
| * | 10.3 | Fourth Amended and Restated Revolving Credit Agreement dated as of August 19, 2008, among Frontier Oil and Refining Company, Frontier Oil Corporation, Union Bank of California, N.A., as administrative agent, and BNP Paribas, as syndication agent and the other lenders specified therein (Exhibit 10.1 to Form 8-K, File Number 1-07627, filed August 20, 2008). |
| * | 10.4 | First Amendment to Fourth Amended and Restated Revolving Credit Agreement dated December 15, 2008, among Frontier Oil and Refining Company, Frontier Oil Corporation, Union Bank of California, N.A., as administrative agent, and BNP Paribas, as syndication agent and the other lenders specified therein (Exhibit 10.1 to Form 8-K, File Number 1-07627, filed December 16, 2008). |
| * | 10.5 | Second Amendment to Fourth Amended and Restated Revolving Credit Agreement dated November 18, 2009, among Frontier Oil and Refining Company, Frontier Oil Corporation, Union Bank of California, N.A., as administrative agent, and BNP Paribas, as syndication agent and the other lenders specified therein (Exhibit 10.11 to Form 10-K, File Number 1-07627, filed February 25, 2010). |
| * | 10.6 | Third Amendment to Fourth Amended and Restated Revolving Credit Agreement dated February 22, 2010, among Frontier Oil and Refining Company, Frontier Oil Corporation, Union Bank of California, N.A., as administrative agent, and BNP Paribas, as syndication agent and the other lenders specified therein (Exhibit 10.11 to Form 10-K, File Number 1-07627, filed February 25, 2010). |
| * | 10.7 | Frontier Products Offtake Agreement El Dorado Refinery, dated as of October 19, 1999 by and between Frontier Oil and Refining Company and Equiva Trading Company (now Shell Oil Products US, assignee of Equiva Trading Company) (“the Agreement”), and First Amendment to the Agreement dated September 18, 2000, Second Amendment to the Agreement dated September 21, 2000, Third Amendment to the Agreement dated December 19, 2000, Fourth Amendment to the Agreement dated February 22, 2001, Fifth Amendment to the Agreement dated August 14, 2001, Sixth Amendment to the Agreement dated November 5, 2001, Seventh Amendment to the Agreement dated April 22, 2002, Eight Amendment to the Agreement dated May 30, 2003, Ninth Amendment to the Agreement dated May 25, 2004, Tenth Amendment to the Agreement dated May 3, 2005, Eleventh Amendment to t he Agreement dated March 31, 2006, Twelfth Amendment to the Agreement dated May 11, 2006, Thirteenth Amendment to the Agreement dated September 30, 2007, Fourteenth Amendment to the Agreement dated May 1, 2008 and Fifteenth Amendment to the Agreement dated May 28, 2008 (Exhibit 10.1 to Form 10-Q, File Number 1-07627, filed August 7, 2008). |
| * | 10.8 | Sixteenth Amendment dated November 1, 2009, to the Frontier Products Offtake Agreement El Dorado Refinery, dated as of October 19, 1999 by and between Frontier Oil and Refining Company and Equiva Trading Company (now Shell Oil Products US, assignee of Equiva Trading Company) (Exhibit 10.14 to Form 10-K, File Number 1-07627, filed February 25, 2010). |
| * | 10.9 | Master Crude Oil Purchase and Sale Agreement, dated November 1, 2010, among BNP Paribas Energy Trading GP, BNP Paribas Energy Trading Canada Corp., Frontier Oil and Refining Company and Frontier Oil Corporation (Exhibit 10.1 to Form 10-Q, File Number 1-07627, filed November 4, 2010). |
| * | 10.10 | Guaranty dated November 1, 2010 made by Frontier Oil Corporation in favor of BNP Paribas Energy Trading GP and BNP Paribas Energy Trading Canada Corp (Exhibit 10.1 to Form 10-Q, File Number 1-07627, filed November 4, 2010). |
*² | 10.11 | Frontier Oil Corporation Omnibus Incentive Compensation Plan (Annex A to Proxy Statement, File Number 1-07627, filed March 21, 2006). |
*² | 10.12 | First Amendment to the Frontier Oil Corporation Omnibus Incentive Compensation Plan (Annex B to Proxy Statement, File Number 1-07627, filed March 22, 2010). |
*² | 10.13 | Form of Frontier Oil Corporation Omnibus Incentive Compensation Plan Stock Unit/Restricted Stock Agreement (Exhibit 4.8 to Form S-8, File Number 333-133595, filed April 27, 2006). |
*² | 10.14 | Form of Frontier Oil Corporation Omnibus Incentive Compensation Plan Nonqualified Stock Option Agreement (Exhibit 4.9 to Form S-8, File Number 333-133595, filed April 27, 2006). |
*² | 10.15 | Form of Non-Employee Director Restricted Stock Unit Grant Agreement (Exhibit 10.1 to Form 8-K, File Number 1-07627, filed April 7, 2006). |
*² | 10.16 | Form of First Amendment to Restricted Stock Unit Grant (Exhibit 10.1 to Form 10-Q, File Number 1-07627, filed August 7, 2006). |
*² | 10.17 | Form of Restricted Stock Agreement (Exhibit 10.2 to Form 8-K, File Number 1-07627, filed April 7, 2006). |
*² | 10.18 | Form of Indemnification Agreement by and between the Company and each of its officers and directors (Exhibit 10.41 to Form 10-K, File Number 1-07627, filed February 28, 2007). |
*² | 10.19 | Management Incentive Compensation Plan for Fiscal 2008 (Exhibit 10.1 to Form 8-K, File Number 1-07627, filed February 29, 2008). |
*² | 10.20 | Management Incentive Compensation Plan for Fiscal 2009 (Exhibit 10.1 to Form 8-K, File Number 1-07627, filed February 27, 2009). |
*² | 10.21 | Form of 2007 Stock Unit / Restricted Stock Agreement (Exhibit 10.1 to Form 10-Q, File Number 1-07627, filed May 9, 2007). |
*² | 10.22 | Form of Stock Unit / Restricted Stock Agreement for other employees (Exhibit 10.2 to Form 10-Q, File Number 1-07627, filed May 8, 2008). |
*² | 10.23 | Executive Change in Control Severance Agreement, effective as of December 30, 2008 by and between Frontier Oil Corporation and Michael C. Jennings (Exhibit 10.2 to Form 8-K, File Number 1-07627, filed January 2, 2009). |
*² | 10.24 | Amendment to Executive and Change in Control Severance Agreement, dated April 28, 2009, between Frontier Oil Corporation and Michael C. Jennings (Exhibit 10.1 to Form 8-K, File Number 1-07627, filed May 01, 2009). |
*² | 10.25 | Executive Change in Control Severance Agreement, effective as of December 30, 2008 by and between Frontier Oil Corporation and Doug S. Aron (Exhibit 10.4 to Form 8-K, File Number 1-07627, filed January 2, 2009). |
*² | 10.26 | Executive Change in Control Severance Agreement, effective as of December 30, 2008 by and between Frontier Oil Corporation and J. Currie Bechtol (Exhibit 10.5 to Form 8-K, File Number 1-07627, filed January 2, 2009). |
*² | 10.27 | Executive Change in Control Severance Agreement, effective as of December 30, 2008 by and between Frontier Oil Corporation and Gerald B. Faudel (Exhibit 10.6 to Form 8-K, File Number 1-07627, filed January 2, 2009). |
*² | 10.28 | Executive Change in Control Severance Agreement, effective as of December 30, 2008 by and between Frontier Oil Corporation and Jon D. Galvin (Exhibit 10.7 to Form 8-K, File Number 1-07627, filed January 2, 2009). |
*² | 10.29 | Executive Change in Control Severance Agreement, effective as of December 30, 2008 by and between Frontier Oil Corporation and Nancy J. Zupan (Exhibit 10.8 to Form 8-K, File Number 1-07627, filed January 2, 2009). |
*² | 10.30 | Executive Change in Control Severance Agreement, effective as of December 30, 2008 by and between Frontier Oil Corporation and Leo J. Hoonakker (Exhibit 10.9 to Form 8-K, File Number 1-07627, filed January 2, 2009). |
*² | 10.31 | Executive Change in Control Severance Agreement, effective as of December 30, 2008 by and between Frontier Oil Corporation and Penny S. Newmark (Exhibit 10.10 to Form 8-K, File Number 1-07627, filed January 2, 2009). |
*² | 10.32 | Executive Change in Control Severance Agreement, effective as of December 30, 2008 by and between Frontier Oil Corporation and Kent A. Olsen (Exhibit 10.12 to Form 8-K, File Number 1-07627, filed January 2, 2009). |
*² | 10.33 | Executive Change in Control Severance Agreement, effective as of December 30, 2008 by and between Frontier Oil Corporation and Joel W. Purdy (Exhibit 10.13 to Form 8-K, File Number 1-07627, filed January 2, 2009). |
*² | 10.34 | Executive Change in Control Severance Agreement, effective as of December 30, 2008 by and between Frontier Oil Corporation and Billy N. Rigby (Exhibit 10.14 to Form 8-K, File Number 1-07627, filed January 2, 2009). |
*² | 10.35 | Executive Change in Control Severance Agreement, effective as of December 30, 2008 by and between Frontier Oil Corporation and James M. Stump (Exhibit 10.15 to Form 8-K, File Number 1-07627, filed January 2, 2009). |
*² | 10.36 | Executive Change in Control Severance Agreement, dated April 28, 2009, between Frontier Oil Corporation and Joshua Goodmanson (Exhibit 10.2 to Form 8-K, File Number 1-07627, filed May 01, 2009). |
*² | 10.37 | Executive Change in Control Severance Agreement, dated September 9, 2009, between Frontier Oil Corporation and Kevin D. Burke (Exhibit 10.1 to Form 8-K, File Number 1-07627, filed September 09, 2009). |
*² | 10.38 | Executive Change in Control Severance Agreement, effective as of June 1, 2010 by and between Frontier Oil Corporation and Paige A. Kester (Exhibit 10.1 to Form 10-Q, File Number 1-07627, filed November 4, 2010). |
*² | 10.39 | Executive Severance Agreement, effective as of December 30, 2008 by and between Frontier Oil Corporation and Michael C. Jennings (Exhibit 10.16 to Form 8-K, File Number 1-07627, filed January 2, 2009). |
*² | 10.40 | Executive Severance Agreement, effective as of December 30, 2008 by and between Frontier Oil Corporation and Doug S. Aron (Exhibit 10.18 to Form 8-K, File Number 1-07627, filed January 2, 2009). |
*² | 10.41 | Executive Severance Agreement, effective as of December 30, 2008 by and between Frontier Oil Corporation and J. Currie Bechtol (Exhibit 10.19 to Form 8-K, File Number 1-07627, filed January 2, 2009). |
*² | 10.42 | Executive Severance Agreement, effective as of December 30, 2008 by and between Frontier Oil Corporation and Gerald B. Faudel (Exhibit 10.20 to Form 8-K, File Number 1-07627, filed January 2, 2009). |
*² | 10.43 | Executive Severance Agreement, effective as of December 30, 2008 by and between Frontier Oil Corporation and Jon D. Galvin (Exhibit 10.21 to Form 8-K, File Number 1-07627, filed January 2, 2009). |
*² | 10.44 | Executive Severance Agreement, effective as of December 30, 2008 by and between Frontier Oil Corporation and Nancy J. Zupan (Exhibit 10.22 to Form 8-K, File Number 1-07627, filed January 2, 2009). |
*² | 10.45 | Executive Severance Agreement, effective as of December 30, 2008 by and between Frontier Oil Corporation and Leo J. Hoonakker (Exhibit 10.23 to Form 8-K, File Number 1-07627, filed January 2, 2009). |
*² | 10.46 | Executive Severance Agreement, effective as of December 30, 2008 by and between Frontier Oil Corporation and Penny S. Newmark (Exhibit 10.24 to Form 8-K, File Number 1-07627, filed January 2, 2009). |
*² | 10.47 | Executive Severance Agreement, effective as of December 30, 2008 by and between Frontier Oil Corporation and Kent A. Olsen (Exhibit 10.26 to Form 8-K, File Number 1-07627, filed January 2, 2009). |
*² | 10.48 | Executive Severance Agreement, effective as of December 30, 2008 by and between Frontier Oil Corporation and Joel W. Purdy (Exhibit 10.27 to Form 8-K, File Number 1-07627, filed January 2, 2009). |
*² | 10.49 | Executive Severance Agreement, effective as of December 30, 2008 by and between Frontier Oil Corporation and Billy N. Rigby (Exhibit 10.28 to Form 8-K, File Number 1-07627, filed January 2, 2009). |
*² | 10.50 | Executive Severance Agreement, effective as of December 30, 2008 by and between Frontier Oil Corporation and James M. Stump (Exhibit 10.29 to Form 8-K, File Number 1-07627, filed January 2, 2009). |
*² | 10.51 | Executive Severance Agreement, dated April 28, 2009, between Frontier Oil Corporation and Joshua Goodmanson (Exhibit 10.3 to Form 8-K, File Number 1-07627, filed May 01, 2009). |
*² | 10.52 | Executive Severance Agreement, dated September 9, 2009, between Frontier Oil Corporation and Kevin D. Burke (Exhibit 10.2 to Form 8-K, File Number 1-07627, filed September 09, 2009). |
*² | 10.53 | Executive Severance Agreement, effective as of June 1, 2010 by and between Frontier Oil Corporation and Paige A. Kester (Exhibit 10.1 to Form 10-Q, File Number 1-07627, filed November 4, 2010). |
| ² | | |
| ² | | |
*² | 10.56 | Retention and Assumption Agreement, dated as of February 21, 2011, by and among Frontier Oil Corporation, Holly Corporation and Michael C. Jennings (Exhibit 10.1 to Form 8-K, File Number 1-07627, filed February 22, 2011). |
*² | 10.57 | Retention and Assumption Agreement, dated as of February 21, 2011, by and among Frontier Oil Corporation, Holly Corporation and Doug S. Aron (Exhibit 10.1 to Form 8-K, File Number 1-07627, filed February 22, 2011). |
| | | |
| | | |
| | | |
| | | |
| | | |
| | | |
| | 101 | The following materials from Frontier Oil Corporation’s Annual Report on Form 10-K for the year ended December 31, 2010, formatted in XBRL (eXtensible Business Reporting Language): (i) Consolidated Statements of Operations for the years ended December 31, 2010, 2009 and 2008, (ii) Consolidated Balance Sheets at December 31, 2010 and 2009, (iii) Consolidated Statements of Cash Flows for the years ended December 31, 2010, 2009 and 2008, (iv) Consolidated Statements of Changes in Shareholders’ Equity and Statements of Comprehensive Income (Loss) for the years ended December 31, 2010, 2009 and 2008 and (v) Notes to Consolidated Financial Statements, tagged as a block of text (1). |
| | | |
| | | (1) Pursuant to Rule 406T of Regulation S-T, the Interactive Data Files on Exhibit 101 hereto are deemed not filed or part of a registration statement or prospectus for purposes of Section 11 or 12 of the Securities Act of 1933, as amended, are deemed not filed for purposes of Section 18 of the Securities and Exchange Act of 1934, as amended, and otherwise are not subject to liability under those sections. |
* Asterisk indicates exhibits incorporated by reference as shown.
² Diamond indicates management contract or compensatory plan or arrangement.
The Company’s 2010 Annual Report is available upon request. Shareholders of the Company may obtain a copy of any exhibits to this Form 10-K at a charge of $0.05 per page. Requests should be directed to:
Investor Relations
Frontier Oil Corporation
10000 Memorial Drive, Suite 600
Houston, Texas 77024-3411
| |
| Condensed Financial Information of Registrant | |
| Balance Sheets | |
| Schedule I | |
| | | | | | | |
| | | | | | | |
| | | December 31, | |
| | | 2010 | | | 2009 | |
| | | (in thousands) | |
| ASSETS | | | | | | |
| Current assets: | | | | | | |
| Cash and cash equivalents | | $ | 278,163 | | | $ | 211,775 | |
| Trade and other receivables | | | 49,398 | | | | 174,843 | |
| Deferred income tax assets - current | | | 30,516 | | | | 26,373 | |
| Other current assets | | | 1,403 | | | | 926 | |
| Total current assets | | | 359,480 | | | | 413,917 | |
| | | | | | | | | |
| Property, plant and equipment, net | | | 328 | | | | 374 | |
| Deferred financing costs, net | | | 5,124 | | | | 2,857 | |
| Deferred income tax assets - noncurrent | | | 11,768 | | | | 10,767 | |
| Other assets | | | 4,180 | | | | 3,665 | |
| Investment in subsidiaries | | | 1,208,245 | | | | 1,144,040 | |
| Total assets | | $ | 1,589,125 | | | $ | 1,575,620 | |
| | | | | | | | | |
| LIABILITIES AND SHAREHOLDERS' EQUITY | | | | | | | | |
| Current liabilities: | | | | | | | | |
| Accounts payable | | $ | 147 | | | $ | 906 | |
| Accrued liabilities and other | | | 9,823 | | | | 20,916 | |
| Total current liabilities | | | 9,970 | | | | 21,822 | |
| Long-term debt | | | 347,773 | | | | 347,485 | |
| Contingent income tax liabilities | | | 2,758 | | | | 27,267 | |
| Other long-term liabilities | | | 4,093 | | | | 3,578 | |
| Deferred income tax liabilities | | | 234,673 | | | | 230,818 | |
| Payable to affiliated companies | | | 3,311 | | | | 674 | |
| | | | | | | | | |
| Commitments and contingencies | | | | | | | | |
| | | | | | | | | |
| Shareholders' equity | | | 986,547 | | | | 943,976 | |
| | | | | | | | | |
| Total liabilities and shareholders' equity | | $ | 1,589,125 | | | $ | 1,575,620 | |
| | | | | | | | | |
| The "Notes to Consolidated Financial Statements" in Item 8 of this Form 10-K are an integral part of these financial statements. | |
| Frontier Oil Corporation | | | | |
| Condensed Financial Information of Registrant | | | | |
| Statements of Operations | | | | |
| Schedule I | |
| | | | | | | | | | |
| | | | | | | | | | |
| | | December 31, | |
| | | 2010 | | | 2009 | | | 2008 | |
| | | (in thousands) | |
| | | | | | | | | | |
| Revenues | | $ | (11 | ) | | $ | (7 | ) | | $ | (7 | ) |
| | | | | | | | | | | | | |
| Costs and expenses: | | | | | | | | | | | | |
| Selling and general expenses, excluding depreciation | | | 16,165 | | | | 23,836 | | | | 17,677 | |
| Depreciation | | | 63 | | | | 70 | | | | 55 | |
| Gain on sales of assets | | | (1 | ) | | | - | | | | (37 | ) |
| | | | 16,227 | | | | 23,906 | | | | 17,695 | |
| | | | | | | | | | | | | |
| Operating loss | | | (16,238 | ) | | | (23,913 | ) | | | (17,702 | ) |
| | | | | | | | | | | | | |
| Interest expense and other financing costs | | | 27,886 | | | | 29,278 | | | | 15,939 | |
| Interest and investment income | | | (1,986 | ) | | | (1,873 | ) | | | (2,868 | ) |
| Equity in loss (earnings) of subsidiaries | | | (96,435 | ) | | | 79,986 | | | | (371,830 | ) |
| Income (loss) before income taxes | | | 54,297 | | | | (131,304 | ) | | | 341,057 | |
| Provision (benefit) for income taxes | | | 16,512 | | | | (47,544 | ) | | | 115,004 | |
| | | | | | | | | | | | | |
| Net income (loss) | | $ | 37,785 | | | $ | (83,760 | ) | | $ | 226,053 | |
| | | | | | | | | | | | | |
| The "Notes to Consolidated Financial Statements" in Item 8 of this Form 10-K are an integral part of these financial statements. | |
| Frontier Oil Corporation | | | | |
| Condensed Financial Information of Registrant | | | | |
| Statements of Cash Flows | | | | |
| Schedule I | |
| | | December 31, | |
| | | 2010 | | | 2009 | | | 2008 | |
| | | (in thousands) | |
| Cash flows from operating activities: | | | | | | | | | |
| Net income (loss) | | $ | 37,785 | | | $ | (83,760 | ) | | $ | 226,053 | |
| Equity in earnings of subsidiaries | | | (96,435 | ) | | | 79,986 | | | | (371,830 | ) |
| Intercompany transactions, net | | | 2,636 | | | | 1,321 | | | | (3,261 | ) |
| Dividends received from subsidiaries | | | 42,200 | | | | 21,200 | | | | 10,000 | |
| Income taxes paid to subsidiaries | | | (18,482 | ) | | | (30,000 | ) | | | (6,000 | ) |
| Depreciation | | | 63 | | | | 70 | | | | 55 | |
| Deferred income taxes | | | 1,963 | | | | 31,082 | | | | 169,766 | |
| Stock-based compensation expense | | | 15,840 | | | | 20,608 | | | | 20,014 | |
| Excess income tax benefits of stock-based compensation | | | (152 | ) | | | (244 | ) | | | (3,191 | ) |
| Amortization of debt issuance costs | | | 779 | | | | 783 | | | | 570 | |
| Senior notes discount amortization | | | 288 | | | | 264 | | | | 60 | |
| Loss on extinguishment of debt | | | 750 | | | | - | | | | 41 | |
| Decrease in allowance for investment loss | | | (15 | ) | | | - | | | | (37 | ) |
| Gain on sale of asset | | | (1 | ) | | | - | | | | - | |
| Increase (decrease) in other long-term liabilities | | | (23,360 | ) | | | 2,633 | | | | (3,716 | ) |
| Other | | | (515 | ) | | | (1,065 | ) | | | 1,622 | |
| Changes in components of working capital from operations | | | 116,812 | | | | (57,416 | ) | | | (80,054 | ) |
| Net cash (used in) provided by operating activities | | | 80,156 | | | | (14,538 | ) | | | (39,908 | ) |
| | | | | | | | | | | | | |
| Cash flows from investing activities: | | | | | | | | | | | | |
| Additions to property, plant and equipment | | | (17 | ) | | | (194 | ) | | | (129 | ) |
| Proceeds from sale of assets | | | 1 | | | | - | | | | 37 | |
| Net cash used in investing activities | | | (16 | ) | | | (194 | ) | | | (92 | ) |
| | | | | | | | | | | | | |
| Cash flows from financing activities: | | | | | | | | | | | | |
| Proceeds from issuance of Senior Notes | | | 150,000 | | | | - | | | | 197,160 | |
| Repayments of Senior Notes | | | (150,000 | ) | | | - | | | | - | |
| Purchase of treasury stock | | | (3,614 | ) | | | (3,008 | ) | | | (67,030 | ) |
| Proceeds from issuance of common stock | | | - | | | | 70 | | | | 405 | |
| Dividends paid to shareholders | | | (6,629 | ) | | | (25,349 | ) | | | (23,144 | ) |
| Excess income tax benefits of stock-based compensation | | | 152 | | | | 244 | | | | 3,191 | |
| Debt issuance costs and other | | | (3,661 | ) | | | 2 | | | | (2,402 | ) |
| Net cash (used in) provided by financing activities | | | (13,752 | ) | | | (28,041 | ) | | | 108,180 | |
| | | | | | | | | | | | | |
| Increase (decrease) in cash and cash equivalents | | | 66,388 | | | | (42,773 | ) | | | 68,180 | |
| Cash and cash equivalents, beginning of period | | | 211,775 | | | | 254,548 | | | | 186,368 | |
| | | | | | | | | | | | | |
| Cash and cash equivalents, end of period | | $ | 278,163 | | | $ | 211,775 | | | $ | 254,548 | |
| | | | | | | | | | | | | |
| The "Notes to Consolidated Financial Statements" in Item 8 of this Form 10-K are an integral part of these financial statements. | |
Notes To Condensed Financial Statements
Incorporated by reference are Frontier Oil Corporation and Subsidiaries Consolidated Statements of Shareholder’s Equity for the three years ended December 31, 2010 in Part II, Item 8.
Basis of Presentation – The condensed financial information of Frontier Oil Corporation’s (“FOC”) investments in subsidiaries are presented under the equity method of accounting. Under this method, the assets and liabilities of subsidiaries are not consolidated. The investments in and advances to subsidiaries are recorded in the Condensed Balance Sheets. The income (losses) from operations of the subsidiaries are reported on an equity basis in earnings of subsidiary companies in the Condensed Statements of Operations.
See the notes to the consolidated FOC financial statements in Part II, Item 8 for other disclosures.
| | | | |
| Valuation and Qualifying Accounts | | | | |
| For the three years ended December 31, | | | | |
| Schedule II | |
| | | | | | | | | | |
| | | | | | | | | | |
| Description | | Balance at beginning of period | | | Additions | | | Deductions | |
| | | (in thousands) | |
| 2010 | | | | | | | | | |
| Allowance for doubtful accounts | | $ | 1,000 | | | $ | - | | | $ | - | |
| Allowance for investment loss | | | 499 | | | | - | | | | 184 | |
| | | | | | | | | | | | | |
| 2009 | | | | | | | | | | | | |
| Allowance for doubtful accounts | | | 500 | | | | 698 | | | | 198 | |
| Allowance for investment loss | | | 499 | | | | - | | | | - | |
| | | | | | | | | | | | | |
| 2008 | | | | | | | | | | | | |
| Allowance for doubtful accounts | | | 500 | | | | - | | | | - | |
| Allowance for investment loss | | | - | | | | 499 | | | | - | |
SIGNATURES
Pursuant to the requirements of Section 13 or 15(d) of the Securities Exchange Act of 1934, the registrant has duly caused this report to be signed on its behalf by the undersigned, thereunto duly authorized on the date indicated.
| | FRONTIER OIL CORPORATION | |
| | | | |
| | By: | /s/ Michael C. Jennings | |
| | | Michael C. Jennings | |
| | | Chairman, President and Chief Executive Officer (chief executive officer) | |
| | | | |
Date: February 24, 2011
Pursuant to the requirements of the Securities Exchange Act of 1934, this report has been signed below by the following persons on behalf of Frontier Oil Corporation and in the capacities and on the date indicated.
| | | | | |
| /s/ Michael C. Jennings | | | /s/ James H. Lee | |
| Michael C. Jennings | | | James H. Lee | |
Chairman, President andChief Executive Officer (chief executive officer) | | | Director | |
| | | | | |
| /s/ Doug S. Aron | | | /s/ Paul B. Loyd | |
| Doug S. Aron | | | Paul B. Loyd | |
Executive Vice President and Chief Financial Officer (principal financial officer) | | | Director | |
| | | | | |
| /s/ Nancy J. Zupan | | | /s/ Franklin Myers | |
| Nancy J. Zupan | | | Franklin Myers | |
Vice President and Chief Accounting Officer (principal accounting officer) | | | Director | |
| | | | | |
| /s/ Douglas Y. Bech | | | /s/ Michael E. Rose | |
| Douglas Y. Bech | | | Michael E. Rose | |
| Director | | | Director | |
| | | | | |
/s/ Robert J. Kostelnik | | | | |
| | | | |
| Director | | | | |