KIRKLAND LAKE GOLD INC.
Management’s Discussion & Analysis
for the year ended
April 30, 2006
July 26, 2006
The following discussion of the financial position of Kirkland Lake Gold Inc. and the results of operations for the year ended April 30, 2006 are to be read in conjunction with the audited financial statements and related notes for the year then ended. All of the financial information presented herein is expressed in Canadian dollars, unless otherwise indicated. The audited financial statements have been prepared in accordance with Canadian generally accepted accounting principles. These statements together with the following management’s discussion and analysis are intended to provide investors with a reasonable basis for assessing the financial performance of the Company as well as certain forward-looking statements relating to the potential future performance. Additional information on the Company can be found in the Company’s Annual Information Form (“AIF”) filed with certain Canadian securities regulators on SEDAR atwww.sedar.com.
Overview
Kirkland Lake Gold Inc. (the “Company”) is an operating gold mining company located in Kirkland Lake, Ontario, which owns the Macassa Mine and Mill and four contiguous former gold producing properties. Production for fiscal year 2006 was 58,314 ounces, which fell short of the Company’s estimated production stated in the prior year MD&A of 90,000 ounces, however this production exceeded fiscal 2005 by 27% or 12,450 ounces.
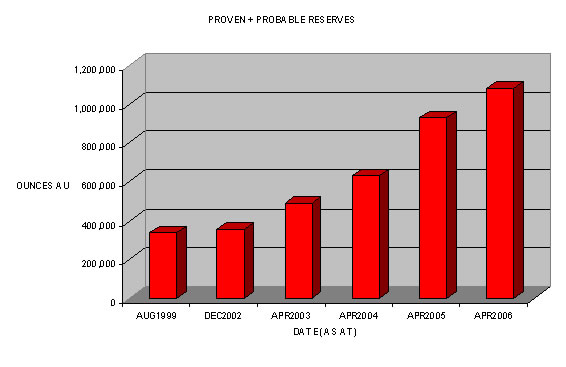
Successful exploration has increased proven and probable gold reserves more than threefold to 1,085,660 ounces of gold (consisting of 512,160 proven ounces and 573,500 probable ounces) between the first reserve estimate in December 2002 and that of April 30, 2006.
Most importantly, as a result of the Company’s $21 million three year exploration program to be completed in fiscal 2007, the discovery of a completely new ore trend, south-north rather than the classic east-west trend of the Kirkland Lake area (from which roughly 24 million ounces of gold have been recovered by various mining companies over the last 90 years), substantially increases the potential for the Company to expand its gold resources and reserves, and increase the production capability of the Corporation. The discoveries to the south of the Camp are the focus of virtually all of the new development and drilling to be undertaken in fiscal 2007. At least 14 new ore-grade structures have been identified between the western limit of the most westerly zone to the eastern limit of the most easterly zone, along a strike distance of 4,300 feet, with strike lengths of individual zones as great as 3,000 feet. The discovery hole of the New South Zone drilled in fiscal 2006 and the follow-up wedged hole, intersected 90.4 feet assaying 2.3 ounces (uncut) and 1.43 (uncut) ounces of gold per ton over 124.5 feet of core length (uncut) respectively.
Major changes and enhancements during fiscal 2006 include:
- Ongoing development of the Safety and Training Department, which has helped to significantly improve the Company’s safety performance and further formalize the underground miner training programs, a vital component in today’s labour market shortage;
2
Continuation of last year’s program of increased underground mechanization and the successful implementation of new and more modern equipment;
The completion of the D-Zone ramp system between the 3400 and 3800 Levels permitting access to the newly discovered D Zone ore reserves; and
The ongoing underground dewatering program reaching the target below the 5700 Level, thereby allowing for the re-commissioning of the 5725 Level loading pocket as well as completion of the 5150 and 5300 Level rehabilitations allowing access to substantial additional new stope mining areas.
Gold production for fiscal year 2007 is expected to rise to between 75,000- 85,000 ounces.
The Company’s common shares continue to trade on the TSX (Toronto Stock Exchange) and on the AIM (Alternative Investment Market) of the London Stock Exchange. As at July 26, 2006, there were 52,866,388 common shares outstanding. With stock options to purchase 529,874 shares and warrants to purchase 896,750 outstanding, there are potentially 54,293,727 fully diluted shares outstanding.
The Company incurred a loss for the year ended April 30, 2006 of $6,456,560 or $0.13 per share, which compares with a loss of $28,159,185 or $0.68 per share reported for fiscal 2005. Gold revenues were 58.5% higher at $35,122,603, (2005- $22,156,105), with 63% of the increase due to gold price increases and 37% due to higher production. Operating costs reduced to $30,834,472, (2005- $36,217,949). This decrease was a function of volume and improved productivity from the considerable investments made in training, modernizing and upgrading infrastructure and equipment. The exploration program to fully capitalize on the exploration potential of the company’s mining properties continued with annual exploration expenditures of $5,024,637 (2005- $8,127,896).
| Financial Highlights (all amounts in thousands of Canadian dollars, except shares and pershare figures) |
| | | | |
| | 12 months | 12 months | 12 months |
| | ended | ended | ended |
| | April 30 | April 30 | April 30 |
| | 2006 | 2005 | 2004 |
| Revenue | 35,123 | 22,156 | 9,807 |
| Operating Costs | 30,834 | 36,218 | 25,045 |
| Exploration Expenditure | 5,025 | 8,127 | 3,124 |
| Net (loss) | (6,457) | (28,159) | (22,616) |
| Per share (basic and diluted) | (0.13) | (0.68) | (0.76) |
| Cash Flow (used) for operating activities | (4,804) | (25,849) | (17,545) |
| Cash Flow from financing activities | 20,169 | 32,676 | 36,715 |
| Cash Flow (used) for investing activities | (14,586) | (9,915) | (11,114) |
| Net increase (decrease) in cash | 779 | (3,088) | 8,056 |
| Cash at end of period | 9,412 | 8,633 | 11,721 |
| Total Assets | 60,767 | 47,735 | 40,530 |
| Total Liabilities | 11,784 | 12,006 | 12,690 |
| Working Capital | 6,805 | 3,976 | 3,443 |
| Weighted average number of shares | | | |
| outstanding | 48,118,378 | 41,611,019 | 29,693,146 |
3
Gold sales during the 2006 fiscal year were 59,630 troy ounces with an average price of CDN$589 per ounce as underground production from No. 3 Shaft continues to ramp up with the Company’s own mining force. This compares with gold sales of 41,900 ounces with an average sales price of CDN$528 per ounce during the prior year. Again, this reflects the increase in gold prices and productivity during the year.
During fiscal 2006, negative operating cash flow decreased significantly to $4,804,198 (2005-negative $25,849,127), as efforts to increase production and become cash flow positive showed through into the results. The $13 million generated in incremental gold revenues together with reductions in operating costs ($5.4 million), exploration ($3 million) and lower general and administrative expenses ($0.7 million), substantially explain this improvement between years. The substantial improvement in operating cash flow, total year over year spending including operating costs, capital and royalties was unchanged at $47 million.
During fiscal 2006 the Company raised equity of almost $20 million on a net basis to fund its operations and exploration. Capital spending on mine development and equipment increased to $14,585,798, up from $9,379,743 reported for the prior year, this increase resulting primarily from an additional $5.2 million of mine development costs incurred during the year.
The Company’s cash position at the end of April 2006 was $9,411,925. Subsequent to year end, in May 2006, the Company raised a further $16.5 million by way of private placement to fund working capital and further development activities.
Critical Accounting Estimates
The details of the Company’s accounting policies are presented in accordance with Canadian generally accepted accounting principles (GAAP) as set out in Note 2 to the financial statements. The preparation of financial statements in conformity with GAAP requires management to make estimates and assumptions that affect the reported amounts of assets and liabilities and the disclosure of contingent assets and liabilities at the date of the financial statements and the reported amounts of revenues and expenses during the year. The preparation of the Company’s financial statements depend upon estimates of proven and probable reserves, measured and indicated mineral resources and recoverable ounces, assumptions of operating costs and future gold prices and possible values assigned to potential resources on exploration properties.Such estimates and assumptions affect the cost recovery of long-lived assets and the rate at which depletion and amortization are charged to earnings. In addition, management must estimate costs associated with mine reclamation and closure costs.
The following estimates are considered by management to be the most critical for investors to understand some of the processes and reasoning that go into the preparation of the Company’s financial statements, providing some insight also to uncertainties that could impact the Company’s financial results.
Going Concern
The Company’s financial statements have been prepared on a going concern basis, which contemplates the realization of assets and liquidation of liabilities during the normal course of operations. Certain historical adverse conditions and events cast substantial doubt upon the validity of this assumption.
During the years ended April 30, 2006, 2005 and 2004, the Company incurred losses of $6.5 million, $28.2 million and $22.6 million respectively. The funds required to continue operations and exploration activities during this period have been financed primarily from the issue of equity
4
securities and, to a small extent, convertible debt instruments. At April 30, 2006, the Company has working capital of $6.8 million and has committed to spend $1.8 million on eligible flow-through expenditures before December, 2006. Management estimates that these funds, together with cash flow from targeted operations, will be sufficient to meet the Company’s obligations and capital expenditure plans for the coming fiscal year. However, differences will occur between actual results and those targeted by management, and those differences may be material. It is possible that the operations will not generate sufficient cash flow for the Company to continue in the normal course without funding being provided from outside sources.
Management has been successful in obtaining sufficient funding for its operating and capital and exploration requirements in the past and believes that it will be able to do so in the future, if necessary. There is, however, no assurance that such funding will be available to the Company, or that it will be available on terms which are acceptable to management. If this occurs, the Company may not be able to continue as a going concern.
The Company’s financial statements do not include any adjustments to the recoverability and classification of recorded asset amounts and classification of liabilities that might be necessary, should the Company be unable to continue as a going concern.
Measurement Uncertainty
The Company’s history of operating losses from mining operations indicate at April 30, 2006, that the recorded costs for mineral properties and related fixed assets may not be recoverable. Using a constant gold price of CDN$584 per ounce and operating costs similar to historical costs incurred over the past year, management estimates that annual production of approximately between 75,000 to 85,000 ounces in fiscal 2007 and for each year thereafter would be required to cover costs of operations, exploration costs and projected capital expenditures required for mining and development operations. To date, the Company has not been successful in achieving this rate of production. To recover these costs and the carrying values of mineral properties and other mining assets, over the life of the mine will require an increase in tonnage of ore processed and ounces of gold produced annually, a reduction in the workforce and associated mining costs through the curtailment of certain development projects, or both.
Management believes that the requisite increase in production can be achieved due to operating improvements which are expected to result from the following:
The attainment over the past year of the mine dewatering to lower horizons, providing physical access to previously unavailable levels for both improved production planning and higher volume production;
The availability, commencing in August 2005, of an ore loading pocket at the 5700 level which has increased hoisting volume and permit enhanced access to large ore blocks on lower levels;
The ongoing staff training program underway with the objective of enhancing the mining skills of the company’s workforce, improving worker retention and therefore improving production volumes;
The expanded use of long-hole stoping mining method which will increase production and reduce costs;
5
The reduction of development waste rock quantities mined in proportion to ore development and ore production quantities, resulting in increased volumes and improved grades of ore available for milling;
The addition of new equipment allowing for more mechanization in operations and resulting in higher production volumes at lower cost per ton than previously experienced.
The increase in available working areas due to new exploration discoveries (e.g. D Zone)
There is uncertainty associated with the ability of the Company to achieve the increase in production or reduction in costs necessary to recover the carrying value of the mineral property and related assets. Gold price or Canadian/U.S. dollar exchange rate movements, the success of the Company in realizing the benefit of the production improvements noted above, changes in the costs of labour and other costs or unforeseen production difficulties all would have an impact on the ability of the Company to achieve its goals from operations. The amount of working capital currently available for use by the Company could mean that a minor adverse development could have an impact on the Company’s operations and ability to recover costs.
As at April 30, 2006, management has determined that the value recorded for mineral property and fixed assets is not impaired, based on the operations improvements set out above, the mine’s updated reserves and resource model, the number of high quality underground exploration targets identified and currently being explored within the Company’s five mineral properties and available public information about prices achieved for purchase transactions involving other mineral properties. Although no impairment was determined at this time, near term adverse changes in gold prices or exchange rates, not attaining the effects of the operations improvements mentioned in this discussion or the lack of success of ongoing exploration programs in locating additional reserves could result in the determination that the assets are impaired and such impairment could be material.
Mineral Reserves
The process of estimating quantities of gold reserves is complex, requiring significant decisions in the evaluation of all available geological, geophysical, engineering and economic data. The data for a given ore body may also change substantially over time as a result of numerous factors, including, but not limited to, additional development activity, production history and the continual reassessment of the viability of ore bodies under various economic conditions. A material revision to existing reserve estimates could occur because of, among other things: revisions to geological data or assumptions; a change in the assumed gold prices; and the results of drilling and exploration activities.
Closure Costs
The Company has an obligation to reclaim its properties after the minerals have been mined from the site, and has estimated the costs necessary to comply with existing reclamation standards. These estimated costs are recorded as a liability at their fair values in the periods in which they occur. If the estimate of reclamation costs proves to be inaccurate, the Company could be required to increase the provision for site closure and reclamation costs, which would increase the amount of future reclamation expense, resulting in a reduction in the Company’s earnings and net assets.
6
Changes in Accounting Policies
There were no changes to accounting policies during fiscal 2006.
Results of Operations
During the fiscal year 2006, a total of $30,834,472 (2005 - $36,217,949) was spent on operating costs. Approximately 60% of current operating costs relate to labour. Fiscal 2006 experienced lower diamond drilling costs that reached $1.33 million (2005- $1.53 million), with 92,820 feet (108,700 feet fiscal 2005) of definition drilling carried out.
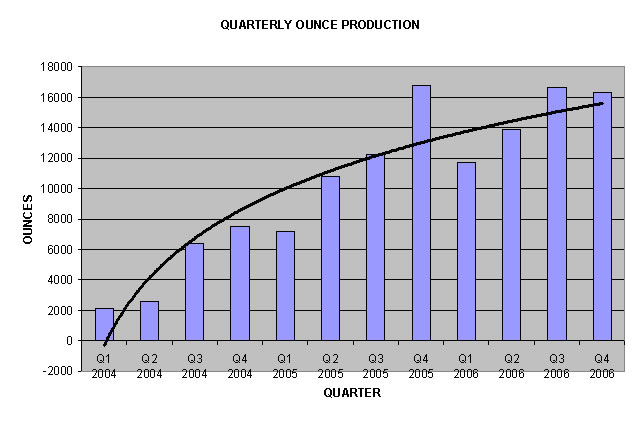
During fiscal 2006, 252,433 tons of rock were hoisted from underground operations, of which 156,688 tons was milled as ore. During fiscal 2005, the total hoisted tons were 236,088 tons from underground, of which 136,774 tons were milled as ore. This represents a 7% increase in hoisted tons and 14.5% increase in ore tons milled. Furthermore, 29,195 feet (in fiscal 2005, 22,250 feet) of lateral and vertical stope development was completed, an increase of 31%. The waste/ore ratio mined continued to be very high in fiscal 2006 as a result of continuing high levels of development work but this is expected to improve during fiscal 2007 and thereafter due to the development having been completed for the Upper D-Zone. The ore grade from underground stopes improved from 0.40 to 0.49 ounces during the year and the following chart provides a view of the improvement in production:
Looking at other expenses, the Company incurred in fiscal 2006 a total of $3,853,109 (2005-$2,354,335) in amortization and depletion of asset costs and $64,736 (2005 - $1,258,250) on interest and bank charges and amortization of finance charges. The increase in amortization and depletion of asset costs is substantially due to the high level of underground development being undertaken by the Company during fiscal year. The decrease in interest and bank charges and amortization of finance charges is due to the reduction in convertible loan financing between fiscal years.
For the year ended April 30, 2006, general and administrative expenses were $1,551,852 which is lower when compared to $2,219,775 reported for the prior year as a result of cost reduction initiatives and one-off costs of $366,680 incurred for the assimilation and distribution of a
7
publication featuring the Company, and $116,356 paid in conjunction with the AIM admission process included in the prior year figures.
Exploration and Ore Reserve Update
| Summary | As at Dec, 2002 | As at 30 April, 2005 | As at April 30, 2006 |
| Reserves | PROVEN | PROBABLE | PROVEN | PROBABLE | PROVEN | PROBABLE |
| Tons | 432,000 | 368,000 | 1,151,000 | 872,000 | 1,164,000 | 1,147,000 |
| Grade (oz./ton) | 0.41 | 0.49 | 0.43 | 0.50 | 0.44 | 0.50 |
| Ounces of Gold | 176,700 | 179,600 | 492,000 | 435,000 | 509,000 | 574,000 |
| | | | | | | |
| Resources* | MEASURED | INDICATED | MEASURED | INDICATED | MEASURED | INDICATED |
| Tons | 876,000 | 2,192,000 | 921,000 | 1,029,000 | 911,000 | 1,055,000 |
| Grade (oz./ton) | 0.38 | 0.28 | 0.38 | 0.36 | 0.36 | 0.35 |
| Ounces of Gold | 329,600 | 615,100 | 349,000 | 372,000 | 331,000 | 369,000 |
| | | | | | | |
| Total | | | |
| Tons | 3,868,000 | 3,972,100 | 4,275,700 |
| Grade | 0.34 | 0.41 | 0.42 |
| (oz./ton) | | | |
| Ounces of | 1,301,000 | 1,647,800 | 1,782,500 |
| Gold | | | |
* Excluding inferred resources
Since resumption of production in January, 2003, the Company increased reserves plus resources (excluding inferred) by 47% to 1,782,500 ounces, including production of approximately 128,500 ounces over that period.
8
The most significant result from the drilling in the 2006 fiscal year was the discovery of the New South Zone on the Macassa Property. The discovery hole, and follow-up wedged hole, intersected 90.4 feet assaying 2.3 ounces (uncut) and 1.43 (uncut) ounces of gold per ton over 124.5 feet of core length (uncut) respectively. The dimensions at this time indicate a potential dip component of 1,300 feet for the zone between the 5100 and 5500 elevations, and a strike component of 500 feet. The LK Zone discovery hole 45-911A, which intersected 26.21 ounces of gold per ton (uncut, or 1.43 ounces per ton cut) over a core length of 6.0 feet appears to be an extension of the new discovery, adding an additional 200 feet of potential strike length.
To date, fourteen mineralized zones have been identified south of the mine workings, eight of which are in the area encompassing the New South/LK Zone. In house metallurgical testing on core samples submitted from the New South Zone indicates that a 96.2% recovery may be achieved by using standard milling procedures.
As of April 11, 2006, the new 5300 exploration drift has been driven 650 feet to the south with drill bays completed and closer spaced drilling at 100 foot centers using smaller air machines has started on the Lower D Zone. This program is designed to both convert inferred resources to indicated resources and further expand the Lower D Zone north.
At its closest point, the Lower D Zone is located 1200 feet south of the operational workings on 5025 level and the #6 Splay is 900 feet to the south. A new drift is planned to be driven in fiscal 2007. At the 5025 level, the Lower D is now known to be virtually continuous ore for 1050 feet, followed by a further 850 feet of unexplored distance to the next drill hole that is also ore. Plans are also underway to advance a new drift on 5025 level in fiscal 2007. This will allow for the mining of the Lower D and #6 Splay. The additional ore that will be added to production, as a result of this development, will further decrease the mine’s cost per ton
Queenston Mining Inc. and Kirkland Lake Gold Inc. have a 50%-50% joint venture to explore the Kirkland Lake West (“KLW”) property owned by Newmont Mining Corporation of Canada Limited (“Newmont”). The KLW property, which adjoins the western boundary of KL Gold’s Macassa Mine, is thought to contain the extension of the western side of a major north/south fault of the Main/04 Break ore horizon which produced 24 million ounces of gold. The two properties are separated by a major north-south structural fault.
An exploration drill program was undertaken in the Corporation’s 2006 fiscal year, primarily funded by ‘flow-through’ investments made by Canadian investors which entitle the investors to certain tax write-offs. A total of $3.25 million was spent on drilling (2005- $7.23 million), with $1.92 million in exploration drilling (2005- $5.7 million), $1.33 million in definition drilling (2005- $1.53 million) with a further $1.66 million spent in exploration development and rehabilitation (2005- $1.3 million). The Corporation was required to spend $2.5 million raised in a ‘flow-through’ exploration financing by December 31, 2006. By April 30, 2006 a total of $700,000 had been spent on qualifying expenditures. A total of 113,000 feet of exploration drilling and 92,800 feet of definition drilling took place. The average cost was $15.79 per foot.
Positive exploration results also continued to be obtained from the D, Lower D, #2 Shaft area, ’04 Break above the 38 level towards surface, and the '05 Zone. The Company was successful on all underground drilling, with a success ratio at or better than the projected 25%.
Looking forward, the Company plans to focus its exploration efforts on underground drilling delineating the newly discovered areas and zones to the south. This and other newly-discovered mineralized zones, and extensions of those found through this successful exploration, will increase the ore resources and reserves of the Corporation.
9
The results of the Company’s diamond drilling program disclosed herein have been reviewed, verified (including sampling, analytical and test data) and compiled by Michael Sutton P.Geo., the Company’s Chief Geologist (a ‘qualified person’ for the purpose of National Instrument 43-101, Standards of Disclosure for Mineral Projects, of the Canadian Securities Administrators). See the Company’s news release issued concurrently with this MD&A for details of Company’s quality assurance program and quality control measures and the gold resource and reserve estimates as at April 30, 2006.
Summary of Quarterly Results
| Quarterly Results |
4th
Quarter |
3rd
Quarter |
2nd
Quarter |
1st
Quarter |
(expressed in 000’s of Canadian dollars )
Fiscal 2006 |
| Revenue | 10,632 | 11,111 | 5,986 | 7,394 |
| Net Earnings (Loss) | (2,464) | 2,310 | (901) | (5,402) |
| Earnings (Loss) per share-Basic & diluted | (0.04) | 0.05 | (0.02) | (0.12) |
Fiscal 2005 |
4th
Quarter |
3rd
Quarter |
2nd
Quarter |
1st
Quarter |
| Revenue | 7,062 | 6,374 | 5,129 | 3,591 |
| Net Earnings (Loss) | (3,911) | (6,331) | (8,886) | (9,031) |
| Earnings (Loss) per share-Basic & diluted | (0.07) | (0.14) | (0.22) | (0.25) |
Although quarterly results continue to fluctuate as the Company matures, when viewed on a half yearly basis the consistent reduction in net losses from $18 million to breakeven is clear evidence that the heavy investment on new equipment, the development of newly discovered and higher grade ore zones, the increasing use of lower cost mining methods and employee training schemes are starting to show through in the operating results
Net losses in the fourth quarter of 2006 were a result of lower capitalized expenses, $1.2 million of year end adjustments relating to workers insurance, bonus and utility costs together with $0.9 million of adjustments to depletion and depreciation charges.
Liquidity, Capital Resources and Financial Condition
Liquidity
The Company’s cash balance at April 30, 2006 was $9,411,925 and working capital surplus was $6,804,669. The Company’s working capital dynamics, as outlined in the ‘Overview’ section, continued to improve but may still fluctuate widely as a result of movements in gold production and, as detailed in the ‘Summary of Quarterly Results’ section, there has been a substantial improvement in operating cash flows during the year.
Subsequent to year end, the Company raised a further $16.5 million, in May 2006, by way of private placement to fund ongoing working capital and further development activities.
While the Company is targeting its operations to work in a profitable and cash-generating environment sufficient to sustain the Company’s operations in the normal course, there are factors which may affect the ability of the Company to maintain operations, as discussed under the section “Going Concern”.
10
Gold Price and Foreign Exchange
The profitability of the Company is affected by business risks including the price of gold and the foreign currency exchange rate. Changes in the exchange rate can have a material impact as costs are incurred in Canadian dollars and revenues are in U.S. dollars.
Cash Flow Discussion
Cash flow used for operations was $4,804,198 during fiscal 2006 (2005-$25,849,127) and as explained in the ‘Overview’ section, this is due to the substantial increase in gold revenues and reduction in operating and exploration expenses.
During the latest fiscal year proceeds from the issuance of equity generated cash of $20.2 million.
The total amount of new capital invested in the Company’s activities stood at $14,585,798 for fiscal 2006, (2005-$9,379,743), with 16% of this amount for new mining equipment and 84% in underground development expenditures as the Company strives to reach profitability.
Proposed Transactions
The Company has no material proposed transactions for the current fiscal year.
Outlook
The Company continues seeking ways to raise production levels and to improve efficiencies by providing consistent investment in training, exploration, and equipment. Production forecasts for fiscal 2007 indicate annual gold production of between 75,000 and 85,000 ounces.
Substantial costs and management time will be taken up during fiscal 2007 to improve operational systems, controls and processes. These initiatives will enable management to identify further opportunities to improve productivity and reduce operating costs as well as ensure compliance under the Sarbanes Oxley Act.
Forward Looking Statements
This report contains “forward-looking statements,” including, but not limited to, statements regarding the Company’s expectations as to the market price of gold, exchange rate, strategic plans, future commercial production, production targets and timetables, mine operating costs, capital expenditures, work programs, exploration budgets and mineral reserve and resource estimates. Forward-looking statements express, as at the date of this report, the Company’s plans, estimates, forecasts or beliefs as to the future events or results. Forward-looking statements involve a number of risks and uncertainties, and there can be no assurance that such statements will prove to be accurate. Therefore, actual results and future events could differ materially from current expectations expressed or implied by the forward-looking statements, include, but are not limited to, factors associated with fluctuations in the market price of precious metals, mining industry risks and hazards, environmental risks and hazards, uncertainty as to the calculation of mineral reserves and resources, requirement of additional financing, and other risks described in the Company’s Annual Information Form filed with the Securities Commissions of the provinces of British Columbia, Alberta and Ontario.
Related Party Transactions
Pursuant to an agreement between the Company and Quest Management Ltd., the Company pays $3,500 per month to Quest in consideration of Quest providing office, reception, secretarial and accounting services to the Company. During fiscal year 2006, the total fees paid to Quest for
11
services performed under the agreement were $42,000. Quest is a subsidiary of Quest Capital Corp. and has one common director and a common corporate secretary with the Company.
Disclosure Controls & Procedures
The Corporation has evaluated the effectiveness of the design and operation of its disclosure controls and procedures as of April 30, 2006, being the date of the Corporation’s fiscal year end for which year this Management's Discussion & Analysis has been prepared. This evaluation was carried out under the supervision and with the participation of the Corporation’s Chief Executive Officer, Chief Financial Officer, and Executive Vice-President. Based upon that evaluation, they concluded that as of the end of that fiscal year the Corporation’s disclosure controls and procedures were effective to ensure that information required to be disclosed by the Corporation in reports that it files or submits under the applicable Canadian securities legislation and instruments is (i) recorded, processed, summarized and reported within the time periods specified in such legislation and instruments, and (ii) accumulated and communicated to the Corporation’s management, including its Chief Executive Officer, Chief Financial Officer and Executive Vice-President, to allow timely decisions regarding required disclosure.
The design of any system of control is based in part on certain assumptions about the likelihood of future events and there can be no assurance that any design will succeed in achieving its stated goals under all potential future conditions, regardless of how remote. A control system, no matter how well conceived or operated, can provide only reasonable, not absolute, assurance that the objectives of the control system are met. Furthermore, despite the Corporation’s Chief Executive Officer, Chief Financial Officer and Executive Vice-President’s belief that the Corporation’s disclosure controls and procedures provide a reasonable level of assurance that they are effective, they do not expect that the disclosure controls and procedures or internal control over financial reporting will prevent all errors or fraud.