UNITED STATES
SECURITIES AND EXCHANGE COMMISSION
Washington, D.C. 20549
FORM N-CSR
CERTIFIED SHAREHOLDER REPORT OF REGISTERED
MANAGEMENT INVESTMENT COMPANIES
Investment Company Act file number | 811-09815 |
|
THE ARBITRAGE FUNDS |
(Exact name of registrant as specified in charter) |
|
41 Madison Avenue, 42nd Floor, New York, NY | | 10010 |
(Address of principal executive offices) | | (Zip code) |
|
John S. Orrico Water Island Capital, LLC 41 Madison Avenue 42nd Floor New York, NY 10010 |
(Name and address of agent for service) |
|
Registrant’s telephone number, including area code: | 800-295-4485 | |
|
Date of fiscal year end: | May 31 | |
|
Date of reporting period: | May 31, 2019 | |
| | | | | | | | |
Item 1. Reports to Stockholders.

Annual Report
May 31, 2019
The Arbitrage Fund
The Arbitrage Event-Driven Fund
The Water Island Credit Opportunities Fund
The Water Island Long/Short Fund
Beginning on January 1, 2021, as permitted by regulations adopted by the Securities and Exchange Commission, paper copies of The Arbitrage Fund's shareholder reports will no longer be sent by mail, unless you specifically request paper copies of the reports from The Arbitrage Funds or from your financial intermediary, such as a broker — dealer or bank. Instead, the reports will be made available on a website (https://artbitragefunds.com/restricted/content/downloads.html) and you will be notified by mail each time a report is posted and provided with a website link to access the report.
If you have already elected to receive your shareholder reports electronically, you will not be affected by this change and you need not take any action. You may elect to receive shareholder reports and other communications from The Arbitrage Funds electronically by sending a request in writing to: Arbitrage Funds, PO Box 219842, Kansas City MO 64121-9842 or by calling 1-800-295-4485.
You may also elect to receive all future reports in paper free of charge. You can inform The Arbitrage Funds [or your financial intermediary] that you wish to continue receiving paper copies of your shareholder reports by sending a request in writing to: Arbitrage Funds, PO Box 219842, Kansas City MO 64121-9842 or by calling 1-800-295-4485. Your election to receive reports in paper will apply to all Arbitrage Funds you hold directly in an account with The Arbitrage Funds. You must provide separate instructions to each of your financial intermediaries.

TABLE OF CONTENTS
Shareholder Letter | | | 1 | | |
The Arbitrage Fund | |
Manager Commentary | | | 3 | | |
Portfolio Information | | | 5 | | |
Portfolio of Investments | | | 7 | | |
The Arbitrage Event-Driven Fund | |
Manager Commentary | | | 19 | | |
Portfolio Information | | | 21 | | |
Portfolio of Investments | | | 23 | | |
The Water Island Credit Opportunities Fund | |
Manager Commentary | | | 38 | | |
Portfolio Information | | | 40 | | |
Portfolio of Investments | | | 42 | | |
The Water Island Long/Short Fund | |
Manager Commentary | | | 50 | | |
Portfolio Information | | | 52 | | |
Portfolio of Investments | | | 54 | | |
Statements of Assets and Liabilities | | | 64 | | |
Statements of Operations | | | 68 | | |
Statements of Changes in Net Assets | | | 72 | | |
Financial Highlights | |
The Arbitrage Fund - Class R | | | 76 | | |
The Arbitrage Fund - Class I | | | 77 | | |
The Arbitrage Fund - Class C | | | 78 | | |
The Arbitrage Fund - Class A | | | 79 | | |
The Arbitrage Event-Driven Fund - Class R | | | 80 | | |
The Arbitrage Event-Driven Fund - Class I | | | 81 | | |
The Arbitrage Event-Driven Fund - Class C | | | 82 | | |
The Arbitrage Event-Driven Fund - Class A | | | 83 | | |
The Water Island Credit Opportunities Fund - Class R | | | 84 | | |
The Water Island Credit Opportunities Fund - Class I | | | 85 | | |
The Water Island Credit Opportunities Fund - Class C | | | 86 | | |
The Water Island Credit Opportunities Fund - Class A | | | 87 | | |
The Water Island Long/Short Fund - Class R | | | 88 | | |
The Water Island Long/Short Fund - Class I | | | 89 | | |
The Water Island Long/Short Fund - Class C | | | 90 | | |
The Water Island Long/Short Fund - Class A | | | 91 | | |
Notes to Financial Statements | | | 92 | | |
Report of Independent Registered Public Accounting Firm | | | 119 | | |
Disclosure of Fund Expenses | | | 121 | | |
Additional Information | | | 124 | | |
Trustees' Approval of Advisory Agreement | | | 125 | | |
Trustees & Officers | | | 130 | | |
The Arbitrage Funds Shareholder Letter
Dear Fellow Shareholders,
Over the past year and a half, investors have witnessed markets vacillate between optimism and uncertainty, with record highs interspersed with dramatic corrections. After a volatile start to 2018, markets largely marched higher for most of the year – until, that is, Q4. At the time, investors seemed to have finally capitulated to slowing global growth indicators, international trade disputes, and rising interest rates, bringing the S&P 500 less than 1% from officially entering bear territory (and producing the index's worst December performance since the Great Depression). In late December, however, the Federal Reserve ("Fed") stepped back from its hawkish stance on raising interest rates. Markets responded positively and returned impressive gains across asset classes during the first four months of 2019, only to stumble in May over fears that the Trump administration's trade war would extend from China to Mexico. While we do not discount the importance of such macro matters, our goal as event-driven investors remains – as always – to generate returns not from the direction of broader credit and equity markets, but from the outcomes of idiosyncratic corporate events. As such, our focus is less on seesawing markets, and more on the universe of corporate catalysts at our disposal. On this front, we continue to be optimistic about our opportunity set.
The spectrum of corporate catalysts spans a range of timelines, from short (four months or less) to long (a year or more), and a range of strengths, from "hard" catalysts (i.e., more definitive) to "soft" catalysts (i.e., less definitive). In our universe, some of the hardest, shortest duration corporate catalysts – which tend to be associated with the highest probabilities of a successful completion and the lowest potential volatility – are definitive, publicly announced mergers and acquisitions ("M&A"). This is the opportunity set in which our merger arbitrage team exclusively participates, and we remain highly constructive on the strategy. Merger arbitrage spreads are buoyed by short-term interest rates, and while the future direction of rates may now be less certain than a year ago – when investors largely expected further hikes – we nonetheless believe current levels are still supportive of a healthy deal spread environment. Deal volume is strong, with the total value of announced deals for the year-to-date period in 2019 being the second greatest since the Financial Crisis (behind only the year-ago period). Furthermore, additional M&A activity is likely to be spurred by private equity buyers, who by some estimates have nearly $2.5 trillion in dry powder waiting to be deployed. Lastly, the ongoing prospect of increased volatility in the markets can present favorable entry points in many M&A transactions. As such, we believe the three primary drivers of merger arbitrage returns – interest rates, deal flow, and volatility – are positioned to create a supportive environment for the strategy. Yet while we are optimistic, we are also cautious. Our primary concern continues to be the regulatory approval process, the timelines of which have begun to extend relative to historical norms. In the U.S., the Federal Trade Commission (FTC) appears emboldened, with the current regime seemingly more willing to take on transactions that previously would have been given a green light without objection. In the U.K., in preparation for a world in which the country is no longer a European Union (EU) member, regulators have stepped up their own reviews of M&A transactions, thus extending timelines even further. Amidst the ongoing trade war between the U.S. and China, the approval process at SAMR (State Administration for Market Regulation) remains a focus, with the potential for any given deal to be used as a pawn in the trade negotiation process. In this atmosphere of unpredictability, properly sizing positions relative to downside risk becomes ever more important and the option to exchange potential return for additional protection through hedges must be considered.
Annual Report | May 31, 2019
1
The Arbitrage Funds Shareholder Letter (continued)
At the softer end of the catalyst spectrum, our special situations team continues to see opportunity in speculative M&A, asset sales, re-ratings, and spin-offs. The number of announced spin-offs for 2019 is already above average, with the total value of announced spins for the year-to-date period having reached a record for the post Financial Crisis period. A primary motivation behind these transactions is companies are seeking to drive shareholder value by achieving simplified corporate structures. With each spin-off situation, we are presented with investment opportunities both pre-event and post-event. Post-event we may evaluate long and short investments in the newly independent companies, which can manifest as short-term alpha contributors or as longer-term investment opportunities as the new management teams execute on their standalone plans. While equity market valuations have rebounded since the lows of Q4 2018, we continue to see the market undervalue spin-offs and other re-rating opportunities relative to what we have historically seen.
Going forward, investors must determine whether the markets can be sustained by central bank support or whether slowing global growth becomes a larger concern. Despite the unpredictability of macro factors and equity markets regaining recent highs, we believe there is ample opportunity for further alpha generation. Corporations are likely to continue to seek to unlock shareholder value by engaging in M&A, asset sales, and spin-offs – and regardless of the specific investment set, we will continue to pursue our goal of generating returns for our clients that are sourced from the outcomes of these idiosyncratic corporate events. At the same time, we are aware that the historic bull markets in credit and equities are growing increasingly long in the tooth and that we are likely approaching some sort of correction that would mark the end of the current market cycle. Thus, we intend to remain disciplined in our approach as we strive to minimize volatility and correlation while we seek to execute on our investment goals in the year ahead.
Sincerely,
The Investment Team
Water Island Capital
The statements and opinions expressed are those of the author as of the date of this report. All information is historical and not indicative of future results and subject to change. This information is not a recommendation to buy or sell any security.
Glossary
Alpha: A measure of excess return relative to a benchmark.
Deal Flow: The volume of announced mergers and acquisitions activity.
Re-Rating: A scenario in which the market changes its view of a company sufficiently to make valuation ratios (such as price-earnings ratio) substantially higher or lower.
Risk-On: A period of positive investment sentiment, or during which investors perceive risk as low, and thus tend to engage in higher-risk investments.
S&P 500: An index of U.S. equities designed to reflect the risk/return characteristics of the domestic large cap universe that is one of the most commonly used benchmarks for the overall U.S. stock market.
www.arbitragefunds.com | 1-800-295-4485
2
The Arbitrage Fund Manager Commentary
Arbitrage Fund | Tickers: ARBNX, ARBFX, ARBCX, ARGAX
The Fund's Goal and Main Investments
The Fund seeks to achieve capital growth by engaging in merger arbitrage. Merger arbitrage is a sub-set of a broader event-driven investment strategy, which seeks to profit from investing in securities that are involved in corporate events such as mergers and acquisitions. Typically merger arbitrage is a low volatility strategy pursued by absolute-return-minded investors. At Water Island Capital, our goal is to capture a return stream with a low correlation to the overall markets.
Investment Strategy
The strategy's focus is to capture returns from corporate events, generate market neutral capital growth, preserve capital, generate consistent and positive returns, and achieve low correlation and low volatility. The Fund generally engages in active and frequent trading of portfolio securities to achieve its principal investment objective. In attempting to achieve its investment strategy, the Fund plans to invest at least 80% of its net assets in equity securities of companies (both U.S. and foreign) that are involved in publicly announced mergers, takeovers, tender offers, leveraged buyouts, spin-offs, liquidations, and other corporate reorganizations. The Fund's investment adviser uses investment strategies designed to minimize market exposure, including short selling along with purchasing and selling options. The most common merger arbitrage activity, and the approach generally used by the Fund, involves purchasing the shares of an announced acquisition target company at a discount to their expected value upon the acquisition's completion. That difference, or "spread," is the primary driver of returns for this investment strategy. There is no limit to the number of stocks the Fund can hold; however, the Fund typically invests in 40 to 80 deals at any given time. Each deal will have one, or perhaps two, equity positions (a long and short position in a stock-for-stock deal) and, in many cases, associated derivative positions for hedging purposes.
Fiscal Year Highlights
Arbitrage (ARBNX) returned 4.13% for the fiscal year ending May 31, 2019. The Fund generated positive returns in all regions of the world, though performance was driven primarily by deals in the Americas region. The top performing sectors in the Fund were communication services and consumer discretionary. Conversely, the materials sector detracted slightly from returns over the period.
The two top contributors for the period were interrelated, in that both were competitive bidding situations that involved Twenty-First Century Fox and Comcast. In December 2016, Fox, the U.S. television and film company, first announced its intent to purchase the 61% of U.K. broadcaster Sky that it didn't already own. While this transaction was still undergoing regulatory review, Fox entered into an agreement to sell its entertainment assets to Disney, the U.S. media and entertainment company, for $52 billion. This eventually led to two separate bidding wars involving Comcast, the U.S. telecommunications conglomerate. First, Comcast made a rival offer for Sky in February 2018, and then it challenged Disney with its own bid for Fox in June 2018. When Disney raised its offer for Fox to $71 billion, Comcast abandoned its pursuit of Fox in order to focus on Sky – ultimately winning an auction process for the asset with a superior offer that represented a 60% premium over Fox's initial offer. Both transactions successfully closed during the fiscal year, with the Fox/Disney deal representing the Fund's greatest contributor for the year and Sky/Comcast the second-greatest contributor.
Annual Report | May 31, 2019
3
The Arbitrage Fund Manager Commentary (continued)
Conversely, the largest detractor for the period was Qualcomm's attempted acquisition of NXP Semiconductor. In October 2016, Qualcomm – a U.S. telecommunications equipment provider – entered into a definitive agreement to acquire NXP Semiconductors – a Dutch provider of mixed-signal semiconductor solutions – for $53 billion. As of Q1 2018, the deal had received regulatory approvals from all required jurisdictions with the exception of one: China. Approval from the Chinese authorities appeared imminent when, in Q2 2018, the transaction was caught in the crossfire of the ongoing trade dispute between the U.S. and China, with China initially refusing to approve any transactions involving U.S. companies. Investors subsequently fled for the exits, leading to a sharp decline in NXP's share price and driving the deal spread wider. The deal was ultimately withdrawn when, after Chinese regulators had yet to approve the deal, the parties declined to extend the merger deadline, leading to a loss for the Fund.
The Fund's second-largest detractor of the period was NVIDIA's planned acquisition of Mellanox Technologies. In November 2018, reports emerged that Mellanox – an Israel-based developer of networking semiconductors – was seeking a buyer for the company. After rumors of several willing bidders, NVIDIA – a U.S.-based manufacturer of computer graphics processing units and chips – signed an agreement to acquire Mellanox for $6.9 billion in cash. The spread widened in Q2 2019 on fears that the still ongoing U.S./China trade war may also prevent this deal from securing regulatory approval in China, leading to losses in the Fund. We have sized our position in a manner that we believe is in line with the risk inherent in the transaction and we continue to monitor the situation closely.
Glossary
Tender Offer: A public, open offer by a prospective acquirer to shareholders of a publicly traded corporation to purchase their stock at a specified price over a specified time, subject to a minimum and maximum number of shares acquired.
Leveraged Buyout: The acquisition of a company using a significant amount of borrowed money to meet the purchase price.
www.arbitragefunds.com | 1-800-295-4485
4
The Arbitrage Fund Portfolio Information
Performance (annualized returns as of May 31, 2019)
| | | One
Year | | Five
Year | | Ten
Year | | Since
Inception* | |
Arbitrage Fund, Class R | | | 3.89 | % | | | 2.31 | % | | | 2.30 | % | | | 3.96 | % | |
Arbitrage Fund, Class I | | | 4.13 | % | | | 2.54 | % | | | 2.55 | % | | | 3.01 | % | |
Arbitrage Fund, Class C** | | | 3.11 | % | | | 1.54 | % | | | N/A | | | | 1.11 | % | |
Arbitrage Fund, Class A*** | | | 3.94 | % | | | 2.30 | % | | | N/A | | | | 2.11 | % | |
S&P 500® Index | | | 3.78 | % | | | 9.66 | % | | | 13.95 | % | | | 5.48 | % | |
ICE BofA Merrill Lynch U.S. 3-Month Treasury
Bill Index | | | 2.26 | % | | | 0.83 | % | | | 0.47 | % | | | 1.61 | % | |
Current performance may be higher or lower than performance quoted above. Any performance data quoted represents past performance and the investment return and principal value of an investment in the Fund will fluctuate so that an investor's shares, when redeemed, may be worth more or less than their original cost. Past performance is no guarantee of future results. Returns shown above include the reinvestment of all dividends and capital gains. Performance results do not include adjustments made for financial reporting purposes in accordance with U.S. generally accepted accounting principles and may differ from the amount reported in the Financial Highlights. You can obtain performance data current to the most recent month end by calling 1-800-295-4485 or going to www.arbitragefunds.com.
* Class R inception: 9/18/00; Class I inception: 10/17/03; Class C inception: 6/1/12; Class A inception: 6/1/13. Since Inception Returns for securities indices are for the inception date of Class R shares.
** Class C shares are subject to a 1.00% contingent deferred sales charge on all purchases redeemed in 12 months of purchase.
*** Class A shares are subject to a maximum front-end sales load of 2.50% on purchases up to $250,000. The shares are also subject to a deferred sales charge of up to 1.00% on purchases of $250,000 or more purchased without a front-end sales charge and redeemed within 18 months of purchase.
The Total Annual Fund Operating Expenses for Class R, Class I, Class C and Class A are 1.94%, 1.69%, 2.69% and 1.94%, respectively. These expense ratios are as stated in the current prospectus and may differ from the expense ratios disclosed in the financial highlights in this report.
The S&P 500® Index is an unmanaged index consisting of 500 stocks.
The ICE Bank of America (BofA) Merrill Lynch U.S. 3-Month Treasury Bill Index tracks the performance of the U.S. dollar denominated U.S. Treasury Bills publicly issued in the U.S. domestic market with a remaining term to final maturity of less than 3 months.
An investor may not invest directly in an index.
Annual Report | May 31, 2019
5
The Arbitrage Fund Portfolio Information (continued)
Growth of $10,000 Investment
The chart represents historical performance of a hypothetical investment of $10,000 in the Class R shares of the Fund. Past performance does not guarantee future results. This chart does not reflect the deduction of taxes that a shareholder would pay on Fund distributions or the redemption of Fund shares.

Sector Weighting
The following chart shows the sector weightings of The Arbitrage Fund's investments (including short sales and excluding derivatives) as of the report date.

www.arbitragefunds.com | 1-800-295-4485
6
The Arbitrage Fund Portfolio of Investments
| | | Shares | | Value | |
COMMON STOCKS - 80.87% | |
Aerospace & Defense - 6.50% | |
L3 Technologies, Inc. | | | 469,100 | | | $ | 113,550,346 | | |
Apparel - 0.10% | |
Perry Ellis International, Inc.(a)(b) | | | 828,485 | | | | 1,781,243 | | |
Auto Parts & Equipment - 1.46% | |
WABCO Holdings, Inc.(a)(c) | | | 194,922 | | | | 25,517,239 | | |
Banks - 4.22% | |
SunTrust Banks, Inc.(c) | | | 837,139 | | | | 50,236,712 | | |
TCF Financial Corp.(c) | | | 1,231,886 | | | | 23,479,747 | | |
| | | | 73,716,459 | | |
Biotechnology - 5.16% | |
Aratana Therapeutics, Inc.(a) | | | 1,311,574 | | | | 6,072,588 | | |
Celgene Corp.(a) | | | 627,279 | | | | 58,832,497 | | |
Nightstar Therapeutics Plc, ADR(a) | | | 458,949 | | | | 11,698,610 | | |
Pacific Biosciences of California, Inc.(a)(c) | | | 2,012,969 | | | | 13,486,892 | | |
| | | | 90,090,587 | | |
Chemicals - 2.30% | |
Versum Materials, Inc.(c)(d) | | | 783,812 | | | | 40,248,746 | | |
Commercial Services - 3.81% | |
Nord Anglia Education, Inc.(a)(b) | | | 200,078 | | | | 960,374 | | |
Rent-A-Center, Inc.(a)(d) | | | 501,623 | | | | 11,968,725 | | |
Tarsus Group Plc | | | 421,667 | | | | 2,308,290 | | |
Total System Services, Inc. | | | 36,221 | | | | 4,474,380 | | |
Worldpay, Inc., Class A(a)(c) | | | 385,627 | | | | 46,907,668 | | |
| | | | 66,619,437 | | |
Computers & Computer Services - 2.43% | |
Cray, Inc.(a)(c) | | | 287,351 | | | | 10,060,158 | | |
Electronics For Imaging, Inc.(a)(c) | | | 429,387 | | | | 15,737,034 | | |
KeyW Holding Corp. (The)(a) | | | 1,479,139 | | | | 16,640,314 | | |
| | | | 42,437,506 | | |
Diversified Financial Services - 0.14% | |
Gluskin Sheff + Associates, Inc. | | | 232,488 | | | | 2,447,695 | | |
Electronics - 0.45% | |
Control4 Corp.(a)(c) | | | 332,385 | | | | 7,864,229 | | |
Entertainment - 1.68% | |
International Speedway Corp., Class A(c) | | | 396,331 | | | | 17,739,776 | | |
Parques Reunidos Servicios Centrales SAU(e) | | | 750,370 | | | | 11,652,033 | | |
| | | | 29,391,809 | | |
See Notes to Financial Statements.
Annual Report | May 31, 2019
7
The Arbitrage Fund Portfolio of Investments (continued)
| | | Shares | | Value | |
COMMON STOCKS - 80.87% (Continued) | |
Environmental Control - 3.21% | |
Advanced Disposal Services, Inc.(a)(c) | | | 1,746,901 | | | $ | 56,145,398 | | |
Food - 0.72% | |
Smart & Final Stores, Inc.(a) | | | 963,573 | | | | 6,272,860 | | |
Wessanen | | | 489,576 | | | | 6,213,123 | | |
| | | | 12,485,983 | | |
Gas - 2.49% | |
AmeriGas Partners LP(c) | | | 1,280,376 | | | | 43,443,158 | | |
Healthcare - Services - 0.31% | |
WellCare Health Plans, Inc.(a)(d) | | | 19,724 | | | | 5,447,572 | | |
Household Products - 0.26% | |
Oriflame Holding AG(a) | | | 196,700 | | | | 4,617,673 | | |
Insurance - 0.25% | |
TOWER Ltd.(a) | | | 8,500,704 | | | | 4,393,315 | | |
Internet - 2.68% | |
Liberty Expedia Holdings, Inc., Class A(a)(c) | | | 1,026,404 | | | | 42,318,637 | | |
SafeCharge International Group Ltd. | | | 828,891 | | | | 4,537,516 | | |
| | | | 46,856,153 | | |
Investment Company Security - 1.89% | |
Oaktree Capital Group LLC(c) | | | 682,834 | | | | 33,001,367 | | |
Media - 7.63% | |
Fox Corp., Class A(a)(d) | | | 293,087 | | | | 10,325,455 | | |
Tribune Media Co., Class A(c) | | | 2,655,808 | | | | 122,963,910 | | |
| | | | 133,289,365 | | |
Metal Fabricate & Hardware - 1.41% | |
Global Brass & Copper Holdings, Inc. | | | 564,349 | | | | 24,622,547 | | |
Mining - 0.27% | |
Atlantic Gold Corp.(a) | | | 2,240,586 | | | | 4,790,836 | | |
Oil & Gas - 4.94% | |
Anadarko Petroleum Corp.(c)(d) | | | 1,226,881 | | | | 86,335,616 | | |
Oil & Gas Services - 0.09% | |
Spectrum ASA | | | 230,512 | | | | 1,625,123 | | |
Packaging & Containers - 2.93% | |
Multi-Color Corp. | | | 298,528 | | | | 14,848,783 | | |
| RPC Group Plc | | | 3,649,768 | | | | 36,415,408 | | |
| | | | 51,264,191 | | |
See Notes to Financial Statements.
www.arbitragefunds.com | 1-800-295-4485
8
The Arbitrage Fund Portfolio of Investments (continued)
| | | Shares | | Value | |
COMMON STOCKS - 80.87% (Continued) | |
Pharmaceuticals - 1.54% | |
BTG Plc(a) | | | 2,553,554 | | | $ | 26,908,129 | | |
Pipelines - 1.81% | |
Andeavor Logistics LP | | | 441,303 | | | | 15,392,648 | | |
Buckeye Partners LP | | | 397,738 | | | | 16,211,801 | | |
| | | | 31,604,449 | | |
Real Estate - 1.03% | |
HFF, Inc., Class A(c) | | | 416,668 | | | | 17,991,724 | | |
Real Estate Investment Trusts - 1.44% | |
Chesapeake Lodging Trust(c) | | | 158,218 | | | | 4,551,932 | | |
Tier REIT, Inc. | | | 762,015 | | | | 20,513,444 | | |
| | | | 25,065,376 | | |
Semiconductors - 2.65% | |
Aquantia Corp.(a)(c) | | | 607,011 | | | | 7,976,125 | | |
Intermolecular, Inc.(a)(c) | | | 919,936 | | | | 1,076,325 | | |
Mellanox Technologies Ltd.(a)(c)(d) | | | 339,254 | | | | 37,243,304 | | |
| | | | 46,295,754 | | |
Software - 12.75% | |
Amber Road, Inc.(a) | | | 741,621 | | | | 9,626,241 | | |
First Data Corp., Class A(a)(c) | | | 3,076,909 | | | | 78,215,027 | | |
MINDBODY, Inc., Class A(a)(b) | | | 843,793 | | | | 30,798,444 | | |
Onemarket Ltd.(a) | | | 111,800 | | | | 61,657 | | |
Red Hat, Inc.(a)(c)(d) | | | 564,450 | | | | 104,028,135 | | |
| | | | 222,729,504 | | |
Telecommunications - 2.32% | |
DNA Oyj | | | 356,450 | | | | 8,338,477 | | |
Inmarsat Plc | | | 2,282,900 | | | | 15,764,182 | | |
KCOM Group Plc | | | 3,417,642 | | | | 4,191,130 | | |
Quantenna Communications, Inc.(a)(c) | | | 215,844 | | | | 5,236,375 | | |
Zayo Group Holdings, Inc.(a) | | | 213,025 | | | | 6,965,918 | | |
| | | | 40,496,082 | | |
TOTAL COMMON STOCKS
(Cost $1,399,546,510) | | | 1,413,074,611 | | |
See Notes to Financial Statements.
Annual Report | May 31, 2019
9
The Arbitrage Fund Portfolio of Investments (continued)
| | | Shares | | Value | |
RIGHTS - 0.06% | |
A Schulman, Inc. CVR(b) | | | 173,468 | | | $ | 161,759 | | |
Corium International, Inc. CVR(b) | | | 920,694 | | | | 174,011 | | |
Cubist Pharmaceuticals, Inc. CPR, Expires 07/01/2019(b) | | | 119,343 | | | | 0 | | |
Media General, Inc. CVR(b) | | | 613,589 | | | | 0 | | |
NewStar Financial, Inc. CVR(b) | | | 1,514,945 | | | | 789,741 | | |
TOTAL RIGHTS
(Cost $634,040) | | | 1,125,511 | | |
| | | Maturity
Date | | Rate | | Principal
Amount | | Value | |
CORPORATE BONDS - 1.89% | |
Media - 0.81% | |
Tribune Media Co. | | 07/15/2022 | | | 5.875 | % | | $ | 13,900,000 | | | $ | 14,052,205 | | |
Software - 1.08% | |
First Data Corp.(c)(e) | |
| | | 01/15/2024 | | | 5.000 | % | | | 9,350,000 | | | | 9,548,453 | | |
| | | 01/15/2024 | | | 5.750 | % | | | 9,135,000 | | | | 9,347,389 | | |
| | | | | | | | | | | | 18,895,842 | | |
TOTAL CORPORATE BONDS
(Cost $33,188,880) | | | 32,948,047 | | |
| | | Shares | | Value | |
MUTUAL FUNDS - 0.88% | |
Arbitrage Event Driven Fund (The), Class I(f) | | | 1,611,740 | | | $ | 15,375,997 | | |
TOTAL MUTUAL FUNDS
(Cost $15,340,129) | | | 15,375,997 | | |
| | | Expiration
Date | | Exercise
Price | | Notional
Amount | | Contracts | | Value | |
PURCHASED OPTIONS(a) - 0.28% | |
Call Options Purchased - 0.05% | |
BB&T Corp. | |
| | | 06/2019 | | $ | 50.00 | | | $ | 2,300,100 | | | | 492 | | | $ | 6,150 | | |
| | | 09/2019 | | | 57.50 | | | | 19,092,700 | | | | 4,084 | | | | 49,008 | | |
Centene Corp. | |
| | | 06/2019 | | | 57.50 | | | | 999,075 | | | | 173 | | | | 51,900 | | |
| | | 06/2019 | | | 60.00 | | | | 4,458,300 | | | | 772 | | | | 156,330 | | |
Chemical
Financial
Corp. | | 06/2019 | | | 55.00 | | | | 7,280,478 | | | | 1,923 | | | | 4,808 | | |
See Notes to Financial Statements.
www.arbitragefunds.com | 1-800-295-4485
10
The Arbitrage Fund Portfolio of Investments (continued)
| | | Expiration
Date | | Exercise
Price | | Notional
Amount | | Contracts | | Value | |
PURCHASED OPTIONS(a) - 0.28% (Continued) | |
Call Options Purchased - 0.05% (Continued) | |
Fidelity National
Information
Services, Inc. | | 07/2019 | | $ | 135.00 | | | $ | 32,613,330 | | | | 2,711 | | | $ | 128,772 | | |
Occidental
Petroleum
Corp. | | 08/2019 | | | 55.00 | | | | 17,917,200 | | | | 3,600 | | | | 405,000 | | |
WellCare Health
Plans, Inc. | |
| | | 06/2019 | | | 290.00 | | | | 2,347,615 | | | | 85 | | | | 31,450 | | |
| | | 06/2019 | | | 300.00 | | | | 3,756,184 | | | | 136 | | | | 23,800 | | |
| | | 06/2019 | | | 310.00 | | | | 5,717,133 | | | | 207 | | | | 11,903 | | |
TOTAL CALL OPTIONS PURCHASED
(Cost $1,499,169) | | | 869,121 | | |
Put Options Purchased - 0.23% | |
Anadarko
Petroleum
Corp. | | 08/2019 | | | 65.00 | | | | 77,195,890 | | | | 10,970 | | | | 1,645,500 | | |
Fox Corp. | | 07/2019 | | | 37.00 | | | | 10,325,913 | | | | 2,931 | | | | 696,112 | | |
Luxoft Holding, Inc. | | 07/2019 | | | 45.00 | | | | 18,445,428 | | | | 3,204 | | | | 104,130 | | |
Mellanox
Technologies,
Ltd. | |
| | | 12/2019 | | | 90.00 | | | | 9,539,882 | | | | 869 | | | | 234,630 | | |
| | | 12/2019 | | | 100.00 | | | | 8,112,742 | | | | 739 | | | | 306,685 | | |
| | | 12/2019 | | | 105.00 | | | | 8,046,874 | | | | 733 | | | | 355,505 | | |
Red Hat, Inc. | |
| | | 09/2019 | | | 160.00 | | | | 9,989,060 | | | | 542 | | | | 63,685 | | |
| | | 09/2019 | | | 165.00 | | | | 2,469,620 | | | | 134 | | | | 16,080 | | |
| | | 01/2020 | | | 170.00 | | | | 1,677,130 | | | | 91 | | | | 21,385 | | |
Rent-A-Center Inc. | | 06/2019 | | | 23.00 | | | | 11,968,176 | | | | 5,016 | | | | 363,660 | | |
Versum
Materials, Inc. | | 06/2019 | | | 40.00 | | | | 2,192,645 | | | | 427 | | | | 1,068 | | |
WellCare Health
Plans, Inc. | | 09/2019 | | | 250.00 | | | | 7,733,320 | | | | 280 | | | | 197,400 | | |
TOTAL PUT OPTIONS PURCHASED
(Cost $3,628,457) | | | 4,005,840 | | |
TOTAL PURCHASED OPTIONS
(Cost $5,127,626) | | | 4,874,961 | | |
See Notes to Financial Statements.
Annual Report | May 31, 2019
11
The Arbitrage Fund Portfolio of Investments (continued)
| | | Yield | | Shares | | Value | |
SHORT-TERM INVESTMENTS - 15.32% | |
Money Market Funds | |
Morgan Stanley Institutional Liquidity
Fund - Government Portfolio,
Institutional Class | | | 2.326 | %(g) | | | 133,864,122 | | | $ | 133,864,122 | | |
State Street Institutional U.S. Government
Money Market Fund, Premier Class | | | 2.338 | %(g) | | | 133,864,122 | | | | 133,864,122 | | |
| | | | | | | | 267,728,244 | | |
TOTAL SHORT-TERM INVESTMENTS
(Cost $267,728,244) | | | 267,728,244 | | |
Total Investments - 99.30%
(Cost $1,721,565,429) | | | 1,735,127,371 | | |
Other Assets in Excess of Liabilities - 0.70%(h) | | | 12,153,851 | | |
NET ASSETS - 100.00% | | $ | 1,747,281,222 | | |
Portfolio Footnotes
(a) Non-income-producing security.
(b) Security fair valued using significant unobservable inputs and classified as a Level 3 security. As of May 31, 2019, the total fair market value of these securities was $34,665,572, representing 1.98% of net assets.
(c) Security, or a portion of security, is being held as collateral for short sales, written option contracts or forward foreign currency exchange contracts. At May 31, 2019, the aggregate fair market value of those securities was $706,038,695 representing 40.41% of net assets.
(d) Underlying security for a written/purchased call/put option.
(e) Security exempt from registration under Rule 144A of the Securities Act of 1933. These securities may be resold in transactions exempt from registration, normally to qualified institutional buyers. As of May 31, 2019, these securities had a total value of $30,547,875 or 1.75% of net assets.
(f) Affiliated investment.
(g) Rate shown is the 7-day effective yield as of May 31, 2019.
(h) Includes cash held as collateral for short sales and written option contracts.
SCHEDULE OF SECURITIES SOLD SHORT | | Shares | | Value | |
COMMON STOCKS - (29.04%) | |
Aerospace & Defense - (6.53%) | |
Harris Corp. | | | (609,483 | ) | | $ | (114,089,123 | ) | |
Banks - (4.26%) | |
BB&T Corp. | | | (1,084,101 | ) | | | (50,681,722 | ) | |
Chemical Financial Corp. | | | (625,979 | ) | | | (23,699,565 | ) | |
| | | | (74,381,287 | ) | |
See Notes to Financial Statements.
www.arbitragefunds.com | 1-800-295-4485
12
The Arbitrage Fund Portfolio of Investments (continued)
| | | Shares | | Value | |
COMMON STOCKS - (29.04%) (Continued) | |
Commercial Services - (0.26%) | |
Global Payments, Inc. | | | (29,344 | ) | | $ | (4,520,150 | ) | |
Computers & Computer Services - (0.57%) | |
Luxoft Holding, Inc., Class A | | | (172,244 | ) | | | (9,916,087 | ) | |
Diversified Financial Services - (0.96%) | |
Brookfield Asset Management, Inc., Class A | | | (367,912 | ) | | | (16,868,765 | ) | |
Gas - (1.89%) | |
UGI Corp. | | | (638,584 | ) | | | (32,957,320 | ) | |
Healthcare - Services - (0.22%) | |
Centene Corp. | | | (66,667 | ) | | | (3,850,019 | ) | |
Internet - (2.43%) | |
Expedia Group, Inc. | | | (369,301 | ) | | | (42,469,615 | ) | |
Oil & Gas - (1.02%) | |
Occidental Petroleum Corp. | | | (359,966 | ) | | | (17,915,508 | ) | |
Oil & Gas Services - (0.09%) | |
TGS NOPEC Geophysical Co. ASA | | | (64,555 | ) | | | (1,617,618 | ) | |
Pharmaceuticals - (1.98%) | |
Bristol-Myers Squibb Co. | | | (627,279 | ) | | | (28,459,648 | ) | |
Elanco Animal Health, Inc. | | | (194,244 | ) | | | (6,075,953 | ) | |
| | | | (34,535,601 | ) | |
Real Estate - (0.45%) | |
Jones Lang LaSalle, Inc. | | | (62,646 | ) | | | (7,796,295 | ) | |
Real Estate Investment Trusts - (1.33%) | |
Cousins Properties, Inc. | | | (2,267,483 | ) | | | (20,520,721 | ) | |
Park Hotels & Resorts, Inc. | | | (99,316 | ) | | | (2,743,108 | ) | |
| | | | (23,263,829 | ) | |
Software - (7.05%) | |
Fidelity National Information Services, Inc. | | | (358,133 | ) | | | (43,083,400 | ) | |
Fiserv, Inc. | | | (932,504 | ) | | | (80,064,793 | ) | |
| | | | (123,148,193 | ) | |
TOTAL COMMON STOCKS
(Proceeds $498,624,440) | | | (507,329,410 | ) | |
LIMITED PARTNERSHIPS - (0.87%) | |
Pipelines - (0.87%) | |
| MPLX LP | | | (500,682 | ) | | | (15,310,857 | ) | |
TOTAL LIMITED PARTNERSHIPS
(Proceeds $15,610,023) | | | (15,310,857 | ) | |
See Notes to Financial Statements.
Annual Report | May 31, 2019
13
The Arbitrage Fund Portfolio of Investments (continued)
| | | Shares | | Value | |
EXCHANGE-TRADED FUNDS - (0.67%) | |
Equity Fund - (0.67%) | |
Invesco QQQ Trust Series 1 | | | (67,077 | ) | | $ | (11,668,044 | ) | |
TOTAL EXCHANGE-TRADED FUNDS
(Proceeds $11,304,683) | | | (11,668,044 | ) | |
RIGHTS - (0.01%) | |
Biotechnology - (0.01%) | |
Celgene Corp. CVR | | | (80,988 | ) | | | (194,371 | ) | |
TOTAL RIGHTS
(Proceeds $171,691) | | | (194,371 | ) | |
TOTAL SECURITIES SOLD SHORT
(Proceeds $525,710,837) | | $ | (534,502,682 | ) | |
WRITTEN OPTIONS | | Expiration
Date | | Exercise
Price | | Notional
Amount | | Contracts | | Value | |
Written Call Options | |
Red Hat, Inc. | |
| | | 06/2019 | | $ | 180.00 | | | $ | (3,686,000 | ) | | | (200 | ) | | $ | (98,000 | ) | |
| | | 06/2019 | | | 185.00 | | | | (3,686,000 | ) | | | (200 | ) | | | (13,000 | ) | |
TOTAL WRITTEN CALL OPTIONS
(Premiums received $123,308) | | | (111,000 | ) | |
Written Put Options | |
WellCare Health
Plans, Inc. | | 09/2019 | | | 220.00 | | | | (7,733,320 | ) | | | (280 | ) | | | (75,600 | ) | |
TOTAL WRITTEN PUT OPTIONS
(Premiums received $88,893) | | | (75,600 | ) | |
TOTAL WRITTEN OPTIONS
(Premiums received $212,201) | | $ | (186,600 | ) | |
OUTSTANDING FORWARD FOREIGN CURRENCY EXCHANGE CONTRACTS
Currency
Purchased | | Currency Sold | | Counterparty | | Settlement
Date | | Unrealized
Appreciation | |
AUD | 2,700 | | | USD | 1,864 | | | Goldman Sachs & Co. | | 06/14/2019 | | $ | 11 | | |
USD | 75,366 | | | AUD | 106,500 | | | Goldman Sachs & Co. | | 06/14/2019 | | | 1,461 | | |
USD | 46,190,957 | | | CAD | 61,544,800 | | | Goldman Sachs & Co. | | 06/14/2019 | | | 643,789 | | |
CHF | 8,107,300 | | | USD | 8,078,210 | | | Goldman Sachs & Co. | | 06/14/2019 | | | 26,678 | | |
USD | 8,134,050 | | | CHF | 8,107,300 | | | Goldman Sachs & Co. | | 06/14/2019 | | | 29,162 | | |
USD | 100,582,689 | | | EUR | 88,611,000 | | | Goldman Sachs & Co. | | 06/14/2019 | | | 1,508,666 | | |
USD | 80,774,289 | | | GBP | 61,093,700 | | | Goldman Sachs & Co. | | 06/14/2019 | | | 3,497,513 | | |
NZD | 298,900 | | | USD | 194,553 | | | Goldman Sachs & Co. | | 06/14/2019 | | | 1,026 | | |
USD | 5,346,503 | | | NZD | 7,863,300 | | | Goldman Sachs & Co. | | 06/14/2019 | | | 201,306 | | |
USD | 11,657,137 | | | SEK | 107,736,500 | | | Goldman Sachs & Co. | | 06/14/2019 | | | 291,606 | | |
| | $ | 6,201,218 | | |
See Notes to Financial Statements.
www.arbitragefunds.com | 1-800-295-4485
14
The Arbitrage Fund Portfolio of Investments (continued)
Currency
Purchased | | Currency Sold | | Counterparty | | Settlement
Date | | Unrealized
Depreciation | |
AUD | 17,100 | | | USD | 12,132 | | | Goldman Sachs & Co. | | 06/14/2019 | | $ | (267 | ) | |
USD | 1,517 | | | AUD | 2,200 | | | Goldman Sachs & Co. | | 06/14/2019 | | | (9 | ) | |
CAD | 51,804,900 | | | USD | 38,563,849 | | | Goldman Sachs & Co. | | 06/14/2019 | | | (224,841 | ) | |
EUR | 66,151,700 | | | USD | 74,649,993 | | | Goldman Sachs & Co. | | 06/14/2019 | | | (687,222 | ) | |
USD | 1,082,521 | | | EUR | 969,500 | | | Goldman Sachs & Co. | | 06/14/2019 | | | (1,457 | ) | |
GBP | 5,594,000 | | | USD | 7,183,076 | | | Goldman Sachs & Co. | | 06/14/2019 | | | (107,284 | ) | |
NZD | 891,300 | | | USD | 599,808 | | | Goldman Sachs & Co. | | 06/14/2019 | | | (16,603 | ) | |
SEK | 107,736,500 | | | USD | 11,388,476 | | | Goldman Sachs & Co. | | 06/14/2019 | | | (22,943 | ) | |
USD | 4,421,250 | | | SEK | 42,194,500 | | | Goldman Sachs & Co. | | 06/14/2019 | | | (30,009 | ) | |
| | $ | (1,090,635 | ) | |
The following is a summary of investments classified by country exposure:
Country | | % of Net Assets(a) | |
United Kingdom | | | 5.69 | % | |
Israel | | | 2.13 | % | |
Spain | | | 0.67 | % | |
Finland | | | 0.48 | % | |
Canada | | | 0.41 | % | |
Netherlands | | | 0.36 | % | |
Switzerland | | | 0.26 | % | |
New Zealand | | | 0.25 | % | |
Ireland | | | 0.13 | % | |
Norway | | | 0.09 | % | |
Hong Kong | | | 0.05 | % | |
Australia | | | 0.00 | %(b) | |
United States | | | 88.78 | % | |
Other Assets in Excess of Liabilities | | | 0.70 | % | |
| | | | 100.00 | % | |
(a) These percentages represent long positions only and are not net of short positions.
(b) Less than 0.005% of net assets.
Abbreviations:
ADR - American Depositary Receipt
AG - Aktiengesellschaft is a German term that refers to a corporation that is limited by shares, i.e., owned by shareholders.
ASA - Allmennaksjeselskap is the Norwegian term for public limited company.
AUD - Australian dollar
CAD - Canadian dollar
CHF - Swiss franc
CPR - Conditional Prepayment Rate
CVR - Contingent Value Rights
EUR - Euro
GBP - British pound
See Notes to Financial Statements.
Annual Report | May 31, 2019
15
The Arbitrage Fund Portfolio of Investments (continued)
LLC - Limited Liability Company
LP - Limited Partnership
Ltd. - Limited
NZD - New Zealand dollar
Oyj - Osakeyhtio is the Finnish equivalent of a public limited company.
Plc - Public Limited Company
REIT - Real Estate Investment Trust
SAU - Sociedad Anónima Unipersonal is a Spanish term for a single shareholder company.
SEK - Swedish krona
USD - United States Dollar
See Notes to Financial Statements.
www.arbitragefunds.com | 1-800-295-4485
16
The Arbitrage Fund Portfolio of Investments (continued)
The following table summarizes The Arbitrage Fund's investments and derivative financial instruments categorized in the disclosure hierarchy as of May 31, 2019:
Investments in Securities at Value* | | Level 1 | | Level 2 | | Level 3 | | Total | |
Assets | |
Common Stocks | |
Aerospace & Defense | | $ | 113,550,346 | | | $ | — | | | $ | — | | | $ | 113,550,346 | | |
Apparel | | | — | | | | ��� | | | | 1,781,243 | | | | 1,781,243 | | |
Auto Parts & Equipment | | | 25,517,239 | | | | — | | | | — | | | | 25,517,239 | | |
Banks | | | 73,716,459 | | | | — | | | | — | | | | 73,716,459 | | |
Biotechnology | | | 90,090,587 | | | | — | | | | — | | | | 90,090,587 | | |
Chemicals | | | 40,248,746 | | | | — | | | | — | | | | 40,248,746 | | |
Commercial Services | | | 65,659,063 | | | | — | | | | 960,374 | | | | 66,619,437 | | |
Computers & Computer
Services | | | 42,437,506 | | | | — | | | | — | | | | 42,437,506 | | |
Diversified Financial Services | | | 2,447,695 | | | | — | | | | — | | | | 2,447,695 | | |
Electronics | | | 7,864,229 | | | | — | | | | — | | | | 7,864,229 | | |
Entertainment | | | 29,391,809 | | | | — | | | | — | | | | 29,391,809 | | |
Environmental Control | | | 56,145,398 | | | | — | | | | — | | | | 56,145,398 | | |
Food | | | 12,485,983 | | | | — | | | | — | | | | 12,485,983 | | |
Gas | | | 43,443,158 | | | | — | | | | — | | | | 43,443,158 | | |
Healthcare - Services | | | 5,447,572 | | | | — | | | | — | | | | 5,447,572 | | |
Household Products | | | 4,617,673 | | | | — | | | | — | | | | 4,617,673 | | |
Insurance | | | 4,393,315 | | | | — | | | | — | | | | 4,393,315 | | |
Internet | | | 46,856,153 | | | | — | | | | — | | | | 46,856,153 | | |
Investment Company Security | | | 33,001,367 | | | | — | | | | — | | | | 33,001,367 | | |
Media | | | 133,289,365 | | | | — | | | | — | | | | 133,289,365 | | |
Metal Fabricate & Hardware | | | 24,622,547 | | | | — | | | | — | | | | 24,622,547 | | |
Mining | | | 4,790,836 | | | | — | | | | — | | | | 4,790,836 | | |
Oil & Gas | | | 86,335,616 | | | | — | | | | — | | | | 86,335,616 | | |
Oil & Gas Services | | | 1,625,123 | | | | — | | | | — | | | | 1,625,123 | | |
Packaging & Containers | | | 51,264,191 | | | | — | | | | — | | | | 51,264,191 | | |
Pharmaceuticals | | | 26,908,129 | | | | — | | | | — | | | | 26,908,129 | | |
Pipelines | | | 31,604,449 | | | | — | | | | — | | | | 31,604,449 | | |
Real Estate | | | 17,991,724 | | | | — | | | | — | | | | 17,991,724 | | |
Real Estate Investment Trusts | | | 25,065,376 | | | | — | | | | — | | | | 25,065,376 | | |
Semiconductors | | | 46,295,754 | | | | — | | | | — | | | | 46,295,754 | | |
Software | | | 191,931,060 | | | | — | | | | 30,798,444 | | | | 222,729,504 | | |
Telecommunications | | | 40,496,082 | | | | — | | | | — | | | | 40,496,082 | | |
Rights | | | — | | | | — | | | | 1,125,511 | | | | 1,125,511 | | |
Corporate Bonds** | | | — | | | | 32,948,047 | | | | — | | | | 32,948,047 | | |
Mutual Funds | | | 15,375,997 | | | | — | | | | — | | | | 15,375,997 | | |
Purchased Options | | | 4,874,961 | | | | — | | | | — | | | | 4,874,961 | | |
Short-Term Investments | | | 267,728,244 | | | | — | | | | — | | | | 267,728,244 | | |
TOTAL | | $ | 1,667,513,752 | | | $ | 32,948,047 | | | $ | 34,665,572 | | | $ | 1,735,127,371 | | |
See Notes to Financial Statements.
Annual Report | May 31, 2019
17
The Arbitrage Fund Portfolio of Investments (continued)
Other Financial Instruments*** | | Level 1 | | Level 2 | | Level 3 | | Total | |
Assets | |
Forward Foreign Currency
Exchange Contracts | | $ | — | | | $ | 6,201,218 | | | $ | — | | | $ | 6,201,218 | | |
Liabilities | |
Common Stocks** | | | (507,329,410 | ) | | | — | | | | — | | | | (507,329,410 | ) | |
Limited Partnerships | | | (15,310,857 | ) | | | — | | | | — | | | | (15,310,857 | ) | |
Exchange-Traded Funds | | | (11,668,044 | ) | | | — | | | | — | | | | (11,668,044 | ) | |
Rights | | | — | | | | (194,371 | ) | | | — | | | | (194,371 | ) | |
Written Options | | | (186,600 | ) | | | — | | | | — | | | | (186,600 | ) | |
Forward Foreign Currency
Exchange Contracts | | | — | | | | (1,090,635 | ) | | | — | | | | (1,090,635 | ) | |
TOTAL | | $ | (534,494,911 | ) | | $ | 4,916,212 | | | $ | — | | | $ | (529,578,699 | ) | |
* Refer to footnote 2 where leveling hierarchy is defined.
** Refer to Portfolio of Investments for sector information.
*** Other financial instruments are instruments such as written options, securities sold short, equity swaps and forward foreign currency exchange contracts.
The following is a reconciliation of the fair valuations using significant unobservable inputs (Level 3) for the Fund's assets and liabilities during the period ended May 31, 2019:
Investments
in Securities | | Balance as of
May 31, 2018 | | Realized
Gain
(Loss) | | Change in
Unrealized
Appreciation
(Depreciation) | | Purchases | | Sales
Proceeds | | Transfers
into
Level 3 | | Transfers
out of
Level 3 | | Balance as of
May 31, 2019 | | Net change in
Unrealized
Appreciation
(Depreciation)
included in the
Statement of
Operations
attributable to
Level 3
investments
held at
May 31, 2019 | |
Common
Stocks | | $ | 98,838,726 | | | $ | 7,727,966 | | | $ | 164,672 | | | $ | 54,403,438 | | | $ | (127,594,741 | ) | | $ | — | | | $ | — | | | $ | 33,540,061 | | | $ | (821,656 | ) | |
Rights | | | 1,020,012 | | | | — | | | | 217,220 | | | | 497,049 | | | | (608,770 | ) | | | — | | | | — | | | | 1,125,511 | | | | 217,220 | | |
Total | | $ | 99,858,738 | | | $ | 7,727,966 | | | $ | 381,892 | | | $ | 54,900,487 | | | $ | (128,203,511 | ) | | $ | — | | | $ | — | | | $ | 34,665,572 | | | $ | (604,436 | ) | |
The following table summarizes the quantitative inputs used for investments categorized as Level 3 of the fair value hierarchy as of May 31, 2019:
Investments in
Securities | | Fair Value at
May 31, 2019 | | Valuation
Technique | | Unobservable
Input | | Range of
Values | | Weighted
Average | |
Common Stocks | | $ | 33,540,061 | | | Deal Value | | Final | | $2.15-$36.50
determination
on Dissent | | $33.77 | |
Rights
| | $ | 1,125,511
| | | Discounted,
probability
adjusted value | | Discount Rate,
Probability
| | 0-10%, 0%-90%
| | $ 0.53
| |
See Notes to Financial Statements.
www.arbitragefunds.com | 1-800-295-4485
18
The Arbitrage Event-Driven Fund Manager Commentary
Arbitrage Event-Driven Fund | Tickers: AEDNX, AEDFX, AEFCX, AGEAX
The Fund's Goal and Main Investments
The Fund seeks to provide capital growth by investing in credit and equity securities involved in specific corporate events, with a focus on low volatility and low correlation relative to the broader capital markets.
Investment Strategy
The Fund's investment process follows a disciplined, fundamental approach that values risk mitigation while identifying compelling risk/reward opportunities available to us as we screen catalyst-driven corporate events, such as mergers and acquisitions, restructurings, refinancings, recapitalizations, spin-offs, litigation, regulatory changes, and bankruptcy. We analyze these events through three core approaches: merger arbitrage, equity special situations, and credit opportunities. We seek to generate investment returns that have low volatility and low correlation compared to the broader capital markets. We do not manage against any particular benchmark and believe that capital preservation in difficult markets is as important as generating positive returns within our low correlated, low volatility event-driven investment strategy. This process and approach have been an integral part of the culture at Water Island Capital since the firm's inception.
Fiscal Year Highlights
Arbitrage Event-Driven (AEDNX) returned 1.77% for the fiscal year ending May 31, 2019. The merger arbitrage and credit opportunities sub-strategy sleeves of the Fund contributed to returns, while the equity special situations sleeve was a detractor for the period. Returns were driven primarily by the Americas region, while the European region detracted slightly from performance. The Fund's top-performing sectors were communication services and consumer discretionary. Conversely, the consumer staples and information technology sectors detracted from returns during the period.
The Fund's top performing deal of the period was a competitive bidding situation for Anadarko Petroleum. In April 2019, Chevron – a U.S.-based integrated oil and gas company – publicly announced it had agreed to acquire Anadarko, a U.S.-based upstream energy company, for $32.5 billion in cash and stock. Prior to the announcement of the deal, Anadarko had also been conducting negotiations with another bidder – Occidental Petroleum – though the company deemed Chevron's bid to be the superior offer. Two weeks after the deal with Chevron was announced, Occidental publicly announced an unsolicited revised offer that valued Anadarko at $38 billion in cash and stock, topping Chevron's bid. Anadarko subsequently agreed to return to the negotiating table. Anadarko ultimately declared Occidental to have the superior offer, at which point Chevron abandoned its pursuit of the company. Occidental's acquisition is currently pending, and we anticipate a successful conclusion before the end of 2019.
The Fund's second-best performing position was the bidding war for Sky – a U.K. pay-television service operator – between Twenty-First Century Fox and Comcast. In December 2016, Twenty-First Century Fox – a U.S. television and film company – entered into a definitive agreement to acquire the 61% of Sky it didn't already own for $23 billion. During Q1 2018, U.S. telecommunications conglomerate Comcast entered with a topping bid that valued Sky at $42 billion. In addition (to make matters more complicated), Fox itself became the subject of a bidding war between Disney and Comcast. While Comcast ultimately abandoned its pursuit of Fox, it remained focused on Sky. In September, the failure to resolve the competing bids forced a rather uncommon mandatory
Annual Report | May 31, 2019
19
The Arbitrage Event-Driven Fund Manager Commentary (continued)
auction process under U.K. Takeover Code. Comcast emerged victorious, with a winning bid that was 60% greater than Fox's original offer in December 2016, leading to a profit for the Fund.
Conversely, the largest detractor for the period was Qualcomm's attempted acquisition of NXP Semiconductor. In October 2016, Qualcomm – a U.S. telecommunications equipment provider – entered into a definitive agreement to acquire NXP Semiconductors – a Dutch provider of mixed-signal semiconductor solutions – for $53 billion. As of Q1 2018, the deal had received regulatory approvals from all required jurisdictions with the exception of one: China. Approval from the Chinese authorities appeared imminent when, in Q2 2018, the transaction was caught in the crossfire of the ongoing trade dispute between the U.S. and China, with China initially refusing to approve any transactions involving U.S. companies. Investors subsequently fled for the exits, leading to a sharp decline in NXP's share price and driving the deal spread wider. The deal was ultimately withdrawn when, after Chinese regulators had yet to approve the deal, the parties declined to extend the merger deadline, leading to a loss for the Fund.
The Fund's second-largest detractor for the period was our special situations investment in CorePoint Lodging, a real-estate investment trust spun-off from La Quinta that now owns the hotel assets of its former parent. In May 2018, La Quinta announced its first earnings report, which disappointed investors with soft margin guidance and a lowered expectation of cash balances due to a change in expected tax reimbursement proceeds from its former parent (now owned by Wyndham Hotels & Resorts). We believe the business is fundamentally undervalued but recognize a turnaround will take time as management looks to restore confidence in the business and outlook. As a result of the long duration turnaround aspects to this investment, we have liquidated the position and allocated the capital to shorter duration opportunities.
Glossary
Recapitalization: A type of corporate reorganization involving substantial change in a company's capital structure, typically when a large portion of equity is replaced with debt or vice versa.
www.arbitragefunds.com | 1-800-295-4485
20
The Arbitrage Event-Driven Fund Portfolio Information
Performance (annualized returns as of May 31, 2019)
| | | One
Year | | Five
Year | | Since
Inception* | |
Arbitrage Event-Driven Fund, Class R | | | 1.60% | | | | -0.36 | % | | | 1.36 | % | |
Arbitrage Event-Driven Fund, Class I | | | 1.77 | % | | | -0.13 | % | | | 1.60 | % | |
Arbitrage Event-Driven Fund, Class C** | | | 0.80 | % | | | -1.11 | % | | | 0.23 | % | |
Arbitrage Event-Driven Fund, Class A*** | | | 1.56 | % | | | -0.38 | % | | | 0.63 | % | |
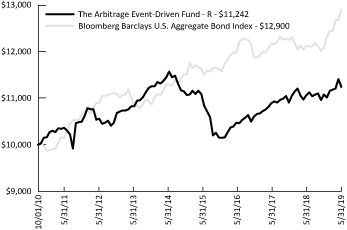
Bloomberg Barclays U.S. Aggregate Bond Index | | | 6.40 | % | | | 2.70 | % | | | 2.98 | % | |
ICE BofA Merrill Lynch U.S. 3-Month Treasury Bill Index | | | 2.26 | % | | | 0.83 | % | | | 0.52 | % | |
Current performance may be higher or lower than performance quoted above. Any performance data quoted represents past performance, and the investment return and principal value of an investment in the Fund will fluctuate so that an investor's shares, when redeemed, may be worth more or less than their original cost. Past performance is no guarantee of future results. Returns shown above include the reinvestment of all dividends and capital gains. Performance results do not include adjustments made for financial reporting purposes in accordance with U.S. generally accepted accounting principles and may differ from the amount reported in the Financial Highlights. Contractual fee waivers are currently in effect. Without such fee waivers, performance numbers would be reduced. You can obtain performance data current to the most recent month end by calling 1-800-295-4485 or going to www.arbitragefunds.com.
* Class R and Class I inception: 10/1/10; Class C inception: 6/1/12; Class A inception: 6/1/13. Since Inception Returns for securities indices are for the inception date of Class R and Class I shares.
** Class C shares are subject to a 1.00% contingent deferred sales charge on all purchases redeemed in 12 months of purchase.
*** Class A shares are subject to a maximum front-end sales load of 3.25% of the offering price and are also subject to a 1.00% contingent deferred sales load on purchases at or above $500,000 made prior to June 30, 2018 and on purchases at or above $250,000 made after June 30, 2018 (determined on a first-in, first-out basis), purchased without a front-end sales charge and redeemed within 18 months of purchase.
The Total Annual Fund Operating Expenses for Class R, Class I, Class C and Class A are 2.63%, 2.38%, 3.38% and 2.63%, respectively. The Adviser has agreed to waive fees (not including the effects of interest, dividends on short positions, brokerage commissions, acquired fund fees and expenses, taxes, or other extraordinary expenses) in excess of 1.69%, 1.44%, 2.44% and 1.69% for Class R, Class I, Class C and Class A, respectively, until at least September 30, 2019. These expense ratios are as stated in the current prospectus and may differ from the expense ratios disclosed in the financial highlights in this report.
The Bloomberg Barclays U.S. Aggregate Bond Index is a market value-weighted index of investment-grade fixed-rated debt issues, including government, corporate, asset-backed and mortgage-backed securities with a maturity of one year or more.
The ICE Bank of America (BofA) Merrill Lynch U.S. 3-Month Treasury Bill Index tracks the performance of the U.S. dollar denominated U.S. Treasury Bills publicly issued in the U.S. domestic market with a remaining term to final maturity of less than 3 months.
An investor may not invest directly in an index.
Annual Report | May 31, 2019
21
The Arbitrage Event-Driven Fund Portfolio Information (continued)
Growth of $10,000 Investment
The chart represents historical performance of a hypothetical investment of $10,000 in the Class R shares of the Fund since inception. Past performance does not guarantee future results. This chart does not reflect the deduction of taxes that a shareholder would pay on Fund distributions or the redemption of Fund shares.
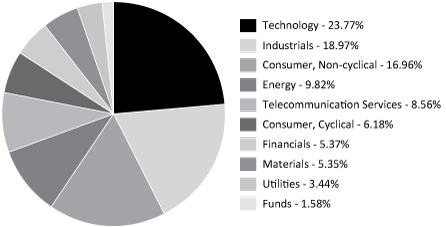
Sector Weighting
The following chart shows the sector weightings of The Arbitrage Event-Driven Fund's investments (including short sales and excluding derivatives) as of the report date.
www.arbitragefunds.com | 1-800-295-4485
22
The Arbitrage Event-Driven Fund Portfolio of Investments
| | | Shares | | Value | |
COMMON STOCKS - 75.17% | |
Aerospace & Defense - 5.59% | |
L3 Technologies, Inc. | | | 28,781 | | | $ | 6,966,729 | | |
Auto Parts & Equipment - 1.47% | |
WABCO Holdings, Inc.(a)(b) | | | 13,987 | | | | 1,831,038 | | |
Biotechnology - 8.33% | |
Celgene Corp.(a)(b) | | | 89,750 | | | | 8,417,653 | | |
Pacific Biosciences of California, Inc.(a)(b) | | | 294,736 | | | | 1,974,731 | | |
| | | | 10,392,384 | | |
Chemicals - 2.80% | |
Air Products & Chemicals, Inc.(b) | | | 2,224 | | | | 452,784 | | |
Celanese Corp., Class A | | | 353 | | | | 33,510 | | |
Eastman Chemical Co. | | | 456 | | | | 29,604 | | |
Huntsman Corp. | | | 1,611 | | | | 27,983 | | |
LyondellBasell Industries N.V., Class A | | | 819 | | | | 60,811 | | |
Versum Materials, Inc.(b)(c) | | | 56,244 | | | | 2,888,129 | | |
| | | | 3,492,821 | | |
Commercial Services - 2.68% | |
Herc Holdings, Inc.(a)(c) | | | 16,322 | | | | 555,438 | | |
LiveRamp Holdings, Inc.(a)(c) | | | 12,189 | | | | 626,271 | | |
Rent-A-Center, Inc.(a)(c) | | | 34,950 | | | | 833,907 | | |
Total System Services, Inc. | | | 5,195 | | | | 641,738 | | |
Worldpay, Inc., Class A(a) | | | 5,582 | | | | 678,994 | | |
| | | | 3,336,348 | | |
Computers & Computer Services - 3.27% | |
Cray, Inc.(a) | | | 41,114 | | | | 1,439,401 | | |
Electronics For Imaging, Inc.(a)(b) | | | 49,311 | | | | 1,807,248 | | |
Perspecta, Inc.(b)(c) | | | 38,562 | | | | 837,181 | | |
| | | | 4,083,830 | | |
Construction Materials - 2.46% | |
Johnson Controls International Plc(c) | | | 79,740 | | | | 3,071,585 | | |
Electronics - 0.45% | |
Control4 Corp.(a)(b) | | | 23,966 | | | | 567,036 | | |
Entertainment - 1.69% | |
International Speedway Corp., Class A | | | 28,365 | | | | 1,269,617 | | |
Parques Reunidos Servicios Centrales SAU(d) | | | 54,309 | | | | 843,331 | | |
| | | | 2,112,948 | | |
Food - 0.37% | |
Smart & Final Stores, Inc.(a) | | | 70,491 | | | | 458,896 | | |
See Notes to Financial Statements.
Annual Report | May 31, 2019
23
The Arbitrage Event-Driven Fund Portfolio of Investments (continued)
| | | Shares | | Value | |
COMMON STOCKS - 75.17% (Continued) | |
Gas - 2.50% | |
AmeriGas Partners LP(b) | | | 92,016 | | | $ | 3,122,103 | | |
Healthcare - Services - 0.63% | |
WellCare Health Plans, Inc.(a)(c) | | | 2,835 | | | | 782,999 | | |
Household Products - 0.53% | |
Oriflame Holding AG | | | 28,143 | | | | 660,677 | | |
Internet - 0.29% | |
Alibaba Group Holding Ltd., Sponsored ADR(a) | | | 2,408 | | | | 359,418 | | |
Lodging - 0.57% | |
Wyndham Hotels & Resorts, Inc.(b)(c) | | | 13,217 | | | | 704,995 | | |
Media - 3.36% | |
Fox Corp., Class A(a)(c) | | | 21,437 | | | | 755,226 | | |
Tribune Media Co., Class A(b) | | | 70,161 | | | | 3,248,454 | | |
Kabel Deutschland Holding AG | | | 1,578 | | | | 188,626 | | |
| | | | 4,192,306 | | |
Metal Fabricate & Hardware - 2.87% | |
Global Brass & Copper Holdings, Inc. | | | 81,937 | | | | 3,574,911 | | |
Miscellaneous Manufacturing - 0.16% | |
Trinity Industries, Inc.(b) | | | 10,475 | | | | 201,958 | | |
Oil & Gas - 7.01% | |
Anadarko Petroleum Corp.(b)(c) | | | 124,198 | | | | 8,739,813 | | |
Packaging & Containers - 0.99% | |
| RPC Group Plc | | | 123,713 | | | | 1,234,341 | | |
Pharmaceuticals - 0.15% | |
Paratek Pharmaceuticals, Inc.(a)(b)(e) | | | 52,781 | | | | 191,595 | | |
Pipelines - 1.87% | |
Buckeye Partners LP(b) | | | 57,168 | | | | 2,330,168 | | |
Real Estate - 0.74% | |
HFF, Inc., Class A(b) | | | 21,485 | | | | 927,722 | | |
Real Estate Investment Trusts - 2.88% | |
Chesapeake Lodging Trust(b) | | | 22,899 | | | | 658,804 | | |
Tier REIT, Inc. | | | 109,028 | | | | 2,935,034 | | |
| | | | 3,593,838 | | |
Retail - 0.54% | |
Lowe's Cos., Inc. | | | 7,216 | | | | 673,109 | | |
See Notes to Financial Statements.
www.arbitragefunds.com | 1-800-295-4485
24
The Arbitrage Event-Driven Fund Portfolio of Investments (continued)
| | | Shares | | Value | |
COMMON STOCKS - 75.17% (Continued) | |
Semiconductors - 3.55% | |
Mellanox Technologies Ltd.(a)(b)(c) | | | 40,287 | | | $ | 4,422,707 | | |
Software - 14.34% | |
Amber Road, Inc.(a) | | | 53,301 | | | | 691,847 | | |
Avaya Holdings Corp.(a)(c) | | | 34,678 | | | | 436,249 | | |
First Data Corp., Class A(a)(b) | | | 276,425 | | | | 7,026,723 | | |
Fiserv, Inc.(a)(b) | | | 1,624 | | | | 139,437 | | |
MINDBODY, Inc., Class A(a)(f) | | | 48,463 | | | | 1,768,900 | | |
Red Hat, Inc.(a)(b)(c) | | | 42,464 | | | | 7,826,115 | | |
| | | | 17,889,271 | | |
Telecommunications - 2.83% | |
DNA Oyj | | | 19,854 | | | | 464,447 | | |
Inmarsat Plc | | | 163,655 | | | | 1,130,092 | | |
LogMeIn, Inc.(b)(c) | | | 17,775 | | | | 1,276,778 | | |
Quantenna Communications, Inc.(a) | | | 27,291 | | | | 662,080 | | |
| | | | 3,533,397 | | |
Transportation - 0.25% | |
Norfolk Southern Corp.(b) | | | 1,600 | | | | 312,224 | | |
TOTAL COMMON STOCKS
(Cost $93,749,977) | | | 93,761,167 | | |
RIGHTS - 0.00% | |
Cubist Pharmaceuticals, Inc. CPR, Expires 07/01/2019(a)(f) | | | 34,500 | | | | — | | |
TOTAL RIGHTS
(Cost $0) | | | — | | |
| | | Maturity
Date | | Rate | | Principal
Amount | | Value | |
CORPORATE BONDS - 22.06% | |
Chemicals - 3.26% | |
Momentive Performance
Materials, Inc. | | 10/24/2021 | | | 3.880 | % | | $ | 3,606,000 | | | $ | 4,063,962 | | |
Commercial Services - 3.88% | |
Nielsen Co. Luxembourg SARL
(The)(d) | | 10/01/2021 | | | 5.500 | % | | | 2,326,000 | | | | 2,320,185 | | |
Rent-A-Center, Inc. | | 11/15/2020 | | | 6.625 | % | | | 2,529,000 | | | | 2,516,355 | | |
| | | | | | | | | | 4,836,540 | | |
Diversified Financial Services - 0.25% | |
Vantiv LLC / Vantiv Issuer Corp.(b)(d) | | 11/15/2025 | | | 4.375 | % | | | 297,000 | | | | 306,338 | | |
See Notes to Financial Statements.
Annual Report | May 31, 2019
25
The Arbitrage Event-Driven Fund Portfolio of Investments (continued)
| | | Maturity
Date | | Rate | | Principal
Amount | | Value | |
CORPORATE BONDS - 22.06% (Continued) | |
Household Products - 0.74% | |
Avon International Operations,
Inc.(d) | | 08/15/2022 | | | 7.875 | % | | $ | 892,000 | | | $ | 926,565 | | |
Internet - 1.75% | |
Zayo Group LLC / Zayo Capital,
Inc.(b) | | 04/01/2023 | | | 6.000 | % | | | 1,339,000 | | | | 1,373,841 | | |
Zayo Group LLC / Zayo Capital,
Inc.(d) | | 01/15/2027 | | | 5.750 | % | | | 791,000 | | | | 812,752 | | |
| | | | | | | | | | 2,186,593 | | |
Lodging - 1.91% | |
Jack Ohio Finance LLC/Jack Ohio
Finance 1 Corp.(b)(d) | | 11/15/2021 | | | 6.750 | % | | | 2,329,000 | | | | 2,383,615 | | |
Machinery - Construction & Mining - 0.69% | |
Vertiv Group Corp.(d) | | 10/15/2024 | | | 9.250 | % | | | 872,000 | | | | 858,920 | | |
Media - 2.56% | |
Tribune Media Co.(b) | | 07/15/2022 | | | 5.875 | % | | | 3,163,000 | | | | 3,197,635 | | |
Oil & Gas - 2.16% | |
QEP Resources, Inc.(b) | | 03/01/2021 | | | 6.875 | % | | | 2,650,000 | | | | 2,689,750 | | |
Packaging & Containers - 2.49% | |
Multi-Color Corp.(d) | |
| | | 12/01/2022 | | | 6.125 | % | | | 2,175,000 | | | | 2,234,812 | | |
| | | 11/01/2025 | | | 4.875 | % | | | 841,000 | | | | 874,640 | | |
| | | | | | | | | | 3,109,452 | | |
Retail - 1.10% | |
GameStop Corp.(d) | | 03/15/2021 | | | 6.750 | % | | | 1,365,000 | | | | 1,368,413 | | |
Software - 1.27% | |
First Data Corp.(b)(d) | |
| | | 01/15/2024 | | | 5.000 | % | | | 695,000 | | | | 709,752 | | |
| | | 01/15/2024 | | | 5.750 | % | | | 857,000 | | | | 876,925 | | |
| | | | | | | | | | 1,586,677 | | |
Telecommunications - 0.00% | |
Avaya, Inc.(d)(f)(g) | | 04/01/2019 | | | 7.000 | % | | | 6,579,000 | | | | — | | |
Avaya, Inc.(d)(f)(g) | | 03/01/2021 | | | 10.500 | % | | | 1,583,000 | | | | — | | |
| | | | | | | | | | — | | |
TOTAL CORPORATE BONDS
(Cost $27,545,162) | | | 27,514,460 | | |
See Notes to Financial Statements.
www.arbitragefunds.com | 1-800-295-4485
26
The Arbitrage Event-Driven Fund Portfolio of Investments (continued)
| | | Maturity
Date | | Rate | | Principal
Amount | | Value | |
CONVERTIBLE CORPORATE BONDS - 2.18% | |
Aerospace & Defense - 2.18% | |
Arconic, Inc.(b) | | 10/15/2019 | | | 1.625 | % | | $ | 2,736,000 | | | $ | 2,722,320 | | |
TOTAL CONVERTIBLE CORPORATE BONDS
(Cost $2,754,701) | | | 2,722,320 | | |
| | | | | | | Shares | | Value | |
WARRANTS - 0.01% | |
Telecommunications - 0.01% | |
Avaya Holdings Corp., Exercise
Price $25.55, Expires 12/15/2022(a)(g) | | | | | | | 5,548 | | | $ | 8,322 | | |
TOTAL WARRANTS
(Cost $0) | | | 8,322 | | |
| | | Expiration
Date | | Exercise
Price | | Notional
Amount | | Contracts | | Value | |
PURCHASED OPTIONS(a) - 0.61% | |
Call Options Purchased - 0.12% | |
BB&T Corp. | |
| | | 06/2019 | | $ | 50.00 | | | $ | 336,600 | | | | 72 | | | $ | 900 | | |
| | | 09/2019 | | | 57.50 | | | | 1,444,575 | | | | 309 | | | | 3,708 | | |
Centene Corp. | |
| | | 06/2019 | | | 57.50 | | | | 144,375 | | | | 25 | | | | 7,500 | | |
| | | 06/2019 | | | 60.00 | | | | 629,475 | | | | 109 | | | | 22,072 | | |
Chemical Financial
Corp. | | 06/2019 | | | 55.00 | | | | 787,488 | | | | 208 | | | | 520 | | |
DXC Technology Co. | | 09/2019 | | | 55.00 | | | | 637,036 | | | | 134 | | | | 14,070 | | |
Fidelity National
Information
Services, Inc. | | 07/2019 | | | 135.00 | | | | 469,170 | | | | 39 | | | | 1,853 | | |
Multi-Color Corp. | | 07/2019 | | | 50.00 | | | | 59,688 | | | | 12 | | | | 90 | | |
Occidental Petroleum
Corp. | | 08/2019 | | | 55.00 | | | | 1,811,628 | | | | 364 | | | | 40,950 | | |
QEP Resources, Inc. | | 07/2019 | | | 9.00 | | | | 111,942 | | | | 162 | | | | 1,215 | | |
Rent-A-Center, Inc. | | 06/2019 | | | 20.00 | | | | 291,092 | | | | 122 | | | | 47,580 | | |
WellCare Health
Plans, Inc. | |
| | | 06/2019 | | | 290.00 | | | | 331,428 | | | | 12 | | | | 4,440 | | |
| | | 06/2019 | | | 300.00 | | | | 524,761 | | | | 19 | | | | 3,325 | | |
| | | 06/2019 | | | 310.00 | | | | 828,570 | | | | 30 | | | | 1,725 | | |
TOTAL CALL OPTIONS PURCHASED
(Cost $214,617) | | | 149,948 | | |
See Notes to Financial Statements.
Annual Report | May 31, 2019
27
The Arbitrage Event-Driven Fund Portfolio of Investments (continued)
| | | Expiration
Date | | Exercise
Price | | Notional
Amount | | Contracts | | Value | |
PURCHASED OPTIONS(a) - 0.61% (Continued) | |
Put Options Purchased - 0.49% | |
Anadarko Petroleum
Corp. | | 08/2019 | | $ | 65.00 | | | $ | 8,549,955 | | | | 1,215 | | | $ | 182,250 | | |
Avaya Holdings Corp. | |
| | | 07/2019 | | | 10.00 | | | | 45,288 | | | | 36 | | | | 1,260 | | |
| | | 08/2019 | | | 10.00 | | | | 178,636 | | | | 142 | | | | 8,094 | | |
| | | 08/2019 | | | 12.50 | | | | 347,208 | | | | 276 | | | | 40,710 | | |
Fox Corp. | | 07/2019 | | | 37.00 | | | | 753,922 | | | | 214 | | | | 50,825 | | |
Herc Holdings, Inc. | |
| | | 06/2019 | | | 30.00 | | | | 142,926 | | | | 42 | | | | 1,785 | | |
| | | 06/2019 | | | 35.00 | | | | 108,896 | | | | 32 | | | | 7,040 | | |
Johnson Controls
International Plc | | 06/2019 | | | 45.00 | | | | 462,240 | | | | 120 | | | | 78,720 | | |
LiveRamp
Holdings, Inc. | | 08/2019 | | | 50.00 | | | | 575,456 | | | | 112 | | | | 36,400 | | |
LogMeIn, Inc. | | 06/2019 | | | 75.00 | | | | 639,287 | | | | 89 | | | | 35,155 | | |
Luxoft Holding, Inc. | | 07/2019 | | | 45.00 | | | | 2,711,547 | | | | 471 | | | | 15,307 | | |
Mellanox
Technologies, Ltd. | |
| | | 12/2019 | | | 90.00 | | | | 1,394,206 | | | | 127 | | | | 34,290 | | |
| | | 12/2019 | | | 105.00 | | | | 1,152,690 | | | | 105 | | | | 50,925 | | |
Perspecta, Inc. | | 06/2019 | | | 20.00 | | | | 403,806 | | | | 186 | | | | 6,975 | | |
Red Hat, Inc. | |
| | | 09/2019 | | | 165.00 | | | | 368,600 | | | | 20 | | | | 2,400 | | |
| | | 01/2020 | | | 170.00 | | | | 165,870 | | | | 9 | | | | 2,115 | | |
Rent-A-Center Inc. | | 06/2019 | | | 23.00 | | | | 858,960 | | | | 360 | | | | 26,100 | | |
Versum Materials,
Inc. | | 06/2019 | | | 40.00 | | | | 323,505 | | | | 63 | | | | 158 | | |
WellCare Health
Plans, Inc. | | 09/2019 | | | 250.00 | | | | 1,104,760 | | | | 40 | | | | 28,200 | | |
Wyndham Hotels &
Resorts, Inc. | | 06/2019 | | | 50.00 | | | | 352,044 | | | | 66 | | | | 2,310 | | |
Zayo Group
Holdings, Inc. | | 06/2019 | | | 25.00 | | | | 284,490 | | | | 87 | | | | 218 | | |
TOTAL PUT OPTIONS PURCHASED
(Cost $565,920) | | | 611,237 | | |
TOTAL PURCHASED OPTIONS
(Cost $780,537) | | | 761,185 | | |
See Notes to Financial Statements.
www.arbitragefunds.com | 1-800-295-4485
28
The Arbitrage Event-Driven Fund Portfolio of Investments (continued)
| | | Yield | | Shares | | Value | |
SHORT-TERM INVESTMENTS - 4.44% | |
Money Market Funds | |
Morgan Stanley Institutional Liquidity
Fund - Government Portfolio,
Institutional Class | | | 2.326 | %(h) | | | 2,751,827 | | | $ | 2,751,827 | | |
State Street Institutional U.S. Government
Money Market Fund, Premier Class | | | 2.338 | %(h) | | | 2,751,827 | | | | 2,751,827 | | |
State Street Institutional U.S. Government
Money Market Fund, Premier Class(i) | | | 2.338 | %(h) | | | 29,924 | | | | 29,924 | | |
| | | | | | | | 5,533,578 | | |
TOTAL SHORT-TERM INVESTMENTS
(Cost $5,533,578) | | | 5,533,578 | | |
Total Investments - 104.47%
(Cost $130,363,955) | | | 130,301,032 | | |
Liabilities in Excess of Other Assets - (4.47)%(j) | | | (5,574,590 | ) | |
NET ASSETS - 100.00% | | $ | 124,726,442 | | |
Portfolio Footnotes
(a) Non-income-producing security.
(b) Security, or a portion of security, is being held as collateral for short sales, swap contracts, written option contracts or forward foreign currency exchange contracts. At May 31, 2019, the aggregate fair market value of those securities was $61,950,455, representing 49.67% of net assets.
(c) Underlying security for a written/purchased call/put option.
(d) Security exempt from registration under Rule 144A of the Securities Act of 1933. These securities may be resold in transactions exempt from registration, normally to qualified institutional buyers. As of May 31, 2019, these securities had a total value of $14,516,248 or 11.64% of net assets.
(e) All or a portion of this security is out on loan.
(f) Security fair valued using significant unobservable inputs and classified as a Level 3 security. As of May 31, 2019, the total fair market value of these securities was $1,768,900, representing 1.42% of net assets.
(g) Security in default on interest payments.
(h) Rate shown is the 7-day effective yield as of May 31, 2019.
(i) Represents an investment of securities lending cash collateral.
(j) Includes cash held as collateral for short sales and written option contracts.
See Notes to Financial Statements.
Annual Report | May 31, 2019
29
The Arbitrage Event-Driven Fund Portfolio of Investments (continued)
SCHEDULE OF SECURITIES SOLD SHORT | | Shares | | Value | |
COMMON STOCKS - (26.50%) | |
Aerospace & Defense - (5.61%) | |
Harris Corp. | | | (37,395 | ) | | $ | (6,999,970 | ) | |
Chemicals - (0.78%) | |
Dow, Inc. | | | (3,426 | ) | | | (160,200 | ) | |
Linde Plc | | | (4,524 | ) | | | (816,808 | ) | |
| | | | (977,008 | ) | |
Commercial Services - (1.17%) | |
Booz Allen Hamilton Holding Corp., Class A | | | (2,458 | ) | | | (155,272 | ) | |
Global Payments, Inc. | | | (4,208 | ) | | | (648,200 | ) | |
Nielsen Holdings Plc | | | (5,502 | ) | | | (125,061 | ) | |
Rent-A-Center, Inc. | | | (9,896 | ) | | | (236,119 | ) | |
United Rentals, Inc. | | | (2,624 | ) | | | (288,902 | ) | |
| | | | (1,453,554 | ) | |
Computers & Computer Services - (1.11%) | |
CACI International, Inc., Class A | | | (764 | ) | | | (155,489 | ) | |
Leidos Holdings, Inc. | | | (2,088 | ) | | | (157,289 | ) | |
Luxoft Holding, Inc., Class A | | | (18,559 | ) | | | (1,068,442 | ) | |
| | | | (1,381,220 | ) | |
Gas - (1.90%) | |
UGI Corp. | | | (45,893 | ) | | | (2,368,538 | ) | |
Healthcare - Services - (0.44%) | |
Centene Corp. | | | (9,583 | ) | | | (553,418 | ) | |
Lodging - (0.31%) | |
Choice Hotels International, Inc. | | | (1,527 | ) | | | (125,657 | ) | |
Hilton Worldwide Holdings, Inc. | | | (1,586 | ) | | | (141,852 | ) | |
Marriott International, Inc., Class A | | | (925 | ) | | | (115,477 | ) | |
| | | | (382,986 | ) | |
Oil & Gas - (1.54%) | |
Occidental Petroleum Corp. | | | (36,440 | ) | | | (1,813,619 | ) | |
QEP Resources, Inc. | | | (15,706 | ) | | | (108,528 | ) | |
| | | | (1,922,147 | ) | |
Packaging & Containers - (0.12%) | |
Multi-Color Corp. | | | (2,966 | ) | | | (147,529 | ) | |
Pharmaceuticals - (3.27%) | |
Bristol-Myers Squibb Co. | | | (89,750 | ) | | | (4,071,957 | ) | |
Real Estate - (0.32%) | |
Jones Lang LaSalle, Inc. | | | (3,239 | ) | | | (403,094 | ) | |
See Notes to Financial Statements.
www.arbitragefunds.com | 1-800-295-4485
30
The Arbitrage Event-Driven Fund Portfolio of Investments (continued)
SCHEDULE OF SECURITIES SOLD SHORT | | Shares | | Value | |
COMMON STOCKS - (26.50%) (Continued) | |
Real Estate Investment Trusts - (2.67%) | |
Cousins Properties, Inc. | | | (324,428 | ) | | $ | (2,936,074 | ) | |
Park Hotels & Resorts, Inc. | | | (14,373 | ) | | | (396,982 | ) | |
| | | | (3,333,056 | ) | |
Retail - (0.32%) | |
GameStop Corp., Class A | | | (8,600 | ) | | | (65,188 | ) | |
Home Depot, Inc. (The) | | | (1,786 | ) | | | (339,072 | ) | |
| | | | (404,260 | ) | |
Software - (6.38%) | |
Fidelity National Information Services, Inc. | | | (5,184 | ) | | | (623,635 | ) | |
First Data Corp., Class A | | | (5,357 | ) | | | (136,175 | ) | |
Fiserv, Inc. | | | (83,779 | ) | | | (7,193,265 | ) | |
| | | | (7,953,075 | ) | |
Telecommunications - (0.15%) | |
Zayo Group Holdings, Inc. | | | (5,720 | ) | | | (187,044 | ) | |
Transportation - (0.29%) | |
CSX Corp. | | | (4,773 | ) | | | (355,445 | ) | |
Trucking & Leasing - (0.12%) | |
GATX Corp. | | | (1,963 | ) | | | (137,057 | ) | |
Greenbrier Cos., Inc. (The) | | | (665 | ) | | | (18,094 | ) | |
| | | | (155,151 | ) | |
TOTAL COMMON STOCKS
(Proceeds $33,348,924) | | | (33,049,452 | ) | |
EXCHANGE-TRADED FUNDS - (1.70%) | |
Equity Funds - (1.70%) | |
Invesco QQQ Trust Series 1 | | | (8,318 | ) | | | (1,446,916 | ) | |
Technology Select Sector SPDR® Fund | | | (9,356 | ) | | | (672,603 | ) | |
| | | | (2,119,519 | ) | |
TOTAL EXCHANGE-TRADED FUNDS
(Proceeds $2,084,485) | | | (2,119,519 | ) | |
MUTUAL FUNDS - (0.33%) | |
Altaba, Inc. | | | (6,862 | ) | | | (406,231 | ) | |
TOTAL MUTUAL FUNDS
(Proceeds $510,696) | | | (406,231 | ) | |
See Notes to Financial Statements.
Annual Report | May 31, 2019
31
The Arbitrage Event-Driven Fund Portfolio of Investments (continued)
SCHEDULE OF SECURITIES SOLD SHORT | | Shares | | Value | |
RIGHTS - (0.02%) | |
Biotechnology - (0.02%) | |
Celgene Corp. CVR | | | (11,836 | ) | | $ | (28,407 | ) | |
TOTAL RIGHTS
(Proceeds $25,092) | | | (28,407 | ) | |
TOTAL SECURITIES SOLD SHORT
(Proceeds $35,969,196) | | $ | (35,603,608 | ) | |
WRITTEN OPTIONS | | Expiration
Date | | Exercise
Price | | Notional
Amount | | Contracts | | Value | |
Written Call Options | |
Avaya Holdings Corp. | | 08/2019 | | $ | 17.50 | | | $ | (178,636 | ) | | | (142 | ) | | $ | (5,680 | ) | |
DXC Technology Co. | | 09/2019 | | | 65.00 | | | | (637,036 | ) | | | (134 | ) | | | (2,680 | ) | |
Johnson Controls
International Plc | | 06/2019 | | | 45.00 | | | | (462,240 | ) | | | (120 | ) | | | (720 | ) | |
TOTAL WRITTEN CALL OPTIONS
(Premiums received $12,879) | | | (9,080 | ) | |
Written Put Options | |
Rent-A-Center, Inc. | |
| | | 06/2019 | | | 15.00 | | | | (26,246 | ) | | | (11 | ) | | | (27 | ) | |
| | | 06/2019 | | | 16.00 | | | | (26,246 | ) | | | (11 | ) | | | (28 | ) | |
| | | 06/2019 | | | 17.00 | | | | (56,485 | ) | | | (11 | ) | | | (55 | ) | |
WellCare Health
Plans, Inc. | | 09/2019 | | | 220.00 | | | | (1,104,760 | ) | | | (40 | ) | | | (10,800 | ) | |
TOTAL WRITTEN PUT OPTIONS
(Premiums received $12,067) | | | (10,910 | ) | |
TOTAL WRITTEN OPTIONS
(Premiums received $24,946) | | $ | (19,990 | ) | |
EQUITY SWAP CONTRACTS
Swap
Counterparty/
Payment
Frequency | | Reference
Obligation | | Rate
Paid/
Received
by the
Fund | | Termination
Date | | Upfront
Payments
Paid | | Upfront
Payments
Received | | Market
Value | | Notional
Amount | | Unrealized
Appreciation | |
Morgan
Stanley &
Co./
Monthly
| | Air Liquide
SA
| | Paid
1 Month-
EUR
LIBOR
plus
50 bps
(0.089%) | |
10/14/2019 | | $ | — | | | $ | — | | | $ | — | | | $ | (319,336 | ) | | $ | — | | |
See Notes to Financial Statements.
www.arbitragefunds.com | 1-800-295-4485
32
The Arbitrage Event-Driven Fund Portfolio of Investments (continued)
OUTSTANDING FORWARD FOREIGN CURRENCY EXCHANGE CONTRACTS
Currency
Purchased | | Currency Sold | | Counterparty | | Settlement
Date | | Unrealized
Appreciation | |
USD | 2,694,674 | | | CAD | 3,587,900 | | | Goldman Sachs & Co. | | 06/14/2019 | | $ | 39,394 | | |
EUR | 249,400 | | | USD | 278,680 | | | Goldman Sachs & Co. | | 06/14/2019 | | | 168 | | |
USD | 8,860,897 | | | EUR | 7,798,600 | | | Goldman Sachs & Co. | | 06/14/2019 | | | 141,452 | | |
USD | 1,856,125 | | | GBP | 1,397,400 | | | Goldman Sachs & Co. | | 06/14/2019 | | | 88,569 | | |
USD | 652,836 | | | SEK | 6,029,900 | | | Goldman Sachs & Co. | | 06/14/2019 | | | 16,719 | | |
| | $ | 286,302 | | |
Currency
Purchased | | Currency Sold | | Counterparty | | Settlement
Date | | Unrealized
Depreciation | |
CAD | 3,587,900 | | | USD | 2,681,491 | | | Goldman Sachs & Co. | | 06/14/2019 | | $ | (26,211 | ) | |
EUR | 6,204,500 | | | USD | 7,001,026 | | | Goldman Sachs & Co. | | 06/14/2019 | | | (63,909 | ) | |
GBP | 416,400 | | | USD | 546,260 | | | Goldman Sachs & Co. | | 06/14/2019 | | | (19,561 | ) | |
SEK | 6,029,900 | | | USD | 637,401 | | | Goldman Sachs & Co. | | 06/14/2019 | | | (1,284 | ) | |
USD | 634,523 | | | SEK | 6,055,600 | | | Goldman Sachs & Co. | | 06/14/2019 | | | (4,305 | ) | |
| | $ | (115,270 | ) | |
The following is a summary of investments classified by country exposure:
Country | | % of Net Assets(a) | |
Israel | | | 3.55 | % | |
United Kingdom | | | 1.90 | % | |
Luxembourg | | | 1.86 | % | |
Spain | | | 0.67 | % | |
Switzerland | | | 0.53 | % | |
Finland | | | 0.37 | % | |
China | | | 0.29 | % | |
Germany | | | 0.15 | % | |
United States | | | 95.15 | % | |
Liabilities in Excess of Other Assets | | | (4.47 | )% | |
| | | | 100.00 | % | |
(a) These percentages represent long positions only and are not net of short positions.
Abbreviations:
ADR - American Depositary Receipt
AG - Aktiengesellschaft is a German term that refers to a corporation that is limited by shares, i.e., owned by shareholders.
bps - Basis Points. 100 Basis Points is equal to 1 percentage point.
CAD - Canadian dollar
CPR - Conditional Prepayment Rate
CVR - Contingent Value Rights
EUR - Euro
EUR LIBOR - London Interbank Offered Rate denominated in Euro
See Notes to Financial Statements.
Annual Report | May 31, 2019
33
The Arbitrage Event-Driven Fund Portfolio of Investments (continued)
GBP - British pound
LLC - Limited Liability Company
LP - Limited Partnership
Ltd. - Limited
N.V. - Naamloze Vennootschap is the Dutch term for a public limited liability corporation.
Oyj - Osakeyhtio is the Finnish equivalent of a public limited company.
Plc - Public Limited Company
REIT - Real Estate Investment Trust
SA - Generally designates corporations in various countries, mostly those employing civil law. This translates literally in all languages mentioned as anonymous company.
SARL - Société Anonyme à Responsabilité Limitée is the French term for limited liability company.
SAU - Sociedad Anónima Unipersonal is a Spanish term for a single shareholder company.
SEK - Swedish krona
SPDR - Standard & Poor's Depositary Receipt
USD - United States Dollar
See Notes to Financial Statements.
www.arbitragefunds.com | 1-800-295-4485
34
The Arbitrage Event-Driven Fund Portfolio of Investments (continued)
The following table summarizes The Arbitrage Event-Driven Fund's investments and derivative financial instruments categorized in the disclosure hierarchy as of May 31, 2019:
Investments in Securities at Value* | | Level 1 | | Level 2 | | Level 3 | | Total | |
Assets | |
Common Stocks | |
Aerospace & Defense | | $ | 6,966,729 | | | $ | — | | | $ | — | | | $ | 6,966,729 | | |
Auto Parts & Equipment | | | 1,831,038 | | | | — | | | | — | | | | 1,831,038 | | |
Biotechnology | | | 10,392,384 | | | | — | | | | — | | | | 10,392,384 | | |
Chemicals | | | 3,492,821 | | | | — | | | | — | | | | 3,492,821 | | |
Commercial Services | | | 3,336,348 | | | | — | | | | — | | | | 3,336,348 | | |
Computers & Computer
Services | | | 4,083,830 | | | | — | | | | — | | | | 4,083,830 | | |
Construction Materials | | | 3,071,585 | | | | — | | | | — | | | | 3,071,585 | | |
Electronics | | | 567,036 | | | | — | | | | — | | | | 567,036 | | |
Entertainment | | | 2,112,948 | | | | — | | | | — | | | | 2,112,948 | | |
Food | | | 458,896 | | | | — | | | | — | | | | 458,896 | | |
Gas | | | 3,122,103 | | | | — | | | | — | | | | 3,122,103 | | |
Healthcare - Services | | | 782,999 | | | | — | | | | — | | | | 782,999 | | |
Household Products | | | 660,677 | | | | — | | | | — | | | | 660,677 | | |
Internet | | | 359,418 | | | | — | | | | — | | | | 359,418 | | |
Lodging | | | 704,995 | | | | — | | | | — | | | | 704,995 | | |
Media | | | 4,192,306 | | | | — | | | | — | | | | 4,192,306 | | |
Metal Fabricate & Hardware | | | 3,574,911 | | | | — | | | | — | | | | 3,574,911 | | |
Miscellaneous Manufacturing | | | 201,958 | | | | — | | | | — | | | | 201,958 | | |
Oil & Gas | | | 8,739,813 | | | | — | | | | — | | | | 8,739,813 | | |
Packaging & Containers | | | 1,234,341 | | | | — | | | | — | | | | 1,234,341 | | |
Pharmaceuticals | | | 191,595 | | | | — | | | | — | | | | 191,595 | | |
Pipelines | | | 2,330,168 | | | | — | | | | — | | | | 2,330,168 | | |
Real Estate | | | 927,722 | | | | — | | | | — | | | | 927,722 | | |
Real Estate Investment Trusts | | | 3,593,838 | | | | — | | | | — | | | | 3,593,838 | | |
Retail | | | 673,109 | | | | — | | | | — | | | | 673,109 | | |
Semiconductors | | | 4,422,707 | | | | — | | | | — | | | | 4,422,707 | | |
Software | | | 16,120,371 | | | | — | | | | 1,768,900 | | | | 17,889,271 | | |
Telecommunications | | | 3,533,397 | | | | — | | | | — | | | | 3,533,397 | | |
Transportation | | | 312,224 | | | | — | | | | — | | | | 312,224 | | |
Rights | | | — | | | | — | | | | 0 | ** | | | — | | |
Corporate Bonds | |
Chemicals | | | — | | | | 4,063,962 | | | | — | | | | 4,063,962 | | |
Commercial Services | | | — | | | | 4,836,540 | | | | — | | | | 4,836,540 | | |
Diversified Financial Services | | | — | | | | 306,338 | | | | — | | | | 306,338 | | |
Household Products | | | — | | | | 926,565 | | | | — | | | | 926,565 | | |
Internet | | | — | | | | 2,186,593 | | | | — | | | | 2,186,593 | | |
Lodging | | | — | | | | 2,383,615 | | | | — | | | | 2,383,615 | | |
Machinery - Construction &
Mining | | | — | | | | 858,920 | | | | — | | | | 858,920 | | |
Media | | | — | | | | 3,197,635 | | | | — | | | | 3,197,635 | | |
Oil & Gas | | | — | | | | 2,689,750 | | | | — | | | | 2,689,750 | | |
Packaging & Containers | | | — | | | | 3,109,452 | | | | — | | | | 3,109,452 | | |
Retail | | | — | | | | 1,368,413 | | | | — | | | | 1,368,413 | | |
See Notes to Financial Statements.
Annual Report | May 31, 2019
35
The Arbitrage Event-Driven Fund Portfolio of Investments (continued)
Investments in Securities at Value* | | Level 1 | | Level 2 | | Level 3 | | Total | |
Software | | $ | — | | | $ | 1,586,677 | | | $ | — | | | $ | 1,586,677 | | |
Telecommunications | | | — | | | | — | | | | 0 | ** | | | — | | |
Convertible Corporate Bonds*** | | | — | | | | 2,722,320 | | | | — | | | | 2,722,320 | | |
Warrants | | | — | | | | 8,322 | | | | — | | | | 8,322 | | |
Purchased Options | | | 761,185 | | | | — | | | | — | | | | 761,185 | | |
Short-Term Investments | | | 5,533,578 | | | | — | | | | — | | | | 5,533,578 | | |
TOTAL | | $ | 98,287,030 | | | $ | 30,245,102 | | | $ | 1,768,900 | | | $ | 130,301,032 | | |
Other Financial Instruments**** | |
Assets | |
Forward Foreign Currency
Exchange Contracts | | $ | — | | | $ | 286,302 | | | $ | — | | | $ | 286,302 | | |
Equity Swap | | | — | | | | — | | | | — | | | | — | | |
Liabilities | |
Common Stocks*** | | | (33,049,452 | ) | | | — | | | | — | | | | (33,049,452 | ) | |
Exchange-Traded Funds | | | (2,119,519 | ) | | | — | | | | — | | | | (2,119,519 | ) | |
Mutual Funds | | | (406,230 | ) | | | — | | | | — | | | | (406,230 | ) | |
Rights | | | — | | | | (28,407 | ) | | | — | | | | (28,407 | ) | |
Written Options | | | (19,990 | ) | | | — | | | | — | | | | (19,990 | ) | |
Forward Foreign Currency
Exchange Contracts | | | — | | | | (115,270 | ) | | | — | | | | (115,270 | ) | |
TOTAL | | $ | (35,595,191 | ) | | $ | 142,625 | | | $ | — | | | $ | (35,452,566 | ) | |
* Refer to footnote 2 of the Notes to Financial Statements where leveling hierarchy is defined.
** Includes securities valued at $0 using unobservable inputs.
*** Refer to Portfolio of Investments for sector information.
**** Other financial instruments are instruments such as written options, securities sold short, equity swaps and forward foreign currency exchange contracts.
The following is a reconciliation of the fair valuations using significant unobservable inputs (Level 3) for the Fund's assets and liabilities during the period ended May 31, 2019:
Investments
in Securities | | Balance as of
May 31, 2018 | | Realized
Gain
(Loss) | | Change in
Unrealized
Appreciation
(Depreciation) | | Purchases | | Sales
Proceeds | | Transfers
into
Level 3 | | Transfers
out of
Level 3 | | Balance as of
May 31, 2019 | | Net change in
Unrealized
Appreciation
(Depreciation)
included in the
Statement of
Operations
attributable to
Level 3
investments
held at
May 31, 2019 | |
Corporate
Bonds | | $ | 0 | | | $ | — | | | $ | — | | | $ | — | | | $ | — | | | $ | — | | | $ | — | | | $ | 0 | | | $ | — | | |
Common
Stock | | | 3,934,158 | | | | 569,308 | | | | 58,487 | | | | 1,852,687 | | | | (4,645,740 | ) | | | — | | | | — | | | | 1,768,900 | | | | 16,994 | | |
Rights | | | 0 | | | | — | | | | — | | | | — | | | | — | | | | — | | | | — | | | | 0 | | | | — | | |
Total | | $ | 3,934,158 | | | $ | 569,308 | | | $ | 58,487 | | | $ | 1,852,687 | | | $ | (4,645,740 | ) | | $ | — | | | $ | — | | | $ | 1,768,900 | | | $ | 16,994 | | |
See Notes to Financial Statements.
www.arbitragefunds.com | 1-800-295-4485
36
The Arbitrage Event-Driven Fund Portfolio of Investments (continued)
The following table summarizes the quantitative inputs used for investments categorized as Level 3 of the fair value hierarchy as of May 31, 2019:
Investments in
Securities | | Fair Value at
May 31, 2019 | | Valuation
Technique | | Unobservable
Input | | Range of
Values | | Weighted
Average | |
Common Stocks
| | $ | 1,768,900
| | | Deal Value
| | Final
determination
on Dissent | | $36.50
| | $36.50
| |
Rights
| | $ | —
| | | Discounted,
probability
adjusted value | | Discount Rate,
Probability
| | 10%, 0%
| | 0
| |
Corporate
Bonds | | $ | — | | | Fair Value | | n/a | | 0 | | 0 | |
See Notes to Financial Statements.
Annual Report | May 31, 2019
37
The Water Island Credit Opportunities Fund Manager Commentary
Water Island Credit Opportunities Fund (formerly known as Arbitrage Credit
Opportunities) | Tickers: ACFIX, ARCFX, ARCCX, AGCAX
The Fund's Goal and Main Investments
The Fund seeks to provide current income and capital growth by focusing on company-specific catalysts and events in order to generate returns that are more correlated to the outcomes and timelines of those events, rather than on overall market direction or changes in interest rates.
Investment Strategy
The Fund employs a fundamentally driven strategy combined with quantitative security analysis. The investment team screens catalyst-driven investments such as mergers, acquisitions, asset sales, spin-offs, refinancings, recapitalizations, corporate reorganizations, litigation, and regulatory changes. From this universe the team selects investments based on factors such as risk/reward profile, potential downside, and security liquidity. The team generates returns by holding outright long and short positions and by utilizing capital structure arbitrage, merger arbitrage, and convertible arbitrage techniques to exploit security mispricing or inefficiencies. This portfolio offers a pure-play credit implementation of Water Island Capital's broader event-driven style.
Fiscal Year Highlights
Water Island Credit Opportunities (ACFIX) returned 2.70% for the fiscal year ending May 31, 2019. The portfolio's returns were driven primarily from the Americas, though Europe-based catalysts detracted from performance. The Fund's top-performing sectors were materials and consumer discretionary. No sectors detracted from returns over the period, although the Fund's broad market hedges – which are designed to mitigate market risk in the portfolio and potentially lower volatility and drawdowns – did detract from returns.
The top contributor in the Fund during the period was our investment in Momentiv Performance bonds. For the past four years, creditors of Momentiv have been in litigation with the company, seeking payment of certain issues including a below-market interest rate on bonds that was set by a bankruptcy court judge in 2015. We initiated a position during 2018 with the thesis that bondholders would receive a catch-up payment for under-paid interest incurred since emergence from Chapter 11. During Q3 2018, an appeals court determined that the initial interest rates set on the bonds did not conform to the market or to generally acceptable rates upon the company's emergence from bankruptcy, leading to gains in the position.
The Fund's second-best performing investment over the period was our position in Aleris bonds. Aleris is a producer of aluminum parts for various industries. In July 2018, Hindalco Industries of India announced the acquisition of Aleris for $2.6 billion. Although we do not expect U.S. regulators to have national security issues with the acquisition, the European Union may have concerns about market concentration. A unique change-of-control clause gives investors a higher call price if the deal is extended, and we believe that the high coupon debt should make this bond a yield-to-call candidate if the deal is ultimately not approved.
The Fund's largest detractor over the period was our convertible bond investment in Qualcomm's attempted acquisition of NXP Semiconductor. During Q2 2018, NXP's merger with Qualcomm became caught directly in the ongoing trade dispute between the U.S. and China, which led to a delay in the regulatory approvals necessary for the deal to complete. While the politics made it difficult to accurately assess the deal's probability of success, we remained invested in these bonds for several reasons: 1) the convertible bonds had roughly half to one-third less volatility than the underlying equity due to their inherent structure; 2) we were at levels where the
www.arbitragefunds.com | 1-800-295-4485
38
The Water Island Credit Opportunities Fund Manager Commentary (continued)
upside/downside of the transaction is better than 2:1; and 3) we were able to use the equity as a hedge against the convertible bond thereby creating optionality for the Fund while simultaneously decreasing our downside. Chinese regulators effectively terminated the transaction when they had yet to approve the deal by the merger deadline and Qualcomm and NXP declined to extend. With no near-term catalyst in sight, we exited the position.
The second-largest detractor for the period was the portfolio's credit market hedge overlay. From time to time, in addition to various issuer-specific hedges, we may choose to implement broader market hedges in the portfolio. The intent of these hedges is to reduce directional exposure and market risk while providing the portfolio with lower volatility and drawdowns. While these hedges served their intended purpose, they nonetheless detracted from returns over the year as credit markets rallied on the whole.
The second-largest catalyst-related detractor (and third-largest detractor on the whole) for the period was our investment in Obrascon Huarte Lain bonds. Obrascon is a global construction and engineering company based in Madrid. During April, the company completed the sale of its concession business (highway tolls and airports) to IFM Investors for €2.2 billion. At that time the company had gross recourse debt of €1.5 billion and indicated plans to repay this debt to realign the capital structure and to reduce financing costs. Bondholders did not tender into a 101 mandatory asset sale offer as bonds were trading higher and closer to their call prices. We believed the 2023 bonds were an attractive short-term refinancing opportunity. After initiating our investment in April 2018, the bonds traded from approximately 102 to below par in August and September. Weakness began after the Villar Mir family sold a stake in the company which left them holding less than 50% of the shares for the first time. Also, following a company investor call early in September, we became more convinced that the company would not de-lever its balance sheet to the extent we desired. We have since exited the position.
Glossary
Par: The face value of a bond or stock, or the value at which a bond will be redeemed at maturity.
Recourse Debt: Debt that is backed by collateral from the borrower.
Annual Report | May 31, 2019
39
The Water Island Credit Opportunities Fund Portfolio Information
Performance (annualized returns as of May 31, 2019)
| | | One
Year | | Five
Year | | Since
Inception* | |
The Water Island Credit Opportunities Fund, Class R | | | 2.55 | % | | | 1.66 | % | | | 2.34 | % | |
The Water Island Credit Opportunities Fund, Class I | | | 2.70 | % | | | 1.90 | % | | | 2.56 | % | |
The Water Island Credit Opportunities Fund, Class C** | | | 1.79 | % | | | 0.92 | % | | | 1.61 | % | |
The Water Island Credit Opportunities Fund, Class A*** | | | 2.55 | % | | | 1.64 | % | | | 2.17 | % | |
Bloomberg Barclays Capital U.S. Aggregate Bond Index | | | 6.40 | % | | | 2.70 | % | | | 2.32 | % | |
ICE BofA Merrill Lynch U.S. 3-Month Treasury Bill Index | | | 2.26 | % | | | 0.83 | % | | | 0.64 | % | |
Current performance may be higher or lower than performance quoted above. Any performance data quoted represents past performance and the investment return and principal value of an investment in the Fund will fluctuate so that an investor's shares, when redeemed, may be worth more or less than their original cost. Past performance is no guarantee of future results. Returns shown above include the reinvestment of all dividends and capital gains. Performance results do not include adjustments made for financial reporting purposes in accordance with U.S. generally accepted accounting principles and may differ from the amount reported in the Financial Highlights. Contractual fee waivers are currently in effect. Without such fee waivers, performance numbers would be reduced. You can obtain performance data current to the most recent month end by calling 1-800-295-4485 or going to www.arbitragefunds.com.
* Class R, Class I and Class C inception: 10/1/12; Class A inception: 6/1/13. The Since Inception Returns for securities indices are for the inception date of Class R, Class I and Class C shares.
** Class C shares are subject to a 1.00% contingent deferred sales charge on all purchases redeemed in 12 months of purchase.
*** Class A shares are subject to a maximum front-end sales load of 3.25% of the offering price and are also subject to a 1.00% contingent deferred sales load on purchases at or above $500,000 made prior to June 30, 2018 and on purchases at or above $250,000 made after June 30, 2018 (determined on a first-in, first-out basis), purchased without a front-end sales charge and redeemed within 18 months of purchase.
The Total Annual Fund Operating Expenses for Class R, Class I, Class C and Class A are 2.24%, 1.99%, 2.99% and 2.24%, respectively. The Adviser has agreed to waive fees (not including the effects of interest, dividends on short positions, brokerage commissions, acquired fund fees and expenses, taxes, or other extraordinary expenses) in excess of 1.23%, 0.98%, 1.98% and 1.23% for Class R, Class I, Class C and Class A, respectively, until at least September 30, 2020. These expense ratios are as stated in the current prospectus and may differ from the expense ratios disclosed in the financial highlights in this report.
The Bloomberg Barclays Capital U.S. Aggregate Bond Index is a market value-weighted index of investment grade fixed-rated debt issues, including government, corporate, asset-backed and mortgage-backed securities with a maturity of one year or more.
The ICE Bank of America (BofA) Merrill Lynch U.S. 3-Month Treasury Bill Index tracks the performance of the U.S. dollar denominated U.S. Treasury Bills publicly issued in the U.S. domestic market with a remaining term to final maturity of less than 3 months.
An investor may not invest directly in an index.
www.arbitragefunds.com | 1-800-295-4485
40
The Water Island Credit Opportunities Fund Portfolio Information (continued)
Growth of $10,000 Investment
The chart represents historical performance of a hypothetical investment of $10,000 in the Class R shares of the Fund since inception. Past performance does not guarantee future results. This chart does not reflect the deduction of taxes that a shareholder would pay on Fund distributions or the redemption of Fund shares.

Sector Weighting
The following chart shows the sector weightings of The Water Island Credit Opportunities Fund investments (including short sales and excluding derivatives) as of the report date.

Annual Report | May 31, 2019
41
The Water Island Credit Opportunities Fund Portfolio of Investments
| | | Shares | | Value | |
COMMON STOCKS - 0.38% | |
Software - 0.38% | |
Fidelity National Information Services, Inc.(a) | | | 1,338 | | | $ | 160,961 | | |
Fiserv, Inc.(a)(b) | | | 723 | | | | 62,077 | | |
| | | | 223,038 | | |
TOTAL COMMON STOCKS
(Cost $205,509) | | | 223,038 | | |
| | | Maturity
Date | | Rate | | Principal
Amount | | Value | |
CORPORATE BONDS - 73.85% | |
Aerospace & Defense - 2.29% | |
Arconic, Inc.(a) | | 08/15/2020 | | | 6.150 | % | | $ | 1,298,000 | | | $ | 1,333,695 | | |
Banks - 1.60% | |
SunTrust Capital III | | 03/15/2028 | | | 3.261 | % | | | 1,000,000 | | | | 928,750 | | |
Chemicals - 9.68% | |
Momentive Performance
Materials, Inc. | | 10/24/2021 | | | 3.880 | % | | | 2,820,000 | | | | 3,178,140 | | |
Versum Materials, Inc.(a)(c) | | 09/30/2024 | | | 5.500 | % | | | 2,300,000 | | | | 2,460,310 | | |
| | | | 5,638,450 | | |
Commercial Services - 7.87% | |
Nielsen Co. Luxembourg
SARL (The)(c) | | 10/01/2021 | | | 5.500 | % | | | 1,844,000 | | | | 1,839,390 | | |
Prime Security Services
Borrower LLC / Prime
Finance, Inc.(a)(c) | | 05/15/2023 | | | 9.250 | % | | | 804,000 | | | | 842,190 | | |
Rent-A-Center, Inc. | | 11/15/2020 | | | 6.625 | % | | | 1,908,000 | | | | 1,898,460 | | |
| | | | 4,580,040 | | |
Computers & Computer Services - 1.76% | |
Dell, Inc. | | 06/15/2019 | | | 5.875 | % | | | 1,025,000 | | | | 1,026,097 | | |
Diversified Financial Services - 2.82% | |
Vantiv LLC / Vantiv Issuer
Corp.(a)(c) | | 11/15/2025 | | | 4.375 | % | | | 1,594,000 | | | | 1,644,115 | | |
Entertainment - 1.87% | |
Scientific Games
International, Inc. | | 12/01/2022 | | | 10.000 | % | | | 1,039,000 | | �� | | 1,090,244 | | |
Food - 4.75% | |
JBS USA LUX SA / JBS
USA Finance, Inc.(c) | | 06/01/2021 | | | 7.250 | % | | | 1,500,000 | | | | 1,500,000 | | |
TreeHouse Foods, Inc.(a) | | 03/15/2022 | | | 4.875 | % | | | 1,270,000 | | | | 1,266,825 | | |
| | | | 2,766,825 | | |
See Notes to Financial Statements.
www.arbitragefunds.com | 1-800-295-4485
42
The Water Island Credit Opportunities Fund Portfolio of Investments (continued)
| | | Maturity
Date | | Rate | | Principal
Amount | | Value | |
CORPORATE BONDS - 73.85% (Continued) | |
Healthcare - Products - 0.41% | |
Kinetic Concepts, Inc. / KCI
USA, Inc.(a)(c) | | 02/15/2021 | | | 7.875 | % | | $ | 231,000 | | | $ | 237,641 | | |
Household Products - 2.23% | |
Avon International
Operations, Inc.(a)(c) | | 08/15/2022 | | | 7.875 | % | | | 1,249,000 | | | | 1,297,399 | | |
Internet - 5.65% | |
EIG Investors Corp. | | 02/01/2024 | | | 10.875 | % | | | 750,000 | | | | 785,625 | | |
Zayo Group LLC / Zayo
Capital, Inc.(a) | | 04/01/2023 | | | 6.000 | % | | | 1,500,000 | | | | 1,539,030 | | |
Zayo Group LLC / Zayo
Capital, Inc.(c) | | 01/15/2027 | | | 5.750 | % | | | 941,000 | | | | 966,878 | | |
| | | | 3,291,533 | | |
Lodging - 2.85% | |
Jack Ohio Finance LLC / Jack
Ohio Finance 1 Corp.(a)(c) | | 11/15/2021 | | | 6.750 | % | | | 1,623,000 | | | | 1,661,059 | | |
Machinery - Construction & Mining - 1.81% | |
Vertiv Group Corp.(c) | | 10/15/2024 | | | 9.250 | % | | | 1,067,000 | | | | 1,050,995 | | |
Media - 2.63% | |
Tribune Media Co.(a) | | 07/15/2022 | | | 5.875 | % | | | 1,514,000 | | | | 1,530,578 | | |
Mining - 3.41% | |
Aleris International, Inc.(c) | | 07/15/2023 | | | 10.750 | % | | | 1,901,000 | | | | 1,986,545 | | |
Oil & Gas - 3.44% | |
QEP Resources, Inc.(a) | | 03/01/2021 | | | 6.875 | % | | | 1,975,000 | | | | 2,004,625 | | |
Packaging & Containers - 6.78% | |
Multi-Color Corp.(c) | |
| | | 12/01/2022 | | | 6.125 | % | | | 2,518,000 | | | | 2,587,245 | | |
| | | 11/01/2025 | | | 4.875 | % | | | 1,305,000 | | | | 1,357,200 | | |
| | | | 3,944,445 | | |
Retail - 1.92% | |
GameStop Corp.(c) | | 03/15/2021 | | | 6.750 | % | | | 1,114,000 | | | | 1,116,785 | | |
Software - 6.55% | |
First Data Corp.(a)(c) | |
| | | 01/15/2024 | | | 5.000 | % | | | 264,000 | | | | 269,603 | | |
| | | 01/15/2024 | | | 5.750 | % | | | 1,395,000 | | | | 1,427,434 | | |
TIBCO Software, Inc.(c) | | 12/01/2021 | | | 11.375 | % | | | 2,000,000 | | | | 2,115,000 | | |
| | | | 3,812,037 | | |
See Notes to Financial Statements.
Annual Report | May 31, 2019
43
The Water Island Credit Opportunities Fund Portfolio of Investments (continued)
| | | Maturity
Date | | Rate | | Principal
Amount | | Value | |
CORPORATE BONDS - 73.85% (Continued) | |
Telecommunications - 3.53% | |
Avaya, Inc.(c)(d)(e) | | 04/01/2019 | | | 7.000 | % | | $ | 3,809,000 | | | $ | 0 | | |
Avaya, Inc.(c)(d)(e) | | 03/01/2021 | | | 10.500 | % | | | 986,000 | | | | 0 | | |
Inmarsat Finance Plc(c) | |
| | | 05/15/2022 | | | 4.875 | % | | | 1,000,000 | | | | 1,005,700 | | |
| | | 10/01/2024 | | | 6.500 | % | | | 1,000,000 | | | | 1,051,250 | | |
| | | | 2,056,950 | | |
TOTAL CORPORATE BONDS
(Cost $42,974,539) | | | 42,998,808 | | |
CONVERTIBLE CORPORATE BONDS - 11.42% | |
Aerospace & Defense - 3.71% | |
Arconic, Inc.(a) | | 10/15/2019 | | | 1.625 | % | | | 2,172,000 | | | | 2,161,140 | | |
Pharmaceuticals - 1.14% | |
Paratek Pharmaceuticals, Inc. | | 05/01/2024 | | | 4.750 | % | | | 985,000 | | | | 666,106 | | |
Semiconductors - 6.57% | |
NXP Semiconductors N.V. | | 12/01/2019 | | | 1.000 | % | | | 1,500,000 | | | | 1,535,625 | | |
Rovi Corp.(a) | | 03/01/2020 | | | 0.500 | % | | | 1,000,000 | | | | 968,800 | | |
Synaptics, Inc.(a) | | 06/15/2022 | | | 0.500 | % | | | 1,500,000 | | | | 1,318,927 | | |
| | | | 3,823,352 | | |
TOTAL CONVERTIBLE CORPORATE BONDS
(Cost $7,044,564) | | | 6,650,598 | | |
| | | Shares | | Value | |
WARRANTS - 0.01% | |
Telecommunications - 0.01% | |
Avaya Holdings Corp., Exercise
Price $25.55, Expires 12/15/2022(b)(d) | | | 3,017 | | | $ | 4,526 | | |
TOTAL WARRANTS
(Cost $0) | | | | | 4,526 | | |
| | | Expiration
Date | | Exercise
Price | | Notional
Amount | | Contracts | | Value | |
PURCHASED OPTIONS(b) - 0.06% | |
Call Options Purchased - 0.06% | |
Multi-Color Corp. | | 07/2019 | | $ | 50.00 | | | $ | 134,298 | | | | 27 | | | $ | 202 | | |
QEP Resources, Inc. | | 07/2019 | | | 9.00 | | | | 73,246 | | | | 106 | | | | 795 | | |
See Notes to Financial Statements.
www.arbitragefunds.com | 1-800-295-4485
44
The Water Island Credit Opportunities Fund Portfolio of Investments (continued)
| | | Expiration
Date | | Exercise
Price | | Notional
Amount | | Contracts | | Value | |
PURCHASED OPTIONS(b) - 0.06% (Continued) | |
Call Options Purchased - 0.06% (Continued) | |
Rent-A-Center, Inc. | | 06/2019 | | $ | 20.00 | | | $ | 200,424 | | | | 84 | | | $ | 32,760 | | |
TOTAL CALL OPTIONS PURCHASED
(Cost $14,682) | | | | | | | | | | | 33,757 | | |
TOTAL PURCHASED OPTIONS
(Cost $14,682) | | | | | | | | | | | 33,757 | | |
| | | Yield | | Shares | | Value | |
SHORT-TERM INVESTMENTS - 15.40% | |
Money Market Funds | |
Morgan Stanley Institutional Liquidity
Fund - Government Portfolio,
Institutional Class | | | 2.326 | %(f) | | | 4,484,478 | | | $ | 4,484,478 | | |
State Street Institutional U.S.
Government Money Market Fund,
Premier Class | | | 2.338 | %(f) | | | 4,484,478 | | | | 4,484,478 | | |
| | | | | | | | 8,968,956 | | |
TOTAL SHORT-TERM INVESTMENTS
(Cost $8,968,956) | | | 8,968,956 | | |
Total Investments - 101.12%
(Cost $59,208,250) | | | 58,879,683 | | |
Liabilities in Excess of Other Assets - (1.12)%(g) | | | (650,641 | ) | |
NET ASSETS - 100.00% | | $ | 58,229,042 | | |
Portfolio Footnotes
(a) Security, or a portion of security, is being held as collateral for short sales or written option contracts. At May 31, 2019, the aggregate fair market value of those securities was $ 21,709,795 representing 37.28% of net assets.
(b) Non-income-producing security.
(c) Security exempt from registration under Rule 144A of the Securities Act of 1933. These securities may be resold in transactions exempt from registration, normally to qualified institutional buyers. As of May 31, 2019, these securities had a total value of $26,416,739 or 45.37% of net assets.
(d) Security in default on interest payments.
(e) Security fair valued using significant unobservable inputs and classified as a Level 3 security. As of May 31, 2019, the total fair market value of these securities was $0, representing 0.0% of net assets.
(f) Rate shown is the 7-day effective yield as of May 31, 2019.
(g) Includes cash held as collateral for short sales and written option contracts.
See Notes to Financial Statements.
Annual Report | May 31, 2019
45
The Water Island Credit Opportunities Fund Portfolio of Investments (continued)
SCHEDULE OF SECURITIES SOLD SHORT | | Shares | | Value | |
COMMON STOCKS - (3.44%) | |
Commercial Services - (0.81%) | |
Nielsen Holdings Plc | | | (4,362 | ) | | $ | (99,148 | ) | |
Rent-A-Center, Inc. | | | (8,296 | ) | | | (197,942 | ) | |
Worldpay, Inc., Class A | | | (1,440 | ) | | | (175,162 | ) | |
| | | | (472,252 | ) | |
Household Products - (0.10%) | |
Avon Products, Inc. | | | (15,500 | ) | | | (58,280 | ) | |
Internet - (0.05%) | |
Endurance International Group Holdings Inc. | | | (6,000 | ) | | | (26,700 | ) | |
Media - (0.24%) | |
Tribune Media Co., Class A | | | (3,000 | ) | | | (138,900 | ) | |
Oil & Gas - (0.14%) | |
QEP Resources, Inc. | | | (11,706 | ) | | | (80,888 | ) | |
Packaging & Containers - (0.46%) | |
Multi-Color Corp. | | | (5,440 | ) | | | (270,586 | ) | |
Pharmaceuticals - (0.14%) | |
Paratek Pharmaceuticals, Inc. | | | (21,700 | ) | | | (78,771 | ) | |
Retail - (0.07%) | |
GameStop Corp., Class A | | | (5,202 | ) | | | (39,431 | ) | |
Semiconductors - (0.96%) | |
NXP Semiconductors N.V. | | | (5,100 | ) | | | (449,616 | ) | |
Synaptics, Inc. | | | (4,200 | ) | | | (111,090 | ) | |
| | | | (560,706 | ) | |
Software - (0.10%) | |
First Data Corp., Class A | | | (2,385 | ) | | | (60,627 | ) | |
Telecommunications - (0.37%) | |
Zayo Group Holdings, Inc. | | | (6,607 | ) | | | (216,049 | ) | |
TOTAL COMMON STOCKS
(Proceeds $2,225,028) | | | (2,003,190 | ) | |
EXCHANGE-TRADED FUNDS - (3.95%) | |
Debt Fund - (3.95%) | |
SPDR Bloomberg Barclays High Yield Bond ETF | | | (21,667 | ) | | | (2,299,915 | ) | |
TOTAL EXCHANGE-TRADED FUNDS
(Proceeds $2,320,891) | | | (2,299,915 | ) | |
TOTAL SECURITIES SOLD SHORT
(Proceeds $4,545,919) | | | | $ | (4,303,105 | ) | |
See Notes to Financial Statements.
www.arbitragefunds.com | 1-800-295-4485
46
The Water Island Credit Opportunities Fund Portfolio of Investments (continued)
WRITTEN OPTIONS | | Expiration
Date | | Exercise
Price | | Notional
Amount | | Contracts | | Value | |
Written Put Options | |
Rent-A-Center, Inc. | |
| | | 06/2019 | | $ | 15.00 | | | $ | (19,088 | ) | | | (8 | ) | | $ | (20 | ) | |
| | | 06/2019 | | | 16.00 | | | | (19,088 | ) | | | (8 | ) | | | (20 | ) | |
| | | 06/2019 | | | 17.00 | | | | (19,088 | ) | | | (8 | ) | | | (40 | ) | |
TOTAL WRITTEN PUT OPTIONS
(Premiums received $1,260) | | | (80 | ) | |
TOTAL WRITTEN OPTIONS
(Premiums received $1,260) | | $ | (80 | ) | |
The following is a summary of investments classified by country exposure:
Country | | % of Net Assets(a) | |
United Kingdom | | | 3.53 | % | |
Luxembourg | | | 3.16 | % | |
Netherlands | | | 2.64 | % | |
United States | | | 91.79 | % | |
Liabilities in Excess of Other Assets | | | (1.12 | )% | |
| | | | 100.00 | % | |
(a) These percentages represent long positions only and are not net of short positions.
Abbreviations:
ETF - Exchange-Traded Fund
LLC - Limited Liability Company
N.V. - Naamloze Vennootschap is the Dutch term for a public limited liability corporation.
Plc - Public Limited Company
SA - Generally designates corporations in various countries, mostly those employing civil law. This translates literally in all languages mentioned as anonymous company.
SARL - Société Anonyme à Responsabilité Limitée is the French term for limited liability company.
SPDR - Standard & Poor's Depositary Receipt
See Notes to Financial Statements.
Annual Report | May 31, 2019
47
The Water Island Credit Opportunities Fund Portfolio of Investments (continued)
The following table summarizes The Water Island Credit Opportunities Fund's investments and derivative financial instruments categorized in the disclosure hierarchy as of May 31, 2019:
Investments in Securities at Value* | | Level 1 | | Level 2 | | Level 3 | | Total | |
Assets | |
Common Stocks** | | $ | 223,038 | | | $ | — | | | $ | — | | | $ | 223,038 | | |
Corporate Bonds | |
Aerospace & Defense | | | — | | | | 1,333,695 | | | | — | | | | 1,333,695 | | |
Banks | | | — | | | | 928,750 | | | | — | | | | 928,750 | | |
Chemicals | | | — | | | | 5,638,450 | | | | — | | | | 5,638,450 | | |
Commercial Services | | | — | | | | 4,580,040 | | | | — | | | | 4,580,040 | | |
Computers & Computer Services | | | — | | | | 1,026,097 | | | | — | | | | 1,026,097 | | |
Diversified Financial Services | | | — | | | | 1,644,115 | | | | — | | | | 1,644,115 | | |
Entertainment | | | — | | | | 1,090,244 | | | | — | | | | 1,090,244 | | |
Food | | | — | | | | 2,766,825 | | | | — | | | | 2,766,825 | | |
Healthcare - Products | | | — | | | | 237,641 | | | | — | | | | 237,641 | | |
Household Products | | | — | | | | 1,297,399 | | | | — | | | | 1,297,399 | | |
Internet | | | — | | | | 3,291,533 | | | | — | | | | 3,291,533 | | |
Lodging | | | — | | | | 1,661,059 | | | | — | | | | 1,661,059 | | |
Machinery - Construction & Mining | | | — | | | | 1,050,995 | | | | — | | | | 1,050,995 | | |
Media | | | — | | | | 1,530,578 | | | | — | | | | 1,530,578 | | |
Mining | | | — | | | | 1,986,545 | | | | — | | | | 1,986,545 | | |
Oil & Gas | | | — | | | | 2,004,625 | | | | — | | | | 2,004,625 | | |
Packaging & Containers | | | — | | | | 3,944,445 | | | | — | | | | 3,944,445 | | |
Retail | | | — | | | | 1,116,785 | | | | — | | | | 1,116,785 | | |
Software | | | — | | | | 3,812,037 | | | | — | | | | 3,812,037 | | |
Telecommunications | | | — | | | | 2,056,950 | | | | 0 | *** | | | 2,056,950 | | |
Convertible Corporate Bonds** | | | — | | | | 6,650,598 | | | | — | | | | 6,650,598 | | |
Warrants** | | | — | | | | 4,526 | | | | — | | | | 4,526 | | |
Purchased Options | | | 33,757 | | | | — | | | | — | | | | 33,757 | | |
Short-Term Investments | | | 8,968,956 | | | | — | | | | — | | | | 8,968,956 | | |
TOTAL | | $ | 9,225,751 | | | $ | 49,653,932 | | | $ | 0 | | | $ | 58,879,683 | | |
Other Financial Instruments**** | |
Liabilities | |
Common Stocks** | | | (2,003,190 | ) | | | — | | | | — | | | | (2,003,190 | ) | |
Exchange-Traded Funds | | | (2,299,915 | ) | | | — | | | | — | | | | (2,299,915 | ) | |
Written Options | | | (80 | ) | | | — | | | | — | | | | (80 | ) | |
TOTAL | | $ | (4,303,185 | ) | | $ | — | | | $ | — | | | $ | (4,303,185 | ) | |
* Refer to footnote 2 of the Notes to Financial Statements where leveling hierarchy is defined.
** Refer to Portfolio of Investments for sector information.
*** Includes securities valued at $0 using unobservable inputs.
**** Other financial instruments are instruments such as written options and securities sold short.
See Notes to Financial Statements.
www.arbitragefunds.com | 1-800-295-4485
48
The Water Island Credit Opportunities Fund Portfolio of Investments (continued)
The following is a reconciliation of the fair valuations using significant unobservable inputs (Level 3) for the Fund's assets and liabilities during the period ended May 31, 2019:
Investments
in Securities | | Balance as of
May 31, 2018 | | Change in
Unrealized
Depreciation | | Purchases | | Sales
Proceeds | | Amortization
Premium/
Discount | | Transfers
into
Level 3 | | Transfers
out of
Level 3 | | Balance as of
May 31, 2019 | | Net change in
Unrealized
Depreciation
included in the
Statement of
Operations
attributable to
Level 3
investments
held at
May 31, 2019 | |
Corporate
Bonds | | $ | 0 | | | $ | — | | | $ | — | | | $ | — | | | $ | — | | | $ | — | | | $ | — | | | $ | 0 | | | $ | — | | |
Total | | $ | 0 | | | $ | — | | | $ | — | | | $ | — | | | $ | — | | | $ | — | | | $ | — | | | $ | 0 | | | $ | — | | |
See Notes to Financial Statements.
Annual Report | May 31, 2019
49
The Water Island Long/Short Fund Manager Commentary
Water Island Long/Short Fund (formerly known as Arbitrage Tactical Equity) |
Tickers: ATQIX, ATQFX, ATQCX, ATQAX
The Fund's Goal and Main Investments
The Fund seeks to achieve capital appreciation over a full market cycle with lower volatility than the broad equity market.
Investment Strategy
The Fund is a catalyst-driven long-short equity portfolio that seeks to profit from investments in securities of companies where recent events or potential future catalysts may drive the security prices higher or lower. Examples of such events and catalysts, referred to as "event-driven investment opportunities," include, but are not limited to, announcements or potential announcements of restructurings (bankruptcies, spin-offs, and asset sales), mergers and acquisitions, management change, institution of shareholder-friendly practices, regulatory changes, litigation, earnings results and outlook, and changes in industry or sector fundamentals. The investment team seeks to identify these event-driven investment opportunities and purchase or sell short such securities when the team believes the market is under or over appreciating the potential value creation opportunity from such event or catalyst.
Fiscal Year Highlights
Water Island Long/Short (ATQIX) returned -0.38% for the fiscal year ending May 31, 2019. The portfolio's returns were driven largely from the Americas, with the European region detracting from performance. Information technology and industrials were the top contributors on a sector basis. Conversely, consumer staples and real estate were the worst performing sectors.
The Fund's largest contributor to returns over the period was our investment in Avaya. Avaya is a name we know well, having followed its re-emergence from bankruptcy in December 2017 and participated in the re-rating of its re-organized equity through our debt holdings. With the Q4 2018 equity market volatility, Avaya's heavy distressed credit/hedge fund ownership caused the shares to significantly underperform. We used this year-end weakness to re-establish a long position in the stock as its free cash flow yield was wider than most any legacy information technology hardware peer. We were rewarded as the shares re-rated alongside equity markets in 2019 and exited the position at a meaningful gain before the company's fiscal Q1 2019 (calendar Q4 2018) earnings report.
Our second-best performing investment during the period was our investment in Zayo, a fiber and data center company that owns key infrastructure assets in large metropolitan areas. We initiated a position in Zayo at the end of 2018 after the company released disappointed earnings and embarked on a spin/separation plan to break up its businesses. We believed this action plan was a pre-cursor to the company selling itself and saw an opportunity to profit in multiple ways, either as a spin-off scenario or a potential full sale. In early Q1 2019, numerous press reports claimed several private equity firms had approached the company, confirming our take-private theory. The subsequent rally in Zayo shares resulted in positive returns for the Fund over the quarter. While we still believe a sale will occur, we have begun to monetize the position as the risk/reward appears less attractive following the run-up in the share price.
Conversely, the Fund's largest detractor for the period was our investment in CorePoint Lodging, a real-estate investment trust spun-off from La Quinta that now owns the hotel assets of its former parent. In May 2018, La Quinta announced its first earnings report, which disappointed investors with soft margin guidance and a lowered expectation of cash balances due to a change
www.arbitragefunds.com | 1-800-295-4485
50
The Water Island Long/Short Fund Manager Commentary (continued)
in expected tax reimbursement proceeds from its former parent (now owned by Wyndham Hotels & Resorts). We believe the business is fundamentally undervalued but recognize a turnaround will take time as management looks to restore confidence in the business and outlook. As a result of the long duration turnaround aspects to this investment, we have liquidated the position and allocated the capital to shorter duration opportunities.
The second-largest detractor for the period was our investment in Keurig Dr. Pepper. We established a short position in Keurig Dr. Pepper in early Q3 2018 after the completion of the Keurig Green Mountain and Dr. Pepper merger. Our short was premised on the belief that market expectations for synergies were overly aggressive and that management's ability to cut costs was unproven. Furthermore, we believed fundamentals would face headwinds as the company would lose rights to distribute growth brands, which played out in the loss of Fiji and Body Armor. With leverage over six times, we expected these headwinds to have a significant impact to the equity value of the company. Our error was underestimating the potential technical squeeze caused by a small public float and demand from investors bullish on the name. We have since exited the position as it reached our single name loss limit.
Annual Report | May 31, 2019
51
The Water Island Long/Short Fund Portfolio Information
Performance (annualized returns as of May 31, 2019)
| | | One
Year | | Since
Inception* | |
The Water Island Long/Short Fund, Class R | | | -0.38 | % | | | 0.42 | % | |
The Water Island Long/Short Fund, Class I | | | -0.38 | % | | | 0.42 | % | |
The Water Island Long/Short Fund, Class C** | | | -0.38 | % | | | 0.42 | % | |
The Water Island Long/Short Fund, Class A*** | | | -0.38 | % | | | 0.42 | % | |
S&P 500® Index | | | 3.78 | % | | | 8.76 | % | |
ICE BofA Merrill Lynch U.S. 3-Month Treasury Bill Index | | | 2.26 | % | | | 0.93 | % | |
Current performance may be higher or lower than performance quoted above. Any performance data quoted represents past performance and the investment return and principal value of an investment in the Fund will fluctuate so that an investor's shares, when redeemed, may be worth more or less than their original cost. Past performance is no guarantee of future results. Returns shown above include the reinvestment of all dividends and capital gains. Performance results do not include adjustments made for financial reporting purposes in accordance with U.S. generally accepted accounting principles and may differ from the amount reported in the Financial Highlights. Contractual fee waivers are currently in effect. Without such fee waivers, performance numbers would be reduced. You can obtain performance data current to the most recent month end by calling 1-800-295-4485 or going to www.arbitragefunds.com.
* Class R, Class I, Class C and Class A inception: 12/31/14.
** Class C shares are subject to a 1.00% contingent deferred sales charge on all purchases redeemed in 12 months of purchase.
*** Class A shares are subject to a maximum front-end sales load of 3.25% on purchases up to $500,000. The shares are also subject to a deferred sales charge of up to 1.00% on purchases of $500,000 or more purchased without a front-end sales load and redeemed within 18 months of purchase.
The Total Annual Fund Operating Expenses for Class R, Class I, Class C and Class A are 12.59%, 12.34%, 13.34% and 12.59%, respectively. The Adviser has agreed to waive fees (not including the effects of interest, dividends on short positions, brokerage commissions, acquired fund fees and expenses, taxes, or other extraordinary expenses) in excess of 1.69%, 1.44%, 2.44% and 1.69% for Class R, Class I, Class C and Class A, respectively, until at least September 30, 2019. These expense ratios are as stated in the current prospectus and may differ from the expense ratios disclosed in the financial highlights in this report.
The S&P 500® Index is an unmanaged index consisting of 500 stocks.
The ICE Bank of America (BofA) Merrill Lynch U.S. 3-Month Treasury Bill Index tracks the performance of the U.S. dollar denominated U.S. Treasury Bills publicly issued in the U.S. domestic market with a remaining term to final maturity of less than 3 months.
An investor may not invest directly in an index.
www.arbitragefunds.com | 1-800-295-4485
52
The Water Island Long/Short Fund Portfolio Information (continued)
Growth of $10,000 Investment
The chart represents historical performance of a hypothetical investment of $10,000 in the Class R shares of the Fund since inception. Past performance does not guarantee future results. This chart does not reflect the deduction of taxes that a shareholder would pay on Fund distributions or the redemption of Fund shares.
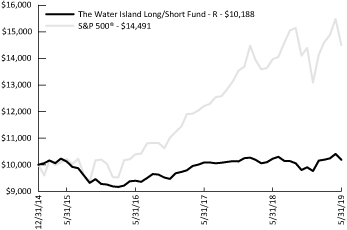
Sector Weighting
The following chart shows the sector weightings of The Water Island Long/Short Fund's investments (including short sales and excluding derivatives) as of the report date.
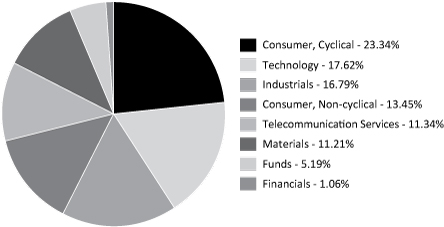
Annual Report | May 31, 2019
53
The Water Island Long/Short Fund Portfolio of Investments
| | | Shares | | Value | |
COMMON STOCKS - 44.19% | |
Auto Parts & Equipment - 3.34% | |
Altra Industrial Motion Corp.(a)(b) | | | 2,525 | | | $ | 79,209 | | |
Biotechnology - 1.29% | |
Acorda Therapeutics, Inc.(a)(b)(c) | | | 3,300 | | | | 30,657 | | |
Chemicals - 5.09% | |
Air Products & Chemicals, Inc. | | | 62 | | | | 12,623 | | |
Axalta Coating Systems Ltd.(a)(b)(c) | | | 2,300 | | | | 54,073 | | |
Celanese Corp., Class A | | | 25 | | | | 2,373 | | |
Eastman Chemical Co. | | | 32 | | | | 2,078 | | |
Element Solutions, Inc.(a)(b)(c) | | | 4,607 | | | | 43,582 | | |
Huntsman Corp.(b) | | | 112 | | | | 1,945 | | |
LyondellBasell Industries N.V., Class A | | | 57 | | | | 4,232 | | |
| | | | 120,906 | | |
Commercial Services - 2.34% | |
Herc Holdings, Inc.(a)(b)(c) | | | 1,633 | | | | 55,571 | | |
Computers & Computer Services - 2.10% | |
International Business Machines Corp.(b) | | | 18 | | | | 2,286 | | |
Perspecta, Inc.(a)(b) | | | 2,196 | | | | 47,675 | | |
| | | | 49,961 | | |
Construction Materials - 5.36% | |
Johnson Controls International Plc(a) | | | 3,303 | | | | 127,232 | | |
Internet - 1.64% | |
Alibaba Group Holding Ltd., Sponsored ADR(b)(c) | | | 261 | | | | 38,957 | | |
Lodging - 3.39% | |
Wyndham Hotels & Resorts, Inc.(a)(b) | | | 1,508 | | | | 80,437 | | |
Media - 2.69% | |
Kabel Deutschland Holding AG(b) | | | 133 | | | | 15,898 | | |
Tribune Publishing Co.(b)(c) | | | 4,884 | | | | 47,961 | | |
| | | | 63,859 | | |
Miscellaneous Manufacturing - 1.71% | |
Ingersoll-Rand Plc(b) | | | 230 | | | | 27,218 | | |
Trinity Industries, Inc.(b) | | | 689 | | | | 13,284 | | |
| | | | 40,502 | | |
Pharmaceuticals - 2.16% | |
McKesson Europe AG(b) | | | 1,526 | | | | 45,688 | | |
Paratek Pharmaceuticals, Inc.(b)(c) | | | 1,575 | | | | 5,717 | | |
| | | | 51,405 | | |
See Notes to Financial Statements.
www.arbitragefunds.com | 1-800-295-4485
54
The Water Island Long/Short Fund Portfolio of Investments (continued)
| | | Shares | | Value | |
COMMON STOCKS - 44.19% (Continued) | |
Retail - 4.60% | |
Jack in the Box, Inc.(a)(b) | | | 397 | | | $ | 33,030 | | |
Lowe's Cos., Inc.(b) | | | 550 | | | | 51,304 | | |
Red Robin Gourmet Burgers, Inc.(a)(b)(c) | | | 970 | | | | 24,813 | | |
| | | | 109,147 | | |
Software - 5.22% | |
Avaya Holdings Corp.(a)(b)(c) | | | 3,844 | | | | 48,357 | | |
LiveRamp Holdings, Inc.(a)(b)(c) | | | 1,283 | | | | 65,921 | | |
Oracle Corp.(b) | | | 58 | | | | 2,935 | | |
Pivotal Software, Inc., Class A(c) | | | 14 | | | | 279 | | |
SecureWorks Corp., Class A(c) | | | 7 | | | | 102 | | |
VMware, Inc., Class A(b) | | | 36 | | | | 6,371 | | |
| | | | 123,965 | | |
Telecommunications - 2.87% | |
LogMeIn, Inc.(a)(b) | | | 950 | | | | 68,238 | | |
Transportation - 0.39% | |
Norfolk Southern Corp. | | | 47 | | | | 9,172 | | |
TOTAL COMMON STOCKS
(Cost $1,082,501) | | | 1,049,218 | | |
| | | Maturity
Date | | Rate | | Principal
Amount | | Value | |
CONVERTIBLE CORPORATE BONDS - 0.43% | |
Pharmaceuticals - 0.43% | |
Paratek Pharmaceuticals, Inc.(b) | | 05/01/2024 | | | 4.750 | % | | $ | 15,000 | | | $ | 10,144 | | |
TOTAL CONVERTIBLE CORPORATE BONDS
(Cost $13,523) | | | 10,144 | | |
| | | Expiration
Date | | Exercise
Price | | Notional
Amount | | Contracts | | Value | |
PURCHASED OPTIONS(c) - 2.60% | |
Call Options Purchased - 0.07% | |
DXC Technology Co. | | 09/2019 | | $ | 55.00 | | | $ | 28,524 | | | | 6 | | | $ | 630 | | |
LiveRamp Holdings, Inc. | | 08/2019 | | | 60.00 | | | | 25,690 | | | | 5 | | | | 575 | | |
LogMeIn, Inc. | | 06/2019 | | | 90.00 | | | | 50,281 | | | | 7 | | | | 53 | | |
| | | 06/2019 | | | 12.50 | | | | 16,337 | | | | 17 | | | | 127 | | |
| | | 07/2019 | | | 12.50 | | | | 16,337 | | | | 17 | | | | 255 | | |
TOTAL CALL OPTIONS PURCHASED
(Cost $8,061) | | | | | | | | | | | 1,640 | | |
See Notes to Financial Statements.
Annual Report | May 31, 2019
55
The Water Island Long/Short Fund Portfolio of Investments (continued)
| | | Expiration
Date | | Exercise
Price | | Notional
Amount | | Contracts | | Value | |
PURCHASED OPTIONS(c) - 2.60% (Continued) | |
Put Options Purchased - 2.53% | |
Acorda Therapeutics, Inc. | | 10/2019 | | $ | 9.00 | | | $ | 30,657 | | | | 33 | | | $ | 5,775 | | |
Altra Industrial Motion Corp. | | 06/2019 | | | 32.00 | | | | 40,781 | | | | 13 | | | | 1,950 | | |
Aramark | | 06/2019 | | | 25.00 | | | | 34,790 | | | | 10 | | | | 2,400 | | |
Avaya Holdings Corp. | |
| | | 07/2019 | | | 10.00 | | | | 6,290 | | | | 5 | | | | 175 | | |
| | | 08/2019 | | | 10.00 | | | | 20,128 | | | | 16 | | | | 912 | | |
| | | 08/2019 | | | 12.50 | | | | 37,740 | | | | 30 | | | | 4,425 | | |
Axalta Coating Systems Ltd. | |
| | | 06/2019 | | | 24.00 | | | | 16,457 | | | | 7 | | | | 613 | | |
| | | 07/2019 | | | 24.00 | | | | 11,755 | | | | 5 | | | | 613 | | |
Element Solutions, Inc. | |
| | | 06/2019 | | | 10.00 | | | | 13,244 | | | | 14 | | | | 980 | | |
| | | 08/2019 | | | 10.00 | | | | 12,298 | | | | 13 | | | | 1,267 | | |
Herc Holdings, Inc. | |
| | | 06/2019 | | | 30.00 | | | | 17,015 | | | | 5 | | | | 213 | | �� |
| | | 06/2019 | | | 35.00 | | | | 10,209 | | | | 3 | | | | 660 | | |
iShares Russell 2000 ETF | |
| | | 08/2019 | | | 144.00 | | | | 43,758 | | | | 3 | | | | 1,362 | | |
| | | 08/2019 | | | 146.00 | | | | 43,758 | | | | 3 | | | | 1,608 | | |
| | | 08/2019 | | | 148.00 | | | | 43,758 | | | | 3 | | | | 1,887 | | |
| | | 11/2019 | | | 148.00 | | | | 43,758 | | | | 3 | | | | 2,533 | | |
| | | 11/2019 | | | 150.00 | | | | 43,758 | | | | 3 | | | | 2,829 | | |
| | | 11/2019 | | | 152.00 | | | | 43,758 | | | | 3 | | | | 3,148 | | |
| | | 12/2019 | | | 140.00 | | | | 364,650 | | | | 25 | | | | 15,075 | | |
Jack in the Box, Inc. | | 06/2019 | | | 70.00 | | | | 24,960 | | | | 3 | | | | 23 | | |
Johnson Controls
International Plc | | 06/2019 | | | 45.00 | | | | 19,260 | | | | 5 | | | | 3,280 | | |
LiveRamp Holdings, Inc. | | 08/2019 | | | 50.00 | | | | 46,242 | | | | 9 | | | | 2,925 | | |
LogMeIn, Inc. | | 06/2019 | | | 75.00 | | | | 43,098 | | | | 6 | | | | 2,370 | | |
Perspecta, Inc. | | 06/2019 | | | 20.00 | | | | 21,710 | | | | 10 | | | | 375 | | |
Red Robin Gourmet
Burgers, Inc. | | 09/2019 | | | 30.00 | | | | 10,232 | | | | 4 | | | | 2,300 | | |
Wyndham Hotels &
Resorts, Inc. | | 06/2019 | | | 50.00 | | | | 42,672 | | | | 8 | | | | 280 | | |
Zayo Group Holdings, Inc. | | 06/2019 | | | 25.00 | | | | 45,780 | | | | 14 | | | | 35 | | |
TOTAL PUT OPTIONS PURCHASED
(Cost $43,865) | | | | | | | | | | | 60,013 | | |
TOTAL PURCHASED OPTIONS
(Cost $51,926) | | | | | | | | | | | 61,653 | | |
See Notes to Financial Statements.
www.arbitragefunds.com | 1-800-295-4485
56
The Water Island Long/Short Fund Portfolio of Investments (continued)
| | | Yield | | Shares | | Value | |
SHORT-TERM INVESTMENTS - 58.16% | |
Money Market Funds | |
Morgan Stanley Institutional Liquidity
Fund - Government Portfolio, Institutional Class | | | 2.326 | %(d) | | | 690,446 | | | $ | 690,446 | | |
State Street Institutional U.S. Government Money
Market Fund, Premier Class | | | 2.338 | %(d) | | | 690,447 | | | | 690,447 | | |
| | | 1,380,893 | | |
TOTAL SHORT-TERM INVESTMENTS
(Cost $1,380,893) | | | 1,380,893 | | |
Total Investments - 105.38%
(Cost $2,528,843) | | | 2,501,908 | | |
Liabilities in Excess of Other Assets - (5.38)%(e) | | | (127,752 | ) | |
NET ASSETS - 100.00% | | $ | 2,374,156 | | |
Portfolio Footnotes
(a) Underlying security for a written/purchased call/put option.
(b) Security, or a portion of security, is being held as collateral for short sales, swap contracts, written option contracts or forward foreign currency exchange contracts. At May 31, 2019, the aggregate market value of those securities was $801,050, representing 33.74% of net assets.
(c) Non-income-producing security.
(d) Rate shown is the 7-day effective yield as of May 31, 2019.
(e) Includes cash held as collateral for short sales and written option contracts.
SCHEDULE OF SECURITIES SOLD SHORT | | Shares | | Value | |
COMMON STOCKS - (16.84%) | |
Biotechnology - (0.91%) | |
Corteva, Inc. | | | (800 | ) | | $ | (21,576 | ) | |
Chemicals - (2.18%) | |
Dow, Inc. | | | (238 | ) | | | (11,129 | ) | |
Linde Plc | | | (127 | ) | | | (22,930 | ) | |
PPG Industries, Inc. | | | (63 | ) | | | (6,593 | ) | |
RPM International, Inc. | | | (103 | ) | | | (5,512 | ) | |
Sherwin-Williams Co. (The) | | | (13 | ) | | | (5,453 | ) | |
| | | | (51,617 | ) | |
Commercial Services - (1.59%) | |
Booz Allen Hamilton Holding Corp., Class A | | | (140 | ) | | | (8,844 | ) | |
United Rentals, Inc. | | | (262 | ) | | | (28,846 | ) | |
| | | | (37,690 | ) | |
See Notes to Financial Statements.
Annual Report | May 31, 2019
57
The Water Island Long/Short Fund Portfolio of Investments (continued)
SCHEDULE OF SECURITIES SOLD SHORT | | Shares | | Value | |
COMMON STOCKS - (16.84%) (Continued) | |
Computers & Computer Services - (3.58%) | |
CACI International, Inc., Class A | | | (44 | ) | | $ | (8,955 | ) | |
Dell Technologies, Inc., Class C | | | (125 | ) | | | (7,444 | ) | |
Leidos Holdings, Inc. | | | (118 | ) | | | (8,889 | ) | |
Luxoft Holding, Inc., Class A | | | (1,038 | ) | | | (59,757 | ) | |
| | | | (85,045 | ) | |
Hand/Machine Tools - (0.36%) | |
Regal Beloit Corp. | | | (118 | ) | | | (8,579 | ) | |
Leisure Time - (0.87%) | |
OneSpaWorld Holdings Ltd. | | | (1,650 | ) | | | (20,641 | ) | |
Lodging - (1.84%) | |
Choice Hotels International, Inc. | | | (174 | ) | | | (14,318 | ) | |
Hilton Worldwide Holdings, Inc. | | | (181 | ) | | | (16,189 | ) | |
Marriott International, Inc., Class A | | | (106 | ) | | | (13,233 | ) | |
| | | | (43,740 | ) | |
Machinery - Diversified - (1.14%) | |
Gardner Denver Holdings, Inc. | | | (794 | ) | | | (26,972 | ) | |
Media - (0.14%) | |
Gannett Co., Inc. | | | (432 | ) | | | (3,396 | ) | |
Metal Fabricate & Hardware - (1.06%) | |
Rexnord Corp. | | | (460 | ) | | | (12,103 | ) | |
Timken Co. (The) | | | (299 | ) | | | (13,159 | ) | |
| | | | (25,262 | ) | |
Real Estate Investment Trusts - (0.69%) | |
Uniti Group, Inc. | | | (1,700 | ) | | | (16,337 | ) | |
Retail - (1.10%) | |
Home Depot, Inc. (The) | | | (137 | ) | | | (26,009 | ) | |
Software - (0.51%) | |
Micro Focus International Plc, Sponsored ADR | | | (509 | ) | | | (12,201 | ) | |
Transportation - (0.44%) | |
CSX Corp. | | | (140 | ) | | | (10,426 | ) | |
Trucking & Leasing - (0.43%) | |
GATX Corp. | | | (129 | ) | | | (9,007 | ) | |
Greenbrier Cos., Inc. (The) | | | (44 | ) | | | (1,197 | ) | |
| | | | (10,204 | ) | |
TOTAL COMMON STOCKS
(Proceeds $420,143) | | | (399,695 | ) | |
See Notes to Financial Statements.
www.arbitragefunds.com | 1-800-295-4485
58
The Water Island Long/Short Fund Portfolio of Investments (continued)
SCHEDULE OF SECURITIES SOLD SHORT | | Shares | | Value | |
EXCHANGE-TRADED FUNDS - (1.51%) | |
Equity Fund - (1.51%) | |
Technology Select Sector SPDR® Fund | | | (500 | ) | | $ | (35,945 | ) | |
TOTAL EXCHANGE-TRADED FUNDS
(Proceeds $35,370) | | | (35,945 | ) | |
MUTUAL FUNDS - (1.85%) | |
Telecommunications - (1.85%) | |
Altaba, Inc. | | | (743 | ) | | | (43,986 | ) | |
TOTAL MUTUAL FUNDS
(Cost $(55,292)) | | | (43,986 | ) | |
TOTAL SECURITIES SOLD SHORT
(Proceeds $510,805) | | $ | (479,626 | ) | |
| WRITTEN OPTIONS Expiration | | Exercise
Date | | Notional
Price | | Amount | | Contracts | | Value | |
Written Call Options | |
Avaya Holdings Corp. | | 08/2019 | | $ | 17.50 | | | $ | (20,128 | ) | | | (16 | ) | | $ | (640 | ) | |
DXC Technology Co. | | 09/2019 | | | 65.00 | | | | (28,524 | ) | | | (6 | ) | | | (120 | ) | |
Johnson Controls
International Plc | | 06/2019 | | | 45.00 | | | | (19,260 | ) | | | (5 | ) | | | (30 | ) | |
LiveRamp Holdings, Inc. | | 08/2019 | | | 70.00 | | | | (25,690 | ) | | | (5 | ) | | | (88 | ) | |
Red Robin Gourmet
Burgers, Inc. | | 06/2019 | | | 40.00 | | | | (10,232 | ) | | | (4 | ) | | | (10 | ) | |
TOTAL WRITTEN CALL OPTIONS
(Premiums received $1,896) | | | | | | | | | | | (888 | ) | |
Written Put Options | |
iShares Russell 2000 ETF | |
| | | 11/2019 | | | 138.00 | | | | (29,172 | ) | | | (2 | ) | | | (949 | ) | |
| | | 11/2019 | | | 140.00 | | | | (29,172 | ) | | | (2 | ) | | | (1,069 | ) | |
| | | 11/2019 | | | 142.00 | | | | (29,172 | ) | | | (2 | ) | | | (1,203 | ) | |
| | | 12/2019 | | | 130.00 | | | | (364,650 | ) | | | (25 | ) | | | (8,575 | ) | |
TOTAL WRITTEN PUT OPTIONS
(Premiums received $9,247) | | | | | | | | | | | (11,796 | ) | |
TOTAL WRITTEN OPTIONS
(Premiums received $11,143) | | | | | | | | | | $ | (12,684 | ) | |
See Notes to Financial Statements.
Annual Report | May 31, 2019
59
The Water Island Long/Short Fund Portfolio of Investments (continued)
EQUITY SWAP CONTRACTS
Swap
Counterparty/
Payment
Frequency | | Reference
Obligation | | Rate
Paid/
Received
by the
Fund | | Termination
Date | | Upfront
Payments
Paid | | Upfront
Payments
Received | | Market
Value | | Notional
Amount | | Unrealized
Appreciation | |
Morgan
Stanley &
Co./Monthly
| | Air Liquide
SA
| | Paid
1 Month-
EUR
LIBOR
plus
50 bps
(0.089%) | |
10/14/2019 | | $ | — | | | $ | — | | | $ | — | | | $ | (8,697 | ) | | $ | — | | |
OUTSTANDING FORWARD FOREIGN CURRENCY EXCHANGE CONTRACTS
Currency
Purchased | | Currency Sold | | Counterparty | | Settlement
Date | | Unrealized
Appreciation | |
USD | 64,706 | | | EUR | 56,880 | | | Goldman Sachs & Co. | | 06/14/2019 | | $ | 1,109 | | |
Currency
Purchased | | Currency Sold | | Counterparty | | Settlement
Date | | Unrealized
Depreciation | |
EUR | 1,750 | | | USD | 1,967 | | | Goldman Sachs & Co. | | 06/14/2019 | | $ | (9 | ) | |
The following is a summary of investments classified by country exposure:
Country | | % of Net Assets(a) | |
Germany | | | 2.59 | % | |
China | | | 1.64 | % | |
United States | | | 101.15 | % | |
Liabilities in Excess of Other Assets | | | (5.38 | )% | |
| | | | 100.00 | % | |
(a) These percentages represent long positions only and are not net of short positions.
Abbreviations:
ADR - American Depositary Receipt
AG - Aktiengesellschaft is a German term that refers to a corporation that is limited by shares, i.e., owned by shareholders.
bps - Basis Points. 100 Basis Points is equal to 1 percentage point.
ETF - Exchange-Traded Fund
EUR - Euro
EUR LIBOR - London Interbank Offered Rate denominated in Euro
Ltd. - Limited
See Notes to Financial Statements.
www.arbitragefunds.com | 1-800-295-4485
60
The Water Island Long/Short Fund Portfolio of Investments (continued)
N.V. - Naamloze Vennootschap is the Dutch term for a public limited liability corporation.
Plc - Public Limited Company
SA - Generally designates corporations in various countries, mostly those employing civil law. This translates literally in all languages mentioned as anonymous company.
SPDR - Standard & Poor's Depositary Receipt
USD - United States Dollar
The following table summarizes The Water Island Long/Short Fund's investments and derivative financial instruments categorized in the disclosure hierarchy as of May 31, 2019:
Investments in Securities at Value* | | Level 1 | | Level 2 | | Level 3 | | Total | |
Assets | |
Common Stocks** | | $ | 1,049,218 | | | $ | — | | | $ | — | | | $ | 1,049,218 | | |
Convertible Corporate Bonds** | | | — | | | | 10,144 | | | | — | | | | 10,144 | | |
Purchased Options | | | 61,653 | | | | — | | | | — | | | | 61,653 | | |
Short-Term Investments | | | 1,380,893 | | | | — | | | | — | | | | 1,380,893 | | |
TOTAL | | $ | 2,491,764 | | | $ | 10,144 | | | $ | — | | | $ | 2,501,908 | | |
Other Financial Instruments*** | |
Assets | |
Forward Foreign Currency Exchange Contracts | | $ | — | | | $ | 1,109 | | | $ | — | | | $ | 1,109 | | |
Equity Swap | | | — | | | | — | | | | — | | | | — | | |
Liabilities | |
Common Stocks** | | | (399,695 | ) | | | — | | | | — | | | | (399,695 | ) | |
Exchange-Traded Funds | | | (35,945 | ) | | | — | | | | — | | | | (35,945 | ) | |
Mutual Funds | | | (43,986 | ) | | | — | | | | — | | | | (43,986 | ) | |
Written Options | | | (12,684 | ) | | | — | | | | — | | | | (12,684 | ) | |
Forward Foreign Currency Exchange Contracts | | | — | | | | (9 | ) | | | — | | | | (9 | ) | |
TOTAL | | $ | (492,310 | ) | | $ | 1,100 | | | $ | — | | | $ | (491,210 | ) | |
* Refer to footnote 2 of the Notes to Financial Statements where leveling hierarchy is defined.
** Refer to Portfolio of Investments for sector information.
*** Other financial instruments are instruments such as written options, securities sold short, equity swaps and forward foreign currency exchange contracts.
See Notes to Financial Statements.
Annual Report | May 31, 2019
61
The Water Island Long/Short Fund Portfolio of Investments (continued)
The following is a reconciliation of the fair valuations using significant unobservable inputs (Level 3) for the Fund's assets and liabilities during the period ended May 31, 2019:
Investments
in Securities | | Balance as of
May 31, 2018 | | Realized
Gain (Loss) | | Change in
Unrealized
Appreciation | | Purchases | | Sales
Proceeds | | Transfers
into
Level 3 | | Transfers
out of
Level 3 | | Balance as of
May 31, 2019 | | Net change in
Unrealized
Appreciation
included in the
Statement of
Operations
attributable to
Level 3
investments
held at
May 31, 2019 | |
Common
Stock | | $ | 70,117 | | | $ | 10,058 | | | $ | 74 | | | $ | — | | | $ | (80,249 | ) | | $ | — | | | $ | — | | | $ | — | | | $ | — | | |
Total | | $ | 70,117 | | | $ | 10,058 | | | $ | 74 | | | $ | — | | | $ | (80,249 | ) | | $ | — | | | $ | — | | | $ | — | | | $ | — | | |
See Notes to Financial Statements.
www.arbitragefunds.com | 1-800-295-4485
62
This Page Intentionally Left Blank
| | | The Arbitrage
Fund | | The Arbitrage
Event-Driven
Fund | |
ASSETS | |
Investments: | |
At cost of unaffiliated investments | | $ | 1,706,225,300 | | | $ | 130,363,955 | | |
At cost of affiliated investments | | $ | 15,340,129 | | | $ | — | | |
At fair value of unaffiliated investments (Note 2)(a) | | $ | 1,719,751,374 | | | $ | 130,301,032 | | |
At fair value of affiliated investments (Note 2) | | $ | 15,375,997 | | | $ | — | | |
Cash | | | 2,747 | | | | 593 | | |
Cash denominated in foreign currency (Cost $117,244, $8,576, $0 and $0) | | | 117,537 | | | | 8,597 | | |
Deposits with brokers for securities sold short (Note 2) | | | 531,521,835 | | | | 34,797,435 | | |
Segregated cash for swaps (Note 2) | | | — | | | | 260,000 | | |
Receivable for investment securities sold | | | 29,457,490 | | | | 1,224,729 | | |
Receivable for capital shares sold | | | 2,164,399 | | | | 204,537 | | |
Unrealized appreciation on forward foreign currency exchange contracts (Note 8) | | | 6,201,218 | | | | 286,302 | | |
Dividends and interest receivable | | | 4,024,445 | | | | 469,115 | | |
Receivable due from Adviser (Note 5) | | | — | | | | — | | |
Prepaid expenses and other assets | | | 1,251,942 | | | | 83,147 | | |
Total Assets | | | 2,309,868,984 | | | | 167,635,487 | | |
LIABILITIES | |
Securities sold short, at value (Note 2) (proceeds $525,710,837, $35,969,196, $4,545,919 and
$510,805) | | | 534,502,682 | | | | 35,603,608 | | |
Written options, at value (Note 2) (premiums received $212,201, $24,946, $1,260 and $11,143) | | | 186,600 | | | | 19,990 | | |
Collateral for securities loaned | | | — | | | | 29,924 | | |
Payable for investment securities purchased | | | 21,985,888 | | | | 6,775,997 | | |
Unrealized depreciation on forward foreign currency exchange contracts (Note 8) | | | 1,090,635 | | | | 115,270 | | |
Payable for capital shares redeemed | | | 1,819,085 | | | | 95,975 | | |
Payable to Adviser (Note 5) | | | 1,549,681 | | | | 123,754 | | |
Dividends payable on securities sold short | | | 977,800 | | | | 36,287 | | |
Payable to Distributor (Note 5) | | | 55,352 | | | | 7,414 | | |
Payable to Administrator (Note 5) | | | 31,333 | | | | 6,043 | | |
Payable to Transfer Agent (Note 5) | | | 116,163 | | | | 30,815 | | |
Payable to Custodian | | | 51,008 | | | | 8,690 | | |
Income distribution payable | | | — | | | | — | | |
Audit and legal fees payable | | | 114,930 | | | | 23,272 | | |
Payable to Trustees | | | 22,494 | | | | 14,526 | | |
Chief Compliance Officer Fees payable (Note 5) | | | 13,212 | | | | 282 | | |
Chief Financial Officer Fees payable (Note 5) | | | 5,497 | | | | 938 | | |
Other accrued expenses and liabilities | | | 65,402 | | | | 16,260 | | |
Total Liabilities | | | 562,587,762 | | | | 42,909,045 | | |
NET ASSETS | | $ | 1,747,281,222 | | | $ | 124,726,442 | | |
NET ASSETS CONSIST OF: | |
Paid-in capital | | $ | 1,709,145,609 | | | $ | 183,563,118 | | |
Distributable earnings (Accumulated loss) | | | 38,135,613 | | | | (58,836,676 | ) | |
NET ASSETS | | $ | 1,747,281,222 | | | $ | 124,726,442 | | |
(a) Includes market value of securities on loan: | | $ | — | | | $ | 27,156 | | |
See Notes to Financial Statements.
www.arbitragefunds.com | 1-800-295-4485
64
Statement of Assets and Liabilities
| | |
The Water
Island Credit
Opportunities Fund | | The Water
Island
Long/Short
Fund | |
ASSETS | |
Investments: | |
At cost of unaffiliated investments | | $ | 59,208,250 | | | $ | 2,528,843 | | |
At cost of affiliated investments | | $ | — | | | $ | — | | |
At fair value of unaffiliated investments (Note 2)(a) | | $ | 58,879,683 | | | $ | 2,501,908 | | |
At fair value of affiliated investments (Note 2) | | $ | — | | | $ | — | | |
Cash | | | 232 | | | | — | | |
Cash denominated in foreign currency (Cost $117,244, $8,576, $0 and $0) | | | — | | | | — | | |
Deposits with brokers for securities sold short (Note 2) | | | 4,210,599 | | | | 513,432 | | |
Segregated cash for swaps (Note 2) | | | — | | | | — | | |
Receivable for investment securities sold | | | 143,254 | | | | 50,044 | | |
Receivable for capital shares sold | | | 40,014 | | | | — | | |
Unrealized appreciation on forward foreign currency exchange contracts (Note 8) | | | — | | | | 1,109 | | |
Dividends and interest receivable | | | 791,858 | | | | 3,856 | | |
Receivable due from Adviser (Note 5) | | | — | | | | 6,646 | | |
Prepaid expenses and other assets | | | 25,121 | | | | 6,538 | | |
Total Assets | | | 64,090,761 | | | | 3,083,533 | | |
LIABILITIES | |
Securities sold short, at value (Note 2) (proceeds $525,710,837, $35,969,196, $4,545,919 and
$510,805) | | | 4,303,105 | | | | 479,626 | | |
Written options, at value (Note 2) (premiums received $212,201, $24,946, $1,260 and $11,143) | | | 80 | | | | 12,684 | | |
Collateral for securities loaned | | | — | | | | — | | |
Payable for investment securities purchased | | | 1,374,132 | | | | 175,165 | | |
Unrealized depreciation on forward foreign currency exchange contracts (Note 8) | | | — | | | | 9 | | |
Payable for capital shares redeemed | | | 119,639 | | | | — | | |
Payable to Adviser (Note 5) | | | 14,131 | | | | — | | |
Dividends payable on securities sold short | | | 885 | | | | 728 | | |
Payable to Distributor (Note 5) | | | 2,102 | | | | 13 | | |
Payable to Administrator (Note 5) | | | 3,498 | | | | 2,080 | | |
Payable to Transfer Agent (Note 5) | | | 5,038 | | | | 273 | | |
Payable to Custodian | | | 2,339 | | | | 2,904 | | |
Income distribution payable | | | 2,171 | | | | — | | |
Audit and legal fees payable | | | 18,520 | | | | 15,599 | | |
Payable to Trustees | | | 14,193 | | | | 13,918 | | |
Chief Compliance Officer Fees payable (Note 5) | | | 696 | | | | 23 | | |
Chief Financial Officer Fees payable (Note 5) | | | 746 | | | | 590 | | |
Other accrued expenses and liabilities | | | 444 | | | | 5,765 | | |
Total Liabilities | | | 5,861,719 | | | | 709,377 | | |
NET ASSETS | | $ | 58,229,042 | | | $ | 2,374,156 | | |
NET ASSETS CONSIST OF: | |
Paid-in capital | | $ | 61,241,004 | | | $ | 2,407,595 | | |
Distributable earnings (Accumulated loss) | | | (3,011,962 | ) | | | (33,439 | ) | |
NET ASSETS | | $ | 58,229,042 | | | $ | 2,374,156 | | |
(a) Includes market value of securities on loan: | | $ | — | | | $ | — | | |
Annual Report | May 31, 2019
65
| | | The Arbitrage
Fund | | The Arbitrage
Event-Driven
Fund | |
PRICING OF SHARES: | |
CLASS R SHARES: | |
Net assets applicable to Class R shares | | $ | 163,349,170 | | | $ | 30,422,712 | | |
Shares of beneficial interest outstanding (unlimited number of shares authorized, no par value) | | | 12,639,819 | | | | 3,213,616 | | |
Net asset value and offering price per share | | $ | 12.92 | | | $ | 9.47 | | |
CLASS I SHARES: | |
Net assets applicable to Class I shares | | $ | 1,546,541,637 | | | $ | 92,710,404 | | |
Shares of beneficial interest outstanding (unlimited number of shares authorized, no par value) | | | 116,145,614 | | | | 9,717,503 | | |
Net asset value and offering price per share | | $ | 13.32 | | | $ | 9.54 | | |
CLASS C SHARES: | |
Net assets applicable to Class C shares | | $ | 19,049,809 | | | $ | 794,206 | | |
Shares of beneficial interest outstanding (unlimited number of shares authorized, no par value) | | | 1,543,878 | | | | 85,524 | | |
Net asset value and offering price per share(a) | | $ | 12.34 | | | $ | 9.29 | | |
CLASS A SHARES: | |
Net assets applicable to Class A shares | | $ | 18,340,606 | | | $ | 799,120 | | |
Shares of beneficial interest outstanding (unlimited number of shares authorized, no par value) | | | 1,421,688 | | | | 84,447 | | |
Net asset value and offering price per share(a) | | $ | 12.90 | | | $ | 9.46 | | |
Maximum offering price per share (NAV/(100% — maximum sales charge)) | | $ | 13.23 | | | $ | 9.78 | | |
Maximum sales charge | | | 2.50 | % | | | 3.25 | % | |
(a) Redemption price varies based on length of time held (Note 1).
(b) Per share amounts may not recalculate due to rounding of net assets and/or shares outstanding.
See Notes to Financial Statements.
www.arbitragefunds.com | 1-800-295-4485
66
Statement of Assets and Liabilities
| | |
The Water
Island Credit
Opportunities Fund | | The Water
Island
Long/Short
Fund | |
PRICING OF SHARES: | |
CLASS R SHARES: | |
Net assets applicable to Class R shares | | $ | 7,844,644 | | | $ | 10,184 | | |
Shares of beneficial interest outstanding (unlimited number of shares authorized, no par value) | | | 808,837 | | | | 1,031 | | |
Net asset value and offering price per share | | $ | 9.70 | | | $ | 9.88 | | |
CLASS I SHARES: | |
Net assets applicable to Class I shares | | $ | 49,795,396 | | | $ | 2,343,604 | | |
Shares of beneficial interest outstanding (unlimited number of shares authorized, no par value) | | | 5,158,321 | | | | 237,284 | | |
Net asset value and offering price per share | | $ | 9.65 | | | $ | 9.88 | | |
CLASS C SHARES: | |
Net assets applicable to Class C shares | | $ | 468,160 | | | $ | 10,184 | | |
Shares of beneficial interest outstanding (unlimited number of shares authorized, no par value) | | | 48,439 | | | | 1,031 | | |
Net asset value and offering price per share(a) | | $ | 9.67 | (b) | | $ | 9.88 | | |
CLASS A SHARES: | |
Net assets applicable to Class A shares | | $ | 120,842 | | | $ | 10,184 | | |
Shares of beneficial interest outstanding (unlimited number of shares authorized, no par value) | | | 12,519 | | | | 1,031 | | |
Net asset value and offering price per share(a) | | $ | 9.65 | | | $ | 9.88 | | |
Maximum offering price per share (NAV/(100% — maximum sales charge)) | | $ | 9.97 | | | $ | 10.21 | | |
Maximum sales charge | | | 3.25 | % | | | 3.25 | % | |
Annual Report | May 31, 2019
67
| | | The Arbitrage
Fund | | The Arbitrage
Event-Driven
Fund | |
INVESTMENT INCOME | |
Dividend income | | $ | 24,922,414 | | | $ | 1,512,538 | | |
Dividend income from affiliated investments | | | 263,187 | | | | — | | |
Foreign taxes withheld on dividends | | | (83,866 | ) | | | (928 | ) | |
Interest income | | | 5,504,223 | | | | 2,462,548 | | |
Total Investment Income | | | 30,605,958 | | | | 3,974,158 | | |
EXPENSES | |
Investment advisory fees (Note 5) | | | 18,523,903 | | | | 1,736,743 | | |
Distribution and service fees (Note 5) | |
Class R | | | 488,305 | | | | 95,023 | | |
Class C | | | 210,432 | | | | 9,495 | | |
Class A | | | 45,043 | | | | 2,036 | | |
Administrative fees (Note 5) | | | 376,188 | | | | 62,831 | | |
Chief Compliance Officer fees (Note 5) | | | 183,941 | | | | 12,924 | | |
Trustees' fees | | | 115,120 | | | | 79,276 | | |
Dividend expense | | | 8,064,471 | | | | 643,218 | | |
Interest rebate expense | | | 35,497 | | | | 2,997 | | |
Transfer agent fees (Note 5) | | | 1,312,216 | | | | 364,506 | | |
Custodian and bank service fees | | | 420,771 | | | | 114,854 | | |
Registration and filing fees | | | 95,060 | | | | 60,979 | | |
Printing of shareholder reports | | | 144,141 | | | | 46,532 | | |
Professional fees | | | 284,108 | | | | 36,869 | | |
Line of credit interest expense (Note 4) | | | — | | | | 35,500 | | |
Insurance expense | | | 80,486 | | | | 6,315 | | |
Chief Financial Officer fees (Note 5) | | | 62,345 | | | | 11,359 | | |
Other expenses | | | 80,059 | | | | 17,188 | | |
Total Expenses | | | 30,522,086 | | | | 3,338,645 | | |
Fees waived by the Adviser, Class R (Note 5) | | | (21,007 | ) | | | (150,425 | ) | |
Fees waived by the Adviser, Class I (Note 5) | | | (164,727 | ) | | | (392,244 | ) | |
Fees waived by the Adviser, Class C (Note 5) | | | (2,267 | ) | | | (3,752 | ) | |
Fees waived by the Adviser, Class A (Note 5) | | | (1,945 | ) | | | (3,225 | ) | |
Net Expenses | | | 30,332,140 | | | | 2,788,999 | | |
NET INVESTMENT INCOME | | | 273,818 | | | | 1,185,159 | | |
See Notes to Financial Statements.
www.arbitragefunds.com | 1-800-295-4485
68
For the Year Ended May 31, 2019
| | |
The Water
Island Credit
Opportunities Fund | | The Water
Island
Long/Short
Fund | |
INVESTMENT INCOME | |
Dividend income | | $ | 147,003 | | | $ | 37,840 | | |
Dividend income from affiliated investments | | | — | | | | — | | |
Foreign taxes withheld on dividends | | | — | | | | (357 | ) | |
Interest income | | | 2,441,260 | | | | 13,342 | | |
Total Investment Income | | | 2,588,263 | | | | 50,825 | | |
EXPENSES | |
Investment advisory fees (Note 5) | | | 514,904 | | | | 27,627 | | |
Distribution and service fees (Note 5) | |
Class R | | | 17,525 | | | | 26 | | |
Class C | | | 5,068 | | | | 102 | | |
Class A | | | 357 | | | | 26 | | |
Administrative fees (Note 5) | | | 43,586 | | | | 27,034 | | |
Chief Compliance Officer fees (Note 5) | | | 6,129 | | | | 222 | | |
Trustees' fees | | | 77,478 | | | | 76,312 | | |
Dividend expense | | | 153,627 | | | | 16,246 | | |
Interest rebate expense | | | 289 | | | | — | | |
Transfer agent fees (Note 5) | | | 53,291 | | | | 2,978 | | |
Custodian and bank service fees | | | 20,028 | | | | 50,605 | | |
Registration and filing fees | | | 58,691 | | | | 8,968 | | |
Printing of shareholder reports | | | 13,749 | | | | 12,987 | | |
Professional fees | | | 23,448 | | | | 15,819 | | |
Line of credit interest expense (Note 4) | | | 3,695 | | | | — | | |
Insurance expense | | | 2,417 | | | | 96 | | |
Chief Financial Officer fees (Note 5) | | | 8,685 | | | | 7,069 | | |
Other expenses | | | 11,062 | | | | 6,744 | | |
Total Expenses | | | 1,014,029 | | | | 252,861 | | |
Fees waived by the Adviser, Class R (Note 5) | | | (35,953 | ) | | | (938 | ) | |
Fees waived by the Adviser, Class I (Note 5) | | | (244,066 | ) | | | (201,824 | ) | |
Fees waived by the Adviser, Class C (Note 5) | | | (2,613 | ) | | | (937 | ) | |
Fees waived by the Adviser, Class A (Note 5) | | | (740 | ) | | | (938 | ) | |
Net Expenses | | | 730,657 | | | | 48,224 | | |
NET INVESTMENT INCOME | | | 1,857,606 | | | | 2,601 | | |
Annual Report | May 31, 2019
69
| | | The Arbitrage
Fund | | The Arbitrage
Event-Driven
Fund | |
REALIZED AND UNREALIZED GAINS (LOSSES) ON INVESTMENTS AND FOREIGN CURRENCIES | |
Net realized gains (losses) from: | |
Unaffiliated investments | | $ | 18,263,290 | | | $ | 2,456,816 | | |
Purchased option contracts | | | (9,906,367 | ) | | | (1,475,621 | ) | |
Swap contracts | | | 6,330,396 | | | | 347,357 | | |
Securities sold short | | | 54,909,157 | | | | (413,048 | ) | |
Written option contracts | | | 7,785,695 | | | | 872,256 | | |
Forward currency contracts | | | 20,593,887 | | | | 918,981 | | |
Foreign currency transactions (Note 8) | | | 836,947 | | | | 37,222 | | |
Net change in unrealized appreciation (depreciation) on: | | | |
Unaffiliated investments | | | (11,301,841 | ) | | | (1,942,929 | ) | |
Affiliated investments | | | 4,775 | | | | — | | |
Purchased option contracts | | | (869,661 | ) | | | 19,748 | | |
Swap contracts | | | (19,040 | ) | | | — | | |
Securities sold short | | | (3,373,640 | ) | | | 963,822 | | |
Written option contracts | | | (21,922 | ) | | | (107,896 | ) | |
Forward currency contracts | | | (12,510,293 | ) | | | (556,649 | ) | |
Foreign currency transactions (Note 8) | | | (353,986 | ) | | | (302 | ) | |
NET REALIZED AND UNREALIZED GAINS (LOSSES) ON INVESTMENTS AND FOREIGN CURRENCIES | | | 70,367,397 | | | | 1,119,757 | | |
NET INCREASE (DECREASE) IN NET ASSETS RESULTING FROM OPERATIONS | | $ | 70,641,215 | | | $ | 2,304,916 | | |
See Notes to Financial Statements.
www.arbitragefunds.com | 1-800-295-4485
70
For the Year Ended May 31, 2019
| | |
The Water
Island Credit
Opportunities Fund | | The Water
Island
Long/Short
Fund | |
REALIZED AND UNREALIZED GAINS (LOSSES) ON INVESTMENTS AND FOREIGN CURRENCIES | |
Net realized gains (losses) from: | |
Unaffiliated investments | | $ | (136,053 | ) | | $ | 200,171 | | |
Purchased option contracts | | | (2,246 | ) | | | (60,947 | ) | |
Swap contracts | | | — | | | | (11,587 | ) | |
Securities sold short | | | 154,774 | | | | (132,947 | ) | |
Written option contracts | | | 65,984 | | | | 17,583 | | |
Forward currency contracts | | | 73,267 | | | | 11,557 | | |
Foreign currency transactions (Note 8) | | | (2,445 | ) | | | (193 | ) | |
Net change in unrealized appreciation (depreciation) on: | | | |
Unaffiliated investments | | | (653,777 | ) | | | (86,799 | ) | |
Affiliated investments | | | — | | | | — | | |
Purchased option contracts | | | 19,075 | | | | 11,438 | | |
Swap contracts | | | — | | | | — | | |
Securities sold short | | | 163,621 | | | | 45,404 | | |
Written option contracts | | | (26,152 | ) | | | (1,628 | ) | |
Forward currency contracts | | | (55,745 | ) | | | (5,741 | ) | |
Foreign currency transactions (Note 8) | | | 384 | | | | (1 | ) | |
NET REALIZED AND UNREALIZED GAINS (LOSSES) ON INVESTMENTS AND FOREIGN CURRENCIES | | | (399,313 | ) | | | (13,690 | ) | |
NET INCREASE (DECREASE) IN NET ASSETS RESULTING FROM OPERATIONS | | $ | 1,458,293 | | | $ | (11,089 | ) | |
Annual Report | May 31, 2019
71
| | | The Arbitrage Fund | |
| | | Year Ended
May 31, 2019 | | Year Ended
May 31, 2018 | |
FROM OPERATIONS | |
Net investment income | | $ | 273,818 | | | $ | 6,493,223 | | |
Net realized gains (losses) from: | |
Unaffiliated investments | | | 18,263,290 | | | | 40,054,475 | | |
Purchased option contracts | | | (9,906,367 | ) | | | 1,192,356 | | |
Swap contracts | | | 6,330,396 | | | | 3,039,770 | | |
Securities sold short | | | 54,909,157 | | | | (44,952,162 | ) | |
Written option contracts | | | 7,785,695 | | | | 5,899,696 | | |
Forward currency contracts | | | 20,593,887 | | | | (11,729,216 | ) | |
Foreign currency transactions | | | 836,947 | | | | (3,771,261 | ) | |
Net change in unrealized appreciation (depreciation) on: | |
Unaffiliated investments | | | (11,301,841 | ) | | | 2,338,832 | | |
Affiliated investments | | | 4,775 | | | | 31,093 | | |
Purchased option contracts | | | (869,661 | ) | | | 641,174 | | |
Swap contracts | | | (19,040 | ) | | | 19,040 | | |
Securities sold short | | | (3,373,640 | ) | | | (11,177,824 | ) | |
Written option contracts | | | (21,922 | ) | | | 313,012 | | |
Forward currency contracts | | | (12,510,293 | ) | | | 18,928,428 | | |
Foreign currency transactions | | | (353,986 | ) | | | 247,641 | | |
Net increase (decrease) in net assets resulting from operations | | | 70,641,215 | | | | 7,568,277 | | |
FROM DIVIDENDS AND DISTRIBUTIONS TO SHAREHOLDERS: | |
Distributions, Class R | | | (3,337,705 | ) | | | (7,912,943 | ) | |
Distributions, Class I | | | (28,493,325 | ) | | | (58,536,445 | ) | |
Distributions, Class C | | | (258,793 | ) | | | (728,863 | ) | |
Distributions, Class A | | | (312,255 | ) | | | (418,896 | ) | |
Decrease in net assets from distributions to shareholders | | | (32,402,078 | ) | | | (67,597,147 | )(a) | |
FROM CAPITAL SHARE TRANSACTIONS (NOTE 7): | |
Proceeds from shares sold | | | 573,691,155 | | | | 777,369,604 | | |
Shares issued in reinvestment of distributions | | | 25,056,881 | | | | 49,184,317 | | |
Proceeds from redemption fees collected (Note 2) | | | — | | | | 4,227 | | |
Payments for shares redeemed | | | (662,269,228 | ) | | | (863,324,352 | ) | |
Net increase (decrease) in net assets from capital share transactions | | | (63,521,192 | ) | | | (36,766,204 | ) | |
TOTAL INCREASE (DECREASE) IN NET ASSETS | | | (25,282,055 | ) | | | (96,795,074 | ) | |
NET ASSETS | |
Beginning of year | | | 1,772,563,277 | | | | 1,869,358,351 | | |
End of year(a)(b) | | $ | 1,747,281,222 | | | $ | 1,772,563,277 | | |
(a) Included in total distributions for net investment income and net realized gains, respectively, as of May 31, 2018 was $(1,534,226) and $(6,378,717) for Class R, $(15,683,047) and $(42,853,398) for Class I, $(2,577) and $(726,286) for Class C, and $(93,341) and $(325,555) for Class A. The accumulated net investment income (loss) included in net assets was $(13,595,408) as of May 31, 2018.
(b) Included in total distributions for net investment income and net realized gains, respectively, as of May 31, 2018 was $(119,357) and $0 for Class R, $(608,995) and $0 for Class I, $0 and $0 for Class C, and $(1,916) and $0 for Class A. The accumulated net investment income (loss) included in net assets was $137,554 as of May 31, 2018.
See Notes to Financial Statements.
www.arbitragefunds.com | 1-800-295-4485
72
Statement of Changes in Net Assets
| | | The Arbitrage Event-Driven Fund | |
| | | Year Ended
May 31, 2019 | | Year Ended
May 31, 2018 | |
FROM OPERATIONS | |
Net investment income | | $ | 1,185,159 | | | $ | 710,672 | | |
Net realized gains (losses) from: | |
Unaffiliated investments | | | 2,456,816 | | | | 7,068,491 | | |
Purchased option contracts | | | (1,475,621 | ) | | | 176,327 | | |
Swap contracts | | | 347,357 | | | | 491,212 | | |
Securities sold short | | | (413,048 | ) | | | (7,058,252 | ) | |
Written option contracts | | | 872,256 | | | | 990,890 | | |
Forward currency contracts | | | 918,981 | | | | (391,883 | ) | |
Foreign currency transactions | | | 37,222 | | | | (299,434 | ) | |
Net change in unrealized appreciation (depreciation) on: | |
Unaffiliated investments | | | (1,942,929 | ) | | | (117,598 | ) | |
Affiliated investments | | | — | | | | — | | |
Purchased option contracts | | | 19,748 | | | | (47,796 | ) | |
Swap contracts | | | — | | | | — | | |
Securities sold short | | | 963,822 | | | | (102,711 | ) | |
Written option contracts | | | (107,896 | ) | | | 124,180 | | |
Forward currency contracts | | | (556,649 | ) | | | 731,389 | | |
Foreign currency transactions | | | (302 | ) | | | (9,009 | ) | |
Net increase (decrease) in net assets resulting from operations | | | 2,304,916 | | | | 2,266,478 | | |
FROM DIVIDENDS AND DISTRIBUTIONS TO SHAREHOLDERS: | |
Distributions, Class R | | | (546,554 | ) | | | (119,357 | ) | |
Distributions, Class I | | | (1,734,805 | ) | | | (608,995 | ) | |
Distributions, Class C | | | (5,311 | ) | | | — | | |
Distributions, Class A | | | (13,015 | ) | | | (1,916 | ) | |
Decrease in net assets from distributions to shareholders | | | (2,299,685 | ) | | | (730,268 | )(b) | |
FROM CAPITAL SHARE TRANSACTIONS (NOTE 7): | |
Proceeds from shares sold | | | 18,462,931 | | | | 62,289,254 | | |
Shares issued in reinvestment of distributions | | | 1,993,650 | | | | 616,739 | | |
Proceeds from redemption fees collected (Note 2) | | | — | | | | 201 | | |
Payments for shares redeemed | | | (45,994,464 | ) | | | (55,109,703 | ) | |
Net increase (decrease) in net assets from capital share transactions | | | (25,537,883 | ) | | | 7,796,491 | | |
TOTAL INCREASE (DECREASE) IN NET ASSETS | | | (25,532,652 | ) | | | 9,332,701 | | |
NET ASSETS | |
Beginning of year | | | 150,259,094 | | | | 140,926,393 | | |
End of year(a)(b) | | $ | 124,726,442 | | | $ | 150,259,094 | | |
Annual Report | May 31, 2019
73
| | | The Water Island
Credit Opportunities Fund | |
| | | Year Ended
May 31, 2019 | | Year Ended
May 31, 2018 | |
FROM OPERATIONS | |
Net investment income | | $ | 1,857,606 | | | $ | 1,216,196 | | |
Net realized gains (losses) from: | |
Unaffiliated investments | | | (136,053 | ) | | | (337,585 | ) | |
Purchased option contracts | | | (2,246 | ) | | | (9,095 | ) | |
Swap contracts | | | — | | | | — | | |
Securities sold short | | | 154,774 | | | | 274,941 | | |
Written option contracts | | | 65,984 | | | | 15,814 | | |
Forward currency contracts | | | 73,267 | | | | 24,779 | | |
Foreign currency transactions | | | (2,445 | ) | | | 3,357 | | |
Net change in unrealized appreciation (depreciation) on: | |
Unaffiliated investments | | | (653,777 | ) | | | 634,951 | | |
Purchased option contracts | | | 19,075 | | | | 2,224 | | |
Swap contracts | | | — | | | | — | | |
Securities sold short | | | 163,621 | | | | (84,809 | ) | |
Written option contracts | | | (26,152 | ) | | | 18,059 | | |
Forward currency contracts | | | (55,745 | ) | | | 55,745 | | |
Foreign currency transactions | | | 384 | | | | (384 | ) | |
Net increase (decrease) in net assets resulting from operations | | | 1,458,293 | | | | 1,814,193 | | |
FROM DIVIDENDS AND DISTRIBUTIONS TO SHAREHOLDERS: | |
Distributions, Class R | | | (223,168 | ) | | | (303,919 | ) | |
Distributions, Class I | | | (1,623,472 | ) | | | (1,078,145 | ) | |
Distributions, Class C | | | (12,522 | ) | | | (10,515 | ) | |
Distributions, Class A | | | (4,639 | ) | | | (8,084 | ) | |
Decrease in net assets from distributions to shareholders | | | (1,863,801 | ) | | | (1,400,663 | )(c) | |
FROM CAPITAL SHARE TRANSACTIONS (NOTE 7): | |
Proceeds from shares sold | | | 31,563,229 | | | | 14,355,166 | | |
Shares issued in reinvestment of distributions | | | 1,841,724 | | | | 1,314,693 | | |
Proceeds from redemption fees collected (Note 2) | | | — | | | | — | | |
Payments for shares redeemed | | | (21,303,781 | ) | | | (26,804,020 | ) | |
Net increase (decrease) in net assets from capital share transactions | | | 12,101,172 | | | | (11,134,161 | ) | |
TOTAL INCREASE (DECREASE) IN NET ASSETS | | | 11,695,664 | | | | (10,720,631 | ) | |
NET ASSETS | |
Beginning of year | | | 46,533,378 | | | | 57,254,009 | | |
End of year(c)(d) | | $ | 58,229,042 | | | $ | 46,533,378 | | |
(c) Included in total distributions for net investment income and net realized gains, respectively, as of May 31, 2018 was $(303,919) and $0 for Class R, $(1,078,145) and $0 for Class I, $(10,515) and $0 for Class C, and $(8,084) and $0 for Class A. The accumulated net investment income (loss) included in net assets was $9,713 as of May 31, 2018.
(d) The accumulated net investment income (loss) included in net assets was $(6,841) as of May 31, 2018.
See Notes to Financial Statements.
www.arbitragefunds.com | 1-800-295-4485
74
Statement of Changes in Net Assets
| | | The Water Island Long/Short Fund | |
| | | Year Ended
May 31, 2019 | | Year Ended
May 31, 2018 | |
FROM OPERATIONS | |
Net investment income | | $ | 2,601 | | | $ | (4,962 | ) | |
Net realized gains (losses) from: | |
Unaffiliated investments | | | 200,171 | | | | 213,124 | | |
Purchased option contracts | | | (60,947 | ) | | | 4,811 | | |
Swap contracts | | | (11,587 | ) | | | 5,809 | | |
Securities sold short | | | (132,947 | ) | | | (214,152 | ) | |
Written option contracts | | | 17,583 | | | | 24,527 | | |
Forward currency contracts | | | 11,557 | | | | (11,998 | ) | |
Foreign currency transactions | | | (193 | ) | | | (1,038 | ) | |
Net change in unrealized appreciation (depreciation) on: | |
Unaffiliated investments | | | (86,799 | ) | | | 2,002 | | |
Purchased option contracts | | | 11,438 | | | | (2,070 | ) | |
Swap contracts | | | — | | | | — | | |
Securities sold short | | | 45,404 | | | | 2,021 | | |
Written option contracts | | | (1,628 | ) | | | 177 | | |
Forward currency contracts | | | (5,741 | ) | | | 10,251 | | |
Foreign currency transactions | | | (1 | ) | | | (133 | ) | |
Net increase (decrease) in net assets resulting from operations | | | (11,089 | ) | | | 28,369 | | |
FROM DIVIDENDS AND DISTRIBUTIONS TO SHAREHOLDERS: | |
Distributions, Class R | | | (206 | ) | | | — | | |
Distributions, Class I | | | (43,718 | ) | | | — | | |
Distributions, Class C | | | (206 | ) | | | — | | |
Distributions, Class A | | | (206 | ) | | | — | | |
Decrease in net assets from distributions to shareholders | | | (44,336 | ) | | | — | | |
FROM CAPITAL SHARE TRANSACTIONS (NOTE 7): | |
Proceeds from shares sold | | | 366,929 | | | | 135,037 | | |
Shares issued in reinvestment of distributions | | | 44,336 | | | | — | | |
Proceeds from redemption fees collected (Note 2) | | | — | | | | — | | |
Payments for shares redeemed | | | (189,524 | ) | | | (34,125 | ) | |
Net increase (decrease) in net assets from capital share transactions | | | 221,741 | | | | 100,912 | | |
TOTAL INCREASE (DECREASE) IN NET ASSETS | | | 166,316 | | | | 129,281 | | |
NET ASSETS | |
Beginning of year | | | 2,207,840 | | | | 2,078,559 | | |
End of year(c)(d) | | $ | 2,374,156 | | | $ | 2,207,840 | | |
Annual Report | May 31, 2019
75
The Arbitrage Fund – Class R Financial Highlights
Selected Per Share Data and Ratios for a Share Outstanding Throughout the Periods Presented:
| | | Year Ended May 31, | |
| | | 2019 | | 2018 | | 2017 | | 2016 | | 2015 | |
Net asset value,
beginning of period | | $ | 12.65 | | | $ | 13.06 | | | $ | 12.78 | | | $ | 12.97 | | | $ | 12.58 | | |
Income (loss) from
investment operations | |
Net investment income (loss)(a) | | | (0.03 | )(c) | | | 0.05 | | | | (0.13 | )(b) | | | (0.06 | ) | | | (0.11 | ) | |
Net realized and unrealized
gains (losses) on investments
and foreign currencies | | | 0.52 | | | | (0.01 | )(c) | | | 0.53 | (d) | | | 0.17 | | | | 0.53 | | |
Total from investment operations | | | 0.49 | | | | 0.04 | | | | 0.40 | | | | 0.11 | | | | 0.42 | | |
Less distributions | |
From net investment income | | | (0.06 | ) | | | (0.09 | ) | | | – | | | | – | | | | – | | |
From net realized gains | | | (0.16 | ) | | | (0.36 | ) | | | (0.12 | ) | | | (0.30 | ) | | | (0.03 | ) | |
Total distributions | | | (0.22 | ) | | | (0.45 | ) | | | (0.12 | ) | | | (0.30 | ) | | | (0.03 | ) | |
Proceeds from redemption
fees collected | | | – | | | | 0.00 | (e) | | | 0.00 | (e) | | | 0.00 | (e) | | | 0.00 | (e) | |
Net asset value, end of period | | $ | 12.92 | | | $ | 12.65 | | | $ | 13.06 | | | $ | 12.78 | | | $ | 12.97 | | |
Total return(f) | | | 3.89 | % | | | 0.31 | % | | | 3.17 | % | | | 0.87 | % | | | 3.35 | % | |
Net assets, end of period
(in 000s) | | $ | 163,349 | | | $ | 222,309 | | | $ | 340,353 | | | $ | 433,936 | | | $ | 500,440 | | |
RATIOS TO AVERAGE
NET ASSETS: | |
Gross expenses(g) | | | 1.94 | % | | | 1.91 | % | | | 1.87 | %(b) | | | 1.88 | % | | | 2.31 | % | |
Net expenses after advisory
fees waived and expenses
reimbursed(g)(h) | | | 1.93 | % | | | 1.90 | % | | | 1.87 | %(b) | | | 1.88 | % | | | 2.31 | % | |
Net investment income (loss) | | | (0.20 | %)(c) | | | 0.41 | % | | | (1.00 | %)(b) | | | (0.51 | %) | | | (0.87 | %) | |
Portfolio turnover rate | | | 419 | % | | | 362 | % | | | 363 | % | | | 321 | % | | | 514 | % | |
(a) Per share amounts were calculated using average shares outstanding for the year.
(b) Includes a non-recurring refund by the custodian for overbilling of prior years' out-of-pocket fees. This amounted to less than $0.01 per share and is less than 0.005% of average net assets.
(c) The amount shown for a share outstanding throughout the period may not correlate with the Statement of Operations for the period due to timing of sales and redemptions of Fund shares in relation to income earned and/or fluctuating market value of the investments of the Fund.
(d) Includes estimated proceeds from the Fund's participation in a class action lawsuit. This represents a non-recurring gain in the amount of $0.01 per share.
(e) Amount rounds to less than $0.01 per share.
(f) Total return is a measure of the change in the value of an investment in the Fund over the years covered, which assumes any dividends or capital gains distributions are reinvested in shares of the Fund. Returns shown do not reflect the deduction of taxes a shareholder would pay on Fund distributions or the redemption of Fund shares.
(g) Dividend expense totaled 0.46%, 0.42%, 0.36%, 0.34% and 0.68% of average net assets for the years ended May 31, 2019, 2018, 2017, 2016 and 2015, respectively. Interest rebate expense and line of credit interest expense totaled 0.00%, 0.01%, 0.03%, 0.07% and 0.18% of average net assets for the years ended May 31, 2019, 2018, 2017, 2016 and 2015, respectively.
(h) Excluding dividend and interest expenses, the Fund's net expenses after advisory fees waived and expenses reimbursed would have been 1.47%, 1.47%, 1.48%, 1.47% and 1.45% of average net assets for the years ended May 31, 2019, 2018, 2017, 2016 and 2015, respectively.
See Notes to Financial Statements.
www.arbitragefunds.com | 1-800-295-4485
76
The Arbitrage Fund – Class I Financial Highlights
Selected Per Share Data and Ratios for a Share Outstanding Throughout the Periods Presented:
| | | Year Ended May 31, | |
| | | 2019 | | 2018 | | 2017 | | 2016 | | 2015 | |
Net asset value,
beginning of period | | $ | 13.03 | | | $ | 13.46 | | | $ | 13.13 | | | $ | 13.28 | | | $ | 12.86 | | |
Income (loss) from
investment operations | |
Net investment income (loss)(a) | | | 0.01 | | | | 0.05 | | | | (0.10 | )(b) | | | (0.03 | ) | | | (0.09 | ) | |
Net realized and unrealized
gains on investments and
foreign currencies | | | 0.54 | | | | 0.01 | | | | 0.55 | (c) | | | 0.18 | | | | 0.54 | | |
Total from investment operations | | | 0.55 | | | | 0.06 | | | | 0.45 | | | | 0.15 | | | | 0.45 | | |
Less distributions | |
From net investment income | | | (0.10 | ) | | | (0.13 | ) | | | – | | | | – | | | | – | | |
From net realized gains | | | (0.16 | ) | | | (0.36 | ) | | | (0.12 | ) | | | (0.30 | ) | | | (0.03 | ) | |
Total distributions | | | (0.26 | ) | | | (0.49 | ) | | | (0.12 | ) | | | (0.30 | ) | | | (0.03 | ) | |
Proceeds from redemption
fees collected | | | – | | | | 0.00 | (d) | | | 0.00 | (d) | | | 0.00 | (d) | | | 0.00 | (d) | |
Net asset value, end of period | | $ | 13.32 | | | $ | 13.03 | | | $ | 13.46 | | | $ | 13.13 | | | $ | 13.28 | | |
Total return(e) | | | 4.21 | % | | | 0.50 | % | | | 3.47 | % | | | 1.16 | % | | | 3.51 | % | |
Net assets, end of period
(in 000s) | | $ | 1,546,542 | | | $ | 1,510,598 | | | $ | 1,492,094 | | | $ | 1,395,178 | | | $ | 1,514,685 | | |
RATIOS TO AVERAGE
NET ASSETS: | |
Gross expenses(f) | | | 1.69 | % | | | 1.66 | % | | | 1.62 | %(b) | | | 1.63 | % | | | 2.06 | % | |
Net expenses after advisory
fees waived and expenses
reimbursed(f)(g) | | | 1.68 | % | | | 1.65 | % | | | 1.62 | %(b) | | | 1.63 | % | | | 2.06 | % | |
Net investment income (loss) | | | 0.06 | % | | | 0.35 | % | | | (0.76 | %)(b) | | | (0.24 | %) | | | (0.65 | %) | |
Portfolio turnover rate | | | 419 | % | | | 362 | % | | | 363 | % | | | 321 | % | | | 514 | % | |
(a) Per share amounts were calculated using average shares outstanding for the year.
(b) Includes a non-recurring refund by the custodian for overbilling of prior years' out-of-pocket fees. This amounted to less than $0.01 per share and is less than 0.005% of average net assets.
(c) Includes estimated proceeds from the Fund's participation in a class action lawsuit. This represents a non-recurring gain in the amount of $0.01 per share.
(d) Amount rounds to less than $0.01 per share.
(e) Total return is a measure of the change in the value of an investment in the Fund over the years covered, which assumes any dividends or capital gains distributions are reinvested in shares of the Fund. Returns shown do not reflect the deduction of taxes a shareholder would pay on Fund distributions or the redemption of Fund shares.
(f) Dividend expense totaled 0.46%, 0.42%, 0.36%, 0.34% and 0.68% of average net assets for the years ended May 31, 2019, 2018, 2017, 2016 and 2015, respectively. Interest rebate expense and line of credit interest expense totaled 0.00%, 0.01%, 0.03%, 0.07% and 0.18% of average net assets for the years ended May 31, 2019, 2018, 2017, 2016 and 2015, respectively.
(g) Excluding dividend and interest expenses, the Fund's net expenses after advisory fees waived and expenses reimbursed would have been 1.22%, 1.22%, 1.23%, 1.22% and 1.20% of average net assets for the years ended May 31, 2019, 2018, 2017, 2016 and 2015, respectively.
See Notes to Financial Statements.
Annual Report | May 31, 2019
77
The Arbitrage Fund – Class C Financial Highlights
Selected Per Share Data and Ratios for a Share Outstanding Throughout the Periods Presented:
| | | Year Ended May 31, | |
| | | 2019 | | 2018 | | 2017 | | 2016 | | 2015 | |
Net asset value,
beginning of period | | $ | 12.12 | | | $ | 12.54 | | | $ | 12.37 | | | $ | 12.65 | | | $ | 12.37 | | |
Income (loss) from
investment operations | |
Net investment loss(a) | | | (0.12 | )(b) | | | (0.07 | )(b) | | | (0.22 | )(c) | | | (0.16 | ) | | | (0.20 | ) | |
Net realized and unrealized
gains on investments and
foreign currencies | | | 0.50 | | | | 0.01 | | | | 0.51 | (d) | | | 0.18 | | | | 0.51 | | |
Total from investment operations | | | 0.38 | | | | (0.06 | ) | | | 0.29 | | | | 0.02 | | | | 0.31 | | |
Less distributions | |
From net investment income | | | – | | | | (0.00 | )(e) | | | – | | | | – | | | | – | | |
From net realized gains | | | (0.16 | ) | | | (0.36 | ) | | | (0.12 | ) | | | (0.30 | ) | | | (0.03 | ) | |
Total distributions | | | (0.16 | ) | | | (0.36 | ) | | | (0.12 | ) | | | (0.30 | ) | | | (0.03 | ) | |
Proceeds from redemption
fees collected | | | – | | | | – | | | | – | | | | – | | | | – | | |
Net asset value, end of period | | $ | 12.34 | | | $ | 12.12 | | | $ | 12.54 | | | $ | 12.37 | | | $ | 12.65 | | |
Total return(f)(g) | | | 3.11 | % | | | (0.45 | %) | | | 2.38 | % | | | 0.18 | % | | | 2.52 | % | |
Net assets, end of period
(in 000s) | | $ | 19,050 | | | $ | 22,917 | | | $ | 26,900 | | | $ | 30,814 | | | $ | 32,958 | | |
RATIOS TO AVERAGE
NET ASSETS: | |
Gross expenses(h) | | | 2.69 | % | | | 2.66 | % | | | 2.62 | %(c) | | | 2.63 | % | | | 3.06 | % | |
Net expenses after advisory
fees waived and expenses
reimbursed(h)(i) | | | 2.68 | % | | | 2.65 | % | | | 2.62 | %(c) | | | 2.63 | % | | | 3.06 | % | |
Net investment loss | | | (0.94 | %)(b) | | | (0.56 | %) | | | (1.76 | %)(c) | | | (1.28 | %) | | | (1.60 | %) | |
Portfolio turnover rate | | | 419 | % | | | 362 | % | | | 363 | % | | | 321 | % | | | 514 | % | |
(a) Per share amounts were calculated using average shares outstanding for the year.
(b) The amount shown for a share outstanding throughout the period may not correlate with the Statement of Operations for the period due to timing of sales and redemptions of Fund shares in relation to income earned and/or fluctuating market value of the investments of the Fund.
(c) Includes a non-recurring refund by the custodian for overbilling of prior years' out-of-pocket fees. This amounted to less than $0.01 per share and is less than 0.005% of average net assets.
(d) Includes estimated proceeds from the Fund's participation in a class action lawsuit. This represents a non-recurring gain in the amount of $0.01 per share.
(e) Amount rounds to less than $0.01 per share.
(f) Total return is a measure of the change in the value of an investment in the Fund over the years covered, which assumes any dividends or capital gains distributions are reinvested in shares of the Fund. Returns shown do not reflect the deduction of taxes a shareholder would pay on Fund distributions or the redemption of Fund shares.
(g) Total return excludes sales charges, if any, and would be lower for the period presented if it reflected these charges.
(h) Dividend expense totaled 0.46%, 0.42%, 0.36%, 0.34% and 0.68% of average net assets for the years ended May 31, 2019, 2018, 2017, 2016 and 2015, respectively. Interest rebate expense and line of credit interest expense totaled 0.00%, 0.01%, 0.03%, 0.07% and 0.18% of average net assets for the years ended May 31, 2019, 2018, 2017, 2016 and 2015, respectively.
(i) Excluding dividend and interest expenses, the Fund's net expenses after advisory fees waived and expenses reimbursed would have been 2.22%, 2.22%, 2.23%, 2.22% and 2.20% of average net assets for the years ended May 31, 2019, 2018, 2017, 2016 and 2015, respectively.
See Notes to Financial Statements.
www.arbitragefunds.com | 1-800-295-4485
78
The Arbitrage Fund – Class A Financial Highlights
Selected Per Share Data and Ratios for a Share Outstanding Throughout the Periods Presented:
| | | Year Ended May 31, | |
| | | 2019 | | 2018 | | 2017 | | 2016 | | 2015 | |
Net asset value,
beginning of period | | $ | 12.63 | | | $ | 13.07 | | | $ | 12.79 | | | $ | 12.97 | | | $ | 12.59 | | |
Income (loss) from
investment operations | |
Net investment income (loss)(a) | | | (0.02 | )(d) | | | — | (b) | | | (0.13 | )(c) | | | (0.07 | ) | | | (0.09 | ) | |
Net realized and unrealized
gains on investments and
foreign currencies | | | 0.52 | | | | 0.02 | | | | 0.53 | (e) | | | 0.19 | | | | 0.50 | | |
Total from investment operations | | | 0.50 | | | | 0.02 | | | | 0.40 | | | | 0.12 | | | | 0.41 | | |
Less distributions | |
From net investment income | | | (0.07 | ) | | | (0.10 | ) | | | – | | | | – | | | | – | | |
From net realized gains | | | (0.16 | ) | | | (0.36 | ) | | | (0.12 | ) | | | (0.30 | ) | | | (0.03 | ) | |
Total distributions | | | (0.23 | ) | | | (0.46 | ) | | | (0.12 | ) | | | (0.30 | ) | | | (0.03 | ) | |
Proceeds from redemption
fees collected | | | – | | | | – | | | | – | | | | – | | | | – | | |
Net asset value, end of period | | $ | 12.90 | | | $ | 12.63 | | | $ | 13.07 | | | $ | 12.79 | | | $ | 12.97 | | |
Total return(f)(g) | | | 3.94 | % | | | 0.21 | % | | | 3.17 | % | | | 0.95 | % | | | 3.27 | % | |
Net assets, end of period
(in 000s) | | $ | 18,341 | | | $ | 16,740 | | | $ | 10,012 | | | $ | 8,421 | | | $ | 17,458 | | |
RATIOS TO AVERAGE
NET ASSETS: | |
Gross expenses(h) | | | 1.94 | % | | | 1.91 | % | | | 1.87 | %(c) | | | 1.87 | % | | | 2.31 | % | |
Net expenses after advisory
fees waived and expenses
reimbursed(h)(i) | | | 1.93 | % | | | 1.90 | % | | | 1.87 | %(c) | | | 1.87 | % | | | 2.31 | % | |
Net investment loss | | | (0.19 | %)(d) | | | (0.01 | %) | | | (1.02 | %)(c) | | | (0.56 | %) | | | (0.70 | %) | |
Portfolio turnover rate | | | 419 | % | | | 362 | % | | | 363 | % | | | 321 | % | | | 514 | % | |
(a) Per share amounts were calculated using average shares outstanding for the year.
(b) Amount rounds to less than $0.01 per share.
(c) Includes a non-recurring refund by the custodian for overbilling of prior years' out-of-pocket fees. This amounted to less than $0.01 per share and is less than 0.005% of average net assets.
(d) The amount shown for a share outstanding throughout the period may not correlate with the Statement of Operations for the period due to timing of sales and redemptions of Fund shares in relation to income earned and/or fluctuating market value of the investments of the Fund.
(e) Includes estimated proceeds from the Fund's participation in a class action lawsuit. This represents a non-recurring gain in the amount of $0.01 per share.
(f) Total return is a measure of the change in the value of an investment in the Fund over the years covered, which assumes any dividends or capital gains distributions are reinvested in shares of the Fund. Returns shown do not reflect the deduction of taxes a shareholder would pay on Fund distributions or the redemption of Fund shares or the imposition of any sales load.
(g) Total return excludes sales charges, if any, and would be lower for the period presented if it reflected these charges.
(h) Dividend expense totaled 0.46%, 0.42%, 0.36%, 0.33% and 0.68% of average net assets for the years ended May 31, 2019, 2018, 2017, 2016 and 2015, respectively. Interest rebate expense and line of credit interest expense totaled 0.00%, 0.01%, 0.03%, 0.07% and 0.18% of average net assets for the the years ended May 31, 2019, 2018, 2017, 2016 and 2015, respectively.
(i) Excluding dividend and interest expenses, the Fund's net expenses after advisory fees waived and expenses reimbursed would have been 1.47%, 1.47%, 1.48%, 1.47% and 1.45% of average net assets for the years ended May 31, 2019, 2018, 2017, 2016 and 2015, respectively.
See Notes to Financial Statements.
Annual Report | May 31, 2019
79
The Arbitrage Event-Driven Fund – Class R Financial Highlights
Selected Per Share Data and Ratios for a Share Outstanding Throughout the Periods Presented:
| | | Year Ended May 31, | |
| | | 2019 | | 2018 | | 2017 | | 2016 | | 2015 | |
Net asset value,
beginning of period | | $ | 9.46 | | | $ | 9.34 | | | $ | 8.98 | | | $ | 9.73 | | | $ | 10.29 | | |
Income (loss) from
investment operations | |
Net investment income (loss)(a) | | | 0.07 | | | | 0.06 | | | | (0.04 | )(b) | | | (0.02 | ) | | | 0.04 | | |
Net realized and unrealized
gains (losses) on investments
and foreign currencies | | | 0.08 | | | | 0.09 | | | | 0.40 | (c) | | | (0.53 | ) | | | (0.36 | ) | |
Total from investment operations | | | 0.15 | | | | 0.15 | | | | 0.36 | | | | (0.55 | ) | | | (0.32 | ) | |
Less distributions | |
From net investment income | | | (0.14 | ) | | | (0.03 | ) | | | – | | | | (0.20 | ) | | | (0.08 | ) | |
From net realized gains | | | – | | | | – | | | | – | | | | (0.00 | )(d) | | | (0.16 | ) | |
Total distributions | | | (0.14 | ) | | | (0.03 | ) | | | – | | | | (0.20 | ) | | | (0.24 | ) | |
Proceeds from redemption
fees collected | | | – | | | | 0.00 | (d) | | | 0.00 | (d) | | | 0.00 | (d) | | | 0.00 | (d) | |
Net asset value, end of period | | $ | 9.47 | | | $ | 9.46 | | | $ | 9.34 | | | $ | 8.98 | | | $ | 9.73 | | |
Total return(e) | | | 1.60 | % | | | 1.56 | % | | | 4.01 | % | | | (5.55 | %) | | | (3.12 | %) | |
Net assets, end of period
(in 000s) | | $ | 30,423 | | | $ | 45,383 | | | $ | 70,277 | | | $ | 80,114 | | | $ | 195,014 | | |
RATIOS TO AVERAGE
NET ASSETS: | |
Gross expenses(f) | | | 2.58 | % | | | 2.59 | % | | | 2.56 | %(b) | | | 2.62 | % | | | 2.52 | % | |
Net expenses after advisory
fees waived and expenses
reimbursed(f)(g) | | | 2.18 | % | | | 2.16 | % | | | 2.26 | % | | | 2.46 | % | | | 2.50 | % | |
Net investment income (loss) | | | 0.70 | % | | | 0.58 | % | | | (0.45 | %)(b) | | | (0.27 | %) | | | 0.37 | % | |
Portfolio turnover rate | | | 504 | % | | | 421 | % | | | 409 | % | | | 350 | % | | | 451 | % | |
(a) Per share amounts were calculated using average shares outstanding for the year.
(b) Includes a non-recurring refund by the custodian for overbilling of prior years' out-of-pocket fees. This amounted to less than $0.01 per share and 0.01% of average net assets.
(c) Includes estimated proceeds from the Fund's participation in a class action lawsuit. This represents a non-recurring gain in the amount of less than $0.005 per share.
(d) Amount rounds to less than $0.01 per share.
(e) Total return is a measure of the change in the value of an investment in the Fund over the years covered, which assumes any dividends or capital gains distributions are reinvested in shares of the Fund. Returns shown do not reflect the deduction of taxes a shareholder would pay on Fund distributions or the redemption of Fund shares.
(f) Dividend expense totaled 0.46%, 0.44%, 0.53%, 0.58% and 0.55% of average net assets for the years ended May 31, 2019, 2018, 2017, 2016 and 2015, respectively. Interest rebate expense and line of credit interest expense totaled 0.03%, 0.03%, 0.04%, 0.19% and 0.26% of average net assets for the years ended May 31, 2019, 2018, 2017, 2016 and 2015, respectively.
(g) Excluding dividend and interest expenses, the Fund's net expenses after advisory fees waived and expenses reimbursed would have been 1.69%, 1.69%, 1.69%, 1.69% and 1.69% of average net assets for the years ended May 31, 2019, 2018, 2017, 2016 and 2015, respectively.
See Notes to Financial Statements.
www.arbitragefunds.com | 1-800-295-4485
80
The Arbitrage Event-Driven Fund – Class I Financial Highlights
Selected Per Share Data and Ratios for a Share Outstanding Throughout the Periods Presented:
| | | Year Ended May 31, | |
| | | 2019 | | 2018 | | 2017 | | 2016 | | 2015 | |
Net asset value,
beginning of period | | $ | 9.53 | | | $ | 9.43 | | | $ | 9.04 | | | $ | 9.81 | | | $ | 10.37 | | |
Income (loss) from
investment operations | |
Net investment income (loss)(a) | | | 0.09 | | | | 0.04 | | | | (0.02 | )(b) | | | (0.02 | ) | | | 0.06 | | |
Net realized and unrealized
gains (losses) on investments
and foreign currencies | | | 0.09 | | | | 0.12 | | | | 0.41 | (c) | | | (0.51 | ) | | | (0.37 | ) | |
Total from investment operations | | | 0.18 | | | | 0.16 | | | | 0.39 | | | | (0.53 | ) | | | (0.31 | ) | |
Less distributions | |
From net investment income | | | (0.17 | ) | | | (0.06 | ) | | | – | | | | (0.24 | ) | | | (0.09 | ) | |
From net realized gains | | | – | | | | – | | | | – | | | | (0.00 | )(d) | | | (0.16 | ) | |
Total distributions | | | (0.17 | ) | | | (0.06 | ) | | | – | | | | (0.24 | ) | | | (0.25 | ) | |
Proceeds from redemption
fees collected | | | – | | | | 0.00 | (d) | | | 0.00 | (d) | | | 0.00 | (d) | | | 0.00 | (d) | |
Net asset value, end of period | | $ | 9.54 | | | $ | 9.53 | | | $ | 9.43 | | | $ | 9.04 | | | $ | 9.81 | | |
Total return(e) | | | 1.88 | % | | | 1.69 | % | | | 4.31 | % | | | (5.27 | %) | | | (2.96 | %) | |
Net assets, end of period
(in 000s) | | $ | 92,710 | | | $ | 103,001 | | | $ | 68,272 | | | $ | 95,155 | | | $ | 390,102 | | |
RATIOS TO AVERAGE
NET ASSETS: | |
Gross expenses(f) | | | 2.33 | % | | | 2.34 | % | | | 2.31 | %(b) | | | 2.37 | % | | | 2.27 | % | |
Net expenses after advisory
fees waived and expenses
reimbursed(f)(g) | | | 1.93 | % | | | 1.91 | % | | | 2.01 | % | | | 2.21 | % | | | 2.25 | % | |
Net investment income (loss) | | | 0.92 | % | | | 0.46 | % | | | (0.22 | %)(b) | | | (0.26 | %) | | | 0.62 | % | |
Portfolio turnover rate | | | 504 | % | | | 421 | % | | | 409 | % | | | 350 | % | | | 451 | % | |
(a) Per share amounts were calculated using average shares outstanding for the year.
(b) Includes a non-recurring refund by the custodian for overbilling of prior years' out-of-pocket fees. This amounted to less than $0.01 per share and 0.01% of average net assets.
(c) Includes estimated proceeds from the Fund's participation in a class action lawsuit. This represents a non-recurring gain in the amount of less than $0.005 per share.
(d) Amount rounds to less than $0.01 per share.
(e) Total return is a measure of the change in the value of an investment in the Fund over the years covered, which assumes any dividends or capital gains distributions are reinvested in shares of the Fund. Returns shown do not reflect the deduction of taxes a shareholder would pay on Fund distributions or the redemption of Fund shares.
(f) Dividend expense totaled 0.46%, 0.44%, 0.53%, 0.58% and 0.55% of average net assets for the years ended May 31, 2019, 2018, 2017, 2016 and 2015, respectively. Interest rebate expense and line of credit interest expense totaled 0.03%, 0.03%, 0.04%, 0.19% and 0.26% of average net assets for the years ended May 31, 2019, 2018, 2017, 2016 and 2015, respectively.
(g) Excluding dividend and interest expenses, the Fund's net expenses after advisory fees waived and expenses reimbursed would have been 1.44%, 1.44%, 1.44%, 1.44% and 1.44% of average net assets for the years ended May 31, 2019, 2018, 2017, 2016 and 2015, respectively.
See Notes to Financial Statements.
Annual Report | May 31, 2019
81
The Arbitrage Event-Driven Fund – Class C Financial Highlights
Selected Per Share Data and Ratios for a Share Outstanding Throughout the Periods Presented:
| | | Year Ended May 31, | |
| | | 2019 | | 2018 | | 2017 | | 2016 | | 2015 | |
Net asset value,
beginning of period | | $ | 9.26 | | | $ | 9.19 | | | $ | 8.91 | | | $ | 9.62 | | | $ | 10.22 | | |
Income (loss) from
investment operations | |
Net investment loss(a) | | | (0.01 | ) | | | (0.03 | )(b) | | | (0.11 | )(c) | | | (0.09 | ) | | | (0.04 | ) | |
Net realized and unrealized
gains (losses) on investments
and foreign currencies | | | 0.09 | | | | 0.10 | | | | 0.39 | (e) | | | (0.50 | ) | | | (0.36 | ) | |
Total from investment operations | | | 0.08 | | | | 0.07 | | | | 0.28 | | | | (0.59 | ) | | | (0.40 | ) | |
Less distributions | |
From net investment income | | | (0.05 | ) | | | – | | | | – | | | | (0.12 | ) | | | (0.04 | ) | |
From net realized gains | | | – | | | | – | | | | – | | | | (0.00 | )(d) | | | (0.16 | ) | |
Total distributions | | | (0.05 | ) | | | – | | | | – | | | | (0.12 | ) | | | (0.20 | ) | |
Net asset value, end of period | | $ | 9.29 | | | $ | 9.26 | | | $ | 9.19 | | | $ | 8.91 | | | $ | 9.62 | | |
Total return(f)(g) | | | 0.91 | % | | | 0.76 | % | | | 3.14 | % | | | (6.14 | %) | | | (3.95 | %) | |
Net assets, end of period
(in 000s) | | $ | 794 | | | $ | 1,175 | | | $ | 1,567 | | | $ | 2,538 | | | $ | 5,020 | | |
RATIOS TO AVERAGE
NET ASSETS: | |
Gross expenses(h) | | | 3.33 | % | | | 3.34 | % | | | 3.31 | %(c) | | | 3.37 | % | | | 3.27 | % | |
Net expenses after advisory
fees waived and expenses
reimbursed(h)(i) | | | 2.93 | % | | | 2.91 | % | | | 3.01 | % | | | 3.21 | % | | | 3.25 | % | |
Net investment loss | | | (0.06 | %) | | | (0.34 | %) | | | (1.26 | %)(c) | | | (0.95 | %) | | | (0.37 | %) | |
Portfolio turnover rate | | | 504 | % | | | 421 | % | | | 409 | % | | | 350 | % | | | 451 | % | |
(a) Per share amounts were calculated using average shares outstanding for the year.
(b) The amount shown for a share outstanding throughout the period may not correlate with the Statement of Operations for the period due to timing of sales and redemptions of Fund shares in relation to income earned and/or fluctuating market value of the investments of the Fund.
(c) Includes a non-recurring refund by the custodian for overbilling of prior years' out-of-pocket fees. This amounted to less than $0.01 per share and 0.01% of average net assets.
(d) Amount rounds to less than $0.01 per share.
(e) Includes estimated proceeds from the Fund's participation in a class action lawsuit. This represents a non-recurring gain in the amount of less than $0.005 per share.
(f) Total return is a measure of the change in the value of an investment in the Fund over the years covered, which assumes any dividends or capital gains distributions are reinvested in shares of the Fund. Returns shown do not reflect the deduction of taxes a shareholder would pay on Fund distributions or the redemption of Fund shares.
(g) Total return excludes sales charges, if any, and would be lower for the period presented if it reflected these charges.
(h) Dividend expense totaled 0.46%, 0.44%, 0.53%, 0.59% and 0.55% of average net assets for the years ended May 31, 2019, 2018, 2017, 2016 and 2015, respectively. Interest rebate expense and line of credit interest expense totaled 0.03%, 0.03%, 0.04%, 0.18% and 0.26% of average net assets for the years ended May 31, 2019, 2018, 2017, 2016 and 2015, respectively.
(i) Excluding dividend and interest expenses, the Fund's net expenses after advisory fees waived and expenses reimbursed would have been 2.44%, 2.44%, 2.44%, 2.44% and 2.44% of average net assets for the years ended May 31, 2019, 2018, 2017, 2016 and 2015, respectively.
See Notes to Financial Statements.
www.arbitragefunds.com | 1-800-295-4485
82
The Arbitrage Event-Driven Fund – Class A Financial Highlights
Selected Per Share Data and Ratios for a Share Outstanding Throughout the Periods Presented:
| | | Year Ended May 31, | |
| | | 2019 | | 2018 | | 2017 | | 2016 | | 2015 | |
Net asset value,
beginning of period | | $ | 9.46 | | | $ | 9.35 | | | $ | 8.98 | | | $ | 9.73 | | | $ | 10.30 | | |
Income (loss) from
investment operations | |
Net investment income (loss)(a) | | | 0.06 | | | | 0.04 | | | | (0.05 | )(b) | | | (0.03 | ) | | | 0.03 | | |
Net realized and unrealized
gains (losses) on investments
and foreign currencies | | | 0.08 | | | | 0.10 | | | | 0.42 | (c) | | | (0.52 | ) | | | (0.36 | ) | |
Total from investment operations | | | 0.14 | | | | 0.14 | | | | 0.37 | | | | (0.55 | ) | | | (0.33 | ) | |
Less distributions | |
From net investment income | | | (0.14 | ) | | | (0.03 | ) | | | – | | | | (0.20 | ) | | | (0.08 | ) | |
From net realized gains | | | – | | | | – | | | | – | | | | (0.00 | )(d) | | | (0.16 | ) | |
Total distributions | | | (0.14 | ) | | | (0.03 | ) | | | – | | | | (0.20 | ) | | | (0.24 | ) | |
Proceeds from redemption
fees collected | | | – | | | | – | | | | – | | | | – | | | | – | | |
Net asset value, end of period | | $ | 9.46 | | | $ | 9.46 | | | $ | 9.35 | | | $ | 8.98 | | | $ | 9.73 | | |
Total return(e)(f) | | | 1.56 | % | | | 1.49 | % | | | 4.12 | % | | | (5.54 | %) | | | (3.22 | %) | |
Net assets, end of period
(in 000s) | | $ | 799 | | | $ | 701 | | | $ | 810 | | | $ | 2,062 | | | $ | 5,341 | | |
RATIOS TO AVERAGE
NET ASSETS: | |
Gross expenses(g) | | | 2.58 | % | | | 2.59 | % | | | 2.56 | %(b) | | | 2.63 | % | | | 2.52 | % | |
Net expenses after advisory
fees waived and expenses
reimbursed(g)(h) | | | 2.18 | % | | | 2.16 | % | | | 2.26 | % | | | 2.47 | % | | | 2.50 | % | |
Net investment income (loss) | | | 0.65 | % | | | 0.41 | % | | | (0.53 | %)(b) | | | (0.28 | %) | | | 0.35 | % | |
Portfolio turnover rate | | | 504 | % | | | 421 | % | | | 409 | % | | | 350 | % | | | 451 | % | |
(a) Per share amounts were calculated using average shares outstanding for the year.
(b) Includes a non-recurring refund by the custodian for overbilling of prior years' out-of-pocket fees. This amounted to less than $0.01 per share and 0.01% of average net assets.
(c) Includes estimated proceeds from the Fund's participation in a class action lawsuit. This represents a non-recurring gain in the amount of less than $0.005 per share.
(d) Amount rounds to less than $0.01 per share.
(e) Total return is a measure of the change in the value of an investment in the Fund over the years covered, which assumes any dividends or capital gains distributions are reinvested in shares of the Fund. Returns shown do not reflect the deduction of taxes a shareholder would pay on Fund distributions or the redemption of Fund shares or the imposition of any sales load.
(f) Total return excludes sales charges, if any, and would be lower for the period presented if it reflected these charges.
(g) Dividend expense totaled 0.46%, 0.44%, 0.53%, 0.59% and 0.55% of average net assets for the years ended May 31, 2019, 2018, 2017, 2016 and 2015, respectively. Interest rebate expense and line of credit interest expense totaled 0.03%, 0.03%, 0.04%, 0.19% and 0.26% of average net assets for the the years ended May 31, 2019, 2018, 2017, 2016 and 2015, respectively.
(h) Excluding dividend and interest expenses, the Fund's net expenses after advisory fees waived and expenses reimbursed would have been 1.69%, 1.69%, 1.69%, 1.69% and 1.69% of average net assets for the years ended May 31, 2019, 2018, 2017, 2016 and 2015, respectively.
See Notes to Financial Statements.
Annual Report | May 31, 2019
83
The Water Island Credit Opportunities Fund – Class R Financial Highlights
Selected Per Share Data and Ratios for a Share Outstanding Throughout the Periods Presented:
| | | Year Ended May 31, | |
| | | 2019 | | 2018 | | 2017 | | 2016 | | 2015 | |
Net asset value,
beginning of period | | $ | 9.77 | | | $ | 9.67 | | | $ | 9.69 | | | $ | 9.95 | | | $ | 10.28 | | |
Income (loss) from
investment operations | |
Net investment income(a) | | | 0.31 | | | | 0.20 | | | | 0.23 | (b) | | | 0.25 | | | | 0.28 | | |
Net realized and unrealized
gains (losses) on investments
and foreign currencies | | | (0.07 | ) | | | 0.12 | | | | 0.01 | | | | (0.24 | ) | | | (0.29 | ) | |
Total from investment operations | | | 0.24 | | | | 0.32 | | | | 0.24 | | | | 0.01 | | | | (0.01 | ) | |
Less distributions | |
From net investment income | | | (0.31 | ) | | | (0.22 | ) | | | (0.26 | ) | | | (0.27 | ) | | | (0.32 | ) | |
Total distributions | | | (0.31 | ) | | | (0.22 | ) | | | (0.26 | ) | | | (0.27 | ) | | | (0.32 | ) | |
Proceeds from redemption
fees collected | | | – | | | | – | | | | 0.00 | (c) | | | – | | | | 0.00 | (c) | |
Net asset value, end of period | | $ | 9.70 | | | $ | 9.77 | | | $ | 9.67 | | | $ | 9.69 | | | $ | 9.95 | | |
Total return(d) | | | 2.55 | % | | | 3.21 | % | | | 2.58 | % | | | 0.10 | % | | | (0.10 | %) | |
Net assets, end of period
(in 000s) | | $ | 7,845 | | | $ | 9,533 | | | $ | 11,935 | | | $ | 12,426 | | | $ | 22,728 | | |
RATIOS TO AVERAGE NET ASSETS: | |
Gross expenses(e) | | | 2.10 | %(f) | | | 2.27 | % | | | 1.96 | %(b) | | | 1.92 | % | | | 2.27 | % | |
Net expenses after advisory
fees waived and expenses
reimbursed(e)(g) | | | 1.59 | %(f) | | | 1.95 | % | | | 1.66 | % | | | 1.67 | % | | | 2.03 | % | |
Net investment income | | | 3.18 | %(f) | | | 2.09 | % | | | 2.34 | %(b) | | | 2.62 | % | | | 2.84 | % | |
Portfolio turnover rate | | | 221 | % | | | 314 | % | | | 211 | % | | | 181 | % | | | 191 | % | |
(a) Per share amounts were calculated using average shares outstanding for the year.
(b) Includes a non-recurring refund by the custodian for overbilling of prior years' out-of-pocket fees. This amounted to less than $0.01 per share and is less than 0.005% of average net assets.
(c) Amount rounds to less than $0.01 per share.
(d) Total return is a measure of the change in the value of an investment in the Fund over the years covered, which assumes any dividends or capital gains distributions are reinvested in shares of the Fund. Returns shown do not reflect the deduction of taxes a shareholder would pay on Fund distributions or the redemption of Fund shares.
(e) Dividend expense totaled 0.29%, 0.42%, 0.16%, 0.03% and 0.06% of average net assets for the years ended May 31, 2019, 2018, 2017, 2016 and 2015, respectively. Interest rebate expense and line of credit interest expense totaled 0.01%, 0.03%, 0.00% , 0.14% and 0.47% of average net assets for the years ended May 31, 2019, 2018, 2017, 2016 and 2015, respectively.
(f) Effective August 6, 2018, the investment adviser reduced the advisory fee paid by the Fund and agreed to increase the expense reimbursements it provides to the Fund by contractually limiting the Fund's total expenses (other than certain expenses noted in the Notes to Financial Statements) to 1.23% for Class R shares. Prior to August 6, 2018, the expense limitiation had been 1.50%
(g) Excluding dividend and interest expenses, the Fund's net expenses after advisory fees waived and expenses reimbursed would have been 1.29%, 1.50%, 1.50%, 1.50% and 1.50% of average net assets for the years ended May 31, 2019, 2018, 2017, 2016 and 2015, respectively.
See Notes to Financial Statements.
www.arbitragefunds.com | 1-800-295-4485
84
The Water Island Credit Opportunities Fund – Class I Financial Highlights
Selected Per Share Data and Ratios for a Share Outstanding Throughout the Periods Presented:
| | | Year Ended May 31, | |
| | | 2019 | | 2018 | | 2017 | | 2016 | | 2015 | |
Net asset value,
beginning of period | | $ | 9.73 | | | $ | 9.65 | | | $ | 9.67 | | | $ | 9.93 | | | $ | 10.25 | | |
Income (loss) from
investment operations | |
Net investment income(a) | | | 0.34 | | | | 0.23 | | | | 0.25 | (b) | | | 0.27 | | | | 0.33 | | |
Net realized and unrealized
gains (losses) on investments
and foreign currencies | | | (0.08 | ) | | | 0.11 | | | | 0.02 | | | | (0.24 | ) | | | (0.31 | ) | |
Total from investment operations | | | 0.26 | | | | 0.34 | | | | 0.27 | | | | 0.03 | | | | 0.02 | | |
Less distributions | |
From net investment income | | | (0.34 | ) | | | (0.26 | ) | | | (0.29 | ) | | | (0.29 | ) | | | (0.34 | ) | |
Total distributions | | | (0.34 | ) | | | (0.26 | ) | | | (0.29 | ) | | | (0.29 | ) | | | (0.34 | ) | |
Proceeds from redemption
fees collected | | | – | | | | – | | | | – | | | | – | | | | 0.00 | (c) | |
Net asset value, end of period | | $ | 9.65 | | | $ | 9.73 | | | $ | 9.65 | | | $ | 9.67 | | | $ | 9.93 | | |
Total return(d) | | | 2.70 | % | | | 3.61 | % | | | 2.78 | % | | | 0.30 | % | | | 0.16 | % | |
Net assets, end of period
(in 000s) | | $ | 49,795 | | | $ | 36,207 | | | $ | 44,159 | | | $ | 41,992 | | | $ | 46,118 | | |
RATIOS TO AVERAGE NET ASSETS: | |
Gross expenses(e) | | | 1.85 | %(f) | | | 2.02 | % | | | 1.71 | %(b) | | | 1.68 | % | | | 2.04 | % | |
Net expenses after advisory
fees waived and expenses
reimbursed(e)(g) | | | 1.32 | %(f) | | | 1.70 | % | | | 1.41 | % | | | 1.43 | % | | | 1.78 | % | |
Net investment income | | | 3.51 | %(f) | | | 2.34 | % | | | 2.62 | %(b) | | | 2.84 | % | | | 3.28 | % | |
Portfolio turnover rate | | | 221 | % | | | 314 | % | | | 211 | % | | | 181 | % | | | 191 | % | |
(a) Per share amounts were calculated using average shares outstanding for the year.
(b) Includes a non-recurring refund by the custodian for overbilling of prior years' out-of-pocket fees. This amounted to less than $0.01 per share and is less than 0.005% of average net assets.
(c) Amount rounds to less than $0.01 per share.
(d) Total return is a measure of the change in the value of an investment in the Fund over the years covered, which assumes any dividends or capital gains distributions are reinvested in shares of the Fund. Returns shown do not reflect the deduction of taxes a shareholder would pay on Fund distributions or the redemption of Fund shares.
(e) Dividend expense totaled 0.29%, 0.42%, 0.16% 0.04% and 0.06% of average net assets for the years ended May 31, 2019, 2018, 2017, 2016 and 2015, respectively. Interest rebate expense and line of credit interest expense totaled 0.01%, 0.03%, 0.00%, 0.14% and 0.47% of average net assets for the years ended May 31, 2019, 2018, 2017, 2016 and 2015, respectively.
(f) Effective August 6, 2018, the investment adviser reduced the advisory fee paid by the Fund and agreed to increase the expense reimbursements it provides to the Fund by contractually limiting the Fund's total expenses (other than certain expenses noted in the Notes to Financial Statements) to 0.98% for Class I shares. Prior to August 6, 2018, the expense limitiation had been 1.25%
(g) Excluding dividend and interest expenses, the Fund's net expenses after advisory fees waived and expenses reimbursed would have been 1.02%, 1.25%, 1.25%, 1.25% and 1.25% of average net assets for the years ended May 31, 2019, 2018, 2017, 2016 and 2015, respectively.
See Notes to Financial Statements.
Annual Report | May 31, 2019
85
The Water Island Credit Opportunities Fund – Class C Financial Highlights
Selected Per Share Data and Ratios for a Share Outstanding Throughout the Periods Presented:
| | | Year Ended May 31, | |
| | | 2019 | | 2018 | | 2017 | | 2016 | | 2015 | |
Net asset value,
beginning of period | | $ | 9.74 | | | $ | 9.62 | | | $ | 9.61 | | | $ | 9.89 | | | $ | 10.23 | | |
Income (loss) from
investment operations | |
Net investment income(a) | | | 0.24 | | | | 0.13 | | | | 0.16 | (b) | | | 0.18 | | | | 0.22 | | |
Net realized and unrealized
gains (losses) on investments
and foreign currencies | | | (0.07 | ) | | | 0.11 | | | | 0.02 | | | | (0.25 | ) | | | (0.30 | ) | |
Total from investment operations | | | 0.17 | | | | 0.24 | | | | 0.18 | | | | (0.07 | ) | | | (0.08 | ) | |
Less distributions | |
From net investment income | | | (0.24 | ) | | | (0.12 | ) | | | (0.17 | ) | | | (0.21 | ) | | | (0.26 | ) | |
Total distributions | | | (0.24 | ) | | | (0.12 | ) | | | (0.17 | ) | | | (0.21 | ) | | | (0.26 | ) | |
Net asset value, end of period | | $ | 9.67 | | | $ | 9.74 | | | $ | 9.62 | | | $ | 9.61 | | | $ | 9.89 | | |
Total return(c)(d) | | | 1.79 | % | | | 2.53 | % | | | 1.83 | % | | | (0.72 | %) | | | (0.76 | %) | |
Net assets, end of period (in 000s) | | $ | 468 | | | $ | 640 | | | $ | 1,053 | | | $ | 1,220 | | | $ | 2,020 | | |
RATIOS TO AVERAGE NET ASSETS: | |
Gross expenses(e) | | | 2.86 | %(f) | | | 3.02 | % | | | 2.71 | %(b) | | | 2.68 | % | | | 3.05 | % | |
Net expenses after advisory
fees waived and expenses
reimbursed(e)(g) | | | 2.34 | %(f) | | | 2.70 | % | | | 2.41 | % | | | 2.43 | % | | | 2.78 | % | |
Net investment income | | | 2.46 | %(f) | | | 1.38 | % | | | 1.69 | %(b) | | | 1.92 | % | | | 2.24 | % | |
Portfolio turnover rate | | | 221 | % | | | 314 | % | | | 211 | % | | | 181 | % | | | 191 | % | |
(a) Per share amounts were calculated using average shares outstanding for the year.
(b) Includes a non-recurring refund by the custodian for overbilling of prior years' out-of-pocket fees. This amounted to less than $0.01 per share and is less than 0.005% of average net assets.
(c) Total return is a measure of the change in the value of an investment in the Fund over the years covered, which assumes any dividends or capital gains distributions are reinvested in shares of the Fund. Returns shown do not reflect the deduction of taxes a shareholder would pay on Fund distributions or the redemption of Fund shares.
(d) Total return excludes sales charges, if any, and would be lower for the period presented if it reflected these charges.
(e) Dividend expense totaled 0.29%, 0.42%, 0.16%, 0.04% and 0.06% of average net assets for the years ended May 31, 2019, 2018, 2017, 2016 and 2015, respectively. Interest rebate expense and line of credit interest expense totaled 0.01%, 0.03%, 0.00%, 0.14% and 0.47% of average net assets for the years ended May 31, 2019, 2018, 2017, 2016 and 2015, respectively.
(f) Effective August 6, 2018, the investment adviser reduced the advisory fee paid by the Fund and agreed to increase the expense reimbursements it provides to the Fund by contractually limiting the Fund's total expenses (other than certain expenses noted in the Notes to Financial Statements) to 1.98% for Class C shares. Prior to August 6, 2018, the expense limitiation had been 2.25%.
(g) Excluding dividend and interest expenses, the Fund's net expenses after advisory fees waived and expenses reimbursed would have been 2.04%, 2.25%, 2.25%, 2.25% and 2.25% of average net assets for the years ended May 31, 2019, 2018, 2017, 2016 and 2015, respectively.
See Notes to Financial Statements.
www.arbitragefunds.com | 1-800-295-4485
86
The Water Island Credit Opportunities Fund – Class A Financial Highlights
Selected Per Share Data and Ratios for a Share Outstanding Throughout the Periods Presented:
| | | Year Ended May 31, | |
| | | 2019 | | 2018 | | 2017 | | 2016 | | 2015 | |
Net asset value,
beginning of period | | $ | 9.73 | | | $ | 9.66 | | | $ | 9.67 | | | $ | 9.93 | | | $ | 10.25 | | |
Income (loss) from
investment operations | |
Net investment income(a) | | | 0.31 | | | | 0.17 | | | | 0.23 | (b) | | | 0.25 | | | | 0.29 | | |
Net realized and unrealized
gains (losses) on investments
and foreign currencies | | | (0.08 | ) | | | 0.14 | | | | 0.02 | | | | (0.25 | ) | | | (0.29 | ) | |
Total from investment operations | | | 0.23 | | | | 0.31 | | | | 0.25 | | | | – | | | | – | | |
Less distributions | |
From net investment income | | | (0.31 | ) | | | (0.24 | ) | | | (0.26 | ) | | | (0.26 | ) | | | (0.32 | ) | |
Total distributions | | | (0.31 | ) | | | (0.24 | ) | | | (0.26 | ) | | | (0.26 | ) | | | (0.32 | ) | |
Net asset value, end of period | | $ | 9.65 | | | $ | 9.73 | | | $ | 9.66 | | | $ | 9.67 | | | $ | 9.93 | | |
Total return(c)(d) | | | 2.45 | % | | | 3.10 | % | | | 2.58 | % | | | 0.02 | % | | | (0.01 | %) | |
Net assets, end of period (in 000s) | | $ | 121 | | | $ | 153 | | | $ | 107 | | | $ | 104 | | | $ | 630 | | |
RATIOS TO AVERAGE NET ASSETS: | |
Gross expenses(e) | | | 2.10 | %(f) | | | 2.27 | % | | | 1.96 | %(b) | | | 1.91 | % | | | 2.29 | % | |
Net expenses after advisory
fees waived and expenses
reimbursed(e)(g) | | | 1.58 | %(f) | | | 1.95 | % | | | 1.66 | % | | | 1.66 | % | | | 2.03 | % | |
Net investment income | | | 3.24 | %(f) | | | 1.81 | % | | | 2.35 | %(b) | | | 2.62 | % | | | 2.95 | % | |
Portfolio turnover rate | | | 221 | % | | | 314 | % | | | 211 | % | | | 181 | % | | | 191 | % | |
(a) Per share amounts were calculated using average shares outstanding for the year.
(b) Includes a non-recurring refund by the custodian for overbilling of prior years' out-of-pocket fees. This amounted to less than $0.01 per share and is less than 0.005% of average net assets.
(c) Total return is a measure of the change in the value of an investment in the Fund over the years covered, which assumes any dividends or capital gains distributions are reinvested in shares of the Fund. Returns shown do not reflect the deduction of taxes a shareholder would pay on Fund distributions or the redemption of Fund shares or the imposition of any sales load.
(d) Total return excludes sales charges, if any, and would be lower for the period presented if it reflected these charges.
(e) Dividend expense totaled 0.29%, 0.42%, 0.16%, 0.02% and 0.06% of average net assets for the years ended May 31, 2019, 2018, 2017, 2016 and 2015, respectively. Interest rebate expense and line of credit interest expense totaled 0.01%, 0.03%, 0.00%, 0.14% and 0.47% of average net assets for the the years ended May 31, 2019, 2018, 2017, 2016 and 2015, respectively.
(f) Effective August 6, 2018, the investment adviser reduced the advisory fee paid by the Fund and agreed to increase the expense reimbursements it provides to the Fund by contractually limiting the Fund's total expenses (other than certain expenses noted in the Notes to Financial Statements) to 1.23% for Class A shares. Prior to August 6, 2018, the expense limitiation had been 1.50%
(g) Excluding dividend and interest expenses, the Fund's net expenses after advisory fees waived and expenses reimbursed would have been 1.28%, 1.50%, 1.50%, 1.50% and 1.50% of average net assets for the years ended May 31, 2019, 2018, 2017, 2016 and 2015, respectively.
See Notes to Financial Statements.
Annual Report | May 31, 2019
87
The Water Island Long/Short Fund – Class R Financial Highlights
Selected Per Share Data and Ratios for a Share Outstanding Throughout the Periods Presented:
| | | Year Ended May 31, | | Period
Ended
May 31, | |
| | | 2019 | | 2018 | | 2017 | | 2016 | | 2015(a) | |
Net asset value,
beginning of period | | $ | 10.12 | | | $ | 9.99 | | | $ | 9.31 | | | $ | 10.12 | | | $ | 10.00 | | |
Income (loss) from
investment operations | |
Net investment loss(b) | | | (0.01 | )(d) | | | (0.05 | ) | | | (0.20 | )(c) | | | (0.03 | ) | | | (0.10 | ) | |
Net realized and unrealized
gains (losses) on investments
and foreign currencies | | | (0.03 | ) | | | 0.18 | | | | 0.88 | | | | (0.69 | ) | | | 0.22 | | |
Total from investment operations | | | (0.04 | ) | | | 0.13 | | | | 0.68 | | | | (0.72 | ) | | | 0.12 | | |
Less distributions | |
From net realized gains | | | (0.20 | ) | | | – | | | | – | | | | (0.09 | ) | | | – | | |
Total distributions | | | (0.20 | ) | | | – | | | | – | | | | (0.09 | ) | | | – | | |
Net asset value, end of period | | $ | 9.88 | | | $ | 10.12 | | | $ | 9.99 | | | $ | 9.31 | | | $ | 10.12 | | |
Total return(e) | | | (0.29 | %) | | | 1.30 | % | | | 7.30 | % | | | (7.12 | %) | | | 1.20 | %(f) | |
Net assets, end of period (in 000s) | | $ | 10 | | | $ | 10 | | | $ | 10 | | | $ | 9 | | | $ | 10 | | |
RATIOS TO AVERAGE NET ASSETS: | |
Gross expenses(g) | | | 11.69 | % | | | 12.52 | % | | | 15.85 | %(c) | | | 20.24 | % | | | 44.48 | %(h) | |
Net expenses after advisory
fees waived and expenses
reimbursed(g)(i) | | | 2.43 | % | | | 2.35 | % | | | 2.66 | % | | | 2.62 | % | | | 2.85 | %(h) | |
Net investment loss | | | (0.15 | %) | | | (0.47 | %) | | | (2.14 | %)(c) | | | (0.34 | %) | | | (2.35 | %)(h) | |
Portfolio turnover rate | | | 528 | % | | | 520 | % | | | 449 | % | | | 416 | % | | | 235 | %(f) | |
(a) Commenced operations on January 2, 2015.
(b) Per share amounts were calculated using average shares outstanding for the year.
(c) Includes a non-recurring refund by the custodian for overbilling of prior years' out-of-pocket fees. This amounted to $0.01 per share and 0.08% of average net assets.
(d) The amount shown for a share outstanding throughout the period may not correlate with the Statement of Operations for the period due to timing of sales and redemptions of Fund shares in relation to income earned and/or fluctuating market value of the investments of the Fund.
(e) Total return is a measure of the change in the value of an investment in the Fund over the years covered, which assumes any dividends or capital gains distributions are reinvested in shares of the Fund. Returns shown do not reflect the deduction of taxes a shareholder would pay on Fund distributions or the redemption of Fund shares.
(f) Not annualized.
(g) Dividend expense totaled 0.74%, 0.66%, 0.84%, 0.70% and 1.01% (annualized) of average net assets for the years ended May 31, 2019, 2018, 2017, 2016, and the period ended May 31, 2015, respectively. Interest rebate expense and line of credit interest expense totaled 0.00%, 0.00%, 0.13%, 0.23% and 0.15% (annualized) of average net assets for the years ended May 31, 2019, 2018, 2017, 2016, and the period ended May 31, 2015, respectively.
(h) Annualized.
(i) Excluding dividend and interest expenses, the Fund's net expenses after advisory fees waived and expenses reimbursed would have been 1.69%, 1.69%, 1.69%, 1.69% and 1.69% (annualized) of average net assets for the years ended May 31, 2019, 2018, 2017, 2016, and the period ended May 31, 2015, respectively.
See Notes to Financial Statements.
www.arbitragefunds.com | 1-800-295-4485
88
The Water Island Long/Short Fund – Class I Financial Highlights
Selected Per Share Data and Ratios for a Share Outstanding Throughout the Periods Presented:
| | | Year Ended May 31, | | Period
Ended
May 31, | |
| | | 2019 | | 2018 | | 2017 | | 2016 | | 2015(a) | |
Net asset value,
beginning of period | | $ | 10.12 | | | $ | 9.99 | | | $ | 9.31 | | | $ | 10.12 | | | $ | 10.00 | | |
Income (loss) from
investment operations | |
Net investment income (loss)(b) | | | 0.01 | | | | (0.02 | ) | | | (0.18 | )(c) | | | (0.04 | ) | | | (0.09 | ) | |
Net realized and unrealized
gains (losses) on investments
and foreign currencies | | | (0.05 | ) | | | 0.15 | | | | 0.86 | | | | (0.68 | ) | | | 0.21 | | |
Total from investment operations | | | (0.04 | ) | | | 0.13 | | | | 0.68 | | | | (0.72 | ) | | | 0.12 | | |
Less distributions | |
From net realized gains | | | (0.20 | ) | | | – | | | | – | | | | (0.09 | ) | | | – | | |
Total distributions | | | (0.20 | ) | | | – | | | | – | | | | (0.09 | ) | | | – | | |
Net asset value, end of period | | $ | 9.88 | | | $ | 10.12 | | | $ | 9.99 | | | $ | 9.31 | | | $ | 10.12 | | |
Total return(d) | | | (0.29 | %) | | | 1.30 | % | | | 7.30 | % | | | (7.12 | %) | | | 1.20 | %(e) | |
Net assets, end of period (in 000s) | | $ | 2,344 | | | $ | 2,177 | | | $ | 2,048 | | | $ | 1,302 | | | $ | 1,386 | | |
RATIOS TO AVERAGE NET ASSETS: | |
Gross expenses(f) | | | 11.44 | % | | | 12.27 | % | | | 15.60 | %(c) | | | 20.02 | % | | | 28.08 | %(g) | |
Net expenses after advisory
fees waived and expenses
reimbursed(f)(h) | | | 2.18 | % | | | 2.10 | % | | | 2.41 | % | | | 2.40 | % | | | 2.60 | %(g) | |
Net investment income (loss) | | | 0.12 | % | | | (0.22 | %) | | | (1.88 | %)(c) | | | (0.47 | %) | | | (2.15 | %)(g) | |
Portfolio turnover rate | | | 528 | % | | | 520 | % | | | 449 | % | | | 416 | % | | | 235 | %(e) | |
(a) Commenced operations on January 2, 2015.
(b) Per share amounts were calculated using average shares outstanding for the year.
(c) Includes a non-recurring refund by the custodian for overbilling of prior years' out-of-pocket fees. This amounted to $0.01 per share and 0.08% of average net assets.
(d) Total return is a measure of the change in the value of an investment in the Fund over the years covered, which assumes any dividends or capital gains distributions are reinvested in shares of the Fund. Returns shown do not reflect the deduction of taxes a shareholder would pay on Fund distributions or the redemption of Fund shares.
(e) Not annualized.
(f) Dividend expense totaled 0.74%, 0.66%, 0.84%, 0.72% and 1.01% (annualized) of average net assets for the years ended May 31, 2019, 2018, 2017, 2016, and the period ended May 31, 2015, respectively. Interest rebate expense and line of credit interest expense totaled 0.00%, 0.00%, 0.13%, 0.24% and 0.15% (annualized) of average net assets for the years ended May 31, 2019, 2018, 2017, 2016, and the period ended May 31, 2015, respectively.
(g) Annualized.
(h) Excluding dividend and interest expenses, the Fund's net expenses after advisory fees waived and expenses reimbursed would have been 1.44%, 1.44%, 1.44%, 1.44% and 1.44% (annualized) of average net assets for the years ended May 31, 2019, 2018, 2017, 2016, and the period ended May 31, 2015, respectively.
See Notes to Financial Statements.
Annual Report | May 31, 2019
89
The Water Island Long/Short Fund – Class C Financial Highlights
Selected Per Share Data and Ratios for a Share Outstanding Throughout the Periods Presented:
| | | Year Ended May 31, | | Period
Ended
May 31, | |
| | | 2019 | | 2018 | | 2017 | | 2016 | | 2015(a) | |
Net asset value,
beginning of period | | $ | 10.12 | | | $ | 9.99 | | | $ | 9.31 | | | $ | 10.12 | | | $ | 10.00 | | |
Income (loss) from
investment operations | |
Net investment loss(b) | | | (0.09 | )(d) | | | (0.12 | ) | | | (0.28 | )(c) | | | (0.10 | ) | | | (0.13 | ) | |
Net realized and unrealized
gains (losses) on investments
and foreign currencies | | | 0.05 | (d) | | | 0.25 | | | | 0.96 | | | | (0.62 | ) | | | 0.25 | | |
Total from investment operations | | | (0.04 | ) | | | 0.13 | | | | 0.68 | | | | (0.72 | ) | | | 0.12 | | |
Less distributions | |
From net realized gains | | | (0.20 | ) | | | – | | | | – | | | | (0.09 | ) | | | – | | |
Total distributions | | | (0.20 | ) | | | – | | | | – | | | | (0.09 | ) | | | – | | |
Net asset value, end of period | | $ | 9.88 | | | $ | 10.12 | | | $ | 9.99 | | | $ | 9.31 | | | $ | 10.12 | | |
Total return(e)(f) | | | (0.29 | %) | | | 1.30 | % | | | 7.30 | % | | | (7.12 | %) | | | 1.20 | %(g) | |
Net assets, end of period (in 000s) | | $ | 10 | | | $ | 10 | | | $ | 10 | | | $ | 9 | | | $ | 10 | | |
RATIOS TO AVERAGE NET ASSETS: | |
Gross expenses(h) | | | 12.43 | % | | | 13.27 | % | | | 16.59 | %(c) | | | 20.99 | % | | | 45.25 | %(i) | |
Net expenses after advisory
fees waived and expenses
reimbursed(h)(j) | | | 3.17 | % | | | 3.10 | % | | | 3.40 | % | | | 3.37 | % | | | 3.60 | %(i) | |
Net investment loss | | | (0.89 | %) | | | (1.20 | %) | | | (2.89 | %)(c) | | | (1.09 | %) | | | (3.10 | %)(i) | |
Portfolio turnover rate | | | 528 | % | | | 520 | % | | | 449 | % | | | 416 | % | | | 235 | %(g) | |
(a) Commenced operations on January 2, 2015.
(b) Per share amounts were calculated using average shares outstanding for the year.
(c) Includes a non-recurring refund by the custodian for overbilling of prior years' out-of-pocket fees. This amounted to $0.01 per share and 0.08% of average net assets.
(d) The amount shown for a share outstanding throughout the period may not correlate with the Statement of Operations for the period due to timing of sales and redemptions of Fund shares in relation to income earned and/or fluctuating market value of the investments of the Fund.
(e) Total return is a measure of the change in the value of an investment in the Fund over the years covered, which assumes any dividends or capital gains distributions are reinvested in shares of the Fund. Returns shown do not reflect the deduction of taxes a shareholder would pay on Fund distributions or the redemption of Fund shares.
(f) Total return excludes sales charges, if any, and would be lower for the period presented if it reflected these charges.
(g) Not annualized.
(h) Dividend expense totaled 0.73%, 0.66%, 0.83%, 0.70% and 1.01% (annualized) of average net assets for the years ended May 31, 2019, 2018, 2017, 2016, and the period ended May 31, 2015, respectively. Interest rebate expense and line of credit interest expense totaled 0.00%, 0.00%, 0.13%, 0.23% and 0.15% (annualized) of average net assets for the years ended May 31, 2019, 2018, 2017, 2016, and the period ended May 31, 2015, respectively.
(i) Annualized.
(j) Excluding dividend and interest expenses, the Fund's net expenses after advisory fees waived and expenses reimbursed would have been 2.44% , 2.44%, 2.44%, 2.44% and 2.44% (annualized) of average net assets for the years ended May 31, 2019, 2018, 2017, 2016, and the period ended May 31, 2015, respectively.
See Notes to Financial Statements.
www.arbitragefunds.com | 1-800-295-4485
90
The Water Island Long/Short Fund – Class A Financial Highlights
Selected Per Share Data and Ratios for a Share Outstanding Throughout the Periods Presented:
| | | Year Ended May 31, | | Period
Ended
May 31, | |
| | | 2019 | | 2018 | | 2017 | | 2016 | | 2015(a) | |
Net asset value,
beginning of period | | $ | 10.12 | | | $ | 9.99 | | | $ | 9.31 | | | $ | 10.12 | | | $ | 10.00 | | |
Income (loss) from
investment operations | |
Net investment (loss)(b) | | | (0.01 | )(d) | | | (0.05 | ) | | | (0.20 | )(c) | | | (0.03 | ) | | | (0.10 | ) | |
Net realized and unrealized
gains (losses) on investments
and foreign currencies | | | (0.03 | ) | | | 0.18 | | | | 0.88 | | | | (0.69 | ) | | | 0.22 | | |
Total from investment operations | | | (0.04 | ) | | | 0.13 | | | | 0.68 | | | | (0.72 | ) | | | 0.12 | | |
Less distributions | |
From net realized gains | | | (0.20 | ) | | | – | | | | – | | | | (0.09 | ) | | | – | | |
Total distributions | | | (0.20 | ) | | | – | | | | – | | | | (0.09 | ) | | | – | | |
Net asset value, end of period | | $ | 9.88 | | | $ | 10.12 | | | $ | 9.99 | | | $ | 9.31 | | | $ | 10.12 | | |
Total return(e)(f) | | | (0.29 | %) | | | 1.30 | % | | | 7.30 | % | | | (7.12 | %) | | | 1.20 | %(g) | |
Net assets, end of period (in 000s) | | $ | 10 | | | $ | 10 | | | $ | 10 | | | $ | 9 | | | $ | 10 | | |
RATIOS TO AVERAGE NET ASSETS: | |
Gross expenses(h) | | | 11.69 | % | | | 12.52 | % | | | 15.84 | %(c) | | | 20.24 | % | | | 44.49 | %(i) | |
Net expenses after advisory
fees waived and expenses
reimbursed(h)(j) | | | 2.43 | % | | | 2.35 | % | | | 2.65 | % | | | 2.62 | % | | | 2.85 | %(i) | |
Net investment loss | | | (0.14 | %)(d) | | | (0.46 | %) | | | (2.13 | %)(c) | | | (0.34 | %) | | | (2.35 | %)(i) | |
Portfolio turnover rate | | | 528 | % | | | 520 | % | | | 449 | % | | | 416 | % | | | 235 | %(g) | |
(a) Commenced operations on January 2, 2015.
(b) Per share amounts were calculated using average shares outstanding for the year.
(c) Includes a non-recurring refund by the custodian for overbilling of prior years' out-of-pocket fees. This amounted to $0.01 per share and 0.08% of average net assets.
(d) The amount shown for a share outstanding throughout the period may not correlate with the Statement of Operations for the period due to timing of sales and redemptions of Fund shares in relation to income earned and/or fluctuating market value of the investments of the Fund.
(e) Total return is a measure of the change in the value of an investment in the Fund over the years covered, which assumes any dividends or capital gains distributions are reinvested in shares of the Fund. Returns shown do not reflect the deduction of taxes a shareholder would pay on Fund distributions or the redemption of Fund shares or the imposition of any sales load.
(f) Total return excludes sales charges, if any, and would be lower for the period presented if it reflected these charges.
(g) Not annualized.
(h) Dividend expense totaled 0.74%, 0.66%, 0.83%, 0.70% and 1.01% (annualized) of average net assets for the years ended May 31, 2019, 2018, 2017, 2016, and the period ended May 31, 2015, respectively. Interest rebate expense and line of credit interest expense totaled 0.00%, 0.00%, 0.13%, 0.23% and 0.15% (annualized) of average net assets for the years ended May 31, 2019, 2018, 2017, 2016, and the period ended May 31, 2015, respectively.
(i) Annualized.
(j) Excluding dividend and interest expenses, the Fund's net expenses after advisory fees waived and expenses reimbursed would have been 1.69%, 1.69%, 1.69%, 1.69% and 1.69% (annualized) of average net assets for the years ended May 31, 2019, 2018, 2017, 2016 and the period ended May 31, 2015, respectively.
See Notes to Financial Statements.
Annual Report | May 31, 2019
91
The Arbitrage Funds Notes to Financial Statements
1. ORGANIZATION
The Arbitrage Funds (the "Trust") is a Delaware statutory trust, which was organized on December 22, 1999 and is registered under the Investment Company Act of 1940, as amended (the "1940 Act"), as an open-end management investment company issuing its shares in series. Each series represents a distinct portfolio with its own investment objective and policies. The four series presently authorized are The Arbitrage Fund (the "Arbitrage Fund"), The Arbitrage Event-Driven Fund (the "Event-Driven Fund"), The Water Island Credit Opportunities Fund (the "Credit Opportunities Fund") and The Water Island Long/Short Fund (the "Long/Short Fund"), each a "Fund" and collectively the "Funds", which offer four classes of shares. Effective August 6, 2018, The Arbitrage Credit Opportunities Fund changed its name to The Water Island Credit Opportunities Fund. The Arbitrage Credit Opportunities Fund's portfolio manager, investment objective and investment strategies did not change. Effective March 12, 2019, The Arbitrage Tactical Equity Fund changed its name to The Water Island Long/Short Fund and changed its investment objective to seek to achieve capital appreciation over a full market cycle with lower volatility than the broad equity market. To pursue its investment objective, the Long/Short Fund employs a "long/short" investment strategy to attempt to achieve capital appreciation and manage risk by purchasing stocks believed to be undervalued and selling short stocks believed to be overvalued. The Long/Short Fund's investment adviser believes that a combination of long and short positions may provide positive returns through a complete market cycle and may offer reduced risk. The Arbitrage Fund, the Event-Driven Fund and the Credit Opportunities Fund are each a diversified series of the Trust. The Long/Short Fund is a non-diversified series of the Trust. The Funds' investments are managed by Water Island Capital, LLC (the "Adviser").
| | | Commencement of Operations | |
Fund | | Class R shares | | Class I shares | | Class C shares | | Class A shares | |
Arbitrage Fund | | September 18, 2000 | | October 17, 2003 | | June 1, 2012 | | June 1, 2013 | |
Event-Driven Fund | | October 1, 2010 | | October 1, 2010 | | June 1, 2012 | | June 1, 2013 | |
Credit Opportunities
Fund | | October 1, 2012 | | October 1, 2012 | | October 1, 2012 | | June 1, 2013 | |
Long/Short Fund | | January 2, 2015 | | January 2, 2015 | | January 2, 2015 | | January 2, 2015 | |
The investment objective of the Arbitrage Fund is to seek to achieve capital growth by engaging in merger arbitrage. The investment objective of the Event-Driven Fund is to seek to achieve capital growth by investing in companies that are impacted by corporate events such as mergers, acquisitions, restructurings, recapitalizations, refinancings, reorganizations and other special situations. The investment objective of the Credit Opportunities Fund is to seek to provide current income and capital growth by investing in debt securities impacted by events such as reorganizations, restructurings, recapitalizations, debt maturities, refinancings, mergers, acquisitions, regulatory changes and other special situations. The investment objective of the Long/Short Fund is to seek to achieve capital appreciation over a full market cycle with lower volatility than the broad equity market.
The Funds' four classes of shares, Class R, Class I, Class C and Class A, represent interests in the same portfolio of investments and have the same rights, but differ primarily in the expenses to which they are subject and the investment eligibility requirements. Class R shares, Class C shares and Class A shares are subject to an annual distribution and servicing fee of up to 0.25%, 1.00% and 0.25%, respectively, of each Fund's average daily net assets attributable to Class R shares, Class C shares and Class A shares, respectively, whereas Class I shares are not subject to any distribution and servicing fees. Class C shares are also subject to a 1.00% contingent deferred
www.arbitragefunds.com | 1-800-295-4485
92
The Arbitrage Funds Notes to Financial Statements (continued)
sales charge on all purchases redeemed within 12 months of purchase. Class A shares of the Arbitrage Fund are sold subject to a maximum front-end sales load equal to 2.50% of the offering price and are also subject to a 1.00% contingent deferred sales load on purchases at or above $250,000, purchased without a front-end sales charge and redeemed within 18 months of purchase. Class A shares of the Event-Driven Fund, the Credit Opportunities Fund and the Long/Short Fund are sold subject to a maximum front-end sales load equal to 3.25% of the offering price and are also subject to a 1.00% contingent deferred sales load on purchases at or above $500,000, purchased without a front-end sales charge and redeemed within 18 months of purchase. Effective June 30, 2018, Class A shares of the Event-Driven Fund and the Credit Opportunities Fund are sold subject to a maximum front-end sales load equal to 3.25% of the offering price and are also subject to a 1.00% contingent deferred sales load on purchases at or above $500,000 made prior to June 30, 2018 and on purchases at or above $250,000 made after June 30, 2018 (determined on a first-in, first-out basis), purchased without a front-end sales charge and redeemed within 18 months of purchase.
2. SIGNIFICANT ACCOUNTING POLICIES
The following is a summary of significant accounting policies followed by the Funds. These policies are in conformity with U.S. generally accepted accounting principles ("GAAP"). The Funds are considered investment companies for financial reporting purposes under GAAP and Accounting Standards Codification Topic 946 — Financial Services — Investment Companies.
In August 2018, the Securities and Exchange Commission ("SEC") released its Final Rule on Disclosure Update and Simplification (the "Final Rule") which is intended to simplify an issuer's disclosure compliance efforts by removing redundant or outdated disclosure requirements without significantly altering the mix of information provided to investors. The most notable impacts being that the portfolio is no longer required to present the components of distributable earnings on the Statement of Assets and Liabilities, or the sources of distributions to shareholders and the amount of undistributed net investment income on the Statement of Changes in Net Assets. The compliance date for the amendments to Regulation S-X is November 5, 2018. Management has evaluated and adopted the disclosure requirements and the impact is reflected within the Fund's financial statements.
In August 2018, the Financial Accounting Standards Board issued Accounting Standards Update ("ASU") No. 2018-13, Fair Value Measurement (Topic 820): Disclosure Framework — Changes to the Disclosure Requirements for Fair Value Measurement, which amends and eliminates certain disclosure requirements for fair value as part of its framework project. The ASU is effective for annual and interim periods beginning after December 15, 2019. The early adoption of the removal or modification of disclosures and delay of adoption of the additional disclosures is permitted. As of May 31, 2019, the Funds have early-adopted the removal of applicable disclosures.
In March 2017, the Financial Accounting Standards Board issued ASU No. 2017-08, Premium Amortization on Purchased Callable Debt Securities, which amends the accounting standards to shorten the amortization period of certain purchased callable debt securities to the earliest call date. The ASU is effective for annual and interim periods beginning after December 15, 2018. At this time, management is evaluating the implications of these changes on the financial statements.
Use of Estimates — The preparation of financial statements in conformity with GAAP requires management to make estimates and assumptions that affect the reported amounts of assets and liabilities at the date of the financial statements and the reported amounts of increases and
Annual Report | May 31, 2019
93
The Arbitrage Funds Notes to Financial Statements (continued)
decreases in net assets from operations during the reporting period. Actual results could differ from those estimates.
Valuation of Investments — The Funds' portfolio securities are valued as of the close of trading of the New York Stock Exchange ("NYSE") (normally 4:00 p.m., Eastern standard time). Common stocks, mutual funds and other securities, including open short positions that are traded on a securities exchange, are valued at the last quoted sales price at the close of regular trading on the day the valuation is made. Securities which are quoted by NASDAQ are valued at the NASDAQ Official Closing Price. Price information on listed stocks is taken from the exchange where the security is primarily traded. Redeemable securities issued by open-end investment companies are valued at the investment company's respective net asset value, with the exception of exchange-traded open-end investment companies, which are priced as common stocks. Market quotations of foreign securities from the principal markets in which they trade may not be reliable if events or circumstances that may affect the value of portfolio securities occur between the time of the market quotation and the close of trading on the NYSE. If a significant event that affects the valuation of a foreign security occurs between the close of a foreign security's primary exchange and the time the Funds calculate their net asset value ("NAV"), the Funds will fair value the foreign security to account for this discrepancy. Securities which are listed on an exchange but which are not traded on the valuation date are valued at the mean of the most recent bid and ask prices. Put and call options and securities traded in the over-the-counter market are valued at the mean of the most recent bid and ask prices. When there is no bid price available, put and call options will be valued using the average of the last ask price and zero. Foreign currency forward contracts are valued at the current day's interpolated foreign exchange rate, as calculated using the current day's spot rate, and the thirty, sixty, ninety and one-hundred eighty day forward rates provided by an independent source.
If available, debt securities are priced based upon an evaluated bid provided by independent, third-party pricing agents. The third-party pricing agents may also value debt securities at an evaluated bid price by employing methodologies that utilize actual market transactions, broker-supplied valuations, or other methodologies designed to identify the market value for such securities. Unlisted securities for which market quotations are readily available are valued at the latest quoted bid price. Swap contracts that are listed or traded on a national securities exchange, commodities exchange, contract market or comparable over-the-counter market, and that are freely transferable, are valued at their closing settlement price on the exchange on which they are primarily traded or based upon the current settlement price for a like instrument acquired on the day on which the instrument is being valued. Over-the-counter swap contracts for which market quotations are readily available are valued based on quotes received from independent pricing services or one or more dealers that make markets in such securities.
Other assets and securities for which no quotations are readily available are valued at fair value using methods determined in good faith by the Pricing Committee, which is under the supervision of the Board of Trustees of the Trust. Some of the more common reasons that may necessitate that a security be valued at fair value include: the security's trading has been halted or suspended; the security has been delisted from a national exchange; the security's primary trading market is temporarily closed at a time when under normal conditions it would be open; the security has been acquired through completion of a merger/tender or the security's primary pricing source is not able or willing to provide a price. Such methods of fair valuation may include, but are not limited to: multiple of earnings, multiple of book value, discount from market of a similar freely traded security, purchase price of a security, subsequent private transactions in the security or related securities, or a combination of these and other factors. Foreign securities are translated
www.arbitragefunds.com | 1-800-295-4485
94
The Arbitrage Funds Notes to Financial Statements (continued)
from the local currency into U.S. dollars using currency exchange rates supplied by a quotation service.
Fair Value Measurements — In accordance with the authoritative guidance on fair value measurements under GAAP, the Funds disclose fair value of their investments in a hierarchy that prioritizes the inputs to valuation techniques used to measure the fair value. The objective of a fair value measurement is to determine the price that would be received to sell an asset or paid to transfer a liability in an orderly transaction between market participants at the measurement date (an exit price). Accordingly, the fair value hierarchy gives the highest priority to quoted prices (unadjusted) in active markets for identical assets or liabilities (Level 1) and the lowest priority to unobservable inputs (Level 3). The guidance establishes three levels of the fair value hierarchy as follows:
Level 1 — Unadjusted quoted prices in active markets for identical, unrestricted assets or liabilities that the Funds have the ability to access at the measurement date;
Level 2 — Observable inputs other than quoted prices included in Level 1 that are observable (either directly or indirectly) for substantially the full term of the asset or liability; and
Level 3 — Unobservable inputs for the asset or liability, to the extent relevant observable inputs are not available, representing each Fund's own assumption about the assumptions a market participant would use in valuing the asset or liability, and would be based on the best information available.
Investments are classified within the level of the lowest significant input considered in determining fair value. Investments classified within Level 3, whose fair value measurement considers several inputs, may include Level 1 or Level 2 inputs as components of the overall fair value measurement. The inputs or methodology used for valuing securities are not necessarily an indication of the risk associated with investing in those securities.
For the year ended May 31, 2019, there were no significant changes to the Funds' fair value methodologies. Transfers for Level 3 securities, if any, are shown as part of the leveling table in each Fund's Portfolio of Investments.
Share Valuation and Redemption Fees — The net asset value per share of each class of shares of the Funds is calculated daily by dividing the total value of a Fund's assets attributable to that class, less liabilities attributable to that class, by the number of shares of that class outstanding. The offering price and redemption price per share of each class of each Fund is equal to the net asset value per share. Effective September 30, 2017, the Trust no longer imposes a redemption fee for shares of the Fund sold within a certain number of days of purchase. Prior to September 30, 2017, Class R, Class I and Class A shares of the Arbitrage Fund, Event-Driven Fund and Long/Short Fund were subject to a redemption fee of 2% if redeemed within 30 days of purchase and Class R, Class I and Class A shares of the Credit Opportunities Fund were subject to a redemption fee of 2% if redeemed within 60 days of purchase. The Class A redemption fee did not apply for purchases over $250,000 in the Arbitrage Fund and purchases over $500,000 in the Event-Driven Fund, Credit Opportunities Fund and Long/Short Fund, as these purchases are subject to a contingent deferred sales charge. Class C shares were not subject to a redemption fee. The redemption fee is paid directly to each Fund rather than the Adviser and is allocated pro-rata to the shareholders based on net assets attributed to each class.
Security Transactions — Security transactions are accounted for on trade date. Gains and losses on securities sold are determined on a specific identification basis.
Annual Report | May 31, 2019
95
The Arbitrage Funds Notes to Financial Statements (continued)
Short Positions — The Funds may sell securities short for economic hedging purposes. Subsequent fluctuations in the market prices of securities sold short may require purchasing the securities at prices which may differ from the market value reflected on the Portfolio of Investments. The Funds are liable for any dividends and interest payable on securities while those securities are in a short position. As collateral for their short positions, the Funds are required under the 1940 Act to maintain assets consisting of cash, cash equivalents or liquid securities. The amount of the collateral is required to be adjusted daily to reflect changes in the value of the securities sold short. The Funds are charged an interest rebate expense by the prime broker on securities sold short. The interest rebate expense is charged for the duration of time that a security is sold short and is shown on the Statements of Operations.
Derivative Instruments and Hedging Activities — The following discloses the Funds' use of derivative instruments and hedging activities.
The Funds' investment objectives not only permit the Funds to purchase investment securities, but they also allow certain Funds to enter into various types of derivative contracts, including, but not limited to, swap contracts, forward foreign currency exchange contracts, and purchased and written option contracts. In doing so, the Funds will employ strategies in differing combinations to permit them to increase, decrease, or change the level or types of exposure to market factors. Central to those strategies are features inherent to derivatives that make them more attractive for this purpose than equity or debt securities: they require little or no initial cash investment; they can focus exposure on only certain selected risk factors; and they may not require the ultimate receipt or delivery of the underlying security (or securities) to satisfy the contract. This may allow the Funds to pursue their objectives more quickly and efficiently than if they were to make direct purchases or sales of securities capable of effecting a similar response to market factors. The Funds may, but are not required to, seek to reduce their currency risk by hedging part or all of their exposure to various foreign currencies.
Market Risk Factors: In pursuit of their investment objectives, the Funds may seek to use derivatives to increase or decrease their exposure to the following market risk factors:
Equity Risk: Equity risk relates to the change in value of equity securities as they relate to increases or decreases in the general market. Investments in securities issued by small and medium capitalization companies tend to be less liquid and more volatile than stocks of companies with relatively large market capitalizations. To the extent a Fund invests in securities of small and medium capitalization companies, it may be more vulnerable to adverse business events than larger, more established companies.
Interest Rate Risk: Interest rate risk refers to the fluctuations in value of fixed-income securities resulting from the inverse relationship between price and yield. For example, an increase in general interest rates will tend to reduce the market value of fixed income investments, and a decline in general interest rates will tend to increase the value of such investments. In addition, debt securities with longer maturities, which tend to have higher yields, are subject to potentially greater fluctuations in value from changes in interest rates than obligations with shorter maturities.
Foreign Exchange Rate Risk: Foreign exchange rate risk relates to the change in the U.S. dollar value of a security held that is denominated in a foreign currency. The value of a foreign currency denominated security will decrease as the dollar appreciates against the currency, while the value of the foreign currency denominated security will increase as the dollar depreciates against the currency. Adverse changes in exchange rates may erode or reverse any gains produced by foreign currency denominated investments and may widen any losses.
www.arbitragefunds.com | 1-800-295-4485
96
The Arbitrage Funds Notes to Financial Statements (continued)
Credit Risk: Credit risk relates to the ability of the issuer to meet interest and principal payments, or both, as they come due. In general, lower-grade, higher-yield bonds are subject to credit risk to a greater extent than lower-yield, higher-quality bonds.
Risk of Investing in Derivatives: The Funds' use of derivatives can result in losses due to unanticipated changes in the market risk factors and the overall market. In instances where the Funds are using derivatives to decrease or hedge exposures to market risk factors for securities held by the Funds, there are also risks that those derivatives may not perform as expected, resulting in losses for the combined or hedged positions.
Derivatives may have little or no initial cash investment relative to their market value exposure and therefore can produce significant gains or losses in excess of their cost. This use of embedded leverage allows the Funds to increase their market value exposure relative to their net assets and can substantially increase the volatility of the Funds' performance.
Additional associated risks from investing in derivatives also exist and potentially could have significant effects on the valuation of the derivative instruments and the Funds. Typically, the associated risks are not the risks that the Funds are attempting to increase or decrease exposure to, per their investment objectives, but are the additional risks from investing in derivatives.
Examples of these associated risks are liquidity risk, which is the risk that the Funds will not be able to sell the derivative in the open market in a timely manner, and counterparty credit risk, which is the risk that the counterparty to a transaction will not fulfill its obligation to the Funds. Associated risks can be different for each type of derivative and are discussed by derivative type in the notes that follow.
Option Writing/Purchasing: Certain Funds may write or purchase option contracts to adjust risk and return of their overall investment positions. When a Fund writes or purchases an option, an amount equal to the premium received or paid by the Fund is recorded as a liability or an asset and is subsequently adjusted to the current market value of the option written or purchased. Premiums received or paid from writing or purchasing options that expire unexercised are treated by the Fund on the expiration date as realized gains or losses. The difference between the premium and the amount paid or received on effecting a closing purchase or sale transaction, including brokerage commissions, is also treated as a realized gain or loss. If an option is exercised, the premium paid or received is added to the cost of the purchase or proceeds from the sale in determining whether the Fund has realized a gain or loss on investment transactions. Risks from entering into option transactions arise from the potential inability of counterparties to meet the terms of the contracts, the potential inability to enter into closing transactions because of an illiquid secondary market and from unexpected movements in security values.
Options held by the Funds at May 31, 2019 are disclosed in the Portfolio of Investments.
During the period ended May 31, 2019, the Funds engaged in option writing/purchasing to limit volatility and correlation, and to create income and optionality.
Foreign Currency Exchange Contracts: The Funds may enter into forward foreign currency exchange contracts as a way of managing foreign exchange rate risk. The Funds may enter into these contracts for the purchase or sale of a specific foreign currency at a fixed price on a future date as a hedge or cross-hedge against either specific transactions or portfolio positions. The objective of the Funds' foreign currency hedging transactions is to reduce risk that the U.S. dollar value of the Funds' securities denominated in foreign currency will decline in value due to changes in foreign currency exchange rates.
Foreign currency exchange contracts held by the Funds at May 31, 2019 are disclosed in the Portfolio of Investments.
Annual Report | May 31, 2019
97
The Arbitrage Funds Notes to Financial Statements (continued)
During the period ended May 31, 2019, the Funds entered into foreign currency exchange contracts to hedge currency risk.
Warrants/Rights: Each Fund may purchase or otherwise receive warrants or rights. Warrants and rights generally give the holder the right to receive, upon exercise, a security of the issuer at a set price. The Funds typically use warrants and rights in a manner similar to their use of purchased options on securities, as described in the Options Writing/Purchasing section above. Risks associated with the use of warrants and rights are generally similar to risks associated with the use of purchased options. However, warrants and rights often do not have standardized terms, and may have longer maturities and may be less liquid than exchange-traded options. In addition, the terms of warrants or rights may limit each Fund's ability to exercise the warrants or rights at such times and in such quantities as each Fund would otherwise wish. Warrants and rights generally pay no dividends and confer no voting or other rights other than to purchase the underlying security.
Warrants/rights held by the Funds at May 31, 2019 are disclosed in the Portfolio of Investments.
During the period ended May 31, 2019, the Funds held warrants/rights as a result of receiving them from completed deals.
Swaps: Certain Funds may enter into interest rate, index, equity, total return and credit default swap agreements, for hedging and non-hedging purposes. These transactions would be entered into in an attempt to obtain a particular return when it is considered desirable to do so, possibly at a lower cost to a Fund than if the Fund had invested directly in the asset that yielded the desired return. Swap agreements may be executed in a multilateral or other trade facility program, such as a registered exchange ("centrally cleared swaps") or may be privately negotiated in the over-the-counter market. The duration of a swap agreement typically ranges from a few weeks to more than one year. In a standard swap transaction, two parties agree to exchange the returns (or differentials in rates of return) earned or realized on particular predetermined investments or instruments, which may be adjusted for an interest factor. The gross returns to be exchanged or "swapped" between the parties are generally calculated with respect to a "notional amount" (i.e., the return on or increase in value of a particular dollar amount invested at a particular interest rate, in a particular foreign currency, or in a "basket" of securities representing a particular index). In a centrally cleared swap, immediately following execution of the swap agreement, the swap agreement is novated to a central counterparty (the "CCP") and the Fund's counterparty on the swap agreement becomes the CCP.
Forms of swap agreements include interest rate caps, under which, in return for a premium, one party agrees to make payments to the other to the extent that interest rates exceed a specified rate, or "cap"; interest rate floors, under which, in return for a premium, one party agrees to make payments to the other to the extent that interest rates fall below a specified level, or "floor"; and interest rate collars, under which a party sells a cap and purchases a floor, or vice versa, in an attempt to protect itself against interest rate movements exceeding given minimum or maximum levels.
Credit default swaps are a type of swap agreement in which the protection "buyer" is generally obligated to pay the protection "seller" an upfront and/or a periodic stream of payments over the term of the contract provided that no credit event, such as a default, on a reference obligation has occurred. The credit default swap agreement may have as reference obligations one or more securities that are not currently held by a Fund. If a credit event occurs, the seller generally must pay the buyer the "par value" (full notional value) of the swap in exchange for an equal face amount of deliverable obligations of the reference entity described in the swap, or the seller may be required to deliver the related net cash amount if the swap is cash settled. A Fund may be either the buyer or seller in the transaction. If a Fund is a buyer and no credit event occurs, the
www.arbitragefunds.com | 1-800-295-4485
98
The Arbitrage Funds Notes to Financial Statements (continued)
Fund may recover nothing if the swap is held through its termination date. However, if a credit event occurs, the buyer generally may elect to receive the full notional value of the swap in exchange for an equal face amount of deliverable obligations of the reference entity whose value may have significantly decreased. As a seller, a Fund generally receives an upfront payment and/or a fixed rate of income throughout the term of the swap provided that there is no credit event. As the seller, a Fund would effectively add leverage to its portfolio because, in addition to its total net assets, the Fund would be subject to investment exposure on the notional amount of the swap. Credit default swap agreements involve greater risks than if a Fund had invested in the reference obligation directly since, in addition to general market risks, credit default swaps are subject to illiquidity risk, counterparty risk and credit risk. A Fund will enter into credit default swap agreements only with counterparties that meet certain standards of creditworthiness or that are centrally cleared.
Total return swap agreements are contracts in which one party agrees to make periodic payments based on the change in market value of underlying assets, which may include a specified security, basket of securities, defined portfolios of bonds, loans and mortgages, or securities indexes during the specified period in return for periodic payments based on a fixed or variable interest rate or the total return from other underlying assets or indices. Total return swap agreements may be used to obtain exposure to a security or market index without owning or taking physical custody of such security or component securities of a market index. Total return swap agreements may effectively add leverage to a Fund's portfolio because, in addition to its total net assets, the Fund would be subject to investment exposure on the notional amount of the swap. Total return swaps are a mechanism for the user to accept the economic benefits of asset ownership without utilizing the balance sheet. The other leg of the swap, usually the London Interbank Offered Rate (LIBOR), is spread to reflect the non-balance sheet nature of the product. Total return swaps can be designed with any underlying asset agreed upon between two parties. Typically no notional amounts are exchanged with total return swaps. Total return swap agreements entail the risk that a party will default on its payment obligations to a Fund thereunder. Swap agreements also entail the risk that a Fund will not be able to meet its obligation to the counterparty. Generally, a Fund will enter into total return swaps on a net basis (i.e., the two payment streams are netted out with the Fund receiving or paying, as the case may be, only the net amount of the two payments).
Most swap agreements entered into by a Fund calculate the obligations of the parties to the agreement on a "net basis." Consequently, a Fund's current obligations (or rights) under a swap agreement will generally be equal only to the net present value of amounts to be paid or received under the agreement based on the relative values of the positions held by each party to the agreement (the "net amount"). A Fund's current obligations under a swap agreement will be accrued daily (offset against amounts owed to the Fund), and any accrued but unpaid net amounts owed to a swap counterparty will be covered in accordance with applicable regulatory requirements to limit any potential leveraging of a Fund's portfolio. Any net amount accrued but not yet paid to a Fund by the counterparty under a swap agreement (i.e., the Fund's current rights under the swap agreement) is recorded as unrealized appreciation until the amount is paid to the Fund. The Fund's maximum risk of loss from counterparty credit risk is generally limited to the net payment to be received by the Fund and/or the termination value at the end of the contract. Obligations under swap agreements so covered will not be construed to be "senior securities" for purposes of the Funds' investment restriction concerning senior securities.
Whether a Fund's use of swap agreements will be successful in furthering its investment objective will depend on Management's ability to correctly predict whether certain types of investments are likely to produce greater returns than other investments. Swap agreements that cannot be terminated or sold within seven days may be considered to be illiquid investments. Moreover, a Fund bears the risk of loss of the amount expected to be received under a swap agreement in the event of the default or bankruptcy of a swap agreement counterparty. Although centrally
Annual Report | May 31, 2019
99
The Arbitrage Funds Notes to Financial Statements (continued)
cleared swaps typically present less counterparty risk than non-centrally cleared swaps, a Fund that has entered into centrally cleared swaps is subject to the risk of the failure of the CCP. A Fund will enter into swap agreements only with counterparties that meet certain standards for creditworthiness (generally, such counterparties would have to be eligible counterparties under the terms of the Fund's repurchase agreement guidelines) or that are centrally cleared. Certain restrictions imposed on the Funds by the Internal Revenue Code of 1986, as amended (the "Code"), may limit a Fund's ability to use swap agreements. It is possible that developments in the swap market, including additional government regulation, could adversely affect a Fund's ability to terminate existing swap agreements or to realize amounts to be received under such agreements.
International Swaps and Derivatives Association, Inc. Master Agreements ("ISDA Master Agreements") govern over-the-counter financial derivative transactions entered into by a Fund and counterparty. The ISDA Master Agreements maintain provisions for general obligations, representations, agreements, collateral and events of default or termination. Events of termination include conditions that may entitle counterparties to elect to terminate early and cause settlement of all outstanding transactions under the applicable ISDA Master Agreement. Any election to terminate early could be material to the financial statements.
Swap agreements held by the Funds at May 31, 2019 are disclosed in the Portfolio of Investments.
During the period ended May 31, 2019, the Arbitrage Fund, Event-Driven Fund and Long/Short Fund entered into swap agreements to invest outside the US more efficiently.
Fair Value of Derivative Instruments — Fair values of derivatives presented in the financial statements are not netted with the fair value of other derivatives or with any collateral amounts posted by the Funds or any counterparty on the Statement of Assets and Liabilities. The fair value of derivative instruments for the Funds as of the year ended May 31, 2019, was as follows:
Derivatives Not
Accounted For As
Hedging Instruments | | Asset
Derivatives
Statement of
Assets and
Liabilities
Location | | Fair Value | | Liability
Derivatives
Statement of
Assets and
Liabilities
Location | | Fair Value | |
Arbitrage Fund | |
Foreign Currency
Contracts
| | Unrealized
appreciation on
forward foreign
currency
exchange
contracts | | $ | 6,201,218 | | | Unrealized
depreciation on
forward foreign
currency
exchange
contracts | | $ | 1,090,635 | | |
Equity Contracts
(purchased option
contracts)
| | Investments:
at fair value of
unaffiliated
investments | | | 4,874,961 | | | | | | | | |
Equity Contracts
(written option
contracts) | | | | | | Written options,
at value | | | 186,600 | | |
| | | | | $ | 11,076,179 | | | | | $ | 1,277,235 | | |
www.arbitragefunds.com | 1-800-295-4485
100
The Arbitrage Funds Notes to Financial Statements (continued)
Derivatives Not
Accounted For As
Hedging Instruments | | Asset
Derivatives
Statement of
Assets and
Liabilities
Location | | Fair Value | | Liability
Derivatives
Statement of
Assets and
Liabilities
Location | | Fair Value | |
Event-Driven Fund | |
Foreign Currency
Contracts
| | Unrealized
appreciation on
forward foreign
currency
exchange
contracts | | $ | 286,302 | | | Unrealized
depreciation on
forward foreign
currency
exchange
contracts | | $ | 115,270 | | |
Equity Contracts
(purchased option
contracts)
| | Investments:
at fair value of
unaffiliated
investments | | | 761,185 | | | | | | | | |
Equity Contracts
(written option
contracts) | | | | | | Written options,
at value | | | 19,990 | | |
| | | | | $ | 1,047,487 | | | | | $ | 135,260 | | |
Derivatives Not
Accounted For As
Hedging Instruments | | Asset
Derivatives
Statement of
Assets and
Liabilities
Location | | Fair Value | | Liability
Derivatives
Statement of
Assets and
Liabilities
Location | | Fair Value | |
Credit Opportunities Fund | |
Equity Contracts
(purchased option
contracts)
| | Investments:
at fair value of
unaffiliated
investments | | $ | 33,757 | | | | | $ | — | | |
Equity Contracts
(written option
contracts) | | | | | | Written options,
at value | | | 80 | | |
| | | | | $ | 33,757 | | | | | $ | 80 | | |
Annual Report | May 31, 2019
101
The Arbitrage Funds Notes to Financial Statements (continued)
Derivatives Not
Accounted For As
Hedging Instruments | | Asset
Derivatives
Statement of
Assets and
Liabilities
Location | | Fair Value | | Liability
Derivatives
Statement of
Assets and
Liabilities
Location | | Fair Value | |
Long/Short Fund | |
Foreign Currency
Contracts
| | Unrealized
appreciation on
forward foreign
currency
exchange
contracts | | $ | 1,109 | | | Unrealized
depreciation on
forward foreign
currency
exchange
contracts | | $ | 9 | | |
Equity Contracts
(purchased option
contracts)
| | Investments:
at fair value of
unaffiliated
investments | | | 61,653 | | | | | | | | |
Equity Contracts
(written option
contracts) | | | | | | Written options,
at value | | | 12,684 | | |
| | | | | $ | 62,762 | | | | | $ | 12,693 | | |
www.arbitragefunds.com | 1-800-295-4485
102
The Arbitrage Funds Notes to Financial Statements (continued)
The effect of derivative instruments on the Funds' Statement of Operations for the year ended May 31, 2019, was as follows:
Derivatives Not
Accounted For As
Hedging Instruments | | Location Of Gains/(Loss) On
Derivatives Recognized In Income | | Realized
Gain/(Loss)
On Derivatives
Recognized In
Income | | Change in
Unrealized
Gain/(Loss)
On Derivatives
Recognized In
Income | |
Arbitrage Fund | |
Foreign Currency
Contracts
| | Net realized gains (losses) from:
Forward currency contracts / Net
change in unrealized appreciation
(depreciation) on: Forward
currency contracts | | $ | 20,593,887 | | | $ | (12,510,293 | ) | |
Equity Contracts
(swap contracts)
| | Net realized gains (losses) from:
Swap contracts / Net change in
unrealized appreciation
(depreciation) on: Swap contracts | | | 6,330,396 | | | | (19,040 | ) | |
Equity Contracts
(purchased option
contracts)
| | Net realized gains (losses) from:
Purchased option contracts / Net
change in unrealized appreciation
(depreciation) on: Purchased
option contracts | | | (9,906,367 | ) | | | (869,661 | ) | |
Equity Contracts
(written option
contracts)
| | Net realized gains (losses) from:
Written option contracts / Net
change in unrealized appreciation
(depreciation) on: Written option
contracts | | | 7,785,695 | | | | (21,922 | ) | |
| | | | | $ | 24,803,611 | | | $ | (13,420,916 | ) | |
Annual Report | May 31, 2019
103
The Arbitrage Funds Notes to Financial Statements (continued)
Derivatives Not
Accounted For As
Hedging Instruments | | Location Of Gains/(Loss) On
Derivatives Recognized In Income | | Realized
Gain/(Loss)
On Derivatives
Recognized In
Income | | Change in
Unrealized
Gain/(Loss)
On Derivatives
Recognized In
Income | |
Event-Driven Fund | |
Foreign Currency
Contracts
| | Net realized gains (losses) from:
Forward currency contracts / Net
change in unrealized appreciation
(depreciation) on: Forward
currency contracts | | $ | 918,981 | | | $ | (556,649 | ) | |
Equity Contracts
(swap contracts)
| | Net realized gains (losses) from:
Swap contracts / Net change in
unrealized appreciation
(depreciation) on: Swap contracts | | | 347,357 | | | | — | | |
Equity Contracts
(purchased option
contracts)
| | Net realized gains (losses) from:
Purchased option contracts / Net
change in unrealized appreciation
(depreciation) on: Purchased
option contracts | | | (1,475,621 | ) | | | 19,748 | | |
Equity Contracts
(written option
contracts)
| | Net realized gains (losses) from:
Written option contracts / Net
change in unrealized appreciation
(depreciation) on: Written option
contracts | | | 872,256 | | | | (107,896 | ) | |
| | | | | $ | 662,973 | | | $ | (644,797 | ) | |
www.arbitragefunds.com | 1-800-295-4485
104
The Arbitrage Funds Notes to Financial Statements (continued)
Derivatives Not
Accounted For As
Hedging Instruments | | Location Of Gains/(Loss) On
Derivatives Recognized In Income | | Realized
Gain/(Loss)
On Derivatives
Recognized In
Income | | Change in
Unrealized
Gain/(Loss)
On Derivatives
Recognized In
Income | |
Credit Opportunities Fund | |
Foreign Currency
Contracts
| | Net realized gains (losses) from:
Forward currency contracts / Net
change in unrealized appreciation
(depreciation) on: Forward
currency contracts | | $ | 73,267 | | | $ | (55,745 | ) | |
Equity Contracts
(purchased option
contracts)
| | Net realized gains (losses) from:
Purchased option contracts / Net
change in unrealized appreciation
(depreciation) on: Purchased
option contracts | | | (2,246 | ) | | | 19,075 | | |
Equity Contracts
(written option
contracts)
| | Net realized gains (losses) from:
Written option contracts / Net
change in unrealized appreciation
(depreciation) on: Written option
contracts | | | 65,984 | | | | (26,152 | ) | |
| | | | | $ | 137,005 | | | $ | (62,822 | ) | |
Derivatives Not
Accounted For As
Hedging Instruments | | Location Of Gains/(Loss) On
Derivatives Recognized In Income | | Realized
Gain/(Loss)
On Derivatives
Recognized In
Income | | Change in
Unrealized
Gain/(Loss)
On Derivatives
Recognized In
Income | |
Long/Short Fund | |
Foreign Currency
Contracts
| | Net realized gains (losses) from:
Forward currency contracts / Net
change in unrealized appreciation
(depreciation) on: Forward
currency contracts | | $ | 11,557 | | | $ | (5,741 | ) | |
Equity Contracts
(swap contracts)
| | Net realized gains (losses) from:
Swap contracts / Net change in
unrealized appreciation
(depreciation) on: Swap contracts | | | (11,587 | ) | | | — | | |
Equity Contracts
(purchased option
contracts)
| | Net realized gains (losses) from:
Purchased option contracts / Net
change in unrealized appreciation
(depreciation) on: Purchased
option contracts | | | (60,947 | ) | | | 11,438 | | |
Equity Contracts
(written option
contracts)
| | Net realized gains (losses) from:
Written option contracts / Net
change in unrealized appreciation
(depreciation) on: Written option
contracts | | | 17,583 | | | | (1,628 | ) | |
| | | | | $ | (43,394 | ) | | $ | 4,069 | | |
Annual Report | May 31, 2019
105
The Arbitrage Funds Notes to Financial Statements (continued)
Volume of derivative instruments held by the Funds during the year ended May 31, 2019, was as follows:
Derivative Type | | Unit of Measurement | | Monthly Average | |
Arbitrage Fund | |
Swap Contracts | | Notional Quantity | | | (6,388,444 | ) | |
Forward Foreign Currency Exchange
Contracts | | Net Contracts to Deliver/(Receive)
| | | (120,461,985 | ) | |
Purchased Option Contracts | | Contracts | | | 24,488 | | |
Written Option Contracts | | Contracts | | | (5,983 | ) | |
Derivative Type | | Unit of Measurement | | Monthly Average | |
Event-Driven Fund | |
Swap Contracts | | Notional Quantity | | | (1,083,628 | ) | |
Forward Foreign Currency Exchange
Contracts | | Net Contracts to Deliver/(Receive)
| | | (4,923,996 | ) | |
Purchased Option Contracts | | Contracts | | | 2,904 | | |
Written Option Contracts | | Contracts | | | (792 | ) | |
Derivative Type | | Unit of Measurement | | Monthly Average | |
Credit Opportunities Fund | |
Forward Foreign Currency Exchange
Contracts | | Net Contracts to Deliver/(Receive)
| | | (287,507 | ) | |
Purchased Option Contracts | | Contracts | | | 66 | | |
Written Option Contracts | | Contracts | | | (12 | ) | |
Derivative Type | | Unit of Measurement | | Monthly Average | |
Long/Short Fund | |
Swap Contracts | | Notional Quantity | | | (15,999 | ) | |
Forward Foreign Currency Exchange
Contracts | | Net Contracts to Deliver/(Receive) | | | (77,413 | ) | |
Purchased Option Contracts | | Contracts | | | 156 | | |
Written Option Contracts | | Contracts | | | (59 | ) | |
Certain derivative contracts are executed under either standardized netting agreements or, for exchange-traded derivatives, the relevant contracts for a particular exchange which contain enforceable netting provisions. A derivative netting arrangement creates an enforceable right of set-off that becomes effective, and affects the realization of settlement on individual assets, liabilities and collateral amounts, only following a specified event of default or early termination. Default events may include the failure to make payments or deliver securities timely, material adverse changes in financial condition or insolvency, the breach of minimum regulatory capital requirements, or loss of license, charter or other legal authorization necessary to perform under the contract.
The Event-Driven Fund and Long/Short Fund held financial instruments such as Equity Swaps that are subject to enforceable netting arrangements or other similar agreements as of May 31, 2019. At May 31, 2019, there was no unrealized appreciation or depreciation on these instruments. The Arbitrage Fund and Credit Opportunities Fund did not hold financial instruments subject to netting or similar arrangements as of May 31, 2019.
www.arbitragefunds.com | 1-800-295-4485
106
The Arbitrage Funds Notes to Financial Statements (continued)
Investment Income — Interest income, adjusted for amortization of premium and accretion of discount, is recorded on the accrual basis. Dividend income is recorded on the ex-dividend date, net of any non-reclaimable tax withholdings. Payment-in-kind securities have the option at each interest payment date of making interest payments in cash or additional debt securities. Any interest accrued on payment-in-kind securities is recorded as interest income. Distributions from REITs may be characterized as ordinary income, net capital gain, or a return of capital to the Funds. The proper characterization of REIT distributions is generally not known until after the end of each calendar year. As such, estimates are used in reporting the character of income and distributions for financial statement purposes when information is not available.
Dividends and Distributions to Shareholders — Dividends arising from net investment income and net capital gain distributions, if any, are declared and paid at least annually to shareholders of the Arbitrage Fund, Event-Driven Fund and Long/Short Fund. Dividends arising from net investment income, if any, are declared daily and paid monthly, and net capital gain distributions, if any, are declared and paid at least annually to shareholders of the Credit Opportunities Fund.
Allocation Between Classes — Investment income earned, realized capital gains and losses, and unrealized appreciation and depreciation are allocated daily to each class of shares based upon the proportionate shares of total net assets of each Fund. Class-specific expenses are charged directly to the class incurring the expense. Common expenses which are not attributable to a specific class are allocated daily to each class of shares based upon the proportionate share of total net assets of each Fund.
Federal Income Tax — It is the Funds' policy to continue to comply with the special provisions of Subchapter M of the Code, as amended, applicable to regulated investment companies. As provided therein, in any fiscal year in which a fund so qualifies and distributes at least 90% of its taxable net income, a fund (but not the shareholders) will be relieved of Federal income tax on the income distributed. Accordingly, no provision for income taxes has been made.
As of and during the year ended May 31, 2019, the Funds did not have a liability for any unrecognized tax benefits. The Funds recognize interest and, if applicable, penalties for any uncertain tax positions. Interest and penalty expense will be recorded as a component of interest or other tax expense. No interest or penalties were recorded during the year ended May 31, 2019. The Funds file U.S. federal, state, and local tax returns as required. The Funds' tax returns are subject to examination by the relevant tax authorities until expiration of the applicable statute of limitations which is generally three years after the filing of the tax return. Tax returns for open years have incorporated no uncertain tax positions that require a provision for income taxes.
3. INVESTMENT TRANSACTIONS
During the year ended May 31, 2019, cost of purchases and proceeds from sales and maturities of investment securities, excluding short-term investments, U.S. government securities, equity swap contracts, purchased and written option contracts and securities sold short, were as follows:
| | | Arbitrage Fund | | Event-Driven Fund | | Credit
Opportunities Fund | | Long/Short
Fund | |
Purchases | | $ | 6,341,052,277 | | | $ | 657,100,173 | | | $ | 111,140,179 | | | $ | 8,455,909 | | |
Sales and Maturities | | | 6,043,511,445 | | | | 660,874,092 | | | | 99,329,232 | | | | 9,369,643 | | |
Annual Report | May 31, 2019
107
The Arbitrage Funds Notes to Financial Statements (continued)
During the year ended May 31, 2019, cost of purchases and proceeds from sales and maturities of U.S. government securities for the Event-Driven Fund and the Credit Opportunities Fund were as follows:
| | | Event Driven Fund | | Credit Opportunities Fund | |
Purchases | | $ | 744,677 | | | $ | 1,605,775 | | |
Sales | | | 2,279,161 | | | | 2,826,424 | | |
4. LINE OF CREDIT
The Trust, on behalf of the Funds, entered into an agreement which enables the Arbitrage Fund, the Event-Driven Fund, the Credit Opportunities Fund and the Long/Short Fund to participate in a $100,000,000 unsecured committed revolving line of credit (the "Committed Line") and a $100,000,000 unsecured uncommitted revolving line of credit (the "Uncommitted Line," together with the Committed Line, the "Credit Agreement") with State Street Bank and Trust Company (the "Custodian"). Borrowings are made solely to temporarily finance the purchase or sale of securities or to finance the redemption of the shares of an investor of the Funds. Interest is charged to the Funds based on their borrowings at a rate per annum of the higher of the LIBOR rate plus 1.25% and the overnight federal funds rate plus 1.25%. The Committed Line has a commitment fee of 0.25% per annum on the unused portion of the Committed Line and is payable quarterly. The Uncommitted Line has an upfront fee of $25,000, is held available on a discretionary demand basis and may be terminated by the Custodian or the Trust at any time for any or no reason. The Trust accrues, on behalf of each of the Funds, the commitment fee on the unused portion of the Committed Line. Such fees are included in the custodian and bank service fees on the Statement of Operations.
For the year ended May 31, 2019, the Event-Driven Fund and the Credit Opportunities Fund had average borrowings of $4,497,561 and $2,078,947, respectively, over a period of 82 days and 19 days, respectively, at a weighted average interest rate of 3.57% and 3.48%, respectively. Interest expense on the line of credit for the Event-Driven Fund and the Credit Opportunities Fund during the year ended May 31, 2019, is shown as line of credit interest expense on the Statements of Operations. The Event-Driven Fund and the Credit Opportunities Fund had no outstanding borrowings at May 31, 2019.
5. ADVISORY FEES, ADMINISTRATION FEES AND OTHER AGREEMENTS
Investment Advisory Agreement
The Funds' investments are managed by the Adviser according to the terms of Investment Advisory Agreements. Under the Investment Advisory Agreement between the Adviser and the Arbitrage Fund, as amended and restated on October 1, 2007, the Arbitrage Fund pays the Adviser an annual fee, which is computed and accrued daily and paid monthly, of 1.25% on the first $250 million, 1.20% on the next $50 million, 1.15% on the next $50 million, 1.10% on the next $75 million, 1.05% on the next $75 million and 1.00% for amounts over $500 million, based on the Arbitrage Fund's average daily net assets. Under the Investment Advisory Agreement between the Adviser and the Event-Driven Fund dated September 27, 2010, the Event-Driven Fund pays the Adviser an annual fee, which is computed and accrued daily and paid monthly, of 1.25% based on the Event-Driven Fund's average daily net assets. Effective August 6, 2018, the Credit Opportunities Fund reduced the annual investment advisory fee to 0.95% on the first $250 million of its average daily net assets, 0.90% on the next $500 million of its average daily net assets and 0.85% on its average daily net assets in excess of $750 million. Prior to August 6, 2018, the Credit Opportunities Fund paid an average annual fee of 1.00% on the amount of the Credit
www.arbitragefunds.com | 1-800-295-4485
108
The Arbitrage Funds Notes to Financial Statements (continued)
Opportunities Fund's average daily net assets. Under the Investment Advisory Agreement between the Adviser and the Long/Short Fund dated December 22, 2014, the Long/Short Fund pays the Adviser an annual fee, which is computed and accrued daily and paid monthly, of 1.25% based on the Long/Short Fund's average daily net assets.
The Adviser has contractually agreed, at least until September 30, 2019 for the Arbitrage Fund, the Event-Driven Fund, and the Long/Short Fund, and until September 30, 2020 for the Credit Opportunities Fund, to waive its advisory fee and/or reimburse the Funds' other expenses to the extent that total operating expenses (exclusive of taxes, interest, dividends on short positions, brokerage commissions, acquired fund fees and expenses and other costs incurred in connection with the purchase or sale of portfolio securities) exceed the annual rate of the Funds' average daily net assets attributable to each share class as shown in the table below:
| | | Arbitrage Fund | | Event-Driven Fund | | Credit Opportunities Fund | | Long/Short Fund | |
Class R | | | 1.69 | % | | | 1.69 | % | | | 1.23 | % | | | 1.69 | % | |
Class I | | | 1.44 | % | | | 1.44 | % | | | 0.98 | % | | | 1.44 | % | |
Class C | | | 2.44 | % | | | 2.44 | % | | | 1.98 | % | | | 2.44 | % | |
Class A | | | 1.69 | % | | | 1.69 | % | | | 1.23 | % | | | 1.69 | % | |
Effective August 6, 2018, the Adviser has contractually agreed to provide additional expense reimbursements to the Credit Opportunities Fund by lowering the contractual expense limitation, not including taxes, interest, dividends on short positions, brokerage commissions, acquired fund fees and expenses and other costs incurred in connection with the purchase or sale of portfolio securities, to the amounts in the table above. Prior to August 6, 2018, the expense limitation was 1.50% of the Credit Opportunities Fund's average daily net assets allocable to the Class R shares, 1.25% of the Credit Opportunities Fund's average daily net assets allocable to the Class I shares, 2.25% of the Credit Opportunities Fund's average daily net assets allocable to the Class C shares, and 1.50% of the Credit Opportunities Fund's average daily net assets allocable to the Class A shares.
During the year ended May 31, 2019, the Arbitrage Fund invested in the Event-Driven Fund. The Adviser has agreed to waive the advisory fee paid by the Arbitrage Fund on the Arbitrage Fund's assets that are invested in the Event-Driven Fund.
As of May 31, 2019, the Long/Short Fund had $6,646 receivable from the Adviser due to an advisory fee reimbursement.
For the year ended May 31, 2019, the aggregate net fee paid to the Adviser as a percentage of average net assets for the Arbitrage Fund, Event-Driven Fund, Credit Opportunities Fund and Long/Short Fund was 1.04%, 0.85%, 0.43% and 0.00%, respectively.
The Adviser is permitted to recapture fees waived and expenses reimbursed to the extent actual fees and expenses for a period are less than the expense limitation of each class, provided, however, that the Adviser shall only be entitled to recapture such amounts for a period of three years after the year in which the expense was waived. The Adviser can recapture, with the exception of the advisory fees waived related to Arbitrage Fund's investment in the Event-Driven Fund, any fees it has waived within three fiscal years of the year in which the fees were waived subject to the applicable annual rate of: 1.69% for Class R shares, 1.44% for Class I shares, 2.44% for Class C shares and 1.69% for Class A shares of the Arbitrage Fund, Event-Driven Fund and Long/Short Fund. The Advisor can recapture any fees it has waived within three years of the date of the expense waiver for the Credit Opportunities Fund subject to the applicable annual rate of 1.23% for Class R shares, 0.98% for Class I shares, 1.98% for Class C shares and 1.23% for Class A
Annual Report | May 31, 2019
109
The Arbitrage Funds Notes to Financial Statements (continued)
shares of the Credit Opportunities Fund for fees waived after August 6, 2018. Prior to August 6, 2018, the Adviser can recapture any fees it has waived within three years after the year in which the expense was waived subject to the applicable annual rate of 1.50% for Class R shares, 1.25% for Class I shares, 2.25% for Class C shares and 1.50% for Class A shares of the Credit Opportunities Fund provided that such recapture would not cause the expense ratio of the Credit Opportunities Fund to exceed the limit in effect at the time such fees were waived and at the time such fees were recaptured.
As of May 31, 2019, the balances of future fee and expense recaptures for each Fund were as follows:
| | | Expiring
May 31, 2020 | | Expiring
May 31, 2021 | | Expiring
May 31, 2022 | | Total | |
Event-Driven Fund | |
Class R | | $ | 222,866 | | | $ | 212,683 | | | $ | 150,425 | | | $ | 585,974 | | |
Class I | | | 236,150 | | | | 390,120 | | | | 392,244 | | | | 1,018,514 | | |
Class C | | | 5,997 | | | | 5,981 | | | | 3,752 | | | | 15,730 | | |
Class A | | | 3,680 | | | | 3,178 | | | | 3,225 | | | | 10,083 | | |
Credit Opportunities Fund | |
Class R | | $ | 37,259 | | | $ | 42,333 | | | $ | 35,953 | | | $ | 115,545 | | |
Class I | | | 129,977 | | | | 126,190 | | | | 244,066 | | | | 500,233 | | |
Class C | | | 2,984 | | | | 2,587 | | | | 2,613 | | | | 8,184 | | |
Class A | | | 330 | | | | 655 | | | | 740 | | | | 1,725 | | |
Long/Short Fund | |
Class R | | $ | 1,275 | | | $ | 1,030 | | | $ | 938 | | | $ | 3,243 | | |
Class I | | | 213,108 | | | | 215,161 | | | | 201,824 | | | | 630,093 | | |
Class C | | | 1,275 | | | | 1,030 | | | | 937 | | | | 3,242 | | |
Class A | | | 1,275 | | | | 1,030 | | | | 938 | | | | 3,243 | | |
There were no amounts recaptured during the year ended May 31, 2019, from the Funds.
Administration Agreement
State Street Bank & Trust Company serves as the Trust's administrator pursuant to an Administration Agreement with the Trust.
Distribution Agreement
ALPS Distributors, Inc. (the "Distributor") serves as the Funds' distributor. The Distributor acts as an agent for the Funds and the distributor of their shares. The Funds have adopted, with respect to their Class R, Class C shares and Class A shares, a plan of distribution pursuant to Rule 12b-1 under the 1940 Act which permits each Fund to pay for expenses incurred in the distribution and promotion of the Funds' Class R shares, Class C shares and Class A shares and for services provided to shareholders. The Plan is a "reimbursement" plan. This means that a Fund's Class R shares, Class C shares and Class A shares only pay a particular 12b-1 fee to the extent that the Adviser, the Distributor or others have incurred expenses in the promotion and distribution of the shares, including but not limited to, the printing of prospectuses and reports used for sales purposes, expenses of preparation of sales literature and related expenses, advertisements, and other distribution-related expenses, as well as any distribution fees paid to securities dealers or others. Under the distribution plan, a Fund may pay compensation to any broker-dealer with whom the Distributor or the Funds has entered into a contract to distribute Class R shares, Class C shares or Class A shares, or to any other qualified financial services firm, for distribution and/or
www.arbitragefunds.com | 1-800-295-4485
110
The Arbitrage Funds Notes to Financial Statements (continued)
shareholder-related services with respect to shares held or purchased by their respective customers or in connection with the purchase of shares attributable to their efforts. The amount of payments under the Plan in any year shall not exceed 0.25% for Class R shares, 0.75% for Class C shares and 0.25% for Class A shares, respectively, of the average daily net assets allocable to a Fund's Class R shares, Class C shares and Class A shares, respectively. In addition, the Plan permits each Fund to make payments at an annual rate of up to 0.25% of the Fund's Class C shares for expenses incurred in connection with the provision of shareholder support or administrative services for the Fund's Class C shares.
During the year ended May 31, 2019, The Arbitrage Fund's Class R shares incurred $488,305, Class C shares incurred $210,432 and Class A shares incurred $45,043, respectively, in distribution expenses for Class R shares and Class A shares and distribution and shareholder support expenses for Class C shares, all of which was used to compensate broker-dealers. With respect to the Event-Driven Fund, during the year ended May 31, 2019, the Event-Driven Fund's Class R shares incurred $95,023, Class C shares incurred $9,495 and Class A shares incurred $2,036, respectively, in distribution expenses for Class R shares and Class A shares and distribution and shareholder support expenses for Class C shares, all of which was used to compensate broker-dealers. With respect to the Credit Opportunities Fund, during the year ended May 31, 2019, the Credit Opportunities Fund's Class R shares incurred $17,525, Class C shares incurred $5,068 and Class A shares incurred $357, respectively, in distribution expenses for Class R shares and Class A shares and distribution and shareholder support expenses for Class C shares, all of which was used to compensate broker-dealers. With respect to the Long/Short Fund, during the year ended May 31, 2019, the Long/Short Fund's Class R shares incurred $26, Class C shares incurred $102 and Class A shares incurred $26, respectively, in distribution expenses for Class R shares and Class A shares and distribution and shareholder support expenses for Class C shares, all of which was used to compensate broker-dealers.
Chief Compliance Officer
Certain officers of the Trust are also officers of the Adviser. The Chief Compliance Officer ("CCO") of the Trust also serves as the CCO of the Adviser. The Funds currently pay the Adviser 50% of the CCO's salary for the CCO's provision of services to the Funds.
Chief Financial Officer
Foreside Management Services, LLC provides Chief Financial Officer ("CFO") services to the Trust. Foreside Management Services, LLC is compensated by the Trust under a Fund CFO/Treasurer Agreement.
Transfer Agent And Shareholder Services Agreement
DST Systems, Inc. ("DST") is the Funds' transfer agent, and per an agency agreement, maintains the records of each shareholder's account, answers shareholders' inquiries concerning their accounts, processes purchases and redemptions of the Funds shares, acts as dividend and distribution disbursing agent and performs other shareholder service functions.
Annual Report | May 31, 2019
111
The Arbitrage Funds Notes to Financial Statements (continued)
6. AFFILIATED ISSUER TRANSACTIONS
A summary of affiliated transactions for the Arbitrage Fund for the year ended May 31, 2019 follows:
Affiliated
Issuer | | Beginning
Value
as of
May 31,
2018 | | Purchases
at
Cost | | Proceeds
from
Sales | | Net
Realized
Gain/
(Loss)
on
Sales | | Change
in
Unrealized
Appreciation/
Depreciation | | Ending
Value
as of
May 31,
2019 | | Shares
as of
May 31,
2019 | | Dividend
Income | | Capital
Gain
Distributions | |
Event-Driven
Fund | | $ | 15,108,035 | | | $ | 263,187 | | | $ | — | | | $ | — | | | $ | 4,775 | | | $ | 15,375,997 | | | | 1,611,740 | | | $ | 263,187 | | | $ | — | | |
7. CAPITAL SHARE TRANSACTIONS
Proceeds and payments on capital shares as shown in the Statement of Changes in Net Assets are the result of the following capital share transactions for the periods shown:
| | | Year Ended
May 31, 2019 | | Year Ended
May 31, 2018 | |
Arbitrage Fund - Class R | | Shares | | Value | | Shares | | Value | |
Proceeds from shares sold | | | 3,793,525 | | | $ | 48,440,688 | | | | 5,228,525 | | | $ | 67,435,640 | | |
Shares issued in reinvestment of
distributions | | | 258,687 | | | | 3,287,911 | | | | 616,165 | | | | 7,794,494 | | |
Proceeds from redemption fees
collected | | | — | | | | — | | | | — | | | | 718 | | |
Payments for shares redeemed | | | (8,983,994 | ) | | | (114,767,511 | ) | | | (14,327,212 | ) | | | (186,947,777 | ) | |
Net decrease | | | (4,931,782 | ) | | $ | (63,038,912 | ) | | | (8,482,522 | ) | | $ | (111,716,925 | ) | |
Arbitrage Fund - Class I | |
Proceeds from shares sold | | | 39,434,735 | | | $ | 518,934,600 | | | | 52,340,988 | | | $ | 695,753,810 | | |
Shares issued in reinvestment of
distributions | | | 1,630,790 | | | | 21,330,733 | | | | 3,117,424 | | | | 40,588,863 | | |
Proceeds from redemption fees
collected | | | — | | | | — | | | | — | | | | 3,509 | | |
Payments for shares redeemed | | | (40,852,721 | ) | | | (537,722,663 | ) | | | (50,389,397 | ) | | | (665,454,235 | ) | |
Net increase | | | 212,804 | | | $ | 2,542,670 | | | | 5,069,015 | | | $ | 70,891,947 | | |
Arbitrage Fund - Class C | |
Proceeds from shares sold | | | 97,547 | | | $ | 1,191,257 | | | | 294,534 | | | $ | 3,663,676 | | |
Shares issued in reinvestment of
distributions | | | 15,160 | | | | 184,649 | | | | 40,246 | | | | 489,384 | | |
Payments for shares redeemed | | | (460,138 | ) | | | (5,623,667 | ) | | | (588,352 | ) | | | (7,294,039 | ) | |
Net decrease | | | (347,431 | ) | | $ | (4,247,761 | ) | | | (253,572 | ) | | $ | (3,140,979 | ) | |
Arbitrage Fund - Class A | |
Proceeds from shares sold | | | 402,219 | | | $ | 5,124,610 | | | | 814,430 | | | $ | 10,516,478 | | |
Shares issued in reinvestment of
distributions | | | 19,983 | | | | 253,588 | | | | 24,669 | | | | 311,576 | | |
Payments for shares redeemed | | | (325,498 | ) | | | (4,155,387 | ) | | | (280,261 | ) | | | (3,628,301 | ) | |
Net increase | | | 96,704 | | | $ | 1,222,811 | | | | 558,838 | | | $ | 7,199,753 | | |
www.arbitragefunds.com | 1-800-295-4485
112
The Arbitrage Funds Notes to Financial Statements (continued)
| | | Year Ended
May 31, 2019 | | Year Ended
May 31, 2018 | |
Event-Driven Fund - Class R | | Shares | | Value | | Shares | | Value | |
Proceeds from shares sold | | | 572,854 | | | $ | 5,382,416 | | | | 952,751 | | | $ | 9,025,402 | | |
Shares issued in reinvestment of
distributions | | | 37,998 | | | | 353,763 | | | | 8,493 | | | | 79,582 | | |
Proceeds from redemption fees
collected | | | — | | | | — | | | | — | | | | 129 | | |
Payments for shares redeemed | | | (2,196,314 | ) | | | (20,654,136 | ) | | | (3,686,005 | ) | | | (34,599,975 | ) | |
Net decrease | | | (1,585,462 | ) | | $ | (14,917,957 | ) | | | (2,724,761 | ) | | $ | (25,494,862 | ) | |
Event-Driven Fund - Class I | |
Proceeds from shares sold | | | 1,337,752 | | | $ | 12,728,183 | | | | 5,551,789 | | | $ | 52,751,442 | | |
Shares issued in reinvestment of
distributions | | | 173,194 | | | | 1,622,831 | | | | 56,759 | | | | 535,241 | | |
Proceeds from redemption fees
collected | | | — | | | | — | | | | — | | | | 72 | | |
Payments for shares redeemed | | | (2,596,458 | ) | | | (24,686,089 | ) | | | (2,048,069 | ) | | | (19,471,721 | ) | |
Net increase/(decrease) | | | (1,085,512 | ) | | $ | (10,335,075 | ) | | | 3,560,479 | | | $ | 33,815,034 | | |
Event-Driven Fund - Class C | |
Proceeds from shares sold | | | 119 | | | $ | 1,100 | | | | 10,593 | | | $ | 97,835 | | |
Shares issued in reinvestment of
distributions | | | 441 | | | | 4,041 | | | | — | | | | — | | |
Payments for shares redeemed | | | (41,879 | ) | | | (387,752 | ) | | | (54,189 | ) | | | (503,253 | ) | |
Net decrease | | | (41,319 | ) | | $ | (382,611 | ) | | | (43,596 | ) | | $ | (405,418 | ) | |
Event-Driven Fund - Class A | |
Proceeds from shares sold | | | 37,148 | | | $ | 351,232 | | | | 43,941 | | | $ | 414,575 | | |
Shares issued in reinvestment of
distributions | | | 1,399 | | | | 13,015 | | | | 205 | | | | 1,916 | | |
Payments for shares redeemed | | | (28,180 | ) | | | (266,487 | ) | | | (56,753 | ) | | | (534,754 | ) | |
Net increase/(decrease) | | | 10,367 | | | $ | 97,760 | | | | (12,607 | ) | | $ | (118,263 | ) | |
Annual Report | May 31, 2019
113
The Arbitrage Funds Notes to Financial Statements (continued)
| | | Year Ended
May 31, 2019 | | Year Ended
May 31, 2018 | |
Credit Opportunities Fund - Class R | | Shares | | Value | | Shares | | Value | |
Proceeds from shares sold | | | 565,549 | | | $ | 5,466,164 | | | | 484,329 | | | $ | 4,700,554 | | |
Shares issued in reinvestment of
distributions | | | 23,032 | | | | 223,098 | | | | 31,334 | | | | 303,892 | | |
Payments for shares redeemed | | | (755,201 | ) | | | (7,333,975 | ) | | | (773,871 | ) | | | (7,518,629 | ) | |
Net decrease | | | (166,620 | ) | | $ | (1,644,713 | ) | | | (258,208 | ) | | $ | (2,514,183 | ) | |
Credit Opportunities Fund - Class I | |
Proceeds from shares sold | | | 2,701,830 | | | $ | 26,082,551 | | | | 906,195 | | | $ | 8,765,846 | | |
Shares issued in reinvestment of
distributions | | | 166,340 | | | | 1,601,817 | | | | 102,882 | | | | 993,716 | | |
Payments for shares redeemed | | | (1,431,809 | ) | | | (13,740,602 | ) | | | (1,861,252 | ) | | | (17,999,359 | ) | |
Net increase/(decrease) | | | 1,436,361 | | | $ | 13,943,766 | | | | (852,175 | ) | | $ | (8,239,797 | ) | |
Credit Opportunities Fund - Class C | |
Proceeds from shares sold | | | — | | | $ | — | | | | 1,558 | | | $ | 15,006 | | |
Shares issued in reinvestment of
distributions | | | 1,278 | | | | 12,324 | | | | 1,084 | | | | 10,480 | | |
Payments for shares redeemed | | | (18,575 | ) | | | (180,135 | ) | | | (46,373 | ) | | | (447,223 | ) | |
Net decrease | | | (17,297 | ) | | $ | (167,811 | ) | | | (43,731 | ) | | $ | (421,737 | ) | |
Credit Opportunities Fund - Class A | |
Proceeds from shares sold | | | 1,501 | | | $ | 14,514 | | | | 90,651 | | | $ | 873,760 | | |
Shares issued in reinvestment of
distributions | | | 466 | | | | 4,485 | | | | 758 | | | | 6,605 | | |
Payments for shares redeemed | | | (5,171 | ) | | | (49,069 | ) | | | (86,741 | ) | | | (838,809 | ) | |
Net increase/(decrease) | | | (3,204 | ) | | $ | (30,070 | ) | | | 4,668 | | | $ | 41,556 | | |
www.arbitragefunds.com | 1-800-295-4485
114
The Arbitrage Funds Notes to Financial Statements (continued)
| | | Year Ended
May 31, 2019 | | Year Ended
May 31, 2018 | |
Long/Short Fund - Class R | | Shares | | Value | | Shares | | Value | |
Shares issued in reinvestment of
distributions | | | 21 | | | | 206 | | | | — | | | | — | | |
Net increase | | | 21 | | | $ | 206 | | | | — | | | $ | — | | |
Long/Short Fund - Class I | |
Proceeds from shares sold | | | 36,793 | | | $ | 366,929 | | | | 13,393 | | | $ | 135,037 | | |
Shares issued in reinvestment of
distributions | | | 4,583 | | | | 43,718 | | | | — | | | | — | | |
Payments for shares redeemed | | | (19,151 | ) | | | (189,524 | ) | | | (3,389 | ) | | | (34,125 | ) | |
Net increase | | | 22,225 | | | $ | 221,123 | | | | 10,004 | | | $ | 100,912 | | |
Long/Short Fund - Class C | |
Shares issued in reinvestment of
distributions | | | 21 | | | | 206 | | | | — | | | | — | | |
Net increase | | | 21 | | | $ | 206 | | | | — | | | $ | — | | |
Long/Short Fund - Class A | |
Shares issued in reinvestment of
distributions | | | 22 | | | | 206 | | | | — | | | | — | | |
Net increase | | | 22 | | | $ | 206 | | | | — | | | $ | — | | |
8. FOREIGN CURRENCY TRANSLATION
Amounts denominated in or expected to settle in foreign currencies are translated to U.S. dollars based on exchange rates on the basis outlined below:
A. The market values of investment securities and other assets and liabilities are translated at the closing rate of exchange each day.
B. Purchases and sales of investment securities and income and expenses are translated at the rate of exchange prevailing on the respective dates of such transactions.
C. The Funds do not isolate that portion of the results of operations caused by changes in foreign exchange rates on investments from those caused by changes in market prices of securities held. Such fluctuations are included with the net realized and unrealized gains or losses on investments. Reported net realized foreign exchange gains or losses arise from 1) purchases and sales of foreign currencies; 2) currency gains or losses realized between the trade and settlement dates on security transactions; and 3) the difference between the amounts of dividends, interest and foreign withholding taxes recorded on the Funds' books, and the U.S. dollar equivalent of the amounts actually received or paid. Reported net unrealized foreign exchange gains and losses arise from changes in the value of assets and liabilities, other than investment securities, resulting from changes in exchange rates.
Annual Report | May 31, 2019
115
The Arbitrage Funds Notes to Financial Statements (continued)
9. CONTINGENCIES AND COMMITMENTS
The Funds indemnify the Trust's officers and trustees for certain liabilities that might arise from their performance of their duties to the Funds. Additionally, in the normal course of business, the Funds enter into contracts that contain a variety of representations and warranties and which provide general indemnifications. The Funds' maximum exposure under these arrangements is unknown, as this would involve future claims that may be made against the Funds that have not yet occurred. However, based on experience, the Funds expect the risk of loss to be remote.
10. SECURITIES LENDING
To generate additional income, the Funds may, from time to time, lend portfolio securities to broker-dealers, banks or institutional borrowers of securities. At the time of the loan, the Funds must receive from the borrower 102% collateral in the form of cash or U.S. government securities. This collateral must be valued daily and, should the market value of the loaned securities increase, the borrower must furnish additional collateral to the Funds. During the time portfolio securities are on loan, the borrower pays the Funds any dividends or interest paid on such securities.
Loans are subject to termination by the Funds or the borrower at any time. While the Funds do not have the right to vote securities on loan, they have the right to terminate the loan and regain the right to vote if that is considered important with respect to the investment. In the event the borrower defaults in its obligation to the Fund, the Funds bear the risk of delay in the recovery of portfolio securities and the risk of loss of rights in the collateral.
The Funds may participate in a securities lending program under which the Funds' custodian, State Street Bank and Trust Company (the "Custodian") acting as securities lending agent, is authorized to lend Fund portfolio securities to qualified brokers/dealers and financial institutions that post appropriate collateral. The value of securities loaned will not exceed one-third of the value of the total assets of the Fund making the loan. The Custodian has agreed to indemnify the Fund in case of default of any security borrower.
Securities on loan are fully collateralized and the collateral was equal to or exceeded the securities on loan. Cash collateral is invested in the State Street Institutional U.S. Government Money Market Fund, Premier Class. The Custodian receives a portion of the interest earned on any reinvested collateral. Income received by the Funds in securities lending transactions during the year ended May 31, 2019, if any, is reflected as securities lending income in the Statement of Operations. The market value of securities on loan to borrowers and the value of collateral held by the Funds with respect to such loans at May 31, 2019 were as follows:
| | | Market Value of
Loaned Securities | | Value of Cash
Collateral | | Value of Non-Cash
Collateral | |
Event-Driven Fund | | $ | 27,156 | | | $ | 29,924 | | | $ | — | | |
11. FEDERAL TAX INFORMATION
In order to avoid imposition of the excise tax applicable to regulated investment companies, it is the Funds' intention to declare as dividends in each calendar year at least 98.0% of its net investment income (earned during the calendar year) and 98.2% of its net realized capital gains (earned during the twelve months ended October 31) plus undistributed amounts from prior years.
The amount of distributions from net investment income and net realized gains, if any, are determined in accordance with Federal income tax regulations which may differ from accounting principles generally accepted in the United States of America. These "book/tax" differences are
www.arbitragefunds.com | 1-800-295-4485
116
The Arbitrage Funds Notes to Financial Statements (continued)
either temporary or permanent in nature and permanent differences are charged or credited to undistributed net investment income (loss), accumulated net realized gain (loss) or paid-in capital as appropriate in the period that the differences arise.
Permanent differences between the Funds' financial statement and income tax reporting requirements are primarily attributable to gains and losses on certain foreign currency related transactions, short sale related dividend expense, investments in passive foreign investment companies, investments in swaps, ordinary loss netting to reduce short-term capital gains, convertible bonds, corporate actions, non-deductible excise tax activity and partnership basis adjustments. These have no effect on the Funds' net assets or net asset value per share.
Fund | | Distributable
Earnings
(Accumulated Loss) | | Paid-in Capital | |
Arbitrage Fund | | $ | 5,122 | | | $ | (5,122 | ) | |
Event-Driven Fund | | | 2,531 | | | | (2,531 | ) | |
Credit Opportunities Fund | | | 1 | | | | (1 | ) | |
Long/Short Fund | | | 48 | | | | (48 | ) | |
The tax character of dividends and distributions declared and paid during the years ended May 31, 2019 and May 31, 2018 was as follows:
Fund | | Year
Ended | | Ordinary
Income | | Long-Term
Capital Gains* | | Total
Distributions | |
Arbitrage Fund | | 5/31/2019 | | $ | 29,608,804 | | | $ | 2,793,274 | | | $ | 32,402,078 | | |
| | | 5/31/2018 | | | 55,974,429 | | | | 11,622,718 | | | | 67,597,147 | | |
Event-Driven Fund | | 5/31/2019 | | $ | 2,299,685 | | | $ | — | | | $ | 2,299,685 | | |
| | | 5/31/2018 | | | 730,268 | | | | — | | | | 730,268 | | |
Credit Opportunities Fund | | 5/31/2019 | | $ | 1,863,801 | | | $ | — | | | $ | 1,863,801 | | |
| | | 5/31/2018 | | | 1,400,663 | | | | — | | | | 1,400,663 | | |
Long/Short Fund | | 5/31/2019 | | $ | 39,986 | | | $ | 4,350 | | | $ | 44,336 | | |
| | | 5/31/2018 | | | — | | | | — | | | | — | | |
* The Funds designate these distributions as long-term capital gains dividends per IRC code section 852(b)(3)(C).
As of May 31, 2019, the components of distributable earnings on a tax basis were as follows:
| | | Arbitrage
Fund | | Event-Driven Fund | | Credit
Opportunities
Fund | | Long/Short
Fund | |
Undistributed ordinary
income | | $ | 21,843,269 | | | $ | 519,952 | | | $ | 66,269 | | | $ | 14,061 | | |
Accumulated capital
gains/losses | | | 12,763,361 | | | | — | | | | — | | | | 22,300 | | |
Unrealized appreciation/
(depreciation) | | | 3,528,983 | | | | (1,306,291 | ) | | | (161,966 | ) | | | (69,800 | ) | |
Capital loss carryover | | | — | | | | (58,050,337 | ) | | | (2,916,265 | ) | | | — | | |
Total distributable
earnings
(accumulated loss) | | $ | 38,135,613 | | | $ | (58,836,676 | ) | | $ | (3,011,962 | ) | | $ | (33,439 | ) | |
Annual Report | May 31, 2019
117
The Arbitrage Funds Notes to Financial Statements (continued)
The following information is computed on a tax basis for each item as of May 31, 2019:
Fund | | Gross
Appreciation
(excess of value
over tax cost) | | Gross
Depreciation
(excess of tax
cost over value) | | Net Unrealized
Appreciation | | Aggregate Cost
of Investments
for Income Tax
Purposes | |
Arbitrage Fund | | $ | 37,729,146 | | | $ | (25,407,852 | ) | | $ | 12,321,294 | | | $ | 1,727,942,261 | | |
Event-Driven Fund | | | 2,396,148 | | | | (4,067,880 | ) | | | (1,671,732 | ) | | | 132,148,752 | | |
Credit Opportunities Fund | | | 291,993 | | | | (696,773 | ) | | | (404,780 | ) | | | 59,285,643 | | |
Long/Short Fund | | | 56,349 | | | | (157,201 | ) | | | (100,852 | ) | | | 2,602,443 | | |
The differences between book-basis and tax-basis net unrealized appreciation/(depreciation) for the Funds are attributable to constructive sales, dividends related to short securities, swap mark to market, wash sales, convertible bonds, straddle loss deferrals, partnership basis adjustments, forward contracts mark to market and unsettled short sales.
Capital Losses
As of May 31, 2019, the Event-Driven Fund had $49,145,252 of short term and $8,905,085 of long term capital loss carryforwards and the Credit Opportunities Fund had $1,802,859 of short term and $1,113,406 of long term capital loss carryforwards which may reduce the Funds' taxable income arising from future net realized gains on investments, if any, to the extent permitted by the Code and thus may reduce the amount of the distributions to shareholders which would otherwise be necessary to relieve the Funds of any liability for federal tax.
The Event-Driven Fund utilized $1,313,446 of capital loss carryforwards, and the Credit Opportunities Fund utilized $190,353 of capital loss carryforwards during the year ended May 31, 2019.
12. SUBSEQUENT EVENTS
Effective July 31, 2019, Class A and Class C shares of the Water Island Long/Short Fund will be liquidated.
Effective August 5, 2019, The Arbitrage Event-Driven Fund will change its name to Water Island Diversified Event-Driven Fund. The Fund's portfolio managers, investment objective and investment strategies will not change.
www.arbitragefunds.com | 1-800-295-4485
118
Report of Independent Registered Public Accounting Firm
The Shareholders and Board of Trustees of
The Arbitrage Funds
Opinion on the Financial Statements
We have audited the accompanying statements of assets and liabilities of The Arbitrage Funds (the Trust) (comprising The Arbitrage Fund, The Arbitrage Event-Driven Fund, The Water Island Credit Opportunities Fund, previously The Arbitrage Credit Opportunities Fund, and The Water Island Long/Short Fund, previously The Arbitrage Tactical Equity Fund) (collectively referred to as the "Funds"), including the schedules of investments, as of May 31, 2019, and the related statements of operations and changes in net assets, and the financial highlights for each of the periods indicated in the table below and the related notes (collectively referred to as the "financial statements"). In our opinion, the financial statements present fairly, in all material respects, the financial position of each of the Funds comprising the Trust at May 31, 2019, the results of their operations, changes in net assets and financial highlights for each of the periods indicated in the table below, in conformity with U.S. generally accepted accounting principles.
| Fund | | Statement of
operations | | Statements of
changes in net assets | | Financial highlights | |
The Arbitrage Fund
The Arbitrage Event-Driven Fund
The Water Island Credit Opportunities Fund | | For the year ended May 31, 2019 | | For each of the two years in the period ended May 31, 2019 | | For each of the five years in the period ended May 31, 2019 | |
The Water Island Long/Short Fund | | For the year ended May 31, 2019 | | For each of the two years in the period ended May 31, 2019 | | For each of the four years in the period ended May 31, 2019, and the period from January 2, 2015 (commencement of operations) to May 31, 2015 | |
Basis for Opinion
These financial statements are the responsibility of the Trust's management. Our responsibility is to express an opinion on each of the Fund's financial statements based on our audits. We are a public accounting firm registered with the Public Company Accounting Oversight Board (United States) ("PCAOB") and are required to be independent with respect to the Trust in accordance with the U.S. federal securities laws and the applicable rules and regulations of the Securities and Exchange Commission and the PCAOB.
We conducted our audits in accordance with the standards of the PCAOB. Those standards require that we plan and perform the audit to obtain reasonable assurance about whether the financial statements are free of material misstatement, whether due to error or fraud. The Trust is not required to have, nor were we engaged to perform, an audit of the Trust's internal control over financial reporting. As part of our audits, we are required to obtain an understanding of internal control over
Annual Report | May 31, 2019
119
Report of Independent Registered Public Accounting Firm (continued)
financial reporting, but not for the purpose of expressing an opinion on the effectiveness of the Trust's internal control over financial reporting. Accordingly, we express no such opinion.
Our audits included performing procedures to assess the risks of material misstatement of the financial statements, whether due to error or fraud, and performing procedures that respond to those risks. Such procedures included examining, on a test basis, evidence regarding the amounts and disclosures in the financial statements. Our procedures included confirmation of securities owned as of May 31, 2019, by correspondence with the custodians and brokers or by other appropriate auditing procedures where replies from brokers were not received. Our audits also included evaluating the accounting principles used and significant estimates made by management, as well as evaluating the overall presentation of the financial statements. We believe that our audits provide a reasonable basis for our opinion.

We have served as the auditor of The Arbitrage Funds since 2012.
Minneapolis, Minnesota
July 25, 2019
www.arbitragefunds.com | 1-800-295-4485
120
The Arbitrage Funds Disclosure of Fund Expenses
All mutual funds have operating expenses. As a shareholder of a mutual fund, your investment is affected by these ongoing costs, which include (among others) costs for portfolio management, administrative services, distribution (12b-1) expenses, redemption fees and shareholder reports like this one. It is important for you to understand the impact of these costs on your investment returns.
Operating expenses such as these are deducted from a mutual fund's gross income and directly reduce its final investment return. These expenses are expressed as a percentage of a mutual fund's average net assets; this percentage is known as a mutual fund's expense ratio.
The following examples use the expense ratio and are intended to help you understand the ongoing costs (in dollars) of investing in your Fund and to compare these costs with those of other mutual funds. The examples are based on an investment of $1,000 made at the beginning of the period shown and held for the entire period.
The table on the following page illustrates your Fund's cost in two ways:
Actual Fund Return. The section helps you to estimate the actual expenses after fee waivers that your Fund incurred over the period. The "Expenses Paid During Period" column shows the actual dollar expense cost incurred by a $1,000 investment in the Fund, and the "Ending Account Value" number is derived from deducting that expense cost from the Fund's gross investment return.
You can use this information, together with the actual amount you invested in the Fund, to estimate the expenses you paid over that period. Simply divide your actual account value by $1,000 to arrive at a ratio (for example, an $8,600 account value divided by $1,000 = 8.6), then multiply that ratio by the number shown for your Fund under "Expenses Paid During Period."
Hypothetical 5% Return. This section helps you compare your Fund's costs with those of other mutual funds. It assumes that the Fund had an annual 5% return before expenses during the period, but that expense ratio (Column 3) for the period is unchanged. This example is useful in making comparisons because the Securities and Exchange Commission requires all mutual funds to make this 5% calculation. You can assess your Fund's comparative cost by comparing the hypothetical result for your Fund in the "Expenses Paid During Period" column with those that appear in the same charts in the shareholder reports for other mutual funds.
Note: Because the return is set at 5% for comparison purposes — NOT your Fund's actual return — the account values shown may not apply to your specific investment.
Annual Report | May 31, 2019
121
The Arbitrage Funds Disclosure of Fund Expenses (continued)
| | | Beginning
Account Value
12/01/2018 | | Ending
Account Value
05/31/2019 | | Expense
Ratio(a) | | Expenses
Paid During
Period(b) | |
The Arbitrage Fund | |
Class R | |
Actual | | $ | 1,000.00 | | | $ | 1,018.70 | | | | 1.99 | % | | $ | 10.02 | | |
Hypothetical (5% return before
expenses) | | $ | 1,000.00 | | | $ | 1,015.01 | | | | 1.99 | % | | $ | 10.00 | | |
Class I | |
Actual | | $ | 1,000.00 | | | $ | 1,020.10 | | | | 1.74 | % | | $ | 8.76 | | |
Hypothetical (5% return before
expenses) | | $ | 1,000.00 | | | $ | 1,016.26 | | | | 1.74 | % | | $ | 8.75 | | |
Class C | |
Actual | | $ | 1,000.00 | | | $ | 1,015.20 | | | | 2.74 | % | | $ | 13.77 | | |
Hypothetical (5% return before
expenses) | | $ | 1,000.00 | | | $ | 1,011.27 | | | | 2.74 | % | | $ | 13.74 | | |
Class A | |
Actual | | $ | 1,000.00 | | | $ | 1,019.20 | | | | 1.98 | % | | $ | 9.97 | | |
Hypothetical (5% return before
expenses) | | $ | 1,000.00 | | | $ | 1,015.06 | | | | 1.98 | % | | $ | 9.95 | | |
(a) Annualized, based on the Fund's most recent fiscal half-year expenses.
(b) Expenses, are equal to the Fund's annualized ratio multiplied by the average account value over the period, multiplied by the number of days in the most recent fiscal half year (182), divided by 365.
| | | Beginning
Account Value
12/01/2018 | | Ending
Account Value
05/31/2019 | | Expense
Ratio(a) | | Expenses
Paid During
Period(b) | |
The Arbitrage Event-Driven Fund | |
Class R | |
Actual | | $ | 1,000.00 | | | $ | 1,014.90 | | | | 2.03 | % | | $ | 10.20 | | |
Hypothetical (5% return before
expenses) | | $ | 1,000.00 | | | $ | 1,014.81 | | | | 2.03 | % | | $ | 10.20 | | |
Class I | |
Actual | | $ | 1,000.00 | | | $ | 1,015.60 | | | | 1.81 | % | | $ | 9.10 | | |
Hypothetical (5% return before
expenses) | | $ | 1,000.00 | | | $ | 1,015.91 | | | | 1.81 | % | | $ | 9.10 | | |
Class C | |
Actual | | $ | 1,000.00 | | | $ | 1,011.30 | | | | 2.79 | % | | $ | 13.99 | | |
Hypothetical (5% return before
expenses) | | $ | 1,000.00 | | | $ | 1,011.02 | | | | 2.79 | % | | $ | 13.99 | | |
Class A | |
Actual | | $ | 1,000.00 | | | $ | 1,014.50 | | | | 2.06 | % | | $ | 10.35 | | |
Hypothetical (5% return before
expenses) | | $ | 1,000.00 | | | $ | 1,014.66 | | | | 2.06 | % | | $ | 10.35 | | |
(a) Annualized, based on the Fund's most recent fiscal half-year expenses.
(b) Expenses, are equal to the Fund's annualized ratio multiplied by the average account value over the period, multiplied by the number of days in the most recent fiscal half year (182), divided by 365.
www.arbitragefunds.com | 1-800-295-4485
122
The Arbitrage Funds Disclosure of Fund Expenses (continued)
| | | Beginning
Account Value
12/01/2018 | | Ending
Account Value
05/31/2019 | | Expense
Ratio(a) | | Expenses
Paid During
Period(b) | |
The Water Island Credit Opportunities Fund | |
Class R | |
Actual | | $ | 1,000.00 | | | $ | 1,023.70 | | | | 1.52 | % | | $ | 7.67 | | |
Hypothetical (5% return before
expenses) | | $ | 1,000.00 | | | $ | 1,017.35 | | | | 1.52 | % | | $ | 7.64 | | |
Class I | |
Actual | | $ | 1,000.00 | | | $ | 1,024.00 | | | | 1.28 | % | | $ | 6.46 | | |
Hypothetical (5% return before
expenses) | | $ | 1,000.00 | | | $ | 1,018.55 | | | | 1.28 | % | | $ | 6.44 | | |
Class C | |
Actual | | $ | 1,000.00 | | | $ | 1,020.00 | | | | 2.28 | % | | $ | 11.48 | | |
Hypothetical (5% return before
expenses) | | $ | 1,000.00 | | | $ | 1,013.56 | | | | 2.28 | % | | $ | 11.45 | | |
Class A | |
Actual | | $ | 1,000.00 | | | $ | 1,022.70 | | | | 1.53 | % | | $ | 7.72 | | |
Hypothetical (5% return before
expenses) | | $ | 1,000.00 | | | $ | 1,017.30 | | | | 1.53 | % | | $ | 7.70 | | |
(a) Annualized, based on the Fund's most recent fiscal half-year expenses.
(b) Expenses, are equal to the Fund's annualized ratio multiplied by the average account value over the period, multiplied by the number of days in the most recent fiscal half year (182), divided by 365.
| | | Beginning
Account Value
12/01/2018 | | Ending
Account Value
05/31/2019 | | Expense
Ratio(a) | | Expenses
Paid During
Period(b) | |
The Water Island Long/Short Fund | |
Class R | |
Actual | | $ | 1,000.00 | | | $ | 1,028.70 | | | | 2.35 | % | | $ | 11.89 | | |
Hypothetical (5% return before
expenses) | | $ | 1,000.00 | | | $ | 1,013.21 | | | | 2.35 | % | | $ | 11.80 | | |
Class I | |
Actual | | $ | 1,000.00 | | | $ | 1,028.70 | | | | 2.08 | % | | $ | 10.52 | | |
Hypothetical (5% return before
expenses) | | $ | 1,000.00 | | | $ | 1,014.56 | | | | 2.08 | % | | $ | 10.45 | | |
Class C | |
Actual | | $ | 1,000.00 | | | $ | 1,028.70 | | | | 3.06 | % | | $ | 15.48 | | |
Hypothetical (5% return before
expenses) | | $ | 1,000.00 | | | $ | 1,009.67 | | | | 3.06 | % | | $ | 15.33 | | |
Class A | |
Actual | | $ | 1,000.00 | | | $ | 1,028.70 | | | | 2.35 | % | | $ | 11.89 | | |
Hypothetical (5% return before
expenses) | | $ | 1,000.00 | | | $ | 1,013.21 | | | | 2.35 | % | | $ | 11.80 | | |
(a) Annualized, based on the Fund's most recent fiscal half-year expenses.
(b) Expenses, are equal to the Fund's annualized ratio multiplied by the average account value over the period, multiplied by the number of days in the most recent fiscal half year (182), divided by 365.
Annual Report | May 31, 2019
123
The Arbitrage Funds Additional Information
1. PROXY VOTING POLICIES AND VOTING RECORD
A description of the policies and procedures that the Funds use to vote proxies relating to portfolio securities during the most recent 12-month period ended June 30 is available without charge upon request by calling toll-free 1-800-295-4485, or on the Securities and Exchange Commission's ("SEC") website at http://www.sec.gov. Information regarding how the Funds voted proxies will be available without charge upon request by calling toll-free 1-800-295-4485, or on the SEC's website at http://www.sec.gov.
2. QUARTERLY PORTFOLIO HOLDINGS
The Funds file a complete listing of their portfolio holdings with the SEC as of the first and third quarters of each fiscal year on Form N-Q. The filings are available upon request by calling 1-800-295-4485. Furthermore, you may obtain a copy of the filing on the SEC's website at http://www.sec.gov. The Funds' Forms N-Q may also be reviewed and copied at the SEC's Public Reference Room in Washington, D.C., and information on the operation of the Public Reference Room may be obtained by calling 1-800-SEC-0330.
www.arbitragefunds.com | 1-800-295-4485
124
The Arbitrage Funds Approval of Investment Advisory Agreements
As required under the Investment Company Act of 1940 (the "1940 Act"), the Board of Trustees (the "Board") of The Arbitrage Funds (the "Trust"), which is comprised of The Arbitrage Fund, The Arbitrage Event-Driven Fund, The Water Island Credit Opportunities Fund (formerly, The Arbitrage Credit Opportunities Fund) and The Water Island Long/Short Fund (formerly, The Arbitrage Tactical Equity Fund) (each, a "Fund" and, collectively, the "Funds"), determines annually whether to continue each Fund's investment advisory agreement with Water Island Capital, LLC, the investment adviser to each Fund (the "Adviser"). In considering the renewal of the agreements, the Board, including a majority of those Trustees who are not "interested persons" of the Funds (the "disinterested Trustees"), as defined in the 1940 Act, met with representatives of the Adviser telephonically on May 3, 2019 (the "Telephonic Meeting") and in-person on May 22, 2019 (the "In-Person Meeting," together with the Telephonic Meeting, the "Meetings") and in separate in-person executive sessions on February 27, 2019 and in advance of the In-Person Meeting on May 22, 2019 and approved the continuation of the agreements after concluding that the continuation of the agreements was in the best interests of each Fund and its shareholders.
The Board requested and received materials relating to the agreements in advance of the Meetings. Among other things, the Board considered comparative fee information from the Adviser. Also, the Board considered expense and performance comparisons with other mutual funds in each Fund's peer group as determined by Broadridge, an independent source of mutual fund analysis, as further discussed below. Representatives of Broadridge discussed their report with the Board and responded to questions from the Trustees at the Telephonic Meeting. The Board also considered that it had reviewed the Funds' performance against other comparable mutual funds as provided by the Adviser at the Meetings and at the Board's other meetings throughout the year, in addition to other information requested by the disinterested Trustees and provided by the Adviser and other service providers at the Meetings and throughout the year. The Trustees were also continually aware of their requests and information provided by the Adviser and other service providers from previous contract renewal periods as well as information regularly received by the Trustees from various other sources such as the Investment Company Institute ("ICI"), the Independent Directors Council and the Mutual Fund Directors Forum, among others.
In approving the agreements, the Board, including the disinterested Trustees advised by independent legal counsel, considered the factors it deemed relevant, including the nature, quality and extent of services provided, the performance of each Fund, the profitability of the Adviser, expenses and fees, and the potential for economies of scale that may be shared with each Fund and its shareholders as each Fund's assets grow. In their deliberations, the Trustees did not identify any single factor which alone was responsible for the Board's decision to approve the agreement with respect to each Fund, or of any individual factor or group of factors which might indicate that the various contracts and plans should not be renewed. In connection with its deliberations, the Board considered information provided by the Adviser throughout the year at regular Board meetings and between Board meetings, presentations from portfolio managers and other information, as well as information furnished at or in advance of the meeting held on May 22, 2019.
Nature, Extent and Quality of the Services under the Advisory Agreements
The Board received and considered information regarding the nature, extent and quality of services provided to each Fund by the Adviser under the advisory agreement for such Fund. The Board also noted information received at regular meetings and at other times throughout the year related to the services rendered by the Adviser. The Board reviewed background information about the Adviser, including its Form ADV. The Board considered the background and experience of the Adviser's senior management and the qualifications, backgrounds and responsibilities of the portfolio managers primarily responsible for the day-to-day portfolio management of the Funds and the extent of the
Annual Report | May 31, 2019
125
The Arbitrage Funds Approval of Investment Advisory Agreements (continued)
resources devoted to research and analysis of actual and potential investments. The Board considered the steps that the Adviser had taken during the past year to improve performance, including, without limitation, hiring and changes in personnel, enhancements in technology, and the Adviser's focus on evaluating risk and performance for the Funds, including the implementation of a liquidity risk management program for the Funds. The Board also received and considered available information about the nature, extent and quality of services and fee rates offered to other clients of the Adviser for comparable services. The Board considered the nature, extent and quality of the investment management services provided to each Fund by the Adviser and the services provided by the Adviser under the advisory agreement for each Fund compared to those provided to similar mutual funds by other investment advisers.
Adviser Profitability
The Board was provided with information on the Adviser's profitability in serving as the investment adviser to each Fund. The Board recognized that it is difficult to make comparisons of profitability from fund management contracts because comparative information is not generally publicly available and is affected by numerous factors, including the structure of the particular adviser, the types of funds it manages, its business mix, numerous assumptions regarding allocations of expenses and the adviser's capital structure and cost of capital. Taking these factors into account, the Board concluded that the Adviser's profitability in relation to the services rendered was reasonable and that it was believed to be sufficient to continue to support increased investments to enhance services to the Funds and their shareholders.
Economies of Scale
The Board considered information regarding potential economies of scale with respect to the management of each Fund, whether the Fund has appropriately benefited from any economies of scale, and whether there is potential for realization of any further economies of scale. With respect to The Arbitrage Fund, the Board noted that the management fee schedule for the Fund includes breakpoints, which have the effect of decreasing the fee rate as assets increase, and that at its current level of assets the Fund's effective fee rate reflected those rate reductions. The Board took note that the Fund's fee structure currently results in benefits to Fund shareholders whether or not the Adviser realizes any economies of scale. With respect to The Water Island Credit Opportunities Fund, the Board noted that the amendment to the Fund's management fee schedule during the past year had lowered the Fund's management fee, which now included breakpoints. The Board noted that the advisory fee schedules for The Arbitrage Event-Driven Fund and The Water Island Long/Short Fund do not contain breakpoints that would reduce the fee rate on assets above specified levels. The Board determined that, while fee breakpoints were not currently necessary for The Arbitrage Event-Driven Fund or The Water Island Long/Short Fund given the smaller size of these Funds, they would continue to review whether breakpoints should be incorporated in the advisory fees for these Funds. The disinterested Trustees were also aware that potential economies of scale may be shared acceptably with a Fund in many different manners such as fee breakpoints, fee waivers or caps, reinvestments in the Adviser's business above contractual levels, additional new product offerings, pricing to scale from inception, among others. The Trustees noted that each Fund is party to an expense limitation agreement with the Adviser, pursuant to which the Adviser has agreed to reimburse expenses should they exceed certain contractually specified levels. The disinterested Trustees are also aware that is it extremely difficult to determine whether potential economies of scale in fact exist for any fund, or for a fund complex, and, or, at what point any potential economies of scale may begin to be reduced at some asset level, or possibly reverse and become diseconomies of scale. The Trustees are aware of the ICI report in December 2000 on mutual fund fees and expenses which concluded that potential economies of scale could not be found with a high degree of statistical certainty when a small number
www.arbitragefunds.com | 1-800-295-4485
126
The Arbitrage Funds Approval of Investment Advisory Agreements (continued)
of extremely large complexes or funds were omitted. Thus, the Trustees are aware that they needed to use their business judgment and experience in evaluating whether any potential economies of scale might be equitably shared with the Funds.
Other Benefits to the Adviser
The Board considered other benefits received by the Adviser as a result of its relationship with the Funds. The Board concluded that the potential benefits to be derived by the Adviser included the ability to use soft dollar credits as well as the potential benefits consistent with those generally resulting from an increase in assets under management, specifically, potential access to additional research resources and benefits to its reputation. The Board concluded that the benefits derived by the Adviser were consistent with the types of benefits generally derived by investment advisers to mutual funds. The Board considered the standards applied in seeking best execution and reviewed the Adviser's method for and policies with respect to allocating portfolio investment opportunities among its advisory clients, including the Funds. The disinterested Trustees considered these and any other potential fall-out benefits and generally determined these to be not material to the consideration of the management and other fees and to the Adviser's profitability generally.
Other Factors and Broader Review
As discussed above, the Board reviewed detailed materials received from the Adviser as part of the annual review, and also at quarterly meetings throughout the year and over previous years. The Board also reviews and assesses the quality of the services that the Funds receive throughout the year. In this regard, the Board reviews reports of the Adviser at least quarterly, which include, among other things, detailed portfolio and market reviews, detailed Fund performance reports and compliance reports along with various reports and information evaluating the Adviser's supervisory oversight of third-party service providers and sub-service providers to the Funds.
Investment Advisory Fee Rates and Expenses and Performance
The Board reviewed and considered the contractual advisory fee rates for each Fund in light of the extent and quality of the advisory services provided by the Adviser. The Board also reviewed and considered the contractual fee waivers and expense reimbursements currently in place for each Fund.
The Board also received and considered information comparing the effective advisory fee rates and gross and net total expenses for each Fund in comparison to those of a group of funds within the Fund's Lipper category selected independently by Broadridge (the "Expense Group") as well as to funds in the same Lipper category ("Expense Universe"). The comparisons placed each Fund in various quintiles, with the first quintile being the lowest cost mutual funds.
The performance of each Fund for the periods ended March 31, 2019, was compared to the performance of the funds within the same Lipper category, regardless of asset size or primary channel of distribution and including exchange-traded funds ("Performance Universe"). The Board also received and considered additional information provided by the Adviser on other comparable mutual funds and comparisons of the performance of each Fund to additional securities indices that the Adviser deemed relevant to the Board's considerations. The disinterested Trustees also noted that they regularly engage in discussions with the Adviser and counsel with regard to the portfolio benchmark comparisons for each Fund. The Trustees and the Adviser discussed the differences between an adviser's duties and its risks incurred in offering a sponsored mutual fund versus the more limited duties and risks involved in acting as a sub-adviser to a mutual fund, and also in comparing a sponsor adviser's duties and risks incurred in offering a sponsored mutual fund versus the much more limited duties and risks incurred managing an institutional separate account.
Annual Report | May 31, 2019
127
The Arbitrage Funds Approval of Investment Advisory Agreements (continued)
The Arbitrage Fund
The Fund's performance (Class I Shares, net of fees) was compared to the Performance Universe of Alternative Event Driven funds as classified by Lipper. The Fund's performance was also compared to its secondary benchmark, the S&P 500 Index. The Fund's net total return ranked in the third quintile of its Performance Universe for the one-, three- and five-year periods and in the fourth quintile of its Performance Universe for the ten-year period. The Fund also outperformed its primary benchmark, the BofA Merrill Lynch U.S. 3-Month Treasury Bill Index, for all periods, but underperformed its secondary benchmark, the S&P 500 Index, for all periods. The Trustees noted that while the secondary benchmark for the Fund is the S&P 500 Index, such benchmark is not directly comparable to the management style of the Fund and thus other factors must be considered in reviewing the performance of the Fund.
The Fund's "actual management fees" (i.e., advisory and administrative fees net of waivers/reimbursements) were in the second quintile of its Expense Group and the third quintile of its Expense Universe. The Fund's "actual nonmanagement expenses" (i.e., transfer agent expenses and custodian fees and other nonmanagement expenses) were in the third and second quintiles of the Expense Group and the Expense Universe, respectively. It was noted that the Adviser had entered into an expense waiver and reimbursement agreement to limit fees through September 30, 2020, although the Fund's expenses did not currently reach a level to require the Adviser to waive fees or reimburse expenses.
The Board determined that, given all of the factors provided, it would be in the best interests of the Fund and its shareholders to continue the advisory agreement. The Fund's fee structure was considered reasonable.
The Arbitrage Event-Driven Fund
The Fund's performance (Class I Shares, net of fees) was compared to the Performance Universe of Alternative Event Driven funds as classified by Lipper. The Fund's performance was also compared to its secondary benchmark, the Bloomberg Barclays U.S. Aggregate Bond Index. The Fund's net total return for the one-year period was in the fourth quintile of the Performance Universe, for the three-year period was in the third quintile of its Performance Universe, and for the five-year period was in the last quintile of the Performance Universe. It was noted that the Fund had underperformed its primary benchmark index, the BofA Merrill Lynch U.S. 3-Month Treasury Bill Index, for the one- and five-year periods, but had outperformed it for the three-year period. The Trustees noted that the Fund outperformed its secondary benchmark index, the Bloomberg Barclays U.S. Aggregate Bond Index, for the three-year period, but had underperformed it for the one- and five-year periods. The Trustees noted that the Fund's underperformance for the five-year period was partially attributable to the Fund's performance in the calendar year ended 2015, and noted that the Fund's performance had shown improvement since that time.
The Fund's "actual management fees" (i.e., advisory and administrative fees net of waivers/reimbursements) were in the first quintile of its Expense Group and of its Expense Universe. The Fund's "actual nonmanagement expenses" (i.e., transfer agent expenses and custodian fees and other nonmanagement expenses) were in the fourth quintile of the Expense Group and the last quintile of the Expense Universe. It was noted that the Adviser had entered into an expense waiver and reimbursement agreement to limit fees through September 30, 2020.
The Board determined that, given all of the factors provided, it would be in the best interests of the Fund and its shareholders to continue the advisory agreement. In light of the Fund's current size and fee rate, the Board concluded that the fee structure was reasonable and that the absence of
www.arbitragefunds.com | 1-800-295-4485
128
The Arbitrage Funds Approval of Investment Advisory Agreements (continued)
breakpoints in the Fund's fee schedule was acceptable at this time, although the Board would continue to monitor whether breakpoints should be implemented for the Fund.
The Water Island Credit Opportunities Fund
The Fund's performance (Class I Shares, net of fees) was compared to a Performance Universe composed of funds within Lipper's Alternative Credit Focus category. The Fund's net total return for the three- and five-year periods was in the fourth quintile of the Performance Universe and for the one-year period was in the second quintile of the Performance Universe. The Fund outperformed its primary benchmark, the BofA Merrill Lynch U.S. 3-Month Treasury Bill Index, for the one-, three- and five-year periods. The Fund outperformed its secondary benchmark, the Bloomberg Barclays Capital U.S. Aggregate Bond Index, for the three-year period and underperformed it for the one- and five-year periods.
The Fund's "actual management fees" (i.e., advisory and administrative fees net of waivers/reimbursements) were in the third quintile of its Expense Group and the fourth quintile of its Expense Universe. The Fund's "actual nonmanagement expenses" (i.e., transfer agent expenses and custodian fees and other nonmanagement expenses) were in the last quintile of the Expense Group and the Expense Universe. It was noted that the median and average asset size of the funds in the Expense Group was much larger than that of the Fund and that many of those funds appear to benefit from economies of scale. It was further noted that the Adviser had lowered the Fund's management fee and instituted a breakpoint to the Fund's management fee schedule during the past year and had entered into an expense waiver and reimbursement agreement to further limit fund fees and expenses through September 30, 2020.
The Board determined, given all of the factors provided, that it would be in the best interests of the Fund and its shareholders to continue the advisory agreement. In light of the Fund's current size and amended fee rate, the Board concluded that the fee structure was reasonable.
The Water Island Long/Short Fund
The Fund's performance (Class I Shares, net of fees) was compared to a Performance Universe composed of the funds within Lipper's Alternative Long/Short Equity category. The Fund's net total return for the one- and three-year periods was in the third and fourth quintiles, respectively, of its Peer Universe. For the one-year period, the Fund underperformed and for the three-year period outperformed its primary benchmark, the BofA Merrill Lynch U.S. 3-Month Treasury Bill Index. The Fund underperformed its secondary benchmark, the S&P 500 Index, for the one- and three-year periods.
The Fund's "actual management fees" (i.e., advisory and administrative fees net of waivers/reimbursements) were in the first quintile of its Expense Group and of its Expense Universe. The Fund's "actual nonmanagement expenses" (i.e., transfer agent expenses and custodian fees and other nonmanagement expenses) were in the last quintile of the Expense Group and the Expense Universe. It was further noted that the Adviser had entered into an expense waiver and reimbursement agreement to limit fund fees and expenses through September 30, 2020.
The Board determined that, given all of the factors provided, it would be in the best interests of the Fund and its shareholders to continue the advisory agreement. In light of the Fund's current size and fee rate, the Board concluded that the fee structure was reasonable and that the absence of breakpoints in the Fund's fee schedule was acceptable at this time, although the Board would continue to monitor whether breakpoints should be implemented for the Fund.
Annual Report | May 31, 2019
129
The Arbitrage Funds Trustees & Officers
INTERESTED TRUSTEES:
Name, Address
and Age | | Length of
Time Served | | Position
with Trust | | Principal
Occupation
During the
Past Five Years | | Other
Directorships
During the Past
Five Years | | Number of
Portfolios in
the Fund
Complex
Overseen by
Trustee | |
John S. Orrico, CFA*
41 Madison
Avenue, 42nd
Floor, New York,
NY 10010
(Age 59) | | Since 2000 | | President and Chairman of the Board of Trustees | | Managing Member, Water Island Capital, LLC, the Investment Adviser, since January 2000. | | None | | | 4 | | |
Christina Chew*
41 Madison
Avenue, 42nd
Floor, New York,
NY 10010
(Age 48) | | Since 2018 | | Trustee | | Senior Managing Partner of Water Island Capital, LLC, the Investment Adviser, since 2013. | | None | | | 4 | | |
* John S. Orrico and Christina Chew, as affiliated persons of the Adviser, are each an "interested person" of the Trust within the meaning of Section 2(a)(19) of the 1940 Act.
www.arbitragefunds.com | 1-800-295-4485
130
The Arbitrage Funds Trustees & Officers (continued)
INDEPENDENT TRUSTEES*:
Name, Address
and Age | | Length of
Time Served | | Position
with Trust | | Principal
Occupation
During the
Past Five Years | | Other
Directorships
During the Past
Five Years | | Number of
Portfolios in
the Fund
Complex
Overseen by
Trustee | |
John C. Alvarado
(Age 59) | | Since 2003 | | Lead Independent Trustee | | CFO of Magnum Development LLC, a privately held Utah-based integrated energy storage and power generation company (2016-present). Previously, Managing Director at Alvarado Energy Advisors LLC ("AEA"), a boutique investment banking firm providing financial advisory services to middle market energy companies (2014-2016); Managing Director for The Seaport Group, a credit-focused investment bank (2010-2014). | | None | | | 4 | | |
Robert P. Herrmann
(Age 56) | | Since 2012 | | Trustee | | President & CEO of Discovery Data, a leading financial services industry data provider (2009 - present). | | Independent Director of TD Asset Management (USA) (since 2014); Independent Director of FundChoice Holdings LLC (since 2014). | | | 4 | | |
Annual Report | May 31, 2019
131
The Arbitrage Funds Trustees & Officers (continued)
Name, Address
and Age | | Length of
Time Served | | Position
with Trust | | Principal
Occupation
During the
Past Five Years | | Other
Directorships
During the Past
Five Years | | Number of
Portfolios in
the Fund
Complex
Overseen by
Trustee | |
Stephen R. Byers
(Age 65) | | Since 2016 | | Trustee | | Independent Director (since 2011); Independent Consultant (since 2014). | | Independent Chair (since November 2016), Trustee (since 2011), Lead Independent Trustee (2015-2016) and Audit Committee Chair (2011-2015), Deutsche Bank db-X ETF Trust (45 portfolios); Independent Director and Audit Committee Chair (since 2012), Sierra Income Corporation; Trustee (2002-2011), The College of William and Mary, Graduate School of Business; Board Member (since 2016), Mutual Fund Directors Forum. | | | 4 | | |
www.arbitragefunds.com | 1-800-295-4485
132
The Arbitrage Funds Trustees & Officers (continued)
Name, Address
and Age | | Length of
Time Served | | Position
with Trust | | Principal
Occupation
During the
Past Five Years | | Other
Directorships
During the Past
Five Years | | Number of
Portfolios in
the Fund
Complex
Overseen by
Trustee | |
Francis X. Tracy
(Age 61) | | Since 2016 | | Trustee | | President, Chief Financial Officer, Treasurer, and Secretary for Batterymarch Financial Management, Inc. (1999-2014). | | Batterymarch Global Emerging Markets Fund (Luxembourg) (2010-2014). | | | 4 | | |
Nancy M. Morris
(Age 67) | | Since 2018 | | Trustee | | Chief Compliance Officer and Managing Director, Wellington Management Company LLP | | Director of Diamond Hill Funds (13 portfolios) (since 2019). | | | 4 | | |
Annual Report | May 31, 2019
133
The Arbitrage Funds Trustees & Officers (continued)
EXECUTIVE OFFICERS:
Name, Address
and Age | | Length of
Time Served | | Position
with Trust | | Principal
Occupation
During the
Past Five Years | | Other
Directorships
During the Past
Five Years | | Number of
Portfolios in
the Fund
Complex
Overseen by
Trustee | |
William Keena
41 Madison
Avenue, 42nd
Floor, New York,
NY 10010
(Age 68) | | Since 2013 | | Secretary | | Chief Administrative Officer (2010 - present), Water Island Capital. | | N/A | | | N/A | | |
Jonathon Hickey
41 Madison
Avenue, 42nd
Floor, New York,
NY 10010
(Age 38) | | Since 2013 | | Treasurer | | Chief Operating Officer (2016 - present), Water Island Capital; Director of Operations (2011-2016), Water Island Capital; Fund Accounting Manager (2004-2011), SEI. | | N/A | | | N/A | | |
Monique Labbe
Foreside
Management
Services, LLC
10 High St. #302,
Boston, MA
02110
(Age 45) | | Since 2015 | | Chief Financial Officer | | Senior Director, Foreside Management Services, LLC** (2014 - present); Principal/Assistant Vice President – Global Funds Management, State Street Global Advisors (2012-2014). | | N/A | | | N/A | | |
www.arbitragefunds.com | 1-800-295-4485
134
The Arbitrage Funds Trustees & Officers (continued)
Name, Address
and Age | | Length of
Time Served | | Position
with Trust | | Principal
Occupation
During the
Past Five Years | | Other
Directorships
During the Past
Five Years | | Number of
Portfolios in
the Fund
Complex
Overseen by
Trustee | |
Ludmila Chwazik
41 Madison
Avenue 42nd
Floor New York,
NY 10010
(Age: 53) | | Since 2016 | | Anti-Money Laundering Officer, Chief Compliance Officer | | Chief Compliance Officer, Water Island Capital (2016 - present); SVP Legal & Compliance, Neuberger Berman (2014-2016); Chief Compliance Officer, APG Asset Management (2010-2014). | | N/A | | | N/A | | |
* Each Independent Trustee may be contacted by writing to the Trustee c/o Fatima Sulaiman, K&L Gates LLP, 1601 K Street, NW, Washington, D.C. 20006-1600.
** Foreside Fund Services provides chief financial officer services to the Trust under a Fund CFO/Treasurer agreement with the Trust.
Annual Report | May 31, 2019
135

The Arbitrage Fund
The Arbitrage Event-Driven Fund
The Water Island Credit Opportunities Fund
The Water Island Long/Short Fund
800-295-4485
www.arbitragefunds.com
Adviser
Water Island Capital, LLC
41 Madison Avenue, 42nd Floor
New York, NY 10010
Distributor
ALPS Distributors, Inc.
1290 Broadway, Suite 1100
Denver, CO 80203
Transfer Agent
DST Systems, Inc.
P.O. Box 219842
Kansas City, MO 64121-9842
Custodian
State Street Bank & Trust
225 Liberty Street
New York, NY 10281
This material must be preceded or accompanied by a prospectus. Please read it carefully before investing.
Item 2. Code of Ethics.
(a) The Registrant, as of the end of the period covered by the report, has adopted a code of ethics that applies to the Registrant’s principal executive officer, principal financial officer, principal accounting officer or controller or any persons performing similar functions on behalf of the Registrant.
(b) Not applicable.
(c) During the period covered by this report, no amendments were made to the provisions of the code of ethics adopted in 2(a) above.
(d) During the period covered by this report, no implicit or explicit waivers to the provisions of the code of ethics adopted in 2(a) above were granted.
(e) Not applicable.
(f) The Registrant’s Code of Ethics is attached as an Exhibit hereto.
Item 3. Audit Committee Financial Expert.
(a)(1) The Registrant’s board of trustees has determined that the Registrant has at least one audit committee financial expert serving on the audit committee.
(a)(2) The audit committee financial experts are John C. Alvarado and Francis X. Tracy, who are each independent as defined in Form N-CSR Item 3(a)(2).
Item 4. Principal Accountant Fees and Services.
(a) Audit Fees: For the Registrant’s fiscal years ended May 31, 2019 and May 31, 2018, the aggregate fees billed for professional services rendered by the principal accountant for the audit of the Registrant’s annual financial statements were $119,400 and $110,500, respectively.
(b) Audit-Related Fees: For the Registrant’s fiscal years ended May 31, 2019 and May 31, 2018, the aggregate fees billed for assurance and related services by the principal accountant that are reasonably related to the performance of the audit of the Registrant’s financial statements and are not reported under paragraph (a) of this Item were $0 and $0, respectively.
(c) Tax Fees: For the Registrant’s fiscal years ended May 31, 2019 and May 31, 2018, aggregate fees of $31,900 and $29,000, respectively, were billed for professional services rendered by the principal accountant for tax compliance, tax advice, and tax planning.
(d) All Other Fees: For the Registrant’s fiscal years ended May 31, 2019 and May 31, 2018, no fees were billed to the Registrant by the principal accountant for services other than the services reported in paragraphs (a) through (c) of this item.
(e)(1) Audit Committee Pre-Approval Policies and Procedures: All services to be performed by the Registrant’s principal auditors must be pre-approved by the Registrant’s audit committee.
(e)(2) No services described in paragraphs (b) through (d) were approved pursuant to paragraph (c)(7)(i)(C) of Rule 2-01 of Regulation S-X.
(f) Not applicable.
(g) The aggregate non-audit fees billed by the Registrant’s principal accountant for the fiscal years ended May 31, 2019 and May 31, 2018 were $31,900 and $29,000, respectively.
(h) Not applicable.
Item 5. Audit Committee of Listed Registrants.
Not applicable.
Item 6. Schedule of Investments.
The Schedule of Investments is included as part of the Report to Stockholders filed under Item 1 of this form.
Item 7. Disclosure of Proxy Voting Policies and Procedures for Closed-End Management Investment Companies.
Not applicable.
Item 8. Portfolio Managers of Closed-End Management Investment Companies.
Not applicable.
Item 9. Purchases of Equity Securities by Closed-End Management Investment Company and Affiliated Purchasers.
Not applicable.
Item 10. Submission of Matters to Vote of Security Holders.
There have been no material changes to the procedures by which shareholders may recommend nominees to the registrant’s Board of Trustees.
Item 11. Controls and Procedures.
(a) The registrant’s principal executive officer and principal financial officer have evaluated the registrant’s disclosure controls and procedures (as defined in Rule 30a-3(c) under the Investment Company Act of 1940, as amended) within 90 days of this filing and have concluded that the registrant’s disclosure controls and procedures were effective, as of that date.
(b) There was no change in the registrant’s internal control over financial reporting (as defined in Rule 30a-3(d) under the Investment Company Act of 1940, as amended) during the second fiscal quarter of the period covered by this report that has materially affected, or is reasonably likely to materially affect, the registrant’s internal control over financial reporting.
Item 12. Disclosure of Securities Lending Activities for Closed-End Management Investment Companies
Not applicable.
Item 13. Exhibits.
(a)(1) The code of ethics that applies to the registrant’s principal executive officer and principal financial officer is attached hereto as EX-13.A.1.
(a)(2) A separate certification for the principal executive officer and the principal financial officer of the registrant as required by Rule 30a-2(a) under the Investment Company Act of 1940, as amended (17 CFR 270.30a-2(a)), are attached hereto as exhibit Ex-99.CERT.
(a)(3) Not applicable.
(a)(4) Not applicable.
(b) The certifications by the registrant’s principal executive officer and principal financial officer, as required by Rule 30a-2(b) of the Investment Company Act of 1940, as amended, and Section 906 of the Sarbanes-Oxley Act of 2002 are attached hereto as Ex-99.906CERT.
SIGNATURES
Pursuant to the requirements of the Securities Exchange Act of 1934 and the Investment Company Act of 1940, the registrant has duly caused this report to be signed on its behalf by the undersigned, thereunto duly authorized.
THE ARBITRAGE FUNDS
By: | /s/ John S. Orrico | |
| John S. Orrico | |
| President (Principal Executive Officer) | |
| | |
Date: | August 6, 2019 | |
Pursuant to the requirements of the Securities Exchange Act of 1934 and the Investment Company Act of 1940, this report has been signed below by the following persons on behalf of the registrant and in the capacities and on the dates indicated.
By: | /s/ John S. Orrico | |
| John S. Orrico | |
| President (Principal Executive Officer) | |
| | |
Date: | August 6, 2019 | |
By: | /s/ Monique Labbe | |
| Monique Labbe | |
| Chief Financial Officer (Principal Financial Officer) | |
| | |
Date: | August 6, 2019 | |