UNITED STATES
SECURITIES AND EXCHANGE COMMISSION
Washington, D.C. 20549
FORM N-CSR
CERTIFIED SHAREHOLDER REPORT OF REGISTERED
MANAGEMENT INVESTMENT COMPANIES
Investment Company Act file number: 811-09815
the arbitrage funds
(exact name of registrant as specified in charter)
41 Madison Avenue, 42nd Floor, New York, NY 10010
(Address of principal executive offices) (Zip code)
John S. Orrico
Water Island Capital, LLC
41 Madison Avenue
42nd Floor
New York, NY 10010
(Name and address of agent for service)
Registrant’s telephone number, including area code: 800-295-4485
Date of fiscal year end: May 31
Date of reporting period: May 31, 2020
Item 1. Reports to Stockholders.

Annual Report
May 31, 2020
Arbitrage Fund
Water Island Diversified Event-Driven Fund
Water Island Credit Opportunities Fund
Water Island Long/Short Fund
Paper copies of The Arbitrage Funds' shareholder reports will no longer be sent by mail, unless you specifically request paper copies of the reports from The Arbitrage Funds or from your financial intermediary, such as a broker — dealer or bank. Instead, the reports will be made available on a website (https://artbitragefunds.com/restricted/content/downloads.html) and you will be notified by mail each time a report is posted and provided with a website link to access the report.
If you have already elected to receive your shareholder reports electronically, you will not be affected by this change and you need not take any action. You may elect to receive shareholder reports and other communications from The Arbitrage Funds electronically by sending a request in writing to: Arbitrage Funds, PO Box 219842, Kansas City MO 64121-9842 or by calling 1-800-295-4485.
You may also elect to receive all future reports in paper free of charge. You can inform The Arbitrage Funds [or your financial intermediary] that you wish to continue receiving paper copies of your shareholder reports by sending a request in writing to: Arbitrage Funds, PO Box 219842, Kansas City MO 64121-9842 or by calling 1-800-295-4485. Your election to receive reports in paper will apply to all Arbitrage Funds you hold directly in an account with The Arbitrage Funds. You must provide separate instructions to each of your financial intermediaries.

TABLE OF CONTENTS
Shareholder Letter | | | 1 | | |
Arbitrage Fund | |
Manager Commentary | | | 3 | | |
Portfolio Information | | | 6 | | |
Portfolio of Investments | | | 8 | | |
Water Island Diversified Event-Driven Fund | |
Manager Commentary | | | 16 | | |
Portfolio Information | | | 18 | | |
Portfolio of Investments | | | 20 | | |
Water Island Credit Opportunities Fund | |
Manager Commentary | | | 30 | | |
Portfolio Information | | | 32 | | |
Portfolio of Investments | | | 34 | | |
Water Island Long/Short Fund | |
Manager Commentary | | | 44 | | |
Portfolio Information | | | 46 | | |
Portfolio of Investments | | | 48 | | |
Statements of Assets and Liabilities | | | 58 | | |
Statements of Operations | | | 62 | | |
Statements of Changes in Net Assets | | | 66 | | |
Financial Highlights | |
Arbitrage Fund - Class R | | | 70 | | |
Arbitrage Fund - Class I | | | 71 | | |
Arbitrage Fund - Class C | | | 72 | | |
Arbitrage Fund - Class A | | | 73 | | |
Water Island Diversified Event-Driven Fund - Class R | | | 74 | | |
Water Island Diversified Event-Driven Fund - Class I | | | 75 | | |
Water Island Diversified Event-Driven Fund - Class C | | | 76 | | |
Water Island Diversified Event-Driven Fund - Class A | | | 77 | | |
Water Island Credit Opportunities Fund - Class R | | | 78 | | |
Water Island Credit Opportunities Fund - Class I | | | 79 | | |
Water Island Credit Opportunities Fund - Class C | | | 80 | | |
Water Island Credit Opportunities Fund - Class A | | | 81 | | |
Water Island Long/Short Fund - Class R | | | 82 | | |
Water Island Long/Short Fund - Class I | | | 83 | | |
Notes to Financial Statements | | | 84 | | |
Report of Independent Registered Public Accounting Firm | | | 111 | | |
Disclosure of Fund Expenses | | | 112 | | |
Additional Information | | | 115 | | |
Approval of Investment Advisory Agreements | | | 116 | | |
Liquidity Risk | | | 121 | | |
Trustees & Officers | | | 122 | | |
The Arbitrage Funds Shareholder Letter
Dear Fellow Shareholders,
The past fiscal year – and the past few months in particular – has been an unprecedented time not just for investors but for much of humanity. Nearly a year ago, most conversations regarding financial markets focused on the US/China trade war, concerns about inflation and slowing global growth, and whether the Federal Reserve ("Fed") would reverse course after more than two years of small but steady interest rate hikes and cut rates for the first time in over a decade. Not only did the Fed implement a 25-basis-point cut in August 2019, but scarcely more than six months later the Fed Funds rate was back at zero, where it was mired for seven years following the Financial Crisis. In the face of widespread uncertainty and the potential for massive economic losses stemming from the COVID-19 pandemic, the Fed had swiftly cut rates to zero and embarked on a massive stimulus program to bolster the economy and financial markets. Further stimulus programs from Congress were also passed to help turn the tide. Though March 2020 officially saw the end of the longest bull run in history, with the S&P 500 Index having traded down nearly 34% at one point, investors responded with confidence. Through April and May markets in the US began to recover just as quickly as they declined. Optimism around progress on coronavirus vaccines and the potential re-opening of economies across the nation may have played a part, but one must also remember the adage, "Don't fight the Fed."
What does such a challenging and unpredictable environment mean for us as event-driven investors? We are cautious not to say that broader market moves are entirely inconsequential for our event-driven strategies, but in general the idiosyncratic nature of our funds' return drivers was maintained throughout the volatility. During the worst moments of the downturn, when levered investors and panicked sellers sought liquidity wherever it was available, we did see correlations converge – even in our most idiosyncratic, most definitive investment opportunities (such as merger arbitrage investments). This is not unexpected in an extreme bear market as these types of positions are often both less impacted by market moves and easier to sell, and we saw many parallels in 2020 to our experiences during 2008. While periods of market stress can lead to a spike in short-term volatility in the strategy, they can also present attractive opportunities to initiate or scale up positions at favorable rates of return, and as of May 31, each of our funds had generated positive returns for both the fiscal year and the calendar year-to-date period.
Looking ahead, we believe we are by no means out of the woods yet – neither for event-driven strategies nor markets overall. We expect to encounter bouts of volatility in the months ahead. Not only has the ultimate outcome of the COVID-19 pandemic yet to be written, but we have the added wrinkle of a presidential election year in the US. Merger arbitrage returns could be challenged in the short term as interest rates are subdued, the pace of newly announced mergers and acquisitions (M&A) is likely to abate before it picks up again, and M&A targets and acquirers are more likely to attempt to abandon a definitive transaction during a time of economic distress and uncertainty. That said, the current slate of announced deals has provided plenty of opportunity and – as always – a definitive merger agreement is a binding contract. With few exceptions (such as a material adverse change in a company's business or failure to secure financing, a shareholder vote, or regulatory approval for a deal) a definitive transaction, once announced, must close. Our job as arbitrageurs is to discern which transactions are at greatest risk of incurring these exceptions – the deals to avoid – and which warrant adding to the portfolio. Furthermore, despite potential headwinds for merger arb, we also have reason to be optimistic. Following a period in which asset prices have been depressed, after an initial slowdown in M&A, consolidation activity typically resumes quickly. Companies in a position of strength seek to make opportunistic acquisitions while companies in a position of weakness must combine to survive.
Annual Report | May 31, 2020
1
The Arbitrage Funds Shareholder Letter (continued)
We also tend to see an increase in competitive bidding situations where multiple topping bids can still result in a takeout price far below where a target had been trading mere months prior. Topping bids are a boon to returns and we witnessed such a scenario in 2009, coming out of the Financial Crisis, when competitive bidders emerged in multiple deals throughout the course of the year. Outside of our merger arbitrage strategy, we intend to remain focused on the types of catalysts that can best help isolate portfolios from broader market moves – i.e., shorter duration investments with more definitive outcomes. This includes a robust pipeline of spin-offs as well as speculative M&A opportunities in several transactions that were rumored to have been underway yet were called off in light of the pandemic, but which we now believe are more likely to resume. The portfolios have also begun investing in special purpose acquisition companies, which are specifically designed to engage in an acquisition as a means to take public the target company.
Regardless of the specific flavor of event-driven investing, whether it be pure-play merger arbitrage, long/short equity and credit investing, or a multi-strategy approach combining all of the above, we will continue to seek to generate returns from the outcomes of idiosyncratic corporate catalysts rather than broad market direction, while also striving to preserve capital during times of market stress. Above all else, throughout the ongoing health crisis we hope that you and your families remain safe, and you may rest assured that our goal is to steward our clients' assets with the same care that we safeguard the health of our own colleagues and families. Thank you for your continued support.
Sincerely,
The Investment Team
Water Island Capital
The discussion of market trends and companies throughout this commentary are not intended as advice to any person regarding the advisability of investing in any particular security. Some of our comments are based on current management expectations and are considered "forward-looking statements." Actual future results, however, may prove to be different from our expectations. Our views are a reflection of our best judgment at the time of the commentary and are subject to change any time based on market and other conditions, and we have no obligation to update them.
Glossary
Basis Point: An amount equal to 1/100 of 1%.
Fed Funds Rate: The interest rate at which a depository institution lends funds maintained at the Federal Reserve to another depository institution overnight.
Long/Short: A strategy that invests both long (i.e., purchases securities, typically with an expectation that their prices will go up) and short (i.e., sells securities, typically with an expectation that their prices will go down).
www.arbitragefunds.com | 1-800-295-4485
2
Arbitrage Fund Manager Commentary
Arbitrage Fund | Tickers: ARBNX, ARBFX, ARBCX, ARGAX
The Fund's Goal and Main Investments
The Fund seeks to achieve capital growth by engaging in merger arbitrage. Merger arbitrage is a sub-set of a broader event-driven investment strategy, which seeks to profit from investing in securities that are involved in corporate events such as mergers and acquisitions. Typically, merger arbitrage is a low volatility strategy pursued by absolute-return-minded investors. At Water Island Capital, our goal is to capture a return stream with a low correlation to the overall markets.
Investment Strategy
The strategy's focus is to capture returns from corporate events, generate market neutral capital growth, preserve capital, generate consistent and positive returns, and achieve low correlation and low volatility. The Fund generally engages in active and frequent trading of portfolio securities to achieve its principal investment objective. In attempting to achieve its investment strategy, the Fund plans to invest at least 80% of its net assets in equity securities of companies (both U.S. and foreign) that are involved in publicly announced mergers, takeovers, tender offers, leveraged buyouts, spin-offs, liquidations, and other corporate reorganizations. The Fund's investment adviser uses investment strategies designed to minimize market exposure, including short selling along with purchasing and selling options. The most common merger arbitrage activity, and the approach generally used by the Fund, involves purchasing the shares of an announced acquisition target company at a discount to their expected value upon the acquisition's completion. That difference, or "spread," is the primary driver of returns for this investment strategy. There is no limit to the number of stocks the Fund can hold; however, the Fund typically invests in 40 to 80 deals at any given time. Each deal will have one, or perhaps two, equity positions (a long and short position in a stock-for-stock deal) and, in many cases, associated derivative positions for hedging purposes.
Fiscal Year Highlights
Arbitrage (ARBNX) returned 3.27% for the fiscal year ending May 31, 2020. Returns were generated predominantly in the Americas region, though Europe contributed as well. The Asia Pacific region detracted from returns slightly. The top performing sectors in the Fund were information technology and consumer discretionary. Real estate and consumer staples were the only sectors that detracted from returns over the period.
The Fund's top performing deal for the period was our position in the acquisition of Caesars Entertainment by Eldorado Resorts. In June 2019, Eldorado Resorts – a US-based holding company for casino hotels – agreed to acquire Caesars Entertainment – a local peer – for $10.0 billion in cash and stock. During Q1 2020, casinos across the nation were forced to shutter due to the novel coronavirus outbreak, causing the share prices of casino operators to plummet. This led many investors to question the desire of Caesars and Eldorado to consummate their transaction, sending the deal spread wider. In our analysis, the merger agreement and the strategic rationale for the transaction remained strong, and with the financing for the deal already committed, we believed there was still a high likelihood of reaching a successful conclusion. The volatility in the deal spread allowed us to increase our position at favorable rates of return. The portfolio benefited from a tightening in the deal spread as the market rallied in April and May, casino operator share prices began to recover, and the deal progressed through the regulatory approval process – providing confidence to investors that the transaction was increasingly likely to close. We anticipate the deal will close in mid-2020 after the receipt of all required regulatory approvals.
The second-best performer was our position in AbbVie's merger with Allergan. In June 2019, pharmaceutical companies Allergan and AbbVie announced their intent to merge. The terms of
Annual Report | May 31, 2020
3
Arbitrage Fund Manager Commentary (continued)
the deal call for AbbVie to pay $85.0 billion in cash and stock to acquire Allergan. We had developed a high degree of conviction in this transaction and built a core position in the deal coming into 2020. Based on the deal timeline, our initial expectation for completion was in early 2020. The deal spread widened amidst the extreme market volatility of Q1, and the widespread quarantining stemming from the global coronavirus pandemic led to slight delays in the regulatory approval process. This provided us an opportunity to increase our position at very favorable rates of return as we did not believe any of these developments would derail the transaction, and we were rewarded when the deal closed successfully in May.
Conversely, the top detractor in the portfolio for the period was our position in Illumina's attempted acquisition of Pacific Biosciences. In November 2018, Illumina – a US developer of tools for DNA sequencing and analysis – agreed to acquire Pacific Biosciences – a US DNA sequencing technology firm – for $1.1 billion in cash. The transaction encountered objections from multiple global regulators over the course of a long, fraught antitrust review process, primarily on a novel basis of potential competition – that is, despite limited overlap between the companies' businesses at the current time, it was feared Illumina was trying to take out a nascent competitor before it could grow. Ultimately, the companies decided to terminate the transaction shortly into 2020 rather than fight the regulators in court. We maintained our exposure to Pacific Biosciences as we believed the company remained an attractive takeout candidate – indeed, the UK regulatory authority's investigation revealed Illumina believed no fewer than four of its major competitors were potential suitors of Pacific Biosciences. While this position detracted from returns amidst widespread market volatility in Q1 2020, we continue to believe Pacific Biosciences is likely to be acquired and we are monitoring the situation closely.
The Fund's second-worst performer was Simon Property Group's planned acquisition of Taubman Centers. In February 2020, Taubman Centers – a US-based real estate investment trust focused on shopping centers – agreed to be acquired by local peer Simon Property Group for $3.2 billion in cash. As the novel coronavirus pandemic spread and malls shuttered or saw their traffic plummet amidst mass quarantines, investors began to fear Simon Property may attempt to abandon the transaction and Taubman shares plummeted as much as 24% from their peak during the quarter. We maintained our exposure to the deal as we believe the definitive merger agreement in this transaction is one of the strongest contracts in our space today, and we believe Simon has very few – if any – avenues to escape its obligation to complete the merger. In June, Simon filed to terminate the transaction, claiming Taubman has been disproportionately impacted by the pandemic and has breached its obligations under the merger agreement. Taubman in turn claimed Simon's termination is invalid and without merit, and the company believes Simon continues to be bound to the transaction in all respects. Our conviction in our position has not wavered, as we believe Taubman by far has the stronger case for several reasons. The merger agreement carves out pandemics as reasons by which a material adverse change (MAC) may be claimed. Furthermore, Taubman's obligations under the agreement only call for the company to exercise "commercially reasonable" efforts in conducting its ordinary course of business. There are no financing contingencies on this deal, and it is being funded solely from Simon's balance sheet. We have reviewed Simon's court filing, which we believe makes what are at best dubious claims to support the company's argument for termination (even more so as malls reopen and foot traffic resumes). Lastly, the case was filed in Michigan, where Taubman is both domiciled and headquartered. In our experience through similar court cases and appraisal rights processes, a "home court" advantage in such proceedings is very much a real thing. Taubman is a highly strategic asset for Simon, and there is a chance the lawsuit is simply an attempt by Simon to convince Taubman to agree to a cut in deal terms to avoid lengthy, costly litigation – but if the
www.arbitragefunds.com | 1-800-295-4485
4
Arbitrage Fund Manager Commentary (continued)
case does go to trial, we are confident that Taubman can emerge victorious and require Simon to complete the deal on its original terms.
Glossary
Commercially Reasonable Efforts: A legal concept with varying definitions in different jurisdictions, but generally understood to mean acting reasonably and not against one's own interests (a level below "best efforts").
Deal Spread: The difference between the price at which a target company's shares currently trade and the price an acquiring company has agreed to pay
Annual Report | May 31, 2020
5
Arbitrage Fund Portfolio Information
Performance (annualized returns as of May 31, 2020)
| | | One
Year | | Five
Year | | Ten
Year | | Since
Inception* | |
Arbitrage Fund, Class R | | | 3.07 | % | | | 2.25 | % | | | 2.30 | % | | | 3.91 | % | |
Arbitrage Fund, Class I | | | 3.27 | % | | | 2.51 | % | | | 2.55 | % | | | 3.03 | % | |
Arbitrage Fund, Class C** | | | 2.24 | % | | | 1.48 | % | | | N/A | | | | 1.25 | % | |
Arbitrage Fund, Class A*** | | | 3.00 | % | | | 2.24 | % | | | N/A | | | | 2.24 | % | |
ICE BofA Merrill Lynch U.S. 3-Month Treasury
Bill Index**** | | | 1.84 | % | | | 1.19 | % | | | 0.64 | % | | | 1.62 | % | |
S&P 500® Index | | | 12.84 | % | | | 9.86 | % | | | 13.15 | % | | | 5.85 | % | |
Current performance may be higher or lower than performance quoted above. Any performance data quoted represents past performance and the investment return and principal value of an investment in the Fund will fluctuate so that an investor's shares, when redeemed, may be worth more or less than their original cost. Past performance is no guarantee of future results. Returns shown above include the reinvestment of all dividends and capital gains. Performance results do not include adjustments made for financial reporting purposes in accordance with U.S. generally accepted accounting principles and may differ from the amount reported in the Financial Highlights. You can obtain performance data current to the most recent month end by calling 1-800-295-4485 or going to www.arbitragefunds.com.
* Class R inception: 9/18/00; Class I inception: 10/17/03; Class C inception: 6/1/12; Class A inception: 6/1/13. The "Since Inception" returns for securities indices are for the inception date of Class R shares.
** Class C shares are subject to a 1.00% contingent deferred sales charge on all purchases redeemed within 12 months of purchase.
*** Class A shares are subject to a maximum front-end sales load of 2.75% on purchases up to $250,000. The shares are also subject to a deferred sales charge of up to 1.00% on purchases of $250,000 or more purchased without a front-end sales charge and redeemed within 18 months of purchase.
**** Merger arbitrage and event-driven investing are market neutral investment strategies, which typically exhibit low betas and low correlations to broad equity and credit market indices. As such, the adviser has determined that a more appropriate benchmark for Arbitrage Fund is a measure of the risk-free rate, in this case the ICE Bank of America (BofA) Merrill Lynch U.S. 3-Month Treasury Bill Index.
The Total Annual Fund Operating Expenses for Class R, Class I, Class C and Class A are 1.99%, 1.74%, 2.74% and 1.99%, respectively. These expense ratios are as stated in the current prospectus and may differ from the expense ratios disclosed in the financial highlights in this report.
The ICE BofA Merrill Lynch U.S. 3-Month Treasury Bill Index tracks the performance of the U.S. dollar denominated U.S. Treasury Bills publicly issued in the U.S. domestic market with a remaining term to final maturity of less than 3 months.
The S&P 500® Index is an unmanaged index consisting of 500 stocks.
An investor may not invest directly in an index.
www.arbitragefunds.com | 1-800-295-4485
6
Arbitrage Fund Portfolio Information (continued)
Growth of $10,000 Investment
The chart represents historical performance of a hypothetical investment of $10,000 in the Class R shares of the Fund. Past performance does not guarantee future results. This chart does not reflect the deduction of taxes that a shareholder would pay on Fund distributions or the redemption of Fund shares.

Sector Weighting
The following chart shows the sector weightings of the Arbitrage Fund's investments (including short sales and excluding derivatives) as of the report date.
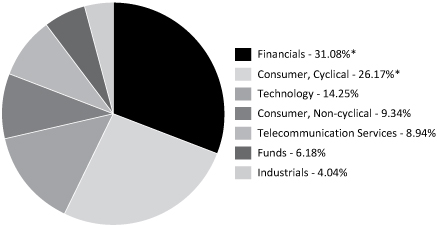
* Concentration Risk: The Fund may invest a large proportion of the Fund's assets in securities of issuers in a single sector over a given time. During such a period of concentration, the Fund may be subject to greater volatility with respect to its portfolio securities than a fund that is more broadly diversified.
Annual Report | May 31, 2020
7
Arbitrage Fund Portfolio of Investments
| | | Shares | | Value | |
COMMON STOCKS - 66.60% | |
Auto Parts & Equipment - 1.23% | |
Delphi Technologies Plc(a) | | | 1,321,984 | | | $ | 17,027,154 | | |
Banks - 1.33% | |
IBERIABANK Corp. | | | 432,845 | | | | 18,356,956 | | |
Biotechnology - 1.40% | |
Pacific Biosciences of California, Inc.(a)(b) | | | 2,841,492 | | | | 10,002,052 | | |
Stemline Therapeutics, Inc.(a) | | | 779,725 | | | | 9,263,133 | | |
| | | | 19,265,185 | | |
Computers & Computer Services - 0.43% | |
Ingenico Group SA | | | 42,904 | | | | 5,915,100 | | |
Distribution/Wholesale - 4.43% | |
Anixter International, Inc.(a) | | | 638,341 | | | | 61,095,617 | | |
Diversified Financial Services - 14.10% | |
Bolsas y Mercados Espanoles SHMSF SA | | | 653,721 | | | | 23,888,834 | | |
E*TRADE Financial Corp.(b) | | | 1,222,072 | | | | 55,653,159 | | |
Legg Mason, Inc.(b) | | | 1,074,711 | | | | 53,552,849 | | |
TD Ameritrade Holding Corp.(b) | | | 1,649,558 | | | | 61,479,027 | | |
| | | | 194,573,869 | | |
Electrical Components & Equipment - 0.70% | |
OSRAM Licht AG(a) | | | 214,289 | | | | 9,657,586 | | |
Electronics - 5.75% | |
Isra Vision AG | | | 142,190 | | | | 7,891,903 | | |
KEMET Corp.(b) | | | 2,051,583 | | | | 55,454,288 | | |
Tech Data Corp.(a) | | | 117,778 | | | | 16,046,075 | | |
| | | | 79,392,266 | | |
Entertainment - 0.72% | |
Flutter Entertainment Plc(a) | | | 78,425 | | | | 9,956,662 | | |
Healthcare - Products - 4.76% | |
QIAGEN N.V.(a) | | | 327,727 | | | | 14,300,722 | | |
Wright Medical Group N.V.(a) | | | 1,737,101 | | | | 51,331,334 | | |
| | | | 65,632,056 | | |
Insurance - 2.81% | |
TOWER Ltd.(a) | | | 9,485,696 | | | | 3,591,831 | | |
Willis Towers Watson Plc | | | 173,364 | | | | 35,175,556 | | |
| | | | 38,767,387 | | |
Internet - 0.25% | |
Meet Group, Inc.(a) | | | 566,523 | | | | 3,501,112 | | |
See Notes to Financial Statements.
www.arbitragefunds.com | 1-800-295-4485
8
Arbitrage Fund Portfolio of Investments (continued)
| | | Shares | | Value | |
COMMON STOCKS - 66.60% (Continued) | |
Lodging - 5.34% | |
Caesars Entertainment Corp.(a)(b) | | | 6,476,350 | | | $ | 73,765,626 | | |
Pharmaceuticals - 1.29% | |
Portola Pharmaceuticals, Inc.(a) | | | 987,904 | | | | 17,732,877 | | |
Real Estate Investment Trusts - 2.71% | |
Front Yard Residential Corp. | | | 366,925 | | | | 2,751,938 | | |
Taubman Centers, Inc. | | | 839,174 | | | | 34,691,453 | | |
| | | | 37,443,391 | | |
Retail - 5.96% | |
Tiffany & Co.(b) | | | 641,915 | | | | 82,248,569 | | |
Semiconductors - 2.14% | |
Adesto Technologies Corp.(a) | | | 609,153 | | | | 7,352,477 | | |
AVX Corp.(a)(c) | | | 1,022,500 | | | | 22,239,375 | | |
| | | | 29,591,852 | | |
Software - 4.39% | |
Instructure, Inc.(a)(c) | | | 249,706 | | | | 12,235,594 | | |
MINDBODY, Inc., Class A(a)(c) | | | 843,793 | | | | 30,798,444 | | |
Onemarket Ltd.(a)(c) | | | 111,800 | | | | 72,285 | | |
RIB Software SE(a) | | | 542,175 | | | | 17,453,406 | | |
| | | | 60,559,729 | | |
Telecommunications - 6.86% | |
Cincinnati Bell, Inc.(a) | | | 701,576 | | | | 10,334,215 | | |
Gilat Satellite Networks Ltd.(a) | | | 600,640 | | | | 5,021,350 | | |
LogMeIn, Inc. | | | 934,820 | | | | 79,366,218 | | |
| | | | 94,721,783 | | |
TOTAL COMMON STOCKS
(Cost $931,572,475) | | | 919,204,777 | | |
RIGHTS - 0.06% | |
Elanco Animal Health, Inc. CVR(c) | | | 1,124,589 | | | | — | | |
Media General, Inc. CVR(c) | | | 613,589 | | | | — | | |
NewStar Financial, Inc. CVR(c) | | | 1,514,945 | | | | 840,340 | | |
TOTAL RIGHTS
(Cost $394,097) | | | 840,340 | | |
See Notes to Financial Statements.
Annual Report | May 31, 2020
9
Arbitrage Fund Portfolio of Investments (continued)
| | | Maturity
Date | | Rate | | Principal
Amount | | Value | |
CORPORATE BONDS - 0.73% | |
Entertainment - 0.73% | |
Stars Group Holdings B.V. /
Stars Group
US Co-Borrower LLC(d) | | 07/15/2026 | | | 7.000 | % | | $ | 9,542,000 | | | $ | 10,114,520 | | |
TOTAL CORPORATE BONDS
(Cost $10,289,641) | | | 10,114,520 | | |
| | | Shares | | Value | |
MUTUAL FUNDS - 4.80% | |
Water Island Diversified Event-Driven Fund, Class I(e) | | | 6,589,384 | | | $ | 66,223,311 | | |
TOTAL MUTUAL FUNDS
(Cost $60,459,409) | | | 66,223,311 | | |
| | | Yield | | Shares | | Value | |
SHORT-TERM INVESTMENTS - 19.05% | |
Money Market Funds | |
Morgan Stanley Institutional Liquidity Fund
Government Portfolio, Institutional Class | | | 0.094 | %(f) | | | 131,427,234 | | | $ | 131,427,234 | | |
State Street Institutional U.S. Government
Money Market Fund, Premier Class | | | 0.249 | %(f) | | | 131,427,234 | | | | 131,427,234 | | |
| | | | | | | | 262,854,468 | | |
TOTAL SHORT-TERM INVESTMENTS
(Cost $262,854,468) | | | 262,854,468 | | |
Total Investments - 91.24%
(Cost $1,265,570,090) | | | 1,259,237,416 | | |
Other Assets in Excess of Liabilities - 8.76%(g) | | | 120,938,282 | | |
NET ASSETS - 100.00% | | $ | 1,380,175,698 | | |
Portfolio Footnotes
(a) Non-income-producing security.
(b) Security, or a portion of security, is being held as collateral for short sales or forward foreign currency exchange contracts. At May 31, 2020, the aggregate fair market value of those securities was $156,327,060, representing 11.33% of net assets.
(c) Security fair valued using significant unobservable inputs and classified as a Level 3 security. As of May 31, 2020, the total fair market value of these securities was $66,186,038, representing 4.80% of net assets.
(d) Security exempt from registration under Rule 144A of the Securities Act of 1933. These securities may be resold in transactions exempt from registration, normally to qualified institutional buyers. As of May 31, 2020, these securities had a total value of $10,114,520 or 0.73% of net assets.
See Notes to Financial Statements.
www.arbitragefunds.com | 1-800-295-4485
10
Arbitrage Fund Portfolio of Investments (continued)
(e) Affiliated investment.
(f) Rate shown is the 7-day effective yield as of May 31, 2020.
(g) Includes cash held as collateral for short sales and written option contracts.
SCHEDULE OF SECURITIES SOLD SHORT | | Shares | | Value | |
COMMON STOCKS - (7.34%) | |
Banks - (2.96%) | |
First Horizon National Corp. | | | (1,984,490 | ) | | $ | (18,554,982 | ) | |
Morgan Stanley | | | (505,806 | ) | | | (22,356,625 | ) | |
| | | | (40,911,607 | ) | |
Distribution/Wholesale - (0.19%) | |
WESCO International, Inc. | | | (78,961 | ) | | | (2,629,401 | ) | |
Electronics - (0.07%) | |
Comtech Telecommunications Corp. | | | (50,603 | ) | | | (901,240 | ) | |
Entertainment - (2.22%) | |
Eldorado Resorts, Inc. | | | (582,224 | ) | | | (20,645,663 | ) | |
Flutter Entertainment Plc | | | (78,427 | ) | | | (9,956,891 | ) | |
| | | | (30,602,554 | ) | |
Environmental Control - (0.72%) | |
Advanced Disposal Services, Inc. | | | (317,259 | ) | | | (9,892,136 | ) | |
Insurance - (0.75%) | |
Aon Plc, Class A | | | (52,632 | ) | | | (10,365,872 | ) | |
Real Estate Investment Trusts - (0.07%) | |
American Homes 4 Rent, Class A | | | (17,991 | ) | | | (454,093 | ) | |
Invitation Homes, Inc. | | | (18,860 | ) | | | (496,018 | ) | |
| | | | (950,111 | ) | |
Software - (0.36%) | |
Worldline SA | | | (67,421 | ) | | | (5,023,308 | ) | |
TOTAL COMMON STOCKS
(Proceeds $93,554,854) | | | (101,276,229 | ) | |
EXCHANGE-TRADED FUNDS - (0.12%) | |
Equity Funds - (0.12%) | |
Consumer Discretionary Select Sector SPDR® Fund | | | (4,835 | ) | | | (600,459 | ) | |
iShares Russell Mid-Cap Growth ETF | | | (1,402 | ) | | | (216,777 | ) | |
iShares U.S. Real Estate ETF | | | (6,256 | ) | | | (484,339 | ) | |
VanEck Vectors Semiconductor ETF | | | (2,735 | ) | | | (385,717 | ) | |
| | | | (1,687,292 | ) | |
TOTAL EXCHANGE-TRADED FUNDS
(Proceeds $1,546,604) | | | (1,687,292 | ) | |
TOTAL SECURITIES SOLD SHORT
(Proceeds $95,101,458) | | $ | (102,963,521 | ) | |
See Notes to Financial Statements.
Annual Report | May 31, 2020
11
Arbitrage Fund Portfolio of Investments (continued)
EQUITY SWAP CONTRACTS
Swap
Counterparty/
Payment
Frequency | | Reference
Obligation | | Rate
Paid/
Received
by the
Fund | | Termination
Date | | Upfront
Payments
Paid | | Upfront
Payments
Received | | Market
Value | | Notional
Amount | | Unrealized
Appreciation | |
Goldman
Sachs &
Co./
Monthly
| | DP World
Plc
| | Paid
1 Month+
2BD-
LIBOR
plus
95 bps
(1.121%) | |
02/24/2021 | | $ | — | | | $ | — | | | $ | — | | | $ | (3,226,462 | ) | | $ | — | | |
Goldman
Sachs &
Co./
Monthly
| | Morgan
Stanley
| | Received
1 Month
LIBOR
Minus
40 bps
(-0.070%) | |
04/30/2021 | | | — | | | | — | | | | — | | | | 33,998,065 | | | | — | | |
Morgan
Stanley &
Co./
Monthly
| | Aon Plc
| | Received
1 Month-
Federal
Rate
Minus
40 bps
(-0.350%) | |
08/12/2021 | | | — | | | | — | | | | — | | | | 26,509,667 | | | | — | | |
Morgan
Stanley &
Co./
Monthly
| | Borgwarner,
Inc.
| | Received
1 Month-
Federal
Rate
Minus
40 bps
(-0.350%) | |
08/12/2021 | | | — | | | | — | | | | — | | | | 18,326,690 | | | | — | | |
Morgan
Stanley &
Co./
Monthly
| | Charles
Schwab
Corp.
| | Received
1 Month-
Federal
Rate
Minus
40 bps
(-0.350%) | |
08/12/2021 | | | — | | | | — | | | | — | | | | 64,197,420 | | | | — | | |
| | | | | | | | | | | | | $ | — | | | $ | 139,805,380 | | | $ | — | | |
See Notes to Financial Statements.
www.arbitragefunds.com | 1-800-295-4485
12
Arbitrage Fund Portfolio of Investments (continued)
OUTSTANDING FORWARD FOREIGN CURRENCY EXCHANGE CONTRACTS
Currency
Purchased | | Currency Sold | | Counterparty | | Settlement
Date | | Unrealized
Appreciation | |
CAD | 50,164,900 | | | USD | 35,830,117 | | | Goldman Sachs & Co. | | 06/15/2020 | | $ | 604,658 | | |
EUR | 20,860,800 | | | USD | 22,836,822 | | | Goldman Sachs & Co. | | 06/15/2020 | | | 325,729 | | |
USD | 67,014,234 | | | EUR | 59,511,800 | | | Goldman Sachs & Co. | | 06/15/2020 | | | 935,985 | | |
GBP | 11,143,600 | | | USD | 13,136,067 | | | Goldman Sachs & Co. | | 06/15/2020 | | | 626,931 | | |
USD | 21,464,337 | | | GBP | 17,010,600 | | | Goldman Sachs & Co. | | 06/15/2020 | | | 455,251 | | |
NZD | 3,225,100 | | | USD | 1,926,232 | | | Goldman Sachs & Co. | | 06/15/2020 | | | 75,669 | | |
USD | 59,020 | | | NZD | 94,900 | | | Goldman Sachs & Co. | | 06/15/2020 | | | 113 | | |
USD | 21,389,598 | | | ZAR | 361,211,200 | | | Goldman Sachs & Co. | | 06/15/2020 | | | 838,276 | | |
ZAR | 361,211,200 | | | USD | 20,359,200 | | | Goldman Sachs & Co. | | 06/15/2020 | | | 192,122 | | |
| | | $ | 4,054,734 | | |
Currency
Purchased | | Currency Sold | | Counterparty | | Settlement
Date | | Unrealized
Depreciation | |
USD | 68,651 | | | AUD | 108,400 | | | Goldman Sachs & Co. | | 06/15/2020 | | $ | (3,604 | ) | |
USD | 35,998,773 | | | CAD | 50,164,900 | | | Goldman Sachs & Co. | | 06/15/2020 | | | (436,003 | ) | |
EUR | 681,800 | | | USD | 766,236 | | | Goldman Sachs & Co. | | 06/15/2020 | | | (9,207 | ) | |
USD | 31,250,792 | | | EUR | 28,682,200 | | | Goldman Sachs & Co. | | 06/15/2020 | | | (596,161 | ) | |
GBP | 5,867,000 | | | USD | 7,286,204 | | | Goldman Sachs & Co. | | 06/15/2020 | | | (40,116 | ) | |
USD | 5,450,731 | | | NZD | 8,916,500 | | | Goldman Sachs & Co. | | 06/15/2020 | | | (83,964 | ) | |
| | | $ | (1,169,055 | ) | |
The following is a summary of investments classified by country exposure:
Country | | % of Net Assets(a) | |
Netherlands | | | 5.49 | % | |
United Kingdom | | | 3.78 | % | |
Germany | | | 2.53 | % | |
Spain | | | 1.73 | % | |
Ireland | | | 0.72 | % | |
France | | | 0.43 | % | |
Israel | | | 0.36 | % | |
New Zealand | | | 0.26 | % | |
United States Virgin Islands | | | 0.20 | % | |
Australia | | | 0.01 | % | |
United States | | | 75.73 | % | |
Other Assets in Excess of Liabilities | | | 8.76 | % | |
| | | | 100.00 | % | |
(a) These percentages represent long positions only and are not net of short positions.
Abbreviations:
AG - Aktiengesellschaft is a German term that refers to a corporation that is limited by shares, i.e., owned by shareholders.
AUD - Australian dollar
bps - Basis Points. 100 Basis Points is equal to 1 percentage point.
See Notes to Financial Statements.
Annual Report | May 31, 2020
13
Arbitrage Fund Portfolio of Investments (continued)
CAD - Canadian dollar
CVR - Contingent Value Rights
ETF - Exchange-Traded Fund
EUR - Euro
GBP - British pound
LIBOR - London Interbank Offered Rate
LLC - Limited Liability Company
Ltd. - Limited
N.V. - Naamloze Vennootschap is the Dutch term for a public limited liability corporation.
NZD - New Zealand dollar
Plc - Public Limited Company
SA - Generally designates corporations in various countries, mostly those employing civil law. This translates literally in all languages mentioned as anonymous company.
SE - SE Regulation. A European Company which can operate on a Europe-wide basis and be governed by Community law directly applicable in all Member States
SPDR - Standard & Poor's Depositary Receipt
USD - United States Dollar
ZAR - South African rand
The following table summarizes the Arbitrage Fund's investments and derivative financial instruments categorized in the fair value hierarchy as of May 31, 2020:
Investments in Securities at Value* | | Level 1 | | Level 2 | | Level 3 | | Total | |
Assets | |
Common Stocks | |
Auto Parts & Equipment | | $ | 17,027,154 | | | $ | — | | | $ | — | | | $ | 17,027,154 | | |
Banks | | | 18,356,956 | | | | — | | | | — | | | | 18,356,956 | | |
Biotechnology | | | 19,265,185 | | | | — | | | | — | | | | 19,265,185 | | |
Computers & Computer
Services | | | 5,915,100 | | | | — | | | | — | | | | 5,915,100 | | |
Distribution/Wholesale | | | 61,095,617 | | | | — | | | | — | | | | 61,095,617 | | |
Diversified Financial Services | | | 194,573,869 | | | | — | | | | — | | | | 194,573,869 | | |
Electrical Components &
Equipment | | | 9,657,586 | | | | — | | | | — | | | | 9,657,586 | | |
Electronics | | | 79,392,266 | | | | — | | | | — | | | | 79,392,266 | | |
Entertainment | | | 9,956,662 | | | | — | | | | — | | | | 9,956,662 | | |
Healthcare - Products | | | 65,632,056 | | | | — | | | | — | | | | 65,632,056 | | |
Insurance | | | 38,767,387 | | | | — | | | | — | | | | 38,767,387 | | |
Internet | | | 3,501,112 | | | | — | | | | — | | | | 3,501,112 | | |
Lodging | | | 73,765,626 | | | | — | | | | — | | | | 73,765,626 | | |
Pharmaceuticals | | | 17,732,877 | | | | — | | | | — | | | | 17,732,877 | | |
Real Estate Investment Trusts | | | 37,443,391 | | | | — | | | | — | | | | 37,443,391 | | |
Retail | | | 82,248,569 | | | | — | | | | — | | | | 82,248,569 | | |
Semiconductors | | | 7,352,477 | | | | — | | | | 22,239,375 | | | | 29,591,852 | | |
Software | | | 17,453,406 | | | | — | | | | 43,106,323 | | | | 60,559,729 | | |
Telecommunications | | | 94,721,783 | | | | — | | | | — | | | | 94,721,783 | | |
Rights | | | — | | | | — | | | | 840,340 | | | | 840,340 | | |
Corporate Bonds** | | | — | | | | 10,114,520 | | | | — | | | | 10,114,520 | | |
Mutual Funds | | | 66,223,311 | | | | — | | | | — | | | | 66,223,311 | | |
Short-Term Investments | | | 262,854,468 | | | | — | | | | — | | | | 262,854,468 | | |
TOTAL | | $ | 1,182,936,858 | | | $ | 10,114,520 | | | $ | 66,186,038 | | | $ | 1,259,237,416 | | |
See Notes to Financial Statements.
www.arbitragefunds.com | 1-800-295-4485
14
Arbitrage Fund Portfolio of Investments (continued)
Other Financial Instruments*** | | Level 1 | | Level 2 | | Level 3 | | Total | |
Assets | |
Forward Foreign Currency
Exchange Contracts | | $ | — | | | $ | 4,054,734 | | | $ | — | | | $ | 4,054,734 | | |
Equity Swaps | | | 0 | | | | — | | | | — | | | | 0 | | |
Liabilities | |
Common Stocks** | | | (101,276,229 | ) | | | — | | | | — | | | | (101,276,229 | ) | |
Exchange-Traded Funds | | | (1,687,292 | ) | | | — | | | | — | | | | (1,687,292 | ) | |
Forward Foreign Currency
Exchange Contracts | | | — | | | | (1,169,055 | ) | | | — | | | | (1,169,055 | ) | |
TOTAL | | $ | (102,963,521 | ) | | $ | 2,885,679 | | | $ | — | | | $ | (100,077,842 | ) | |
* Refer to footnote 2 where leveling hierarchy is defined.
** Refer to Portfolio of Investments for sector information.
*** Other financial instruments are instruments such as securities sold short, equity swaps and forward foreign currency exchange contracts.
The following is a reconciliation of the fair valuations using significant unobservable inputs (Level 3) for the Fund's assets and liabilities during the period ended May 31, 2020:
Investments
in Securities | | Balance as of
May 31, 2019 | | Realized
Gain
(Loss) | | Change in
Unrealized
Appreciation
(Depreciation) | | Purchases | | Sales
Proceeds | | Transfers
into
Level 3 | | Transfers
out of
Level 3 | |
Balance as of
May 31, 2020 | | Net change in
Unrealized
(Depreciation)
included in the
Statement of
Operations
attributable to
Level 3
investments
held at
May 31, 2020 | |
Common
Stocks | | $ | 33,540,061 | | | $ | 140,664 | | | $ | 1,339,574 | | | $ | 87,939,061 | | | $ | (57,675,319 | ) | | $ | 61,657 | | | $ | — | | | $ | 65,345,698 | | | $ | 383,962 | | |
Rights | | | 1,125,511 | | | | (83,154 | ) | | | (16,914 | ) | | | — | | | | (185,103 | ) | | | — | | | | — | | | | 840,340 | | | | 78,020 | | |
Total | | $ | 34,665,572 | | | $ | 57,510 | | | $ | 1,322,660 | | | $ | 87,939,061 | | | $ | (57,860,422 | ) | | $ | 61,657 | | | $ | — | | | $ | 66,186,038 | | | $ | 461,982 | | |
The following table summarizes the quantitative inputs used for investments categorized as Level 3 of the fair value hierarchy as of May 31, 2020:
Investments in
Securities | | Fair Value at
May 31, 2020 | | Valuation
Technique | | Unobservable
Input | | Range of
Values | | Weighted
Average | |
Common Stocks
| | $ | 65,345,698
| | | Deal Value,
Last Trade
| | Final
determination
on Dissent, Final
Liquidation Value | | | $21.75-$49, .97 AUD
| | | | $33.78
| | |
Rights
| | $ | 840,340
| | | Discounted,
probability
adjusted value | | Discount Rate,
Probability
| | | 10%, 90%
| | | | 45%
| | |
See Notes to Financial Statements.
Annual Report | May 31, 2020
15
Water Island Diversified Event-Driven Fund Manager Commentary
Water Island Diversified Event-Driven Fund (formerly known as Arbitrage Event-Driven) |
Tickers: AEDNX, AEDFX, AEFCX, AGEAX
The Fund's Goal and Main Investments
The Fund seeks to provide capital growth by investing in credit and equity securities involved in specific corporate events, with a focus on low volatility and low correlation relative to the broader capital markets.
Investment Strategy
The Fund's investment process follows a disciplined, fundamental approach that values risk mitigation while identifying compelling risk/reward opportunities available to us as we screen catalyst-driven corporate events, such as mergers and acquisitions, restructurings, refinancings, recapitalizations, spin-offs, litigation, regulatory changes, and bankruptcy. We analyze these events through three core approaches: merger arbitrage, equity special situations, and credit opportunities. We seek to generate investment returns that have low volatility and low correlation compared to the broader capital markets. We do not manage against any particular benchmark and believe that capital preservation in difficult markets is as important as generating positive returns within our low correlated, low volatility event-driven investment strategy. This process and approach have been an integral part of the culture at Water Island Capital since the firm's inception.
Fiscal Year Highlights
Water Island Diversified Event-Driven (AEDNX) returned 5.83% for the fiscal year ending May 31, 2020. Both hard and soft catalysts investments contributed to returns overall, as did all three sub-strategies – merger arbitrage, credit opportunities, and equity special situations. Returns were driven predominantly by the Americas region, though both the European and Asia Pacific regions contributed slightly as well. The Fund's top-performing sectors were consumer discretionary and information technology. The only sector to detract from returns was real estate.
The Fund's top performing deal for the period was our merger arbitrage position in the acquisition of Caesars Entertainment by Eldorado Resorts. In June 2019, Eldorado Resorts – a US-based holding company for casino hotels – agreed to acquire Caesars Entertainment – a local peer – for $10.0 billion in cash and stock. During Q1 2020, casinos across the nation were forced to shutter due to the novel coronavirus outbreak, causing the share prices of casino operators to plummet. This led many investors to question the desire of Caesars and Eldorado to consummate their transaction, sending the deal spread wider. In our analysis, the merger agreement and the strategic rationale for the transaction remained strong, and with the financing for the deal already committed, we believed there was still a high likelihood of reaching a successful conclusion. The volatility in the deal spread allowed us to increase our position at favorable rates of return. The portfolio benefited from a tightening in the deal spread as the market rallied in April and May, casino operator share prices began to recover, and the deal progressed through the regulatory approval process – providing confidence to investors that the transaction was increasingly likely to close. We anticipate the deal will close in mid-2020 after the receipt of all required regulatory approvals.
The second-best performer was our merger arbitrage position in the AbbVie-Allergan tie-up. In June 2019, pharmaceutical companies Allergan and AbbVie announced their intent to merge. The terms of the deal call for AbbVie to pay $85.0 billion in cash and stock to acquire Allergan. We had developed a high degree of conviction in this transaction and built a core position in the deal coming into 2020. Based on the deal timeline, our initial expectation for completion was in early 2020. The deal spread widened amidst the extreme market volatility of Q1, and the widespread
www.arbitragefunds.com | 1-800-295-4485
16
Water Island Diversified Event-Driven Fund Manager Commentary (continued)
quarantining stemming from the global coronavirus pandemic led to slight delays in the regulatory approval process. This provided us an opportunity to increase our position at very favorable rates of return as we did not believe any of these developments would derail the transaction, and we were rewarded when the deal closed successfully in May.
Conversely, the top detractor in the portfolio for the period was our merger arbitrage position in Illumina's attempted acquisition of Pacific Biosciences. In November 2018, Illumina – a US developer of tools for DNA sequencing and analysis – agreed to acquire Pacific Biosciences – a US DNA sequencing technology firm – for $1.1 billion in cash. The transaction encountered objections from multiple global regulators over the course of a long, fraught antitrust review process, primarily on a novel basis of potential competition – that is, despite limited overlap between the companies' businesses at the current time, it was feared Illumina was trying to take out a nascent competitor before it could grow. Ultimately, the companies decided to terminate the transaction shortly into 2020 rather than fight the regulators in court. We maintained our exposure to Pacific Biosciences as we believed the company remained an attractive takeout candidate – indeed, the UK regulatory authority's investigation revealed Illumina believed no fewer than four of its major competitors were potential suitors of Pacific Biosciences. While this position detracted from returns amidst widespread market volatility in Q1 2020, we continue to believe Pacific Biosciences is likely to be acquired and we are monitoring the situation closely.
The Fund's second-worst performer was our merger arbitrage position in Simon Property Group's planned acquisition of Taubman Centers. In February 2020, Taubman Centers – a US-based real estate investment trust focused on shopping centers – agreed to be acquired by local peer Simon Property Group for $3.2 billion in cash. As the novel coronavirus pandemic spread and malls shuttered or saw their traffic plummet amidst mass quarantines, investors began to fear Simon Property may attempt to abandon the transaction and Taubman shares plummeted as much as 24% from their peak during the quarter. We maintained our exposure to the deal as we believe the definitive merger agreement in this transaction is one of the strongest contracts in our space today, and we believe Simon has very few – if any – avenues to escape its obligation to complete the merger. In June, Simon filed to terminate the transaction, claiming Taubman has been disproportionately impacted by the pandemic and has breached its obligations under the merger agreement. Taubman in turn claimed Simon's termination is invalid and without merit, and the company believes Simon continues to be bound to the transaction in all respects. Our conviction in our position has not wavered, as we believe Taubman by far has the stronger case for several reasons. The merger agreement carves out pandemics as reasons by which a material adverse change (MAC) may be claimed. Furthermore, Taubman's obligations under the agreement only call for the company to exercise "commercially reasonable" efforts in conducting its ordinary course of business. There are no financing contingencies on this deal, and it is being funded solely from Simon's balance sheet. We have reviewed Simon's court filing, which we believe makes what are at best dubious claims to support the company's argument for termination (even more so as malls reopen and foot traffic resumes). Lastly, the case was filed in Michigan, where Taubman is both domiciled and headquartered. In our experience through similar court cases and appraisal rights processes, a "home court" advantage in such proceedings is very much a real thing. Taubman is a highly strategic asset for Simon, and there is a chance the lawsuit is simply an attempt by Simon to convince Taubman to agree to a cut in deal terms to avoid lengthy, costly litigation – but if the case does go to trial, we are confident that Taubman can emerge victorious and require Simon to complete the deal on its original terms.
Annual Report | May 31, 2020
17
Water Island Diversified Event-Driven Fund Portfolio Information
Performance (annualized returns as of May 31, 2020)
| | | One
Year | | Five
Year | | Ten
Year | | Since
Inception* | |
Water Island Diversified Event-Driven Fund, Class R | | | 5.49 | % | | | 1.35 | % | | | N/A | | | | 1.78 | % | |
Water Island Diversified Event-Driven Fund, Class I | | | 5.83 | % | | | 1.62 | % | | | N/A | | | | 2.03 | % | |
Water Island Diversified Event-Driven Fund, Class C** | | | 4.74 | % | | | 0.61 | % | | | N/A | | | | 0.78 | % | |
Water Island Diversified Event-Driven Fund, Class A*** | | | 5.62 | % | | | 1.38 | % | | | N/A | | | | 1.33 | % | |
ICE BofA Merrill Lynch U.S. 3-Month Treasury Bill Index**** | | | 1.84 | % | | | 1.19 | % | | | N/A | | | | 0.65 | % | |
Bloomberg Barclays U.S. Aggregate Bond Index | | | 9.42 | % | | | 3.94 | % | | | N/A | | | | 3.63 | % | |
Current performance may be higher or lower than performance quoted above. Any performance data quoted represents past performance, and the investment return and principal value of an investment in the Fund will fluctuate so that an investor's shares, when redeemed, may be worth more or less than their original cost. Past performance is no guarantee of future results. Returns shown above include the reinvestment of all dividends and capital gains. Performance results do not include adjustments made for financial reporting purposes in accordance with U.S. generally accepted accounting principles and may differ from the amount reported in the Financial Highlights. Contractual fee waivers are currently in effect. Without such fee waivers, performance numbers would be reduced. You can obtain performance data current to the most recent month end by calling 1-800-295-4485 or going to www.arbitragefunds.com.
* Class R and Class I inception: 10/1/10; Class C inception: 6/1/12; Class A inception: 6/1/13. The "Since Inception" returns for securities indices are for the inception date of Class R and Class I shares.
** Class C shares are subject to a 1.00% contingent deferred sales charge on all purchases redeemed within 12 months of purchase.
*** Class A shares are subject to a maximum front-end sales load of 3.25% of the offering price and are also subject to a 1.00% contingent deferred sales load on purchases at or above $250,000 purchased without a front-end sales charge and redeemed within 18 months of purchase.
**** Merger arbitrage and event-driven investing are market neutral investment strategies, which typically exhibit low betas and low correlations to broad equity and credit market indices. As such, the adviser has determined that a more appropriate benchmark for Water Island Diversified Event-Driven Fund is a measure of the risk-free rate, in this case the ICE Bank of America (BofA) Merrill Lynch U.S. 3-Month Treasury Bill Index.
The Total Annual Fund Operating Expenses for Class R, Class I, Class C and Class A are 2.62%, 2.37%, 3.37% and 2.62%, respectively. The Adviser has agreed to waive fees (not including the effects of interest, dividends on short positions, brokerage commissions, acquired fund fees and expenses, taxes, or other extraordinary expenses) in excess of 1.69%, 1.44%, 2.44% and 1.69% for Class R, Class I, Class C and Class A, respectively, until at least September 30, 2021. These expense ratios are as stated in the current prospectus and may differ from the expense ratios disclosed in the financial highlights in this report.
The ICE BofA Merrill Lynch U.S. 3-Month Treasury Bill Index tracks the performance of the U.S. dollar denominated U.S. Treasury Bills publicly issued in the U.S. domestic market with a remaining term to final maturity of less than 3 months.
The Bloomberg Barclays U.S. Aggregate Bond Index is a market value-weighted index of investment-grade fixed-rated debt issues, including government, corporate, asset-backed and mortgage-backed securities with a maturity of one year or more.
An investor may not invest directly in an index.
www.arbitragefunds.com | 1-800-295-4485
18
Water Island Diversified Event-Driven Fund Portfolio Information (continued)
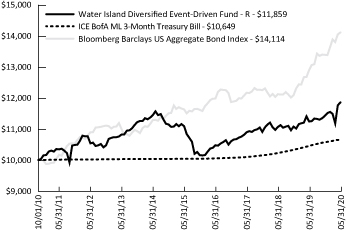
Growth of $10,000 Investment
The chart represents historical performance of a hypothetical investment of $10,000 in the Class R shares of the Fund since inception. Past performance does not guarantee future results. This chart does not reflect the deduction of taxes that a shareholder would pay on Fund distributions or the redemption of Fund shares.
Sector Weighting
The following chart shows the sector weightings of the Water Island Diversified Event-Driven Fund's investments (including short sales and excluding derivatives) as of the report date.

* Concentration Risk: The Fund may invest a large proportion of the Fund's assets in securities of issuers in a single sector over a given time. During such a period of concentration, the Fund may be subject to greater volatility with respect to its portfolio securities than a fund that is more broadly diversified.
Annual Report | May 31, 2020
19
Water Island Diversified Event-Driven Fund Portfolio of Investments
| | | Shares | | Value | |
COMMON STOCKS - 69.08% | |
Auto Parts & Equipment - 2.27% | |
Delphi Technologies Plc(a) | | | 189,750 | | | $ | 2,443,980 | | |
Biotechnology - 3.01% | |
Pacific Biosciences of California, Inc.(a)(b) | | | 460,403 | | | | 1,620,618 | | |
Stemline Therapeutics, Inc.(a) | | | 135,912 | | | | 1,614,635 | | |
| | | | 3,235,253 | | |
Computers & Computer Services - 0.45% | |
HP, Inc. | | | 27,416 | | | | 415,078 | | |
Perspecta, Inc.(b) | | | 3,259 | | | | 72,252 | | |
| | | | 487,330 | | |
Diversified Financial Services - 9.37% | |
Bolsas y Mercados Espanoles SHMSF SA | | | 20,528 | | | | 750,152 | | |
E*TRADE Financial Corp. | | | 42,077 | | | | 1,916,187 | | |
Legg Mason, Inc. | | | 42,939 | | | | 2,139,650 | | |
TD Ameritrade Holding Corp.(b) | | | 141,195 | | | | 5,262,338 | | |
| | | | 10,068,327 | | |
Electronics - 1.16% | |
Tech Data Corp.(a) | | | 9,189 | | | | 1,251,909 | | |
Energy - Alternate Sources - 0.28% | |
Championx Corp.(a) | | | 33,175 | | | | 300,897 | | |
Engineering & Construction - 0.14% | |
AECOM(a)(b) | | | 3,912 | | | | 151,668 | | |
Entertainment - 1.48% | |
Flutter Entertainment Plc(a) | | | 12,548 | | | | 1,593,122 | | |
Healthcare - Products - 6.57% | |
Wright Medical Group N.V.(a) | | | 238,862 | | | | 7,058,372 | | |
Healthcare - Services - 0.16% | |
Metlifecare Ltd. | | | 64,168 | | | | 166,897 | | |
Holding Companies-Diversified - 3.14% | |
CC Neuberger Principal Holdings(a) | | | 46,018 | | | | 468,923 | | |
Collier Creek Holdings, Class A(a) | | | 43,259 | | | | 463,737 | | |
Foley Trasimene Acquisition Corp.(a) | | | 27,234 | | | | 279,149 | | |
Fortress Value Acquisition Corp.(a) | | | 35,134 | | | | 351,691 | | |
GigCapital3, Inc.(a) | | | 54,696 | | | | 543,678 | | |
Graf Industrial Corp.(a) | | | 32,802 | | | | 340,813 | | |
Live Oak Acquisition Corp.(a) | | | 53,988 | | | | 531,242 | | |
Sustainable Opportunities Acquisition Corp.(a) | | | 40,491 | | | | 400,861 | | |
| | | | 3,380,094 | | |
See Notes to Financial Statements.
www.arbitragefunds.com | 1-800-295-4485
20
Water Island Diversified Event-Driven Fund Portfolio of Investments (continued)
| | | Shares | | Value | |
COMMON STOCKS - 69.08% (Continued) | |
Insurance - 2.55% | |
Willis Towers Watson Plc | | | 13,529 | | | $ | 2,745,034 | | |
Internet - 1.91% | |
Grubhub, Inc.(a) | | | 5,689 | | | | 322,794 | | |
IAC/interactivecorp(a) | | | 4,086 | | | | 1,104,732 | | |
Meet Group, Inc.(a) | | | 101,981 | | | | 630,242 | | |
| | | | 2,057,768 | | |
Lodging - 8.93% | |
Caesars Entertainment Corp.(a)(b) | | | 842,715 | | | | 9,598,524 | | |
Media - 0.41% | |
Madison Square Garden Entertainment Corp.(a)(b) | | | 5,515 | | | | 436,954 | | |
Pharmaceuticals - 2.15% | |
Paratek Pharmaceuticals, Inc.(a)(b) | | | 52,781 | | | | 234,348 | | |
Portola Pharmaceuticals, Inc.(a)(b) | | | 115,593 | | | | 2,074,894 | | |
| | | | 2,309,242 | | |
Real Estate Investment Trusts - 4.11% | |
Front Yard Residential Corp. | | | 28,550 | | | | 214,125 | | |
Taubman Centers, Inc.(b) | | | 101,628 | | | | 4,201,302 | | |
| | | | 4,415,427 | | |
Retail - 6.30% | |
Tiffany & Co.(b) | | | 52,854 | | | | 6,772,183 | | |
Software - 4.12% | |
Instructure, Inc.(a)(c) | | | 19,650 | | | | 962,850 | | |
MINDBODY, Inc., Class A(a)(c) | | | 48,463 | | | | 1,768,899 | | |
RIB Software SE(a) | | | 52,532 | | | | 1,691,082 | | |
| | | | 4,422,831 | | |
Telecommunications - 10.57% | |
Cincinnati Bell, Inc.(a)(d) | | | 109,283 | | | | 1,609,739 | | |
Gilat Satellite Networks Ltd.(a) | | | 140,004 | | | | 1,170,433 | | |
LogMeIn, Inc. | | | 101,029 | | | | 8,577,362 | | |
| | | | 11,357,534 | | |
TOTAL COMMON STOCKS
(Cost $73,892,218) | | | 74,253,346 | | |
See Notes to Financial Statements.
Annual Report | May 31, 2020
21
Water Island Diversified Event-Driven Fund Portfolio of Investments (continued)
| | | Maturity
Date | | Rate | | Principal
Amount | | Value | |
CORPORATE BONDS - 6.97% | |
Commercial Services - 2.10% | |
Nielsen Co. Luxembourg SARL
(The)(b)(e) | | 10/01/2021 | | | 5.500 | % | | $ | 1,611,000 | | | $ | 1,613,014 | | |
Refinitiv US Holdings, Inc.(e) | | 05/15/2026 | | | 6.250 | % | | | 608,000 | | | | 649,040 | | |
| | | | | | | | | | 2,262,054 | | |
Entertainment - 1.56% | |
Stars Group Holdings B.V. /
Stars Group US
Co-Borrower LLC(e) | | 07/15/2026 | | | 7.000 | % | | | 1,585,000 | | | | 1,680,100 | | |
Household Products - 0.83% | |
Avon International Operations,
Inc.(b)(e) | | 08/15/2022 | | | 7.875 | % | | | 892,000 | | | | 888,673 | | |
Oil & Gas - 0.29% | |
Northern Oil and Gas, Inc.,
(8.50% Cash + 1.00% PIK) | | 05/15/2023 | | | 8.500 | % | | | 366,000 | | | | 307,440 | | |
Storage/Warehousing - 0.94% | |
Mobile Mini, Inc.(b) | | 07/01/2024 | | | 5.875 | % | | | 986,000 | | | | 1,010,650 | | |
Telecommunications - 1.25% | |
Cincinnati Bell, Inc.(e) | | 07/15/2024 | | | 7.000 | % | | | 1,305,000 | | | | 1,344,150 | | |
TOTAL CORPORATE BONDS
(Cost $7,617,322) | | | 7,493,067 | | |
CONVERTIBLE CORPORATE BONDS - 2.08% | |
Pharmaceuticals - 1.34% | |
Dermira, Inc.(b) | | 05/15/2022 | | | 3.000 | % | | | 1,430,000 | | | | 1,444,300 | | |
Semiconductors - 0.74% | |
Adesto Technologies Corp.(b)(e) | | 09/15/2024 | | | 4.250 | % | | | 674,000 | | | | 790,559 | | |
TOTAL CONVERTIBLE CORPORATE BONDS
(Cost $2,249,469) | | | 2,234,859 | | |
See Notes to Financial Statements.
www.arbitragefunds.com | 1-800-295-4485
22
Water Island Diversified Event-Driven Fund Portfolio of Investments (continued)
| | | Shares | | Value | |
WARRANTS - 0.02% | |
Investment Company Security - 0.02% | |
Graf Industrial Corp., Exercise
Price $11.50, Expires 12/31/2025(a) | | | 42,707 | | | $ | 21,353 | | |
Telecommunications - 0.00%(f) | |
Avaya Holdings Corp., Exercise
Price $25.55, Expires 12/15/2022(a) | | | 5,548 | | | | 2,164 | | |
TOTAL WARRANTS
(Cost $19,482) | | | | | 23,517 | | |
| | | Expiration
Date | | Exercise
Price | | Notional
Amount | | Contracts | | Value | |
PURCHASED OPTIONS(a) - 0.01% | |
Call Option Purchased - 0.01% | |
Cincinnati Bell, Inc. | | 08/2020 | | $ | 12.50 | | | $ | 82,488 | | | | 56 | | | $ | 7,840 | | |
TOTAL CALL OPTIONS PURCHASED
(Cost $1,104) | | | 7,840 | | |
TOTAL PURCHASED OPTIONS
(Cost $1,104) | | | 7,840 | | |
| | | Yield | | Shares | | Value | |
SHORT-TERM INVESTMENTS - 16.91% | |
Money Market Funds | |
Morgan Stanley Institutional Liquidity Fund
Government Portfolio, Institutional Class | | | 0.094 | %(g) | | | 9,085,428 | | | $ | 9,085,428 | | |
State Street Institutional U.S. Government
Money Market Fund, Premier Class | | | 0.249 | %(g) | | | 9,085,428 | | | | 9,085,428 | | |
| | | | | | | | | | | | 18,170,856 | | |
TOTAL SHORT-TERM INVESTMENTS
(Cost $18,170,856) | | | 18,170,856 | | |
Total Investments - 95.07%
(Cost $101,950,451) | | | | | | | 102,183,485 | | |
Other Assets in Excess of Liabilities - 4.93%(h) | | | | | | | 5,295,924 | | |
NET ASSETS - 100.00% | | $ | 107,479,409 | | |
Portfolio Footnotes
(a) Non-income-producing security.
(b) Security, or a portion of security, is being held as collateral for short sales or forward foreign currency exchange contracts. At May 31, 2020, the aggregate fair market value of those securities was $29,539,966, representing 27.48% of net assets.
See Notes to Financial Statements.
Annual Report | May 31, 2020
23
Water Island Diversified Event-Driven Fund Portfolio of Investments (continued)
(c) Security fair valued using significant unobservable inputs and classified as a Level 3 security. As of May 31, 2020, the total fair market value of these securities was $2,731,749, representing 2.54% of net assets.
(d) Underlying security for a written/purchased call/put option.
(e) Security exempt from registration under Rule 144A of the Securities Act of 1933. These securities may be resold in transactions exempt from registration, normally to qualified institutional buyers. As of May 31, 2020, these securities had a total value of $6,965,536 or 6.48% of net assets.
(f) Less than 0.005% of net assets.
(g) Rate shown is the 7-day effective yield as of May 31, 2020.
(h) Includes cash held as collateral for short sales and written option contracts.
SCHEDULE OF SECURITIES SOLD SHORT | | Shares | | Value | |
COMMON STOCKS - (11.19%) | |
Banks - (1.81%) | |
Morgan Stanley | | | (43,901 | ) | | $ | (1,940,424 | ) | |
Commercial Services - (0.01%) | |
Booz Allen Hamilton Holding Corp., Class A | | | (170 | ) | | | (13,559 | ) | |
Computers & Computer Services - (0.20%) | |
CACI International, Inc., Class A | | | (48 | ) | | | (12,037 | ) | |
Hewlett Packard Enterprise Co. | | | (4,814 | ) | | | (46,744 | ) | |
International Business Machines Corp. | | | (518 | ) | | | (64,698 | ) | |
Science Applications International Corp. | | | (141 | ) | | | (12,414 | ) | |
Seagate Technology Plc | | | (1,565 | ) | | | (83,008 | ) | |
| | | | (218,901 | ) | |
Electronics - (0.19%) | |
Comtech Telecommunications Corp. | | | (11,737 | ) | | | (209,036 | ) | |
Engineering & Construction - (0.11%) | |
Jacobs Engineering Group, Inc. | | | (464 | ) | | | (38,986 | ) | |
Stantec, Inc. | | | (1,472 | ) | | | (44,263 | ) | |
WSP Global, Inc. | | | (611 | ) | | | (39,433 | ) | |
| | | | (122,682 | ) | |
Entertainment - (3.36%) | |
Eldorado Resorts, Inc. | | | (56,802 | ) | | | (2,014,199 | ) | |
Flutter Entertainment Plc | | | (12,549 | ) | | | (1,593,238 | ) | |
| | | | (3,607,437 | ) | |
Environmental Control - (0.75%) | |
Advanced Disposal Services, Inc. | | | (24,685 | ) | | | (769,678 | ) | |
Tetra Tech, Inc. | | | (492 | ) | | | (38,819 | ) | |
| | | | (808,497 | ) | |
Insurance - (2.68%) | |
Aon Plc, Class A | | | (14,611 | ) | | | (2,877,637 | ) | |
See Notes to Financial Statements.
www.arbitragefunds.com | 1-800-295-4485
24
Water Island Diversified Event-Driven Fund Portfolio of Investments (continued)
SCHEDULE OF SECURITIES SOLD SHORT | | Shares | | Value | |
COMMON STOCKS - (11.19%) (Continued) | |
Internet - (1.33%) | |
ANGI Homeservices, Inc., Class A | | | (15,200 | ) | | $ | (164,920 | ) | |
Match Group, Inc. | | | (9,729 | ) | | | (866,270 | ) | |
Uber Technologies, Inc. | | | (10,951 | ) | | | (397,741 | ) | |
| | | | (1,428,931 | ) | |
Real Estate Investment Trusts - (0.07%) | |
American Homes 4 Rent, Class A | | | (1,400 | ) | | | (35,336 | ) | |
Invitation Homes, Inc. | | | (1,467 | ) | | | (38,582 | ) | |
| | | | (73,918 | ) | |
Semiconductors - (0.44%) | |
Adesto Technologies Corp. | | | (38,931 | ) | | | (469,897 | ) | |
Telecommunications - (0.24%) | |
Cincinnati Bell, Inc. | | | (17,617 | ) | | | (259,498 | ) | |
TOTAL COMMON STOCKS
(Proceeds $10,710,822) | | | (12,030,417 | ) | |
EXCHANGE-TRADED FUNDS - (0.42%) | |
Equity Funds - (0.42%) | |
Consumer Discretionary Select Sector SPDR® Fund | | | (404 | ) | | | (50,173 | ) | |
iShares Russell Mid-Cap Growth ETF | | | (175 | ) | | | (27,058 | ) | |
iShares U.S. Real Estate ETF | | | (754 | ) | | | (58,375 | ) | |
VanEck Vectors Oil Services ETF | | | (2,422 | ) | | | (287,637 | ) | |
VanEck Vectors Semiconductor ETF | | | (213 | ) | | | (30,039 | ) | |
| | | | (453,282 | ) | |
TOTAL EXCHANGE-TRADED FUNDS
(Proceeds $436,601) | | | (453,282 | ) | |
TOTAL SECURITIES SOLD SHORT
(Proceeds $11,147,423) | | $ | (12,483,699 | ) | |
See Notes to Financial Statements.
Annual Report | May 31, 2020
25
Water Island Diversified Event-Driven Fund Portfolio of Investments (continued)
EQUITY SWAP CONTRACTS
Swap
Counterparty/
Payment
Frequency | | Reference
Obligation | | Rate
Paid/
Received
by the
Fund | | Termination
Date | | Upfront
Payments
Paid | | Upfront
Payments
Received | | Market
Value | | Notional
Amount | | Unrealized
Appreciation | |
Morgan
Stanley &
Co./
Monthly
| | Borgwarner,
Inc.
| | Received
1 Month-
Federal
Rate
Minus
40 bps
(-0.350%) | |
08/19/2021 | | $ | — | | | $ | — | | | $ | — | | | $ | 2,630,674 | | | $ | — | | |
Morgan
Stanley &
Co./
Monthly
| | Charles
Schwab
Corp.
| | Received
1 Month-
Federal
Rate
Minus
40 bps
(-0.350%) | |
08/19/2021 | | | — | | | | — | | | | — | | | | 5,494,697 | | | | — | | |
| | | | | | | | | | | | | $ | — | | | $ | 8,125,371 | | | $ | — | | |
OUTSTANDING FORWARD FOREIGN CURRENCY EXCHANGE CONTRACTS
Currency
Purchased | | Currency Sold | | Counterparty | | Settlement
Date | | Unrealized
Appreciation | |
CAD | 5,965,300 | | | USD | 4,255,168 | | | Goldman Sachs & Co. | | 06/15/2020 | | $ | 77,432 | | |
EUR | 1,529,300 | | | USD | 1,667,668 | | | Goldman Sachs & Co. | | 06/15/2020 | | | 30,373 | | |
USD | 3,552,692 | | | EUR | 3,156,800 | | | Goldman Sachs & Co. | | 06/15/2020 | | | 47,575 | | |
GBP | 927,500 | | | USD | 1,099,208 | | | Goldman Sachs & Co. | | 06/15/2020 | | | 46,308 | | |
USD | 1,170,339 | | | GBP | 927,500 | | | Goldman Sachs & Co. | | 06/15/2020 | | | 24,822 | | |
NZD | 44,300 | | | USD | 26,848 | | | Goldman Sachs & Co. | | 06/15/2020 | | | 650 | | |
| | | $ | 227,160 | | |
Currency
Purchased | | Currency Sold | | Counterparty | | Settlement
Date | | Unrealized
Depreciation | |
USD | 4,219,365 | | | CAD | 5,910,800 | | | Goldman Sachs & Co. | | 06/15/2020 | | $ | (73,652 | ) | |
USD | 628,270 | | | EUR | 572,900 | | | Goldman Sachs & Co. | | 06/15/2020 | | | (7,843 | ) | |
USD | 190,290 | | | NZD | 313,200 | | | Goldman Sachs & Co. | | 06/15/2020 | | | (4,119 | ) | |
| | | $ | (85,614 | ) | |
See Notes to Financial Statements.
www.arbitragefunds.com | 1-800-295-4485
26
Water Island Diversified Event-Driven Fund Portfolio of Investments (continued)
The following is a summary of investments classified by country exposure:
Country | | % of Net Assets(a) | |
Netherlands | | | 8.13 | % | |
United Kingdom | | | 4.82 | % | |
Germany | | | 1.57 | % | |
Luxembourg | | | 1.50 | % | |
Ireland | | | 1.48 | % | |
Israel | | | 1.09 | % | |
Spain | | | 0.70 | % | |
United States Virgin Islands | | | 0.20 | % | |
New Zealand | | | 0.16 | % | |
United States | | | 75.42 | % | |
Other Assets in Excess of Liabilities | | | 4.93 | % | |
| | | | 100.00 | % | |
(a) These percentages represent long positions only and are not net of short positions.
Abbreviations:
bps - Basis Points. 100 Basis Points is equal to 1 percentage point.
CAD - Canadian dollar
ETF - Exchange-Traded Fund
EUR - Euro
GBP - British pound
LLC - Limited Liability Company
Ltd. - Limited
N.V. - Naamloze Vennootschap is the Dutch term for a public limited liability corporation.
NZD - New Zealand dollar
PIK - Payment-in-kind
Plc - Public Limited Company
SA - Generally designates corporations in various countries, mostly those employing civil law. This translates literally in all languages mentioned as anonymous company.
SARL - Société Anonyme à Responsabilité Limitée is the French term for limited liability company.
SE - SE Regulation. A European Company which can operate on a Europe-wide basis and be governed by Community law directly applicable in all Member States
SPDR - Standard & Poor's Depositary Receipt
USD - United States Dollar
See Notes to Financial Statements.
Annual Report | May 31, 2020
27
Water Island Diversified Event-Driven Fund Portfolio of Investments (continued)
The following table summarizes the Water Island Diversified Event-Driven Fund's investments and derivative financial instruments categorized in the fair value hierarchy as of May 31, 2020:
Investments in Securities at Value* | | Level 1 | | Level 2 | | Level 3 | | Total | |
Assets | |
Common Stocks | |
Auto Parts & Equipment | | $ | 2,443,980 | | | $ | — | | | $ | — | | | $ | 2,443,980 | | |
Biotechnology | | | 3,235,253 | | | | — | | | | — | | | | 3,235,253 | | |
Computers & Computer Services | | | 487,330 | | | | — | | | | — | | | | 487,330 | | |
Diversified Financial Services | | | 10,068,327 | | | | — | | | | — | | | | 10,068,327 | | |
Electronics | | | 1,251,909 | | | | — | | | | — | | | | 1,251,909 | | |
Energy - Alternate Sources | | | 300,897 | | | | — | | | | — | | | | 300,897 | | |
Engineering & Construction | | | 151,668 | | | | — | | | | — | | | | 151,668 | | |
Entertainment | | | 1,593,122 | | | | — | | | | — | | | | 1,593,122 | | |
Healthcare - Products | | | 7,058,372 | | | | — | | | | — | | | | 7,058,372 | | |
Healthcare - Services | | | 166,897 | | | | — | | | | — | | | | 166,897 | | |
Holding Companies-Diversified | | | 3,380,094 | | | | — | | | | — | | | | 3,380,094 | | |
Insurance | | | 2,745,034 | | | | — | | | | — | | | | 2,745,034 | | |
Internet | | | 2,057,768 | | | | — | | | | — | | | | 2,057,768 | | |
Lodging | | | 9,598,524 | | | | — | | | | — | | | | 9,598,524 | | |
Media | | | 436,954 | | | | — | | | | — | | | | 436,954 | | |
Pharmaceuticals | | | 2,309,242 | | | | — | | | | — | | | | 2,309,242 | | |
Real Estate Investment Trusts | | | 4,415,427 | | | | — | | | | — | | | | 4,415,427 | | |
Retail | | | 6,772,183 | | | | — | | | | — | | | | 6,772,183 | | |
Software | | | 1,691,082 | | | | — | | | | 2,731,749 | | | | 4,422,831 | | |
Telecommunications | | | 11,357,534 | | | | — | | | | — | | | | 11,357,534 | | |
Corporate Bonds** | | | — | | | | 7,493,067 | | | | — | | | | 7,493,067 | | |
Convertible Corporate Bonds** | | | — | | | | 2,234,859 | | | | — | | | | 2,234,859 | | |
Warrants | | | 21,353 | | | | 2,164 | | | | — | | | | 23,517 | | |
Purchased Options | | | 7,840 | | | | — | | | | — | | | | 7,840 | | |
Short-Term Investments | | | 18,170,856 | | | | — | | | | — | | | | 18,170,856 | | |
TOTAL | | $ | 89,721,646 | | | $ | 9,730,090 | | | $ | 2,731,749 | | | $ | 102,183,485 | | |
Other Financial Instruments*** | |
Assets | |
Forward Foreign Currency
Exchange Contracts | | $ | — | | | $ | 227,160 | | | $ | — | | | $ | 227,160 | | |
Equity Swaps | | | 0 | | | | — | | | | — | | | | 0 | | |
Liabilities | |
Common Stocks** | | | (12,030,417 | ) | | | — | | | | — | | | | (12,030,417 | ) | |
Exchange-Traded Funds | | | (453,282 | ) | | | — | | | | — | | | | (453,282 | ) | |
Forward Foreign Currency
Exchange Contracts | | | — | | | | (85,614 | ) | | | — | | | | (85,614 | ) | |
TOTAL | | $ | (12,483,699 | ) | | $ | 141,546 | | | $ | — | | | $ | (12,342,153 | ) | |
* Refer to footnote 2 where leveling hierarchy is defined.
See Notes to Financial Statements.
www.arbitragefunds.com | 1-800-295-4485
28
Water Island Diversified Event-Driven Fund Portfolio of Investments (continued)
** Refer to Portfolio of Investments for sector information.
*** Other financial instruments are instruments such as securities sold short, equity swaps and forward foreign currency exchange contracts.
The following is a reconciliation of the fair valuations using significant unobservable inputs (Level 3) for the Fund's assets and liabilities during the period ended May 31, 2020:
Investments
in Securities | | Balance as of
May 31, 2019 | | Realized
Gain
(Loss) | | Change in
Unrealized
Appreciation
(Depreciation) | | Purchases | | Sales
Proceeds | | Transfers
into
Level 3 | | Transfers
out of
Level 3 | | Balance as of
May 31, 2020 | | Net change in
Unrealized
(Depreciation)
included in the
Statement of
Operations
attributable to
Level 3
investments
held at
May 31, 2020 | |
Corporate
Bonds | | $ | 0 | | | $ | 7 | | | $ | — | | | $ | — | | | $ | (7 | ) | | $ | — | | | $ | — | | | $ | 0 | | | $ | — | | |
Common
Stock | | | 1,768,900 | | | | 30,085 | | | | 17,532 | | | | 6,300,528 | | | | (5,385,296 | ) | | | — | | | | — | | | | 2,731,749 | | | | 17,532 | | |
Total | | $ | 1,768,900 | | | $ | 30,092 | | | $ | 17,532 | | | $ | 6,300,528 | | | $ | (5,385,303 | ) | | $ | — | | | $ | — | | | $ | 2,731,749 | | | $ | 17,532 | | |
The following table summarizes the quantitative inputs used for investments categorized as Level 3 of the fair value hierarchy as of May 31, 2020:
Investments in
Securities | | Fair Value at
May 31, 2020 | | Valuation
Technique | | Unobservable
Input | | Range of
Values | | Weighted
Average | |
Common Stocks
| | $ | 2,731,749
| | | Deal Value
| | Final
determination
on Dissent | | | $36.50-$49
| | | | $40.91
| | |
See Notes to Financial Statements.
Annual Report | May 31, 2020
29
Water Island Credit Opportunities Fund Manager Commentary
Water Island Credit Opportunities Fund | Tickers: ACFIX, ARCFX, ARCCX, AGCAX
The Fund's Goal and Main Investments
The Fund seeks to provide current income and capital growth by focusing on company-specific catalysts and events in order to generate returns that are more correlated to the outcomes and timelines of those events, rather than on overall market direction or changes in interest rates.
Investment Strategy
The Fund employs a fundamentally driven investment approach. The investment team screens catalyst-driven investments such as mergers, acquisitions, asset sales, spin-offs, refinancings, recapitalizations, corporate reorganizations, litigation, and regulatory changes. From this universe the team selects investments based on factors such as risk/reward profile, potential downside, and security liquidity. The team generates returns by holding outright long and short positions and by utilizing capital structure arbitrage, merger arbitrage, and convertible arbitrage techniques to exploit security mispricing or inefficiencies. This portfolio offers a pure-play credit implementation of Water Island Capital's broader event-driven style.
Fiscal Year Highlights
Water Island Credit Opportunities (ACFIX) returned 2.82% for the fiscal year ending May 31, 2020. The portfolio's returns were driven predominantly from the Americas, though the European region also contributed positively to performance. The Fund's top-performing sectors were information technology and communication services. The only sector that detracted from returns over the period was energy.
The Fund's top contributor for the period was our position in broad credit market hedges. From time to time, in addition to various issuer-specific hedges, we may choose to implement broader market hedges in the portfolio. The intent of these hedges is to reduce directional exposure and market risk while providing the portfolio with lower volatility and smaller drawdowns. Amidst the extreme volatility during Q1 2020, these hedges served their intended purpose and generated gains for the Fund. The top event contributor was our position in Boeing bonds. Boeing is one of the world's most powerful aerospace and defense companies. Over the past year, the company has faced some of the most serious challenges in its history. Following the grounding of the 737 Max due to software and avionics issues, combined with the significant impact of the COVID-19 pandemic on the company's airline customers, Boeing needed to raise short-term liquidity to cover its global obligations and manufacturing infrastructure. In April 2020, the company raised $25 billion through various debt tranches which were brought to market at historically wide spreads. We purchased some of this debt as a medium-term investment which is predicated on Boeing eventually re-capturing a temporary loss of business as well as the re-launch of its 737 Max project following adequate testing.
The second-best performing event contributor was our position in Synaptics convertible bonds. Synaptics is a US-based developer of human user interface hardware and software such as trackpads and biometrics. We initiated a long/short position with a long convertible bond hedged with a short equity position which reflected our expectation of higher volatility with the company having refocused its operations and strategy following a spurned takeover offer in 2018. During April and May of 2020, the bonds increased in value after the market's March sell-off, and as convertible investors began to appreciate the positive risk/reward in these bonds.
Conversely, the Fund's top detractor for the fiscal year was our position in QEP Resources bonds. QEP Resources is a natural gas and oil exploration company located in the Permian and Williston Basins. Since the inception of this position, our focus has been on the front-end of QEP's maturity
www.arbitragefunds.com | 1-800-295-4485
30
Water Island Credit Opportunities Fund Manager Commentary (continued)
curve and the company's efforts to de-lever its balance sheet through asset sales and operational changes. During Q1 2020, QEP bonds sold off with nearly the entire energy sector due to dramatic supply and demand imbalances which were brought about by global production issues and the COVID-19 pandemic. While the position was the fund's largest detractor for the fiscal year, we added to our position during April and May as we continued to believe that QEP had multiple ways to redeem its 2021 bonds. In short course, we were rewarded for our conviction. On QEP's most recent earnings call, management confirmed the company indeed intended to use all its resources to address its upcoming maturities. Bond prices moved significantly higher on the news and as of this writing the position is now a positive contributor to returns.
The Fund's second-largest detractor was our position in Triumph Group bonds. Triumph Group designs, manufactures, distributes, and repairs both commercial and military aircraft systems. Our investment focused on Triumph's 2022 notes as the company's new management restructures its businesses and leads de-levering efforts with the sale of its aero-structures division. During Q4 2019 and Q1 2020, Triumph's bond and stock prices dropped significantly due to Boeing's 737 MAX issues (for which Triumph serves as a supplier) and as the COVID-19 pandemic forced a temporary shut-down of the aero and aviation industry. Although our hedges offset some mark-to-market losses, the position overall detracted from returns during the period. During this time, management began to take aggressive steps to increase liquidity and to restructure operations to preserve cash and working capital. These actions were announced in late May which did result in a partial recovery in the company's bond prices.
Glossary
Convertible Bond: A type of bond that the holder can convert into a specified number of shares of common stock in the issuing company or cash of equal value.
Debt Tranche: A collection of debt securities that are separated and grouped by risk or other characteristics in order to be marketable to different investors.
Mark-to-Market: A measure of value using the most recently available market price.
Annual Report | May 31, 2020
31
Water Island Credit Opportunities Fund Portfolio Information
Performance (annualized returns as of May 31, 2020)
| | | One
Year | | Five
Year | | Ten
Year | | Since
Inception* | |
Water Island Credit Opportunities Fund, Class R | | | 2.46 | % | | | 2.17 | % | | | N/A | | | | 2.35 | % | |
Water Island Credit Opportunities Fund, Class I | | | 2.82 | % | | | 2.44 | % | | | N/A | | | | 2.59 | % | |
Water Island Credit Opportunities Fund, Class C** | | | 1.70 | % | | | 1.42 | % | | | N/A | | | | 1.62 | % | |
Water Island Credit Opportunities Fund, Class A*** | | | 2.56 | % | | | 2.16 | % | | | N/A | | | | 2.22 | % | |
Bloomberg Barclays Capital U.S. Aggregate Bond Index | | | 9.42 | % | | | 3.94 | % | | | N/A | | | | 3.22 | % | |
ICE BofA Merrill Lynch U.S. 3-Month Treasury Bill Index | | | 1.84 | % | | | 1.19 | % | | | N/A | | | | 0.80 | % | |
Current performance may be higher or lower than performance quoted above. Any performance data quoted represents past performance and the investment return and principal value of an investment in the Fund will fluctuate so that an investor's shares, when redeemed, may be worth more or less than their original cost. Past performance is no guarantee of future results. Returns shown above include the reinvestment of all dividends and capital gains. Performance results do not include adjustments made for financial reporting purposes in accordance with U.S. generally accepted accounting principles and may differ from the amount reported in the Financial Highlights. Contractual fee waivers are currently in effect. Without such fee waivers, performance numbers would be reduced. You can obtain performance data current to the most recent month end by calling 1-800-295-4485 or going to www.arbitragefunds.com.
* Class R, Class I and Class C inception: 10/1/12; Class A inception: 6/1/13. The "Since Inception" returns for securities indices are for the inception date of Class R, Class I and Class C shares.
** Class C shares are subject to a 1.00% contingent deferred sales charge on all purchases redeemed in 12 months of purchase.
*** Class A shares are subject to a maximum front-end sales load of 3.25% of the offering price and are also subject to a 1.00% contingent deferred sales load on purchases at or above $250,000 purchased without a front-end sales charge and redeemed within 18 months of purchase.
The Total Annual Fund Operating Expenses for Class R, Class I, Class C and Class A are 2.11%, 1.86%, 2.86% and 2.11%, respectively. The Adviser has agreed to waive fees (not including the effects of interest, dividends on short positions, brokerage commissions, acquired fund fees and expenses, taxes, or other extraordinary expenses) in excess of 1.23%, 0.98%, 1.98% and 1.23% for Class R, Class I, Class C and Class A, respectively, until at least September 30, 2021. These expense ratios are as stated in the current prospectus and may differ from the expense ratios disclosed in the financial highlights in this report.
The Bloomberg Barclays Capital U.S. Aggregate Bond Index is a market value-weighted index of investment grade fixed-rated debt issues, including government, corporate, asset-backed and mortgage-backed securities with a maturity of one year or more.
The ICE Bank of America (BofA) Merrill Lynch U.S. 3-Month Treasury Bill Index tracks the performance of the U.S. dollar denominated U.S. Treasury Bills publicly issued in the U.S. domestic market with a remaining term to final maturity of less than 3 months.
An investor may not invest directly in an index.
www.arbitragefunds.com | 1-800-295-4485
32
Water Island Credit Opportunities Fund Portfolio Information (continued)
Growth of $10,000 Investment
The chart represents historical performance of a hypothetical investment of $10,000 in the Class R shares of the Fund since inception. Past performance does not guarantee future results. This chart does not reflect the deduction of taxes that a shareholder would pay on Fund distributions or the redemption of Fund shares.

Sector Weighting
The following chart shows the sector weightings of the Water Island Credit Opportunities Fund investments (including short sales and excluding derivatives) as of the report date.
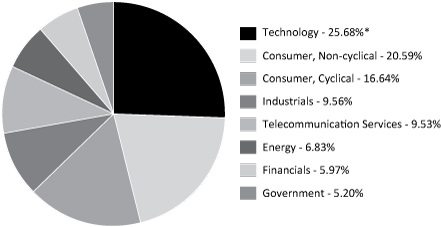
* Concentration Risk: The Fund may invest a large proportion of the Fund's assets in securities of issuers in a single sector over a given time. During such a period of concentration, the Fund may be subject to greater volatility with respect to its portfolio securities than a fund that is more broadly diversified.
Annual Report | May 31, 2020
33
Water Island Credit Opportunities Fund Portfolio of Investments
| | | Shares | | Value | |
COMMON STOCKS - 1.22% | |
Auto Parts & Equipment - 0.71% | |
BorgWarner, Inc. | | | 13,395 | | | $ | 430,649 | | |
Entertainment - 0.51% | |
Eldorado Resorts, Inc.(a) | | | 405 | | | | 14,361 | | |
Flutter Entertainment Plc(a) | | | 2,359 | | | | 299,494 | | |
| | | | 313,855 | | |
TOTAL COMMON STOCKS
(Cost $696,089) | | | 744,504 | | |
| | | Maturity
Date | | Rate | | Principal
Amount | | Value | |
BANK LOAN - 1.60% | |
Commercial Services - 1.60% | |
Refinitiv US Holdings, Inc.,
2018 USD Term Loan B,
Variable Rate, (1 mo. USD
LIBOR plus 3.250%) | | 10/01/2025 | | | 3.424 | % | | $ | 994,962 | | | $ | 981,460 | | |
TOTAL BANK LOANS
(Cost $1,000,640) | | | 981,460 | | |
CORPORATE BONDS - 72.73% | |
Aerospace & Defense - 3.82% | |
Boeing Co. (The) | | 05/01/2050 | | | 5.805 | % | | | 1,250,000 | | | | 1,414,899 | | |
Triumph Group, Inc.(b) | | 06/01/2022 | | | 5.250 | % | | | 1,135,000 | | | | 928,396 | | |
| | | | 2,343,295 | | |
Auto Manufacturers - 4.42% | |
Navistar International Corp.(c) | |
| | | 05/01/2025 | | | 9.500 | % | | | 750,000 | | | | 806,250 | | |
| | | 11/01/2025 | | | 6.625 | % | | | 2,032,000 | | | | 1,899,920 | | |
| | | | 2,706,170 | | |
Auto Parts & Equipment - 2.66% | |
Delphi Technologies Plc(b)(c) | | 10/01/2025 | | | 5.000 | % | | | 1,581,000 | | | | 1,631,987 | | |
Banks - 1.40% | |
Truist Bank, Variable Rate,
(3 mo. USD LIBOR
plus 0.65%) | | 03/15/2028 | | | 1.391 | % | | | 1,000,000 | | | | 856,378 | | |
See Notes to Financial Statements.
www.arbitragefunds.com | 1-800-295-4485
34
Water Island Credit Opportunities Fund Portfolio of Investments (continued)
| | | Maturity
Date | | Rate | | Principal
Amount | | Value | |
CORPORATE BONDS - 72.73% (Continued) | |
Commercial Services - 6.62% | |
Nielsen Co. Luxembourg
SARL (The)(c) | | 10/01/2021 | | | 5.500 | % | | $ | 1,844,000 | | | $ | 1,846,305 | | |
Refinitiv US Holdings, Inc.(b)(c) | | 05/15/2026 | | | 6.250 | % | | | 2,069,000 | | | | 2,208,658 | | |
| | | | 4,054,963 | | |
Computers & Computer Services - 4.45% | |
Dell International LLC /
EMC Corp.(c) | | 06/15/2021 | | | 4.420 | % | | | 750,000 | | | | 764,066 | | |
Dell International LLC /
EMC Corp.(b)(c) | | 10/01/2026 | | | 4.900 | % | | | 1,000,000 | | | | 1,080,594 | | |
NCR Corp. | | 07/15/2022 | | | 5.000 | % | | | 882,000 | | | | 882,847 | | |
| | | | 2,727,507 | | |
Electrical Components & Equipment - 1.35% | |
WESCO Distribution, Inc. | | 12/15/2021 | | | 5.375 | % | | | 833,000 | | | | 828,835 | | |
Electronics - 1.69% | |
Tech Data Corp. | | 02/15/2027 | | | 4.950 | % | | | 1,000,000 | | | | 1,034,008 | | |
Engineering & Construction - 1.53% | |
AECOM Global II LLC /
URS Fox US LP(b) | | 04/01/2022 | | | 5.000 | % | | | 938,000 | | | | 940,345 | | |
Entertainment - 7.36% | |
Eldorado Resorts, Inc. | |
| | | 08/01/2023 | | | 7.000 | % | | | 1,329,000 | | | | 1,339,247 | | |
| | | 04/01/2025 | | | 6.000 | % | | | 180,000 | | | | 183,787 | | |
Stars Group Holdings B.V. /
Stars Group US
Co-Borrower LLC(c) | | 07/15/2026 | | | 7.000 | % | | | 2,820,000 | | | | 2,989,200 | | |
| | | | 4,512,234 | | |
Environmental Control - 1.69% | |
Advanced Disposal
Services, Inc.(c) | | 11/15/2024 | | | 5.625 | % | | | 1,000,000 | | | | 1,033,750 | | |
Food - 2.07% | |
TreeHouse Foods, Inc. | | 03/15/2022 | | | 4.875 | % | | | 1,270,000 | | | | 1,270,787 | | |
Household Products - 5.54% | |
Avon International
Operations, Inc.(b)(c) | | 08/15/2022 | | | 7.875 | % | | | 1,844,000 | | | | 1,837,122 | | |
Edgewell Personal Care Co. | | 05/19/2021 | | | 4.700 | % | | | 1,500,000 | | | | 1,558,350 | | |
| | | | 3,395,472 | | |
See Notes to Financial Statements.
Annual Report | May 31, 2020
35
Water Island Credit Opportunities Fund Portfolio of Investments (continued)
| | | Maturity
Date | | Rate | | Principal
Amount | | Value | |
CORPORATE BONDS - 72.73% (Continued) | |
Insurance - 3.49% | |
Fidelity & Guaranty Life
Holdings, Inc.(c) | | 05/01/2025 | | | 5.500 | % | | $ | 2,000,000 | | | $ | 2,140,000 | | |
Media - 0.79% | |
Walt Disney Co. (The)(b) | | 09/01/2049 | | | 2.750 | % | | | 500,000 | | | | 485,669 | | |
Office/Business Equip - 2.54% | |
Xerox Corp. | | 05/15/2021 | | | 4.500 | % | | | 1,553,000 | | | | 1,557,473 | | |
Oil & Gas - 5.18% | |
Northern Oil and Gas, Inc.,
(8.50% Cash + 1.00% PIK) | | 05/15/2023 | | | 8.500 | % | | | 1,459,238 | | | | 1,225,760 | | |
QEP Resources, Inc. | | 03/01/2021 | | | 6.875 | % | | | 2,780,000 | | | | 1,946,000 | | |
| | | | 3,171,760 | | |
Pharmaceuticals - 1.66% | |
Bausch Health Companies, Inc.(c) | | 03/15/2022 | | | 6.500 | % | | | 1,000,000 | | | | 1,017,300 | | |
Pipelines - 2.78% | |
NuStar Logistics LP | | 09/01/2020 | | | 4.800 | % | | | 1,692,000 | | | | 1,705,748 | | |
Semiconductors - 0.42% | |
Microchip Technology, Inc. | | 06/01/2021 | | | 3.922 | % | | | 250,000 | | | | 254,130 | | |
Storage/Warehousing - 2.33% | |
Mobile Mini, Inc.(b) | | 07/01/2024 | | | 5.875 | % | | | 1,391,000 | | | | 1,425,775 | | |
Telecommunications - 8.94% | |
Cincinnati Bell, Inc.(c) | | 07/15/2024 | | | 7.000 | % | | | 2,300,000 | | | | 2,369,000 | | |
Cincinnati Bell, Inc.(b)(c) | | 10/15/2025 | | | 8.000 | % | | | 2,000,000 | | | | 2,065,000 | | |
Hughes Satellite Systems Corp. | | 06/15/2021 | | | 7.625 | % | | | 1,000,000 | | | | 1,045,200 | | |
| | | | 5,479,200 | | |
TOTAL CORPORATE BONDS
(Cost $45,528,259) | | | 44,572,786 | | |
CONVERTIBLE CORPORATE BONDS - 21.55% | |
Pharmaceuticals - 5.59% | |
Dermira, Inc. | | 05/15/2022 | | | 3.000 | % | | | 1,938,000 | | | | 1,957,380 | | |
Jazz Investments I Ltd. | | 08/15/2021 | | | 1.875 | % | | | 1,500,000 | | | | 1,467,015 | | |
| | | | 3,424,395 | | |
See Notes to Financial Statements.
www.arbitragefunds.com | 1-800-295-4485
36
Water Island Credit Opportunities Fund Portfolio of Investments (continued)
| | | Maturity
Date | | Rate | | Principal
Amount | | Value | |
CONVERTIBLE CORPORATE BONDS - 21.55% (Continued) | |
Semiconductors - 10.92% | |
Adesto Technologies Corp.(b)(c) | | 09/15/2024 | | | 4.250 | % | | $ | 2,500,000 | | | $ | 2,932,341 | | |
ON Semiconductor Corp.(b) | | 12/01/2020 | | | 1.000 | % | | | 2,000,000 | | | | 2,129,788 | | |
Synaptics, Inc. | | 06/15/2022 | | | 0.500 | % | | | 1,500,000 | | | | 1,633,713 | | |
| | | | 6,695,842 | | |
Software - 5.04% | |
Verint Systems, Inc.(b) | | 06/01/2021 | | | 1.500 | % | | | 2,000,000 | | | | 1,991,474 | | |
Nuance Communications, Inc.(b) | | 12/15/2035 | | | 1.000 | % | | | 1,000,000 | | | | 1,095,844 | | |
| | | | 3,087,318 | | |
TOTAL CONVERTIBLE CORPORATE BONDS
(Cost $12,733,324) | | | 13,207,555 | | |
| | | Shares | | Value | |
WARRANTS - 0.00%(d) | |
Telecommunications - 0.00%(d) | |
Avaya Holdings Corp., Exercise
Price $25.55, Expires 12/15/2022(a) | | | 3,017 | | | $ | 1,177 | | |
TOTAL WARRANTS
(Cost $0) | | | | | 1,177 | | |
PREFERRED STOCKS - 2.06% | |
Real Estate Investment Trusts - 2.06% | |
Taubman Centers, Inc., Series J | | | 55,711 | | | | 1,264,640 | | |
TOTAL PREFERRED STOCKS
(Cost $1,260,049) | | | | | 1,264,640 | | |
| | | Expiration
Date | | Exercise
Price | | Notional
Amount | | Contracts | | Value | |
PURCHASED OPTIONS(a) - 1.52% | |
Call Options Purchased - 1.52% | |
AECOM | |
| | | 06/2020 | | $ | 35.00 | | | $ | 290,775 | | | | 75 | | | $ | 31,875 | | |
| | | 06/2020 | | | 50.00 | | | | 89,171 | | | | 23 | | | | 46 | | |
Bausch Health
Companies, Inc. | | 07/2020 | | | 17.00 | | | | 924,000 | | | | 500 | | | | 116,250 | | |
Cincinnati Bell, Inc. | | 08/2020 | | | 12.50 | | | | 60,393 | | | | 41 | | | | 5,740 | | |
EchoStar Corp. | | 07/2020 | | | 35.00 | | | | 311,600 | | | | 100 | | | | 7,750 | | |
Edgewell Personal Care Co. | | 08/2020 | | | 30.00 | | | | 1,186,380 | | | | 390 | | | | 136,500 | | |
NCR Corp. | | 07/2020 | | | 25.00 | | | | 722,000 | | | | 400 | | | | 3,000 | | |
Nielsen Holdings Plc | | 08/2020 | | | 18.00 | | | | 1,041,750 | | | | 750 | | | | 18,750 | | |
See Notes to Financial Statements.
Annual Report | May 31, 2020
37
Water Island Credit Opportunities Fund Portfolio of Investments (continued)
| | | Expiration
Date | | Exercise
Price | | Notional
Amount | | Contracts | | Value | |
PURCHASED OPTIONS(a) - 1.52% (Continued) | |
Call Options Purchased - 1.52% (Continued) | |
NuStar Energy LP | | 09/2020 | | $ | 15.00 | | | $ | 781,650 | | | | 450 | | | $ | 150,750 | | |
QEP Resources, Inc. | | 09/2020 | | | 3.00 | | | | 46,094 | | | | 540 | | | | 5,400 | | |
SPDR S&P 500 ETF Trust | | 07/2020 | | | 260.00 | | | | 1,673,760 | | | | 55 | | | | 258,363 | | |
TreeHouse Foods, Inc. | | 08/2020 | | | 50.00 | | | | 316,260 | | | | 60 | | | | 35,700 | | |
Triumph Group, Inc. | |
| | | 09/2020 | | | 7.50 | | | | 187,250 | | | | 250 | | | | 48,125 | | |
| | | 09/2020 | | | 10.00 | | | | 374,500 | | | | 500 | | | | 57,500 | | |
WESCO International, Inc. | | 09/2020 | | | 30.00 | | | | 233,100 | | | | 70 | | | | 50,400 | | |
Xerox Holdings Corp. | | 10/2020 | | | 25.00 | | | | 555,800 | | | | 350 | | | | 4,725 | | |
TOTAL CALL OPTIONS PURCHASED
(Cost $667,975) | | | | | | | | | | | 930,874 | | |
TOTAL PURCHASED OPTIONS
(Cost $667,975) | | | | | | | | | | | 930,874 | | |
Total Investments - 100.68%
(Cost $61,886,336) | | | 61,702,996 | | |
Liabilities in Excess of Other Assets - (0.68)%(e) | | | (414,720 | ) | |
NET ASSETS - 100.00% | | $ | 61,288,276 | | |
Portfolio Footnotes
(a) Non-income-producing security.
(b) Security, or a portion of security, is being held as collateral for short sales, written option contracts or forward foreign currency exchange contracts. At May 31, 2020, the aggregate fair market value of those securities was $11,899,148, representing 19.42% of net assets.
(c) Security exempt from registration under Rule 144A of the Securities Act of 1933. These securities may be resold in transactions exempt from registration, normally to qualified institutional buyers. As of May 31, 2020, these securities had a total value of $26,621,493 or 43.44% of net assets.
(d) Less than 0.005% of net assets.
(e) Includes cash held as collateral for short sales and written option contracts.
See Notes to Financial Statements.
www.arbitragefunds.com | 1-800-295-4485
38
Water Island Credit Opportunities Fund Portfolio of Investments (continued)
SCHEDULE OF SECURITIES SOLD SHORT | | Shares | | Value | |
COMMON STOCKS - (11.32%) | |
Aerospace & Defense - (0.78%) | |
Triumph Group, Inc. | | | (64,100 | ) | | $ | (480,109 | ) | |
Auto Parts & Equipment - (0.65%) | |
Delphi Technologies Plc | | | (31,100 | ) | | | (400,568 | ) | |
Commercial Services - (0.41%) | |
Nielsen Holdings Plc | | | (18,200 | ) | | | (252,798 | ) | |
Distribution/Wholesale - (0.19%) | |
WESCO International, Inc. | | | (3,400 | ) | | | (113,220 | ) | |
Engineering & Construction - (0.20%) | |
AECOM | | | (3,100 | ) | | | (120,187 | ) | |
Entertainment - (0.49%) | |
Flutter Entertainment Plc | | | (2,360 | ) | | | (299,594 | ) | |
Environmental Control - (0.08%) | |
Advanced Disposal Services, Inc. | | | (1,634 | ) | | | (50,948 | ) | |
Food - (0.37%) | |
TreeHouse Foods, Inc. | | | (4,300 | ) | | | (226,653 | ) | |
Household Products - (0.58%) | |
Edgewell Personal Care Co. | | | (11,700 | ) | | | (355,914 | ) | |
Lodging - (0.08%) | |
Caesars Entertainment Corp. | | | (4,500 | ) | | | (51,255 | ) | |
Office/Business Equip - (0.05%) | |
Xerox Holdings Corp. | | | (1,825 | ) | | | (28,981 | ) | |
Pharmaceuticals - (1.16%) | |
Bausch Health Companies, Inc. | | | (31,900 | ) | | | (589,512 | ) | |
Jazz Pharmaceuticals Plc | | | (1,000 | ) | | | (119,320 | ) | |
| | | | (708,832 | ) | |
Semiconductors - (3.73%) | |
Adesto Technologies Corp. | | | (105,742 | ) | | | (1,276,306 | ) | |
ON Semiconductor Corp. | | | (23,800 | ) | | | (392,462 | ) | |
Synaptics, Inc. | | | (9,700 | ) | | | (618,084 | ) | |
| | | | (2,286,852 | ) | |
Software - (1.18%) | |
Nuance Communications, Inc. | | | (22,300 | ) | | | (510,224 | ) | |
Verint Systems, Inc. | | | (4,600 | ) | | | (213,302 | ) | |
| | | | (723,526 | ) | |
See Notes to Financial Statements.
Annual Report | May 31, 2020
39
Water Island Credit Opportunities Fund Portfolio of Investments (continued)
SCHEDULE OF SECURITIES SOLD SHORT | | Shares | | Value | |
COMMON STOCKS - (11.32%) (Continued) | |
Telecommunications - (1.37%) | |
Cincinnati Bell, Inc. | | | (47,500 | ) | | $ | (699,675 | ) | |
EchoStar Corp., Class A | | | (4,500 | ) | | | (140,220 | ) | |
| | | | (839,895 | ) | |
TOTAL COMMON STOCKS
(Proceeds $6,294,044) | | | (6,939,332 | ) | |
| | | Maturity
Date | | Rate | | Principal
Amount | | Value | |
U.S. TREASURY & GOVERNMENT AGENCIES - (6.06%) | |
Sovereign - (6.06%) | |
U.S. Treasury Bond | | 02/15/2050 | | | 2.000 | % | | $ | (1,850,000 | ) | | $ | (2,114,854 | ) | |
U.S. Treasury Bond | | 11/15/2049 | | | 2.375 | % | | | (268,000 | ) | | | (330,268 | ) | |
U.S. Treasury Note | | 02/28/2022 | | | 1.125 | % | | | (140,000 | ) | | | (142,324 | ) | |
U.S. Treasury Note | | 02/28/2025 | | | 1.125 | % | | | (1,080,000 | ) | | | (1,122,905 | ) | |
| | | | (3,710,351 | ) | |
TOTAL U.S. TREASURY & GOVERNMENT AGENCIES
(Proceeds $3,725,373) | | | (3,710,351 | ) | |
TOTAL SECURITIES SOLD SHORT
(Proceeds $10,019,417) | | $ | (10,649,683 | ) | |
WRITTEN OPTIONS | | Expiration
Date | | Exercise
Price | | Notional
Amount | | Contracts | | Value | |
Written Call Options | |
Jazz Pharmaceuticals
Plc | | 06/2020 | | | 110.00 | | | $ | (178,980 | ) | | | (15 | ) | | $ | (17,100 | ) | |
TOTAL WRITTEN CALL OPTIONS
(Premiums received $9,133) | | | (17,100 | ) | |
TOTAL WRITTEN OPTIONS
(Premiums received $9,133) | | $ | (17,100 | ) | |
See Notes to Financial Statements.
www.arbitragefunds.com | 1-800-295-4485
40
Water Island Credit Opportunities Fund Portfolio of Investments (continued)
EQUITY SWAP CONTRACTS
Swap
Counterparty/
Payment
Frequency | | Reference
Obligation | | Rate
Paid/
Received
by the
Fund | | Termination
Date | | Upfront
Payments
Paid | | Upfront
Payments
Received | | Market
Value | | Notional
Amount | | Unrealized
Appreciation | |
Morgan
Stanley &
Co./
Monthly
| | SPDR
Bloomberg
Barclays
High Yield
Bond ETF
| | Received
1 Month-
Federal
Rate
Minus
40 Bps
(-0.350%) | | 08/19/2021 | | $ | — | | | $ | — | | | $ | — | | | $ | 1,162,686 | | | $ | — | | |
Morgan
Stanley &
Co./
Monthly
| | iShares
iBoxx $
Investment
Grade
Corporate
Bond ETF
| | Received
1 Month-
Federal
Rate
Minus
40 Bps
(-0.350%) | | 08/19/2021 | | | — | | | | — | | | | — | | | | 1,135,372 | | | | — | | |
Morgan
Stanley &
Co./
Monthly
| | NuStar
Energy LP
| | Received
1 Month-
Federal
Rate
Minus
40 Bps
(-0.350%) | | 08/19/2021 | | | — | | | | — | | | | — | | | | 411,669 | | | | — | | |
| | | | | | | | | | | | | $ | — | | | $ | 2,709,727 | | | $ | — | | |
The following is a summary of investments classified by country exposure:
Country | | % of Net Assets(a) | |
Netherlands | | | 4.88 | % | |
Luxembourg | | | 3.01 | % | |
Ireland | | | 2.88 | % | |
United Kingdom | | | 2.66 | % | |
United States | | | 87.25 | % | |
Liabilities in Excess of Other Assets | | | (0.68 | )% | |
| | | | 100.00 | % | |
(a) These percentages represent long positions only and are not net of short positions.
See Notes to Financial Statements.
Annual Report | May 31, 2020
41
Water Island Credit Opportunities Fund Portfolio of Investments (continued)
Abbreviations:
bps - Basis Points. 100 Basis Points is equal to 1 percentage point.
ETF - Exchange-Traded Fund
LIBOR - London Interbank Offered Rate
LLC - Limited Liability Company
LP - Limited Partnership
Ltd. - Limited
PIK - Payment-in-kind
Plc - Public Limited Company
SARL - Société Anonyme à Responsabilité Limitée is the French term for limited liability company.
S&P - Standard & Poor's
SPDR - Standard & Poor's Depositary Receipt
USD - United States Dollar
The following table summarizes the Water Island Credit Opportunities Fund's investments and derivative financial instruments categorized in the fair value hierarchy as of May 31, 2020:
Investments in Securities at Value* | | Level 1 | | Level 2 | | Level 3 | | Total | |
Assets | |
Common Stocks** | | $ | 744,504 | | | $ | — | | | $ | — | | | $ | 744,504 | | |
Bank Loans | | | — | | | | 981,460 | | | | — | | | | 981,460 | | |
Corporate Bonds** | | | — | | | | 44,572,786 | | | | — | | | | 44,572,786 | | |
Convertible Corporate Bonds** | | | — | | | | 13,207,555 | | | | — | | | | 13,207,555 | | |
Warrants | | | — | | | | 1,177 | | | | — | | | | 1,177 | | |
Preferred Stocks** | | | 1,264,640 | | | | — | | | | — | | | | 1,264,640 | | |
Purchased Options | | | 930,874 | | | | — | | | | — | | | | 930,874 | | |
TOTAL | | $ | 2,940,018 | | | $ | 58,762,978 | | | $ | — | | | $ | 61,702,996 | | |
Other Financial Instruments*** | |
Assets | |
Equity Swaps | | $ | 0 | | | $ | — | | | $ | — | | | $ | 0 | | |
Liabilities | |
Common Stocks** | | | (6,939,332 | ) | | | — | | | | — | | | | (6,939,332 | ) | |
U.S. Treasury & Government
Agencies | | | — | | | | (3,710,351 | ) | | | — | | | | (3,710,351 | ) | |
Written Options | | | (17,100 | ) | | | — | | | | — | | | | (17,100 | ) | |
TOTAL | | $ | (6,956,432 | ) | | $ | (3,710,351 | ) | | $ | — | | | $ | (10,666,783 | ) | |
* Refer to footnote 2 where leveling hierarchy is defined.
** Refer to Portfolio of Investments for sector information.
*** Other financial instruments are instruments such as written options, securities sold short and equity swaps.
See Notes to Financial Statements.
www.arbitragefunds.com | 1-800-295-4485
42
Water Island Credit Opportunities Fund Portfolio of Investments (continued)
The following is a reconciliation of the fair valuations using significant unobservable inputs (Level 3) for the Fund's assets and liabilities during the period ended May 31, 2020:
Investments
in Securities | | Balance as of
May 31, 2019 | | Realized
Gain/(Loss) | | Purchases | | Sales
Proceeds | | Amortization
Premium/
Discount | | Transfers
into
Level 3 | | Transfers
out of
Level 3 | | Balance as of
May 31, 2020 | | Net change in
Unrealized
(Depreciation)
included in the
Statement of
Operations
attributable to
Level 3
investments
held at
May 31, 2020 | |
Corporate
Bonds | | $ | 0 | | | $ | 4 | | | $ | — | | | $ | (4 | ) | | $ | — | | | $ | — | | | $ | — | | | $ | — | | | $ | — | | |
Total | | $ | 0 | | | $ | 4 | | | $ | — | | | $ | (4 | ) | | $ | — | | | $ | — | | | $ | — | | | $ | — | | | $ | — | | |
See Notes to Financial Statements.
Annual Report | May 31, 2020
43
Water Island Long/Short Fund Manager Commentary
Water Island Long/Short Fund | Tickers: ATQIX, ATQFX
The Fund's Goal and Main Investments
The Fund seeks to achieve capital appreciation over a full market cycle with lower volatility than the broad equity market.
Investment Strategy
The Fund is a catalyst-driven long-short equity portfolio that seeks to profit from investments in securities of companies where recent events or potential future catalysts may drive the security prices higher or lower. Examples of such events and catalysts, referred to as "event-driven investment opportunities," include, but are not limited to, announcements or potential announcements of restructurings (bankruptcies, spin-offs, and asset sales), mergers and acquisitions, management change, institution of shareholder-friendly practices, regulatory changes, litigation, earnings results and outlook, and changes in industry or sector fundamentals. The investment team seeks to identify these event-driven investment opportunities and purchase or sell short such securities when the team believes the market is under- or over-appreciating the potential value creation opportunity from such event or catalyst.
Fiscal Year Highlights
Water Island Long/Short (ATQIX) returned 7.84% for the fiscal year ending May 31, 2020. The portfolio's returns were driven predominantly from the Americas, though the European region also contributed positively to performance. Industrials and consumer discretionary were the top contributors on a sector basis. Conversely, health care and energy were the worst performing sectors.
The Fund's top performing deal for the period was our merger arbitrage position in the acquisition of Caesars Entertainment by Eldorado Resorts. In June 2019, Eldorado Resorts – a US-based holding company for casino hotels – agreed to acquire Caesars Entertainment – a local peer – for $10.0 billion in cash and stock. During Q1 2020, casinos across the nation were forced to shutter due to the novel coronavirus outbreak, causing the share prices of casino operators to plummet. This led many investors to question the desire of Caesars and Eldorado to consummate their transaction, sending the deal spread wider. In our analysis, the merger agreement and the strategic rationale for the transaction remained strong, and with the financing for the deal already committed, we believed there was still a high likelihood of reaching a successful conclusion. The volatility in the deal spread allowed us to increase our position at favorable rates of return. The portfolio benefited from a tightening in the deal spread as the market rallied in April and May, casino operator share prices began to recover, and the deal progressed through the regulatory approval process – providing confidence to investors that the transaction was increasingly likely to close. We anticipate the deal will close in mid-2020 after the receipt of all required regulatory approvals.
The second highest contributor was our special situations investment in United Technologies. We invested in United Technologies in Q1 2020 as the company approached the final weeks of its merger with Raytheon and subsequent spin-off of both Otis Worldwide and Carrier Global. Based on our fundamental analysis, we saw the pro forma United Technologies/Raytheon merged company, soon to be named Raytheon Technologies, as fairly valued in the market but the combined Otis and Carrier entities as significantly undervalued. By owning United Technologies and selling short Raytheon shares, we were able to isolate the value of the combined Otis and Carrier businesses ahead of the spin-off completion. Both Otis and Carrier significantly re-rated post spin-off, leading to gains in the fund. We subsequently exited each investment.
www.arbitragefunds.com | 1-800-295-4485
44
Water Island Long/Short Fund Manager Commentary (continued)
Conversely, the top detractor in the portfolio for the period was our merger arbitrage position in Illumina's attempted acquisition of Pacific Biosciences. In November 2018, Illumina – a US developer of tools for DNA sequencing and analysis – agreed to acquire Pacific Biosciences – a US DNA sequencing technology firm – for $1.1 billion in cash. The transaction encountered objections from multiple global regulators over the course of a long, fraught antitrust review process, primarily on a novel basis of potential competition – that is, despite limited overlap between the companies' businesses at the current time, it was feared Illumina was trying to take out a nascent competitor before it could grow. Ultimately, the companies decided to terminate the transaction shortly into 2020 rather than fight the regulators in court. We maintained our exposure to Pacific Biosciences as we believed the company remained an attractive takeout candidate – indeed, the UK regulatory authority's investigation revealed Illumina believed no fewer than four of its major competitors were potential suitors of Pacific Biosciences. While this position detracted from returns amidst widespread market volatility in Q1 2020, we continue to believe Pacific Biosciences is likely to be acquired and we are monitoring the situation closely.
The Fund's second-worst performer for the fiscal year was our position in broad equity market hedges. From time to time, in addition to various issuer-specific hedges, we may choose to implement broader market hedges in the portfolio. The intent of these hedges is to reduce directional exposure and market risk while providing the portfolio with lower volatility and drawdowns. Equity markets swiftly recovered late in the fiscal year, and while these hedges behaved as expected, they nonetheless detracted from returns. The second largest event detractor, however, was our special situations investment in Liberty TripAdvisor. Liberty TripAdvisor is a holding company that primarily owns shares in TripAdvisor. We initiated a long position in Liberty TripAdvisor while shorting TripAdvisor shares in September of 2019, in order to invest in the relative discount between the holding company and the underlying asset. As a relative value investment, our expectation was that over time, the discount between owning Liberty TripAdvisor vs. TripAdvisor would revert back to its historical mean. In November 2019, TripAdvisor announced disappointing earnings in light of Google changing its search algorithms, resulting in more traffic being directed to Google-owned properties than to external travel websites such as TripAdvisor, Priceline, and Expedia. The dislocation in TripAdvisor stock resulted in a significant widening of the relative discount. Given the significant devaluation of TripAdvisor, we expect the discount to remain wider than its historical mean for some time, and thus opted to exit our position at the end of 2019.
Glossary
Price-Earnings Ratio: The ratio of a security's price to its earnings.
Re-Rate: A re-rating occurs when the market changes its view of a company sufficiently to make valuation ratios (such as price-earnings ratio) substantially higher or lower.
Short: To sell a borrowed security without owning it, usually with the expectation that the price will decline so it can be bought back later at a profit.
Spin-Off: The creation of an independent company through the sale or distribution of new shares of an existing unit of a parent company.
Annual Report | May 31, 2020
45
Water Island Long/Short Fund Portfolio Information
Performance (annualized returns as of May 31, 2020)
| | | One
Year | | Five
Year | | Ten
Year | | Since
Inception* | |
Water Island Long/Short Fund, Class R | | | 7.58 | % | | | 1.61 | % | | | N/A | | | | 1.71 | % | |
Water Island Long/Short Fund, Class I | | | 7.84 | % | | | 1.66 | % | | | N/A | | | | 1.75 | % | |
S&P 500® Index | | | 12.84 | % | | | 9.86 | % | | | N/A | | | | 9.50 | % | |
ICE BofA Merrill Lynch U.S. 3-Month Treasury Bill Index | | | 1.84 | % | | | 1.19 | % | | | N/A | | | | 1.10 | % | |
Current performance may be higher or lower than performance quoted above. Any performance data quoted represents past performance and the investment return and principal value of an investment in the Fund will fluctuate so that an investor's shares, when redeemed, may be worth more or less than their original cost. Past performance is no guarantee of future results. Returns shown above include the reinvestment of all dividends and capital gains. Performance results do not include adjustments made for financial reporting purposes in accordance with U.S. generally accepted accounting principles and may differ from the amount reported in the Financial Highlights. Contractual fee waivers are currently in effect. Without such fee waivers, performance numbers would be reduced. You can obtain performance data current to the most recent month end by calling 1-800-295-4485 or going to www.arbitragefunds.com.
* Class R and Class I inception: 12/31/14. The "Since Inception" returns for securities indices are for the inception date of Class R and Class I shares.
The Total Annual Fund Operating Expenses for Class R and Class I are 11.80% and 11.55%, respectively. The Adviser has agreed to waive fees (not including the effects of interest, dividends on short positions, brokerage commissions, acquired fund fees and expenses, taxes, or other extraordinary expenses) in excess of 1.69% and 1.44% for Class R and Class I, respectively, until at least September 30, 2021. These expense ratios are as stated in the current prospectus and may differ from the expense ratios disclosed in the financial highlights in this report.
The S&P 500® Index is an unmanaged index consisting of 500 stocks.
The ICE Bank of America (BofA) Merrill Lynch U.S. 3-Month Treasury Bill Index tracks the performance of the U.S. dollar denominated U.S. Treasury Bills publicly issued in the U.S. domestic market with a remaining term to final maturity of less than 3 months.
An investor may not invest directly in an index.
www.arbitragefunds.com | 1-800-295-4485
46
Water Island Long/Short Fund Portfolio Information (continued)
Growth of $10,000 Investment
The chart represents historical performance of a hypothetical investment of $10,000 in the Class R shares of the Fund since inception. Past performance does not guarantee future results. This chart does not reflect the deduction of taxes that a shareholder would pay on Fund distributions or the redemption of Fund shares.
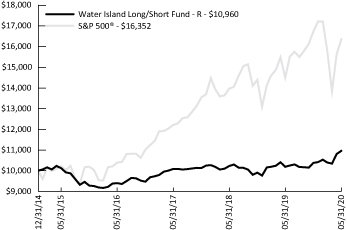
Sector Weighting
The following chart shows the sector weightings of the Water Island Long/Short Fund's investments (including short sales and excluding derivatives) as of the report date.

* Concentration Risk: The Fund may invest a large proportion of the Fund's assets in securities of issuers in a single sector over a given time. During such a period of concentration, the Fund may be subject to greater volatility with respect to its portfolio securities than a fund that is more broadly diversified.
Annual Report | May 31, 2020
47
Water Island Long/Short Fund Portfolio of Investments
| | | Shares | | Value | |
COMMON STOCKS - 76.32% | |
Biotechnology - 0.79% | |
Pacific Biosciences of California, Inc.(a)(b) | | | 4,298 | | | $ | 15,129 | | |
Commercial Services - 0.38% | |
IWG Plc | | | 2,000 | | | | 7,306 | | |
Computers & Computer Services - 2.25% | |
HP, Inc. | | | 2,205 | | | | 33,384 | | |
Perspecta, Inc.(b) | | | 439 | | | | 9,733 | | |
| | | | 43,117 | | |
Electronics - 1.01% | |
Tech Data Corp.(a) | | | 143 | | | | 19,483 | | |
Energy - Alternate Sources - 1.68% | |
Championx Corp.(a) | | | 3,558 | | | | 32,271 | | |
Engineering & Construction - 2.26% | |
AECOM(a)(b) | | | 589 | | | | 22,836 | | |
frontdoor, Inc.(a)(c) | | | 450 | | | | 20,542 | | |
| | | | 43,378 | | |
Holding Companies-Diversified - 21.29% | |
CC Neuberger Principal Holdings(a) | | | 3,982 | | | | 40,577 | | |
Collier Creek Holdings, Class A(a) | | | 8,750 | | | | 93,800 | | |
Foley Trasimene Acquisition Corp.(a) | | | 2,426 | | | | 24,866 | | |
Fortress Value Acquisition Corp.(a) | | | 3,020 | | | | 30,230 | | |
GigCapital3, Inc.(a) | | | 4,787 | | | | 47,583 | | |
Graf Industrial Corp.(a) | | | 8,795 | | | | 91,380 | | |
Live Oak Acquisition Corp.(a) | | | 4,656 | | | | 45,815 | | |
Sustainable Opportunities Acquisition Corp.(a) | | | 3,491 | | | | 34,561 | | |
| | | | 408,812 | | |
Internet - 8.71% | |
Grubhub, Inc.(a) | | | 608 | | | | 34,498 | | |
IAC/interactivecorp(a) | | | 365 | | | | 98,685 | | |
NortonLifeLock, Inc.(b) | | | 1,500 | | | | 34,170 | | |
| | | | 167,353 | | |
Lodging - 7.19% | |
Caesars Entertainment Corp.(a)(b) | | | 12,129 | | | | 138,149 | | |
Media - 11.11% | |
Liberty Broadband Corp., Class A(a)(b) | | | 835 | | | | 112,466 | | |
Madison Square Garden Entertainment Corp.(a) | | | 491 | | | | 38,902 | | |
Kabel Deutschland Holding AG | | | 553 | | | | 62,000 | | |
| | | | 213,368 | | |
See Notes to Financial Statements.
www.arbitragefunds.com | 1-800-295-4485
48
Water Island Long/Short Fund Portfolio of Investments (continued)
| | | Shares | | Value | |
| COMMON STOCKS - 76.32% (Continued) | |
Miscellaneous Manufacturing - 1.06% | |
Trane Technologies Plc(b) | | | 225 | | | $ | 20,297 | | |
Oil & Gas - 1.83% | |
Marathon Petroleum Corp.(b) | | | 1,000 | | | | 35,140 | | |
Pharmaceuticals - 3.68% | |
McKesson Europe AG | | | 2,223 | | | | 63,665 | | |
Paratek Pharmaceuticals, Inc.(a)(b) | | | 1,575 | | | | 6,993 | | |
| | | | 70,658 | | |
Real Estate Investment Trusts - 1.74% | |
Front Yard Residential Corp. | | | 4,460 | | | | 33,450 | | |
Retail - 1.23% | |
Tiffany & Co.(b) | | | 184 | | | | 23,576 | | |
Software - 4.72% | |
Change Healthcare, Inc.(a)(b)(c) | | | 3,700 | | | | 46,176 | | |
Instructure, Inc.(a)(d) | | | 908 | | | | 44,492 | | |
| | | | 90,668 | | |
Telecommunications - 5.39% | |
LogMeIn, Inc. | | | 1,219 | | | | 103,493 | | |
TOTAL COMMON STOCKS
(Cost $1,381,618) | | | 1,465,648 | | |
EXCHANGE-TRADED FUNDS - 0.79% | |
Equity Fund - 0.79% | |
Industrial Select Sector SPDR® Fund(b) | | | 223 | | | | 15,090 | | |
TOTAL EXCHANGE-TRADED FUNDS
(Cost $18,138) | | | 15,090 | | |
WARRANTS - 0.20% | |
Investment Company Security - 0.20% | |
Graf Industrial Corp., Exercise Price $11.50, Expires 12/31/2025(a) | | | 7,541 | | | | 3,771 | | |
TOTAL WARRANTS
(Cost $3,442) | | | 3,771 | | |
PREFERRED STOCKS - 2.62% | |
Real Estate Investment Trusts - 2.62% | |
Taubman Centers, Inc., Series J | | | 2,219 | | | | 50,371 | | |
TOTAL PREFERRED STOCKS
(Cost $50,192) | | | 50,371 | | |
See Notes to Financial Statements.
Annual Report | May 31, 2020
49
Water Island Long/Short Fund Portfolio of Investments (continued)
| | | Expiration
Date | | Exercise
Price | | Notional
Amount | | Contracts | | Value | |
PURCHASED OPTIONS(a) - 1.73% | |
Call Options Purchased - 0.92% | |
Altra Industrial Motion Corp. | | 07/2020 | | $ | 21.00 | | | $ | 24,800 | | | | 8 | | | $ | 8,480 | | |
Aramark | | 07/2020 | | | 25.00 | | | | 15,534 | | | | 6 | | | | 1,650 | | |
WESCO International, Inc. | | 09/2020 | | | 30.00 | | | | 23,310 | | | | 7 | | | | 5,040 | | |
WillScot Corp. | | 07/2020 | | | 12.50 | | | | 22,678 | | | | 17 | | | | 2,465 | | |
TOTAL CALL OPTIONS PURCHASED
(Cost $5,393) | | | | | | | | | | | 17,635 | | |
Put Options Purchased - 0.81% | |
Change Healthcare, Inc. | | | | | | | | | | | |
| | | 06/2020 | | | 9.00 | | | | 24,960 | | | | 20 | | | | 850 | | |
| | | 07/2020 | | | 10.00 | | | | 12,480 | | | | 10 | | | | 325 | | |
frontdoor, Inc. | | 07/2020 | | | 35.00 | | | | 45,650 | | | | 10 | | | | 975 | | |
iShares Russell 2000 ETF | | | | | | | | | | | |
| | | 09/2020 | | | 105.00 | | | | 166,680 | | | | 12 | | | | 2,544 | | |
| | | 12/2020 | | | 120.00 | | | | 208,350 | | | | 15 | | | | 10,950 | | |
TOTAL PUT OPTIONS PURCHASED
(Cost $26,663) | | | | | | | | | | | 15,644 | | |
TOTAL PURCHASED OPTIONS
(Cost $32,056) | | | | | | | | | | | 33,279 | | |
| | | Yield | | Shares | | Value | |
SHORT-TERM INVESTMENTS - 18.48% | |
Money Market Funds | |
Morgan Stanley Institutional Liquidity
Fund Government Portfolio, Institutional Class | | | 0.094 | %(e) | | | 177,494 | | | $ | 177,494 | | |
State Street Institutional U.S. Government Money
Market Fund, Premier Class | | | 0.249 | %(e) | | | 177,494 | | | | 177,494 | | |
| | | 354,988 | | |
TOTAL SHORT-TERM INVESTMENTS
(Cost $354,988) | | | 354,988 | | |
Total Investments - 100.14%
(Cost $1,840,434) | | | 1,923,147 | | |
Liabilities in Excess of Other Assets - (0.14)%(f) | | | (2,778 | ) | |
NET ASSETS - 100.00% | | $ | 1,920,369 | | |
See Notes to Financial Statements.
www.arbitragefunds.com | 1-800-295-4485
50
Water Island Long/Short Fund Portfolio of Investments (continued)
Portfolio Footnotes
(a) Non-income-producing security.
(b) Security, or a portion of security, is being held as collateral for short sales, written option contracts or forward foreign currency exchange contracts. At May 31, 2020, the aggregate fair market value of those securities was $457,908, representing 23.84% of net assets.
(c) Underlying security for a written/purchased call/put option.
(d) Security fair valued using significant unobservable inputs and classified as a Level 3 security. As of May 31, 2020, the total fair market value of these securities was $44,492, representing 2.32% of net assets.
(e) Rate shown is the 7-day effective yield as of May 31, 2020.
(f) Includes cash held as collateral for short sales and written option contracts.
SCHEDULE OF SECURITIES SOLD SHORT | | Shares | | Value | |
COMMON STOCKS - (23.65%) | |
Commercial Services - (0.10%) | |
Booz Allen Hamilton Holding Corp., Class A | | | (23 | ) | | $ | (1,834 | ) | |
Computers & Computer Services - (1.00%) | |
CACI International, Inc., Class A | | | (7 | ) | | | (1,755 | ) | |
Hewlett Packard Enterprise Co. | | | (387 | ) | | | (3,758 | ) | |
International Business Machines Corp. | | | (42 | ) | | | (5,246 | ) | |
Science Applications International Corp. | | | (19 | ) | | | (1,673 | ) | |
Seagate Technology Plc | | | (126 | ) | | | (6,683 | ) | |
| | | | (19,115 | ) | |
Construction Materials - (0.96%) | |
Johnson Controls International Plc | | | (273 | ) | | | (8,575 | ) | |
Lennox International, Inc. | | | (46 | ) | | | (9,837 | ) | |
| | | | (18,412 | ) | |
Distribution/Wholesale - (1.07%) | |
WESCO International, Inc. | | | (616 | ) | | | (20,513 | ) | |
Engineering & Construction - (2.14%) | |
Jacobs Engineering Group, Inc. | | | (70 | ) | | | (5,881 | ) | |
Stantec, Inc. | | | (222 | ) | | | (6,675 | ) | |
WillScot Corp. | | | (1,700 | ) | | | (22,678 | ) | |
WSP Global, Inc. | | | (92 | ) | | | (5,938 | ) | |
| | | | (41,172 | ) | |
Entertainment - (1.51%) | |
Eldorado Resorts, Inc. | | | (818 | ) | | | (29,006 | ) | |
Environmental Control - (0.30%) | |
Tetra Tech, Inc. | | | (74 | ) | | | (5,839 | ) | |
Food Service - (0.94%) | |
Aramark | | | (700 | ) | | | (18,123 | ) | |
See Notes to Financial Statements.
Annual Report | May 31, 2020
51
Water Island Long/Short Fund Portfolio of Investments (continued)
SCHEDULE OF SECURITIES SOLD SHORT | | Shares | | Value | |
| COMMON STOCKS - (23.65%) (Continued) | |
Internet - (7.01%) | |
ANGI Homeservices, Inc., Class A | | | (1,358 | ) | | $ | (14,734 | ) | |
Match Group, Inc. | | | (869 | ) | | | (77,376 | ) | |
Uber Technologies, Inc. | | | (1,170 | ) | | | (42,494 | ) | |
| | | | (134,604 | ) | |
Machinery - Diversified - (2.04%) | |
Altra Industrial Motion Corp. | | | (1,266 | ) | | | (39,246 | ) | |
Media - (5.33%) | |
Charter Communications, Inc., Class A | | | (188 | ) | | | (102,272 | ) | |
Oil & Gas - (0.65%) | |
HollyFrontier Corp. | | | (236 | ) | | | (7,422 | ) | |
PBF Energy, Inc., Class A | | | (480 | ) | | | (5,098 | ) | |
| | | | (12,520 | ) | |
Real Estate Investment Trusts - (0.60%) | |
American Homes 4 Rent, Class A | | | (219 | ) | | | (5,527 | ) | |
Invitation Homes, Inc. | | | (229 | ) | | | (6,023 | ) | |
| | | | (11,550 | ) | |
TOTAL COMMON STOCKS
(Proceeds $421,390) | | | (454,206 | ) | |
EXCHANGE-TRADED FUNDS - (1.61%) | |
Equity Fund - (1.61%) | |
VanEck Vectors Oil Services ETF | | | (260 | ) | | | (30,878 | ) | |
TOTAL EXCHANGE-TRADED FUNDS
(Proceeds $30,607) | | | (30,878 | ) | |
TOTAL SECURITIES SOLD SHORT
(Proceeds $451,997) | | $ | (485,084 | ) | |
WRITTEN OPTIONS | | Expiration
Date | | Exercise
Price | | Notional
Amount | | Contracts | | Value | |
Written Put Options | |
iShares Russell 2000 ETF | |
| | | 09/2020 | | $ | 90.00 | | | $ | (166,680 | ) | | | (12 | ) | | $ | (1,284 | ) | |
| | | 12/2020 | | | 110.00 | | | | (208,350 | ) | | | (15 | ) | | | (7,665 | ) | |
TOTAL WRITTEN PUT OPTIONS
(Premiums received $15,500) | | | | | | | | | | | (8,949 | ) | |
TOTAL WRITTEN OPTIONS
(Premiums received $15,500) | | | | | | | | | | $ | (8,949 | ) | |
See Notes to Financial Statements.
www.arbitragefunds.com | 1-800-295-4485
52
Water Island Long/Short Fund Portfolio of Investments (continued)
EQUITY SWAP CONTRACTS
Swap
Counterparty/
Payment
Frequency | | Reference
Obligation | | Rate
Paid/
Received
by the
Fund | | Termination
Date | | Upfront
Payments
Paid | | Upfront
Payments
Received | | Market
Value | | Notional
Amount | | Unrealized
Appreciation | |
Morgan
Stanley &
Co./Monthly
| | MPLX LP
| | Received
1 Month-
Federal
Rate
Minus
40 bps
(-0.350%) | |
03/11/2022 | | $ | — | | | $ | — | | | $ | — | | | $ | 11,964 | | | $ | — | | |
Morgan
Stanley &
Co./Monthly
| | Valero
Energy
Corp.
| | Received
1 Month-
Federal
Rate
Minus
40 bps
(-0.350%) | |
03/11/2022 | | | — | | | | — | | | | — | | | | 9,996 | | | | — | | |
| | | | | | | | | | | | | $ | — | | | $ | 21,960 | | | $ | — | | |
OUTSTANDING FORWARD FOREIGN CURRENCY EXCHANGE CONTRACTS
Currency
Purchased | | Currency Sold | | Counterparty | | Settlement
Date | | Unrealized
Appreciation | |
CAD | 42,100 | | | USD | 30,255 | | | Goldman Sachs & Co. | | 06/15/2020 | | $ | 322 | | |
EUR | 6,740 | | | USD | 7,358 | | | Goldman Sachs & Co. | | 06/15/2020 | | | 125 | | |
USD | 129,897 | | | EUR | 115,310 | | | Goldman Sachs & Co. | | 06/15/2020 | | | 1,864 | | |
GBP | 10,100 | | | USD | 12,433 | | | Goldman Sachs & Co. | | 06/15/2020 | | | 41 | | |
USD | 14,402 | | | GBP | 11,600 | | | Goldman Sachs & Co. | | 06/15/2020 | | | 77 | | |
| | | $ | 2,429 | | |
Currency
Purchased | | Currency Sold | | Counterparty | | Settlement
Date | | Unrealized
Depreciation | |
USD | 23,805 | | | CAD | 33,910 | | | Goldman Sachs & Co. | | 06/15/2020 | | $ | (824 | ) | |
EUR | 5,160 | | | USD | 5,796 | | | Goldman Sachs & Co. | | 06/15/2020 | | | (66 | ) | |
USD | 9,842 | | | EUR | 9,020 | | | Goldman Sachs & Co. | | 06/15/2020 | | | (171 | ) | |
GBP | 2,600 | | | USD | 3,245 | | | Goldman Sachs & Co. | | 06/15/2020 | | | (34 | ) | |
USD | 8,596 | | | GBP | 7,000 | | | Goldman Sachs & Co. | | 06/15/2020 | | | (50 | ) | |
| | | $ | (1,145 | ) | |
See Notes to Financial Statements.
Annual Report | May 31, 2020
53
Water Island Long/Short Fund Portfolio of Investments (continued)
The following is a summary of investments classified by country exposure:
Country | | % of Net Assets(a) | |
Germany | | | 6.55 | % | |
United States Virgin Islands | | | 1.74 | % | |
Ireland | | | 1.06 | % | |
Switzerland | | | 0.38 | % | |
United States | | | 90.41 | % | |
Liabilities in Excess of Other Assets | | | (0.14 | )% | |
| | | | 100.00 | % | |
(a) These percentages represent long positions only and are not net of short positions.
Abbreviations:
AG - Aktiengesellschaft is a German term that refers to a corporation that is limited by shares, i.e., owned by shareholders.
bps - Basis Points. 100 Basis Points is equal to 1 percentage point.
CAD - Canadian dollar
ETF - Exchange-Traded Fund
EUR - Euro
GBP - British pound
LP - Limited Partnership
Plc - Public Limited Company
SPDR - Standard & Poor's Depositary Receipt
USD - United States Dollar
The following table summarizes the Water Island Long/Short Fund's investments and derivative financial instruments categorized in the fair value hierarchy as of May 31, 2020:
Investments in Securities at Value* | | Level 1 | | Level 2 | | Level 3 | | Total | |
Assets | |
Common Stocks | |
Biotechnology | | $ | 15,129 | | | $ | — | | | $ | — | | | $ | 15,129 | | |
Commercial Services | | | 7,306 | | | | — | | | | — | | | | 7,306 | | |
Computers & Computer Services | | | 43,117 | | | | — | | | | — | | | | 43,117 | | |
Electronics | | | 19,483 | | | | — | | | | — | | | | 19,483 | | |
Energy - Alternate Sources | | | 32,271 | | | | — | | | | — | | | | 32,271 | | |
Engineering & Construction | | | 43,378 | | | | — | | | | — | | | | 43,378 | | |
Holding Companies-Diversified | | | 408,812 | | | | — | | | | — | | | | 408,812 | | |
Internet | | | 167,353 | | | | — | | | | — | | | | 167,353 | | |
Lodging | | | 138,149 | | | | — | | | | — | | | | 138,149 | | |
Media | | | 213,368 | | | | — | | | | — | | | | 213,368 | | |
Miscellaneous Manufacturing | | | 20,297 | | | | — | | | | — | | | | 20,297 | | |
Oil & Gas | | | 35,140 | | | | — | | | | — | | | | 35,140 | | |
Pharmaceuticals | | | 70,658 | | | | — | | | | — | | | | 70,658 | | |
Real Estate Investment Trusts | | | 33,450 | | | | — | | | | — | | | | 33,450 | | |
See Notes to Financial Statements.
www.arbitragefunds.com | 1-800-295-4485
54
Water Island Long/Short Fund Portfolio of Investments (continued)
Investments in Securities at Value* | | Level 1 | | Level 2 | | Level 3 | | Total | |
Retail | | $ | 23,576 | | | $ | — | | | $ | — | | | $ | 23,576 | | |
Software | | | 46,176 | | | | — | | | | 44,492 | | | | 90,668 | | |
Telecommunications | | | 103,493 | | | | — | | | | — | | | | 103,493 | | |
Exchange-Traded Funds | | | 15,090 | | | | — | | | | — | | | | 15,090 | | |
Warrants | | | 3,771 | | | | — | | | | — | | | | 3,771 | | |
Preferred Stocks** | | | 50,371 | | | | — | | | | — | | | | 50,371 | | |
Purchased Options | | | 33,279 | | | | — | | | | — | | | | 33,279 | | |
Short-Term Investments | | | 354,988 | | | | — | | | | — | | | | 354,988 | | |
TOTAL | | $ | 1,878,655 | | | $ | — | | | $ | 44,492 | | | $ | 1,923,147 | | |
Other Financial Instruments*** | |
Assets | |
Forward Foreign Currency Exchange Contracts | | $ | — | | | $ | 2,429 | | | $ | — | | | $ | 2,429 | | |
Equity Swaps | | | 0 | | | | — | | | | — | | | | 0 | | |
Liabilities | |
Common Stocks** | | | (454,206 | ) | | | — | | | | — | | | | (454,206 | ) | |
Exchange-Traded Funds | | | (30,878 | ) | | | — | | | | — | | | | (30,878 | ) | |
Written Options | | | (8,949 | ) | | | — | | | | — | | | | (8,949 | ) | |
Forward Foreign Currency Exchange Contracts | | | — | | | | (1,145 | ) | | | — | | | | (1,145 | ) | |
TOTAL | | $ | (494,033 | ) | | $ | 1,284 | | | $ | — | | | $ | (492,749 | ) | |
* Refer to footnote 2 where leveling hierarchy is defined.
** Refer to Portfolio of Investments for sector information.
*** Other financial instruments are instruments such as written options, securities sold short, equity swaps and forward foreign currency exchange contracts.
The following is a reconciliation of the fair valuations using significant unobservable inputs (Level 3) for the Fund's assets and liabilities during the period ended May 31, 2020:
Investments
in Securities | | Balance as of
May 31, 2019 | | Realized
Gain (Loss) | | Change in
Unrealized
Appreciation
(Depreciation) | | Purchases | | Sales
Proceeds | | Transfers
into
Level 3 | | Transfers
out of
Level 3 | | Balance as of
May 31, 2020 | | Net change in
Unrealized
(Depreciation)
included in the
Statement of
Operations
attributable to
Level 3
investments
held at
May 31, 2020 | |
Common
Stock | | $ | 0 | | | $ | 2,931 | | | $ | 1,311 | | | $ | 266,280 | | | $ | (226,030 | ) | | $ | — | | | $ | — | | | $ | 44,492 | | | $ | 1,311 | | |
Total | | $ | 0 | | | $ | 2,931 | | | $ | 1,311 | | | $ | 266,280 | | | $ | (226,030 | ) | | $ | — | | | $ | — | | | $ | 44,492 | | | $ | 1,311 | | |
See Notes to Financial Statements.
Annual Report | May 31, 2020
55
Water Island Long/Short Fund Portfolio of Investments (continued)
The following table summarizes the quantitative inputs used for investments categorized as Level 3 of the fair value hierarchy as of May 31, 2020:
Investments in
Securities | | Fair Value at
May 31, 2020 | | Valuation
Technique | | Unobservable
Input | | Range of
Values | | Weighted
Average | |
Common Stocks
| | $ | 44,492
| | | Deal Value
| | Final
determination
on Dissent | | $ | 49
| | | $ | 49.00
| | |
See Notes to Financial Statements.
www.arbitragefunds.com | 1-800-295-4485
56
This Page Intentionally Left Blank
| | | Arbitrage
Fund | | Water Island
Diversified
Event-Driven
Fund | |
ASSETS | |
Investments: | |
At cost of unaffiliated investments | | $ | 1,205,110,681 | | | $ | 101,950,451 | | |
At cost of affiliated investments | | $ | 60,459,409 | | | $ | — | | |
At fair value of unaffiliated investments (Note 2) | | $ | 1,193,014,105 | | | $ | 102,183,485 | | |
At fair value of affiliated investments (Note 2) | | $ | 66,223,311 | | | $ | — | | |
Cash | | | 1,211,417 | | | | 273,889 | | |
Cash denominated in foreign currency (Cost $1,327, $1,750, $0 and $0) | | | 1,332 | | | | 1,757 | | |
Deposits with brokers for securities sold short (Note 2) | | | 104,354,506 | | | | 12,219,727 | | |
Segregated cash for collateral (Note 2) | | | 48,725,000 | | | | 1,319,540 | | |
Receivable for investment securities sold | | | 82,130,035 | | | | 5,238,935 | | |
Receivable for capital shares sold | | | 3,325,671 | | | | 9,030 | | |
Unrealized appreciation on forward foreign currency exchange contracts (Note 8) | | | 4,054,734 | | | | 227,160 | | |
Dividends and interest receivable | | | 449,585 | | | | 158,158 | | |
Receivable due from Adviser (Note 5) | | | — | | | | — | | |
Prepaid expenses and other assets | | | 77,920 | | | | 29,840 | | |
Total Assets | | | 1,503,567,616 | | | | 121,661,521 | | |
LIABILITIES | |
Securities sold short, at value (Note 2) (proceeds $95,101,458, $11,147,423, $10,019,417 and
$451,997) | | | 102,963,521 | | | | 12,483,699 | | |
Written options, at value (Note 2) (premiums received $0, $0, $9,133 and $15,500) | | | — | | | | — | | |
Line of credit payable (Note 4) | | | — | | | | — | | |
Payable for investment securities purchased | | | 16,564,399 | | | | 1,232,168 | | |
Unrealized depreciation on forward foreign currency exchange contracts (Note 8) | | | 1,169,055 | | | | 85,614 | | |
Payable for capital shares redeemed | | | 801,237 | | | | 135,664 | | |
Payable to Adviser (Note 5) | | | 1,179,358 | | | | 101,225 | | |
Dividends payable on securities sold short | | | — | | | | 1,399 | | |
Payable to Distributor (Note 5) | | | 42,815 | | | | 2,151 | | |
Payable to Administrator (Note 5) | | | 92,799 | | | | 15,802 | | |
Payable to Transfer Agent (Note 5) | | | 112,264 | | | | 14,669 | | |
Payable to Custodian | | | 90,519 | | | | 25,516 | | |
Interest expense payable | | | 32,293 | | | | 5,309 | | |
Payable for swap reset | | | 126,571 | | | | 15,600 | | |
Audit and legal fees payable | | | 103,521 | | | | 22,576 | | |
Payable to Trustees | | | 20,156 | | | | 20,156 | | |
Chief Compliance Officer Fees payable (Note 5) | | | 22,694 | | | | 1,783 | | |
Chief Financial Officer Fees payable (Note 5) | | | 5,036 | | | | 931 | | |
Other accrued expenses and liabilities | | | 65,680 | | | | 17,850 | | |
Total Liabilities | | | 123,391,918 | | | | 14,182,112 | | |
NET ASSETS | | $ | 1,380,175,698 | | | $ | 107,479,409 | | |
NET ASSETS CONSIST OF: | |
Paid-in capital | | $ | 1,330,639,186 | | | $ | 160,770,439 | | |
Distributable earnings (Accumulated loss) | | | 49,536,512 | | | | (53,291,030 | ) | |
NET ASSETS | | $ | 1,380,175,698 | | | $ | 107,479,409 | | |
See Notes to Financial Statements.
www.arbitragefunds.com | 1-800-295-4485
58
Statement of Assets and Liabilities
May 31, 2020
| | | Water
Island Credit
Opportunities Fund | | Water Island
Long/Short
Fund | |
ASSETS | |
Investments: | |
At cost of unaffiliated investments | | $ | 61,886,336 | | | $ | 1,840,434 | | |
At cost of affiliated investments | | $ | — | | | $ | — | | |
At fair value of unaffiliated investments (Note 2) | | $ | 61,702,996 | | | $ | 1,923,147 | | |
At fair value of affiliated investments (Note 2) | | $ | — | | | $ | — | | |
Cash | | | 77,226 | | | | — | | |
Cash denominated in foreign currency (Cost $1,327, $1,750, $0 and $0) | | | — | | | | — | | |
Deposits with brokers for securities sold short (Note 2) | | | 10,735,664 | | | | 440,548 | | |
Segregated cash for collateral (Note 2) | | | 1,450,000 | | | | 83,329 | | |
Receivable for investment securities sold | | | 47,694 | | | | 69,936 | | |
Receivable for capital shares sold | | | 47,540 | | | | — | | |
Unrealized appreciation on forward foreign currency exchange contracts (Note 8) | | | — | | | | 2,429 | | |
Dividends and interest receivable | | | 685,734 | | | | 1,029 | | |
Receivable due from Adviser (Note 5) | | | 1,560 | | | | 13,504 | | |
Prepaid expenses and other assets | | | 23,050 | | | | 10,408 | | |
Total Assets | | | 74,771,464 | | | | 2,544,330 | | |
LIABILITIES | |
Securities sold short, at value (Note 2) (proceeds $95,101,458, $11,147,423, $10,019,417 and
$451,997) | | | 10,649,683 | | | | 485,084 | | |
Written options, at value (Note 2) (premiums received $0, $0, $9,133 and $15,500) | | | 17,100 | | | | 8,949 | | |
Line of credit payable (Note 4) | | | 2,400,000 | | | | — | | |
Payable for investment securities purchased | | | 185,760 | | | | 66,249 | | |
Unrealized depreciation on forward foreign currency exchange contracts (Note 8) | | | — | | | | 1,145 | | |
Payable for capital shares redeemed | | | 124,576 | | | | 6,882 | | |
Payable to Adviser (Note 5) | | | — | | | | — | | |
Dividends payable on securities sold short | | | 510 | | | | 252 | | |
Payable to Distributor (Note 5) | | | 1,390 | | | | 2 | | |
Payable to Administrator (Note 5) | | | 19,873 | | | | 5,879 | | |
Payable to Transfer Agent (Note 5) | | | 5,901 | | | | 230 | | |
Payable to Custodian | | | 6,776 | | | | 6,889 | | |
Interest expense payable | | | 19,563 | | | | 168 | | |
Payable for swap reset | | | 668 | | | | 152 | | |
Audit and legal fees payable | | | 18,997 | | | | 15,909 | | |
Payable to Trustees | | | 20,156 | | | | 20,156 | | |
Chief Compliance Officer Fees payable (Note 5) | | | 1,689 | | | | 43 | | |
Chief Financial Officer Fees payable (Note 5) | | | 778 | | | | 589 | | |
Other accrued expenses and liabilities | | | 9,768 | | | | 5,383 | | |
Total Liabilities | | | 13,483,188 | | | | 623,961 | | |
NET ASSETS | | $ | 61,288,276 | | | $ | 1,920,369 | | |
NET ASSETS CONSIST OF: | |
Paid-in capital | | $ | 64,646,278 | | | $ | 1,848,425 | | |
Distributable earnings (Accumulated loss) | | | (3,358,002 | ) | | | 71,944 | | |
NET ASSETS | | $ | 61,288,276 | | | $ | 1,920,369 | | |
Annual Report | May 31, 2020
59
| | | Arbitrage
Fund | | Water Island
Diversified
Event-Driven
Fund | |
PRICING OF SHARES: | |
CLASS R SHARES: | |
Net assets applicable to Class R shares | | $ | 98,714,997 | | | $ | 7,694,365 | | |
Shares of beneficial interest outstanding (unlimited number of shares authorized, no par value) | | | 7,571,093 | | | | 771,832 | | |
Net asset value and offering price per share | | $ | 13.04 | | | $ | 9.97 | | |
CLASS I SHARES: | |
Net assets applicable to Class I shares | | $ | 1,243,838,214 | | | $ | 99,068,635 | | |
Shares of beneficial interest outstanding (unlimited number of shares authorized, no par value) | | | 92,359,506 | | | | 9,856,576 | | |
Net asset value and offering price per share | | $ | 13.47 | | | $ | 10.05 | | |
CLASS C SHARES: | |
Net assets applicable to Class C shares | | $ | 19,860,378 | | | $ | 369,318 | | |
Shares of beneficial interest outstanding (unlimited number of shares authorized, no par value) | | | 1,609,355 | | | | 37,960 | | |
Net asset value and offering price per share(a) | | $ | 12.34 | | | $ | 9.73 | | |
CLASS A SHARES: | |
Net assets applicable to Class A shares | | $ | 17,762,109 | | | $ | 347,091 | | |
Shares of beneficial interest outstanding (unlimited number of shares authorized, no par value) | | | 1,365,077 | | | | 34,828 | | |
Net asset value and offering price per share(a) | | $ | 13.01 | | | $ | 9.97 | | |
Maximum offering price per share (NAV/(100% — maximum sales charge)) | | $ | 13.34 | | | $ | 10.30 | | |
Maximum sales charge | | | 2.75 | % | | | 3.25 | % | |
(a) Redemption price varies based on length of time held (Note 1).
See Notes to Financial Statements.
www.arbitragefunds.com | 1-800-295-4485
60
Statement of Assets and Liabilities
May 31, 2020
| | | Water
Island Credit
Opportunities Fund | | Water Island
Long/Short
Fund | |
PRICING OF SHARES: | |
CLASS R SHARES: | |
Net assets applicable to Class R shares | | $ | 3,672,697 | | | $ | 10,958 | | |
Shares of beneficial interest outstanding (unlimited number of shares authorized, no par value) | | | 380,824 | | | | 1,049 | | |
Net asset value and offering price per share | | $ | 9.64 | | | $ | 10.45 | | |
CLASS I SHARES: | |
Net assets applicable to Class I shares | | $ | 56,868,836 | | | $ | 1,909,411 | | |
Shares of beneficial interest outstanding (unlimited number of shares authorized, no par value) | | | 5,924,208 | | | | 182,754 | | |
Net asset value and offering price per share | | $ | 9.60 | | | $ | 10.45 | | |
CLASS C SHARES: | |
Net assets applicable to Class C shares | | $ | 658,825 | | | $ | — | | |
Shares of beneficial interest outstanding (unlimited number of shares authorized, no par value) | | | 68,566 | | | | — | | |
Net asset value and offering price per share(a) | | $ | 9.61 | | | $ | — | | |
CLASS A SHARES: | |
Net assets applicable to Class A shares | | $ | 87,918 | | | $ | — | | |
Shares of beneficial interest outstanding (unlimited number of shares authorized, no par value) | | | 9,155 | | | | — | | |
Net asset value and offering price per share(a) | | $ | 9.60 | | | $ | — | | |
Maximum offering price per share (NAV/(100% — maximum sales charge)) | | $ | 9.92 | | | $ | — | | |
Maximum sales charge | | | 3.25 | % | | | — | | |
Annual Report | May 31, 2020
61
| | | Arbitrage
Fund | | Water Island
Diversified
Event-Driven
Fund | |
INVESTMENT INCOME | |
Dividend income | | $ | 16,059,077 | | | $ | 1,476,394 | | |
Dividend income from affiliated investments | | | 119,280 | | | | — | | |
Foreign taxes withheld on dividends | | | (236,046 | ) | | | (13,682 | ) | |
Interest income | | | 4,329,858 | | | | 804,763 | | |
Securities lending income | | | — | | | | 477 | | |
Total Investment Income | | | 20,272,169 | | | | 2,267,952 | | |
EXPENSES | |
Investment advisory fees (Note 5) | | | 17,217,445 | | | | 1,467,297 | | |
Distribution and service fees (Note 5) | |
Class R | | | 356,873 | | | | 64,332 | | |
Class C | | | 196,500 | | | | 6,378 | | |
Class A | | | 45,572 | | | | 1,865 | | |
Administrative fees (Note 5) | | | 372,592 | | | | 60,266 | | |
Chief Compliance Officer fees (Note 5) | | | 104,929 | | | | 8,846 | | |
Trustees' fees | | | 103,330 | | | | 84,149 | | |
Dividend expense | | | 2,470,776 | | | | 158,443 | | |
Interest rebate expense | | | — | | | | 1,125 | | |
Transfer agent fees (Note 5) | | | 1,292,728 | | | | 298,114 | | |
Custodian and bank service fees | | | 408,346 | | | | 80,786 | | |
Registration and filing fees | | | 96,895 | | | | 61,292 | | |
Printing of shareholder reports | | | 155,380 | | | | 32,427 | | |
Professional fees | | | 265,566 | | | | 34,956 | | |
Line of credit interest expense (Note 4) | | | 97,046 | | | | 10,116 | | |
Insurance expense | | | 72,485 | | | | 5,737 | | |
Chief Financial Officer fees (Note 5) | | | 62,131 | | | | 11,255 | | |
Other expenses | | | 98,715 | | | | 23,449 | | |
Total Expenses | | | 23,417,309 | | | | 2,410,833 | | |
Fees waived and/or reimbursed by the Adviser, Class R (Note 5) | | | (35,738 | ) | | | (72,714 | ) | |
Fees waived and/or reimbursed by the Adviser, Class I (Note 5) | | | (362,985 | ) | | | (279,224 | ) | |
Fees waived and/or reimbursed by the Adviser, Class C (Note 5) | | | (4,920 | ) | | | (1,804 | ) | |
Fees waived and/or reimbursed by the Adviser, Class A (Note 5) | | | (4,564 | ) | | | (2,112 | ) | |
Net Expenses | | | 23,009,102 | | | | 2,054,979 | | |
NET INVESTMENT INCOME (LOSS) | | | (2,736,933 | ) | | | 212,973 | | |
See Notes to Financial Statements.
www.arbitragefunds.com | 1-800-295-4485
62
For the Year Ended May 31, 2020
| | | Water
Island Credit
Opportunities Fund | | Water Island
Long/Short
Fund | |
INVESTMENT INCOME | |
Dividend income | | $ | 79,500 | | | $ | 87,378 | | |
Dividend income from affiliated investments | | | — | | | | — | | |
Foreign taxes withheld on dividends | | | — | | | | (535 | ) | |
Interest income | | | 2,149,302 | | | | 6,202 | | |
Securities lending income | | | — | | | | — | | |
Total Investment Income | | | 2,228,802 | | | | 93,045 | | |
EXPENSES | |
Investment advisory fees (Note 5) | | | 552,515 | | | | 25,052 | | |
Distribution and service fees (Note 5) | |
Class R | | | 18,976 | | | | 26 | | |
Class C | | | 4,679 | | | | 17 | | |
Class A | | | 614 | | | | 4 | | |
Administrative fees (Note 5) | | | 67,951 | | | | 25,335 | | |
Chief Compliance Officer fees (Note 5) | | | 4,291 | | | | 137 | | |
Trustees' fees | | | 83,231 | | | | 82,525 | | |
Dividend expense | | | 42,155 | | | | 4,288 | | |
Interest rebate expense | | | — | | | | 279 | | |
Transfer agent fees (Note 5) | | | 63,213 | | | | 4,849 | | |
Custodian and bank service fees | | | 29,621 | | | | 25,958 | | |
Registration and filing fees | | | 60,651 | | | | 44,720 | | |
Printing of shareholder reports | | | 7,310 | | | | 2,537 | | |
Professional fees | | | 24,740 | | | | 16,106 | | |
Line of credit interest expense (Note 4) | | | 29,477 | | | | 16 | | |
Insurance expense | | | 2,401 | | | | 83 | | |
Chief Financial Officer fees (Note 5) | | | 8,974 | | | | 7,068 | | |
Other expenses | | | 21,351 | | | | 12,223 | | |
Total Expenses | | | 1,022,150 | | | | 251,223 | | |
Fees waived and/or reimbursed by the Adviser, Class R (Note 5) | | | (46,492 | ) | | | (1,126 | ) | |
Fees waived and/or reimbursed by the Adviser, Class I (Note 5) | | | (305,422 | ) | | | (216,303 | ) | |
Fees waived and/or reimbursed by the Adviser, Class C (Note 5) | | | (2,868 | ) | | | (152 | ) | |
Fees waived and/or reimbursed by the Adviser, Class A (Note 5) | | | (1,504 | ) | | | (152 | ) | |
Net Expenses | | | 665,864 | | | | 33,490 | | |
NET INVESTMENT INCOME (LOSS) | | | 1,562,938 | | | | 59,555 | | |
Annual Report | May 31, 2020
63
| | | Arbitrage
Fund | | Water Island
Diversified
Event-Driven
Fund | |
REALIZED AND UNREALIZED GAINS (LOSSES) ON INVESTMENTS AND FOREIGN CURRENCIES | |
Net realized gains (losses) from: | |
Unaffiliated investments | | $ | 93,070,280 | | | $ | 8,182,595 | | |
Purchased option contracts | | | (5,039,302 | ) | | | (621,405 | ) | |
Swap contracts | | | (12,721,184 | ) | | | 1,324,551 | | |
Securities sold short | | | (11,978,565 | ) | | | (2,345,694 | ) | |
Written option contracts | | | 317,902 | | | | 181,455 | | |
Forward currency contracts | | | 3,988,837 | | | | 86,167 | | |
Foreign currency transactions (Note 8) | | | 2,309,502 | | | | 19,249 | | |
Net change in unrealized appreciation (depreciation) on: | |
Unaffiliated investments | | | (25,875,315 | ) | | | 269,869 | | |
Affiliated investments | | | 5,728,034 | | | | — | | |
Securities sold short | | | 929,782 | | | | (1,701,864 | ) | |
Foreign currency transactions (Note 8) | | | 389 | | | | 26 | | |
Purchased option contracts | | | 252,665 | | | | 26,088 | | |
Written option contracts | | | (25,601 | ) | | | (4,956 | ) | |
Forward currency contracts | | | (2,224,904 | ) | | | (29,486 | ) | |
NET REALIZED AND UNREALIZED GAINS (LOSSES) ON INVESTMENTS AND FOREIGN CURRENCIES | | | 48,732,520 | | | | 5,386,595 | | |
NET INCREASE IN NET ASSETS RESULTING FROM OPERATIONS | | $ | 45,995,587 | | | $ | 5,599,568 | | |
See Notes to Financial Statements.
www.arbitragefunds.com | 1-800-295-4485
64
For the Year Ended May 31, 2020
| | | Water
Island Credit
Opportunities Fund | | Water Island
Long/Short
Fund | |
REALIZED AND UNREALIZED GAINS (LOSSES) ON INVESTMENTS AND FOREIGN CURRENCIES | |
Net realized gains (losses) from: | |
Unaffiliated investments | | $ | 175,502 | | | $ | 20,869 | | |
Purchased option contracts | | | 130,754 | | | | (51,982 | ) | |
Swap contracts | | | (113,022 | ) | | | (5,921 | ) | |
Securities sold short | | | 511,864 | | | | 48,669 | | |
Written option contracts | | | 21,926 | | | | 14,261 | | |
Forward currency contracts | | | — | | | | 2,966 | | |
Foreign currency transactions (Note 8) | | | (106 | ) | | | (331 | ) | |
Net change in unrealized appreciation (depreciation) on: | |
Unaffiliated investments | | | (98,597 | ) | | | 118,152 | | |
Affiliated investments | | | — | | | | — | | |
Securities sold short | | | (873,080 | ) | | | (64,266 | ) | |
Foreign currency transactions (Note 8) | | | — | | | | 1 | | |
Purchased option contracts | | | 243,824 | | | | (8,504 | ) | |
Written option contracts | | | (9,147 | ) | | | 8,092 | | |
Forward currency contracts | | | — | | | | 184 | | |
NET REALIZED AND UNREALIZED GAINS (LOSSES) ON INVESTMENTS AND FOREIGN CURRENCIES | | | (10,082 | ) | | | 82,190 | | |
NET INCREASE IN NET ASSETS RESULTING FROM OPERATIONS | | $ | 1,552,856 | | | $ | 141,745 | | |
Annual Report | May 31, 2020
65
| | | Arbitrage Fund | |
| | | Year Ended
May 31, 2020 | | Year Ended
May 31, 2019 | |
FROM OPERATIONS | |
Net investment income (loss) | | $ | (2,736,933 | ) | | $ | 273,818 | | |
Net realized gains (losses) from: | |
Unaffiliated investments | | | 93,070,280 | | | | 18,263,290 | | |
Purchased option contracts | | | (5,039,302 | ) | | | (9,906,367 | ) | |
Swap contracts | | | (12,721,184 | ) | | | 6,330,396 | | |
Securities sold short | | | (11,978,565 | ) | | | 54,909,157 | | |
Written option contracts | | | 317,902 | | | | 7,785,695 | | |
Forward currency contracts | | | 3,988,837 | | | | 20,593,887 | | |
Foreign currency transactions | | | 2,309,502 | | | | 836,947 | | |
Net change in unrealized appreciation (depreciation) on: | |
Unaffiliated investments | | | (25,875,315 | ) | | | (11,301,841 | ) | |
Affiliated investments | | | 5,728,034 | | | | 4,775 | | |
Securities sold short | | | 929,782 | | | | (3,373,640 | ) | |
Foreign currency transactions | | | 389 | | | | (353,986 | ) | |
Purchased option contracts | | | 252,665 | | | | (869,661 | ) | |
Written option contracts | | | (25,601 | ) | | | (21,922 | ) | |
Swap contracts | | | — | | | | (19,040 | ) | |
Forward currency contracts | | | (2,224,904 | ) | | | (12,510,293 | ) | |
Net increase (decrease) in net assets resulting from operations | | | 45,995,587 | | | | 70,641,215 | | |
FROM DIVIDENDS AND DISTRIBUTIONS TO SHAREHOLDERS: | |
Distributions, Class R | | | (3,028,417 | ) | | | (3,337,705 | ) | |
Distributions, Class I | | | (30,760,287 | ) | | | (28,493,325 | ) | |
Distributions, Class C | | | (441,292 | ) | | | (258,793 | ) | |
Distributions, Class A | | | (377,484 | ) | | | (312,255 | ) | |
Decrease in net assets from distributions to shareholders | | | (34,607,480 | ) | | | (32,402,078 | ) | |
FROM CAPITAL SHARE TRANSACTIONS (NOTE 7): | |
Proceeds from shares sold | | | 388,612,998 | | | | 573,691,155 | | |
Shares issued in reinvestment of distributions | | | 27,514,664 | | | | 25,056,881 | | |
Payments for shares redeemed | | | (794,621,293 | ) | | | (662,269,228 | ) | |
Net increase (decrease) in net assets from capital share transactions | | | (378,493,631 | ) | | | (63,521,192 | ) | |
TOTAL INCREASE (DECREASE) IN NET ASSETS | | | (367,105,524 | ) | | | (25,282,055 | ) | |
NET ASSETS | |
Beginning of year | | | 1,747,281,222 | | | | 1,772,563,277 | | |
End of year | | $ | 1,380,175,698 | | | $ | 1,747,281,222 | | |
See Notes to Financial Statements.
www.arbitragefunds.com | 1-800-295-4485
66
Statement of Changes in Net Assets
| | | Water Island Diversified
Event-Driven Fund | |
| | | Year Ended
May 31, 2020 | | Year Ended
May 31, 2019 | |
FROM OPERATIONS | |
Net investment income (loss) | | $ | 212,973 | | | $ | 1,185,159 | | |
Net realized gains (losses) from: | |
Unaffiliated investments | | | 8,182,595 | | | | 2,456,816 | | |
Purchased option contracts | | | (621,405 | ) | | | (1,475,621 | ) | |
Swap contracts | | | 1,324,551 | | | | 347,357 | | |
Securities sold short | | | (2,345,694 | ) | | | (413,048 | ) | |
Written option contracts | | | 181,455 | | | | 872,256 | | |
Forward currency contracts | | | 86,167 | | | | 918,981 | | |
Foreign currency transactions | | | 19,249 | | | | 37,222 | | |
Net change in unrealized appreciation (depreciation) on: | |
Unaffiliated investments | | | 269,869 | | | | (1,942,929 | ) | |
Affiliated investments | | | — | | | | — | | |
Securities sold short | | | (1,701,864 | ) | | | 963,822 | | |
Foreign currency transactions | | | 26 | | | | (302 | ) | |
Purchased option contracts | | | 26,088 | | | | 19,748 | | |
Written option contracts | | | (4,956 | ) | | | (107,896 | ) | |
Swap contracts | | | — | | | | — | | |
Forward currency contracts | | | (29,486 | ) | | | (556,649 | ) | |
Net increase (decrease) in net assets resulting from operations | | | 5,599,568 | | | | 2,304,916 | | |
FROM DIVIDENDS AND DISTRIBUTIONS TO SHAREHOLDERS: | |
Distributions, Class R | | | (57,935 | ) | | | (546,554 | ) | |
Distributions, Class I | | | (460,278 | ) | | | (1,734,805 | ) | |
Distributions, Class C | | | — | | | | (5,311 | ) | |
Distributions, Class A | | | (1,743 | ) | | | (13,015 | ) | |
Decrease in net assets from distributions to shareholders | | | (519,956 | ) | | | (2,299,685 | ) | |
FROM CAPITAL SHARE TRANSACTIONS (NOTE 7): | |
Proceeds from shares sold | | | 58,223,304 | | | | 18,462,931 | | |
Shares issued in reinvestment of distributions | | | 469,438 | | | | 1,993,650 | | |
Payments for shares redeemed | | | (81,019,387 | ) | | | (45,994,464 | ) | |
Net increase (decrease) in net assets from capital share transactions | | | (22,326,645 | ) | | | (25,537,883 | ) | |
TOTAL INCREASE (DECREASE) IN NET ASSETS | | | (17,247,033 | ) | | | (25,532,652 | ) | |
NET ASSETS | |
Beginning of year | | | 124,726,442 | | | | 150,259,094 | | |
End of year | | $ | 107,479,409 | | | $ | 124,726,442 | | |
Annual Report | May 31, 2020
67
| | | Water Island Credit
Opportunities Fund | |
| | | Year Ended
May 31, 2020 | | Year Ended
May 31, 2019 | |
FROM OPERATIONS | |
Net investment income (loss) | | $ | 1,562,938 | | | $ | 1,857,606 | | |
Net realized gains (losses) from: | |
Unaffiliated investments | | | 175,502 | | | | (136,053 | ) | |
Purchased option contracts | | | 130,754 | | | | (2,246 | ) | |
Swap contracts | | | (113,022 | ) | | | — | | |
Securities sold short | | | 511,864 | | | | 154,774 | | |
Written option contracts | | | 21,926 | | | | 65,984 | | |
Forward currency contracts | | | — | | | | 73,267 | | |
Foreign currency transactions | | | (106 | ) | | | (2,445 | ) | |
Net change in unrealized appreciation (depreciation) on: | |
Unaffiliated investments | | | (98,597 | ) | | | (653,777 | ) | |
Securities sold short | | | (873,080 | ) | | | 163,621 | | |
Foreign currency transactions | | | — | | | | 384 | | |
Purchased option contracts | | | 243,824 | | | | 19,075 | | |
Written option contracts | | | (9,147 | ) | | | (26,152 | ) | |
Swap contracts | | | — | | | | — | | |
Forward currency contracts | | | — | | | | (55,745 | ) | |
Net increase (decrease) in net assets resulting from operations | | | 1,552,856 | | | | 1,458,293 | | |
FROM DIVIDENDS AND DISTRIBUTIONS TO SHAREHOLDERS: | |
Distributions, Class R | | | (233,649 | ) | | | (223,168 | ) | |
Distributions, Class I | | | (1,648,549 | ) | | | (1,623,472 | ) | |
Distributions, Class C | | | (10,320 | ) | | | (12,522 | ) | |
Distributions, Class A | | | (7,297 | ) | | | (4,639 | ) | |
Decrease in net assets from distributions to shareholders | | | (1,899,815 | ) | | | (1,863,801 | ) | |
FROM CAPITAL SHARE TRANSACTIONS (NOTE 7): | |
Proceeds from shares sold | | | 25,851,224 | | | | 31,563,229 | | |
Shares issued in reinvestment of distributions | | | 1,887,360 | | | | 1,841,724 | | |
Payments for shares redeemed | | | (24,332,391 | ) | | | (21,303,781 | ) | |
Net increase (decrease) in net assets from capital share transactions | | | 3,406,193 | | | | 12,101,172 | | |
TOTAL INCREASE (DECREASE) IN NET ASSETS | | | 3,059,234 | | | | 11,695,664 | | |
NET ASSETS | |
Beginning of year | | | 58,229,042 | | | | 46,533,378 | | |
End of year | | $ | 61,288,276 | | | $ | 58,229,042 | | |
See Notes to Financial Statements.
www.arbitragefunds.com | 1-800-295-4485
68
Statement of Changes in Net Assets
| | | Water Island Long/Short Fund | |
| | | Year Ended
May 31, 2020 | | Year Ended
May 31, 2019 | |
FROM OPERATIONS | |
Net investment income (loss) | | $ | 59,555 | | | $ | 2,601 | | |
Net realized gains (losses) from: | |
Unaffiliated investments | | | 20,869 | | | | 200,171 | | |
Purchased option contracts | | | (51,982 | ) | | | (60,947 | ) | |
Swap contracts | | | (5,921 | ) | | | (11,587 | ) | |
Securities sold short | | | 48,669 | | | | (132,947 | ) | |
Written option contracts | | | 14,261 | | | | 17,583 | | |
Forward currency contracts | | | 2,966 | | | | 11,557 | | |
Foreign currency transactions | | | (331 | ) | | | (193 | ) | |
Net change in unrealized appreciation (depreciation) on: | |
Unaffiliated investments | | | 118,152 | | | | (86,799 | ) | |
Securities sold short | | | (64,266 | ) | | | 45,404 | | |
Foreign currency transactions | | | 1 | | | | (1 | ) | |
Purchased option contracts | | | (8,504 | ) | | | 11,438 | | |
Written option contracts | | | 8,092 | | | | (1,628 | ) | |
Swap contracts | | | — | | | | — | | |
Forward currency contracts | | | 184 | | | | (5,741 | ) | |
Net increase (decrease) in net assets resulting from operations | | | 141,745 | | | | (11,089 | ) | |
FROM DIVIDENDS AND DISTRIBUTIONS TO SHAREHOLDERS: | |
Distributions, Class R | | | (176 | ) | | | (206 | ) | |
Distributions, Class I | | | (36,186 | ) | | | (43,718 | ) | |
Distributions, Class C | | | — | | | | (206 | ) | |
Distributions, Class A | | | — | | | | (206 | ) | |
Decrease in net assets from distributions to shareholders | | | (36,362 | ) | | | (44,336 | ) | |
FROM CAPITAL SHARE TRANSACTIONS (NOTE 7): | |
Proceeds from shares sold | | | 70,694 | | | | 366,929 | | |
Shares issued in reinvestment of distributions | | | 36,362 | | | | 44,336 | | |
Payments for shares redeemed | | | (666,226 | ) | | | (189,524 | ) | |
Net increase (decrease) in net assets from capital share transactions | | | (559,170 | ) | | | 221,741 | | |
TOTAL INCREASE (DECREASE) IN NET ASSETS | | | (453,787 | ) | | | 166,316 | | |
NET ASSETS | |
Beginning of year | | | 2,374,156 | | | | 2,207,840 | | |
End of year | | $ | 1,920,369 | | | $ | 2,374,156 | | |
Annual Report | May 31, 2020
69
Arbitrage Fund – Class R Financial Highlights
Selected Per Share Data and Ratios for a Share Outstanding Throughout the Periods Presented:
| | | Year Ended May 31, | |
| | | 2020 | | 2019 | | 2018 | | 2017 | | 2016 | |
Net asset value,
beginning of period | | $ | 12.92 | | | $ | 12.65 | | | $ | 13.06 | | | $ | 12.78 | | | $ | 12.97 | | |
Income (loss) from
investment operations | |
Net investment income (loss)(a) | | | (0.05 | ) | | | (0.03 | )(c) | | | 0.05 | | | | (0.13 | )(b) | | | (0.06 | ) | |
Net realized and unrealized
gains (losses) on investments
and foreign currencies | | | 0.44 | | | | 0.52 | | | | (0.01 | )(c) | | | 0.53 | (d) | | | 0.17 | | |
Total from investment operations | | | 0.39 | | | | 0.49 | | | | 0.04 | | | | 0.40 | | | | 0.11 | | |
Less distributions | |
From net investment income | | | — | | | | (0.06 | ) | | | (0.09 | ) | | | — | | | | — | | |
From net realized gains | | | (0.27 | ) | | | (0.16 | ) | | | (0.36 | ) | | | (0.12 | ) | | | (0.30 | ) | |
Total distributions | | | (0.27 | ) | | | (0.22 | ) | | | (0.45 | ) | | | (0.12 | ) | | | (0.30 | ) | |
Proceeds from redemption
fees collected | | | — | | | | — | | | | 0.00 | (e) | | | 0.00 | (e) | | | 0.00 | (e) | |
Net asset value, end of period | | $ | 13.04 | | | $ | 12.92 | | | $ | 12.65 | | | $ | 13.06 | | | $ | 12.78 | | |
Total return(f) | | | 3.07 | % | | | 3.89 | % | | | 0.31 | % | | | 3.17 | % | | | 0.87 | % | |
Net assets, end of period
(in 000s) | | $ | 98,715 | | | $ | 163,349 | | | $ | 222,309 | | | $ | 340,353 | | | $ | 433,936 | | |
RATIOS TO AVERAGE
NET ASSETS: | |
Gross expenses(g) | | | 1.66 | % | | | 1.94 | % | | | 1.91 | % | | | 1.87 | %(b) | | | 1.88 | % | |
Net expenses after advisory
fees waived and expenses
reimbursed(g)(h) | | | 1.63 | % | | | 1.93 | % | | | 1.90 | % | | | 1.87 | %(b) | | | 1.88 | % | |
Net investment income (loss) | | | (0.36 | %) | | | (0.20 | %)(c) | | | 0.41 | % | | | (1.00 | %)(b) | | | (0.51 | %) | |
Portfolio turnover rate | | | 273 | % | | | 419 | % | | | 362 | % | | | 363 | % | | | 321 | % | |
(a) Per share amounts were calculated using average shares outstanding for the period.
(b) Includes a non-recurring refund by the custodian for overbilling of prior years' out-of-pocket fees. This amounted to less than $0.01 per share and is less than 0.005% of average net assets.
(c) The amount shown for a share outstanding throughout the period may not correlate with the Statement of Operations for the period due to timing of sales and redemptions of Fund shares in relation to income earned and/or fluctuating market value of the investments of the Fund.
(d) Includes estimated proceeds from the Fund's participation in a class action lawsuit. This represents a non-recurring gain in the amount of $0.01 per share.
(e) Amount rounds to less than $0.01 per share.
(f) Total return is a measure of the change in the value of an investment in the Fund over the years covered, which assumes any dividends or capital gains distributions are reinvested in shares of the Fund. Returns shown do not reflect the deduction of taxes a shareholder would pay on Fund distributions or the redemption of Fund shares.
(g) Dividend expense totaled 0.15%, 0.46%, 0.42%, 0.36% and 0.34% of average net assets for the years ended May 31, 2020, 2019, 2018, 2017 and 2016, respectively. Interest rebate expense and line of credit interest expense totaled 0.01%, 0.00%, 0.01%, 0.03% and 0.07% of average net assets for the years ended May 31, 2020, 2019, 2018, 2017 and 2016, respectively.
(h) Excluding dividend and interest expenses, the Fund's net expenses after advisory fees waived and expenses reimbursed would have been 1.47%, 1.47%, 1.47%, 1.48% and 1.47% of average net assets for the years ended May 31, 2020, 2019, 2018, 2017 and 2016, respectively.
See Notes to Financial Statements.
www.arbitragefunds.com | 1-800-295-4485
70
Arbitrage Fund – Class I Financial Highlights
Selected Per Share Data and Ratios for a Share Outstanding Throughout the Periods Presented:
| | | Year Ended May 31, | |
| | | 2020 | | 2019 | | 2018 | | 2017 | | 2016 | |
Net asset value,
beginning of period | | $ | 13.32 | | | $ | 13.03 | | | $ | 13.46 | | | $ | 13.13 | | | $ | 13.28 | | |
Income (loss) from
investment operations | |
Net investment income (loss)(a) | | | (0.02 | ) | | | 0.01 | | | | 0.05 | | | | (0.10 | )(b) | | | (0.03 | ) | |
Net realized and unrealized
gains on investments and
foreign currencies | | | 0.45 | | | | 0.54 | | | | 0.01 | | | | 0.55 | (c) | | | 0.18 | | |
Total from investment operations | | | 0.43 | | | | 0.55 | | | | 0.06 | | | | 0.45 | | | | 0.15 | | |
Less distributions | |
From net investment income | | | (0.01 | ) | | | (0.10 | ) | | | (0.13 | ) | | | — | | | | — | | |
From net realized gains | | | (0.27 | ) | | | (0.16 | ) | | | (0.36 | ) | | | (0.12 | ) | | | (0.30 | ) | |
Total distributions | | | (0.28 | ) | | | (0.26 | ) | | | (0.49 | ) | | | (0.12 | ) | | | (0.30 | ) | |
Proceeds from redemption
fees collected | | | — | | | | — | | | | 0.00 | (d) | | | 0.00 | (d) | | | 0.00 | (d) | |
Net asset value, end of period | | $ | 13.47 | | | $ | 13.32 | | | $ | 13.03 | | | $ | 13.46 | | | $ | 13.13 | | |
Total return(e) | | | 3.27 | % | | | 4.21 | % | | | 0.50 | % | | | 3.47 | % | | | 1.16 | % | |
Net assets, end of period
(in 000s) | | $ | 1,243,838 | | | $ | 1,546,542 | | | $ | 1,510,598 | | | $ | 1,492,094 | | | $ | 1,395,178 | | |
RATIOS TO AVERAGE
NET ASSETS: | |
Gross expenses(f) | | | 1.41 | % | | | 1.69 | % | | | 1.66 | % | | | 1.62 | %(b) | | | 1.63 | % | |
Net expenses after advisory
fees waived and expenses
reimbursed(f)(g) | | | 1.38 | % | | | 1.68 | % | | | 1.65 | % | | | 1.62 | %(b) | | | 1.63 | % | |
Net investment income (loss) | | | (0.13 | %) | | | 0.06 | % | | | 0.35 | % | | | (0.76 | %)(b) | | | (0.24 | %) | |
Portfolio turnover rate | | | 273 | % | | | 419 | % | | | 362 | % | | | 363 | % | | | 321 | % | |
(a) Per share amounts were calculated using average shares outstanding for the year.
(b) Includes a non-recurring refund by the custodian for overbilling of prior years' out-of-pocket fees. This amounted to less than $0.01 per share and is less than 0.005% of average net assets.
(c) Includes estimated proceeds from the Fund's participation in a class action lawsuit. This represents a non-recurring gain in the amount of $0.01 per share.
(d) Amount rounds to less than $0.01 per share.
(e) Total return is a measure of the change in the value of an investment in the Fund over the years covered, which assumes any dividends or capital gains distributions are reinvested in shares of the Fund. Returns shown do not reflect the deduction of taxes a shareholder would pay on Fund distributions or the redemption of Fund shares.
(f) Dividend expense totaled 0.15%, 0.46%, 0.42%, 0.36% and 0.34% of average net assets for the years ended May 31, 2020, 2019, 2018, 2017 and 2016, respectively. Interest rebate expense and line of credit interest expense totaled 0.01%, 0.00%, 0.01%, 0.03% and 0.07% of average net assets for the years ended May 31, 2020, 2019, 2018, 2017 and 2016, respectively.
(g) Excluding dividend and interest expenses, the Fund's net expenses after advisory fees waived and expenses reimbursed would have been 1.22%, 1.22%, 1.22%, 1.23% and 1.22% of average net assets for the years ended May 31, 2020, 2019, 2018, 2017 and 2016, respectively.
See Notes to Financial Statements.
Annual Report | May 31, 2020
71
Arbitrage Fund – Class C Financial Highlights
Selected Per Share Data and Ratios for a Share Outstanding Throughout the Periods Presented:
| | | Year Ended May 31, | |
| | | 2020 | | 2019 | | 2018 | | 2017 | | 2016 | |
Net asset value,
beginning of period | | $ | 12.34 | | | $ | 12.12 | | | $ | 12.54 | | | $ | 12.37 | | | $ | 12.65 | | |
Income (loss) from
investment operations | |
Net investment loss(a) | | | (0.14 | ) | | | (0.12 | )(b) | | | (0.07 | )(b) | | | (0.22 | )(c) | | | (0.16 | ) | |
Net realized and unrealized
gains on investments and
foreign currencies | | | 0.41 | | | | 0.50 | | | | 0.01 | | | | 0.51 | (d) | | | 0.18 | | |
Total from investment operations | | | 0.27 | | | | 0.38 | | | | (0.06 | ) | | | 0.29 | | | | 0.02 | | |
Less distributions | |
From net investment income | | | — | | | | — | | | | (0.00 | )(e) | | | — | | | | — | | |
From net realized gains | | | (0.27 | ) | | | (0.16 | ) | | | (0.36 | ) | | | (0.12 | ) | | | (0.30 | ) | |
Total distributions | | | (0.27 | ) | | | (0.16 | ) | | | (0.36 | ) | | | (0.12 | ) | | | (0.30 | ) | |
Proceeds from redemption
fees collected | | | — | | | | — | | | | — | | | | — | | | | — | | |
Net asset value, end of period | | $ | 12.34 | | | $ | 12.34 | | | $ | 12.12 | | | $ | 12.54 | | | $ | 12.37 | | |
Total return(f)(g) | | | 2.24 | % | | | 3.11 | % | | | (0.45 | %) | | | 2.38 | % | | | 0.18 | % | |
Net assets, end of period
(in 000s) | | $ | 19,860 | | | $ | 19,050 | | | $ | 22,917 | | | $ | 26,900 | | | $ | 30,814 | | |
RATIOS TO AVERAGE
NET ASSETS: | |
Gross expenses(h) | | | 2.41 | % | | | 2.69 | % | | | 2.66 | % | | | 2.62 | %(c) | | | 2.63 | % | |
Net expenses after advisory
fees waived and expenses
reimbursed(h)(i) | | | 2.38 | % | | | 2.68 | % | | | 2.65 | % | | | 2.62 | %(c) | | | 2.63 | % | |
Net investment loss | | | (1.16 | %) | | | (0.94 | %)(b) | | | (0.56 | %) | | | (1.76 | %)(c) | | | (1.28 | %) | |
Portfolio turnover rate | | | 273 | % | | | 419 | % | | | 362 | % | | | 363 | % | | | 321 | % | |
(a) Per share amounts were calculated using average shares outstanding for the year.
(b) The amount shown for a share outstanding throughout the period may not correlate with the Statement of Operations for the period due to timing of sales and redemptions of Fund shares in relation to income earned and/or fluctuating market value of the investments of the Fund.
(c) Includes a non-recurring refund by the custodian for overbilling of prior years' out-of-pocket fees. This amounted to less than $0.01 per share and is less than 0.005% of average net assets.
(d) Includes estimated proceeds from the Fund's participation in a class action lawsuit. This represents a non-recurring gain in the amount of $0.01 per share.
(e) Amount rounds to less than $0.01 per share.
(f) Total return is a measure of the change in the value of an investment in the Fund over the years covered, which assumes any dividends or capital gains distributions are reinvested in shares of the Fund. Returns shown do not reflect the deduction of taxes a shareholder would pay on Fund distributions or the redemption of Fund shares.
(g) Total return excludes sales charges, if any, and would be lower for the period presented if it reflected these charges.
(h) Dividend expense totaled 0.15%, 0.46%, 0.42%, 0.36% and 0.34% of average net assets for the years ended May 31, 2020, 2019, 2018, 2017 and 2016, respectively. Interest rebate expense and line of credit interest expense totaled 0.01%, 0.00%, 0.01%, 0.03% and 0.07% of average net assets for the years ended May 31, 2020, 2019, 2018, 2017 and 2016, respectively.
(i) Excluding dividend and interest expenses, the Fund's net expenses after advisory fees waived and expenses reimbursed would have been 2.22%, 2.22%, 2.22%, 2.23% and 2.22% of average net assets for the years ended May 31, 2020, 2019, 2018, 2017 and 2016, respectively.
See Notes to Financial Statements.
www.arbitragefunds.com | 1-800-295-4485
72
Arbitrage Fund – Class A Financial Highlights
Selected Per Share Data and Ratios for a Share Outstanding Throughout the Periods Presented:
| | | Year Ended May 31, | |
| | | 2020 | | 2019 | | 2018 | | 2017 | | 2016 | |
Net asset value,
beginning of period | | $ | 12.90 | | | $ | 12.63 | | | $ | 13.07 | | | $ | 12.79 | | | $ | 12.97 | | |
Income (loss) from
investment operations | |
Net investment income (loss)(a) | | | (0.05 | ) | | | (0.02 | )(d) | | | — | (b) | | | (0.13 | )(c) | | | (0.07 | ) | |
Net realized and unrealized
gains on investments and
foreign currencies | | | 0.43 | | | | 0.52 | | | | 0.02 | | | | 0.53 | (e) | | | 0.19 | | |
Total from investment operations | | | 0.38 | | | | 0.50 | | | | 0.02 | | | | 0.40 | | | | 0.12 | | |
Less distributions | |
From net investment income | | | — | | | | (0.07 | ) | | | (0.10 | ) | | | — | | | | — | | |
From net realized gains | | | (0.27 | ) | | | (0.16 | ) | | | (0.36 | ) | | | (0.12 | ) | | | (0.30 | ) | |
Total distributions | | | (0.27 | ) | | | (0.23 | ) | | | (0.46 | ) | | | (0.12 | ) | | | (0.30 | ) | |
Proceeds from redemption
fees collected | | | — | | | | — | | | | — | | | | — | | | | — | | |
Net asset value, end of period | | $ | 13.01 | | | $ | 12.90 | | | $ | 12.63 | | | $ | 13.07 | | | $ | 12.79 | | |
Total return(f)(g) | | | 3.00 | % | | | 3.94 | % | | | 0.21 | % | | | 3.17 | % | | | 0.95 | % | |
Net assets, end of period
(in 000s) | | $ | 17,762 | | | $ | 18,341 | | | $ | 16,740 | | | $ | 10,012 | | | $ | 8,421 | | |
RATIOS TO AVERAGE
NET ASSETS: | |
Gross expenses(h) | | | 1.66 | % | | | 1.94 | % | | | 1.91 | % | | | 1.87 | %(c) | | | 1.87 | % | |
Net expenses after advisory
fees waived and expenses
reimbursed(h)(i) | | | 1.63 | % | | | 1.93 | % | | | 1.90 | % | | | 1.87 | %(c) | | | 1.87 | % | |
Net investment loss | | | (0.40 | %) | | | (0.19 | %)(d) | | | (0.01 | %) | | | (1.02 | %)(c) | | | (0.56 | %) | |
Portfolio turnover rate | | | 273 | % | | | 419 | % | | | 362 | % | | | 363 | % | | | 321 | % | |
(a) Per share amounts were calculated using average shares outstanding for the year.
(b) Amount rounds to less than $0.01 per share.
(c) Includes a non-recurring refund by the custodian for overbilling of prior years' out-of-pocket fees. This amounted to less than $0.01 per share and is less than 0.005% of average net assets.
(d) The amount shown for a share outstanding throughout the period may not correlate with the Statement of Operations for the period due to timing of sales and redemptions of Fund shares in relation to income earned and/or fluctuating market value of the investments of the Fund.
(e) Includes estimated proceeds from the Fund's participation in a class action lawsuit. This represents a non-recurring gain in the amount of $0.01 per share.
(f) Total return is a measure of the change in the value of an investment in the Fund over the years covered, which assumes any dividends or capital gains distributions are reinvested in shares of the Fund. Returns shown do not reflect the deduction of taxes a shareholder would pay on Fund distributions or the redemption of Fund shares.
(g) Total return excludes sales charges, if any, and would be lower for the period presented if it reflected these charges.
(h) Dividend expense totaled 0.15%, 0.46%, 0.42%, 0.36% and 0.33% of average net assets for the years ended May 31, 2020, 2019, 2018, 2017 and 2016, respectively. Interest rebate expense and line of credit interest expense totaled 0.01%, 0.00%, 0.01%, 0.03% and 0.07% of average net assets for the years ended May 31, 2020, 2019, 2018, 2017 and 2016, respectively.
(i) Excluding dividend and interest expenses, the Fund's net expenses after advisory fees waived and expenses reimbursed would have been 1.47%, 1.47%, 1.47%, 1.48% and 1.47% of average net assets for the years ended May 31, 2020, 2019, 2018, 2017 and 2016, respectively.
See Notes to Financial Statements.
Annual Report | May 31, 2020
73
Water Island Diversified Event-Driven Fund – Class R Financial Highlights
Selected Per Share Data and Ratios for a Share Outstanding Throughout the Periods Presented:
| | | Year Ended May 31, | |
| | | 2020 | | 2019 | | 2018 | | 2017 | | 2016 | |
Net asset value,
beginning of period | | $ | 9.47 | | | $ | 9.46 | | | $ | 9.34 | | | $ | 8.98 | | | $ | 9.73 | | |
Income (loss) from
investment operations | |
Net investment income (loss)(a) | | | 0.01 | | | | 0.07 | | | | 0.06 | | | | (0.04 | )(b) | | | (0.02 | ) | |
Net realized and unrealized
gains (losses) on investments
and foreign currencies | | | 0.51 | | | | 0.08 | | | | 0.09 | | | | 0.40 | (c) | | | (0.53 | ) | |
Total from investment operations | | | 0.52 | | | | 0.15 | | | | 0.15 | | | | 0.36 | | | | (0.55 | ) | |
Less distributions | |
From net investment income | | | (0.02 | ) | | | (0.14 | ) | | | (0.03 | ) | | | — | | | | (0.20 | ) | |
From net realized gains | | | — | | | | — | | | | — | | | | — | | | | (0.00 | )(d) | |
Total distributions | | | (0.02 | ) | | | (0.14 | ) | | | (0.03 | ) | | | — | | | | (0.20 | ) | |
Proceeds from redemption
fees collected | | | — | | | | — | | | | 0.00 | (d) | | | 0.00 | (d) | | | 0.00 | (d) | |
Net asset value, end of period | | $ | 9.97 | | | $ | 9.47 | | | $ | 9.46 | | | $ | 9.34 | | | $ | 8.98 | | |
Total return(e) | | | 5.49 | % | | | 1.60 | % | | | 1.56 | % | | | 4.01 | % | | | (5.55 | %) | |
Net assets, end of period
(in 000s) | | $ | 7,694 | | | $ | 30,423 | | | $ | 45,383 | | | $ | 70,277 | | | $ | 80,114 | | |
RATIOS TO AVERAGE
NET ASSETS: | |
Gross expenses(f) | | | 2.11 | % | | | 2.58 | % | | | 2.59 | % | | | 2.56 | %(b) | | | 2.62 | % | |
Net expenses after advisory
fees waived and expenses
reimbursed(f)(g) | | | 1.83 | % | | | 2.18 | % | | | 2.16 | % | | | 2.26 | % | | | 2.46 | % | |
Net investment income (loss) | | | 0.09 | % | | | 0.70 | % | | | 0.58 | % | | | (0.45 | %)(b) | | | (0.27 | %) | |
Portfolio turnover rate | | | 397 | % | | | 504 | % | | | 421 | % | | | 409 | % | | | 350 | % | |
(a) Per share amounts were calculated using average shares outstanding for the period.
(b) Includes a non-recurring refund by the custodian for overbilling of prior years' out-of-pocket fees. This amounted to less than $0.01 per share and 0.01% of average net assets.
(c) Includes estimated proceeds from the Fund's participation in a class action lawsuit. This represents a non-recurring gain in the amount of less than $0.005 per share.
(d) Amount rounds to less than $0.01 per share.
(e) Total return is a measure of the change in the value of an investment in the Fund over the years covered, which assumes any dividends or capital gains distributions are reinvested in shares of the Fund. Returns shown do not reflect the deduction of taxes a shareholder would pay on Fund distributions or the redemption of Fund shares.
(f) Dividend expense totaled 0.13%, 0.46%, 0.44%, 0.53% and 0.58% of average net assets for the years ended May 31, 2020, 2019, 2018, 2017 and 2016, respectively. Interest rebate expense and line of credit interest expense totaled 0.01%, 0.03%, 0.03%, 0.04% and 0.19% of average net assets for the years ended May 31, 2020, 2019, 2018, 2017 and 2016, respectively.
(g) Excluding dividend and interest expenses, the Fund's net expenses after advisory fees waived and expenses reimbursed would have been 1.69%, 1.69%, 1.69%, 1.69% and 1.69% of average net assets for the years ended May 31, 2020, 2019, 2018, 2017 and 2016, respectively.
See Notes to Financial Statements.
www.arbitragefunds.com | 1-800-295-4485
74
Water Island Diversified Event-Driven Fund – Class I Financial Highlights
Selected Per Share Data and Ratios for a Share Outstanding Throughout the Periods Presented:
| | | Year Ended May 31, | |
| | | 2020 | | 2019 | | 2018 | | 2017 | | 2016 | |
Net asset value,
beginning of period | | $ | 9.54 | | | $ | 9.53 | | | $ | 9.43 | | | $ | 9.04 | | | $ | 9.81 | | |
Income (loss) from
investment operations | |
Net investment income (loss)(a) | | | 0.02 | | | | 0.09 | | | | 0.04 | | | | (0.02 | )(b) | | | (0.02 | ) | |
Net realized and unrealized
gains (losses) on investments
and foreign currencies | | | 0.53 | | | | 0.09 | | | | 0.12 | | | | 0.41 | (c) | | | (0.51 | ) | |
Total from investment operations | | | 0.55 | | | | 0.18 | | | | 0.16 | | | | 0.39 | | | | (0.53 | ) | |
Less distributions | |
From net investment income | | | (0.04 | ) | | | (0.17 | ) | | | (0.06 | ) | | | — | | | | (0.24 | ) | |
From net realized gains | | | — | | | | — | | | | — | | | | — | | | | (0.00 | )(d) | |
Total distributions | | | (0.04 | ) | | | (0.17 | ) | | | (0.06 | ) | | | — | | | | (0.24 | ) | |
Proceeds from redemption
fees collected | | | — | | | | — | | | | 0.00 | (d) | | | 0.00 | (d) | | | 0.00 | (d) | |
Net asset value, end of period | | $ | 10.05 | | | $ | 9.54 | | | $ | 9.53 | | | $ | 9.43 | | | $ | 9.04 | | |
Total return(e) | | | 5.83 | % | | | 1.88 | % | | | 1.69 | % | | | 4.31 | % | | | (5.27 | %) | |
Net assets, end of period
(in 000s) | | $ | 99,069 | | | $ | 92,710 | | | $ | 103,001 | | | $ | 68,272 | | | $ | 95,155 | | |
RATIOS TO AVERAGE
NET ASSETS: | |
Gross expenses(f) | | | 1.86 | % | | | 2.33 | % | | | 2.34 | % | | | 2.31 | %(b) | | | 2.37 | % | |
Net expenses after advisory
fees waived and expenses
reimbursed(f)(g) | | | 1.58 | % | | | 1.93 | % | | | 1.91 | % | | | 2.01 | % | | | 2.21 | % | |
Net investment income (loss) | | | 0.20 | % | | | 0.92 | % | | | 0.46 | % | | | (0.22 | %)(b) | | | (0.26 | %) | |
Portfolio turnover rate | | | 397 | % | | | 504 | % | | | 421 | % | | | 409 | % | | | 350 | % | |
(a) Per share amounts were calculated using average shares outstanding for the year.
(b) Includes a non-recurring refund by the custodian for overbilling of prior years' out-of-pocket fees. This amounted to less than $0.01 per share and 0.01% of average net assets.
(c) Includes estimated proceeds from the Fund's participation in a class action lawsuit. This represents a non-recurring gain in the amount of less than $0.005 per share.
(d) Amount rounds to less than $0.01 per share.
(e) Total return is a measure of the change in the value of an investment in the Fund over the years covered, which assumes any dividends or capital gains distributions are reinvested in shares of the Fund. Returns shown do not reflect the deduction of taxes a shareholder would pay on Fund distributions or the redemption of Fund shares.
(f) Dividend expense totaled 0.13%, 0.46%, 0.44%, 0.53% and 0.58% of average net assets for the years ended May 31, 2020, 2019, 2018, 2017 and 2016, respectively. Interest rebate expense and line of credit interest expense totaled 0.01%, 0.03%, 0.03%, 0.04% and 0.19% of average net assets for the years ended May 31, 2020, 2019, 2018, 2017 and 2016, respectively.
(g) Excluding dividend and interest expenses, the Fund's net expenses after advisory fees waived and expenses reimbursed would have been 1.44%, 1.44%, 1.44%, 1.44% and 1.44% of average net assets for the years ended May 31, 2020, 2019, 2018, 2017 and 2016, respectively.
See Notes to Financial Statements.
Annual Report | May 31, 2020
75
Water Island Diversified Event-Driven Fund – Class C Financial Highlights
Selected Per Share Data and Ratios for a Share Outstanding Throughout the Periods Presented:
| | | Year Ended May 31, | |
| | | 2020 | | 2019 | | 2018 | | 2017 | | 2016 | |
Net asset value,
beginning of period | | $ | 9.29 | | | $ | 9.26 | | | $ | 9.19 | | | $ | 8.91 | | | $ | 9.62 | | |
Income (loss) from
investment operations | |
Net investment loss(a) | | | (0.08 | )(d) | | | (0.01 | ) | | | (0.03 | )(b) | | | (0.11 | )(c) | | | (0.09 | ) | |
Net realized and unrealized
gains (losses) on investments
and foreign currencies | | | 0.52 | | | | 0.09 | | | | 0.10 | | | | 0.39 | (e) | | | (0.50 | ) | |
Total from investment operations | | | 0.44 | | | | 0.08 | | | | 0.07 | | | | 0.28 | | | | (0.59 | ) | |
Less distributions | |
From net investment income | | | — | | | | (0.05 | ) | | | — | | | | — | | | | (0.12 | ) | |
From net realized gains | | | — | | | | — | | | | — | | | | — | | | | (0.00 | )(f) | |
Total distributions | | | — | | | | (0.05 | ) | | | — | | | | — | | | | (0.12 | ) | |
Net asset value, end of period | | $ | 9.73 | | | $ | 9.29 | | | $ | 9.26 | | | $ | 9.19 | | | $ | 8.91 | | |
Total return(g)(h) | | | 4.74 | % | | | 0.91 | % | | | 0.76 | % | | | 3.14 | % | | | (6.14 | %) | |
Net assets, end of period
(in 000s) | | $ | 369 | | | $ | 794 | | | $ | 1,175 | | | $ | 1,567 | | | $ | 2,538 | | |
RATIOS TO AVERAGE
NET ASSETS: | |
Gross expenses(i) | | | 2.86 | % | | | 3.33 | % | | | 3.34 | % | | | 3.31 | %(c) | | | 3.37 | % | |
Net expenses after advisory
fees waived and expenses
reimbursed(i)(j) | | | 2.58 | % | | | 2.93 | % | | | 2.91 | % | | | 3.01 | % | | | 3.21 | % | |
Net investment loss | | | (0.89 | %) | | | (0.06 | %) | | | (0.34 | %) | | | (1.26 | %)(c) | | | (0.95 | %) | |
Portfolio turnover rate | | | 397 | % | | | 504 | % | | | 421 | % | | | 409 | % | | | 350 | % | |
(a) Per share amounts were calculated using average shares outstanding for the year.
(b) The amount shown for a share outstanding throughout the period may not correlate with the Statement of Operations for the period due to timing of sales and redemptions of Fund shares in relation to income earned and/or fluctuating market value of the investments of the Fund.
(c) Includes a non-recurring refund by the custodian for overbilling of prior years' out-of-pocket fees. This amounted to less than $0.01 per share and 0.01% of average net assets.
(d) The amount shown for a share outstanding throughout the period may not correlate with the Statement of Operations for the period due to class specific expenses.
(e) Includes estimated proceeds from the Fund's participation in a class action lawsuit. This represents a non-recurring gain in the amount of less than $0.005 per share.
(f) Amount rounds to less than $0.01 per share.
(g) Total return is a measure of the change in the value of an investment in the Fund over the years covered, which assumes any dividends or capital gains distributions are reinvested in shares of the Fund. Returns shown do not reflect the deduction of taxes a shareholder would pay on Fund distributions or the redemption of Fund shares.
(h) Total return excludes sales charges, if any, and would be lower for the period presented if it reflected these charges.
(i) Dividend expense totaled 0.13%, 0.46%, 0.44%, 0.53% and 0.59% of average net assets for the years ended May 31, 2020, 2019, 2018, 2017 and 2016, respectively. Interest rebate expense and line of credit interest expense totaled 0.01%, 0.03%, 0.03%, 0.04% and 0.18% of average net assets for the years ended May 31, 2020, 2019, 2018, 2017 and 2016, respectively.
(j) Excluding dividend and interest expenses, the Fund's net expenses after advisory fees waived and expenses reimbursed would have been 2.44%, 2.44%, 2.44%, 2.44% and 2.44% of average net assets for the years ended May 31, 2020, 2019, 2018, 2017 and 2016, respectively.
See Notes to Financial Statements.
www.arbitragefunds.com | 1-800-295-4485
76
Water Island Diversified Event-Driven Fund – Class A Financial Highlights
Selected Per Share Data and Ratios for a Share Outstanding Throughout the Periods Presented:
| | | Year Ended May 31, | |
| | | 2020 | | 2019 | | 2018 | | 2017 | | 2016 | |
Net asset value,
beginning of period | | $ | 9.46 | | | $ | 9.46 | | | $ | 9.35 | | | $ | 8.98 | | | $ | 9.73 | | |
Income (loss) from
investment operations | |
Net investment income (loss)(a) | | | (0.00 | )(d) | | | 0.06 | | | | 0.04 | | | | (0.05 | )(b) | | | (0.03 | ) | |
Net realized and unrealized
gains (losses) on investments
and foreign currencies | | | 0.53 | | | | 0.08 | | | | 0.10 | | | | 0.42 | (c) | | | (0.52 | ) | |
Total from investment operations | | | 0.53 | | | | 0.14 | | | | 0.14 | | | | 0.37 | | | | (0.55 | ) | |
Less distributions | |
From net investment income | | | (0.02 | ) | | | (0.14 | ) | | | (0.03 | ) | | | — | | | | (0.20 | ) | |
From net realized gains | | | — | | | | — | | | | — | | | | — | | | | (0.00 | )(d) | |
Total distributions | | | (0.02 | ) | | | (0.14 | ) | | | (0.03 | ) | | | — | | | | (0.20 | ) | |
Proceeds from redemption
fees collected | | | — | | | | — | | | | — | | | | — | | | | — | | |
Net asset value, end of period | | $ | 9.97 | | | $ | 9.46 | | | $ | 9.46 | | | $ | 9.35 | | | $ | 8.98 | | |
Total return(e)(f) | | | 5.62 | % | | | 1.56 | % | | | 1.49 | % | | | 4.12 | % | | | (5.54 | %) | |
Net assets, end of period
(in 000s) | | $ | 347 | | | $ | 799 | | | $ | 701 | | | $ | 810 | | | $ | 2,062 | | |
RATIOS TO AVERAGE
NET ASSETS: | |
Gross expenses(g) | | | 2.11 | % | | | 2.58 | % | | | 2.59 | % | | | 2.56 | %(b) | | | 2.63 | % | |
Net expenses after advisory
fees waived and expenses
reimbursed(g)(h) | | | 1.83 | % | | | 2.18 | % | | | 2.16 | % | | | 2.26 | % | | | 2.47 | % | |
Net investment income (loss) | | | 0.02 | % | | | 0.65 | % | | | 0.41 | % | | | (0.53 | %)(b) | | | (0.28 | %) | |
Portfolio turnover rate | | | 397 | % | | | 504 | % | | | 421 | % | | | 409 | % | | | 350 | % | |
(a) Per share amounts were calculated using average shares outstanding for the year.
(b) Includes a non-recurring refund by the custodian for overbilling of prior years' out-of-pocket fees. This amounted to less than $0.01 per share and 0.01% of average net assets.
(c) Includes estimated proceeds from the Fund's participation in a class action lawsuit. This represents a non-recurring gain in the amount of less than $0.005 per share.
(d) Amount rounds to less than $0.01 per share.
(e) Total return excludes sales charges, if any, and would be lower for the period presented if it reflected these charges.
(f) Total return is a measure of the change in the value of an investment in the Fund over the years covered, which assumes any dividends or capital gains distributions are reinvested in shares of the Fund. Returns shown do not reflect the deduction of taxes a shareholder would pay on Fund distributions or the redemption of Fund shares or the imposition of any sales load.
(g) Dividend expense totaled 0.13%, 0.46%, 0.44%, 0.53% and 0.59% of average net assets for the years ended May 31, 2020, 2019, 2018, 2017 and 2016, respectively. Interest rebate expense and line of credit interest expense totaled 0.01%, 0.03%, 0.03%, 0.04% and 0.19% of average net assets for the years ended May 31, 2020, 2019, 2018, 2017 and 2016, respectively.
(h) Excluding dividend and interest expenses, the Fund's net expenses after advisory fees waived and expenses reimbursed would have been 1.69%, 1.69%, 1.69%, 1.69% and 1.69% of average net assets for the years ended May 31, 2020, 2019, 2018, 2017 and 2016, respectively.
See Notes to Financial Statements.
Annual Report | May 31, 2020
77
Water Island Credit Opportunities Fund – Class R Financial Highlights
Selected Per Share Data and Ratios for a Share Outstanding Throughout the Periods Presented:
| | | Year Ended May 31, | |
| | | 2020 | | 2019 | | 2018 | | 2017 | | 2016 | |
Net asset value,
beginning of period | | $ | 9.70 | | | $ | 9.77 | | | $ | 9.67 | | | $ | 9.69 | | | $ | 9.95 | | |
Income (loss) from
investment operations | |
Net investment income(a) | | | 0.24 | | | | 0.31 | | | | 0.20 | | | | 0.23 | (b) | | | 0.25 | | |
Net realized and unrealized
gains (losses) on investments
and foreign currencies | | | (0.01 | ) | | | (0.07 | ) | | | 0.12 | | | | 0.01 | | | | (0.24 | ) | |
Total from investment operations | | | 0.23 | | | | 0.24 | | | | 0.32 | | | | 0.24 | | | | 0.01 | | |
Less distributions | |
From net investment income | | | (0.29 | ) | | | (0.31 | ) | | | (0.22 | ) | | | (0.26 | ) | | | (0.27 | ) | |
Total distributions | | | (0.29 | ) | | | (0.31 | ) | | | (0.22 | ) | | | (0.26 | ) | | | (0.27 | ) | |
Proceeds from redemption
fees collected | | | — | | | | — | | | | — | | | | 0.00 | (c) | | | — | | |
Net asset value, end of period | | $ | 9.64 | | | $ | 9.70 | | | $ | 9.77 | | | $ | 9.67 | | | $ | 9.69 | | |
Total return(d) | | | 2.46 | % | | | 2.55 | % | | | 3.21 | % | | | 2.58 | % | | | 0.10 | % | |
Net assets, end of period
(in 000s) | | $ | 3,673 | | | $ | 7,845 | | | $ | 9,533 | | | $ | 11,935 | | | $ | 12,426 | | |
RATIOS TO AVERAGE
NET ASSETS: | |
Gross expenses(e) | | | 1.96 | % | | | 2.10 | %(f) | | | 2.27 | % | | | 1.96 | %(b) | | | 1.92 | % | |
Net expenses after advisory
fees waived and expenses
reimbursed(e)(g) | | | 1.35 | % | | | 1.59 | %(f) | | | 1.95 | % | | | 1.66 | % | | | 1.67 | % | |
Net investment income | | | 2.48 | % | | | 3.18 | %(f) | | | 2.09 | % | | | 2.34 | %(b) | | | 2.62 | % | |
Portfolio turnover rate | | | 175 | % | | | 221 | % | | | 314 | % | | | 211 | % | | | 181 | % | |
(a) Per share amounts were calculated using average shares outstanding for the period.
(b) Includes a non-recurring refund by the custodian for overbilling of prior years' out-of-pocket fees. This amounted to less than $0.01 per share and is less than 0.005% of average net assets.
(c) Amount rounds to less than $0.01 per share.
(d) Total return is a measure of the change in the value of an investment in the Fund over the years covered, which assumes any dividends or capital gains distributions are reinvested in shares of the Fund. Returns shown do not reflect the deduction of taxes a shareholder would pay on Fund distributions or the redemption of Fund shares.
(e) Dividend expense totaled 0.07%, 0.29%, 0.42%, 0.16% and 0.03% of average net assets for the years ended May 31, 2020, 2019, 2018, 2017 and 2016, respectively. Interest rebate expense and line of credit interest expense totaled 0.05%, 0.01%, 0.03%, 0.00% and 0.14% of average net assets for the years ended May 31, 2020, 2019, 2018, 2017 and 2016, respectively.
(f) Effective August 6, 2018, the investment adviser reduced the advisory fee paid by the Fund and agreed to increase the expense reimbursements it provides to the Fund by contractually limiting the Fund's total expenses (other than certain expenses noted in the Notes to Financial Statements) to 1.23% for Class R shares. Prior to August 6, 2018, the expense limitation had been 1.50%
(g) Excluding dividend and interest expenses, the Fund's net expenses after advisory fees waived and expenses reimbursed would have been 1.23%, 1.29%, 1.50%, 1.50% and 1.50% of average net assets for the years ended May 31, 2020, 2019, 2018, 2017 and 2016, respectively.
See Notes to Financial Statements.
www.arbitragefunds.com | 1-800-295-4485
78
Water Island Credit Opportunities Fund – Class I Financial Highlights
Selected Per Share Data and Ratios for a Share Outstanding Throughout the Periods Presented:
| | | Year Ended May 31, | |
| | | 2020 | | 2019 | | 2018 | | 2017 | | 2016 | |
Net asset value,
beginning of period | | $ | 9.65 | | | $ | 9.73 | | | $ | 9.65 | | | $ | 9.67 | | | $ | 9.93 | | |
Income (loss) from
investment operations | |
Net investment income(a) | | | 0.26 | | | | 0.34 | | | | 0.23 | | | | 0.25 | (b) | | | 0.27 | | |
Net realized and unrealized
gains (losses) on investments
and foreign currencies | | | 0.01 | (c) | | | (0.08 | ) | | | 0.11 | | | | 0.02 | | | | (0.24 | ) | |
Total from investment operations | | | 0.27 | | | | 0.26 | | | | 0.34 | | | | 0.27 | | | | 0.03 | | |
Less distributions | |
From net investment income | | | (0.32 | ) | | | (0.34 | ) | | | (0.26 | ) | | | (0.29 | ) | | | (0.29 | ) | |
Total distributions | | | (0.32 | ) | | | (0.34 | ) | | | (0.26 | ) | | | (0.29 | ) | | | (0.29 | ) | |
Proceeds from redemption
fees collected | | | — | | | | — | | | | — | | | | — | | | | — | | |
Net asset value, end of period | | $ | 9.60 | | | $ | 9.65 | | | $ | 9.73 | | | $ | 9.65 | | | $ | 9.67 | | |
Total return(d) | | | 2.82 | % | | | 2.70 | % | | | 3.61 | % | | | 2.78 | % | | | 0.30 | % | |
Net assets, end of period
(in 000s) | | $ | 56,869 | | | $ | 49,795 | | | $ | 36,207 | | | $ | 44,159 | | | $ | 41,992 | | |
RATIOS TO AVERAGE
NET ASSETS: | |
Gross expenses(e) | | | 1.71 | % | | | 1.85 | %(f) | | | 2.02 | % | | | 1.71 | %(b) | | | 1.68 | % | |
Net expenses after advisory
fees waived and expenses
reimbursed(e)(g) | | | 1.10 | % | | | 1.32 | %(f) | | | 1.70 | % | | | 1.41 | % | | | 1.43 | % | |
Net investment income | | | 2.73 | % | | | 3.51 | %(f) | | | 2.34 | % | | | 2.62 | %(b) | | | 2.84 | % | |
Portfolio turnover rate | | | 175 | % | | | 221 | % | | | 314 | % | | | 211 | % | | | 181 | % | |
(a) Per share amounts were calculated using average shares outstanding for the year.
(b) Includes a non-recurring refund by the custodian for overbilling of prior years' out-of-pocket fees. This amounted to less than $0.01 per share and is less than 0.005% of average net assets.
(c) The amount shown for a share outstanding throughout the period may not correlate with the Statement of Operations for the period due to timing of sales and redemptions of Fund shares in relation to income earned and/or fluctuating market value of the investments of the Fund.
(d) Total return is a measure of the change in the value of an investment in the Fund over the years covered, which assumes any dividends or capital gains distributions are reinvested in shares of the Fund. Returns shown do not reflect the deduction of taxes a shareholder would pay on Fund distributions or the redemption of Fund shares.
(e) Dividend expense totaled 0.07%, 0.29%, 0.42% 0.16% and 0.04% of average net assets for the years ended May 31, 2020, 2019, 2018, 2017 and 2016, respectively. Interest rebate expense and line of credit interest expense totaled 0.05%, 0.01%, 0.03%, 0.00% and 0.14% of average net assets for the years ended May 31, 2020, 2019, 2018, 2017 and 2016, respectively.
(f) Effective August 6, 2018, the investment adviser reduced the advisory fee paid by the Fund and agreed to increase the expense reimbursements it provides to the Fund by contractually limiting the Fund's total expenses (other than certain expenses noted in the Notes to Financial Statements) to 0.98% for Class I shares. Prior to August 6, 2018, the expense limitation had been 1.25%
(g) Excluding dividend and interest expenses, the Fund's net expenses after advisory fees waived and expenses reimbursed would have been 0.98%, 1.02%, 1.25%, 1.25% and 1.25% of average net assets for the years ended May 31, 2020, 2019, 2018, 2017 and 2016, respectively.
See Notes to Financial Statements.
Annual Report | May 31, 2020
79
Water Island Credit Opportunities Fund – Class C Financial Highlights
Selected Per Share Data and Ratios for a Share Outstanding Throughout the Periods Presented:
| | | Year Ended May 31, | |
| | | 2020 | | 2019 | | 2018 | | 2017 | | 2016 | |
Net asset value,
beginning of period | | $ | 9.67 | | | $ | 9.74 | | | $ | 9.62 | | | $ | 9.61 | | | $ | 9.89 | | |
Income (loss) from
investment operations | |
Net investment income(a) | | | 0.16 | | | | 0.24 | | | | 0.13 | | | | 0.16 | (b) | | | 0.18 | | |
Net realized and unrealized
gains (losses) on investments
and foreign currencies | | | 0.00 | (c) | | | (0.07 | ) | | | 0.11 | | | | 0.02 | | | | (0.25 | ) | |
Total from investment operations | | | 0.16 | | | | 0.17 | | | | 0.24 | | | | 0.18 | | | | (0.07 | ) | |
Less distributions | |
From net investment income | | | (0.22 | ) | | | (0.24 | ) | | | (0.12 | ) | | | (0.17 | ) | | | (0.21 | ) | |
Total distributions | | | (0.22 | ) | | | (0.24 | ) | | | (0.12 | ) | | | (0.17 | ) | | | (0.21 | ) | |
Net asset value, end of period | | $ | 9.61 | | | $ | 9.67 | | | $ | 9.74 | | | $ | 9.62 | | | $ | 9.61 | | |
Total return(d)(e) | | | 1.70 | % | | | 1.79 | % | | | 2.53 | % | | | 1.83 | % | | | (0.72 | %) | |
Net assets, end of period
(in 000s) | | $ | 659 | | | $ | 468 | | | $ | 640 | | | $ | 1,053 | | | $ | 1,220 | | |
RATIOS TO AVERAGE
NET ASSETS: | |
Gross expenses(f) | | | 2.71 | % | | | 2.86 | %(g) | | | 3.02 | % | | | 2.71 | %(b) | | | 2.68 | % | |
Net expenses after advisory
fees waived and expenses
reimbursed(f)(h) | | | 2.10 | % | | | 2.34 | %(g) | | | 2.70 | % | | | 2.41 | % | | | 2.43 | % | |
Net investment income | | | 1.65 | % | | | 2.46 | %(g) | | | 1.38 | % | | | 1.69 | %(b) | | | 1.92 | % | |
Portfolio turnover rate | | | 175 | % | | | 221 | % | | | 314 | % | | | 211 | % | | | 181 | % | |
(a) Per share amounts were calculated using average shares outstanding for the year.
(b) Includes a non-recurring refund by the custodian for overbilling of prior years' out-of-pocket fees. This amounted to less than $0.01 per share and is less than 0.005% of average net assets.
(c) Amount rounds to less than $0.01 per share.
(d) Total return is a measure of the change in the value of an investment in the Fund over the years covered, which assumes any dividends or capital gains distributions are reinvested in shares of the Fund. Returns shown do not reflect the deduction of taxes a shareholder would pay on Fund distributions or the redemption of Fund shares.
(e) Total return excludes sales charges, if any, and would be lower for the period presented if it reflected these charges.
(f) Dividend expense totaled 0.07%, 0.29%, 0.42%, 0.16% and 0.04% of average net assets for the years ended May 31, 2020, 2019, 2018, 2017 and 2016, respectively. Interest rebate expense and line of credit interest expense totaled 0.05%, 0.01%, 0.03%, 0.00% and 0.14% of average net assets for the years ended May 31, 2020, 2019, 2018, 2017 and 2016, respectively.
(g) Effective August 6, 2018, the investment adviser reduced the advisory fee paid by the Fund and agreed to increase the expense reimbursements it provides to the Fund by contractually limiting the Fund's total expenses (other than certain expenses noted in the Notes to Financial Statements) to 1.98% for Class C shares. Prior to August 6, 2018, the expense limitation had been 2.25%.
(h) Excluding dividend and interest expenses, the Fund's net expenses after advisory fees waived and expenses reimbursed would have been 1.98%, 2.04%, 2.25%, 2.25% and 2.25% of average net assets for the years ended May 31, 2020, 2019, 2018, 2017 and 2016, respectively.
See Notes to Financial Statements.
www.arbitragefunds.com | 1-800-295-4485
80
Water Island Credit Opportunities Fund – Class A Financial Highlights
Selected Per Share Data and Ratios for a Share Outstanding Throughout the Periods Presented:
| | | Year Ended May 31, | |
| | | 2020 | | 2019 | | 2018 | | 2017 | | 2016 | |
Net asset value,
beginning of period | | $ | 9.65 | | | $ | 9.73 | | | $ | 9.66 | | | $ | 9.67 | | | $ | 9.93 | | |
Income (loss) from
investment operations | |
Net investment income(a) | | | 0.23 | | | | 0.31 | | | | 0.17 | | | | 0.23 | (b) | | | 0.25 | | |
Net realized and unrealized
gains (losses) on investments
and foreign currencies | | | 0.01 | (c) | | | (0.08 | ) | | | 0.14 | | | | 0.02 | | | | (0.25 | ) | |
Total from investment operations | | | 0.24 | | | | 0.23 | | | | 0.31 | | | | 0.25 | | | | — | | |
Less distributions | |
From net investment income | | | (0.29 | ) | | | (0.31 | ) | | | (0.24 | ) | | | (0.26 | ) | | | (0.26 | ) | |
Total distributions | | | (0.29 | ) | | | (0.31 | ) | | | (0.24 | ) | | | (0.26 | ) | | | (0.26 | ) | |
Net asset value, end of period | | $ | 9.60 | | | $ | 9.65 | | | $ | 9.73 | | | $ | 9.66 | | | $ | 9.67 | | |
Total return(d)(e) | | | 2.56 | % | | | 2.45 | % | | | 3.10 | % | | | 2.58 | % | | | 0.02 | % | |
Net assets, end of period
(in 000s) | | $ | 88 | | | $ | 121 | | | $ | 153 | | | $ | 107 | | | $ | 104 | | |
RATIOS TO AVERAGE
NET ASSETS: | |
Gross expenses(f) | | | 1.96 | % | | | 2.10 | %(g) | | | 2.27 | % | | | 1.96 | %(b) | | | 1.91 | % | |
Net expenses after advisory
fees waived and expenses
reimbursed(f)(h) | | | 1.35 | % | | | 1.58 | %(g) | | | 1.95 | % | | | 1.66 | % | | | 1.66 | % | |
Net investment income | | | 2.37 | % | | | 3.24 | %(g) | | | 1.81 | % | | | 2.35 | %(b) | | | 2.62 | % | |
Portfolio turnover rate | | | 175 | % | | | 221 | % | | | 314 | % | | | 211 | % | | | 181 | % | |
(a) Per share amounts were calculated using average shares outstanding for the year.
(b) Includes a non-recurring refund by the custodian for overbilling of prior years' out-of-pocket fees. This amounted to less than $0.01 per share and is less than 0.005% of average net assets.
(c) The amount shown for a share outstanding throughout the period may not correlate with the Statement of Operations for the period due to timing of sales and redemptions of Fund shares in relation to income earned and/or fluctuating market value of the investments of the Fund.
(d) Total return is a measure of the change in the value of an investment in the Fund over the years covered, which assumes any dividends or capital gains distributions are reinvested in shares of the Fund. Returns shown do not reflect the deduction of taxes a shareholder would pay on Fund distributions or the redemption of Fund shares or the imposition of any sales load.
(e) Total return excludes sales charges, if any, and would be lower for the period presented if it reflected these charges.
(f) Dividend expense totaled 0.07%, 0.29%, 0.42%, 0.16% and 0.02% of average net assets for the years ended May 31, 2020, 2019, 2018, 2017 and 2016, respectively. Interest rebate expense and line of credit interest expense totaled 0.05%, 0.01%, 0.03%, 0.00% and 0.14% of average net assets for the years ended May 31, 2020, 2019, 2018, 2017 and 2016, respectively.
(g) Effective August 6, 2018, the investment adviser reduced the advisory fee paid by the Fund and agreed to increase the expense reimbursements it provides to the Fund by contractually limiting the Fund's total expenses (other than certain expenses noted in the Notes to Financial Statements) to 1.23% for Class A shares. Prior to August 6, 2018, the expense limitation had been 1.50%
(h) Excluding dividend and interest expenses, the Fund's net expenses after advisory fees waived and expenses reimbursed would have been 1.23%, 1.28%, 1.50%, 1.50% and 1.50% of average net assets for the years ended May 31, 2020, 2019, 2018, 2017 and 2016, respectively.
See Notes to Financial Statements.
Annual Report | May 31, 2020
81
Water Island Long/Short Fund – Class R Financial Highlights
Selected Per Share Data and Ratios for a Share Outstanding Throughout the Periods Presented:
| | | Year Ended May 31, | |
| | | 2020 | | 2019 | | 2018 | | 2017 | | 2016 | |
Net asset value,
beginning of period | | $ | 9.88 | | | $ | 10.12 | | | $ | 9.99 | | | $ | 9.31 | | | $ | 10.12 | | |
Income (loss) from
investment operations | |
Net investment income (loss)(a) | | | 0.28 | | | | (0.01 | )(c) | | | (0.05 | ) | | | (0.20 | )(b) | | | (0.03 | ) | |
Net realized and unrealized
gains (losses) on investments
and foreign currencies | | | 0.46 | | | | (0.03 | ) | | | 0.18 | | | | 0.88 | | | | (0.69 | ) | |
Total from investment operations | | | 0.74 | | | | (0.04 | ) | | | 0.13 | | | | 0.68 | | | | (0.72 | ) | |
Less distributions | |
From net investment income | | | (0.03 | ) | | | — | | | | — | | | | — | | | | — | | |
From net realized gains | | | (0.14 | ) | | | (0.20 | ) | | | — | | | | — | | | | (0.09 | ) | |
Total distributions | | | (0.17 | ) | | | (0.20 | ) | | | — | | | | — | | | | (0.09 | ) | |
Net asset value, end of period | | $ | 10.45 | | | $ | 9.88 | | | $ | 10.12 | | | $ | 9.99 | | | $ | 9.31 | | |
Total return(d) | | | 7.58 | % | | | (0.29 | %) | | | 1.30 | % | | | 7.30 | % | | | (7.12 | %) | |
Net assets, end of period
(in 000s) | | $ | 11 | | | $ | 10 | | | $ | 10 | | | $ | 10 | | | $ | 9 | | |
RATIOS TO AVERAGE
NET ASSETS: | |
Gross expenses(e) | | | 12.79 | % | | | 11.69 | % | | | 12.52 | % | | | 15.85 | %(b) | | | 20.24 | % | |
Net expenses after advisory
fees waived and expenses
reimbursed(e)(f) | | | 1.92 | % | | | 2.43 | % | | | 2.35 | % | | | 2.66 | % | | | 2.62 | % | |
Net investment income (loss) | | | 2.81 | % | | | (0.15 | %) | | | (0.47 | %) | | | (2.14 | %)(b) | | | (0.34 | %) | |
Portfolio turnover rate | | | 577 | % | | | 528 | % | | | 520 | % | | | 449 | % | | | 416 | % | |
(a) Per share amounts were calculated using average shares outstanding for the period.
(b) Includes a non-recurring refund by the custodian for overbilling of prior years' out-of-pocket fees. This amounted to $0.01 per share and 0.08% of average net assets.
(c) The amount shown for a share outstanding throughout the period may not correlate with the Statement of Operations for the period due to timing of sales and redemptions of Fund shares in relation to income earned and/or fluctuating market value of the investments of the Fund.
(d) Total return is a measure of the change in the value of an investment in the Fund over the years covered, which assumes any dividends or capital gains distributions are reinvested in shares of the Fund. Returns shown do not reflect the deduction of taxes a shareholder would pay on Fund distributions or the redemption of Fund shares.
(e) Dividend expense totaled 0.22%, 0.74%, 0.66%, 0.84% and 0.70% of average net assets for the years ended May 31, 2020, 2019, 2018, 2017 and 2016, respectively. Interest rebate expense and line of credit interest expense totaled 0.01%, 0.00%, 0.00%, 0.13% and 0.23% of average net assets for the years ended May 31, 2020, 2019, 2018, 2017 and 2016, respectively.
(f) Excluding dividend and interest expenses, the Fund's net expenses after advisory fees waived and expenses reimbursed would have been 1.69%, 1.69%, 1.69%, 1.69% and 1.69% of average net assets for the years ended May 31, 2020, 2019, 2018, 2017 and 2016, respectively.
See Notes to Financial Statements.
www.arbitragefunds.com | 1-800-295-4485
82
Water Island Long/Short Fund – Class I Financial Highlights
Selected Per Share Data and Ratios for a Share Outstanding Throughout the Periods Presented:
| | | Year Ended May 31, | |
| | | 2020 | | 2019 | | 2018 | | 2017 | | 2016 | |
Net asset value,
beginning of period | | $ | 9.88 | | | $ | 10.12 | | | $ | 9.99 | | | $ | 9.31 | | | $ | 10.12 | | |
Income (loss) from
investment operations | |
Net investment income (loss)(a) | | | 0.30 | | | | 0.01 | | | | (0.02 | ) | | | (0.18 | )(b) | | | (0.04 | ) | |
Net realized and unrealized
gains (losses) on investments
and foreign currencies | | | 0.47 | | | | (0.05 | ) | | | 0.15 | | | | 0.86 | | | | (0.68 | ) | |
Total from investment operations | | | 0.77 | | | | (0.04 | ) | | | 0.13 | | | | 0.68 | | | | (0.72 | ) | |
Less distributions | |
From net investment income | | | (0.06 | ) | | | — | | | | — | | | | — | | | | — | | |
From net realized gains | | | (0.14 | ) | | | (0.20 | ) | | | — | | | | — | | | | (0.09 | ) | |
Total distributions | | | (0.20 | ) | | | (0.20 | ) | | | — | | | | — | | | | (0.09 | ) | |
Net asset value, end of period | | $ | 10.45 | | | $ | 9.88 | | | $ | 10.12 | | | $ | 9.99 | | | $ | 9.31 | | |
Total return(c) | | | 7.84 | % | | | (0.29 | %) | | | 1.30 | % | | | 7.30 | % | | | (7.12 | %) | |
Net assets, end of period
(in 000s) | | $ | 1,909 | | | $ | 2,344 | | | $ | 2,177 | | | $ | 2,048 | | | $ | 1,302 | | |
RATIOS TO AVERAGE
NET ASSETS: | |
Gross expenses(d) | | | 12.53 | % | | | 11.44 | % | | | 12.27 | % | | | 15.60 | %(b) | | | 20.02 | % | |
Net expenses after advisory
fees waived and expenses
reimbursed(d)(e) | | | 1.66 | % | | | 2.18 | % | | | 2.10 | % | | | 2.41 | % | | | 2.40 | % | |
Net investment income (loss) | | | 2.97 | % | | | 0.12 | % | | | (0.22 | %) | | | (1.88 | %)(b) | | | (0.47 | %) | |
Portfolio turnover rate | | | 577 | % | | | 528 | % | | | 520 | % | | | 449 | % | | | 416 | % | |
(a) Per share amounts were calculated using average shares outstanding for the year.
(b) Includes a non-recurring refund by the custodian for overbilling of prior years' out-of-pocket fees. This amounted to $0.01 per share and 0.08% of average net assets.
(c) Total return is a measure of the change in the value of an investment in the Fund over the years covered, which assumes any dividends or capital gains distributions are reinvested in shares of the Fund. Returns shown do not reflect the deduction of taxes a shareholder would pay on Fund distributions or the redemption of Fund shares.
(d) Dividend expense totaled 0.21%, 0.74%, 0.66%, 0.84% and 0.72% of average net assets for the years ended May 31, 2020, 2019, 2018, 2017 and 2016, respectively. Interest rebate expense and line of credit interest expense totaled 0.01%, 0.00%, 0.00%, 0.13% and 0.24% of average net assets for the years ended May 31, 2020, 2019, 2018, 2017 and 2016, respectively.
(e) Excluding dividend and interest expenses, the Fund's net expenses after advisory fees waived and expenses reimbursed would have been 1.44%, 1.44%, 1.44%, 1.44% and 1.44% of average net assets for the years ended May 31, 2020, 2019, 2018, 2017 and 2016, respectively.
See Notes to Financial Statements.
Annual Report | May 31, 2020
83
The Arbitrage Funds Notes to Financial Statements
1. ORGANIZATION
The Arbitrage Funds (the "Trust") is a Delaware statutory trust, which was organized on December 22, 1999 and is registered under the Investment Company Act of 1940, as amended (the "1940 Act"), as an open-end management investment company issuing its shares in series. Each series represents a distinct portfolio with its own investment objective and policies. The four series presently authorized are the Arbitrage Fund (the "Arbitrage Fund"), the Water Island Diversified Event-Driven Fund (the "Diversified Event-Driven Fund"), the Water Island Credit Opportunities Fund (the "Credit Opportunities Fund") and the Water Island Long/Short Fund (the "Long/Short Fund"), each a "Fund" and collectively the "Funds". Prior to August 5, 2019, the Diversified Event-Driven Fund was named Arbitrage Event-Driven Fund. The Diversified Event-Driven Fund's portfolio manager, investment objective and investment strategies did not change. The Arbitrage Fund, the Diversified Event-Driven Fund and the Credit Opportunities Fund are each a diversified series of the Trust. The Long/Short Fund is a non-diversified series of the Trust. The Funds' investments are managed by Water Island Capital, LLC (the "Adviser").
| | | Commencement of Operations | |
Fund | | Class R shares | | Class I shares | | Class C shares | | Class A shares | |
Arbitrage Fund | | September 18, 2000 | | October 17, 2003 | | June 1, 2012 | | June 1, 2013 | |
Diversified
Event-Driven Fund | | October 1, 2010 | | October 1, 2010 | | June 1, 2012 | | June 1, 2013 | |
Credit Opportunities
Fund | | October 1, 2012 | | October 1, 2012 | | October 1, 2012 | | June 1, 2013 | |
Long/Short Fund | | January 2, 2015 | | January 2, 2015 | | N/A | | N/A | |
The investment objective of the Arbitrage Fund is to seek to achieve capital growth by engaging in merger arbitrage. The investment objective of the Diversified Event-Driven Fund is to seek to achieve capital growth by investing in companies that are impacted by corporate events such as mergers, acquisitions, asset sales, restructurings, recapitalizations, refinancings, reorganizations and other special situations. The investment objective of the Credit Opportunities Fund is to seek to provide current income and capital growth by investing in debt securities impacted by events such as reorganizations, restructurings, recapitalizations, debt maturities, refinancings, mergers, acquisitions, regulatory changes and other special situations. The investment objective of the Long/Short Fund is to seek to achieve capital appreciation over a full market cycle with lower volatility than the broad equity market.
The Arbitrage Fund, Water Island Diversified Event-Driven Fund and Water Island Credit Opportunities Fund's four classes of shares, Class R, Class I, Class C and Class A, and the Water Island Long/Short Fund's two classes of shares, Class R and Class I, represent interests in the same portfolio of investments and have the same rights, but differ primarily in the expenses to which they are subject and the investment eligibility requirements. Class R shares, Class C shares and Class A shares are subject to an annual distribution and servicing fee of up to 0.25%, 1.00% and 0.25%, respectively, of each Fund's average daily net assets attributable to Class R shares, Class C shares and Class A shares, respectively, whereas Class I shares are not subject to any distribution and servicing fees. Class C shares are also subject to a 1.00% contingent deferred sales charge on all purchases redeemed within 12 months of purchase. Class A shares of the Arbitrage Fund are sold subject to a maximum front-end sales load equal to 2.75% of the offering price and are also subject to a 1.00% contingent deferred sales load on purchases at or above $250,000, purchased without a front-end sales charge and redeemed within 18 months of purchase. Class A shares of the Diversified Event-Driven Fund and the Credit Opportunities Fund are sold subject to a
www.arbitragefunds.com | 1-800-295-4485
84
The Arbitrage Funds Notes to Financial Statements (continued)
maximum front-end sales load equal to 3.25% of the offering price and are also subject to a 1.00% contingent deferred sales load on purchases at or above $250,000 purchased without a front-end sales charge and redeemed within 18 months of purchase.
2. SIGNIFICANT ACCOUNTING POLICIES
The following is a summary of significant accounting policies followed by the Funds. These policies are in conformity with U.S. generally accepted accounting principles ("GAAP"). The Funds are considered investment companies for financial reporting purposes under GAAP and Accounting Standards Codification Topic 946 — Financial Services — Investment Companies.
In March 2020, the FASB issued ASU 2020-04, Reference Rate Reform, which provide optional expedients and exceptions for applying GAAP to contracts, hedging relationships, and other transactions which are affected by reference rate reform if certain criteria are met. Such provisions are elective and apply to all entities as of March 12, 2020 through December 31, 2022, subject to meeting certain criteria, that have transactions that reference LIBOR or another reference rate that are discontinued because of reference rate reform. ASU 2020-04 had no impact on the Funds during the current reporting period.
The Funds have adopted Financial Accounting Standards Board Accounting Standards Update ("ASU") No. 2017-08 "Premium Amortization on Purchased Callable Debt Securities", which amends the accounting standards to shorten the amortization period of certain purchased callable debt securities held at a premium to the earliest call date. The ASU is effective for annual and interim periods beginning after December 15, 2018. In accordance with the transition provisions of the standard, the Funds applied the amendments on a modified retrospective basis beginning with the fiscal year ended May 31, 2020. The change in accounting policy has been made to comply with the newly issued accounting standard and had no impact on total accumulated earnings (loss) or the net asset value of the Funds' financial statements.
Use of Estimates — The preparation of financial statements in conformity with GAAP requires management to make estimates and assumptions that affect the reported amounts of assets and liabilities at the date of the financial statements and the reported amounts of increases and decreases in net assets from operations during the reporting period. Actual results could differ from those estimates.
Valuation of Investments — The Funds' portfolio securities are valued as of the close of trading of the New York Stock Exchange ("NYSE") (normally 4:00 p.m., Eastern standard time). Common stocks, mutual funds and other securities, including open short positions that are traded on a securities exchange, are valued at the last quoted sales price at the close of regular trading on the day the valuation is made. Securities which are quoted by NASDAQ are valued at the NASDAQ Official Closing Price. Price information on listed stocks is taken from the exchange where the security is primarily traded. Redeemable securities issued by open-end investment companies are valued at the investment company's respective net asset value, with the exception of exchange-traded open-end investment companies, which are priced as common stocks. Market quotations of foreign securities from the principal markets in which they trade may not be reliable if events or circumstances that may affect the value of portfolio securities occur between the time of the market quotation and the close of trading on the NYSE. If a significant event that affects the valuation of a foreign security occurs between the close of a foreign security's primary exchange and the time the Funds calculate their net asset value ("NAV"), the Funds will fair value the foreign security to account for this discrepancy. Securities which are listed on an exchange but which are not traded on the valuation date will be valued at last bid if held long, and last ask
Annual Report | May 31, 2020
85
The Arbitrage Funds Notes to Financial Statements (continued)
if held short. Put and call options and securities traded in the over-the-counter market are valued at the mean of the most recent bid and ask prices. Foreign currency forward contracts are valued at the current day's interpolated foreign exchange rate, as calculated using the current day's spot rate, and the thirty, sixty, ninety and one-hundred eighty day forward rates provided by an independent source.
If available, debt securities are priced based upon an evaluated bid provided by independent, third-party pricing agents. The third-party pricing agents may also value debt securities at an evaluated bid price by employing methodologies that utilize actual market transactions, broker-supplied valuations, or other methodologies designed to identify the market value for such securities. Unlisted securities for which market quotations are readily available are valued at the latest quoted bid price. Single name swap agreements are valued based on the underlying terms of the agreement. Other swap agreements (such as baskets of securities) are valued daily based on the terms of the swap agreement as provided by an independent third party or the counterparty. If a third-party valuation is not available, these other swap agreements are valued based on the valuation provided by the counterparty.
Other assets and securities for which no quotations are readily available are valued at fair value using methods determined in good faith by the Pricing Committee, which is under the supervision of the Board of Trustees of the Trust. Some of the more common reasons that may necessitate that a security be valued at fair value include: the security's trading has been halted or suspended; the security has been delisted from a national exchange; the security's primary trading market is temporarily closed at a time when under normal conditions it would be open; the security has been acquired through completion of a merger/tender or the security's primary pricing source is not able or willing to provide a price. Such methods of fair valuation may include, but are not limited to: multiple of earnings, multiple of book value, discount from market of a similar freely traded security, purchase price of a security, subsequent private transactions in the security or related securities, or a combination of these and other factors. Foreign securities are translated from the local currency into U.S. dollars using currency exchange rates supplied by a quotation service.
Fair Value Measurements — In accordance with the authoritative guidance on fair value measurements under GAAP, the Funds disclose fair value of their investments in a hierarchy that prioritizes the inputs to valuation techniques used to measure the fair value. The objective of a fair value measurement is to determine the price that would be received to sell an asset or paid to transfer a liability in an orderly transaction between market participants at the measurement date (an exit price). Accordingly, the fair value hierarchy gives the highest priority to quoted prices (unadjusted) in active markets for identical assets or liabilities (Level 1) and the lowest priority to unobservable inputs (Level 3). The guidance establishes three levels of the fair value hierarchy as follows:
Level 1 — Unadjusted quoted prices in active markets for identical, unrestricted assets or liabilities that the Funds have the ability to access at the measurement date;
Level 2 — Observable inputs other than quoted prices included in Level 1 that are observable (either directly or indirectly) for substantially the full term of the asset or liability; and
Level 3 — Unobservable inputs for the asset or liability, to the extent relevant observable inputs are not available, representing each Fund's own assumption about the assumptions a market participant would use in valuing the asset or liability, and would be based on the best information available.
www.arbitragefunds.com | 1-800-295-4485
86
The Arbitrage Funds Notes to Financial Statements (continued)
Investments are classified within the level of the lowest significant input considered in determining fair value. Investments classified within Level 3, whose fair value measurement considers several inputs, may include Level 1 or Level 2 inputs as components of the overall fair value measurement. The inputs or methodology used for valuing securities are not necessarily an indication of the risk associated with investing in those securities.
For the year ended May 31, 2020, there were no significant changes to the Funds' fair value methodologies. Transfers for Level 3 securities, if any, are shown as part of the leveling table in each Fund's Portfolio of Investments.
Share Valuation and Redemption Fees — The net asset value per share of each class of shares of the Funds is calculated daily by dividing the total value of a Fund's assets attributable to that class, less liabilities attributable to that class, by the number of shares of that class outstanding. The offering price and redemption price per share of each class of each Fund is equal to the net asset value per share. The Trust does not impose a redemption fee on the sale of a Fund's shares.
Security Transactions — Security transactions are accounted for on trade date. Gains and losses on securities sold are determined on a specific identification basis.
Short Positions — The Funds may sell securities short for economic hedging purposes. Subsequent fluctuations in the market prices of securities sold short may require purchasing the securities at prices which may differ from the market value reflected on the Portfolio of Investments. The Funds are liable for any dividends and interest payable on securities while those securities are in a short position. As collateral for their short positions, the Funds are required under the 1940 Act to maintain assets consisting of cash, cash equivalents or liquid securities. The amount of the collateral is required to be adjusted daily to reflect changes in the value of the securities sold short. The Funds are charged an interest rebate expense by the prime broker on securities sold short. The interest rebate expense is charged for the duration of time that a security is sold short and is shown on the Statements of Operations.
Derivative Instruments and Hedging Activities — The following discloses the Funds' use of derivative instruments and hedging activities.
The Funds' investment objectives not only permit the Funds to purchase investment securities, but they also allow certain Funds to enter into various types of derivative contracts, including, but not limited to, swap contracts, forward foreign currency exchange contracts, and purchased and written option contracts. In doing so, the Funds will employ strategies in differing combinations to permit them to increase, decrease, or change the level or types of exposure to market factors. Central to those strategies are features inherent to derivatives that make them more attractive for this purpose than equity or debt securities: they require little or no initial cash investment; they can focus exposure on only certain selected risk factors; and they may not require the ultimate receipt or delivery of the underlying security (or securities) to satisfy the contract. This may allow the Funds to pursue their objectives more quickly and efficiently than if they were to make direct purchases or sales of securities capable of effecting a similar response to market factors. The Funds may, but are not required to, seek to reduce their currency risk by hedging part or all of their exposure to various foreign currencies.
Market Risk Factors: In pursuit of their investment objectives, the Funds may seek to use derivatives to increase or decrease their exposure to the following market risk factors:
Equity Risk: Equity risk relates to the change in value of equity securities as they relate to increases or decreases in the general market. Investments in securities issued by small and
Annual Report | May 31, 2020
87
The Arbitrage Funds Notes to Financial Statements (continued)
medium capitalization companies tend to be less liquid and more volatile than stocks of companies with relatively large market capitalizations. To the extent a Fund invests in securities of small and medium capitalization companies, it may be more vulnerable to adverse business events than larger, more established companies.
Interest Rate Risk: Interest rate risk refers to the fluctuations in value of fixed-income securities resulting from the inverse relationship between price and yield. For example, an increase in general interest rates will tend to reduce the market value of fixed income investments, and a decline in general interest rates will tend to increase the value of such investments. In addition, debt securities with longer maturities, which tend to have higher yields, are subject to potentially greater fluctuations in value from changes in interest rates than obligations with shorter maturities.
Foreign Exchange Rate Risk: Foreign exchange rate risk relates to the change in the U.S. dollar value of a security held that is denominated in a foreign currency. The value of a foreign currency denominated security will decrease as the dollar appreciates against the currency, while the value of the foreign currency denominated security will increase as the dollar depreciates against the currency. Adverse changes in exchange rates may erode or reverse any gains produced by foreign currency denominated investments and may widen any losses.
Credit Risk: Credit risk relates to the ability of the issuer to meet interest and principal payments, or both, as they come due. In general, lower-grade, higher-yield bonds are subject to credit risk to a greater extent than lower-yield, higher-quality bonds.
The extent of the impact of the novel coronavirus ("COVID-19") outbreak on the financial performance of the Funds will depend on future developments, including duration and spread of the outbreak, related advisories and restrictions, and the impact of COVID-19 on the financial markets and the overall economy, all of which are highly uncertain and cannot be predicted. Adverse market conditions may be prolonged and may not have the same impact on all types of securities. These disruptions could prevent a Fund from executing advantageous investment decisions in a timely manner and could negatively impact the Fund's ability to achieve its investment objective. If the financial markets and/or the overall economy are impacted for an extended period of time, the Funds' results of operations may be materially adversely affected. During the year ended May 31, 2020, there was no significant impact to the Funds.
Risk of Investing in Derivatives: The Funds' use of derivatives can result in losses due to unanticipated changes in the market risk factors and the overall market. In instances where the Funds are using derivatives to decrease or hedge exposures to market risk factors for securities held by the Funds, there are also risks that those derivatives may not perform as expected, resulting in losses for the combined or hedged positions.
Derivatives may have little or no initial cash investment relative to their market value exposure and therefore can produce significant gains or losses in excess of their cost. This use of embedded leverage allows the Funds to increase their market value exposure relative to their net assets and can substantially increase the volatility of the Funds' performance.
Additional associated risks from investing in derivatives also exist and potentially could have significant effects on the valuation of the derivative instruments and the Funds. Typically, the associated risks are not the risks that the Funds are attempting to increase or decrease exposure to, per their investment objectives, but are the additional risks from investing in derivatives.
www.arbitragefunds.com | 1-800-295-4485
88
The Arbitrage Funds Notes to Financial Statements (continued)
Examples of these associated risks are liquidity risk, which is the risk that the Funds will not be able to sell the derivative in the open market in a timely manner, and counterparty credit risk, which is the risk that the counterparty to a transaction will not fulfill its obligation to the Funds. Associated risks can be different for each type of derivative and are discussed by derivative type in the notes that follow.
Option Writing/Purchasing: Certain Funds may write or purchase option contracts to adjust risk and return of their overall investment positions. When a Fund writes or purchases an option, an amount equal to the premium received or paid by the Fund is recorded as a liability or an asset and is subsequently adjusted to the current market value of the option written or purchased. Premiums received or paid from writing or purchasing options that expire unexercised are treated by the Fund on the expiration date as realized gains or losses. The difference between the premium and the amount paid or received on effecting a closing purchase or sale transaction, including brokerage commissions, is also treated as a realized gain or loss. If an option is exercised, the premium paid or received is added to the cost of the purchase or proceeds from the sale in determining whether the Fund has realized a gain or loss on investment transactions. Risks from entering into option transactions arise from the potential inability of counterparties to meet the terms of the contracts, the potential inability to enter into closing transactions because of an illiquid secondary market and from unexpected movements in security values.
Options held by the Funds at May 31, 2020 are disclosed in the Portfolio of Investments.
During the period ended May 31, 2020, the Funds engaged in option writing/purchasing to limit volatility and correlation and to create income and optionality.The maximum potential amount of future payments (undiscounted) that a fund as a writer of put options could be required to make is equal to the notional amount multiplied by the exercise price as shown in the Schedule of Investments.
Foreign Currency Exchange Contracts: The Funds may enter into forward foreign currency exchange contracts as a way of managing foreign exchange rate risk. The Funds may enter into these contracts for the purchase or sale of a specific foreign currency at a fixed price on a future date as a hedge or cross-hedge against either specific transactions or portfolio positions. The objective of the Funds' foreign currency hedging transactions is to reduce risk that the U.S. dollar value of the Funds' securities denominated in foreign currency will decline in value due to changes in foreign currency exchange rates.
Foreign currency exchange contracts held by the Funds at May 31, 2020 are disclosed in the Portfolio of Investments.
During the period ended May 31, 2020, the Funds entered into foreign currency exchange contracts to hedge currency risk.
Warrants/Rights: Each Fund may purchase or otherwise receive warrants or rights. Warrants and rights generally give the holder the right to receive, upon exercise, a security of the issuer at a set price. The Funds typically use warrants and rights in a manner similar to their use of purchased options on securities, as described in the Options Writing/Purchasing section above. Risks associated with the use of warrants and rights are generally similar to risks associated with the use of purchased options. However, warrants and rights often do not have standardized terms, and may have longer maturities and may be less liquid than exchange-traded options. In addition, the terms of warrants or rights may limit each Fund's ability to exercise the warrants or rights at such times and in such quantities as each Fund would otherwise wish. Warrants and rights
Annual Report | May 31, 2020
89
The Arbitrage Funds Notes to Financial Statements (continued)
generally pay no dividends and confer no voting or other rights other than to purchase the underlying security.
Warrants/rights held by the Funds at May 31, 2020 are disclosed in the Portfolio of Investments.
During the period ended May 31, 2020, the Funds held warrants/rights as a result of receiving them from completed deals, and to participate in investment opportunities.
Swaps: Certain Funds may enter into interest rate, index, equity, total return and credit default swap agreements, for hedging and non-hedging purposes. These transactions would be entered into in an attempt to obtain a particular return when it is considered desirable to do so, possibly at a lower cost to a Fund than if the Fund had invested directly in the asset that yielded the desired return. Swap agreements may be executed in a multilateral or other trade facility program, such as a registered exchange ("centrally cleared swaps") or may be privately negotiated in the over-the-counter market. The duration of a swap agreement typically ranges from a few weeks to more than one year. In a standard swap transaction, two parties agree to exchange the returns (or differentials in rates of return) earned or realized on particular predetermined investments or instruments, which may be adjusted for an interest factor. The gross returns to be exchanged or "swapped" between the parties are generally calculated with respect to a "notional amount" (i.e., the return on or increase in value of a particular dollar amount invested at a particular interest rate, in a particular foreign currency, or in a "basket" of securities representing a particular index). In a centrally cleared swap, immediately following execution of the swap agreement, the swap agreement is novated to a central counterparty (the "CCP") and the Fund's counterparty on the swap agreement becomes the CCP.
Total return swap agreements are contracts in which one party agrees to make periodic payments based on the change in market value of underlying assets, which may include a specified security, basket of securities, defined portfolios of bonds, loans and mortgages, or securities indexes during the specified period in return for periodic payments based on a fixed or variable interest rate or the total return from other underlying assets or indices. Total return swap agreements may be used to obtain exposure to a security or market index without owning or taking physical custody of such security or component securities of a market index. Total return swap agreements may effectively add leverage to a Fund's portfolio because, in addition to its total net assets, the Fund would be subject to investment exposure on the notional amount of the swap. Total return swaps are a mechanism for the user to accept the economic benefits of asset ownership without utilizing the balance sheet. The other leg of the swap, usually the London Interbank Offered Rate (LIBOR) or the federal funds rate, is spread to reflect the non-balance sheet nature of the product. Total return swaps can be designed with any underlying asset agreed upon between two parties. Typically no notional amounts are exchanged with total return swaps. Total return swap agreements entail the risk that a party will default on its payment obligations to a Fund thereunder. Swap agreements also entail the risk that a Fund will not be able to meet its obligation to the counterparty. Generally, a Fund will enter into total return swaps on a net basis (i.e., the two payment streams are netted out with the Fund receiving or paying, as the case may be, only the net amount of the two payments). The Funds will typically enter into agreements based on either long or short exposure to underlying equities. To help mitigate against default risk by the counterparties these agreements are reset monthly, with cashflows exchanged based on the change in the value of the underlying equity from either the opening price or the last reset price, netted against the interest leg of the swap.
Most swap agreements entered into by a Fund calculate the obligations of the parties to the agreement on a "net basis." Consequently, a Fund's current obligations (or rights) under a swap
www.arbitragefunds.com | 1-800-295-4485
90
The Arbitrage Funds Notes to Financial Statements (continued)
agreement will generally be equal only to the net present value of amounts to be paid or received under the agreement based on the relative values of the positions held by each party to the agreement (the "net amount"). A Fund's current obligations under a swap agreement will be accrued daily (offset against amounts owed to the Fund), and any accrued but unpaid net amounts owed to a swap counterparty will be covered in accordance with applicable regulatory requirements to limit any potential leveraging of a Fund's portfolio. Any net amount accrued but not yet paid to a Fund by the counterparty under a swap agreement (i.e., the Fund's current rights under the swap agreement) is recorded as unrealized appreciation until the amount is paid to the Fund. The Fund's maximum risk of loss from counterparty credit risk is generally limited to the net payment to be received by the Fund and/or the termination value at the end of the contract. Obligations under swap agreements so covered will not be construed to be "senior securities" for purposes of the Funds' investment restriction concerning senior securities.
Whether a Fund's use of swap agreements will be successful in furthering its investment objective will depend on management's ability to correctly predict whether certain types of investments are likely to produce greater returns than other investments. Swap agreements that cannot be terminated or sold within seven days may be considered to be illiquid investments. Moreover, a Fund bears the risk of loss of the amount expected to be received under a swap agreement in the event of the default or bankruptcy of a swap agreement counterparty. Although centrally cleared swaps typically present less counterparty risk than non-centrally cleared swaps, a Fund that has entered into centrally cleared swaps is subject to the risk of the failure of the CCP. A Fund will enter into swap agreements only with counterparties that meet certain standards for creditworthiness (generally, such counterparties would have to be eligible counterparties under the terms of the Fund's repurchase agreement guidelines) or that are centrally cleared. Certain restrictions imposed on the Funds by the Internal Revenue Code of 1986, as amended (the "Code"), may limit a Fund's ability to use swap agreements. It is possible that developments in the swap market, including additional government regulation, could adversely affect a Fund's ability to terminate existing swap agreements or to realize amounts to be received under such agreements.
International Swaps and Derivatives Association, Inc. Master Agreements ("ISDA Master Agreements") govern over-the-counter financial derivative transactions entered into by a Fund and counterparty. The ISDA Master Agreements maintain provisions for general obligations, representations, agreements, collateral and events of default or termination. Events of termination include conditions that may entitle counterparties to elect to terminate early and cause settlement of all outstanding transactions under the applicable ISDA Master Agreement. Any election to terminate early could be material to the financial statements.
Swap agreements held by the Funds at May 31, 2020 are disclosed in the Portfolio of Investments.
During the period ended May 31, 2020, the Arbitrage Fund, Diversified Event-Driven Fund, Credit Opportunities Fund and Long/Short Fund entered into swap agreements to gain efficient exposure to underlying equities.
Annual Report | May 31, 2020
91
The Arbitrage Funds Notes to Financial Statements (continued)
Fair Value of Derivative Instruments – Fair values of derivatives presented in the financial statements are not netted with the fair value of other derivatives or with any collateral amounts posted by the Funds or any counterparty on the Statement of Assets and Liabilities. The fair value of derivative instruments for the Funds as of the year ended May 31, 2020, was as follows:
Derivatives Not
Accounted For As
Hedging Instruments | | Asset
Derivatives
Statement of
Assets and
Liabilities
Location | | Fair Value | | Liability
Derivatives
Statement of
Assets and
Liabilities
Location | | Fair Value | |
Arbitrage Fund | |
Foreign Currency
Contracts
| | Unrealized
appreciation on
forward foreign
currency
exchange
contracts | | $ | 4,054,734 | | | Unrealized
depreciation on
forward foreign
currency
exchange
contracts | | $ | 1,169,055 | | |
| | | | | $ | 4,054,734 | | | | | $ | 1,169,055 | | |
Derivatives Not
Accounted For As
Hedging Instruments | | Asset
Derivatives
Statement of
Assets and
Liabilities
Location | | Fair Value | | Liability
Derivatives
Statement of
Assets and
Liabilities
Location | | Fair Value | |
Diversified Event-Driven Fund | |
Foreign Currency
Contracts
| | Unrealized
appreciation on
forward foreign
currency exchange
contracts | | $ | 227,160 | | | Unrealized
depreciation on
forward foreign
currency exchange
contracts | | $ | 85,614 | | |
Equity Contracts
(purchased
option contracts)
| | Investments:
at fair value of
unaffiliated
investments | | | 7,840 | | | | | | — | | |
| | | $ | 235,000 | | | | | $ | 85,614 | | |
www.arbitragefunds.com | 1-800-295-4485
92
The Arbitrage Funds Notes to Financial Statements (continued)
Derivatives Not
Accounted For As
Hedging Instruments | | Asset
Derivatives
Statement of
Assets and
Liabilities
Location | | Fair Value | | Liability
Derivatives
Statement of
Assets and
Liabilities
Location | | Fair Value | |
Credit Opportunities Fund | |
Equity Contracts
(purchased option
contracts)
| | Investments:
at fair value of
unaffiliated
investments | | $ | 930,874 | | | | | $ | — | | |
Equity Contracts
(written option
contracts) | | | | | — | | | Written options,
at value | | | 17,100 | | |
| | | | | $ | 930,874 | | | | | $ | 17,100 | | |
Derivatives Not
Accounted For As
Hedging Instruments | | Asset
Derivatives
Statement of
Assets and
Liabilities
Location | | Fair Value | | Liability
Derivatives
Statement of
Assets and
Liabilities
Location | | Fair Value | |
Long/Short Fund | |
Foreign Currency
Contracts
| | Unrealized
appreciation on
forward foreign
currency exchange
contracts | | $ | 2,429 | | | Unrealized
depreciation on
forward foreign
currency exchange
contracts | | $ | 1,145 | | |
Equity Contracts
(purchased
option contracts)
| | Investments:
at fair value of
unaffiliated
investments | | | 33,279 | | | | | | — | | |
Equity Contracts
(written option
contracts) | | | | | — | | | Written options,
at value | | | 8,949 | | |
| | | | | $ | 35,708 | | | | | $ | 10,094 | | |
Annual Report | May 31, 2020
93
The Arbitrage Funds Notes to Financial Statements (continued)
The effect of derivative instruments on the Funds' Statement of Operations for the year ended May 31, 2020, was as follows:
Derivatives Not
Accounted For As
Hedging Instruments | | Location Of Gains/(Loss) On
Derivatives Recognized In Income | | Realized
Gain/(Loss)
On Derivatives
Recognized In
Income | | Change in
Unrealized
Gain/(Loss)
On Derivatives
Recognized In
Income | |
Arbitrage Fund | |
Foreign Currency
Contracts
| | Net realized gains (losses) from:
Forward currency contracts / Net
change in unrealized appreciation
(depreciation) on: Forward currency
contracts | | $ | 3,988,837 | | | $ | (2,224,904 | ) | |
Equity Contracts
(swap contracts)
| | Net realized gains (losses) from: Swap
contracts / Net change in
unrealized appreciation
(depreciation) on: Swap contracts | | | (12,721,184 | ) | | | — | | |
Equity Contracts
(purchased option
contracts)
| | Net realized gains (losses) from:
Purchased option contracts / Net
change in unrealized appreciation
(depreciation) on: Purchased option
contracts | | | (5,039,302 | ) | | | 252,665 | | |
Equity Contracts
(written option
contracts)
| | Net realized gains (losses) from:
Written option contracts / Net
change in unrealized appreciation
(depreciation) on: Written option
contracts | | | 317,902 | | | | (25,601 | ) | |
| | | | | $ | (13,453,747 | ) | | $ | (1,997,840 | ) | |
www.arbitragefunds.com | 1-800-295-4485
94
The Arbitrage Funds Notes to Financial Statements (continued)
Derivatives Not
Accounted For As
Hedging Instruments | | Location Of Gains/(Loss) On
Derivatives Recognized In Income | | Realized
Gain/(Loss)
On Derivatives
Recognized In
Income | | Change in
Unrealized
Gain/(Loss)
On Derivatives
Recognized In
Income | |
Diversified Event-Driven Fund | |
Foreign Currency
Contracts
| | Net realized gains (losses) from:
Forward currency contracts / Net
change in unrealized appreciation
(depreciation) on: Forward currency
contracts | | $ | 86,167 | | | $ | (29,486 | ) | |
Equity Contracts
(swap contracts)
| | Net realized gains (losses) from: Swap
contracts / Net change in
unrealized appreciation
(depreciation) on: Swap contracts | | | 1,324,551 | | | | — | | |
Equity Contracts
(purchased option
contracts)
| | Net realized gains (losses) from:
Purchased option contracts / Net
change in unrealized appreciation
(depreciation) on: Purchased
option contracts | | | (621,405 | ) | | | 26,088 | | |
Equity Contracts
(written option
contracts)
| | Net realized gains (losses) from:
Written option contracts / Net
change in unrealized appreciation
(depreciation) on: Written option
contracts | | | 181,455 | | | | (4,956 | ) | |
| | | | | $ | 970,768 | | | $ | (8,354 | ) | |
Annual Report | May 31, 2020
95
The Arbitrage Funds Notes to Financial Statements (continued)
Derivatives Not
Accounted For As
Hedging Instruments | | Location Of Gains/(Loss) On
Derivatives Recognized In Income | | Realized
Gain/(Loss)
On Derivatives
Recognized In
Income | | Change in
Unrealized
Gain/(Loss)
On Derivatives
Recognized In
Income | |
Credit Opportunities Fund | |
Equity Contracts
(swap contracts)
| | Net realized gains (losses) from: Swap
contracts / Net change in
unrealized appreciation
(depreciation) on: Swap contracts | | $ | (113,022 | ) | | $ | — | | |
Equity Contracts
(purchased option
contracts)
| | Net realized gains (losses) from:
Purchased option contracts / Net
change in unrealized appreciation
(depreciation) on: Purchased
option contracts | | | 130,754 | | | | 243,824 | | |
Equity Contracts
(written option
contracts)
(depreciation) on: Written option
contracts | | Net realized gains (losses) from:
Written option contracts / Net
change in unrealized appreciation | | | 21,926 | | | | (9,147) | | |
| | | | | $ | 39,658 | | | $ | 234,677 | | |
Derivatives Not
Accounted For As
Hedging Instruments | | Location Of Gains/(Loss) On
Derivatives Recognized In Income | | Change in
Realized
Gain/(Loss)
On Derivatives
Recognized In
Income | | Unrealized
Gain/(Loss)
On Derivatives
Recognized In
Income | |
Long/Short Fund | |
Foreign Currency
Contracts
| | Net realized gains (losses) from:
Forward currency contracts / Net
change in unrealized appreciation
(depreciation) on: Forward
currency contracts | | $ | 2,966 | | | $ | 184 | | |
Equity Contracts
(swap contracts)
| | Net realized gains (losses) from:
Swap contracts / Net change in
unrealized appreciation
(depreciation) on: Swap contracts | | | (5,921 | ) | | | — | | |
Equity Contracts
(purchased option
contracts)
| | Net realized gains (losses) from:
Purchased option contracts / Net
change in unrealized appreciation
(depreciation) on: Purchased
option contracts | | | (51,982 | ) | | | (8,504 | ) | |
Equity Contracts
(written option
contracts)
| | Net realized gains (losses) from:
Written option contracts / Net
change in unrealized appreciation
(depreciation) on: Written option
contracts | | | 14,261 | | | | 8,092 | | |
| | | $ | (40,676 | ) | | $ | (228 | ) | |
www.arbitragefunds.com | 1-800-295-4485
96
The Arbitrage Funds Notes to Financial Statements (continued)
Volume of derivative instruments held by the Funds during the year ended May 31, 2020, was as follows:
Derivative Type | | Unit of Measurement | | Monthly Average | |
Arbitrage Fund | |
Swap Contracts | | Notional Quantity | | | 137,878,540 | | |
Forward Foreign Currency Exchange
Contracts | | Net Contracts to Deliver/(Receive)
| | | (154,988,183 | ) | |
Purchased Option Contracts | | Contracts | | | 6,350 | | |
Written Option Contracts | | Contracts | | | (350 | ) | |
Derivative Type | | Unit of Measurement | | Monthly Average | |
Diversified Event-Driven Fund | |
Swap Contracts | | Notional Quantity | | | 7,321,475 | | |
Forward Foreign Currency Exchange
Contracts | | Net Contracts to Deliver/(Receive)
| | | (6,112,608 | ) | |
Purchased Option Contracts | | Contracts | | | 1,572 | | |
Written Option Contracts | | Contracts | | | (206 | ) | |
Derivative Type | | Unit of Measurement | | Monthly Average | |
Credit Opportunities Fund | |
Swap Contracts | | Notional Quantity | | | 2,488,363 | | |
Purchased Option Contracts | | Contracts | | | 1,852 | | |
Written Option Contracts | | Contracts | | | (26 | ) | |
Derivative Type | | Unit of Measurement | | Monthly Average | |
Long/Short Fund | |
Swap Contracts | | Notional Quantity | | | 12,223 | | |
Forward Foreign Currency Exchange
Contracts | | Net Contracts to Deliver/(Receive)
| | | (120,584 | ) | |
Purchased Option Contracts | | Contracts | | | 191 | | |
Written Option Contracts | | Contracts | | | (28 | ) | |
Certain derivative contracts are executed under either standardized netting agreements or, for exchange-traded derivatives, the relevant contracts for a particular exchange which contain enforceable netting provisions. A derivative netting arrangement creates an enforceable right of set-off that becomes effective, and affects the realization of settlement on individual assets, liabilities and collateral amounts, only following a specified event of default or early termination. Default events may include the failure to make payments or deliver securities timely, material adverse changes in financial condition or insolvency, the breach of minimum regulatory capital requirements, or loss of license, charter or other legal authorization necessary to perform under the contract.
The Funds held financial instruments such as equity swaps that are subject to enforceable netting arrangements or other similar agreements as of May 31, 2020. At May 31, 2020, there was no unrealized appreciation or depreciation on these instruments held by the Funds. All other derivative contracts held by the Funds were not subject to netting agreements.
Investment Income — Interest income, adjusted for amortization of premium and accretion of discount, is recorded on the accrual basis. Dividend income is recorded on the ex-dividend date, net of any non-reclaimable tax withholdings. Payment-in-kind securities have the option at each
Annual Report | May 31, 2020
97
The Arbitrage Funds Notes to Financial Statements (continued)
interest payment date of making interest payments in cash or additional debt securities. Any interest accrued on payment-in-kind securities is recorded as interest income on an accrual basis. Distributions from REITs may be characterized as ordinary income, net capital gain, or a return of capital to the Funds. The proper characterization of REIT distributions is generally not known until after the end of each calendar year. As such, estimates are used in reporting the character of income and distributions for financial statement purposes when information is not available.
Dividends and Distributions to Shareholders — Dividends arising from net investment income and net capital gain distributions, if any, are declared and paid at least annually to shareholders of the Arbitrage Fund, Diversified Event-Driven Fund and Long/Short Fund. Dividends arising from net investment income, if any, are declared daily and paid monthly, and net capital gain distributions, if any, are declared and paid at least annually to shareholders of the Credit Opportunities Fund.
Allocation Between Classes — Investment income earned, realized capital gains and losses, and unrealized appreciation and depreciation are allocated daily to each class of shares based upon the proportionate shares of total net assets of each Fund. Class-specific expenses are charged directly to the class incurring the expense. Common expenses which are not attributable to a specific class are allocated daily to each class of shares based upon the proportionate share of total net assets of each Fund.
Federal Income Tax — It is the Funds' policy to continue to comply with the special provisions of Subchapter M of the Code, as amended, applicable to regulated investment companies. As provided therein, in any fiscal year in which a fund so qualifies and distributes at least 90% of its taxable net income, a fund (but not the shareholders) will be relieved of Federal income tax on the income distributed. Accordingly, no provision for income taxes has been made.
As of and during the year ended May 31, 2020, the Funds did not have a liability for any unrecognized tax benefits. The Funds recognize interest and, if applicable, penalties for any uncertain tax positions. Interest and penalty expense will be recorded as a component of interest or other tax expense. No interest or penalties were recorded during the year ended May 31, 2020. The Funds file U.S. federal, state, and local tax returns as required. The Funds' tax returns are subject to examination by the relevant tax authorities until expiration of the applicable statute of limitations which is generally three years after the filing of the tax return. Tax returns for open years have incorporated no uncertain tax positions that require a provision for income taxes.
3. INVESTMENT TRANSACTIONS
During the year ended May 31, 2020, cost of purchases and proceeds from sales and maturities of investment securities, excluding short-term investments, U.S. government securities, equity swap contracts, purchased and written option contracts and securities sold short, were as follows:
| | | Arbitrage Fund | | Diversified
Event-Driven Fund | | Credit
Opportunities Fund | | Long/Short
Fund | |
Purchases | | $ | 4,061,521,674 | | | $ | 445,403,965 | | | $ | 104,108,744 | | | $ | 7,927,351 | | |
Sales and Maturities | | | 3,815,648,074 | | | | 451,127,609 | | | | 92,390,415 | | | | 7,488,564 | | |
www.arbitragefunds.com | 1-800-295-4485
98
The Arbitrage Funds Notes to Financial Statements (continued)
During the year ended May 31, 2020, cost of purchases and proceeds from sales and maturities of U.S. government securities for the Credit Opportunities Fund were as follows:
| | | | | Credit Opportunities Fund | |
Purchases | | | | $ | 473,219 | | |
Sales | | | | | | | 4,191,452 | | |
4. LINE OF CREDIT
The Trust, on behalf of the Funds, entered into an agreement which enables the Arbitrage Fund, the Diversified Event-Driven Fund, the Credit Opportunities Fund and the Long/Short Fund to participate in a $100,000,000 unsecured committed revolving line of credit (the "Committed Line") and a $100,000,000 unsecured uncommitted revolving line of credit (the "Uncommitted Line," together with the Committed Line, the "Credit Agreement") with State Street Bank and Trust Company (the "Custodian"). Borrowings are made solely to temporarily finance the purchase or sale of securities or to finance the redemption of the shares of an investor of the Funds. Interest is charged to the Funds based on their borrowings at a rate per annum of the higher of the LIBOR rate plus 1.25% and the overnight federal funds rate plus 1.25%. The Committed Line has a commitment fee of 0.25% per annum on the unused portion of the Committed Line and is payable quarterly. The Uncommitted Line has an upfront fee of $25,000, is held available on a discretionary demand basis and may be terminated by the Custodian or the Trust at any time for any or no reason. On December 3, 2019, the Trust reduced the amount on the Committed Line to $50,000,000. The Trust accrues, on behalf of each of the Funds, the commitment fee on the unused portion of the Committed Line. Such fees are included in the custodian and bank service fees on the Statements of Operations.
In July 2017, the Financial Conduct Authority, the United Kingdom's financial regulatory body, announced that after 2021 it will cease its active encouragement of banks to provide quotations needed to sustain the LIBOR rate, which means that the LIBOR rate may no longer be published after 2021. Although there is still uncertainty regarding a replacement rate, it is anticipated that, beginning in 2020, transactions that currently utilize LIBOR will transition to using the Secured Overnight Financing Rate ("SOFR"), which is a broad measure of the cost of overnight borrowings secured by U.S. Treasury securities. However, various counterparties or other entities may be unwilling or unable to utilize SOFR prior to 2021 or may be unable to modify existing agreements or instruments in a timely manner. The transition from LIBOR to SOFR (or any other replacement rate) may lead to a reduction in the value of some LIBOR-based investments and the effectiveness of new hedges placed against existing LIBOR-based investments, as well as significant market uncertainty, increased volatility, and illiquidity in markets for various instruments, which may result in prolonged adverse market conditions and impact a Fund's performance or NAV.
For the year ended May 31, 2020, the Arbitrage Fund, the Diversified Event-Driven Fund, the Credit Opportunities Fund and the Long/Short Fund had average borrowings of $39,958,333, $2,661,404, $2,733,333 and $50,000, respectively, over a period of 24 days, 57 days, 156 days and 4 days, respectively, at a weighted average interest rate of 3.58%, 2.72%, 2.47% and 2.90%, respectively. Interest expense on the line of credit for the Arbitrage Fund, the Diversified Event-Driven Fund, the Credit Opportunities Fund and the Long/Short Fund during the year ended May 31, 2020, is shown as line of credit interest expense on the Statements of Operations. The Arbitrage Fund, the Diversified Event-Driven Fund and the Long/Short Fund had no outstanding borrowings at May 31, 2020. The Credit Opportunities Fund had outstanding borrowings of $2,400,000 at May 31, 2020.
Annual Report | May 31, 2020
99
The Arbitrage Funds Notes to Financial Statements (continued)
5. ADVISORY FEES, ADMINISTRATION FEES AND OTHER AGREEMENTS
Investment Advisory Agreement
The Funds' investments are managed by the Adviser according to the terms of Investment Advisory Agreements. Under the Investment Advisory Agreement between the Adviser and the Arbitrage Fund, as amended and restated on October 1, 2007, the Arbitrage Fund pays the Adviser an annual fee, which is computed and accrued daily and paid monthly, of 1.25% on the first $250 million, 1.20% on the next $50 million, 1.15% on the next $50 million, 1.10% on the next $75 million, 1.05% on the next $75 million and 1.00% for amounts over $500 million, based on the Arbitrage Fund's average daily net assets. Effective November 1, 2019, the Diversified Event-Driven Fund reduced the annual investment advisory fee to 1.10% based on the Diversified Event-Driven Fund's average daily net assets. Prior to November 1, 2019, under the Investment Advisory Agreement between the Adviser and the Diversified Event-Driven Fund dated September 27, 2010, the Diversified Event-Driven Fund paid the Adviser an annual fee, which was computed and accrued daily and paid monthly, of 1.25% based on the Diversified Event-Driven Fund's average daily net assets. Effective August 6, 2018, the Credit Opportunities Fund reduced the annual investment advisory fee to 0.95% on the first $250 million of its average daily net assets, 0.90% on the next $500 million of its average daily net assets and 0.85% on its average daily net assets in excess of $750 million. Prior to August 6, 2018, under the Investment Advisory Agreement between the Adviser and the Credit Opportunities Fund dated October 1, 2012, the Credit Opportunities Fund paid an average annual fee of 1.00% on the amount of the Credit Opportunities Fund's average daily net assets. Under the Investment Advisory Agreement between the Adviser and the Long/Short Fund dated December 22, 2014, the Long/Short Fund pays the Adviser an annual fee, which is computed and accrued daily and paid monthly, of 1.25% based on the Long/Short Fund's average daily net assets.
The Adviser has contractually agreed, at least until September 30, 2021, to waive its advisory fee and/or reimburse the Funds' other expenses to the extent that total operating expenses (exclusive of taxes, interest, dividends on short positions, brokerage commissions, acquired fund fees and expenses and other costs incurred in connection with the purchase or sale of portfolio securities) exceed the annual rate of the Funds' average daily net assets attributable to each share class as shown in the table below:
| | | Arbitrage Fund | | Diversified
Event-Driven Fund | | Credit Opportunities Fund | | Long/Short Fund | |
Class R | | | 1.69 | % | | | 1.69 | % | | | 1.23 | % | | | 1.69 | % | |
Class I | | | 1.44 | % | | | 1.44 | % | | | 0.98 | % | | | 1.44 | % | |
Class C | | | 2.44 | % | | | 2.44 | % | | | 1.98 | % | | | N/A | | |
Class A | | | 1.69 | % | | | 1.69 | % | | | 1.23 | % | | | N/A | | |
Effective August 6, 2018, the Adviser has contractually agreed to provide additional expense reimbursements to the Credit Opportunities Fund by lowering the contractual expense limitation, not including taxes, interest, dividends on short positions, brokerage commissions, acquired fund fees and expenses and other costs incurred in connection with the purchase or sale of portfolio securities, to the amounts in the table above. Prior to August 6, 2018, the expense limitation was 1.50% of the Credit Opportunities Fund's average daily net assets allocable to the Class R shares, 1.25% of the Credit Opportunities Fund's average daily net assets allocable to the Class I shares, 2.25% of the Credit Opportunities Fund's average daily net assets allocable to the Class C shares, and 1.50% of the Credit Opportunities Fund's average daily net assets allocable to the Class A shares.
www.arbitragefunds.com | 1-800-295-4485
100
The Arbitrage Funds Notes to Financial Statements (continued)
During the year ended May 31, 2020, the Arbitrage Fund invested in the Diversified Event-Driven Fund. The Adviser has agreed to waive $408,207 in advisory fees paid by the Arbitrage Fund on the Arbitrage Fund's assets that are invested in the Diversified Event-Driven Fund.
As of May 31, 2020, the Credit Opportunities Fund and the Long/Short Fund had $1,560 and $13,504, respectively, receivable from the Adviser due to advisory fee reimbursements.
For the year ended May 31, 2020, the aggregate net fee paid to the Adviser as a percentage of average net assets for the Arbitrage Fund, Diversified Event-Driven Fund, Credit Opportunities Fund and Long/Short Fund was 1.03%, 0.88%, 0.34% and 0.00%, respectively.
The Adviser may recapture any waived amount from a Fund pursuant to the agreement, if such recapture does not cause the Fund to exceed existing expense limitations in effect at the time the amounts were waived, the recapture does not cause the Fund to exceed the current expense limitation and the recapture is done within three years after the date on which the expense was waived. The Adviser can recapture, with the exception of the advisory fees waived related to Arbitrage Fund's investment in the Diversified Event-Driven Fund, any fees it has waived within three fiscal years of the year in which the fees were waived subject to the applicable annual rate of: 1.69% for Class R shares, 1.44% for Class I shares, 2.44% for Class C shares and 1.69% for Class A shares of the Arbitrage Fund and Diversified Event-Driven Fund. The Adviser can recapture any fees it has waived within three fiscal years of the year in which the fees were waived subject to the applicable annual rate of: 1.69% for Class R shares, 1.44% for Class I shares, 2.44% of the Long/Short Fund. The Advisor can recapture any fees it has waived within three years of the date of the expense waiver for the Credit Opportunities Fund subject to the applicable annual rate of 1.23% for Class R shares, 0.98% for Class I shares, 1.98% for Class C shares and 1.23% for Class A shares of the Credit Opportunities Fund for fees waived after August 6, 2018. Prior to August 6, 2018, the Adviser can recapture any fees it has waived within three years after the year in which the expense was waived subject to the applicable annual rate of 1.50% for Class R shares, 1.25% for Class I shares, 2.25% for Class C shares and 1.50% for Class A shares of the Credit Opportunities Fund provided that such recapture would not cause the expense ratio of the Credit Opportunities Fund to exceed the limit in effect at the time such fees were recaptured.
As of May 31, 2020, the balances of future fee and expense recaptures for each Fund were as follows:
| | | Expiring
May 31, 2021 | | Expiring
May 31, 2022 | | Expiring
May 31, 2023 | | Total | |
Diversified Event-Driven Fund | |
Class R | | $ | 212,683 | | | $ | 150,425 | | | $ | 72,714 | | | $ | 435,822 | | |
Class I | | | 390,120 | | | | 392,244 | | | | 279,224 | | | | 1,061,588 | | |
Class C | | | 5,981 | | | | 3,752 | | | | 1,804 | | | | 11,537 | | |
Class A | | | 3,178 | | | | 3,225 | | | | 2,112 | | | | 8,515 | | |
Credit Opportunities Fund | |
Class R | | $ | 42,333 | | | $ | 35,953 | | | $ | 46,492 | | | $ | 124,778 | | |
Class I | | | 126,190 | | | | 244,066 | | | | 305,422 | | | | 675,678 | | |
Class C | | | 2,587 | | | | 2,613 | | | | 2,868 | | | | 8,068 | | |
Class A | | | 655 | | | | 740 | | | | 1,504 | | | | 2,899 | | |
Long/Short Fund | |
Class R | | $ | 1,030 | | | $ | 938 | | | $ | 1,126 | | | $ | 3,094 | | |
Class I | | | 215,161 | | | | 201,824 | | | | 216,303 | | | | 633,288 | | |
Annual Report | May 31, 2020
101
The Arbitrage Funds Notes to Financial Statements (continued)
During the year ended May 31, 2020, the Adviser did not recapture fees or expenses from the Funds.
Administration Agreement
State Street Bank & Trust Company serves as the Trust's administrator pursuant to an Administration Agreement with the Trust.
Distribution Agreement
ALPS Distributors, Inc. (the "Distributor") serves as the Funds' distributor. The Distributor acts as an agent for the Funds and the distributor of their shares. The Funds have adopted, with respect to their Class R, Class C shares and Class A shares, as applicable, a plan of distribution pursuant to Rule 12b-1 under the 1940 Act which permits each Fund to pay for expenses incurred in the distribution and promotion of the Funds' Class R shares, Class C shares and Class A shares and for services provided to shareholders. The Plan is a "reimbursement" plan. This means that a Fund's Class R shares, Class C shares and Class A shares only pay the 12b-1 fee to the extent that the Adviser, the Distributor or others have incurred expenses in the promotion and distribution of the shares, including but not limited to, the printing of prospectuses and reports used for sales purposes, expenses of preparation of sales literature and related expenses, advertisements, and other distribution-related expenses, as well as any distribution fees paid to securities dealers or others. Under the distribution plan, a Fund may pay compensation to any broker-dealer with whom the Distributor or the Funds has entered into a contract to distribute Class R shares, Class C shares or Class A shares, or to any other qualified financial services firm, for distribution and/or shareholder-related services with respect to shares held or purchased by their respective customers or in connection with the purchase of shares attributable to their efforts. The amount of payments under the Plan in any year shall not exceed 0.25% for Class R shares, 0.75% for Class C shares and 0.25% for Class A shares, respectively, of the average daily net assets allocable to a Fund's Class R shares, Class C shares and Class A shares, respectively. In addition, the Plan permits each Fund to make payments at an annual rate of up to 0.25% of the Fund's Class C shares for expenses incurred in connection with the provision of shareholder support or administrative services for the Fund's Class C shares.
During the year ended May 31, 2020, the Arbitrage Fund's Class R shares incurred $356,873, Class C shares incurred $196,500 and Class A shares incurred $45,572, respectively, in distribution expenses for Class R shares and Class A shares and distribution and shareholder support expenses for Class C shares, all of which was used to compensate broker-dealers. During the year ended May 31, 2020, the Diversified Event-Driven Fund's Class R shares incurred $64,332, Class C shares incurred $6,378 and Class A shares incurred $1,865, respectively, in distribution expenses for Class R shares and Class A shares and distribution and shareholder support expenses for Class C shares, all of which was used to compensate broker-dealers. During the year ended May 31, 2020, the Credit Opportunities Fund's Class R shares incurred $18,976, Class C shares incurred $4,679 and Class A shares incurred $614, respectively, in distribution expenses for Class R shares and Class A shares and distribution and shareholder support expenses for Class C shares, all of which was used to compensate broker-dealers. During the year ended May 31, 2020, the Long/Short Fund's Class R shares incurred $26, Class C shares incurred $17 and Class A shares incurred $4, respectively, in distribution expenses for Class R shares and Class A shares and distribution and shareholder support expenses for Class C shares, all of which was used to compensate broker-dealers. Effective July 31, 2019, Class A and Class C shares of the Long/Short Fund were liquidated.
www.arbitragefunds.com | 1-800-295-4485
102
The Arbitrage Funds Notes to Financial Statements (continued)
Chief Compliance Officer
Certain officers of the Trust are also officers of the Adviser. The Chief Compliance Officer ("CCO") of the Trust also serves as the CCO of the Adviser. The Funds currently pay the Adviser 50% of the CCO's salary for the CCO's provision of services to the Funds.
Chief Financial Officer
Foreside Management Services, LLC provides Chief Financial Officer ("CFO") services to the Trust. Foreside Management Services, LLC is compensated by the Trust under a Fund CFO/Treasurer Agreement.
Transfer Agent And Shareholder Services Agreement
DST Systems, Inc. ("DST") is the Funds' transfer agent, and per an agency agreement, maintains the records of each shareholder's account, answers shareholders' inquiries concerning their accounts, processes purchases and redemptions of the Funds shares, acts as dividend and distribution disbursing agent and performs other shareholder service functions.
6. AFFILIATED ISSUER TRANSACTIONS
A summary of affiliated transactions for the Arbitrage Fund for the year ended May 31, 2020 follows:
Affiliated
Issuer | | Beginning
Value
as of
May 31,
2019 | | Purchases
at
Cost | | Proceeds
from
Sales | | Net
Realized
Gain/
(Loss)
on
Sales | | Change
in
Unrealized
Appreciation/
Depreciation | | Ending
Value
as of
May 31,
2020 | | Shares
as of
May 31,
2020 | | Dividend
Income | | Capital
Gain
Distributions | |
Diversified
Event-Driven
Fund | | $ | 15,375,997 | | | $ | 45,119,280 | | | $ | — | | | $ | — | | | $ | 5,728,034 | | | $ | 66,223,311 | | | | 6,589,384 | | | $ | 119,280 | | | $ | — | | |
Other: At May 31, 2020, there were affiliated investors owning 61.58% of Diversified Event-Driven Fund's shares.
Annual Report | May 31, 2020
103
The Arbitrage Funds Notes to Financial Statements (continued)
7. CAPITAL SHARE TRANSACTIONS
Proceeds and payments on capital shares as shown in the Statement of Changes in Net Assets are the result of the following capital share transactions for the periods shown:
| | | Year Ended
May 31, 2020 | | Year Ended
May 31, 2019 | |
Arbitrage Fund - Class R | | Shares | | Value | | Shares | | Value | |
Proceeds from shares sold | | | 1,844,057 | | | $ | 23,874,599 | | | | 3,793,525 | | | $ | 48,440,688 | | |
Shares issued in reinvestment of
distributions | | | 226,522 | | | | 2,928,930 | | | | 258,687 | | | | 3,287,911 | | |
Payments for shares redeemed | | | (7,139,305 | ) | | | (91,524,308 | ) | | | (8,983,994 | ) | | | (114,767,511 | ) | |
Net decrease | | | (5,068,726 | ) | | $ | (64,720,779 | ) | | | (4,931,782 | ) | | $ | (63,038,912 | ) | |
Arbitrage Fund - Class I | |
Proceeds from shares sold | | | 26,307,371 | | | $ | 350,888,952 | | | | 39,434,735 | | | $ | 518,934,600 | | |
Shares issued in reinvestment of
distributions | | | 1,798,724 | | | | 23,994,981 | | | | 1,630,790 | | | | 21,330,733 | | |
Payments for shares redeemed | | | (51,892,203 | ) | | | (688,847,296 | ) | | | (40,852,721 | ) | | | (537,722,663 | ) | |
Net increase/(decrease) | | | (23,786,108 | ) | | $ | (313,963,363 | ) | | | 212,804 | | | $ | 2,542,670 | | |
Arbitrage Fund - Class C | |
Proceeds from shares sold | | | 362,286 | | | $ | 4,484,833 | | | | 97,547 | | | $ | 1,191,257 | | |
Shares issued in reinvestment of
distributions | | | 26,490 | | | | 325,301 | | | | 15,160 | | | | 184,649 | | |
Payments for shares redeemed | | | (323,299 | ) | | | (3,960,880 | ) | | | (460,138 | ) | | | (5,623,667 | ) | |
Net increase/(decrease) | | | 65,477 | | | $ | 849,254 | | | | (347,431 | ) | | $ | (4,247,761 | ) | |
Arbitrage Fund - Class A | |
Proceeds from shares sold | | | 721,756 | | | $ | 9,364,614 | | | | 402,219 | | | $ | 5,124,610 | | |
Shares issued in reinvestment of
distributions | | | 20,562 | | | | 265,452 | | | | 19,983 | | | | 253,588 | | |
Payments for shares redeemed | | | (798,929 | ) | | | (10,288,809 | ) | | | (325,498 | ) | | | (4,155,387 | ) | |
Net increase/(decrease) | | | (56,611 | ) | | $ | (658,743 | ) | | | 96,704 | | | $ | 1,222,811 | | |
www.arbitragefunds.com | 1-800-295-4485
104
The Arbitrage Funds Notes to Financial Statements (continued)
| | | Year Ended
May 31, 2020 | | Year Ended
May 31, 2019 | |
Diversified Event-Driven Fund - Class R | | Shares | | Value | | Shares | | Value | |
Proceeds from shares sold | | | 438,183 | | | $ | 4,185,461 | | | | 572,854 | | | $ | 5,382,416 | | |
Shares issued in reinvestment of
distributions | | | 3,440 | | | | 33,265 | | | | 37,998 | | | | 353,763 | | |
Payments for shares redeemed | | | (2,883,407 | ) | | | (26,064,348 | ) | | | (2,196,314 | ) | | | (20,654,136 | ) | |
Net decrease | | | (2,441,784 | ) | | $ | (21,845,622 | ) | | | (1,585,462 | ) | | $ | (14,917,957 | ) | |
Diversified Event-Driven Fund - Class I | |
Proceeds from shares sold | | | 5,883,521 | | | $ | 53,863,559 | | | | 1,337,752 | | | $ | 12,728,183 | | |
Shares issued in reinvestment of
distributions | | | 44,603 | | | | 434,430 | | | | 173,194 | | | | 1,622,831 | | |
Payments for shares redeemed | | | (5,789,051 | ) | | | (53,843,540 | ) | | | (2,596,458 | ) | | | (24,686,089 | ) | |
Net increase/(decrease) | | | 139,073 | | | $ | 454,449 | | | | (1,085,512 | ) | | $ | (10,335,075 | ) | |
Diversified Event-Driven Fund - Class C | |
Proceeds from shares sold | | | 10,870 | | | $ | 101,200 | | | | 119 | | | $ | 1,100 | | |
Shares issued in reinvestment of
distributions | | | — | | | | — | | | | 441 | | | | 4,041 | | |
Payments for shares redeemed | | | (58,434 | ) | | | (550,984 | ) | | | (41,879 | ) | | | (387,752 | ) | |
Net decrease | | | (47,564 | ) | | $ | (449,784 | ) | | | (41,319 | ) | | $ | (382,611 | ) | |
Diversified Event-Driven Fund - Class A | |
Proceeds from shares sold | | | 7,600 | | | $ | 73,084 | | | | 37,148 | | | $ | 351,232 | | |
Shares issued in reinvestment of
distributions | | | 180 | | | | 1,743 | | | | 1,399 | | | | 13,015 | | |
Payments for shares redeemed | | | (57,399 | ) | | | (560,515 | ) | | | (28,180 | ) | | | (266,487 | ) | |
Net increase/(decrease) | | | (49,619 | ) | | $ | (485,688 | ) | | | 10,367 | | | $ | 97,760 | | |
Annual Report | May 31, 2020
105
The Arbitrage Funds Notes to Financial Statements (continued)
| | | Year Ended
May 31, 2020 | | Year Ended
May 31, 2019 | |
Credit Opportunities Fund - Class R | | Shares | | Value | | Shares | | Value | |
Proceeds from shares sold | | | 497,173 | | | $ | 4,825,641 | | | | 565,549 | | | $ | 5,466,164 | | |
Shares issued in reinvestment of
distributions | | | 24,121 | | | | 233,233 | | | | 23,032 | | | | 223,098 | | |
Payments for shares redeemed | | | (949,307 | ) | | | (8,929,822 | ) | | | (755,201 | ) | | | (7,333,975 | ) | |
Net decrease | | | (428,013 | ) | | $ | (3,870,948 | ) | | | (166,620 | ) | | $ | (1,644,713 | ) | |
Credit Opportunities Fund - Class I | |
Proceeds from shares sold | | | 2,161,328 | | | $ | 20,403,304 | | | | 2,701,830 | | | $ | 26,082,551 | | |
Shares issued in reinvestment of
distributions | | | 170,327 | | | | 1,636,801 | | | | 166,340 | | | | 1,601,817 | | |
Payments for shares redeemed | | | (1,565,768 | ) | | | (14,940,053 | ) | | | (1,431,809 | ) | | | (13,740,602 | ) | |
Net increase | | | 765,887 | | | $ | 7,100,052 | | | | 1,436,361 | | | $ | 13,943,766 | | |
Credit Opportunities Fund - Class C | |
Proceeds from shares sold | | | 33,505 | | | $ | 325,001 | | | | — | | | $ | — | | |
Shares issued in reinvestment of
distributions | | | 1,057 | | | | 10,156 | | | | 1,278 | | | | 12,324 | | |
Payments for shares redeemed | | | (14,435 | ) | | | (138,110 | ) | | | (18,575 | ) | | | (180,135 | ) | |
Net increase/(decrease) | | | 20,127 | | | $ | 197,047 | | | | (17,297 | ) | | $ | (167,811 | ) | |
Credit Opportunities Fund - Class A | |
Proceeds from shares sold | | | 30,785 | | | $ | 297,278 | | | | 1,501 | | | $ | 14,514 | | |
Shares issued in reinvestment of
distributions | | | 748 | | | | 7,170 | | | | 466 | | | | 4,485 | | |
Payments for shares redeemed | | | (34,897 | ) | | | (324,406 | ) | | | (5,171 | ) | | | (49,069 | ) | |
Net decrease | | | (3,364 | ) | | $ | (19,958 | ) | | | (3,204 | ) | | $ | (30,070 | ) | |
www.arbitragefunds.com | 1-800-295-4485
106
The Arbitrage Funds Notes to Financial Statements (continued)
| | | Year Ended
May 31, 2020 | | Year Ended
May 31, 2019 | |
Long/Short Fund - Class R | | Shares | | Value | | Shares | | Value | |
Shares issued in reinvestment of
distributions | | | 18 | | | | 176 | | | | 21 | | | | 206 | | |
Net increase | | | 18 | | | $ | 176 | | | | 21 | | | $ | 206 | | |
Long/Short Fund - Class I | |
Proceeds from shares sold | | | 7,089 | | | $ | 70,694 | | | | 36,793 | | | $ | 366,929 | | |
Shares issued in reinvestment of
distributions | | | 3,640 | | | | 36,186 | | | | 4,583 | | | | 43,718 | | |
Payments for shares redeemed | | | (65,259 | ) | | | (645,623 | ) | | | (19,151 | ) | | | (189,524 | ) | |
Net increase/(decrease) | | | (54,530 | ) | | $ | (538,743 | ) | | | 22,225 | | | $ | 221,123 | | |
Long/Short Fund - Class C(a) | |
Shares issued in reinvestment of
distributions | | | — | | | | — | | | | 21 | | | | 206 | | |
Payments for shares redeemed | | | (1,031 | ) | | | (10,300 | ) | | | — | | | | — | | |
Net increase/(decrease) | | | (1,031 | ) | | $ | (10,300 | ) | | | 21 | | | $ | 206 | | |
Long/Short Fund - Class A(a) | |
Shares issued in reinvestment of
distributions | | | — | | | | — | | | | 22 | | | | 206 | | |
Payments for shares redeemed | | | (1,031 | ) | | | (10,303 | ) | | | — | | | | — | | |
Net increase/(decrease) | | | (1,031 | ) | | $ | (10,303 | ) | | | 22 | | | $ | 206 | | |
(a) Effective July 31, 2019, Class A and Class C shares of the Long/Short Fund were liquidated.
8. FOREIGN CURRENCY TRANSLATION
Amounts denominated in or expected to settle in foreign currencies are translated to U.S. dollars based on exchange rates on the basis outlined below:
A. The market values of investment securities and other assets and liabilities are translated at the closing rate of exchange each day.
B. Purchases and sales of investment securities and income and expenses are translated at the rate of exchange prevailing on the respective dates of such transactions.
C. The Funds do not isolate that portion of the results of operations caused by changes in foreign exchange rates on investments from those caused by changes in market prices of securities held. Such fluctuations are included with the net realized and unrealized gains or losses on investments. Reported net realized foreign exchange gains or losses arise from 1) purchases and sales of foreign currencies; 2) currency gains or losses realized between the trade and settlement dates on security transactions; and 3) the difference between the amounts of dividends, interest and foreign withholding taxes recorded on the Funds' books, and the U.S. dollar equivalent of the amounts actually received or paid. Reported net unrealized foreign exchange gains and losses arise from changes in the value of assets and liabilities, other than investment securities, resulting from changes in exchange rates.
Annual Report | May 31, 2020
107
The Arbitrage Funds Notes to Financial Statements (continued)
9. CONTINGENCIES AND COMMITMENTS
The Funds indemnify the Trust's officers and trustees for certain liabilities that might arise from their performance of their duties to the Funds. Additionally, in the normal course of business, the Funds enter into contracts that contain a variety of representations and warranties and which provide general indemnifications. The Funds' maximum exposure under these arrangements is unknown, as this would involve future claims that may be made against the Funds that have not yet occurred. However, based on experience, the Funds expect the risk of loss to be remote.
10. SECURITIES LENDING
To generate additional income, the Funds may, from time to time, lend portfolio securities to broker-dealers, banks or institutional borrowers of securities. At the time of the loan, the Funds must receive from the borrower 102% collateral in the form of cash or U.S. government securities. This collateral must be valued daily and, should the market value of the loaned securities increase, the borrower must furnish additional collateral to the Funds. During the time portfolio securities are on loan, the borrower pays the Funds any dividends or interest paid on such securities.
Loans are subject to termination by the Funds or the borrower at any time. While the Funds do not have the right to vote securities on loan, they have the right to terminate the loan and regain the right to vote if that is considered important with respect to the investment. In the event the borrower defaults in its obligation to the Fund, the Funds bear the risk of delay in the recovery of portfolio securities and the risk of loss of rights in the collateral.
The Funds may participate in a securities lending program under which the Funds' custodian, State Street Bank and Trust Company (the "Custodian") acting as securities lending agent, is authorized to lend Fund portfolio securities to qualified brokers/dealers and financial institutions that post appropriate collateral. The value of securities loaned will not exceed one-third of the value of the total assets of the Fund making the loan. The Custodian has agreed to indemnify the Fund in case of default of any security borrower.
Securities on loan are fully collateralized and the collateral was equal to or exceeded the securities on loan. Cash collateral is invested in the State Street Institutional U.S. Government Money Market Fund, Premier Class. The Custodian receives a portion of the interest earned on any reinvested collateral. Income received by the Funds in securities lending transactions during the year ended May 31, 2020, if any, is reflected as securities lending income in the Statement of Operations. The Diversified Event-Driven Fund did participate in securities lending during the year ended May 31, 2020, however, the Funds had no securities on loan as of May 31, 2020.
11. FEDERAL TAX INFORMATION
In order to avoid imposition of the excise tax applicable to regulated investment companies, it is each Fund's intention to declare as dividends in each calendar year at least 98.0% of its net investment income (earned during the calendar year) and 98.2% of its net realized capital gains (earned during the twelve months ended October 31) plus undistributed amounts from prior years.
The amount of distributions from net investment income and net realized gains, if any, are determined in accordance with Federal income tax regulations which may differ from accounting principles generally accepted in the United States of America. These "book/tax" differences are either temporary or permanent in nature and permanent differences are charged or credited to undistributed net investment income (loss), accumulated net realized gain (loss) or paid-in capital as appropriate in the period that the differences arise.
www.arbitragefunds.com | 1-800-295-4485
108
The Arbitrage Funds Notes to Financial Statements (continued)
Permanent differences between the Funds' financial statement and income tax reporting requirements are primarily attributable to gains and losses on certain foreign currency related transactions, short sale related dividend expense, investments in passive foreign investment companies, investments in swaps, ordinary loss netting to reduce short-term capital gains, convertible bonds, corporate actions, non-deductible excise tax activity and partnership basis adjustments. These have no effect on the Funds' net assets or net asset value per share.
Fund | | Distributable
Earnings
(Accumulated Loss) | | Paid-in Capital | |
Arbitrage Fund | | $ | 12,792 | | | $ | (12,792 | ) | |
Diversified Event-Driven Fund | | | 466,034 | | | | (466,034 | ) | |
Credit Opportunities Fund | | | 919 | | | | (919 | ) | |
Long/Short Fund | | | — | | | | — | | |
The tax character of dividends and distributions declared and paid during the years ended May 31, 2020 and May 31, 2019 was as follows:
Fund | | Year
Ended | | Ordinary
Income | | Long-Term
Capital Gains* | | Total
Distributions | |
Arbitrage Fund | | 5/31/2020 | | $ | 21,844,119 | | | $ | 12,763,361 | | | $ | 34,607,480 | | |
| | | 5/31/2019 | | | 29,608,804 | | | | 2,793,274 | | | | 32,402,078 | | |
Diversified Event-Driven Fund | | 5/31/2020 | | $ | 519,956 | | | $ | — | | | $ | 519,956 | | |
| | | 5/31/2019 | | | 2,299,685 | | | | — | | | | 2,299,685 | | |
Credit Opportunities Fund | | 5/31/2020 | | $ | 1,899,815 | | | $ | — | | | $ | 1,899,815 | | |
| | | 5/31/2019 | | | 1,863,801 | | | | — | | | | 1,863,801 | | |
Long/Short Fund | | 5/31/2020 | | $ | 14,062 | | | $ | 22,300 | | | $ | 36,362 | | |
| | | 5/31/2019 | | | 39,986 | | | | 4,350 | | | | 44,336 | | |
* The Funds designate these distributions as long-term capital gains dividends per IRC code section 852(b)(3)(C).
As of May 31, 2020, the components of distributable earnings on a tax basis were as follows:
| | | Arbitrage
Fund | | Diversified
Event-Driven Fund | | Credit
Opportunities
Fund | | Long/Short
Fund | |
Undistributed ordinary
income | | $ | 85,958,483 | | | $ | — | | | $ | — | | | $ | 73,560 | | |
Accumulated capital
gains/losses | | | — | | | | — | | | | — | | | | — | | |
Unrealized appreciation/
(depreciation) | | | (36,421,971 | ) | | | (1,715,937 | ) | | | (1,392,015 | ) | | | 508 | | |
Capital loss carryover and
late year ordinary
loss deferrals | | | — | | | | (51,575,093 | ) | | | (1,965,987 | ) | | | (2,124 | ) | |
Total distributable
earnings
(accumulated loss) | | $ | 49,536,512 | | | $ | (53,291,030 | ) | | $ | (3,358,002 | ) | | $ | 71,944 | | |
Annual Report | May 31, 2020
109
The Arbitrage Funds Notes to Financial Statements (continued)
The following information is computed on a tax basis for each item as of May 31, 2020:
Fund | | Gross
Appreciation
(excess of value
over tax cost) | | Gross
Depreciation
(excess of tax
cost over value) | | Net Unrealized
Appreciation | | Aggregate Cost
of Investments
for Income Tax
Purposes | |
Arbitrage Fund | | $ | 35,087,412 | | | $ | (63,647,243 | ) | | $ | (28,559,831 | ) | | $ | 1,287,797,247 | | |
Diversified Event-Driven Fund | | | 3,738,288 | | | | (4,117,827 | ) | | | (379,539 | ) | | | 102,563,024 | | |
Credit Opportunities Fund | | | 1,419,228 | | | | (2,180,977 | ) | | | (761,749 | ) | | | 62,456,778 | | |
Long/Short Fund | | | 73,884 | | | | (40,287 | ) | | | 33,597 | | | | 1,896,101 | | |
The differences between book-basis and tax-basis net unrealized appreciation/(depreciation) for the Funds are attributable to constructive sales, dividends related to short securities, swap mark to market, wash sales, convertible bonds, straddle loss deferrals, partnership basis adjustments, forward contracts mark to market and unsettled short sales.
Capital Losses
As of May 31, 2020, the Diversified Event-Driven Fund had $42,803,914 of short term and $8,771,179 of long term capital loss carryforwards, the Credit Opportunities Fund had $422,403 of short term and $1,183,171 of long term capital loss carryforwards and Long/Short Fund had $2,124 of long term capital loss carryforwards which may reduce the Funds' taxable income arising from future net realized gains on investments, if any, to the extent permitted by the Code and thus may reduce the amount of the distributions to shareholders which would otherwise be necessary to relieve the Funds of any liability for federal tax.
The Diversified Event-Driven Fund utilized $6,475,244 of capital loss carryforwards, and the Credit Opportunities Fund utilized $1,310,691 of capital loss carryforwards during the year ended May 31, 2020.
Late Year Losses
The Credit Opportunities Fund elected to defer to the period ending May 31, 2021 in the amount of $360,413.
12. SUBSEQUENT EVENTS
Management has evaluated subsequent events for the Funds through the date the financial statements were issued, and has concluded that there are no recognized or non-recognized subsequent events relevant for financial statement disclosure.
www.arbitragefunds.com | 1-800-295-4485
110
Report of Independent Registered Public Accounting Firm
To the Shareholders and the Board of
Trustees of the Arbitrage Funds
Opinion on the Financial Statements
We have audited the accompanying statements of assets and liabilities of The Arbitrage Funds (the Trust) (comprising Arbitrage Fund, Water Island Diversified Event-Driven Fund, previously Arbitrage Event-Driven Fund, Water Island Credit Opportunities Fund, and Water Island Long/Short Fund, (collectively referred to as the "Funds")), including the schedules of investments, as of May 31, 2020, and the related statements of operations for the year then ended, the statements of changes in net assets for each of the two years in the period then ended, the financial highlights for each of the five years in the period then ended and the related notes (collectively referred to as the "financial statements"). In our opinion, the financial statements present fairly, in all material respects, the financial position of each of the Funds comprising the Trust at May 31, 2020, the results of their operations for the year then ended, changes in their net assets for each of the two years in the period then ended and their financial highlights for each of the five years in the period then ended, in conformity with U.S. generally accepted accounting principles.
Basis for Opinion
These financial statements are the responsibility of the Trust's management. Our responsibility is to express an opinion on each of the Fund's financial statements based on our audits. We are a public accounting firm registered with the Public Company Accounting Oversight Board (United States) ("PCAOB") and are required to be independent with respect to the Trust in accordance with the U.S. federal securities laws and the applicable rules and regulations of the Securities and Exchange Commission and the PCAOB.
We conducted our audits in accordance with the standards of the PCAOB. Those standards require that we plan and perform the audit to obtain reasonable assurance about whether the financial statements are free of material misstatement, whether due to error or fraud. The Trust is not required to have, nor were we engaged to perform, an audit of the Trust's internal control over financial reporting. As part of our audits, we are required to obtain an understanding of internal control over financial reporting, but not for the purpose of expressing an opinion on the effectiveness of the Trust's internal control over financial reporting. Accordingly, we express no such opinion.
Our audits included performing procedures to assess the risks of material misstatement of the financial statements, whether due to error or fraud, and performing procedures that respond to those risks. Such procedures included examining, on a test basis, evidence regarding the amounts and disclosures in the financial statements. Our procedures included confirmation of securities owned as of May 31, 2020, by correspondence with the custodians, agent banks, and brokers or by other appropriate auditing procedures where replies from brokers were not received. Our audits also included evaluating the accounting principles used and significant estimates made by management, as well as evaluating the overall presentation of the financial statements. We believe that our audits provide a reasonable basis for our opinion.

We have served as the auditor of one or more of the Water Island Capital investment companies since 2012.
Minneapolis, Minnesota
July 28, 2020
Annual Report | May 31, 2020
111
The Arbitrage Funds Disclosure of Fund Expenses
All mutual funds have operating expenses. As a shareholder of a mutual fund, your investment is affected by these ongoing costs, which include (among others) costs for portfolio management, administrative services, distribution (12b-1) expenses, redemption fees and shareholder reports like this one. It is important for you to understand the impact of these costs on your investment returns.
Operating expenses such as these are deducted from a mutual fund's gross income and directly reduce its final investment return. These expenses are expressed as a percentage of a mutual fund's average net assets; this percentage is known as a mutual fund's expense ratio.
The following examples use the expense ratio and are intended to help you understand the ongoing costs (in dollars) of investing in your Fund and to compare these costs with those of other mutual funds. The examples are based on an investment of $1,000 made at the beginning of the period shown and held for the entire period.
The table on the following page illustrates your Fund's cost in two ways:
Actual Fund Return. The section helps you to estimate the actual expenses after fee waivers that your Fund incurred over the period. The "Expenses Paid During Period" column shows the actual dollar expense cost incurred by a $1,000 investment in the Fund, and the "Ending Account Value" number is derived from deducting that expense cost from the Fund's gross investment return.
You can use this information, together with the actual amount you invested in the Fund, to estimate the expenses you paid over that period. Simply divide your actual account value by $1,000 to arrive at a ratio (for example, an $8,600 account value divided by $1,000 = 8.6), then multiply that ratio by the number shown for your Fund under "Expenses Paid During Period."
Hypothetical 5% Return. This section helps you compare your Fund's costs with those of other mutual funds. It assumes that the Fund had an annual 5% return before expenses during the period, but that expense ratio (Column 3) for the period is unchanged. This example is useful in making comparisons because the Securities and Exchange Commission requires all mutual funds to make this 5% calculation. You can assess your Fund's comparative cost by comparing the hypothetical result for your Fund in the "Expenses Paid During Period" column with those that appear in the same charts in the shareholder reports for other mutual funds.
Note: Because the return is set at 5% for comparison purposes – NOT your Fund's actual return – the account values shown may not apply to your specific investment.
www.arbitragefunds.com | 1-800-295-4485
112
The Arbitrage Funds Disclosure of Fund Expenses (continued)
| | | Beginning
Account Value
12/01/2019 | | Ending
Account Value
05/31/2020 | | Expense
Ratio(a) | | Expenses
Paid During
Period(b) | |
Arbitrage Fund | |
Class R | |
Actual | | $ | 1,000.00 | | | $ | 1,011.90 | | | | 1.46 | % | | $ | 7.34 | | |
Hypothetical (5% return before
expenses) | | $ | 1,000.00 | | | $ | 1,017.70 | | | | 1.46 | % | | $ | 7.36 | | |
Class I | |
Actual | | $ | 1,000.00 | | | $ | 1,013.70 | | | | 1.22 | % | | $ | 6.14 | | |
Hypothetical (5% return before
expenses) | | $ | 1,000.00 | | | $ | 1,018.90 | | | | 1.22 | % | | $ | 6.16 | | |
Class C | |
Actual | | $ | 1,000.00 | | | $ | 1,007.70 | | | | 2.24 | % | | $ | 11.24 | | |
Hypothetical (5% return before
expenses) | | $ | 1,000.00 | | | $ | 1,013.80 | | | | 2.24 | % | | $ | 11.28 | | |
Class A | |
Actual | | $ | 1,000.00 | | | $ | 1,011.90 | | | | 1.48 | % | | $ | 7.44 | | |
Hypothetical (5% return before
expenses) | | $ | 1,000.00 | | | $ | 1,017.60 | | | | 1.48 | % | | $ | 7.47 | | |
(a) Annualized, based on the Fund's most recent fiscal half-year expenses.
(b) Expenses, are equal to the Fund's annualized ratio multiplied by the average account value over the period, multiplied by the number of days in the most recent fiscal half year (183), divided by 366.
| | | Beginning
Account Value
12/01/2019 | | Ending
Account Value
05/31/2020 | | Expense
Ratio(a) | | Expenses
Paid During
Period(b) | |
Water Island Diversified Event-Driven Fund | |
Class R | |
Actual | | $ | 1,000.00 | | | $ | 1,038.40 | | | | 1.67 | % | | $ | 8.51 | | |
Hypothetical (5% return before
expenses) | | $ | 1,000.00 | | | $ | 1,016.65 | | | | 1.67 | % | | $ | 8.42 | | |
Class I | |
Actual | | $ | 1,000.00 | | | $ | 1,040.90 | | | | 1.47 | % | | $ | 7.50 | | |
Hypothetical (5% return before
expenses) | | $ | 1,000.00 | | | $ | 1,017.65 | | | | 1.47 | % | | $ | 7.41 | | |
Class C | |
Actual | | $ | 1,000.00 | | | $ | 1,035.10 | | | | 2.39 | % | | $ | 12.16 | | |
Hypothetical (5% return before
expenses) | | $ | 1,000.00 | | | $ | 1,013.05 | | | | 2.39 | % | | $ | 12.03 | | |
Class A | |
Actual | | $ | 1,000.00 | | | $ | 1,039.70 | | | | 1.71 | % | | $ | 8.72 | | |
Hypothetical (5% return before
expenses) | | $ | 1,000.00 | | | $ | 1,016.45 | | | | 1.71 | % | | $ | 8.62 | | |
(a) Annualized, based on the Fund's most recent fiscal half-year expenses.
(b) Expenses, are equal to the Fund's annualized ratio multiplied by the average account value over the period, multiplied by the number of days in the most recent fiscal half year (183), divided by 366.
Annual Report | May 31, 2020
113
The Arbitrage Funds Disclosure of Fund Expenses (continued)
| | | Beginning
Account Value
12/01/2019 | | Ending
Account Value
05/31/2020 | | Expense
Ratio(a) | | Expenses
Paid During
Period(b) | |
Water Island Credit Opportunities Fund | |
Class R | |
Actual | | $ | 1,000.00 | | | $ | 1,007.00 | | | | 1.32 | % | | $ | 6.62 | | |
Hypothetical (5% return before
expenses) | | $ | 1,000.00 | | | $ | 1,018.40 | | | | 1.32 | % | | $ | 6.66 | | |
Class I | |
Actual | | $ | 1,000.00 | | | $ | 1,009.40 | | | | 1.08 | % | | $ | 5.43 | | |
Hypothetical (5% return before
expenses) | | $ | 1,000.00 | | | $ | 1,019.60 | | | | 1.08 | % | | $ | 5.45 | | |
Class C | |
Actual | | $ | 1,000.00 | | | $ | 1,004.30 | | | | 2.08 | % | | $ | 10.42 | | |
Hypothetical (5% return before
expenses) | | $ | 1,000.00 | | | $ | 1,014.60 | | | | 2.08 | % | | $ | 10.48 | | |
Class A | |
Actual | | $ | 1,000.00 | | | $ | 1,008.10 | | | | 1.34 | % | | $ | 6.73 | | |
Hypothetical (5% return before
expenses) | | $ | 1,000.00 | | | $ | 1,018.30 | | | | 1.34 | % | | $ | 6.76 | | |
(a) Annualized, based on the Fund's most recent fiscal half-year expenses.
(b) Expenses, are equal to the Fund's annualized ratio multiplied by the average account value over the period, multiplied by the number of days in the most recent fiscal half year (183), divided by 366.
| | | Beginning
Account Value
12/01/2019 | | Ending
Account Value
05/31/2020 | | Expense
Ratio(a) | | Expenses
Paid During
Period(b) | |
Water Island Long/Short Fund | |
Class R | |
Actual | | $ | 1,000.00 | | | $ | 1,059.20 | | | | 1.90 | % | | $ | 9.78 | | |
Hypothetical (5% return before
expenses) | | $ | 1,000.00 | | | $ | 1,015.50 | | | | 1.90 | % | | $ | 9.57 | | |
Class I | |
Actual | | $ | 1,000.00 | | | $ | 1,056.60 | | | | 1.64 | % | | $ | 8.43 | | |
Hypothetical (5% return before
expenses) | | $ | 1,000.00 | | | $ | 1,016.80 | | | | 1.64 | % | | $ | 8.27 | | |
(a) Annualized, based on the Fund's most recent fiscal half-year expenses.
(b) Expenses, are equal to the Fund's annualized ratio multiplied by the average account value over the period, multiplied by the number of days in the most recent fiscal half year (183), divided by 366.
www.arbitragefunds.com | 1-800-295-4485
114
The Arbitrage Funds Additional Information
1. PROXY VOTING POLICIES AND VOTING RECORD
A description of the policies and procedures that the Funds use to vote proxies relating to portfolio securities during the most recent 12-month period ended June 30 is available without charge upon request by calling toll-free 1-800-295-4485, or on the Securities and Exchange Commission's ("SEC") website at http://www.sec.gov. Information regarding how the Funds voted proxies will be available without charge upon request by calling toll-free 1-800-295-4485, or on the SEC's website at http://www.sec.gov.
2. QUARTERLY PORTFOLIO HOLDINGS
The Funds file a complete listing of their portfolio holdings with the SEC as of the first and third quarters of each fiscal year on Form N-PORT. The filings are available upon request by calling 1-800-295-4485. Furthermore, you may obtain a copy of the filing on the SEC's website at http://www.sec.gov. The Funds' Forms N-PORT may also be reviewed and copied at the SEC's Public Reference Room in Washington, D.C., and information on the operation of the Public Reference Room may be obtained by calling 1-800-SEC-0330.
Annual Report | May 31, 2020
115
The Arbitrage Funds Approval of Investment Advisory Agreements
As required under the Investment Company Act of 1940 (the "1940 Act"), the Board of Trustees (the "Board") of The Arbitrage Funds (the "Trust"), which is comprised of Arbitrage Fund, Water Island Diversified Event-Driven Fund, Water Island Credit Opportunities Fund and Water Island Long/Short Fund (each, a "Fund" and, collectively, the "Funds"), determines annually whether to continue each Fund's investment advisory agreement with Water Island Capital, LLC, the investment adviser to each Fund (the "Adviser"). In considering the renewal of the agreements, the Board, including a majority of those Trustees who are not "interested persons" of the Funds (the "Independent Trustees"), as defined in the 1940 Act, met with representatives of the Adviser on May 11, 2020 and on May 28, 2020 (the "Meetings") and in separate executive sessions in advance of and at the May 28, 2020 meeting and approved the continuation of the agreements after concluding that the continuation of the agreements was in the best interests of each Fund and its shareholders.
The Board requested and received materials relating to the agreements in advance of the Meetings. Among other things, the Board considered expense and performance comparisons with other mutual funds in each Fund's peer group as determined by Broadridge Financial Solutions Inc. ("Broadridge"), an independent provider of mutual fund industry data, as well as additional substantial material prepared by the Funds' management. The additional material prepared by management generally included Fund-by-Fund information including each Fund's average net assets; management fees; expense limitation arrangements; investment performance and risk metrics (in addition to the performance information prepared by Broadridge); services provided by the Adviser and profitability information. The Board also considered that it had reviewed the Funds' performance against other comparable mutual funds as provided by the Adviser at the Meetings and at the Board's other meetings throughout the year, in addition to other information requested by the Independent Trustees and provided by the Adviser and other service providers at the Meetings and throughout the year. The Trustees were also continually aware of their requests and information provided by the Adviser and other service providers from previous contract renewal periods as well as information regularly received by the Trustees from various other sources such as the Investment Company Institute ("ICI"), the Independent Directors Council and the Mutual Fund Directors Forum, among others.
In approving the agreements, the Board, including the Independent Trustees advised by independent legal counsel, considered the factors it deemed relevant, including the nature, quality and extent of services provided, the performance of each Fund, the profitability of the Adviser, expenses and fees, and the potential for economies of scale that may be shared with each Fund and its shareholders as each Fund's assets grow. In their deliberations, the Trustees did not identify any single factor which alone was responsible for the Board's decision to approve the agreement with respect to each Fund, and each Trustee may have given different weights to different factors and, thus, each Trustee may have had a different basis for his or her decision. In connection with its deliberations, the Board considered information provided by the Adviser throughout the year at regular Board meetings and between Board meetings, presentations from portfolio managers and other information, as well as information furnished at or in advance of the meeting held on May 28, 2020.
Nature, Extent and Quality of the Services under the Advisory Agreements
The Board received and considered information regarding the nature, extent and quality of services provided to each Fund by the Adviser under the advisory agreement for such Fund. The Board also noted information received at regular meetings and at other times throughout the year related to the services rendered by the Adviser. The Board reviewed background information about the Adviser, and considered the background and experience of the Adviser's senior management and the qualifications, backgrounds and responsibilities of the portfolio managers primarily responsible for the day-to-day portfolio management of the Funds and the extent of the resources devoted to
www.arbitragefunds.com | 1-800-295-4485
116
The Arbitrage Funds Approval of Investment Advisory Agreements (continued)
research and analysis of actual and potential investments. The Board considered the steps that the Adviser had taken during the past year to improve performance, including, without limitation, hiring and changes in personnel, enhancements in technology, and the Adviser's focus on evaluating risk and performance for the Funds. The Board also received and considered available information about the nature, extent and quality of services and fee rates offered to other clients of the Adviser for advisory services. The Trustees and the Adviser discussed the differences between an adviser's duties and its risks incurred in offering a sponsored mutual fund versus the more limited duties and risks involved in acting as a sub-adviser to a mutual fund, and also in comparing a sponsor adviser's duties and risks incurred in offering a sponsored mutual fund versus the much more limited duties and risks incurred managing an institutional separate account. The Board also considered that the Adviser assumes significant entrepreneurial risk in sponsoring new funds and that the Adviser also bears and assumes significant ongoing risks, including investment, operational, enterprise, litigation, regulatory and compliance risks, with respect to all the Funds.
Adviser Profitability
The Board was provided with information on the Adviser's profitability in serving as the investment adviser to each Fund. The Board recognized that it is difficult to make comparisons of profitability from fund management contracts because comparative information is not generally publicly available and is affected by numerous factors, including the structure of the particular adviser, the types of funds it manages, its business mix, numerous assumptions regarding allocations of expenses and the adviser's capital structure and cost of capital. Taking these factors into account, the Board concluded that the Adviser's profitability in relation to the services rendered was reasonable and that it was believed to be sufficient to continue to support increased investments to enhance services to the Funds and their shareholders.
Economies of Scale
The Board considered information regarding potential economies of scale with respect to the management of each Fund, whether the Fund has appropriately benefited from any economies of scale, and whether there is potential for realization of any further economies of scale. With respect to the Arbitrage Fund, the Board noted that the management fee schedule for the Fund includes breakpoints, which have the effect of decreasing the fee rate as assets increase, and that at its current level of assets the Fund's effective fee rate reflected those rate reductions. The Board took note that the Fund's fee structure currently results in benefits to Fund shareholders whether or not the Adviser realizes any economies of scale. With respect to the Water Island Credit Opportunities Fund, the Board noted that the Fund's management fee schedule includes breakpoints and that amendments to the management fee schedule in 2018 had lowered the Fund's management fee. The Board noted that the advisory fee schedules for the Water Island Diversified Event-Driven Fund and the Water Island Long/Short Fund do not contain breakpoints that would reduce the fee rate on assets above specified levels. The Board noted that the advisory fee for the Water Island Diversified Event-Driven Fund had been reduced effective November 1, 2019. The Board determined that, while fee breakpoints were not currently necessary for the Water Island Diversified Event-Driven Fund or the Water Island Long/Short Fund given the smaller size of these Funds, it would continue to review whether breakpoints should be incorporated in the advisory fees for these Funds. The Independent Trustees were also aware that potential economies of scale may be shared acceptably with a Fund in many different manners such as fee breakpoints, fee waivers or caps, reinvestments in the Adviser's business above contractual levels, additional new product offerings, pricing to scale from inception, among others. The Trustees noted that each Fund is party to an expense limitation agreement with the Adviser, pursuant to which the Adviser has agreed to reimburse expenses should they exceed certain contractually specified levels. The Independent Trustees were also aware that is it extremely
Annual Report | May 31, 2020
117
The Arbitrage Funds Approval of Investment Advisory Agreements (continued)
difficult to determine whether potential economies of scale in fact exist for any fund, or for a fund complex, and, or, at what point any potential economies of scale may begin to be reduced at some asset level, or possibly reverse and become diseconomies of scale. The Trustees were aware of the ICI report in December 2000 on mutual fund fees and expenses which concluded that potential economies of scale could not be found with a high degree of statistical certainty when a small number of extremely large complexes or funds were omitted. Thus, the Trustees were aware that they needed to use their business judgment and experience in evaluating whether any potential economies of scale might be equitably shared with the Funds.
Other Benefits to the Adviser
The Board considered other benefits received by the Adviser as a result of its relationship with the Funds. The Board concluded that the potential benefits to be derived by the Adviser included the ability to use soft dollar credits as well as the potential benefits consistent with those generally resulting from an increase in assets under management, specifically, potential access to additional research resources and benefits to its reputation. The Board concluded that the benefits derived by the Adviser were consistent with the types of benefits generally derived by investment advisers to mutual funds. The Board considered the standards applied in seeking best execution and reviewed the Adviser's method for and policies with respect to allocating portfolio investment opportunities among its advisory clients, including the Funds. The Independent Trustees considered these and any other potential fall-out benefits and generally determined these to be not material to the consideration of the management and other fees and to the Adviser's profitability generally.
Other Factors and Broader Review
As discussed above, the Board considered detailed materials received from the Adviser as part of the annual review, and also at quarterly meetings throughout the year and over previous years. The Board also reviews and assesses the quality of the services that the Funds receive throughout the year. In this regard, the Board reviews reports of the Adviser at least quarterly, which include, among other things, detailed portfolio and market reviews, detailed Fund performance reports and compliance reports along with various reports and information evaluating the Adviser's supervisory oversight of third-party service providers and sub-service providers to the Funds.
Investment Advisory Fee Rates and Expenses and Performance
The Board reviewed and considered the contractual advisory fee rates for each Fund in light of the nature, extent and quality of the advisory services provided by the Adviser. The Board also reviewed and considered the contractual fee waivers and expense reimbursements currently in place for each Fund.
The Board received and considered information on the contractual advisory fee and gross and net total operating expense ratios for each Fund in comparison to those of a group of funds within the Fund's Morningstar category selected independently by Broadridge (the "Peer Group") as well as to funds in the same Morningstar category (the "Category"). For each Fund, the Board considered information provided by Broadridge on the Fund's contractual advisory fee in comparison with the contractual advisory fee that would have been charged by other funds within a Peer Group and Category assuming the other funds were similar in size to the Fund. The contractual advisory fee analysis does not take into account any fee waivers or expense reimbursements. The comparisons placed each Fund in various quartiles, with the first quartile being the lowest cost mutual funds. The Broadridge expense data was based upon historical information taken from each Fund's audited annual report for the period ended May 31, 2019. Broadridge provided expense data for Class I shares of each Fund.
www.arbitragefunds.com | 1-800-295-4485
118
The Arbitrage Funds Approval of Investment Advisory Agreements (continued)
The performance of each Fund for the periods ended March 31, 2020, was compared to the performance of the funds within the same Morningstar Category, regardless of asset size or primary channel of distribution ("Performance Category"). The Board also received and considered additional information provided by the Adviser on comparisons of the performance of each Fund to additional securities indices that the Adviser deemed relevant to the Board's considerations. The Independent Trustees also noted that they regularly engage in discussions with the Adviser and counsel with regard to the portfolio benchmark comparisons for each Fund.
Arbitrage Fund
The Fund's performance (Class I Shares, net of fees) was compared to that of funds comprising the Morningstar Market Neutral Category. The Fund's net total return ranked in the second quartile of the Market Neutral Category for the one-, three-, five- and ten-year periods. The Fund's performance was also compared to its prospectus benchmark index, the ICE B of A Merrill Lynch U.S. 3-Month Treasury Bill Index. The Fund underperformed its benchmark for the one- and three- year periods and outperformed the benchmark for the five- and ten-year and since-inception periods. The Fund's contractual advisory fee was in the third quartile and second quartile of its Category and Peer Group, respectively, and the Fund's net total operating expense ratio (i.e., the Fund's total operating expenses, net of waivers/reimbursements) was in the second quartile and first quartile for the Category and the Peer Group, respectively. It was noted that the Adviser had entered into an expense waiver and reimbursement agreement to limit fees through September 30, 2021, although the Fund's expenses did not currently reach a level to require the Adviser to waive fees or reimburse expenses.
The Board determined that, given all of the factors provided, it would be in the best interests of the Fund and its shareholders to continue the advisory agreement. The Fund's fee structure was considered reasonable.
Water Island Diversified Event-Driven Fund
The Fund's performance (Class I Shares, net of fees) was compared to that of funds comprising the Morningstar Market Neutral Category. The Fund's net total return ranked in the second quartile, third quartile and fourth quartile of the Market Neutral Category for the one-, three-, five-year periods, respectively. The Trustees noted that the Fund's underperformance for the five-year period was partially attributable to the Fund's performance in the calendar year ended 2015, and noted that the Fund's performance had shown improvement since that time. The Fund's performance was also compared to its prospectus benchmark index, the ICE B of A Merrill Lynch U.S. 3-Month Treasury Bill Index. The Fund underperformed its benchmark for the one-, three- and five-year periods, and outperformed its benchmark since inception. The Fund's contractual advisory fee was in the fourth and third quartile of its Category and Peer Group, respectively, and the Fund's net total operating expense ratio (i.e., the Fund's total operating expenses, net of waivers/reimbursements) was in the fourth quartile for the Category and Peer Group. However, in this regard, the Board considered that the Broadridge report did not reflect that the Fund's contractual advisory fee rate had been reduced effective November 1, 2019 from 1.25% to 1.10%, and therefore the Board determined that the comparative fee information included in in the report for the Fund was of limited applicability. It was further noted that the Adviser had entered into an expense waiver and reimbursement agreement to limit fund fees and expenses through September 30, 2021.
The Board determined that, given all of the factors provided, it would be in the best interests of the Fund and its shareholders to continue the advisory agreement. In light of the Fund's current size and fee rate, the Board concluded that the fee structure was reasonable and that the absence of breakpoints in the Fund's fee schedule was acceptable at this time, although the Board would continue to monitor whether breakpoints should be implemented for the Fund.
Annual Report | May 31, 2020
119
The Arbitrage Funds Approval of Investment Advisory Agreements (continued)
Water Island Credit Opportunities Fund
The Fund's performance (Class I Shares, net of fees) was compared to that of funds comprising the Morningstar Long-Short Credit category. The Fund's net total return for the one- and three- periods was in the first quartile of the Performance Category and for the five-year period was in the second quartile of the Performance Category. The Fund underperformed its primary benchmark, the ICE B of A Merrill Lynch U.S. 3-Month Treasury Bill Index, for the one- and three-year periods and outperformed the benchmark for the five-year and since-inception periods. The Fund underperformed its secondary benchmark, the Bloomberg Barclays Capital U.S. Aggregate Bond Index, for the one-, three- and five-year periods. The Fund's contractual advisory fee was in second quartile of its Category and Peer Group, and the Fund's net total operating expense ratio (i.e., the Fund's total operating expenses, net of waivers/reimbursements) was in the second quartile for the Category and the third quartile for its Peer Group. It was noted that the median and average asset size of the funds in the Peer Group was much larger than that of the Fund and that many of those funds appear to benefit from economies of scale. It was further noted that the Adviser had lowered the Fund's management fee and instituted a breakpoint to the Fund's management fee schedule in 2018 and had entered into an expense waiver and reimbursement agreement to further limit fund fees and expenses through September 30, 2021.
The Board determined, given all of the factors provided, that it would be in the best interests of the Fund and its shareholders to continue the advisory agreement. In light of the Fund's current size and amended fee rate, the Board concluded that the fee structure was reasonable.
Water Island Long/Short Fund
The Fund's performance (Class I Shares, net of fees) was compared to that of funds comprising Morningstar's Long-Short Equity category. The Fund's net total return ranked in the first quartile, second quartile and third quartile of the Performance Category for the one-, three-, five-year periods, respectively. The Fund underperformed its primary benchmark, the ICE B of A Merrill Lynch U.S. 3-Month Treasury Bill Index, for the one-, three- and five-year periods. The Fund outperformed its secondary benchmark, the S&P 500 Index, for the one-year period and underperformed the benchmark for the three- and five-year periods. The Fund's contractual advisory fee was in the third quartile of its Category and Peer Group, and the Fund's net total operating expense ratio (i.e., the Fund's total operating expenses, net of waivers/reimbursements) was in the third quartile for the Category and Peer Group. It was noted that the median and average asset size of the funds in the Peer Group was much larger than that of the Fund and that many of those funds appear to benefit from economies of scale. It was further noted that the Adviser had entered into an expense waiver and reimbursement agreement to limit fund fees and expenses through September 30, 2021.
The Board determined that, given all of the factors provided, it would be in the best interests of the Fund and its shareholders to continue the advisory agreement. In light of the Fund's current size and fee rate, the Board concluded that the fee structure was reasonable and that the absence of breakpoints in the Fund's fee schedule was acceptable at this time, although the Board would continue to monitor whether breakpoints should be implemented for the Fund.
www.arbitragefunds.com | 1-800-295-4485
120
The Arbitrage Funds Liquidity Risk
Consistent with Rule 22e-4 under the Investment Company Act of 1940 (the "Liquidity Rule"), the Funds have adopted and implemented a liquidity risk management program (the "Program"). The Program seeks to assess and manage each Fund's liquidity risk, which is defined as the risk that a Fund is unable to meet investor redemption requests without significantly diluting the remaining investors' interests in the Fund. The Funds' Board of Trustees (the "Board") has designated Water Island Capital, LLC, the Funds' investment adviser, as the administrator of the Program. The Program is implemented and monitored by the Operational Risk Committee, a committee comprised of representatives of Water Island Capital, LLC. As part of its responsibilities as administrator, Water Island Capital, LLC has retained a third party to perform certain functions, including providing market data and liquidity classification model information.
The Funds' Program includes a number of processes designed to support the assessment and management of its liquidity risk. In particular, the Program includes no less than annual assessments of factors that influence each Fund's liquidity risk; no less than monthly classifications of each Fund's investments into one of four liquidity classifications provided for in the Liquidity Rule; a 15% of net assets limit on the acquisition of "illiquid investments" (as defined under the Liquidity Rule); establishment of a minimum percentage of a Fund's assets to be invested in investments classified as "highly liquid" (as defined under the Liquidity Rule) if the Fund does not invest primarily in highly liquid investments; and periodic reporting to the Funds' Board.
At a meeting of the Board of Trustees on May 28, 2020, Water Island Capital, LLC provided a written report (the "Report") to the Board addressing the operation, adequacy, and effectiveness the Funds' Program, including any material changes to the Program for the period from the inception of the Program on December 1, 2018 through March 31, 2020 ("Reporting Period"). The Report included a summary of the oversight of the Program and the system that is used to operate the Program, a discussion of the Funds' investment strategies and liquidity sources, reasonably anticipated trade sizes, historical redemptions, investor concentrations, liquidity events and liquidity classifications during the Reporting Period. The Report concluded that the Program was operating adequately and effectively in promoting effective liquidity risk management for the Funds during the Reporting Period. There were no material changes to the Program during the Reporting Period. The Report further concluded that each Fund's investment strategy continues to be appropriate given the Fund's status as an open-end fund.
There can be no assurance that the Program will achieve its objectives in the future. Additional information regarding risks of investing in each Fund, including liquidity risks presented by the Fund's investment portfolio, is found in the Fund's Prospectus and Statement of Additional Information.
Annual Report | May 31, 2020
121
The Arbitrage Funds Trustees & Officers
INTERESTED TRUSTEES:
Name, Address
and Age | | Length of
Time Served | | Position
with Trust | | Principal
Occupation
During the
Past Five Years | | Other
Directorships
During the Past
Five Years | | Number of
Portfolios in
the Fund
Complex
Overseen by
Trustee** | |
John S. Orrico, CFA*
41 Madison
Avenue, 42nd
Floor, New York,
NY 10010
(Age 60) | | Since 2000 | | President and Chairman of the Board of Trustees | | Managing Member, Water Island Capital, LLC, the Investment Adviser, since January 2000. | | None | | | 5 | | |
Christina Chew*
41 Madison
Avenue, 42nd
Floor, New York,
NY 10010
(Age 49) | | Since 2018 | | Trustee | | Senior Managing Partner of Water Island Capital, LLC, the Investment Adviser, since 2013. | | None | | | 4 | | |
* John S. Orrico and Christina Chew, as affiliated persons of the Adviser, are each an "interested person" of the Trust within the meaning of Section 2(a)(19) of the 1940 Act.
** The registered investment companies in the fund complex include the Trust and AltShares Trust.
www.arbitragefunds.com | 1-800-295-4485
122
The Arbitrage Funds Trustees & Officers (continued)
INDEPENDENT TRUSTEES*:
Name, Address
and Age | | Length of
Time Served | | Position
with Trust | | Principal
Occupation
During the
Past Five Years | | Other
Directorships
During the Past
Five Years | | Number of
Portfolios in
the Fund
Complex
Overseen by
Trustee** | |
John C. Alvarado
(Age 60) | | Since 2003 | | Lead Independent Trustee | | COO (2018 -present) and CFO (2016-present) of Magnum Development LLC, a privately held Utah-based integrated energy storage and power generation company. Previously, Managing Director at Alvarado Energy Advisors LLC ("AEA"), a boutique investment banking firm providing financial advisory services to middle market energy companies (2014 - 2016); Managing Director for The Seaport Group, a credit-focused investment bank (2010 - 2014). | | None | | | 4 | | |
Annual Report | May 31, 2020
123
The Arbitrage Funds Trustees & Officers (continued)
Name, Address
and Age | | Length of
Time Served | | Position
with Trust | | Principal
Occupation
During the
Past Five Years | | Other
Directorships
During the Past
Five Years | | Number of
Portfolios in
the Fund
Complex
Overseen by
Trustee** | |
Robert P. Herrmann
(Age 57) | | Since 2012 | | Trustee | | CEO of EQIS Capital Management, Inc., a national financial advisory firm (2020-present). Independent Director of GeoWealth LLC, a technology provider in the financial services industry (2019 -present); Previously, President & CEO of Discovery Data, a leading financial services industry data provider (2009 - 2019). | | Independent Director and Chairman of Nominating and Governance Committee of TD Funds (USA) (2014 - 2019); Independent Director of FundChoice Holdings LLC (2014 - 2018); Chairman of the Board, Monmouth Medical Center (since 2012), Advisory Board Member, Monmouth University School of Science (since 2017). | | | 4 | | |
www.arbitragefunds.com | 1-800-295-4485
124
The Arbitrage Funds Trustees & Officers (continued)
Name, Address
and Age | | Length of
Time Served | | Position
with Trust | | Principal
Occupation
During the
Past Five Years | | Other
Directorships
During the Past
Five Years | | Number of
Portfolios in
the Fund
Complex
Overseen by
Trustee** | |
Stephen R. Byers
(Age 66) | | Since 2016 | | Trustee | | Independent Director (since 2011); Independent Consultant (since 2014). | | Independent Chair (since November
2016),
Trustee (since 2011), Lead Independent Trustee (2015 - 2016) and Audit Committee Chair (2011 - 2015), Deutsche Bank db-X ETF Trust (45 portfolios); Independent Director and Audit Committee Chair (since 2012), Lead Independent Director (since July 2019), Chairman of Sierra Special Committee (since August 2019), Sierra Income Corporation; Trustee (2002 - 2011), The College of William and Mary, Graduate School of Business; Board Member, (since 2016) and Audit Committee Chair (since 2019), Mutual Fund Directors Forum. | | | 4 | | |
Annual Report | May 31, 2020
125
The Arbitrage Funds Trustees & Officers (continued)
Name, Address
and Age | | Length of
Time Served | | Position
with Trust | | Principal
Occupation
During the
Past Five Years | | Other
Directorships
During the Past
Five Years | | Number of
Portfolios in
the Fund
Complex
Overseen by
Trustee** | |
Francis X. Tracy
(Age 62) | | Since 2016 | | Trustee | | Independent Director (since 2016). Previously, President, Chief Financial Officer, Treasurer, and Secretary for Batterymarch Financial Management, Inc. (1999 - 2014). | | Batterymarch Global Emerging Markets Fund (Luxembourg) (2010 - 2014). | | | 5 | | |
Nancy M. Morris
(Age 67) | | Since 2018 | | Trustee | | Independent Director (since 2019). Previously, Chief Compliance Officer and Managing Director, Wellington Management Company LLP (2012 - 2018). | | Director of Diamond Hill Funds (13 portfolios) (since 2019). | | | 5 | | |
www.arbitragefunds.com | 1-800-295-4485
126
The Arbitrage Funds Trustees & Officers (continued)
EXECUTIVE OFFICERS:
Name, Address
and Age | | Length of
Time Served | | Position
with Trust | | Principal
Occupation
During the
Past Five Years | | Other
Directorships
During the Past
Five Years | | Number of
Portfolios in
the Fund
Complex
Overseen by
Trustee** | |
William Keena
41 Madison
Avenue, 42nd
Floor, New York,
NY 10010
(Age 69) | | Anti-Money Laundering Officer since November 2019, Secretary since 2013 | | Anti-Money Laundering Officer, Secretary | | Anti-Money Laundering Officer (2019 - present) and Chief Administrative Officer (2010 -present), Water Island Capital. | | N/A | | N/A | |
Jonathon Hickey
41 Madison
Avenue, 42nd
Floor, New York,
NY 10010
(Age 39) | | Since 2013 | | Treasurer | | Chief Operating Officer (2016 -present); Director of Operations (2011 - 2016), Water Island Capital. | | N/A | | N/A | |
Monique Labbe
Foreside
Management
Services, LLC
10 High St. #302,
Boston, MA
02110
(Age 46) | | Since 2015 | | Chief Financial Officer | | Senior Director, Foreside Management Services, LLC*** (2014 - present) | | N/A | | N/A | |
Annual Report | May 31, 2020
127
Name, Address
and Age | | Length of
Time Served | | Position
with Trust | | Principal
Occupation
During the
Past Five Years | | Other
Directorships
During the Past
Five Years | | Number of
Portfolios in
the Fund
Complex
Overseen by
Trustee** | |
Philip Channen
41 Madison
Avenue, 42nd
Floor, New York,
NY 10010
(Age: 55) | | Since December
2019 | | Chief Compliance Officer | | Chief Compliance Officer, Water Island Capital (2019 -present); Deputy Chief Compliance Officer, HarbourVest Partners, LLC (2017 - 2019); Chief Compliance Officer/Senior Advisor to the CCO, QS Investors, LLC (2014 - 2016). | | N/A | | N/A | |
* Each Independent Trustee may be contacted by writing to the Trustee c/o Fatima Sulaiman, K&L Gates LLP, 1601 K Street, NW, Washington, D.C. 20006-1600.
** The registered investment companies in the fund complex include the Trust and AltShares Trust.
*** Foreside Fund Services provides chief financial officer services to the Trust under a Fund CFO/Treasurer agreement with the Trust.
www.arbitragefunds.com | 1-800-295-4485
128

Arbitrage Fund
Water Island Diversified Event-Driven Fund
Water Island Credit Opportunities Fund
Water Island Long/Short Fund
800-295-4485
www.arbitragefunds.com
Adviser
Water Island Capital, LLC
41 Madison Avenue, 42nd Floor
New York, NY 10010
Distributor
ALPS Distributors, Inc.
1290 Broadway, Suite 1100
Denver, CO 80203
Transfer Agent
DST Systems, Inc.
P.O. Box 219842
Kansas City, MO 64121-9842
Custodian
State Street Bank & Trust
225 Liberty Street
New York, NY 10281
This material must be preceded or accompanied by a prospectus. Please read it carefully before investing.
Item 2. Code of Ethics.
| (a) | The Registrant, as of the end of the period covered by the report, has adopted a code of ethics that applies to the Registrant's principal executive officer, principal financial officer, principal accounting officer or controller or any persons performing similar functions on behalf of the Registrant. |
| (c) | During the period covered by this report, no amendments were made to the provisions of the code of ethics adopted in 2(a) above. |
| (d) | During the period covered by this report, no implicit or explicit waivers to the provisions of the code of ethics adopted in 2(a) above were granted. |
| (f) | The Registrant's Code of Ethics is attached as an Exhibit hereto. |
Item 3. Audit Committee Financial Expert.
| (a)(1) | The Registrant’s board of trustees has determined that the Registrant has at least one audit committee financial expert serving on the audit committee. |
| (a)(2) | The audit committee financial experts are John C. Alvarado and Francis X. Tracy, who are each independent as defined in Form N-CSR Item 3(a)(2). |
Item 4. Principal Accountant Fees and Services.
| (a) | Audit Fees: For the Registrant’s fiscal years ended May 31, 2020 and May 31, 2019, the aggregate fees billed for professional services rendered by the principal accountant for the audit of the Registrant’s annual financial statements were $126,500 and $119,400, respectively. |
| (b) | Audit-Related Fees: For the Registrant’s fiscal years ended May 31, 2020 and May 31, 2019, the aggregate fees billed for assurance and related services by the principal accountant that are reasonably related to the performance of the audit of the Registrant’s financial statements and are not reported under paragraph (a) of this Item were $0 and $0, respectively. |
| (c) | Tax Fees: For the Registrant’s fiscal years ended May 31, 2020 and May 31, 2019, aggregate fees of $33,200 and $31,900, respectively, were billed for professional services rendered by the principal accountant for tax compliance, tax advice, and tax planning. |
| (d) | All Other Fees: For the Registrant’s fiscal years ended May 31, 2020 and May 31, 2019, no fees were billed to the Registrant by the principal accountant for services other than the services reported in paragraphs (a) through (c) of this item. |
| (e)(1) | Audit Committee Pre-Approval Policies and Procedures: All services to be performed by the Registrant's principal auditors must be pre-approved by the Registrant's audit committee. |
| (e)(2) | No services described in paragraphs (b) through (d) were approved pursuant to paragraph (c)(7)(i)(C) of Rule 2-01 of Regulation S-X. |
| (g) | The aggregate non-audit fees billed by the Registrant’s principal accountant for the fiscal years ended May 31, 2020 and May 31, 2019 were $33,200 and $31,900, respectively. |
Item 5. Audit Committee of Listed Registrants.
Not applicable.
Item 6. Schedule of Investments.
The Schedule of Investments is included as part of the Report to Stockholders filed under Item 1 of this form.
Item 7. Disclosure of Proxy Voting Policies and Procedures for Closed-End Management Investment Companies.
Not applicable.
Item 8. Portfolio Managers of Closed-End Management Investment Companies.
Not applicable.
Item 9. Purchases of Equity Securities by Closed-End Management Investment Company and Affiliated Purchasers.
Not applicable.
Item 10. Submission of Matters to Vote of Security Holders.
There have been no material changes to the procedures by which shareholders may recommend nominees to the registrant’s Board of Trustees.
Item 11. Controls and Procedures.
| (a) | The registrant’s principal executive officer and principal financial officer have evaluated the registrant’s disclosure controls and procedures (as defined in Rule 30a-3(c) under the Investment Company Act of 1940, as amended) within 90 days of this filing and have concluded that the registrant’s disclosure controls and procedures were effective, as of that date. |
| (b) | There was no change in the registrant’s internal control over financial reporting (as defined in Rule 30a-3(d) under the Investment Company Act of 1940, as amended) during the period covered by this report that has materially affected, or is reasonably likely to materially affect, the registrant’s internal control over financial reporting. |
Item 12. Disclosure of Securities Lending Activities for Closed-End Management Investment Companies
Not applicable.
Item 13. Exhibits.
SIGNATURES
Pursuant to the requirements of the Securities Exchange Act of 1934 and the Investment Company Act of 1940, the registrant has duly caused this report to be signed on its behalf by the undersigned, thereunto duly authorized.
THE ARBITRAGE FUNDS
| By: | /s/ John S. Orrico | |
| | John S. Orrico | |
| | President (Principal Executive Officer) | |
| | | |
| Date: | August 7, 2020 | |
Pursuant to the requirements of the Securities Exchange Act of 1934 and the Investment Company Act of 1940, this report has been signed below by the following persons on behalf of the registrant and in the capacities and on the dates indicated.
| By: | /s/ John S. Orrico | |
| | John S. Orrico | |
| | President (Principal Executive Officer) | |
| | | |
| Date: | August 7, 2020 | |
| By: | /s/ Monique Labbe | |
| | Monique Labbe | |
| | Chief Financial Officer (Principal Financial Officer) | |
| | | |
| Date: | August 7, 2020 | |